Embed Size (px)
Citation preview

Atmos. Chem. Phys., 9, 4011–4021, 2009www.atmos-chem-phys.net/9/4011/2009/© Author(s) 2009. This work is distributed underthe Creative Commons Attribution 3.0 License.
AtmosphericChemistry
and Physics
Taklimakan dust aerosol radiative heating derived from CALIPSOobservations using the Fu-Liou radiation model with CERESconstraints
J. Huang1, Q. Fu2,1, J. Su1, Q. Tang1, P. Minnis3, Y. Hu3, Y. Yi4, and Q. Zhao5
1Key Laboratory for Semi-Arid Climate Change of the Ministry of Education, College of Atmospheric Sciences,Lanzhou University, Lanzhou, 730000, China2Department of Atmosphere Science, University of Washington, USA3NASA Langley Research Center, Hampton, VA, 23666, USA4Science Systems and Applications Inc., Hampton, VA 23666, USA5Gansu Meteorological Bureau, Lanzhou, 73000 China
Received: 25 November 2008 – Published in Atmos. Chem. Phys. Discuss.: 5 March 2009Revised: 5 May 2009 – Accepted: 29 May 2009 – Published: 18 June 2009
Abstract. The dust aerosol radiative forcing and heatingrate over the Taklimakan Desert in Northwestern China inJuly 2006 are estimated using the Fu-Liou radiative trans-fer model along with satellite observations. The verticaldistributions of the dust aerosol extinction coefficient arederived from the CALIPSO (Cloud-Aerosol Lidar and In-frared Pathfinder Satellite Observations) lidar measurements.The CERES (Cloud and the Earth’s Energy Budget Scanner)measurements of reflected solar radiation are used to con-strain the dust aerosol type in the radiative transfer model,which determines the dust aerosol single-scattering albedoand asymmetry factor as well as the aerosol optical proper-ties’ spectral dependencies. We find that the dust aerosolshave a significant impact on the radiative energy budgetover the Taklimakan desert. In the atmospheres containinglight, moderate and heavy dust layers, the dust aerosols heatthe atmosphere (daily mean) by up to 1, 2, and 3 K day−1,respectively. The maximum daily mean radiative heatingrate reaches 5.5 K day−1 at 5 km on 29 July. The averageddaily mean net radiative effect of the dust are 44.4,−41.9,and 86.3 W m−2, respectively, at the top of the atmosphere(TOA), surface, and in the atmosphere. Among these ef-fects about two thirds of the warming effect at the TOA isrelated to the longwave radiation, while about 90% of theatmospheric warming is contributed by the solar radiation.At the surface, about one third of the dust solar radiative
Correspondence to:J. Huang([email protected])
cooling effect is compensated by its longwave warming ef-fect. The large modifications of radiative energy budget bythe dust aerosols over Taklimakan Desert should have impor-tant implications for the atmospheric circulation and regionalclimate, topics for future investigations.
1 Introduction
Aerosols influence the radiative energy budget directly byscattering and absorbing solar radiation (direct effect), andindirectly by altering cloud droplet size distribution and con-centration (Indirect effect) (Twomey, 1977; Albrecht, 1989).Absorbing aerosols, such as black carbon and mineral dust,could contribute to large diabatic heating in the atmospherethat often enhances cloud evaporation (semi-indirect effect)(Ackerman et al., 2000; Koren et al., 2004; Kruger andGraßl, 2004; Huang et al., 2006). The magnitude of theglobal mean radiative effect of dust aerosols is comparableto that of anthropogenic aerosols from sulphates and biomasscombustion (Sokolik and Toon, 1999). Dust aerosols alsohave a significant greenhouse effect through longwave radi-ation which warms both the surface and atmosphere (e.g.,Zhang and Christopher 2003). However, there are consider-able uncertainties in estimating the radiative effects of dustaerosols. The net radiative effect at the top-of-atmosphere(TOA) could be either positive or negative, depending onseveral key variables, such as surface albedo, particle size,vertical distribution of the dust layer, dust optical depth, and
Published by Copernicus Publications on behalf of the European Geosciences Union.

4012 J. Huang et al.: Dust aerosol radiative heating derived from CALIPSO
the imaginary part of the refractive index (Liao and Seinfeld,1998). Recently, Satheesh et al. (2006) studied the atmo-spheric warming due to dust aerosols over the Afro-Asianregion. They found a reduction of solar radiation reachingat the surface with a lower atmospheric warming of 0.3 to0.5 K day−1.
The vertical distribution of dust aerosols is one of the crit-ical parameters in the assessment of the dust radiative effect(Claquin et al., 1998; Zhu et al., 2007). A model study byCarlson and Benjamin (1980) showed that an elevated Saha-ran dust layer could change the atmospheric heating rate dra-matically. Liao and Seinfeld (1998) claimed that clear skylong-wave radiative forcing and cloudy sky TOA shortwave(SW) radiative forcing of dust aerosols are very sensitive tothe altitude of the dust and cloud layers. Meloni et al.(2005)also found that SW aerosol radiative forcing at the TOA hasa significant dependence on aerosol vertical profiles.
The recently launched CALIPSO satellite provides awealth of actively sensed vertical structures of aerosols overregional and global scales and provides an unprecedentedopportunity to study the radiative effects of dust aerosols.Unlike the space-based passive remote sensing instruments,CALIPSO can observe aerosols over bright surfaces and be-neath thin clouds as well as in clear sky conditions (Winkeret al., 2006; Hu et al., 2006, 2007; Liu et al., 2004, 2008;Huang et al., 2007, 2008). One of the most distinct advan-tages of the CALIPSO lidar observations is that it provides adirect measure of the vertical structure of aerosols.
This paper estimates the dust aerosol radiatve heating rateand the radiative effect during the dust events that occurredover the Taklimakan Desert in the summer of 2006. The Tak-limakan Desert is a significant source of airborne dust that af-fects much of Eastern Asia, the Northern Pacific, and some-times North America (references, Huang et al., 2008). TheFu-Liou radiation model (Fu and Liou, 1992, 1993) is used tocompute the aerosol heating rates and radiative forcing. Thevertical distributions of dust aerosol extinction coefficientsused in the computations are derived from the CALIPSO li-dar observations. We use the reflected solar radiation mea-sured at the top of the atmosphere (TOA) from the Cloudsand Earth’s Radiant Energy System (CERES) (Wielicki et al.,1996) Single Satellite Footprint (SSF) to constrain the dustaerosol type employed in the radiation model. The combina-tion of the radiation model with the CALIPSO and CERESobservations should lead to a reliable estimate of the dustaerosol radiative effects.
The paper is organized as follows. The summer Takli-makan dust events and the dust aerosol extinction profilesfrom CALIPSO observations are discussed in Sects. 2 and 3,respectively. The radiation model and the CERES constraintof dust aerosol single scattering albedo and asymmetry fac-tor are described in Sect. 4. The estimation of the Takli-makan dust aerosol radiative heating and forcing is presentedin Sect. 5 and summary and conclusions are given in Sect. 6.
2 Summer Taklimakan dust events
The Taklimakan Desert is a desert in Central Asia, in the Xin-jiang Uyghur Autonomous Region of China, which is knownas one of the largest sandy deserts in the world. It covers anarea of 270 000 km2 of the Tarim Basin, which is 1000 kmlong and 400 km wide. The Taklimakan Desert is about 1 kmabove sea level, surrounded by mountains except for an open-ing at its northeast corner.
Most Asian dust studies have focused on the late win-ter and spring due to observed long-range dust transport(Iwasaka et al., 1983; Zhang et al., 1997; Murayama et al.,2001; Uno et al., 2001; Sun et al., 2001; Wang et al., 2005).Uno et al. (2008) reported the 3-dimensional structure ofAsian dust outflow from a dust source region to the North-western Pacific Ocean. They found that the elevated dust wastransported to the Pacific Ocean with the major dust layermaintaining a height between 2.5–4.0 km. There have beenvery few studies analyzing the specific signatures of sum-mer and fall dust storms over the Taklimakan Desert. Re-cently CALIPSO lidar observations show that dust eventsoccur throughout the year over the Taklimakan (Liu et al.,2008a) and that heavy dust storms are part of the summerweather (Huang et al., 2007). The impact of the Taklimakandust storms on the radiative energy budget and the implica-tion to the regional climate are open questions. In this studywe will quantify the vertical structures of dust aerosol extinc-tion coefficients and radiative effects during the dust eventthat occurred during the period of 26 to 31 July 2006 overthe Taklimakan.
The start of the dust outbreak was associated with the in-tensive low pressure system over West Siberian with a troughextending from northwest toward southeast. This causeda large pressure gradient and strong northwesterly winds(>20 m/s) between 45◦ and 55◦ N, which resulted in the on-set of this dust episode. During 26 July, a moderate windand dust storm in the northern Taklimakan, accompanied bylocalized severe dust storms, developed and extended south-ward. Under the influence of this storm, a wind-blown sandand/or dust cloud persisted over northern Qinghai and Tibetthrough 31 July. The strong dust events mainly occurred be-tween 27 and 29 July.
3 Vertical structures of dust aerosol extinction coeffi-cient
CALIPSO lidar measurements are used to derive the verti-cal distribution of dust aerosol extinction coefficient. TheCALIPSO lidar is designed to acquire vertical profiles ofelastic backscatter at two wavelengths (532 and 1064 nm)from a near nadir-viewing geometry during both day andnight phases of the Sun-synchronous orbit, which has a13:30 LT equatorial crossing time. In addition to totalbackscatter at the two wavelengths, CALIPSO also provides
Atmos. Chem. Phys., 9, 4011–4021, 2009 www.atmos-chem-phys.net/9/4011/2009/
J. Huang et al.: Dust aerosol radiative heating derived from CALIPSO 4013
31
1
2 3
4 5
Figure 1. The altitude-orbit cross-section of 532nm total attenuated backscattering intensity 6 (left panels) for the green-shaded portion of each track (right panels) over Taklimakan 7 Desert region (35°N-45°N) for: a) July24, b) July 26, c) July 29, d) July 30, and e) July 31, 8 2006. 9
10 11
12 13 14 15 16 17
18
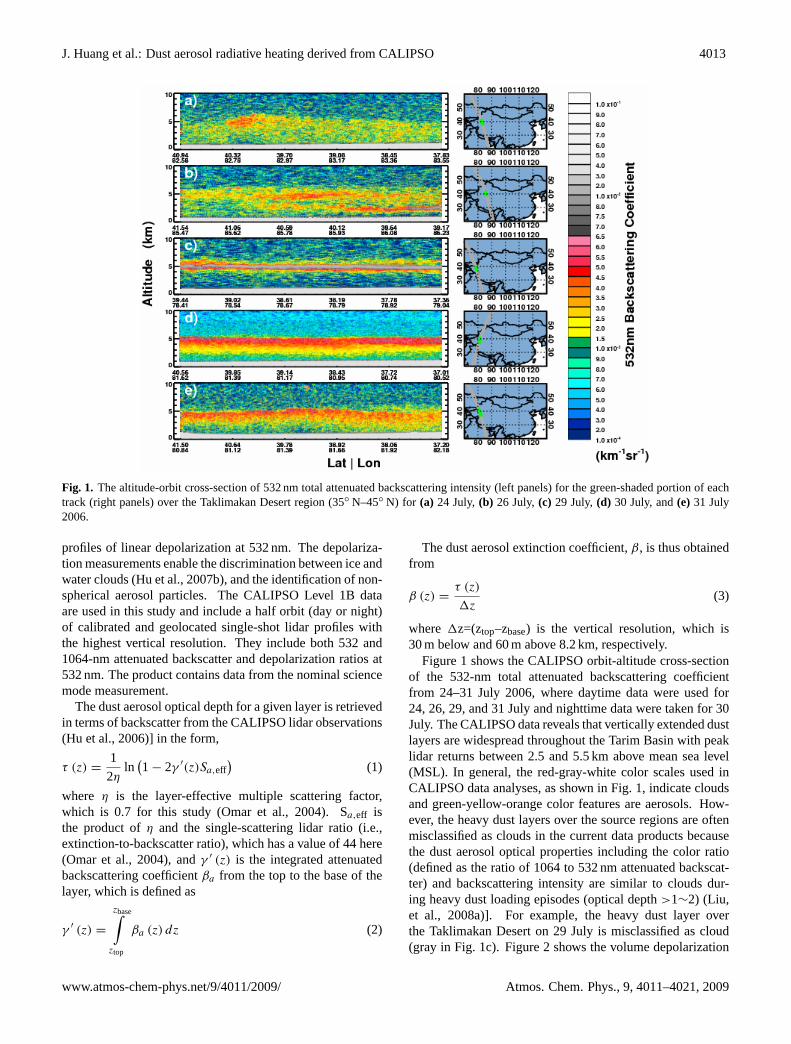
Fig. 1. The altitude-orbit cross-section of 532 nm total attenuated backscattering intensity (left panels) for the green-shaded portion of eachtrack (right panels) over the Taklimakan Desert region (35◦ N–45◦ N) for (a) 24 July,(b) 26 July,(c) 29 July,(d) 30 July, and(e) 31 July2006.
profiles of linear depolarization at 532 nm. The depolariza-tion measurements enable the discrimination between ice andwater clouds (Hu et al., 2007b), and the identification of non-spherical aerosol particles. The CALIPSO Level 1B dataare used in this study and include a half orbit (day or night)of calibrated and geolocated single-shot lidar profiles withthe highest vertical resolution. They include both 532 and1064-nm attenuated backscatter and depolarization ratios at532 nm. The product contains data from the nominal sciencemode measurement.
The dust aerosol optical depth for a given layer is retrievedin terms of backscatter from the CALIPSO lidar observations(Hu et al., 2006)] in the form,
τ (z) =1
2ηln
(1 − 2γ ′(z)Sa,eff
)(1)
where η is the layer-effective multiple scattering factor,which is 0.7 for this study (Omar et al., 2004). Sa,eff isthe product ofη and the single-scattering lidar ratio (i.e.,extinction-to-backscatter ratio), which has a value of 44 here(Omar et al., 2004), andγ ′ (z) is the integrated attenuatedbackscattering coefficientβa from the top to the base of thelayer, which is defined as
γ ′ (z) =
zbase∫ztop
βa (z) dz (2)
The dust aerosol extinction coefficient,β, is thus obtainedfrom
β (z) =τ (z)
1z(3)
where 1z=(ztop–zbase) is the vertical resolution, which is30 m below and 60 m above 8.2 km, respectively.
Figure 1 shows the CALIPSO orbit-altitude cross-sectionof the 532-nm total attenuated backscattering coefficientfrom 24–31 July 2006, where daytime data were used for24, 26, 29, and 31 July and nighttime data were taken for 30July. The CALIPSO data reveals that vertically extended dustlayers are widespread throughout the Tarim Basin with peaklidar returns between 2.5 and 5.5 km above mean sea level(MSL). In general, the red-gray-white color scales used inCALIPSO data analyses, as shown in Fig. 1, indicate cloudsand green-yellow-orange color features are aerosols. How-ever, the heavy dust layers over the source regions are oftenmisclassified as clouds in the current data products becausethe dust aerosol optical properties including the color ratio(defined as the ratio of 1064 to 532 nm attenuated backscat-ter) and backscattering intensity are similar to clouds dur-ing heavy dust loading episodes (optical depth>1∼2) (Liu,et al., 2008a)]. For example, the heavy dust layer overthe Taklimakan Desert on 29 July is misclassified as cloud(gray in Fig. 1c). Figure 2 shows the volume depolarization
www.atmos-chem-phys.net/9/4011/2009/ Atmos. Chem. Phys., 9, 4011–4021, 2009
4014 J. Huang et al.: Dust aerosol radiative heating derived from CALIPSO
32
1 2
3 4
5
6 Figure 2. The altitude-orbit cross-section of volume depolarization ratio (a) and 7
1064-nm/532-nm backscatter color ratio (b) for July 29, 2006 over Taklimakan Desert 8 region (35°N-45° N). 9
32
1 2
3 4
5
6 Figure 2. The altitude-orbit cross-section of volume depolarization ratio (a) and 7
1064-nm/532-nm backscatter color ratio (b) for July 29, 2006 over Taklimakan Desert 8 region (35°N-45° N). 9
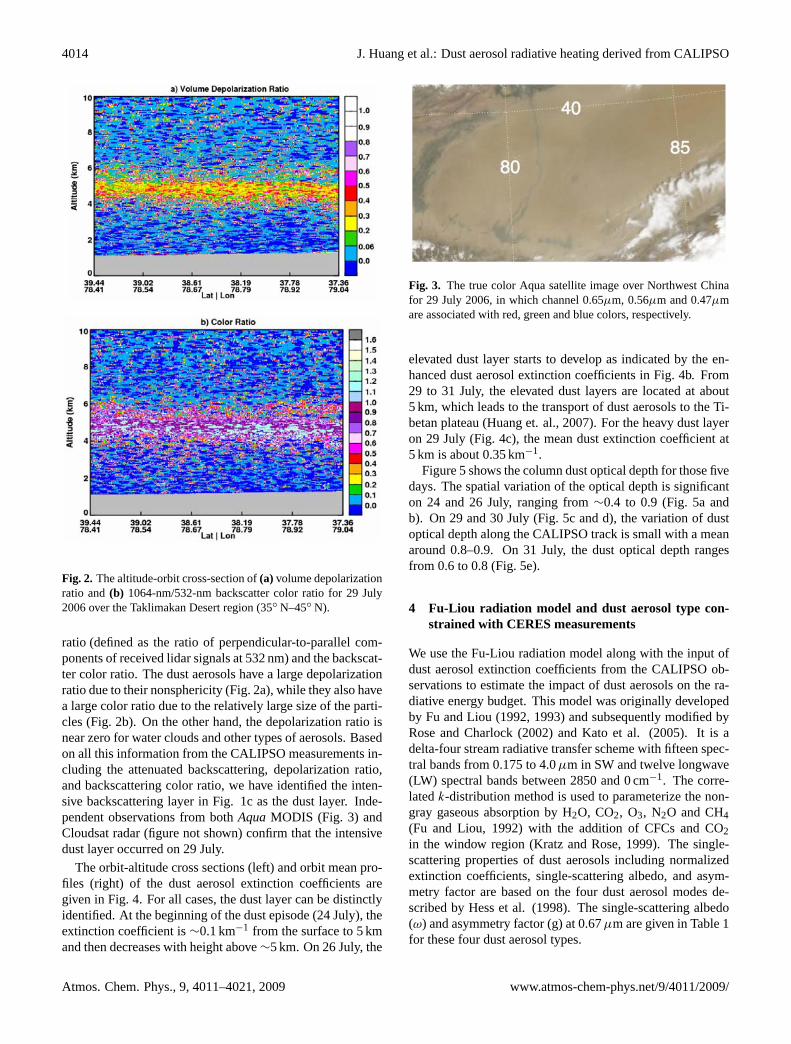
Fig. 2. The altitude-orbit cross-section of(a) volume depolarizationratio and(b) 1064-nm/532-nm backscatter color ratio for 29 July2006 over the Taklimakan Desert region (35◦ N–45◦ N).
ratio (defined as the ratio of perpendicular-to-parallel com-ponents of received lidar signals at 532 nm) and the backscat-ter color ratio. The dust aerosols have a large depolarizationratio due to their nonsphericity (Fig. 2a), while they also havea large color ratio due to the relatively large size of the parti-cles (Fig. 2b). On the other hand, the depolarization ratio isnear zero for water clouds and other types of aerosols. Basedon all this information from the CALIPSO measurements in-cluding the attenuated backscattering, depolarization ratio,and backscattering color ratio, we have identified the inten-sive backscattering layer in Fig. 1c as the dust layer. Inde-pendent observations from bothAquaMODIS (Fig. 3) andCloudsat radar (figure not shown) confirm that the intensivedust layer occurred on 29 July.
The orbit-altitude cross sections (left) and orbit mean pro-files (right) of the dust aerosol extinction coefficients aregiven in Fig. 4. For all cases, the dust layer can be distinctlyidentified. At the beginning of the dust episode (24 July), theextinction coefficient is∼0.1 km−1 from the surface to 5 kmand then decreases with height above∼5 km. On 26 July, the
33
1 2 3 4 5
6
7 8 9 10 11
Figure 3. The true color Aqua MODIS image over northwestern China during July 29, 2006, 12 in which the channels 0.65, 0.56, and 0.47μm are assigned the colors, red, green and blue, 13 respectively. 14 15 16 17 18 19
20 21 22
23
Fig. 3. The true color Aqua satellite image over Northwest Chinafor 29 July 2006, in which channel 0.65µm, 0.56µm and 0.47µmare associated with red, green and blue colors, respectively.
elevated dust layer starts to develop as indicated by the en-hanced dust aerosol extinction coefficients in Fig. 4b. From29 to 31 July, the elevated dust layers are located at about5 km, which leads to the transport of dust aerosols to the Ti-betan plateau (Huang et. al., 2007). For the heavy dust layeron 29 July (Fig. 4c), the mean dust extinction coefficient at5 km is about 0.35 km−1.
Figure 5 shows the column dust optical depth for those fivedays. The spatial variation of the optical depth is significanton 24 and 26 July, ranging from∼0.4 to 0.9 (Fig. 5a andb). On 29 and 30 July (Fig. 5c and d), the variation of dustoptical depth along the CALIPSO track is small with a meanaround 0.8–0.9. On 31 July, the dust optical depth rangesfrom 0.6 to 0.8 (Fig. 5e).
4 Fu-Liou radiation model and dust aerosol type con-strained with CERES measurements
We use the Fu-Liou radiation model along with the input ofdust aerosol extinction coefficients from the CALIPSO ob-servations to estimate the impact of dust aerosols on the ra-diative energy budget. This model was originally developedby Fu and Liou (1992, 1993) and subsequently modified byRose and Charlock (2002) and Kato et al. (2005). It is adelta-four stream radiative transfer scheme with fifteen spec-tral bands from 0.175 to 4.0µm in SW and twelve longwave(LW) spectral bands between 2850 and 0 cm−1. The corre-latedk-distribution method is used to parameterize the non-gray gaseous absorption by H2O, CO2, O3, N2O and CH4(Fu and Liou, 1992) with the addition of CFCs and CO2in the window region (Kratz and Rose, 1999). The single-scattering properties of dust aerosols including normalizedextinction coefficients, single-scattering albedo, and asym-metry factor are based on the four dust aerosol modes de-scribed by Hess et al. (1998). The single-scattering albedo(ω) and asymmetry factor (g) at 0.67µm are given in Table 1for these four dust aerosol types.
Atmos. Chem. Phys., 9, 4011–4021, 2009 www.atmos-chem-phys.net/9/4011/2009/

J. Huang et al.: Dust aerosol radiative heating derived from CALIPSO 4015
34
1
2 Figure 4. The altitude-orbit cross-section of dust aerosol extinction coefficient (left panels) 3
and orbit averaged vertical profile for a) July24, b) July 26 c) July 29, d) July 30, and e) 4 July 31, 2006. 5
6 7 8 9 10 11 12 13 14 15
Fig. 4. The altitude-orbit cross-section of dust aerosol extinction coefficient (left panels) and orbit averaged vertical profile for(a) 24 July,(b) 26 July(c) 29 July,(d) 30 July, and(e)31 July 2006.
Table 1. Single-scattering albedo (ω) and asymmetry factor (g) at 0.67µm for 4 dust aerosol types used in Fu-Liou model.
Nucleation mode Accumulation mode Transported mode Coarse mode
Single-scattering albedo (ω) 0.9767 0.9203 0.89 0.7266asymmetry factor (g) 0.6471 0.7143 0.7460 0.8613
For a given time and location, the pressure, tempera-ture, and water vapor profiles are interpolated from theNCEP/NCAR reanalysis and ozone concentration is takenfrom the NCEP Stratospheric Monitoring Group OzoneBlended Analysis (SMOBA) product based on SBUV andTOVS observations. The surface albedo is based on MODISobservations as used by the CERES team (Minnis et al.,2008) with the spectral dependence prescribed for the desertscene type (T. Charlock, personal communication, 2007),which is validated with the CERES observations along theFu-Liou radiation model. The mean value of the broadbandsurface albedo used in this study is 0.346 and the standarddeviation is 0.005. Climatological concentrations are usedfor CO2, CH4, N2O, and CFCs.
To evaluate the radiative heating and forcing due to dustaerosols, the aerosol optical properties such as extinction co-efficient, single-scattering albedo and asymmetry factor arerequired. These properties depend upon dust characteris-
tics such as density, size distribution, and refractive index.The dust aerosol extinction coefficients at 532 nm are de-rived from CALIPSO measurements. In this study, we se-lect the dust aerosol type that determines the single-scatteringalbedo and asymmetry factor and the spectral dependencesof dust single-scattering properties by comparing the model-simulated reflected instantaneous solar radiative fluxes at theTOA with those observed by CERES. The CERES AquaEdition 1B SSF data are used here (Wielicki et al., 1996).CERES SSF data sets combine CERES radiation measure-ments, MODIS cloud microphysical retrievals, and ancillarymeteorology fields to form a comprehensive, high-qualitycompilation of satellite-derived cloud, aerosol, and radiationbudget information for radiation and climate studies.
To optimize the dust aerosol single-scattering albedo andasymmetry factor used over the Taklimakan region, wecompare the CERES TOA solar fluxes with Fu-Liou modelsimulations along the CALIPSO orbit using 4 different dust
www.atmos-chem-phys.net/9/4011/2009/ Atmos. Chem. Phys., 9, 4011–4021, 2009

4016 J. Huang et al.: Dust aerosol radiative heating derived from CALIPSO
35
1 2 Figure 5. Integrated dust optical depth derived from CALIPSO measurements for (a) July 3
24, (b) Jul 26, (c) July 29, (d) July 30, and (e) July 31, 2006. 4 5 6 7
8
Fig. 5. Dust aerosol optical depth along CALIPSO track for(a) 24July, (b) 26 July,(c) 29 July,(d) 30 July, and(e)31 July 2006.
aerosol types from OPAC (Optical properties of aerosol andclouds: The software package OPAC) (Hess, et al., 1998).We found that the dust aerosol type that fits best is the trans-ported mode. Figure 6 shows a comparison of the TOAreflected solar fluxes derived from the Fu-Liou model withCERES measurements along the CALIPSO orbit over theTaklimakan Desert region (35◦ N–45◦ N) for the daytimecases (24, 26, 29, 31 July). The model-simulated TOA short-wave fluxes agree reasonably well with those from CERES.The averaged difference between the model simulations andCERES measurements is only 1.5 Wm−2. Thus, it is clearfrom this comparison that the radiative transfer model con-
36
1
2
3
4
5
6 7 8 Figure 6. Comparison of the modeled TOA short-wave flux with CERES along the orbit of 9
CALIPSO over Taklamkan Desert region (35°N-45°N) 10 11 12 13
Fig. 6. Comparison of the modeled simultaneous TOA shortwaveflux with CERES observations along the CALIPSO orbit over theTaklimakan Desert region (35◦ N–45◦ N) on 24, 26, 29, and 31 July2006.
strained with the CERES observations can be used to reliablydetermine the variation of dust aerosol radiative heating rateswith the input of vertical distributions of dust aerosols fromCALIPSO measurements.
We thus used the single-scattering albedo and asymmetryfactor and their spectral dependences for the transported dustaerosol mode in all the simulations. The extinction coeffi-cient is from
β(λ) =β(532 nm)
β0(532)β0(λ), (4)
where β(532 nm) is the dust extinction coefficient fromCALIPSO at 532 nm andβ0 is the normalized extinction co-efficients of the transported dust aerosol mode. Thus, ourcalculations allowed the extinction coefficient profiles to varyaccording to the CALIPSO observations.
5 Taklimakan dust aerosol radiative heating and forc-ing
Figures 7–9 show the impact of dust aerosols on the daily-mean (24 h average) SW, LW, and net heating rates, respec-tively. They are obtained as the differences between the sim-ulated radiative heating rates with and without consideringthe observed dust aerosols. The dust has a significant ef-fect on SW radiation. For relatively light (Fig. 7a), moderate(Fig. 7b and e) and heavy dust layers (Fig. 7c and d), dustaerosols heat the atmosphere via absorption of SW radiationby up to∼1, 2, and 3 K day−1, respectively. The maximumdaily-mean solar radiative heating rate of 7 K day−1 is foundat 5 km on 29 July. Figure 7 shows that the SW heating rateshave a peak corresponding to the maximum dust aerosol ex-tinction coefficient levels.
Atmos. Chem. Phys., 9, 4011–4021, 2009 www.atmos-chem-phys.net/9/4011/2009/

J. Huang et al.: Dust aerosol radiative heating derived from CALIPSO 4017
37
1 2 3 4 5 6
7 8
Figure 7. The altitude-orbit cross-section of the impact of dust aerosols on the daily averaged 9 shortwave heating rates (left panels) and orbit averaged vertical profile for a) July24, b) 10 July 26 c) July 29, d) July 30, e) July 31, 2006. Units: K day-1. 11
Fig. 7. The altitude-orbit cross-section of daily averaged shortwave heating rates due to dust aerosols (left panels) and the orbit-averagedvertical profile (right panels) for(a) 24 July,(b) 26 July(c) 29 July,(d) 30 July, and(e)31 July 2006. Unit: K day−1.
Table 2a. Daily mean radiative forcing of dust aerosols at TOAover the Taklimankan region. Unit: Wm−2
Date 24 July 26 July 29 July 30 July 31 July Mean
SW 12.49 15.6 14.93 14.42 13.13 14.11LW 28.64 28.86 32.73 27.64 33.65 30.30Net 41.13 44.46 47.66 42.06 46.78 44.41
Table 2b. Same as Table 2a, but for surface. Unit: Wm−2.
Date 24 July 26 July 29 July 30 July 31 July Mean
SW −49.70 −67.0 −73.53 −67.27 −66.12 −64.72LW 19.92 23.37 21.93 22.58 26.36 22.83Net −29.78 −43.63 −51.60 −44.69 −39.76 −41.89
Although dust aerosols appear to have less effect on LWradiative heating rates (Fig. 8), they do show a warming ef-fect below the dust layers and cooling near the top of the lay-ers. The maximum warming, which occurs near the surface,is typically about 0.5 K day−1. The LW cooling ranges from
Table 2c.Same as Table 2a, but for in atmosphere. Unit: Wm−2.
Date 24 July 26 July 29 July 30 July 31 July Mean
SW 62.19 82.6 88.46 81.69 79.25 78.83LW 8.72 5.49 10.8 5.06 7.29 7.47Net 70.91 88.09 99.26 86.75 86.54 86.31
near zero on 24 July to about−1.5 K day−1 on 29 July, whichpartly compensates the large solar radiative heating near thetop of the dust layers. The net aerosol heating near the dustlayer top is about 1 K day−1 on 24 July, 1.5–2.0 K day−1 on26 July, 5.5 K day−1 on 29 July, 3 K day−1 on 30 July, and1.5 K day−1 on 31 July (Fig. 9). The net heating rates due tothe dust aerosols are about 0.5–1.0 K day−1 below and abovethe dust layers.
Table 2 shows the daily-mean dust aerosol radiation forc-ing at the TOA and surface and in the atmosphere overthe Taklimakan region. Dust aerosols have a warming ef-fect at the TOA in both SW and LW radiation, which areabout 14 and 30 W m−2, respectively. The net warming is44.4 W m−2. The positive solar radiative forcing is due tothe elevated absorbing dust aerosol layer above the highly
www.atmos-chem-phys.net/9/4011/2009/ Atmos. Chem. Phys., 9, 4011–4021, 2009

4018 J. Huang et al.: Dust aerosol radiative heating derived from CALIPSO
38
1 2 3 4 5 6
7 Figure 8. Same as Fig. 7 but for longwave heating rate. 8
Fig. 8. Same as Fig. 7, but for longwave heating rates.
Table 3. Estimation of uncertainties of radiation forcing. Unit: Wm−2.
SSA±6% Surface Albedo±10% Lidar Ratio±20%
TOA Surface Atmos TOA Surface Atmos TOA Surface AtmosSW ∓14.815 ±11.450 ∓26.265 ±4.585 ±3.360 ±1.225 ±1.775 ∓11.155 ±12.935LW ∓0.360 ∓0.370 ±0.010 0 0 0 ±4.820 ±3.480 ±1.335Net ∓15.175 ±11.080 ∓26.255 ±4.585 ±3.360 ±1.225 ±6.595 ∓7.675 ±14.270
Table 4. Estimation of uncertainties of vertical averaged atmo-spheric heating rate. Unit: K/day
SSA±6% Surface Albedo±10% Lidar Ratio±20%
SW ∓0.272 ±0.010 ±0.138LW ∓0.004 0 ±0.019Net ∓0.276 ±0.010 ±0.157
reflective desert surface. The dust aerosol radiative forcingin the atmosphere is also positive for both SW and LW radi-ation, which are 78.8 and 7.5 W m−2, respectively, and thetotal warming is 86.3 W m−2. The dust aerosols cool the
surface significantly by decreasing the incident SW radia-tion (−64.7 W m−2) but warms it through the dust-emittedLW radiation (22.8 W m−2). The net cooling at the surfaceis 41.9 W m−2. Table 2 indicates that both SW and LW ra-diative forcing of dust aerosols play an important role in theradiative energy budget at the TOA and the surface.
6 Uncertainties in radiation forcing
Although this study attempts to minimize the errors by us-ing reliable observations for the model input and to constrainthe dust aerosol single-scattering properties, the estimateddust radiative forcing may have some unavoidable uncertain-ties. They are related to the uncertainties in the CALIPSO
Atmos. Chem. Phys., 9, 4011–4021, 2009 www.atmos-chem-phys.net/9/4011/2009/

J. Huang et al.: Dust aerosol radiative heating derived from CALIPSO 4019
39
1 2 3 4 5 6
7 8 Figure 9. Same as Fig. 7 but for net heating rate. 9 10
11
Fig. 9. Same as Fig. 7, but for net heating rates.
lidar ratio for the retrieval of dust aerosol extinction co-efficient, surface albedo, and dust aerosol single scatteringalbedo (SSA). The range of uncertainties in the CALIPSOlidar ratio is about 20% (Winker et al., 2006). The sensitivitytest showed that the lidar ratio uncertainty of±20% can leadto uncertainties of about±6.8,∓7.6,±14.4 Wm−2 in the netdust radiative forcing at the TOA, in the atmosphere, and atthe surface, respectively (see Table 3). The surface albedois another possible source of error. If the surface albedo un-certainty is±10%, the dust SW radiation forcing at TOAand surface will be changed about±4.6, ±3.4 Wm−2, re-spectively (see Table 3). Detailed discussion of uncertaintiesin SW radiative forcing with respect to surface albedo canbe found in the studies of Claquin et al. (1998) and Liaoand Seinfeld (1998). The major uncertainty in the estimateddust radiative forcing arises from the SSA. A±0.03 uncer-tainty in the AERONET SSA (Dubovik et al., 2002) can leadto a 12% uncertainty in the SW TOA forcing. Our sensitiv-ity test revealed that the largest error is caused by the SSAuncertainty. The observation study of AERONET showsthat maximum dust SW spectral weighted SSA may be 0.94over Taklimakan, i.e., current value 0.89+6% (Dubovik et al.,2002). Thus, the uncertainty range in the SSA is estimatedto be±6%. A ±6% change in SSA (with a constraint thatSSA should not be larger than one) can lead to about∓15.2,
±11.1, ∓26.3 Wm−2 uncertainties in the net dust radiativeforcing at TOA, in the atmosphere, and at the surface, re-spectively (see Table 3). Although the aforementioned threeparameters have large effects on the estimated dust radiativeforcing, the pattern of dust heating rate is not affected. Onlythe magnitude of the dust heating rate varies with the changesof parameters. The SSA was found to have its largest ef-fect in regulating the magnitude of the dust heating rate. Ifthe SSA increases by 10%, the net vertically averaged at-mospheric heating rate will change by roughly 0.27 K day−1
(see Table 4). The lidar ratio uncertainty of±20% can leadto ∼0.16 K day−1 uncertainty in the net vertical mean atmo-spheric heating rate (see Table 4), while 10% changes in thesurface albedo can only cause 0.01 K day−1 changes in thenet vertical mean atmospheric heating rate.
7 Discussion and conclusions
In this study, we investigated the impact of dust aerosols onthe radiative energy budget over the Taklimakan Desert dur-ing dust episodes in late July 2006. The dust aerosol radiativeforcing was estimated using the Fu-Liou model along withCALIPSO and CERES measurements. It was determinedthat dust aerosols warm the atmosphere over the Takli-makan, especially at the levels between 3 and 6 km where the
www.atmos-chem-phys.net/9/4011/2009/ Atmos. Chem. Phys., 9, 4011–4021, 2009

4020 J. Huang et al.: Dust aerosol radiative heating derived from CALIPSO
maximum aerosol extinction coefficients are found. In thedusty atmospheric layers, the dust typically heats the layerby up to 1–3 K day−1 depending on the dust concentration.The maximum daily mean net (shortwave + longwave) radia-tive heating rate reached 5.5 K day−1 at 5 km on 29 July.The averaged daily mean net radiative forcings of the dustaerosols, averaged over our case studies, were 44.4,−41.9,and 86.3 W m−2, respectively, at the TOA, surface, and in theatmosphere. Among these forcings about two thirds of thewarming effect at the TOA is due to absorption and emissionof longwave radiation by the layer, while about 90% of atmo-spheric warming is due to absorption of the solar radiation.At the surface, about one third of the dust aerosol solar radia-tive cooling effect is compensated by the dust aerosol long-wave warming effect. This study indicates that both short-wave and longwave radiative forcing of dust aerosols play animportant role in the radiative energy budget at the TOA andthe surface.
For the radiative effect of the dust aerosol, the most impor-tant factors for the shortwave forcing of dust aersols at theTOA are the aerosol optical depth and the single scatteringalbedo while the longwave forcing is highly dependent on thevertical profile of the dust aerosols. Previous spectral, simul-taneous remote and in situ observations suggest that the sin-gle scattering albedo of pure dust at a wavelength of 0.67µmis predominantly in the range from 0.90 to 0.99, with a cen-tral global estimate of 0.96 (Forster, et al., 2007). This is inaccordance with the bottom-up modeling ofω based on thehematite content in desert dust sources (Claquin et al., 1999;Shi et al., 2005). Analyses ofω from long-term AERONETsites influenced by Saharan dust suggest an average valueof 0.95 at 0.67µm (Dubovik et al., 2002), while unpollutedAsian dust during the Aeolian Dust Experiment on Climate(ADEC) had an average value of 0.93 at 0.67µm (Mikamiet al., 2006). These highω values suggest that a signifi-cant positive shortwave radiative forcing by dust is unlikely(Forster et al., 2007). However, our results suggest that thesingle scattering albedo of Taklimakan dust aerosols is about0.89 at 0.67µm which is about 6% less than Saharan dust.The mean shortwave radiative forcing at TOA is as much as14.1 Wm−2.
Acknowledgements.This research is supported by the National Sci-ence Foundation of China under grant (40628005, and 40633017)and National Basic Research Program of China (2006CB400501).Q. Fu is also supported by NASA Grant NNX08AF66G. This re-search was also supported by the CALIPSO and CloudSat projects.The CALIPSO and CERES data were obtained from the NASAEarth Observing System Data and Information System, DistributedActive Archive Center (DAAC) at the Langley Research Center.
Edited by: J. Quaas
References
Ackerman A. S., Toon, O. B., Stevens, D. E., Heymsfield, A. J., Ra-manathan, V., and Welton, E. J.: Reduction of tropical cloudinessby soot, Science, 288, 1042–1047, 2000.
Albrecht, B. A.: Aerosols, cloud microphysics, and fractionalcloudiness, Science, 245, 1227–1230, 1989.
Carlson, T. N., and Benjamin, S. G.: Radiative heating rates forSaharan dust, J. Atmos. Sci., 37, 193–213, 1980.
Claquin, T., Schulz, M., Balkanski, Y. J., and Boucher, O.: Uncer-tainties in assessing radiative forcing by mineral dust, Tellus B,50, 491–505, 1998.
Claquin, T., Schulz, M., and Balkanski, Y.: Modeling the miner-alogy of atmospheric dust, J. Geophys. Res., 104(D18), 22243–22256, 1999.
Dubovik, O., Holben, B., Eck, T. F., et al.: Variability of absorptionand optical properties of key aerosol types observed in world-wide locations, J. Atmos. Sci., 59, 590–608, 2002.
Forster, P., Ramaswamy, V., Artaxo, P., Berntsen, T., Betts, R.,Fahey, D. W., Haywood, J., Lean, J., Lowe, D.C., Myhre, G.,Nganga, J., Prinn, R., Raga, G., Schulz, M., and Van Dorland,R.: Changes in Atmospheric Constituents and in Radiative Forc-ing, in: Climate Change 2007: The Physical Science Basis. Con-tribution of Working Group I to the Fourth Assessment Reportof the Intergovernmental Panel on Climate Change, edited by:Solomon, S., Qin, D., Manning, M., Chen, Z., Marquis, M., Av-eryt, K. B., Tignor, M., and Miller, H. L., Cambridge UniversityPress, Cambridge, UK and New York, NY, USA, 2007.
Fu, Q., and Liou, K.-N.: On the correlated k-distribution methodfor radiative transfer in nonhomogenous atmospheres, J. Atmos.Sci., 49, 2139–2156, 1992.
Fu, Q., and Liou, K. N.: Parameterization of the radiative propertiespf cirrus clouds, J. Atmos. Sci., 50, 2008–2025, 1993.
Hess, M. P., Koepke, P., and Schultz, I.: Optical properties ofaerosol and clouds: The software package OPAC, B. Am. Me-teor. Soc., 79, 831–844, 1998.
Huang, J., Lin, B., Minnis, P., Wang, T., Wang, X., Hu, Y., Yi,Y., and Ayers, J. K.: Satellite-based assessment of possible dustaerosols semidirect effect on cloud water path over East Asia,Geophys. Res. Lett., 33, L19802, doi:10.1029/2006GL026561,2006.
Huang, J., Minnis, P., Yi, Y., Tang, Q., Wang, X., Hu, Y., Liu, Z.,Ayers, K., Trepte, C., and Winker, D.: Summer dust aerosolsdetected from CALIPSO over the Tibetan Plateau, Geophys. Res.Lett., 34, L18805, doi:10.1029/2007GL029938, 2007.
Huang, J., Minnis, P., Chen, B., Huang, Z., Liu, Z., Zhao,Q., Yi, Y., and Ayers, J.: Long-range transport and verti-cal structure of Asian dust from CALIPSO an surface mea-surements during PACDEX, J. Geophys. Res., 113, D23212,doi:10.1029/2008JD010620, 2008.
Hu, Y., Liu, Z., Winker, D., Vaughan, M., Noel, V., Bissonnette, L.,Roy, G., and McGill, M.: A simple relation between depolariza-tion and multiple scattering of water clouds and its applicationfor lidar calibration, Opt. Lett., 31, 1809–1811, 2006.
Hu, Y., Vaughan, M., Liu, Z., Lin, B., et al.: The depolarization-attenuated backscatter relation: CALIPSO lidar measurementsvs. theory, Opt. Express, 15, 5327–5332, 2007.
Iwasaka, Y., Minoura, H., and Nagaya, K.: The transport and spatialscale of Asian dust-storm clouds: A case study of the dust-stormevent of April 1979, Tellus B, 35, 189–196, 1983.
Atmos. Chem. Phys., 9, 4011–4021, 2009 www.atmos-chem-phys.net/9/4011/2009/

J. Huang et al.: Dust aerosol radiative heating derived from CALIPSO 4021
Kato, S., Charlock, T. P., and Rose, F. G.: Paper Computationof Domain-Averaged Irradiance Using Satellite-Derived CloudProperties, J. Atmos. Ocean. Technol., 22b, 146–164, 2005.
Koren, I., Kaufman, Y. J., Remer, L. A., and Marins, J. V.: Mea-surement of the Effect of amazon smoke on inhibition of cloudformation, Science, 303, 1342–1345, 2004.
Kratz, D. P. and Rose, F. G.: Accounting for molecular absorp-tion within the spectral range of the CERES window channel, J.Quant. Spectrosc. Radiat. T., 48, 83, 1999.
Kruger, O. and Graßl, H.: Albedo reduction by absorb-ing aerosols over China, Geophys. Res. Lett., 31, L02108,doi:10.1029/2003GL019111, 2004.
Liao, H. and Seinfeild, J. H.: Radiative forcing by mineraldust aerosols: Sensitivity to key variables, J. Geophys. Res.,103(D24), 31637–31645, 1998.
Liu, Z., Vaughan, M. A., Winker, D. M., Hostetler, C. A., Poole,L. R., Hlavka, D., Hart, W., and McGill, M.: Use of probabil-ity distribution functions for discriminating between cloud andaerosol in lidar backscatter data, J. Geophys. Res., 109, D15202,doi:10.1029/2004JD004732, 2004.
Liu, Z., Liu, D., Huang, J., Vaughan, M., Uno, I., Sugimoto, N., Kit-taka, C., Trepte, C., Wang, Z., Hostetler, C., and Winker, D.: Air-borne dust distributions over the Tibetan Plateau and surroundingareas derived from the first year of CALIPSO lidar observations,Atmos. Chem. Phys., 8, 5045–5060, 2008.
Meloni, D., Sarra, A. D., Iotio, T. D., and Fiocco, G.: (), Influence ofthe vertical profile of Saharan dust on the visible direct radiativeforcing, J. Quant. Spectrosc. Radiat. T., 93, 497–413, 2005.
Mikami, M., Shi, G. Y., Uno, I., et al.: Aeolian dust ex-periment on climate impact: an overview of Japan-ChinaJoint Project ADEC, Global Planet Change, 52, 142–172,doi:10.1016/j.gloplacha.2006.03.001, 2006.
Minnis, P., Trepte, Q. Z., Sun-Mack, S., Chen, Y., et al.: Clouddetection in non-polar regions for CERES using TRMM VIRSand Terra and Aqua MODIS data, IEEE Trans. Geosci. RemoteSens., 46, 3857–3884, 2008.
Murayama, T., Sugimoto, N., Uno, I., et al.: Ground-based networkobservation of Asian dust events of April 1998 in east Asia, J.Geophys. Res., 106(D16), 18345–18360, 2001.
Omar, A., Winker, D., and Won, J.: Aerosol models for theCALIPSO lidar inversion algorithms, Laser Radar Technologyfor Remote Sensing, Proc. SPIE, 5240, 153–164, 2004.
Rose, F. G. and Charlock, T. P.: New Fu-Liou Code Tested withARM Raman Lidar and CERES in pre-CALIPSO Exercise, Ex-tended abstract for 11th Conference on Atmospheric Radiation(AMS), Ogden, Utah, USA, 3–7 June 2002, 2002.
Satheesh, S. K., Vinoj, V., and Moorthy, K. K.: Vertical distri-bution of aerosols over an urban continental site in India in-ferred using a micro pulse lidar, Geophys. Res. Lett., 33, L20816,doi:10.1029/2006GL027729, 2006.
Shi, G. Y., Wang, H., Wang, B., et al.: Sensitivity experiments onthe effects of optical properties of dust aerosols on their radiativeforcing under clear sky condition, J. Meteorol. Soc. Japan, 83A,333–346, 2005.
Slingo, A., Ackerman, T. P., Allan, R. P., et al.: Observa-tions of the impact of a major Saharan dust storm on theat-mospheric radiation balance, Geophys. Res. Lett., 33, L24817doi:10.1029/2006GL027869, 2006.
Sokolik, I. N. and Toon, O. B.: Incorporation of mineralogical com-position into models of the radiative properties of mineral aerosolfrom UV to IR wavelengths, J. Geophys. Res., 104, 9423–9444,1999.
Stephens, G. L., Vane, D. G., Boain, R. J., Mace, G. G., et al.: TheCloudSat Mission and the A-Train: A New Dimension of Space-Based Observations of Clouds and Precipitation, B. Am. Meteor.Soc., 83, 1771–1790, 2002.
Sun, J., Zhang, M., and Liu, T.: Spatial and temporal characteris-tics of dust storms in China and its surrounding regions, 1960–1999: Relations to source area and climate, J. Geophys. Res.,106, 10325–10333, 2001.
Tegen, I., Lacis, A. A., and Fung, I.: The infl uence on climateforcing of mineral aerosols from disturbed soils, Nature, 380,419–421, doi:10.1038/38041900, 1996.
Tegen, I., Werner, M., Harrison, S. P., and Kohfeld, K. E.: Rela-tive importance of climate and land use in determining presentand future global soil dust emission, Geophys. Res. Lett., 31,L05105, doi:10.1029/2003GL019216, 2004.
Twomey, S.: The influence of pollution on the shortwave albedo ofclouds, J. Atmos. Sci., 34, 1149–1152, 1977.
Uno, I., Yumimoto, K., Shimizu, A., Hara, Y., Sugimoto, N., Wang,Z., Liu, Z., and Winker D. M.: 3D structure of Asian dust trans-port revealed by CALIPSO lidar and a 4DVAR dust model, Geo-phys. Res. Lett., 35, L06803, doi:10.1029/2007GL032329, 2008.
Uno, I., Amano, H., Emori, S., Kinoshita, K., Matsui, I., and Sugi-moto, N.: Trans- Pacific yellow sand transport observed in April1998: A numerical simulation, J. Geophys. Res., 106(D16),18331–18344, doi:10.1029/2000JD900748, 2001.
Wang, S., Wang, J., Zhou, Z., and Shang, K.: Regional character-istics of three kinds of dust storm events in China, Atmos. Envi-ron., 39, 509–520, 2005.
Wielicki, B. A., Barkstrom, B. R., Harrison, E. F., et al.: Clouds andthe Earth’s Radiant Energy System (CERES): an earthobservingsystem experiment, B. Am. Meteor. Soc., 77, 853–868, 1996.
Winker, D., Vaughan, M., and Hunt, W.: The CALIPSO missionand initial results from CALIOP, Proc. SPIE, 6409, 640902,doi:10.1117/12.698003, 2006.
Zhang, J. L. and Christopher, S. A.: Longwave radiativeforcing of Saharan dust aerosols estimated from MODIS,MISR, CERES observtions on Terra, Geophys. Res. Lett., 30,doi:10.1029/2003GL018479, 2003.
Zhang, X. Y., Arimoto, R., and An, Z. S.: Dust emission from Chi-nese desert sources linked to variations in atmospheric circula-tion, J. Geophys. Res., 102(D23), 28041–28044, 1997.
Zhu, A., Ramanathan, V., Li, F., and Kim, D.: Dust plumesover the Pacific, Indian, and Atlantic oceans: Climatol-ogy and radiative impact, J. Geophys. Res., 112, D16208,doi:10.1029/2007JD008427, 2007.
www.atmos-chem-phys.net/9/4011/2009/ Atmos. Chem. Phys., 9, 4011–4021, 2009