Embed Size (px)
Citation preview

2
3
4
5
6
7
8
9
10
II
12
13
14
15
16
7
IPY issue or Environment
Taking the Pulse of PyroCumulus Clouds
Gatcbc l Varnai2.3. R. PoudyaJ2A. khoku2 and M. D.
1 Space Association, Columbia, A4aryland 21228,
]NASA Goddard Space Flight Center, Greenbelt, Maryland 20771,
of ji4aryland, Baltimore County, Baltimore, lvfaryland 2
"'Science Systems and Applications, Inc., Lanham, lvfaryland 20706, USA
5 Laboratory for Atmospheric and Space Physics, University of Colorado, Boulder, Colo
rado, USA.
Correspondence: [email protected]
Abstract: Forest fires can burn large areas, but can also inject smoke into the upper
tropospherellower stratosphere (UT/LS), where stakes are even higher for climate,
because emissions tend to have a longer lifetime, and can produce significant regional
and even global climate effects, as is the case with some volcanoes. Large forest fires
are now believed to be more common in summer, especially in the boreal regions,
pyrocumulus (pyroCu), and occasionally pyrocumuionimbus (pyroCb) douds
are formed, which can transport emissions into the UT/LS. difficulty
models is
a
of observational
can to
https://ntrs.nasa.gov/search.jsp?R=20120009494 2020-02-08T23:19:51+00:00Z

IPY Issue of Atmospheric Environment
summer field campaign in 2008. We find that the angular distribution of radiance
within the pyroCu is closely related to the diffusion domain in water clouds and can
simple functions.
4 Carlo simulations that radiation transport in pyroCu is inherently a 3D phenomenon
5 and must account for particle absorption. However, the simple cosine function prom-
6 ises to offer an easy solution for climate models. The presence of a prominent smoke
7 core, defined by extinction in the UV, VIS NIR, suggests core
8 might be an important pathway for emission transport to the upper troposphere and
9 lower stratosphere. We speculate that this plume injection core is generated and sus-
10 tained by complex processes not yet well understood, but not necessarily related di-
II redly to the intense fires that originally initiated the plume rise.
12

of
L Introduction
Forest tires are known to bum vast areas, and also inject smoke into the upper tropo-
3
4 emissions tend to have a longer lifetime, and can cause regional and global climate effects,
5 as is the case with some volcanic eruptions. Fires of this nature are common in summer in
6 the boreal regions of Alaska, Canada, and Russia (Fromm et aI., 20 10; Soja ct ai., 2007;
7 Stocks ct ai., 2003).
8 Large forest fires release enough energy, both sensible and latent heat, to lift the
9 smoke-laden air beyond the condensation level, resulting in the formation of cumulus
10 clouds. Due to their association with fires, these clouds are commonly referred to as pyro-
11 cumulus (pyroCu), or pyrocumulonimbus (pyroCb) when convective storms are sufficiently
12 deep to glaciate and form anvils. The pyroCbs have unique dynamical and microphysical
13 and an for
14 biomass burning emissions such as aerosols and trace gases, thereby contributing to raising
15 their budgets in the UT/LS (Damoah et aI., 2006; Luderer et aI., 2006; Trentmann ct ai.,
16 2006; Fromm et aI., 2005; Fromm and Servranckx, 2003). There is now growing evidence
17 that wildfires should be considered as additional sources of aerosol and trace gases to the
18 UTiLS region, which was previously thought to be primarily dominated by volcanic erup-
19 (Fromm et at, 2010; et aI., 2006).
There is significant uncertainty on how much of the released
2 atmosphere and is
IPY isSlle of Atmospheric Environment
pyroCu or pyroCb convection is subject to considerable uncertainty. The interaction of this
2 radiative energy with atmospheric constituents is also highly uncertain. In the thermal in-
is
4 ficient absorbers. It is likely that most of the radiative energy from the fire is absorbed by
5 cloud droplets or gaseous absorption at cloud base or in air masses that are entrained into
6 the convective plume. This implies that the radiative energy from the fire is trapped in the
7 lower part of the pyro-convection and therefore contributes to the convective energy. It is
8 therefore important to consider the radiative processes in detaiL
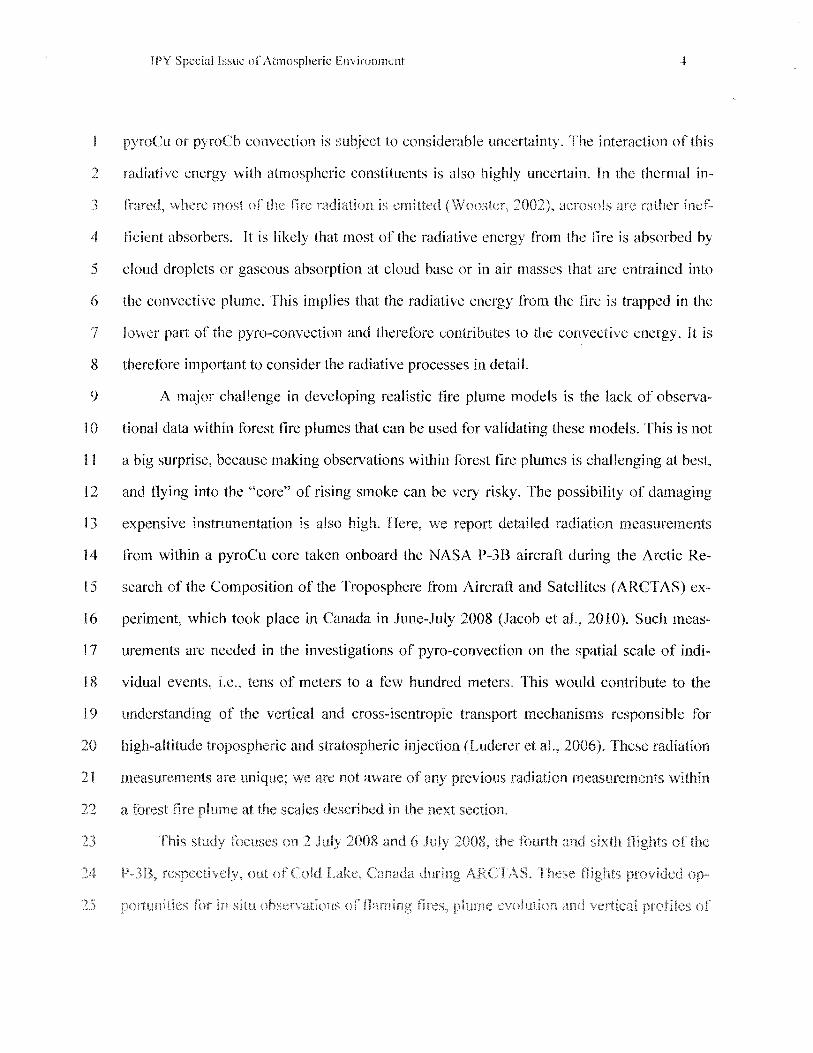
9 A major challenge in developing realistic fire plume models is the lack of observa-
10 tional data within forest fire plumes that can be used for validating these models. This is not
11 a big surprise, because making observations within forest fire plumes is challenging at best,
12 and Hying into the "core" of rising smoke can be very risky. The possibility of damaging
13 expensive instrumentation is also high. Here, we report detailed radiation measurements
14 from within a pyroCu core taken onboard the NASA P-3B aircraft during the Arctic Re-
15 search of the Composition of the Troposphere from Aircraft and Satellites (ARCTAS) ex-
16 periment, which took place in Canada in June-July 2008 (Jacob et aI., 2010). Such meas-
17 urements are needed in the investigations of pyro-convection on the spatial scale of indi-
18 vidual events, i.e., tens of meters to a few hundred meters. This would contribute to the
19 understanding of the vertical and cross-isentropic transport mechanisms responsible for
20 high-altitude tropospheric and stratospheric injection (Luderer et ai., 2006). These radiation
measurements are unique; we are not aware any nn_'I1lC
>l radiation measurements within
a at the described

IPY of Environnwnt
plumes homogeneous outflow Most importantly, they are
where P-3B penetrated the pyroCu clouds of active fire plumes. In this study, we em-
4 sorption Radiometer (CAR; Gatebe et ai., 2003; King et aL 1986), which provides unpre-
5 cedented detail on pyroCu clouds.
6 The CAR instrument measures scattered light in 14 spectral bands betwccn 0.34 and
7 ~Lm and has a unique geometry and is able to scan a scene the atmosphere
8 and surface over a 190° scan angle and at high angular resolution (1 instantaneous field of
9 view). When it is flown inside clouds, it is able to provide a side view in the zenith and na-
10 dir directions, and all scattering angles in between from an aircraft platform with as much
11 as a 5° roll--assuming no aircraft pitch. Data are sampled simultaneously and continuously
12 on nine individual detectors. Eight of the data channels for spectral bands from 0.34 to 1.27
13 ~tm are always during the operation, while the ninth channel is registered
14 signal selected among six spectral channels (1.55-2.30 ~lm) on a filter wheel. The filter
15 wheel can either cyele through all six spectral bands at a prescribed interval (usually chm1-
16 ging filter every fifth scan line), or lock onto anyone of the six spectral bands, mostly
17 1.656, 2.103, or 2.205 ~m, and sample it continuously
18 Observational Assessment of the PyroCn
19 Some of the biggest Saskatchewan fires during the 2008 summer campaign
burned west of Mcintosh Lake and east of Lake Athabaska in Canada. 2 July Flight
21 I8/CAR Flight 2017) 6 July Flight Flight # 2019) the conditions for
a

IPY Special Issue of Atmospheric Em ironment 6
crating during the night. We will not describe the 6 July night because of similarities be-
2 tween the two tlights, however, full details t()f this flight can be found on the CAR website
I 1
4 descriptions, we attempt to paint a picture of the nature and character of the fires and in ad-
5 dition, create a preamble for further work on pyroCu and their effects on climate.
General Description of Flight 2017, 2 July 2008
7 Our objectives for this flight included tlying a segment under the Terra satellite, co-
S ordinated with the NASA 8-200 carrying the High Spectral Resolution Lidar (HSRL) and
9 the Research Scanning Polarimeter (RSP) instrument) with radiation measurements under
10 clear sky conditions stacked at different altitudes, and in situ observations of tlaming fires,
11 showing plume evolution and vertical profiles in homogeneous tire outflow regions. The
12 flight took 6 hours and 20 minutes, with take otf at 15:31 UTC (9:31 a.m. local time; see
13 night log: http://car.gsfc.nasa.gov/data/index.php?id=113&mis_id=8&n=ARCTAS). Fig.
14 la shows the flight path from Cold Lake, heading northeast towards Reindeer Lake. We
15 made measurements collocated with the 8-200 for about 50 minutes beginning at 16:25
16 UTC, and observed active fires of different intensities under scattered cloud conditions. We
17 penetrated an active fire plume near Mcintosh Lake at two altitudes, 1303 m (19: 18 UTC)
18 and 294 m (19:49 UTC) above the local surface, and flew along the plume axis for about 80
19 km to study the evolution of aerosol microphysics during downwind transport. Between the
two penetrations, we obtained radiation measurements in a vertical profile
part of the plume and flew across-plume at a
to
most
sampled
lb
2 on the
Environment
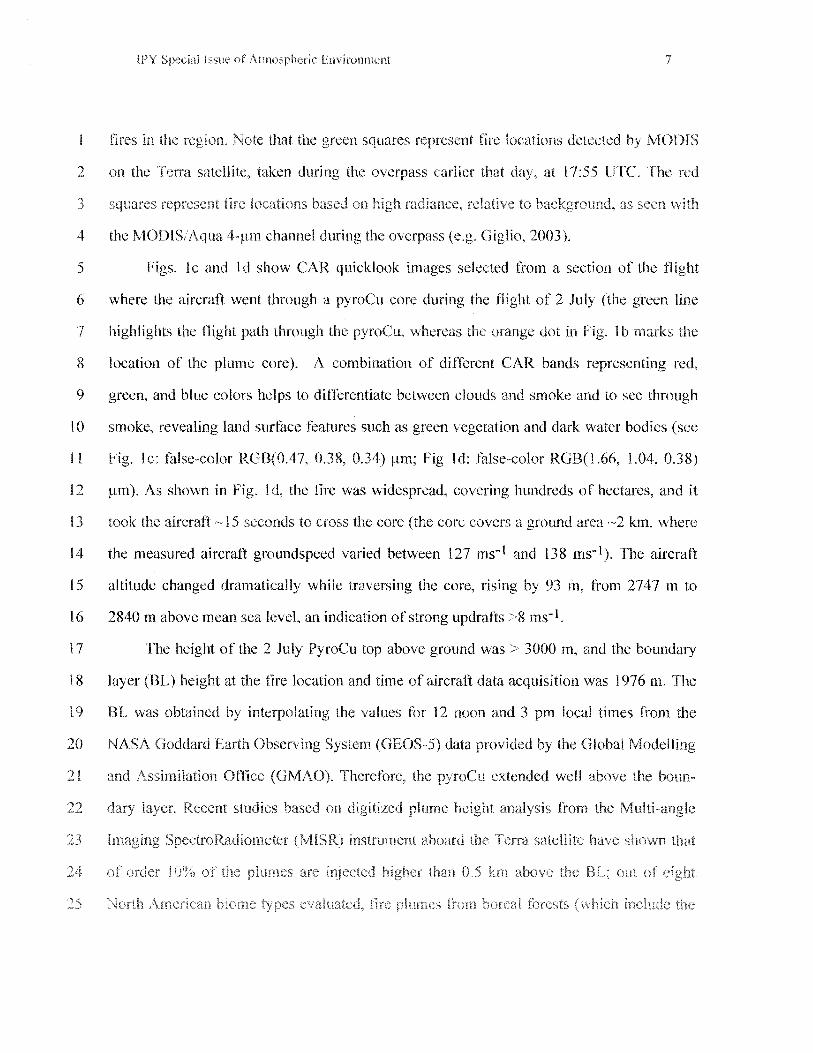
fire
satellite, taken during the overpass earlier that day, at
4 the MODIS/Aqua 4-~lm channel during the overpass (e.g. Giglio, 2003).
MODIS
UTe. The red
5 Figs. Ie and Id show CAR quicklook images selected from a section of the flight
6 where the aircraft went through a pyroCu core during the night of 2 July (the green line
7 highlights the flight path through the pyroCu, whereas orange dot in Fig. 1 b the
8 location of the plume core). A combination of different CAR bands representing red,
9 green, and blue colors helps to differentiate between clouds and smoke and to see through
10 smoke, revealing land surface features such as green vegetation and dark water bodies (see
II Fig. Ic: false-color RGB(0.47, 0.38, 0.34) ~l1n; Fig Id: false-color RGB(1.66, 1.04, 0.38)
12 ~Lm). As shown in Fig. 1 d, the tire was widespread, covering hundreds of hectares, and it
13 the aircraft 15 seconds to cross the core (the core covers a ground area km, where
14 the measured aircraft groundspeed varied between 127 ms- 1 and 138 ms- l ). The aircraft
15 altitude changed dramatically while traversing the core, rising by in, from 2747 m to
16 2840 m above mean sea level, an indication of strong updrafts ms- i .
17 The height of the 2 July PyroCu top above ground was 3000 m, and the boundary
18 layer (BL) height at the tire location and time of aircraft data acquisition was 1976 m. The
19 was obtained by interpolating the 12 noon 3 pm local times from the
20 NASA Goddard Observing System (GEOS-5) data provided by the Global Modelling
21 (GMAO). the well

IPY Issue of Atmospheric Environment 8
study area) are typically injected the highest with a median injection top height of 1200 m
2 (as compared to~800 m for croplands; Kahn et aL 2008; Val Martin et aI., 2(10). Those
3 a
4 (FRP) measurements from MODIS (Ichoku et ai., 20(8), indicating that in addition to at-
5 mospheric stability structure, fire intensity (represented by FRP) has a strong inlluence on
6 plume injection height; plume top heights that reached the free troposphere (FT) were pro-
7 duced mainly by high intensity having a median FRP of order 500 MW. Table 1
8 shows the FRP values of the MODIS fire pixels (depicting their relative intensities) from
9 Aqua coinciding with 2 July 2008 nights (in space but not in time). The FRP data record
10 corresponding spatially to the pyroCu plume penetrated by P-3B is shown in boldface char-
Il acters. However, because of the large ditIerence in time between the FRP measurement
12 from Aqua-MODIS (19:35 UTC) and P-3B penetration of the pyroCu (~21 :05 UTC), this
13 FRP value is much less than what would have been required to generate such a high plume
14 and the associated pyroCu. It is probable that the tire became much stronger by the time of
15 the pyroCu measurement. For the P-3B pyroCu penetration on 6 July 2008, no fire pixels
16 were detected by MODIS within a few km of the pyroCu. It is believed that the pyroCu
17 may have moved substantially away from the fire at the time of its penetration, making it
18 impossible to link it to any specific fire detected by MODIS. Therefore, to establish a cause
19 and effect relationship of such transient features as and their associated plumes and
21
it is crucial to conduct airborne measurements in synchronicity with satellite over
and ground-based measurements whenever possible.

of Environment
Table optical depth, aerosol
2 scattering, aerosol distribution (Russell et aL, 1999; Clarke et aI., 2007), spectral (0.380
4 ance (4.5-42 ~Lm; Pilewskie et al., 2003; Bucholtz personal communication:
5 http://airbomcscicnce.nasa.gov/instrumcntiBBR), angular distribution of scattered radiation
6 in di fferent directions (Gatebe et aI., 2(03), cloud condensation nuclei (Roberts and Nenes,
7 2005; ct ai., 2006), and and et a\., 2007; et
8 a1. 20(5). The base meteorological and navigational measurements were provided by the
9 Project Data System, which is the primary navigational data system for P-3B investigators.
to Fig. 2b shows a schematic of the CAR instrument (Gatebe ct a1., 2003; King et ai.,
11 1986), highlighting main features. Fig. 2c shows a pyroCu taken onboard the NASA P-
12 38 on 2 July 2008 near Reindeer Lake, Saskatchewan, Canada. The aircraft flew around
13 sampling clean and the polluted air downwind. It then flew through
14 the smoke at various altitudes, probing and charting changes in concentration and the
15 "chemical evolution" of the compounds emitted by the fires. The plane also flew into the
16 "core" of the rising tire plumes, where the CAR instrument managed to acquire good data
17 as discussed in this study. These represent the first such measurements in the core of a
18 pyroCb of which we are aware. (See pictures from the 2 July flight on the CAR website at
19 http://car.gsfc.nasa.govldata/photos.php?mis_id=8&n=ARCTAS&d=2008-07-
02&f=20 I and from the 6 July 11ight at
21 http://car.gsfc.nasa.gov/dataiphotos.php?mis_id=8&n=ARCT AS&d=2008-07-
an

IPY Issue Atmospheric Environment
Results and Discussion
2 3.1
3
Ana~vsis of CAR Measurements
core seen
o
Ic ld as
4 the plume, where radiation seems to be uniformly distributed and dominated by strong ab-
5 sorption in all directions. The CAR instrument measured very low spectral radiance values
6 « 1 Wm-2~tm-Iscl in the ultraviolet and visible bands having "A < 0.5 ~L1n, and at ). 1.6
7 ~tln, and Wm-2~m-lsrl for bands between 0.5 ~t1n and 1.3 ~Lm), independent of direc-
8 tion. The radiance distributions within the core at two zenith angles: 5° and 175° at 0.472
9 ~m, shown in Fig. 3 demonstrate that there is hardly any ditJerence between the downwel-
10 ling and upwelling radiance within the core region. The a, band c images in this figures
11 were taken by a forward camera aboard the NASA P-3B at the entry, core, and exit points
12 in the pyroCu. Note the brownish color of the plume inside the core region. The radiance
13 decreases by about two orders of magnitude from outside to the central part of the core, ir-
14 respective of the direction and wavelength. We speculate that the core region plays an im-
15 portant role as the main physical pathway through which emissions from fires are trans-
16 ported into the upper troposphere/lower stratosphere (UT/LS), but this observation needs to
17 be validated.
18 Fig. 4 compares relative spectral radiance as a function of zenith angle for internally
19 scattered radiation measured deep inside an optically thick water cloud, pyroCu and a thick
"pure" is defined by lack of retlectance sensitivity the near-infrared bands
0.87 !.lm), at selected CAR wavelengths. According to King et (1990),
measurements an scan are to

of Environment
changes is than or equal to to assure that are ran-·
2 dom, and not systematic drifts. These criteria pertain to the diffusion domain of an optically
if to
4 liquid water clouds at vvave1engths around 0.67 ~1I11 (as seen in Fig. 4a). The theoretical
5 curve is generated from measured zenith and nadir radianc(;s using the following cosine
6 relationship
7
8
9
10
where
/( r,cos = a + hcos (J
I a = 2 (/0 (r,1) + /180(r,-1)),
1 b = 2 (/o(r, 1) -/180(r,-1)) ( la)
II and fo and fl80 are the zenith and nadir radiances at 8 0° and 8 180°, respectively. From
12 Eq. la, we came up with a general equation for any two downward and upward viewing
13
14
15
16
angks in the form
a = ~(/B'(r,cOSe') + f180_B,(r,-Cose'», 2
b = 1 (/e,(r,eos8') - ,(r,-cose'» (ib) 2eose'
As such, Eq. Ibis not restricted to using zenith (8 = 8' = 0°) and nadir (8 = e' 180°) in-
17 put radiances, unlike Eq. la, and can be used to describe the radiation field in optically
18 thick media given any two downward and upward viewing directions, or 8' = 90° (where b
19 = ) other fonnula can applied to observa-
the zenith and nadir directions, therefore can accommodate
21 acquisition on an airborne piadcmn that has a nonzero pitch and/or roll
water on
IPY ISSLIC of Environmcnt 12
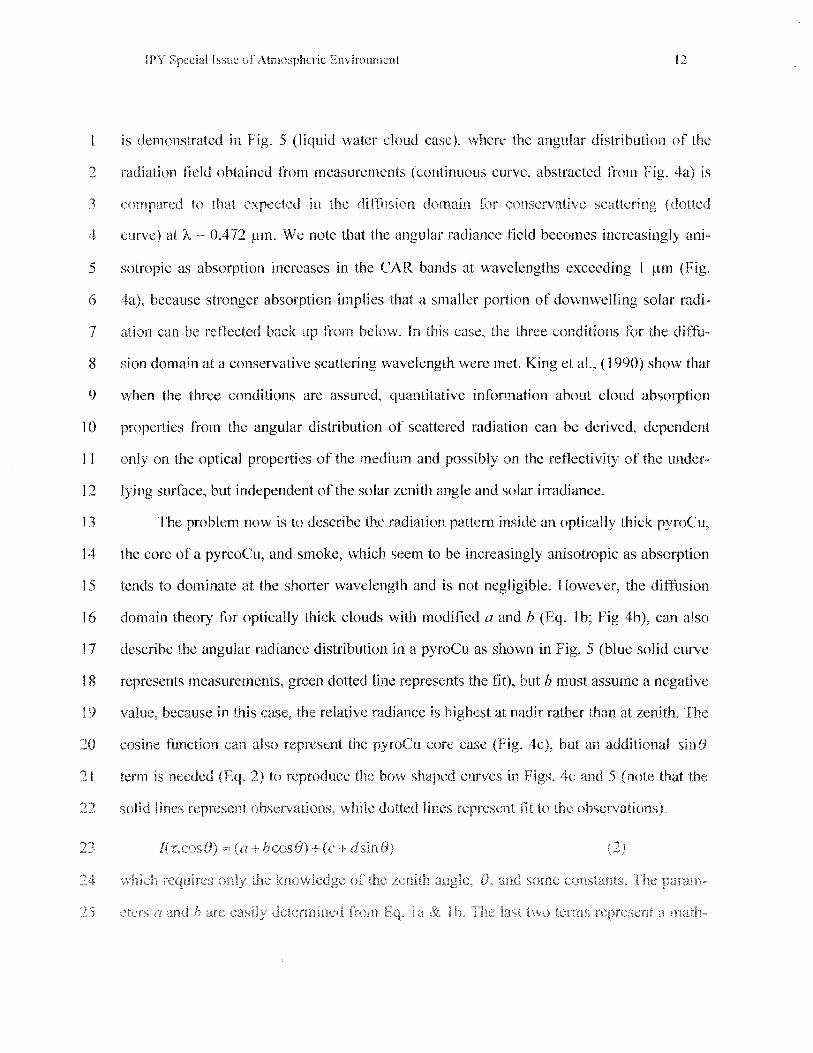
is demonstrated in Fig. 5 (liquid water cloud case), where the angular distribution of the
2 radiation field obtained from measurements (continuous curve, abstracted from Fig. 4a) is
to di
4 curve} at /, 0.472 ~lln. We note that the angular radiance field becomes increasingly ani-
5 sotropic as absorption increases in the CAR bands at wavelengths exceeding I ~tm (Fig.
6 4a), because stronger absorption implies that a smaller portion of downwelling solar radi-
7 can rcl1ected up below. this case, three conditions for the ditfu-
8 sion domain at a conservative scattering wavelength were met. King et ai., (1990) show that
9 when the three conditions are assured, quantitative information about cloud absorption
10 properties from the angular distribution of scattered radiation can be derived, dependent
I I only on the optical properties of the medium and possibly on the reflectivity of the under-
12 lying surface, but independent of the solar zenith angle and solar irradiance.
13 The problem now is to describe the radiation pattern inside an optically thick pyroCu,
14 the core of a pyrcoCu, and smoke, which seem to be increasingly anisotropic as absorption
15 tends to dominate at the shorter wavelength and is not negligible. However, the diifusion
16 domain theory for optically thick clouds with modified a and b (Eq. 1 b; Fig 4b), can also
17 describe the angular radiance distribution in a pyroCu as shown in Fig. 5 (blue solid curve
18 represents measurements, green dotted line represents the fit), but b must assume a negative
19 value, because in this case, the relative radiance is highest at nadir rather than at zenith. The
UIH_ll~'U can represent the pyroCu core case 4c), but an additional e term is 2) to reproduce the bow shaped curves in Figs. and 5 (note that
dotted to

Issue Environment 3
ematical ansatz, the term c is obtained from and nadir radiances
2 1 b, and d was determined through trial and error until the best tit was found (d -0.1). It
is to see that an can
4 scribed by simple geometrical functions, whereby the tirst two terms represent scattering
5 processes, while the third and fourth terms represent absorption processes. To gain better
6 understanding of radiation transport in a pyroCu, we next attempt to reproduce the radiation
7 pattern observed by the CAR instrument using 1 D and 3D Monte Carlo simulations.
8 3.2 Monte Carlo Simulation
9 We now explore the optical characteristics of pyroCu using ID and 3D Monte Carlo
10 radiative transfer simulations. The Monte Carlo model is an appropriately modified version
11 of the code used in several earlier studies, incl uding Varnai and Marshak (200 I), and was
12 also tested in the Intercomparison of 3D Radiation Codes (I3RC) project (Cahalan et aI.,
L3 2005). The actual code used in this paper was also tested through comparisons with
14 DISORT (Discrete Ordinates Radiative Transfer) model (Stamnes et a1. 1988) runs for ab-
15 sorbing, plane-parallel clouds. To keep simulation uncertainties below 0.5%, each result is
16 based on 4 million photon trajectories in backward Monte Carlo simulations.
17 Because the purpose of these Monte Carlo simulations is to understand the basic be-
18 haviours in Fig. 4 (and not to simulate the exact values observed by CAR), the simulations
19 use a simple setup (Fig. 6). The calculations assume a 20 slab cloud that is infinite
cross-sun direction, lies between 1 km and 2 km altitudes, and is 1 km wide (LlZ =
21 km). extinction coefficient is 100 km- l , so cloud optical thickness is 100 in
IPY Issue of Atmospheric Environment 14
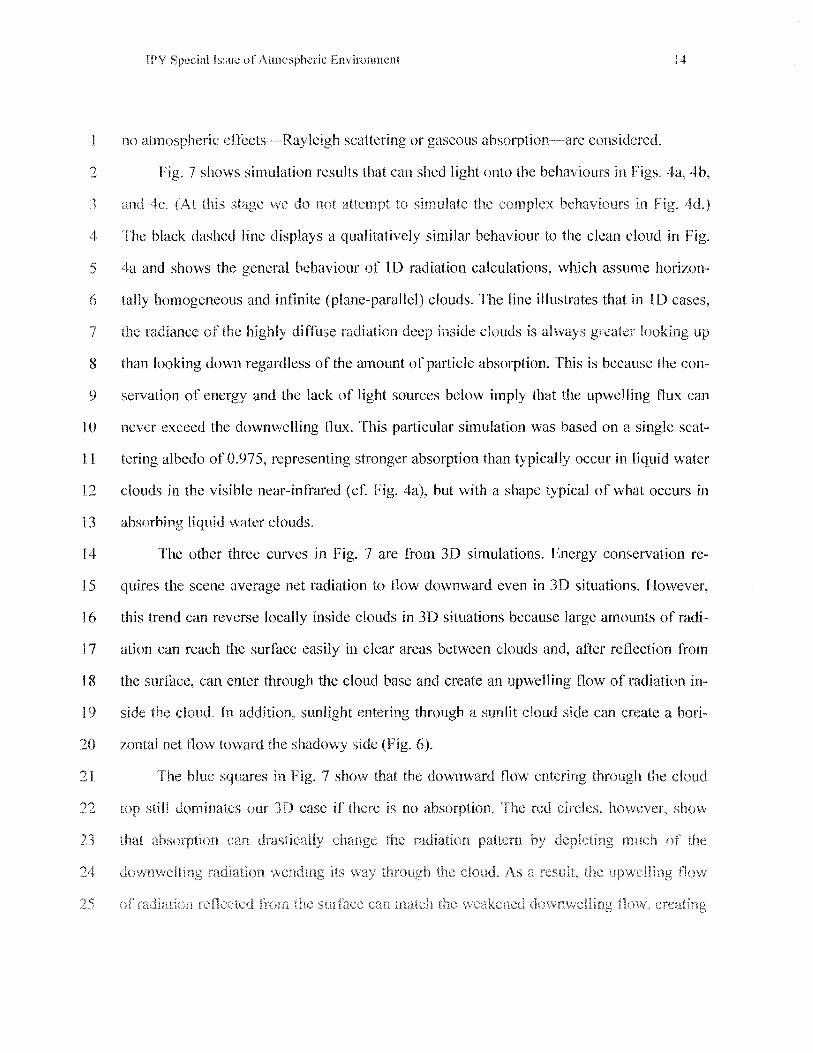
no atmospheric effects-Rayleigh scattering or gaseous absorption-are considered.
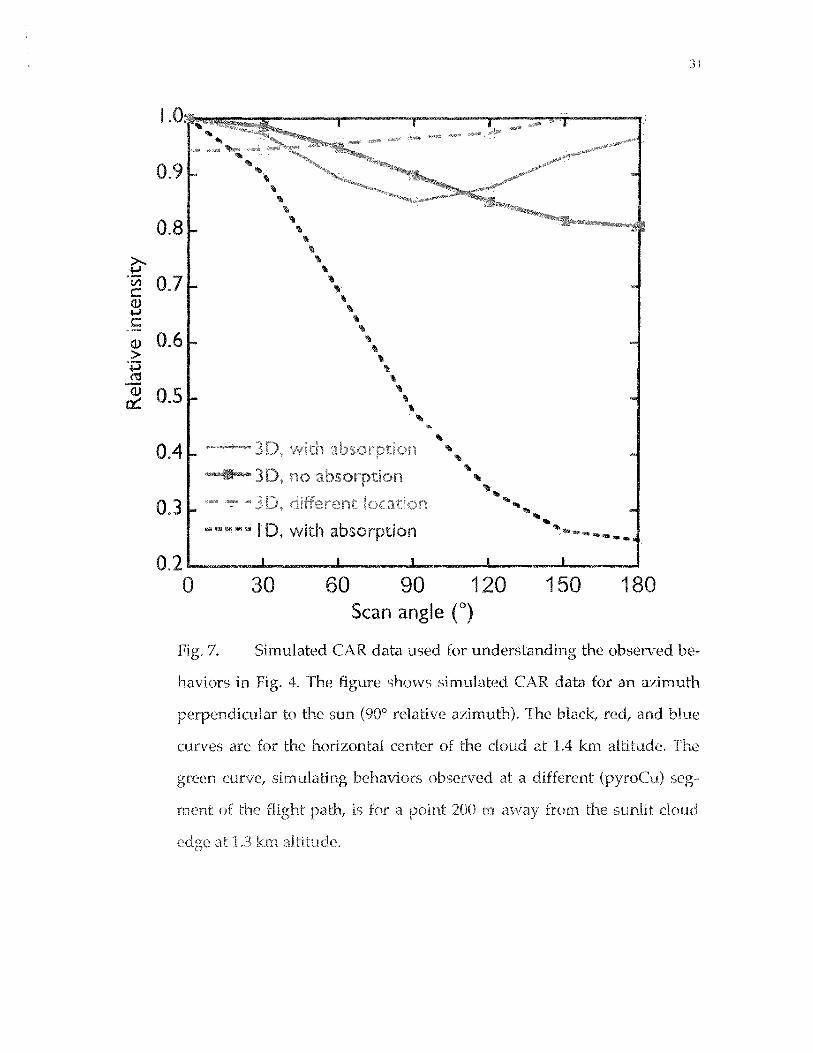
2 Fig. 7 shows simulation results that can shed light onto the behaviours in Figs. 4a, 4b,
not
4 The black dashed line displays a qualitatively similar behaviour to the clean cloud in Fig.
5 4a and shows the general behaviour of 1 D radiation calculations, which assume horizon-
6 tally homogeneous and infinite (plane-parallel) clouds. The line illustrates that in I D cases,
7 radiance the highly diffuse radiation deep inside clouds is always looking up
8 than looking down regardless of the amount of particle absorption. This is because the con-
9 servation of energy and the lack of light sources below imply that the upwelling nux can
10 never exceed the downwelling nux. This particular simulation was based on a single scat-
11 tering albedo of 0.975, representing stronger absorption than typically occur in liquid water
12 clouds in the visible near-infrared (cf. Fig. 4a), but with a shape typical of what occurs in
13 absorbing liquid water clouds.
14 The other three curves in Fig. 7 are from 3D simulations. Energy conservation re-
15 quires the scene average net radiation to now downward even in 3D situations. However,
16 this trend can reverse locally inside clouds in 3D situations because large amounts of radi-
17 ation can reach the surface easily in clear areas between clouds and, after reflection from
18 the surface, can enter through the cloud base and create an upwelling flow of radiation in-
19 cloud. addition, sunlight entering through a sunlit cloud side can create a hori-
zontal net flow toward the shadowy (Fig. 6).
21 blue squares in Fig. 7 show that the downward flow entering through cloud
dominates our 3D case is no absorption.

Issue of Env ironment
looking ( and ( 180°). is to
2 behaviour in 4c (pyroCu core). Lastly, the green dashed curve 7 shows that for
4 (less), and so upwelling radiation can fully dominate and create a trend similar to that in
5 Figure 4b (pyroCu).
6 Finally, Fig. 8 more explicitly explores the role of absorption and scattering proper-
7 ties in shaping radiation patterns. Fig.8a shows that even relatively absorption (SSA :S
8 0.99) can allow upwelling radiation to match or even exceed the downwelling tlow in a 3D
9 situation. In turn, Fig. 8b shows that increasing the number of particles (i.e., the extinction
10 coefficient) yields similar effects to increasing their absorptivity, as both changes make it
11 harder for radiation to reach an instrument deep inside the cloud. This implies that radiation
12 patterns similar to those observed in pyroCu and pyroCu core (Figs. 4b and 4c) can arise in
13 thick clouds even if absorption is relatively weak, although SIflDn!ler absorption is required
14 in thin clouds. The interplay between scattering and absorption can also allow upwelling
15 radiation to dominate even in the upper parts of clouds if particles are distributed unevenly.
16 For example, if the cloud extinction coefficient increases with altitude (e.g., Raga and
17 Jonas, 1993)--e.g., as ascending droplets grow through condensation~strong absorption or
18 scattering above can greatly reduce the downwelling radiation and allow the upwelling ra-
19 diation the ground to dominate even at high altitudes.
20 Conclusions
21 This study provides an analysis of airborne radiation measurements with the
strument

IPY Issue of fmr"'nI1M'''' Environm-:nt 16
We found the pyroCu core to be interesting having very low light levels from the
to near IR regions of the electromagnetic spectrum, and very uniform radiance field in
3
4 I sr- I in the ultraviolet and visible bands, I, 0.5 !lm, and at 1,6 !lm, but substantially lar-
S ger (2-5 Wm-2~lm-lsr-l) for 0.5 ~lm Ie < 1.3 ~lm, independent of direction, We found the
6 angular distribution of radiance within the pyroCu to be related to the ditTusion domain in
7 water clouds that can be described by very similar cosine functions with an additional sine
8 term, We demonstrate with Monte Carlo simulation that radiation transport in pyroCu is
9 inherently a 3D problem and must account for strong particle absorption, The proposed
J 0 simple description of the radiation distribution within the pyroCu or pyroCu core may lead
11 to better understanding of these cloud systems and provide a simpler solution t()r their in-
12 clusion in elimate models. Based on the low radiation values measured in the core of the
13 pyroCu, we speCUlate that the formation of the dark core is an important feature tor estab-
14 lishment of a possible pathway for transportation of tIre emissions to the upper troposphere
15 and lower stratosphere, but this remains to be validated.
16 Aclmowledgements
17 This research was supported by the Science Mission Directorate of the National
18 Aeronautics and Space Administration as part of the Radiation Sciences Program under Hal
19 Maring and Airborne Science Program under Bruce Tagg. We also thank Ewald,
20 Kundu, A. Marshak, W. Wiscombe, Nenes, and Lathem for insightful discussions
21 and comments. This work was perfonned NASA Grants NNX08A89G and
11

Issue of Em ironment
2 Cahalan Orcopoulos, Marshak, A., Evans, K.F., Davis, Pincus, Yctzer, K.,
4
5
6
7
8
9
10
11
12
13
14
15
16
17
18
19
21
M., Kassianov, Kinne, Macke, OHirok W .. Partain, P .. Prigarin, Rublev,
A., Stephens, G., Szczap, F., Takara, E., Vamai, T., Wen, G., Zhuravleva, T., 2005.
The International lntcrcomparison of 3D Radiation Codes (l3RC): Bringing together
the most advanced radiative transfer tools for cloudy atmospheres, Bull.
Soc., 86, 1275-1293.
Clarke, A., McNaughton, C., Kapustin, V., Shinozuka, Y., Howell, S., Dibb, J., Zhou, J.,
Anderson, 8., Brekhovskikh, V., Turner, H., Pinkerton, M., 2007. Biomass burning
and pollution aerosol over North America: Organic components and their intluence on
spectral optical properties and humiditication response, J. Geophys. Res., 112,
01 18, doi: 1 1029/2006.10007777.
Damoah, R., Spichtinger, N., Servranckx, R., Fromm, M., Eloranta, E.W., Razenkov, LA.,
James, P., Shulski, M., Forster, Stohl, A., 2006. A case study of pyro-convection
using transport model and remote sensing data, Atmos. Chern. Phys., 6, 173-185.
Fromm, M., Lindsey, D.T., Scrvranckx, R., Yue, G., Trickl, T., Sica, R., Doucet, P., Godin
Beckmann, S., 2010. The untold story of pyrocumulonimbus, Bull. Ameri. Meteor.
91,1193-1209.
M., Bevilacqua, "'l..V"'-'U, 1., Thayer, Herman,
UH'-"'-A, R., 2005. >"U"-FLf' injection of to
IPY Issue of Atmospheric Environment 18
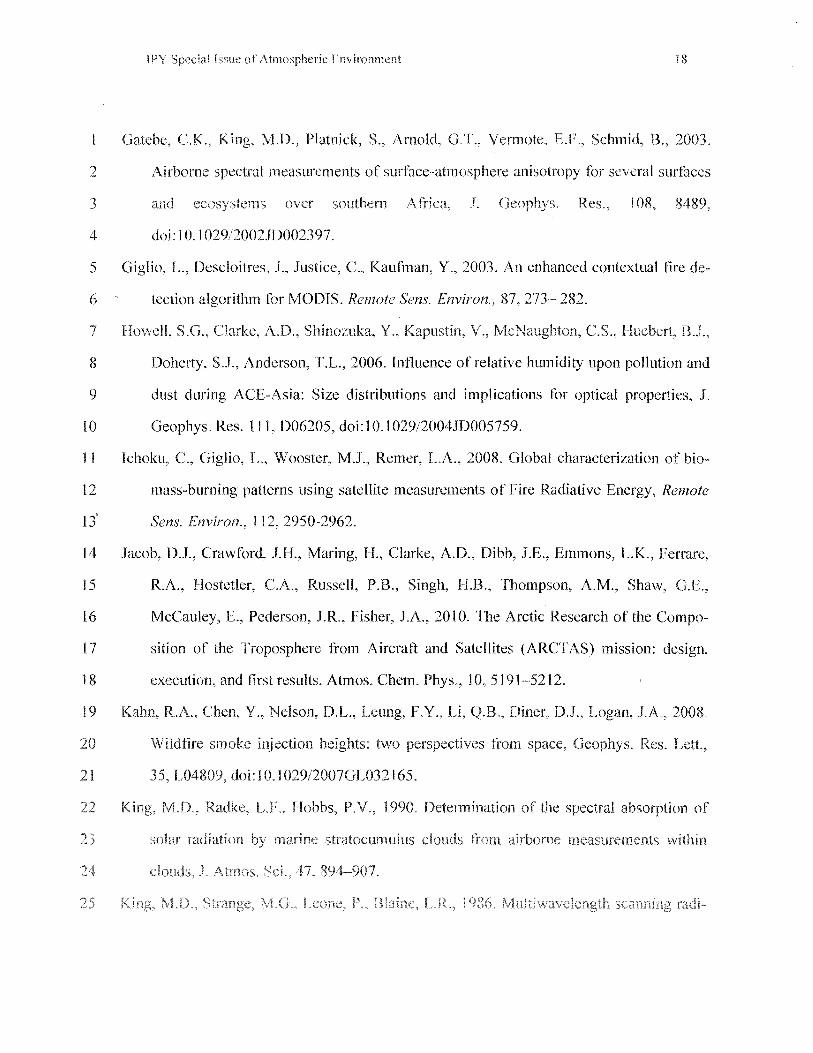
Gatebe, King. 1\1,D., Platnick, Arnold, G.T Vermote, E.F Schmid, R, 2003.
2 Airborne spectral measurements of surface-atmosphere anisotropy for several surfaces
3 over l 108, 8489,
4 doi: I 0.1 029/2002JD002397.
5 Giglio, L., Descloitres, J., Justice, c., Kaufman, Y., 2003. An enhanced contextual fire de-
6 tection algorithm for MODIS. Remote Sens. Environ., 87,273- 282.
7 Clarke, Shinozuka, Kapustin,., McNaughton, BJ.,
8 Doherty, S.J., Anderson, T.L., 2006. Influence of relative humidity upon pollution and
9 dust during ACE-Asia: Size distributions and implications for optical properties, J.
10 Geophys. Res. ] 11, D06205, doi:lO.1029/2004JD005759.
11 Ichoku, c., Giglio, Wooster, M.J., Remer, L.A., 2008. Global characterization of bio-
12 mass-burning patterns using satellite measurements of Fire Radiative Energy, Remote
13' Sens. Environ., 112, 2950-2962.
14 Jacob, D.J., Crawford, J.B., Maring, H., Clarke, A.D., Dibb, J.E., Emmons, LX., Ferrare,
15 RA., I-Iostetler, c.A., Russell, P.B., Singh, FLB., Thompson, A.M., Shaw,
16 McCauley, E., Pederson, IR., Fisher, J.A., 2010. The Arctic Research of the Compo-
17 sition of the Troposphere from Aircraft and Satellites (ARCTAS) mission: design,
18
19
21
execution, and first results. Atmos. Chem. Phys., 10,5191-5212.
Chen, Nelson, D.L., Leung, F.Y., Q.R, Diner. D.J., Logan, 2008.
WildfIre injection heights: two np."",,,,~, trom
L04809, doi: 10.1029/2007GL032 165.
Hobbs, 1990.

2
3
4
5
6
7
8
9
10
11
12
13
14
15
16
17
18
19
20
21
Environment
ometer measurements
Oceanic Techno!. 3, 51
I.
observation of the internal scattered radiation field, J. Atmos. 38,2031-2044.
Luderef, G., Trentmann, J., Winterrath, T., Textor, Herzog, M., Grat: Andreae,
M.O., 2006. Modeling of biomass smoke injection into the lower stratosphere (part II):
sensitivity studies, Atmos. Chem. Phys., 6,
McCarter, RJ., Broido, A., 1965. Radiative and convective energy from wood crib fires,
Pyrodyn., 65-85.
Packham,O.R., 1969. Heat transfer above a small ground fire, Australia Forest Research 5,
19-24.
Pi1ewskie, P., Pommier, J., Bergstrom, R., Gore, W., Howard, Rabbette, M., Schmid, B.,
Hobbs, P 2003. Solar spectral during the Southern
rican Regional Science Initiative, J. Geophys. Res., 108, 8486,
doi: 10.1 029/2002J000241l.
Provencal, R., Gupta, M., Owano, T Baer, D.S, Ricci, K.N, O'Keefe, A., Podolske, l.R,
2005. Cavity-enhanced quantum-cascade laser-based instrument for carbon monoxide
measurements, Appl. Opt., 44, 6712-6717.
G.B., Jonas, P.R., 1993. Microphysical radiative properties of
clouds over the sea, Quart. J. Royal Meteor. Soc., 11 1399-1417.
2005. A continuous-flow "t,.,d • .,,,,,

IPY Special Issue of Atmospheric Environment 20
airborne pyranometer, J. Geophys. Res .. 104,2289-2307.
2 Shinozuka, Redemann, l., Livingston, J.M., Russell, P.B., Clarke, A.D., Howell, S.G.,
O'Neill. "L
4 S., Kapustin, V.N., Brekhovskikh, V., Holben, B.N., McArthur, L.J.B., 2011. Airborne
5 observation of aerosol optical depth during ARCTAS: vertical profiles, inter-
6 comparison and fine-mode fraction, Atmos. Chern. Phys., 11,3673-3688.
7 AJ., Tchebakova, N.M., French, N.H.F., Flannigan, M.D., Shugart, lUI.,
8 B.1., Sukhinin, A.I., Parfenova, E.!., Chapin, F.S., Stackhouse, P.W., 2007. Climate-
9 induced boreal forest change: predictions versus current observations, Global and
10 Planet. Change, 56, 274-296.
11 Stamnes, K., Tsay, S.-c., Wiscombe, W., Jayaweera, K., 1988, Numerically stable algor-
12 ithm for discrete-ordinate-method radiative transfer in multiple scattering and emitting
13 layered media, AppL Opt., 27, 2502-2509.
14 Stocks, B.1., 1995. The extent and impact of forest fires in northern circumpolar countries.
15 In: Levine, l.S. (Ed.), Global Biomass Burning: Atmospheric, Climatic, and Biospheric
16 Implications, MIT Press, Cambridge, Massachusetts, pp. 197-202.
17 Stocks, 8.1., Mason, l.A., Todd, J.8., Bosch, E.M., Wotton, B.M., Amiro, B.D., Flannigan,
18 M.D., Hirsch, K.G., Logan, K.A., Martell, D. L., Skinner, W.R., 2003. Large forest
19 fires in Canada, 1959-1997. J. Geophys. Res. 108,8149, doi: 1O.1029/20011D000484.
Provencal, Owano, Kirschstetter, Hallar, Williams,
21 2007. Aero3 X: accurate measurement of aerosol optical properties for climate
quality Geophysical Union, Fall
IPY IssU\; of Environment
(Part l):
2 5260.
4 Smoke injection heights from fires in North America: analysis of 5 of satellite
5 observations,Atmos. Chem. Phys., 10, 1491-1510.
6 Vamai, T, Marshak, A., 2001. Statistical analysis of the uncertainties in cloud optical depth
retrievals caused hy three-dimensional radiative eftects, 1. Atmos. Sci., 548.
8 Wooster, M.J., 2002. Small-scale experimental testing of fire radiative energy for quantify-
9 ing mass combusted in natural vegetation fires, Geophys. Res. Lett.,
10 doi:l O. 1029/2002GLO 15487.
11 Wooster, M.J., Roberts, G., Perry, G.L. W., Kaufman, Y.J., 2005. Retrieval of biomass
12 combustion rates and totals /loom tire radiative power observations: FRP derivation and
13 calibration relationships biomass consumption re-
14 lease, J. Geophys. Res., 110, D24311, doi: 10. [029/2005JD006318. 15

IPY fssliC of Environment 22
Table I
2 Locations and FRP values of firc pixels dctected by Aqua-MODIS on 2 July 2008 at 19:35
3 UTC in the vicinity of the measured pyroCu, as indicated in Fig. 1 b
I~atitude Longitude Fire Radiative Power (ON) (OW) (MW)
55.685 105.283 108.273
55.682 105.299 112.081
55.677 105.331 37.455
55.688 105.320 84.818
55.706 105.320 105.710
55.733 105.334 20.674
55.778 105.235 24.367
55.773 105.267 18.737
55.803 105.197 84.151
55.838 105.150 25.296
55.835 105.l66 17.619
4

IPY Issue
Instrumentation ARCTAS
Data Prlxiucts
Aerosol optical prop
eIiies, N02 mixing
Aerosol optical depth
Sunpho- and extinction.
tometer water vapor column
profile
Environment
Technique
Cavity ring-down ex
tinction; Sample rate:
2 sec. (Strawa et aL
2007).
Tracking Sun photom
eter. 0.354-2.138 ~tm
(Russell et al. 1999)
PIincipal Investigator
A. Strawa. NASA
ARC
J. Redemann,
BAERIINASA
ARC
Radi
ometers
Radiation fluxes (so- Radiometer A. Bucholtz,
NRL . 0.2-3.6 ~m &
4.5-42 ~m)
Radiance, aerosol.
& Eatih sur
propeliies
Condensation
(CCN)
Angular (cross-track C. Gatebe,
zenith to nadir) scan- USRAINASA
ning radiometer,
0.340-2.30 1 ~m
Supersaturation gener
ated by relative diffu
sion of water vapour
and heat (Roberts and
Nenes.
GSFC
A. Nenes. Georgia
Tech
23
(Nominal
Extinction
sensitivity
and scattering 2 1 Mnrl,
sensitivity
Slant
Estimated
Radiance
SS

fPY Special Issue of Atmospheric Environment
Counter
mixing ratio off-axis integrated J. Podolske.
fraction) at a cavity output spec- NASA/ARC
rate based on troscopy -- TLAS
measured absorp- (Provencal et al.
gas tempera- 2005) ture. and pressure using Beer's Lm'V
aerosols (Aerosol ope PSAP. TDMA. A. Clarke, See
size. com- CN counter. ToF-AMS. Hawaii 11 Research position, volatility. SP2. nephelometer
optical properties:
et aL 2007: Shinozuka et aL
20 I. Howell et
2006) base meteorological See reference: Barrick John Barrick See
tern T. RH) and NASA/LaRC
navigational meas-urements
Solar spectral flux Spectrometer (380- S. Schmidt Absolute
1700 nm) with nadir Colorado 1 and zenith hemispheric
collectors

Fig.1. (a) NASA P-3B flight track 2 July 2008 during the ARCTAS 2008 summer campaign. (b) MODIS/ Aqua image taken on 2 July 2008 over the area marked by the rectangle in (a). The red (green) squares are fire locations during Terra (Aqua) overpass at 19:35 UTC (17:55 UTC), and the orange square marks the location of the fire plume that was penetrated by the 3B. (c)-(d) CAR quick-look images of the fires taken aboard the NASA 3B over the flight section highlighted in green in (b). combination
and blue colors using different CAR bands helps differentiate

Fig. 2.
26
Pyrocumulus Clouds Studied
(d) Cloud Absorption Radiometer (CAR) Parameters
Angular Scan Range 190" Instantaneous field of view 175 mrad
Pixels per scan line 382
Scan rate Spectral channels
bilndwidth (FWHM)
1.67 lines per second 14' (8 continuously six in filter wheel)
0.340(0.009),0.381 (0.006), 0.473(0.021 l, 0.683(0.021),0.871 (a.Oll), 1.037(0.021), .LLd.\V.\J'LJI, 1,275(0.023), 1564(0,032),
1.657(0.042), 1.738(0.040), 2.1 05{0.045), 2.202(0.043),2.303(0,044)
(a). The NASA P-3B at NASA Ames Research Center, California, USA in June 2008 during the ARCTAS field experiment. (b) Schematic of NASA's Cloud Absorption Radiometer (CAR), which is mounted in the nose of the NASA P-3B aircraft. (c) Picture of the fire plume that the P-3 penetrated on 2 July during ARCTAS. (d) Specifications for the CAR, which contains 14 narrow spectral bands between 0.34 and 2.30 /lm. The CAR flew nine fire missions aboard P-3B in Canada between 28 June and 10 July 2008.

Zenith nadir radiances 0.472 11m, on a flight through a pyroCu,
21:04:45 and 21:05:29 UTe on 02 Julv 2008. Pictures a, band c are j
from a forward camera aboard the NASA P-3B, and coincide with entry,
core penetration, and exit points of the pyroCu, respectively. The core
was very dark, and brownish in color. The distance from the core to the
edge of
m/s).
pyroCu is 318 m average aircraft speed

28
Fig. 4. Relative spectral intensities from CAR as a function of zenith angle for
internally scattered radiation measured inside (a) liquid water cloud, (b)
pyroCu, (c) core pyroCu, and (d) thick smoke from smoldering fires
with no cloud The UV channels are not included (b) and (c)

---
( )
fitted relative
respectively; for water cloud, pyroCu
core.
solid
the pyroCu
a
a

30
Fig. 6. Illustration of solar illumination paths responsible for the observed radia
tion patterns in Figs. 4a-c.
.~ (/)
c ~ c (])
> .~
(])
ex::
" " " " " , " " ,
" " " " .. " " , , ,
\
'"
"'P"'''''.'' I 0, with absorption 0,2 L........_ ........... __ ......a.... __ .......... _..........,i...--_______ .....
o 30 60 90 120 150 180
Fig. 7. Simulated CAR data used for understanding the observed be-
haviors in Fig. 4. The figure shows simulated CAR data for an azimuth
perpendicular the sun (900
curves are for the horizontal 1'':>1'1,1"<>1'"
curve, simulating behaviors
a
1
azimuth). The black, and blue
the 1.4 km
m

32
Fig. 8. Impact of (a) variations in single scattering albedo (SSA) at a constant
cloud extinction coefficient (100 km-I); and (b) variations in cloud extinc
tion coefficient at a constant SSA (0.97). The simulations are for 85° rela
tive azimuth at a point 300 m away from the sunlit cloud edge at 1.3 km
altitude.