Embed Size (px)
Citation preview

Taking Action on Energy: A CEO Vision for America’s Energy Future
February 2013
Business Roundtable (BRT) is an association of chief executive officers of leading U.S. companies with more
than $7.3 trillion in annual revenues and nearly 16 million employees. BRT member companies comprise nearly
a third of the total value of the U.S. stock market and invest more than $150 billion annually in research and
development — equal to 61 percent of U.S. private R&D spending. Our companies pay $182 billion in dividends
to shareholders and generate nearly $500 billion in sales for small and medium-sized businesses annually. BRT
companies give more than $9 billion a year in combined charitable contributions.
Copyright © 2013 by Business Roundtable
Taking Action on Energy
A CEO Vision for America’s Energy Future
February 2013

i
Taking Action on Energy: A CEO Vision for America’s Energy Future
Dear Business Leaders, Policymakers and Other Stakeholders:
The CEOs of the Business Roundtable believe that we are at a pivotal time in our nation’s history. America faces a
number of serious economic and policy challenges, including unacceptably low economic growth, unacceptably high
unemployment, unsustainable budget deficits, escalating health care costs, an uncompetitive tax code and an incoherent
patchwork of regulation. Collectively, these challenges create a business climate that discourages the long-term
investment that is needed to revitalize our economy and create jobs.
With these challenges in mind, the Business Roundtable released the March 2012 report Taking Action for America — a
comprehensive plan to accelerate new business investment and remove barriers to economic growth. In that report, the
CEOs of the Business Roundtable identified affordable, reliable energy as one of several critical strategies to revitalize
economic growth and job creation.
Taking Action on Energy is designed to provide greater detail about the policies needed to make affordable, reliable
energy a reality for U.S. consumers and businesses. To support this goal, the Business Roundtable Energy and
Environment Committee embarked on an effort to re-evaluate U.S. energy policy and forge a long-term framework that
has the potential to simultaneously advance the nation’s economic, security and environmental interests.
In short, our assessment is that America’s energy future is exceptionally bright. The nation’s energy outlook has
improved substantially in recent years due to a confluence of factors that are fundamentally reshaping the U.S. energy
landscape, including the development of technologies to unlock vast new domestic oil and natural gas resources and
the application of innovative technologies to economically extract and deliver these resources to market. In addition,
the United States remains a global leader in the research, development and commercialization of energy efficiency,
renewable energy, new nuclear and advanced coal technologies.
The Business Roundtable believes that America should capitalize on these advantages and accelerate efforts to develop
a portfolio of affordable, diverse and efficient options for meeting our energy needs in the 21st century. As major
domestic energy producers, energy consumers and technology suppliers, our companies are uniquely positioned to help
the nation make the most of this opportunity. The business community is prepared to lead the way, but the government
has an important role to play in establishing a coherent, forward-looking energy policy.
Accordingly, the CEOs of the Business Roundtable call on U.S. policymakers, business leaders and consumers to take
action on energy. We can no longer afford to sustain our current patchwork of policies. Instead, we need a more
purposeful approach that looks beyond today’s headlines to forge a more enduring vision of how America will meet its
energy needs in the coming decades.
Taking Action on Energy attempts to provide this vision. Our goal was to outline an energy policy framework that is
both timely and durable — that is, one that is capable of addressing current issues as well as accommodating future
developments. Accordingly, while many of our policy solutions speak specifically to the major issues of the day, we have
Business Roundtable
ii
also attempted to place them within a broader system of national energy policy goals, principles and strategies. We
believe that the framework outlined in this paper represents a balanced approach to enhancing economic growth and
energy security while also reducing the environmental risks associated with criteria pollutants, greenhouse gases and
other emissions.
Despite our optimism, we remain realistic about the difficulty of replacing our ad hoc energy policy with a more
purposeful approach. Making this change will require leaders who are willing to engage in an open and honest dialogue
about our values and priorities as a nation, as well as the policy and regulatory approaches most likely to achieve them.
This report is intended to contribute to that dialogue.
David M. Cote
Chairman & CEO
Honeywell International, Inc.
Chairman, Energy & Environment Committee
Business Roundtable
Taking Action on Energy: A CEO Vision for America’s Energy Future
1
Table of ContentsExecutive Summary 2
I. Capitalizing on America’s Energy Renaissance 4
II. Vision Statement 6
III. Guiding Principles 9
IV. Energy Efficiency 10
• Trends in Energy Efficiency 11
• Barriers to Investment in Energy Efficiency 15
• Policy Recommendations To Improve Energy Efficiency 17
V. Traditional Energy Production 20
• Trends in Traditional Energy Production 21
• Barriers to Investment in Traditional Energy Production 27
• Policy Recommendations To Enhance Traditional
Energy Production 30
VI. Renewable Energy Production 32
• Trends in Renewable Electricity Production 33
• Barriers to Investment in Renewable Electricity Production 36
• Trends in Renewable Transportation Fuels 39
• Barriers to Investment in Renewable Transportation Fuels 40
• Policy Recommendations To Enhance Renewable
Energy Production 42
VII. Electric Power Generation, Transmission and Distribution 43
• Trends in Electric Power Generation 44
• Barriers to Investment in Electric Power Generation 47
• Trends in Transmission and Distribution 50
• Barriers to Investment in Transmission and Distribution 51
• Policy Recommendations To Enhance Generation,
Transmission and Distribution 54
VIII. Conclusion 57
Appendix: Acronyms 58
Endnotes 59
Business Roundtable
2
Executive Summary
America is in the midst of an energy renaissance. Fueled by a combination of ingenuity and investment, recent
developments have fundamentally altered the U.S. energy landscape. The implications of this energy renaissance are
potentially profound and far-reaching. In fact, some energy experts believe that North American energy self-sufficiency
is now within reach — a prospect that seemed unattainable as recently as five years ago.
In light of these developments, the CEOs of the Business Roundtable are optimistic about America’s energy future. As
major domestic energy producers, energy consumers and technology suppliers, our companies are uniquely positioned
to help the nation make the most of this opportunity. Indeed, the unlocking of highly challenging resources, such as oil
and natural gas from shale formations, is a textbook example of the private sector’s ability to drive innovation, capitalize
on new opportunities and put the United States back in the driver’s seat toward a secure and sustainable energy future.
The private sector must continue to lead the way if America is to sustain this energy renaissance and restore our status
as an energy superpower.
But let us be clear: The business community cannot do this alone, and the federal government has an important role to
play in facilitating private investment — namely, by establishing a coherent, forward-looking energy policy framework.
Unfortunately, the nation’s energy policy has evolved through decades of ad hoc measures, resulting in an incoherent
patchwork of subsidies, mandates and regulations. The result is a policy labyrinth that, on balance, is more likely to
inhibit than to unleash the private-sector investment needed to transform the energy sector. Accordingly, the CEOs of
the Business Roundtable call on U.S. policymakers, business leaders and consumers to take action on energy.
With this goal in mind, Taking Action on Energy offers a comprehensive U.S. energy policy framework. The foundation
of the framework is the CEO vision statement, which identifies three overarching policy goals (economic growth, energy
security and environmental stewardship) and describes a virtuous cycle in which an expanding economy supports
the investments needed to improve our energy security and safeguard our environment. The report then builds on
this foundation by enumerating a set of guiding principles that advance these goals, including fostering innovation,
encouraging competition and energy resource diversity, empowering consumers, engaging the international community,
ensuring smarter regulation, and fortifying critical infrastructure. These guiding principles provide a yardstick by which
policymakers should evaluate the merits of any policy proposal.
However, a successful energy policy framework cannot rest solely on visions and principles — it must apply those
concepts toward actionable recommendations on the major issues of the day. Accordingly, Taking Action on Energy
applies these principles to four critical areas: energy efficiency; traditional energy production; renewable energy
production; and electric power generation, transmission and distribution. For each area, the document outlines current
trends and barriers that are actively shaping investment decisions and presents a set of concrete, actionable policy
recommendations. These recommendations, while directed at immediate issues in the short term, are also designed to
transition the nation toward a more coherent, sustainable energy policy framework in the long term.
Taking Action on Energy: A CEO Vision for America’s Energy Future
3
The CEOs of the Business Roundtable believe that restoring America’s economic strengths remains our top priority, and
sustaining America’s energy renaissance is critical to realizing that goal. To do so, policymakers must:
◗◗ Foster innovation by sustaining public investments in a diverse portfolio of precommercial research and
development activities;
◗◗ Encourage competition and energy resource diversity by ensuring that tax incentives are designed to address well-
documented market inefficiencies, applied only to those fuels and technologies with a credible path to unsubsidized
competitiveness, and finite in duration and eventually phased out in a predictable fashion;1
◗◗ Empower consumers by adopting transparent, cost-effective standards for energy efficiency and allowing efficiency
investments to be reflected in consumers’ utility rates;
◗◗ Engage internationally by approving infrastructure projects that provide access to world energy markets and
expanding rules-based trade opportunities for coal and other materials;
◗◗ Ensure smarter regulation by requiring regulation to be grounded in sound science and cost-benefit analysis,
streamlining the permitting process, and expediting critical infrastructure projects; and
◗◗ Fortify critical infrastructure by investing in upgrades and encouraging cooperation and information-sharing among
government agencies, critical infrastructure owners and operators.
Three Overarching Goals of a Long-Term National Energy Policy
◗◗ Boost economic growth by ensuring access to affordable energy supplies and pursuing cost-effective
energy efficiency measures;
◗◗ Enhance energy security by providing an adaptable, reliable and diverse portfolio of energy resources; and
◗◗ Promote environmental stewardship by improving energy efficiency and ensuring responsible management
of natural resources.
Business Roundtable
4
I. Capitalizing on America’s Energy Renaissance
America is in the midst of an energy renaissance. Fueled by a
combination of ingenuity and investment, recent developments
have fundamentally altered the U.S. energy landscape —
upending long-held assumptions and turning conventional
wisdom on its head. The facts speak for themselves. Despite
decades of decline, U.S. crude oil production has increased in
each of the past four years.2 After decades of stagnation, U.S.
natural gas production has surged to historic highs.3 At the
same time, coal-fired and nuclear power plants continue to
provide affordable, reliable baseload electricity while renewable
energy sources are becoming an increasingly important part
of the nation’s energy portfolio.4 And on the demand side of
the energy equation, improvements in energy efficiency and
conservation are helping to ensure that energy is used more
productively and, as a result, emissions are lower than they
otherwise would be.5
The implications of this energy renaissance are potentially
profound and far-reaching. After peaking at 60 percent in 2005,
oil imports as a share of consumption have decreased to 47
percent — the lowest level since 1996.6 Likewise, natural gas
imports have fallen to their lowest level since 1992, and the Energy Information Administration (EIA) projects that the
United States could be a net exporter of natural gas within a decade.7 Enticed by the prospect of secure and affordable
energy supplies, key manufacturing industries, including the chemical, steel and fertilizer industries, are returning to
the United States after more than a decade of declining investment, bringing much-needed job growth.8 Indeed, some
energy experts believe that North American energy self-sufficiency may be on the horizon — a prospect that was
considered unattainable five years ago.9
Given these developments, the CEOs of the Business Roundtable are optimistic about America’s energy future. We
believe that recent developments in the U.S. energy sector are overwhelmingly positive and potentially transformative.
As major domestic energy producers, energy consumers and technology suppliers, our companies are uniquely
positioned to help the nation make the most of this opportunity.
But let us be clear: The business community cannot do this alone, and the federal government has an important role to
play. First and foremost, the federal government has a responsibility to forge a comprehensive, forward-looking energy
policy framework that advances the nation’s key interests. Unfortunately, no such policy framework exists. Evolving
through decades of ad hoc measures, the nation’s de facto energy policy is an incoherent patchwork of subsidies,
“America’s energy future is bright, but
it is not certain. The only guarantee
is that the energy landscape
will continue to evolve as new
technologies emerge, new resources
are developed and markets respond
accordingly. A diverse portfolio of
energy efficiency and supply options
is the best insurance policy against
this uncertain future — enabling
America to seize the opportunities
and mitigate the risks associated with
technological and economic change.”
— David M. Cote Chairman & CEO
Honeywell International, Inc.
Taking Action on Energy: A CEO Vision for America’s Energy Future
5
mandates and regulations. The result is a policy labyrinth that, on balance, is more likely to inhibit than to enable the
innovation and investment needed to sustain a diverse, affordable and efficient energy system.
With this challenge in mind, Taking Action on Energy provides an alternative to our ad hoc energy policy that capitalizes
on America’s energy renaissance. The foundation of this approach is the vision statement, which establishes economic
growth, energy security and environmental stewardship as the three overarching goals of a sustainable energy policy
and describes why the concepts of affordability, diversity and efficiency are central to advancing all three goals
simultaneously. The report’s guiding principles build on this foundation, providing a blueprint for designing and
implementing policies that are likely to achieve this shared vision. A series of chapters then explores four key areas of
energy policy in greater detail: (1) energy efficiency; (2) traditional energy production; (3) renewable energy production;
and (4) electric power generation, transmission and distribution. Each chapter concludes with specific, actionable policy
recommendations that are designed to address immediate issues in the short term while transitioning the nation toward
a more coherent, sustainable energy policy framework in the long term.
The energy landscape has shifted dramatically in the past five years — infusing the U.S. energy outlook with new
uncertainties, challenges and opportunities. Although these developments are, on balance, overwhelmingly positive
for U.S. consumers and businesses, America’s energy future is not certain. The only thing we know for sure is that the
energy landscape will eventually shift again. America needs a comprehensive energy policy framework that is flexible
enough to capitalize on known near-term opportunities while accommodating new long-term developments. The CEOs
of the Business Roundtable believe this is that framework.
Energy Policy in the Context of Comprehensive Tax Reform
The tax code is a key tool by which policymakers encourage or discourage a wide range of behaviors in the
private sector, including decisions regarding energy consumption, production and investment. As a result, some
of the recommendations in this report necessarily touch on the issue of tax policy. At the same time, the Business
Roundtable believes that comprehensive tax reform is a critical component of a long-term plan to restore U.S.
economic growth and international competitiveness. To the extent that policymakers undertake comprehensive
tax reform in the future, some recommendations in this report may need to be re-evaluated in the context of the
proposed reforms.
Business Roundtable
6
II. Vision Statement
The Business Roundtable believes that a successful and sustainable long-term U.S. energy policy should simultaneously
advance three national goals: economic growth, energy security and environmental stewardship.
Economic Growth
A long-term U.S. energy strategy should increase the nation’s ability to compete in global markets, support private-
sector job creation and improve the quality of life for all citizens. Access to affordable energy supplies and the pursuit
of cost-effective energy efficiency measures are critical to attaining these goals. From a global and local perspective,
affordable energy has been a primary driver of economic growth for
decades, and it facilitates broad economic benefits that can generate
increased spending on a variety of national priorities. Indeed, affordable
energy can produce positive feedback loops in which increased economic
prosperity leads to greater investment in new energy production and
innovation, which in turn help keep energy costs competitive for
businesses and consumers. As such, an effective long-term U.S. energy
strategy must allow for flexibility to respond to changing economics in the
energy sector as new technologies and resources emerge.
Conversely, when energy costs rise, the impact is felt by consumers, businesses and governments, resulting in reduced
consumer spending, job creation and government revenues. Rising energy costs also function as a regressive tax on
consumers and hurt them in a variety of ways, including higher prices for electricity, gasoline and other basic necessities;
an increased likelihood of unemployment or underemployment; and reduced economic vitality.
Energy Security
A long-term U.S. energy strategy should enhance the nation’s capacity to prevent, mitigate, adapt to and recover
from energy market disruptions resulting from political instability, military conflict, natural disasters, physical and cyber
terrorist attacks, and disruptions of global energy supplies. To achieve this goal, U.S. energy supplies must be adaptable,
reliable and diverse. Fortunately, the United States is endowed with a wide array of energy resources, including both
traditional fuels and renewable resources, as well as access to global energy supplies. Coupled with sustained efforts
to improve energy efficiency, this diversity affords U.S. energy producers and importers more flexibility in meeting our
energy needs while also increasing the energy market’s resilience against natural and man-made shocks.
The security of the energy supply is also affected by political developments. Policies that support open international
markets and predictable regulatory and fiscal frameworks are critical to ensuring that U.S. businesses and consumers
have access to the affordable energy they need, when they need it and where they need it. Energy security also requires
a robust energy infrastructure, including sufficient processing capacity, and transmission and distribution systems that
reliably deliver energy to consumers and businesses.
“Affordable energy supports
the very foundation of
American life.”
— John S. Watson Chairman & CEO
Chevron Corporation
Taking Action on Energy: A CEO Vision for America’s Energy Future
7
Environmental Stewardship
A long-term U.S. energy strategy should ensure that the nation produces and consumes energy in a manner that is
consistent with protecting human health and preserving the environment through responsible and diligent management
of natural resources. U.S. energy producers are responsible for meeting today’s energy needs, and they should do so
while safeguarding the environment for future generations. Energy producers should continuously strive for operational
excellence to mitigate risks and minimize the overall environmental impact using proven and cost-effective practices and
technologies. Likewise, energy users have an interest in consuming energy efficiently, reducing both their energy costs
and their environmental impact.
Efforts to increase our understanding of the short- and long-term environmental risks of energy production are
important and should be based on sound science. Regulations designed to ensure environmental stewardship should
be based on a full lifecycle accounting of costs and benefits. The importance of this cannot be overstated. In addition
to making energy less affordable and harming economic growth, excessive regulation and government intervention can
drive production and energy-intensive manufacturing overseas, where environmental protection can be less of a priority.
Successful environmental stewardship also requires a global commitment that levels the playing field and ensures that
energy is produced in an environmentally responsible manner, regardless of location.
Energy Policy and Climate Change
As described in the Business Roundtable’s 2007 Statement on Climate Change:
Because the consequences of global warming for society and ecosystems are potentially serious and
far-reaching, steps to address the risks of such warming are prudent even now, while the science
continues to evolve. The Business Roundtable supports collective actions that will lead to the reduction
of [greenhouse gas (GHG)] emissions on a global basis with the goal of slowing increases in GHG
concentrations in the atmosphere and ultimately stabilizing them at levels that will address the risks
of climate change. These actions need to be coordinated with efforts to address other urgent world
priorities, such as reducing poverty, improving public health, reducing environmental degradation and
raising living standards. Reliable and affordable world supplies of energy are essential for meeting
these challenges.
Business Roundtable
8
Toward a Coherent, Balanced and Sustainable U.S. Energy Policy
Traditional policy paradigms frequently place the pursuit of our economic, security and environmental goals in
competition with one another. The Business Roundtable believes, however, that America’s economic, security and
environmental futures can and should be mutually reinforcing in the long run. For example:
◗◗ Economic growth enables increased investment in new technologies, including energy efficiency and supply
technologies, and the public and private gains generated by a strong economy can fund both environmental
improvements and a more robust, secure energy infrastructure.
◗◗ A secure and reliable energy supply, especially when coupled with cost-effective improvements in energy efficiency,
reduces the economy’s exposure to market volatility and provides a more predictable climate for investing in cleaner
technologies.
◗◗ Successful environmental stewardship improves human health and environmental quality while reducing pollution-
related health care costs and increasing worker productivity. It can also reduce the likelihood of disruptions to
energy supplies and highly dependent economic activities.
The CEOs of the Business Roundtable believe that economic growth is the primary driver of this virtuous cycle. Without
economic growth, we cannot afford the investments required to improve our energy security and safeguard our
environment. And without access to a diverse portfolio of affordable energy supplies and continuous improvements
in energy efficiency, economic growth will suffer. For this reason, we believe that a long-term U.S. energy policy that
places the concepts of affordability, diversity and efficiency at its core has the greatest potential to place the nation on
a more sustainable pathway — that is, a pathway in which we simultaneously advance all three of our policy goals and
maintain those improvements indefinitely.
Taking Action on Energy: A CEO Vision for America’s Energy Future
9
III. Guiding Principles
To advance the goals of economic growth, energy security and environmental stewardship, U.S. policies and regulations
should be aligned with the following principles.
Foster Innovation: A long-term U.S. energy policy should foster innovation by improving education at all levels,
especially in science, technology, engineering and math; sustaining public investments in a diverse portfolio of
precommercial energy technology research and development; and focusing public investments on research and
development for scalable energy sources that are likely to be commercially viable in the absence of government support.
Encourage Competition and Energy Resource Diversity: A long-term U.S. energy policy should encourage
competition and energy source diversity by ensuring that the private sector has access to all energy sources, both
foreign and domestic; avoiding measures that discourage any energy source or any form of energy investment; ensuring
that policies and regulations are technology and fuel-source neutral; and ensuring that any policies supporting the
commercialization of fuels or technologies are designed to overcome well-documented market inefficiencies, are applied
only to fuels and technologies that have a credible pathway to unsubsidized competitiveness, and are finite in duration
and eventually phased out in a predictable fashion.
Empower Consumers: A long-term U.S. energy policy should empower consumers by improving the quality,
transparency and flow of information to energy consumers and by leveraging market-based solutions that use price
signals and consumer choice among competitive fuel and technology options.
Engage Internationally: A long-term U.S. energy policy should engage the international community by supporting
open, unbiased and rules-based trade and investment systems and by providing leadership and encouraging collective
action to address global energy and environmental challenges, including climate change.
Ensure Smarter Regulation: A long-term U.S. energy policy should ensure smarter regulation by establishing
clear, predictable “rules of the road” that encourage investments in long-lived energy assets; improving the quality,
transparency and flow of information to policymakers; minimizing administrative and regulatory burden; requiring
regulations to undergo a rigorous, consistent and transparent analysis of their cumulative costs and benefits; supporting
the historic role of states as the primary regulators of energy production; incentivizing investment in energy efficiency;
and avoiding regulatory policies that discourage investments in energy efficiency.
Fortify Critical Infrastructure: A long-term U.S. energy policy should support the fortification of critical infrastructure
by maintaining and enhancing the security of key domestic energy infrastructure and by removing impediments to the
alignment of market-driven infrastructure investments with future energy production and demand.
Business Roundtable
10
IV. Energy Efficiency
Energy efficiency is a cornerstone of a successful energy policy.
Indeed, investments in energy efficiency have the potential to
simultaneously advance all three pillars of a balanced, long-term
energy strategy — resulting in a proverbial “win-win-win” for
U.S. consumers and businesses. Cost-effective improvements
in energy efficiency can boost economic growth by decreasing
energy costs while increasing productivity and competitiveness;
enhance energy security by reducing domestic energy
consumption and lessening our exposure to disruptions in global
energy markets; and protect human health and the environment
by curtailing the release of criteria pollutants, GHGs and other
emissions.
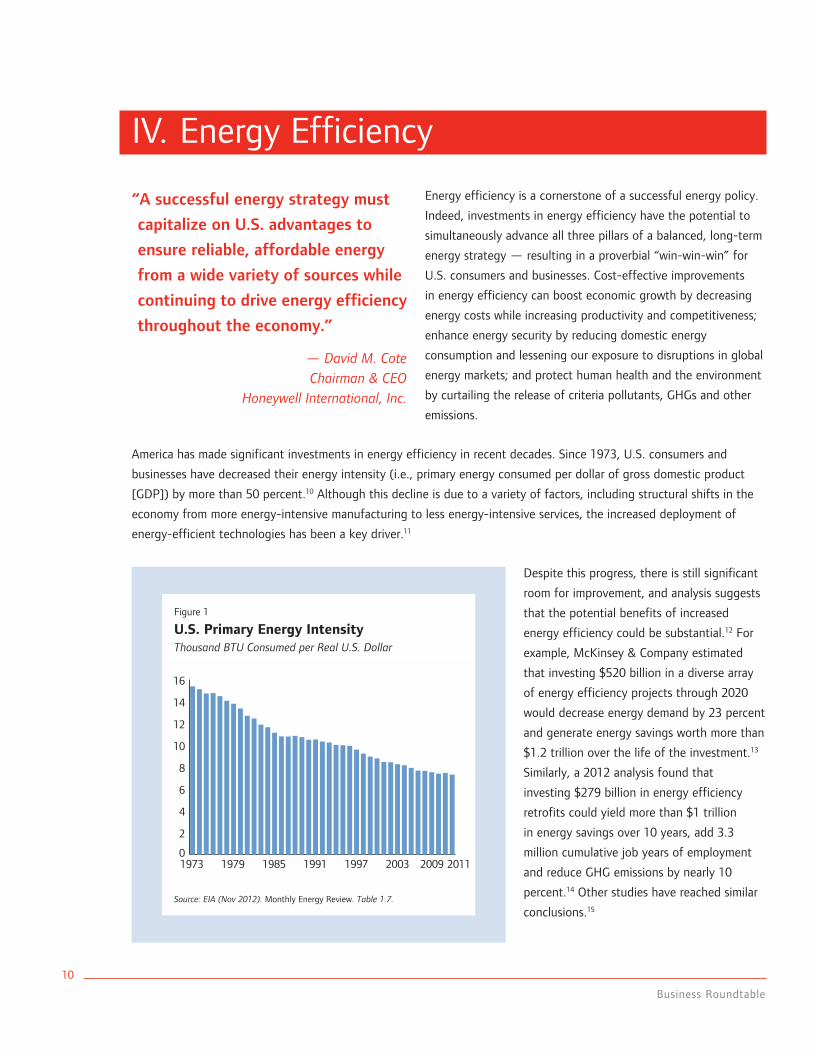
America has made significant investments in energy efficiency in recent decades. Since 1973, U.S. consumers and
businesses have decreased their energy intensity (i.e., primary energy consumed per dollar of gross domestic product
[GDP]) by more than 50 percent.10 Although this decline is due to a variety of factors, including structural shifts in the
economy from more energy-intensive manufacturing to less energy-intensive services, the increased deployment of
energy-efficient technologies has been a key driver.11
Despite this progress, there is still significant
room for improvement, and analysis suggests
that the potential benefits of increased
energy efficiency could be substantial.12 For
example, McKinsey & Company estimated
that investing $520 billion in a diverse array
of energy efficiency projects through 2020
would decrease energy demand by 23 percent
and generate energy savings worth more than
$1.2 trillion over the life of the investment.13
Similarly, a 2012 analysis found that
investing $279 billion in energy efficiency
retrofits could yield more than $1 trillion
in energy savings over 10 years, add 3.3
million cumulative job years of employment
and reduce GHG emissions by nearly 10
percent.14 Other studies have reached similar
conclusions.15
“A successful energy strategy must
capitalize on U.S. advantages to
ensure reliable, affordable energy
from a wide variety of sources while
continuing to drive energy efficiency
throughout the economy.”
— David M. Cote Chairman & CEO
Honeywell International, Inc.
Figure 1
U.S. Primary Energy IntensityThousand BTu Consumed per Real u.S. Dollar
0
2
4
6
8
10
12
14
16
1973 1979 1985 1991 2011
Figure 1. U.S. Primary Energy Intensity
2003 20091997
Source: EIA (Nov 2012). Monthly Energy Review. Table 1.7.
Taking Action on Energy: A CEO Vision for America’s Energy Future
11
To capture these benefits, however, America needs a coherent energy policy that prioritizes cost-effective energy
efficiency. Technological advances, combined with innovative approaches to encourage the adoption of cost-effective
efficiency measures, are driving further improvements in the way that we produce and consume energy. Nevertheless,
smarter regulation and well-designed policies are needed to overcome key barriers and unlock the economic, security
and environmental benefits associated with improved efficiency.
Trends in Energy Efficiency
Energy Efficiency Incentives
In recent years, policymakers have attempted to incentivize energy efficiency through a variety of measures. Funding for
energy efficiency projects has been authorized in a number of federal legislative packages, including the Energy Policy
Act of 2005, the Energy Independence and Security Act of 2007 (EISA), and the Energy Improvement and Extension
Act of 2008. More recently, the American Recovery and Reinvestment Act (ARRA) provided more than $25 billion for
core energy efficiency projects across the country.16 These funds were disbursed through a variety of channels, including
Energy Efficiency and Conservation Block Grants to states, the State Energy Program, and the Weatherization Assistance
Program. Other funding was also provided through grants that were matched by the private sector (e.g., smart grid
grants).
Tax incentives (e.g., personal, corporate, sales or property taxes) are also used to encourage energy efficiency. ARRA
included substantial federal tax incentives for energy efficiency, while many states and localities offer their own tax
incentives for energy efficiency measures.17 Other incentives, such as utility rebates, grants and loans, have also been
used as a means to encourage implementation of energy efficiency measures in the residential, commercial and industrial
markets. Currently, utilities provide more than 1,000 programs across the country to incentivize a wide portfolio of
efficiency measures in each sector.18
In addition, a variety of innovative financing arrangements have incentivized individuals and businesses to implement
energy efficiency measures. These arrangements include:
◗◗ Energy Savings Performance Contracts (ESPCs) — Under an ESPC, an Energy Services Company (ESCO)
arranges private financing to pay the costs associated with identifying and installing energy-efficient equipment.
The ESCO also guarantees that the cost savings resulting from these energy efficiency improvements will cover the
cost of the financing and service on the newly installed equipment. Any savings in excess of the guarantee accrue
to the owner.
◗◗ Energy Service Agreements (ESAs) — Under an ESA, private lenders fund the cost of efficiency improvements
and also assume responsibility for paying the property owner’s energy bills. The property owner pays the lender
an agreed-upon monthly amount that is based on the owner’s historical energy consumption charge. As such, the
lender captures the full value of the energy efficiency improvements and savings at no cost to the property owner.
◗◗ Property Assessed Clean Energy (PACE) Financing — Administered through municipalities, PACE funds are
provided through public bonds or private lenders and provide up-front funding for efficiency improvements. This
Business Roundtable
12
funding is paid back through a special assessment on participants’ property taxes. If the property is sold before the
loan is repaid, the new owner assumes responsibility for the tax assessment. If the property owner defaults on the
mortgage, the PACE lender has “first lien” rights and would recover funds before the mortgage lender.
◗◗ On-Bill Financing — On-bill financing is a financial agreement between a property owner and utility company in
which the company provides funding for energy efficiency improvements. The utility provides the initial funding for
the improvement and recoups its expense from the property owner through a surcharge on the owner’s monthly
utility bills until the loan is repaid. Utilities in at least 20 states have already implemented or will soon implement
on-bill financing programs.19
Voluntary Standards
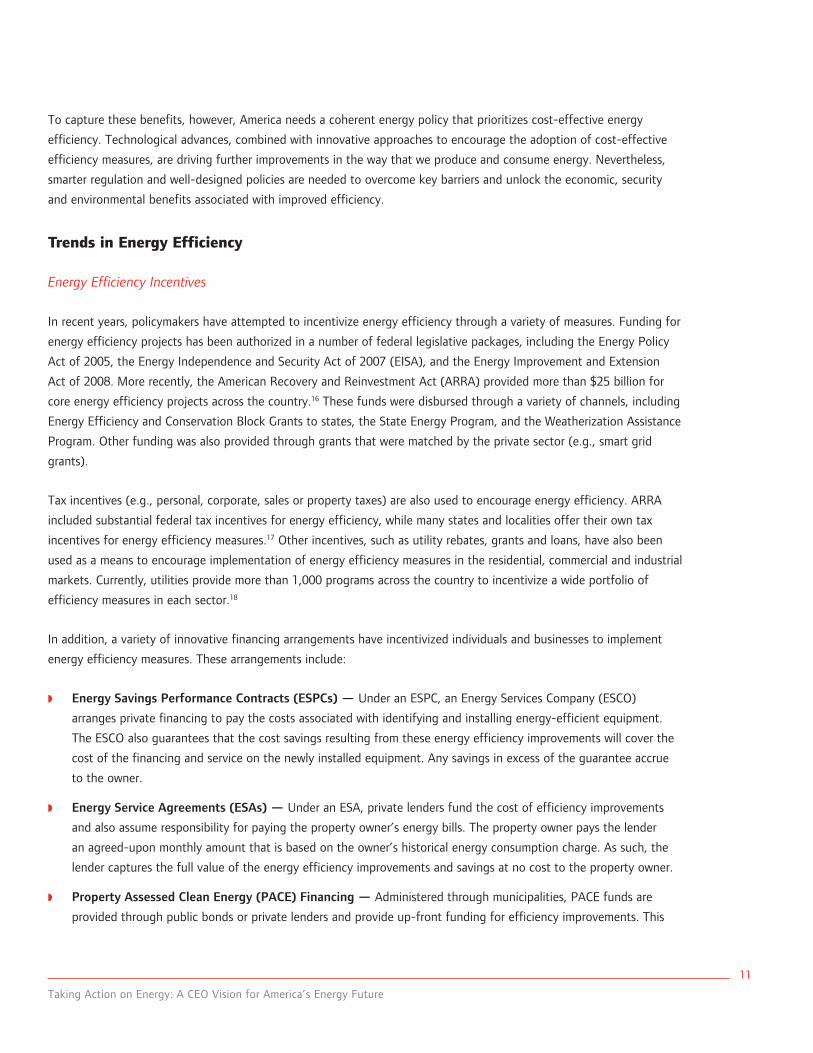
In addition to financial incentives, voluntary
energy standards for buildings, appliances
and equipment can also play an important
part in increasing energy efficiency.
Buildings represent the largest energy
consuming sector in the United States, and
measures to increase their energy efficiency
can have significant impacts.20 For example,
through the voluntary ENERGY STAR®
program, the Department of Energy (DOE)
and Environmental Protection Agency (EPA)
have helped make consumers and businesses
more aware of and informed about the
energy efficiency of various products, which
is estimated to have saved nearly $18 billion
in utility bill expenses while reducing GHG
emissions.21 Through ENERGY AWARE — a
voluntary program coordinated by private
industry — thermostat manufacturers
worked with the National Electrical Manufacturers Association to create and implement a certification and labeling
standard for high-performance programmable residential thermostats. The program is intended to assist homeowners,
distributors, contractors and installers in choosing programmable thermostat models that will best meet individual and
family needs to manage and reduce energy.
Other voluntary programs, such as the U.S. Green Building Council’s Leadership in Energy and Environmental Design
(LEED) program and the International Living Building Institute’s Living Building Challenge program, use comprehensive
rating systems to assess a building’s energy and environmental performance. Another voluntary standard, known as ISO
50001, was developed by the International Organization for Standardization and establishes frameworks for industrial,
commercial, institutional and governmental facilities.
Figure 2
Energy Consumption by End-Use SectorPercentage of Total u.S. Energy Consumption, 2011Figure 2. Energy Consumption by End-Use Sector
Commercial(19%)
Residential(22%)
Industrial(31%)
Transportation(28%)
Source: EIA (2012). Annual Energy Review 2011. Table 2.1a.
Taking Action on Energy: A CEO Vision for America’s Energy Future
13
Regulatory Requirements
State and federal governments are increasingly issuing regulatory requirements intended to improve energy efficiency.
For example, Citi Global Perspectives & Solutions predicts that, by 2020, new federal vehicle standards could increase
the weighted-average fuel economy of the national automobile fleet by 16 percent from 2010 levels.22 EISA included a
variety of energy efficiency provisions, including higher efficiency standards for lighting.23 Presidents Bush and Obama
each issued Executive Orders and other guidance calling on federal agencies to improve energy efficiency in their
building operations and purchases, including a December 2011 order requiring agencies to enter into at least $2 billion
in ESPCs and Utility Energy Service Contracts (UESCs) over two years.24
Although progress related to prior efforts to improve energy efficiency in federal facilities has been slower than
some industry stakeholders had hoped, industry is currently working closely with the government to implement the
recent memorandum. For instance, the Department of Defense (DOD), which is the nation’s largest energy user, has
established a variety of energy-related goals, including increasing efficiency across its platforms and facilities and
reducing overall consumption.25 Internationally, buildings ratings systems, such as Australia’s government-implemented
National Australian Built Environment Rating System (NABERS) program, are designed to help businesses and consumers
improve their energy efficiency and reduce their environmental impact.26
States and municipalities have also developed requirements related to energy efficiency. Of the 30 states (including the
District of Columbia) that have a mandatory Renewable Portfolio Standard or an Alternative Energy Portfolio Standard,
13 incorporate energy efficiency as an eligible resource for meeting the standard.27 In addition, municipal building codes
are widely acknowledged to improve the energy efficiency of buildings.28
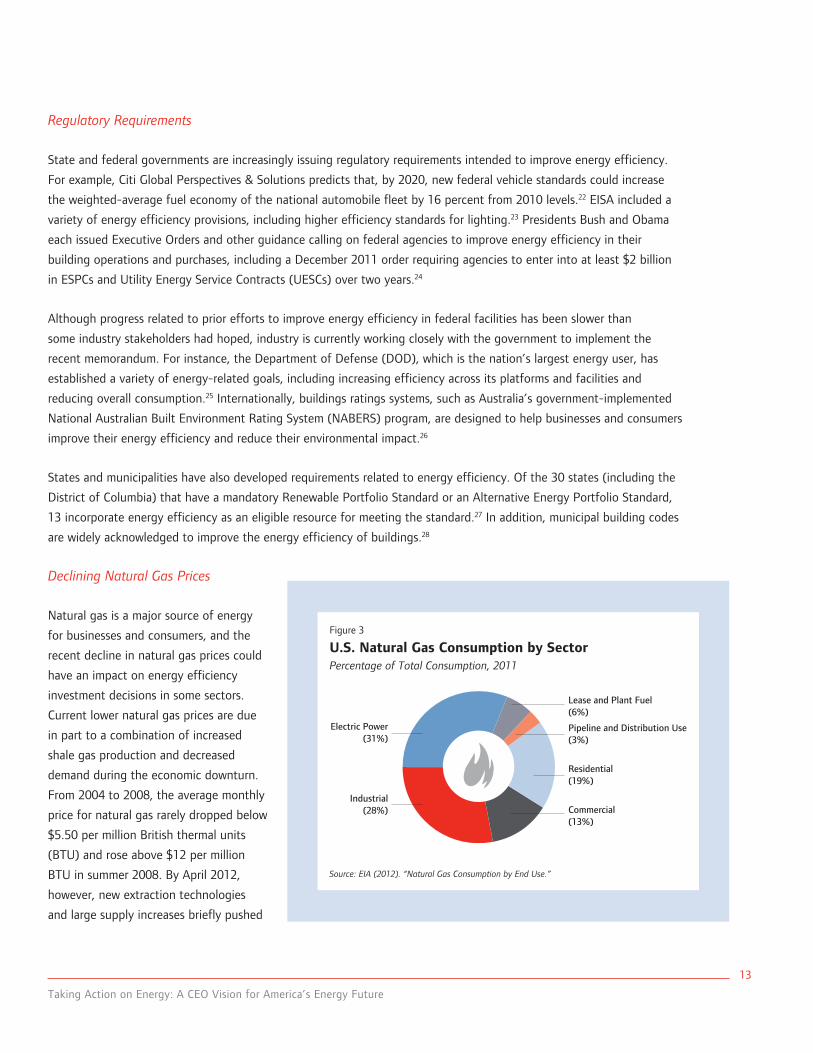
Declining Natural Gas Prices
Natural gas is a major source of energy
for businesses and consumers, and the
recent decline in natural gas prices could
have an impact on energy efficiency
investment decisions in some sectors.
Current lower natural gas prices are due
in part to a combination of increased
shale gas production and decreased
demand during the economic downturn.
From 2004 to 2008, the average monthly
price for natural gas rarely dropped below
$5.50 per million British thermal units
(BTU) and rose above $12 per million
BTU in summer 2008. By April 2012,
however, new extraction technologies
and large supply increases briefly pushed
Figure 3
U.S. Natural Gas Consumption by SectorPercentage of Total Consumption, 2011
Pipeline and Distribution Use(3%)
Figure 3. U.S. Natural Gas Consumption by Sector
Lease and Plant Fuel(6%)
Commercial(13%)
Residential(19%)
Electric Power(31%)
Industrial(28%)
Source: EIA (2012). “Natural Gas Consumption by End use.”
Business Roundtable
14
prices below $2 per million BTU,29 and EIA expects them to remain below $5 per million BTU in real dollars through
2025.30 Although low natural gas prices benefit the economy via lower energy costs for consumers and business, they
may also diminish the economic incentive for some consumers to use energy more efficiently.
Increased Awareness
U.S. consumers are placing even more emphasis on managing their energy use due to the economic downturn, as well as
their increasing awareness of environmental impact.31 A recent survey found that 83 percent of consumers took steps to
reduce their electricity bills in 2011, up 15 percentage points from the previous year.32 Similarly, more than 90 percent
of surveyed consumers indicated that they expect their future energy use would be equal to or less than their current
energy use.33
U.S. businesses have demonstrated a similar willingness to embrace cost-effective energy efficiency measures. A survey
of business executives across industries found that 90 percent of companies have set goals regarding electricity and
energy management.34 While cutting costs is the primary motivator (66 percent), internal motivations (56 percent) and
“just the right thing to do” (49 percent) were also cited as reasons. Businesses are increasingly investing in building
technologies that improve energy efficiency and elevate its importance in their corporate culture, embracing the energy
savings potential of LEED, ENERGY STAR and similar programs. However, some businesses continue to require relatively
short payback periods to justify making such investments.35
utility Requirements and Resource Planning
Some public policies inadvertently discourage utilities’ investment in energy efficiency. For example, while demand
reduction investments may be significantly cheaper than building new generating capacity or purchasing new supplies
of electricity or natural gas, some state and utility resource planning processes do not consider efficiency or demand
reduction as resources.36
While EISA requires that each state regulatory authority consider adopting federal standards relating to integrated
resource planning; load management techniques; and rates that allow for utility investment in energy conservation,
energy efficiency and other demand-side management measures, states are not required to implement such measures.37
Additionally, as previously discussed, ARRA includes a provision requiring state governors to “seek to implement”
electricity rate-making policies that align utilities’ financial incentives with more efficient energy use to receive State
Energy Program funding. Some state utility regulators are increasingly integrating efficiency requirements into planning
processes, and cost-effective energy efficiency is already a key component of the resource planning conducted in
many states with vertically integrated utilities. Despite these efforts, progress remains uneven among investor owned,
municipally owned and cooperatively owned utilities.
Taking Action on Energy: A CEO Vision for America’s Energy Future
15
Barriers to Investment in Energy Efficiency
Regulatory Barriers
Regulations can play a role in bridging the gap between naturally occurring and socially optimal levels of energy
use. However, poorly designed regulations can have unintended consequences that discourage investments in
energy efficiency. For example, some industry and utility regulations require costly upgrades and lengthy permitting
processes before energy efficiency projects can move forward.38 These obstacles increase the effective cost of
efficiency investments, which lengthens payback periods and may prevent investments from occurring. Regulation
can also discourage investment in energy efficiency. Under some forms of traditional retail regulation, selling less
electricity means a utility has fewer revenues to cover its costs, providing a disincentive to invest in energy efficiency.39
Additionally, generators in restructured markets and wholesale electricity providers may undervalue energy efficiency
if their revenues are based solely on electricity sales.40 Finally, although recent trends suggest that some utility
regulators have now begun to recognize the important role that energy efficiency can play in resource planning, they
are sometimes less inclined to embrace relatively new technologies when compared to more traditional and established
resource options, such as new generation.41
Local regulations can also be improved to ensure the adoption of cost-effective energy efficiency measures. For
example, as local building codes become out of date they may fail to reflect advancements in building practices that
provide cost-effective improvements in energy efficiency. Given that most new construction is typically built up to —
but not in excess of — minimum building codes, it is critical that these codes are kept up to date to reflect current
cost-effective technologies as identified through consultation with residential and commercial building industries.
Residential and commercial building codes developed by the International Code Council and the American Society
of Heating, Refrigerating and Air-Conditioning Engineers are good examples of existing codes that promote energy
efficiency in new buildings. In addition to updating building codes, some communities require property owners to
conduct a home energy audit on their
structure prior to selling it, which can
provide prospective buyers with valuable
information on the structure’s energy use
and opportunities for cost-effective energy
efficiency improvements.
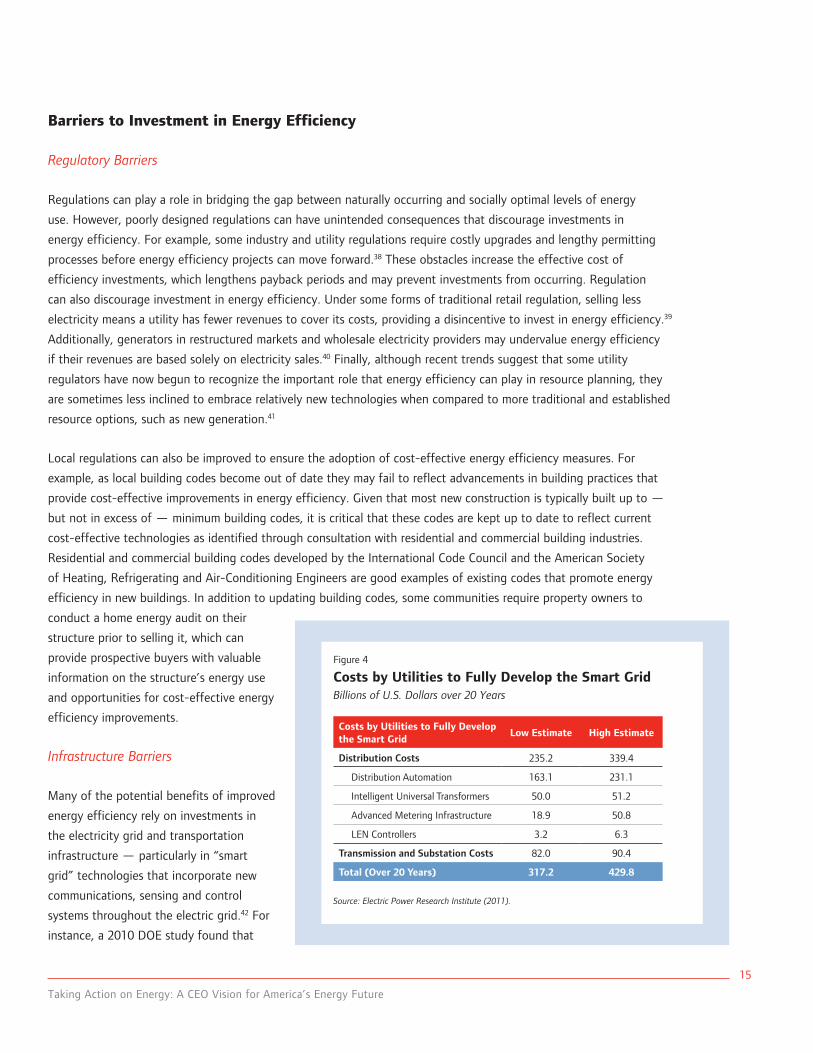
Infrastructure Barriers
Many of the potential benefits of improved
energy efficiency rely on investments in
the electricity grid and transportation
infrastructure — particularly in “smart
grid” technologies that incorporate new
communications, sensing and control
systems throughout the electric grid.42 For
instance, a 2010 DOE study found that
Figure 4
Costs by Utilities to Fully Develop the Smart GridBillions of u.S. Dollars over 20 Years
Costs by Utilities to Fully Develop the Smart Grid
Low Estimate High Estimate
Distribution Costs 235.2 339.4
Distribution Automation 163.1 231.1
Intelligent Universal Transformers 50.0 51.2
Advanced Metering Infrastructure 18.9 50.8
LEN Controllers 3.2 6.3
Transmission and Substation Costs 82.0 90.4
Total (Over 20 Years) 317.2 429.8
Source: Electric Power Research Institute (2011).
Business Roundtable
16
implementing smart grid technologies could reduce total U.S. energy consumption by 7 percent,43 while the Electric
Power Research Institute (EPRI) estimates the total benefits of smart grid to be between $1.3 and $2.0 trillion over the
next two decades.44 By facilitating efficiency improvements through automation and demand response, a modernized
grid can play a significant role in a long-term U.S. energy policy.
Rapid and widespread adoption of smart grid technologies, however, can require substantial up-front investments. EPRI
estimates that fully developing the smart grid — including installing smart devices and communication capabilities in
buildings and throughout the transmission and distribution system — will cost utilities $317 to $430 billion over the
next two decades.45 While some individual smart grid investments are affordable and can be implemented incrementally,
developing a fully modernized grid is a significant undertaking that must compete against other utility investments, such
as transmission upgrades, new generation capacity and plant retrofits.
Split Incentives
A common barrier to improving energy efficiency in the residential and commercial sectors is the so-called split incentive
or principal-agent problem. Split incentives tend to arise when the entity responsible for making decisions to improve
energy efficiency does not receive the full economic benefits associated with those improvements. For instance, a
homebuilder may be responsible for making a range of efficiency-related decisions (e.g., building materials, windows,
heating and cooling systems, and appliances), while the homeowner will ultimately be responsible for paying the
ongoing energy bills that are directly affected by these decisions. Likewise, a building tenant may be responsible for
making energy consumption decisions (e.g., use of lighting and heating/cooling systems), while the building owner is
responsible for paying the ongoing energy bills. It is estimated that the split incentives problem affects half or more of
the energy use in many common residential and commercial end-use markets.46
Awareness and understanding
Another barrier to improving energy efficiency can be a lack of consumer awareness and understanding. For example,
some consumers may be unaware that cost-effective opportunities to improve energy efficiency exist, while others may
be unaware that there are energy efficiency programs that can help finance those investments. Also, in some instances,
there is a reluctance to deviate from regional norms based on climate, available materials and skills. Further, builders
may view new energy efficient materials as risky until they gain more experience with them, as new materials require
additional time to train workers and may also entail higher up-front costs.47
Transaction Costs
Transaction costs represent another significant barrier to improving energy efficiency. For instance, even if consumers
and businesses are aware that certain efficiency-enhancing opportunities exist, they may be unwilling or unable to invest
the time and effort needed to identify, research and assess their options. For many supply-side investments (e.g., the
decision to build a new power plant), the transaction costs are often a relatively small portion of the overall costs of the
project. For many demand-side investments (e.g., the decision to purchase a new dishwasher), however, the transaction
costs can be a substantial portion of the overall costs of the project. Thus, although consumers and businesses may have
Taking Action on Energy: A CEO Vision for America’s Energy Future
17
numerous opportunities to improve energy efficiency, the potential benefits associated with each individual opportunity
may be too small to justify the investments in time and effort needed to take advantage of it.48 Measures that reduce
transaction costs, such as disseminating accurate information and analysis to consumers about common opportunities,
can help overcome this barrier and accelerate cost-effective investments in energy efficiency.
Policy Recommendations To Improve Energy Efficiency
Innovation
◗◗ Focus research and development on cost-effective technologies that have the potential to improve energy
efficiency while diversifying energy sources.
◗◗ The federal government should provide resources, either by itself or in combination with industry, for precommercial
aspects of priority technology areas, such as those identified in the National Petroleum Council’s Future
Transportation Fuels report.
◗◗ Direct DOE to establish collaborative research and development partnerships between the DOE Advanced
Manufacturing Office and other DOE offices, with a focus on precommercial energy efficiency technology
development for innovative manufacturing processes that improve efficiency, reduce emissions and waste, and
improve industrial cost competitiveness.
◗◗ Establish an industry-government research and development partnership for new sustainable manufacturing
and industrial processes, and ensure adequate funding for the Industries of the Future program, which provides
industrial research and development of energy efficient technologies.
Incentives
◗◗ Congress should evaluate the cost-effectiveness of existing and proposed measures to improve energy efficiency,
including but not limited to efficiency standard credits for appliances, accelerated depreciation of capital
investments, financing mechanisms for residential building improvements and other financing innovations that
facilitate the installation of cost-effective energy efficient technologies in buildings.
◗◗ To the extent that Congress adopts or extends tax incentives and other measures designed to improve energy
efficiency, it should ensure that those measures are designed to overcome well-documented market inefficiencies,
are applied only to technologies that have a credible pathway to unsubsidized competitiveness, and are finite in
duration and eventually phased out in a predictable fashion.
Standards and Regulations
◗◗ States and localities should be encouraged to accelerate the adoption and implementation of energy efficient
building codes on an ongoing basis, including the most recent nationally recognized energy efficiency standards for
residential and commercial buildings.
Business Roundtable
18
◗◗ Adopt new cost-effective standards for home appliances, residential heating and cooling systems, and other
products as jointly recommended by a group of key stakeholders, including energy consumers, technology suppliers,
manufacturers and efficiency advocates.
◗◗ Support industry-led standards for energy efficiency, including ENERGY AWARE for residential and light commercial
thermostats.
◗◗ Ensure that state legislatures and public utility commissions consider policies that promote investment in cost-
effective energy efficiency measures, demand response measures and home energy management systems through
a public and state regulatory approval process, and ensure that such investments are as profitable for utilities as
generation and distribution assets.
◗◗ Congress should (1) direct the federal government to adopt a uniform buildings rating system; (2) ensure that all
federal government buildings constructed, acquired or newly occupied after a certain date meet a minimum rating
standard for energy efficiency; and (3) ensure that all government buildings currently owned or occupied meet
a minimum rating standard for energy efficiency by 2020, provided that an ESCO or a similar entity is willing to
finance the upgrades and guarantee the savings.
Information and Awareness
◗◗ Support technical assistance programs such as ENERGY STAR, the EPA Local Climate and Energy Program and the
DOE Better Buildings Program.
◗◗ Establish a DOE “Supply Star” program to promote best practices and recognize companies and products that use
highly efficient supply chains.
◗◗ Policymakers should support the deployment of cost-effective automated controls and energy management
technologies and systems that make real-time energy consumption visible to industrial users, homeowners, building
owners and tenants.
◗◗ Develop best practices for the advanced monitoring and management of energy use in federal facilities, buildings
and equipment.
Taking Action on Energy: A CEO Vision for America’s Energy Future
19
Other Recommendations
◗◗ Expand the use of ESPCs and UESCs in the federal government, as well as training and education for federal energy
managers, policymakers and procurement/legal staff regarding the use and benefits of these contracts.
◗◗ Develop energy efficiency programs based on effective federal policy guidelines that can be cost-effectively
implemented at the state level, and give states the flexibility to account for local differences in regulatory
approaches.
◗◗ Establish an industry-government partnership to evaluate barriers to expanding electric vehicle charging and
disposal infrastructure, such as installation costs, ownership and effective utility rate structures.
◗◗ Encourage government policies that promote energy efficiency and retrofit in residential and commercial
buildings including proposals that (1) address mortgage lending regulators’ concerns about PACE financing (PACE
Assessment Protection Act of 2011); (2) encourage federal loan agencies to factor expected energy costs into
the mortgage underwriting process for single family homes; and (3) encourage the use of ESPCs and other similar
efforts for private commercial buildings.
◗◗ Congress and the Executive Branch should continue to support Corporate Average Fuel Economy (CAFE) rulemaking
to improve motor vehicle fuel efficiency, subject to ongoing assessments of economic viability and public safety.
◗◗ Direct the National Institute of Standards and Technology (NIST) to develop model energy efficiency measurement,
forecasting and accounting methodologies and planning protocols for consideration and possible use by load-
serving entities, states and Regional Transmission Organization/Independent System Operators for resource
adequacy planning activities.
Business Roundtable
20
V. Traditional Energy Production
For decades, traditional energy sources — including oil, coal
and natural gas — have been the standard-bearer of the U.S.
energy portfolio, and they will continue to play a crucial role
in America’s long-term energy strategy. Today, these energy
sources supply more than 80 percent of U.S. energy demand.49
Investment in traditional production promotes all three pillars of
a successful energy strategy. Economically, sound investments
in new technologies and processes such as horizontal drilling
and hydraulic fracturing are unlocking new energy sources that
create jobs, grow the economy, revitalize manufacturing and
improve international competitiveness. From an energy security
perspective, increased domestic production of oil, coal, natural
gas and other traditional fuels is consistent with increased
energy self-sufficiency and can help insulate U.S. consumers
and businesses against global energy market disruptions. Finally,
improvements in fossil fuel extraction and production methods are helping to reduce the environmental footprint of
these fuels, and emerging carbon capture, utilization and storage (CCUS) technologies hold promise for further reducing
the impact of traditional energy production on
the environment.
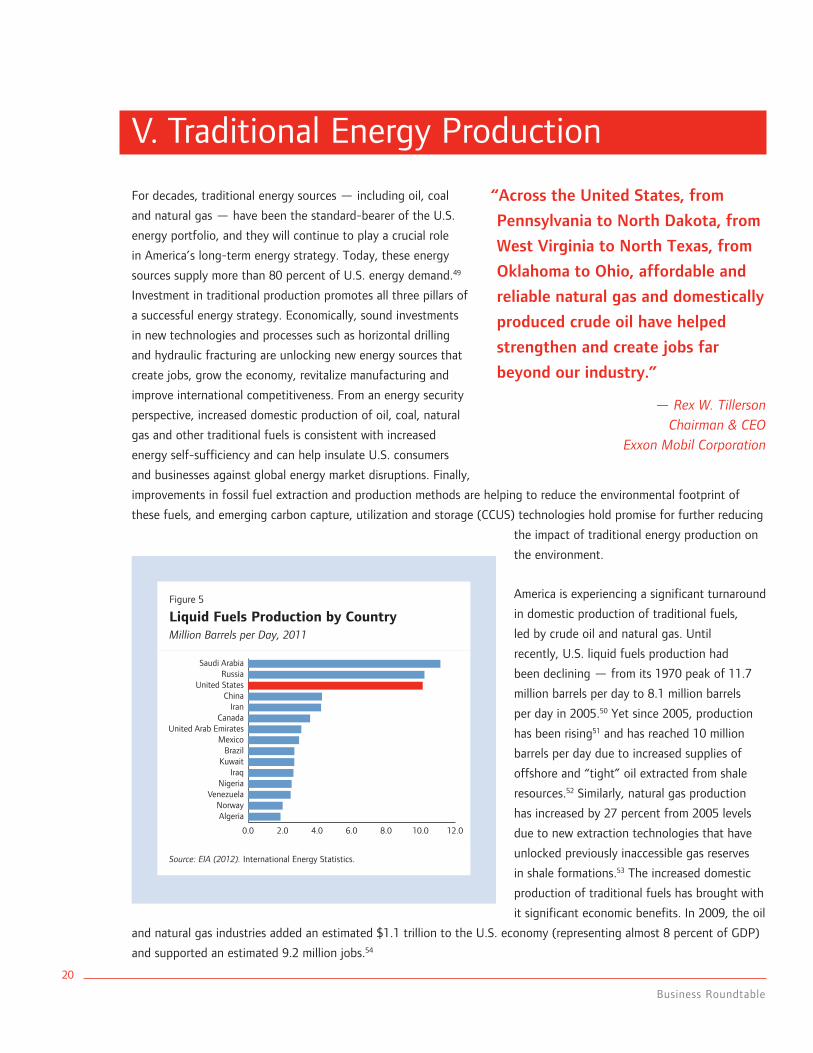
America is experiencing a significant turnaround
in domestic production of traditional fuels,
led by crude oil and natural gas. Until
recently, U.S. liquid fuels production had
been declining — from its 1970 peak of 11.7
million barrels per day to 8.1 million barrels
per day in 2005.50 Yet since 2005, production
has been rising51 and has reached 10 million
barrels per day due to increased supplies of
offshore and “tight” oil extracted from shale
resources.52 Similarly, natural gas production
has increased by 27 percent from 2005 levels
due to new extraction technologies that have
unlocked previously inaccessible gas reserves
in shale formations.53 The increased domestic
production of traditional fuels has brought with
it significant economic benefits. In 2009, the oil
and natural gas industries added an estimated $1.1 trillion to the U.S. economy (representing almost 8 percent of GDP)
and supported an estimated 9.2 million jobs.54
“Across the United States, from
Pennsylvania to North Dakota, from
West Virginia to North Texas, from
Oklahoma to Ohio, affordable and
reliable natural gas and domestically
produced crude oil have helped
strengthen and create jobs far
beyond our industry.”
— Rex W. Tillerson Chairman & CEO
Exxon Mobil Corporation
Figure 5
Liquid Fuels Production by CountryMillion Barrels per Day, 2011
0.0 2.0 4.0 6.0 8.0 10.0 12.0
Saudi ArabiaRussia
United StatesChina
IranCanada
United Arab EmiratesMexico
BrazilKuwait
IraqNigeria
VenezuelaNorwayAlgeria
Figure 5. Liquid Fuels Production by Country
Source: EIA (2012). International Energy Statistics.
Taking Action on Energy: A CEO Vision for America’s Energy Future
21
Even as increasing energy efficiency helps to reduce the growth in energy demand, and technological advances and
economies of scale are reducing the cost of alternatives, the United States will continue to rely heavily on traditional
energy resources to power our economy for many decades to come.55 The EIA expects that oil, coal and natural gas
will still supply 81 percent of the nation’s energy needs in 2035.56 According to the National Petroleum Council (NPC),
under optimal conditions — including favorable regulations, technology improvements and access to key lands — the
United States and Canada could maintain high levels of crude oil production through 2050.57
Future economic growth depends upon policies to encourage the development of new and existing oil, natural gas
and coal resources. A study commissioned by the American Petroleum Institute estimates that, by 2030, such policies
could generate an additional $800 billion in government revenue and produce 1.4 million jobs.58 Likewise, a National
Coal Council study estimates that advanced coal technologies, coupled with CCUS technologies for use in enhanced oil
recovery could generate an additional $200 billion in economic activity and add 1 million jobs, while also reducing oil
imports by more than 6 million barrels per day and substantially lowering carbon emissions.59
The energy renaissance has provided America with a tremendous opportunity. If harnessed correctly, increased
development of the nation’s traditional fuel resources can result in significant business investment and job growth and
bring the nation closer to energy self-sufficiency, all while reducing GHG emissions and other pollutants. Realizing this
long-term potential, however, will require a comprehensive, consistent and forward-looking national energy strategy
that reflects current realities, addresses key barriers and capitalizes on future trends.
Trends in Traditional Energy Production
Global Energy Trends
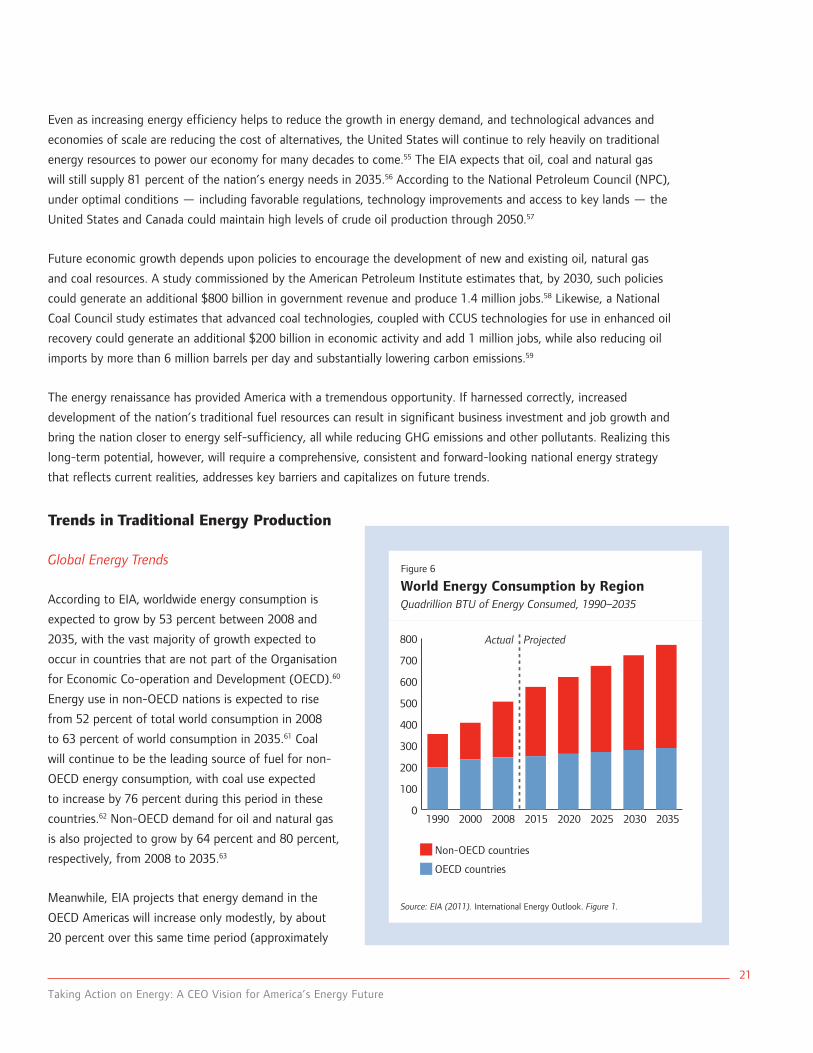
According to EIA, worldwide energy consumption is
expected to grow by 53 percent between 2008 and
2035, with the vast majority of growth expected to
occur in countries that are not part of the Organisation
for Economic Co-operation and Development (OECD).60
Energy use in non-OECD nations is expected to rise
from 52 percent of total world consumption in 2008
to 63 percent of world consumption in 2035.61 Coal
will continue to be the leading source of fuel for non-
OECD energy consumption, with coal use expected
to increase by 76 percent during this period in these
countries.62 Non-OECD demand for oil and natural gas
is also projected to grow by 64 percent and 80 percent,
respectively, from 2008 to 2035.63
Meanwhile, EIA projects that energy demand in the
OECD Americas will increase only modestly, by about
20 percent over this same time period (approximately
Figure 6
World Energy Consumption by RegionQuadrillion BTu of Energy Consumed, 1990–2035
0
100
200
300
400
500
600
700
800
1990 2008 2015 20352000
Non-OECD countries
OECD countries
2020
Figure 6. World Energy Consumption by Region
ProjectedActual
2025 2030
Source: EIA (2011). International Energy Outlook. Figure 1.
Business Roundtable
22
0.7 percent per year).64 Yet even while demand is moderating, domestic production of key traditional energy resources
is seeing significant gains, which are projected to continue. Recent oil and natural gas discoveries and the application
of new recovery technologies — along with continuous improvement in reducing the costs of renewables — raise the
possibility that North America could become energy self-sufficient and an important exporter of some fuels to the rest
of the world in the coming decades.65 These developments could fundamentally alter the foundation on which our
energy policies have been based over the past 30 years.
Oil and Natural Gas: Domestic Production and Import Dynamics
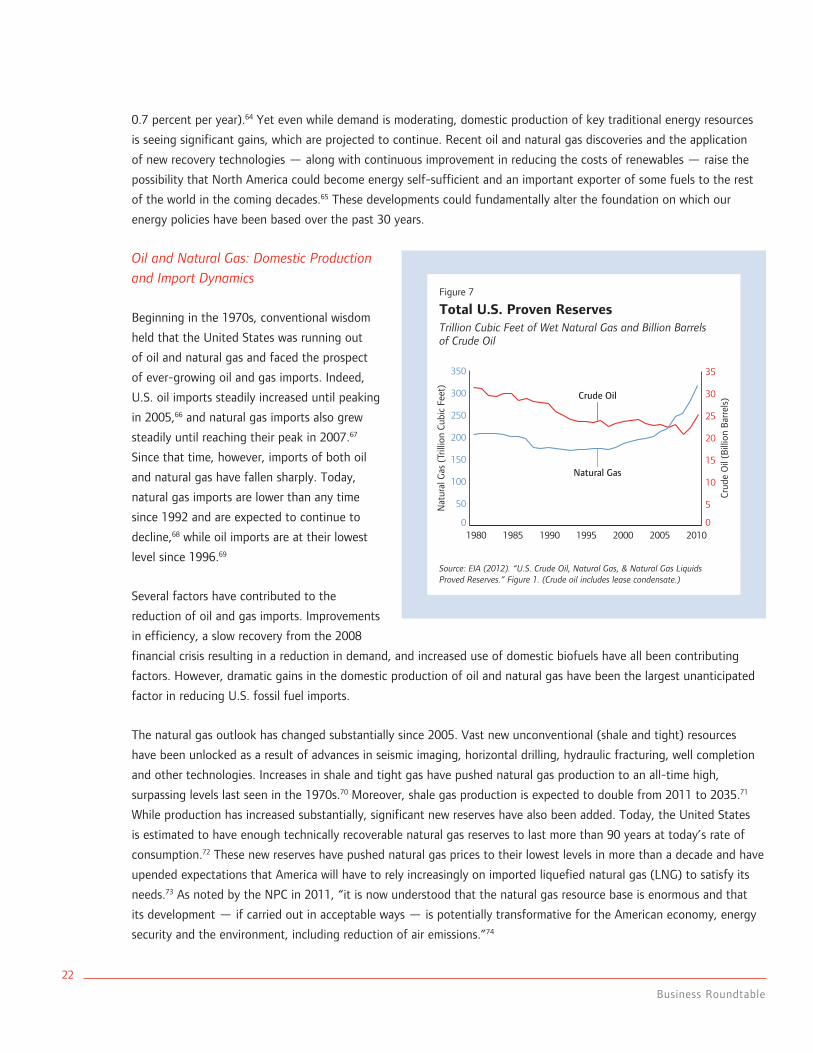
Beginning in the 1970s, conventional wisdom
held that the United States was running out
of oil and natural gas and faced the prospect
of ever-growing oil and gas imports. Indeed,
U.S. oil imports steadily increased until peaking
in 2005,66 and natural gas imports also grew
steadily until reaching their peak in 2007.67
Since that time, however, imports of both oil
and natural gas have fallen sharply. Today,
natural gas imports are lower than any time
since 1992 and are expected to continue to
decline,68 while oil imports are at their lowest
level since 1996.69
Several factors have contributed to the
reduction of oil and gas imports. Improvements
in efficiency, a slow recovery from the 2008
financial crisis resulting in a reduction in demand, and increased use of domestic biofuels have all been contributing
factors. However, dramatic gains in the domestic production of oil and natural gas have been the largest unanticipated
factor in reducing U.S. fossil fuel imports.
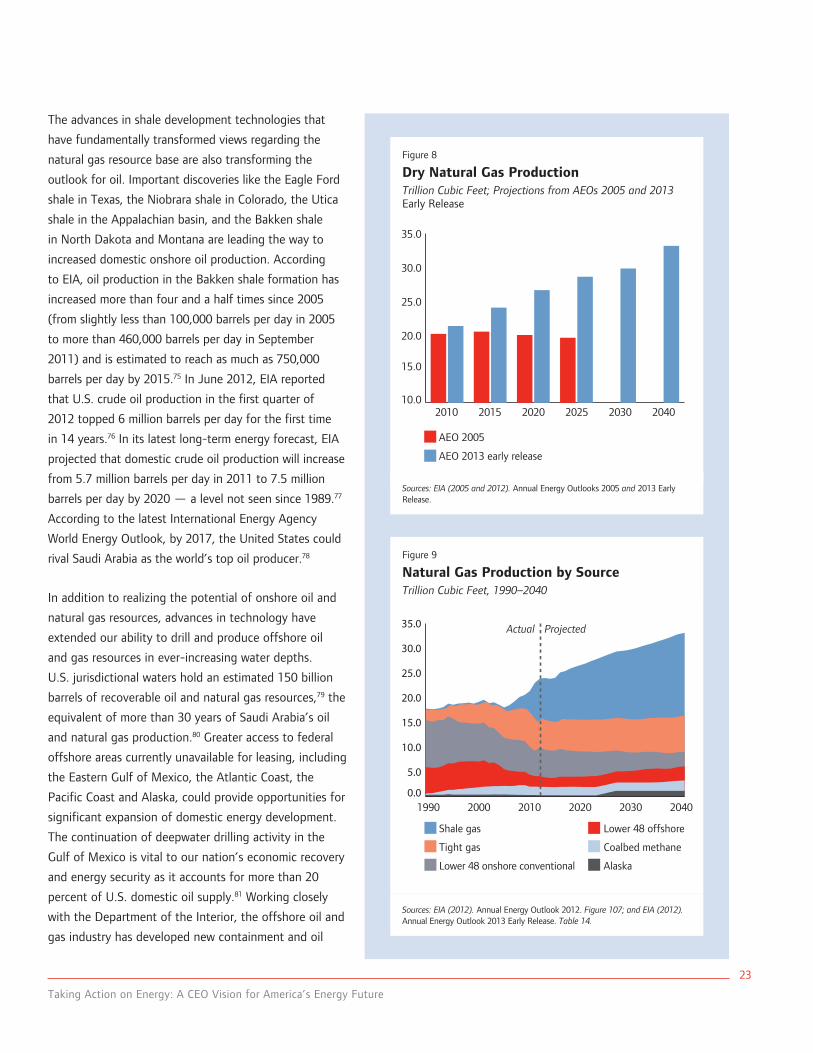
The natural gas outlook has changed substantially since 2005. Vast new unconventional (shale and tight) resources
have been unlocked as a result of advances in seismic imaging, horizontal drilling, hydraulic fracturing, well completion
and other technologies. Increases in shale and tight gas have pushed natural gas production to an all-time high,
surpassing levels last seen in the 1970s.70 Moreover, shale gas production is expected to double from 2011 to 2035.71
While production has increased substantially, significant new reserves have also been added. Today, the United States
is estimated to have enough technically recoverable natural gas reserves to last more than 90 years at today’s rate of
consumption.72 These new reserves have pushed natural gas prices to their lowest levels in more than a decade and have
upended expectations that America will have to rely increasingly on imported liquefied natural gas (LNG) to satisfy its
needs.73 As noted by the NPC in 2011, “it is now understood that the natural gas resource base is enormous and that
its development — if carried out in acceptable ways — is potentially transformative for the American economy, energy
security and the environment, including reduction of air emissions.”74
Figure 7
Total U.S. Proven ReservesTrillion Cubic Feet of Wet Natural Gas and Billion Barrels of Crude Oil
Crude Oil
Crud
e O
il (B
illio
n B
arre
ls)
0
5
10
15
20
25
30
35
1980 20101985 1990 1995 2005
Domestic Production
Net Imports
Figure 7. Total U.S. Proven Reserves
Nat
ural
Gas
(Tr
illio
n Cu
bic
Feet
)
2000
Natural Gas
0
50
100
150
200
250
300
350
Source: EIA (2012). “u.S. Crude Oil, Natural Gas, & Natural Gas Liquids Proved Reserves.” Figure 1. (Crude oil includes lease condensate.)
Taking Action on Energy: A CEO Vision for America’s Energy Future
23
The advances in shale development technologies that
have fundamentally transformed views regarding the
natural gas resource base are also transforming the
outlook for oil. Important discoveries like the Eagle Ford
shale in Texas, the Niobrara shale in Colorado, the Utica
shale in the Appalachian basin, and the Bakken shale
in North Dakota and Montana are leading the way to
increased domestic onshore oil production. According
to EIA, oil production in the Bakken shale formation has
increased more than four and a half times since 2005
(from slightly less than 100,000 barrels per day in 2005
to more than 460,000 barrels per day in September
2011) and is estimated to reach as much as 750,000
barrels per day by 2015.75 In June 2012, EIA reported
that U.S. crude oil production in the first quarter of
2012 topped 6 million barrels per day for the first time
in 14 years.76 In its latest long-term energy forecast, EIA
projected that domestic crude oil production will increase
from 5.7 million barrels per day in 2011 to 7.5 million
barrels per day by 2020 — a level not seen since 1989.77
According to the latest International Energy Agency
World Energy Outlook, by 2017, the United States could
rival Saudi Arabia as the world’s top oil producer.78
In addition to realizing the potential of onshore oil and
natural gas resources, advances in technology have
extended our ability to drill and produce offshore oil
and gas resources in ever-increasing water depths.
U.S. jurisdictional waters hold an estimated 150 billion
barrels of recoverable oil and natural gas resources,79 the
equivalent of more than 30 years of Saudi Arabia’s oil
and natural gas production.80 Greater access to federal
offshore areas currently unavailable for leasing, including
the Eastern Gulf of Mexico, the Atlantic Coast, the
Pacific Coast and Alaska, could provide opportunities for
significant expansion of domestic energy development.
The continuation of deepwater drilling activity in the
Gulf of Mexico is vital to our nation’s economic recovery
and energy security as it accounts for more than 20
percent of U.S. domestic oil supply.81 Working closely
with the Department of the Interior, the offshore oil and
gas industry has developed new containment and oil
Figure 8
Dry Natural Gas Production Trillion Cubic Feet; Projections from AEOs 2005 and 2013 Early Release
10.0
15.0
20.0
25.0
30.0
35.0
2010 2015 2020 2025
Figure 8. Dry Natural Gas Production
20402030
AEO 2005
AEO 2013 early release
Sources: EIA (2005 and 2012). Annual Energy Outlooks 2005 and 2013 Early Release.
Figure 9
Natural Gas Production by Source Trillion Cubic Feet, 1990–2040
0.0
5.0
10.0
15.0
20.0
25.0
30.0
35.0
1990 20402000 2030
Figure 9. Natural Gas Production by Source
2010 2020
ProjectedActual
Shale gas
Tight gas
Lower 48 onshore conventional
Lower 48 offshore
Coalbed methane
Alaska
Sources: EIA (2012). Annual Energy Outlook 2012. Figure 107; and EIA (2012). Annual Energy Outlook 2013 Early Release. Table 14.
Business Roundtable
24
spill response equipment and procedures. With
the advances in technology and the lessons
learned from the 2010 Deepwater Horizon oil
spill in the Gulf of Mexico, both industry and
the Department of the Interior are confident
that our offshore resources can be developed
safely and help to ensure reliable, affordable
U.S. energy supplies.82
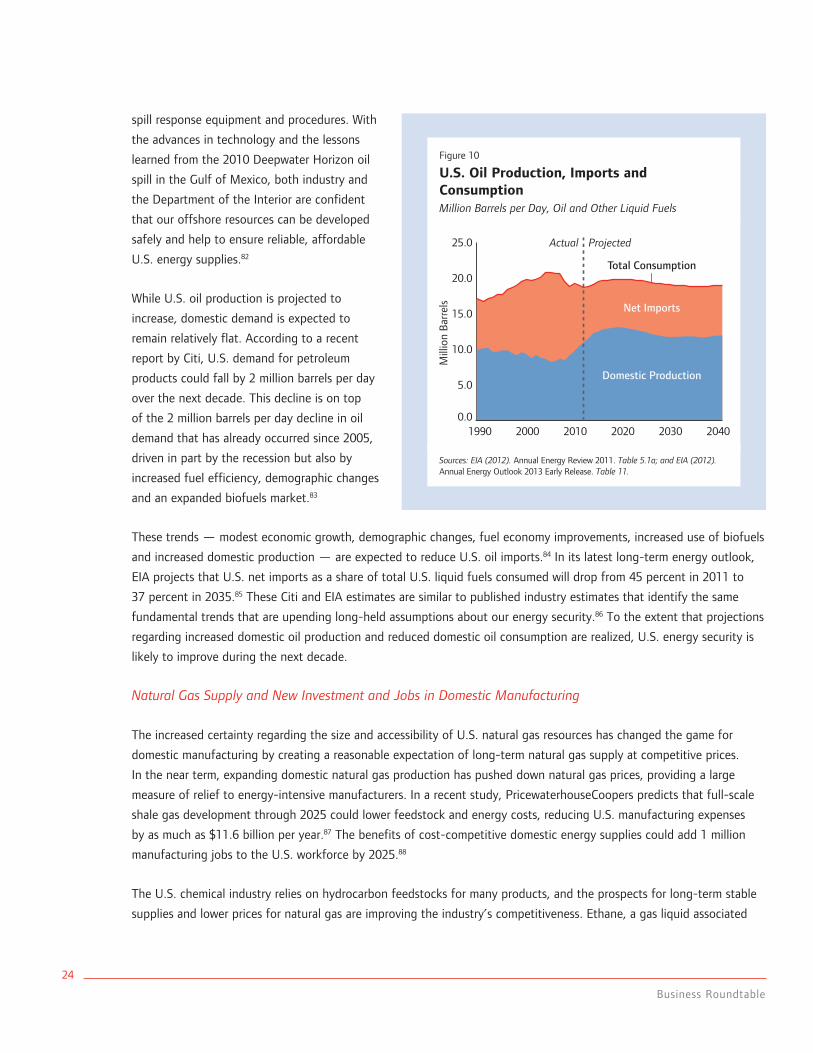
While U.S. oil production is projected to
increase, domestic demand is expected to
remain relatively flat. According to a recent
report by Citi, U.S. demand for petroleum
products could fall by 2 million barrels per day
over the next decade. This decline is on top
of the 2 million barrels per day decline in oil
demand that has already occurred since 2005,
driven in part by the recession but also by
increased fuel efficiency, demographic changes
and an expanded biofuels market.83
These trends — modest economic growth, demographic changes, fuel economy improvements, increased use of biofuels
and increased domestic production — are expected to reduce U.S. oil imports.84 In its latest long-term energy outlook,
EIA projects that U.S. net imports as a share of total U.S. liquid fuels consumed will drop from 45 percent in 2011 to
37 percent in 2035.85 These Citi and EIA estimates are similar to published industry estimates that identify the same
fundamental trends that are upending long-held assumptions about our energy security.86 To the extent that projections
regarding increased domestic oil production and reduced domestic oil consumption are realized, U.S. energy security is
likely to improve during the next decade.
Natural Gas Supply and New Investment and Jobs in Domestic Manufacturing
The increased certainty regarding the size and accessibility of U.S. natural gas resources has changed the game for
domestic manufacturing by creating a reasonable expectation of long-term natural gas supply at competitive prices.
In the near term, expanding domestic natural gas production has pushed down natural gas prices, providing a large
measure of relief to energy-intensive manufacturers. In a recent study, PricewaterhouseCoopers predicts that full-scale
shale gas development through 2025 could lower feedstock and energy costs, reducing U.S. manufacturing expenses
by as much as $11.6 billion per year.87 The benefits of cost-competitive domestic energy supplies could add 1 million
manufacturing jobs to the U.S. workforce by 2025.88
The U.S. chemical industry relies on hydrocarbon feedstocks for many products, and the prospects for long-term stable
supplies and lower prices for natural gas are improving the industry’s competitiveness. Ethane, a gas liquid associated
Figure 10
U.S. Oil Production, Imports and ConsumptionMillion Barrels per Day, Oil and Other Liquid Fuels
Total Consumption
Mill
ion
Bar
rels
0.0
5.0
10.0
15.0
20.0
25.0
1990 2040
ProjectedActual
Domestic Production
Net Imports
Figure 10. U.S. Oil Production, Imports, & Consumption
2000 2010 2020 2030
Sources: EIA (2012). Annual Energy Review 2011. Table 5.1a; and EIA (2012). Annual Energy Outlook 2013 Early Release. Table 11.
Taking Action on Energy: A CEO Vision for America’s Energy Future
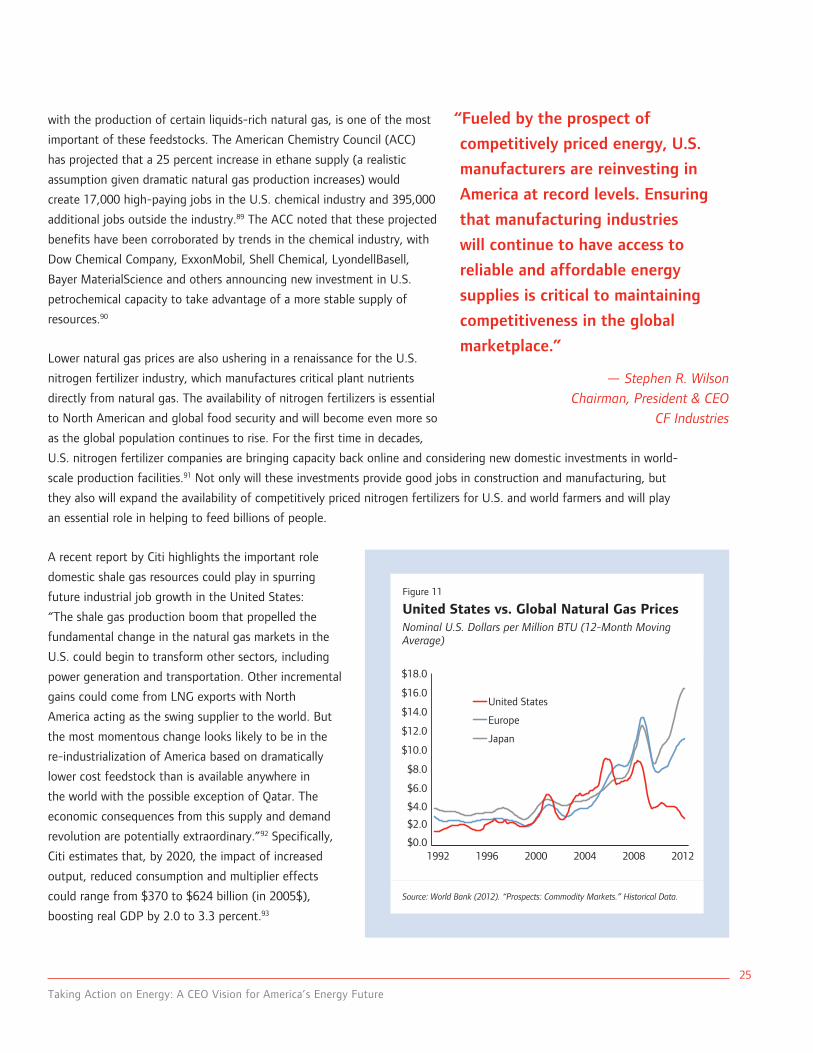
25
with the production of certain liquids-rich natural gas, is one of the most
important of these feedstocks. The American Chemistry Council (ACC)
has projected that a 25 percent increase in ethane supply (a realistic
assumption given dramatic natural gas production increases) would
create 17,000 high-paying jobs in the U.S. chemical industry and 395,000
additional jobs outside the industry.89 The ACC noted that these projected
benefits have been corroborated by trends in the chemical industry, with
Dow Chemical Company, ExxonMobil, Shell Chemical, LyondellBasell,
Bayer MaterialScience and others announcing new investment in U.S.
petrochemical capacity to take advantage of a more stable supply of
resources.90
Lower natural gas prices are also ushering in a renaissance for the U.S.
nitrogen fertilizer industry, which manufactures critical plant nutrients
directly from natural gas. The availability of nitrogen fertilizers is essential
to North American and global food security and will become even more so
as the global population continues to rise. For the first time in decades,
U.S. nitrogen fertilizer companies are bringing capacity back online and considering new domestic investments in world-
scale production facilities.91 Not only will these investments provide good jobs in construction and manufacturing, but
they also will expand the availability of competitively priced nitrogen fertilizers for U.S. and world farmers and will play
an essential role in helping to feed billions of people.
A recent report by Citi highlights the important role
domestic shale gas resources could play in spurring
future industrial job growth in the United States:
“The shale gas production boom that propelled the
fundamental change in the natural gas markets in the
U.S. could begin to transform other sectors, including
power generation and transportation. Other incremental
gains could come from LNG exports with North
America acting as the swing supplier to the world. But
the most momentous change looks likely to be in the
re-industrialization of America based on dramatically
lower cost feedstock than is available anywhere in
the world with the possible exception of Qatar. The
economic consequences from this supply and demand
revolution are potentially extraordinary.”92 Specifically,
Citi estimates that, by 2020, the impact of increased
output, reduced consumption and multiplier effects
could range from $370 to $624 billion (in 2005$),
boosting real GDP by 2.0 to 3.3 percent.93
“Fueled by the prospect of
competitively priced energy, U.S.
manufacturers are reinvesting in
America at record levels. Ensuring
that manufacturing industries
will continue to have access to
reliable and affordable energy
supplies is critical to maintaining
competitiveness in the global
marketplace.”
— Stephen R. Wilson Chairman, President & CEO
CF Industries
Figure 11
United States vs. Global Natural Gas Prices Nominal u.S. Dollars per Million BTu (12-Month Moving Average)
$0.0
$2.0
$4.0
$6.0
$8.0
$10.0
$12.0
$14.0
$16.0
$18.0
1992 20121996 2000 2004
Domestic Production
Figure 11. United States vs. Global Natural Gas Prices
2008
United States
Europe
Japan
Source: World Bank (2012). “Prospects: Commodity Markets.” Historical Data.
Business Roundtable
26
While increased domestic supplies of natural gas have the potential to improve the competitiveness of certain U.S.
manufacturers, the extent of this improvement will depend on the future development of global natural gas markets. For
some industries, the thermal-equivalent price differential between oil and natural gas (and their derivatives) represents
a significant U.S. competitive advantage. As discussed below, increased shale gas production has raised the prospect
that the United States could become a net natural gas exporter. Some stakeholders, particularly energy-intensive
manufacturers, are concerned that exports of large volumes of LNG will place upward pressure on domestic natural gas
prices and offset improvements in competitiveness.94
Lower natural gas prices occasioned by increased natural gas production are also having an unexpected effect on
electricity prices. The Federal Energy Regulatory Commission’s latest State of the Markets report found that despite
an exceptionally warmer-than-normal summer, power prices were down in most areas of the United States in 2011,
primarily due to lower natural gas prices.95 While it is unclear whether these trends will continue, lower electricity costs
will benefit homeowners as well as commercial and industrial users.
Potential for Increased Natural Gas and Petroleum Product Exports
Increasing natural gas and oil production has raised the prospect that the United States could become a net exporter of
LNG and petroleum products. The Natural Gas Act requires a license to export LNG, which DOE is obligated to issue unless,
after a public notice and opportunity to comment, it finds that the export is not in the public interest. With respect to
petroleum products, the United States has one of the most modern, efficient and competitive refining industries in the
world. Indeed, the United States recently became a net exporter of refined petroleum products for the first time in six
decades.96 In light of moderating domestic demand, increasing domestic supply and a highly competitive refining industry,
the United States is likely to have additional opportunities to expand petroleum product exports in the coming years.
Coal
For decades, coal has served as the workhorse fuel of the electric power industry. According to EIA, approximately 93
percent of U.S. coal consumption is in the electric power sector, with the balance primarily used to produce cement and
steel.97 The existing coal generating fleet enables commerce, manufacturing and an electricity supply that is affordable,
abundant and stable. Yet despite coal’s relatively low cost, historically low natural gas prices and more stringent
environmental regulations are, in some cases, creating cost advantages for natural gas as an electric generation fuel. As
a result of these current conditions, combined cycle natural gas is displacing some coal-fired generation.98 Between 2002
and 2011, coal’s share of total electricity generation declined from 51 percent to 44 percent, while natural gas combined
cycle generation increased from 10 percent to 20 percent.99 However, despite the short-term pressures created by
historically low natural gas prices, coal still maintains a fuel cost advantage for large baseload plants in certain locations
and also provides key fuel diversity and reliability benefits.
EPA regulatory policies have profoundly affected the use of coal in the electric power industry. During the past year,
EPA has either finalized or proposed a number of rules aimed at coal-fired power plants. For instance, EPA finalized the
Cross-State Air Pollution Rule (though it was recently vacated by the U.S. Court of Appeals for the D.C. Circuit) and
the Mercury and Air Toxics Standards (MATS, or utility MACT).100 EPA has also proposed GHG new source performance
standards (GHG NSPS) for electric generating units, coal combustion residuals regulation under the Resource
Taking Action on Energy: A CEO Vision for America’s Energy Future
27
Conservation and Recovery Act, and cooling water intake regulations under section 316(b) of the Clean Water Act
(which will affect all thermal plants). The net effect of these regulations will be to hasten the retirement of some older,
smaller, less controlled and less efficient coal-fired electricity generating units.101
Furthermore, the proposed GHG NSPS regulation, as currently written, would require new coal generation facilities to
use CCUS technology, which has not been economically demonstrated at scale. Significant legal and regulatory issues
must also be resolved before CCUS technology is commercially deployed at scale. (Note: Additional information on CCUS
technology is presented in “Chapter VII: Electric Power Generation, Transmission and Distribution.”)
Although the combination of EPA regulations and competitive natural gas prices has placed pressure on domestic coal
consumption, exports of both thermal and metallurgical coal have enjoyed robust growth. Between 2003 and 2008, world
coal consumption increased by 30 percent, primarily as a result of coal demand in China, which increased 71 percent over
the five-year period.102 EIA expects these trends to continue, noting that coal will continue to be an important fuel source,
especially in non-OECD Asia, where demand is likely to be supported by large domestic coal reserves and rapid economic
growth.103 EIA also forecasts that world net coal-fired generation will grow by 67 percent from 2008 to 2035.104 As a result,
U.S. coal exports are projected to increase by roughly 80 percent during the same period.105
A broad portfolio of traditional energy resources, including coal, will remain essential to U.S. economic success and
job creation.
Barriers to Investment in Traditional Energy Production
Access to Federal Lands
Much of the recent increase in oil and natural gas production is occurring on privately owned lands, not lands controlled
by the federal government. According to a recent study by the Congressional Research Service, approximately 96
percent of the increase in domestic oil production since 2007 took place on nonfederal lands.106 Over the same time
period, oil production on federal lands increased only slightly.107 Federal offshore production declined in 2010 and 2011
as a consequence of the moratorium placed on new offshore drilling in the Gulf of Mexico in the wake of the Deepwater
Horizon accident. While activity in the Gulf is returning to normal, it will take some time before production increases
to the levels anticipated before the moratorium. EIA estimates that actual Gulf output in 2012 will be 29 percent lower
than pre-moratorium projections.108
The development of traditional energy supplies is being hindered by limited access to promising onshore and offshore
resources, as well as permitting delays. The entire Atlantic and Pacific Coasts, nearly all of the Eastern Gulf of Mexico,
and the majority of offshore Alaska remain off-limits to leasing and exploration. In addition, federal permitting delays
have prevented the development of the few promising Alaskan offshore leases that were auctioned in 2008.109 Currently,
60 percent of federal onshore lands are either off-limits or subject to significant access restrictions.110 According to the
Bureau of Land Management (BLM), federal onshore lands hold an estimated 30.5 billion barrels of oil and 231.0 trillion
cubic feet of natural gas,111 which is equivalent to approximately 15 years of current U.S. crude oil production and 10
years of current U.S. natural gas production.112 In addition, 87 percent of federal offshore lands are currently unavailable
for oil and natural gas leasing and development.113
Business Roundtable
28
EPA Regulations
As noted previously, existing coal capacity will be adversely affected by EPA’s recently finalized and proposed
regulations. In addition, if EPA’s proposed GHG NSPS regulations are finalized in their current form, new coal units
will be required to have CCUS technology. Although EPA’s proposed GHG NSPS regulations apply only to new electric
generating units, EPA is required under the Clean Air Act to also regulate GHG emissions from existing power plants and
those undergoing substantial modification. Depending on the stringency of these anticipated regulations, there could
be additional impacts. At a minimum, additional investment and compliance costs will be incurred. Yet it is also possible
that these regulations could, by reducing the diversity of available energy resources, cause the costs of other traditional
energy resources to rise, resulting in negative impacts on manufacturing, transportation, agriculture and other energy-
intensive economic sectors.
Additional EPA regulations are anticipated regarding other aspects of the energy sector, including the refining,
exploration and production processes. New air quality standards for fine particles, tighter ozone standards, a new
refinery GHG NSPS and rules pertaining to cooling water intake structures are anticipated in the next two years.
Depending on their stringency, these regulations could increase compliance costs and make some existing capacity
uneconomic.
Recently Finalized and Proposed EPA Regulations Affecting the Energy Industry
◗◗ Utility MACT/National Emissions Standards for Hazardous Air Pollutants (NESHAP) for mercury and air toxics
◗◗ Cement MACT/NESHAP for cement kilns
◗◗ Mandatory reporting of GHGs
◗◗ National Ambient Air Quality Standards (NAAQS) for SO2
◗◗ Industrial boiler MACT/NESHAP for major source and area source
◗◗ Commercial/Industrial Solid Waste Incinerators Rule
◗◗ Cooling Water Intake Structures Rule
◗◗ Coal Combustion Product Regulation (i.e., Coal Ash Rule)
◗◗ New source performance standards for GHGs (utilities)
◗◗ New source performance standards for GHGs (refineries)
◗◗ National Ambient Air Quality Standard for fine particles (PM 2.5 NAAQS)
◗◗ Updates to Regional Haze Rule
Taking Action on Energy: A CEO Vision for America’s Energy Future
29
New Federal Regulation of Hydraulic Fracturing
Oil and gas operations are subject to a combination of state and federal regulations, which are complemented
by industry-recommended practices and standards. State agencies have the primary role in many regulation and
enforcement activities, leveraging their experience and local knowledge necessary for effective implementation. The
federal government also plays an important role in the regulatory framework for oil and gas through EPA regulation of
air, water and waste and the Department of the Interior’s BLM regulation and permitting of oil and gas development
occurring on federal onshore lands.
In recent years, many states have updated and strengthened their regulation of hydraulic fracturing, including well
integrity testing, fracturing fluid ingredient disclosure and fracturing liquids disposal. In addition, both EPA and BLM
are considering new regulation of hydraulic fracturing. EPA recently finalized a suite of new regulations for the oil and
natural gas industry, including the first federal air standard for wells that are hydraulically fractured. These regulations
include a new source performance standard for volatile organic compounds, a new source performance standard for
sulfur dioxide, an air toxics standard for oil and natural gas production, and an air toxics standard for natural gas
transmission and storage.114
Further, EPA has announced that it intends to propose a rulemaking on disposal of fracturing water and fluids from
shale gas extraction operations in 2014.115 EPA also announced a rulemaking on fracturing fluid chemical reporting
under the Toxic Substances Control Act and is in the midst of a long-term study on the impact of hydraulic fracturing
on ground water and drinking water. A recently released progress report has outlined the framework of the study, but
results are not expected to be released until 2014.116
BLM has proposed regulations for hydraulic fracturing on the federal lands it administers. These regulations require
fracturing fluid ingredient disclosure and new well integrity measures.117 Because of the sheer number of federal
regulatory initiatives potentially affecting hydraulic fracturing, in early 2012 the Business Roundtable discussed with the
President the notion of having a single point of contact within the White House to help ensure that Executive Branch
regulatory activities regarding hydraulic fracturing are well coordinated, not overly burdensome and not duplicative. On
April 13, 2012, the President issued an Executive Order establishing an interagency working group of relevant agencies
that should help ensure better coordination of such regulatory activities.118
While this working group is a step in the right direction, it will be important to ensure that any future federal regulations
applicable to hydraulic fracturing are consistent with industry best practices and not duplicative or inconsistent with
state regulations.
Difficulty in Permitting Infrastructure
The federal government’s permitting process is fraught with complexity, redundancy and uncertainty, creating a
business environment that discourages large-scale capital investments and impairs job creation.119 Large-scale energy
projects, often requiring dozens of federal permits, are particularly susceptible to redundant, conflicting and unnecessary
Business Roundtable
30
permitting delays. In addition, litigation over these permits adds another layer of delay and uncertainty that may
threaten the viability of a project. As discussed in previous Business Roundtable documents, any comprehensive, long-
term energy policy should address the regulatory, permitting and judicial review barriers that stand in the way of sensibly
developing the nation’s energy resources.120 Such reforms can significantly accelerate beneficial energy development
while maintaining the nation’s commitments to public health and environmental quality.
Policy Recommendations To Enhance Traditional Energy Production
Access to Promising Resources
◗◗ Congress and the Executive Branch should increase access to onshore and offshore federal lands — focusing on
the most promising areas, including oil and natural gas resources located in the Eastern Gulf of Mexico, the Atlantic
Coast, the Pacific Coast and Alaska — to ensure reliable supplies of coal, oil and natural gas in the coming decades.
Permitting and Approval
◗◗ Congress and the Executive Branch should streamline permitting processes, including judicial review, to substantially
lower the anticipated and unanticipated costs of investing in, producing, processing and transporting energy
resources, while continuing to ensure public health, environmental quality and safety.
◗◗ The Executive Branch should ensure the expeditious approval of infrastructure projects, such as the Keystone XL
pipeline and other privately funded infrastructure projects, pursuant to a predictable regulatory framework, to
support increased domestic production and provide access to world energy markets.
Regulation of Onshore Oil and Natural Gas Exploration and Development
◗◗ Onshore oil and gas exploration and development is currently subject to a combination of federal and state
regulations. Any proposal to promulgate new or expanded federal regulations should be weighed against the fact
that the states traditionally have had the pre-eminent role in regulating oil and natural gas activity on nonfederal
lands. The states have responded to the recent increased oil and natural gas development by updating their rules
and the effectiveness of their regulatory programs. This regulatory approach has worked well and should continue
to be the model applied for ongoing and future activity.
◗◗ BLM regulates oil and gas activities on federal lands but historically has worked closely with the relevant state
authorities. New federal regulation of oil and natural gas activities on federal lands located within a state should be
developed in consultation with states and be consistent with state regulations.
◗◗ Where regulatory authority overlaps, the Executive Branch should avoid promulgating conflicting or duplicative
regulations and should work with the states and industry to ensure that the development of oil and natural gas
occurs responsibly.
Taking Action on Energy: A CEO Vision for America’s Energy Future
31
Regulation of Coal Development and Exports
◗◗ Federal regulation of coal production on federal lands located within a state should be deferential to and consistent
with state regulations.
◗◗ Where regulatory authority overlaps, the Executive Branch should avoid promulgating conflicting or duplicative
regulations and should work with the states and industry to ensure that coal production occurs responsibly, and
states should continue to have the pre-eminent role in regulating coal production.
◗◗ The federal government and states should streamline the process for developing new and expanded port facilities
to expand opportunities for coal and other materials exports. Permitting should include deadlines for completing
study, and regulations should be promulgated that clearly define the parameters of any studies required for
permitting and other approvals.
EPA Regulations
◗◗ EPA regulations should be based on sound science; undergo thorough net cost-benefit analysis; and take into
consideration the net cumulative impact these regulations have on energy costs, economic growth and job creation,
while being protective of human health and the environment. Adequate, affordable and reliable domestic energy
supplies depend on rational EPA regulations and guidance.
Carbon Capture, utilization and Storage (CCuS) Technology
◗◗ Congress and the Executive Branch should direct DOE and other appropriate agencies to pursue a comprehensive
program that invests in research and development to focus on technologies and practices that lower the cost of
CCUS technologies. This should include legal and regulatory reform and research and development investments
in CCUS.
◗◗ Congress should fund projects to demonstrate the viability of CCUS technologies at commercial scale. Funding
should be provided for a finite timeframe and limited to the minimum number of plants needed to determine
whether the technology has a credible pathway to unsubsidized competitiveness.
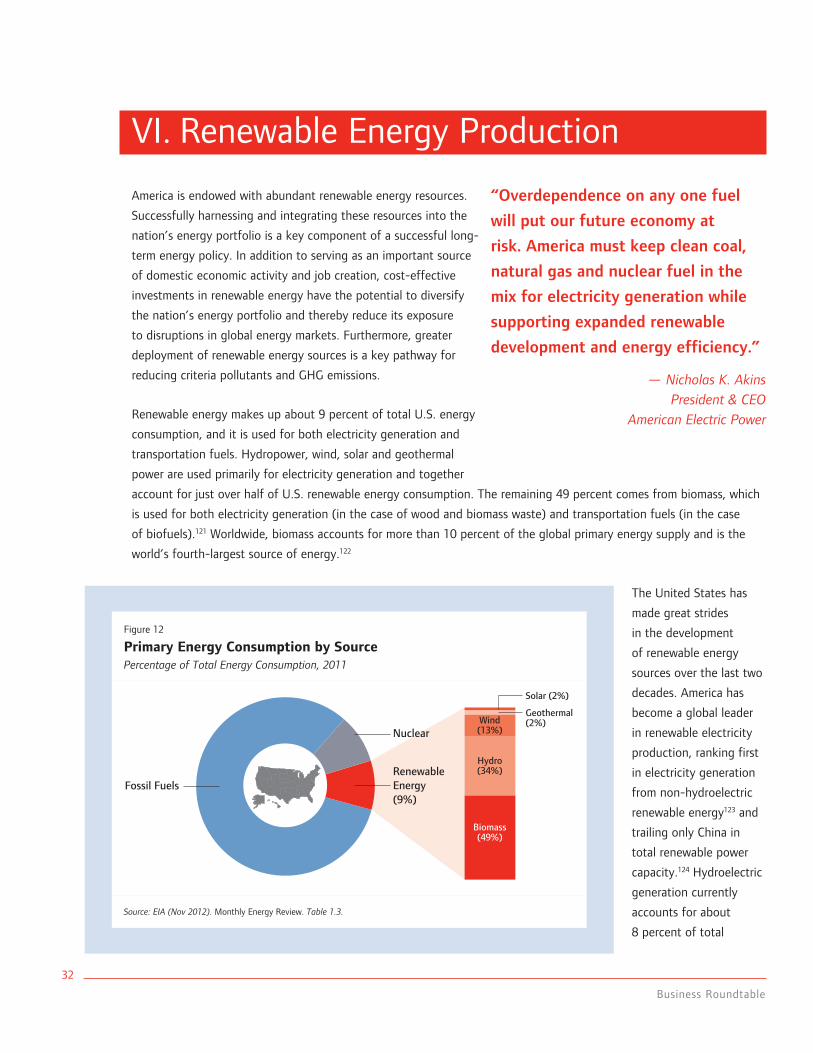
Business Roundtable
32
VI. Renewable Energy Production
America is endowed with abundant renewable energy resources.
Successfully harnessing and integrating these resources into the
nation’s energy portfolio is a key component of a successful long-
term energy policy. In addition to serving as an important source
of domestic economic activity and job creation, cost-effective
investments in renewable energy have the potential to diversify
the nation’s energy portfolio and thereby reduce its exposure
to disruptions in global energy markets. Furthermore, greater
deployment of renewable energy sources is a key pathway for
reducing criteria pollutants and GHG emissions.
Renewable energy makes up about 9 percent of total U.S. energy
consumption, and it is used for both electricity generation and
transportation fuels. Hydropower, wind, solar and geothermal
power are used primarily for electricity generation and together
account for just over half of U.S. renewable energy consumption. The remaining 49 percent comes from biomass, which
is used for both electricity generation (in the case of wood and biomass waste) and transportation fuels (in the case
of biofuels).121 Worldwide, biomass accounts for more than 10 percent of the global primary energy supply and is the
world’s fourth-largest source of energy.122
The United States has
made great strides
in the development
of renewable energy
sources over the last two
decades. America has
become a global leader
in renewable electricity
production, ranking first
in electricity generation
from non-hydroelectric
renewable energy123 and
trailing only China in
total renewable power
capacity.124 Hydroelectric
generation currently
accounts for about
8 percent of total
“Overdependence on any one fuel
will put our future economy at
risk. America must keep clean coal,
natural gas and nuclear fuel in the
mix for electricity generation while
supporting expanded renewable
development and energy efficiency.”
— Nicholas K. Akins President & CEO
American Electric Power
Figure 12
Primary Energy Consumption by SourcePercentage of Total Energy Consumption, 2011Figure 12. Primary Energy Consumption by Source
Nuclear
RenewableEnergy(9%)
Fossil Fuels
Solar (2%)
Geothermal(2%)Wind
(13%)
Hydro(34%)
Biomass(49%)
Source: EIA (Nov 2012). Monthly Energy Review. Table 1.3.
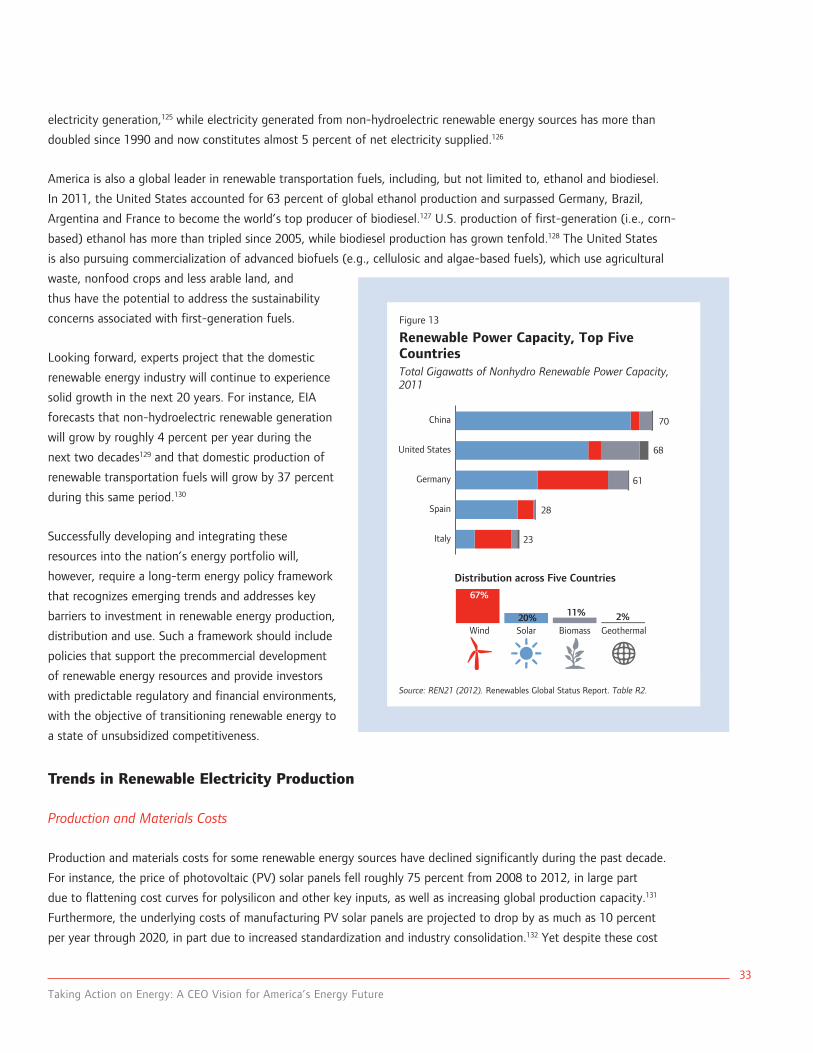
Taking Action on Energy: A CEO Vision for America’s Energy Future
33
electricity generation,125 while electricity generated from non-hydroelectric renewable energy sources has more than
doubled since 1990 and now constitutes almost 5 percent of net electricity supplied.126
America is also a global leader in renewable transportation fuels, including, but not limited to, ethanol and biodiesel.
In 2011, the United States accounted for 63 percent of global ethanol production and surpassed Germany, Brazil,
Argentina and France to become the world’s top producer of biodiesel.127 U.S. production of first-generation (i.e., corn-
based) ethanol has more than tripled since 2005, while biodiesel production has grown tenfold.128 The United States
is also pursuing commercialization of advanced biofuels (e.g., cellulosic and algae-based fuels), which use agricultural
waste, nonfood crops and less arable land, and
thus have the potential to address the sustainability
concerns associated with first-generation fuels.
Looking forward, experts project that the domestic
renewable energy industry will continue to experience
solid growth in the next 20 years. For instance, EIA
forecasts that non-hydroelectric renewable generation
will grow by roughly 4 percent per year during the
next two decades129 and that domestic production of
renewable transportation fuels will grow by 37 percent
during this same period.130
Successfully developing and integrating these
resources into the nation’s energy portfolio will,
however, require a long-term energy policy framework
that recognizes emerging trends and addresses key
barriers to investment in renewable energy production,
distribution and use. Such a framework should include
policies that support the precommercial development
of renewable energy resources and provide investors
with predictable regulatory and financial environments,
with the objective of transitioning renewable energy to
a state of unsubsidized competitiveness.
Trends in Renewable Electricity Production
Production and Materials Costs
Production and materials costs for some renewable energy sources have declined significantly during the past decade.
For instance, the price of photovoltaic (PV) solar panels fell roughly 75 percent from 2008 to 2012, in large part
due to flattening cost curves for polysilicon and other key inputs, as well as increasing global production capacity.131
Furthermore, the underlying costs of manufacturing PV solar panels are projected to drop by as much as 10 percent
per year through 2020, in part due to increased standardization and industry consolidation.132 Yet despite these cost
Figure 13
Renewable Power Capacity, Top Five Countries Total Gigawatts of Nonhydro Renewable Power Capacity, 2011 Figure 13. Renewable Power Capacity, Top 5 Countries
China 70
68
61
28
23
United States
Germany
Spain
Italy
67%
20% 11% 2%Wind
Distribution across Five Countries
Solar Biomass Geothermal
Source: REN21 (2012). Renewables Global Status Report. Table R2.
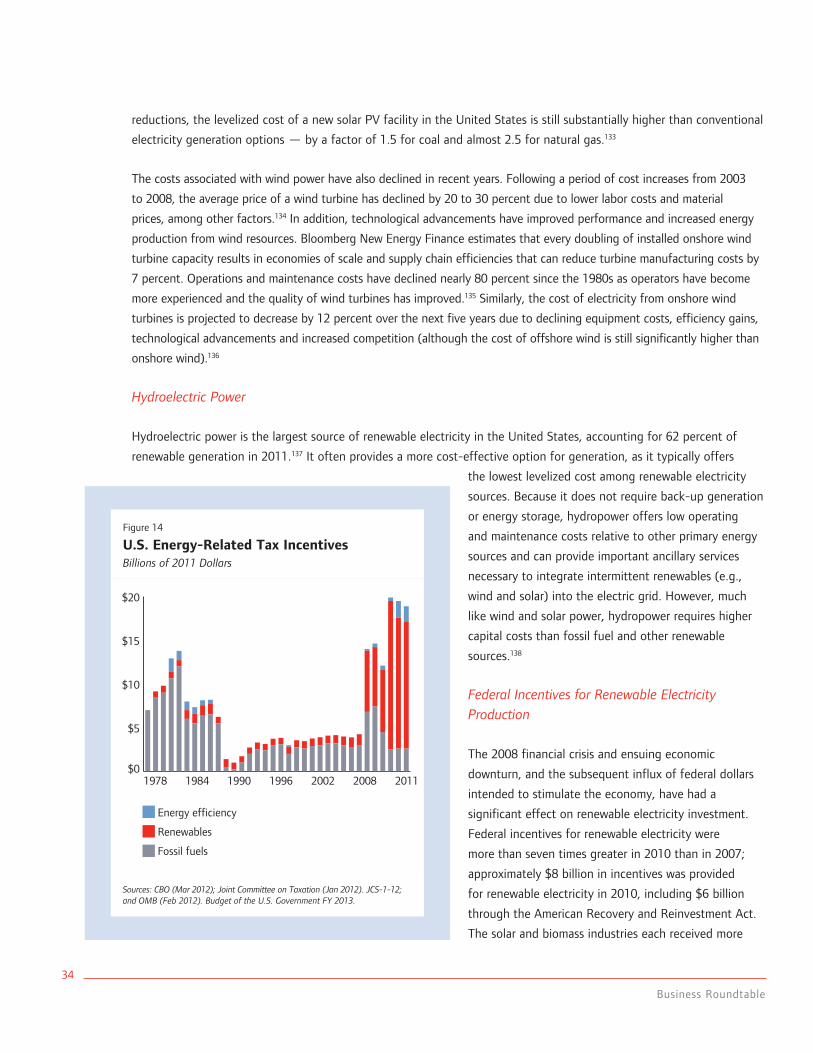
Business Roundtable
34
reductions, the levelized cost of a new solar PV facility in the United States is still substantially higher than conventional
electricity generation options — by a factor of 1.5 for coal and almost 2.5 for natural gas.133
The costs associated with wind power have also declined in recent years. Following a period of cost increases from 2003
to 2008, the average price of a wind turbine has declined by 20 to 30 percent due to lower labor costs and material
prices, among other factors.134 In addition, technological advancements have improved performance and increased energy
production from wind resources. Bloomberg New Energy Finance estimates that every doubling of installed onshore wind
turbine capacity results in economies of scale and supply chain efficiencies that can reduce turbine manufacturing costs by
7 percent. Operations and maintenance costs have declined nearly 80 percent since the 1980s as operators have become
more experienced and the quality of wind turbines has improved.135 Similarly, the cost of electricity from onshore wind
turbines is projected to decrease by 12 percent over the next five years due to declining equipment costs, efficiency gains,
technological advancements and increased competition (although the cost of offshore wind is still significantly higher than
onshore wind).136
Hydroelectric Power
Hydroelectric power is the largest source of renewable electricity in the United States, accounting for 62 percent of
renewable generation in 2011.137 It often provides a more cost-effective option for generation, as it typically offers
the lowest levelized cost among renewable electricity
sources. Because it does not require back-up generation
or energy storage, hydropower offers low operating
and maintenance costs relative to other primary energy
sources and can provide important ancillary services
necessary to integrate intermittent renewables (e.g.,
wind and solar) into the electric grid. However, much
like wind and solar power, hydropower requires higher
capital costs than fossil fuel and other renewable
sources.138
Federal Incentives for Renewable Electricity Production
The 2008 financial crisis and ensuing economic
downturn, and the subsequent influx of federal dollars
intended to stimulate the economy, have had a
significant effect on renewable electricity investment.
Federal incentives for renewable electricity were
more than seven times greater in 2010 than in 2007;
approximately $8 billion in incentives was provided
for renewable electricity in 2010, including $6 billion
through the American Recovery and Reinvestment Act.
The solar and biomass industries each received more
Figure 14
U.S. Energy-Related Tax Incentives Billions of 2011 Dollars
$0
$5
$10
$15
$20
1978 1996 20111984
Energy efficiency
Renewables
Fossil fuels
Figure 14. U.S. Energy-Related Tax Incentives
2002 20081990
Sources: CBO (Mar 2012); Joint Committee on Taxation (Jan 2012). JCS-1-12; and OMB (Feb 2012). Budget of the u.S. Government FY 2013.
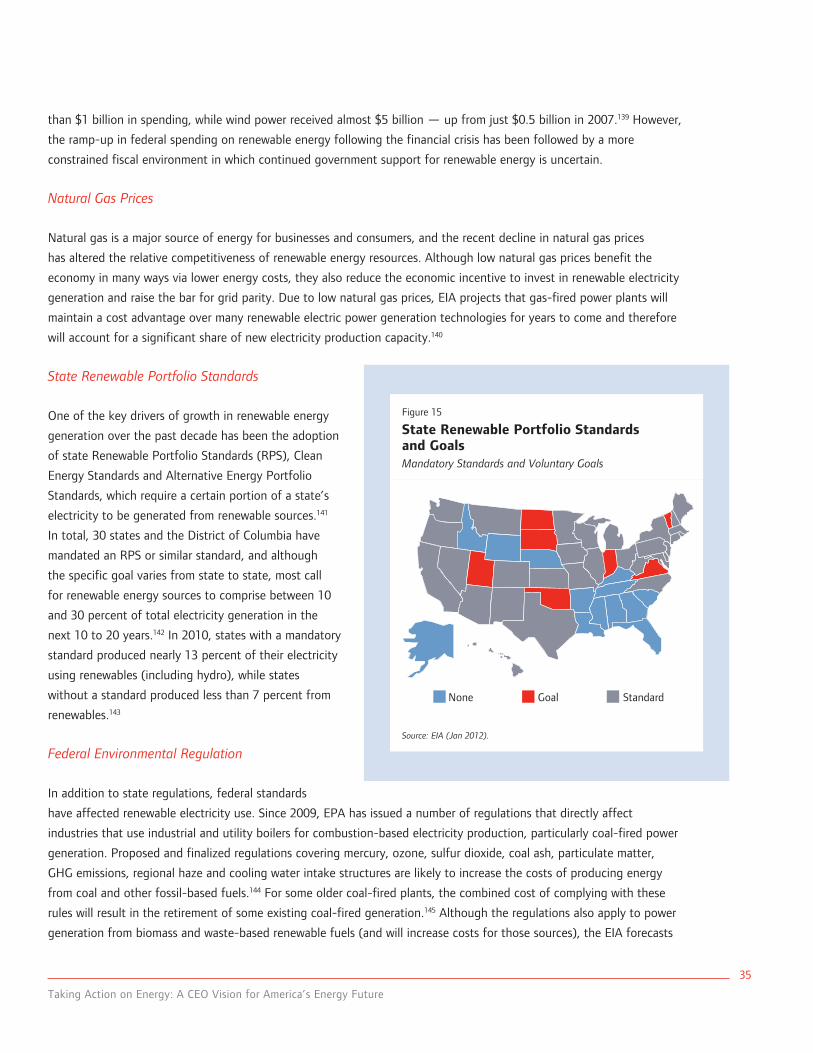
Taking Action on Energy: A CEO Vision for America’s Energy Future
35
than $1 billion in spending, while wind power received almost $5 billion — up from just $0.5 billion in 2007.139 However,
the ramp-up in federal spending on renewable energy following the financial crisis has been followed by a more
constrained fiscal environment in which continued government support for renewable energy is uncertain.
Natural Gas Prices
Natural gas is a major source of energy for businesses and consumers, and the recent decline in natural gas prices
has altered the relative competitiveness of renewable energy resources. Although low natural gas prices benefit the
economy in many ways via lower energy costs, they also reduce the economic incentive to invest in renewable electricity
generation and raise the bar for grid parity. Due to low natural gas prices, EIA projects that gas-fired power plants will
maintain a cost advantage over many renewable electric power generation technologies for years to come and therefore
will account for a significant share of new electricity production capacity.140
State Renewable Portfolio Standards
One of the key drivers of growth in renewable energy
generation over the past decade has been the adoption
of state Renewable Portfolio Standards (RPS), Clean
Energy Standards and Alternative Energy Portfolio
Standards, which require a certain portion of a state’s
electricity to be generated from renewable sources.141
In total, 30 states and the District of Columbia have
mandated an RPS or similar standard, and although
the specific goal varies from state to state, most call
for renewable energy sources to comprise between 10
and 30 percent of total electricity generation in the
next 10 to 20 years.142 In 2010, states with a mandatory
standard produced nearly 13 percent of their electricity
using renewables (including hydro), while states
without a standard produced less than 7 percent from
renewables.143
Federal Environmental Regulation
In addition to state regulations, federal standards
have affected renewable electricity use. Since 2009, EPA has issued a number of regulations that directly affect
industries that use industrial and utility boilers for combustion-based electricity production, particularly coal-fired power
generation. Proposed and finalized regulations covering mercury, ozone, sulfur dioxide, coal ash, particulate matter,
GHG emissions, regional haze and cooling water intake structures are likely to increase the costs of producing energy
from coal and other fossil-based fuels.144 For some older coal-fired plants, the combined cost of complying with these
rules will result in the retirement of some existing coal-fired generation.145 Although the regulations also apply to power
generation from biomass and waste-based renewable fuels (and will increase costs for those sources), the EIA forecasts
Figure 15
State Renewable Portfolio Standards and Goals Mandatory Standards and Voluntary Goals
None Goal Standard
Figure 15. State Renewable Portfolio Standards & Goals
Source: EIA (Jan 2012).
Business Roundtable
36
that other renewable energy sources, along with combined cycle natural gas, will play increased roles in replacing this
retired capacity.146 Other industries (e.g., forest products, chemicals, primary metals and glass) will be similarly affected
by EPA regulations, as many currently generate their own power using boilers or process heat production and are
sensitive to retail electricity prices.
DOD’s Green Initiative
As the nation’s largest energy consumer, DOD has enormous purchasing power. Facing large fuel cost increases,147 DOD
has undertaken several initiatives to reduce its dependency on fossil fuels by shifting to renewable sources for a portion
of its stationary energy demands and to second-generation renewable fuels for automotive, aviation and ship use. For
example, DOD established a strategic goal of diversifying and developing new energy sources suitable for field use,
including the testing, development and use of alternative energy sources, such as solar power, that can be generated
near troop deployments.148 In 2012, President Obama announced a DOD commitment to deploy 3 gigawatts of solar,
wind, biomass and geothermal energy in Army, Navy and Air Force installations by 2025.149 These efforts encourage
renewable power development, and their ultimate success depends on the ability of new technologies to meet
scalability, performance and economic expectations.
Barriers to Investment in Renewable Electricity Production
Policy uncertainty
Significant policy uncertainty exists regarding the future of the renewable electricity production and investment tax
credits. One federal incentive, the renewable electricity production tax credit (PTC) for wind energy, was enacted in
1992 and is scheduled to expire at the end of 2013.150 According to EIA, the PTC has contributed significantly to the
expansion of the wind industry over the past 10 years, and historical data show that new wind installations decrease
during periods when the PTC has been allowed to lapse.151
Similar credits and incentive programs for biomass, geothermal, landfill gas, municipal solid waste and qualified
hydroelectric generation are also scheduled to expire at the end of 2013. Another federal incentive that faces an
uncertain future is the energy investment tax credit, which provides a 30 percent tax credit for solar, fuel cells and small
wind projects and is set to expire in 2016. The uncertainty surrounding incentives for renewables discourages investment
and complicates long-term planning, as many generation developers may choose to postpone decisions about expanding
their renewable capacity until policymakers provide more clarity about the government’s future level of support.
Cost Competitiveness
As is common with relatively new technologies, cost competitiveness remains a key barrier for many renewable electricity
generation options. Some of these higher costs are related to intermittency and transmission barriers faced by wind
and solar energy in some regions. For example, just as with traditional generation sources, wind and solar power
investments can require additional investments in transmission infrastructure. Furthermore, wind and solar require back-
up generating capacity or energy storage.152 The competitiveness gap sometimes created by the additional back-up and
energy storage costs has been exacerbated by increasing natural gas supplies, which have placed downward pressure on
natural gas prices and improved the relative competitiveness of gas-fired generation.
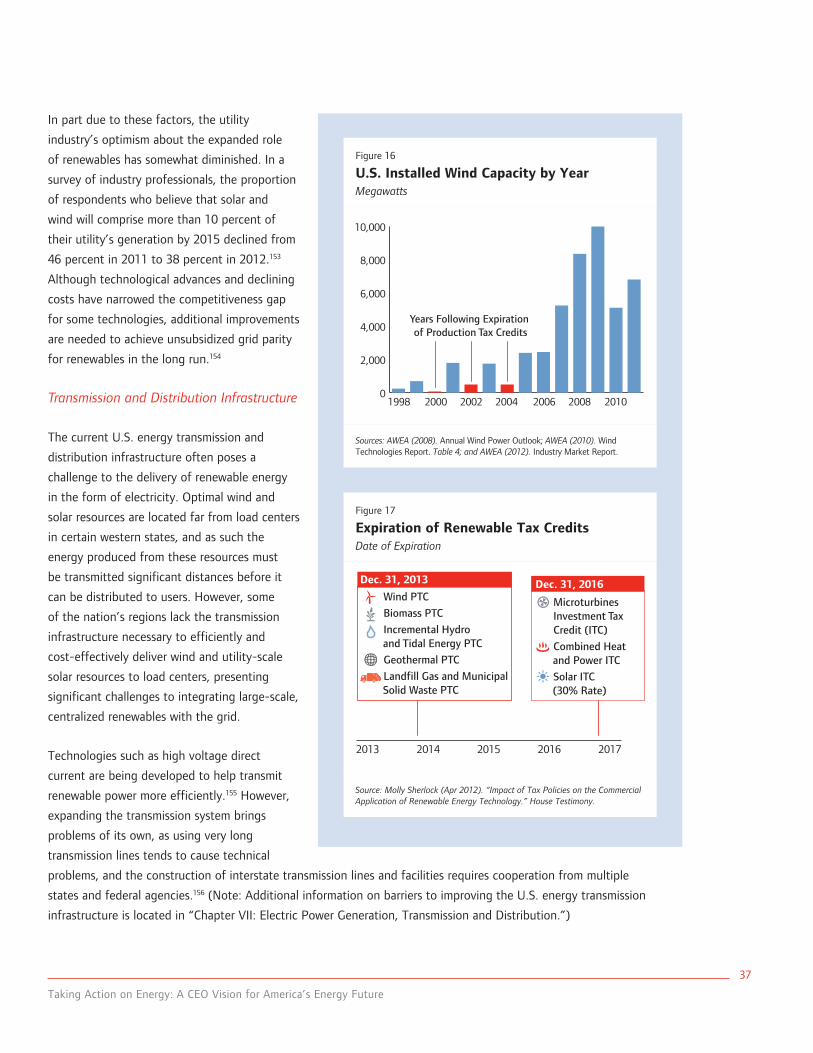
Taking Action on Energy: A CEO Vision for America’s Energy Future
37
In part due to these factors, the utility
industry’s optimism about the expanded role
of renewables has somewhat diminished. In a
survey of industry professionals, the proportion
of respondents who believe that solar and
wind will comprise more than 10 percent of
their utility’s generation by 2015 declined from
46 percent in 2011 to 38 percent in 2012.153
Although technological advances and declining
costs have narrowed the competitiveness gap
for some technologies, additional improvements
are needed to achieve unsubsidized grid parity
for renewables in the long run.154
Transmission and Distribution Infrastructure
The current U.S. energy transmission and
distribution infrastructure often poses a
challenge to the delivery of renewable energy
in the form of electricity. Optimal wind and
solar resources are located far from load centers
in certain western states, and as such the
energy produced from these resources must
be transmitted significant distances before it
can be distributed to users. However, some
of the nation’s regions lack the transmission
infrastructure necessary to efficiently and
cost-effectively deliver wind and utility-scale
solar resources to load centers, presenting
significant challenges to integrating large-scale,
centralized renewables with the grid.
Technologies such as high voltage direct
current are being developed to help transmit
renewable power more efficiently.155 However,
expanding the transmission system brings
problems of its own, as using very long
transmission lines tends to cause technical
problems, and the construction of interstate transmission lines and facilities requires cooperation from multiple
states and federal agencies.156 (Note: Additional information on barriers to improving the U.S. energy transmission
infrastructure is located in “Chapter VII: Electric Power Generation, Transmission and Distribution.”)
Figure 16
U.S. Installed Wind Capacity by Year Megawatts
0
2,000
4,000
6,000
8,000
10,000
1998 2000 2002 2004
Figure 16. U.S. Installed Wind Capacity by Year
20102006 2008
Years Following Expiration of Production Tax Credits
Sources: AWEA (2008). Annual Wind Power Outlook; AWEA (2010). Wind Technologies Report. Table 4; and AWEA (2012). Industry Market Report.
Figure 17
Expiration of Renewable Tax Credits Date of Expiration
2013 2014 2015 2016 2017
Wind PTC
Biomass PTC
Incremental Hydro and Tidal Energy PTC
Geothermal PTC
Landfill Gas and Municipal Solid Waste PTC
Figure 17. Expiration of Renewable Tax Credits
Microturbines Investment TaxCredit (ITC)
Combined Heat and Power ITC
Solar ITC (30% Rate)
Dec. 31, 2013 Dec. 31, 2016
Source: Molly Sherlock (Apr 2012). “Impact of Tax Policies on the Commercial Application of Renewable Energy Technology.” House Testimony.
Business Roundtable
38
Intermittency
Further compounding the electricity transmission capacity issue in some regions of the United States is the fact that
wind and solar technologies are intermittent generators of electricity, which can complicate resource planning and
contribute to grid instability. For instance, wind energy typically peaks at night, when electricity demand is lowest,
though it may be available at various times throughout the day. In contrast, solar energy typically peaks in the middle
of the day, when electricity demand is relatively high, but it is unavailable at night and varies depending on weather
conditions. In addition, as system demands change and new technologies, such as electric vehicles, are deployed,
utilities may experience multiple peaks throughout a day.
There are several ways to address the intermittency factor involved in wind and solar generation — including back-up
generation capacity, automated demand response (ADR) technology and energy storage technologies. Back-up capacity
involves bringing an alternate energy source (e.g., natural gas, coal or hydro power) online during periods of high
demand. To plan for peak capacity, wind power typically needs to be backed up at a level of 90 percent of its installed
capacity, which substantially adds to its total costs.157 In addition, ADR can help mitigate intermittency challenges, as
noted in a June 2012 DOE study.158 Pilot programs are now under way to test the capabilities of ADR in integrating
intermittent renewable energy sources into the electrical grid.159 Lastly, energy storage technologies can help alleviate
the intermittency barrier by reserving the energy produced in low demand periods and delivering it during high demand
periods. These technologies include capacitors, batteries and superconducting magnetic devices for short discharge
durations and hydro-pumped storage and compressed air energy storage for long discharge durations. These storage
facilities may require long lead time for development, permitting and construction, which necessitates early action to
ensure sufficient flexible storage resources.160 Whether it be through more flexible backup resources, ADR or energy
storage technologies, overcoming the intermittency barrier will be critical to efficiently integrating substantial additions
of wind and solar resources into the grid.
Land use Policies
Renewable electricity generation offers favorable environmental attributes and a lower overall environmental footprint,
including fewer criteria pollutants and GHG emissions, than traditional energy sources. However, as the wind and solar
industries have grown, some stakeholders have expressed land use concerns regarding large-scale solar arrays and
wind farms.161 For example, some solar projects have been delayed and costs have risen due to the need to study the
potential impacts on wildlife habitats.162 Onshore wind farms sometimes require large swaths of land and have been
reported to cause damage to bird populations in some areas,163 while offshore wind farms can generate resistance from
local stakeholder groups due to environmental and aesthetic concerns.164
In addition, hydroelectricity faces land use and environmental restrictions that make it unlikely that new large capacity
hydroelectric generating facilities will be built in the United States.165 However, a study by Navigant Consulting has
identified significant growth potential in hydropower through a variety of means that do not require the creation of new
dams. For instance, efficiency measures, capacity upgrades at existing facilities, and efforts to increase pumped storage and
generation at existing non-power dams could substantially boost installed capacity by 2025.166 With the right policies in
place, hydroelectric generation can continue to approach DOE’s goal of water providing 15 percent of U.S. electricity needs
by 2030.167 Such policies include a streamlined licensing/relicensing process for low-impact projects and better coordination
among federal agencies involved in the permitting and licensing/relicensing of hydroelectric facilities.
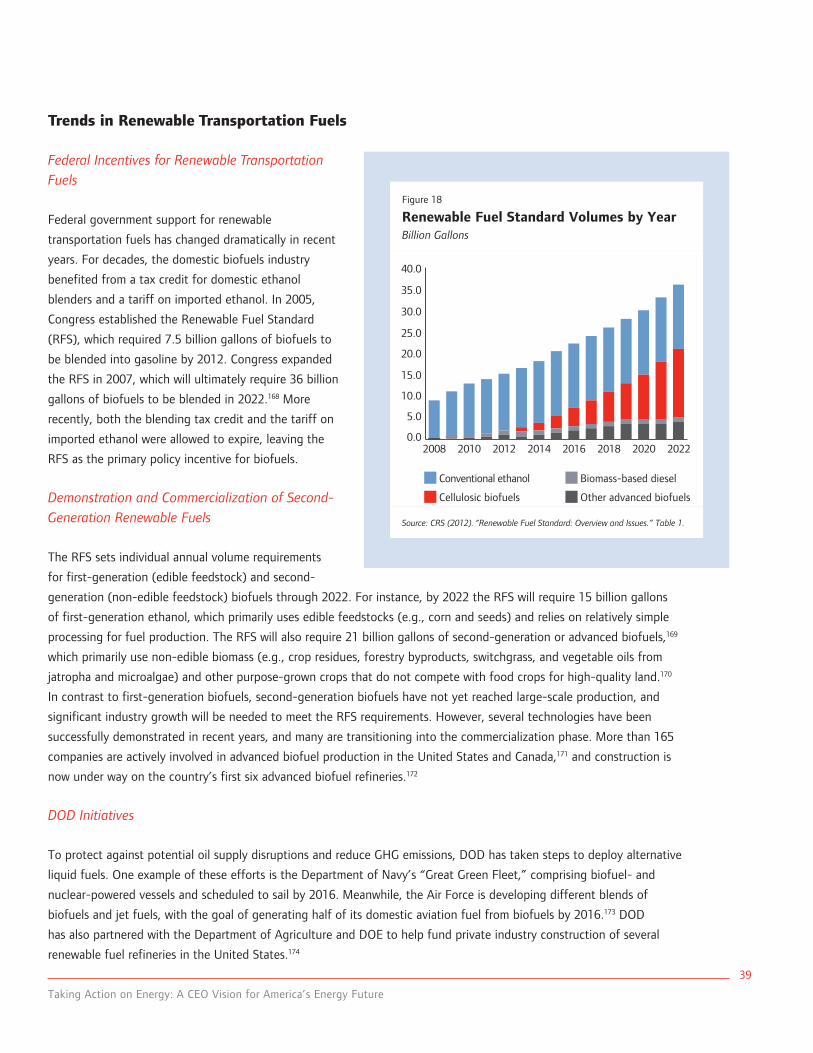
Taking Action on Energy: A CEO Vision for America’s Energy Future
39
Trends in Renewable Transportation Fuels
Federal Incentives for Renewable Transportation Fuels
Federal government support for renewable
transportation fuels has changed dramatically in recent
years. For decades, the domestic biofuels industry
benefited from a tax credit for domestic ethanol
blenders and a tariff on imported ethanol. In 2005,
Congress established the Renewable Fuel Standard
(RFS), which required 7.5 billion gallons of biofuels to
be blended into gasoline by 2012. Congress expanded
the RFS in 2007, which will ultimately require 36 billion
gallons of biofuels to be blended in 2022.168 More
recently, both the blending tax credit and the tariff on
imported ethanol were allowed to expire, leaving the
RFS as the primary policy incentive for biofuels.
Demonstration and Commercialization of Second-Generation Renewable Fuels
The RFS sets individual annual volume requirements
for first-generation (edible feedstock) and second-
generation (non-edible feedstock) biofuels through 2022. For instance, by 2022 the RFS will require 15 billion gallons
of first-generation ethanol, which primarily uses edible feedstocks (e.g., corn and seeds) and relies on relatively simple
processing for fuel production. The RFS will also require 21 billion gallons of second-generation or advanced biofuels,169
which primarily use non-edible biomass (e.g., crop residues, forestry byproducts, switchgrass, and vegetable oils from
jatropha and microalgae) and other purpose-grown crops that do not compete with food crops for high-quality land.170
In contrast to first-generation biofuels, second-generation biofuels have not yet reached large-scale production, and
significant industry growth will be needed to meet the RFS requirements. However, several technologies have been
successfully demonstrated in recent years, and many are transitioning into the commercialization phase. More than 165
companies are actively involved in advanced biofuel production in the United States and Canada,171 and construction is
now under way on the country’s first six advanced biofuel refineries.172
DOD Initiatives
To protect against potential oil supply disruptions and reduce GHG emissions, DOD has taken steps to deploy alternative
liquid fuels. One example of these efforts is the Department of Navy’s “Great Green Fleet,” comprising biofuel- and
nuclear-powered vessels and scheduled to sail by 2016. Meanwhile, the Air Force is developing different blends of
biofuels and jet fuels, with the goal of generating half of its domestic aviation fuel from biofuels by 2016.173 DOD
has also partnered with the Department of Agriculture and DOE to help fund private industry construction of several
renewable fuel refineries in the United States.174
Figure 18
Renewable Fuel Standard Volumes by Year Billion Gallons
0.0
5.0
10.0
15.0
20.0
25.0
30.0
35.0
40.0
2008 2014 2016 20222010
Conventional ethanol
Cellulosic biofuels
Biomass-based diesel
Other advanced biofuels
2018
Figure 18. Renewable Fuel Standard Volumes by Year
20202012
Source: CRS (2012). “Renewable Fuel Standard: Overview and Issues.” Table 1.
Business Roundtable
40
Barriers to Investment in Renewable Transportation Fuels
Policy uncertainty
The RFS has received heightened scrutiny in the past year. Much of this attention comes in the aftermath of a
severe drought, which reduced the country’s corn supply and raised ethanol prices significantly. An additional source
of concern is the RFS requirement for cellulosic biofuels, which has not yet been met due to lack of commercial
availability. EPA has the authority to issue RFS waivers in special circumstances, and it has had to substantially reduce
the cellulosic biofuels requirement for the past three years.175 Despite progress, only 20,000 gallons of cellulosic
biofuels were produced in 2012 — prompting a federal appeals court to reject EPA’s 8.65 million gallon mandate.176
Some members of Congress are now calling for the targets themselves to be reconsidered,177 while others point to
the numerous advanced biofuel refineries under construction that will soon produce commercial-scale quantities of
second-generation fuels. The policy uncertainty surrounding
these RFS requirements has significant implications for industry
investment and growth.178
In addition, the future of many biofuels tax credits is uncertain.
As previously mentioned, some were allowed to expire at the
end of 2011.179 Others, including the producer tax credits for
cellulosic ethanol and biodiesel, have been extended through
the end of 2013, but their future beyond then is uncertain.180
This policy uncertainty, combined with the industry’s sensitivity
to fluctuations in feedstock and petroleum prices, makes it
difficult for biofuel producers to anticipate future demand and
make investment decisions.
Sustainability and Land use Concerns
As domestic production of first-generation biofuels has increased, some stakeholders have expressed concerns about
their sustainability and collateral impact on closely related markets.181 Relying on agricultural crops (e.g., corn and
soybeans) as feedstock, first-generation biofuels compete directly with other industries for food, land and other
key resources — raising concerns about the impact of first-generation biofuel production on food prices and land
use.182 In the short term, a focused use of rotational or cover crops, which do not affect land or food production
levels, could mitigate these concerns. Increased production efficiencies and higher crop and forest yields also have
the potential to address this issue and ensure that first-generation biofuels are produced and consumed in the
most efficient and sustainable manner possible. In the longer term, second-generation biofuels, which use non-
edible feedstock and less arable land, have the potential to significantly augment domestic fuel supplies without
exacerbating sustainability concerns.
“Affordable energy is now America’s
competitive advantage, and a secure
energy future is within our grasp.
We must continue to develop our
conventional resources and use
them wisely, while we apply our
unparalleled innovative capacity to
bring new energy sources to market.”
— Andrew N. Liveris Chairman & CEO
The Dow Chemical Company
Taking Action on Energy: A CEO Vision for America’s Energy Future
41
Transmission and Distribution Infrastructure
First-generation biofuels (e.g., ethanol and biodiesel) face transmission and distribution infrastructure barriers. For
example, there are significant logistical and technical challenges involved in shipping increased amounts of ethanol or
biodiesel through existing pipelines. Ethanol tends to mix with traces of water in the pipeline system, raising the risk of
corrosion and reducing fuel quality.183 In addition, compatibility issues exist with respect to underground storage tanks
(USTs) and fuel dispensing equipment. Most UST systems and fuel pumps at gas stations are designed to handle a blend
of 10 percent ethanol and 90 percent gasoline (i.e., E10), and higher ethanol blends can increase the risk of equipment
damage and malfunction. In its 2011 UST proposed rulemaking, EPA stated, “As the use of ethanol- and biodiesel-
blended fuels increases, EPA is concerned that not all UST system components are compatible with these fuel blends.”184
In addition, the National Renewable Energy Laboratory and Underwriters Laboratories have found compatibility issues
with both existing and new fuel dispensing equipment when tested with higher ethanol gasoline blends.185
While all ethanol-based fuels face compatibility issues, some second-generation biofuels have chemical properties that
resemble traditional petroleum-based fuels and meet quality specifications for diesel, gasoline and jet fuel. These “drop-
in” fuels can be used with existing tanks, pipelines and pumps without costly modifications, reducing compatibility
concerns and enabling greater biofuel adoption upon commercialization.186
Vehicle Compatibility
The rapid growth of ethanol production in recent years has increased the demand for ethanol as a blendstock, putting
pressure on the legal gasoline blending limit of 10 percent (E10) for gasoline-powered vehicles. In January 2011, EPA
increased the limit to 15 percent (E15) for vehicles built since 2001. However, several issues stand in the way of E15’s
widespread adoption.
The vast majority of the existing vehicle fleet is designed to run on E10 blends, and recent studies have identified
engine compatibility issues when those engines use higher ethanol blends.187 Some gasoline retailers may be reluctant
to sell E15 due to concerns about liability issues in the event of misfueling or storage equipment malfunctions.188 Even
if supply issues are addressed, the new blend will be subject to consumer demand. Some studies suggest consumer
acceptance has been slow to take hold, as vehicle owners worry that the new blend could cause engine damage and
void vehicle warranties.189 As with the preceding infrastructure issue, drop-in biofuels have the potential to overcome
the vehicle compatibility barrier due to their similarities to petroleum-based fuels. As drop-in replacements, they can
be used in today’s car, truck and other combustion engines without requiring costly modifications or risking mechanical
damage.190
Cost Competitiveness
The widespread deployment of renewable transportation fuels will ultimately depend on their long-term cost
competitiveness relative to traditional liquid fuels, such as gasoline and diesel. This is particularly true for second-
generation biofuels. Indeed, the World Bank estimates that the current cost of second-generation ethanol can be two
Business Roundtable
42
or three times as high as the price of gasoline. Similarly, the cost of biodiesel produced from microalgae is much higher
than the price of diesel.191 Capital costs are the primary determinant of overall production costs for second-generation
fuels, though feedstock costs are also an important factor.192 As with many new technologies, capital costs are likely
to decline over time as second-generation fuels transition from demonstration projects to large-scale commercial
production. Nevertheless, substantial investments in a first tranche of production capacity will be required to build a
successful track record with the market, attract additional capital and achieve economies of scale.
Policy Recommendations To Enhance Renewable Energy Production
Innovation
◗◗ The federal government should continue to support research, development and demonstration projects for
precommercial renewable electricity generation technologies, storage and related infrastructure, with an emphasis
on performance, emissions reductions, technology neutrality and integration with existing infrastructure.
◗◗ The federal government should continue to support research, development and demonstration projects for
precommercial renewable transportation fuels and related infrastructure, with an emphasis on performance,
emissions reductions and technology neutrality.
Incentives
◗◗ Congress should provide wind-powered electricity generation with a smooth transition to an era of unsubsidized
competitiveness by extending the wind production tax credit so that the benefit is gradually reduced and ultimately
eliminated.
◗◗ In the event that Congress adopts or extends renewable tax incentives in future years, it should ensure that such
measures are designed to address well-documented market inefficiencies, are applied only to those fuels and
technologies with a credible path to unsubsidized competitiveness, and are finite in duration and eventually phased
out in a predictable fashion.
◗◗ Congress should expand the availability of Master Limited Partnership tax treatment to all energy projects, including
renewable energy and biofuels projects.
◗◗ Congress should authorize the U.S. DOD to engage in 15-year contracts for advanced biofuels, rather than the five-
year contracts allowed under current law.
Regulations and Standards
◗◗ Congress and the Executive Branch should account for regional variations in renewable energy resource availability
when developing legislation and regulation.
◗◗ With respect to the RFS mandate, policymakers should consider the limitations of the current vehicle fleet, fuel
distribution infrastructure and actual production capacity and adopt targeted modifications as needed.
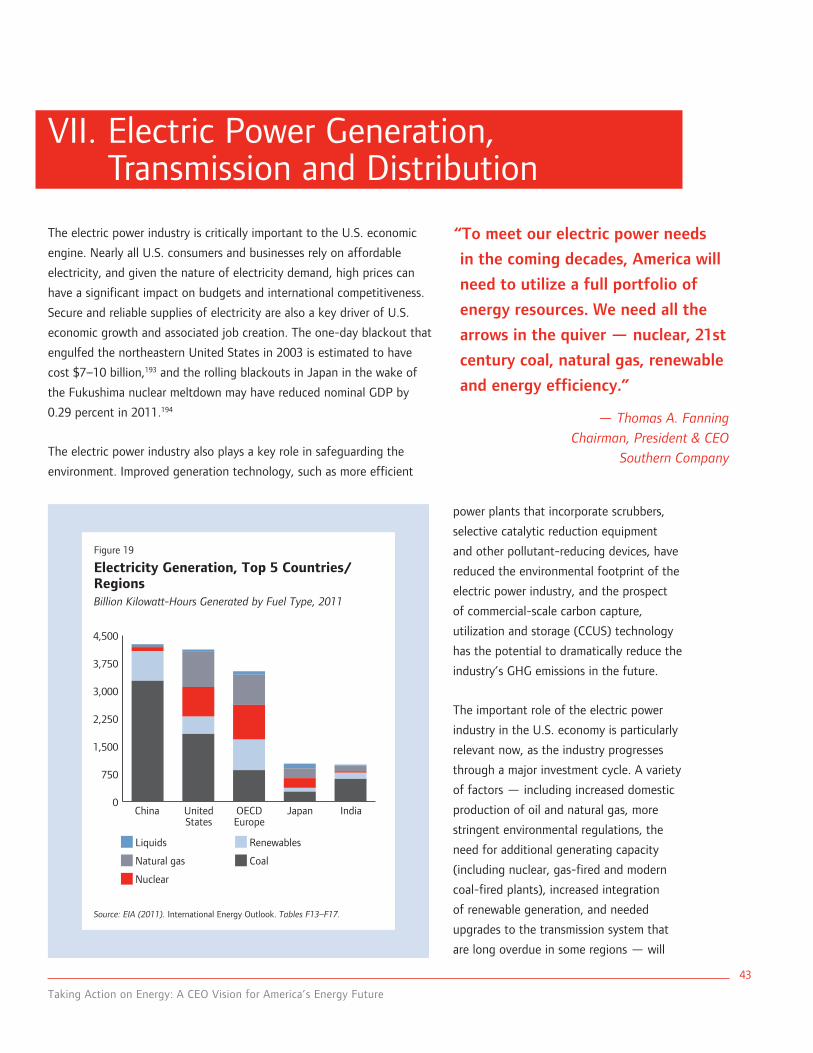
Taking Action on Energy: A CEO Vision for America’s Energy Future
43
VII. Electric Power Generation, Transmission and Distribution
The electric power industry is critically important to the U.S. economic
engine. Nearly all U.S. consumers and businesses rely on affordable
electricity, and given the nature of electricity demand, high prices can
have a significant impact on budgets and international competitiveness.
Secure and reliable supplies of electricity are also a key driver of U.S.
economic growth and associated job creation. The one-day blackout that
engulfed the northeastern United States in 2003 is estimated to have
cost $7–10 billion,193 and the rolling blackouts in Japan in the wake of
the Fukushima nuclear meltdown may have reduced nominal GDP by
0.29 percent in 2011.194
The electric power industry also plays a key role in safeguarding the
environment. Improved generation technology, such as more efficient
power plants that incorporate scrubbers,
selective catalytic reduction equipment
and other pollutant-reducing devices, have
reduced the environmental footprint of the
electric power industry, and the prospect
of commercial-scale carbon capture,
utilization and storage (CCUS) technology
has the potential to dramatically reduce the
industry’s GHG emissions in the future.
The important role of the electric power
industry in the U.S. economy is particularly
relevant now, as the industry progresses
through a major investment cycle. A variety
of factors — including increased domestic
production of oil and natural gas, more
stringent environmental regulations, the
need for additional generating capacity
(including nuclear, gas-fired and modern
coal-fired plants), increased integration
of renewable generation, and needed
upgrades to the transmission system that
are long overdue in some regions — will
“To meet our electric power needs
in the coming decades, America will
need to utilize a full portfolio of
energy resources. We need all the
arrows in the quiver — nuclear, 21st
century coal, natural gas, renewable
and energy efficiency.”
— Thomas A. Fanning Chairman, President & CEO
Southern Company
Figure 19
Electricity Generation, Top 5 Countries/Regions Billion Kilowatt-Hours Generated by Fuel Type, 2011
0
750
1,500
2,250
3,000
3,750
4,500
China OECDEurope
UnitedStates
Liquids
Natural gas
Nuclear
Renewables
Coal
Figure 19. Electricity Generation, Top 5 Countries/Regions
Japan India
Source: EIA (2011). International Energy Outlook. Tables F13–F17.
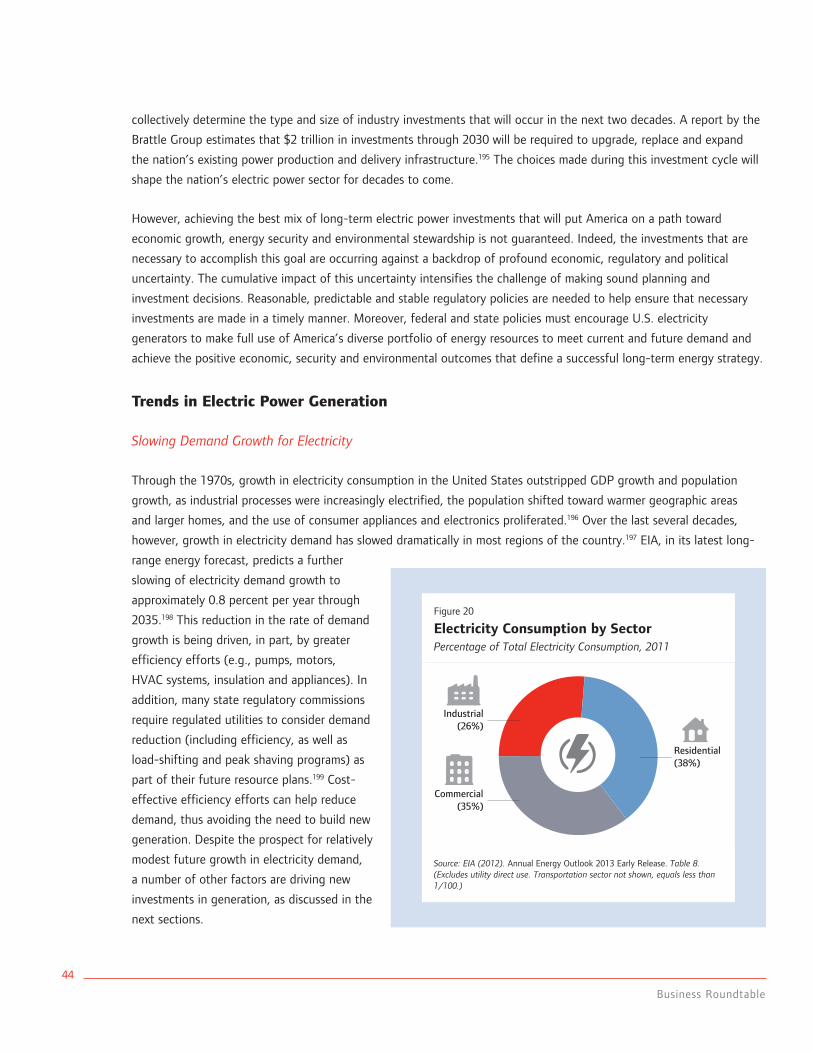
Business Roundtable
44
collectively determine the type and size of industry investments that will occur in the next two decades. A report by the
Brattle Group estimates that $2 trillion in investments through 2030 will be required to upgrade, replace and expand
the nation’s existing power production and delivery infrastructure.195 The choices made during this investment cycle will
shape the nation’s electric power sector for decades to come.
However, achieving the best mix of long-term electric power investments that will put America on a path toward
economic growth, energy security and environmental stewardship is not guaranteed. Indeed, the investments that are
necessary to accomplish this goal are occurring against a backdrop of profound economic, regulatory and political
uncertainty. The cumulative impact of this uncertainty intensifies the challenge of making sound planning and
investment decisions. Reasonable, predictable and stable regulatory policies are needed to help ensure that necessary
investments are made in a timely manner. Moreover, federal and state policies must encourage U.S. electricity
generators to make full use of America’s diverse portfolio of energy resources to meet current and future demand and
achieve the positive economic, security and environmental outcomes that define a successful long-term energy strategy.
Trends in Electric Power Generation
Slowing Demand Growth for Electricity
Through the 1970s, growth in electricity consumption in the United States outstripped GDP growth and population
growth, as industrial processes were increasingly electrified, the population shifted toward warmer geographic areas
and larger homes, and the use of consumer appliances and electronics proliferated.196 Over the last several decades,
however, growth in electricity demand has slowed dramatically in most regions of the country.197 EIA, in its latest long-
range energy forecast, predicts a further
slowing of electricity demand growth to
approximately 0.8 percent per year through
2035.198 This reduction in the rate of demand
growth is being driven, in part, by greater
efficiency efforts (e.g., pumps, motors,
HVAC systems, insulation and appliances). In
addition, many state regulatory commissions
require regulated utilities to consider demand
reduction (including efficiency, as well as
load-shifting and peak shaving programs) as
part of their future resource plans.199 Cost-
effective efficiency efforts can help reduce
demand, thus avoiding the need to build new
generation. Despite the prospect for relatively
modest future growth in electricity demand,
a number of other factors are driving new
investments in generation, as discussed in the
next sections.
Figure 20
Electricity Consumption by SectorPercentage of Total Electricity Consumption, 2011Figure 20. Electricity Consumption by Sector
Industrial(26%)
Residential (38%)
Commercial(35%)
Source: EIA (2012). Annual Energy Outlook 2013 Early Release. Table 8. (Excludes utility direct use. Transportation sector not shown, equals less than 1/100.)
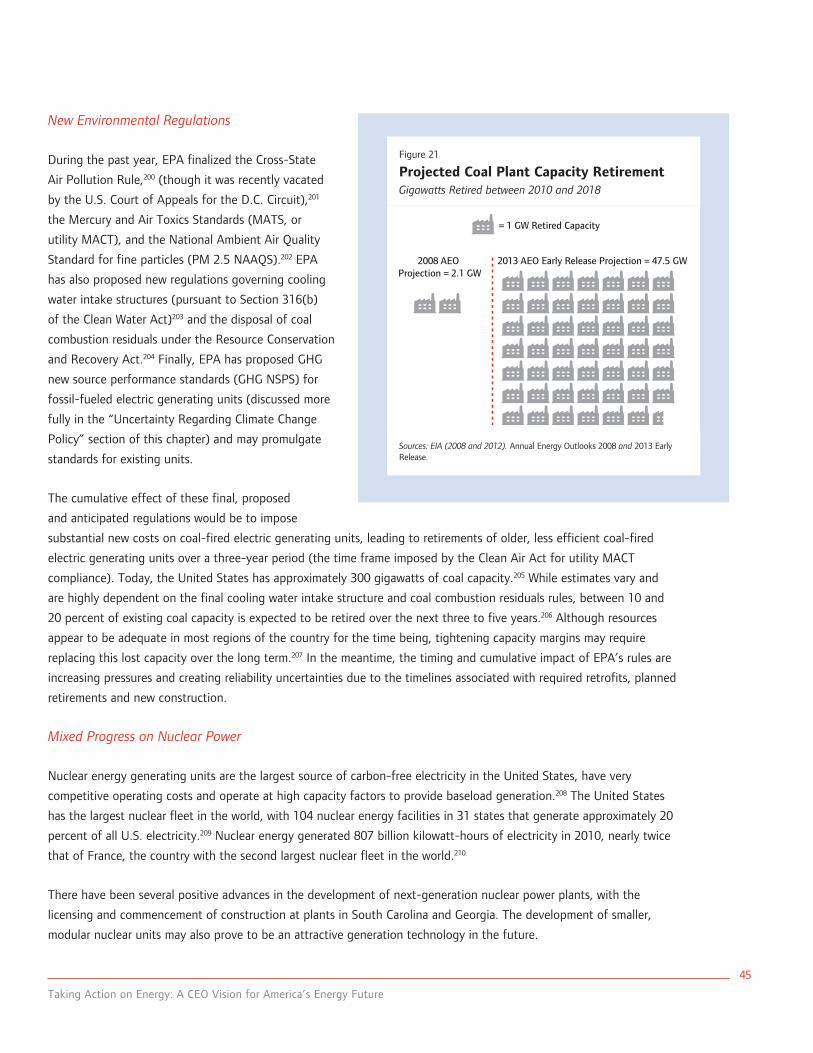
Taking Action on Energy: A CEO Vision for America’s Energy Future
45
New Environmental Regulations
During the past year, EPA finalized the Cross-State
Air Pollution Rule,200 (though it was recently vacated
by the U.S. Court of Appeals for the D.C. Circuit),201
the Mercury and Air Toxics Standards (MATS, or
utility MACT), and the National Ambient Air Quality
Standard for fine particles (PM 2.5 NAAQS).202 EPA
has also proposed new regulations governing cooling
water intake structures (pursuant to Section 316(b)
of the Clean Water Act)203 and the disposal of coal
combustion residuals under the Resource Conservation
and Recovery Act.204 Finally, EPA has proposed GHG
new source performance standards (GHG NSPS) for
fossil-fueled electric generating units (discussed more
fully in the “Uncertainty Regarding Climate Change
Policy” section of this chapter) and may promulgate
standards for existing units.
The cumulative effect of these final, proposed
and anticipated regulations would be to impose
substantial new costs on coal-fired electric generating units, leading to retirements of older, less efficient coal-fired
electric generating units over a three-year period (the time frame imposed by the Clean Air Act for utility MACT
compliance). Today, the United States has approximately 300 gigawatts of coal capacity.205 While estimates vary and
are highly dependent on the final cooling water intake structure and coal combustion residuals rules, between 10 and
20 percent of existing coal capacity is expected to be retired over the next three to five years.206 Although resources
appear to be adequate in most regions of the country for the time being, tightening capacity margins may require
replacing this lost capacity over the long term.207 In the meantime, the timing and cumulative impact of EPA’s rules are
increasing pressures and creating reliability uncertainties due to the timelines associated with required retrofits, planned
retirements and new construction.
Mixed Progress on Nuclear Power
Nuclear energy generating units are the largest source of carbon-free electricity in the United States, have very
competitive operating costs and operate at high capacity factors to provide baseload generation.208 The United States
has the largest nuclear fleet in the world, with 104 nuclear energy facilities in 31 states that generate approximately 20
percent of all U.S. electricity.209 Nuclear energy generated 807 billion kilowatt-hours of electricity in 2010, nearly twice
that of France, the country with the second largest nuclear fleet in the world.210
There have been several positive advances in the development of next-generation nuclear power plants, with the
licensing and commencement of construction at plants in South Carolina and Georgia. The development of smaller,
modular nuclear units may also prove to be an attractive generation technology in the future.
Figure 21
Projected Coal Plant Capacity Retirement Gigawatts Retired between 2010 and 2018
Figure 21. Projected Coal Plant Capacity Retirement
= 1 GW Retired Capacity
2013 AEO Early Release Projection = 47.5 GW2008 AEO Projection = 2.1 GW
Sources: EIA (2008 and 2012). Annual Energy Outlooks 2008 and 2013 Early Release.
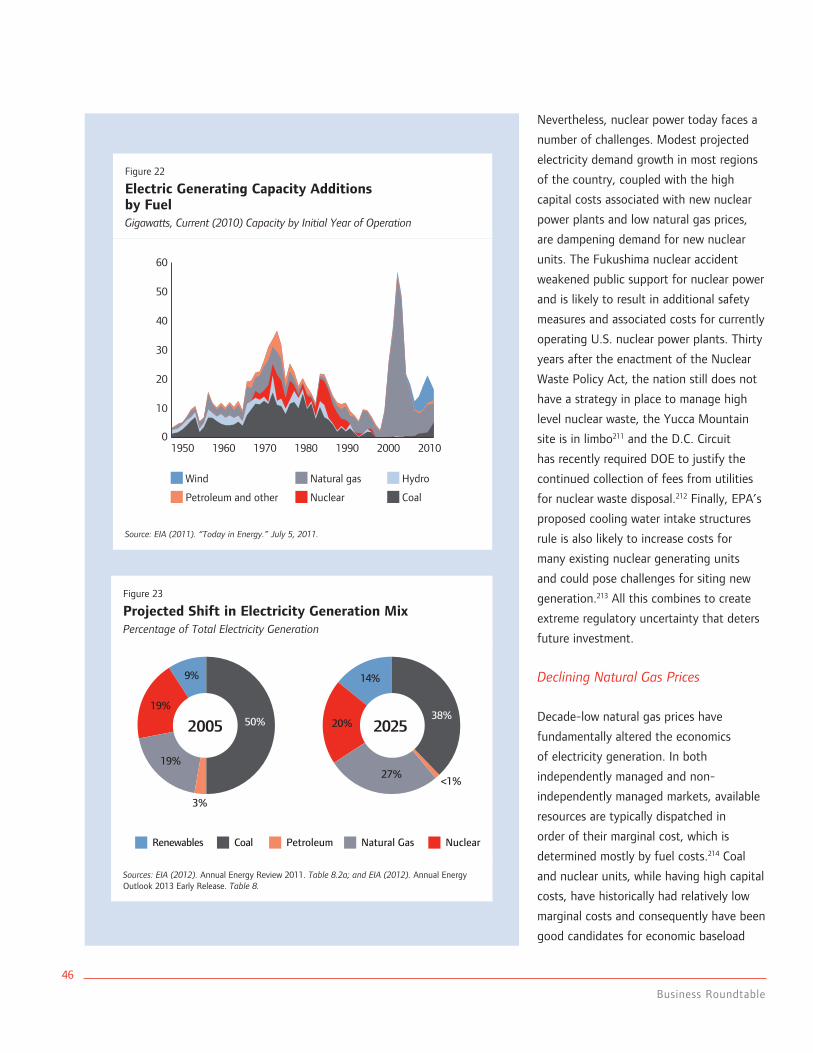
Business Roundtable
46
Nevertheless, nuclear power today faces a
number of challenges. Modest projected
electricity demand growth in most regions
of the country, coupled with the high
capital costs associated with new nuclear
power plants and low natural gas prices,
are dampening demand for new nuclear
units. The Fukushima nuclear accident
weakened public support for nuclear power
and is likely to result in additional safety
measures and associated costs for currently
operating U.S. nuclear power plants. Thirty
years after the enactment of the Nuclear
Waste Policy Act, the nation still does not
have a strategy in place to manage high
level nuclear waste, the Yucca Mountain
site is in limbo211 and the D.C. Circuit
has recently required DOE to justify the
continued collection of fees from utilities
for nuclear waste disposal.212 Finally, EPA’s
proposed cooling water intake structures
rule is also likely to increase costs for
many existing nuclear generating units
and could pose challenges for siting new
generation.213 All this combines to create
extreme regulatory uncertainty that deters
future investment.
Declining Natural Gas Prices
Decade-low natural gas prices have
fundamentally altered the economics
of electricity generation. In both
independently managed and non-
independently managed markets, available
resources are typically dispatched in
order of their marginal cost, which is
determined mostly by fuel costs.214 Coal
and nuclear units, while having high capital
costs, have historically had relatively low
marginal costs and consequently have been
good candidates for economic baseload
Figure 22
Electric Generating Capacity Additions by Fuel Gigawatts, Current (2010) Capacity by Initial Year of Operation
0
10
20
30
40
50
60
1950 20101960 1970 1980 2000
Figure 22. Electric Generating Capacity Additions by Fuel
1990
Wind
Petroleum and other
Natural gas
Nuclear
Hydro
Coal
Source: EIA (2011). “Today in Energy.” July 5, 2011.
Figure 23
Projected Shift in Electricity Generation MixPercentage of Total Electricity Generation
Figure 23. Projected Shift in Electricity Generation Mix
2005 202538%
<1%27%
20%
14%9%
19%
3%
50%
19%
Renewables Coal Petroleum Natural Gas Nuclear
Sources: EIA (2012). Annual Energy Review 2011. Table 8.2a; and EIA (2012). Annual Energy Outlook 2013 Early Release. Table 8.
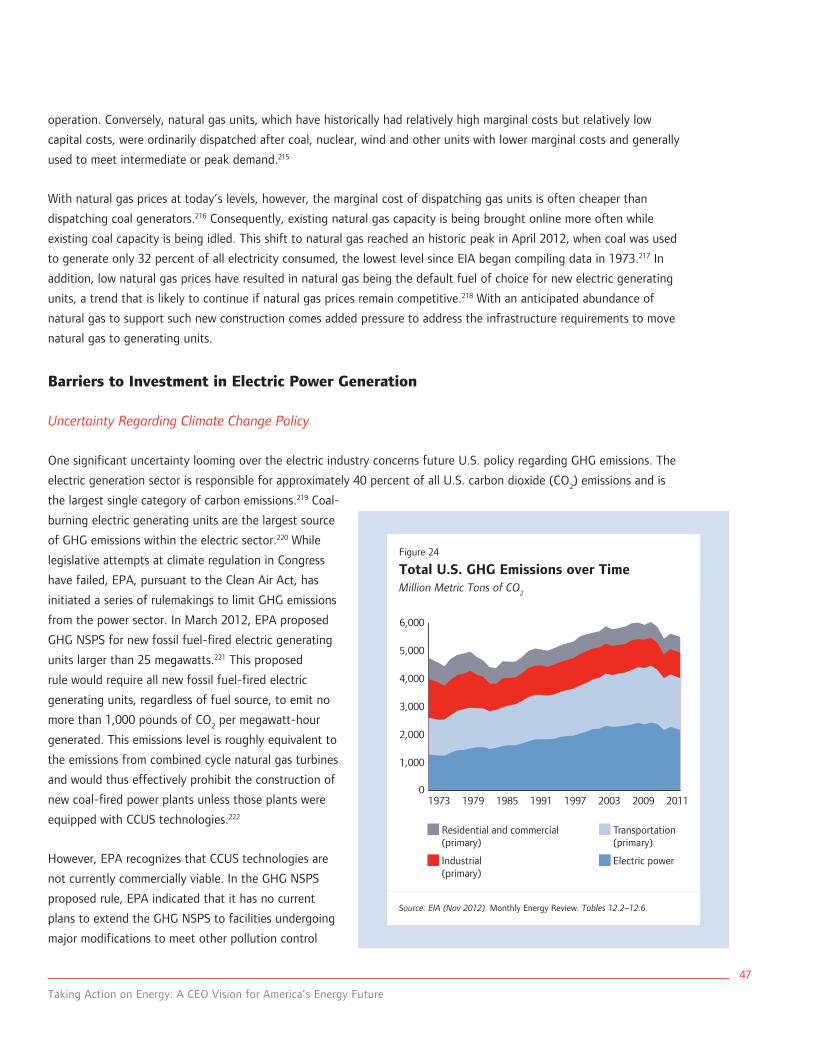
Taking Action on Energy: A CEO Vision for America’s Energy Future
47
operation. Conversely, natural gas units, which have historically had relatively high marginal costs but relatively low
capital costs, were ordinarily dispatched after coal, nuclear, wind and other units with lower marginal costs and generally
used to meet intermediate or peak demand.215
With natural gas prices at today’s levels, however, the marginal cost of dispatching gas units is often cheaper than
dispatching coal generators.216 Consequently, existing natural gas capacity is being brought online more often while
existing coal capacity is being idled. This shift to natural gas reached an historic peak in April 2012, when coal was used
to generate only 32 percent of all electricity consumed, the lowest level since EIA began compiling data in 1973.217 In
addition, low natural gas prices have resulted in natural gas being the default fuel of choice for new electric generating
units, a trend that is likely to continue if natural gas prices remain competitive.218 With an anticipated abundance of
natural gas to support such new construction comes added pressure to address the infrastructure requirements to move
natural gas to generating units.
Barriers to Investment in Electric Power Generation
uncertainty Regarding Climate Change Policy
One significant uncertainty looming over the electric industry concerns future U.S. policy regarding GHG emissions. The
electric generation sector is responsible for approximately 40 percent of all U.S. carbon dioxide (CO2) emissions and is
the largest single category of carbon emissions.219 Coal-
burning electric generating units are the largest source
of GHG emissions within the electric sector.220 While
legislative attempts at climate regulation in Congress
have failed, EPA, pursuant to the Clean Air Act, has
initiated a series of rulemakings to limit GHG emissions
from the power sector. In March 2012, EPA proposed
GHG NSPS for new fossil fuel-fired electric generating
units larger than 25 megawatts.221 This proposed
rule would require all new fossil fuel-fired electric
generating units, regardless of fuel source, to emit no
more than 1,000 pounds of CO2 per megawatt-hour
generated. This emissions level is roughly equivalent to
the emissions from combined cycle natural gas turbines
and would thus effectively prohibit the construction of
new coal-fired power plants unless those plants were
equipped with CCUS technologies.222
However, EPA recognizes that CCUS technologies are
not currently commercially viable. In the GHG NSPS
proposed rule, EPA indicated that it has no current
plans to extend the GHG NSPS to facilities undergoing
major modifications to meet other pollution control
Figure 24
Total U.S. GHG Emissions over TimeMillion Metric Tons of CO
2
0
1,000
2,000
3,000
4,000
5,000
6,000
1973 201119851979 2009
Figure 24. Total U.S. GHG Emissions Over Time
20031997
Residential and commercial (primary)
Industrial (primary)
Transportation (primary)
Electric power
1991
Source: EIA (Nov 2012). Monthly Energy Review. Tables 12.2–12.6.
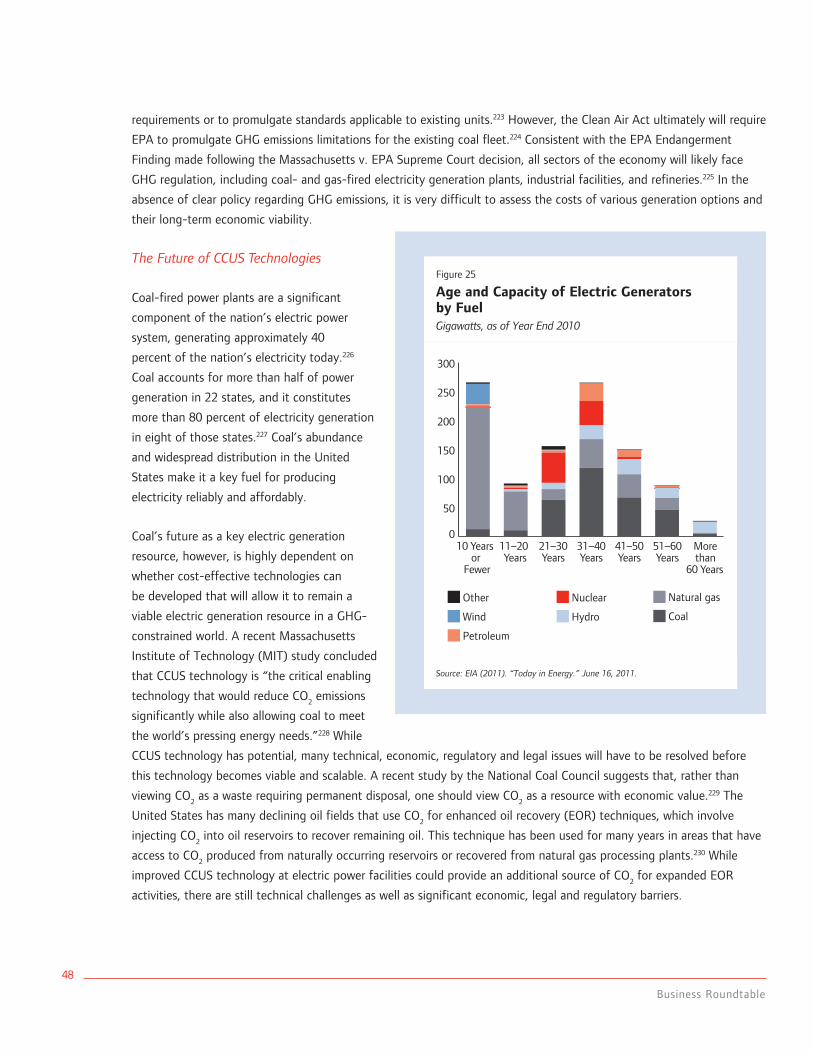
Business Roundtable
48
requirements or to promulgate standards applicable to existing units.223 However, the Clean Air Act ultimately will require
EPA to promulgate GHG emissions limitations for the existing coal fleet.224 Consistent with the EPA Endangerment
Finding made following the Massachusetts v. EPA Supreme Court decision, all sectors of the economy will likely face
GHG regulation, including coal- and gas-fired electricity generation plants, industrial facilities, and refineries.225 In the
absence of clear policy regarding GHG emissions, it is very difficult to assess the costs of various generation options and
their long-term economic viability.
The Future of CCuS Technologies
Coal-fired power plants are a significant
component of the nation’s electric power
system, generating approximately 40
percent of the nation’s electricity today.226
Coal accounts for more than half of power
generation in 22 states, and it constitutes
more than 80 percent of electricity generation
in eight of those states.227 Coal’s abundance
and widespread distribution in the United
States make it a key fuel for producing
electricity reliably and affordably.
Coal’s future as a key electric generation
resource, however, is highly dependent on
whether cost-effective technologies can
be developed that will allow it to remain a
viable electric generation resource in a GHG-
constrained world. A recent Massachusetts
Institute of Technology (MIT) study concluded
that CCUS technology is “the critical enabling
technology that would reduce CO2 emissions
significantly while also allowing coal to meet
the world’s pressing energy needs.”228 While
CCUS technology has potential, many technical, economic, regulatory and legal issues will have to be resolved before
this technology becomes viable and scalable. A recent study by the National Coal Council suggests that, rather than
viewing CO2 as a waste requiring permanent disposal, one should view CO
2 as a resource with economic value.229 The
United States has many declining oil fields that use CO2 for enhanced oil recovery (EOR) techniques, which involve
injecting CO2 into oil reservoirs to recover remaining oil. This technique has been used for many years in areas that have
access to CO2 produced from naturally occurring reservoirs or recovered from natural gas processing plants.230 While
improved CCUS technology at electric power facilities could provide an additional source of CO2 for expanded EOR
activities, there are still technical challenges as well as significant economic, legal and regulatory barriers.
Figure 25
Age and Capacity of Electric Generators by Fuel Gigawatts, as of Year End 2010
0
50
100
150
200
250
300
10 Years or
Fewer
21–30Years
31–40Years
Morethan
60 Years
Other
Wind
Petroleum
Nuclear
Hydro
41–50Years
Figure 25. Age & Capacity of Electric Generators by Fuel
51–60Years
11–20 Years
Natural gas
Coal
Source: EIA (2011). “Today in Energy.” June 16, 2011.
Taking Action on Energy: A CEO Vision for America’s Energy Future
49
Distributed Generation
Distributed electricity generation technologies (e.g., industrial and commercial combined heat and power [CHP], rooftop
solar, and micro-generators at customer sites) involve a number of complex regulatory issues, including rates and the
assignment of costs, which discourage more widespread adoption. As noted in an MIT study on the future of the electric
grid, “[i]ncreased penetration of distributed generation will pose challenges for the design and operation of distribution
systems. New regulatory approaches may be required to encourage the adoption of innovative network technologies.”231
Ultimately, a new utility regulatory model may have to be devised if distributed generation becomes widespread. Policies
regulating the treatment of distributed electricity generation technologies — including back-up power rates, rates for
power sold to the grid and interconnection costs — should be crafted to encourage adoption of these technologies
while avoiding negative impacts on reliability or consumer rates.
Fuel Price Variability
All fuel costs involve future price variability. A primary reason to have a diverse generation portfolio is to better cope
with the price volatility of any particular fuel. For example, natural gas prices for electric generation peaked at $12.41
per thousand cubic feet (Mcf) in June 2008, before falling to $2.79/Mcf in April 2012.232 Despite decades of low
volatility, coal prices have also recently experienced significant variability; prices rose to a peak in 2008, before falling
just as quickly as natural gas.233 Operators in the electric generation sector seek to mitigate price risk through a variety
of measures, such as hedging or entering into long-term fuel supply contracts. However, locking in or hedging fuel
costs on a long-term basis is currently difficult, which can create a challenge to greater use of natural gas. In addition,
with low prices spurring increased demand for natural gas from the transportation and manufacturing sectors and new
proposals for the export of LNG, some stakeholders are concerned that future natural gas prices could be higher than
they are today.234 Finally, overly burdensome regulation of hydraulic fracturing technology could increase the costs of
developing domestic natural gas resources and place some promising areas off-limits entirely. These concerns will need
to be addressed by rigorous analyses of future technology, regulations, supply and demand so that hedging strategies
and a reasonable range of future gas prices can be used to make informed investment decisions for generation assets
that will be expected to operate for decades.
Inconsistent State Policies Regarding Competitive Generation Markets
Certain regions of the country that operate within independently managed competitive wholesale electricity markets
are seeing an increase in state-sponsored efforts to promote the construction of new power plants, rather than rely on
the market to provide the necessary resources.235 In many of these cases, developers have been incentivized to build
with customer guarantees or subsidies that are not available to other market participants. These state-sponsored efforts
have been controversial because they could undermine independently managed competitive wholesale markets and chill
future private investment.
Business Roundtable
50
Trends in Transmission and Distribution
Increased Investment in Transmission Infrastructure
After decades of underinvestment in the electric transmission infrastructure in some regions of the United States,
transmission investment increased significantly over the past decade, rising from about $5 billion in 1995 to
approximately $12 billion in 2009.236 However, the Brattle Group projects that an additional $300 billion of transmission
investments will be needed from 2010 through 2030 (in nominal dollars) to connect renewable resources with the grid
to meet state Renewable Portfolio Standards (RPS), connect other generation resources to ensure resource adequacy
and meet reliability needs.237 Ultimately, investing in transmission infrastructure is a prerequisite to achieving a more
secure, more reliable, more domestic, lower-carbon energy future.
Increased Integration and Collaboration in the Transmission Planning Process
Historically, transmission planning and investment have been primarily conducted by local and Regional Transmission
Organizations and utilities, which in some cases has made it difficult to take into account the potential benefits
associated with transmission projects that span jurisdictions. To address this issue, Federal Energy Regulatory
Commission (FERC), which has jurisdiction over interstate transmission systems and wholesale power markets, has
issued a series of orders. Most recently in 2011, FERC adopted Order No. 1000, which requires both regional and inter-
regional transmission planning (and cost allocation, as discussed below).238 In addition, the order requires that local and
regional planning processes provide for consideration of transmission needs that are driven by public policy requirements
under federal or state laws or regulations. This could include, for example, RPS or Clean Energy Standard requirements,
although it is left to transmission providers and regional stakeholders to identify the public policy requirements to be
considered. With respect to inter-regional planning, transmission providers are required to coordinate with transmission
providers in neighboring planning regions within the same interconnection, though interconnectionwide planning is not
required.239
Order No. 1000 also establishes new principles for cost allocation methods for both intraregional and inter-regional
transmission facilities. Under the order, each transmission provider would be required to have a method or set of
methods in place for allocating the costs of new transmission facilities included in regional transmission plans “in a
manner that is at least roughly commensurate with estimated benefits” of the new facilities.240 Different regions and
transmission providers may propose specific cost allocation methodologies that are consistent with the general principles
under the order.
Increased Deployment of Smart Grid Technologies
Smart grid technologies “can facilitate the integration of large volumes of renewable and distributed generation, provide
greater visibility of the instantaneous state of the grid, and make possible the engagement of demand as a resource.”241
Smart grid investments have accelerated due to the Energy Independence and Security Act of 2007242 and the American
Recovery and Reinvestment Act, which provided $4.5 billion in smart grid-related funding,243 including $3.4 billion for the
Smart Grid Investment Grant program.244 One promising smart grid technology is volt var optimization (VVO), a method
Taking Action on Energy: A CEO Vision for America’s Energy Future
51
of remotely monitoring and managing the voltage on the electric distribution grid through the deployment of capacitors,
capacity monitors and associated control software. VVO allows for dynamic control of voltage on the distribution circuit,
and preliminary results suggest that demand reductions of 2 to 4 percent could be achieved. Technologies like VVO can
improve energy efficiency, reduce air emissions and avoid the need to build new generation.245
Increased Deployment of Load-Balancing Technologies
Due to the challenges of storing electricity efficiently and cost-effectively, demand for electricity and the amount of
power generated must be in balance on a real-time basis. Given that the amount of power needed changes continuously
throughout the day, resources must be brought on line or ramped up and down in real time. This complex balancing
must occur almost instantaneously. Being able to accurately predict demand and smooth peak demand can increase grid
reliability and reduce the need to dispatch more expensive resources — thereby reducing costs to consumers.
To meet this challenge, load-balancing technologies have advanced over recent years as a consequence of greater
computer power, better data analytics capability, improved communications capability and a greater recognition by state
regulators of the value of these programs. As technology continues to improve and the grid becomes “smarter,” load-
balancing technologies hold the promise of making the electric sector more efficient, reducing costs and the need for
new generation capacity.
Barriers to Investment in Transmission and Distribution
Despite the progress that has been made in recent years in improving the nation’s electric transmission infrastructure,
regional and multistate transmission projects continue to confront a variety of major challenges.
Transmission Planning
In many areas, transmission planning is an incumbent utility-driven, bottom-up process that focuses on reliably meeting
delivery service obligations. While in some regions transmission planning is handled through independent regional grid
operators, utility-driven transmission planning does not ordinarily consider promoting national policy goals unless such
goals involve providing firm transmission delivery services within the planning region. The planning process has been
very good at what it is primarily designed to do: ensure the continued reliability of the bulk power system. However, it
was not designed to facilitate, and is in fact ill equipped to address, projects providing widespread public benefits on a
prospective basis absent specific delivery service needs.
As previously mentioned, FERC has recognized this long-standing challenge and through a series of orders (including
Order No. 1000) has attempted to improve multijurisdictional transmission planning. Regional planning may improve
as a result of FERC’s efforts. However, the extent of the changes made will depend on the specific compliance plans
developed by each Regional Transmission Organization/Independent System Operator/transmission provider and
approved by FERC. In addition, numerous appeals of Order No. 1000 have been filed, and the outcome of the litigation
is uncertain. Until these uncertainties are resolved, the new FERC transmission planning policies will not be fully
recognized in regional transmission planning efforts.
Business Roundtable
52
Permitting and Siting
The states traditionally have been responsible for the permitting and siting of transmission facilities because historically,
the electric industry was vertically integrated and transmission was more intrastate in nature. However, the necessity
of additional interstate transmission capacity has increased with the partial deregulation of wholesale electric markets,
the adoption of legislative and regulatory policies that provide for open and non-discriminatory access to interstate
transmission, the development of organized wholesale electric markets, and the growth of generation located further
from load centers.
Large, multistate transmission projects with widely dispersed benefits at times do not fit well within existing state
permitting and siting procedures. An inclusive planning process that produces widespread stakeholder agreement on the
need for a facility can help mitigate permitting and siting concerns, but difficulties remain when states have different
processes governing permitting and siting decisions. Furthermore, siting and permitting difficulties can also reflect a lack
of consensus regarding the need for facilities and disagreement over the broader benefits of a particular project and how
costs should be allocated. However, even when there is consensus regarding the need for and benefits of a particular
project, environmental concerns often result in rerouting, which can increase costs and delay construction.
Recognizing the need to upgrade and expand the transmission grid to support competitive electricity markets; provide
access to new energy resources; and simplify the balkanized planning, siting and permitting processes, Congress gave FERC
in the Energy Policy Act of 2005 limited “backstop” siting authority to permit transmission projects in National Interest
Electric Transmission Corridors.246 However, two federal appellate court decisions have, for the present, rendered FERC’s
authority to site transmission facilities ineffective.247 Furthermore, any attempt to exercise this authority would likely be met
with continued fierce opposition from state and local governments, environmental groups, and property owners.
Siting and permitting problems encountered by transmission developers do not rest solely at the state and local levels. If
a project traverses federal public lands, federal land management agencies are responsible for the environmental review,
permitting and siting of a transmission facility. Unfortunately, cumbersome statutory requirements and the inclusion of
more than one federal agency can delay the siting of transmission even after a state has issued the necessary permits.
Cost Allocation
FERC has jurisdiction over the allocation of costs associated with interstate transmission. Cost allocation decisions are
often straightforward for relatively small projects that are needed for reliability or economic dispatch and are located
within a single state with clear benefits to the residents of that state. However, difficulties arise with respect to regional
or super-regional, multistate projects that are intended to benefit more than one state or more than one region. Cost
allocation — particularly the determination of who benefits from a project — has proven to be the most contentious of
the transmission issues, although many believe that with improved transmission planning, cost allocation issues would be
easier to resolve.
The cost allocation principle of FERC’s Order No. 890 (adopted in 2007) requires that every transmission provider
establish a methodology for the allocation of the costs of new transmission facilities, but it does not specify what
that method should be.248 As previously mentioned, FERC’s Order No. 1000 goes a step further and establishes new
principles for cost allocation methods for both intraregional and inter-regional transmission facilities.249 However,
Taking Action on Energy: A CEO Vision for America’s Energy Future
53
petitions for review of the order have been filed, and it is inevitable that challenges to the cost allocation principles will
be raised. Accordingly, while progress is being made, the uncertainty that surrounds cost allocation for transmission is
likely to continue for some time.
Accommodating Intermittent Generation Resources
One of the key drivers of regional or multistate high voltage transmission projects is the need to interconnect location-
constrained renewable resource projects to help utilities meet state renewable portfolio requirements. More than half
of all states have adopted some form of RPS, most with escalating requirements.250 These requirements will continue
to drive investment in new generation, although many of the renewable resources most likely to be developed for
generation (particularly wind and solar resources) are found in sparsely populated areas, located far from major load
centers. The transmission infrastructure in these renewable resource-rich areas is often inadequate to allow for the
development of these resources without additional infrastructure investments.
Another challenge posed by incorporating increasing amounts of renewable power into the nation’s electricity
generation portfolio is the intermittent nature of these resources, particularly wind and solar resources.251 Given that
widespread, cost-effective storage technologies are not yet available, intermittent resources require back-up, quick-start
generation that can be brought online rapidly when it is needed and ramped down when it is not. Natural gas peaking
units are uniquely suited for this role, but having such additional capacity on hand to back up unpredictable resources
adds significant costs.
Increased transmission capacity can also help meet the challenge of integrating intermittent resources by increasing
transfer capacity between load-balancing areas or regions, so that more generation resources can be called upon if
needed. As state renewable portfolio requirements become increasingly stringent, integration of intermittent resources
will become a more pressing concern. Better weather forecasting and predictive modeling capability, larger transmission
balancing areas, blended supply products (e.g., renewable backed by gas generation), and better planning can improve
intermittent generation integration.252 The costs of additional transmission and back-up generation will be significant
factors to consider in the overall economic evaluation of renewables.
Storage Challenges
Electricity demand can fluctuate widely during the day and varies between regions. Because peak load may be
substantially above average load, cost-effective storage technologies would help reduce the need for high-cost
generation capacity that is used intermittently as additional generation during peak demand.
A number of possible storage technologies are being explored, including molten salt, batteries, flywheel, compressed
air and water pumped storage systems. One promising storage technology being deployed by concentrating solar
generators involves heating a sodium solution to collect heat during periods of peak generation. In the evening, the
molten solution is run through a heat exchanger to generate steam that runs a turbine.253 Increased deployment of plug-
in electric drive vehicles also offers potential storage capacity, as these vehicles could function as distributed electricity
storage systems. While a number of storage technologies are being explored, no one technology has emerged as ready
for widespread commercialization, primarily due to high costs.
Business Roundtable
54
Cybersecurity Concerns
Cyberspace has been defined as “the interdependent network of information technology infrastructures, and includes
the Internet, telecommunications networks, computer systems, and embedded processors and controllers in critical
industries.”254 The widespread reliance on digital information and communications technology has increased the extent
and efficiency of our ability to do business in all sectors of our economy. However, because these networks were
designed with interoperability rather than security in mind, the United States’ critical infrastructure, economy and
national security are exposed to growing cybersecurity threats and vulnerabilities from state and nonstate actors.255
While the electric grid was built primarily to transmit local generation to serve local load, the complex, interconnected
grid of today now moves power across vast distances, relying on advanced control systems and equipment that
communicate, store and act on data.256 As with other sectors of the economy, the electric industry depends on digital
technology to increase efficiency, reduce costs and maintain bulk power system reliability. According to the North
American Electric Reliability Corporation (NERC), “[t]he networks and computer environments that make up this digital
technology could be as vulnerable to malicious attacks and misuse as any other technology infrastructure.”257 NERC has
developed and FERC has approved Critical Infrastructure Protection standards designed to reduce the transmission grid’s
vulnerability to a cyber attack.258
Because of the constantly changing nature of cyber threats, there is general agreement within the industry on the need
for improved information sharing between government and the private sector regarding cyber threats and vulnerabilities
and a defined role for the government in responding in real time to cyber emergencies that threaten the electric grid.
Sensitivity to Rate Increases
Large capital investments will be required to retrofit existing generation units to comply with new regulations, build
the new generation capacity necessary to replace retirements over the next three years, and upgrade the transmission
system to connect location-constrained renewable resources and maintain reliability. Ultimately, these costs will be
passed on to consumers and businesses through higher electricity prices. Consumers and regulators in certain geographic
areas facing particularly large investments have already expressed concerns about rates.259 These concerns will only
increase as the full costs of meeting the challenges facing the industry become more evident. For the first time in many
years, key U.S. manufacturing sectors have begun to show signs of recovery driven largely by the new availability of
affordable domestic energy resources like shale gas. Some U.S. manufacturing sectors are poised to make significant
new capital investments that will create new jobs and drive supply chain growth.260 To sustain this trend, policymakers
need to be mindful of the cumulative impact that their decisions have on consumer rates and energy affordability.
Policy Recommendations To Enhance Generation, Transmission and Distribution
Generation
◗◗ The United States should seek to expand our broad portfolio of cost-effective generating options by continuing to
provide precommercial funding for research and development for nuclear, clean coal, CCUS, renewable energy and
other promising generation technologies in order to help drive down costs and preserve them as generating options.
Taking Action on Energy: A CEO Vision for America’s Energy Future
55
(Also see “Chapter V: Traditional Energy Production” and “Chapter VI: Renewable Energy Production,” which
discuss more specific recommendations regarding these technologies.)
◗◗ Congress and the Executive Branch should devise a long-term solution to remove and manage nuclear spent fuel. It
is important to protect consumers’ investment in the Nuclear Waste Fund and ensure it serves its intended purpose
of managing spent fuel. In particular, Congress and the Executive Branch should promptly resume the licensing and
development of a spent nuclear fuel repository at Yucca Mountain, NV; develop one or more consolidated interim
storage sites; provide access to the Nuclear Waste Fund for spent fuel storage and management without annual
congressional appropriations; and develop a transportation plan to prepare for large-scale movement of spent
nuclear fuel and high level waste to disposal facilities.
◗◗ The states should review and revise policies as necessary to regulate the treatment of distributed electricity
generating technologies (such as CHP and rooftop solar PV) and facilitate the adoption of cost-effective
technologies, while ensuring reliability and reasonable utility rates.
◗◗ FERC, DOE, NERC and private industry should collaborate and coordinate policies covering the electric and natural
gas industries to ensure adequate integration of these industries as natural gas increasingly is used as an electricity
generation fuel.
◗◗ Congress and the Executive Branch should carefully evaluate the timing and cumulative impact of EPA regulations
under the Clean Air Act, Clean Water Act, Resource Conservation and Recovery Act, and other environmental
statutes on the electric utility industry and its customers. Congress and the Executive Branch should modify these
regulations, as appropriate, to ensure continued reliability; avoid unreasonable rate impacts; and maintain a diverse,
market-driven portfolio of electricity generation fuel options.
◗◗ State and federal policymakers should recognize the need for stable and predictable regulatory environments in
wholesale electricity markets and avoid interventions that threaten the benefits customers receive from these
markets.
Efficiency
◗◗ States that do not already do so should allow cost-effective generation efficiency, distribution and customer-
premise efficiency investments to be included in a utility’s rates in order to encourage utility investments in energy
efficiency. (Also see “Chapter IV: Energy Efficiency” for more detailed recommendations regarding efficiency
measures.) FERC should continue to provide rate treatment for efficiency investments in transmission where FERC
has jurisdiction over such investments.
Infrastructure
◗◗ FERC and other agencies, such as the Corps of Engineers, should improve and streamline the permit application
process for the construction of additional pipeline infrastructure and storage capacity, in order to accommodate
the increasing amount of natural gas being used to generate electricity. (Also see “Chapter V: Traditional Energy
Production.”)
Business Roundtable
56
◗◗ Upgrade the nation’s railways, locks, ports and river transportation system to ensure continued access to reliable
supplies of coal and other critical materials.
Transmission
◗◗ FERC should continue to provide transparent rate incentives for cost-effective upgrades to the nation’s transmission
infrastructure in order to facilitate grid modernization and support competitive wholesale electricity markets.
◗◗ Improve coordination among federal agencies, such as FERC and DOE; state commissions; and other stakeholders
to address the complexity, unpredictability and inefficiency of transmission planning, siting and cost allocation
decisions for interstate transmission projects, particularly those that cross federal lands.
Distribution
◗◗ Continue to support DOE and National Institute of Standards and Technology (NIST) efforts to accelerate and
coordinate the development of “smart grid” standards in order to maintain continued U.S. leadership in smart grid
technologies.
Cybersecurity
◗◗ Congress should continue to support existing FERC/NERC efforts regarding information sharing, education and
development of industry best practices and avoid duplicative or preemptive legislation or standards.
◗◗ Federal legislation should cover all critical infrastructure while recognizing existing regulation and avoiding the
creation of additional or duplicative burdens for highly regulated industries.
◗◗ Federal legislation also should require actionable and timely threat intelligence sharing from government to critical
infrastructure owners and operators.
Taking Action on Energy: A CEO Vision for America’s Energy Future
57
VIII. Conclusion
America’s energy future is brighter than it has been in decades, and recent events have paved the way for the nation to
reclaim our position as a global energy leader. Newly discovered oil and natural gas deposits in shale formations are at
the heart of the energy renaissance and will undoubtedly play a major role in America’s energy future, but the critical
role of nuclear power and the abundance and affordability of coal must not be overlooked. Just as important, efforts to
sustain the growth of renewable energy capacity and generation that has occurred over the last decade — particularly
in the wind, solar and biomass markets — are important elements for diversifying our energy mix and safeguarding the
environment. Regardless of the mix of traditional and renewable fuels in U.S. energy production, we must ensure that
appropriate and sufficient private and public investments are made in our nation’s energy infrastructure, as a robust
electric power sector capable of generating, transmitting and distributing electricity securely and without interruption
is a fundamental component of U.S. economic growth and associated job creation. Finally, businesses and consumers
also have a key role to play in ensuring America’s energy future by continuing to improve the efficiency with which they
consume energy.
To fully capitalize on this rare opportunity, however, America must break the decades-long cycle of ad hoc energy
policies and forge a coherent, forward-looking energy framework. To accomplish this, we must first engage in an open
and honest dialogue about our nation’s energy priorities and values, which the Business Roundtable believes to be
economic growth, energy security and environmental stewardship. The policy framework that is produced from this
dialogue must strike a balance between ensuring regulatory and financial predictability and providing the flexibility
necessary to capitalize on new energy developments and opportunities that will undoubtedly occur in the future.
The decisions we make regarding energy policy in the coming months and years will shape our nation’s future for
decades to come. The CEOs of the Business Roundtable believe that this document provides the right path forward for
these decisions. By following the framework and recommendations outlined in this report, policymakers can help reclaim
the United States’ position as a global energy leader and improve our nation’s economic, security and environmental
futures.
Business Roundtable
58
ACC – American Chemistry Council
ADR – automated demand response
ARRA – American Recovery and Reinvestment Act
BLM – Bureau of Land Management
BTU – British thermal unit
CAFE – Corporate Average Fuel Economy
CCUS – carbon capture, utilization and storage
CHP – combined heat and power
CO2 – carbon dioxide
DOD – Department of Defense
DOE – Department of Energy
E10 – blend of 10 percent ethanol with 90 percent
gasoline
E15 – blend of 15 percent ethanol with 85 percent
gasoline
EIA – Energy Information Administration
EISA – Energy Independence and Security Act of 2007
EOR – enhanced oil recovery
EPA – Environmental Protection Agency
EPRI – Electric Power Research Institute
ESAs – Energy Service Agreements
ESCO – Energy Services Company
ESPCs – Energy Savings Performance Contracts
FERC – Federal Energy Regulatory Commission
GDP – gross domestic product
GHGs – greenhouse gases
GHG NSPS – GHG new source performance standards
LEED – Leadership in Energy and Environmental Design
LNG – liquefied natural gas
MATS – Mercury Air and Toxics Standards
Mcf – thousand cubic feet
MIT – Massachusetts Institute of Technology
NAAQS – National Ambient Air Quality Standards
NABERS – National Australian Built Environment Rating
System
NERC – North American Electric Reliability Corporation
NESHAP – National Emissions Standards for Hazardous
Air Pollutants
NIST – National Institute of Standards and Technology
NPC – National Petroleum Council
OECD – Organisation for Economic Co-operation and
Development
PACE – Property Assessed Clean Energy
PM 2.5 NAAQS – National Ambient Air Quality Standard
for fine particles
PTC – production tax credit
PV – photovoltaic
RFS – Renewable Fuel Standard
RPS – Renewable Portfolio Standard
UESCs – Utility Energy Service Contracts
utility MACT – Mercury Air and Toxics Standards
USTs – underground storage tanks
VVO – volt var optimization
Appendix: Acronyms
Taking Action on Energy: A CEO Vision for America’s Energy Future
59
Endnotes1 The term “market inefficiencies” refers to instances in which a freely functioning market fails to attain a socially optimal allocation of resources.
This may result from the existence of imperfect competition, imperfect information, incomplete markets, externalities (e.g., pollution) and other so-called market failures.
2 U.S. Energy Information Administration (2012). Annual Energy Review 2011. Table 5.2; and U.S. Energy Information (2012). Annual Energy Outlook 2013 Early Release. Table 11.
3 U.S. Energy Information Administration (2012). Annual Energy Review 2011. Table 6.2.
4 Ibid., Table 1.2.
5 U.S. Energy Information Administration (2012). Annual Energy Outlook 2013 Early Release. P. 9.
6 U.S. Energy Information Administration (2012). Annual Energy Review 2011. Table 5.1a; and U.S. Energy Information Administration (2012). Annual Energy Outlook 2013 Early Release. Table 11.
7 U.S. Energy Information Administration (2012). Annual Energy Review 2011. Table 6.3; and U.S. Energy Information Administration (2012). Annual Energy Outlook 2013 Early Release. Table 13.
8 Loder, Asjylyn (2012). “America’s Energy Seen Adding 3.6 Million Jobs Along with 3% GDP.” Bloomberg. Published August 13, 2012; and PricewaterhouseCoopers LLP (2011). Shale Gas: A Renaissance in u.S. Manufacturing? See also Bureau of Economic Analysis (2012). Table 3.7ES: Investment in Private Fixed Assets by Industry. Fixed Assets Accounts Tables; and Bureau of Economic Analysis (2012). Table 1.1.5: Gross Domestic Product. National Income and Product Accounts Tables.
9 Citi GPS: Global Perspectives & Solutions (2012). Energy 2020: North America, the New Middle East? P. 84; and James, Raymond (2012). “Yes, Mr. President, We Believe We Can Drill Our Way Out of This Problem.”
10 U.S. Energy Information Administration (2012). Monthly Energy Review. November 2012. Table 1.7.
11 U.S. Energy Information Administration (2012). Annual Energy Outlook 2013 Early Release. P. 9.
12 Ayres, Robert U. and Benjamin Warr (2009). The Economic Growth Engine: How Energy and Work Drive Material Prosperity. Northampton, MA: Edward Elgar Publishing. Cited by Laitner, John, et al. (2012). The Long-Term Energy Efficiency Potential. American Council for an Energy-Efficient Economy. Report Number E121.
13 Choi-Granade, Hannah, et al. (2009). unlocking Energy Efficiency in the u.S. Economy. McKinsey & Company Report.
14 The Rockefeller Foundation and DB Climate Change Advisors (2012). united States Building Energy Efficiency Retrofits: Market Sizing and Financing Models.
15 See, for example, Electric Power Research Institute (2009). Assessment of Achievable Potential from Energy Efficiency and Demand Response Programs in the u.S. (2010-2013); Fischer, Emily, et al. (2012). Building a Better America: Reducing Pollution and Saving Money with Efficiency. Environment America Research & Policy Center; Laitner, John, et al. (2012). The Long-Term Energy Efficiency Potential: What the Evidence Suggests. American Council for an Energy-Efficient Economy; and Lowenberger, Amanda, et al. (2012). The Efficiency Boom: Cashing in on the Savings from Appliance Standards. American Council for an Energy-Efficient Economy.
16 Alliance to Save Energy (2011). “Recovery Act — Chart of Energy Efficiency Provisions.”
17 North Carolina Solar Center and the Interstate Renewable Energy Council, Inc. (2012). “Financial Incentives for Energy Efficiency.” Database of State Incentives for Renewables & Efficiency. Funded by U.S. Department of Energy.
18 Ibid.
19 Bell, Catherine J., et al. (2011). On-Bill Financing for Energy Efficiency Improvements: A Review of Current Program Challenges, Opportunities, and Best Practices. American Council for an Energy-Efficient Economy. Report Number E118.
20 U.S. Department of Energy (2010). Energy Efficiency Trends in Residential and Commercial Buildings.
21 ENERGY STAR (2012). “About Energy Star.” Available at http://www.energystar.gov/index.cfm?c=about.ab_index. Accessed on May 30, 2012.
22 Citi GPS: Global Perspectives & Solutions (2012). Energy 2020: North America, the New Middle East?
23 These standards took effect in 2012 but have not yet been implemented due to a one-year enforcement ban by congressional appropriators. It is currently unclear whether the enforcement ban will be lifted in 2013.
24 White House Memo (2011). “Presidential Memorandum — Implementation of Energy Savings Projects and Performance-Based Contracting for Energy Savings.” See also U.S. Department of Energy (2012). “Utility Energy Service Contracts.” Available at http://www1.eere.energy.gov/femp/financing/uescs.html. Accessed on November 27, 2012.
Business Roundtable
60
25 Environment and Energy Study Institute (2011). “Fact Sheet: DOD’s Energy Efficiency and Renewable Energy Initiatives.” Available at http://www.eesi.org/dod_eere_factsheet_072711. Accessed on May 31, 2012.
26 Australian Office of Environment and Heritage (n.d.). “Benefits of NABERS.” Available at http://www.nabers.gov.au/public/WebPages/ContentStandard.aspx?module=10&template=3&include=Benefits.htm&side=CommitmentAgrTertiary.htm. Accessed on December 19, 2012.
27 Center for Climate and Energy Solutions (2011). “Comparison of Qualifying Resources for Individual States’ RPS and AEPS.” Available at http://www.c2es.org/docUploads/State%20rps%20eligible%20resources.pdf. Accessed on May 30, 2012.
28 American Council for an Energy-Efficiency Economy (2012). “Building Codes.” Available at http://www.aceee.org/topics/building-codes. Accessed on July 3, 2012.
29 U.S. Energy Information Administration (2012). Monthly Energy Review. November 2012. Table 9.10. Wellhead prices converted to Henry Hub spot prices using a conversion factor of 1.027 MMBTU per 1,000 cubic feet.
30 U.S. Energy Information Administration (2012). Annual Energy Outlook 2013 Early Release. Table 13. Henry Hub spot prices used.
31 Woodall, Gina and Joe Bates (2011). “How the Recession and a Targeted Energy Efficiency Marketing Program Can Create a Greener Economy and Benefit Energy Utilities.” Rockbridge Associates White Paper.
32 Deloitte Center for Energy Solutions (2012). “Charge your Business Strategy with Electricity Customer Insights through the Deloitte reSources 2012 Study.”
33 Ibid.
34 Deloitte Center for Energy Solutions (2012). “Charge your Business Strategy with Corporate Energy Management Insights through the Deloitte reSources 2012 Study.”
35 Johnson Controls (2010). Energy Efficiency Indicator: 2010 North America EEI Survey Findings Summary.
36 National Resources Defense Council (2011). “Energy Facts: Removing Disincentives to Utility Energy Efficiency Efforts.”
37 16 U.S.C. § 2621(d)(7) and (8).
38 For example, under New Source Review, even projects that are intended to maintain or improve the efficiency and reliability of an existing energy source require preconstruction permit review that can require the installation of additional emission control technology before the efficiency improvement can be made. See, for example, Clean Coal USA (n.d.). “New Source Review.” Available at http://www.joyglobal.com/JoyGlobal/SocialResponsibility/NewSourceReview.pdf. Accessed on May 22, 2012.
39 Hoppock, David, et al. (2008). Transforming utility and Ratepayer Support for Electrical Energy Efficiency Nationwide. Nicholas Institute for Environmental Policy Solutions. Duke University. P. 3.
40 Ibid.
41 Massachusetts Institute of Technology (2011). The Future of the Electric Grid. Chapter 8: Utility Regulation. P. 131.
42 Ibid., Chapter 1: Challenges, Opportunities, and Major Recommendations. P. 20.
43 Pratt, R.G., et al. (2010). The Smart Grid: An Estimation of the Energy and CO2 Benefits. Pacific Northwest Research Laboratory. Prepared for U.S.
Department of Energy. P. vi.
44 Electric Power Research Institute (2011). Estimating the Costs and Benefits of the Smart Grid: A Preliminary Estimate of the Investment Requirements and the Resultant Benefits of a Fully Functioning Smart Grid. 2011 Technical Report. Pp. 4–10.
45 Ibid., Pp. 5.42, 6.17 and 6.18. Costs cited include costs to upgrade the existing system, as well as costs to embed smart grid functionality while accommodating load growth and large-scale renewables.
46 American Council for an Energy-Efficient Economy (2007). Quantifying the Effects of Market Failures in the End-use of Energy. Prepared for International Energy Agency. P. 11.
47 Gentry, Thomas A. (2008). Written testimony before the House Energy and Commerce Subcommittee on Energy. July 17, 2008. P. 72. Available at http://www.gpo.gov/fdsys/pkg/CHRG-110hhrg57974/pdf/CHRG-110hhrg57974.pdf. Accessed on June 12, 2012.
48 National Governors Association (2008). Securing a Clean Energy Future — A Governor’s Guide to Clean Power Generation and Energy Efficiency. P. 10.
49 U.S. Energy Information Administration (2012). Annual Energy Outlook 2013 Early Release. Table 1.
50 U.S. Energy Information Administration (2012). Annual Energy Review 2011. Table 5.1a. “Liquid fuels production” includes crude oil (including lease condensate) production, natural gas plant liquids production and processing gain (refinery and blender net production minus refinery and blender net inputs). Beginning in 1981, it also includes fuel ethanol (minus denaturant production) and, beginning in 2011, biodiesel production. It does not include product stock withdrawal.

Taking Action on Energy: A CEO Vision for America’s Energy Future
61
51 Ibid.
52 U.S. Energy Information Administration (2012). Annual Energy Outlook 2013 Early Release. Table 11. “Liquid fuels production” includes crude oil (including lease condensate) production; natural gas plant liquids production; refinery processing gain; ethanol and biodiesel production; and domestic sources of other blending components, other hydrocarbons and ethers. It does not include product stock withdrawal.
53 U.S. Energy Information Administration (2012). Annual Energy Review 2011. Table 6.2; and U.S. Energy Information Administration (2012). Annual Energy Outlook 2013 Early Release. Table 13.
54 PricewaterhouseCoopers LLP (2011). The Economic Impacts of the Oil and Natural Gas Industry on the u.S. Economy in 2009: Employment, Labor, Income, and Value Added. Prepared for American Petroleum Institute.
55 U.S. Energy Information Administration (2012). Annual Energy Outlook 2013 Early Release. Table 1. See also ExxonMobil (2012). The Outlook for Energy: A View to 2040. 2013 Outlook; and National Petroleum Council (2007). Hard Truths: Facing the Hard Truths about Energy.
56 U.S. Energy Information Administration (2012). Annual Energy Outlook 2013 Early Release. Table 1.
57 National Petroleum Council (2011). Prudent Development — Realizing the Potential of North America’s Abundant Natural Gas and Oil Resources. Chapter 1: Crude Oil and Natural Gas Resources and Supply. P. 53.
58 Wood Mackenzie Energy Consulting (2011). u.S. Supply Forecast and Potential Jobs and Economic Impacts (2012-2030). Prepared for American Petroleum Institute.
59 National Coal Council (2012). Harnessing Coal’s Carbon Content to Advance the Economy, Environment, and Energy Security.
60 U.S. Energy Information Administration (2011). International Energy Outlook 2011. P. 1.
61 Ibid., Figure 1 Data.
62 Ibid., P. 71.
63 Ibid., Table A2.
64 Ibid.
65 Citi GPS: Global Perspectives & Solutions (2012). Energy 2020: North America, the New Middle East?
66 U.S. Energy Information Administration (2012). “Energy in Brief: How Dependent Are We on Foreign Oil?”
67 U.S. Energy Information Administration (2012). “Today in Energy: U.S. Natural Gas Net Imports at Lowest Levels since 1992.” March 15, 2012.
68 U.S. Energy Information Administration (2012). Annual Energy Outlook 2013 Early Release. Table 13.
69 U.S. Energy Information Administration (2012). Annual Energy Review 2011. Table 5.1a; and U.S. Energy Information Administration (2012). Annual Energy Outlook 2013 Early Release. Table 11.
70 Federal Energy Regulatory Commission (2012). 2011 State of the Markets.
71 U.S. Energy Information Administration (2012). Annual Energy Outlook 2013 Early Release. Table 14.
72 U.S. Energy Information Administration (2012). “Frequently Asked Questions: How Much Natural Gas Does the United States Have and How Long Will It Last?” Last updated August 29, 2012. Available at http://www.eia.gov/tools/faqs/faq.cfm?id=58&t=8. Accessed on September 6, 2012.
73 Federal Energy Regulatory Commission (2012). 2011 State of the Markets.
74 National Petroleum Council (2011). Prudent Development: Realizing the Potential of North America’s Abundant Natural Gas and Oil Resources. Executive Summary. P. 8.
75 U.S. Energy Information Administration (2011). “Today in Energy: North Dakota’s Oil Production Has More than Quadrupled since 2005.” November 22, 2011.
76 U.S. Energy Information Administration (2012). “Today in Energy: U.S. Crude Oil Production in First Quarter of 2012 Highest in 14 Years.” June 8, 2012.
77 U.S. Energy Information Administration (2012). Annual Energy Outlook 2013 Early Release. Table 11; and U.S. Energy Information Administration (2012). Annual Energy Review 2011. Table 5.2.
78 International Energy Agency (2012). World Energy Outlook 2012. Executive Summary.
79 American Petroleum Institute (2012). Energizing America: Facts for Addressing Energy Policy. P. 33. Natural gas resources measured in barrels of oil equivalent.
80 U.S. Energy Information Administration (2012). International Energy Statistics. Petroleum Production.
Business Roundtable
62
81 Bureau of Ocean Energy Management (2012). “Gulf of Mexico Region: Annual Summary of Production for Entire Region.” U.S. Department of the Interior Minerals Management Service. Available at http://www.data.boem.gov/homepg/pubinfo/repcat/product/Region.asp. Accessed on December 11, 2012; and U.S. Energy Information Administration (2012). Annual Energy Outlook 2013 Early Release. Table 11.
82 The White House (2012). “Responsibly Expanding America’s Offshore Energy Development.” Available at http://www.whitehouse.gov/blog/2012/07/18/responsibly-expanding-america-s-offshore-energy-development. Accessed on December 11, 2012; and National Petroleum Council (2011). “Prudent Development Topic Paper #1-3: Offshore Oil and Gas Supply.” Prepared by the Offshore Supply Subgroup of the Resource & Supply Task Group.
83 Citi GPS: Global Perspectives & Solutions (2012). Energy 2020: North America, the New Middle East?
84 U.S. Energy Information Administration (2012). Annual Energy Outlook 2013 Early Release. P. 9.
85 Ibid., Table 11.
86 See, for example, ExxonMobil (2012). The Outlook for Energy: A View to 2040. 2013 Outlook; and BP, Inc. (2012). BP Energy Outlook 2030.
87 PricewaterhouseCoopers LLP (2011). Shale Gas: A Renaissance in u.S. Manufacturing?
88 Ibid.
89 American Chemistry Council (2011). Shale Gas and New Petrochemicals Investment: Benefits for the Economy, Jobs and uS Manufacturing.
90 Ibid.
91 CF Industries (2011). “CF Industries Holdings, Inc. Reports Record Quarterly Earnings and Announces Capital Deployment Actions.” Press Release. August 4, 2011.
92 Citi GPS: Global Perspectives & Solutions (2012). Energy 2020: North America, the New Middle East?
93 Ibid.
94 See, for example, U.S. Energy Information Administration (2012). Effect of Increased Natural Gas Exports on Domestic Energy Markets. Prepared for Office of Fossil Energy.
95 Federal Energy Regulatory Commission (2012). 2011 State of the Markets.
96 U.S. Energy Information Administration (2012). “Today in Energy: U.S. Petroleum Product Exports Exceeded Imports in 2011 for First Time in Over Six Decades.” March 7, 2012.
97 U.S. Energy Information Administration (2012). “Energy In Brief: What Is the Role of Coal in the United States?”
98 Combined cycle natural gas plants differ from simple cycle plants. Simple cycle plants have short start-up times but are very inefficient, so they are used primarily for peaking purposes. The more efficient combined cycle plants are used for baseload and intermediate-load generation and thus compete directly with coal and other baseload resources. See, for example, American Electric Power (n.d.). “Issues in Electricity: Gas-Fired Power.” Available at http://www.aep.com/about/IssuesAndPositions/Generation/Technologies/docs/NaturalGasTechnology.pdf. Accessed on September 17, 2012.
99 Federal Energy Regulatory Commission (2012). 2011 State of the Markets.
100 U.S. Court of Appeals for the District of Columbia Circuit (2012). “EME Homer City Generation, L.P., v. Environmental Protection Agency, et al.” Decided August 21, 2012. Available at http://www.cadc.uscourts.gov/internet/opinions.nsf/19346B280C78405C85257A61004DC0E5/ $file/11-1302-1390314.pdf. Accessed on August 29, 2012.
101 ICF International (2011). “Implications of New EPA Regulations on the Electric Power Industry.” Presentation to the Business Roundtable Sustainable Growth Listening Session. June 14, 2011.
102 U.S. Energy Information Administration (2011). International Energy Outlook 2011. P. 11.
103 Ibid.
104 Ibid., Figure 17 data.
105 Ibid., P. 78. Estimated increase of 80 percent is for the period 2009 through 2035.
106 Congressional Research Service (2012). “U.S. Crude Oil Production in Federal and Non-Federal Areas.”
107 Ibid.
108 U.S. Energy Information Administration (2012). Short Term Energy Outlook. November 2012. Table Builder. Crude Oil Production Federal Gulf of Mexico; and U.S. Energy Information Administration (2010). Annual Energy Outlook 2010. Table 113.
109 Broder, John M. and Clifford Krauss (2012). “New and Frozen Frontier Awaits Offshore Drilling.” The New York Times. May 23, 2012.
Taking Action on Energy: A CEO Vision for America’s Energy Future
63
110 Calculation based on Bureau of Energy Management (2012). “The Proposed Final 2012-2017 Outer Continental Shelf (OCS) Oil and Gas Leasing Program (PFP).” Available at http://www.boem.gov/Oil-and-Gas-Energy-Program/Leasing/Five-Year-Program/2012-2017/Five-Year-Program.aspx. Accessed on September 9, 2012; and U.S. Departments of the Interior, Agriculture, and Energy (2008). Inventory of Onshore Federal Oil and Natural Gas Resources and Restrictions to their Development. Phase III Inventory — Onshore United States. P. xxx.
111 Ibid., P. xxviii.
112 U.S. Energy Information Administration (2012). Annual Energy Outlook 2013 Early Release. Tables 11 and 13.
113 American Petroleum Institute (2012). 2012 Energy in Charts: Energy Industry Statistics. P. 38.
114 U.S. Environmental Protection Agency (2012). “Oil and Natural Gas Air Pollution Standards.” Available at http://www.epa.gov/airquality/oilandgas/. Accessed on December 11, 2012.
115 U.S. Environmental Protection Agency (2011). “EPA Announces Schedule to Develop Natural Gas Wastewater Standards / Announcement Is Part of Administration’s Priority to Ensure Natural Gas Development Continues Safely and Responsibly.” News Release. October 20, 2011.
116 U.S. Environmental Protection Agency (2012). “EPA Releases Update on Ongoing Hydraulic Fracturing Study.” Press Release. December 21, 2012. For a more complete list of EPA initiatives in this area, see also EPA (2012). “Natural Gas Extraction — Hydraulic Fracturing.”
117 Bureau of Land Management (2012). “Interior Releases Draft Rule Requiring Public Disclosure of Chemicals Used in Hydraulic Fracturing on Public and Indian Lands.” U.S. Department of Interior.
118 Business Roundtable (2012). “On Hydrofracking, Coordination”; and The White House (2012). “Supporting Safe and Responsible Development of Unconventional Domestic Natural Gas Resources.” Executive Order.
119 Business Roundtable (2012). “Permitting Jobs and Business Investment: Streamlining the Federal Permitting Process.” P. 1.
120 Comprehensive recommendations for reform can be found in two previous studies issued by Business Roundtable. See Business Roundtable (2011). “Toward Smarter Regulation”; and Business Roundtable (2012). “Permitting Jobs and Business Investment: Streamlining the Federal Permitting Process.”
121 U.S. Energy Information Administration (2012). Monthly Energy Review. November 2012. Table 1.3.
122 REN21 (2012). Renewables 2012: Global Status Report. P. 31.
123 U.S. Energy Information Administration (2012). “Energy in Brief: How Much of Our Electricity Is Generated from Renewable Energy?”
124 REN21 (2012). Renewables 2012: Global Status Report. P. 98.
125 U.S. Energy Information Administration (2012). Monthly Energy Review. November 2012. Table 7.2a.
126 U.S. Energy Information Administration (2012). “Energy in Brief: How Much of Our Electricity Is Generated from Renewable Energy?”
127 REN21 (2012). Renewables 2012: Global Status Report. P. 36.
128 U.S. Energy Information Administration (2012). Annual Energy Review 2011. Tables 10.3 and 10.4; and U.S. Energy Information Administration (2012). Annual Energy Outlook 2013 Early Release. Table 11.
129 U.S. Energy Information Administration (2012). Annual Energy Outlook 2013 Early Release. Table 16.
130 U.S. Energy Information Administration (2012). Annual Energy Outlook 2013 Early Release. Table 11.
131 Aanesen, K., S. Heck, and D. Pinner (2012). Solar Power: Darkest Before Dawn. McKinsey on Sustainability & Resource Productivity. P. 10.
132 Ibid., P. 2.
133 U.S. Energy Information Administration (2012). “Levelized Cost of New Generation Resources in the Annual Energy Outlook 2012.” Table 1.
134 Bolinger, Mark and Ryan Wiser (2011). understanding Trends in Wind Turbine Prices Over the Past Decade. Lawrence Berkeley National Laboratory. Report LBNL-5119E. P. 1.
135 Bloomberg New Energy Finance (2011). “Onshore Wind Energy to Reach Parity with Fossil-Fuel Electricity by 2016.” Press Release. November 10, 2011.
136 Ibid.; and Lantz, Eric, et al. (2012). IEA Wind Task 26: The Past and Future Cost of Wind Energy. National Renewable Energy Laboratory. P. 20.
137 U.S. Energy Information Administration (2012). Annual Energy Review 2011. Table 8.4a.
138 U.S. Energy Information Administration (2012). “Levelized Cost of New Generation Resources in the Annual Energy Outlook 2012.” Table 1.
139 U.S. Energy Information Administration (2011). “Direct Federal Financial Interventions and Subsidies in Energy in Fiscal Year 2010.” Table ES-2.
140 U.S. Energy Information Administration (2012). Annual Energy Outlook 2013 Early Release. Pp. 11–12.
Business Roundtable
64
141 In his 2011 State of the Union address, President Obama called for a national portfolio standard that would require 20 percent of the nation’s electricity to be produced using clean energy sources by 2035. However, as of 2012, Congress has not yet passed a bill that would establish such a standard.
142 U.S. Energy Information Administration (2012). “Today in Energy: Most States have Renewable Portfolio Standards.” February 3, 2012; and Center for Climate and Energy Solutions (2011). “Detailed Table of State Renewable & Alternative Energy Portfolio Standards.” Available at http://www.c2es.org/docUploads/state-rps-aeps-details.pdf. Accessed on June 6, 2012.
143 U.S. Energy Information Administration (2012). “State Renewable Electricity Profiles 2010”; and DSIRE (2012). “Quantitative RPS Data Project.”
144 Bipartisan Policy Center (2011). “Environmental Regulation and Electric System Reliability.” See also North American Electric Reliability Corporation (2011). 2011 Long-Term Reliability Assessment.
145 U.S. Energy Information Administration (2012). Annual Energy Outlook 2013 Early Release. Pp. 10–11. See also Federal Energy Regulatory Commission (2012). 2011 State of the Markets.
146 U.S. Energy Information Administration (2012). Annual Energy Outlook 2013 Early Release. P. 2.
147 Panetta, Leon (2012). “Secretary of Defense Leon E. Panetta Defense Budget Request — Written Submitted Statement Senate Appropriations Committee — Defense, Wednesday June 13, 2012.” P. 10. Available at http://www.appropriations.senate.gov/ht-defense.cfm?method=hearings.view&id=42acda0e-780c-4220-acbc-e0dd1fcbc7d3. Accessed on June 22, 2012.
148 Department of Defense (2011). Energy for the Warfighter: Operational Energy Strategy. Report to Congress.
149 White House (2012). “Fact Sheet: Obama Administration Announces Additional Steps to Increase Energy Security.” Available at http://www.whitehouse.gov/the-press-office/2012/04/11/fact-sheet-obama-administration-announces-additional-steps-increase-ener. Accessed on June 7, 2012.
150 As part of the January 2013 “fiscal cliff” negotiations, the wind production tax credit was extended for one year and is now set to expire at the end of 2013. See Colman, Zack (2013). “Wind Credit Extension Approved in ‘Fiscal Cliff’ Deal.” The Hill. January 2, 2013 .
151 U.S. Energy Information Administration (2009). “Tax Credits and Renewable Generation.” Annual Energy Outlook Analyses.
152 Sovacool, Benjamin (2009). “The Intermittency of Wind, Solar, and Renewable Electricity Generators: Technical Barrier or Rhetorical Excuse?” utilities Policy, Vol. 17. No. 3–4. Pp. 288–96.
153 Black and Veatch (2012). 2012 Strategic Directions in the u.S. Electric utility Industry. P. 46.
154 United Nations Environment Programme and Frankfurt School (2012). Global Trends in Renewable Energy Investment 2012. P. 30.
155 Business Wire (2012). “Large Build-Outs of HVDC Transmission Systems Will Help Integrate Renewable Energy on the Power Grid, According to Pike Research.” Press Release. October 29, 2012.
156 Massachusetts Institute of Technology (2011). The Future of the Electric Grid. Pp. 12–13.
157 E-ON Netz (2005). Wind Report 2005.
158 Watson, David S., et al. (2012). Fast Automated Demand Response to Enable the Integration of Renewable Resources. Ernest Orlando Lawrence Berkeley National Laboratory.
159 Honeywell (2012). “Honeywell and Hawaiian Electric to Use Demand Response to Integrate Renewables and Reduce Fossil Fuel Dependence.” Press Release. February 2, 2012. See also EnerNOC (2012). “Genesis Energy Selects EnerNOC for Inaugural Demand Response Programme.” Press Release. August 20, 2012.
160 Université Libre de Bruxelles (2010). Energy Storage Technologies for Wind Power Integration. BEAMS Department.
161 See, for example, McDonald, Robert, et al. (2009). “Energy Sprawl or Energy Efficiency: Climate Policy Impacts on Natural Habitat for the United States of America.” PLoS ONE. Vol. 4; and Outka, Uma (2011). “The Renewable Energy Footprint.” Stanford Environmental Law Journal. Vol. 30.
162 Cart, Julie (2012). “Saving Desert Tortoises is a Costly Hurdle for Solar Projects.” Los Angeles Times. March 4, 2012.
163 Drewitt, Allan and Rowena Langston (2006). “Assessing the Impact of Wind Farms on Birds.” International Journal of Avian Science. Vol. 148. Pp. 29–42.
164 Eilperin, Juliet (2010). “Massachusetts Wind Farm That Obama Administration Might Support Meets Strong Resistance.” The Washington Post. February 8, 2010.
165 U.S. Department of the Interior (2005). “Hydroelectric Power.” Bureau of Reclamation Power Resources Office.
166 Navigant Consulting (2009). “Job Creation Opportunities in Hydropower: Final Report.” Presented to National Hydropower Association.
167 U.S. Department of Energy (2012). Water Power for a Clean Energy Future. Wind and Water Power Program.
Taking Action on Energy: A CEO Vision for America’s Energy Future
65
168 U.S. Environmental Protection Agency (2012). “Renewable Fuel Standard (RFS).” Last updated November 28, 2012. Available at http://www.epa.gov/otaq/fuels/renewablefuels/index.htm. Accessed on December 11, 2012.
169 Schnepf, Randy and Brent D. Yacobucci (2012). “Renewable Fuel Standard (RFS): Overview and Issues.” Congressional Research Service.
170 Carriquiry, Miguel A., et al. (2010). Second-Generation Biofuels: Economics and Policies. The World Bank Development Research Group. Environment and Energy Team.
171 Environmental Entrepreneurs (2012). “Advanced Biofuel Market Report 2012: Meeting U.S. Fuel Standards.”
172 Business Wire (2012). “Ag Energy Coalition Asks House Leaders to Bring the Farm Bill to the Floor.” Press Release. September 19, 2012.
173 Environmental and Energy Study Institute (2011). “Fact Sheet: DoD’s Energy Efficiency and Renewable Energy Initiatives.” P. 2. Available at http://files.eesi.org/dod_eere_factsheet_072711.pdf. Accessed on June 4, 2012.
174 White House Press Office (2011). ”President Obama Announces Major Initiative to Spur Biofuels Industry and Enhance America’s Energy Security.” Press Release. August 16, 2011.
175 U.S. Environmental Protection Agency (2012). Annual Energy Outlook 2012. P. 97.
176 Harris, Andrew and Mark Drajem (2013). “EPA Cellulosic Biofuel Regulation Rejected by Court.” Bloomberg. January 25, 2013. The 8.65 million gallon mandate is actual volume, which equals 10.45 million gallons of ethanol equivalent volume.
177 Goodlatte, Bob and Jim Costa (2012). “Renewable Fuel Standard Flexibility Needed.” The Hill’s Congress Blog. September 20, 2012.
178 Bracmort, Kelsi (2011). “Meeting the Renewable Fuel Standard (RFS) Mandate for Cellulosic Biofuels: Questions and Answers.” Congressional Research Service.
179 CCH Group (2012). “Alcohol, Biodiesel, and Alternative Fuel Credits Expire; Extender Is Doubtful; Budget Worries and Policy Considerations Are Central Factors.” January 10, 2012.
180 Colman, Zack (2012). “Senate Extends Two Biofuels Tax Credits.” The Hill. August 3, 2012. See also Kotrba, Ron (2012). “Big News for Biodiesel.” Biodiesel Magazine. August 8, 2012.
181 See, for example, McDonald et al. (2009). “Energy Sprawl or Energy Efficiency: Climate Policy Impacts on Natural Habitat for the United States of America.”PLoS ONE. Vol. 4.
182 Searchinger, Timothy, et al. (2008). “Use of U.S. Croplands for Biofuels Increases Greenhouse Gases Through Emissions from Land-Use Change.” Science. Vol. 319.
183 American Petroleum Institute and Association of Oil Pipelines (2010). “Ethanol, Biofuels, and Pipeline Transport.”
184 Federal Register (2011). “Revising Underground Storage Tank Regulations—Revisions to Existing Requirements and New Requirements for Secondary Containment and Operator Training; Proposed Rule.” Vol. 76. No. 223. P. 71739.
185 Larry Gregory Consulting LLC (2012). A Comprehensive Analysis of Current Research on E15 Dispensing Component Compatibility. Prepared for American Petroleum Institute. P. 2.
186 U.S. Department of Energy (2012). “Drop-In Biofuels.” Alternative Fuels Data Center. Available at http://www.afdc.energy.gov/fuels/emerging_dropin_biofuels.html. Accessed on October 15, 2012.
187 The Coordinated Research Council recently published the results of an analysis of mid-level ethanol blends on engine durability. See CRC (2012). “Summary of CRC Research Program on Intermediate Ethanol Blends.”
188 U.S. Energy Information Administration (2012). Annual Energy Outlook. P. 97.
189 Ibid.
190 U.S. Department of Energy (2012). “Drop-In Biofuels.” Alternative Fuels Data Center. Available at http://www.afdc.energy.gov/fuels/emerging_dropin_biofuels.html. Accessed on October 15, 2012.
191 Carriquiry, Miguel A., et al. (2010). Second-Generation Biofuels: Economics and Policies. The World Bank Development Research Group. Environment and Energy Team.
192 International Energy Agency (2011). Technology Roadmap: Biofuels for Transport. P. 31.
193 ICF Consulting (2004). “The Economic Cost of the Blackout: An Issue Paper on the Northeastern Blackout, August 14, 2003.”
194 Kiuchi, Takahide and Ryota Takemoto (2011). “Rolling Power Cuts to Hit Japan’s Economy.” Nomura Securities Co., Ltd., Tokyo Economic Research. Available at http://www.institutionalinvestorchina.com/arfy/uploads/soft/110324/1_0759422801.pdf. Accessed on August 8, 2012.
195 Chupka, Marc W., et al. (2008). Transforming America’s Power Industry: The Investment Challenge 2010-2030. The Brattle Group. Prepared for the Edison Foundation. P. vi.
Business Roundtable
66
196 U.S. Energy Information Administration (2010). Annual Energy Outlook 2010. “Electricity Demand.” P. 65.
197 Ibid.
198 U.S. Energy Information Administration (2012). Annual Energy Outlook 2013 Early Release. Table 8.
199 Pietsch, Paul (2012). “Demand Response & Smart Grid—State Legislative and Regulatory Policy Action Review: July 2011 – May 2012.” Association for Demand Response and Smart Grid.
200 Federal Register (2011). “Federal Implementation Plans: Interstate Transport of Fine Particulate Matter and Ozone and Correction of SIP Approvals; Final Rule.” Vol. 76. No. 152.
201 U.S. Court of Appeals for the District of Columbia Circuit (2012). “EME Homer City Generation, L.P., v. Environmental Protection Agency, et al.” No. 11-1302. Decided August 21, 2012.
202 Federal Register (2012). “National Emissions Standards for Hazardous Air Pollutants from Coal and Oil Fired Electric Utility Steam Generating Units and Standards of Performance for Fossil-Fuel-Fired Electric Utility, Industrial-Commercial-Institutional, and Small Industrial-Commercial-Institutional Steam Generating Units.” Vol. 77. No. 32; and Environmental Protection Agency (2012). “National Ambient Air Quality Standards for Particulate Matter.” Available at http://www.epa.gov/pm/2012/finalrule.pdf. Accessed on December 31, 2012.
203 U.S. Environmental Protection Agency (2012). “Cooling Water Intake Structures — CWA § 316(b).” Available at http://water.epa.gov/lawsregs/lawsguidance/cwa/316b/. Accessed on July 18, 2012.
204 U.S. Environmental Protection Agency (2012). “Coal Combustion Residuals — Proposed Rule.” Available at http://www.epa.gov/wastes/nonhaz/industrial/special/fossil/ccr-rule/.
205 U.S. Energy Information Administration (2011). “Electricity Generating Capacity.” Last updated August 18, 2011.
206 Institute for Energy Research (2012). “Impact of EPA’s Regulatory Assault on Power Plants: New Regulations to Take 34 GW of Electricity Generation Offline and the Plant Closing Announcements Keep Coming…”; and North American Electric Reliability Corporation (2011). Potential Impacts of Future Environmental Regulations. P. 116.
207 North American Electric Reliability Corporation (2011). 2011 Long-Term Reliability Assessment.
208 U.S. Energy Information Administration (2012). Annual Energy Outlook 2013 Early Release. Table 8; and U.S. Energy Information Administration (2012). “Levelized Cost of New Generation Resources in the Annual Energy Outlook 2012.” Table 1.
209 Nuclear Energy Institute (2012). “State Nuclear Facts.” Available at http://www.nei.org/publicpolicy/stateactivities/statenuclearfacts/. Accessed on September 5, 2012.
210 Nuclear Regulatory Commission (2011). “U.S. and Worldwide Nuclear Energy.” Table 3. Available at www.nrc.gov/reading-rm/doc-collections/nuregs/staff/sr1350/v23/sr1350v23-sec-2.pdf. Accessed on September 5, 2012.
211 U.S. Court of Appeals for the District of Columbia Circuit (2012). “In Re: Aiken County, et al., Petitioners.” No. 11-1271. Filed August 3, 2012.
212 U.S. Court of Appeals for the District of Columbia Circuit (2012). “National Association of Regulatory Utility Commissioners v. United States Department of Energy.” No. 11-1066. Decided June 1, 2012.
213 North American Electric Reliability Corporation (2011). Potential Impacts of Future Environmental Regulations.
214 Kaplan, Stan (2008). “Power Plants: Characteristics and Costs.” Congressional Research Service. P. 4.
215 Ibid.
216 National Energy Technology Laboratory (2010). “Cost and Performance Baseline for Fossil Energy Plants; Volume 1: Bituminous Coal and Natural Gas to Electricity.”
217 U.S. Energy Information Administration (2012). “Today in Energy: Monthly Coal- and Natural Gas-Fired Generation Equal for First Time in April 2012.” July 6, 2012.
218 U.S. Energy Information Administration (2012). “Today in Energy: Most Electric Generating Capacity Additions in the Last Decade Were Natural Gas Fired.” July 5, 2012.
219 U.S. Environmental Protection Agency (2012). “Inventory of U.S. Greenhouse Gas Emissions and Sinks: 1990–2010.” Executive Summary. Table ES-2.
220 Ibid., Figure ES-5.
221 U.S. Environmental Protection Agency (2012). “Carbon Pollution Standard for New Power Plants.” Available at http://www.epa.gov/carbonpollutionstandard/. Accessed on July 18, 2012.
222 U.S. Environmental Protection Agency (2012). “Regulatory Impact Analysis for the Proposed Standards of Performance for Greenhouse Gas Emissions for New Stationary Sources: Electric Utility Generating Units.” Pp. ES 2–ES 3.
Taking Action on Energy: A CEO Vision for America’s Energy Future
67
223 U.S. Environmental Protection Agency (2012). “Standards of Performance for Greenhouse Gas Emissions for New Stationary Sources: Electric Utility Generating Units.” P. 34. Available at http://epa.gov/carbonpollutionstandards/pdfs/20120327proposal.pdf. Accessed on July 18, 2012.
224 Federal Register (2012). “Standards of Performance for Greenhouse Gas Emissions for New Stationary Sources; Electric Utility Generating Units; Proposed Rule.” Vol. 77. No. 72. P. 22427.
225 Wald, Matthew (2012). “Court Backs EPA Over Emissions Limits Intended to Reduce Global Warming.” The New York Times. June 26, 2012.
226 U.S. Energy Information Administration (2012). “Energy in Brief: What Is the Role of Coal in the United States?”
227 U.S. Energy Information Administration (2012). “State Profiles and Energy Estimates.” Table C9. Electric Power Sector Consumption Estimates, 2010.
228 Massachusetts Institute of Technology (2007). The Future of Coal. P. x.
229 National Coal Council (2012). Harnessing Coal’s Carbon Content to Advance the Economy, Environment and Energy Security.
230 Rahim, Saquib (2012). “Could Oil Recovery Create a Market for Carbon Capture?” Energy Wire. September 24, 2012.
231 Massachusetts Institute of Technology (2011). The Future of the Electric Grid. P. xi.
232 U.S. Energy Information Administration (2012). “U.S. Natural Gas Electric Power Price.” Last updated November 30, 2012.
233 U.S. Energy Information Administration (2012). “NYMEX Central Appalachian Coal Futures Near-Month Contract Final Settlement Price History.”
234 Platts (2012). “Exporting LNG Would Increase Prices, Impair U.S. Energy Independence: APGA.” September 12, 2012.
235 Johnson, Tom (2012). “Steep Ratepayer Subsidies for New Plants Could Spike Power Prices.” Energy & Environment. May 30, 2012.
236 WIRES and The Brattle Group (2011). “Employment and Economic Benefits of Transmission Infrastructure Investment in the U.S. and Canada.” Figure 2.
237 Ibid. See also Chupka, Marc W., et al. (2008). Transforming America’s Power Industry: The Investment Challenge 2010-2030. The Brattle Group. Prepared for the Edison Foundation. P. 37.
238 Federal Energy Regulatory Commission (2011). “Transmission Planning and Cost Allocation by Transmission Owning and Operating Public Utilities.” Order No. 1000. Pp. 1–2.
239 Ibid., P. 14.
240 Ibid., P. 170.
241 Massachusetts Institute of Technology (2011). The Future of the Electric Grid. P. xi.
242 U.S. Government Printing Office (2007). “Energy Independence and Security Act of 2007.” Public Law 110-140.
243 U.S. Government Printing Office (2009). “American Recovery and Reinvestment Act of 2009.” Public Law 111-5.
244 U.S. Department of Energy (2012). “American Recovery and Reinvestment Act of 2009 Smart Grid Investment Grant Program Progress Report.” P. ii. http://energy.gov/sites/prod/files/Smart%20Grid%20Investment%20Grant%20Program%20-%20Progress%20Report%20July%202012.pdf. Accessed on September 5, 2012.
245 Ventyx (2012). Model-Based volt/VAR Optimization: An Introduction. Whitepaper. P. 3.
246 U.S. Government Printing Office (2005). “Energy Policy Act of 2005.” Public Law 109-58.
247 U.S. Court of Appeals for the Fourth Circuit (2009). “Piedmont Environmental Council v. FERC.” No. 07-1651; and U.S. Court of Appeals for the Ninth Circuit (2011). “California Wilderness Coalition v. U.S. Department of Energy.” 631 F.3d 1072.
248 Federal Energy Regulatory Commission (2007). “Preventing Undue Discrimination and Preference in Transmission Service.” Order No. 890.
249 Federal Energy Regulatory Commission (2011). “Transmission Planning and Cost Allocation by Transmission Owning and Operating Public Utilities.” Order No. 1000.
250 U.S. Department of Energy (2012). “RPS Data.” Database of State Incentives for Renewables & Efficiency. Available at http://www.dsireusa.org/rpsdata/index.cfm. Accessed on December 11, 2012.
251 For an excellent discussion on the challenges facing the electric grid, including integration of intermittent resources, see Massachusetts Institute of Technology (2011). The Future of the Electric Grid. Chapter 3.
252 Department of Energy (2008). 20% Wind Energy by 2030: Increasing Wind Energy’s Contribution to u.S. Electricity Supply.
253 B&W and eSolar (2011). “Modular and Scalable Baseload CSP Molten Salt Plant and Conceptual Design and Feasibility Study.”
254 White House (2009). “Cyberspace Policy Review: Assuring a Trusted and Resilient Information and Communications Infrastructure.” P. 1.

Business Roundtable
68
255 Ibid.
256 See, for example, National Association of Regulatory Utility Commissioners (2012). “Cybersecurity for State Regulators.” P. 3.
257 Cauley, Gerry (2011). Testimony before the House Energy and Commerce Committee Subcommittee on Energy and Power. May 31, 2011. P. 3. Available at http://democrats.energycommerce.house.gov/sites/default/files/image_uploads/Testimony_Hearing_EP_05.31.11_Cauley.pdf. Accessed on September 5, 2012.
258 Ibid., P. 2.
259 See, for example, Consumers Against Rate Hikes (2012). “Issues: Annual Rate Hikes.” Available at http://www.consumersagainstratehikes.org/issues/. Accessed on September 11, 2012.
260 Loder, Asjylyn (2012). “America’s Energy Seen Adding 3.6 Million Jobs Along with 3% GDP.” Bloomberg. August 13, 2012; and PricewaterhouseCoopers LLP (2011). Shale Gas: A Renaissance in u.S. Manufacturing?


300 New Jersey Avenue, NW
Suite 800
Washington, DC 20001
Telephone 202.872.1260
Facsimile 202.466.3509
Website brt.orgPrinted on recycled paper