Embed Size (px)
Citation preview
Psychology in the Schools, Vol. 50(7), 2013 C© 2013 Wiley Periodicals, Inc.View this article online at wileyonlinelibrary.com/journal/pits DOI: 10.1002/pits.21699
TAKING A “SIMPLE VIEW” OF THE DYNAMIC INDICATORS OF BASIC EARLYLITERACY SKILLS AS A PREDICTOR OF MULTIPLE MEASURES OF THIRD-GRADE
READING COMPREHENSION
KRISTEN A. MUNGER
SUNY Oswego, Syracuse University
BENITA A. BLACHMAN
Syracuse University
The purpose of this study was to examine the validity evidence of first-grade Dynamic Indicatorsof Basic Early Literacy Skills (DIBELS) scores for predicting third-grade reading comprehensionscores. We used the “simple view” of reading as the theoretical foundation for examining theextent to which DIBELS subtest scores predict comprehension through both word recognitionand language comprehension. Scores from the DIBELS Oral Reading Fluency (ORF) subtest,a measure of word recognition speed and accuracy, strongly and significantly predicted multi-ple measures of reading comprehension. No other DIBELS subtest score explained additionalvariance beyond DIBELS ORF. Although experimental DIBELS Word Use Fluency (WUF) wassignificantly correlated with a language comprehension measure and measures of reading compre-hension, WUF scores did not predict reading comprehension beyond ORF scores. Alternatively,first-grade Peabody Picture Vocabulary Test scores did predict additional, significant variance inreading comprehension, beyond DIBELS ORF. C© 2013 Wiley Periodicals, Inc.
There has been enormous effort exerted to improve reading achievement of students acrossthe nation. To reach this goal, research has demonstrated that delivering high-quality instruction tochildren very early in their school careers has the potential to prevent negative long-term conse-quences from reading failure (Adams, 1990; Blachman et al., 2004; Snow, Burns, & Griffin, 1998).Delaying intervention consistently decreases the probability that lower-achieving students can catchup to their peers, making it critical that children who may experience difficulties learning to readbe identified as early as possible (Torgesen, 2005). For these and other reasons, the use of earlyliteracy assessments has increased considerably and, at the same time, has generated considerablecontroversy.
Controversy especially erupted when the universal screening of children’s early literacy skillsbecame a requirement under the No Child Left Behind Act (2001) for schools receiving ReadingFirst grant money. This is when the universal early literacy assessment, the Dynamic Indicatorsof Basic Early Literacy Skills (DIBELS; Good & Kaminski, 2002), became most popular. Morerecently, as the result of the reauthorization of Individuals with Disabilities Education ImprovementAct in 2004, Response to Intervention (RTI) began to influence schools. RTI can be thought of as aconceptual framework that guides schools in providing students with progressively greater supports,depending on their response to evidence-based instruction and interventions (Gresham, Reschly, &Shinn, 2010). Practices associated with RTI, including universal literacy assessment, amplified thepopularity of the DIBELS despite growing concerns that there was insufficient validity evidence tojustify its widespread use (Manzo, 2005).
This research was supported by a grant from the Syracuse University School of Education Research and CreativeGrant Committee. Appreciation is expressed to the educators, students, and their families for participating in thisresearch, as well as Dr. James Bellini and Dr. Rachel Brown for their support in the project.
Correspondence to: Kristen A. Munger, Counseling and Psychological Services Department, SUNY Oswego,321 Mahar Hall, Oswego, NY 13126. E-mail: [email protected]
722
Taking a “Simple View” 723
DIBELS remains a popular tool used in elementary schools across the country; however,there continue to be important aspects of DIBELS that have remained largely uninvestigated. Forexample, although there has been an accumulation of validity evidence for DIBELS scores as apredictor of group-administered tests (e.g., TerraNova, Stanford Achievement Test, various statetests; see, e.g., Baker et al., 2008; Riedel, 2007; Roehrig, Petscher, Nettles, Hudson, & Torgesen,2008), the ability of DIBELS to predict individually administered diagnostic tests is limited. Thefact that individually administered diagnostic tests (as opposed to group tests) are the tests requiredfor use in the identification of students with educational disabilities makes the investigation ofDIBELS’ ability to predict performance on such tests especially important. Even with regard to theprediction of group-administered tests, there are areas where we lack data. For example, no studyhas investigated the ability of first-grade DIBELS to predict the third-grade New York State EnglishLanguage Arts Test (NYSELA3), a test that is mandated for all third graders in the state.
The main purpose of the present study was to explore more fully the predictive validity evidenceof first-grade DIBELS (6th edition) subtest scores in relation to third-grade reading comprehension.To provide a theoretical context for understanding reading comprehension, the “simple view” ofreading (Gough & Tunmer, 1986) was adopted, which proposes that reading comprehension isrooted in both successful word recognition and the ability to comprehend spoken language. Inthe present study, scores from first-grade DIBELS subtests were used to predict scores on threedifferent measures of third-grade reading comprehension: (1) the comprehension subtest of anindividually administered diagnostic test (Wechsler Individual Achievement Test–Second Edition[WIAT-II]; Psychological Corporation, 2001); (2) a group-administered reading test (Group ReadingAssessment and Diagnostic Evaluation [GRADE]; Williams, 2001); and (3) the third-grade statetest in New York (NYSELA3; New York State Education Department, 2009). Because much of thecontroversy surrounding DIBELS is over the extent to which any of the subtests directly measuremeaning, the research also explored the relationships among an experimental first-grade DIBELSsubtest, Word Use Fluency (WUF), and other measures of meaning, including the well-researchedPeabody Picture Vocabulary Test–Third Edition (PPVT-III; Dunn & Dunn, 1997) and the threethird-grade measures of reading comprehension.
It should be noted that for young children, DIBELS includes subtests that are purported tomeasure phonemic awareness (an understanding that spoken words are composed of individualsounds, along with the ability to manipulate these sounds; Blachman, 2000), as well as letter nameand sound knowledge, all of which are related to accurate reading decoding. The coordinationof these beginning reading skills facilitates the development of fluent oral reading of connectedtext (National Institute of Child Health and Human Development, 2000; Torgesen, Rashotte, &Alexander, 2001), a skill also measured by DIBELS. Of all of the DIBELS subtests, Oral ReadingFluency (ORF) is the most well researched. Its format corresponds most closely to the traditionalprocedures used in Curriculum-Based Measurement (CBM; Deno, 1986). CBM typically consistsof a series of short (i.e., 1-minute) timed reading tasks. These tasks are useful for determining whichstudents may need more intensive instruction and for monitoring their response to the instructionthey receive (Fuchs & Fuchs, 2006). As noted by one of our reviewers, because DIBELS is based inthe tradition of CBM, research on CBM can be generalized to DIBELS to a certain extent.
PREDICTIVE VALIDITY OF DIBELS
In a recent review of the available validity evidence of the required (i.e., not experimental)DIBELS subtests, Goffreda and DiPerna (2010) found that there was strong and consistent validityevidence, reporting a median predictive validity coefficient of .68 for DIBELS ORF scores for partic-ipants from first to fourth grades. Other DIBELS subtest scores, however, including Letter NamingFluency (LNF), Phoneme Segmentation Fluency (PSF), and Nonsense Word Fluency (NWF), lacked
Psychology in the Schools DOI: 10.1002/pits
724 Munger and Blachman
sufficient validity evidence. Although LNF demonstrated evidence of concurrent validity, too fewstudies included LNF scores as a predictor to draw definitive conclusions regarding its predictivevalidity.
Several additional studies, not reviewed by Goffreda and DiPerna, supported their findingsof sufficient predictive validity evidence for DIBELS ORF scores. For example, research by Kim,Petscher, Schatschneider, and Foorman (2010) found that growth in DIBELS ORF was the strongestpredictor of third-grade reading comprehension scores on the Stanford Achievement Test-10(SAT-10). Johnson, Jenkins, Petscher, and Catts (2009) found significant correlations betweenfirst-grade DIBELS ORF and the third-grade Florida state test (FCAT; r = .55), whereas Gof-freda, DiPerna, and Pedersen (2009) reported a strikingly similar correlation between first-gradeDIBELS ORF and the third-grade Pennsylvania state test (PSSA; r = .54). Wanzek et al. (2010)also found significant correlations among end-of-first-grade DIBELS ORF scores and two measuresof third-grade comprehension, including the SAT-10 (r = .64) and Texas Assessment of Knowledgeand Skills (r = .44). Thus, a consensus has emerged that, with regard to the prediction of group-administered tests, end-of-first-grade DIBELS ORF scores appear to have the strongest validityevidence.
THEORETICAL FOUNDATIONS OF READING COMPREHENSION
Although a number of studies provide predictive validity data on DIBELS scores, the studies,in general, are not grounded in theoretical models of reading. Although it is advantageous to knowthe extent to which DIBELS scores predict various measures of reading comprehension from anempirical standpoint, it is also useful to anchor validity research within a clear theoretical base.Research related to the measurement of reading comprehension does not necessarily draw from aclear theoretical base, and the Rand Reading Study Group (2002) points out that “none of the currentlyavailable comprehension assessments is based in a viable or articulated theory of comprehension”(p. 53).
In an effort to provide a theoretical foundation for the present research, the prediction of readingcomprehension is examined in reference to Gough and Tunmer’s (1986) simple view of reading.The simple view proposes that reading comprehension comprises both successful word recognitionand the ability to comprehend spoken language, and this theoretical structure has been supportedempirically by early studies (Hoover & Gough, 1990; Stanovich, Cunningham, & Freeman, 1984),as well as more recent studies (Catts, Hogan, & Adlof, 2005; Kendeou, van den Broek, White, &Lynch, 2009).
DIBELS has been criticized for exploiting one aspect of reading relevant to the simple view,word recognition, to the exclusion of the other aspect, language comprehension. This has beena persistent concern for a number of literacy researchers (Goodman, 2006; Pressley, Hilden, &Shankland, 2005; Samuels, 2007; Schilling, Carlisle, Scott, & Zeng, 2007), who question the validityof DIBELS as a measure of early literacy skills, given this lack of representation of language-basedaspects of reading. Although the authors of DIBELS have attempted to include subtests intendedto measure meaning (i.e., WUF and Retell Fluency [RTF]), these measures are optional, and thereis no clear evidence to date to support the validity of these subtest scores in measuring meaning(Burke & Hagen-Burke, 2007; Pressley et al., 2005). To explore the role of the optional DIBELSsubtests in measuring different aspects of reading, the present research included investigation intothe relationships among first-grade DIBELS WUF and other measures of meaning (i.e., first-gradePPVT-III and third-grade reading comprehension), as well as the extent to which DIBELS WUFaccounts for aspects of reading comprehension beyond what is accounted for by other DIBELSsubtests that involve word recognition speed and accuracy (e.g., DIBELS ORF).
Psychology in the Schools DOI: 10.1002/pits
Taking a “Simple View” 725
MEASUREMENT OF READING COMPREHENSION
As noted earlier, the validity evidence available for the prediction of reading comprehension byDIBELS scores almost exclusively involves the use of commercially available group-administeredtests. Consequently, most of what we know is predicated on how these group tests represent readingcomprehension (e.g., silent reading of passages and responding to multiple-choice items). To morethoroughly operationalize reading comprehension in the present study, multiple measures of readingcomprehension were used. The measures included an individually administered diagnostic test thatpermits students to read aloud and answer open-ended questions. A group administered readingcomprehension measure (GRADE) was also used, with a format similar to other silent readingmultiple-choice tests used in reading comprehension research (e.g., Terra Nova, SAT-10). The statetest for New York (NYSELA3) was also included, because relationships among first-grade DIBELSscores and the NYSELA3 scores have not yet been investigated.
The decision to represent reading comprehension broadly by using more than one measure issupported by Cutting and Scarborough (2006) and Keenan, Betjemann, and Olson (2008), who foundthat the relative contribution of word reading and language comprehension to reading comprehensionwas heavily dependent on the characteristics of the reading comprehension measures used. Byincluding multiple measures that require a diversity of response styles by students, the differences inthe contributions of word reading and language-based aspects of reading can be better understood.
RESEARCH QUESTIONS AND HYPOTHESES
In this study, we investigated the following research questions. First, we examined the extentto which required first-grade DIBELS subtest scores predicted three third-grade measures of read-ing comprehension. Based on the strong predictive validity evidence for DIBELS ORF found inthe literature, we hypothesized that none of the other required first-grade DIBELS subtest scoreswould explain additional significant variance in third-grade reading comprehension, beyond that ex-plained by DIBELS ORF. Next, we explored the relationships among scores from the experimentalDIBELS WUF subtest, the well-researched PPVT-III, and the three measures of third-grade readingcomprehension. We also investigated the extent to which DIBELS WUF and PPVT-III predictedreading comprehension, beyond other first-grade DIBELS scores. Informed by the simple view ofreading, we hypothesized that first-grade vocabulary scores would explain variance in third-gradereading comprehension not explained by ORF, but that this prediction would hold true only for thewell-researched PPVT and not the experimental DIBELS WUF.
METHOD
Participants and Setting
The initial sample, from whom first-grade DIBELS and PPVT-III data were collected in thespring of 2007, consisted of 47 students from each of three first-grade classrooms in a small,urban elementary school located in the Northeastern United States. The school was not receivingReading First funding; therefore, the use of DIBELS, along with decisions regarding instruction andintervention, were made by the local district. The children who participated in first-grade testingwere all 6 or 7 years old (median age = 6.9 years). Two children diagnosed with autism were notincluded because of their inability to participate in the assessments. Twelve students moved betweenfirst and third grades, leaving a participant sample of 35 (median age = 8.9 years).
The third-grade participant sample consisted of students who were identified as 51% AfricanAmerican, 26% White, 11% Asian, 9% Hispanic/Latino, and 3% Indian. Seventeen percent of thestudents spoke a language other than English in their homes, and 25% were identified as having an
Psychology in the Schools DOI: 10.1002/pits
726 Munger and Blachman
educational disability. Children’s families were in predominantly lower- to middle-income groups,with 73% receiving free or reduced-price lunch at the time of third-grade testing.
Procedures
In first grade, all children were administered the PPVT-III, as well as five subtests from theDIBELS. For the PPVT-III, children were asked to match pictures with a word spoken by the tester,and for the first-grade DIBELS battery, they were asked to perform tasks such as naming letters,saying sounds in spoken words, reading passages, and using words in sentences, with each tasklasting 1 minute. No measures of reading comprehension were administered in first grade.
For the third-grade test battery, the same students who participated in first-grade testing wereadministered three tests of reading comprehension. Students’ scores were obtained from the group-administered third-grade NYSELA3. Classroom teachers, along with designated proctors, adminis-tered the NYSELA in January 2009. During a second testing session in May, the WIAT-II ReadingComprehension subtest was administered, and during a third testing session in June, the GRADEwas administered. The three testers who administered the end-of-year first- and third-grade testingbatteries were educators from the elementary school the children attended and had at least 10 yearsof teaching and testing experience.
Testers were provided with 20 hours of training and practice by the first author in administeringand scoring first-grade and third-grade tests, with the exception of the NYSELA3, which wasadministered by classroom teachers. Testers were specifically trained in how to correctly administerand score each test and were required to administer them to the first author with no errors beforethey were permitted to test in the field. They were provided oral and written feedback regardingtheir performance and were observed by the researcher while testing students to ensure the properadministration and scoring of the instruments. A total of eight (17% of the sample) reliabilityobservations were conducted for the first-grade DIBELS battery, and seven (20% of the sample)were conducted for the third-grade individually administered diagnostic reading comprehensionmeasure. Consistency in the testers’ administration and scoring of the batteries, based on Pearsoncorrelations, were all .99 or higher, with the exception of DIBELS PSF (r = .89). The administrationof the GRADE was conducted by one of the testers, and adherence to standardized testing procedureswas found to be adequate, as determined by feedback provided on observation forms completed bya trained observer.
Measures
First-Grade Study Measures. In first grade, five DIBELS subtests were administered, alongwith the PPVT-III, each of which is described in the following sections. It should be noted that, intheir review of the psychometric evidence of DIBELS, Goffreda and DiPerna (2010) found that test–retest reliability and inter-rater reliability indices for the various DIBELS subtests were adequate(r = .82 to .94).
Letter Naming Fluency. The DIBELS LNF subtest required students to name as many lettersas they could from a card featuring an array of all 26 uppercase and lowercase letters in mixed-uporder. DIBELS LNF is typically administered to beginning-first-grade students, but not to end-of-first-grade students. It was decided to administer DIBELS LNF (using beginning-of-year benchmarkprobes) to the end-of-first-grade students in this study because teachers reported that at the end offirst grade, many of these students still did not know all of their letter names. DIBELS LNF rawscores reflect the number of letters named correctly within 60 seconds.
Psychology in the Schools DOI: 10.1002/pits
Taking a “Simple View” 727
Phoneme Segmentation Fluency. The DIBELS PSF subtest required children to listen to aword spoken by the tester, after which the child was instructed to break the word apart (i.e., segmentit) into the separate sounds. Students received points for each sound segment correctly produced.Raw scores reflect the total number of sounds correctly segmented in 60 seconds.
Nonsense Word Fluency. The DIBELS NWF subtest required students to say the sounds intwo- and three-letter printed words. Students were credited for correct sounds that they said inisolation or that they blended. The raw score is the total number of correct phonemes spoken foreach nonsense word within 60 seconds.
Oral Reading Fluency. The DIBELS ORF subtest was administered to measure students’automatic reading of words within the context of the three benchmark reading passages that areadministered at the end of first grade. Students have 60 seconds to read each passage. Each passageconsists of several paragraphs leveled to represent an approximate grade level at which studentsare placed. The highest and lowest passage scores are disregarded per subtest directions, and theraw score for this subtest is the number of words children read correctly within 60 seconds for thepassage with the middle (median) score.
Word Use Fluency. The DIBELS WUF is an experimental subtest that was administered tothe students when they were in first grade, using first grade end-of-year benchmark probes. Toadminister WUF, the tester says a word, such as “frog,” and the student is required to use the wordin a sentence. Scoring is based on the total number of words that students use in the sentenceor phrase in 60 seconds. The subtest does not have cut-off points for risk status determinationbecause there is insufficient research linking it to other aspects of reading (Good & Kaminski,2002). Although WUF is considered optional, it was included in the first-grade testing battery toaddress the research questions regarding the relationship between WUF scores and scores from othermeasures of language comprehension (e.g., vocabulary) and reading comprehension. Schilling et al.(2007) investigated the technical adequacy of this subtest and found that when examined in referenceto the Illinois Test of Basic Skills (ITBS) reading subtests, WUF was only weakly correlated with theITBS and was especially weak when correlated with ITBS Vocabulary. However, Munger (2007) didfind a statistically significant relationship (r = .59) between first-grade WUF scores and scores on awell-researched measure of vocabulary, the PPVT-III (also see Tannenbaum, Torgesen, & Wagner,2006).
Vocabulary. Students’ word knowledge was measured using the PPVT-III Form B (Dunn &Dunn, 1997). The PPVT-III is an untimed test that measures children’s receptive (i.e., understanding)vocabulary. Children point to one of four pictures that matches a word spoken by the tester. Criterionvalidity is well established for the PPVT-III, and this test has compared favorably to other measuresof cognitive and language development. For example, it has been found to be very strongly correlated(r = .92) with the verbal scale of the Wechsler Intelligence Scale for Children–Third Edition (seeDunn & Dunn, 1997). The Cronbach’s alpha for the PPVT-III for the present sample was .97.
Third-Grade Reading Comprehension Measures. In third grade, three measures of readingcomprehension were administered.
Individual Reading Comprehension Test. The first reading comprehension measure includedin the study was the WIAT-II: Reading Comprehension subtest (Psychological Corporation, 2001).This individually administered subtest takes approximately 20 minutes for third-grade students tocomplete. Students were asked to read sets of sentences or passages either aloud or silently andthen orally provide answers to questions asked by the tester. Split-half, test–retest, and inter-rater
Psychology in the Schools DOI: 10.1002/pits
728 Munger and Blachman
reliability estimates for this subtest all exceed .90 at primary grade levels (Psychological Corporation,2001).
Commercially Available Group Reading Comprehension Test. The second reading compre-hension measure used in the study was the GRADE (Level 3, Form A Spring; Reading Comprehen-sion), which included both untimed Sentence Comprehension and Passage Comprehension subtests.The administration of the two subtests of the GRADE involves students reading either sentencesor brief passages silently and then answering multiple-choice items. The Sentence Comprehensionsection includes items such as the following: “It’s time to leave, so find your jacket.” Studentschoose a word from the following options to complete the sentence: a) watch; b) hurry; c) dinner;d) almost.
The Passage Comprehension Section is similar except students read short passages ratherthan sentences, and the multiple-choice items are not blanks to be filled in but are possible an-swers to test questions. The internal consistency coefficient for Form A Spring, Level 3 SentenceComprehension is .83, Passage Comprehension is .83, and the Comprehension composite is .94(Williams, 2001). Level 3 GRADE scores have been found to be well correlated with other group-administered reading achievement tests, including the Gates-MacGinitie Reading Tests (r = .86;Williams, 2001). For students with educational disabilities with Individualized Education Plans,test modifications/accommodations were permitted on the GRADE. Specifically, students were ableto take the test in a distraction-reduced environment/separate location. Consistent with GRADEadministration procedures, testers read directions and sample items to all students; however, no testpassages or test items were read to any students, including students with educational disabilities.
State-Constructed Reading Comprehension Test. The third reading comprehension measureused in the study was the third-grade NYSELA3. This is a mandated assessment for all third-gradestudents attending public schools in New York State. For the reading comprehension section ofthe NYSELA3, students read passages silently and answer multiple-choice questions, along witha single, open-ended question to convey their understanding of what they read. For the listeningcomprehension and writing sections of the NYSELA3, students listen to passages read aloud bythe tester and then write their answers to open-ended response questions. For the writing section,students edit short paragraphs by correcting capitalization and punctuation errors. Total NYSELA3scaled scores were used.
RESULTS
Preliminary Analysis
Data were initially examined for missing values, distributional characteristics, and their de-scriptive statistics. There were no missing values for first-grade data; however, in third grade, scoresfor 1 student were missing on two of the reading comprehension measures because the studentdeclined to participate in third-grade testing.
The distributional characteristics of the first- and third-grade measures were largely normal,although box plots from DIBELS subtests showed evidence of one to three outliers (i.e., scores thatfell outside of the first and fourth interquartile range; Vogt, 2005), depending on the subtest. The datawere carefully examined to ensure that the more extreme scores were not due to data entry or codingerrors, and because the outliers appeared to represent legitimate data, analyses were conductedwith the outliers included. The data were found to be reasonably normally distributed, scatterplotsshowed linear relationships among variables, and analysis of residuals showed no serious concernswith homoscedasticity. When the predictor variables were initially examined for potential problemsrelated to multicollinearity, variance inflation factors (VIF) were found to be acceptable among the
Psychology in the Schools DOI: 10.1002/pits
Taking a “Simple View” 729
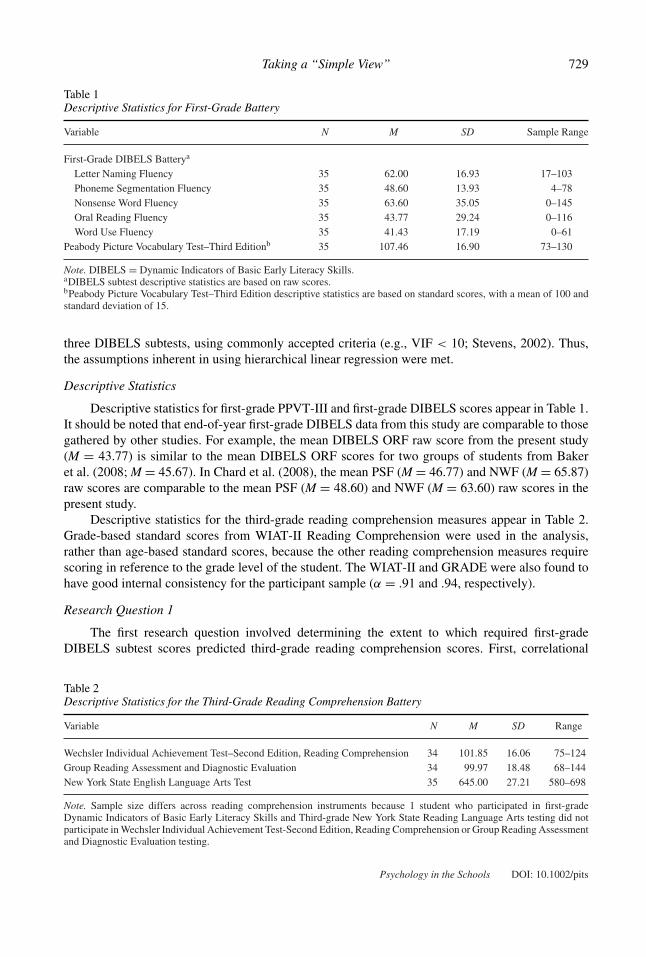
Table 1Descriptive Statistics for First-Grade Battery
Variable N M SD Sample Range
First-Grade DIBELS Batterya
Letter Naming Fluency 35 62.00 16.93 17–103Phoneme Segmentation Fluency 35 48.60 13.93 4–78Nonsense Word Fluency 35 63.60 35.05 0–145Oral Reading Fluency 35 43.77 29.24 0–116Word Use Fluency 35 41.43 17.19 0–61
Peabody Picture Vocabulary Test–Third Editionb 35 107.46 16.90 73–130
Note. DIBELS = Dynamic Indicators of Basic Early Literacy Skills.aDIBELS subtest descriptive statistics are based on raw scores.bPeabody Picture Vocabulary Test–Third Edition descriptive statistics are based on standard scores, with a mean of 100 andstandard deviation of 15.
three DIBELS subtests, using commonly accepted criteria (e.g., VIF < 10; Stevens, 2002). Thus,the assumptions inherent in using hierarchical linear regression were met.
Descriptive Statistics
Descriptive statistics for first-grade PPVT-III and first-grade DIBELS scores appear in Table 1.It should be noted that end-of-year first-grade DIBELS data from this study are comparable to thosegathered by other studies. For example, the mean DIBELS ORF raw score from the present study(M = 43.77) is similar to the mean DIBELS ORF scores for two groups of students from Bakeret al. (2008; M = 45.67). In Chard et al. (2008), the mean PSF (M = 46.77) and NWF (M = 65.87)raw scores are comparable to the mean PSF (M = 48.60) and NWF (M = 63.60) raw scores in thepresent study.
Descriptive statistics for the third-grade reading comprehension measures appear in Table 2.Grade-based standard scores from WIAT-II Reading Comprehension were used in the analysis,rather than age-based standard scores, because the other reading comprehension measures requirescoring in reference to the grade level of the student. The WIAT-II and GRADE were also found tohave good internal consistency for the participant sample (α = .91 and .94, respectively).
Research Question 1
The first research question involved determining the extent to which required first-gradeDIBELS subtest scores predicted third-grade reading comprehension scores. First, correlational
Table 2Descriptive Statistics for the Third-Grade Reading Comprehension Battery
Variable N M SD Range
Wechsler Individual Achievement Test–Second Edition, Reading Comprehension 34 101.85 16.06 75–124Group Reading Assessment and Diagnostic Evaluation 34 99.97 18.48 68–144New York State English Language Arts Test 35 645.00 27.21 580–698
Note. Sample size differs across reading comprehension instruments because 1 student who participated in first-gradeDynamic Indicators of Basic Early Literacy Skills and Third-grade New York State Reading Language Arts testing did notparticipate in Wechsler Individual Achievement Test-Second Edition, Reading Comprehension or Group Reading Assessmentand Diagnostic Evaluation testing.
Psychology in the Schools DOI: 10.1002/pits
730 Munger and Blachman
Table 3Correlations Among First-Grade DIBELS Subtest Scores and Third-Grade Measures of Reading Comprehension
1 2 3 4 5 6 7
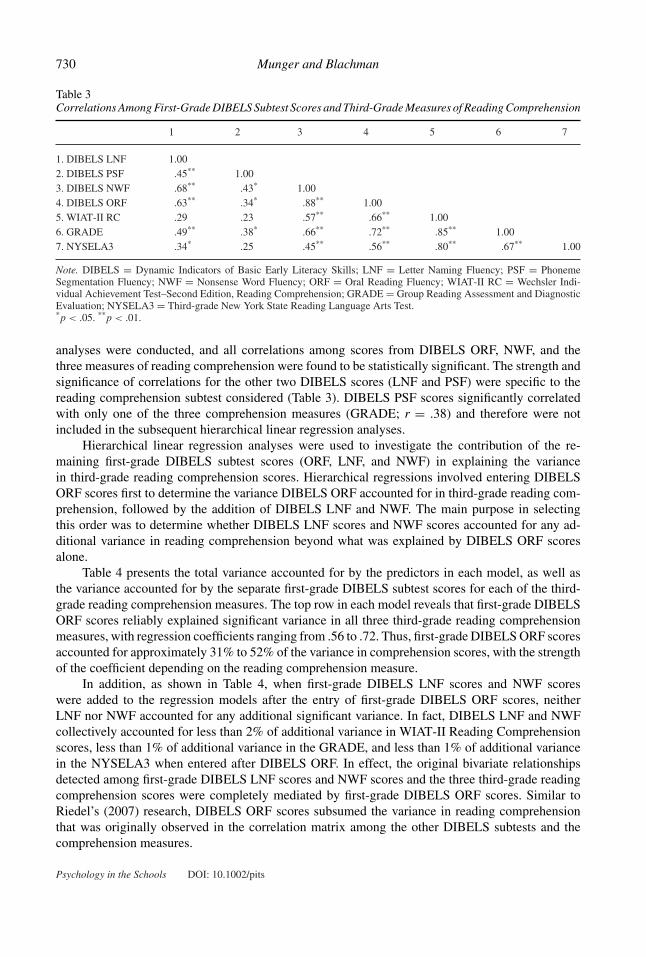
1. DIBELS LNF 1.002. DIBELS PSF .45** 1.003. DIBELS NWF .68** .43* 1.004. DIBELS ORF .63** .34* .88** 1.005. WIAT-II RC .29 .23 .57** .66** 1.006. GRADE .49** .38* .66** .72** .85** 1.007. NYSELA3 .34* .25 .45** .56** .80** .67** 1.00
Note. DIBELS = Dynamic Indicators of Basic Early Literacy Skills; LNF = Letter Naming Fluency; PSF = PhonemeSegmentation Fluency; NWF = Nonsense Word Fluency; ORF = Oral Reading Fluency; WIAT-II RC = Wechsler Indi-vidual Achievement Test–Second Edition, Reading Comprehension; GRADE = Group Reading Assessment and DiagnosticEvaluation; NYSELA3 = Third-grade New York State Reading Language Arts Test.*p < .05. **p < .01.
analyses were conducted, and all correlations among scores from DIBELS ORF, NWF, and thethree measures of reading comprehension were found to be statistically significant. The strength andsignificance of correlations for the other two DIBELS scores (LNF and PSF) were specific to thereading comprehension subtest considered (Table 3). DIBELS PSF scores significantly correlatedwith only one of the three comprehension measures (GRADE; r = .38) and therefore were notincluded in the subsequent hierarchical linear regression analyses.
Hierarchical linear regression analyses were used to investigate the contribution of the re-maining first-grade DIBELS subtest scores (ORF, LNF, and NWF) in explaining the variancein third-grade reading comprehension scores. Hierarchical regressions involved entering DIBELSORF scores first to determine the variance DIBELS ORF accounted for in third-grade reading com-prehension, followed by the addition of DIBELS LNF and NWF. The main purpose in selectingthis order was to determine whether DIBELS LNF scores and NWF scores accounted for any ad-ditional variance in reading comprehension beyond what was explained by DIBELS ORF scoresalone.
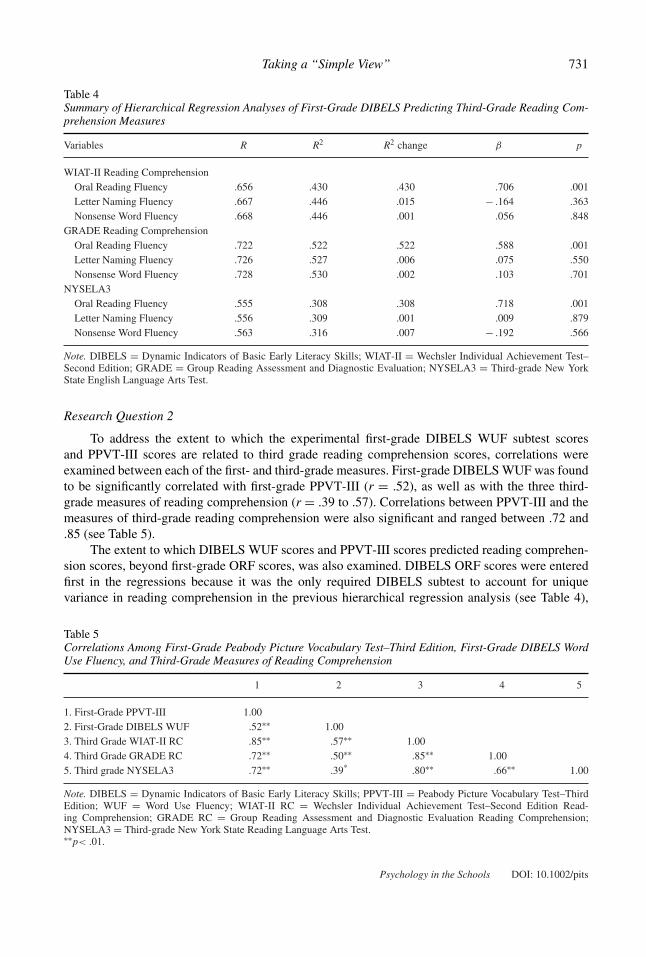
Table 4 presents the total variance accounted for by the predictors in each model, as well asthe variance accounted for by the separate first-grade DIBELS subtest scores for each of the third-grade reading comprehension measures. The top row in each model reveals that first-grade DIBELSORF scores reliably explained significant variance in all three third-grade reading comprehensionmeasures, with regression coefficients ranging from .56 to .72. Thus, first-grade DIBELS ORF scoresaccounted for approximately 31% to 52% of the variance in comprehension scores, with the strengthof the coefficient depending on the reading comprehension measure.
In addition, as shown in Table 4, when first-grade DIBELS LNF scores and NWF scoreswere added to the regression models after the entry of first-grade DIBELS ORF scores, neitherLNF nor NWF accounted for any additional significant variance. In fact, DIBELS LNF and NWFcollectively accounted for less than 2% of additional variance in WIAT-II Reading Comprehensionscores, less than 1% of additional variance in the GRADE, and less than 1% of additional variancein the NYSELA3 when entered after DIBELS ORF. In effect, the original bivariate relationshipsdetected among first-grade DIBELS LNF scores and NWF scores and the three third-grade readingcomprehension scores were completely mediated by first-grade DIBELS ORF scores. Similar toRiedel’s (2007) research, DIBELS ORF scores subsumed the variance in reading comprehensionthat was originally observed in the correlation matrix among the other DIBELS subtests and thecomprehension measures.
Psychology in the Schools DOI: 10.1002/pits
Taking a “Simple View” 731
Table 4Summary of Hierarchical Regression Analyses of First-Grade DIBELS Predicting Third-Grade Reading Com-prehension Measures
Variables R R2 R2 change β p
WIAT-II Reading ComprehensionOral Reading Fluency .656 .430 .430 .706 .001Letter Naming Fluency .667 .446 .015 − .164 .363Nonsense Word Fluency .668 .446 .001 .056 .848
GRADE Reading ComprehensionOral Reading Fluency .722 .522 .522 .588 .001Letter Naming Fluency .726 .527 .006 .075 .550Nonsense Word Fluency .728 .530 .002 .103 .701
NYSELA3Oral Reading Fluency .555 .308 .308 .718 .001Letter Naming Fluency .556 .309 .001 .009 .879Nonsense Word Fluency .563 .316 .007 − .192 .566
Note. DIBELS = Dynamic Indicators of Basic Early Literacy Skills; WIAT-II = Wechsler Individual Achievement Test–Second Edition; GRADE = Group Reading Assessment and Diagnostic Evaluation; NYSELA3 = Third-grade New YorkState English Language Arts Test.
Research Question 2
To address the extent to which the experimental first-grade DIBELS WUF subtest scoresand PPVT-III scores are related to third grade reading comprehension scores, correlations wereexamined between each of the first- and third-grade measures. First-grade DIBELS WUF was foundto be significantly correlated with first-grade PPVT-III (r = .52), as well as with the three third-grade measures of reading comprehension (r = .39 to .57). Correlations between PPVT-III and themeasures of third-grade reading comprehension were also significant and ranged between .72 and.85 (see Table 5).
The extent to which DIBELS WUF scores and PPVT-III scores predicted reading comprehen-sion scores, beyond first-grade ORF scores, was also examined. DIBELS ORF scores were enteredfirst in the regressions because it was the only required DIBELS subtest to account for uniquevariance in reading comprehension in the previous hierarchical regression analysis (see Table 4),
Table 5Correlations Among First-Grade Peabody Picture Vocabulary Test–Third Edition, First-Grade DIBELS WordUse Fluency, and Third-Grade Measures of Reading Comprehension
1 2 3 4 5
1. First-Grade PPVT-III 1.002. First-Grade DIBELS WUF .52∗∗ 1.003. Third Grade WIAT-II RC .85∗∗ .57∗∗ 1.004. Third Grade GRADE RC .72∗∗ .50∗∗ .85∗∗ 1.005. Third grade NYSELA3 .72∗∗ .39* .80∗∗ .66∗∗ 1.00
Note. DIBELS = Dynamic Indicators of Basic Early Literacy Skills; PPVT-III = Peabody Picture Vocabulary Test–ThirdEdition; WUF = Word Use Fluency; WIAT-II RC = Wechsler Individual Achievement Test–Second Edition Read-ing Comprehension; GRADE RC = Group Reading Assessment and Diagnostic Evaluation Reading Comprehension;NYSELA3 = Third-grade New York State Reading Language Arts Test.∗∗p< .01.
Psychology in the Schools DOI: 10.1002/pits
732 Munger and Blachman
Table 6Summary of Hierarchical Regression Analyses of First-Grade DIBELS ORF, DIBELS WUF, and PPVT-IIIPredicting Third-Grade Reading Comprehension Measures
Variables R R2 R2 change β p
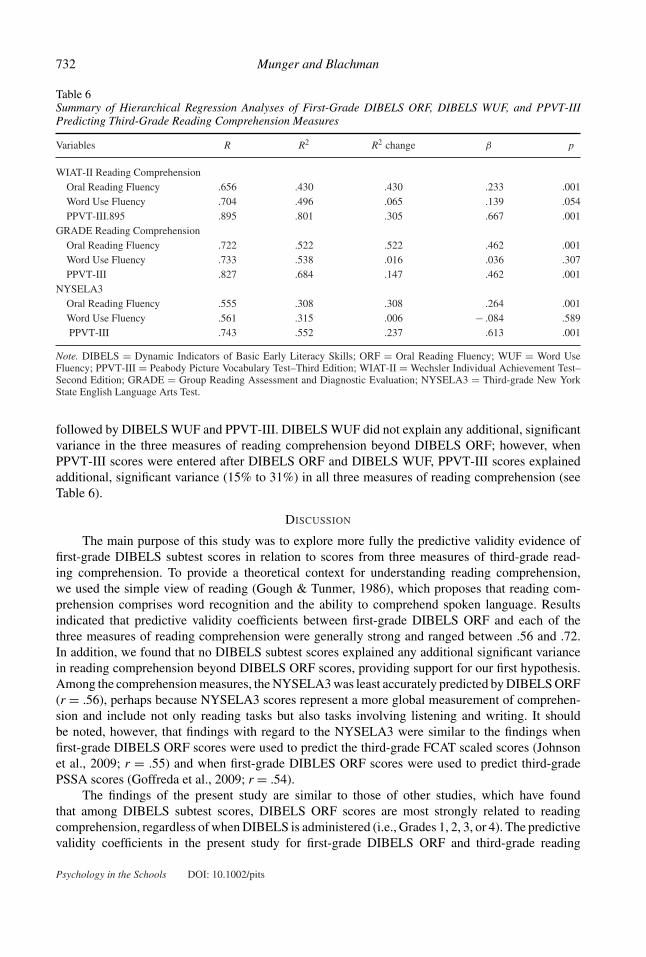
WIAT-II Reading ComprehensionOral Reading Fluency .656 .430 .430 .233 .001Word Use Fluency .704 .496 .065 .139 .054PPVT-III.895 .895 .801 .305 .667 .001
GRADE Reading ComprehensionOral Reading Fluency .722 .522 .522 .462 .001Word Use Fluency .733 .538 .016 .036 .307PPVT-III .827 .684 .147 .462 .001
NYSELA3Oral Reading Fluency .555 .308 .308 .264 .001Word Use Fluency .561 .315 .006 − .084 .589PPVT-III .743 .552 .237 .613 .001
Note. DIBELS = Dynamic Indicators of Basic Early Literacy Skills; ORF = Oral Reading Fluency; WUF = Word UseFluency; PPVT-III = Peabody Picture Vocabulary Test–Third Edition; WIAT-II = Wechsler Individual Achievement Test–Second Edition; GRADE = Group Reading Assessment and Diagnostic Evaluation; NYSELA3 = Third-grade New YorkState English Language Arts Test.
followed by DIBELS WUF and PPVT-III. DIBELS WUF did not explain any additional, significantvariance in the three measures of reading comprehension beyond DIBELS ORF; however, whenPPVT-III scores were entered after DIBELS ORF and DIBELS WUF, PPVT-III scores explainedadditional, significant variance (15% to 31%) in all three measures of reading comprehension (seeTable 6).
DISCUSSION
The main purpose of this study was to explore more fully the predictive validity evidence offirst-grade DIBELS subtest scores in relation to scores from three measures of third-grade read-ing comprehension. To provide a theoretical context for understanding reading comprehension,we used the simple view of reading (Gough & Tunmer, 1986), which proposes that reading com-prehension comprises word recognition and the ability to comprehend spoken language. Resultsindicated that predictive validity coefficients between first-grade DIBELS ORF and each of thethree measures of reading comprehension were generally strong and ranged between .56 and .72.In addition, we found that no DIBELS subtest scores explained any additional significant variancein reading comprehension beyond DIBELS ORF scores, providing support for our first hypothesis.Among the comprehension measures, the NYSELA3 was least accurately predicted by DIBELS ORF(r = .56), perhaps because NYSELA3 scores represent a more global measurement of comprehen-sion and include not only reading tasks but also tasks involving listening and writing. It shouldbe noted, however, that findings with regard to the NYSELA3 were similar to the findings whenfirst-grade DIBELS ORF scores were used to predict the third-grade FCAT scaled scores (Johnsonet al., 2009; r = .55) and when first-grade DIBLES ORF scores were used to predict third-gradePSSA scores (Goffreda et al., 2009; r = .54).
The findings of the present study are similar to those of other studies, which have foundthat among DIBELS subtest scores, DIBELS ORF scores are most strongly related to readingcomprehension, regardless of when DIBELS is administered (i.e., Grades 1, 2, 3, or 4). The predictivevalidity coefficients in the present study for first-grade DIBELS ORF and third-grade reading
Psychology in the Schools DOI: 10.1002/pits
Taking a “Simple View” 733
comprehension (r = .56 to .72) are comparable to the predictive validity coefficients identified inGoffreda and DiPerna’s 2010 comprehensive review of psychometric evidence of DIBELS (medianpredictive validly coefficient = .68). Consistent with findings from Goffreda et al. (2009) and Riedel(2007), the present study found that first-grade DIBELS ORF scores subsumed the variance inreading comprehension scores that was initially accounted for by other first-grade DIBELS subtestscores. The results of this study, when added to the previous literature, bring into question the valueof the administration of DIBELS subtests besides DIBELS ORF after the middle of first grade.
As previously discussed, the most persistent criticism of DIBELS is that it does not includeany items that have been found to measure language-based aspects of reading, and research that hasinvestigated whether DIBELS WUF or RTF contribute to the prediction of later reading compre-hension has had discouraging results (McKenna & Good, 2003; Pressley et al., 2005; Riedel, 2007).Although in the present study, DIBELS WUF was significantly correlated with first grade PPVT-III and the three measures of reading comprehension, the use of hierarchical multiple regressiondemonstrated that DIBELS WUF scores were not able to account for significant variance in readingcomprehension scores beyond what was already accounted for by DIBELS ORF scores. However,first-grade PPVT-III scores explained approximately 15% to 31% additional, significant variance inreading comprehension beyond that explained by DIBELS ORF scores. This means that the vari-ance explained by first-grade DIBELS ORF and PPVT-III in third-grade reading comprehension wascomplementary, whereas the variance explained by first-grade DIBELS ORF and DIBELS WUFwas merely redundant. These data provide support for our second hypothesis that, consistent withthe simple view of reading, vocabulary scores explain variance in reading comprehension beyondthat explained by DIBELS ORF, but this was true only for the well-researched PPVT-III and not theexperimental WUF.
Thus, the present research reveals that the combination of first-grade DIBELS ORF and first-grade PPVT-III is able to capture the two linguistic components—word recognition and languagecomprehension—of the theoretical model of reading comprehension referred to as the “simple view”of reading (Gough & Tunmer, 1986). Including procedures to measure language-based aspects ofreading in an early literacy instrument can do more than just improve the face validity of theinstrument; it can also potentially improve the construct validity as well as provide importantinformation to educators beyond what is revealed by oral reading fluency information alone.
Although DIBELS subtests alone do not appear to capture the two important linguistic compo-nents of the simple view of reading (specifically, aspects of language comprehension), supplementingDIBELS ORF with the PPVT-III does appear to account for variance in reading comprehension re-lated to language comprehension. Whereas on the surface, PPVT-III may appear to be an idealsupplement to DIBELS, it is an individually administered test that is considerably more labor in-tensive to administer, and therefore, it is unlikely to serve as a realistic supplement to DIBELS.A universal screening test must not only have well-established evidence of reliability and validitybut also must be efficient to administer and score. The PPVT-III is not nearly as efficient to useas DIBELS, but perhaps some version of a picture vocabulary test with fewer items is worth in-vestigating as a supplement to DIBELS. In reality, supplementing DIBELS with a language-basedmeasure would not only require that the measure provide greater efficiency than the PPVT, it wouldalso have to improve on the classification accuracy of DIBELS, because DIBELS “cut” scores aremost often used in schools to classify students according to their level of risk for reading difficultiesand, thus, their need for reading intervention. Scores are associated with three levels of risk, withthe highest level of concern applied to those classified as “at risk.” Other students are classified ashaving “some risk,” whereas the more successful students, in terms of their DIBELS scores, areclassified as “low risk.” Cut scores for risk determination are established by research estimatingthe probability of the student meeting later benchmarks (Good & Kaminski, 2002). It should be
Psychology in the Schools DOI: 10.1002/pits
734 Munger and Blachman
noted, however, that research related to the classification accuracy of DIBELS (see, for example,Nelson, 2008, Riedel, 2007; Schilling et al., 2007) reveals concerns regarding the false-positiveand false-negative rates associated with DIBELS cut scores. Thus, research is needed to determinewhether adding a language-based measure improves the classification accuracy of DIBELS.
To date, the few studies that have included vocabulary measures such as PPVT (Johnsonet al., 2009) or GRADE Vocabulary (Riedel, 2007) have not shown remarkable improvement inthe classification accuracy of DIBELS in terms of students’ risk status. Nonetheless, researchershave recommended additional investigation into using vocabulary as a supplement, because thegroup-administered vocabulary measure on the GRADE, for example, showed a small but statis-tically significant increase in classification accuracy with young students (Riedel, 2007). Perhapsusing early language comprehension measures through the use of “multiple-gating” (Johnson et al.,2009) could also increase the decision-making accuracy for students whose reading futures remainindeterminate, rather than relying on DIBELS data alone. Multiple-gating would involve reservingmore comprehensive assessment procedures for students who are identified as being at risk on ascreening instrument, rather than incorporating more comprehensive screening procedures for allstudents.
Although the present study provides some unique insights into the validity evidence of first-grade DIBELS, the small sample size selected from a single school is a limitation. Small sample sizesmake findings less generalizable and tend to provide less stable validity coefficients compared withlarger studies, and in the case of the present research, also limited the extent to which other variables,such as English language learning or disability status, could be investigated as moderating theprediction of early reading. In addition, future research on DIBELS, in reference to the simple viewof reading, should include a sufficiently large and diverse sample to explore the classification accuracyof students (i.e., their degree of risk for future reading problems) when DIBELS is supplementedwith measures of language comprehension.
Many findings from the present study fundamentally agree with those from much larger studies,which further reinforce what we know about the predictive validity of DIBELS. This study addsto the information previously known about DIBELS, especially in terms of its prediction of theNYSELA3 and the prediction of the individually administered WIAT-II Reading Comprehensionsubtest.
The consistency of the findings in the present study with other large-scale studies was likelyrelated, in part, to minimization of avoidable error in the data (e.g., thoroughly trained testers),administration of measures when profound floor effects were least likely to occur (Paris, 2005), andcareful selection of criterion instruments with good psychometric properties. It should be noted,however, that although the minimization of error in the present research is a potential strength ofthe study, the more typical use of DIBELS involves educators who are not provided with as muchpreparation or practice as testers who participate in research studies. In actuality, DIBELS scores arelikely to contain more error than that found in this and other studies. These differences in precisionshould be the subject of future research.
Educational Implications
Based on this and other research, first-grade DIBELS ORF scores have been shown to bea strong predictor of reading comprehension on a variety of measures, including commerciallyavailable reading comprehension tests, state-constructed tests, and an individually administereddiagnostic measure. It also has been shown to have much stronger validity evidence for screeningprimary school students’ reading skills compared with other DIBELS subtests (Goffreda & DiPerna,2010). Thus, it appears that we may have sufficient data to consider some practical modifications
Psychology in the Schools DOI: 10.1002/pits
Taking a “Simple View” 735
regarding the use of DIBELS in schools. For example, from the middle of first grade on, it looksas if DIBELS ORF scores are the only scores providing essential information about students’ laterreading, and the other subtest scores are either redundant with what they tell us or simply havepoor validity evidence for use as an early literacy screener (Goffreda & DiPerna, 2010; Johnsonet al., 2009; Riedel, 2007). Rather than repeatedly administering other DIBELS subtests that are ofquestionable utility, it seems worthwhile to attempt to develop other screening procedures to optimizewhat we can learn about students’ reading. Research investigating the use of an abbreviated (andperhaps supplemented) battery might be an especially valuable contribution to the practical use ofDIBELS in schools, because “endeavoring to use a single screen to measure all or even most of theimportant individual differences that contribute to reading acquisition is probably futile” (Johnsonet al., 2009, p. 183). It also makes sense to use a well-substantiated theory of reading comprehension,such as the simple view, as a foundation for guiding the assessment of literacy skills. DIBELS ORFscores appear to have strong empirical evidence to serve as a predictor of reading based on students’ability to read words both accurately and fluently; however, DIBELS still lacks the ability to measurethe language comprehension aspects of reading that the simple view of reading has shown are criticalin the development of reading comprehension.
In addition, as recommended by Goffreda and DiPerna (2010), “Future studies are also necessaryto examine the effects of DIBELS use on classroom instruction, and ultimately, student achievement”(p. 480). It is especially critical that early literacy screening result in improved outcomes forstudents—an issue of consequential validity extending far beyond the evaluation of the psychometricevidence of DIBELS. In reality, we hope to positively impact student learning from first to thirdgrade so that “we can ruin this prediction and accelerate learning” (Chard et al., 2008, p. 184).
The Future of DIBELS
In May 2010, the University of Oregon released a new version of DIBELS called DIBELS Next.The structure of the assessment is similar to earlier versions of DIBELS, with updates includingchanges in fonts, new items, child-friendlier directions, and additional scoring procedures. For first-grade DIBELS subtests, some changes are consistent with recommendations based on the earlierresearch on DIBELS, such as not administering DIBELS PSF beyond the beginning of first grade(Riedel, 2007). Other changes are not necessarily consistent with the research. For example, theadministration of DIBELS RTF is now required after students read DIBELS ORF passages toprovide information regarding reading comprehension, despite the lack of evidence of this subtest’svalidity for this purpose (Pressley et al., 2005; Riedel, 2007). DIBELS WUF is revised (WUF-R)but is still considered experimental and is only available through the DIBELS Next website forschools participating in DIBELS Next research. DIBELS WUF-R is featured in the assessmentmanual (Good & Kaminski, 2011) as an indicator of vocabulary and language skills, although thereis a lack of evidence regarding its contribution to language-based aspects of reading. As previouslydiscussed, the simple view of reading helps inform us that both word identification and languagecomprehension skills contribute to reading comprehension, and relying on subtests such as WUFor RTF, when there is insufficient validity evidence supporting the use of either subtest score tomeasure language-based aspects of reading, seems ill-advised. It should be noted that DIBELSNext does include a new subtest called DIBELS Daze, which can be administered in a group inwhich students read brief passages and fill in a blank with one of several word choices next to theblank. Although research is needed to determine how well these procedures measure and/or predictreading comprehension, the subtest is administered starting in third grade, and therefore, obtaininginformation on students’ comprehension abilities is delayed until the middle of elementary school,which seems rather late to make this discovery. The release of DIBELS Next invites a new round
Psychology in the Schools DOI: 10.1002/pits
736 Munger and Blachman
of research, and it will be interesting to see whether any DIBELS subtest measures language-basedaspects of reading.
REFERENCES
Adams, M. J. (1990). Beginning to read: Thinking and learning about print. Cambridge, MA: MIT Press.Baker, S. K., Smolkowski, K., Katz, R., Fien, H., Seeley, J. R., Keme’enui, E. J., & Beck, C. T. (2008). Reading fluency
as a predictor of reading proficiency in low-performing, high-poverty schools. School Psychology Review, 37, 18 – 37.Retrieved from http://www.nasponline.org/publications/spr/index-list.aspx
Blachman, B. A. (2000). Phonological awareness. In M. L. Kamil, P. B. Mosenthal, P. D. Pearson, & R. Barr (Eds.), Handbookof reading research, Vol. III. (pp. 483 – 502). Mahwah, NJ: Erlbaum.
Blachman, B. A., Schatschneider, C., Fletcher, J. M., Francis, D. J., Clonan, S. M., Shaywitz, B. A., & Shaywitz, S. E. (2004).Effects of intensive reading remediation for second and third graders and a 1-year follow-up. Journal of EducationalPsychology, 96, 444 – 461. doi: 10.1037/0022-0663.96.3.444
Burke, M. D., & Hagen-Burke, S. H. (2007). Concurrent criterion-related validity of early literacy indicators for middle offirst grade. Assessment for Effective Intervention, 32, 66 – 77. doi: 10.1177/15345084070320020401
Catts, H. W., Hogan, T. P., & Adlof, S. M. (2005). Developmental changes in reading and reading disabilities. In H. W. Catts& A. G. Kamhi (Eds.), The connections between language and reading disabilities (pp. 25 – 40). Mahwah, NJ: Erlbaum.
Chard, D., Stoolmiller, M., Harn, B. A., Wanzek, J., Vaughn, S., Linan-Thompson, S., & Keme’enui, E. J. (2008). Predictingreading success in a multi-level school-wide reading model: A retrospective analysis. Journal of Learning Disabilities,41, 174 – 188. doi: 10.1177/0022219407313588
Cutting, L. E., & Scarborough, H. S. (2006). Prediction of reading comprehension: Relative contributions of word recognition,language proficiency, and other cognitive skills can depend on how comprehension is measured. Scientific Studies ofReading, 10, 277 – 299. doi: 10.1207/s1532799xssr1003_5
Deno, S. L. (1986). Formative evaluation of individual student programs: A new role for school psychologists. SchoolPsychology Review, 15, 358 – 374. Retrieved from http://www.nasponline.org/publications/spr/index-list.aspx
Dunn, L. M., & Dunn, L. M. (1997). Peabody Picture Vocabulary Test–Third Edition. Bloomington, MN: Pearson Assess-ments.
Fuchs, D., & Fuchs, L. S. (2006). Introduction to Response to Intervention: What, why, and how valid is it? Reading ResearchQuarterly, 41, 93 – 99. doi: 10.1598/RRQ.41.1.4
Goffreda, C. T., & DiPerna, J. C. (2010). An empirical review of psychometric evidence for the Dynamic Indicatorsof Basic Early Literacy Skills. School Psychology Review, 39, 463 – 483. Retrieved from http://www.nasponline.org/publications/spr/index-list.aspx
Goffreda, C. T., DiPerna, J. C., & Pedersen, J. A. (2009). Preventive screening for early readers: Predictive validity ofthe Dynamic Indicators of Basic Early Literacy Skills (DIBELS). Psychology in the Schools, 46, 539 – 552. doi:10.1002/pits.20396
Good, R. H., & Kaminski, R. A. (Eds.). (2002). Dynamic Indicators of Basic Early Literacy Skills (6th ed.). Eugene, OR:Institute for the Development of Educational Achievement. Retrieved from http://dibels.uoregon.edu
Good, R. H., & Kaminski, R. A. (Eds.). (2011). DIBELS Next Assessment Manual. Eugene, OR: Dynamic MeasurementGroup. Retrieved from http://dibels.org/next.html
Goodman, K. S. (2006). The truth about DIBELS: What it is, what it does. Portsmouth, NH: Heinemann.Gough, P. B., & Tunmer, W. E. (1986). Decoding, reading, and reading disability. Remedial and Special Education, 7, 6 – 10.
doi: 10.1177/074193258600700104Gresham, F. M., Reschly, D. J., & Shinn, M. R. (2010). RTI as a driving force in educational improvement: Historical,
legal, research, and practice perspectives. In M. R. Shinn & H. M. Walker (Eds.), Interventions for achievement andbehavior problems in a three-tier model including RTI (pp. 47 – 78). Bethesda, MD: National Association of SchoolPsychologists.
Hoover, W. A., & Gough, P. B. (1990). The simple view of reading. Reading and Writing: An Interdisciplinary Journal, 2,127 – 160. doi: 10.1007/BF00401799
Individuals With Disabilities Education Improvement Act of 2004, Pub. L. 108–446 (2004).Johnson, E., Jenkins, J., Petscher, Y., & Catts, H. (2009). How can we improve the accuracy of screening instruments?
Learning Disabilities Research & Practice, 24, 174 – 185. doi: 10.1111/j.1540-5826.2009.00291.xKeenan, J. M., Betjemann, R. S., & Olson, R. K. (2008). Reading comprehension tests vary in the skills they assess:
Differential dependence on decoding and oral comprehension. Scientific Studies of Reading, 12, 281 – 300. doi:10.1080/10888430802132279
Kendeou, P., van den Broek, P., White, M. J., & Lynch, J. S. (2009). Predicting reading comprehension in early elementaryschool: The independent contributions of oral language and decoding skills. Journal of Educational Psychology, 101,765 – 778. doi: 10.1037/a0015956
Psychology in the Schools DOI: 10.1002/pits
Taking a “Simple View” 737
Kim, Y., Petscher, Y., Schatschneider, C., & Foorman, B. (2010). Does growth rate in oral reading fluency matter in predictingreading comprehension achievement? Journal of Educational Psychology, 102, 652 – 667. doi: 10.1037/a0019643
Manzo, K. K. (2005, September 28). National clout of DIBELS test draws scrutiny: Critics say reading tool’s scopefails to justify its broad use. Education Week, 25(5), 1, 12. Retrieved from http://www.edweek.org/ew/articles/2005/09/28/05dibels.h25.html
McKenna, M. K., & Good, R. H. (2003). Assessing reading comprehension: The relation between DIBELS Oral ReadingFluency, DIBELS Retell Fluency, and Oregon State Assessment scores [Technical report]. Eugene, OR: University ofOregon.
Munger, K. A. (2007). A concurrent validity study of the Dynamic Indicators of Basic Early Literacy Skills (DIBELS).Unpublished manuscript.
National Institute of Child Health and Human Development. (2000). Report of the National Reading Panel. Teaching childrento read: An evidence-based assessment of the scientific research literature on reading and its implications for readinginstruction: Reports of the subgroups (NIH Publication No. 00-4754). Washington, DC: U.S. Government PrintingOffice. Retrieved from http://www.nationalreadingpanel.org/Publications/subgroups.htm
Nelson, J. M. (2008). Beyond correlational analysis of the Dynamic Indicators of Basic Early Literacy Skills (DIBELS): Aclassification validity study. School Psychology Quarterly, 23, 542 – 552. doi: 10.1037/a0013245
New York State Education Department. (2009). 2009 English Language Arts Grade 3 Test. Retrieved from http://www.nysedregents.org/Grade3/EnglishLanguageArts/home.html
No Child Left Behind Act of 2001, Pub. L. No. 107-110, 115 Stat. 1425 (2002).Paris, S. (2005). Reinterpreting the development of reading skills. Reading Research Quarterly, 40, 184 – 202. doi:
10.1598/RRQ.40.2.3Pressley, M., Hilden, K., & Shankland, R. (2005). An evaluation of end-of-grade 3 Dynamic Indicators of Basic Early
Literacy Skills (DIBELS): Speed reading without comprehension, predicting little. East Lansing, MI: MichiganState University Literacy Achievement Research Center. Retrieved from http://www.wce.wwu.edu/Depts/SPED/Forms/Kens%20Readings/reading/Readings/Pressely_Retell_DIBELS.pdf
Psychological Corporation. (2001). Wechsler Individual Achievement Test (2nd ed.). San Antonio, TX: Author.Rand Reading Study Group (Snow, C., Chair). (2002). Reading for understanding, toward an R&D program in reading
comprehension. Prepared for the Office of Educational Research and Improvement (OERI). Santa Monica, CA: Rand.Retrieved from http://www.rand.org/pubs/monograph_reports/MR1465.html
Riedel, B. W. (2007). The relation between DIBELS, reading comprehension, and vocabulary in urban first-grade students.Reading Research Quarterly, 42, 546 – 567. doi: 10.1598/RRQ.42.4.5
Roehrig, A. D., Petscher, Y., Nettles, S. M., Hudson, R. F., & Torgesen, J. K. (2008). Accuracy of the DIBELS OralReading Fluency measure for predicting third grade reading comprehension outcomes. Journal of School Psychology,46, 343 – 366. doi: 10.1016/j.jsp.2007.06.006
Samuels, J. (2007). The DIBELS tests: Is speed of barking at print what we mean by reading fluency? Reading ResearchQuarterly, 42, 563 – 566. doi: 10.1598/RRQ.42.4.5
Schilling, S. G., Carlisle, J. F., Scott, S. E., & Zeng, J. (2007). Are fluency measures accurate predictors of readingachievement? The Elementary School Journal, 107, 429 – 448. doi: 10.1086/518622
Snow, C. E., Burns, M. S., & Griffin, P. (Eds.). (1998). Preventing reading difficulties in young children. Washington, DC:National Academy Press.
Stanovich, K. E., Cunningham, A. E., & Freeman, D. J. (1984). Intelligence, cognitive skills and early reading progress.Reading Research Quarterly, 19, 278 – 303. doi: 10.2307/747822
Stevens, J. P. (2002). Applied multivariate statistics for the social sciences (4thed.). Mahwah, NJ: LEA.Tannenbaum, K. R., Torgesen, J. K., & Wagner, R. K. (2006). Relationships between word knowledge and reading compre-
hension in third-grade children. Scientific Studies of Reading, 10, 381 – 398. doi: 10.1207/s1532799xssr1004_3Torgesen, J. K. (2005). Recent discoveries from research on remedial interventions for children with dyslexia. In M. Snowling
& C. Hulme (Eds.), The science of reading: A handbook (pp. 521 – 537). Oxford, UK: Blackwell.Torgesen, J. K., Rashotte, C.A., & Alexander, A. (2001). Principles of fluency instruction in reading: Relationships with
established empirical outcomes. In M. Wolf (Ed.), Dyslexia, fluency, and the brain (pp. 333 – 355). Parkton, MD: YorkPress.
Vogt, W. P. (2005). Dictionary of statistics methodology: A nontechnical guide for the social sciences (3rd ed.). ThousandOaks, CA: Sage.
Wanzek, J., Roberts, G., Linan-Thompson, S., Vaughn, S., Woodruff, A. L., & Murray, C. S. (2010). Differences in therelationship of oral reading fluency and high-stakes measures of reading comprehension. Assessment for EffectiveIntervention, 35, 67 – 77. doi: 10.1177/1534508409339917
Williams, K. T. (2001). Group Reading Assessment and Diagnostic Evaluation. Circle Pines, MN: American GuidanceService.
Psychology in the Schools DOI: 10.1002/pits