Embed Size (px)
Citation preview

2012 CONVENTION 16 – 17 OCTOBER
Takaful Models: Overview from an actuarial perspective
Antonie Jagga
Junaid Khan
PwC Actuarial & Insurance Management Solutions
2012 CONVENTION 16 – 17 OCTOBER PwC
Agenda
Introduction to Takaful
Overview
The African Market
Summary Market Statistics
Takaful Operating Models
Mudharaba Model
Wakala Model
Wakala-Waqf Model
A comparison of models:
Assumptions & Methodology
Performance Metrics
How Actuaries can get involved
2012 CONVENTION 16 – 17 OCTOBER PwC
Introduction to Takaful
General overview
The African market
Summary market statistics

2012 CONVENTION 16 – 17 OCTOBER
Introduction to Takaful General overview
Takaful is derived from the Arabic word kafala meaning
“joint benefit or shared responsibility”.
Takaful is the Islamic alternative to conventional insurance and is therefore Shariah
compliant.
What are the principles of Shariah?
islamic law
interest, gambling and dealing in arms is prohibited
What are the key features of Takaful?
mutuality – risk sharing
separation of assets (between operator and participants)
shariah-compliant investments
2012 CONVENTION 16 – 17 OCTOBER
Introduction to Takaful General overview (continued)
Takaful insurance can include General insurance, Life
insurance, Medical and Health insurance, as well as
accident and education plans.
Family Takaful:
Includes endowments and savings products
Characterised by low penetration rates
General and Health Takaful:
Includes commercial and personal property and motor products, marine and aviation, and
health insurance
Health Takaful is a rapidly growing sector in the GCC as health insurance is increasingly
being made compulsory in GCC countries.
2012 CONVENTION 16 – 17 OCTOBER
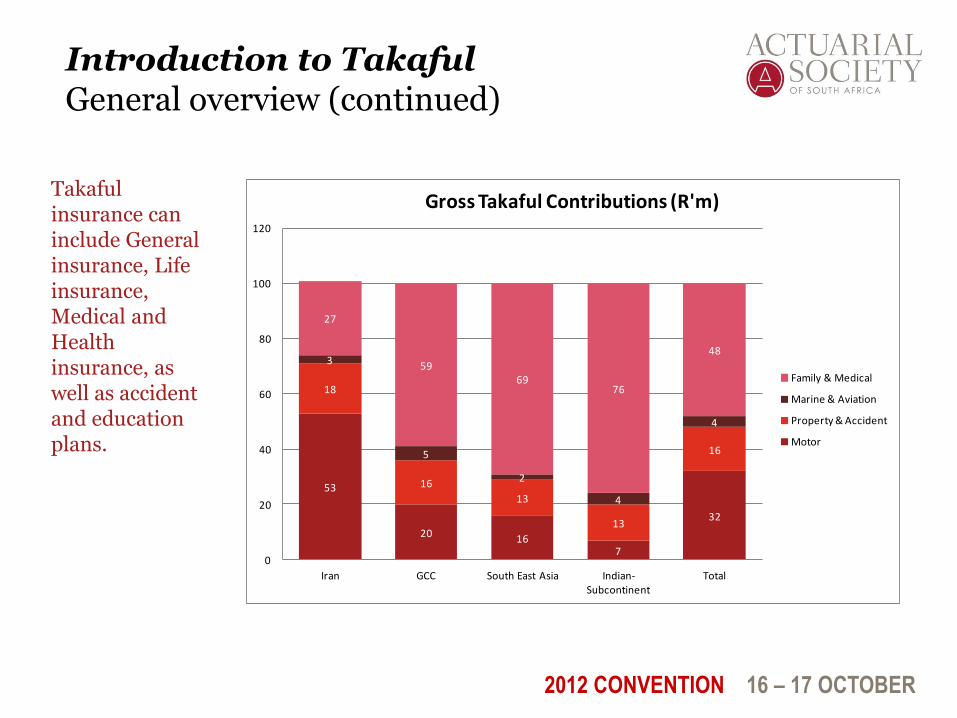
Introduction to Takaful General overview (continued)
Takaful insurance can include General insurance, Life insurance, Medical and Health insurance, as well as accident and education plans.
53
20 167
32
18
16
13
13
16
3
5
2
4
4
27
5969
76
48
0
20
40
60
80
100
120
Iran GCC South East Asia Indian-Subcontinent
Total
Gross Takaful Contributions (R'm)
Family & Medical
Marine & Aviation
Property & Accident
Motor
2012 CONVENTION 16 – 17 OCTOBER
Introduction to Takaful General overview (continued)
As in the conventional insurance industry, there is a need
for strong and reliable re-insurers in the Takaful space.
Although most Shariah scholars have allowed Takaful operators to re-insure
conventionally when no re-Takaful alternative is available, the development of re-
Takaful has been strongly encouraged.
From an operational perspective, the re-Takaful operator is set up in a similar manner
to the Takaful operator.
Examples of Re-Takaful companies are:
TakafulRe in Dubai – paid-up capital of USD 125 million and a BBB+ credit rating
BEST Re in Tunisia – paid-up capital of USD 55 million and a BBB+ credit rating

2012 CONVENTION 16 – 17 OCTOBER
Introduction to Takaful The African Market
The map below illustrates the countries in Africa which we have identified as showing the greatest potential for the expansion and growth of Takaful and Islamic Finance.
The countries in the Middle East and North Africa should also be considered as areas where African specialists can be involved - currently these markets are mainly served through European companies.
Legend: Key countries identified Middle East and North Africa Other
2012 CONVENTION 16 – 17 OCTOBER
Introduction to Takaful The African Market
Kenya, Tanzania, Sudan, Ethiopia
Stable economic region, with steady levels of growth and a highly educated population.
The region also has a significant Muslim population,
Nigeria, Ghana, Senegal, Ivory Coast, Cameroon
West Africa has the largest population concentration in Africa (including large proportion of Muslims).
Booming financial services industry
Morocco, Algeria, Libya, Tunisia
The Northern African Takaful and Islamic Finance market can be considered to be the most well established.
However, these markets have traditionally been serviced by companies in Europe and the U.K.
2012 CONVENTION 16 – 17 OCTOBER
Introduction to Takaful Summary market statistics
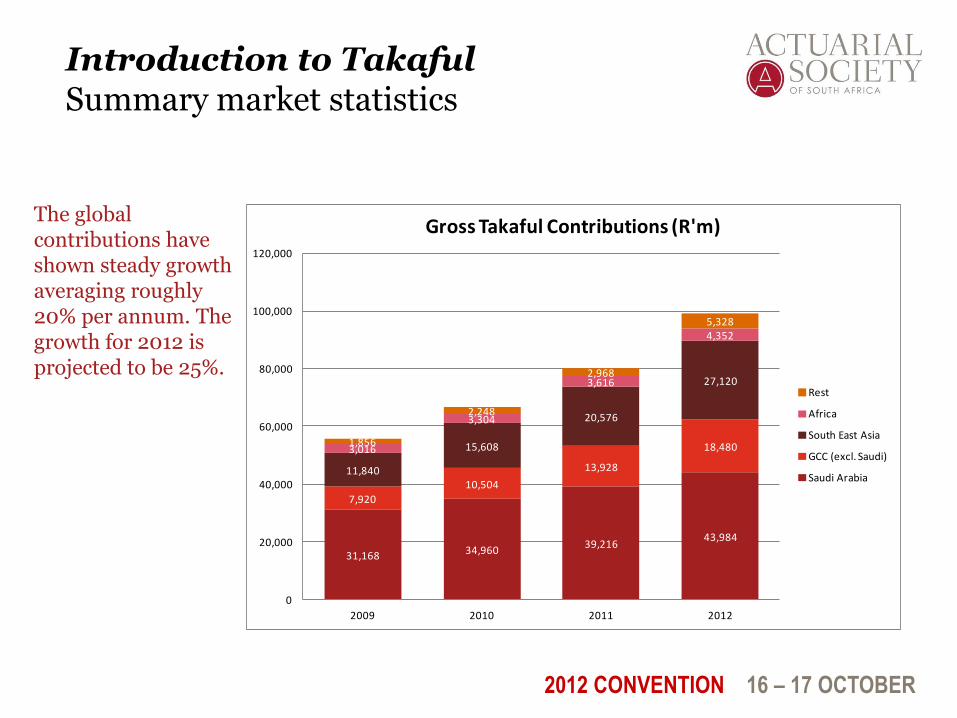
The global contributions have shown steady growth averaging roughly 20% per annum. The growth for 2012 is projected to be 25%.
31,168 34,96039,216
43,984
7,920
10,504
13,928
18,480
11,840
15,608
20,576
27,120
3,016
3,304
3,616
4,352
1,856
2,248
2,968
5,328
0
20,000
40,000
60,000
80,000
100,000
120,000
2009 2010 2011 2012
Gross Takaful Contributions (R'm)
Rest
Africa
South East Asia
GCC (excl. Saudi)
Saudi Arabia

2012 CONVENTION 16 – 17 OCTOBER PwC
Takaful Operating Models
Overview
Models
Mudharaba (“profit-share model”)
Wakala (“agency model”)
Wakala-Waqf (“hybrid model”)
2012 CONVENTION 16 – 17 OCTOBER
Takaful Operating Models Overview
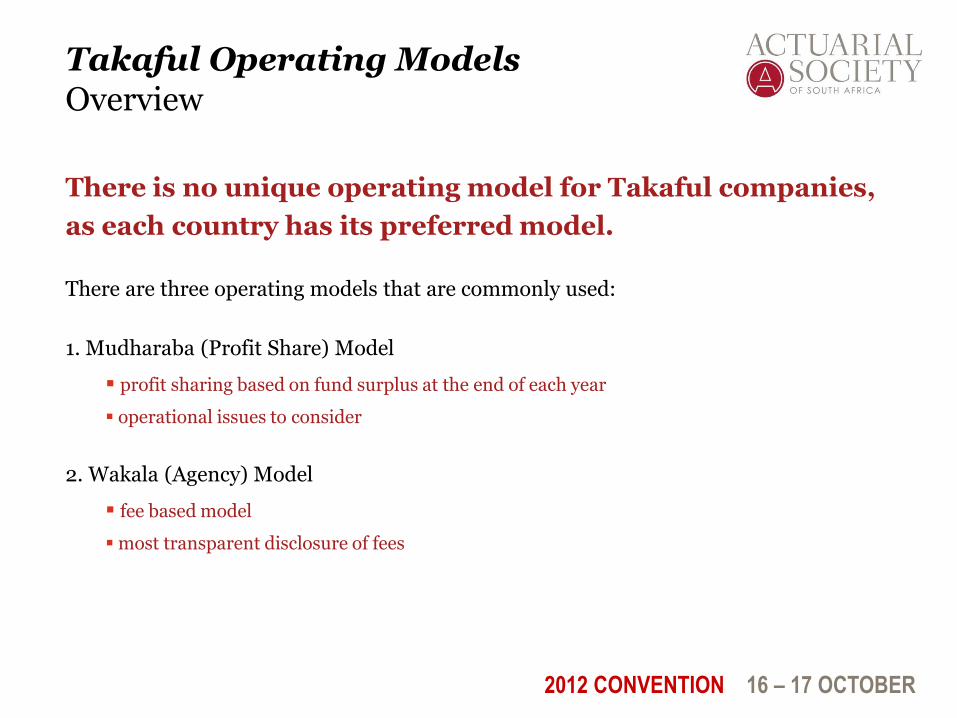
There is no unique operating model for Takaful companies,
as each country has its preferred model.
There are three operating models that are commonly used:
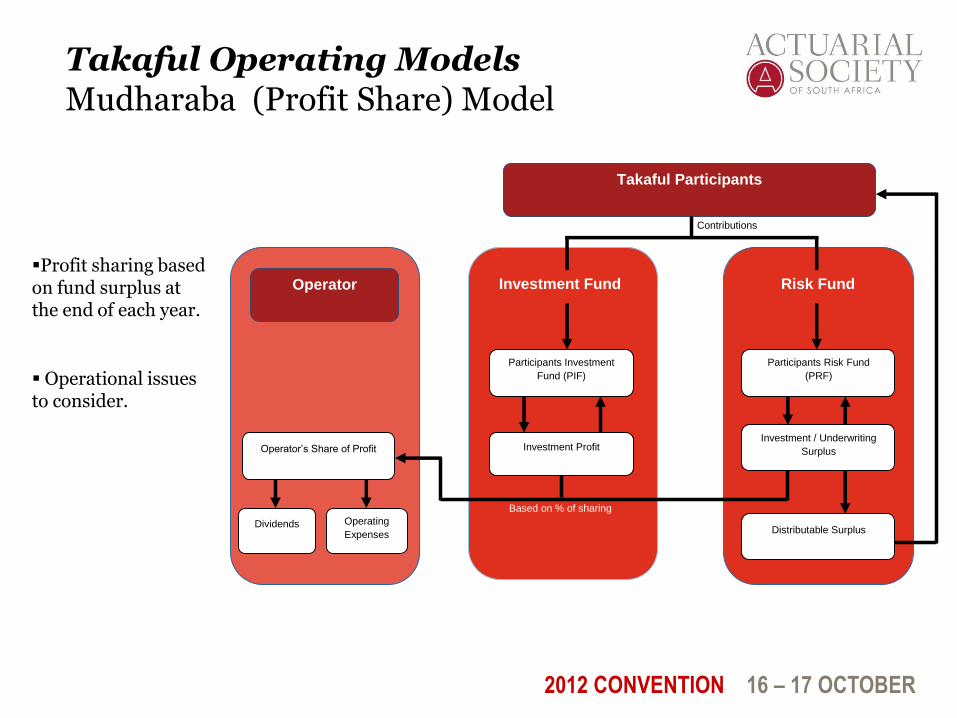
1. Mudharaba (Profit Share) Model
profit sharing based on fund surplus at the end of each year
operational issues to consider
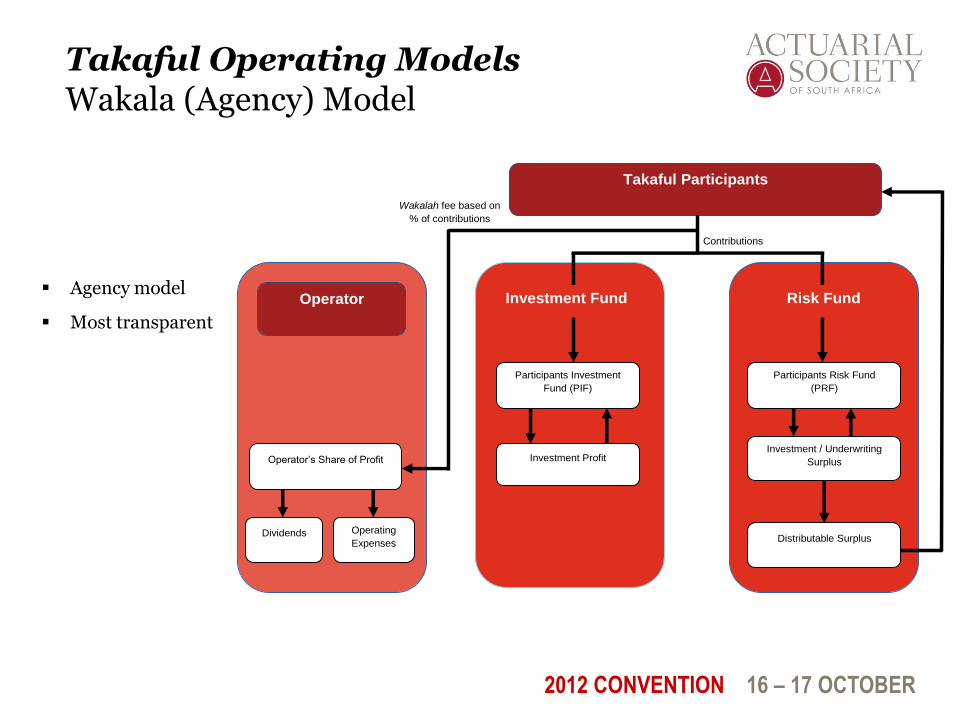
2. Wakala (Agency) Model
fee based model
most transparent disclosure of fees

2012 CONVENTION 16 – 17 OCTOBER
Takaful Operating Models Overview
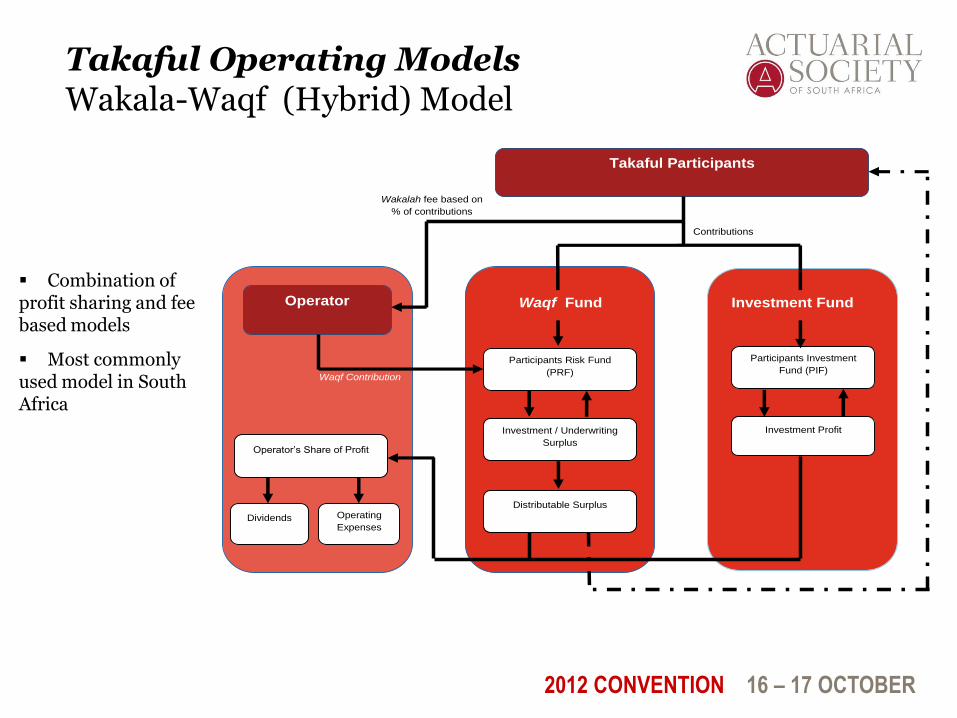
3. Wakala-Waqf (Hybrid) Model
combination of profit sharing and fee based models
most commonly used model in South Africa
Models by country
Saudi GCC Africa Asia
Mudharaba (Profit Share)
Wakala (Agency)
Wakala-Waqf (Hybrid)
2012 CONVENTION 16 – 17 OCTOBER
Takaful Operating Models Mudharaba (Profit Share) Model
Contributions
Participants Investment
Fund (PIF)
Participants Risk Fund
(PRF)
Investment Profit Investment / Underwriting
Surplus
Distributable Surplus
Operator’s Share of Profit
Operating
Expenses Dividends
Takaful Participants
Based on % of sharing
Operator
Investment Fund Risk Fund Profit sharing based on fund surplus at the end of each year.
Operational issues to consider.
2012 CONVENTION 16 – 17 OCTOBER
Takaful Operating Models Wakala (Agency) Model
Contributions
Participants Investment
Fund (PIF)
Participants Risk Fund
(PRF)
Investment Profit Investment / Underwriting
Surplus
Distributable Surplus
Operator’s Share of Profit
Operating
Expenses Dividends
Takaful Participants
Wakalah fee based on
% of contributions
Operator
Investment Fund Risk Fund Agency model
Most transparent
2012 CONVENTION 16 – 17 OCTOBER
Takaful Operating Models Wakala-Waqf (Hybrid) Model
Contributions
Participants Investment
Fund (PIF) Participants Risk Fund
(PRF)
Investment Profit Investment / Underwriting
Surplus
Distributable Surplus
Operator’s Share of Profit
Operating
Expenses Dividends
Takaful Participants
Operator
Investment Fund Waqf Fund
Wakalah fee based on
% of contributions
Waqf Contribution
Combination of profit sharing and fee based models
Most commonly used model in South Africa
2012 CONVENTION 16 – 17 OCTOBER PwC
Comparison of Models
Assumptions and Methodology
Performance Metrics
Probability of Qard (based on Stochastic Returns)
Cost of Capital
Present value of net cashflows to the Operator
Capital ratios
Risk Fund cashflows
Reduction in Yield
Return on Equity

2012 CONVENTION 16 – 17 OCTOBER
Comparison of Models Assumptions and Methodology
Product features:
10-year endowment assurance product with sum assured of R500,000
savings element in the investment fund
Assumptions:
Pricing margin of 40% above risk premium.
1000 stochastic projections (annual) across 10 years
– Investment returns based on LogNormal distribution (expected returns of 10%, volatility of 30%)
– Deaths based on Binomial distribution (n = 1,000, p = 0.2%)
product features are identical across all models
no new business

2012 CONVENTION 16 – 17 OCTOBER
Comparison of Models Performance Metrics
Stochastic Projection Results (frequency by year)
The majority of the loans occur in years 1 and 2. This is because the impact of poor investment returns outweighs the effect of other positive cashflows.
At later durations, these cashflows are less dependent on the actual investment performance.
0.00%
10.00%
20.00%
30.00%
40.00%
50.00%
60.00%
70.00%
80.00%
90.00%
1 2 3 4 5 6 7 8 9 10
Fre
qu
en
cy
Year
Qard Distribution (Investment)
Mudharaba
Wakala
Wakala-Waqf
2012 CONVENTION 16 – 17 OCTOBER
Comparison of Models Performance Metrics
Stochastic Projection Results (frequency by year)
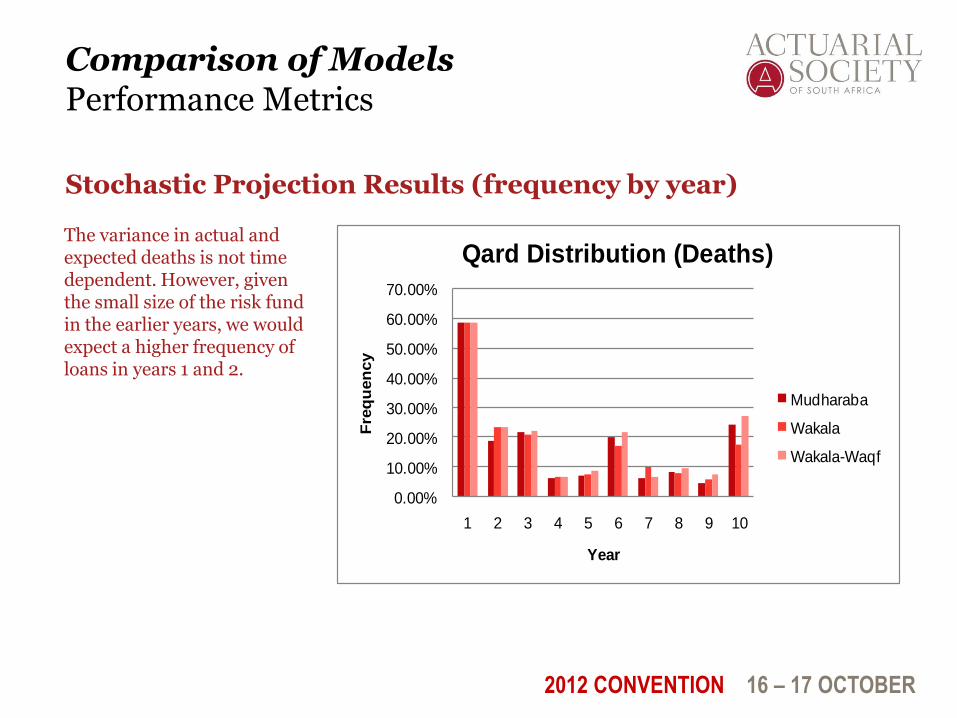
The variance in actual and expected deaths is not time dependent. However, given the small size of the risk fund in the earlier years, we would expect a higher frequency of loans in years 1 and 2.
0.00%
10.00%
20.00%
30.00%
40.00%
50.00%
60.00%
70.00%
1 2 3 4 5 6 7 8 9 10
Fre
qu
en
cy
Year
Qard Distribution (Deaths)
Mudharaba
Wakala
Wakala-Waqf
2012 CONVENTION 16 – 17 OCTOBER
Comparison of Models Performance Metrics
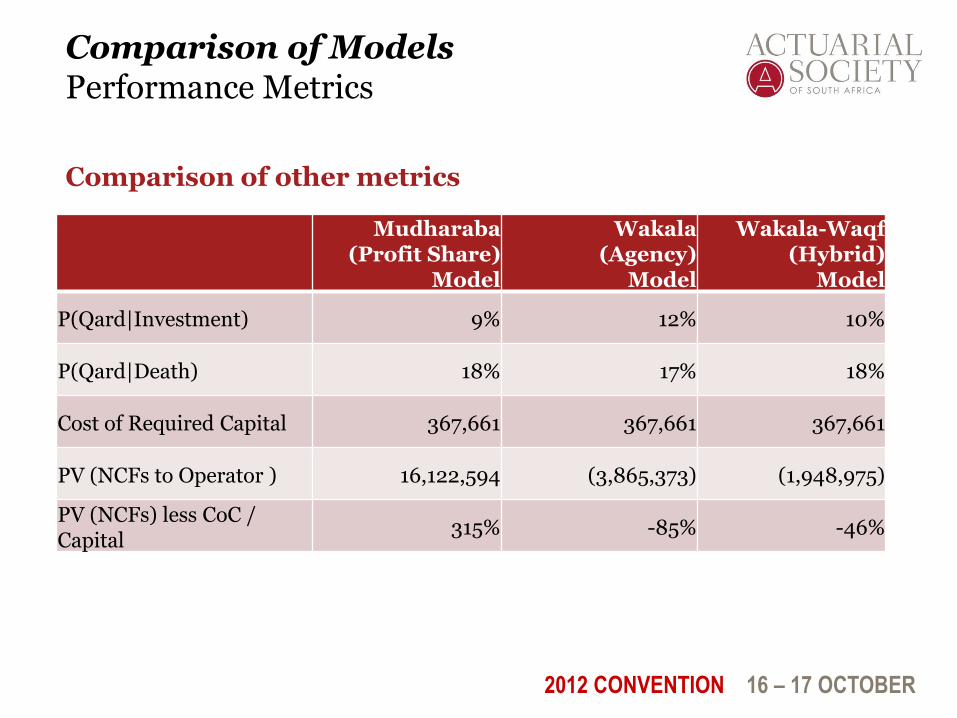
Comparison of other metrics
Mudharaba (Profit Share)
Model
Wakala (Agency)
Model
Wakala-Waqf (Hybrid)
Model
P(Qard|Investment) 9% 12% 10%
P(Qard|Death) 18% 17% 18%
Cost of Required Capital 367,661 367,661 367,661
PV (NCFs to Operator ) 16,122,594 (3,865,373) (1,948,975)
PV (NCFs) less CoC / Capital
315% -85% -46%

2012 CONVENTION 16 – 17 OCTOBER
Comparison of Models Performance Metrics
Comparison of other metrics
Mudharaba (Profit Share)
Model
Wakala (Agency)
Model
Wakala-Waqf (Hybrid)
Model
PV Claims / Premiums 55% 63% 57%
PV PH Surplus / Premiums
9% 18% 9%
PV SH Surplus / Premiums
23% 0% 23%
RIY 31% 1% 4%
Average ROE 379% -72% -24%

2012 CONVENTION 16 – 17 OCTOBER
Comparison of Models Performance Metrics
Conclusions and Limitation
Conclusions:
The Mudharaba (Profit Share) and Wakala-Waqf (Hybrid) model provide a
higher potential up-side to the Operator
The Wakala (Agency) model has the highest return to policyholders
Pricing of products will therefore differ under each of the 3 models. This may
include pricing for the likelihood of providing an interest-free loan.
Operational risk differs across all 3 models and hence capital requirement will
differ
The model results are dependent on the assumptions made up-front.

2012 CONVENTION 16 – 17 OCTOBER PwC
How Actuaries can get involved
How can we help in entering the Takaful market?
How can we help our in managing risk?
How can we help in meeting regulatory requirements?
2012 CONVENTION 16 – 17 OCTOBER
What Actuaries can offer
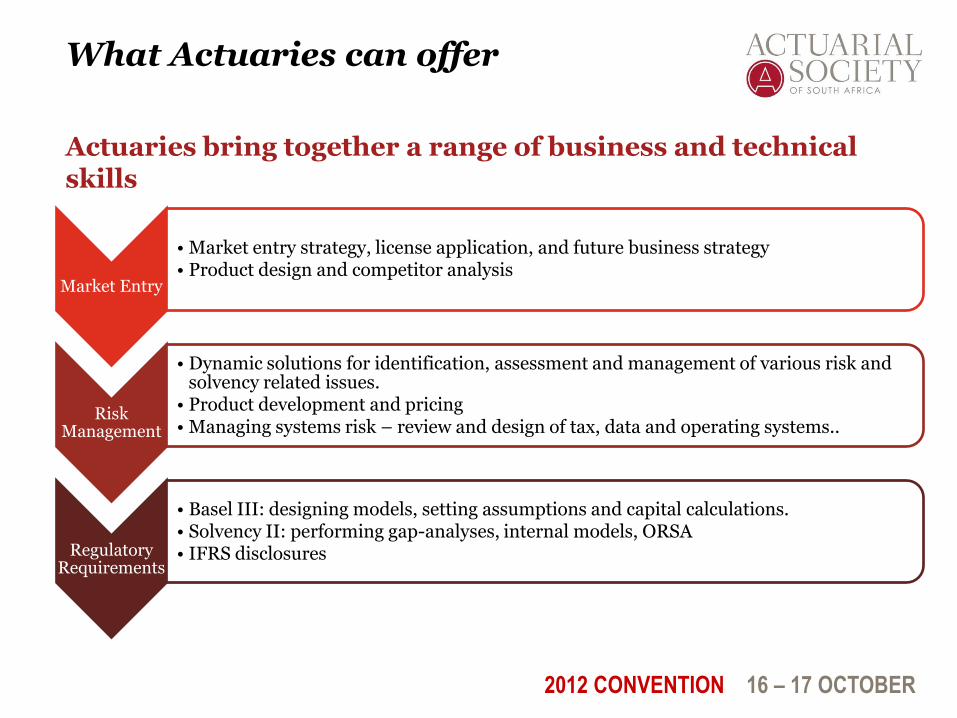
Actuaries bring together a range of business and technical skills
Market Entry
• Market entry strategy, license application, and future business strategy • Product design and competitor analysis
Risk Management
• Dynamic solutions for identification, assessment and management of various risk and solvency related issues.
• Product development and pricing • Managing systems risk – review and design of tax, data and operating systems..
Regulatory Requirements
• Basel III: designing models, setting assumptions and capital calculations. • Solvency II: performing gap-analyses, internal models, ORSA • IFRS disclosures

2012 CONVENTION 16 – 17 OCTOBER PwC
Discussion
Thank you:
David Kirk
Mohammed Khan