Embed Size (px)
Citation preview
Takaaki Kajita
ICRR, Univ. of Tokyo
Nufact05, Frascati, June
2005

◆New solar neutrino data from SNO and neutrino oscillations
◆New atmospheric neutrino data from Super-K and neutrino oscillations

SNO collab nucl-ex/0502021Also, M.Chen ENTApP2005

History of SNOHistory of SNO1999 2000 2001 2002 2003 2004 2005 2006
Pure D2O
Salt3He Counters
NOW
?
(1)e++de-+p+p (CC)
(also compared with SK +e+e)
(2)xdxpn, n+dt+(6.25MeV) (NC)
& e+de-+p+p (CC)
(3)x+dx+p+n, n+35Cl36Cl+’s(8.6MeV) (NC)
& e+de-+p+p (CC)
(4) New!New! Same as (3), but with improved stat. and syst.
(1)(2)
(3)(4)

391-day salt phase flux measurements391-day salt phase flux measurements
CC(e) = 1.68 (stat.) (syst.) × 106 cm−2s−1
ES(x) = 2.35 (stat.) (syst.) × 106 cm−2s−1
NC(x) = 4.94 (stat.) (syst.) × 106 cm−2s−1
+0.06
−0.06
+0.08
−0.09
+0.22
−0.22
+0.15
−0.15
+0.21
−0.21
+0.38
−0.34
vertex cossun ~ isotropy
029.0031.0023.0340.0
NC
CC
※The previous number based
on 254days salt data was: 0.306±0.026±0.024.
w/o 8B energy constraint

ee and ( and (++) fluxes) fluxes
SSM 68%CL
SNO NC 68%CL
SNO NC 68%CL
SNO CC68%CL
SNO CC68%CL SNO ES
68%CL
SNO ES68%CL SK ES
68%CL
SK ES68%CL
All the data are consistently explained within the standard oscillationAll the data are consistently explained within the standard oscillation
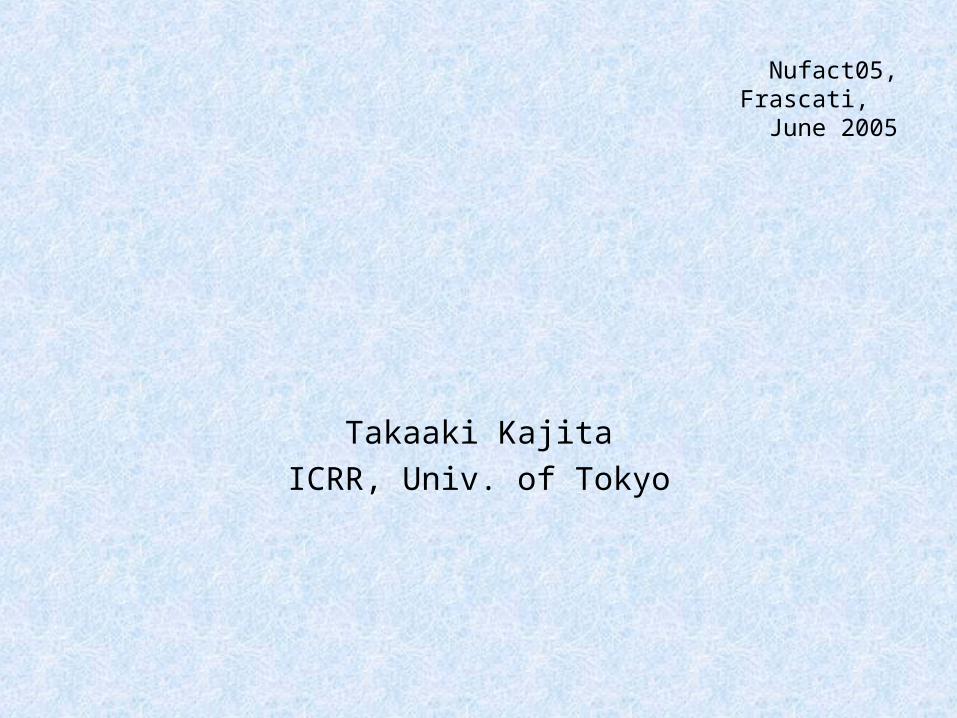
Comparison of results from SNO-DComparison of results from SNO-D22O O
phase and SNO-salt phasephase and SNO-salt phase
Pure D2O
Salt phase
Salt phase
CC spectrum constrained
Un-constrained
CCCC NCNC

New day-night results from the salt-phaseNew day-night results from the salt-phase
ANC=0 not required, E spectrum unconstrained:
ACC= -0.056±0.074±0.053
ANC=0 required, E spectrum constrained:
ACC= -0.015±0.058±0.027ACC(%)
AN
C(%
)A = 2(N-D) / (N+D)
LMA prediction = +2.7%
Combined result with the pure D2O ACC(=0.070±0.049+0.013-0.012):
ACC(phase-I+II)=+0.037±0.040
Combined result with the Super-K AES (=0.021±0.020+0.012-0.013)
assuming the dilution factor due to and fluxes is 1.55:
ACC(SNO+SK)=+0.035±0.027 consistent with the LMA prediction

Oscillation Analysis with 391-day SaltOscillation Analysis with 391-day Saltglobal solar with new SNO salt
global solar plus latest KamLAND and new SNO salt
SNO collab nucl-ex/0502021 Also many other analyses
Best fit 12=33.9deg. (previous = 32.5deg)

New SK-II dataNew SK-II data
Signal 5482 +132-130 (stat.)7.0 – 20.0 MeV622 days SK-II
Preliminary
SK-II Flux = 2.36 ±0.06 (stat.)+0.16-0.15x 10⁶/cm2/sec
(SK-I flux: 2.35 0.02(stat.) 0.08(sys.) )
Ready to start the physics analysis with the SK-II data.
SK collab. Y.Takeuchi WIN05
= 0.014+/-0.049(stat.) (sys.)ADN=(Day-Night)
(Day+Night)/2
(SK-I D-N asymmetry: -0.021+/-0.020+0.013-0.012)
Preliminary +0.024- 0.025

• SK-I atmospheric neutrino analysis with finer
binning.• Solar term effect and sin223 (SK-I)• Detection of CC interactions (SK-I)• SK-II data and 2 flavor oscillation analysis• SK-II L/E analysis
(preliminary)
SK collab. K.Scholberg, WIN05

SK-I SK-I atmatm analysis with finer binning analysis with finer binning
In the previous atmospheric neutrino analyses in Super-K,
Zenith-angle analysis good for sin22
L/E analysis good for m2
Single analysis that gives best sin22 and m2 ?
Full
oscillation
1/2 osci.
Important energy range to see the oscillation dip = multi-GeV
Finer energy bins for multi-GeV events
Important energy range to see the oscillation dip = multi-GeV
Finer energy bins for multi-GeV events
180 370 bins in (p, zenith, ev-type)180 370 bins in (p, zenith, ev-type)

Expected sensitivities (MC 5yr exposure)Expected sensitivities (MC 5yr exposure)
Zenith-180bin Zenith-370bin
L/E
@(sin22, m2)truth = (1.00, 2.5×10⁻³)
Zenith-370bin

Allowed region from the finer binning analysisAllowed region from the finer binning analysis
Old zenith-angle analysisL/E analysis
90% CL allowed region:
sin22> 0.93
2.0 < m2 < 3.0×10⁻³eV2
90% CL allowed region:
sin22> 0.93
2.0 < m2 < 3.0×10⁻³eV2
(preliminary)
Also consistent with all the other data
KamSoudan-2
K2K
MACRO

s2212=0.825 m212=8.3×10⁻⁵
m223=2.5×10⁻³
sin213=0
Because of the LMA solution, atmospheric neutrinos should also oscillate by (12, m12
2).
)( eP
Oscillation probability is different between s223=0.4 and 0.6 discrimination between 23 >/4 and </4 might be possible by studying low energy atmospheric e and events.
)(
)(
oscnoflux
oscflux
e
e
s223=0.4 =0.5 =0.6
However, due to the cancellation
between e
and e, the
change in the e flux is small.
Peres & Smirnov NPB 680 (2004)
479
Solar term effect to atmospheric Solar term effect to atmospheric

Constraint on sinConstraint on sin222323 with and without the solar terms with and without the solar terms
hep-ph/0408170 found the 2 minimum at sin223=0.46 (Also
E.Lisi this conference) …We need to understand the reason
for this difference.
w/o solar terms
w/ solar terms
Still (almost) maximum mixing is most favored.
(preliminary)

Search forSearch for CCCC eventsevents
CC events
hadrons
● Many hadrons .... (But no big difference with other (NC) events . )
BAD - likelihood analysis● Upward going only
GOOD Zenith angle
Only ~ 1.0 CC FC events/kton ・ yr
(BG (other events) ~ 130 ev./kton ・ yr)
Only ~ 1.0 CC FC events/kton ・ yr
(BG (other events) ~ 130 ev./kton ・ yr)
hadrons
CC MC

Tau likelihood (or NN) analysisTau likelihood (or NN) analysis Selection Criteria
multi-GeV, multi-ring most energetic ring : e-like log(likelihood) > 0 or NN > 0.5
total visible energy number of ring candidates distance between interaction point and decay-e point max(P) clustered sphericity log(sphericity)
downwarddownward
DATABG-MCtau-MC
Cut
likelihood
upwardupward
MC)
DATABG-MCtau-MC
Cut
likelihood
Num
ber
of e
vent
s

Zenith angle dist. and fit results (prelim., new)Zenith angle dist. and fit results (prelim., new)Likelihood analysis NN analysis
, e, & NC background , e, & NC
background
Data Data ×1.82 MC
×1.93 MC
coszenith coszenith
Nu
mb
er
of e
vent
s
145±48(stat)
+9 / -36 (osc. para. uncertainty)
152±47(stat)
+12 / -27 (osc. para. uncertainty)
79±31(syst) 79±31 (syst)
Fitted # of events
Expected # of events

SK-II atmospheric neutrino dataSK-II atmospheric neutrino dataFC&PC: 627days, Up-going muons: 609days
e-like -like

Allowed osc. parameter regionAllowed osc. parameter region
(preliminary)
SK-II data are consistent with the SK-I data.SK-II data are consistent with the SK-I data.
(preliminary)
(SK-I + II combined analysis: next stage)

SK-II L/E analysisSK-II L/E analysisL/E analysis was carried out for the SK-II data with the identical selection criteria as those in SK-I.
(preliminary)SK-II SK-I
Osc.
Decay
Decoh.
Consistent with SK-I.Oscillation still gives the best fit to the data.
Consistent with SK-I.Oscillation still gives the best fit to the data.

Allowed parameter region based on the Allowed parameter region based on the SK-II L/E analysisSK-II L/E analysis
(preliminary)
SK-II SK-I
SK-II data are consistent with the SK-I data.SK-II data are consistent with the SK-I data.
(SK-I + II combined analysis: next stage)

• New SNO salt result
• New SK(-II) atmospheric neutrino results
• No surprise
• But our knowledge on neutrino masses and mixing angles are improving.

end
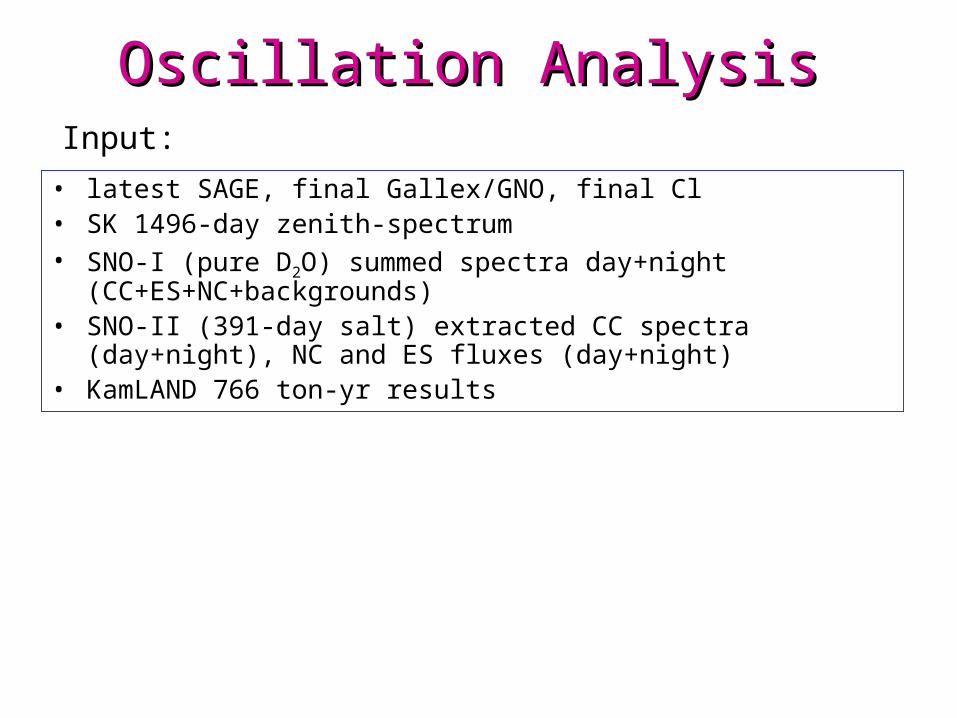
Oscillation Analysis Oscillation Analysis
• latest SAGE, final Gallex/GNO, final Cl • SK 1496-day zenith-spectrum • SNO-I (pure D2O) summed spectra day+night
(CC+ES+NC+backgrounds) • SNO-II (391-day salt) extracted CC spectra (day+night), NC and ES
fluxes (day+night) • KamLAND 766 ton-yr results
Input:

Binning for new analysis (=same binning as 3 flavor analysis)
E
Single-Ring
Multi-Ring
Up-stop
Up-through
37 momentum bins x 10 zenith bins = 370 bins in total
Multi-Ring e
Single-Ring e
PC-stop
PC-through
Same as old analysisfiner binning Sample used in 3-flavor
Fewer number of events per bin Poisson statistics to calculate 2
Multi-GeV
Sub-GeV
CC e CC


![[INNOVATUBE] Tech Talk #3: Golang - Takaaki Mizuno](https://img.pdfslide.us/doc/110x75/5870a4e31a28abcb078b58d9/innovatube-tech-talk-3-golang-takaaki-mizuno.jpg)