Embed Size (px)
Citation preview
2015
1. Spokesperson
Name:Jerry Harn
Title :President
Tel :(886)2-2771-6699#62111
E-mail:[email protected]
Acting Spokesperson
Name:Sunny Yao
Title :Executive VP
Tel :(886)2-2771-6699#62700
E-mail:[email protected]
2. Contact Information – Corporate Headquarters and Branches
Please see page23
3. Stock Registration Agent
Name:Fubon Securities Co., Ltd. Address:2F, No.17, Hsuchang St.,Taipei, Taiwan, R.O.C.
Website:www.fubon.com
Tel:(886)2-2361-1300
4. Credit Rating Institution
Name Address Tel
Taiwan Ratings Corporation 49F. Taipei 101 Tower, No.7, Sec. 5,
Xinyi Rd., Taipei city 110, Taiwan
(R.O.C.)
(886)-2-8722 5800
Moody’s Investors Service 24/F, One Pacific Place 88 Queensway
Admiralty, Hong Kong
(852)-3758-1300
Standard & Poor’s Ratings
Service
49F. Taipei 101 Tower, No.7, Sec. 5,
Xinyi Rd., Taipei city 110, Taiwan
(R.O.C.)
(886)-2-8722 5800
5. Certified Public Accountants for Fiscal Year 2015
CPAs:Amanda Wu, S. C. Huang
Company:Deloitte & Touche
Address:12F., No. 156, Sec. 3, Minsheng E. Rd., Taipei City 105, Taiwan (R.O.C.)
Website:www.deloitte.com.tw
Tel:(886)2-2545-9988
6. Exchange Houses where Overseas Securities are Listed:None
7. Website:www.fubon.com
CONTENTS
I. Message to Shareholders 1
II. Corporate Profile 5 1. Introduction 5
2. Organizational Structure 7
III. Business Operations 11 1. Business Information 11
2. Business Strategies and Business Plans 13
3. Research & Development Plans 16
4. Employees Profile 19
IV. Special Notes 20 1. Dividend Policy and Implementation Status 20
2.Implementation of the Internal Controls System 21
V. Headquarters and Branches 23
Appendix:Annual Financial Reports for
2015 and 2014
30
- 1 -
I. Message to Shareholders
Amid global economic doldrums last year, Taiwan suffered worse-than-expected exports
throughout the year for due to several factors, including sluggish market demand for consumer
electronics when vendors were still clearing backlogged inventories, and China’s continuing
localization of supply chains of, particularly, tech products that have to some extent dampened
demand for Taiwan-made counterparts. In Taiwan’s domestic market, spending and investments in
capital equipment by the private sector showed growth slowdown compared to that in 2014, despite
the Cabinet’s implementation of short-term stimulus measures. Under the scenario, Taiwan’s 2015
economic growth stood at only 0.75 percent, sharply shrinking from 2014’s 3.92 percent, as shown
by data compiled by the Cabinet-level Directorate General of Budget, Accounting and Statistics
(DGBAS).
With long-term, stable profitability being the ultimate goal of its business development
strategy, Taipei Fubon Bank (TFB) tapped the advantage of the integrated resources of its parent
company, Fubon Financial Holdings, to strengthen cross sales with affiliates on maximized
synergies, expand business scope and further build customer relations. Thanks to its continuously
growing businesses and strictly enforced risk management, TFB, looking to achieve a balance
between benefits and risks, effectively achieved consolidated after-tax net profits of NT$18.606
billion in 2015, retaining normal profitability.
In institutional banking, TFB continued exploring overseas markets, expanding its asset base
and improving return on assets, while actively developing new financial products to meet clients’
requirements and build a more complete platform for its financial products. In retail banking, TFB,
tapping the advantage of big data analytics and increasingly strong consumer demand for digital and
mobile financial services amid the Bank 3.0 shift (digitization of Taiwan’s financial services),
constructed and introduced various information systems into its operations, in an effort to expand its
e-banking functions and launch more mobile banking services, while integrating its virtual channels
and traditional banks in response to changes in consumer behaviors in the financial market. To
secure its business development and enhance efficiency of internal management while maximizing
operational performance, TFB reshuffled the top positions at its head office and reorganized its
retail banking department accordingly, and continued upgrading its information systems.
As to overseas business development, TFB, after acquiring Shanghai-based First Sino Bank
and renaming it Fubon Bank (China) in 2014 to explore the financial services market across Greater
China, including Shanghai, Pearl River Delta, Yangtze River Delta and Bohai Economic Rim
regions, has become China’s largest Taiwanese-operated bank in terms of service points and
coverage to take the lead among peers across the Taiwan Strait. In light of financial integration
increasingly a future trend in Asia, the bank has been approved to set up a branch in Singapore,
scheduled to come online in the first quarter of 2016, which will help extend its reach from Greater
China to Singapore to provide more comprehensive financial service and better tap business
opportunities in the ASEAN bloc, to be well on its way to compete among Asia’s top-caliber
financial firms.
To adapt to market changes and future business strategies, TFB reorganized its business units
in 2015 as summarized in the below.
1. To improve data quality and strengthen its management team, TFB set up the “Data
Application And Governance Committee.”
2. To better divide the duties and scope of authority of its retail banking channels, TFB
renamed “Central Operation Department-Retail Banking” as “Operation Service Department-Retail
Banking” while eliminating the “Branch Operation Management Department” to leave the
department’s original duties partly to “Branch Banking Department-Retail Banking” and partly to
- 2 -
“Operation Service Department-Retail Banking.”
3. To speed the development of its digital banking and the integration of related
retail-banking divisions throughout the organization to respond to the trend of digitization of
financial services, TFB renamed “eBanking Department-Retail Banking” as “Digital Banking
Department-Retail Banking” to focus on designing and developing functions of its digital banking
platforms, building connections among exiting platforms, integrating platform interface and
exploring new customer bases, as well as planning and developing emerging payment businesses.
4. To upgrade and integrate its information service capability, TFB set up “Channel
Intergration Department.”
5. During the reorganization, “General Affairs Department” was renamed as “Purchase &
Maintenance Support Department.”
With fulfilling of corporate social responsibility always among TFB’s concerns, including
environmental protection, social welfare, sustainable development, etc., the bank has been
streamlining operational procedures, promoting paperless operations and strengthening the “Green
Value” appeal of its financial services, in hopes of minimizing usage of paper and energy. It
continues to actively encourage clients to utilize automated banking equipment and online banking
services to help slash carbon footprint that typically result from conventional banking operations, in
an effort to wield its influence on the pursuit of a sustainable environment in the financial industry.
Additionally and underpinned by its business philosophy “Give Back What One Takes From
Society,” TFB regularly donates to its foundations yearly and encourages employees to set up
volunteer clubs to effectively support the Fubon Cultural & Educational Foundation, Fubon Charity
Foundation, Fubon Art Foundation and other foundations under the Fubon Group. Also tapping
synergies from other charitable organizations to give to charity, TFB donated generously to victims
of the dust-ignited explosion at the Formosa Fun Coast on June, 27, 2015 in Taiwan, and the
7.8-magnitude earthquake on April 25, 2015 in Nepal, showing its altruism and magnanimity
towards society.
Below are the 2015 business report and 2016 business plan:
1. 2015 Business Report
Taipei Fubon Bank’s consolidated after-tax net profits amounted to NT$18.606 billion in
2015, for NT$1.81 in earnings per share (EPS). As of the end of 2015, TFB’s consolidated assets
totaled NT$2.4098 trillion, with outstanding loans of NT$1.3535 trillion and outstanding deposits
of NT$1.8134 trillion.
While pursuing growth in business and profit, TFB spared no efforts to enforce strict risk
management, effectively keeping its non-performance loan (NPL) and NPL coverage ratios at the
phenomenal levels of 0.15 percent and 816.37 percent, respectively. The results underline TFB’s
high asset quality and lay the solid foundation for future development, also enabling effective
maintenance of its long-term credit rating of “twAA+” and short-term credit rating of “twA-1+”, as
well as a “Stable” outlook, as rated by Taiwan Rating Corp. in its report issued on November 16,
2015, all of which clearly reflect TFB’s excellent profitability and asset quality.
Thanks to the sound ratings mentioned above, TFB in 2015 is named the Best Bank in
Taiwan by Global Finance-Best Bank Awards, and has received awards from Asiamoney, The
Asset, IFR Asia and CFI for outstanding performance in institutional banking, as well as having
received rave reviews and awards from such globally known trade magazines as Global Views
Monthly, CommonWealth, Wealth Magazine, The Asian Banker, The Banker/PWM and
Euromoney for its enviable retail banking achievement in aspects of private banking, wealth
management, customer service and many others.
- 3 -
2. Summary of 2016 Business Plan
The global economy shows signs of slow recovery, with major international forecast bodies,
such as World Bank, IHS Global Insight, and International Monetary Fund, mostly having adjusted
downward global economic growth forecasts for the year. With Taiwan’s export-driven economy
highly related to economic performance of the U.S., Europe and China, increasing market
uncertainties in the said nations coupled with fluctuating crude oil prices have cast shadow on
Taiwan’s exports this year, hence making local enterprises hesitant to invest in fixed assets. In
response, DGBAS holds cautious economic outlook by issuing on February 17 a relatively mild
GDP growth forecast of only 1.47 percent for this year, compared to 0.75 percent in 2015.
In the face of volatility of the global financial market as indicated by roller-coasting of major
stock market since mid-2015, TFB will reinforce its risk management as priority in the years to
come, while continuing to improve organizational management structure, operational procedures
and information systems to sustain its long-term business development and enhance operational
efficiency. Also, TFB will integrate marketing resources and customer information to launch
competitive financial products to serve customers. To adapt to the trend of digitization and
mobilization of financial services, TFB will actively develop next-generation online and mobile
banking services to meet clients’ growing preference for digital life and changing shopping
behavior, and push the integration of virtual and physical services to build more convenient service
platforms in the future. In anticipation of emerging Fintech that looks to serve as a major growth
driver of Taiwan’s economy, TFB believes that innovation capability is key to sustainable growth
of financial firms amid growth of cloud computing, Internet of Things, biomedical engineering and
big data, and therefore will tap the resources of its Innovative Technology Office to work on the
cross-sectoral integration of digital financial services, aiming to build an edge over its peers and
foster a corporate culture of active service to make itself the most trustworthy bank in the minds of
customers..
(1). Institutional Banking Business
A. To further strength relations and enhance communication with customers to
continuously boost return on investment.
B. To set up more branches and increase market penetration to raise profit margins.
C. To expand overseas business deployment and raise the ratio of its outbound assets.
a. To expand scale of overseas branches and tap benefits of the cross-sectoral
integration.
b. To optimize utilizing advantages of its Singapore branch to increase regional
connections and speed boosting its overseas customer base.
c. To tap business opportunities brought by China’s “The Belt and Road Initiative”
when related risk factors are controllable.
D. To improve product range and reinforce its role as an operating bank.
E. To develop banking product portfolio to provide customers with wider range of
products and services.
F. To closely monitor industry trends, meticulously screen customers, enhance risk
monitoring and strengthen risk recognition to maintain excellent asset quality.
G. To recruit qualified people, cultivate talent and set up quality manpower pool to meet
business and channel growth needs in Taiwan and abroad and increase the quality
and quantity of marketing teams.
- 4 -
(2). Retail Banking Business
A. To optimize digital/mobile banking services.
TFB will expand functions and service scope of its online and mobile banking
platforms. With its brand new service platforms continually coming online, it will
provide customers with reliable digital financial services that meet demand for
self-directed wealth management.
TFB is actively planning the construction of emerging payment systems and
the integration of its service platforms, looking to anticipate customer demand and
provide plentiful financial production information through behavior analysis of users
via its digital platforms, and thereby build closer ties between customers and TFB to
increase customer satisfaction.
B. To integrate virtual and traditional service platforms to maximize the advantages of
full-function branches for retail banking.
In line with the development of Internet and mobile devices, TFB will change
business and marketing models as conducted by conventional banks. To that end,
TFB will adjust its branch establishment plan to retain competitive advantage across
the Taipei region and reinforce its operations in other counties, while trying to
increase customer willingness to access its broadened e-banking services from
mobile devices after reviewing the layout and improving access to its branch offices.
Specialists at physical branches will provide guidance on wealth management and
loan planning, with daily accounting work to be handled via the electronic platform,
realizing synergies from the integration of virtual and physical platforms.
Single-window specialized services will also be offered to help TFB fully understand
customer needs in terms of integrating assets and liabilities to offer products that
better meet their needs. On another front, it will also offer courtesy service at all its
branches as a means to boost its image as a quality bank.
C. To strengthen customized service.
TFB will continue to collect and build marketing information, as well as
analyze and apply massive information on the e-behavior of customers. This will
help TFB to more accurately grasp customer needs, provide competitive products
and services tailored to highly segmented customer groups, and thereby establish a
market leading position.
D. To improve credit scoring models and develop an automatic-screen environment.
To cope with growing online applications for home mortgages, TFB will
develop an online appraisal system to realize automated appraisal of fixed assets. It
will apply more screening parameters in personalized credit scoring models to
reduce human error and create an automatic screening mechanism to boost risk
management efficiency.
3. Credit Rating
Rating Date Credit Rating Institution Long-term
Credit Ratings
Short-term
Credit Ratings Outlook
2016/01/04 Moody’s A2 P-1 Stable
2015/11/16 Standard & Poor’s A- A-2 Stable
2015/11/16 Taiwan Ratings Corporation twAA+ twA-1+ Stable
- 5 -
II. Corporate Profile
1. Introduction
(1)Date of Establishment
Taipei Fubon Bank started operations on April 21, 1969 after being approved by the
Ministry of Finance (MOF. No. 7864).
(2)History of Bank
TFB's predecessor is Taipei City Bank, founded by the Taipei City Government on
April 21, 1969 to comply with national financial policy, adjust municipal finances,
support municipal development and serve as the municipal coffer, with its business
operations initially confined to Taipei City. Originally a financial agency, TFB was
reorganized into a limited company on July 1, 1984.
On Jan. 1, 1993, TFB was renamed "Taipei Bank Co., Ltd.," or "TAIPEIBANK" for
short. In line with the government's financial-liberalization policy, TFB set up a
branch in Kaohsiung City in 1994. On Jan. 20, 1995, it was approved to be
reorganized from a regional bank into a national bank, enabling it to expand
throughout Taiwan. TFB went public on July 23, 1997, raising NT$2 billion of fresh
capital through issuance of new shares for subscription by employees and the general
public. In line with governmental policy, TFB was privatized on Nov. 30, 1999. To
facilitate long-term development, TFB was converted into a wholly-owned subsidiary,
Fubon Financial Holdings, on Dec. 23, 2002, when it was delisted from the Taiwan
Stock Exchange.
After bringing Taipei Bank under its umbrella on Dec. 23, 2002, Fubon Financial
Holdings continued to operate Taipei Bank and its existing banking subsidiary Fubon
Bank independently, while integrating the information systems, workflows, and
organizations/employees of the two banks to retaining respective management
advantages and brand assets and minimizing the impact of the merger.
After a lengthy two-year merger process, Taipei Bank and Fubon Bank were
combined on Jan. 1, 2005, under the new name of Taipei Fubon Bank. The merger,
the first between a former government-owned bank and a private bank in Taiwan, not
only greatly expanded profit-making potential of Fubon Financial Holdings but also
set a milestone in the history of Taiwan's banking industry.
- 6 -
Taipei Fubon Bank incorporated Fubon Bills Finance, a wholly-owned subsidiary of
TFB, on Dec. 25, 2006, thereby removing the overlapping businesses of the two
entities. In addition, TFB set up a branch in Ho Chi Minh city, Vietnam, in June 2008.
On March 6, 2010, TFB acquired the Hanoi branch and the sub-branch in Ho Chi
Minh City of Chinfon Commercial Bank, and completed the entire administration
procedure for renaming the branches on June 7 that year. The bank's Vietnamese
operations now include three branches in Hanoi, Ho Chi Minh, and Binh Duong.
Fubon Insurance Broker, originally a wholly-owned subsidiary of TFB, underwent
clearance on August 31, 2010, according to a resolution passed by its board of
directors, with Taipei Fubon Bank serving as its bookkeeper.
TFB acquired a 10% stake in First Sino Bank on Dec. 31, 2013 and then gained
control of the latter by increasing the stake to 51% on Jan. 7, 2014. The acquired bank
was later renamed Fubon Bank (China).
TFB received approval from the Monetary Authority of Singapore for establishment
of a branch in the country on May 21, 2015, which is scheduled to become operational
sometime in the first half of 2016.
In 2015, TFB saw no changes in its management rights, no major changes in operating
mode and business scope, and no major incidents affecting shareholders' equity or the
bank's operations.
TFB was approved to cease operations of its branch in Los Angeles, the U.S. by the
Banking Bureau under the Cabinet-level Financial Supervisory Commission on
January 6, 2016 and formally close said branch by mid-2016.
- 7 -
2. Organizational Structure
(1) Organization
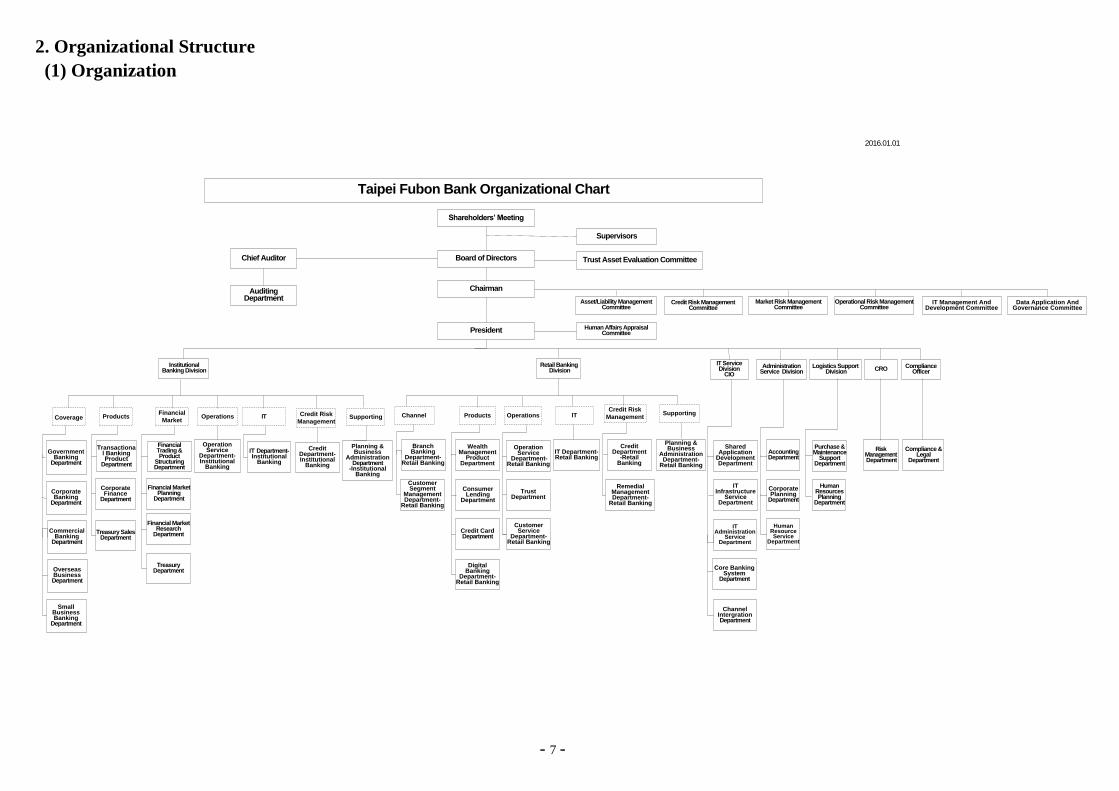
Taipei Fubon Bank Organizational Chart
Shareholders’ Meeting
Board of Directors
AuditingDepartment
Asset/Liability Management Committee
Institutional Banking Division
Corporate Banking
Department
Corporate Finance
Department
Transactional Banking Product
Department
Credit Department-Institutional
Banking
Commercial Banking
Department
Planning & Business
AdministrationDepartment
-Institutional Banking
Small Business Banking
Department
Overseas BusinessDepartment
Financial Trading & Product
StructuringDepartment
Treasury SalesDepartment
Administration Service Division
AccountingDepartment
Purchase & Maintenance
Support Department
Human ResourcesPlanning
Department
Corporate Planning
Department
IT Service Division
CIO
Shared Application
Development Department
IT Infrastructure
Service Department
ITAdministration
Service Department
Supervisors
Chairman
Branch Banking
Department-Retail Banking
Human Affairs Appraisal CommitteePresident
Chief Auditor Trust Asset Evaluation Committee
Government Banking
Department
Financial Market Planning
Department
Financial Market Research
Department
ITCoverage Products Operations Credit Risk
ManagementSupporting
Financial
MarketChannel Products Operations
TreasuryDepartment
OperationService
Department-Institutional
Banking
IT Department-Institutional
Banking
Operational Risk Management Committee
Credit Risk Management Committee
Market Risk Management Committee
Compliance &Legal
Department
Digital Banking
Department-Retail Banking
Customer Service
Department-Retail Banking
Credit CardDepartment
Wealth Management
Product Department
Consumer Lending
Department
Core Banking System
Department
Supporting
Credit Department
-Retail Banking
Retail Banking Division
Logistics Support Division
Remedial Management Department-
Retail Banking
Risk Management Department
ITCredit Risk
Management
Customer Segment
Management Department-
Retail Banking
OperationService
Department-Retail Banking
Trust Department
IT Department-Retail Banking
Planning & Business
Administration Department-
Retail Banking
2016.01.01
CRO ComplianceOfficer
Human Resource Service
Department
IT Management And Development Committee
Data Application And Governance Committee
Channel IntergrationDepartment
- 8 -
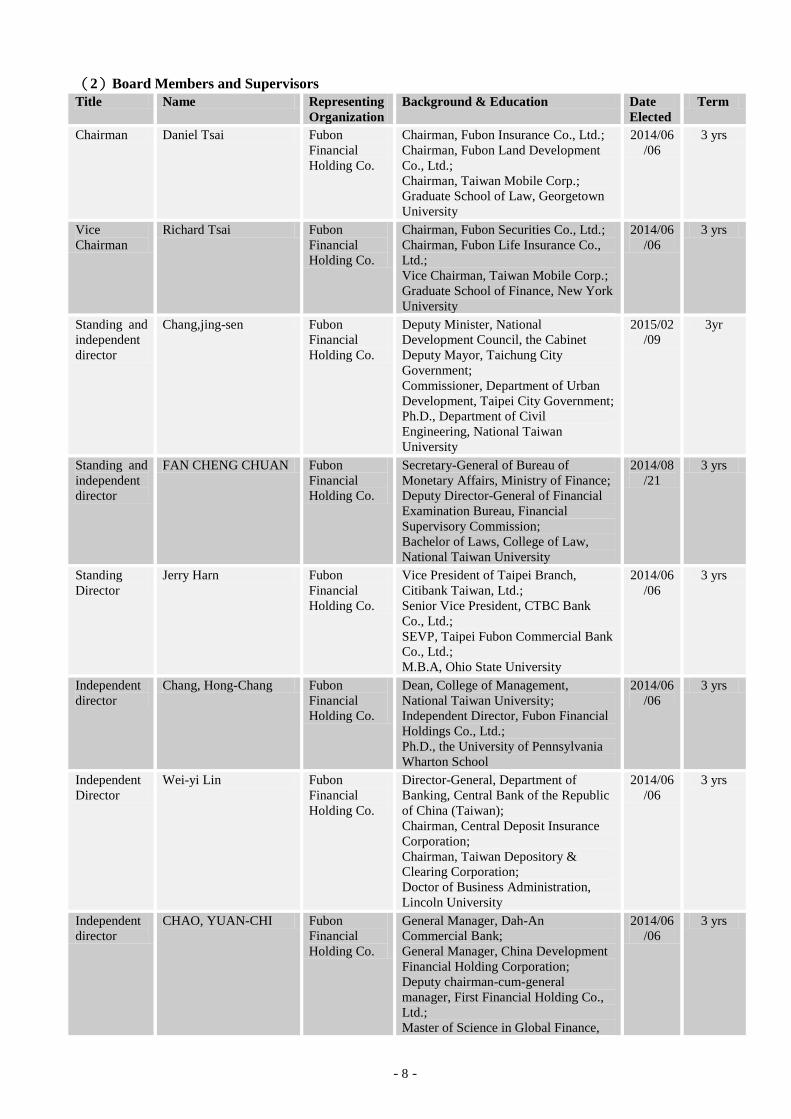
(2)Board Members and Supervisors
Title Name Representing
Organization
Background & Education Date
Elected
Term
Chairman Daniel Tsai Fubon
Financial
Holding Co.
Chairman, Fubon Insurance Co., Ltd.;
Chairman, Fubon Land Development
Co., Ltd.;
Chairman, Taiwan Mobile Corp.;
Graduate School of Law, Georgetown
University
2014/06
/06
3 yrs
Vice
Chairman
Richard Tsai Fubon
Financial
Holding Co.
Chairman, Fubon Securities Co., Ltd.;
Chairman, Fubon Life Insurance Co.,
Ltd.;
Vice Chairman, Taiwan Mobile Corp.;
Graduate School of Finance, New York
University
2014/06
/06
3 yrs
Standing and
independent
director
Chang,jing-sen Fubon
Financial
Holding Co.
Deputy Minister, National
Development Council, the Cabinet
Deputy Mayor, Taichung City
Government;
Commissioner, Department of Urban
Development, Taipei City Government;
Ph.D., Department of Civil
Engineering, National Taiwan
University
2015/02
/09
3yr
Standing and
independent
director
FAN CHENG CHUAN Fubon
Financial
Holding Co.
Secretary-General of Bureau of
Monetary Affairs, Ministry of Finance;
Deputy Director-General of Financial
Examination Bureau, Financial
Supervisory Commission;
Bachelor of Laws, College of Law,
National Taiwan University
2014/08
/21
3 yrs
Standing
Director
Jerry Harn Fubon
Financial
Holding Co.
Vice President of Taipei Branch,
Citibank Taiwan, Ltd.;
Senior Vice President, CTBC Bank
Co., Ltd.;
SEVP, Taipei Fubon Commercial Bank
Co., Ltd.;
M.B.A, Ohio State University
2014/06
/06
3 yrs
Independent
director
Chang, Hong-Chang Fubon
Financial
Holding Co.
Dean, College of Management,
National Taiwan University;
Independent Director, Fubon Financial
Holdings Co., Ltd.;
Ph.D., the University of Pennsylvania
Wharton School
2014/06
/06
3 yrs
Independent
Director
Wei-yi Lin Fubon
Financial
Holding Co.
Director-General, Department of
Banking, Central Bank of the Republic
of China (Taiwan);
Chairman, Central Deposit Insurance
Corporation;
Chairman, Taiwan Depository &
Clearing Corporation;
Doctor of Business Administration,
Lincoln University
2014/06
/06
3 yrs
Independent
director
CHAO, YUAN-CHI Fubon
Financial
Holding Co.
General Manager, Dah-An
Commercial Bank;
General Manager, China Development
Financial Holding Corporation;
Deputy chairman-cum-general
manager, First Financial Holding Co.,
Ltd.;
Master of Science in Global Finance,
2014/06
/06
3 yrs
- 9 -
Title Name Representing
Organization
Background & Education Date
Elected
Term
New York University
Director Fang-Ling Yang Fubon
Financial
Holding Co.
Associate Professor, National Sun
Yat-Sen University;
Director, Fubon Financial Holding Co.,
Ltd.;
Ph.D. in Law, Bielefeld University
2015/02
/09
3 yrs
Director Vivien Hsu Fubon
Financial
Holding Co.
Director and General Manager, Taiwan
Mobile Corporation;
CFO, Cathay Financial Holdings Co.,
Ltd.;
Master of Business Administration, The
University of New South Wales,
Australia
2014/06
/06
3 yrs
Director Eric Chen Fubon
Financial
Holding Co.
President, Chinatrust Financial
Holdings Co., Ltd.;
President, CTBC Bank;
Head, Citgroup, Taiwan;
Master of Business Administration,
University of Missouri
2015/07
/01
3 yrs
Director Patrick. Chang Fubon
Financial
Holding Co.
CRO (Executive Vice President),
Taipei Fubon Commercial Bank;
Senior Deputy President, HSBC in
Taiwan;
Master of Business Administration,
The University of Chicago
2014/06
/06
3 yrs
Director John Y. Kuang Fubon
Financial
Holding Co.
Head of Standard Chartered’s Business
Banking & Global Marketing Division;
General Manager, Polaris Securities
Co., Ltd.’s bonds business deparment;
Executive Vice President, Tai Yu
Securities Group; General Manager,
Tai Yu Securities Investment Trust Co.;
Bachelor of International Trade,
Department of Commerce, National
Taiwan University
2014/06
/06
3 yrs
Director Morris Huang Fubon
Financial
Holding Co.
Senior Vice President, Taishin
International Bank;
President, Citibank Trust Fund,
Citibank Taiwan;
Vice President, Investment Business
Department, Citibank Taiwan;
Master of Business Administration, The
Ohio State University
2014/06
/06
3 yrs
Director Eric Wu Fubon
Financial
Holding Co.
Senior Consultant, Fubon Financial
Holding Co., Ltd.’s
wealth-management business division;
Senior Vice President, CTBC Bank;
EMBA, National Taiwan University
2014/06
/06
3 yrs
Standing and
independent
director
Wen-Ssn Chuang
(Note 2)
Fubon
Financial
Holding Co.
Professor, Institute of Oceanography,
National Taiwan University;
Bachelor of Science in Geophysics,
Department of Physics, National
Central University;
Ph.D., Dept. of Earth & Planetary
Sciences, Johns Hopkins University
2014/06
/06
3 yrs
Director Benny Chen
(Note 3)
Fubon
Financial
Holding Co.
Chairman, Fubon Securities Co., Ltd.
President, Citibank in China;
Deputy CEO, CTBC Financial Holding
Co., Ltd.;
2014/06
/06
3 yrs
- 10 -
Title Name Representing
Organization
Background & Education Date
Elected
Term
Senior Vice President, McDonald’s
Taiwan.;
Master of Business Administration,
Southern Illinois University
Supervisor Tsan-Ming Shih Fubon
Financial
Holding Co.
Chairman, Fubon Insurance Co., Ltd.;
Senior Consultant, Fubon Financial
Holding Co., Ltd.’s insurance business
division;
Bachelor of Laws,Soochow University
2014/06
/06
3 yrs
Supervisor Thomas Liang Fubon
Financial
Holding Co.
President, consumer-banking group,
Fubon Financial Holding Co.;
President, Retail Banking, Taipei
Fubon Commercial Bank;
Managing Director, Fubon Bank (Hong
Kong);
Master of Science in Operations
Research, Case Western Reserve
University
2014/06
/06
3 yrs
Supervisor LIN.KUN-SAN Fubon
Financial
Holding Co.
Branch Chief, Xiamen Bank Co., Ltd.;
Ph.D. in Global Economics, School of
Economics, Nankai University;
Master of Finance, National Taiwan
University
2014/06
/06
3 yrs
Note 1:The tenure of the 12th board of directors and supervisors of the company is June 6, 2014 - June 5, 2017.
Note 2:Wen-Ssn Chuang resigned the tenure of the 12th board of directors on January 5, 2015.
Note 3:Benny Chen resigned the tenure of the 12th board of director on July 1, 2015.
(3)Major Shareholder of Major Institutional Shareholder
Institutional Shareholders Major Shareholder of Major Institutional Shareholder
Fubon Financial
Holding Company Taipei City Government、Ming Tong Co.、Dao Ying Co.
- 11 -
III. Business Operations
1. Business Information
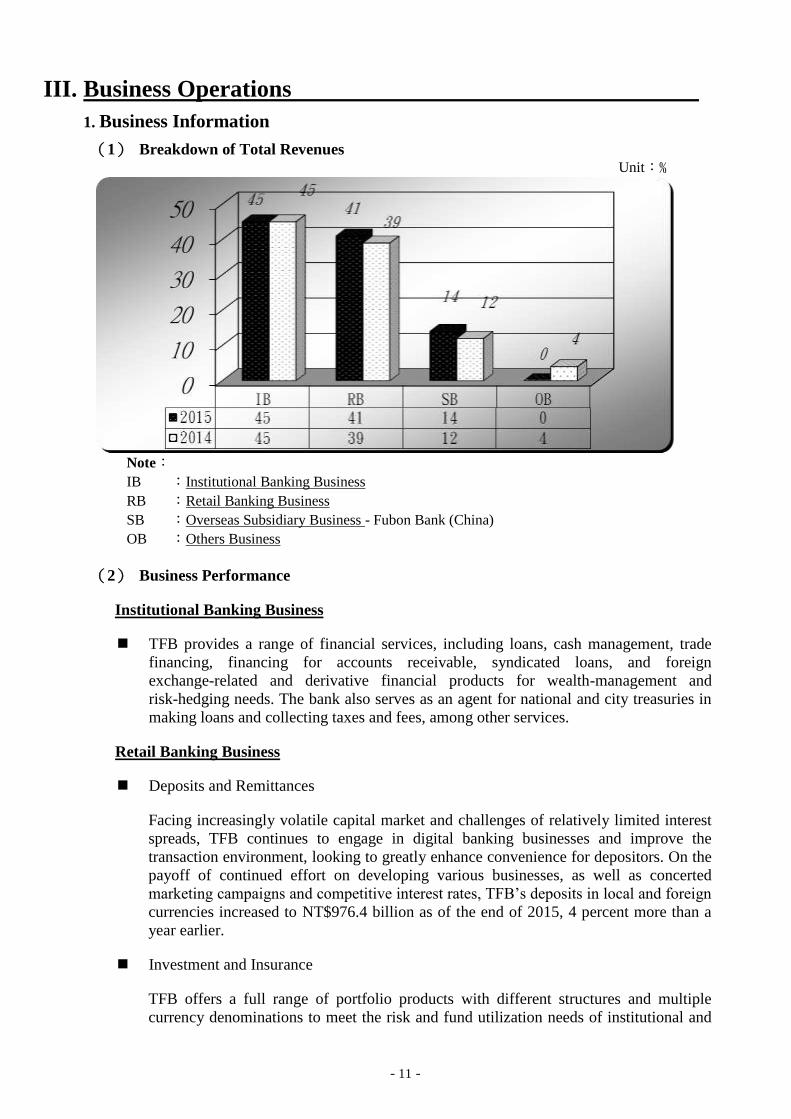
(1) Breakdown of Total Revenues Unit:﹪
Note:
IB :Institutional Banking Business
RB :Retail Banking Business
SB :Overseas Subsidiary Business - Fubon Bank (China)
OB :Others Business
(2) Business Performance
Institutional Banking Business
TFB provides a range of financial services, including loans, cash management, trade
financing, financing for accounts receivable, syndicated loans, and foreign
exchange-related and derivative financial products for wealth-management and
risk-hedging needs. The bank also serves as an agent for national and city treasuries in
making loans and collecting taxes and fees, among other services.
Retail Banking Business
Deposits and Remittances
Facing increasingly volatile capital market and challenges of relatively limited interest
spreads, TFB continues to engage in digital banking businesses and improve the
transaction environment, looking to greatly enhance convenience for depositors. On the
payoff of continued effort on developing various businesses, as well as concerted
marketing campaigns and competitive interest rates, TFB’s deposits in local and foreign
currencies increased to NT$976.4 billion as of the end of 2015, 4 percent more than a
year earlier.
Investment and Insurance
TFB offers a full range of portfolio products with different structures and multiple
currency denominations to meet the risk and fund utilization needs of institutional and
- 12 -
retail investors, including funds, ETFs, structured products, overseas bonds and
insurance. At the end of 2015, TFB's outstanding investment and insurance business
reached NT$600.5 billion, up 9 percent from a year earlier.
Loans
TFB achieved steady growth in mortgage lending in 2015 despite slowing growth
momentum in the domestic realty market due to market-cooling measures by the
government. New housing loans amounted to NT$118.8 billion at the end of the year
for a 15 percent increase over 2014, adding to the outstanding total of NT$437.7 billion,
up 12 percent. As of the end of last November, TFB’s share in the domestic market for
housing and house-repairing loans rose to 5.50 percent, compared to 5.16 percent at the
end of December, 2014.
In the unsecured loans sector, TFB witnessed its outstanding loans reach NT$44.5
billion at the end of 2015, helped by efforts to attract salary-transfer and group accounts,
flexible marketing strategies, and streamlined lending procedures, albeit with a slight
decline of student loans amid Taiwan’s slowing birth rate being a major offsetting
factor. Credit quality was maintained by focusing on quality of cardholders and strictly
managing risk.
Credit Cards
In 2015, TFB continued to expand its bankcard portfolio to develop new consumer
groups and sign up quality wealth-management customers for TFB's credit card service,
effectively driving total spending on TFB's credit cards by 12 percent over last year,
helped by joint promotions with co-branding partners. TFB also led Taiwan’s top-six
credit card issuers by average monthly spending on credit cards.
Individual Trust
TFB focused on promotion of money trust products featuring designated single
management and usage. These products meet wealth-management needs by providing
comprehensive asset security package covering insurance money trust, retirement
package and children's education and expense funds. TFB also helps customers with
asset transfer planning in well-rounded wealth management programs.
Overseas Subsidiary Business:
To satisfy demand of Taiwanese enterprises operating in China for financial services,
Fubon Bank (China) speeded constructing its information system, optimizing flows for
loan applications and expanding its branches. In the meantime, the subsidiary continued
to adjust the structure of customers and carry out business transformation in line with
the guidance included in China’s national policies on extended credit for municipal
development to local governments.
Ever since issuing its debit card as the top-rated Taiwanese bank in China to target
Taiwanese customers in need of convenient financing and travel there, Fubon Bank
(China) has further offered various value-added services, including preferential benefits
on cross-border, inter-bank cash withdrawals to registered customers, hence boosting its
cumulative circulation to 25,860 debit cards as of the end of December, 2015, including
24,522 cards issued in the year alone.
- 13 -
2. Business Strategies and Business Plans
(1)Business Strategies
Institutional Banking Business
TFB will continue to explore new customer segments and extend services through its
cross-border platform and one-stop service offering.
In line with regulatory and market changes, TFB will develop innovative niche
financial products to differentiate its services and boost competitiveness.
TFB will further reinforce its risk management according to different customer
segments, so as to realize effective allocation of risky assets.
TFB will continue to recruit and internally foster high-quality personnel to hone its
international banking expertise of its corporate banking specialists.
Retail Banking Business
Based on business intelligence, TFB will determine features of different customer
groups to tailor products to their needs. It will also regularly examine risk-bearing
levels of customers to provide multiple options for asset allocation to expand its
wealth-management services to new customer groups and increase customer loyalty.
TFB will review the layout of branch offices and improve access to create a friendly,
comfortable experience and a new image. It will also duplicate the successful
experience of exemplary branches to further upgrade service quality and cement
customer relationships.
TFB will expand digital platforms, channels, and conduits to further promote business.
It will integrate physical and virtual channels to enhance product promotion, expand
customer base, and boost customer satisfaction.
TFB will analyze target customer groups to help formulate effective marketing strategy,
as well as use visual design and intensive promotion to boost its market visibility.
Overseas Subsidiary Business:
Fubon Bank (China) will continue to open new branches, extending its Shanghai base
into a regionally balanced network to build national presence.
Fubon Bank (China) will continue to innovate and optimize its business models, create
value with quality service, and provide a fuller range of financial products to boost
profits and secure multiple revenue streams.
Fubon Bank (China) will expand its e-platform with mobile and smart banking systems,
by streamlining operating flow to enrich the customer experience.
Fubon Bank (China) will solicit business from high-quality Taiwanese-invested and
mainland Chinese enterprises (including high-growth enterprises and SMEs). In the
former segment, it will provide consulting and financing services targeting main
customer groups, backed by resources from Fubon Group and its advantageous network
established across the Taiwan Strait, to help Taiwanese enterprises operating in China
develop and transform business operations. Also, the launch of specialized services as
- 14 -
offered by investment banks will be part of its future business plan.
As to retail banking business targeting overseas Taiwanese customers, Fubon Bank
(China) will further promote its LINE FRIENDS credit cards, virtual banking services,
wealth-management services with foreign exchange denominations, direct fund sales
and various loan products. It will also launch private banking services at its branches in
Shanghai and a planned branch in Chengdu. These promotional strategies will help
Fubon Bank (China) to not just increase its market share, but attract customers with
more considerate services and better localized operations.
Others
TFB will review human resource flow (planning, recruitment, training, evaluation,
career development, and talent retention) to expand and build professional expertise of
its teams. Personal wealth-management services will be shifted to a consultation model
in place of the one-way marketing approach used previously.
TFB will strengthen understanding of its customers and their risk tolerance to provide
products meeting needs in different life stages, while applying risk-management
mechanisms to minimize risk exposure.
(2)Business Plans
Institutional Banking Business
To strengthen relations and increase communication with customers to continuously
expand profitability.
To set up new branches and increase market penetration to raise profit margins.
To focus more on overseas operations and raise the ratio of outbound assets.
To expand scale of overseas branches and tap benefits of the cross-sectoral
integration.
To better take advantage of its Singapore branch to increase regional connections
and speed boosting its base of overseas customers.
To tap business opportunities brought by China’s “The Belt and Road Initiative”
when related risk factors are controllable.
To improve product assortment and reinforce its role as an operating bank.
To develop banking product portfolio in line with market changes to satisfy customers
with a wider range of products and services.
To closely monitor industry trends, meticulously screen customers, enhance risk
monitoring and strengthen risk recognition to maintain excellent asset quality.
To recruit qualified people, cultivate talent and set up quality manpower pool to meet
business and channel growth needs in Taiwan and abroad and increase the quality and
quantity of marketing teams.
To vie for local government tenders with better credit rating achieved by strict credit
risk assessments according to local government structures.
- 15 -
TFB will seek government treasury service opportunities, build on the experience of
serving as the treasury service provider of the Taipei City Government.
Retail Banking Business
TFB will steadily diversify its wealth-management product mix and focus promotion of
main products, and increase funding for insurance paid in installment and fixed deposits
denominated in NT- dollar. It will aim to maintain growth momentum in its home
mortgage business, while strengthening its capability of risk-based pricing and expand
scale of its unsecured loans. As to the credit card business, TFB will rid of less
profitable ones from its portfolio, dedicate its resources to serving higher-end customers,
and launch promotional activities to motivate new cardholders to activate credit cards.
TFB will offer redirecting services for customers among its branches and personal
financial planning services to better serve quality customers. It will also expand its
marketing teams, tap synergies of its institutional banking department, retail banking
department and subsidiaries, and extend its service coverage to central and southern
Taiwan while retaining its lead in the northern region.
TFB will reinforce the development of potential customer groups to expand the base of
its customers of structured investment products, and help them achieve capital growth
by offering financial advice. Meanwhile, it will apply big data to sharpen its precision
marketing techniques.
TFB will further enhance functionality of its digital service platforms, develop diverse
emerging payment products, and improve cross-platform connectivity, so as to satisfy
customers with optimized user experience and convenient, efficient digital services
amid growing consumer preference for self-directed wealth management today.
TFB will continue to improve the quality of its services based on feedback from
customers and through regular thorough reviews, and cultivate a customer-centered
corporate culture to offer more personalized services.
Overseas Subsidiary Business:
Institutional Banking Business
Fubon Bank (China) will improve its diversified financial service and foster product
innovation to secure more growth momentum for profitability and boost profits and
operational efficiency.
Responding to growing demand of Taiwanese enterprises operating in China for
corporate financial service, Fubon Bank (China) will tap the advantages of its
existing local branches and benefits resulting from the reinforced financial and
economic cooperation between Taiwan and China to explore the segment.
Fubon Bank (China) will take advantage of the network formed by its branches in
free trade zones to accelerate the development of cross-border financial products
and services as part of its effort to explore markets for cross-border finance, trade
finance and foreign exchange derivatives.
To develop asset management business to diversify its financial service and secure
more growth momentum is included in Fubon Bank (China)’s overseas operations
plan.
- 16 -
To hone its competitiveness in the segment for Internet finance, Fubon Bank (China)
will optimize its e-banking functions, enhance service convenience, and tap its
platforms to innovate product and services, such as electronic ticketing.
Fubon Bank (China) will continue to open new branch offices and maximize such
benefits through physical and e-banking networks to achieve bigger market share.
Retail Banking Business
Fubon Bank (China) will complete the construction of seven computer systems for
wealth management, loans business, e-banking and customer information
management, so as to enhance its retail banking operational efficiency and enrich
customer experience.
Fubon Bank (China) will add differentiated features to its branches for more relaxed
mood according to local taste and customer preference.
To satisfy customers with consultative selling, Fubon Bank (China) will continue to
foster expertise and marketing skills of its specialists, develop diversified wealth-
and debt-management products and set up investment consulting and coordinated
marketing teams.
Fubon Bank (China) will enhance utility of its e-banking platforms, and diversity of
business operations online, and upgrade its self-service banking equipment, so as to
dedicate its virtual platforms to handle daily operations and boost operational
efficiency. In light of trends in account management in mainland China, it will also
consider introducing high-end technologies, such as a biometric system, to enable
remote bank account opening in the future.
Targeting foreigners in China who have difficulty applying for loans there, Fubon
Bank (China) will expand scope of its loans business to offer a diverse loan
portfolio, including small business startup and student loans, operating loans,
consumer loans, home mortgage and subprime loans.
3. Research & Development Plans
(1)R&D Expenses
Unit: NT$1,000 Year 2015 2014
Amount 246,997 228,171
(2)R &D Achievements
In line with the Bank 3.0 promoted by Financial Supervisory Commission, TFB has
finished developing various online banking platforms in 2015.
TFB has applied data analytics and data mining models in demand-oriented analysis of
segmented customer groups (by such parameters as life stages, wealth potential and
investment preference) using existing customer data and external sources of credit
information, and has accurately collated customer needs, so as to better conduct
precision marketing. The results of such effort have been satisfactory, as its marketing
accuracy has been raised by 1 to 5 folds.
In 2015, TFB set up digital banking service zones in all its branches, where customers
ushered by service representatives experience the convenience of e-banking and mobile
- 17 -
banking services, to have effectively raises the number of users of such services.
After redesigning its Internet banking platform, TFB in March, 2015, launched its
brand new mobile banking system with improved operational interface, which
facilitates easy operation of the system via instinctive design to differentiate it from
typical platforms developed by local peers.
Throughout 2015, TFB continually launched payment services, including smartphone
card payment in July, and Wali smart wallet and QR code payment in August in
cooperation with Taiwan Mobile Corp., after debuting its MasterPass service, to meet
customer demand for diverse mobile payment methods.
TFB continued to develop a new customer-screening and credit-checking system and a
risk-assessing model in 2015, in effort to enhance accuracy of credit rating and
efficiency of credit checking.
TFB established an independent database for data dictionary, which enables the support
of data format displayed in native languages, English and optional languages.
TFB upgraded modeling software running on its credit risk management system for
compatibility with Windows 7, as well as related hardware, thereby strengthening its
capability of data analysis for internal credit rating.
Fubon Bank (China) established an integrated platform for multi-channel online
banking services (including Internet banking, smartphone banking and PAD payment),
debit card system, second-generation payment system, super online banking system
(enabling instant money transfers and capital collection), supply-chain system, ECIF &
CRM system, desktop cloud system shared among all branches, OCR system,
third-party payment platform, network connected to Alipay, fax transaction platform,
system security management platform, etc., and completed the first-phase construction
of its mobile lending system and management support system.
In September, 2014, Fubon Bank (China) relocated its data center equipment that was
newly set up.
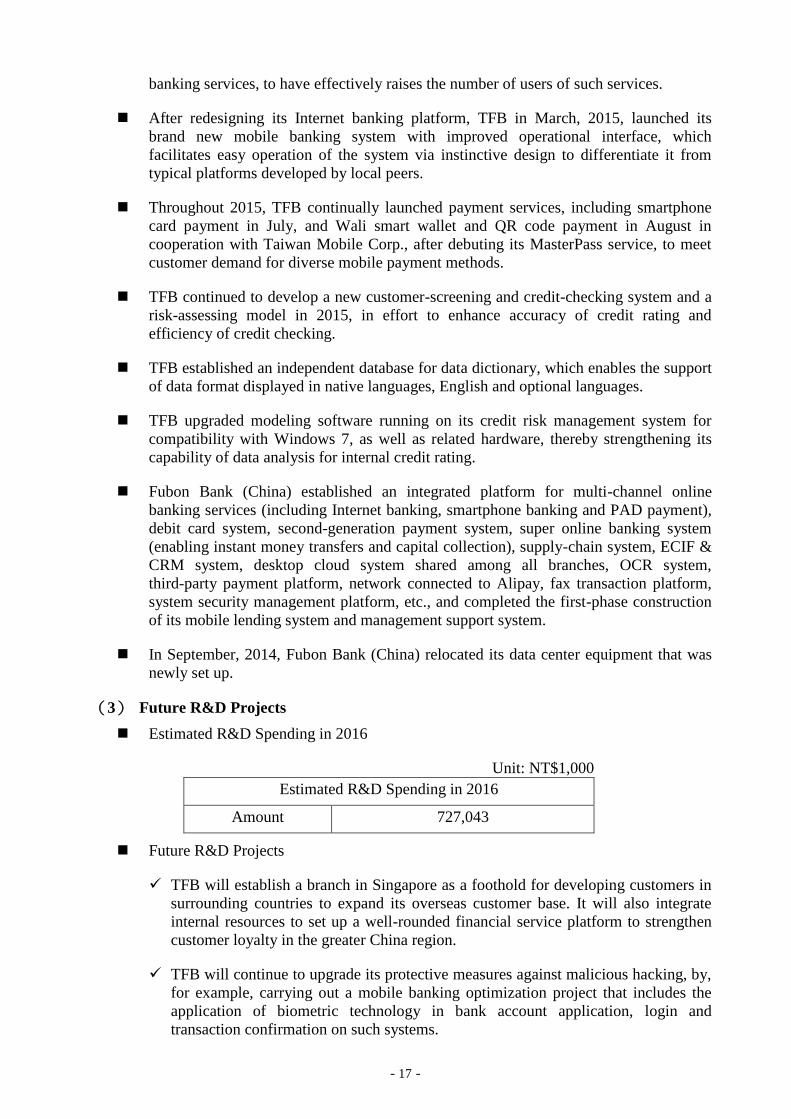
(3) Future R&D Projects
Estimated R&D Spending in 2016
Unit: NT$1,000
Estimated R&D Spending in 2016
Amount 727,043
Future R&D Projects
TFB will establish a branch in Singapore as a foothold for developing customers in
surrounding countries to expand its overseas customer base. It will also integrate
internal resources to set up a well-rounded financial service platform to strengthen
customer loyalty in the greater China region.
TFB will continue to upgrade its protective measures against malicious hacking, by,
for example, carrying out a mobile banking optimization project that includes the
application of biometric technology in bank account application, login and
transaction confirmation on such systems.
- 18 -
TFB will continue to expand its digital and mobile banking services to include the
provision of real-time, active and interactive financial consulting service.
TFB will continue to develop and upgrade mobile payment services, including a
HCE (Host Card Emulation)-based smartphone-enabling credit card payment
system using cloud technology, cross-border payment and MasterPass O2O (online
to offline) payment, to meet growing consumers’ preference for mobile payments
amid continual popularity of smartphones.
TFB will stay focused on the development of an automated customer-screening and
credit-checking environment to enhance accuracy of risk assessment and efficiency
of credit checking and rating.
TFB will upgrade system structure at all its branches through transposition
operations, as well as its core systems with project management tools, including an
issue tracking system. Meanwhile, it will also carry out operational streamlining and
automation. These will enable TFB to further enhance its management capability
and improve administrative models, so its business development is expected to be
upgraded and gain momentum from the support of information technology, coupled
with maximized return on investment.
TFB will upgrade its banking facilities, including ATMs, cash recycling machines,
passbook updating machines and currency exchange machines, so as to enhance
overall efficiency in deposit, withdrawal, transfer, payment and balance checking
operations as required by customers, and improve system security.
TFB will offer to set up four kiosks in Taipei City Hospital, which will provide not
just appointment and information querying services, but payment service to help the
hospital reduce labor cost.
Fubon Bank (China) will upgrade its core systems, system development
environments and related tools, so as to enhance efficiency in the development of
core systems and performance to better shore up its retail banking and onshore
Renminbi businesses.
Fubon Bank (China) will focus on the development of Internet banking platforms
and virtual channels, to upgrade its e-banking platform functions, develop virtual
bank cards, accelerate construction of various support systems to shore up its
e-banking services, including WeChat payment, wealth management and retail
banking.
To innovate its business and sustain long-term development, Fubon Bank (China)
will develop smart banking systems, Comstar systems, capital pool systems,
mortgage management systems, private banking systems and an integrated mobile
payment system for use in Shenzhen, Guandong, China.
Fubon Bank (China) will further improve its crisis management capability by setting
up a crisis management center and related systems at its headquarters.
Fubon Bank (China) will continue to improve organizational structure of its
information technology department, and streamline operational procedures and
workflow, in a bid to enhance its risk management, the quality of IT staffers and
work efficiency.
- 19 -
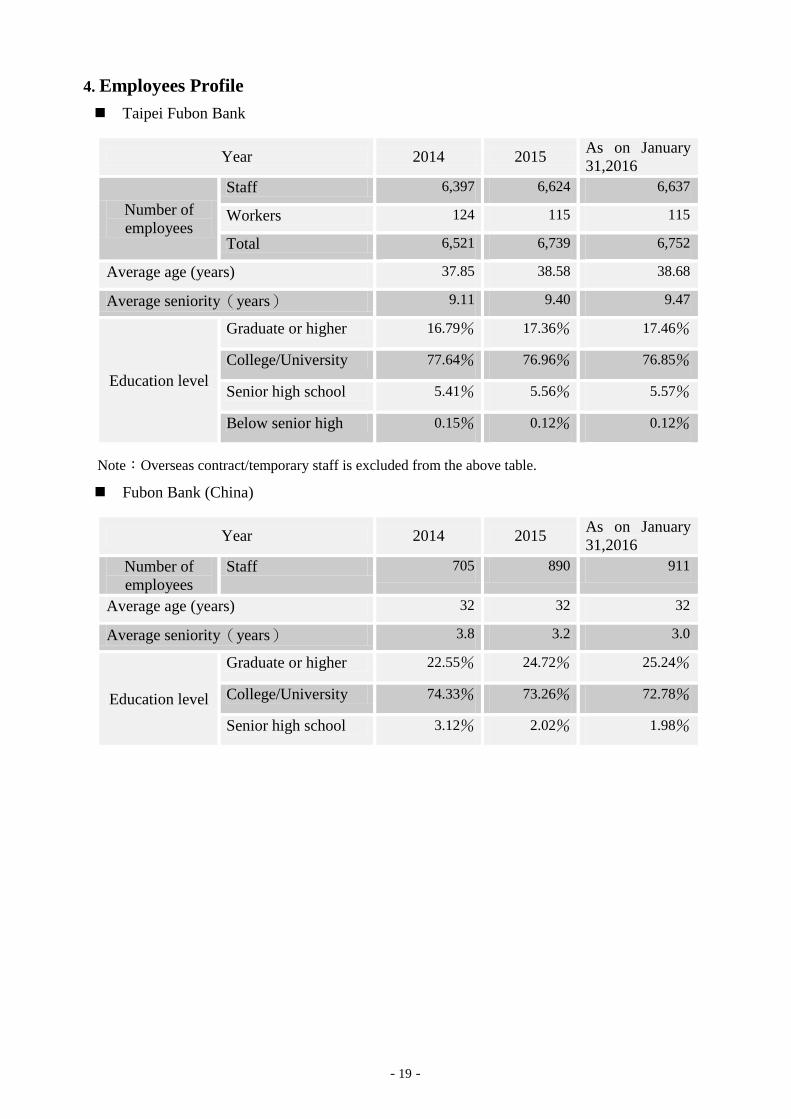
4. Employees Profile
Taipei Fubon Bank
Year 2014 2015 As on January
31,2016
Number of
employees
Staff 6,397 6,624 6,637
Workers 124 115 115
Total 6,521 6,739 6,752
Average age (years) 37.85 38.58 38.68
Average seniority(years) 9.11 9.40 9.47
Education level
Graduate or higher 16.79% 17.36% 17.46%
College/University 77.64% 76.96% 76.85%
Senior high school 5.41% 5.56% 5.57%
Below senior high 0.15% 0.12% 0.12%
Note:Overseas contract/temporary staff is excluded from the above table.
Fubon Bank (China)
Year 2014 2015 As on January
31,2016
Number of
employees
Staff 705 890 911
Average age (years) 32 32 32
Average seniority(years) 3.8 3.2 3.0
Education level
Graduate or higher 22.55% 24.72% 25.24%
College/University 74.33% 73.26% 72.78%
Senior high school 3.12% 2.02% 1.98%
- 20 -
IV. Special Notes
1. Dividend Policy and Implementation Status
(1)Dividend Policy
After yearly budget settlements, after-tax profits, if they exist, will be first used to make
up deficits from the previous year, with 30% of the balance being set aside for legal
reserves, and, under Financial Supervisory Commission rules, a special reserve (or
special reserve reversal). While the remainder will be incorporated into the accumulated
retained earnings of past years. The board of directors will then make a proposal for
payout of dividends, which will be submitted to the shareholders’ meeting for final
ratification. Should the Bank’s legally-required reserves consist of equivalent paid-in
capital or reach levels according to acceptable financial standards set by the regulator as
per item 2, article 50 of the Banking Law, including appropriation of earnings for
legally-required reserves according to the Company Law, the company can be exempt
from restrictions regarding appropriation of earnings for legally-required reserves and
cash-dividend payout.
Before legal reserves equal paid-in capital and when the capital/risk-based assets ratio
meets the requirements of the Banking Law, the ceiling for the payout of cash earnings
should comply with the stipulations of the Banking Law and the requirements of the
regulator.
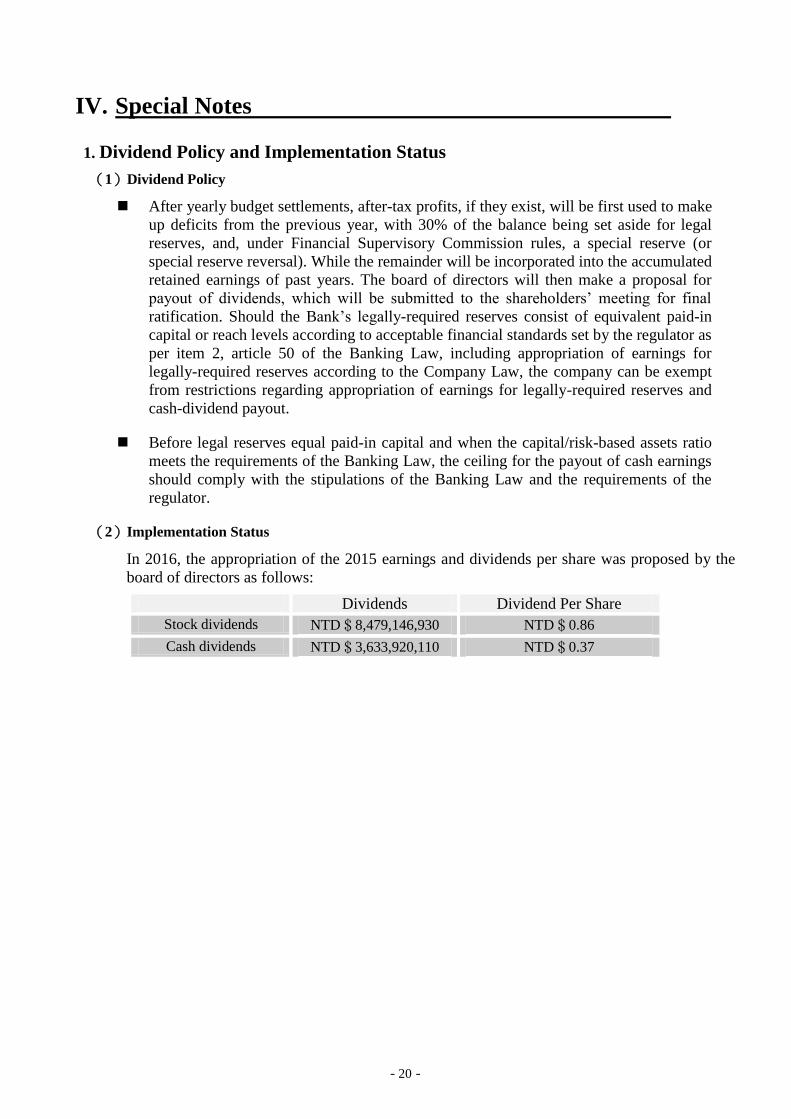
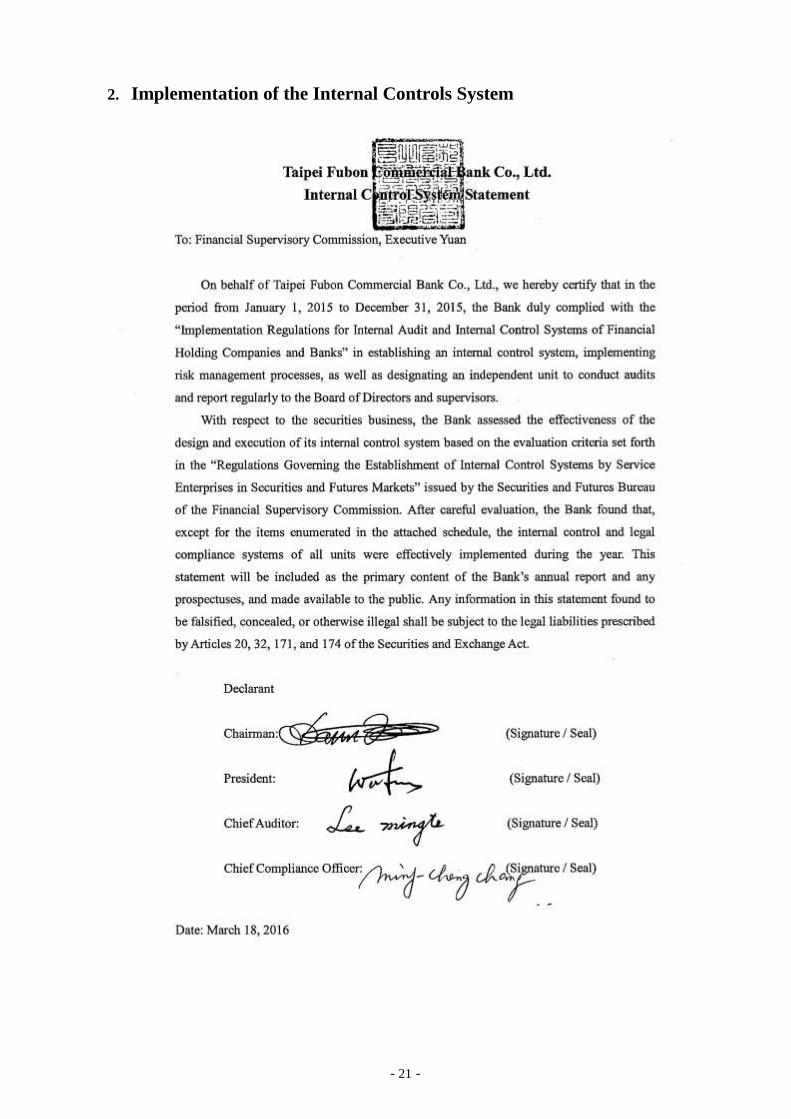
(2)Implementation Status
In 2016, the appropriation of the 2015 earnings and dividends per share was proposed by the
board of directors as follows:
Dividends Dividend Per Share
Stock dividends NTD$8,479,146,930 NTD$0.86
Cash dividends NTD$3,633,920,110 NTD$0.37
- 21 -
2. Implementation of the Internal Controls System
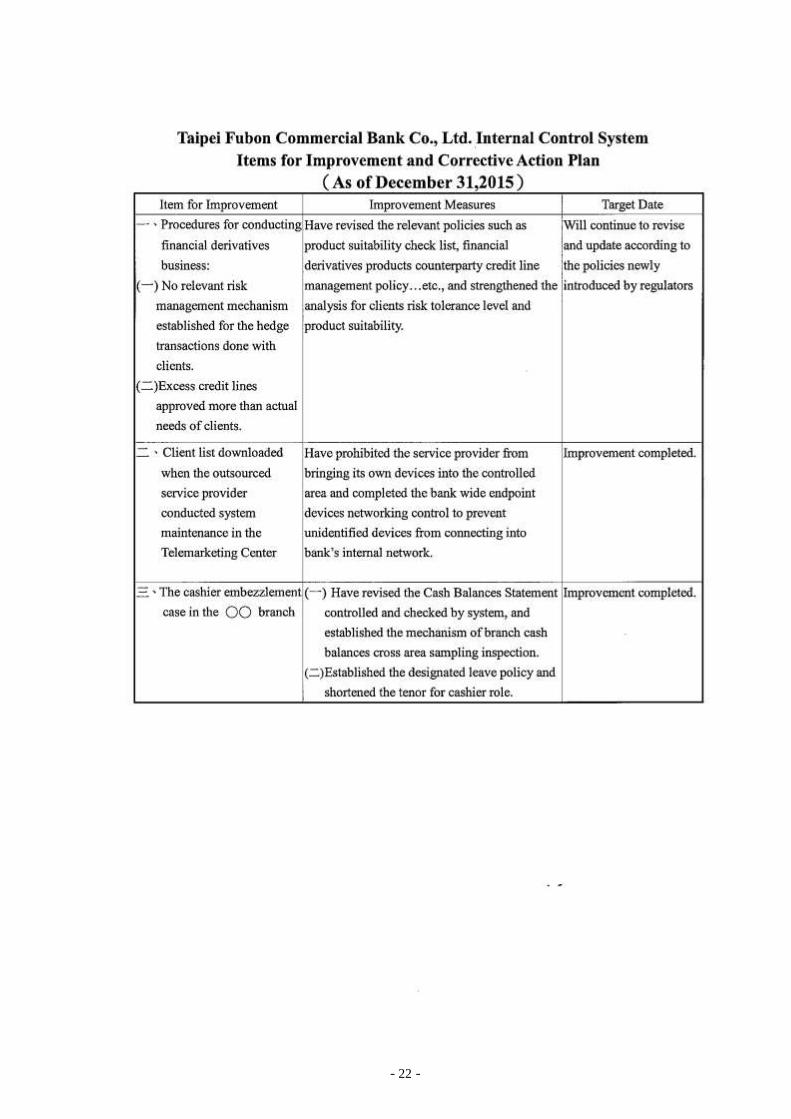
- 22 -
- 23 -
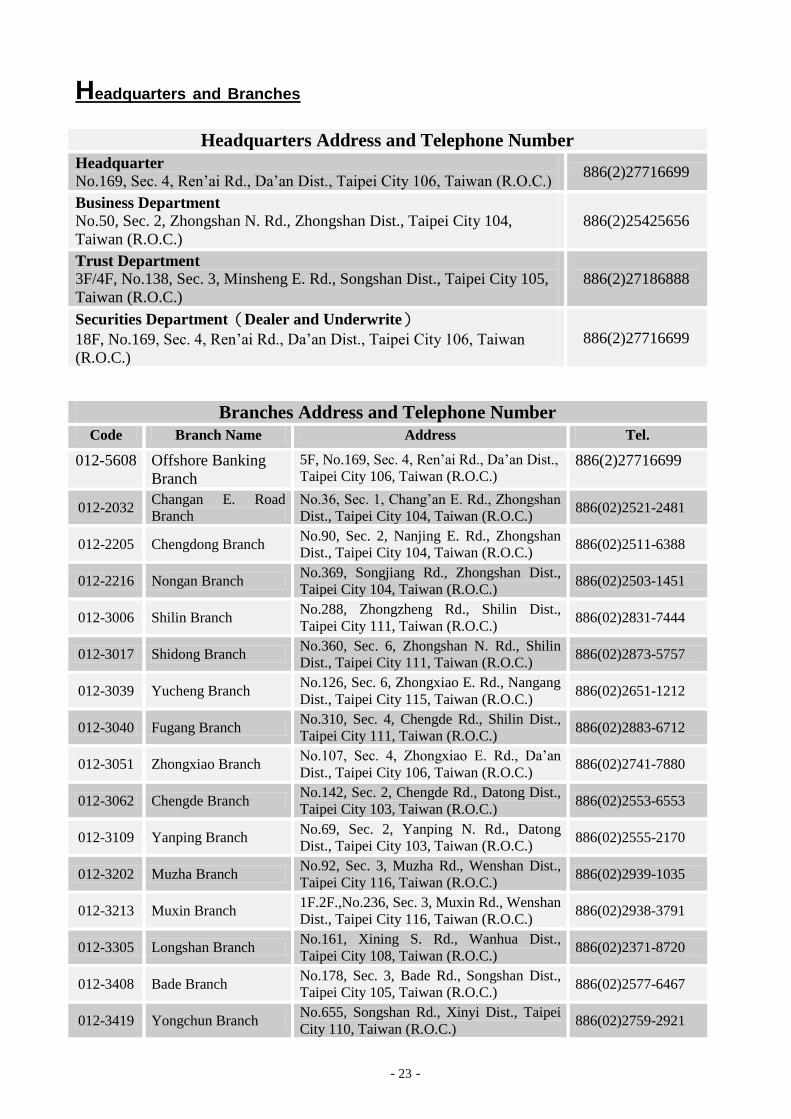
Headquarters and Branches
Headquarters Address and Telephone Number
Headquarter
No.169, Sec. 4, Ren’ai Rd., Da’an Dist., Taipei City 106, Taiwan (R.O.C.) 886(2)27716699
Business Department
No.50, Sec. 2, Zhongshan N. Rd., Zhongshan Dist., Taipei City 104,
Taiwan (R.O.C.)
886(2)25425656
Trust Department
3F/4F, No.138, Sec. 3, Minsheng E. Rd., Songshan Dist., Taipei City 105,
Taiwan (R.O.C.)
886(2)27186888
Securities Department(Dealer and Underwrite)
18F, No.169, Sec. 4, Ren’ai Rd., Da’an Dist., Taipei City 106, Taiwan
(R.O.C.)
886(2)27716699
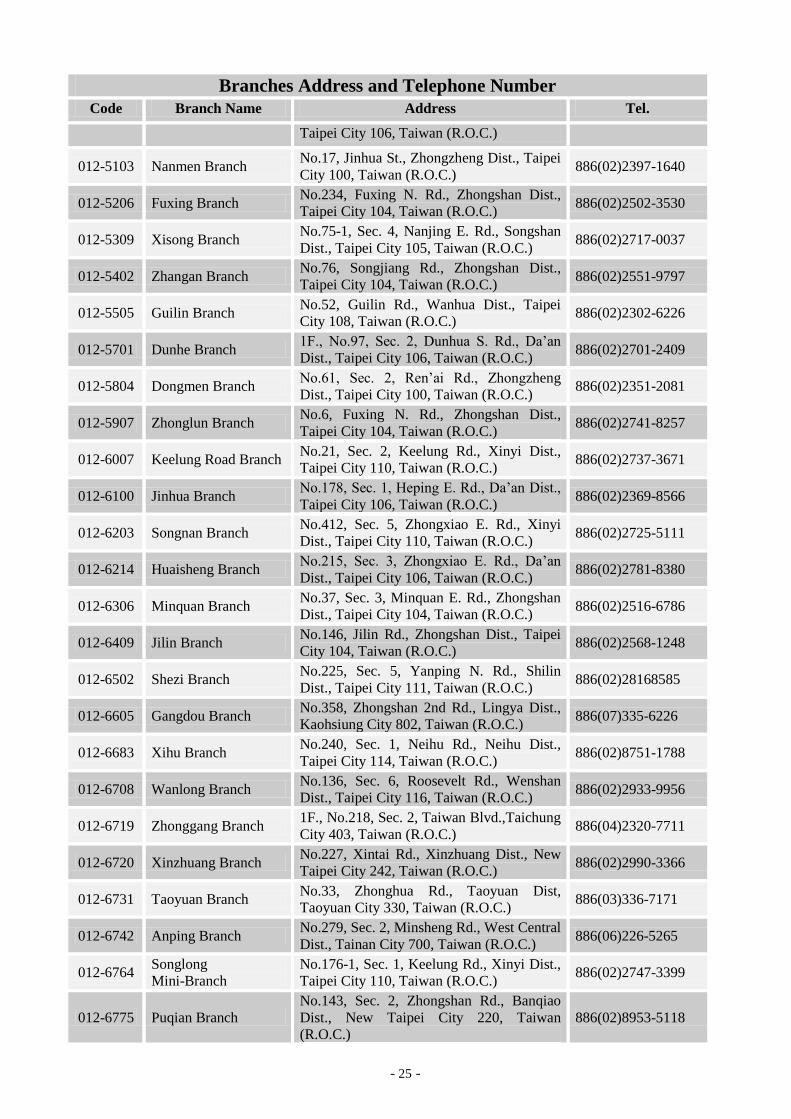
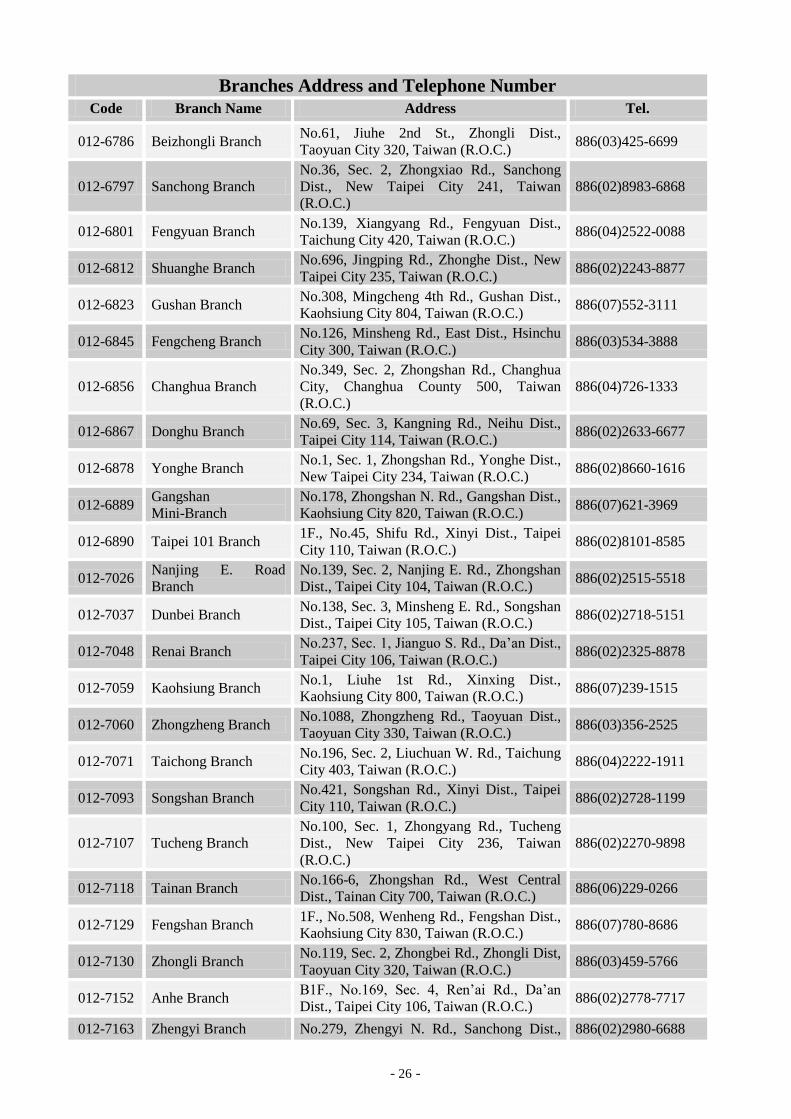
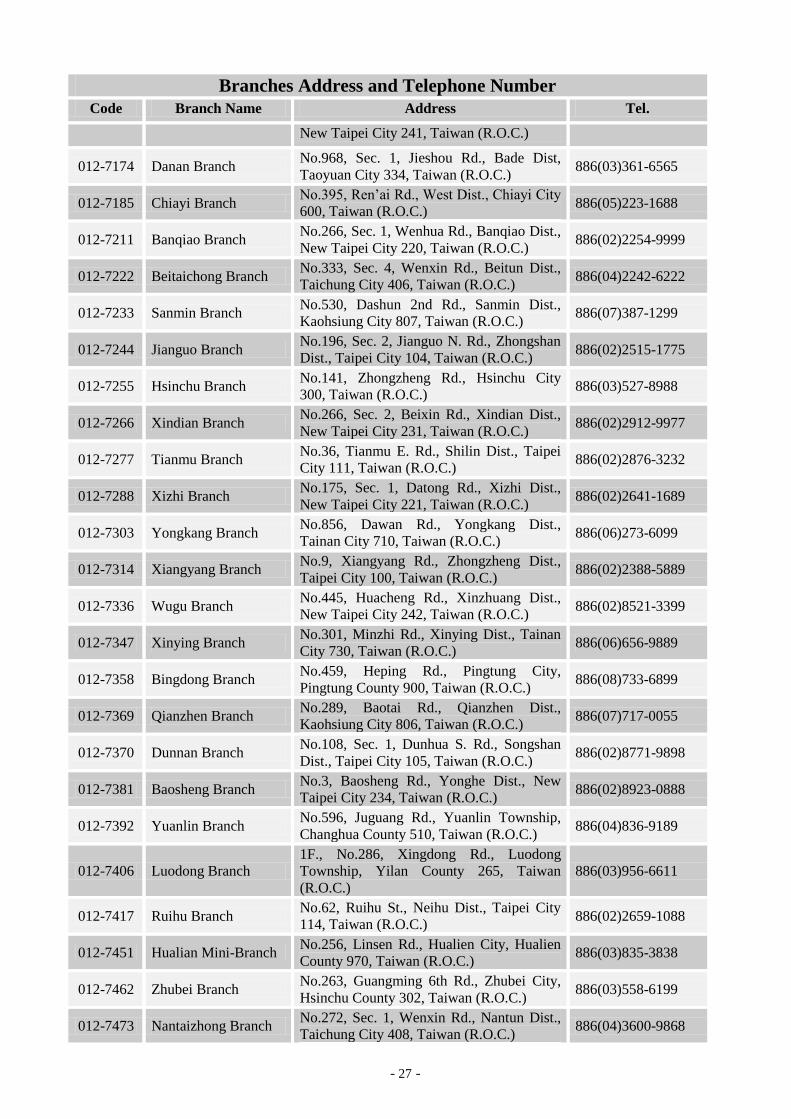
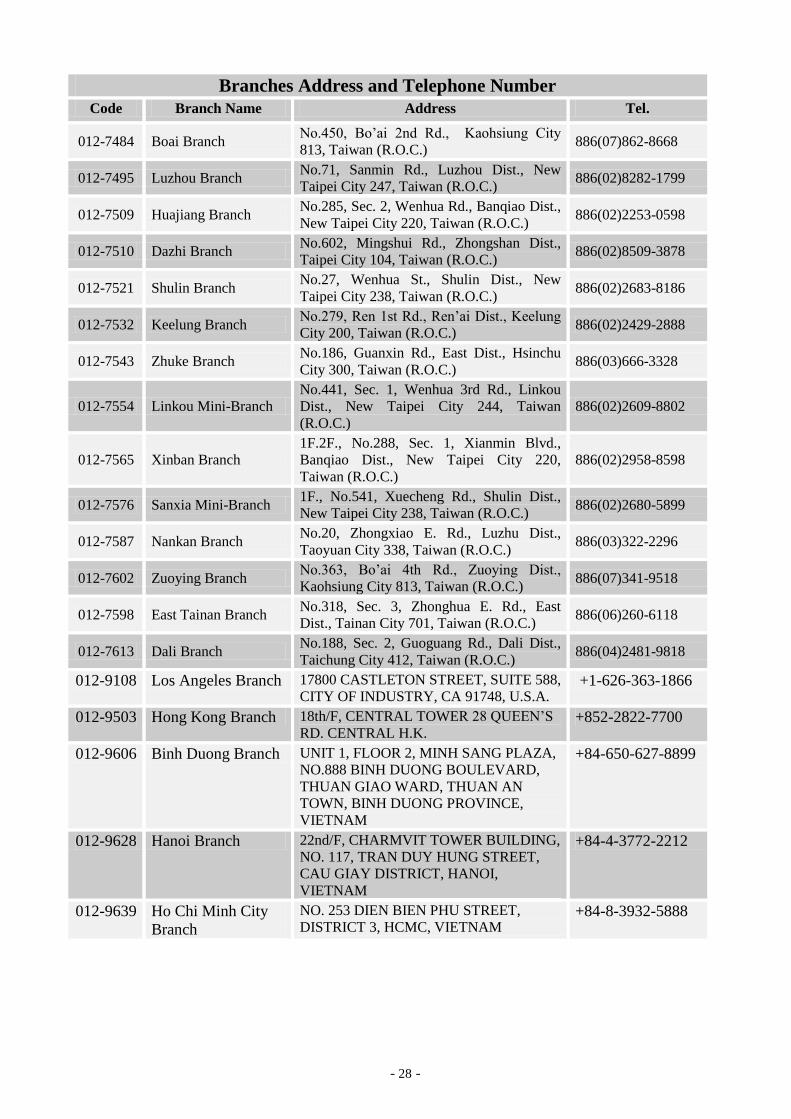
Branches Address and Telephone Number
Code Branch Name Address Tel.
012-5608 Offshore Banking
Branch
5F, No.169, Sec. 4, Ren’ai Rd., Da’an Dist.,
Taipei City 106, Taiwan (R.O.C.) 886(2)27716699
012-2032 Changan E. Road
Branch
No.36, Sec. 1, Chang’an E. Rd., Zhongshan
Dist., Taipei City 104, Taiwan (R.O.C.) 886(02)2521-2481
012-2205 Chengdong Branch No.90, Sec. 2, Nanjing E. Rd., Zhongshan
Dist., Taipei City 104, Taiwan (R.O.C.) 886(02)2511-6388
012-2216 Nongan Branch No.369, Songjiang Rd., Zhongshan Dist.,
Taipei City 104, Taiwan (R.O.C.) 886(02)2503-1451
012-3006 Shilin Branch No.288, Zhongzheng Rd., Shilin Dist.,
Taipei City 111, Taiwan (R.O.C.) 886(02)2831-7444
012-3017 Shidong Branch No.360, Sec. 6, Zhongshan N. Rd., Shilin
Dist., Taipei City 111, Taiwan (R.O.C.) 886(02)2873-5757
012-3039 Yucheng Branch No.126, Sec. 6, Zhongxiao E. Rd., Nangang
Dist., Taipei City 115, Taiwan (R.O.C.) 886(02)2651-1212
012-3040 Fugang Branch No.310, Sec. 4, Chengde Rd., Shilin Dist.,
Taipei City 111, Taiwan (R.O.C.) 886(02)2883-6712
012-3051 Zhongxiao Branch No.107, Sec. 4, Zhongxiao E. Rd., Da’an
Dist., Taipei City 106, Taiwan (R.O.C.) 886(02)2741-7880
012-3062 Chengde Branch No.142, Sec. 2, Chengde Rd., Datong Dist.,
Taipei City 103, Taiwan (R.O.C.) 886(02)2553-6553
012-3109 Yanping Branch No.69, Sec. 2, Yanping N. Rd., Datong
Dist., Taipei City 103, Taiwan (R.O.C.) 886(02)2555-2170
012-3202 Muzha Branch No.92, Sec. 3, Muzha Rd., Wenshan Dist.,
Taipei City 116, Taiwan (R.O.C.) 886(02)2939-1035
012-3213 Muxin Branch 1F.2F.,No.236, Sec. 3, Muxin Rd., Wenshan
Dist., Taipei City 116, Taiwan (R.O.C.) 886(02)2938-3791
012-3305 Longshan Branch No.161, Xining S. Rd., Wanhua Dist.,
Taipei City 108, Taiwan (R.O.C.) 886(02)2371-8720
012-3408 Bade Branch No.178, Sec. 3, Bade Rd., Songshan Dist.,
Taipei City 105, Taiwan (R.O.C.) 886(02)2577-6467
012-3419 Yongchun Branch No.655, Songshan Rd., Xinyi Dist., Taipei
City 110, Taiwan (R.O.C.) 886(02)2759-2921
- 24 -
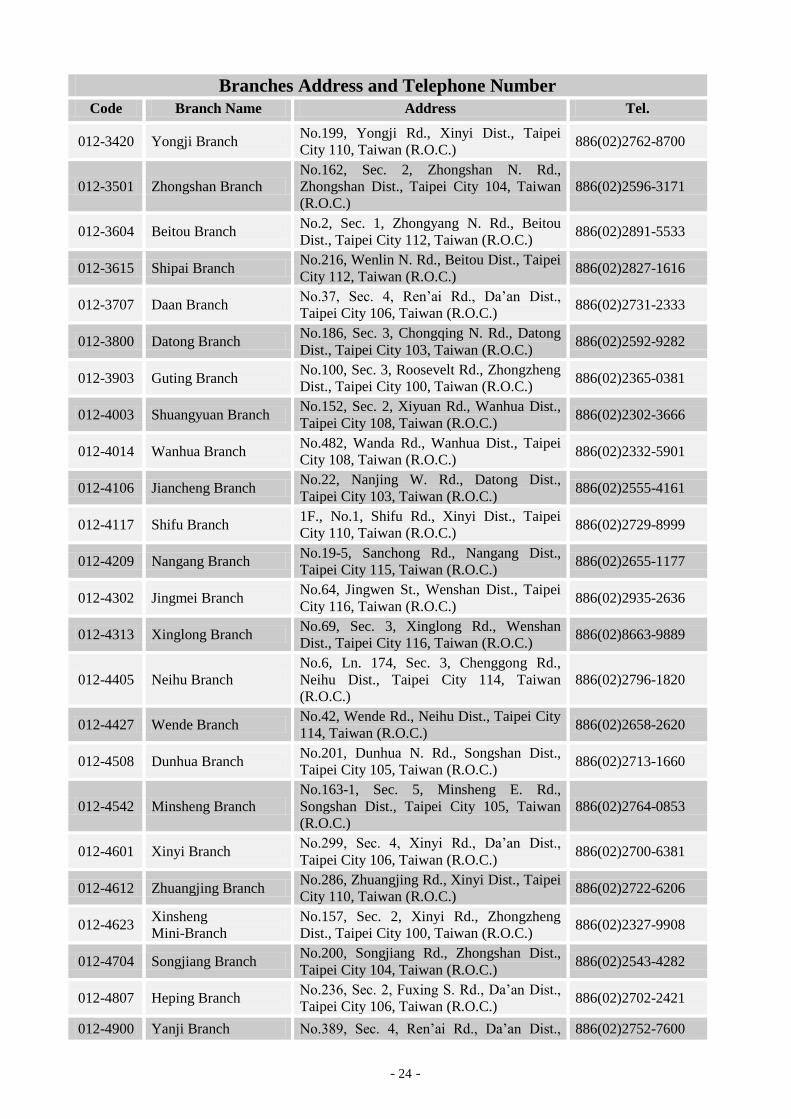
Branches Address and Telephone Number
Code Branch Name Address Tel.
012-3420 Yongji Branch No.199, Yongji Rd., Xinyi Dist., Taipei
City 110, Taiwan (R.O.C.) 886(02)2762-8700
012-3501 Zhongshan Branch
No.162, Sec. 2, Zhongshan N. Rd.,
Zhongshan Dist., Taipei City 104, Taiwan
(R.O.C.)
886(02)2596-3171
012-3604 Beitou Branch No.2, Sec. 1, Zhongyang N. Rd., Beitou
Dist., Taipei City 112, Taiwan (R.O.C.) 886(02)2891-5533
012-3615 Shipai Branch No.216, Wenlin N. Rd., Beitou Dist., Taipei
City 112, Taiwan (R.O.C.) 886(02)2827-1616
012-3707 Daan Branch No.37, Sec. 4, Ren’ai Rd., Da’an Dist.,
Taipei City 106, Taiwan (R.O.C.) 886(02)2731-2333
012-3800 Datong Branch No.186, Sec. 3, Chongqing N. Rd., Datong
Dist., Taipei City 103, Taiwan (R.O.C.) 886(02)2592-9282
012-3903 Guting Branch No.100, Sec. 3, Roosevelt Rd., Zhongzheng
Dist., Taipei City 100, Taiwan (R.O.C.) 886(02)2365-0381
012-4003 Shuangyuan Branch No.152, Sec. 2, Xiyuan Rd., Wanhua Dist.,
Taipei City 108, Taiwan (R.O.C.) 886(02)2302-3666
012-4014 Wanhua Branch No.482, Wanda Rd., Wanhua Dist., Taipei
City 108, Taiwan (R.O.C.) 886(02)2332-5901
012-4106 Jiancheng Branch No.22, Nanjing W. Rd., Datong Dist.,
Taipei City 103, Taiwan (R.O.C.) 886(02)2555-4161
012-4117 Shifu Branch 1F., No.1, Shifu Rd., Xinyi Dist., Taipei
City 110, Taiwan (R.O.C.) 886(02)2729-8999
012-4209 Nangang Branch No.19-5, Sanchong Rd., Nangang Dist.,
Taipei City 115, Taiwan (R.O.C.) 886(02)2655-1177
012-4302 Jingmei Branch No.64, Jingwen St., Wenshan Dist., Taipei
City 116, Taiwan (R.O.C.) 886(02)2935-2636
012-4313 Xinglong Branch No.69, Sec. 3, Xinglong Rd., Wenshan
Dist., Taipei City 116, Taiwan (R.O.C.) 886(02)8663-9889
012-4405 Neihu Branch
No.6, Ln. 174, Sec. 3, Chenggong Rd.,
Neihu Dist., Taipei City 114, Taiwan
(R.O.C.)
886(02)2796-1820
012-4427 Wende Branch No.42, Wende Rd., Neihu Dist., Taipei City
114, Taiwan (R.O.C.) 886(02)2658-2620
012-4508 Dunhua Branch No.201, Dunhua N. Rd., Songshan Dist.,
Taipei City 105, Taiwan (R.O.C.) 886(02)2713-1660
012-4542 Minsheng Branch
No.163-1, Sec. 5, Minsheng E. Rd.,
Songshan Dist., Taipei City 105, Taiwan
(R.O.C.)
886(02)2764-0853
012-4601 Xinyi Branch No.299, Sec. 4, Xinyi Rd., Da’an Dist.,
Taipei City 106, Taiwan (R.O.C.) 886(02)2700-6381
012-4612 Zhuangjing Branch No.286, Zhuangjing Rd., Xinyi Dist., Taipei
City 110, Taiwan (R.O.C.) 886(02)2722-6206
012-4623 Xinsheng
Mini-Branch
No.157, Sec. 2, Xinyi Rd., Zhongzheng
Dist., Taipei City 100, Taiwan (R.O.C.) 886(02)2327-9908
012-4704 Songjiang Branch No.200, Songjiang Rd., Zhongshan Dist.,
Taipei City 104, Taiwan (R.O.C.) 886(02)2543-4282
012-4807 Heping Branch No.236, Sec. 2, Fuxing S. Rd., Da’an Dist.,
Taipei City 106, Taiwan (R.O.C.) 886(02)2702-2421
012-4900 Yanji Branch No.389, Sec. 4, Ren’ai Rd., Da’an Dist., 886(02)2752-7600
- 25 -
Branches Address and Telephone Number
Code Branch Name Address Tel.
Taipei City 106, Taiwan (R.O.C.)
012-5103 Nanmen Branch No.17, Jinhua St., Zhongzheng Dist., Taipei
City 100, Taiwan (R.O.C.) 886(02)2397-1640
012-5206 Fuxing Branch No.234, Fuxing N. Rd., Zhongshan Dist.,
Taipei City 104, Taiwan (R.O.C.) 886(02)2502-3530
012-5309 Xisong Branch No.75-1, Sec. 4, Nanjing E. Rd., Songshan
Dist., Taipei City 105, Taiwan (R.O.C.) 886(02)2717-0037
012-5402 Zhangan Branch No.76, Songjiang Rd., Zhongshan Dist.,
Taipei City 104, Taiwan (R.O.C.) 886(02)2551-9797
012-5505 Guilin Branch No.52, Guilin Rd., Wanhua Dist., Taipei
City 108, Taiwan (R.O.C.) 886(02)2302-6226
012-5701 Dunhe Branch 1F., No.97, Sec. 2, Dunhua S. Rd., Da’an
Dist., Taipei City 106, Taiwan (R.O.C.) 886(02)2701-2409
012-5804 Dongmen Branch No.61, Sec. 2, Ren’ai Rd., Zhongzheng
Dist., Taipei City 100, Taiwan (R.O.C.) 886(02)2351-2081
012-5907 Zhonglun Branch No.6, Fuxing N. Rd., Zhongshan Dist.,
Taipei City 104, Taiwan (R.O.C.) 886(02)2741-8257
012-6007 Keelung Road Branch No.21, Sec. 2, Keelung Rd., Xinyi Dist.,
Taipei City 110, Taiwan (R.O.C.) 886(02)2737-3671
012-6100 Jinhua Branch No.178, Sec. 1, Heping E. Rd., Da’an Dist.,
Taipei City 106, Taiwan (R.O.C.) 886(02)2369-8566
012-6203 Songnan Branch No.412, Sec. 5, Zhongxiao E. Rd., Xinyi
Dist., Taipei City 110, Taiwan (R.O.C.) 886(02)2725-5111
012-6214 Huaisheng Branch No.215, Sec. 3, Zhongxiao E. Rd., Da’an
Dist., Taipei City 106, Taiwan (R.O.C.) 886(02)2781-8380
012-6306 Minquan Branch No.37, Sec. 3, Minquan E. Rd., Zhongshan
Dist., Taipei City 104, Taiwan (R.O.C.) 886(02)2516-6786
012-6409 Jilin Branch No.146, Jilin Rd., Zhongshan Dist., Taipei
City 104, Taiwan (R.O.C.) 886(02)2568-1248
012-6502 Shezi Branch No.225, Sec. 5, Yanping N. Rd., Shilin
Dist., Taipei City 111, Taiwan (R.O.C.) 886(02)28168585
012-6605 Gangdou Branch No.358, Zhongshan 2nd Rd., Lingya Dist.,
Kaohsiung City 802, Taiwan (R.O.C.) 886(07)335-6226
012-6683 Xihu Branch No.240, Sec. 1, Neihu Rd., Neihu Dist.,
Taipei City 114, Taiwan (R.O.C.) 886(02)8751-1788
012-6708 Wanlong Branch No.136, Sec. 6, Roosevelt Rd., Wenshan
Dist., Taipei City 116, Taiwan (R.O.C.) 886(02)2933-9956
012-6719 Zhonggang Branch 1F., No.218, Sec. 2, Taiwan Blvd.,Taichung
City 403, Taiwan (R.O.C.) 886(04)2320-7711
012-6720 Xinzhuang Branch No.227, Xintai Rd., Xinzhuang Dist., New
Taipei City 242, Taiwan (R.O.C.) 886(02)2990-3366
012-6731 Taoyuan Branch No.33, Zhonghua Rd., Taoyuan Dist,
Taoyuan City 330, Taiwan (R.O.C.) 886(03)336-7171
012-6742 Anping Branch No.279, Sec. 2, Minsheng Rd., West Central
Dist., Tainan City 700, Taiwan (R.O.C.) 886(06)226-5265
012-6764 Songlong
Mini-Branch
No.176-1, Sec. 1, Keelung Rd., Xinyi Dist.,
Taipei City 110, Taiwan (R.O.C.) 886(02)2747-3399
012-6775 Puqian Branch
No.143, Sec. 2, Zhongshan Rd., Banqiao
Dist., New Taipei City 220, Taiwan
(R.O.C.)
886(02)8953-5118
- 26 -
Branches Address and Telephone Number
Code Branch Name Address Tel.
012-6786 Beizhongli Branch No.61, Jiuhe 2nd St., Zhongli Dist.,
Taoyuan City 320, Taiwan (R.O.C.) 886(03)425-6699
012-6797 Sanchong Branch
No.36, Sec. 2, Zhongxiao Rd., Sanchong
Dist., New Taipei City 241, Taiwan
(R.O.C.)
886(02)8983-6868
012-6801 Fengyuan Branch No.139, Xiangyang Rd., Fengyuan Dist.,
Taichung City 420, Taiwan (R.O.C.) 886(04)2522-0088
012-6812 Shuanghe Branch No.696, Jingping Rd., Zhonghe Dist., New
Taipei City 235, Taiwan (R.O.C.) 886(02)2243-8877
012-6823 Gushan Branch No.308, Mingcheng 4th Rd., Gushan Dist.,
Kaohsiung City 804, Taiwan (R.O.C.) 886(07)552-3111
012-6845 Fengcheng Branch No.126, Minsheng Rd., East Dist., Hsinchu
City 300, Taiwan (R.O.C.) 886(03)534-3888
012-6856 Changhua Branch
No.349, Sec. 2, Zhongshan Rd., Changhua
City, Changhua County 500, Taiwan
(R.O.C.)
886(04)726-1333
012-6867 Donghu Branch No.69, Sec. 3, Kangning Rd., Neihu Dist.,
Taipei City 114, Taiwan (R.O.C.) 886(02)2633-6677
012-6878 Yonghe Branch No.1, Sec. 1, Zhongshan Rd., Yonghe Dist.,
New Taipei City 234, Taiwan (R.O.C.) 886(02)8660-1616
012-6889 Gangshan
Mini-Branch
No.178, Zhongshan N. Rd., Gangshan Dist.,
Kaohsiung City 820, Taiwan (R.O.C.) 886(07)621-3969
012-6890 Taipei 101 Branch 1F., No.45, Shifu Rd., Xinyi Dist., Taipei
City 110, Taiwan (R.O.C.) 886(02)8101-8585
012-7026 Nanjing E. Road
Branch
No.139, Sec. 2, Nanjing E. Rd., Zhongshan
Dist., Taipei City 104, Taiwan (R.O.C.) 886(02)2515-5518
012-7037 Dunbei Branch No.138, Sec. 3, Minsheng E. Rd., Songshan
Dist., Taipei City 105, Taiwan (R.O.C.) 886(02)2718-5151
012-7048 Renai Branch No.237, Sec. 1, Jianguo S. Rd., Da’an Dist.,
Taipei City 106, Taiwan (R.O.C.) 886(02)2325-8878
012-7059 Kaohsiung Branch No.1, Liuhe 1st Rd., Xinxing Dist.,
Kaohsiung City 800, Taiwan (R.O.C.) 886(07)239-1515
012-7060 Zhongzheng Branch No.1088, Zhongzheng Rd., Taoyuan Dist.,
Taoyuan City 330, Taiwan (R.O.C.) 886(03)356-2525
012-7071 Taichong Branch No.196, Sec. 2, Liuchuan W. Rd., Taichung
City 403, Taiwan (R.O.C.) 886(04)2222-1911
012-7093 Songshan Branch No.421, Songshan Rd., Xinyi Dist., Taipei
City 110, Taiwan (R.O.C.) 886(02)2728-1199
012-7107 Tucheng Branch
No.100, Sec. 1, Zhongyang Rd., Tucheng
Dist., New Taipei City 236, Taiwan
(R.O.C.)
886(02)2270-9898
012-7118 Tainan Branch No.166-6, Zhongshan Rd., West Central
Dist., Tainan City 700, Taiwan (R.O.C.) 886(06)229-0266
012-7129 Fengshan Branch 1F., No.508, Wenheng Rd., Fengshan Dist.,
Kaohsiung City 830, Taiwan (R.O.C.) 886(07)780-8686
012-7130 Zhongli Branch No.119, Sec. 2, Zhongbei Rd., Zhongli Dist,
Taoyuan City 320, Taiwan (R.O.C.) 886(03)459-5766
012-7152 Anhe Branch B1F., No.169, Sec. 4, Ren’ai Rd., Da’an
Dist., Taipei City 106, Taiwan (R.O.C.) 886(02)2778-7717
012-7163 Zhengyi Branch No.279, Zhengyi N. Rd., Sanchong Dist., 886(02)2980-6688
- 27 -
Branches Address and Telephone Number
Code Branch Name Address Tel.
New Taipei City 241, Taiwan (R.O.C.)
012-7174 Danan Branch No.968, Sec. 1, Jieshou Rd., Bade Dist,
Taoyuan City 334, Taiwan (R.O.C.) 886(03)361-6565
012-7185 Chiayi Branch No.395, Ren’ai Rd., West Dist., Chiayi City
600, Taiwan (R.O.C.) 886(05)223-1688
012-7211 Banqiao Branch No.266, Sec. 1, Wenhua Rd., Banqiao Dist.,
New Taipei City 220, Taiwan (R.O.C.) 886(02)2254-9999
012-7222 Beitaichong Branch No.333, Sec. 4, Wenxin Rd., Beitun Dist.,
Taichung City 406, Taiwan (R.O.C.) 886(04)2242-6222
012-7233 Sanmin Branch No.530, Dashun 2nd Rd., Sanmin Dist.,
Kaohsiung City 807, Taiwan (R.O.C.) 886(07)387-1299
012-7244 Jianguo Branch No.196, Sec. 2, Jianguo N. Rd., Zhongshan
Dist., Taipei City 104, Taiwan (R.O.C.) 886(02)2515-1775
012-7255 Hsinchu Branch No.141, Zhongzheng Rd., Hsinchu City
300, Taiwan (R.O.C.) 886(03)527-8988
012-7266 Xindian Branch No.266, Sec. 2, Beixin Rd., Xindian Dist.,
New Taipei City 231, Taiwan (R.O.C.) 886(02)2912-9977
012-7277 Tianmu Branch No.36, Tianmu E. Rd., Shilin Dist., Taipei
City 111, Taiwan (R.O.C.) 886(02)2876-3232
012-7288 Xizhi Branch No.175, Sec. 1, Datong Rd., Xizhi Dist.,
New Taipei City 221, Taiwan (R.O.C.) 886(02)2641-1689
012-7303 Yongkang Branch No.856, Dawan Rd., Yongkang Dist.,
Tainan City 710, Taiwan (R.O.C.) 886(06)273-6099
012-7314 Xiangyang Branch No.9, Xiangyang Rd., Zhongzheng Dist.,
Taipei City 100, Taiwan (R.O.C.) 886(02)2388-5889
012-7336 Wugu Branch No.445, Huacheng Rd., Xinzhuang Dist.,
New Taipei City 242, Taiwan (R.O.C.) 886(02)8521-3399
012-7347 Xinying Branch No.301, Minzhi Rd., Xinying Dist., Tainan
City 730, Taiwan (R.O.C.) 886(06)656-9889
012-7358 Bingdong Branch No.459, Heping Rd., Pingtung City,
Pingtung County 900, Taiwan (R.O.C.) 886(08)733-6899
012-7369 Qianzhen Branch No.289, Baotai Rd., Qianzhen Dist.,
Kaohsiung City 806, Taiwan (R.O.C.) 886(07)717-0055
012-7370 Dunnan Branch No.108, Sec. 1, Dunhua S. Rd., Songshan
Dist., Taipei City 105, Taiwan (R.O.C.) 886(02)8771-9898
012-7381 Baosheng Branch No.3, Baosheng Rd., Yonghe Dist., New
Taipei City 234, Taiwan (R.O.C.) 886(02)8923-0888
012-7392 Yuanlin Branch No.596, Juguang Rd., Yuanlin Township,
Changhua County 510, Taiwan (R.O.C.) 886(04)836-9189
012-7406 Luodong Branch
1F., No.286, Xingdong Rd., Luodong
Township, Yilan County 265, Taiwan
(R.O.C.)
886(03)956-6611
012-7417 Ruihu Branch No.62, Ruihu St., Neihu Dist., Taipei City
114, Taiwan (R.O.C.) 886(02)2659-1088
012-7451 Hualian Mini-Branch No.256, Linsen Rd., Hualien City, Hualien
County 970, Taiwan (R.O.C.) 886(03)835-3838
012-7462 Zhubei Branch No.263, Guangming 6th Rd., Zhubei City,
Hsinchu County 302, Taiwan (R.O.C.) 886(03)558-6199
012-7473 Nantaizhong Branch No.272, Sec. 1, Wenxin Rd., Nantun Dist.,
Taichung City 408, Taiwan (R.O.C.) 886(04)3600-9868
- 28 -
Branches Address and Telephone Number
Code Branch Name Address Tel.
012-7484 Boai Branch No.450, Bo’ai 2nd Rd., Kaohsiung City
813, Taiwan (R.O.C.) 886(07)862-8668
012-7495 Luzhou Branch No.71, Sanmin Rd., Luzhou Dist., New
Taipei City 247, Taiwan (R.O.C.) 886(02)8282-1799
012-7509 Huajiang Branch No.285, Sec. 2, Wenhua Rd., Banqiao Dist.,
New Taipei City 220, Taiwan (R.O.C.) 886(02)2253-0598
012-7510 Dazhi Branch No.602, Mingshui Rd., Zhongshan Dist.,
Taipei City 104, Taiwan (R.O.C.) 886(02)8509-3878
012-7521 Shulin Branch No.27, Wenhua St., Shulin Dist., New
Taipei City 238, Taiwan (R.O.C.) 886(02)2683-8186
012-7532 Keelung Branch No.279, Ren 1st Rd., Ren’ai Dist., Keelung
City 200, Taiwan (R.O.C.) 886(02)2429-2888
012-7543 Zhuke Branch No.186, Guanxin Rd., East Dist., Hsinchu
City 300, Taiwan (R.O.C.) 886(03)666-3328
012-7554 Linkou Mini-Branch
No.441, Sec. 1, Wenhua 3rd Rd., Linkou
Dist., New Taipei City 244, Taiwan
(R.O.C.)
886(02)2609-8802
012-7565 Xinban Branch
1F.2F., No.288, Sec. 1, Xianmin Blvd.,
Banqiao Dist., New Taipei City 220,
Taiwan (R.O.C.)
886(02)2958-8598
012-7576 Sanxia Mini-Branch 1F., No.541, Xuecheng Rd., Shulin Dist.,
New Taipei City 238, Taiwan (R.O.C.) 886(02)2680-5899
012-7587 Nankan Branch No.20, Zhongxiao E. Rd., Luzhu Dist.,
Taoyuan City 338, Taiwan (R.O.C.) 886(03)322-2296
012-7602 Zuoying Branch No.363, Bo’ai 4th Rd., Zuoying Dist.,
Kaohsiung City 813, Taiwan (R.O.C.) 886(07)341-9518
012-7598 East Tainan Branch No.318, Sec. 3, Zhonghua E. Rd., East
Dist., Tainan City 701, Taiwan (R.O.C.) 886(06)260-6118
012-7613 Dali Branch No.188, Sec. 2, Guoguang Rd., Dali Dist.,
Taichung City 412, Taiwan (R.O.C.) 886(04)2481-9818
012-9108 Los Angeles Branch 17800 CASTLETON STREET, SUITE 588,
CITY OF INDUSTRY, CA 91748, U.S.A. +1-626-363-1866
012-9503 Hong Kong Branch 18th/F, CENTRAL TOWER 28 QUEEN’S
RD. CENTRAL H.K. +852-2822-7700
012-9606 Binh Duong Branch UNIT 1, FLOOR 2, MINH SANG PLAZA,
NO.888 BINH DUONG BOULEVARD,
THUAN GIAO WARD, THUAN AN
TOWN, BINH DUONG PROVINCE,
VIETNAM
+84-650-627-8899
012-9628 Hanoi Branch 22nd/F, CHARMVIT TOWER BUILDING,
NO. 117, TRAN DUY HUNG STREET,
CAU GIAY DISTRICT, HANOI,
VIETNAM
+84-4-3772-2212
012-9639 Ho Chi Minh City
Branch
NO. 253 DIEN BIEN PHU STREET,
DISTRICT 3, HCMC, VIETNAM +84-8-3932-5888
- 29 -
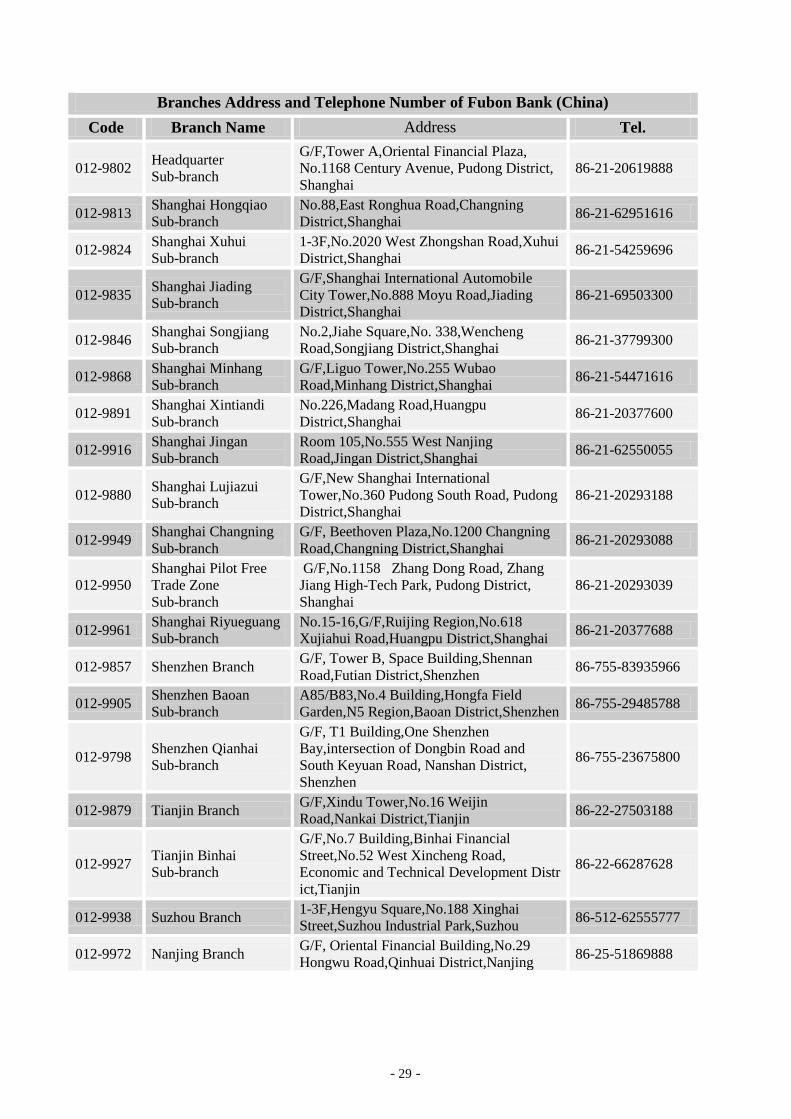
Branches Address and Telephone Number of Fubon Bank (China)
Code Branch Name Address Tel.
012-9802 Headquarter
Sub-branch
G/F,Tower A,Oriental Financial Plaza,
No.1168 Century Avenue, Pudong District,
Shanghai 86-21-20619888
012-9813 Shanghai Hongqiao
Sub-branch No.88,East Ronghua Road,Changning
District,Shanghai 86-21-62951616
012-9824 Shanghai Xuhui
Sub-branch 1-3F,No.2020 West Zhongshan Road,Xuhui
District,Shanghai 86-21-54259696
012-9835 Shanghai Jiading
Sub-branch
G/F,Shanghai International Automobile
City Tower,No.888 Moyu Road,Jiading
District,Shanghai 86-21-69503300
012-9846 Shanghai Songjiang
Sub-branch No.2,Jiahe Square,No. 338,Wencheng
Road,Songjiang District,Shanghai 86-21-37799300
012-9868 Shanghai Minhang
Sub-branch G/F,Liguo Tower,No.255 Wubao
Road,Minhang District,Shanghai 86-21-54471616
012-9891 Shanghai Xintiandi
Sub-branch No.226,Madang Road,Huangpu
District,Shanghai 86-21-20377600
012-9916 Shanghai Jingan
Sub-branch Room 105,No.555 West Nanjing
Road,Jingan District,Shanghai 86-21-62550055
012-9880 Shanghai Lujiazui
Sub-branch
G/F,New Shanghai International
Tower,No.360 Pudong South Road, Pudong
District,Shanghai 86-21-20293188
012-9949 Shanghai Changning
Sub-branch G/F, Beethoven Plaza,No.1200 Changning
Road,Changning District,Shanghai 86-21-20293088
012-9950 Shanghai Pilot Free
Trade Zone
Sub-branch
G/F,No.1158 Zhang Dong Road, Zhang
Jiang High-Tech Park, Pudong District,
Shanghai 86-21-20293039
012-9961 Shanghai Riyueguang
Sub-branch No.15-16,G/F,Ruijing Region,No.618
Xujiahui Road,Huangpu District,Shanghai 86-21-20377688
012-9857 Shenzhen Branch G/F, Tower B, Space Building,Shennan
Road,Futian District,Shenzhen 86-755-83935966
012-9905 Shenzhen Baoan
Sub-branch A85/B83,No.4 Building,Hongfa Field
Garden,N5 Region,Baoan District,Shenzhen 86-755-29485788
012-9798 Shenzhen Qianhai
Sub-branch
G/F, T1 Building,One Shenzhen
Bay,intersection of Dongbin Road and
South Keyuan Road, Nanshan District,
Shenzhen
86-755-23675800
012-9879 Tianjin Branch G/F,Xindu Tower,No.16 Weijin
Road,Nankai District,Tianjin 86-22-27503188
012-9927 Tianjin Binhai
Sub-branch
G/F,No.7 Building,Binhai Financial
Street,No.52 West Xincheng Road,
Economic and Technical Development Distr
ict,Tianjin
86-22-66287628
012-9938 Suzhou Branch 1-3F,Hengyu Square,No.188 Xinghai
Street,Suzhou Industrial Park,Suzhou 86-512-62555777
012-9972 Nanjing Branch G/F, Oriental Financial Building,No.29
Hongwu Road,Qinhuai District,Nanjing 86-25-51869888
- 30 -
Appendix
Annual Financial Reports
for 2015 and 2014
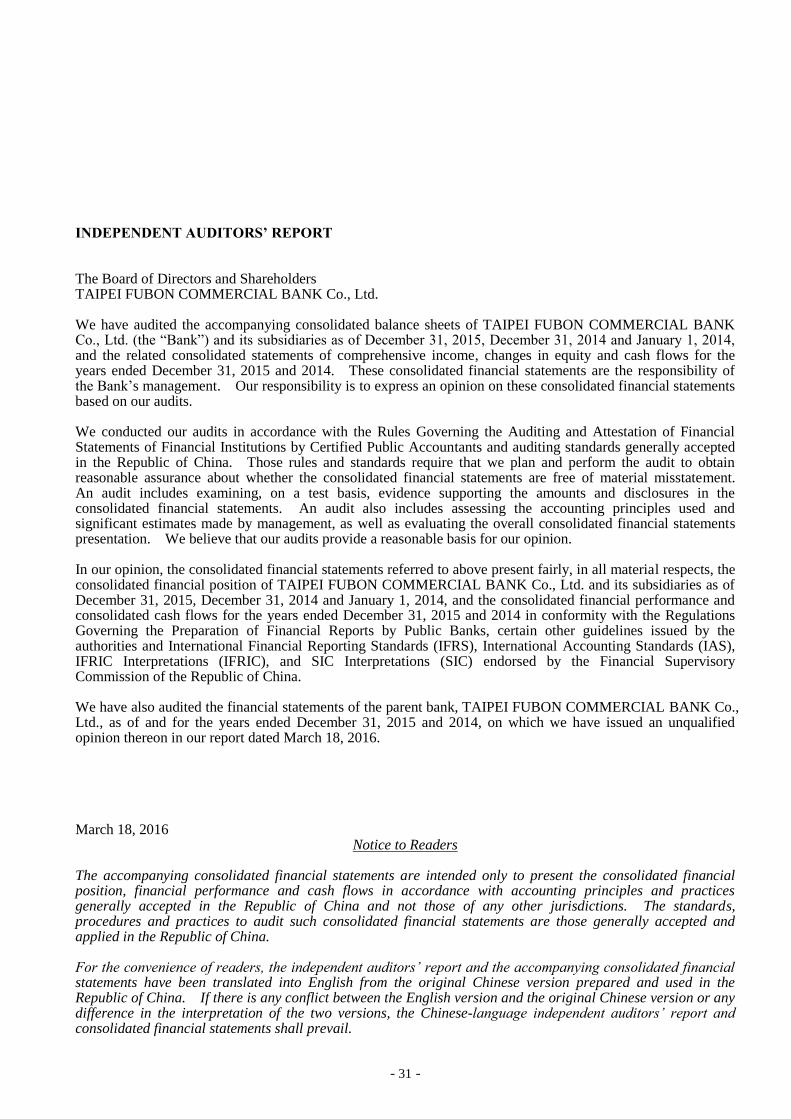
- 31 -
INDEPENDENT AUDITORS’ REPORT The Board of Directors and Shareholders TAIPEI FUBON COMMERCIAL BANK Co., Ltd. We have audited the accompanying consolidated balance sheets of TAIPEI FUBON COMMERCIAL BANK Co., Ltd. (the “Bank”) and its subsidiaries as of December 31, 2015, December 31, 2014 and January 1, 2014, and the related consolidated statements of comprehensive income, changes in equity and cash flows for the years ended December 31, 2015 and 2014. These consolidated financial statements are the responsibility of the Bank’s management. Our responsibility is to express an opinion on these consolidated financial statements based on our audits. We conducted our audits in accordance with the Rules Governing the Auditing and Attestation of Financial Statements of Financial Institutions by Certified Public Accountants and auditing standards generally accepted in the Republic of China. Those rules and standards require that we plan and perform the audit to obtain reasonable assurance about whether the consolidated financial statements are free of material misstatement. An audit includes examining, on a test basis, evidence supporting the amounts and disclosures in the consolidated financial statements. An audit also includes assessing the accounting principles used and significant estimates made by management, as well as evaluating the overall consolidated financial statements presentation. We believe that our audits provide a reasonable basis for our opinion. In our opinion, the consolidated financial statements referred to above present fairly, in all material respects, the consolidated financial position of TAIPEI FUBON COMMERCIAL BANK Co., Ltd. and its subsidiaries as of December 31, 2015, December 31, 2014 and January 1, 2014, and the consolidated financial performance and consolidated cash flows for the years ended December 31, 2015 and 2014 in conformity with the Regulations Governing the Preparation of Financial Reports by Public Banks, certain other guidelines issued by the authorities and International Financial Reporting Standards (IFRS), International Accounting Standards (IAS), IFRIC Interpretations (IFRIC), and SIC Interpretations (SIC) endorsed by the Financial Supervisory Commission of the Republic of China. We have also audited the financial statements of the parent bank, TAIPEI FUBON COMMERCIAL BANK Co., Ltd., as of and for the years ended December 31, 2015 and 2014, on which we have issued an unqualified opinion thereon in our report dated March 18, 2016. March 18, 2016
Notice to Readers The accompanying consolidated financial statements are intended only to present the consolidated financial position, financial performance and cash flows in accordance with accounting principles and practices generally accepted in the Republic of China and not those of any other jurisdictions. The standards, procedures and practices to audit such consolidated financial statements are those generally accepted and applied in the Republic of China. For the convenience of readers, the independent auditors’ report and the accompanying consolidated financial statements have been translated into English from the original Chinese version prepared and used in the Republic of China. If there is any conflict between the English version and the original Chinese version or any difference in the interpretation of the two versions, the Chinese-language independent auditors’ report and consolidated financial statements shall prevail.
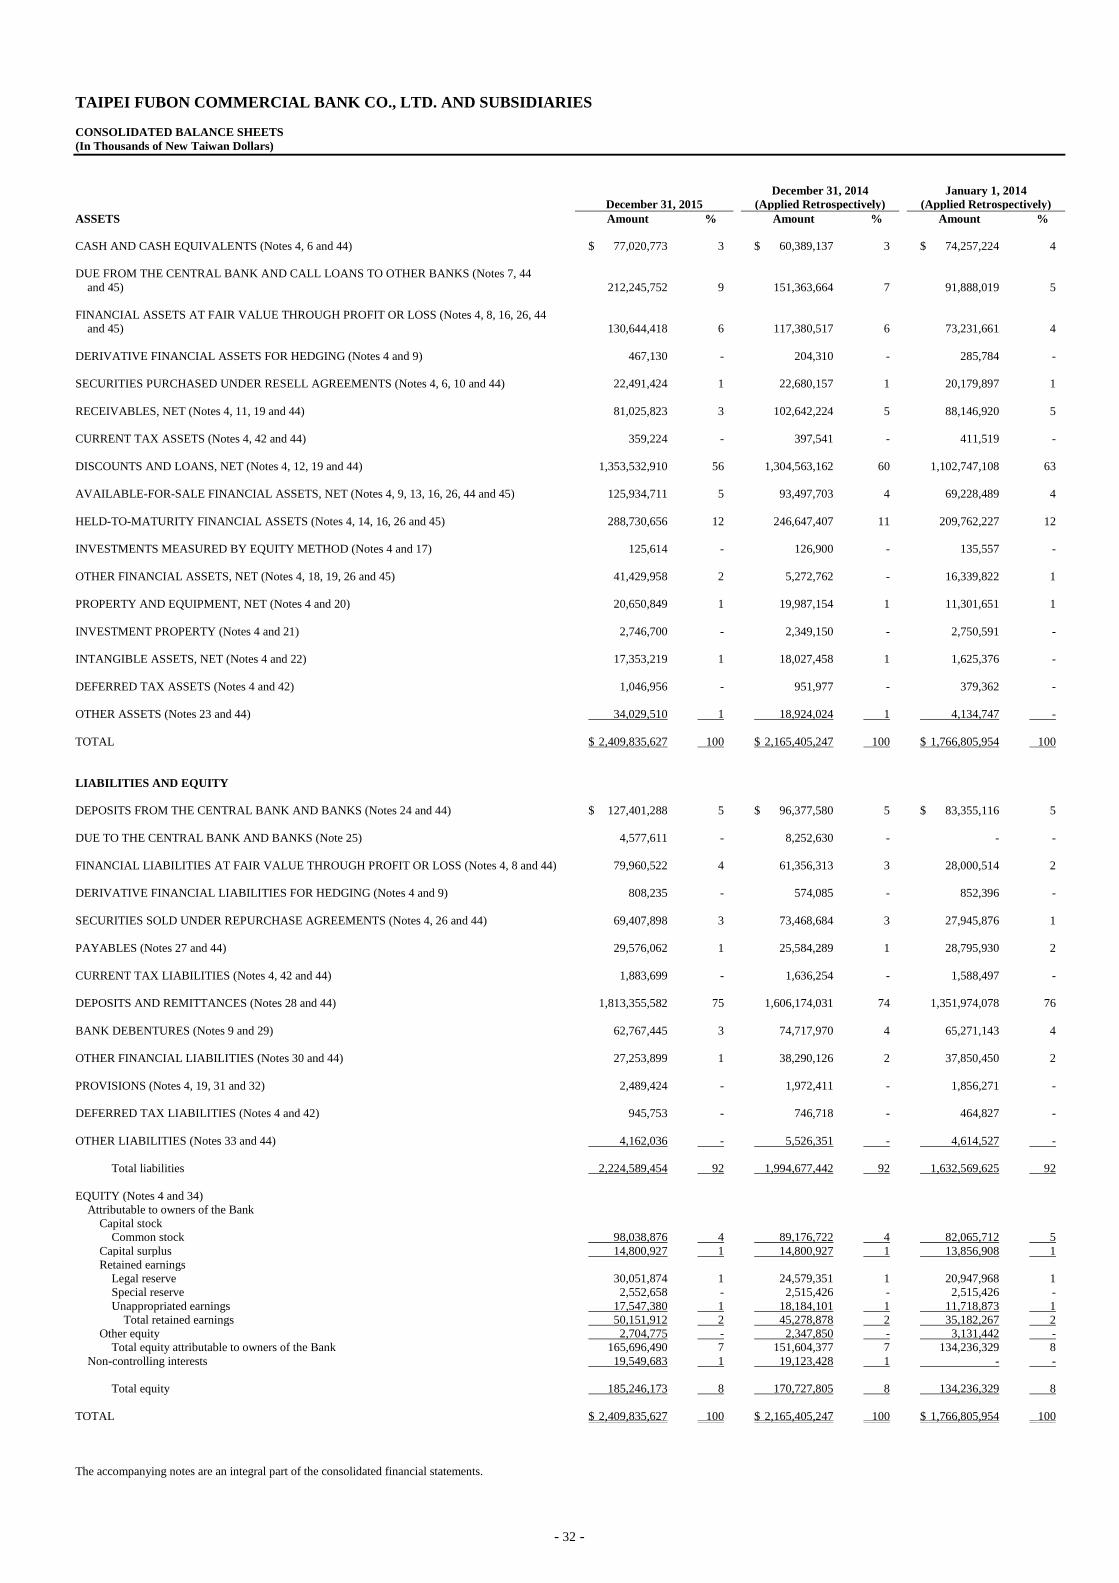
- 32 -
TAIPEI FUBON COMMERCIAL BANK CO., LTD. AND SUBSIDIARIES
CONSOLIDATED BALANCE SHEETS
(In Thousands of New Taiwan Dollars)
December 31, 2015
December 31, 2014
(Applied Retrospectively)
January 1, 2014
(Applied Retrospectively)
ASSETS Amount % Amount % Amount %
CASH AND CASH EQUIVALENTS (Notes 4, 6 and 44) $ 77,020,773 3 $ 60,389,137 3 $ 74,257,224 4
DUE FROM THE CENTRAL BANK AND CALL LOANS TO OTHER BANKS (Notes 7, 44
and 45) 212,245,752 9 151,363,664 7 91,888,019 5
FINANCIAL ASSETS AT FAIR VALUE THROUGH PROFIT OR LOSS (Notes 4, 8, 16, 26, 44
and 45) 130,644,418 6 117,380,517 6 73,231,661 4
DERIVATIVE FINANCIAL ASSETS FOR HEDGING (Notes 4 and 9) 467,130 - 204,310 - 285,784 -
SECURITIES PURCHASED UNDER RESELL AGREEMENTS (Notes 4, 6, 10 and 44) 22,491,424 1 22,680,157 1 20,179,897 1
RECEIVABLES, NET (Notes 4, 11, 19 and 44) 81,025,823 3 102,642,224 5 88,146,920 5
CURRENT TAX ASSETS (Notes 4, 42 and 44) 359,224 - 397,541 - 411,519 -
DISCOUNTS AND LOANS, NET (Notes 4, 12, 19 and 44) 1,353,532,910 56 1,304,563,162 60 1,102,747,108 63
AVAILABLE-FOR-SALE FINANCIAL ASSETS, NET (Notes 4, 9, 13, 16, 26, 44 and 45) 125,934,711 5 93,497,703 4 69,228,489 4
HELD-TO-MATURITY FINANCIAL ASSETS (Notes 4, 14, 16, 26 and 45) 288,730,656 12 246,647,407 11 209,762,227 12
INVESTMENTS MEASURED BY EQUITY METHOD (Notes 4 and 17) 125,614 - 126,900 - 135,557 -
OTHER FINANCIAL ASSETS, NET (Notes 4, 18, 19, 26 and 45) 41,429,958 2 5,272,762 - 16,339,822 1
PROPERTY AND EQUIPMENT, NET (Notes 4 and 20) 20,650,849 1 19,987,154 1 11,301,651 1
INVESTMENT PROPERTY (Notes 4 and 21) 2,746,700 - 2,349,150 - 2,750,591 -
INTANGIBLE ASSETS, NET (Notes 4 and 22) 17,353,219 1 18,027,458 1 1,625,376 -
DEFERRED TAX ASSETS (Notes 4 and 42) 1,046,956 - 951,977 - 379,362 -
OTHER ASSETS (Notes 23 and 44) 34,029,510 1 18,924,024 1 4,134,747 -
TOTAL $ 2,409,835,627 100 $ 2,165,405,247 100 $ 1,766,805,954 100
LIABILITIES AND EQUITY
DEPOSITS FROM THE CENTRAL BANK AND BANKS (Notes 24 and 44) $ 127,401,288 5 $ 96,377,580 5 $ 83,355,116 5
DUE TO THE CENTRAL BANK AND BANKS (Note 25) 4,577,611 - 8,252,630 - - -
FINANCIAL LIABILITIES AT FAIR VALUE THROUGH PROFIT OR LOSS (Notes 4, 8 and 44) 79,960,522 4 61,356,313 3 28,000,514 2
DERIVATIVE FINANCIAL LIABILITIES FOR HEDGING (Notes 4 and 9) 808,235 - 574,085 - 852,396 -
SECURITIES SOLD UNDER REPURCHASE AGREEMENTS (Notes 4, 26 and 44) 69,407,898 3 73,468,684 3 27,945,876 1
PAYABLES (Notes 27 and 44) 29,576,062 1 25,584,289 1 28,795,930 2
CURRENT TAX LIABILITIES (Notes 4, 42 and 44) 1,883,699 - 1,636,254 - 1,588,497 -
DEPOSITS AND REMITTANCES (Notes 28 and 44) 1,813,355,582 75 1,606,174,031 74 1,351,974,078 76
BANK DEBENTURES (Notes 9 and 29) 62,767,445 3 74,717,970 4 65,271,143 4
OTHER FINANCIAL LIABILITIES (Notes 30 and 44) 27,253,899 1 38,290,126 2 37,850,450 2
PROVISIONS (Notes 4, 19, 31 and 32) 2,489,424 - 1,972,411 - 1,856,271 -
DEFERRED TAX LIABILITIES (Notes 4 and 42) 945,753 - 746,718 - 464,827 -
OTHER LIABILITIES (Notes 33 and 44) 4,162,036 - 5,526,351 - 4,614,527 -
Total liabilities 2,224,589,454 92 1,994,677,442 92 1,632,569,625 92
EQUITY (Notes 4 and 34)
Attributable to owners of the Bank
Capital stock
Common stock 98,038,876 4 89,176,722 4 82,065,712 5
Capital surplus 14,800,927 1 14,800,927 1 13,856,908 1
Retained earnings
Legal reserve 30,051,874 1 24,579,351 1 20,947,968 1
Special reserve 2,552,658 - 2,515,426 - 2,515,426 -
Unappropriated earnings 17,547,380 1 18,184,101 1 11,718,873 1
Total retained earnings 50,151,912 2 45,278,878 2 35,182,267 2
Other equity 2,704,775 - 2,347,850 - 3,131,442 -
Total equity attributable to owners of the Bank 165,696,490 7 151,604,377 7 134,236,329 8
Non-controlling interests 19,549,683 1 19,123,428 1 - -
Total equity 185,246,173 8 170,727,805 8 134,236,329 8
TOTAL $ 2,409,835,627 100 $ 2,165,405,247 100 $ 1,766,805,954 100
The accompanying notes are an integral part of the consolidated financial statements.
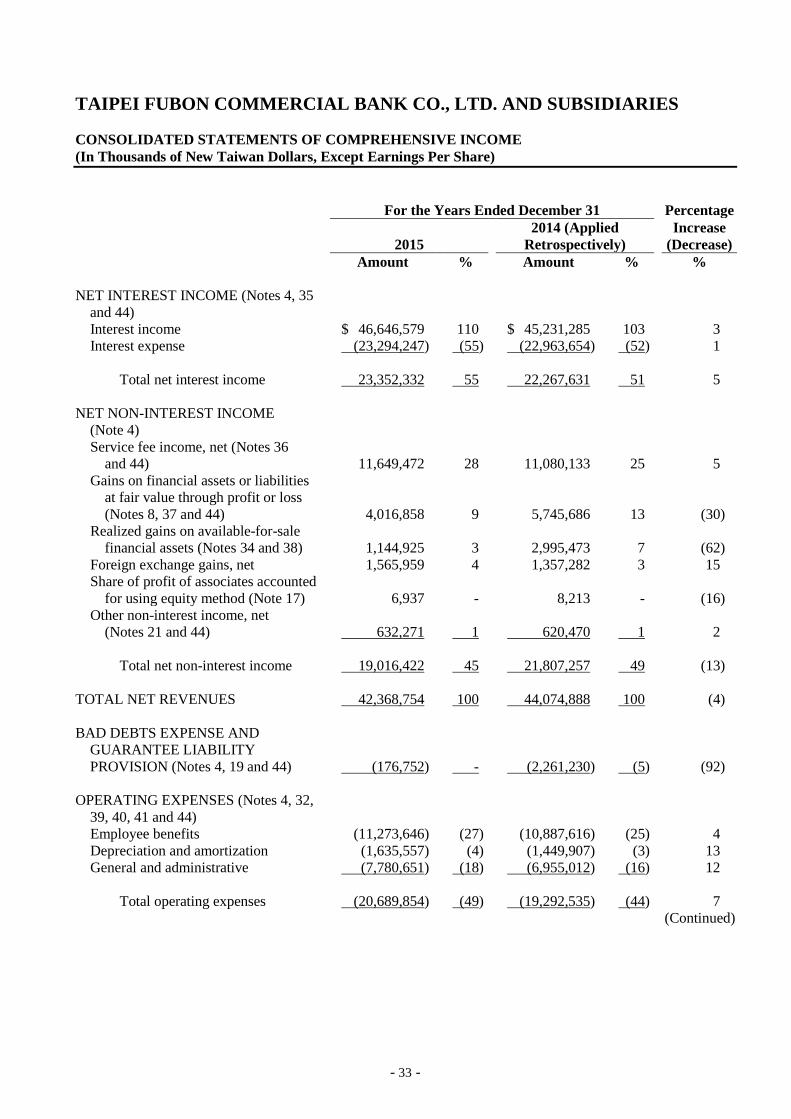
- 33 -
TAIPEI FUBON COMMERCIAL BANK CO., LTD. AND SUBSIDIARIES
CONSOLIDATED STATEMENTS OF COMPREHENSIVE INCOME
(In Thousands of New Taiwan Dollars, Except Earnings Per Share)
For the Years Ended December 31 Percentage
2015 2014 (Applied
Retrospectively) Increase
(Decrease)
Amount % Amount % %
NET INTEREST INCOME (Notes 4, 35
and 44)
Interest income $ 46,646,579 110 $ 45,231,285 103 3
Interest expense (23,294,247) (55) (22,963,654) (52) 1
Total net interest income 23,352,332 55 22,267,631 51 5
NET NON-INTEREST INCOME
(Note 4)
Service fee income, net (Notes 36
and 44) 11,649,472 28 11,080,133 25 5
Gains on financial assets or liabilities
at fair value through profit or loss
(Notes 8, 37 and 44) 4,016,858 9 5,745,686 13 (30)
Realized gains on available-for-sale
financial assets (Notes 34 and 38) 1,144,925 3 2,995,473 7 (62)
Foreign exchange gains, net 1,565,959 4 1,357,282 3 15
Share of profit of associates accounted
for using equity method (Note 17) 6,937 - 8,213 - (16)
Other non-interest income, net
(Notes 21 and 44) 632,271 1 620,470 1 2
Total net non-interest income 19,016,422 45 21,807,257 49 (13)
TOTAL NET REVENUES 42,368,754 100 44,074,888 100 (4)
BAD DEBTS EXPENSE AND
GUARANTEE LIABILITY
PROVISION (Notes 4, 19 and 44) (176,752) - (2,261,230) (5) (92)
OPERATING EXPENSES (Notes 4, 32,
39, 40, 41 and 44)
Employee benefits (11,273,646) (27) (10,887,616) (25) 4
Depreciation and amortization (1,635,557) (4) (1,449,907) (3) 13
General and administrative (7,780,651) (18) (6,955,012) (16) 12
Total operating expenses (20,689,854) (49) (19,292,535) (44) 7
(Continued)
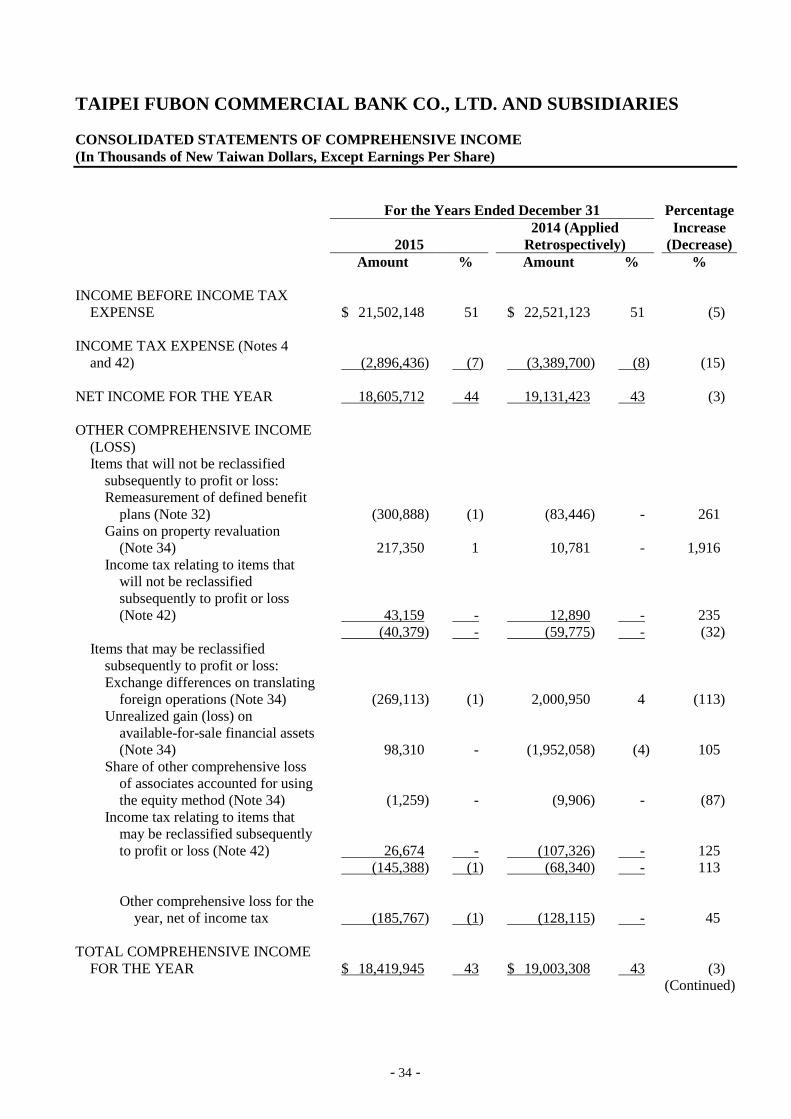
- 34 -
TAIPEI FUBON COMMERCIAL BANK CO., LTD. AND SUBSIDIARIES
CONSOLIDATED STATEMENTS OF COMPREHENSIVE INCOME
(In Thousands of New Taiwan Dollars, Except Earnings Per Share)
For the Years Ended December 31 Percentage
2015 2014 (Applied
Retrospectively) Increase
(Decrease)
Amount % Amount % %
INCOME BEFORE INCOME TAX
EXPENSE $ 21,502,148 51 $ 22,521,123 51 (5)
INCOME TAX EXPENSE (Notes 4
and 42) (2,896,436) (7) (3,389,700) (8) (15)
NET INCOME FOR THE YEAR 18,605,712 44 19,131,423 43 (3)
OTHER COMPREHENSIVE INCOME
(LOSS)
Items that will not be reclassified
subsequently to profit or loss:
Remeasurement of defined benefit
plans (Note 32) (300,888) (1) (83,446) - 261
Gains on property revaluation
(Note 34) 217,350 1 10,781 - 1,916
Income tax relating to items that
will not be reclassified
subsequently to profit or loss
(Note 42) 43,159 - 12,890 - 235
(40,379) - (59,775) - (32)
Items that may be reclassified
subsequently to profit or loss:
Exchange differences on translating
foreign operations (Note 34) (269,113) (1) 2,000,950 4 (113)
Unrealized gain (loss) on
available-for-sale financial assets
(Note 34) 98,310 - (1,952,058) (4) 105
Share of other comprehensive loss
of associates accounted for using
the equity method (Note 34) (1,259) - (9,906) - (87)
Income tax relating to items that
may be reclassified subsequently
to profit or loss (Note 42) 26,674 - (107,326) - 125
(145,388) (1) (68,340) - 113
Other comprehensive loss for the
year, net of income tax (185,767) (1) (128,115) - 45
TOTAL COMPREHENSIVE INCOME
FOR THE YEAR $ 18,419,945 43 $ 19,003,308 43 (3)
(Continued)
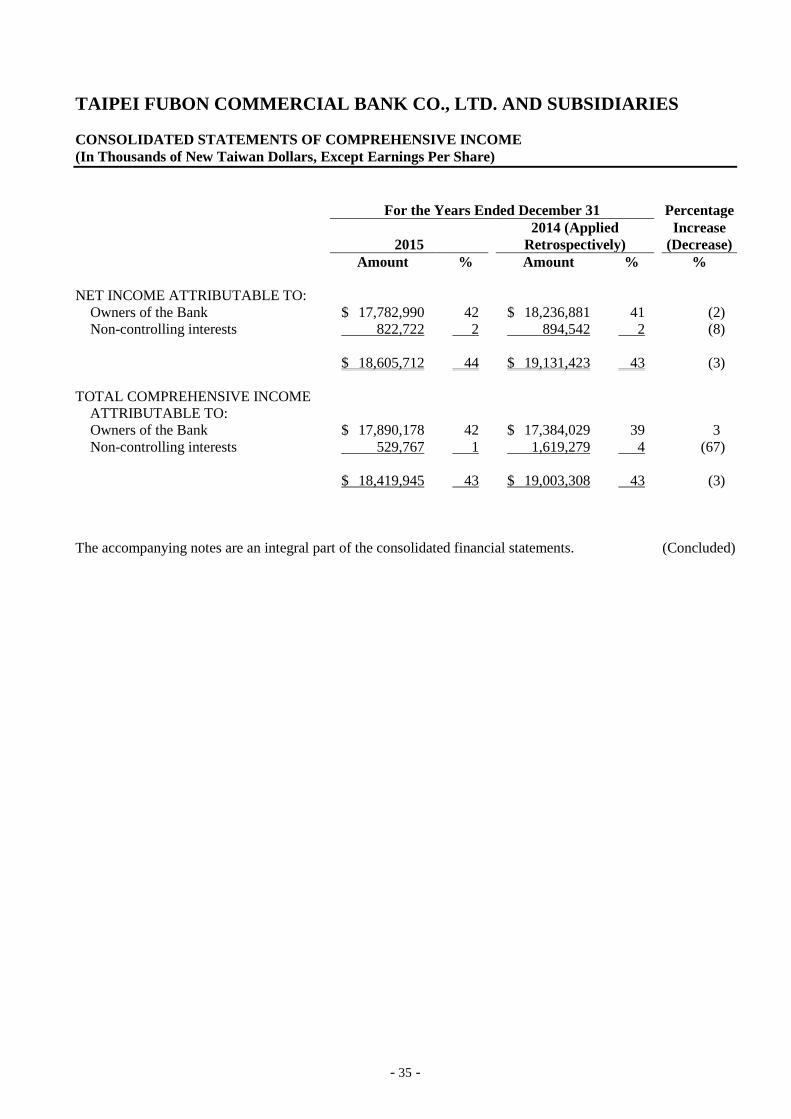
- 35 -
TAIPEI FUBON COMMERCIAL BANK CO., LTD. AND SUBSIDIARIES
CONSOLIDATED STATEMENTS OF COMPREHENSIVE INCOME
(In Thousands of New Taiwan Dollars, Except Earnings Per Share)
For the Years Ended December 31 Percentage
2015 2014 (Applied
Retrospectively) Increase
(Decrease)
Amount % Amount % %
NET INCOME ATTRIBUTABLE TO:
Owners of the Bank $ 17,782,990 42 $ 18,236,881 41 (2)
Non-controlling interests 822,722 2 894,542 2 (8)
$ 18,605,712 44 $ 19,131,423 43 (3)
TOTAL COMPREHENSIVE INCOME
ATTRIBUTABLE TO:
Owners of the Bank $ 17,890,178 42 $ 17,384,029 39 3
Non-controlling interests 529,767 1 1,619,279 4 (67)
$ 18,419,945 43 $ 19,003,308 43 (3)
The accompanying notes are an integral part of the consolidated financial statements. (Concluded)
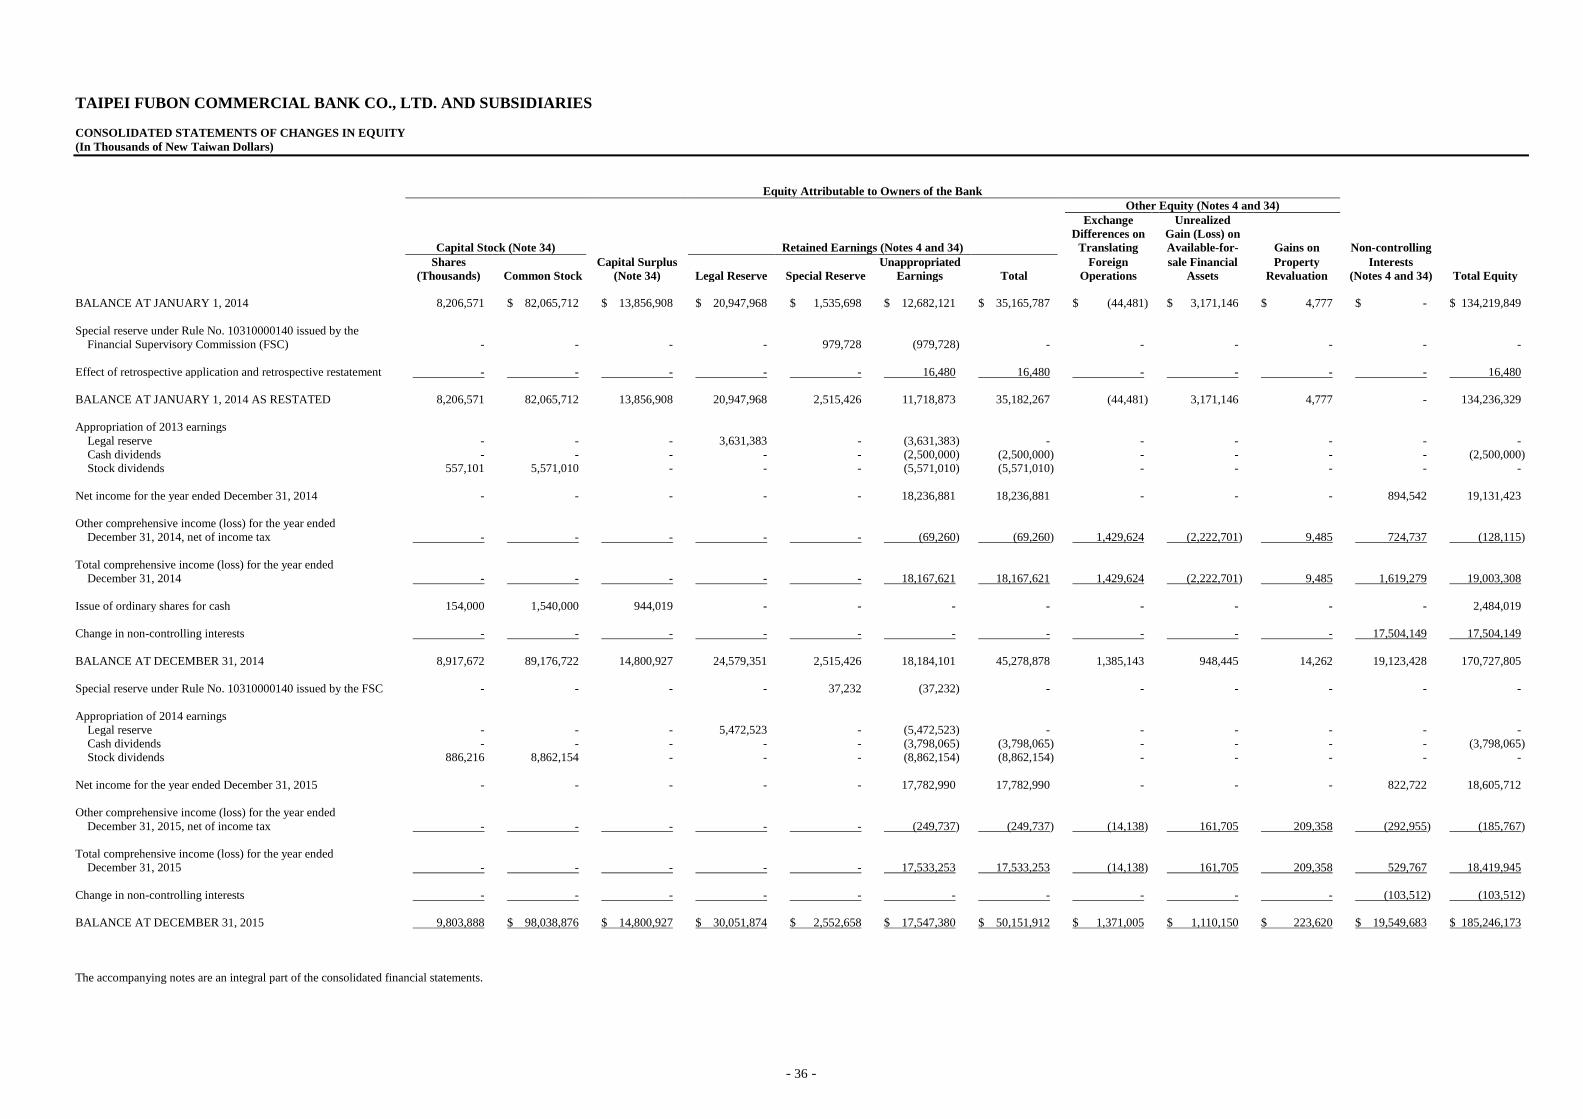
- 36 -
TAIPEI FUBON COMMERCIAL BANK CO., LTD. AND SUBSIDIARIES
CONSOLIDATED STATEMENTS OF CHANGES IN EQUITY
(In Thousands of New Taiwan Dollars)
Equity Attributable to Owners of the Bank
Other Equity (Notes 4 and 34)
Capital Stock (Note 34) Retained Earnings (Notes 4 and 34)
Exchange
Differences on
Translating
Unrealized
Gain (Loss) on
Available-for- Gains on Non-controlling
Shares
(Thousands) Common Stock
Capital Surplus
(Note 34) Legal Reserve Special Reserve
Unappropriated
Earnings Total
Foreign
Operations
sale Financial
Assets
Property
Revaluation
Interests
(Notes 4 and 34) Total Equity
BALANCE AT JANUARY 1, 2014 8,206,571 $ 82,065,712 $ 13,856,908 $ 20,947,968 $ 1,535,698 $ 12,682,121 $ 35,165,787 $ (44,481) $ 3,171,146 $ 4,777 $ - $ 134,219,849
Special reserve under Rule No. 10310000140 issued by the
Financial Supervisory Commission (FSC) - - - - 979,728 (979,728) - - - - - -
Effect of retrospective application and retrospective restatement - - - - - 16,480 16,480 - - - - 16,480
BALANCE AT JANUARY 1, 2014 AS RESTATED 8,206,571 82,065,712 13,856,908 20,947,968 2,515,426 11,718,873 35,182,267 (44,481) 3,171,146 4,777 - 134,236,329
Appropriation of 2013 earnings
Legal reserve - - - 3,631,383 - (3,631,383) - - - - - -
Cash dividends - - - - - (2,500,000) (2,500,000) - - - - (2,500,000)
Stock dividends 557,101 5,571,010 - - - (5,571,010) (5,571,010) - - - - -
Net income for the year ended December 31, 2014 - - - - - 18,236,881 18,236,881 - - - 894,542 19,131,423
Other comprehensive income (loss) for the year ended
December 31, 2014, net of income tax - - - - - (69,260) (69,260) 1,429,624 (2,222,701) 9,485 724,737 (128,115)
Total comprehensive income (loss) for the year ended
December 31, 2014 - - - - - 18,167,621 18,167,621 1,429,624 (2,222,701) 9,485 1,619,279 19,003,308
Issue of ordinary shares for cash 154,000 1,540,000 944,019 - - - - - - - - 2,484,019
Change in non-controlling interests - - - - - - - - - - 17,504,149 17,504,149
BALANCE AT DECEMBER 31, 2014 8,917,672 89,176,722 14,800,927 24,579,351 2,515,426 18,184,101 45,278,878 1,385,143 948,445 14,262 19,123,428 170,727,805
Special reserve under Rule No. 10310000140 issued by the FSC - - - - 37,232 (37,232) - - - - - -
Appropriation of 2014 earnings
Legal reserve - - - 5,472,523 - (5,472,523) - - - - - -
Cash dividends - - - - - (3,798,065) (3,798,065) - - - - (3,798,065)
Stock dividends 886,216 8,862,154 - - - (8,862,154) (8,862,154) - - - - -
Net income for the year ended December 31, 2015 - - - - - 17,782,990 17,782,990 - - - 822,722 18,605,712
Other comprehensive income (loss) for the year ended
December 31, 2015, net of income tax - - - - - (249,737) (249,737) (14,138) 161,705 209,358 (292,955) (185,767)
Total comprehensive income (loss) for the year ended
December 31, 2015 - - - - - 17,533,253 17,533,253 (14,138) 161,705 209,358 529,767 18,419,945
Change in non-controlling interests - - - - - - - - - - (103,512) (103,512)
BALANCE AT DECEMBER 31, 2015 9,803,888 $ 98,038,876 $ 14,800,927 $ 30,051,874 $ 2,552,658 $ 17,547,380 $ 50,151,912 $ 1,371,005 $ 1,110,150 $ 223,620 $ 19,549,683 $ 185,246,173
The accompanying notes are an integral part of the consolidated financial statements.
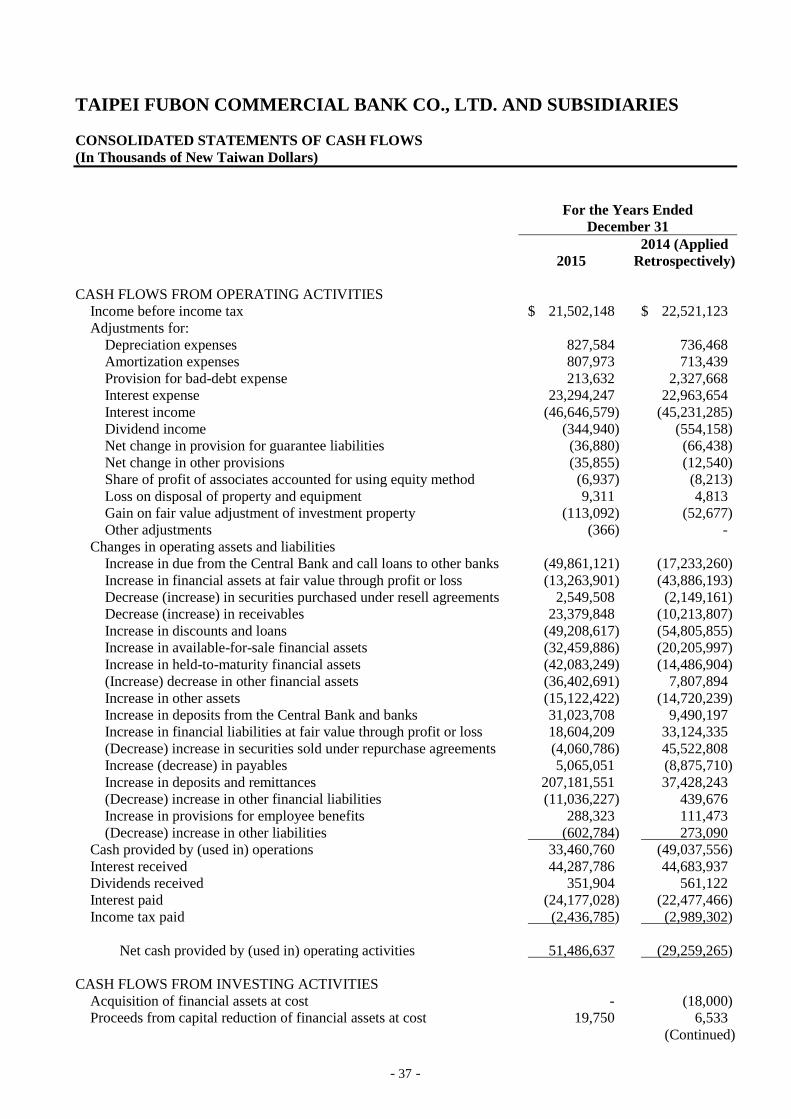
- 37 -
TAIPEI FUBON COMMERCIAL BANK CO., LTD. AND SUBSIDIARIES
CONSOLIDATED STATEMENTS OF CASH FLOWS
(In Thousands of New Taiwan Dollars)
For the Years Ended
December 31
2015 2014 (Applied
Retrospectively)
CASH FLOWS FROM OPERATING ACTIVITIES
Income before income tax $ 21,502,148 $ 22,521,123
Adjustments for:
Depreciation expenses 827,584 736,468
Amortization expenses 807,973 713,439
Provision for bad-debt expense 213,632 2,327,668
Interest expense 23,294,247 22,963,654
Interest income (46,646,579) (45,231,285)
Dividend income (344,940) (554,158)
Net change in provision for guarantee liabilities (36,880) (66,438)
Net change in other provisions (35,855) (12,540)
Share of profit of associates accounted for using equity method (6,937) (8,213)
Loss on disposal of property and equipment 9,311 4,813
Gain on fair value adjustment of investment property (113,092) (52,677)
Other adjustments (366) -
Changes in operating assets and liabilities
Increase in due from the Central Bank and call loans to other banks (49,861,121) (17,233,260)
Increase in financial assets at fair value through profit or loss (13,263,901) (43,886,193)
Decrease (increase) in securities purchased under resell agreements 2,549,508 (2,149,161)
Decrease (increase) in receivables 23,379,848 (10,213,807)
Increase in discounts and loans (49,208,617) (54,805,855)
Increase in available-for-sale financial assets (32,459,886) (20,205,997)
Increase in held-to-maturity financial assets (42,083,249) (14,486,904)
(Increase) decrease in other financial assets (36,402,691) 7,807,894
Increase in other assets (15,122,422) (14,720,239)
Increase in deposits from the Central Bank and banks 31,023,708 9,490,197
Increase in financial liabilities at fair value through profit or loss 18,604,209 33,124,335
(Decrease) increase in securities sold under repurchase agreements (4,060,786) 45,522,808
Increase (decrease) in payables 5,065,051 (8,875,710)
Increase in deposits and remittances 207,181,551 37,428,243
(Decrease) increase in other financial liabilities (11,036,227) 439,676
Increase in provisions for employee benefits 288,323 111,473
(Decrease) increase in other liabilities (602,784) 273,090
Cash provided by (used in) operations 33,460,760 (49,037,556)
Interest received 44,287,786 44,683,937
Dividends received 351,904 561,122
Interest paid (24,177,028) (22,477,466)
Income tax paid (2,436,785) (2,989,302)
Net cash provided by (used in) operating activities 51,486,637 (29,259,265)
CASH FLOWS FROM INVESTING ACTIVITIES
Acquisition of financial assets at cost - (18,000)
Proceeds from capital reduction of financial assets at cost 19,750 6,533
(Continued)
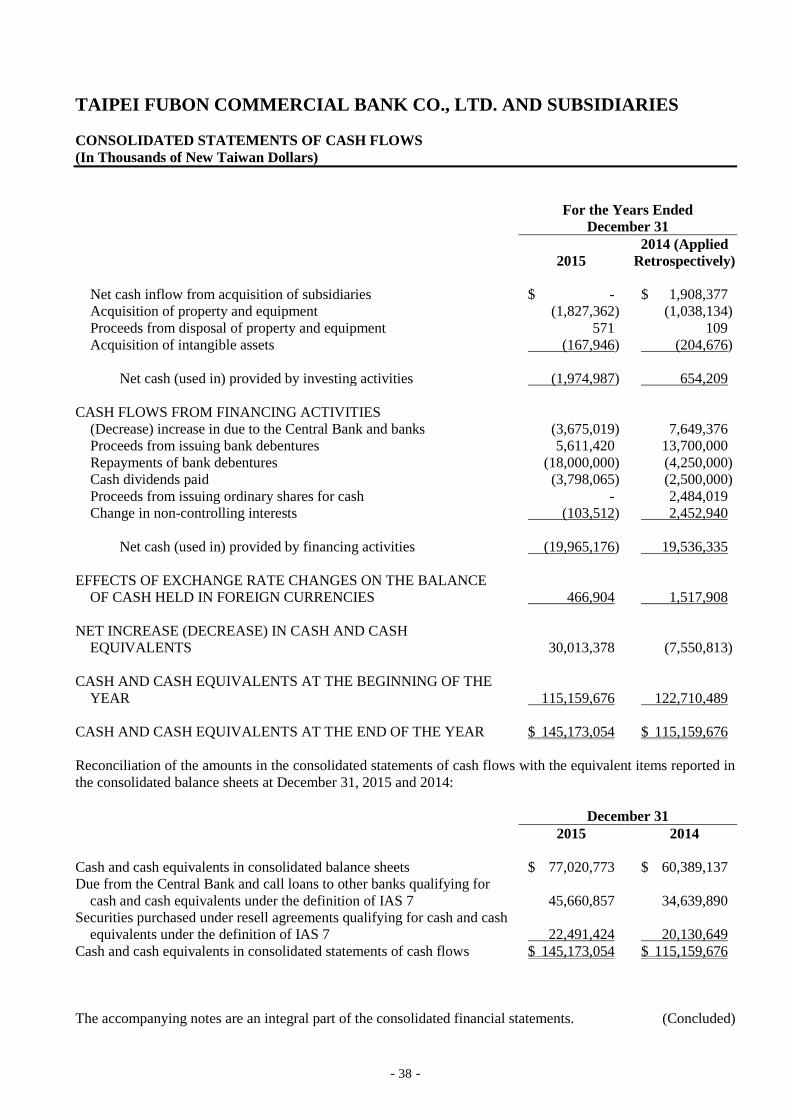
- 38 -
TAIPEI FUBON COMMERCIAL BANK CO., LTD. AND SUBSIDIARIES
CONSOLIDATED STATEMENTS OF CASH FLOWS
(In Thousands of New Taiwan Dollars)
For the Years Ended
December 31
2015 2014 (Applied
Retrospectively)
Net cash inflow from acquisition of subsidiaries $ - $ 1,908,377
Acquisition of property and equipment (1,827,362) (1,038,134)
Proceeds from disposal of property and equipment 571 109
Acquisition of intangible assets (167,946) (204,676)
Net cash (used in) provided by investing activities (1,974,987) 654,209
CASH FLOWS FROM FINANCING ACTIVITIES
(Decrease) increase in due to the Central Bank and banks (3,675,019) 7,649,376
Proceeds from issuing bank debentures 5,611,420 13,700,000
Repayments of bank debentures (18,000,000) (4,250,000)
Cash dividends paid (3,798,065) (2,500,000)
Proceeds from issuing ordinary shares for cash - 2,484,019
Change in non-controlling interests (103,512) 2,452,940
Net cash (used in) provided by financing activities (19,965,176) 19,536,335
EFFECTS OF EXCHANGE RATE CHANGES ON THE BALANCE
OF CASH HELD IN FOREIGN CURRENCIES 466,904 1,517,908
NET INCREASE (DECREASE) IN CASH AND CASH
EQUIVALENTS 30,013,378 (7,550,813)
CASH AND CASH EQUIVALENTS AT THE BEGINNING OF THE
YEAR 115,159,676 122,710,489
CASH AND CASH EQUIVALENTS AT THE END OF THE YEAR $ 145,173,054 $ 115,159,676
Reconciliation of the amounts in the consolidated statements of cash flows with the equivalent items reported in
the consolidated balance sheets at December 31, 2015 and 2014:
December 31
2015 2014
Cash and cash equivalents in consolidated balance sheets $ 77,020,773 $ 60,389,137
Due from the Central Bank and call loans to other banks qualifying for
cash and cash equivalents under the definition of IAS 7
45,660,857 34,639,890
Securities purchased under resell agreements qualifying for cash and cash
equivalents under the definition of IAS 7
22,491,424 20,130,649
Cash and cash equivalents in consolidated statements of cash flows $ 145,173,054 $ 115,159,676
The accompanying notes are an integral part of the consolidated financial statements. (Concluded)
- 39 -
TAIPEI FUBON COMMERCIAL BANK CO., LTD. AND SUBSIDIARIES
NOTES TO CONSOLIDATED FINANCIAL STATEMENTS
FOR THE YEARS ENDED DECEMBER 31, 2015 AND 2014
(In Thousands of New Taiwan Dollars, Unless Stated Otherwise)
1. GENERAL INFORMATION
TAIPEI FUBON COMMERCIAL BANK Co., Ltd. (the “Bank”) began operations as a financial institution
under the Taipei City Government (TCG) in 1969. On July 1, 1984, it was reorganized into a limited
liability corporation and was renamed City Bank of Taipei Co., Ltd. On January 1, 1993, the Bank was
renamed TAIPEIBANK Co., Ltd. (“TAIPEIBANK”). On November 30, 1999, the Bank was privatized
through the sale of its shares to the public, with TCG’s holdings reduced to less than 50% of the Bank’s
outstanding capital stock. In a special meeting on October 4, 2002, the shareholders approved a share
swap, which resulted in the Bank becoming a wholly owned subsidiary of the Fubon Financial Holdings
Company (FFH). The board of directors designated December 23, 2002 as the effective date of the share
swap and the delisting of the Bank’s stock from the Taiwan Stock Exchange.
To fully benefit from the synergy of two diversified businesses and reduce operating costs, the boards of
directors of the Bank and Fubon Bank Co., Ltd. (“Fubon Bank”, also a wholly owned subsidiary of FFH)
decided on January 1, 2005 to combine these two entities. On January 1, 2005, the Bank acquired the
assets and liabilities of Fubon Bank through a share swap and changed its name to TAIPEI FUBON
COMMERCIAL BANK Co., Ltd.
On September 20, 2006, the boards of directors of the Bank and Fubon Bills Finance Co., Ltd. (FBFC)
decided to merge the Bank and FBFC to strengthen their operating synergies and lower operating costs,
with the Bank as the surviving entity. The Bank set December 25, 2006 as the effective date of the
merger.
Later, under the terms and conditions of the “Sale and Assumption Agreement” signed by the Bank,
Chinfon Commercial Bank Co., Ltd. (hereinafter referred to as “Chinfon Bank”), the Central Deposit
Insurance Corp. and the Executive Yuan’s Financial Reconstruction Trust Corporation on October 30,
2009, the Bank assumed-effective midnight of March 6, 2010 - the assets, liabilities and businesses of the
Hanoi branch and Ho Chi Minh City sub branch of Chinfon Bank with the relevant authorities’ approval
and then completed the settlement procedure.
On December 31, 2013, the Bank acquired 10% equity interest in First Sino Bank (FSB, which was
renamed Fubon Bank (China) in April 2014) and acquired an additional 41% equity interest on January 7,
2014. With the Bank’s 51% interest in FSB, the Bank became FSB’s parent company.
Under its business license, the Bank engages in all commercial banking operations authorized under the
Banking Act.
The Bank has its head office in Taipei City, and as of December 31, 2015, had 2 major operating
departments - Banking and Trust departments - with 132 branches (including one offshore banking unit
(OBU) and 5 overseas branches).
The operations of the Bank’s Trust Department include: (1) planning, managing and operating a trust
business; and (2) custodianship of nondiscretionary trust funds in foreign securities and mutual funds.
These operations are regulated under the Banking Act and Trust Law.
On May 21, 2015, the Bank’s plan to set up a Singapore branch was approved by the Monetary Authority
of Singapore, and the Bank started business on March 14, 2016.
- 40 -
Fubon Bank (China) is the joint venture bank founded by the Shanghai Pudong Development Bank and
Lotus Worldwide Ltd. on March 20, 1997 in Shanghai Pudong in accordance with “Regulations Governing
Foreign Financial Institutions in the People’s Republic of China”. Fubon Bank (China) mainly renders
full-scope RMB and foreign currency services to customers, except citizens in the territory of China. As
of December 31, 2015, Fubon Bank (China) had headquarters, 21 branches (including preparatory offices)
within Mainland China.
Taipei Fubon Bank Life Insurance Agency Co., Ltd. was incorporated in accordance with the Company
Law in June, 2000 and mainly engages in the life insurance agency business.
The Bank’s ultimate parent is Fubon Financial Holdings Company, which holds all the ordinary shares of
the Bank.
The functional currency of the Bank is the New Taiwan dollar, and the consolidated financial statements are
presented in New Taiwan dollars.
2. APPROVAL OF FINANCIAL STATEMENTS
The consolidated financial statements were approved by the board of directors and authorized for issue on
March 18, 2016.
3. APPLICATION OF NEW AND REVISED STANDARDS, AMENDMENTS AND
INTERPRETATIONS
a. Initial application of the amendments to the Regulations Governing the Preparation of Financial Reports
by Public Banks and the 2013 version of the International Financial Reporting Standards (IFRS),
International Accounting Standards (IAS), Interpretations of IFRS (IFRIC), and Interpretations of IAS
(SIC) endorsed by the Financial Supervisory Commission (FSC).
Rule No. 10310006010 and Rule No. 1030010325 issued by the FSC, stipulated that the Bank and its
subsidiaries should apply the 2013 version of IFRS, IAS, IFRIC and SIC (collectively, the “IFRSs”)
endorsed by the FSC and the related amendments to the Regulations Governing the Preparation of
Financial Reports by Public Banks Issuers starting January 1, 2015.
Except for the following, the initial application of the amendments to the Regulations Governing the
Preparation of Financial Reports by Public Banks and the 2013 IFRSs version would not have any
material impact on the Bank and its subsidiaries’ accounting policies:
1) IFRS 10 “Consolidated Financial Statements”
IFRS 10 replaces IAS 27 “Consolidated and Separate Financial Statements” and SIC 12
“Consolidation - Special Purpose Entities”. The Bank and its subsidiaries have control over an
investee only if they have (i) power over the investee; (ii) exposure, or rights, to variable returns
from its involvement with the investee and (iii) the ability to use its power over the investee to
affect the amount of its returns. Additional guidance has been included in IFRS 10 to explain
when an investor has control over an investee.
2) IFRS 12 “Disclosure of Interests in Other Entities”
IFRS 12 is a new disclosure standard that applies to entities with interests in subsidiaries, joint
arrangements, associates and/or unconsolidated structured entities. In general, the disclosure
requirements in IFRS 12 are more extensive, please refer to Notes 15, 16 and 17 for related
disclosures.
- 41 -
3) IFRS 13 “Fair Value Measurement”
IFRS 13 establishes a single source of guidance for fair value measurements. It defines fair value,
establishes a framework for measuring fair value, and requires disclosures about fair value
measurements. The disclosure requirements in IFRS 13 are more extensive than those required by
the current standards. For example, quantitative and qualitative disclosures based on the
three-level fair value hierarchy currently required for financial instruments only will be extended by
IFRS 13 to cover all assets and liabilities within its scope.
The fair value measurements under IFRS 13 will be applied prospectively from January 1, 2015.
Refer to Note 49 for related disclosures.
4) Amendments to IAS 1 “Presentation of Items of Other Comprehensive Income”
The amendments to IAS 1 require items of other comprehensive income to be grouped into those
items that (1) will not be reclassified subsequently to profit or loss; and (2) may be reclassified
subsequently to profit or loss. Income taxes on related items of other comprehensive income are
grouped on the same basis. Under the prior IAS 1, there were no such requirements.
The Bank and its subsidiaries retrospectively applied the above amendments starting in 2015.
Items not expected to be reclassified to profit or loss are remeasurements of the defined benefit
plans, gains on property revaluations, and changes in credit risk of financial liabilities designated as
at fair value through profit or loss. Items expected to be reclassified to profit or loss are the
exchange differences on translating foreign operations, unrealized gain (loss) on available-for-sale
financial assets, and share of the associates’ other comprehensive income (except the share of the
remeasurements of the defined benefit plans). However, the application of these amendments will
not have any impact on the net profit for the year, other comprehensive income for the year (net of
income tax), and total comprehensive income for the year.
5) Revision to IAS 19 “Employee Benefits”
The revised IAS 19 requires the recognition of changes in defined benefit obligations and in the fair
value of plan assets when they occur, hence eliminating the corridor approach permitted under the
prior IAS 19 and accelerating the recognition of past service costs. The revision also requires all
remeasurements of the defined benefit plans to be recognized immediately through other
comprehensive income so that the net defined benefit asset or liability will reflect the full value of
the plan deficit or surplus.
Furthermore, the interest cost and expected return on plan assets used in the prior IAS 19 have been
replaced with net interest, which is calculated by multiplying the net defined benefit liability or
asset by the discount rate determined at the start of the period. In addition, the revised IAS 19
introduces certain changes in the presentation of the defined benefit cost, and also includes more
extensive disclosures.
In addition, the revised IAS 19 has changed the definition of short-term employee benefits to
“employee benefits (other than termination benefits) that are expected to be settled wholly before
twelve months after the end of the annual reporting period in which the employees render the
related services”. Thus, the Bank’s unused annual leaves, which could be carried forward within
24 months after the end of the annual period in which employees render services and which were
previously classified as short-term employee benefits, have been classified as other long-term
employee benefits under revised IAS 19. For long-term defined benefit obligations, the projected
unit credit method is used to determine the present value of these obligations and the related current
service cost.
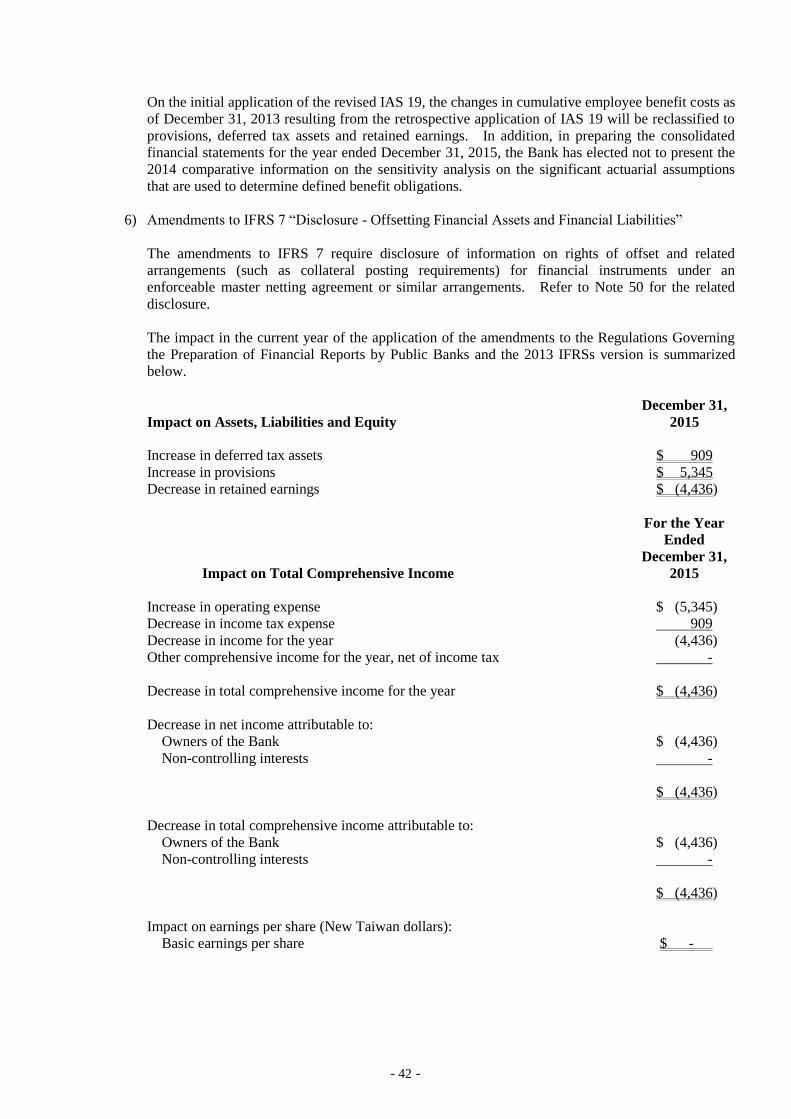
- 42 -
On the initial application of the revised IAS 19, the changes in cumulative employee benefit costs as
of December 31, 2013 resulting from the retrospective application of IAS 19 will be reclassified to
provisions, deferred tax assets and retained earnings. In addition, in preparing the consolidated
financial statements for the year ended December 31, 2015, the Bank has elected not to present the
2014 comparative information on the sensitivity analysis on the significant actuarial assumptions
that are used to determine defined benefit obligations.
6) Amendments to IFRS 7 “Disclosure - Offsetting Financial Assets and Financial Liabilities”
The amendments to IFRS 7 require disclosure of information on rights of offset and related
arrangements (such as collateral posting requirements) for financial instruments under an
enforceable master netting agreement or similar arrangements. Refer to Note 50 for the related
disclosure.
The impact in the current year of the application of the amendments to the Regulations Governing
the Preparation of Financial Reports by Public Banks and the 2013 IFRSs version is summarized
below.
Impact on Assets, Liabilities and Equity
December 31,
2015
Increase in deferred tax assets $ 909
Increase in provisions $ 5,345
Decrease in retained earnings $ (4,436)
Impact on Total Comprehensive Income
For the Year
Ended
December 31,
2015
Increase in operating expense $ (5,345)
Decrease in income tax expense 909
Decrease in income for the year (4,436)
Other comprehensive income for the year, net of income tax -
Decrease in total comprehensive income for the year $ (4,436)
Decrease in net income attributable to:
Owners of the Bank $ (4,436)
Non-controlling interests -
$ (4,436)
Decrease in total comprehensive income attributable to:
Owners of the Bank $ (4,436)
Non-controlling interests -
$ (4,436)
Impact on earnings per share (New Taiwan dollars):
Basic earnings per share $ -
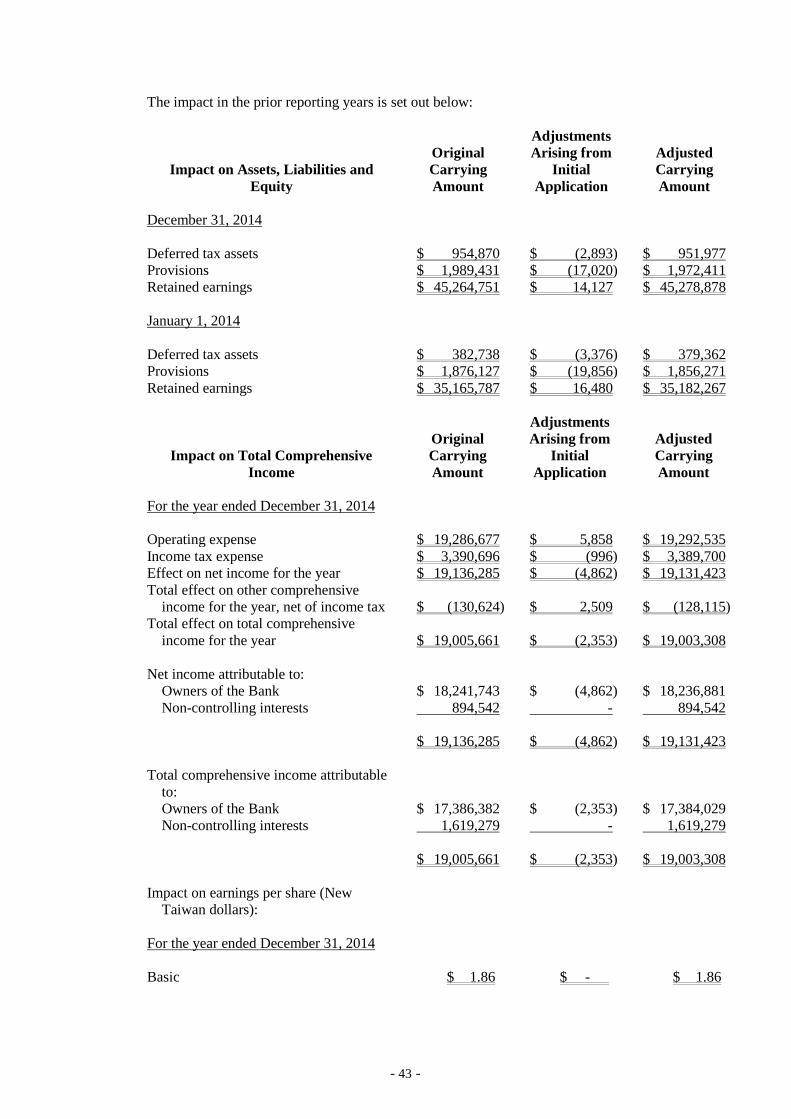
- 43 -
The impact in the prior reporting years is set out below:
Impact on Assets, Liabilities and
Equity
Original
Carrying
Amount
Adjustments
Arising from
Initial
Application
Adjusted
Carrying
Amount
December 31, 2014
Deferred tax assets $ 954,870 $ (2,893) $ 951,977
Provisions $ 1,989,431 $ (17,020) $ 1,972,411
Retained earnings $ 45,264,751 $ 14,127 $ 45,278,878
January 1, 2014
Deferred tax assets $ 382,738 $ (3,376) $ 379,362
Provisions $ 1,876,127 $ (19,856) $ 1,856,271
Retained earnings $ 35,165,787 $ 16,480 $ 35,182,267
Impact on Total Comprehensive
Income
Original
Carrying
Amount
Adjustments
Arising from
Initial
Application
Adjusted
Carrying
Amount
For the year ended December 31, 2014
Operating expense $ 19,286,677 $ 5,858 $ 19,292,535
Income tax expense $ 3,390,696 $ (996) $ 3,389,700
Effect on net income for the year $ 19,136,285 $ (4,862) $ 19,131,423
Total effect on other comprehensive
income for the year, net of income tax $ (130,624) $ 2,509 $ (128,115)
Total effect on total comprehensive
income for the year $ 19,005,661 $ (2,353) $ 19,003,308
Net income attributable to:
Owners of the Bank $ 18,241,743 $ (4,862) $ 18,236,881
Non-controlling interests 894,542 - 894,542
$ 19,136,285 $ (4,862) $ 19,131,423
Total comprehensive income attributable
to:
Owners of the Bank $ 17,386,382 $ (2,353) $ 17,384,029
Non-controlling interests 1,619,279 - 1,619,279
$ 19,005,661 $ (2,353) $ 19,003,308
Impact on earnings per share (New
Taiwan dollars):
For the year ended December 31, 2014
Basic $ 1.86 $ - $ 1.86
- 44 -
b. New IFRSs in issue but not yet endorsed by the FSC
On March 10, 2016, the FSC announced the scope of IFRSs to be endorsed and will take effect from
January 1, 2017. The scope includes all IFRSs that were issued by the IASB before January 1, 2016
and have effective dates on or before January 1, 2017, which means the scope excludes those that are
not yet effective as of January 1, 2017 such as IFRS 9 “Financial Instruments” and IFRS 15 “Revenue
from Contracts with Customers” and those with undetermined effective date. In addition, the FSC
announced that the Bank and its subsidiaries should apply IFRS 15 starting January 1, 2018. As of the
date the consolidated financial statements were authorized for issue, the FSC has not announced the
effective dates of other new, amended and revised standards and interpretations.
New IFRSs
Effective Date
Announced by IASB (Note 1)
Annual Improvements to IFRSs 2010-2012 Cycle July 1, 2014 (Note 2)
Annual Improvements to IFRSs 2011-2013 Cycle July 1, 2014
Annual Improvements to IFRSs 2012-2014 Cycle January 1, 2016 (Note 3)
IFRS 9 “Financial Instruments” January 1, 2018
Amendments to IFRS 9 and IFRS 7 “Mandatory Effective Date of
IFRS 9 and Transition Disclosures”
January 1, 2018
Amendments to IFRS 10 and IAS 28 “Sale or Contribution of Assets
between an Investor and its Associate or Joint Venture”
To be determined by IASB
Amendments to IFRS 10, IFRS 12 and IAS 28 “Investment Entities:
Applying the Consolidation Exception”
January 1, 2016
Amendment to IFRS 11 “Accounting for Acquisitions of Interests in
Joint Operations”
January 1, 2016
IFRS 14 “Regulatory Deferral Accounts” January 1, 2016
IFRS 15 “Revenue from Contracts with Customers” January 1, 2018
IFRS 16 “Leases” January 1, 2019
Amendment to IAS 1 “Disclosure Initiative” January 1, 2016
Amendment to IAS 7 “Disclosure Initiative” January 1, 2017
Amendments to IAS 12 “Recognition of Deferred Tax Assets for
Unrealized Losses”
January 1, 2017
Amendments to IAS 16 and IAS 38 “Clarification of Acceptable
Methods of Depreciation and Amortization”
January 1, 2016
Amendments to IAS 16 and IAS 41 “Agriculture: Bearer Plants” January 1, 2016
Amendment to IAS 19 “Defined Benefit Plans: Employee
Contributions”
July 1, 2014
Amendment to IAS 36 “Impairment of Assets: Recoverable Amount
Disclosures for Non-financial Assets”
January 1, 2014
Amendment to IAS 39 “Novation of Derivatives and Continuation of
Hedge Accounting”
January 1, 2014
IFRIC 21 “Levies” January 1, 2014
Note 1: Unless stated otherwise, the above New IFRSs are effective for annual periods beginning on
or after their respective effective dates.
Note 2: The amendment to IFRS 2 applies to share-based payment transactions with grant date on or
after July 1, 2014; the amendment to IFRS 3 applies to business combinations with acquisition
date on or after July 1, 2014; the amendment to IFRS 13 is effective immediately; the
remaining amendments are effective for annual periods beginning on or after July 1, 2014.
Note 3: The amendment to IFRS 5 is applied prospectively to changes in a method of disposal that
occur in annual periods beginning on or after January 1, 2016; the remaining amendments are
effective for annual periods beginning on or after January 1, 2016.
- 45 -
The initial application of the above New IFRSs, whenever applied, would not have any material impact
on the Bank and its subsidiaries’ accounting policies, except for the following:
1) IFRS 9 “Financial Instruments”
All recognized financial assets that are within the scope of IAS 39 “Financial Instruments:
Recognition and Measurement” are subsequently measured at amortized cost or fair value. Under
IFRS 9, the requirement for the classification of financial assets is stated below.
For the Bank and its subsidiaries’ debt instruments with contractual cash flows that are solely
payments of principal and its interest, their classification and measurement are as follows:
a) If the debt instruments are held within a business model whose objective is to collect contractual
cash flows, the financial assets are measured at amortized cost and are assessed for impairment
continually, with any impairment loss recognized in profit or loss. Interest revenue is
recognized in profit or loss by using the effective interest method;
b) If the debt instruments are held within a business model whose objective is to both collect
contractual cash flows and sell financial assets, the financial assets are measured at fair value
through other comprehensive income (FVTOCI) and are assessed for impairment. Interest
revenue is recognized in profit or loss by using the effective interest method, and other gain or
loss is recognized in other comprehensive income, except for impairment gains or losses and
foreign exchange gains and losses. When the debt instruments are derecognized or
reclassified, the cumulative gain or loss previously recognized in other comprehensive income
is reclassified from equity to profit or loss.
Except for the above, all financial assets are measured at fair value through profit or loss.
However, the Bank and its subsidiaries may, on the initial recognition of an equity instrument that is
within the scope of IFRS 9 and is not held for trading, irrevocably designate this instrument as at
fair value through other comprehensive income, with only dividend income generally recognized in
profit or loss. No subsequent impairment assessment is required, and the cumulative gain or loss
previously recognized in other comprehensive income cannot be reclassified from equity to profit or
loss.
The impairment of financial assets
IFRS 9 requires the recognition of impairment losses on financial assets using the expected credit
loss model. The expected credit loss allowance is required for certain financial assets measured at
amortized cost, financial assets mandatorily measured at FVTOCI, certain lease receivables,
contract assets within the scope of IFRS 15 “Revenue from Contracts with Customers”, and certain
written loan commitments and financial guarantee contracts. A loss allowance for the 12-month
expected credit losses is required for a financial asset if its credit risk has not increased significantly
since initial recognition. A loss allowance for full lifetime expected credit losses is required for a
financial asset if its credit risk has increased significantly since initial recognition and is not low.
However, a loss allowance for full lifetime expected credit losses is required for certain trade
receivables that do not constitute a financing transaction.
For purchased or originated credit-impaired financial assets, the Bank and its subsidiaries take into
account the expected credit losses on initial recognition, and these losses should be discounted using
the credit-adjusted effective interest rate. Subsequently, any changes from the initial expected
credit losses are recognized as a loss allowance, with the gain or loss recognized in profit or loss.
- 46 -
Hedge accounting
The main changes allow an entity to better reflect its economic hedging activities in its financial
statements. Compared with the prior IAS 39, the main changes include: (1) increasing the items
eligible for hedge accounting, e.g., risk components of non-financial items can now be eligible for
hedging if these components meet certain criteria; (2) allowing derivative instruments to be
designated as hedged items under certain conditions in order to reduce profit or loss volatility; and
(3) replacing the retrospective quantitative effectiveness assessment with certain criteria, which
include the existence of an economic relationship between the hedging instrument and the hedged
item.
2) Amendment to IAS 36 “Recoverable Amount Disclosures for Non-financial Assets”
In issuing IFRS 13 “Fair Value Measurement”, the IASB made a consequential amendment to the
disclosure requirements in IAS 36 “Impairment of Assets”, introducing a requirement to disclose
the recoverable amount of an asset or each cash-generating unit only when an impairment loss has
been recognized or reversed during the period. Furthermore, the Bank and its subsidiaries are
required to disclose the discount rate used in determining impairment or impairment reversals if the
recoverable amount based on fair value less costs of disposal is measured using a present value
technique.
3) IFRS 15 “Revenue from Contracts with Customers”
IFRS 15 establishes principles for recognizing revenue on all contracts with customers and
supersedes IAS 18 “Revenue”, IAS 11 “Construction Contracts” and IFRIC and SIC interpretations.
In applying IFRS 15, an entity should recognize revenue by taking all the following steps:
Identify the contract with the customer.
Identify the performance obligations in the contract.
Determine the transaction price.
Allocate the transaction price to the performance obligations in the contracts.
Recognize revenue when the entity satisfies a performance obligation.
When IFRS 15 takes effect, the Bank and its subsidiaries may elect to apply this Standard either
retrospectively to each prior reporting year presented or retrospectively with the cumulative effect
of initially applying this Standard recognized at the date of initial application.
4) IFRS 16 “Leases”
IFRS 16 sets out the accounting standards for leases that will supersede IAS 17 and a number of
related interpretations.
Under IFRS 16, if the Bank and its subsidiaries are a lessee, it shall recognize right-of-use assets
and lease liabilities for all leases on the consolidated balance sheets except for low-value and
short-term leases. The Group may elect to apply the accounting method similar to the accounting
for operating lease under IAS 17 to the low-value and short-term leases. On the consolidated
statements of comprehensive income, the Bank and its subsidiaries should present the depreciation
expense charged on the right-of-use asset separately from interest expense accrued on the lease
liability; interest is computed by using effective interest method. On the consolidated statements
of cash flows, cash payments for the principal portion of the lease liability are classified within
financing activities; cash payments for interest portion are classified within operating activities.
The application of IFRS 16 is not expected to have a material impact on the accounting of the Bank
and its subsidiaries as lessor.
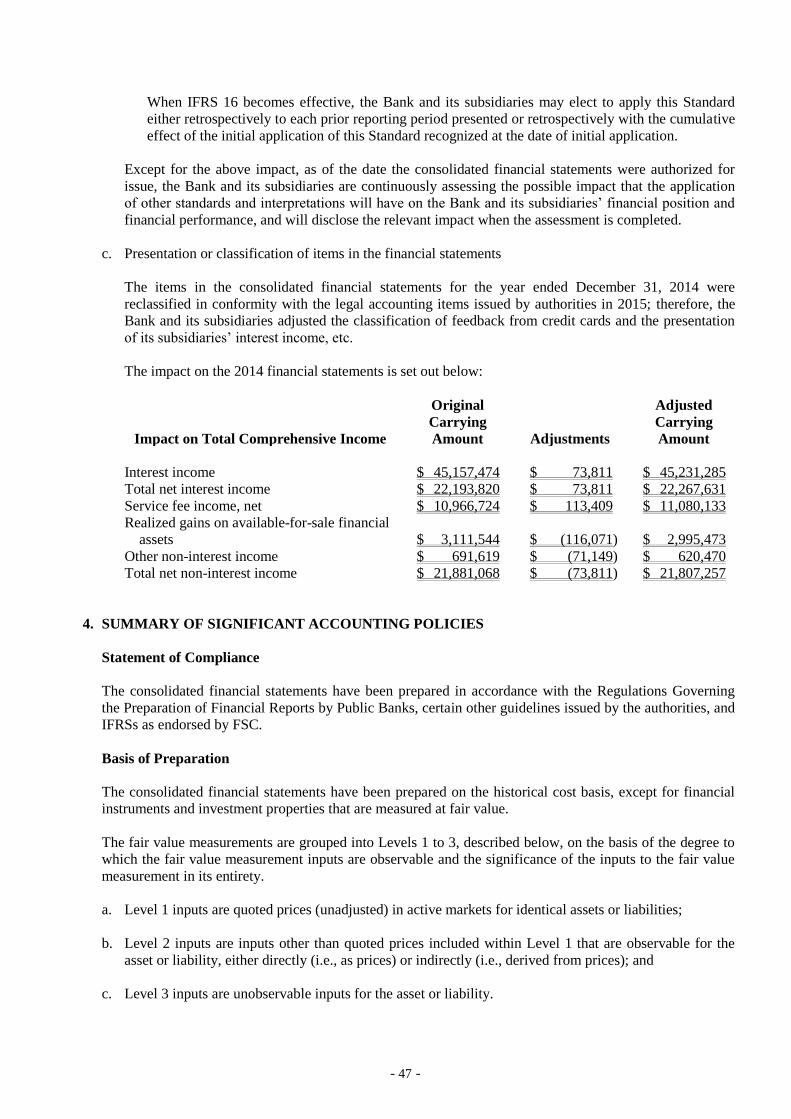
- 47 -
When IFRS 16 becomes effective, the Bank and its subsidiaries may elect to apply this Standard
either retrospectively to each prior reporting period presented or retrospectively with the cumulative
effect of the initial application of this Standard recognized at the date of initial application.
Except for the above impact, as of the date the consolidated financial statements were authorized for
issue, the Bank and its subsidiaries are continuously assessing the possible impact that the application
of other standards and interpretations will have on the Bank and its subsidiaries’ financial position and
financial performance, and will disclose the relevant impact when the assessment is completed.
c. Presentation or classification of items in the financial statements
The items in the consolidated financial statements for the year ended December 31, 2014 were
reclassified in conformity with the legal accounting items issued by authorities in 2015; therefore, the
Bank and its subsidiaries adjusted the classification of feedback from credit cards and the presentation
of its subsidiaries’ interest income, etc.
The impact on the 2014 financial statements is set out below:
Impact on Total Comprehensive Income
Original
Carrying
Amount Adjustments
Adjusted
Carrying
Amount
Interest income $ 45,157,474 $ 73,811 $ 45,231,285
Total net interest income $ 22,193,820 $ 73,811 $ 22,267,631
Service fee income, net $ 10,966,724 $ 113,409 $ 11,080,133
Realized gains on available-for-sale financial
assets $ 3,111,544 $ (116,071) $ 2,995,473
Other non-interest income $ 691,619 $ (71,149) $ 620,470
Total net non-interest income $ 21,881,068 $ (73,811) $ 21,807,257
4. SUMMARY OF SIGNIFICANT ACCOUNTING POLICIES
Statement of Compliance
The consolidated financial statements have been prepared in accordance with the Regulations Governing
the Preparation of Financial Reports by Public Banks, certain other guidelines issued by the authorities, and
IFRSs as endorsed by FSC.
Basis of Preparation
The consolidated financial statements have been prepared on the historical cost basis, except for financial
instruments and investment properties that are measured at fair value.
The fair value measurements are grouped into Levels 1 to 3, described below, on the basis of the degree to
which the fair value measurement inputs are observable and the significance of the inputs to the fair value
measurement in its entirety.
a. Level 1 inputs are quoted prices (unadjusted) in active markets for identical assets or liabilities;
b. Level 2 inputs are inputs other than quoted prices included within Level 1 that are observable for the
asset or liability, either directly (i.e., as prices) or indirectly (i.e., derived from prices); and
c. Level 3 inputs are unobservable inputs for the asset or liability.
- 48 -
Classification of Current and Non-current Assets and Liabilities
Since the Bank’s accounts are a major part of the consolidated accounts and the operating cycle in the
banking industry cannot be clearly identified, accounts included in the consolidated financial statements of
the Bank and its subsidiaries were not classified as current or non-current. Nevertheless, accounts were
properly categorized in accordance with the nature of each account and sequenced by their liquidity.
Please refer to Note 50 for the maturity analysis of assets and liabilities.
Basis of Consolidation
Principles for preparing consolidated financial statements
The consolidated financial statements incorporate the financial statements of the Bank and the entities
controlled by the Bank (i.e., its subsidiaries and structured entities).
Income and expenses of subsidiaries acquired or disposed of during the period are included in the
consolidated statement of profit or loss and other comprehensive income from the effective date of
acquisition up to the effective date of disposal, as appropriate.
When necessary, adjustments are made to the financial statements of subsidiaries to bring their
accounting policies into line with those used by the Bank.
All intra-group transactions, balances, income and expenses are eliminated in full upon consolidation.
The total comprehensive income of subsidiaries is attributed to the owners of the Bank and to the
non-controlling interests even if this attribution results in the non-controlling interests having a deficit
balance.
See Note 15 for the detailed information of subsidiaries (including the percentages of ownership and
main businesses).
Foreign Currencies
In the preparation of the financial statements of each Group entity, transactions in currencies other than the
entity’s functional currency (foreign currencies) are recognized at the rates of exchange prevailing at the
dates of the transactions.
At the end of each reporting period, monetary items denominated in foreign currencies are retranslated at
the rates prevailing at that date. Nonmonetary items measured at fair value that are denominated in
foreign currencies are retranslated at the rates prevailing at the date when the fair value was determined.
Nonmonetary items that are measured in terms of historical cost in a foreign currency are not retranslated.
Exchange differences arising from settlement are recognized in profit or loss in the period in which they
arise. Exchange differences on monetary items arising from translation at period-end are recognized in
profit or loss, but cash flow hedges or effective portions of the hedging of net investments in foreign
operations are recognized in other comprehensive income.
Non-monetary items measured at fair value that are denominated in foreign currencies are retranslated at
the rates prevailing at the date when the fair value was determined. When a gain or loss on a
non-monetary item is recognized in profit or loss, any exchange component of that gain or loss is
recognized in profit or loss. When a gain or loss on a non-monetary item is recognized in other
comprehensive income, any exchange component of that gain or loss is recognized in other comprehensive
income.
- 49 -
For the purposes of presenting consolidated financial statements, the assets and liabilities of the Bank’s
foreign operations are translated into New Taiwan dollars using exchange rates prevailing at the end of each
reporting period. Income and expense items are translated at the average exchange rates for the period,
but if exchange rates fluctuate significantly during that period, the exchange rates at the dates of the
transactions are used. Exchange differences arising are recognized in other comprehensive income and
accumulated in equity (attributed to the owners of the Bank and non-controlling interests as appropriate).
Cash and Cash Equivalents
Cash and cash equivalents include cash on hand, demand deposits, time deposits that can be readily
terminated without the reduction of principal, and highly liquid investments that are readily convertible to
known amounts of cash and which are subject to an insignificant risk of changes in value. For the
statement of cash flows, cash and cash equivalents include cash and cash equivalents in balance sheets, and
those amounts due from the Central Bank and call loans to other banks and securities purchased under resell
agreements that meet the definition of cash and cash equivalents in IAS 7 “Statement of Cash Flows”, etc.
Investment in Associates
An associate is an entity over which the Bank and its subsidiaries have significant influence and that is
neither a subsidiary nor an interest in a joint venture.
The results and assets and liabilities of associates are incorporated in these consolidated financial
statements using the equity method of accounting. Under the equity method, an investment in an associate
is initially recognized at cost and adjusted thereafter to recognize the Bank and its subsidiaries’ share of the
associate’s profit or loss and other comprehensive income. The Bank and its subsidiaries also recognize
the changes in the Bank and its subsidiaries’ share of equity of the associates.
Any acquisition cost in excess of the Bank and its subsidiaries’ share of the net fair value of the identifiable
assets and liabilities of an associate or a joint venture at the date of acquisition is recognized as goodwill,
which is included in the carrying amount of the investment and is not amortized. Any Bank and its
subsidiaries’ share of the net fair value of the identifiable assets and liabilities in excess of the cost of
acquisition, after reassessment, is recognized immediately in profit or loss.
The entire carrying amount of the investment (including goodwill) is tested for impairment as a single asset
by comparing its recoverable amount with its carrying amount. Any impairment loss recognized forms
part of the carrying amount of the investment. Any reversal of that impairment loss is recognized to the
extent that the recoverable amount of the investment subsequently increases.
Financial Instruments
Financial assets and financial liabilities are recognized when the Bank and its subsidiaries become a party
to the contractual provisions of the instruments.
Financial assets and financial liabilities are initially measured at fair value. Transaction costs that are
directly attributable to the acquisition or issue of financial assets and financial liabilities (other than
financial assets and financial liabilities at fair value through profit or loss) are added to or deducted from
the fair value of the financial assets or financial liabilities, as appropriate, on initial recognition.
Transaction costs directly attributable to the acquisition of financial assets or financial liabilities at fair
value through profit or loss are recognized immediately in profit or loss.
a. Financial assets
All regular way purchases or sales of financial assets are recognized and derecognized on a trade date
basis.
- 50 -
1) Measurement category
Financial assets are classified into financial assets at fair value through profit or loss;
held-to-maturity investments; available-for-sale financial assets; and loans and receivables.
a) Financial assets at fair value through profit or loss
Financial assets are classified as at fair value through profit or loss when the financial asset is
either held for trading or designated as at fair value through profit or loss.
A financial asset may be designated as at fair value through profit or loss upon initial
recognition if:
i. This designation eliminates or significantly reduces a measurement or recognition
inconsistency that would otherwise arise; or
ii. The financial asset forms part of a group of financial assets or financial liabilities or both,
which is managed and its performance is evaluated on a fair value basis, in accordance with
the Bank and subsidiaries’ documented risk management or investment strategy, and
information on this grouping is provided internally on that basis; or
iii. The contract contains one or more embedded derivatives so that the entire hybrid
(combined) contract can be designated as at fair value through profit or loss.
Fair value is determined in the manner described in Note 49.
Financial assets at fair value through profit or loss are stated at fair value, and gains or losses
arising on remeasurement are recognized in profit or loss and incorporates any dividend or
interest earned on the assets. Fair value is determined in the manner described in Note 49.
b) Held-to-maturity financial assets
Held-to-maturity investments are nonderivative financial assets with fixed or determinable
payments and fixed maturity dates, and the Bank and its subsidiaries have the positive intent
and ability to hold these assets to maturity. On initial recognition, these assets are not
designated as at fair value through profit or loss or as available for sale nor do they meet the
definition of loans and receivables
After initial recognition, held-to-maturity investments are measured at amortized cost using the
effective interest method less any impairment.
c) Available-for-sale financial assets
Available-for-sale financial assets are nonderivatives that are not classified as loans and
receivables, held-to-maturity investments or financial assets at fair value through profit or loss.
Available-for-sale financial assets are measured at fair value. Changes in the carrying amount
of available-for-sale monetary financial assets relating to changes in foreign currency exchange
rates, interest income calculated using the effective interest method and dividends on
available-for-sale equity investments are recognized in profit or loss. Other changes in the
carrying amount of available-for-sale financial assets are recognized in other comprehensive
income and will be reclassified to profit or loss when the investment is disposed of or is
determined to be impaired.
Dividends on available-for-sale equity instruments are recognized in profit or loss when the
Bank and its subsidiaries’ right to receive the dividends is established.
- 51 -
Available-for-sale equity investments with no quoted market prices in an active market and with
fair values that cannot be reliably measured and derivatives that are linked to and must be
settled by delivery of these unquoted equity investments are measured at cost less any identified
impairment loss at the end of each reporting period and are recognized in a separate line item as
financial assets carried at cost. If, subsequently, the fair value of the financial assets can be
reliably measured, the financial assets are remeasured at fair value. The difference between
the carrying amount and fair value is recognized in profit or loss or other comprehensive income
on financial assets. Any impairment losses are recognized in profit and loss.
d) Loans and receivables
Loans and receivables (discounts and loans, trade receivables, cash and cash equivalents, debt
investments with no active market, etc.) are measured at amortized cost using the effective
interest method, less any impairment. Interest income is recognized by applying the effective
interest rate, except for short-term receivables when the effect of discounting is immaterial.
2) Impairment of financial assets
Financial assets, other than those at fair value through profit or loss, are assessed for indicators of
impairment at the end of each reporting period. Financial assets are considered impaired when
there is objective evidence that, as a result of one or more events that occurred after the initial
recognition of the financial assets, the estimated future cash flows of the investments have been
negatively affected.
The objective evidence of impairment could include significant financial difficulty of the issuer or
counterparty, breach of contract (such as a default or a delinquency in interest or principal
payments), it becoming that the borrower will undergo bankruptcy or financial reorganization, or
the disappearance of an active market for financial asset because of financial difficulties.
a) Financial assets carried at amortized cost
Certain categories of financial assets, such as loans and receivables, are assessed for impairment
collectively even if they had been assessed as not impaired individually. Objective evidence of
impairment for a portfolio could include the Bank and its subsidiaries’ past experience of
collecting payments and an increase in the number of delayed payments in the portfolio, as well
as observable changes in national or local economic conditions that correlate with default on
discounts and loans and receivables.
Impairment loss is recognized as the difference between the asset’s carrying amount and the
present value of estimated future cash flows, discounted at the financial asset’s original effective
interest rate.
If the impairment loss decreases and the decrease can be related objectively to an event
occurring after impairment recognition, the previously recognized impairment loss is reversed
through profit or loss to the extent that the carrying amount of the investment at the date the
impairment is reversed, does not exceed what the amortized cost would have been had the
impairment not been recognized.
Under the “Regulations Governing the Procedures for Banking Institutions to Evaluate Assets
and Deal with Nonperforming/Nonaccrual Loans” (the “Regulations”) issued by the authorities,
the Bank assesses the recoverability of credit assets on the basis of a customer’s financial
position, delinquency in interest or principal payments, and the Bank’s internal valuation of
collaterals.
- 52 -
Under the Regulations, the Bank categorizes credit assets (other than loans to the ROC
government) into normal, special mention, substandard, doubtful, and loss, for which minimum
provisions are 1%, 2%, 10%, 50%, and 100%, respectively. In addition, under FSC guidelines
No. 10010006830, there should be a provision at more than 1% of the sum of a minimum
allowance for credit losses and the provision for losses on guarantees. Based on Rule No.
10300329440 issued by the FSC, for the banks to have an enhanced risk coverage, the minimum
provision for the loan loss reserve is 1.5% of the mortgage and construction loans that have
been classified as normal assets before 2016. Based on Rule No. 10410001840 issued by the
FSC, for the Bank to have an enhanced control of the exposure to risk in Mainland China, the
minimum provision for the loan loss reserve is 1.5% of the loans that were granted to companies
based in Mainland China before 2015 and classified as normal assets.
Under the loan risk classification guidelines of the China Banking Regulatory Commission,
(CBRC), Fubon Bank (China) classifies its credit assets into normal, concern, subprime,
doubtful, and losses. Based on the CBRC’s “Administrative Measures for the Loan Loss
Reserves of Commercial Banks”, the basic provision requirement for loan loss coverage is 2.5%
and the minimum allowance for bad debts is 150%. The higher of the amounts corresponding
to these two ratios is the amount that should be provided as the loan loss reserve of a
commercial bank; thus, Fubon Bank (China) assesses its credit assets for both individual and
collective impairment and complies with these ratio requirements for its minimum reserve.
Credits deemed uncollectible may be written off if the write-off is approved by the board of
directors. Recoveries of amounts previously written off are credited to the allowance account.
b) Available-for-sale financial assets
For an available-for-sale equity investment, a significant or prolonged decline in the fair value
of the security below its cost is considered an objective evidence of impairment.
When an available-for-sale financial asset is considered impaired, the cumulative gain or loss
previously recognized in other comprehensive income is reclassified to profit or loss in the
impairment period.
For an available-for-sale equity security, impairment loss previously recognized in profit or loss
is not reversed through profit or loss. Any increase in fair value after an impairment loss is
recognized in other comprehensive income and accumulated under the heading of investment
revaluation reserve. For available-for-sale debt securities, an impairment loss is reversed
through profit or loss if an increase in the fair value of the investment can be objectively related
to an event occurring after impairment loss recognition.
c) Financial assets carried at cost
For financial assets that are carried at cost, impairment loss is measured as the difference
between the asset’s carrying amount and the present value of the estimated future cash flows
discounted at the current market rate of return for a similar financial asset. This impairment
loss will not be reversed in subsequent periods.
The carrying amount of the financial asset is reduced through the use of an allowance account.
When a financial asset is considered uncollectible, it is written off against the allowance
account. Subsequent recoveries of amounts previously written off are credited against the
allowance account. Changes in the carrying amount of the allowance account are recognized
in profit or loss
- 53 -
3) Derecognition of financial assets
The Bank and its subsidiaries derecognize a financial asset only when the contractual rights to the
cash flows from the asset expire, or when they transfer the financial asset and substantially all the
risks and rewards of ownership of the asset to another party. If the Bank and its subsidiaries
neither transfer nor retain substantially all the risks and rewards of ownership and continue to
control the transferred asset, the Bank and its subsidiaries recognize their retained interest in the
asset and an associated liability for amounts they may have to pay. If the Bank and its subsidiaries
retain substantially all the risks and rewards of ownership of a transferred financial asset, the Bank
and its subsidiaries continue to recognize the financial asset and also recognize a collateralized
borrowing for the proceeds received.
On the full derecognition of a financial asset, the difference between (a) the asset’s carrying amount
and the sum of the consideration received or receivable and (b) the cumulative gain or loss that had
been recognized in other comprehensive income and accumulated in equity is recognized in profit
or loss.
On the partial derecognition of a financial asset (e.g., when the Bank and its subsidiaries retain an
option to repurchase part of a transferred asset), the Bank and its subsidiaries allocate the previous
carrying amount of the financial asset between the part they continue to recognize under continuing
involvement and the part they no longer recognize on the basis of the respective fair values of these
parts on the date of the transfer. The difference between (a) the carrying amount allocated to the
part that is no longer recognized and the sum of the consideration received for this part and (b) any
cumulative gain or loss allocated to it that had been recognized in other comprehensive income is
recognized in profit or loss. A cumulative gain or loss that had been recognized in other
comprehensive income is allocated between the part that continues to be recognized and the part
that is no longer recognized on the basis of the their respective fair values.
b. Equity instruments
Debt and equity instruments issued by the Bank and its subsidiaries are classified as either financial
liabilities or as equity in accordance with the substance of the contractual arrangements and whether the
instruments meet the definitions of a financial liability or an equity instrument.
Equity instruments issued by the Bank and its subsidiaries are recognized at the proceeds received, net
of direct issue costs.
Repurchase of the Bank’s own equity instruments is recognized and deducted directly in equity. No
gain or loss is recognized in profit or loss on the purchase, sale, issue or cancellation of these
repurchased instruments.
c. Financial liabilities
1) Subsequent measurement
Except for the following, all financial liabilities are measured at amortized cost using the effective
interest method, less any impairment:
a) Financial liabilities at fair value through profit or loss
Financial liabilities are classified as at fair value through profit or loss when the financial
liability is either held for trading or designated as at fair value through profit or loss.
- 54 -
Financial liabilities held for trading are stated at fair value, with any gain or loss arising on
remeasurement recognized in profit or loss. The net gain or loss recognized in profit or loss
incorporates any interest or dividend paid on the financial liability. Fair value is determined in
the manner described in Note 49.
A financial liability may be designated as at fair value through profit or loss upon initial
recognition when doing so results in more relevant information and if:
i. This designation eliminates or significantly reduces a measurement or recognition
inconsistency that would otherwise arise; or
ii. The financial liability forms part of a group of the Bank and its subsidiaries’ financial assets
or financial liabilities or both, and this grouping is managed, and its performance is
evaluated, on a fair value basis, in accordance with the Bank and its subsidiaries’
documented risk management or investment strategy, and with information on the grouping
provided internally on that basis.
iii. The contract contains one or more embedded derivatives so that the entire combined
contract (asset or liability) can be designated as at fair value through profit or loss.
For a financial liability designated as at fair value through profit or loss, if a portion of a change
in fair value incorporates any interest or dividend paid on the financial liability, this portion is
presented in profit or loss. If a portion of a change in fair value is attributable to changes in the
credit risk of the liability, this portion is presented in other comprehensive income, and it will
not be subsequently reclassified to profit or loss. The gain or loss accumulated in other
comprehensive income will be transferred to retained earnings when the financial liability is
derecognized. If this accounting treatment related to credit risk would create or enlarge an
accounting mismatch, the total amount of the change in fair value of the liability is presented in
profit or loss. Fair value is determined in the manner described in Note 49.
b) Financial guarantee contracts
Financial guarantee contracts issued by the Bank and its subsidiaries are initially measured at
their fair values and, if not designated as at fair value through profit or loss, are subsequently
measured at the higher of the best estimate of the obligation under the contract or the amount
initially recognized less cumulative amortization recognized.
2) Derecognition of financial liabilities
The difference between the carrying amount of the financial liability derecognized and the
consideration paid, including any non-cash assets transferred or liabilities assumed, is recognized in
profit or loss.
d. Derivative financial instruments
Derivatives are initially recognized at fair value at the date the derivative contracts are entered into and
are subsequently remeasured to their fair value at the end of each reporting period. The resulting gain
or loss is recognized in profit or loss immediately unless the derivative is designated and effective as a
hedging instrument, in which event the timing of the recognition in profit or loss depends on the nature
of the hedge relationship. When the fair value of derivative financial instruments is positive, the
derivative is recognized as a financial asset; when the fair value of derivative financial instruments is
negative, the derivative is recognized as a financial liability.
Derivatives embedded in nonderivative host contracts are treated as separate derivatives when they
meet the definition of a derivative, their risks and characteristics are not closely related to those of the
host contracts and the contracts are not measured at fair value through profit or loss.
- 55 -
Hedge Accounting
The Bank and its subsidiaries designate certain hedging instruments, which include derivatives, embedded
derivatives and nonderivatives in respect of foreign currency risk, as either fair value hedges or cash flow
hedges.
At the start of a hedge relationship, the Bank and its subsidiaries document the relationship between the
hedging instrument and the hedged item, along with their risk management objectives and their strategy for
undertaking various hedge transactions. Further, at the start of the hedge and on an ongoing basis, the
Bank and its subsidiaries document whether the hedging instrument is highly effective in offsetting the
exposure to adverse changes in fair values or cash flows of the hedged item. Note 9 sets out the details of
the fair values of the derivative instruments used for hedging purposes.
a. Fair value hedges
The change in the fair value of the hedging instrument (e.g., derivative) and the change in the hedged
item attributable to the hedged risk are recognized in profit or loss in the line item relating to the hedged
item.
Hedge accounting is discontinued when the Bank and its subsidiaries revoke the designated hedging
relationship, or when the hedging instrument expires or is sold or terminated, or when it no longer
meets the criteria for hedge accounting. The fair value adjustment to the carrying amount of the
hedged instrument for which the effective interest method is used, is amortized to profit or loss from the
date of the discontinuation of hedge accounting. The adjustment is based on the recalculated effective
interest rate at the date amortization begins.
b. Cash flow hedges
The effective portion of changes in the fair value of derivatives that are designated and qualify as cash
flow hedges is recognized in other comprehensive income and accumulated under the heading of cash
flow hedging reserve. The gain or loss relating to the ineffective portion is recognized immediately in
profit or loss.
The gain or loss recognized in other comprehensive income is reclassified from equity to profit or loss
as a reclassification adjustment in the line item relating to the hedged item in the same period when the
hedged item affects profit or loss. If a hedge of a forecast transaction subsequently results in the
recognition of a nonfinancial asset or a nonfinancial liability, the gain or loss recognized in other
comprehensive income is removed from equity and is included in the initial cost of the nonfinancial
asset or nonfinancial liability.
Hedge accounting is discontinued when the Bank and its subsidiaries revoke the designated hedging
relationship, or when the hedging instrument expires or is sold, terminated, or exercised, or when it no
longer meets the criteria for hedge accounting. The cumulative gain or loss on the hedging instrument
that has been previously recognized in other comprehensive income from the period when the hedge
was effective remains separately in equity until the forecast transaction occurs. When a forecast
transaction is no longer expected to occur, the gain or loss accumulated in equity is recognized
immediately in profit or loss.
Repurchase and Resell Transactions
Securities under repurchase or resell agreement are accounted for as securities sold under repurchase
agreements or securities purchased under resell agreements. Related interest expenses and interest income
are accrued over the period from the date of sale to the date of repurchase or from the date of purchase to
the date of resale.
- 56 -
Property and Equipment
Property and equipment (P&E) are stated at cost, less subsequent accumulated depreciation and subsequent
accumulated impairment loss.
Depreciation is recognized using the straight-line method. Each part of a P&E item with a cost that is
significant in relation to the total cost of the item is depreciated separately. The estimated useful lives,
residual values and depreciation method are reviewed at the end of each reporting period, with the effect of
any changes in estimate accounted for prospectively.
On derecognition of an item of property and equipment, the difference between the sales proceeds and the
carrying amount of the asset is recognized in profit or loss.
Investment Properties
Investment properties are properties held for earning rentals and/or for capital appreciation.
Investment properties are measured initially at cost, including transaction costs, and are subsequently
measured using the fair value model. Gains or losses arising from changes in the fair value of investment
properties are included in profit or loss for the period in which these changes arise.
For a transfer from property and equipment to investment property at the end of owner-occupation, any
difference between the fair value of the property at the transfer date and its previous carrying amount is
recognized in other comprehensive income.
On derecognition of an investment property, the difference between the net disposal proceeds and the
carrying amount of the asset is included in profit or loss.
Goodwill
Goodwill arising on an acquisition of a business is carried at cost as of the date of acquisition less
accumulated impairment loss.
For the purposes of impairment testing, goodwill is allocated to each of the cash-generating units of the
Bank and its subsidiaries that is expected to benefit from the synergies resulting from the business
acquisition.
A cash-generating unit to which goodwill has been allocated is tested for impairment annually-or more
frequently when there is an indication that the unit may be impaired-by comparing its carrying amount,
including the allocated goodwill, with its recoverable amount. However, if the goodwill allocated to a
cash-generating unit has been acquired in a business combination during the current annual period, this unit
should be tested for impairment before the end of the current annual period. If the recoverable amount of
the cash-generating unit is less than its carrying amount, the impairment loss is first used to reduce the
carrying amount of any goodwill allocated to the unit and the rest of the impairment loss is then allocated to
the other assets of the unit pro rata based on the carrying amount of each asset in the unit. Any
impairment loss on goodwill is recognized directly in profit or loss, and is not reversed in subsequent
periods.
If goodwill has been allocated to a cash-generating unit and the entity disposes of an operation within that
unit, the goodwill associated with the operation disposed of is included in the carrying amount of the
operation when determining the gain or loss on disposal, and is measured on the basis of the respective
values of the operation disposed of and the portion of the cash-generating unit retained.
- 57 -
Intangible Assets
a. Intangible assets acquired separately
Intangible assets with finite useful lives that are acquired separately are initially measured at cost and
subsequently measured at cost less accumulated amortization and accumulated impairment loss.
Amortization is recognized on a straight-line basis. The estimated useful life, residual value, and
amortization method are reviewed at the end of each reporting period, with the effect of any changes in
estimates accounted for prospectively. Intangible assets with indefinite useful lives that are acquired
separately are measured at cost less accumulated impairment loss.
b. Intangible assets acquired in a business combination
Intangible assets acquired in a business combination and recognized separately from goodwill are
initially recognized at their fair value (which is regarded as their cost) at the acquisition date. After
initial recognition, these are measured on the same basis as intangible assets that are acquired
separately.
c. Derecognition of intangible assets
On the derecognition of an intangible asset, the difference between the net disposal proceeds and the
carrying amount of the asset are recognized in profit or loss.
Impairment of Tangible and Intangible Assets Other than Goodwill
At the end of each reporting period, the Bank and its subsidiaries review the carrying amounts of their
tangible and intangible assets, excluding goodwill, to determine for any indication of impairment loss. If
any such indication exists, the recoverable amount of the asset is estimated in order to determine the extent
of the impairment loss. When it is not possible to estimate the recoverable amount of an individual asset,
the Bank and its subsidiaries estimate the recoverable amount of the cash-generating unit to which the asset
belongs. When a reasonable and consistent basis of allocation can be identified, corporate assets are also
allocated to the individual cash-generating units; otherwise they are allocated to the smallest group of
cash-generating units.
Intangible assets with indefinite useful lives and intangible assets not yet available for use are tested for
impairment at least annually, and whenever there is an indication of asset impairment.
The recoverable amount is the higher of fair value less costs to sell and value in use. If the recoverable
amount of an asset or cash-generating unit is estimated to be less than its carrying amount, the carrying
amount of the asset or cash-generating unit is reduced to its recoverable amount, with the resulting
impairment loss recognized in profit and loss.
When an impairment loss reverses, the carrying amount of the asset or cash-generating unit is increased to
the revised estimate of its recoverable amount, but only to the extent of the carrying amount that would
have been determined had no impairment loss been recognized for the asset or cash-generating unit in prior
years. A reversal of an impairment loss is recognized immediately in profit or loss.
Employee Benefits
a. Short-term employee benefits
Liabilities recognized for short-term employee benefits are measured at the undiscounted amount of the
benefits expected to be paid in exchange for the related employee services.
- 58 -
b. Retirement benefits
Payments to defined contribution retirement benefit plans are recognized as an expense when
employees have rendered services entitling them to the contributions.
Costs (including service cost, net interest and remeasurement) of the defined benefit plans are
determined using the projected unit credit method. Service cost and net interest on the net defined
benefit liability (asset) are recognized as employee benefit expense in the period they arise.
Remeasurement, comprising actuarial gains and losses, and the return on plan assets (excluding
interest), are recognized in other comprehensive income in the period in which they occur.
Remeasurement recognized in other comprehensive income is reflected immediately in retained
earnings and will not be reclassified to profit or loss.
Net defined benefit liability (asset) represents the actual deficit (surplus) in the defined benefit plan.
Any surplus resulting from this calculation is limited to the present value of any refunds from the plans
or reductions in future contributions to the plans.
c. Other long-term employee benefits
Other long-term employee benefits are accounted for in the same way as the accounting required for the
defined benefit plan, except that remeasurement is recognized in profit or loss.
d. Employee benefit - employees’ preferential deposits
The Bank has granted a preferential interest rate to its current employees and retired employees for their
deposits within a prescribed amount. The preferential interest rate in excess of market interest rate is
considered employee benefits.
Under Article 30 of the “Regulations Governing the Preparation of Financial Reports by Public Banks”,
if the Bank’s preferential deposit interest rate for an employee as stated in the employment contract
exceeds the market interest rate, the excess will be subject to IAS 19 “Employee Benefits” upon the
employees’ retirement. The actuarial valuation assumptions and parameters are based on the
guidelines announced by the authorities.
Income Tax
Income tax expense is the sum of the tax currently payable and deferred tax.
a. Current tax
Based on the Income Tax Law, an additional tax at 10% of unappropriated earnings is provided for as
income tax in the year the shareholders approve the retention of these earnings.
Adjustments of prior years’ tax liabilities are added to or deducted from the current period’s tax
provision.
b. Deferred tax
Deferred tax is calculated on temporary differences between the carrying amounts of assets and
liabilities and the corresponding tax bases used in the computation of taxable profit. Deferred tax
liabilities are generally recognized for all taxable temporary differences. Deferred tax assets are
generally recognized for all deductible temporary differences to the extent that it is probable that
taxable profits will be available against which those deductible temporary differences can be used.
- 59 -
The carrying amount of deferred tax assets is reviewed at the end of each reporting period and reduced
to the extent that it is no longer probable that sufficient taxable profits will be available to allow all or
part of the asset to be recovered. A previously unrecognized deferred tax asset is also reviewed at the
end of each reporting period and recognized to the extent that it has become probable that future taxable
profit will allow the deferred tax asset to be recovered.
Deferred tax liabilities and assets are measured at the tax rates that are expected to apply in the period in
which the liability is settled or the asset realized, based on tax rates and laws that have been enacted or
substantively enacted by the end of the reporting period. The measurement of deferred tax liabilities
and assets reflects the tax consequences of how the Bank and its subsidiaries expect, at the end of the
reporting period, to recover or settle the carrying amount of their assets and liabilities.
c. Current and deferred taxes for the year
Current and deferred taxes are recognized in profit or loss, but taxes that relate to items recognized in
other comprehensive income or directly in equity are also recognized in other comprehensive income or
directly in equity respectively.
Recognition of Interest Income and Interest Expense
Except for financial assets and liabilities at fair value through profit or loss, all interest-earning financial
assets and interest-bearing financial liabilities are accrued using the effective interest rate method and are
accounted for as interest income and interest expense in the consolidated statement of comprehensive
income.
Recognition of Service Fee Income and Service Fee Expense
Service fee income and expense are recognized when loans or other services are provided. Service fees on
significant projects are recognized when the project has been completed, for instance, loan syndication fees
are recognized as revenue when the syndication has been completed. If service fee income and expense
are related to provide service on loans, service fee income and expense are either recognized over the
period that service is performed or as an adjustment to the effective interest rate on the loans and
receivables, mainly depending the materiality of these loans.
Business Combinations
Acquisitions of businesses are accounted for using the acquisition method. Acquisition-related costs are
generally recognized in profit or loss as incurred.
Goodwill is measured as the sum of the consideration transferred, the amount of any non-controlling
interests in the acquiree, and the fair value of the acquirer’s previously held equity interest in the acquiree in
excess of the net of the acquisition-date amounts of the identifiable assets acquired and the liabilities
assumed.
Current non-controlling interests, which entitle their holders to a proportionate share of an acquiree’s net
assets in the event of liquidation, may be initially measured either at fair value or at the non-controlling
interests’ proportionate share of the recognized amounts of the acquiree’s identifiable net assets.
- 60 -
5. CRITICAL ACCOUNTING JUDGMENTS AND KEY SOURCES OF ESTIMATION
UNCERTAINTY
In the application of the Bank and its subsidiaries’ accounting policies, management is required to make
judgments, estimates and assumptions about the carrying amounts of assets and liabilities that are not
readily apparent from other sources. The estimates and associated assumptions are based on historical
experience and other factors that are considered to be relevant. Actual results may differ from these
estimates.
The estimates and underlying assumptions are reviewed by management on an ongoing basis. Revisions
to accounting estimates are recognized in the period in which the estimate is revised if the revision affects
only that period, or in the period of the revision and future periods if the revision affects both current and
future periods.
a. Estimated impairment loss on loans and receivables
The Bank and its subsidiaries review loan portfolios and receivables to assess impairment periodically.
In determining whether an impairment loss should be recognized, the Bank and its subsidiaries make
judgments on whether there is any evidence of impairment loss. This evidence may include
observable data on an adverse change in the payment status of borrowers in the portfolio (e.g., payment
delinquency or default or in the national or economic condition that correlates with defaults on the
assets in the portfolio. Management also determines the future cash flows in the portfolio using
estimates based on historical loss experience on financial assets grouped on the basis of similar credit
risk characteristics. The methodology and assumptions used for estimating both the amount and
timing of future cash flows are reviewed regularly to decrease any difference between estimated loss
and actual loss.
b. Fair value of financial instruments
The fair value of non-active market or non-quoted financial instruments is determined using valuation
techniques based on observable data of similar financial instruments or valuation model. If fair value
is determined using a valuation model, only observable data should be used as model inputs as much as
possible, and the model should be calibrated to ensure that all output data and the results reflect the
actual market price. And the fair value also reflects the consideration of the counterparties’ credit risk
and the Bank and its subsidiaries’ credit quality. Please refer to Note 49,b,3) for the information on
fair value adjustment.
c. Impairment of goodwill
Determining whether goodwill is impaired requires an estimation of the value in use of the
cash-generating units to which goodwill has been allocated. The calculation of the value in use
requires management to estimate the future cash flows expected to arise from the cash-generating unit
and to use a discount rate suited to the calculation of the present value of the cash flows. When the
actual future cash flows are less than expected, a material impairment loss may arise.
d. Retirement benefit
The present value of the retirement benefit obligations is determined actuarially using a number of
assumptions. Any changes in these assumptions will affect the carrying amount of retirement benefit
obligations. The assumptions used in determining the pension net cost (income) include the discount
rate. The Bank determines the appropriate discount rate at the end of each to calculate the present
value of future cash outflows expected to be required for settling retirement benefit obligations. In
determining the appropriate discount rate, the Bank should consider the interest rates for high-quality
corporate bonds or government bonds having a currency that is the same as the currency to be used in
benefit payments and also having maturity periods that are the same as those of the pension liabilities.
Other key assumptions for retirement benefit obligations are based on current market conditions.
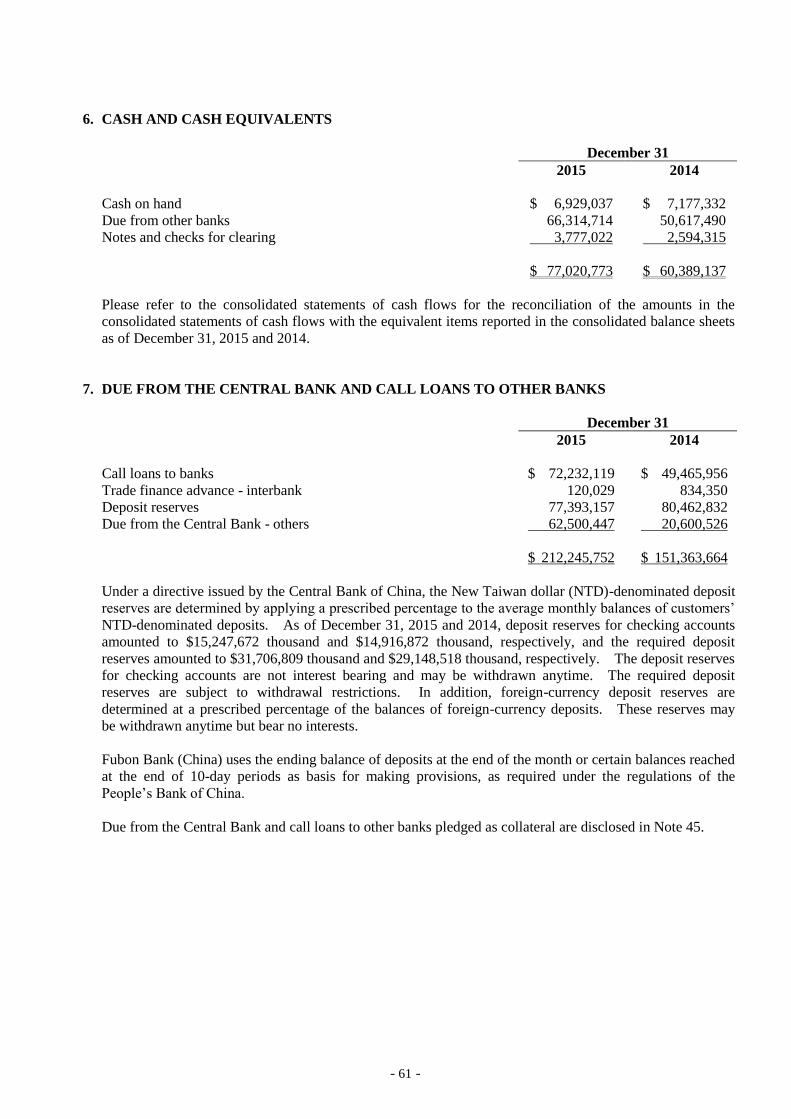
- 61 -
6. CASH AND CASH EQUIVALENTS
December 31
2015 2014
Cash on hand $ 6,929,037 $ 7,177,332
Due from other banks 66,314,714 50,617,490
Notes and checks for clearing 3,777,022 2,594,315
$ 77,020,773 $ 60,389,137
Please refer to the consolidated statements of cash flows for the reconciliation of the amounts in the
consolidated statements of cash flows with the equivalent items reported in the consolidated balance sheets
as of December 31, 2015 and 2014.
7. DUE FROM THE CENTRAL BANK AND CALL LOANS TO OTHER BANKS
December 31
2015 2014
Call loans to banks $ 72,232,119 $ 49,465,956
Trade finance advance - interbank 120,029 834,350
Deposit reserves 77,393,157 80,462,832
Due from the Central Bank - others 62,500,447 20,600,526
$ 212,245,752 $ 151,363,664
Under a directive issued by the Central Bank of China, the New Taiwan dollar (NTD)-denominated deposit
reserves are determined by applying a prescribed percentage to the average monthly balances of customers’
NTD-denominated deposits. As of December 31, 2015 and 2014, deposit reserves for checking accounts
amounted to $15,247,672 thousand and $14,916,872 thousand, respectively, and the required deposit
reserves amounted to $31,706,809 thousand and $29,148,518 thousand, respectively. The deposit reserves
for checking accounts are not interest bearing and may be withdrawn anytime. The required deposit
reserves are subject to withdrawal restrictions. In addition, foreign-currency deposit reserves are
determined at a prescribed percentage of the balances of foreign-currency deposits. These reserves may
be withdrawn anytime but bear no interests.
Fubon Bank (China) uses the ending balance of deposits at the end of the month or certain balances reached
at the end of 10-day periods as basis for making provisions, as required under the regulations of the
People’s Bank of China.
Due from the Central Bank and call loans to other banks pledged as collateral are disclosed in Note 45.
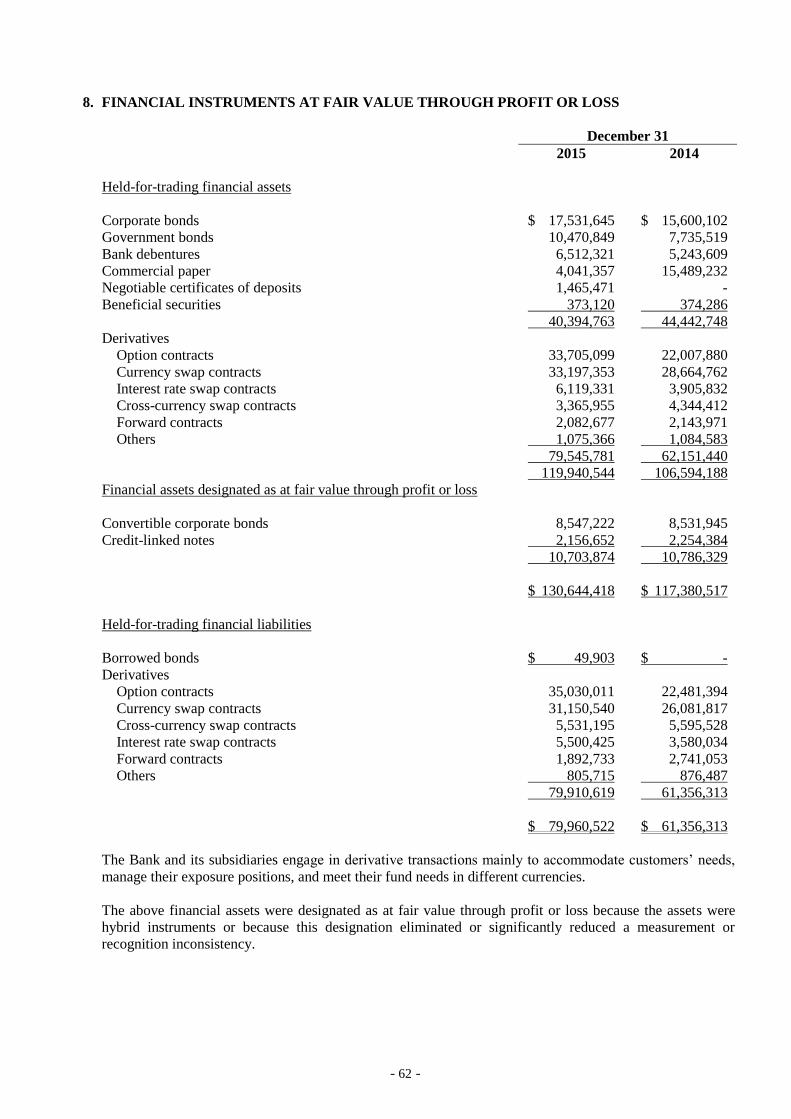
- 62 -
8. FINANCIAL INSTRUMENTS AT FAIR VALUE THROUGH PROFIT OR LOSS
December 31
2015 2014
Held-for-trading financial assets
Corporate bonds $ 17,531,645 $ 15,600,102
Government bonds 10,470,849 7,735,519
Bank debentures 6,512,321 5,243,609
Commercial paper 4,041,357 15,489,232
Negotiable certificates of deposits 1,465,471 -
Beneficial securities 373,120 374,286
40,394,763 44,442,748
Derivatives
Option contracts 33,705,099 22,007,880
Currency swap contracts 33,197,353 28,664,762
Interest rate swap contracts 6,119,331 3,905,832
Cross-currency swap contracts 3,365,955 4,344,412
Forward contracts 2,082,677 2,143,971
Others 1,075,366 1,084,583
79,545,781 62,151,440
119,940,544 106,594,188
Financial assets designated as at fair value through profit or loss
Convertible corporate bonds 8,547,222 8,531,945
Credit-linked notes 2,156,652 2,254,384
10,703,874 10,786,329
$ 130,644,418 $ 117,380,517
Held-for-trading financial liabilities
Borrowed bonds $ 49,903 $ -
Derivatives
Option contracts 35,030,011 22,481,394
Currency swap contracts 31,150,540 26,081,817
Cross-currency swap contracts 5,531,195 5,595,528
Interest rate swap contracts 5,500,425 3,580,034
Forward contracts 1,892,733 2,741,053
Others 805,715 876,487
79,910,619 61,356,313
$ 79,960,522 $ 61,356,313
The Bank and its subsidiaries engage in derivative transactions mainly to accommodate customers’ needs,
manage their exposure positions, and meet their fund needs in different currencies.
The above financial assets were designated as at fair value through profit or loss because the assets were
hybrid instruments or because this designation eliminated or significantly reduced a measurement or
recognition inconsistency.
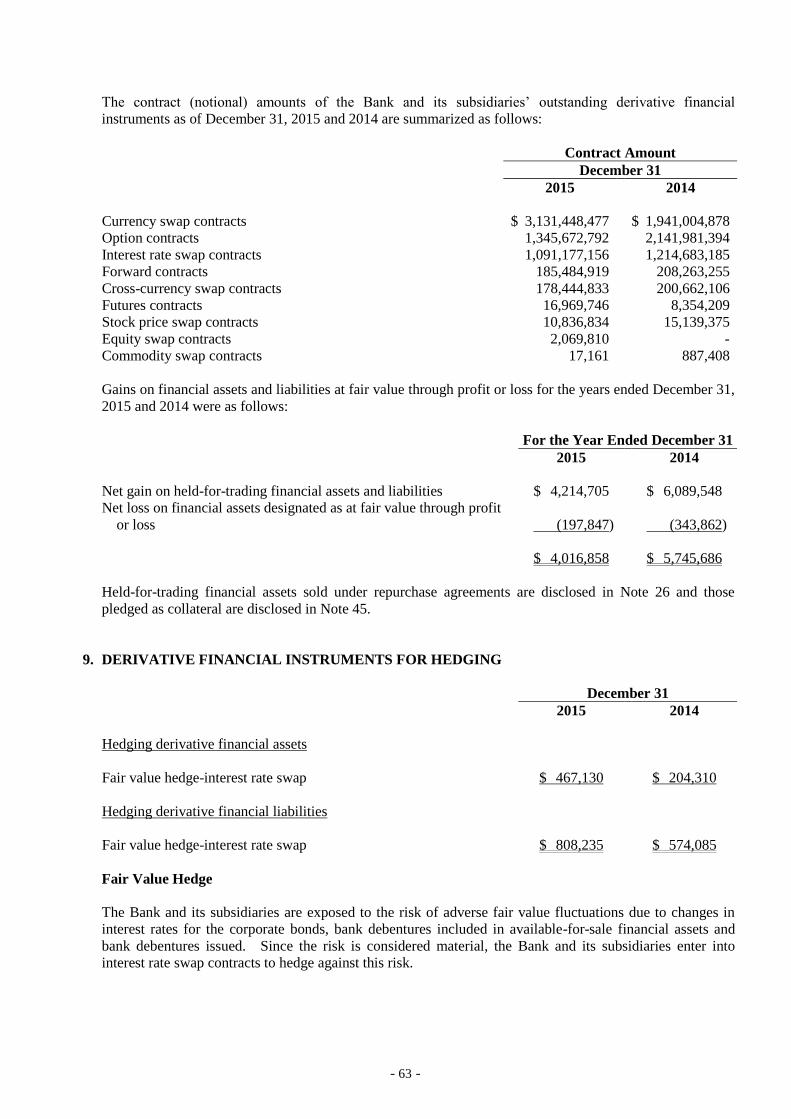
- 63 -
The contract (notional) amounts of the Bank and its subsidiaries’ outstanding derivative financial
instruments as of December 31, 2015 and 2014 are summarized as follows:
Contract Amount
December 31
2015 2014
Currency swap contracts $ 3,131,448,477 $ 1,941,004,878
Option contracts 1,345,672,792 2,141,981,394
Interest rate swap contracts 1,091,177,156 1,214,683,185
Forward contracts 185,484,919 208,263,255
Cross-currency swap contracts 178,444,833 200,662,106
Futures contracts 16,969,746 8,354,209
Stock price swap contracts 10,836,834 15,139,375
Equity swap contracts 2,069,810 -
Commodity swap contracts 17,161 887,408
Gains on financial assets and liabilities at fair value through profit or loss for the years ended December 31,
2015 and 2014 were as follows:
For the Year Ended December 31
2015 2014
Net gain on held-for-trading financial assets and liabilities $ 4,214,705 $ 6,089,548
Net loss on financial assets designated as at fair value through profit
or loss (197,847) (343,862)
$ 4,016,858 $ 5,745,686
Held-for-trading financial assets sold under repurchase agreements are disclosed in Note 26 and those
pledged as collateral are disclosed in Note 45.
9. DERIVATIVE FINANCIAL INSTRUMENTS FOR HEDGING
December 31
2015 2014
Hedging derivative financial assets
Fair value hedge-interest rate swap $ 467,130 $ 204,310
Hedging derivative financial liabilities
Fair value hedge-interest rate swap $ 808,235 $ 574,085
Fair Value Hedge
The Bank and its subsidiaries are exposed to the risk of adverse fair value fluctuations due to changes in
interest rates for the corporate bonds, bank debentures included in available-for-sale financial assets and
bank debentures issued. Since the risk is considered material, the Bank and its subsidiaries enter into
interest rate swap contracts to hedge against this risk.
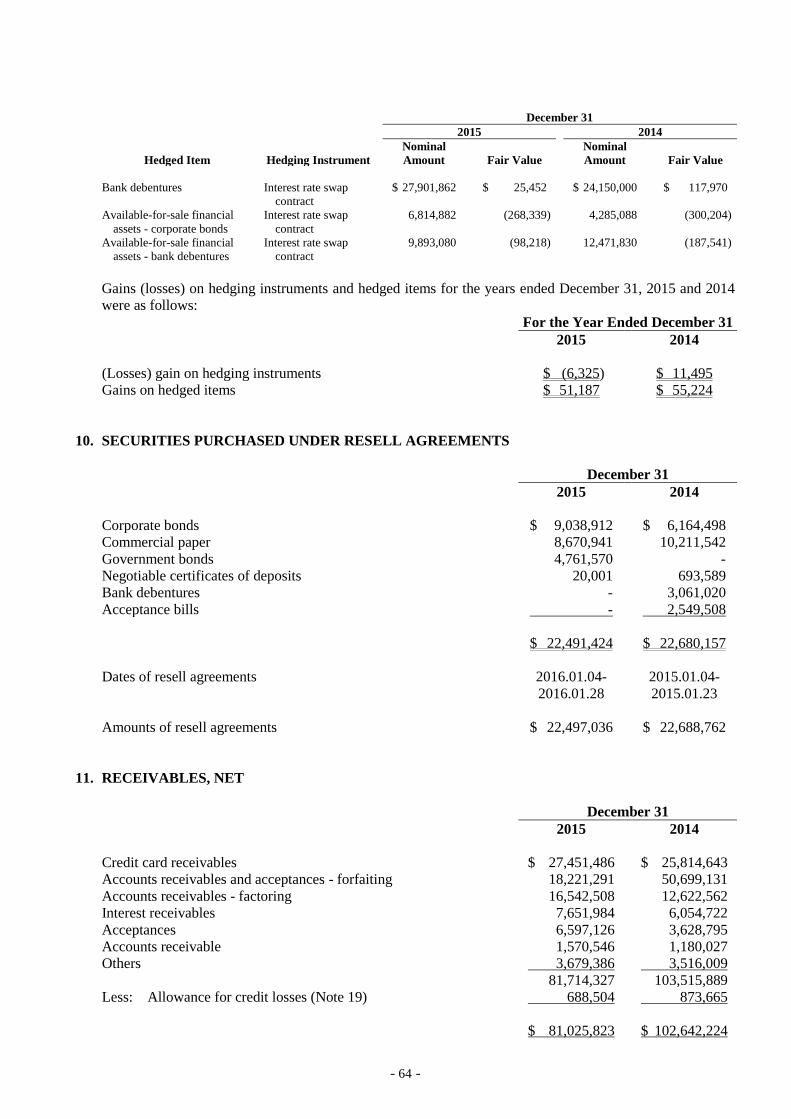
- 64 -
December 31
2015 2014
Hedged Item Hedging Instrument Nominal
Amount Fair Value Nominal
Amount Fair Value
Bank debentures Interest rate swap
contract
$ 27,901,862 $ 25,452 $ 24,150,000 $ 117,970
Available-for-sale financial
assets - corporate bonds
Interest rate swap
contract
6,814,882 (268,339) 4,285,088 (300,204)
Available-for-sale financial
assets - bank debentures
Interest rate swap
contract
9,893,080 (98,218) 12,471,830 (187,541)
Gains (losses) on hedging instruments and hedged items for the years ended December 31, 2015 and 2014
were as follows:
For the Year Ended December 31
2015 2014
(Losses) gain on hedging instruments $ (6,325) $ 11,495
Gains on hedged items $ 51,187 $ 55,224
10. SECURITIES PURCHASED UNDER RESELL AGREEMENTS
December 31
2015 2014
Corporate bonds $ 9,038,912 $ 6,164,498
Commercial paper 8,670,941 10,211,542
Government bonds 4,761,570 -
Negotiable certificates of deposits 20,001 693,589
Bank debentures - 3,061,020
Acceptance bills - 2,549,508
$ 22,491,424 $ 22,680,157
Dates of resell agreements
2016.01.04-
2016.01.28
2015.01.04-
2015.01.23
Amounts of resell agreements $ 22,497,036 $ 22,688,762
11. RECEIVABLES, NET
December 31
2015 2014
Credit card receivables $ 27,451,486 $ 25,814,643
Accounts receivables and acceptances - forfaiting 18,221,291 50,699,131
Accounts receivables - factoring 16,542,508 12,622,562
Interest receivables 7,651,984 6,054,722
Acceptances 6,597,126 3,628,795
Accounts receivable 1,570,546 1,180,027
Others 3,679,386 3,516,009
81,714,327 103,515,889
Less: Allowance for credit losses (Note 19) 688,504 873,665
$ 81,025,823 $ 102,642,224
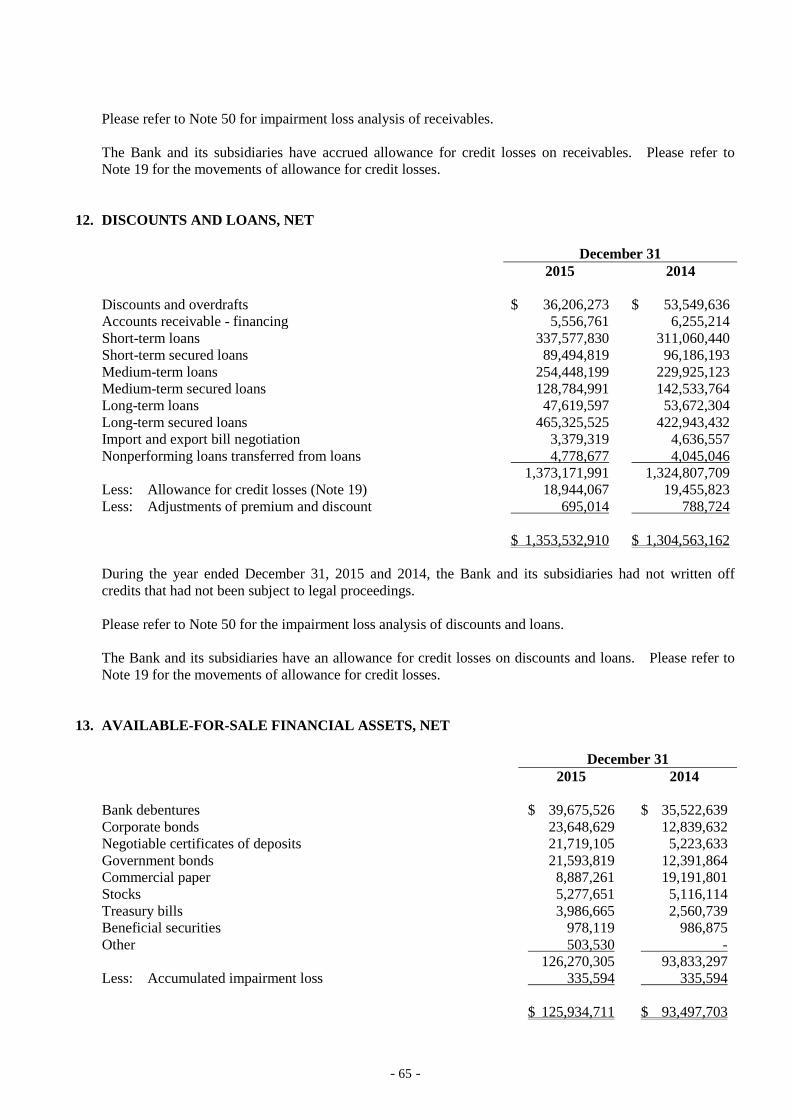
- 65 -
Please refer to Note 50 for impairment loss analysis of receivables.
The Bank and its subsidiaries have accrued allowance for credit losses on receivables. Please refer to
Note 19 for the movements of allowance for credit losses.
12. DISCOUNTS AND LOANS, NET
December 31
2015 2014
Discounts and overdrafts $ 36,206,273 $ 53,549,636
Accounts receivable - financing 5,556,761 6,255,214
Short-term loans 337,577,830 311,060,440
Short-term secured loans 89,494,819 96,186,193
Medium-term loans 254,448,199 229,925,123
Medium-term secured loans 128,784,991 142,533,764
Long-term loans 47,619,597 53,672,304
Long-term secured loans 465,325,525 422,943,432
Import and export bill negotiation 3,379,319 4,636,557
Nonperforming loans transferred from loans 4,778,677 4,045,046
1,373,171,991 1,324,807,709
Less: Allowance for credit losses (Note 19) 18,944,067 19,455,823
Less: Adjustments of premium and discount 695,014 788,724
$ 1,353,532,910 $ 1,304,563,162
During the year ended December 31, 2015 and 2014, the Bank and its subsidiaries had not written off
credits that had not been subject to legal proceedings.
Please refer to Note 50 for the impairment loss analysis of discounts and loans.
The Bank and its subsidiaries have an allowance for credit losses on discounts and loans. Please refer to
Note 19 for the movements of allowance for credit losses.
13. AVAILABLE-FOR-SALE FINANCIAL ASSETS, NET
December 31
2015 2014
Bank debentures $ 39,675,526 $ 35,522,639
Corporate bonds 23,648,629 12,839,632
Negotiable certificates of deposits 21,719,105 5,223,633
Government bonds 21,593,819 12,391,864
Commercial paper 8,887,261 19,191,801
Stocks 5,277,651 5,116,114
Treasury bills 3,986,665 2,560,739
Beneficial securities 978,119 986,875
Other 503,530 -
126,270,305 93,833,297
Less: Accumulated impairment loss 335,594 335,594
$ 125,934,711 $ 93,497,703
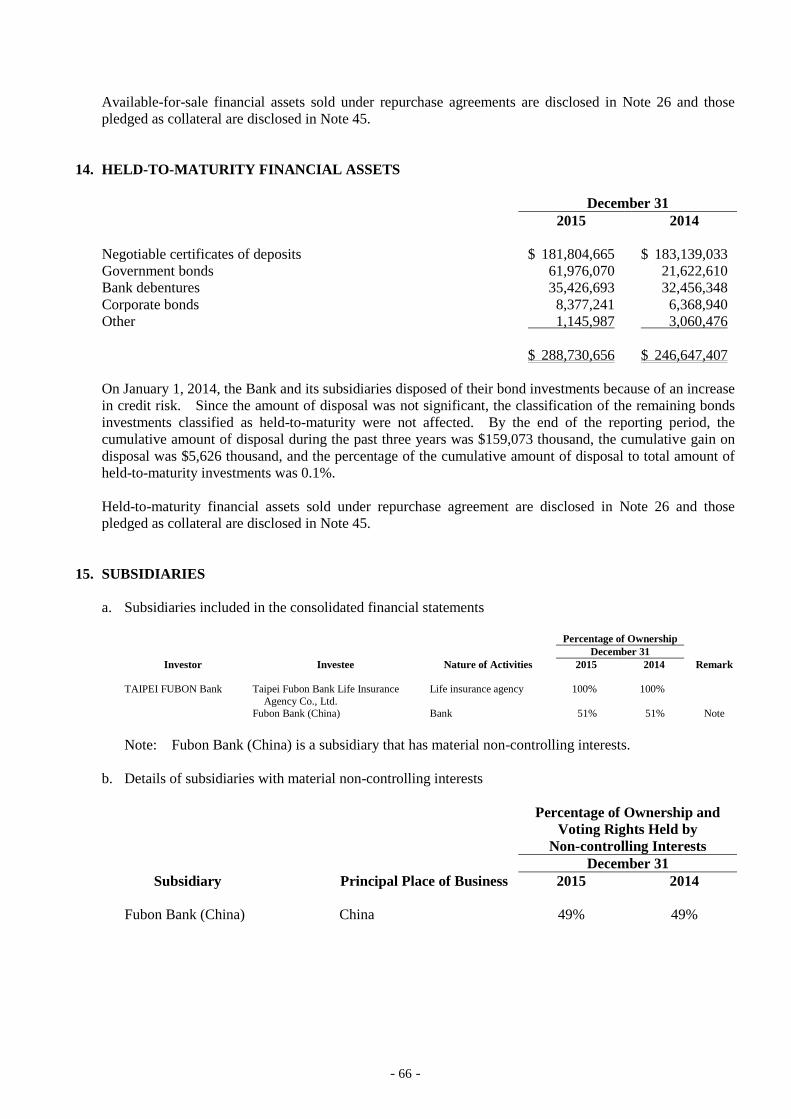
- 66 -
Available-for-sale financial assets sold under repurchase agreements are disclosed in Note 26 and those
pledged as collateral are disclosed in Note 45.
14. HELD-TO-MATURITY FINANCIAL ASSETS
December 31
2015 2014
Negotiable certificates of deposits $ 181,804,665 $ 183,139,033
Government bonds 61,976,070 21,622,610
Bank debentures 35,426,693 32,456,348
Corporate bonds 8,377,241 6,368,940
Other 1,145,987 3,060,476
$ 288,730,656 $ 246,647,407
On January 1, 2014, the Bank and its subsidiaries disposed of their bond investments because of an increase
in credit risk. Since the amount of disposal was not significant, the classification of the remaining bonds
investments classified as held-to-maturity were not affected. By the end of the reporting period, the
cumulative amount of disposal during the past three years was $159,073 thousand, the cumulative gain on
disposal was $5,626 thousand, and the percentage of the cumulative amount of disposal to total amount of
held-to-maturity investments was 0.1%.
Held-to-maturity financial assets sold under repurchase agreement are disclosed in Note 26 and those
pledged as collateral are disclosed in Note 45.
15. SUBSIDIARIES
a. Subsidiaries included in the consolidated financial statements
Percentage of Ownership
December 31
Investor Investee Nature of Activities 2015 2014 Remark
TAIPEI FUBON Bank Taipei Fubon Bank Life Insurance
Agency Co., Ltd.
Life insurance agency 100% 100%
Fubon Bank (China) Bank 51% 51% Note
Note: Fubon Bank (China) is a subsidiary that has material non-controlling interests.
b. Details of subsidiaries with material non-controlling interests
Percentage of Ownership and
Voting Rights Held by
Non-controlling Interests
December 31
Subsidiary Principal Place of Business 2015 2014
Fubon Bank (China) China 49% 49%
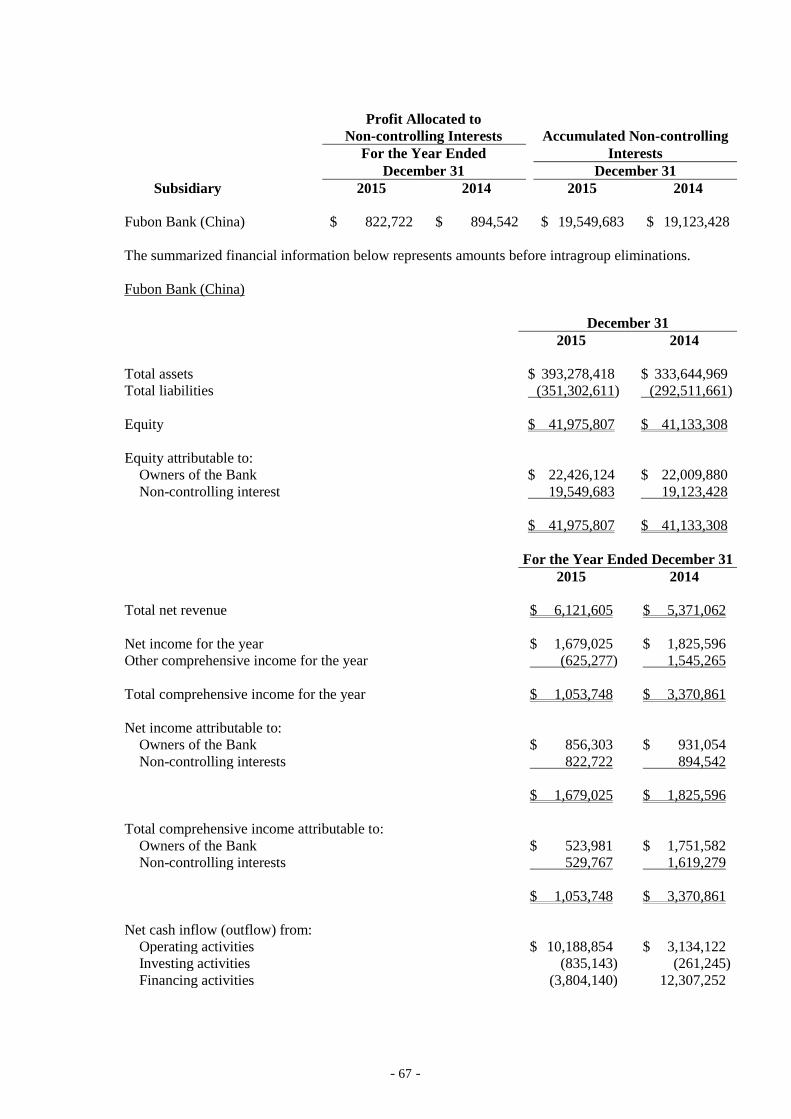
- 67 -
Profit Allocated to
Non-controlling Interests Accumulated Non-controlling
For the Year Ended Interests
December 31 December 31
Subsidiary 2015 2014 2015 2014
Fubon Bank (China) $ 822,722 $ 894,542 $ 19,549,683 $ 19,123,428
The summarized financial information below represents amounts before intragroup eliminations.
Fubon Bank (China)
December 31
2015 2014
Total assets $ 393,278,418 $ 333,644,969
Total liabilities (351,302,611) (292,511,661)
Equity $ 41,975,807 $ 41,133,308
Equity attributable to:
Owners of the Bank $ 22,426,124 $ 22,009,880
Non-controlling interest 19,549,683 19,123,428
$ 41,975,807 $ 41,133,308
For the Year Ended December 31
2015 2014
Total net revenue $ 6,121,605 $ 5,371,062
Net income for the year $ 1,679,025 $ 1,825,596
Other comprehensive income for the year (625,277) 1,545,265
Total comprehensive income for the year $ 1,053,748 $ 3,370,861
Net income attributable to:
Owners of the Bank $ 856,303 $ 931,054
Non-controlling interests 822,722 894,542
$ 1,679,025 $ 1,825,596
Total comprehensive income attributable to:
Owners of the Bank $ 523,981 $ 1,751,582
Non-controlling interests 529,767 1,619,279
$ 1,053,748 $ 3,370,861
Net cash inflow (outflow) from:
Operating activities $ 10,188,854 $ 3,134,122
Investing activities (835,143) (261,245)
Financing activities (3,804,140) 12,307,252
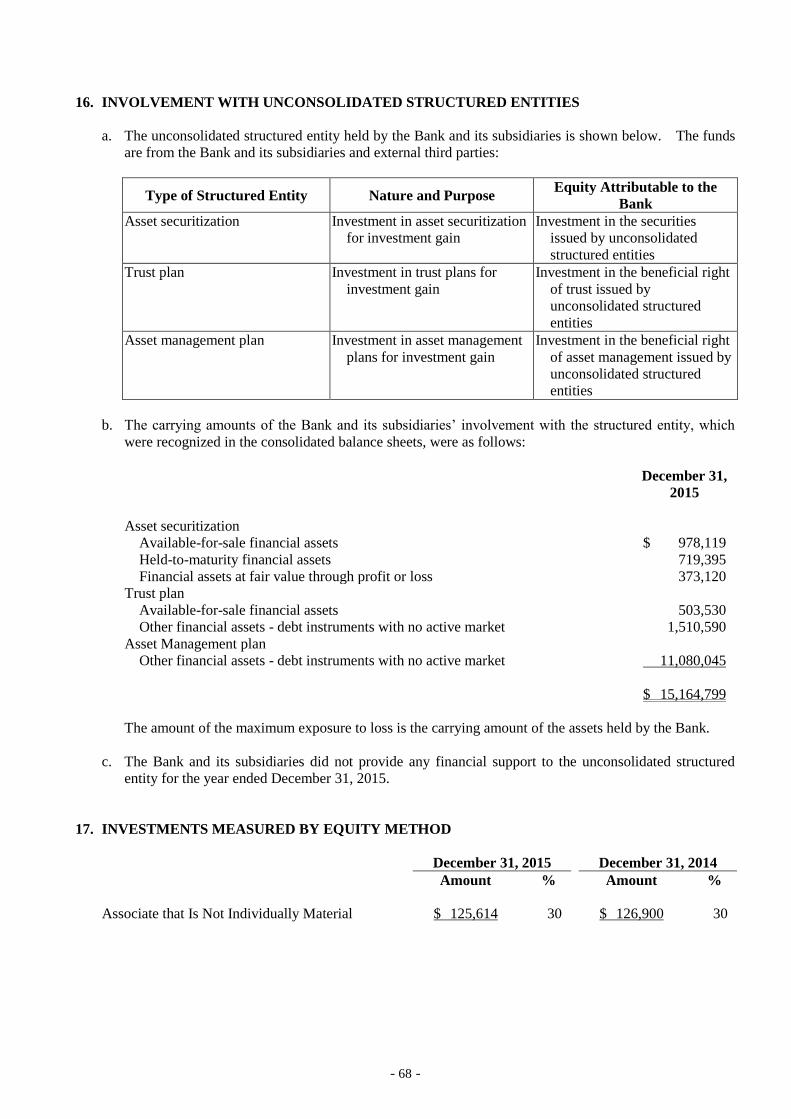
- 68 -
16. INVOLVEMENT WITH UNCONSOLIDATED STRUCTURED ENTITIES
a. The unconsolidated structured entity held by the Bank and its subsidiaries is shown below. The funds
are from the Bank and its subsidiaries and external third parties:
Type of Structured Entity Nature and Purpose Equity Attributable to the
Bank
Asset securitization Investment in asset securitization
for investment gain
Investment in the securities
issued by unconsolidated
structured entities
Trust plan Investment in trust plans for
investment gain
Investment in the beneficial right
of trust issued by
unconsolidated structured
entities
Asset management plan Investment in asset management
plans for investment gain
Investment in the beneficial right
of asset management issued by
unconsolidated structured
entities
b. The carrying amounts of the Bank and its subsidiaries’ involvement with the structured entity, which
were recognized in the consolidated balance sheets, were as follows:
December 31,
2015
Asset securitization
Available-for-sale financial assets $ 978,119
Held-to-maturity financial assets 719,395
Financial assets at fair value through profit or loss 373,120
Trust plan
Available-for-sale financial assets 503,530
Other financial assets - debt instruments with no active market 1,510,590
Asset Management plan
Other financial assets - debt instruments with no active market 11,080,045
$ 15,164,799
The amount of the maximum exposure to loss is the carrying amount of the assets held by the Bank.
c. The Bank and its subsidiaries did not provide any financial support to the unconsolidated structured
entity for the year ended December 31, 2015.
17. INVESTMENTS MEASURED BY EQUITY METHOD
December 31, 2015 December 31, 2014
Amount % Amount %
Associate that Is Not Individually Material $ 125,614 30 $ 126,900 30
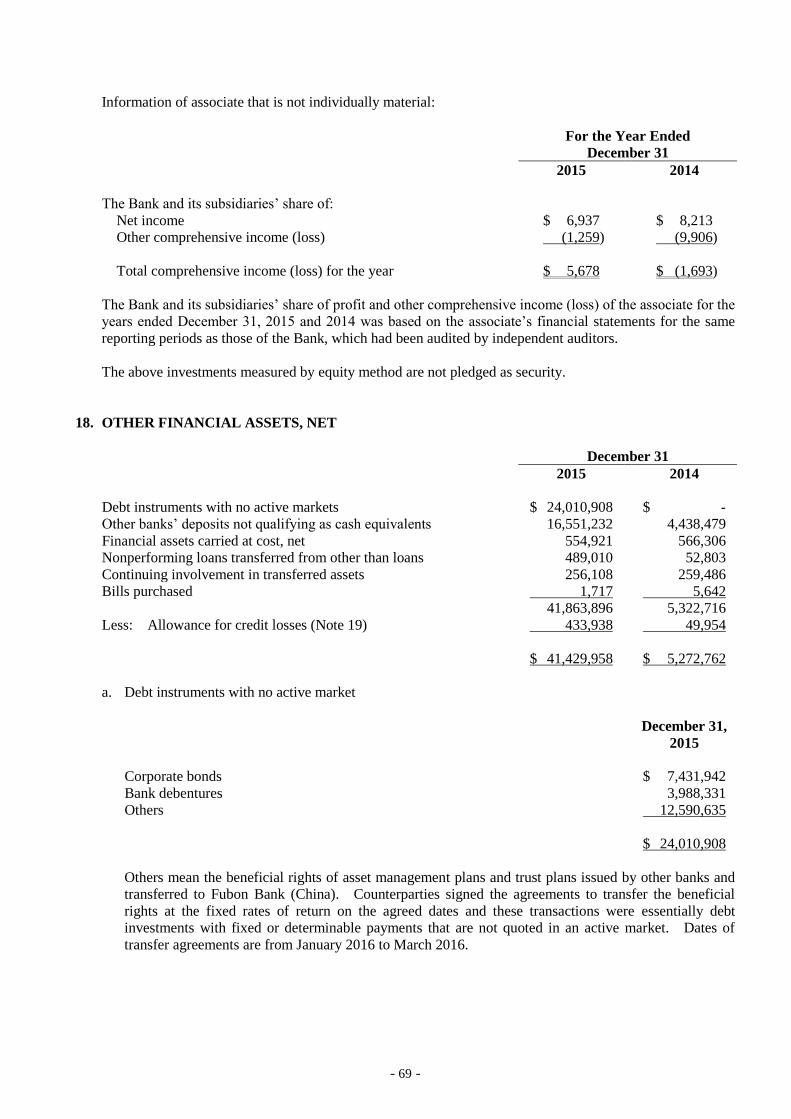
- 69 -
Information of associate that is not individually material:
For the Year Ended
December 31
2015 2014
The Bank and its subsidiaries’ share of:
Net income $ 6,937 $ 8,213
Other comprehensive income (loss) (1,259) (9,906)
Total comprehensive income (loss) for the year $ 5,678 $ (1,693)
The Bank and its subsidiaries’ share of profit and other comprehensive income (loss) of the associate for the
years ended December 31, 2015 and 2014 was based on the associate’s financial statements for the same
reporting periods as those of the Bank, which had been audited by independent auditors.
The above investments measured by equity method are not pledged as security.
18. OTHER FINANCIAL ASSETS, NET
December 31
2015 2014
Debt instruments with no active markets $ 24,010,908 $ -
Other banks’ deposits not qualifying as cash equivalents 16,551,232 4,438,479
Financial assets carried at cost, net 554,921 566,306
Nonperforming loans transferred from other than loans 489,010 52,803
Continuing involvement in transferred assets 256,108 259,486
Bills purchased 1,717 5,642
41,863,896 5,322,716
Less: Allowance for credit losses (Note 19) 433,938 49,954
$ 41,429,958 $ 5,272,762
a. Debt instruments with no active market
December 31,
2015
Corporate bonds $ 7,431,942
Bank debentures 3,988,331
Others 12,590,635
$ 24,010,908
Others mean the beneficial rights of asset management plans and trust plans issued by other banks and
transferred to Fubon Bank (China). Counterparties signed the agreements to transfer the beneficial
rights at the fixed rates of return on the agreed dates and these transactions were essentially debt
investments with fixed or determinable payments that are not quoted in an active market. Dates of
transfer agreements are from January 2016 to March 2016.
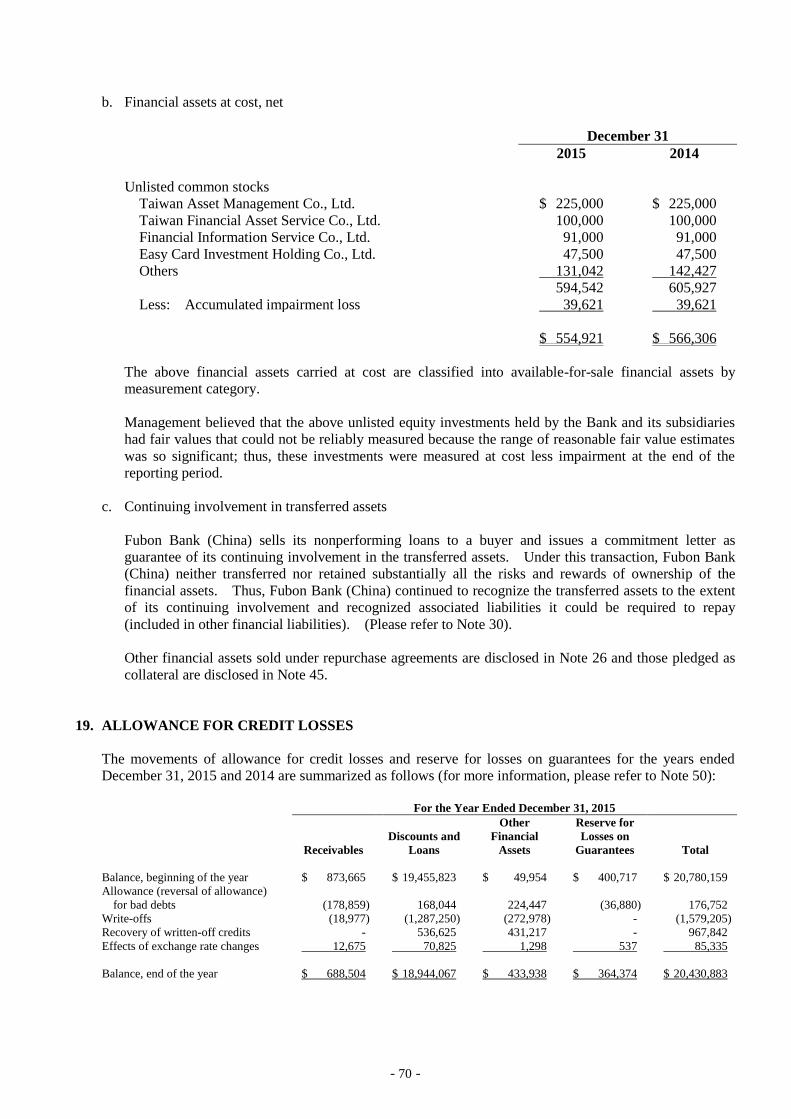
- 70 -
b. Financial assets at cost, net
December 31
2015 2014
Unlisted common stocks
Taiwan Asset Management Co., Ltd. $ 225,000 $ 225,000
Taiwan Financial Asset Service Co., Ltd. 100,000 100,000
Financial Information Service Co., Ltd. 91,000 91,000
Easy Card Investment Holding Co., Ltd. 47,500 47,500
Others 131,042 142,427
594,542 605,927
Less: Accumulated impairment loss 39,621 39,621
$ 554,921 $ 566,306
The above financial assets carried at cost are classified into available-for-sale financial assets by
measurement category.
Management believed that the above unlisted equity investments held by the Bank and its subsidiaries
had fair values that could not be reliably measured because the range of reasonable fair value estimates
was so significant; thus, these investments were measured at cost less impairment at the end of the
reporting period.
c. Continuing involvement in transferred assets
Fubon Bank (China) sells its nonperforming loans to a buyer and issues a commitment letter as
guarantee of its continuing involvement in the transferred assets. Under this transaction, Fubon Bank
(China) neither transferred nor retained substantially all the risks and rewards of ownership of the
financial assets. Thus, Fubon Bank (China) continued to recognize the transferred assets to the extent
of its continuing involvement and recognized associated liabilities it could be required to repay
(included in other financial liabilities). (Please refer to Note 30).
Other financial assets sold under repurchase agreements are disclosed in Note 26 and those pledged as
collateral are disclosed in Note 45.
19. ALLOWANCE FOR CREDIT LOSSES
The movements of allowance for credit losses and reserve for losses on guarantees for the years ended
December 31, 2015 and 2014 are summarized as follows (for more information, please refer to Note 50):
For the Year Ended December 31, 2015
Receivables
Discounts and
Loans
Other
Financial
Assets
Reserve for
Losses on
Guarantees Total
Balance, beginning of the year $ 873,665 $ 19,455,823 $ 49,954 $ 400,717 $ 20,780,159
Allowance (reversal of allowance)
for bad debts (178,859) 168,044 224,447 (36,880) 176,752
Write-offs (18,977) (1,287,250) (272,978) - (1,579,205)
Recovery of written-off credits - 536,625 431,217 - 967,842
Effects of exchange rate changes 12,675 70,825 1,298 537 85,335
Balance, end of the year $ 688,504 $ 18,944,067 $ 433,938 $ 364,374 $ 20,430,883
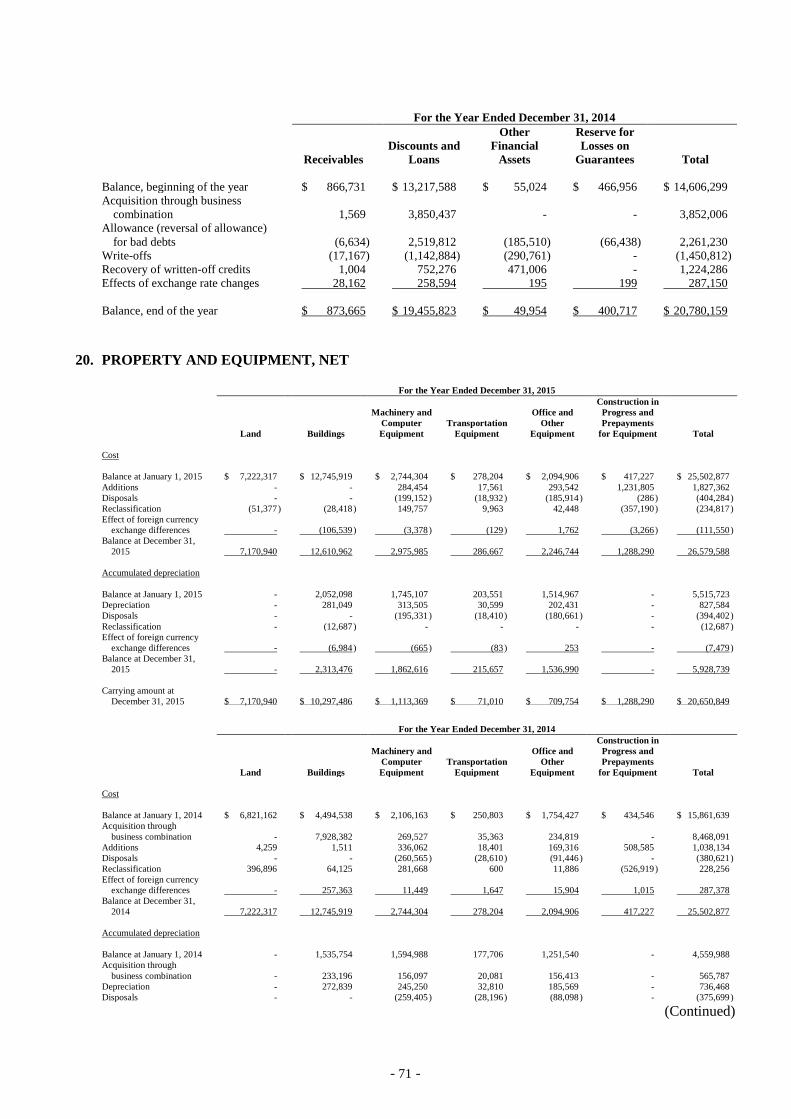
- 71 -
For the Year Ended December 31, 2014
Receivables
Discounts and
Loans
Other
Financial
Assets
Reserve for
Losses on
Guarantees Total
Balance, beginning of the year $ 866,731 $ 13,217,588 $ 55,024 $ 466,956 $ 14,606,299
Acquisition through business
combination 1,569 3,850,437 - - 3,852,006
Allowance (reversal of allowance)
for bad debts (6,634) 2,519,812 (185,510) (66,438) 2,261,230
Write-offs (17,167) (1,142,884) (290,761) - (1,450,812)
Recovery of written-off credits 1,004 752,276 471,006 - 1,224,286
Effects of exchange rate changes 28,162 258,594 195 199 287,150
Balance, end of the year $ 873,665 $ 19,455,823 $ 49,954 $ 400,717 $ 20,780,159
20. PROPERTY AND EQUIPMENT, NET
For the Year Ended December 31, 2015
Land Buildings
Machinery and
Computer
Equipment
Transportation
Equipment
Office and
Other
Equipment
Construction in
Progress and
Prepayments
for Equipment Total
Cost
Balance at January 1, 2015 $ 7,222,317 $ 12,745,919 $ 2,744,304 $ 278,204 $ 2,094,906 $ 417,227 $ 25,502,877
Additions - - 284,454 17,561 293,542 1,231,805 1,827,362
Disposals - - (199,152 ) (18,932 ) (185,914 ) (286 ) (404,284 )
Reclassification (51,377 ) (28,418 ) 149,757 9,963 42,448 (357,190 ) (234,817 )
Effect of foreign currency
exchange differences - (106,539 ) (3,378 ) (129 ) 1,762 (3,266 ) (111,550 )
Balance at December 31,
2015 7,170,940 12,610,962 2,975,985 286,667 2,246,744 1,288,290 26,579,588
Accumulated depreciation
Balance at January 1, 2015 - 2,052,098 1,745,107 203,551 1,514,967 - 5,515,723
Depreciation - 281,049 313,505 30,599 202,431 - 827,584
Disposals - - (195,331 ) (18,410 ) (180,661 ) - (394,402 )
Reclassification - (12,687 ) - - - - (12,687 )
Effect of foreign currency
exchange differences - (6,984 ) (665 ) (83 ) 253 - (7,479 )
Balance at December 31,
2015 - 2,313,476 1,862,616 215,657 1,536,990 - 5,928,739
Carrying amount at
December 31, 2015 $ 7,170,940 $ 10,297,486 $ 1,113,369 $ 71,010 $ 709,754 $ 1,288,290 $ 20,650,849
For the Year Ended December 31, 2014
Land Buildings
Machinery and
Computer
Equipment
Transportation
Equipment
Office and
Other
Equipment
Construction in
Progress and
Prepayments
for Equipment Total
Cost
Balance at January 1, 2014 $ 6,821,162 $ 4,494,538 $ 2,106,163 $ 250,803 $ 1,754,427 $ 434,546 $ 15,861,639
Acquisition through
business combination - 7,928,382 269,527 35,363 234,819 - 8,468,091
Additions 4,259 1,511 336,062 18,401 169,316 508,585 1,038,134
Disposals - - (260,565 ) (28,610 ) (91,446 ) - (380,621 )
Reclassification 396,896 64,125 281,668 600 11,886 (526,919 ) 228,256
Effect of foreign currency
exchange differences - 257,363 11,449 1,647 15,904 1,015 287,378
Balance at December 31,
2014 7,222,317 12,745,919 2,744,304 278,204 2,094,906 417,227 25,502,877
Accumulated depreciation
Balance at January 1, 2014 - 1,535,754 1,594,988 177,706 1,251,540 - 4,559,988
Acquisition through
business combination - 233,196 156,097 20,081 156,413 - 565,787
Depreciation - 272,839 245,250 32,810 185,569 - 736,468
Disposals - - (259,405 ) (28,196 ) (88,098 ) - (375,699 )
(Continued)
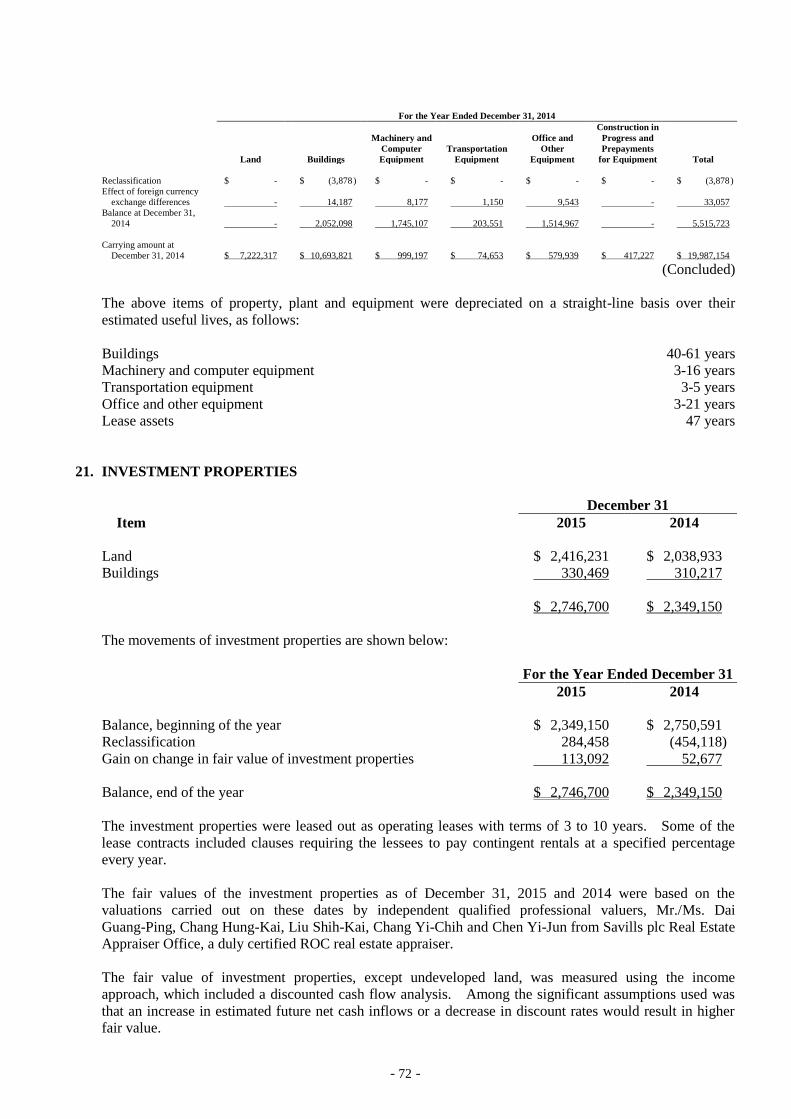
- 72 -
For the Year Ended December 31, 2014
Land Buildings
Machinery and
Computer
Equipment
Transportation
Equipment
Office and
Other
Equipment
Construction in
Progress and
Prepayments
for Equipment Total
Reclassification $ - $ (3,878 ) $ - $ - $ - $ - $ (3,878 )
Effect of foreign currency
exchange differences - 14,187 8,177 1,150 9,543 - 33,057
Balance at December 31,
2014 - 2,052,098 1,745,107 203,551 1,514,967 - 5,515,723
Carrying amount at
December 31, 2014 $ 7,222,317 $ 10,693,821 $ 999,197 $ 74,653 $ 579,939 $ 417,227 $ 19,987,154
(Concluded)
The above items of property, plant and equipment were depreciated on a straight-line basis over their
estimated useful lives, as follows:
Buildings 40-61 years
Machinery and computer equipment 3-16 years
Transportation equipment 3-5 years
Office and other equipment 3-21 years
Lease assets 47 years
21. INVESTMENT PROPERTIES
December 31
Item 2015 2014
Land $ 2,416,231 $ 2,038,933
Buildings 330,469 310,217
$ 2,746,700 $ 2,349,150
The movements of investment properties are shown below:
For the Year Ended December 31
2015 2014
Balance, beginning of the year $ 2,349,150 $ 2,750,591
Reclassification 284,458 (454,118)
Gain on change in fair value of investment properties 113,092 52,677
Balance, end of the year $ 2,746,700 $ 2,349,150
The investment properties were leased out as operating leases with terms of 3 to 10 years. Some of the
lease contracts included clauses requiring the lessees to pay contingent rentals at a specified percentage
every year.
The fair values of the investment properties as of December 31, 2015 and 2014 were based on the
valuations carried out on these dates by independent qualified professional valuers, Mr./Ms. Dai
Guang-Ping, Chang Hung-Kai, Liu Shih-Kai, Chang Yi-Chih and Chen Yi-Jun from Savills plc Real Estate
Appraiser Office, a duly certified ROC real estate appraiser.
The fair value of investment properties, except undeveloped land, was measured using the income
approach, which included a discounted cash flow analysis. Among the significant assumptions used was
that an increase in estimated future net cash inflows or a decrease in discount rates would result in higher
fair value.
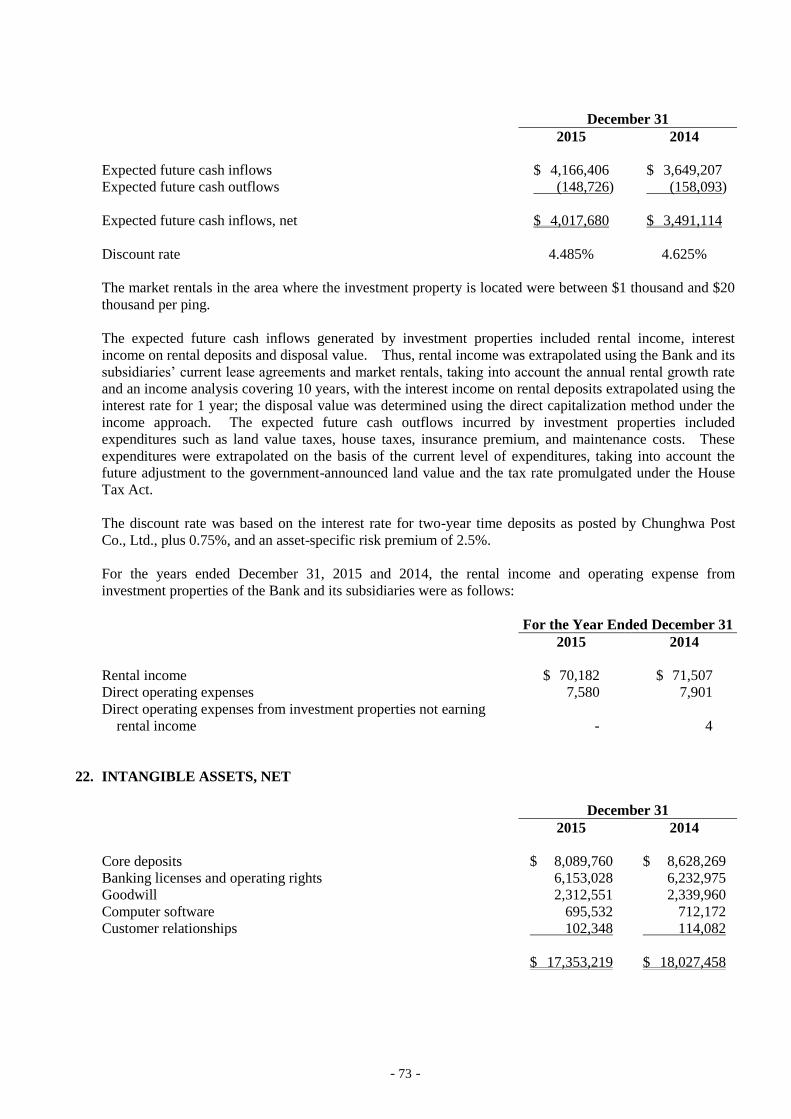
- 73 -
December 31
2015 2014
Expected future cash inflows $ 4,166,406 $ 3,649,207
Expected future cash outflows (148,726) (158,093)
Expected future cash inflows, net $ 4,017,680 $ 3,491,114
Discount rate 4.485% 4.625%
The market rentals in the area where the investment property is located were between $1 thousand and $20
thousand per ping.
The expected future cash inflows generated by investment properties included rental income, interest
income on rental deposits and disposal value. Thus, rental income was extrapolated using the Bank and its
subsidiaries’ current lease agreements and market rentals, taking into account the annual rental growth rate
and an income analysis covering 10 years, with the interest income on rental deposits extrapolated using the
interest rate for 1 year; the disposal value was determined using the direct capitalization method under the
income approach. The expected future cash outflows incurred by investment properties included
expenditures such as land value taxes, house taxes, insurance premium, and maintenance costs. These
expenditures were extrapolated on the basis of the current level of expenditures, taking into account the
future adjustment to the government-announced land value and the tax rate promulgated under the House
Tax Act.
The discount rate was based on the interest rate for two-year time deposits as posted by Chunghwa Post
Co., Ltd., plus 0.75%, and an asset-specific risk premium of 2.5%.
For the years ended December 31, 2015 and 2014, the rental income and operating expense from
investment properties of the Bank and its subsidiaries were as follows:
For the Year Ended December 31
2015 2014
Rental income $ 70,182 $ 71,507
Direct operating expenses 7,580 7,901
Direct operating expenses from investment properties not earning
rental income - 4
22. INTANGIBLE ASSETS, NET
December 31
2015 2014
Core deposits $ 8,089,760 $ 8,628,269
Banking licenses and operating rights 6,153,028 6,232,975
Goodwill 2,312,551 2,339,960
Computer software 695,532 712,172
Customer relationships 102,348 114,082
$ 17,353,219 $ 18,027,458
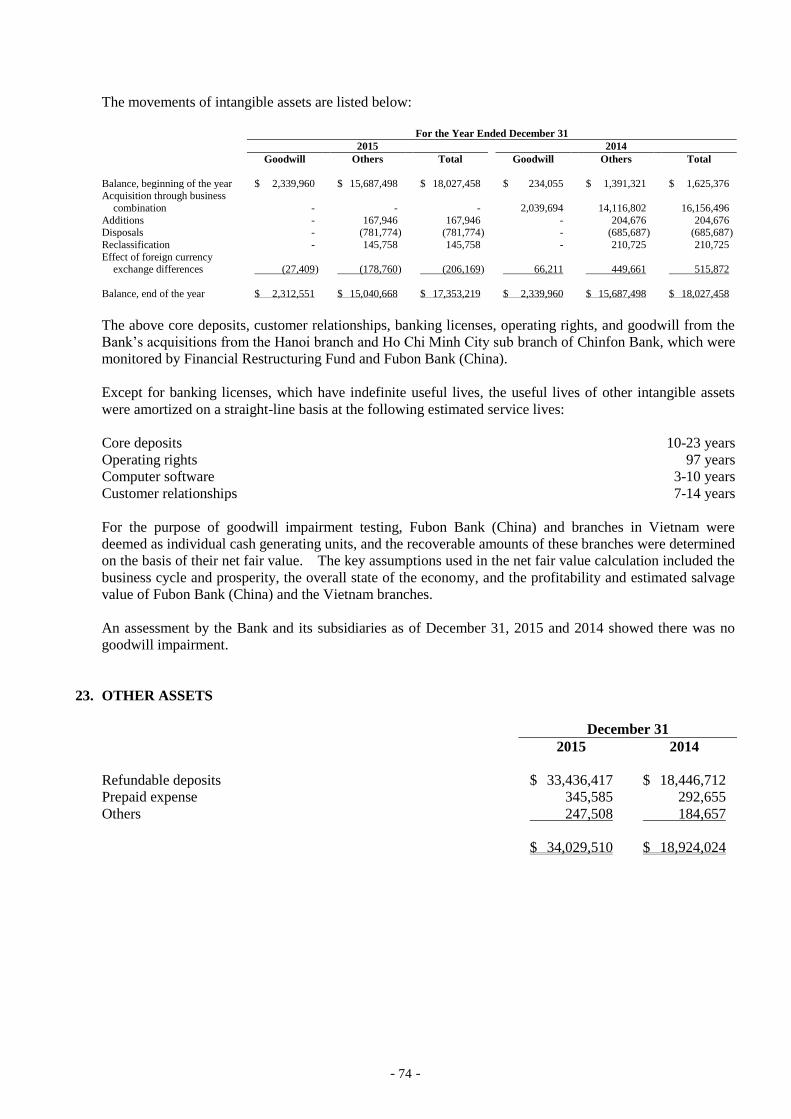
- 74 -
The movements of intangible assets are listed below:
For the Year Ended December 31
2015 2014
Goodwill Others Total Goodwill Others Total
Balance, beginning of the year $ 2,339,960 $ 15,687,498 $ 18,027,458 $ 234,055 $ 1,391,321 $ 1,625,376 Acquisition through business
combination - - - 2,039,694 14,116,802 16,156,496
Additions - 167,946 167,946 - 204,676 204,676 Disposals - (781,774 ) (781,774 ) - (685,687 ) (685,687 )
Reclassification - 145,758 145,758 - 210,725 210,725
Effect of foreign currency exchange differences (27,409 ) (178,760 ) (206,169 ) 66,211 449,661 515,872
Balance, end of the year $ 2,312,551 $ 15,040,668 $ 17,353,219 $ 2,339,960 $ 15,687,498 $ 18,027,458
The above core deposits, customer relationships, banking licenses, operating rights, and goodwill from the
Bank’s acquisitions from the Hanoi branch and Ho Chi Minh City sub branch of Chinfon Bank, which were
monitored by Financial Restructuring Fund and Fubon Bank (China).
Except for banking licenses, which have indefinite useful lives, the useful lives of other intangible assets
were amortized on a straight-line basis at the following estimated service lives:
Core deposits 10-23 years
Operating rights 97 years
Computer software 3-10 years
Customer relationships 7-14 years
For the purpose of goodwill impairment testing, Fubon Bank (China) and branches in Vietnam were
deemed as individual cash generating units, and the recoverable amounts of these branches were determined
on the basis of their net fair value. The key assumptions used in the net fair value calculation included the
business cycle and prosperity, the overall state of the economy, and the profitability and estimated salvage
value of Fubon Bank (China) and the Vietnam branches.
An assessment by the Bank and its subsidiaries as of December 31, 2015 and 2014 showed there was no
goodwill impairment.
23. OTHER ASSETS
December 31
2015 2014
Refundable deposits $ 33,436,417 $ 18,446,712
Prepaid expense 345,585 292,655
Others 247,508 184,657
$ 34,029,510 $ 18,924,024
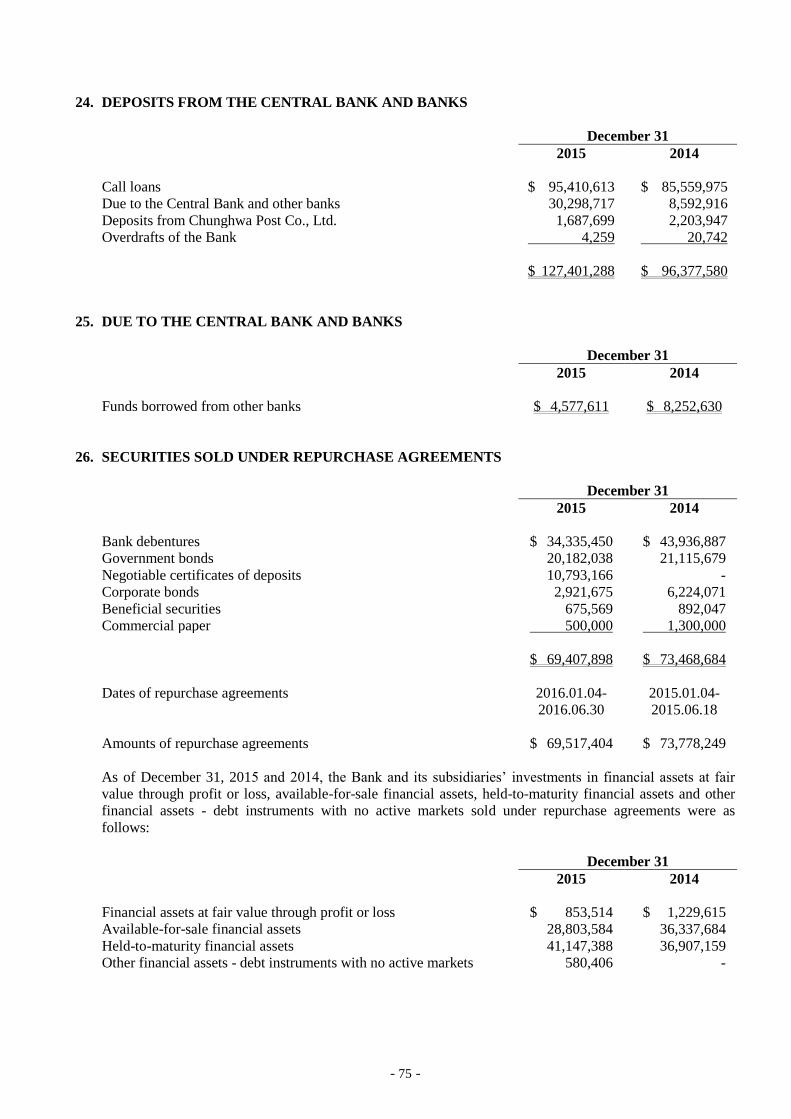
- 75 -
24. DEPOSITS FROM THE CENTRAL BANK AND BANKS
December 31
2015 2014
Call loans $ 95,410,613 $ 85,559,975
Due to the Central Bank and other banks 30,298,717 8,592,916
Deposits from Chunghwa Post Co., Ltd. 1,687,699 2,203,947
Overdrafts of the Bank 4,259 20,742
$ 127,401,288 $ 96,377,580
25. DUE TO THE CENTRAL BANK AND BANKS
December 31
2015 2014
Funds borrowed from other banks $ 4,577,611 $ 8,252,630
26. SECURITIES SOLD UNDER REPURCHASE AGREEMENTS
December 31
2015 2014
Bank debentures $ 34,335,450 $ 43,936,887
Government bonds 20,182,038 21,115,679
Negotiable certificates of deposits 10,793,166 -
Corporate bonds 2,921,675 6,224,071
Beneficial securities 675,569 892,047
Commercial paper 500,000 1,300,000
$ 69,407,898 $ 73,468,684
Dates of repurchase agreements 2016.01.04-
2016.06.30
2015.01.04-
2015.06.18
Amounts of repurchase agreements $ 69,517,404 $ 73,778,249
As of December 31, 2015 and 2014, the Bank and its subsidiaries’ investments in financial assets at fair
value through profit or loss, available-for-sale financial assets, held-to-maturity financial assets and other
financial assets - debt instruments with no active markets sold under repurchase agreements were as
follows:
December 31
2015 2014
Financial assets at fair value through profit or loss $ 853,514 $ 1,229,615
Available-for-sale financial assets 28,803,584 36,337,684
Held-to-maturity financial assets 41,147,388 36,907,159
Other financial assets - debt instruments with no active markets 580,406 -
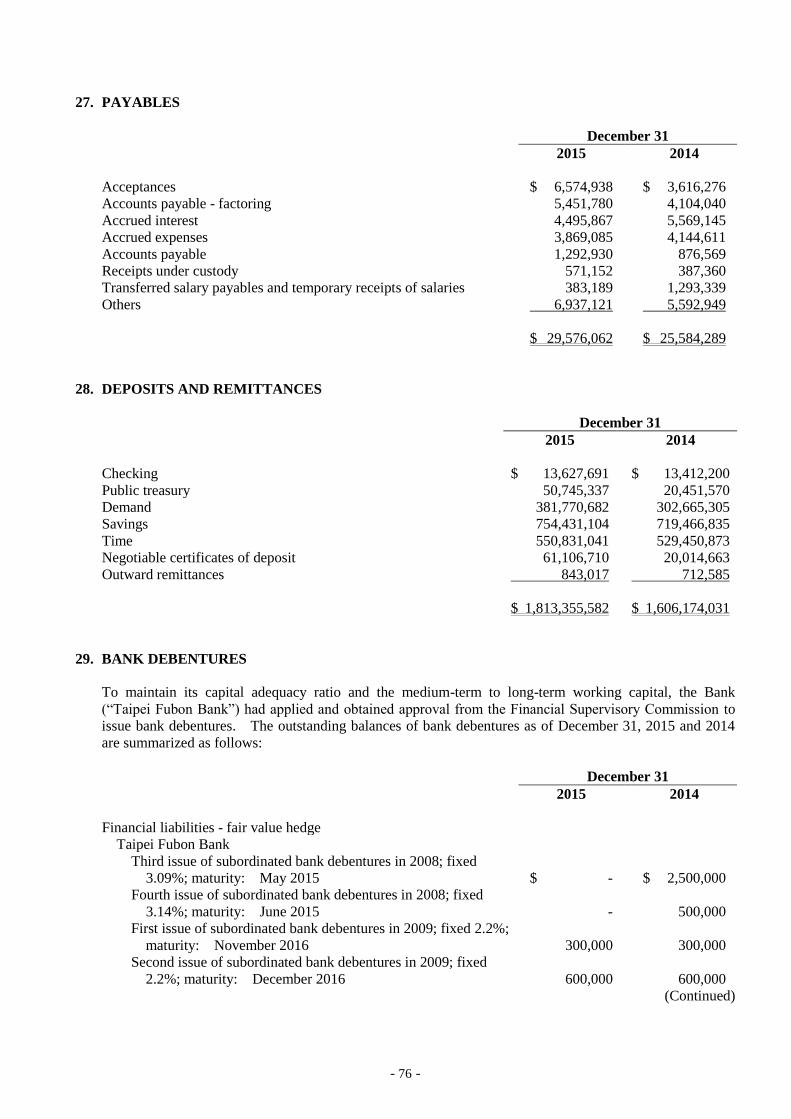
- 76 -
27. PAYABLES
December 31
2015 2014
Acceptances $ 6,574,938 $ 3,616,276
Accounts payable - factoring 5,451,780 4,104,040
Accrued interest 4,495,867 5,569,145
Accrued expenses 3,869,085 4,144,611
Accounts payable 1,292,930 876,569
Receipts under custody 571,152 387,360
Transferred salary payables and temporary receipts of salaries 383,189 1,293,339
Others 6,937,121 5,592,949
$ 29,576,062 $ 25,584,289
28. DEPOSITS AND REMITTANCES
December 31
2015 2014
Checking $ 13,627,691 $ 13,412,200
Public treasury 50,745,337 20,451,570
Demand 381,770,682 302,665,305
Savings 754,431,104 719,466,835
Time 550,831,041 529,450,873
Negotiable certificates of deposit 61,106,710 20,014,663
Outward remittances 843,017 712,585
$ 1,813,355,582 $ 1,606,174,031
29. BANK DEBENTURES
To maintain its capital adequacy ratio and the medium-term to long-term working capital, the Bank
(“Taipei Fubon Bank”) had applied and obtained approval from the Financial Supervisory Commission to
issue bank debentures. The outstanding balances of bank debentures as of December 31, 2015 and 2014
are summarized as follows:
December 31
2015 2014
Financial liabilities - fair value hedge
Taipei Fubon Bank
Third issue of subordinated bank debentures in 2008; fixed
3.09%; maturity: May 2015 $ - $ 2,500,000
Fourth issue of subordinated bank debentures in 2008; fixed
3.14%; maturity: June 2015 - 500,000
First issue of subordinated bank debentures in 2009; fixed 2.2%;
maturity: November 2016 300,000 300,000
Second issue of subordinated bank debentures in 2009; fixed
2.2%; maturity: December 2016 600,000 600,000
(Continued)
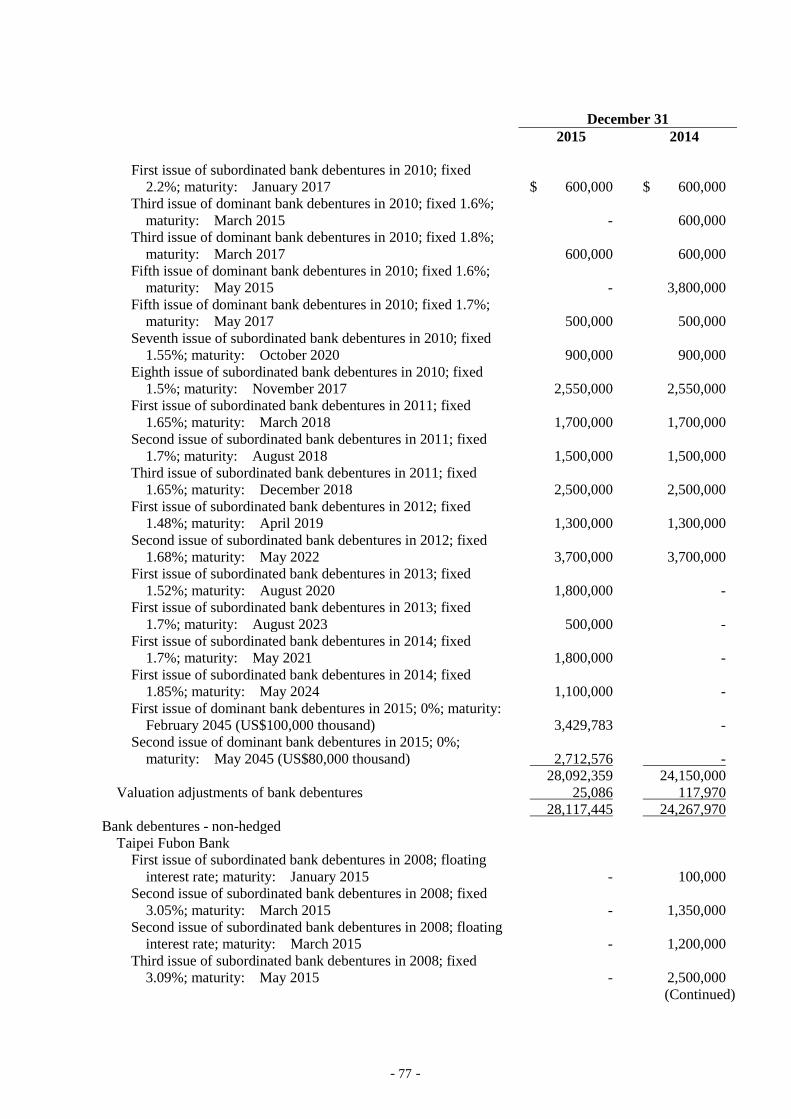
- 77 -
December 31
2015 2014
First issue of subordinated bank debentures in 2010; fixed
2.2%; maturity: January 2017 $ 600,000 $ 600,000
Third issue of dominant bank debentures in 2010; fixed 1.6%;
maturity: March 2015 - 600,000
Third issue of dominant bank debentures in 2010; fixed 1.8%;
maturity: March 2017 600,000 600,000
Fifth issue of dominant bank debentures in 2010; fixed 1.6%;
maturity: May 2015 - 3,800,000
Fifth issue of dominant bank debentures in 2010; fixed 1.7%;
maturity: May 2017 500,000 500,000
Seventh issue of subordinated bank debentures in 2010; fixed
1.55%; maturity: October 2020 900,000 900,000
Eighth issue of subordinated bank debentures in 2010; fixed
1.5%; maturity: November 2017 2,550,000 2,550,000
First issue of subordinated bank debentures in 2011; fixed
1.65%; maturity: March 2018 1,700,000 1,700,000
Second issue of subordinated bank debentures in 2011; fixed
1.7%; maturity: August 2018 1,500,000 1,500,000
Third issue of subordinated bank debentures in 2011; fixed
1.65%; maturity: December 2018 2,500,000 2,500,000
First issue of subordinated bank debentures in 2012; fixed
1.48%; maturity: April 2019 1,300,000 1,300,000
Second issue of subordinated bank debentures in 2012; fixed
1.68%; maturity: May 2022 3,700,000 3,700,000
First issue of subordinated bank debentures in 2013; fixed
1.52%; maturity: August 2020 1,800,000 -
First issue of subordinated bank debentures in 2013; fixed
1.7%; maturity: August 2023 500,000 -
First issue of subordinated bank debentures in 2014; fixed
1.7%; maturity: May 2021 1,800,000 -
First issue of subordinated bank debentures in 2014; fixed
1.85%; maturity: May 2024 1,100,000 -
First issue of dominant bank debentures in 2015; 0%; maturity:
February 2045 (US$100,000 thousand) 3,429,783 -
Second issue of dominant bank debentures in 2015; 0%;
maturity: May 2045 (US$80,000 thousand) 2,712,576 -
28,092,359 24,150,000
Valuation adjustments of bank debentures 25,086 117,970
28,117,445 24,267,970
Bank debentures - non-hedged
Taipei Fubon Bank
First issue of subordinated bank debentures in 2008; floating
interest rate; maturity: January 2015 - 100,000
Second issue of subordinated bank debentures in 2008; fixed
3.05%; maturity: March 2015 - 1,350,000
Second issue of subordinated bank debentures in 2008; floating
interest rate; maturity: March 2015 - 1,200,000
Third issue of subordinated bank debentures in 2008; fixed
3.09%; maturity: May 2015 - 2,500,000
(Continued)
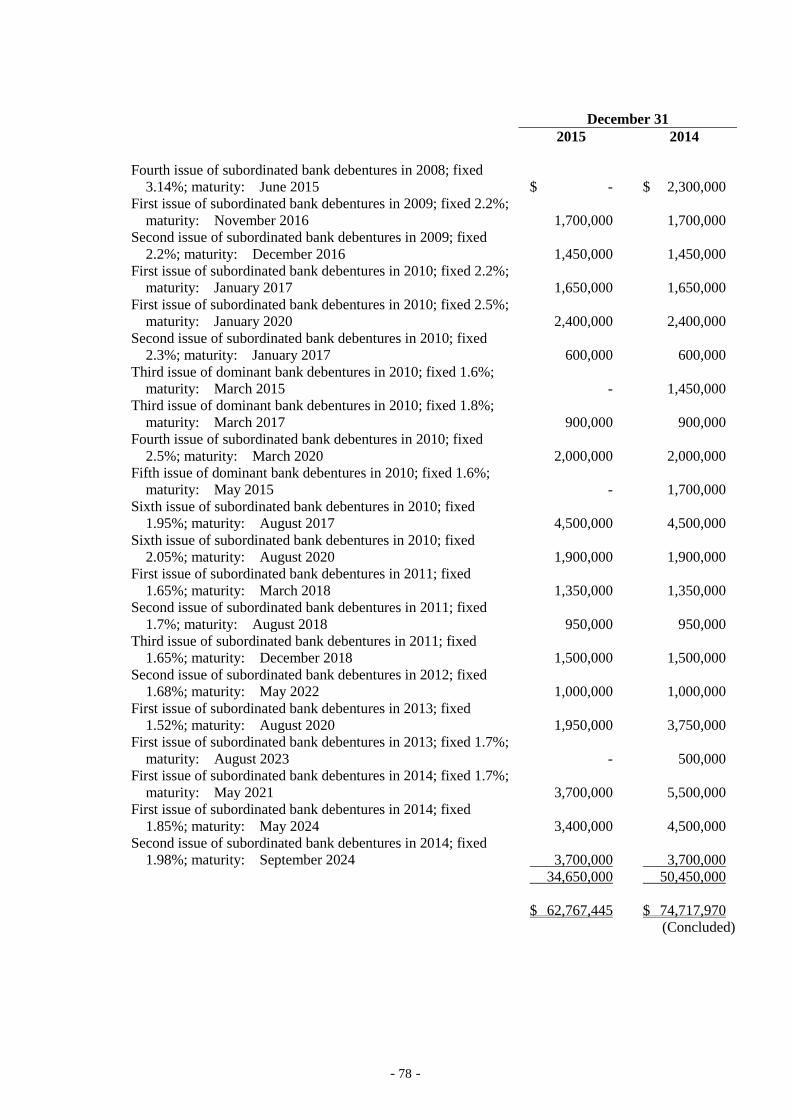
- 78 -
December 31
2015 2014
Fourth issue of subordinated bank debentures in 2008; fixed
3.14%; maturity: June 2015 $ - $ 2,300,000
First issue of subordinated bank debentures in 2009; fixed 2.2%;
maturity: November 2016 1,700,000 1,700,000
Second issue of subordinated bank debentures in 2009; fixed
2.2%; maturity: December 2016 1,450,000 1,450,000
First issue of subordinated bank debentures in 2010; fixed 2.2%;
maturity: January 2017 1,650,000 1,650,000
First issue of subordinated bank debentures in 2010; fixed 2.5%;
maturity: January 2020 2,400,000 2,400,000
Second issue of subordinated bank debentures in 2010; fixed
2.3%; maturity: January 2017 600,000 600,000
Third issue of dominant bank debentures in 2010; fixed 1.6%;
maturity: March 2015 - 1,450,000
Third issue of dominant bank debentures in 2010; fixed 1.8%;
maturity: March 2017 900,000 900,000
Fourth issue of subordinated bank debentures in 2010; fixed
2.5%; maturity: March 2020 2,000,000 2,000,000
Fifth issue of dominant bank debentures in 2010; fixed 1.6%;
maturity: May 2015 - 1,700,000
Sixth issue of subordinated bank debentures in 2010; fixed
1.95%; maturity: August 2017 4,500,000 4,500,000
Sixth issue of subordinated bank debentures in 2010; fixed
2.05%; maturity: August 2020 1,900,000 1,900,000
First issue of subordinated bank debentures in 2011; fixed
1.65%; maturity: March 2018 1,350,000 1,350,000
Second issue of subordinated bank debentures in 2011; fixed
1.7%; maturity: August 2018 950,000 950,000
Third issue of subordinated bank debentures in 2011; fixed
1.65%; maturity: December 2018 1,500,000 1,500,000
Second issue of subordinated bank debentures in 2012; fixed
1.68%; maturity: May 2022 1,000,000 1,000,000
First issue of subordinated bank debentures in 2013; fixed
1.52%; maturity: August 2020 1,950,000 3,750,000
First issue of subordinated bank debentures in 2013; fixed 1.7%;
maturity: August 2023 - 500,000
First issue of subordinated bank debentures in 2014; fixed 1.7%;
maturity: May 2021 3,700,000 5,500,000
First issue of subordinated bank debentures in 2014; fixed
1.85%; maturity: May 2024 3,400,000 4,500,000
Second issue of subordinated bank debentures in 2014; fixed
1.98%; maturity: September 2024 3,700,000 3,700,000
34,650,000 50,450,000
$ 62,767,445 $ 74,717,970
(Concluded)
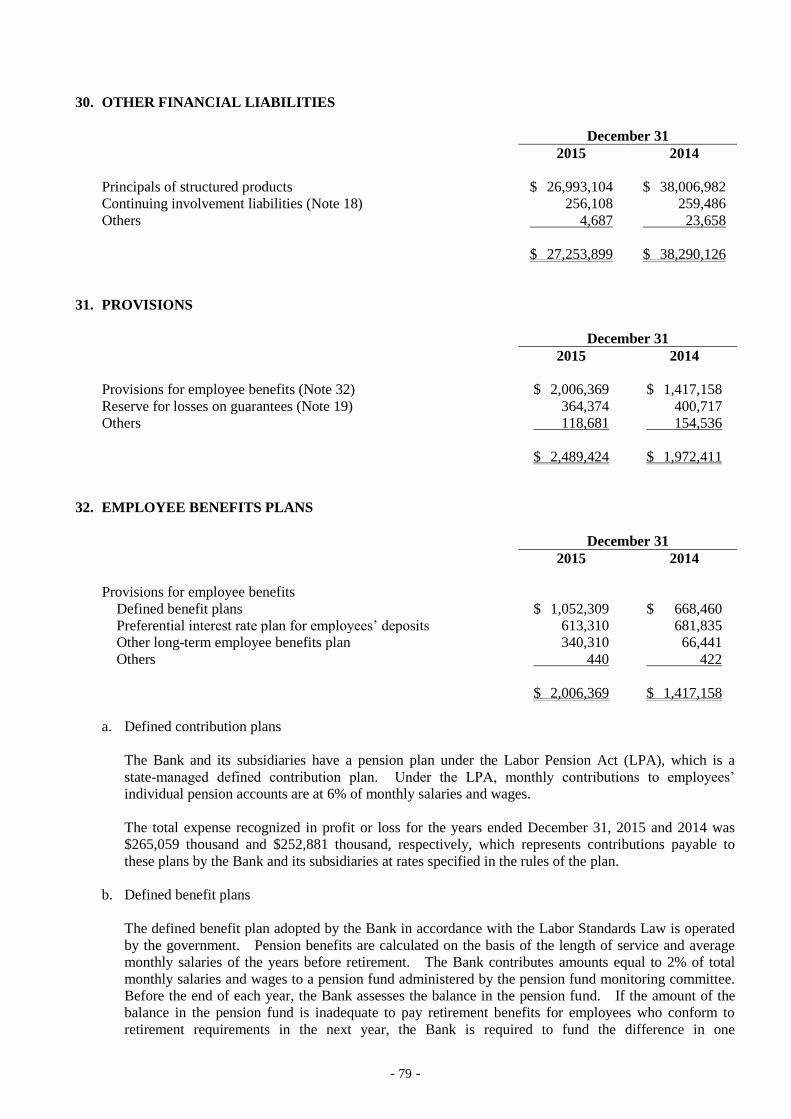
- 79 -
30. OTHER FINANCIAL LIABILITIES
December 31
2015 2014
Principals of structured products $ 26,993,104 $ 38,006,982
Continuing involvement liabilities (Note 18) 256,108 259,486
Others 4,687 23,658
$ 27,253,899 $ 38,290,126
31. PROVISIONS
December 31
2015 2014
Provisions for employee benefits (Note 32) $ 2,006,369 $ 1,417,158
Reserve for losses on guarantees (Note 19) 364,374 400,717
Others 118,681 154,536
$ 2,489,424 $ 1,972,411
32. EMPLOYEE BENEFITS PLANS
December 31
2015 2014
Provisions for employee benefits
Defined benefit plans $ 1,052,309 $ 668,460
Preferential interest rate plan for employees’ deposits 613,310 681,835
Other long-term employee benefits plan 340,310 66,441
Others 440 422
$ 2,006,369 $ 1,417,158
a. Defined contribution plans
The Bank and its subsidiaries have a pension plan under the Labor Pension Act (LPA), which is a
state-managed defined contribution plan. Under the LPA, monthly contributions to employees’
individual pension accounts are at 6% of monthly salaries and wages.
The total expense recognized in profit or loss for the years ended December 31, 2015 and 2014 was
$265,059 thousand and $252,881 thousand, respectively, which represents contributions payable to
these plans by the Bank and its subsidiaries at rates specified in the rules of the plan.
b. Defined benefit plans
The defined benefit plan adopted by the Bank in accordance with the Labor Standards Law is operated
by the government. Pension benefits are calculated on the basis of the length of service and average
monthly salaries of the years before retirement. The Bank contributes amounts equal to 2% of total
monthly salaries and wages to a pension fund administered by the pension fund monitoring committee.
Before the end of each year, the Bank assesses the balance in the pension fund. If the amount of the
balance in the pension fund is inadequate to pay retirement benefits for employees who conform to
retirement requirements in the next year, the Bank is required to fund the difference in one
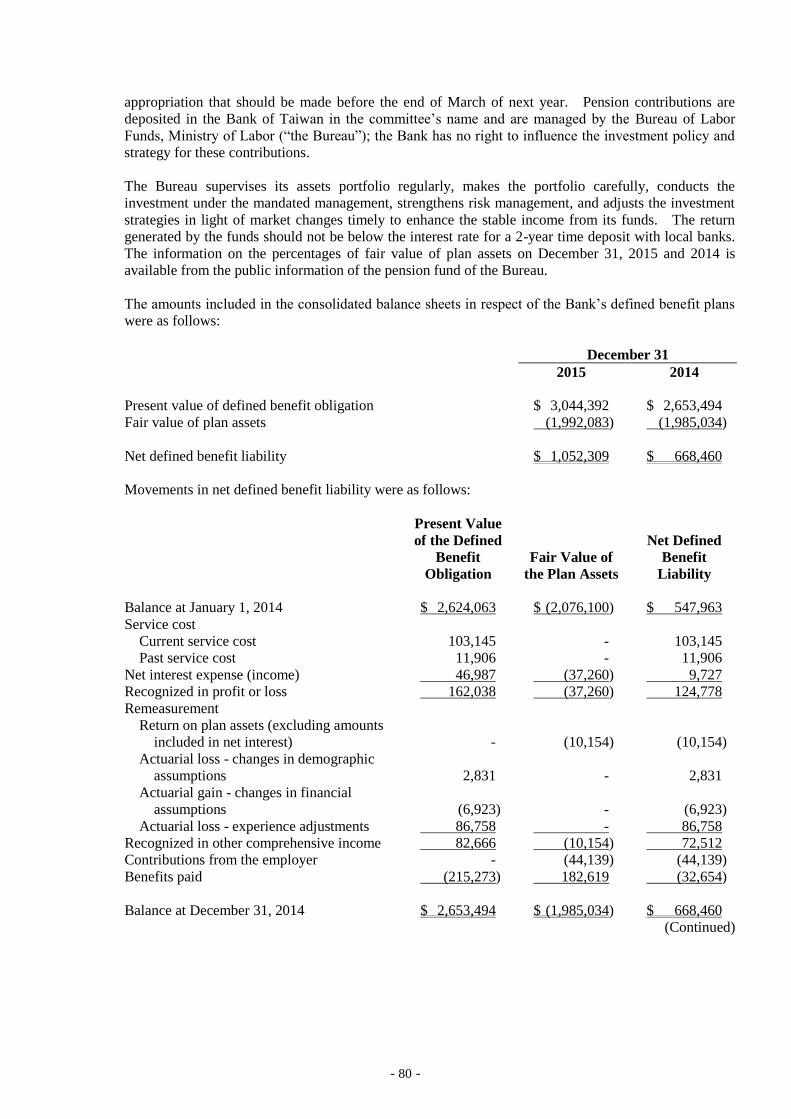
- 80 -
appropriation that should be made before the end of March of next year. Pension contributions are
deposited in the Bank of Taiwan in the committee’s name and are managed by the Bureau of Labor
Funds, Ministry of Labor (“the Bureau”); the Bank has no right to influence the investment policy and
strategy for these contributions.
The Bureau supervises its assets portfolio regularly, makes the portfolio carefully, conducts the
investment under the mandated management, strengthens risk management, and adjusts the investment
strategies in light of market changes timely to enhance the stable income from its funds. The return
generated by the funds should not be below the interest rate for a 2-year time deposit with local banks.
The information on the percentages of fair value of plan assets on December 31, 2015 and 2014 is
available from the public information of the pension fund of the Bureau.
The amounts included in the consolidated balance sheets in respect of the Bank’s defined benefit plans
were as follows:
December 31
2015 2014
Present value of defined benefit obligation $ 3,044,392 $ 2,653,494
Fair value of plan assets (1,992,083) (1,985,034)
Net defined benefit liability $ 1,052,309 $ 668,460
Movements in net defined benefit liability were as follows:
Present Value
of the Defined
Benefit
Obligation
Fair Value of
the Plan Assets
Net Defined
Benefit
Liability
Balance at January 1, 2014 $ 2,624,063 $ (2,076,100) $ 547,963
Service cost
Current service cost 103,145 - 103,145
Past service cost 11,906 - 11,906
Net interest expense (income) 46,987 (37,260) 9,727
Recognized in profit or loss 162,038 (37,260) 124,778
Remeasurement
Return on plan assets (excluding amounts
included in net interest) - (10,154) (10,154)
Actuarial loss - changes in demographic
assumptions 2,831 - 2,831
Actuarial gain - changes in financial
assumptions (6,923) - (6,923)
Actuarial loss - experience adjustments 86,758 - 86,758
Recognized in other comprehensive income 82,666 (10,154) 72,512
Contributions from the employer - (44,139) (44,139)
Benefits paid (215,273) 182,619 (32,654)
Balance at December 31, 2014 $ 2,653,494 $ (1,985,034) $ 668,460
(Continued)
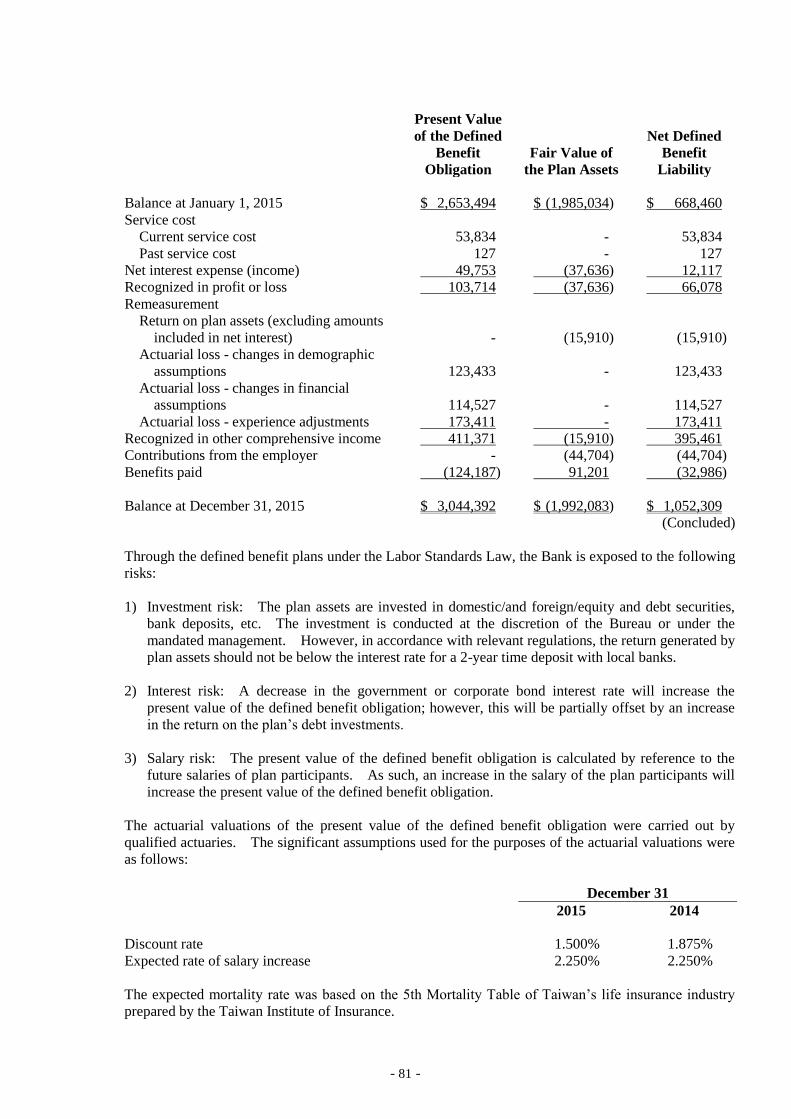
- 81 -
Present Value
of the Defined
Benefit
Obligation
Fair Value of
the Plan Assets
Net Defined
Benefit
Liability
Balance at January 1, 2015 $ 2,653,494 $ (1,985,034) $ 668,460
Service cost
Current service cost 53,834 - 53,834
Past service cost 127 - 127
Net interest expense (income) 49,753 (37,636) 12,117
Recognized in profit or loss 103,714 (37,636) 66,078
Remeasurement
Return on plan assets (excluding amounts
included in net interest) - (15,910) (15,910)
Actuarial loss - changes in demographic
assumptions 123,433 - 123,433
Actuarial loss - changes in financial
assumptions 114,527 - 114,527
Actuarial loss - experience adjustments 173,411 - 173,411
Recognized in other comprehensive income 411,371 (15,910) 395,461
Contributions from the employer - (44,704) (44,704)
Benefits paid (124,187) 91,201 (32,986)
Balance at December 31, 2015 $ 3,044,392 $ (1,992,083) $ 1,052,309
(Concluded)
Through the defined benefit plans under the Labor Standards Law, the Bank is exposed to the following
risks:
1) Investment risk: The plan assets are invested in domestic/and foreign/equity and debt securities,
bank deposits, etc. The investment is conducted at the discretion of the Bureau or under the
mandated management. However, in accordance with relevant regulations, the return generated by
plan assets should not be below the interest rate for a 2-year time deposit with local banks.
2) Interest risk: A decrease in the government or corporate bond interest rate will increase the
present value of the defined benefit obligation; however, this will be partially offset by an increase
in the return on the plan’s debt investments.
3) Salary risk: The present value of the defined benefit obligation is calculated by reference to the
future salaries of plan participants. As such, an increase in the salary of the plan participants will
increase the present value of the defined benefit obligation.
The actuarial valuations of the present value of the defined benefit obligation were carried out by
qualified actuaries. The significant assumptions used for the purposes of the actuarial valuations were
as follows:
December 31
2015 2014
Discount rate 1.500% 1.875%
Expected rate of salary increase 2.250% 2.250%
The expected mortality rate was based on the 5th Mortality Table of Taiwan’s life insurance industry
prepared by the Taiwan Institute of Insurance.
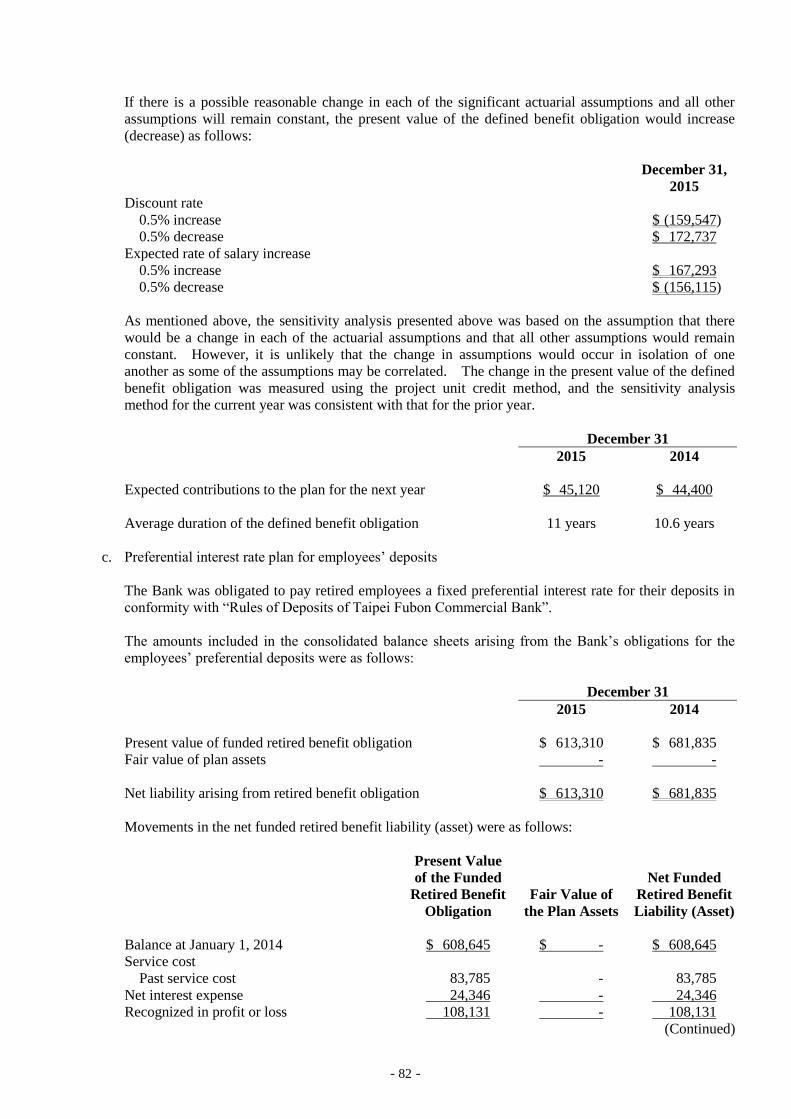
- 82 -
If there is a possible reasonable change in each of the significant actuarial assumptions and all other
assumptions will remain constant, the present value of the defined benefit obligation would increase
(decrease) as follows:
December 31,
2015
Discount rate
0.5% increase $ (159,547)
0.5% decrease $ 172,737
Expected rate of salary increase
0.5% increase $ 167,293
0.5% decrease $ (156,115)
As mentioned above, the sensitivity analysis presented above was based on the assumption that there
would be a change in each of the actuarial assumptions and that all other assumptions would remain
constant. However, it is unlikely that the change in assumptions would occur in isolation of one
another as some of the assumptions may be correlated. The change in the present value of the defined
benefit obligation was measured using the project unit credit method, and the sensitivity analysis
method for the current year was consistent with that for the prior year.
December 31
2015 2014
Expected contributions to the plan for the next year $ 45,120 $ 44,400
Average duration of the defined benefit obligation 11 years 10.6 years
c. Preferential interest rate plan for employees’ deposits
The Bank was obligated to pay retired employees a fixed preferential interest rate for their deposits in
conformity with “Rules of Deposits of Taipei Fubon Commercial Bank”.
The amounts included in the consolidated balance sheets arising from the Bank’s obligations for the
employees’ preferential deposits were as follows:
December 31
2015 2014
Present value of funded retired benefit obligation $ 613,310 $ 681,835
Fair value of plan assets - -
Net liability arising from retired benefit obligation $ 613,310 $ 681,835
Movements in the net funded retired benefit liability (asset) were as follows:
Present Value
of the Funded
Retired Benefit
Obligation
Fair Value of
the Plan Assets
Net Funded
Retired Benefit
Liability (Asset)
Balance at January 1, 2014 $ 608,645 $ - $ 608,645
Service cost
Past service cost 83,785 - 83,785
Net interest expense 24,346 - 24,346
Recognized in profit or loss 108,131 - 108,131
(Continued)
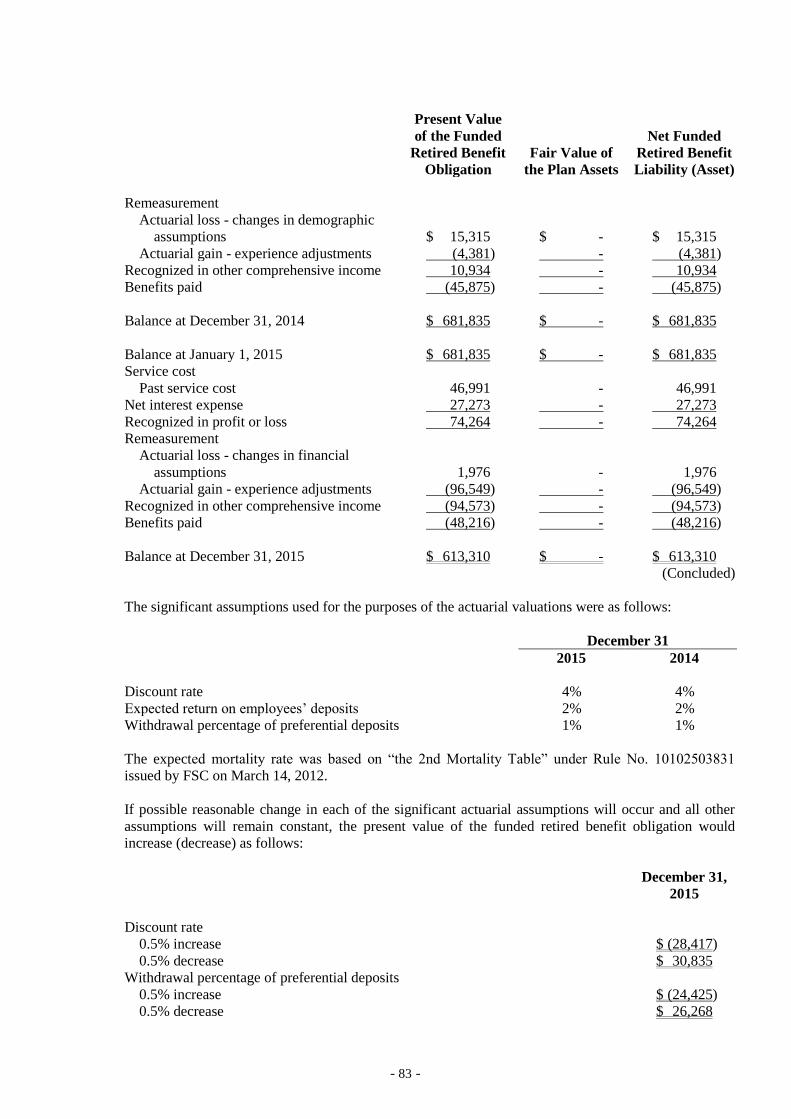
- 83 -
Present Value
of the Funded
Retired Benefit
Obligation
Fair Value of
the Plan Assets
Net Funded
Retired Benefit
Liability (Asset)
Remeasurement
Actuarial loss - changes in demographic
assumptions $ 15,315 $ - $ 15,315
Actuarial gain - experience adjustments (4,381) - (4,381)
Recognized in other comprehensive income 10,934 - 10,934
Benefits paid (45,875) - (45,875)
Balance at December 31, 2014 $ 681,835 $ - $ 681,835
Balance at January 1, 2015 $ 681,835 $ - $ 681,835
Service cost
Past service cost 46,991 - 46,991
Net interest expense 27,273 - 27,273
Recognized in profit or loss 74,264 - 74,264
Remeasurement
Actuarial loss - changes in financial
assumptions 1,976 - 1,976
Actuarial gain - experience adjustments (96,549) - (96,549)
Recognized in other comprehensive income (94,573) - (94,573)
Benefits paid (48,216) - (48,216)
Balance at December 31, 2015 $ 613,310 $ - $ 613,310
(Concluded)
The significant assumptions used for the purposes of the actuarial valuations were as follows:
December 31
2015 2014
Discount rate 4% 4%
Expected return on employees’ deposits 2% 2%
Withdrawal percentage of preferential deposits 1% 1%
The expected mortality rate was based on “the 2nd Mortality Table” under Rule No. 10102503831
issued by FSC on March 14, 2012.
If possible reasonable change in each of the significant actuarial assumptions will occur and all other
assumptions will remain constant, the present value of the funded retired benefit obligation would
increase (decrease) as follows:
December 31,
2015
Discount rate
0.5% increase $ (28,417)
0.5% decrease $ 30,835
Withdrawal percentage of preferential deposits
0.5% increase $ (24,425)
0.5% decrease $ 26,268
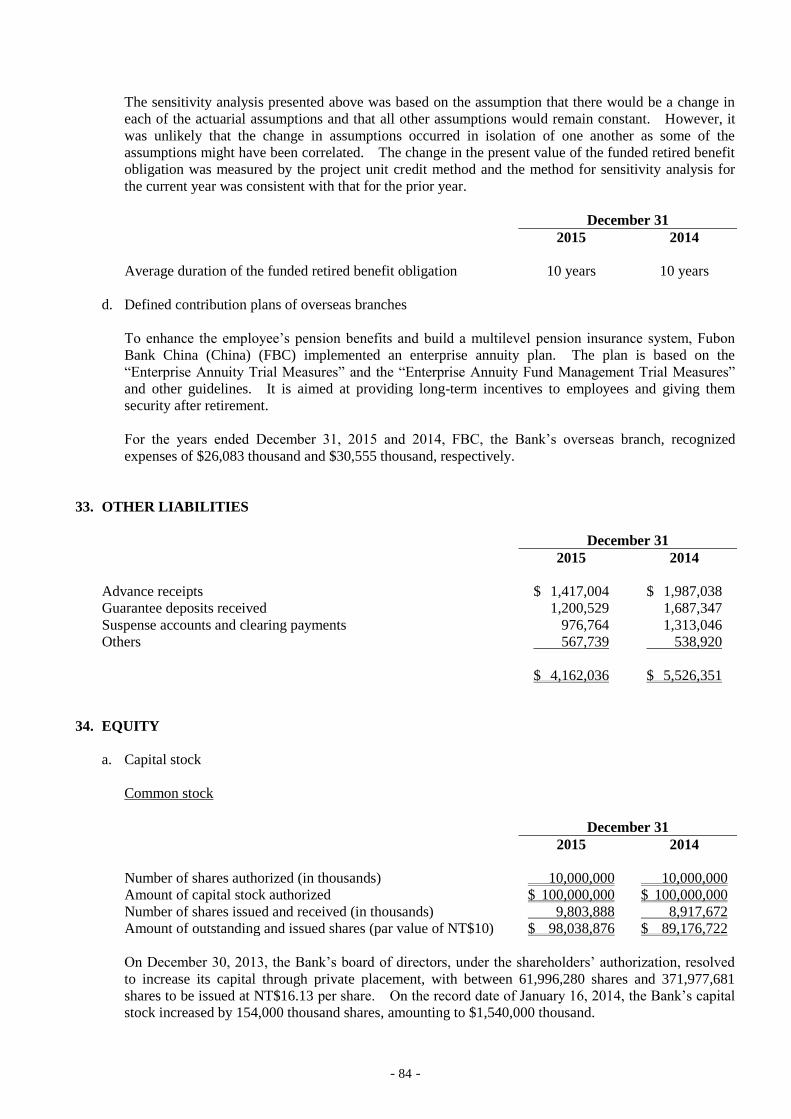
- 84 -
The sensitivity analysis presented above was based on the assumption that there would be a change in
each of the actuarial assumptions and that all other assumptions would remain constant. However, it
was unlikely that the change in assumptions occurred in isolation of one another as some of the
assumptions might have been correlated. The change in the present value of the funded retired benefit
obligation was measured by the project unit credit method and the method for sensitivity analysis for
the current year was consistent with that for the prior year.
December 31
2015 2014
Average duration of the funded retired benefit obligation 10 years 10 years
d. Defined contribution plans of overseas branches
To enhance the employee’s pension benefits and build a multilevel pension insurance system, Fubon
Bank China (China) (FBC) implemented an enterprise annuity plan. The plan is based on the
“Enterprise Annuity Trial Measures” and the “Enterprise Annuity Fund Management Trial Measures”
and other guidelines. It is aimed at providing long-term incentives to employees and giving them
security after retirement.
For the years ended December 31, 2015 and 2014, FBC, the Bank’s overseas branch, recognized
expenses of $26,083 thousand and $30,555 thousand, respectively.
33. OTHER LIABILITIES
December 31
2015 2014
Advance receipts $ 1,417,004 $ 1,987,038
Guarantee deposits received 1,200,529 1,687,347
Suspense accounts and clearing payments 976,764 1,313,046
Others 567,739 538,920
$ 4,162,036 $ 5,526,351
34. EQUITY
a. Capital stock
Common stock
December 31
2015 2014
Number of shares authorized (in thousands) 10,000,000 10,000,000
Amount of capital stock authorized $ 100,000,000 $ 100,000,000
Number of shares issued and received (in thousands) 9,803,888 8,917,672
Amount of outstanding and issued shares (par value of NT$10) $ 98,038,876 $ 89,176,722
On December 30, 2013, the Bank’s board of directors, under the shareholders’ authorization, resolved
to increase its capital through private placement, with between 61,996,280 shares and 371,977,681
shares to be issued at NT$16.13 per share. On the record date of January 16, 2014, the Bank’s capital
stock increased by 154,000 thousand shares, amounting to $1,540,000 thousand.
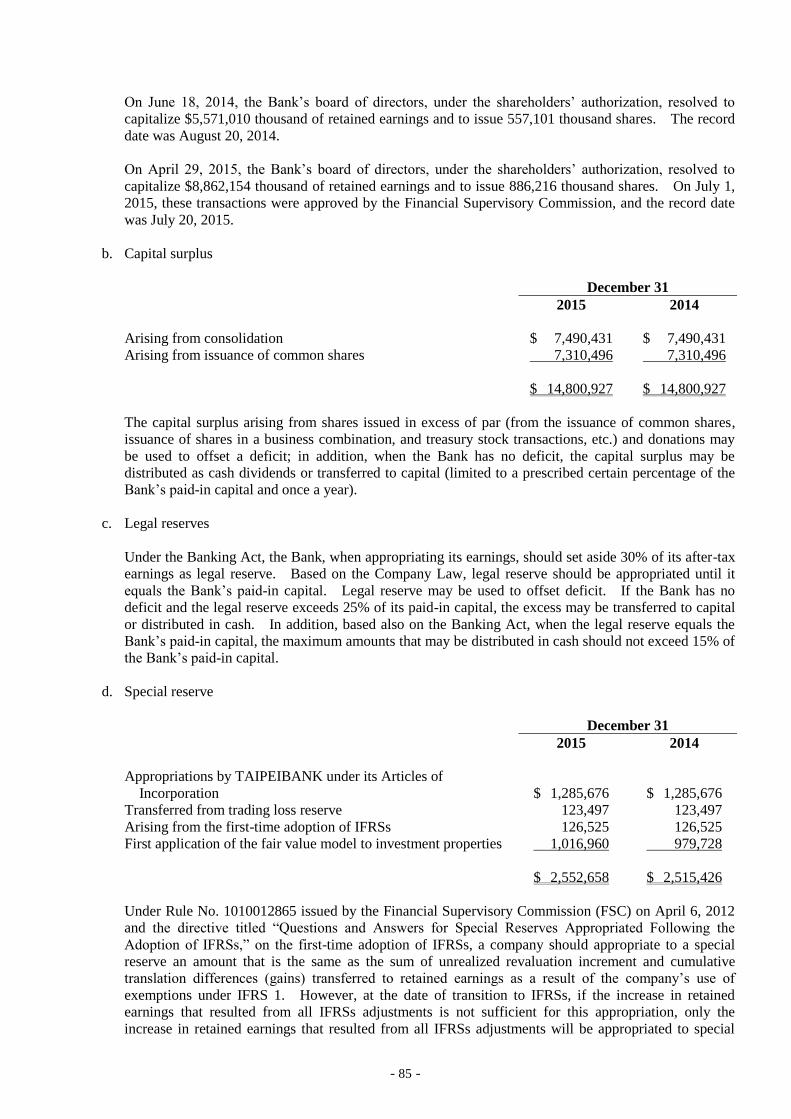
- 85 -
On June 18, 2014, the Bank’s board of directors, under the shareholders’ authorization, resolved to
capitalize $5,571,010 thousand of retained earnings and to issue 557,101 thousand shares. The record
date was August 20, 2014.
On April 29, 2015, the Bank’s board of directors, under the shareholders’ authorization, resolved to
capitalize $8,862,154 thousand of retained earnings and to issue 886,216 thousand shares. On July 1,
2015, these transactions were approved by the Financial Supervisory Commission, and the record date
was July 20, 2015.
b. Capital surplus
December 31
2015 2014
Arising from consolidation $ 7,490,431 $ 7,490,431
Arising from issuance of common shares 7,310,496 7,310,496
$ 14,800,927 $ 14,800,927
The capital surplus arising from shares issued in excess of par (from the issuance of common shares,
issuance of shares in a business combination, and treasury stock transactions, etc.) and donations may
be used to offset a deficit; in addition, when the Bank has no deficit, the capital surplus may be
distributed as cash dividends or transferred to capital (limited to a prescribed certain percentage of the
Bank’s paid-in capital and once a year).
c. Legal reserves
Under the Banking Act, the Bank, when appropriating its earnings, should set aside 30% of its after-tax
earnings as legal reserve. Based on the Company Law, legal reserve should be appropriated until it
equals the Bank’s paid-in capital. Legal reserve may be used to offset deficit. If the Bank has no
deficit and the legal reserve exceeds 25% of its paid-in capital, the excess may be transferred to capital
or distributed in cash. In addition, based also on the Banking Act, when the legal reserve equals the
Bank’s paid-in capital, the maximum amounts that may be distributed in cash should not exceed 15% of
the Bank’s paid-in capital.
d. Special reserve
December 31
2015 2014
Appropriations by TAIPEIBANK under its Articles of
Incorporation $ 1,285,676 $ 1,285,676
Transferred from trading loss reserve 123,497 123,497
Arising from the first-time adoption of IFRSs 126,525 126,525
First application of the fair value model to investment properties 1,016,960 979,728
$ 2,552,658 $ 2,515,426
Under Rule No. 1010012865 issued by the Financial Supervisory Commission (FSC) on April 6, 2012
and the directive titled “Questions and Answers for Special Reserves Appropriated Following the
Adoption of IFRSs,” on the first-time adoption of IFRSs, a company should appropriate to a special
reserve an amount that is the same as the sum of unrealized revaluation increment and cumulative
translation differences (gains) transferred to retained earnings as a result of the company’s use of
exemptions under IFRS 1. However, at the date of transition to IFRSs, if the increase in retained
earnings that resulted from all IFRSs adjustments is not sufficient for this appropriation, only the
increase in retained earnings that resulted from all IFRSs adjustments will be appropriated to special
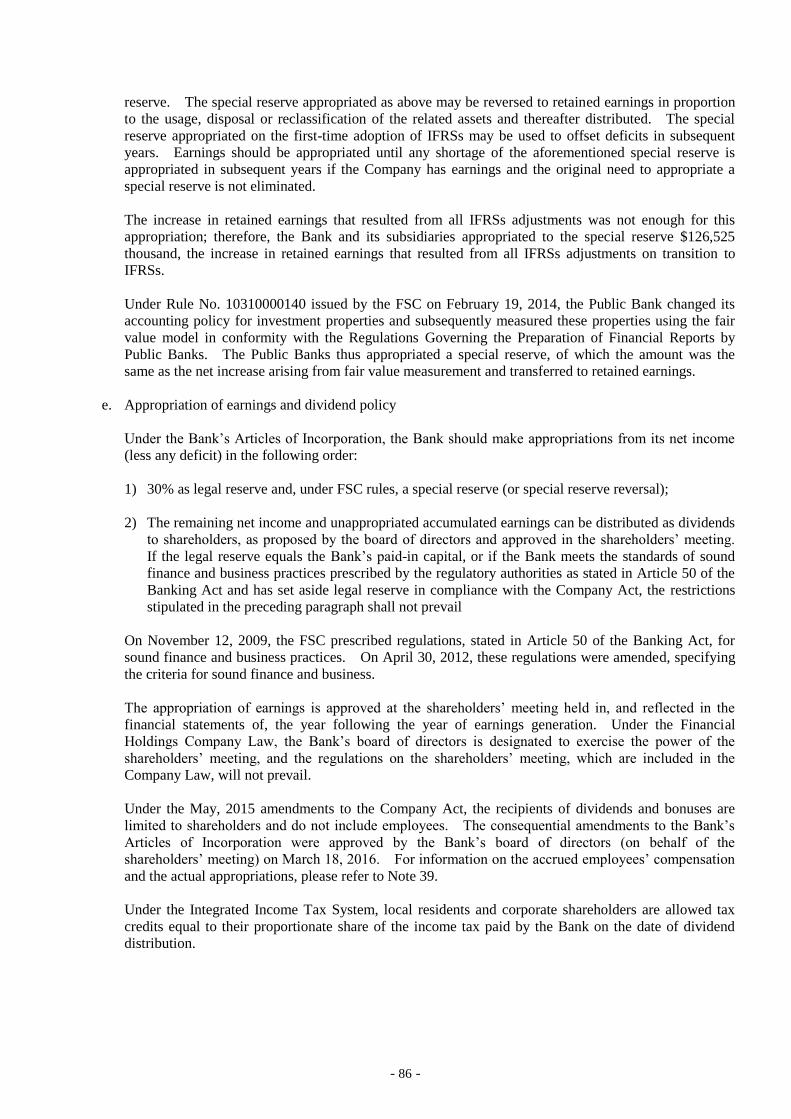
- 86 -
reserve. The special reserve appropriated as above may be reversed to retained earnings in proportion
to the usage, disposal or reclassification of the related assets and thereafter distributed. The special
reserve appropriated on the first-time adoption of IFRSs may be used to offset deficits in subsequent
years. Earnings should be appropriated until any shortage of the aforementioned special reserve is
appropriated in subsequent years if the Company has earnings and the original need to appropriate a
special reserve is not eliminated.
The increase in retained earnings that resulted from all IFRSs adjustments was not enough for this
appropriation; therefore, the Bank and its subsidiaries appropriated to the special reserve $126,525
thousand, the increase in retained earnings that resulted from all IFRSs adjustments on transition to
IFRSs.
Under Rule No. 10310000140 issued by the FSC on February 19, 2014, the Public Bank changed its
accounting policy for investment properties and subsequently measured these properties using the fair
value model in conformity with the Regulations Governing the Preparation of Financial Reports by
Public Banks. The Public Banks thus appropriated a special reserve, of which the amount was the
same as the net increase arising from fair value measurement and transferred to retained earnings.
e. Appropriation of earnings and dividend policy
Under the Bank’s Articles of Incorporation, the Bank should make appropriations from its net income
(less any deficit) in the following order:
1) 30% as legal reserve and, under FSC rules, a special reserve (or special reserve reversal);
2) The remaining net income and unappropriated accumulated earnings can be distributed as dividends
to shareholders, as proposed by the board of directors and approved in the shareholders’ meeting.
If the legal reserve equals the Bank’s paid-in capital, or if the Bank meets the standards of sound
finance and business practices prescribed by the regulatory authorities as stated in Article 50 of the
Banking Act and has set aside legal reserve in compliance with the Company Act, the restrictions
stipulated in the preceding paragraph shall not prevail
On November 12, 2009, the FSC prescribed regulations, stated in Article 50 of the Banking Act, for
sound finance and business practices. On April 30, 2012, these regulations were amended, specifying
the criteria for sound finance and business.
The appropriation of earnings is approved at the shareholders’ meeting held in, and reflected in the
financial statements of, the year following the year of earnings generation. Under the Financial
Holdings Company Law, the Bank’s board of directors is designated to exercise the power of the
shareholders’ meeting, and the regulations on the shareholders’ meeting, which are included in the
Company Law, will not prevail.
Under the May, 2015 amendments to the Company Act, the recipients of dividends and bonuses are
limited to shareholders and do not include employees. The consequential amendments to the Bank’s
Articles of Incorporation were approved by the Bank’s board of directors (on behalf of the
shareholders’ meeting) on March 18, 2016. For information on the accrued employees’ compensation
and the actual appropriations, please refer to Note 39.
Under the Integrated Income Tax System, local residents and corporate shareholders are allowed tax
credits equal to their proportionate share of the income tax paid by the Bank on the date of dividend
distribution.
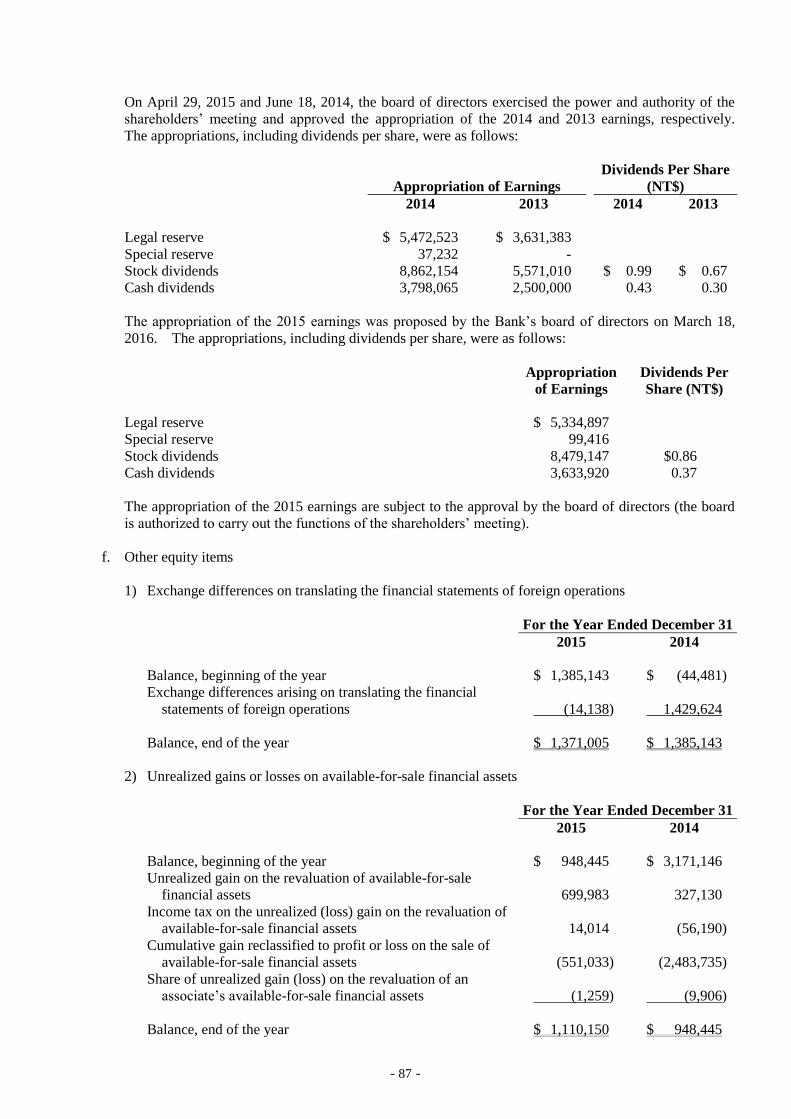
- 87 -
On April 29, 2015 and June 18, 2014, the board of directors exercised the power and authority of the
shareholders’ meeting and approved the appropriation of the 2014 and 2013 earnings, respectively.
The appropriations, including dividends per share, were as follows:
Appropriation of Earnings
Dividends Per Share
(NT$)
2014 2013 2014 2013
Legal reserve $ 5,472,523 $ 3,631,383
Special reserve 37,232 -
Stock dividends 8,862,154 5,571,010 $ 0.99 $ 0.67
Cash dividends 3,798,065 2,500,000 0.43 0.30
The appropriation of the 2015 earnings was proposed by the Bank’s board of directors on March 18,
2016. The appropriations, including dividends per share, were as follows:
Appropriation
of Earnings
Dividends Per
Share (NT$)
Legal reserve $ 5,334,897
Special reserve 99,416
Stock dividends 8,479,147 $0.86
Cash dividends 3,633,920 0.37
The appropriation of the 2015 earnings are subject to the approval by the board of directors (the board
is authorized to carry out the functions of the shareholders’ meeting).
f. Other equity items
1) Exchange differences on translating the financial statements of foreign operations
For the Year Ended December 31
2015 2014
Balance, beginning of the year $ 1,385,143 $ (44,481)
Exchange differences arising on translating the financial
statements of foreign operations (14,138) 1,429,624
Balance, end of the year $ 1,371,005 $ 1,385,143
2) Unrealized gains or losses on available-for-sale financial assets
For the Year Ended December 31
2015 2014
Balance, beginning of the year $ 948,445 $ 3,171,146
Unrealized gain on the revaluation of available-for-sale
financial assets 699,983 327,130
Income tax on the unrealized (loss) gain on the revaluation of
available-for-sale financial assets 14,014 (56,190)
Cumulative gain reclassified to profit or loss on the sale of
available-for-sale financial assets (551,033) (2,483,735)
Share of unrealized gain (loss) on the revaluation of an
associate’s available-for-sale financial assets (1,259) (9,906)
Balance, end of the year $ 1,110,150 $ 948,445
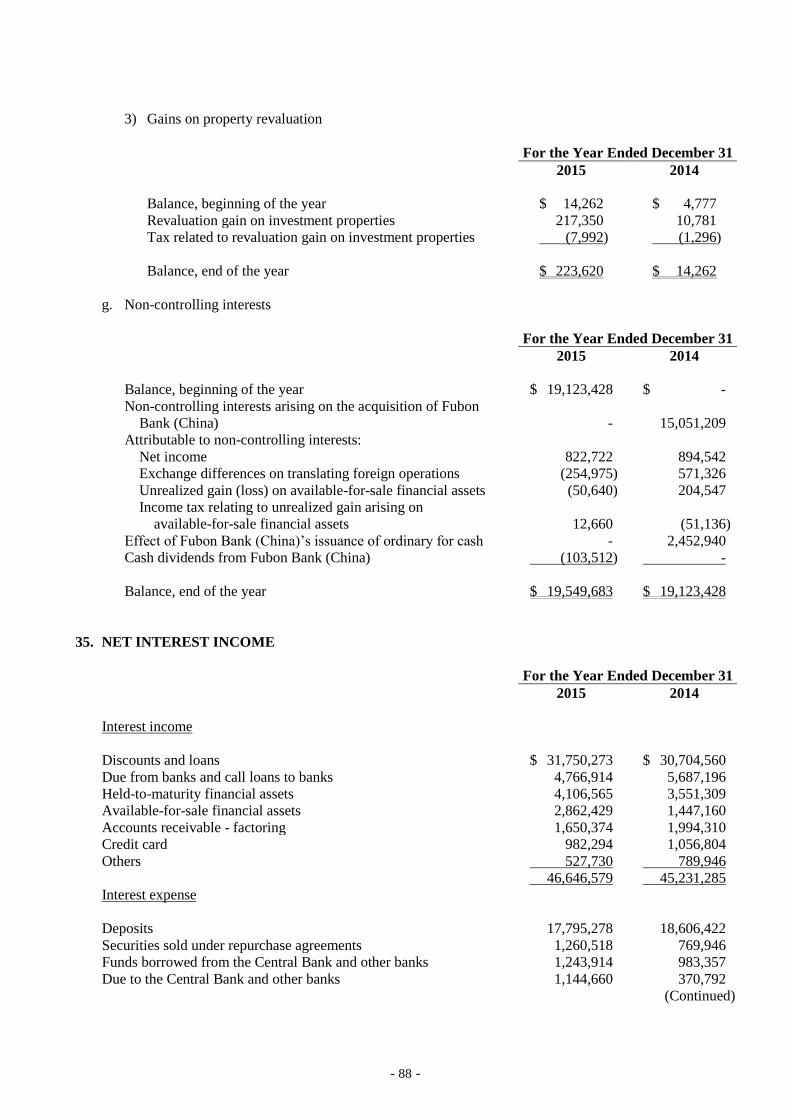
- 88 -
3) Gains on property revaluation
For the Year Ended December 31
2015 2014
Balance, beginning of the year $ 14,262 $ 4,777
Revaluation gain on investment properties 217,350 10,781
Tax related to revaluation gain on investment properties (7,992) (1,296)
Balance, end of the year $ 223,620 $ 14,262
g. Non-controlling interests
For the Year Ended December 31
2015 2014
Balance, beginning of the year $ 19,123,428 $ -
Non-controlling interests arising on the acquisition of Fubon
Bank (China) - 15,051,209
Attributable to non-controlling interests:
Net income 822,722 894,542
Exchange differences on translating foreign operations (254,975) 571,326
Unrealized gain (loss) on available-for-sale financial assets (50,640) 204,547
Income tax relating to unrealized gain arising on
available-for-sale financial assets 12,660 (51,136)
Effect of Fubon Bank (China)’s issuance of ordinary for cash - 2,452,940
Cash dividends from Fubon Bank (China) (103,512) -
Balance, end of the year $ 19,549,683 $ 19,123,428
35. NET INTEREST INCOME
For the Year Ended December 31
2015 2014
Interest income
Discounts and loans $ 31,750,273 $ 30,704,560
Due from banks and call loans to banks 4,766,914 5,687,196
Held-to-maturity financial assets 4,106,565 3,551,309
Available-for-sale financial assets 2,862,429 1,447,160
Accounts receivable - factoring 1,650,374 1,994,310
Credit card 982,294 1,056,804
Others 527,730 789,946
46,646,579 45,231,285
Interest expense
Deposits 17,795,278 18,606,422
Securities sold under repurchase agreements 1,260,518 769,946
Funds borrowed from the Central Bank and other banks 1,243,914 983,357
Due to the Central Bank and other banks 1,144,660 370,792
(Continued)
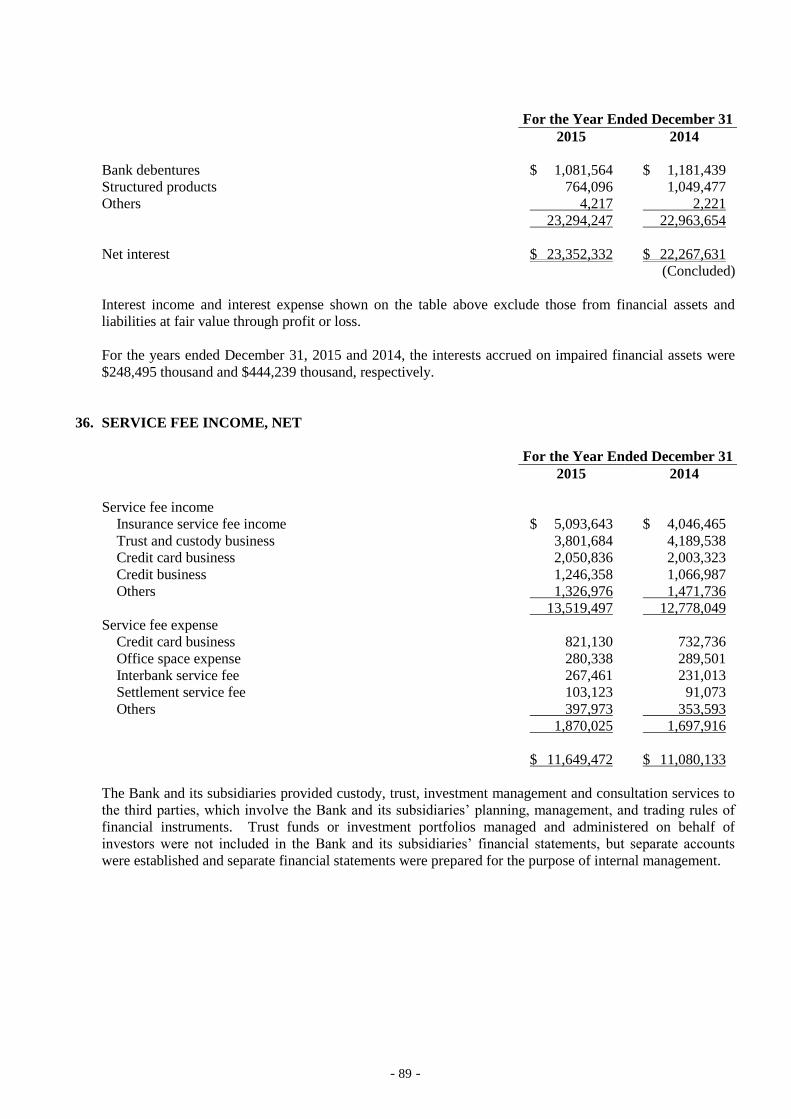
- 89 -
For the Year Ended December 31
2015 2014
Bank debentures $ 1,081,564 $ 1,181,439
Structured products 764,096 1,049,477
Others 4,217 2,221
23,294,247 22,963,654
Net interest $ 23,352,332 $ 22,267,631
(Concluded)
Interest income and interest expense shown on the table above exclude those from financial assets and
liabilities at fair value through profit or loss.
For the years ended December 31, 2015 and 2014, the interests accrued on impaired financial assets were
$248,495 thousand and $444,239 thousand, respectively.
36. SERVICE FEE INCOME, NET
For the Year Ended December 31
2015 2014
Service fee income
Insurance service fee income $ 5,093,643 $ 4,046,465
Trust and custody business 3,801,684 4,189,538
Credit card business 2,050,836 2,003,323
Credit business 1,246,358 1,066,987
Others 1,326,976 1,471,736
13,519,497 12,778,049
Service fee expense
Credit card business 821,130 732,736
Office space expense 280,338 289,501
Interbank service fee 267,461 231,013
Settlement service fee 103,123 91,073
Others 397,973 353,593
1,870,025 1,697,916
$ 11,649,472 $ 11,080,133
The Bank and its subsidiaries provided custody, trust, investment management and consultation services to
the third parties, which involve the Bank and its subsidiaries’ planning, management, and trading rules of
financial instruments. Trust funds or investment portfolios managed and administered on behalf of
investors were not included in the Bank and its subsidiaries’ financial statements, but separate accounts
were established and separate financial statements were prepared for the purpose of internal management.
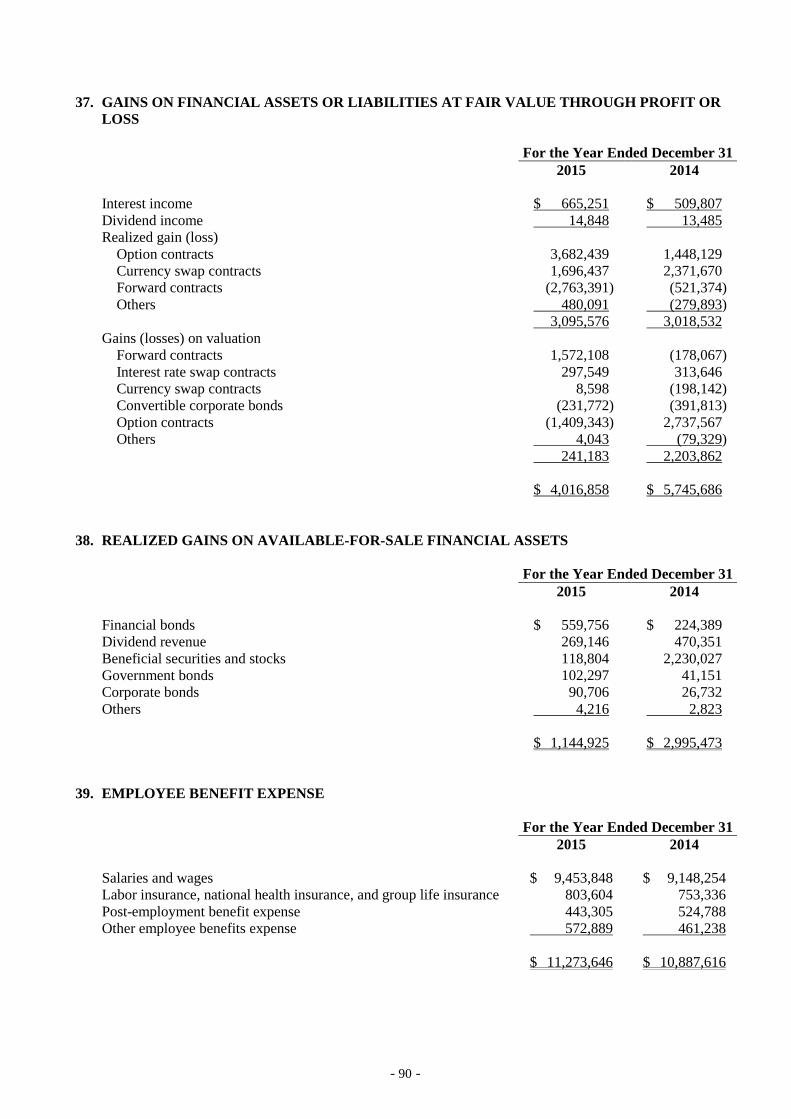
- 90 -
37. GAINS ON FINANCIAL ASSETS OR LIABILITIES AT FAIR VALUE THROUGH PROFIT OR
LOSS
For the Year Ended December 31
2015 2014
Interest income $ 665,251 $ 509,807
Dividend income 14,848 13,485
Realized gain (loss)
Option contracts 3,682,439 1,448,129
Currency swap contracts 1,696,437 2,371,670
Forward contracts (2,763,391) (521,374)
Others 480,091 (279,893)
3,095,576 3,018,532
Gains (losses) on valuation
Forward contracts 1,572,108 (178,067)
Interest rate swap contracts 297,549 313,646
Currency swap contracts 8,598 (198,142)
Convertible corporate bonds (231,772) (391,813)
Option contracts (1,409,343) 2,737,567
Others 4,043 (79,329)
241,183 2,203,862
$ 4,016,858 $ 5,745,686
38. REALIZED GAINS ON AVAILABLE-FOR-SALE FINANCIAL ASSETS
For the Year Ended December 31
2015 2014
Financial bonds $ 559,756 $ 224,389
Dividend revenue 269,146 470,351
Beneficial securities and stocks 118,804 2,230,027
Government bonds 102,297 41,151
Corporate bonds 90,706 26,732
Others 4,216 2,823
$ 1,144,925 $ 2,995,473
39. EMPLOYEE BENEFIT EXPENSE
For the Year Ended December 31
2015 2014
Salaries and wages $ 9,453,848 $ 9,148,254
Labor insurance, national health insurance, and group life insurance 803,604 753,336
Post-employment benefit expense 443,305 524,788
Other employee benefits expense 572,889 461,238
$ 11,273,646 $ 10,887,616
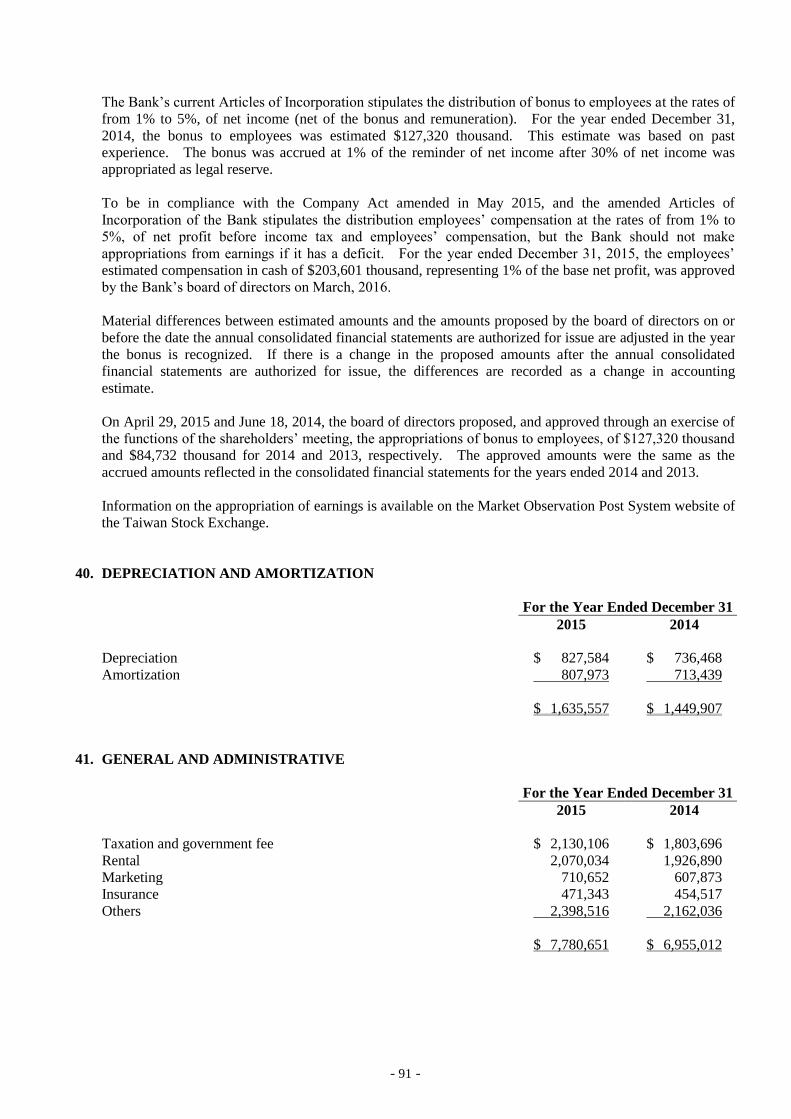
- 91 -
The Bank’s current Articles of Incorporation stipulates the distribution of bonus to employees at the rates of
from 1% to 5%, of net income (net of the bonus and remuneration). For the year ended December 31,
2014, the bonus to employees was estimated $127,320 thousand. This estimate was based on past
experience. The bonus was accrued at 1% of the reminder of net income after 30% of net income was
appropriated as legal reserve.
To be in compliance with the Company Act amended in May 2015, and the amended Articles of
Incorporation of the Bank stipulates the distribution employees’ compensation at the rates of from 1% to
5%, of net profit before income tax and employees’ compensation, but the Bank should not make
appropriations from earnings if it has a deficit. For the year ended December 31, 2015, the employees’
estimated compensation in cash of $203,601 thousand, representing 1% of the base net profit, was approved
by the Bank’s board of directors on March, 2016.
Material differences between estimated amounts and the amounts proposed by the board of directors on or
before the date the annual consolidated financial statements are authorized for issue are adjusted in the year
the bonus is recognized. If there is a change in the proposed amounts after the annual consolidated
financial statements are authorized for issue, the differences are recorded as a change in accounting
estimate.
On April 29, 2015 and June 18, 2014, the board of directors proposed, and approved through an exercise of
the functions of the shareholders’ meeting, the appropriations of bonus to employees, of $127,320 thousand
and $84,732 thousand for 2014 and 2013, respectively. The approved amounts were the same as the
accrued amounts reflected in the consolidated financial statements for the years ended 2014 and 2013.
Information on the appropriation of earnings is available on the Market Observation Post System website of
the Taiwan Stock Exchange.
40. DEPRECIATION AND AMORTIZATION
For the Year Ended December 31
2015 2014
Depreciation $ 827,584 $ 736,468
Amortization 807,973 713,439
$ 1,635,557 $ 1,449,907
41. GENERAL AND ADMINISTRATIVE
For the Year Ended December 31
2015 2014
Taxation and government fee $ 2,130,106 $ 1,803,696
Rental 2,070,034 1,926,890
Marketing 710,652 607,873
Insurance 471,343 454,517
Others 2,398,516 2,162,036
$ 7,780,651 $ 6,955,012
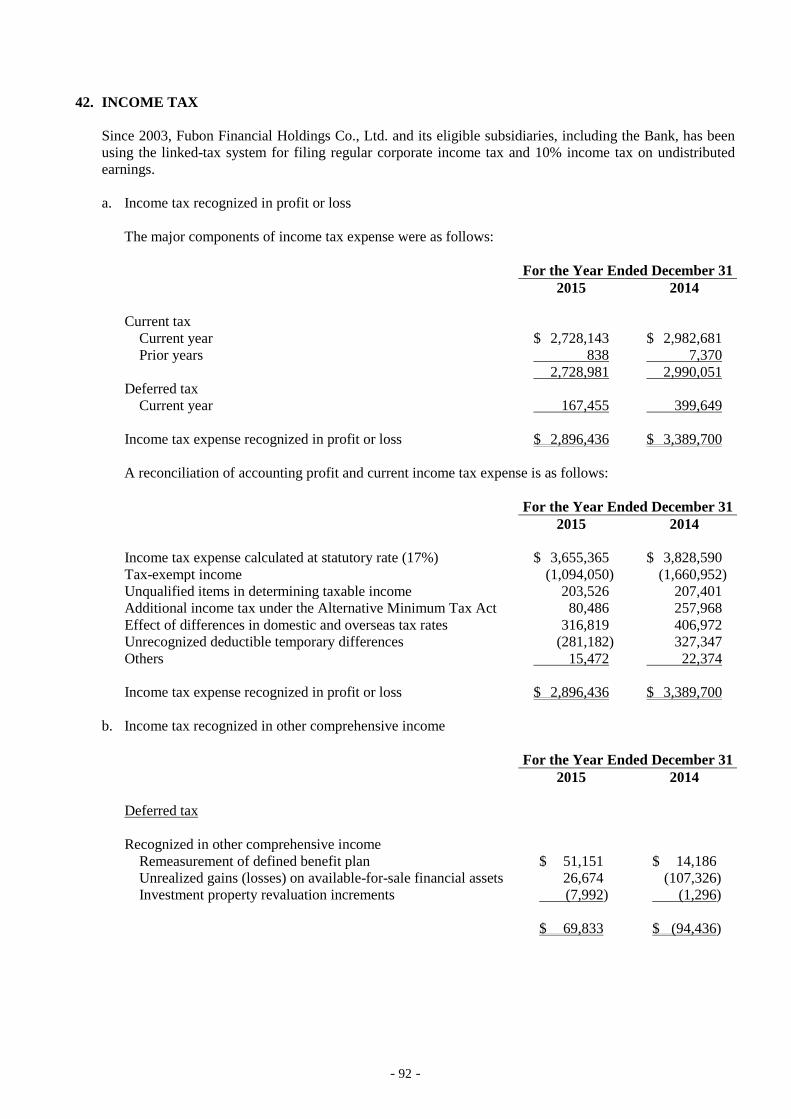
- 92 -
42. INCOME TAX
Since 2003, Fubon Financial Holdings Co., Ltd. and its eligible subsidiaries, including the Bank, has been
using the linked-tax system for filing regular corporate income tax and 10% income tax on undistributed
earnings.
a. Income tax recognized in profit or loss
The major components of income tax expense were as follows:
For the Year Ended December 31
2015 2014
Current tax
Current year $ 2,728,143 $ 2,982,681
Prior years 838 7,370
2,728,981 2,990,051
Deferred tax
Current year 167,455 399,649
Income tax expense recognized in profit or loss $ 2,896,436 $ 3,389,700
A reconciliation of accounting profit and current income tax expense is as follows:
For the Year Ended December 31
2015 2014
Income tax expense calculated at statutory rate (17%) $ 3,655,365 $ 3,828,590
Tax-exempt income (1,094,050) (1,660,952)
Unqualified items in determining taxable income 203,526 207,401
Additional income tax under the Alternative Minimum Tax Act 80,486 257,968
Effect of differences in domestic and overseas tax rates 316,819 406,972
Unrecognized deductible temporary differences (281,182) 327,347
Others 15,472 22,374
Income tax expense recognized in profit or loss $ 2,896,436 $ 3,389,700
b. Income tax recognized in other comprehensive income
For the Year Ended December 31
2015 2014
Deferred tax
Recognized in other comprehensive income
Remeasurement of defined benefit plan $ 51,151 $ 14,186
Unrealized gains (losses) on available-for-sale financial assets 26,674 (107,326)
Investment property revaluation increments (7,992) (1,296)
$ 69,833 $ (94,436)
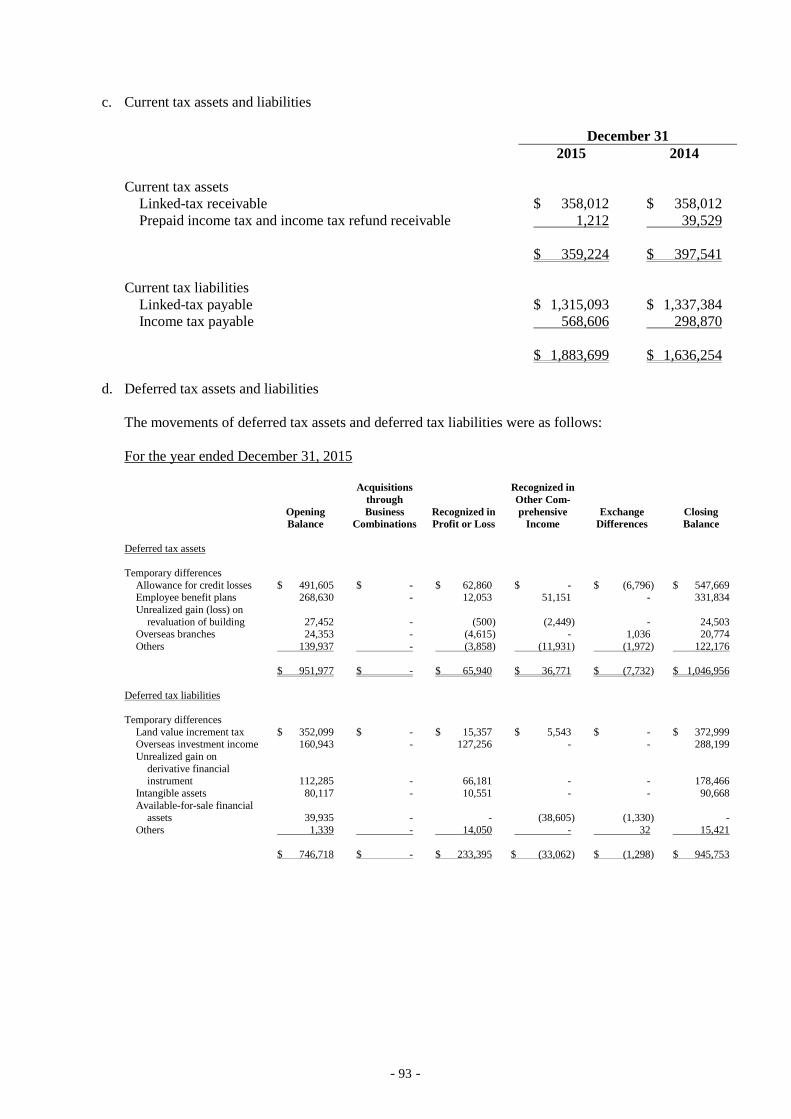
- 93 -
c. Current tax assets and liabilities
December 31
2015 2014
Current tax assets
Linked-tax receivable $ 358,012 $ 358,012
Prepaid income tax and income tax refund receivable 1,212 39,529
$ 359,224 $ 397,541
Current tax liabilities
Linked-tax payable $ 1,315,093 $ 1,337,384
Income tax payable 568,606 298,870
$ 1,883,699 $ 1,636,254
d. Deferred tax assets and liabilities
The movements of deferred tax assets and deferred tax liabilities were as follows:
For the year ended December 31, 2015
Opening
Balance
Acquisitions
through
Business
Combinations
Recognized in
Profit or Loss
Recognized in
Other Com-
prehensive
Income
Exchange
Differences
Closing
Balance
Deferred tax assets
Temporary differences
Allowance for credit losses $ 491,605 $ - $ 62,860 $ - $ (6,796 ) $ 547,669 Employee benefit plans 268,630 - 12,053 51,151 - 331,834
Unrealized gain (loss) on
revaluation of building 27,452 - (500 ) (2,449 ) - 24,503 Overseas branches 24,353 - (4,615 ) - 1,036 20,774
Others 139,937 - (3,858 ) (11,931 ) (1,972 ) 122,176
$ 951,977 $ - $ 65,940 $ 36,771 $ (7,732 ) $ 1,046,956
Deferred tax liabilities
Temporary differences
Land value increment tax $ 352,099 $ - $ 15,357 $ 5,543 $ - $ 372,999 Overseas investment income 160,943 - 127,256 - - 288,199
Unrealized gain on
derivative financial instrument 112,285 - 66,181 - - 178,466
Intangible assets 80,117 - 10,551 - - 90,668
Available-for-sale financial
assets 39,935 - - (38,605 ) (1,330 ) -
Others 1,339 - 14,050 - 32 15,421
$ 746,718 $ - $ 233,395 $ (33,062 ) $ (1,298 ) $ 945,753
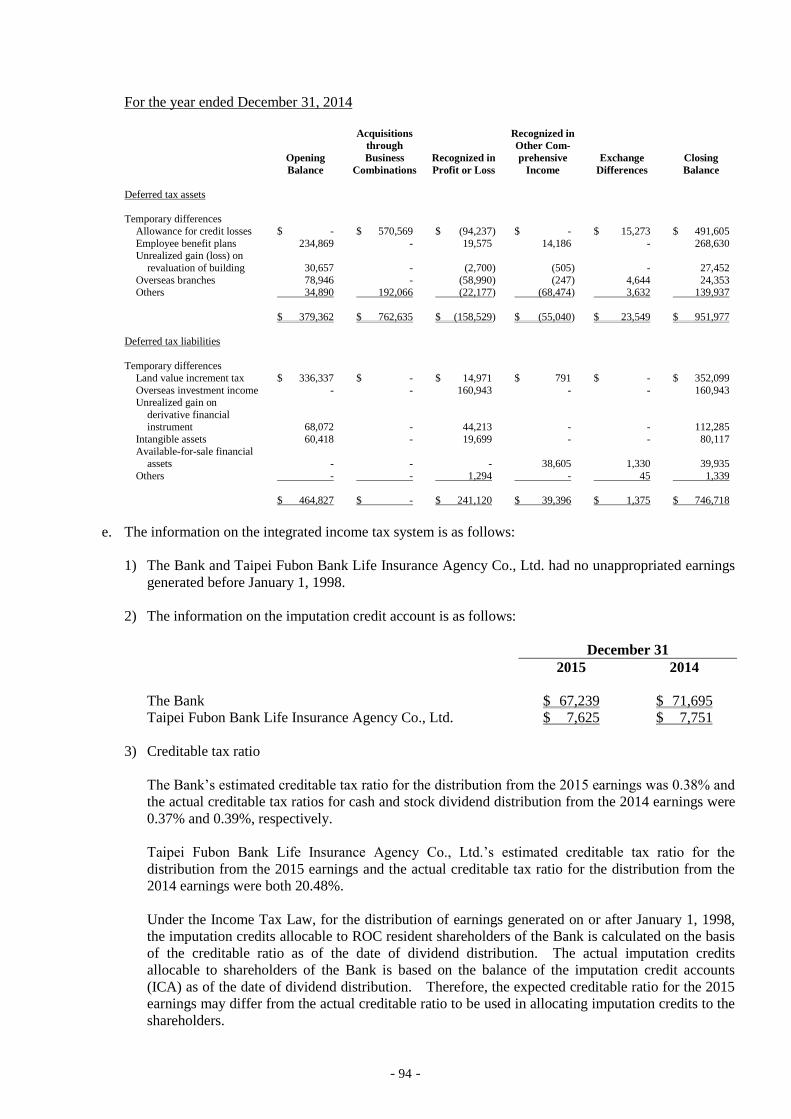
- 94 -
For the year ended December 31, 2014
Opening
Balance
Acquisitions
through
Business
Combinations
Recognized in
Profit or Loss
Recognized in
Other Com-
prehensive
Income
Exchange
Differences
Closing
Balance
Deferred tax assets
Temporary differences
Allowance for credit losses $ - $ 570,569 $ (94,237 ) $ - $ 15,273 $ 491,605
Employee benefit plans 234,869 - 19,575 14,186 - 268,630 Unrealized gain (loss) on
revaluation of building 30,657 - (2,700 ) (505 ) - 27,452
Overseas branches 78,946 - (58,990 ) (247 ) 4,644 24,353 Others 34,890 192,066 (22,177 ) (68,474 ) 3,632 139,937
$ 379,362 $ 762,635 $ (158,529 ) $ (55,040 ) $ 23,549 $ 951,977
Deferred tax liabilities
Temporary differences
Land value increment tax $ 336,337 $ - $ 14,971 $ 791 $ - $ 352,099
Overseas investment income - - 160,943 - - 160,943 Unrealized gain on
derivative financial instrument 68,072 - 44,213 - - 112,285
Intangible assets 60,418 - 19,699 - - 80,117
Available-for-sale financial assets - - - 38,605 1,330 39,935
Others - - 1,294 - 45 1,339
$ 464,827 $ - $ 241,120 $ 39,396 $ 1,375 $ 746,718
e. The information on the integrated income tax system is as follows:
1) The Bank and Taipei Fubon Bank Life Insurance Agency Co., Ltd. had no unappropriated earnings
generated before January 1, 1998.
2) The information on the imputation credit account is as follows:
December 31
2015 2014
The Bank $ 67,239 $ 71,695
Taipei Fubon Bank Life Insurance Agency Co., Ltd. $ 7,625 $ 7,751
3) Creditable tax ratio
The Bank’s estimated creditable tax ratio for the distribution from the 2015 earnings was 0.38% and
the actual creditable tax ratios for cash and stock dividend distribution from the 2014 earnings were
0.37% and 0.39%, respectively.
Taipei Fubon Bank Life Insurance Agency Co., Ltd.’s estimated creditable tax ratio for the
distribution from the 2015 earnings and the actual creditable tax ratio for the distribution from the
2014 earnings were both 20.48%.
Under the Income Tax Law, for the distribution of earnings generated on or after January 1, 1998,
the imputation credits allocable to ROC resident shareholders of the Bank is calculated on the basis
of the creditable ratio as of the date of dividend distribution. The actual imputation credits
allocable to shareholders of the Bank is based on the balance of the imputation credit accounts
(ICA) as of the date of dividend distribution. Therefore, the expected creditable ratio for the 2015
earnings may differ from the actual creditable ratio to be used in allocating imputation credits to the
shareholders.
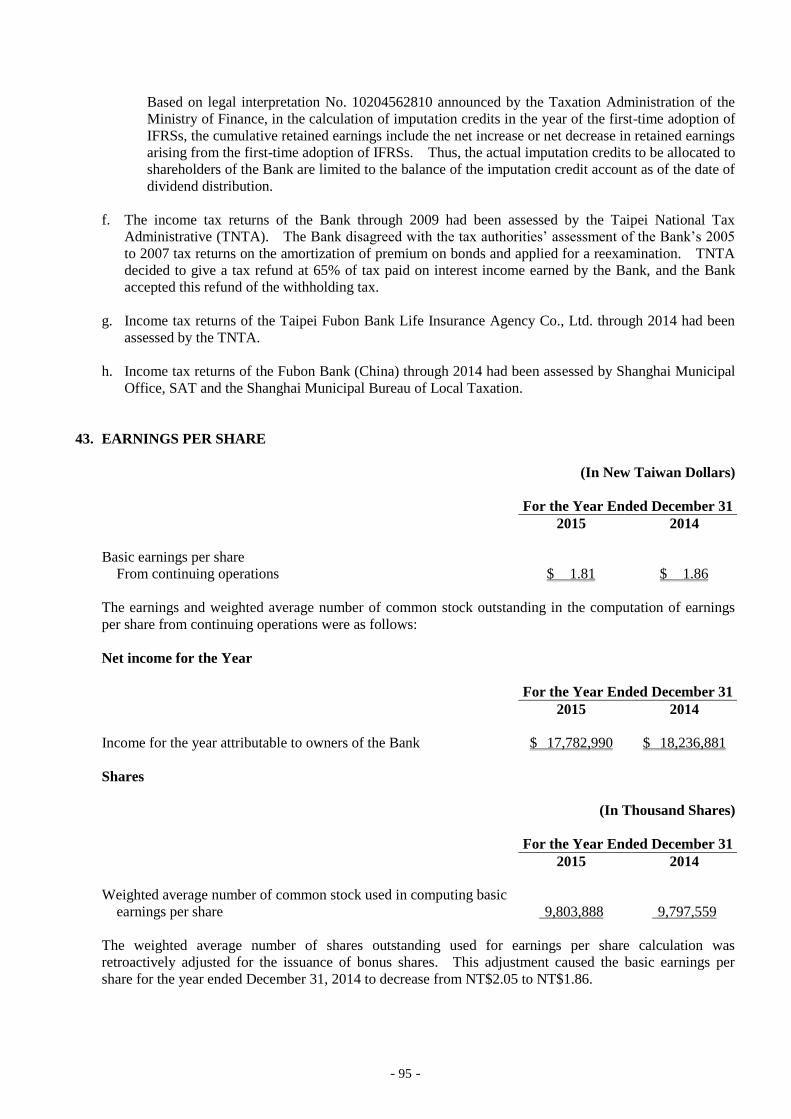
- 95 -
Based on legal interpretation No. 10204562810 announced by the Taxation Administration of the
Ministry of Finance, in the calculation of imputation credits in the year of the first-time adoption of
IFRSs, the cumulative retained earnings include the net increase or net decrease in retained earnings
arising from the first-time adoption of IFRSs. Thus, the actual imputation credits to be allocated to
shareholders of the Bank are limited to the balance of the imputation credit account as of the date of
dividend distribution.
f. The income tax returns of the Bank through 2009 had been assessed by the Taipei National Tax
Administrative (TNTA). The Bank disagreed with the tax authorities’ assessment of the Bank’s 2005
to 2007 tax returns on the amortization of premium on bonds and applied for a reexamination. TNTA
decided to give a tax refund at 65% of tax paid on interest income earned by the Bank, and the Bank
accepted this refund of the withholding tax.
g. Income tax returns of the Taipei Fubon Bank Life Insurance Agency Co., Ltd. through 2014 had been
assessed by the TNTA.
h. Income tax returns of the Fubon Bank (China) through 2014 had been assessed by Shanghai Municipal
Office, SAT and the Shanghai Municipal Bureau of Local Taxation.
43. EARNINGS PER SHARE
(In New Taiwan Dollars)
For the Year Ended December 31
2015 2014
Basic earnings per share
From continuing operations $ 1.81 $ 1.86
The earnings and weighted average number of common stock outstanding in the computation of earnings
per share from continuing operations were as follows:
Net income for the Year
For the Year Ended December 31
2015 2014
Income for the year attributable to owners of the Bank $ 17,782,990 $ 18,236,881
Shares
(In Thousand Shares)
For the Year Ended December 31
2015 2014
Weighted average number of common stock used in computing basic
earnings per share 9,803,888 9,797,559
The weighted average number of shares outstanding used for earnings per share calculation was
retroactively adjusted for the issuance of bonus shares. This adjustment caused the basic earnings per
share for the year ended December 31, 2014 to decrease from NT$2.05 to NT$1.86.
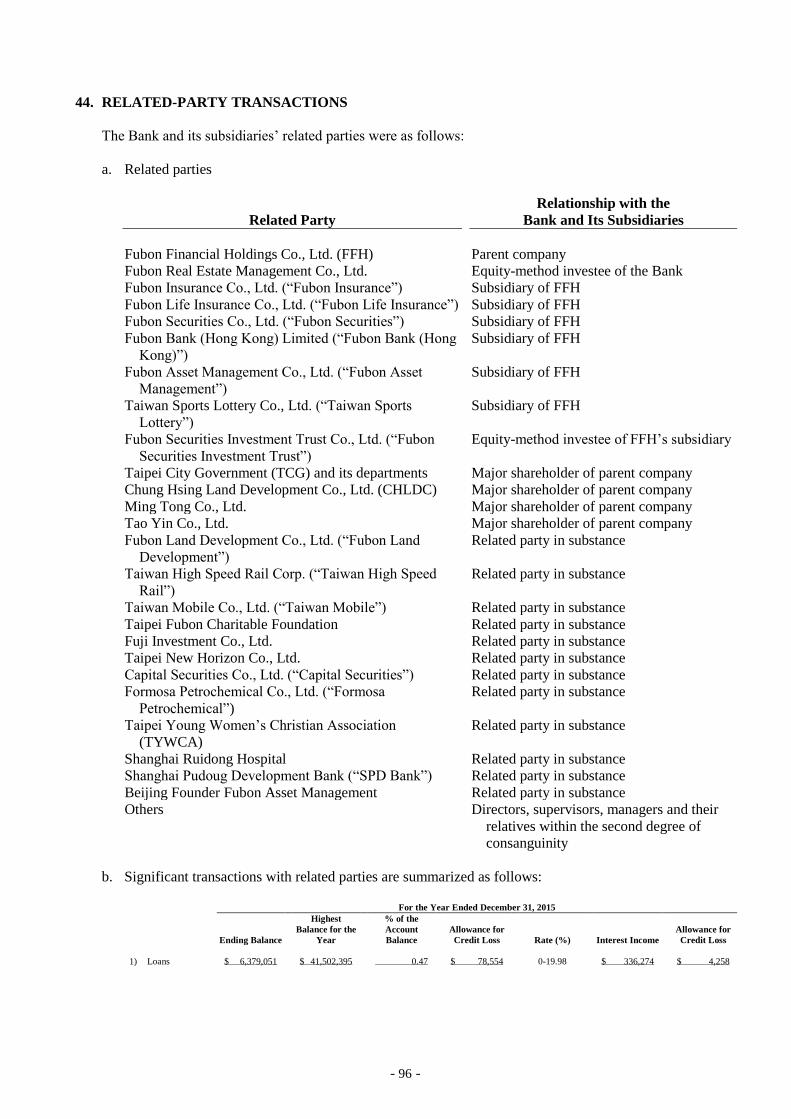
- 96 -
44. RELATED-PARTY TRANSACTIONS
The Bank and its subsidiaries’ related parties were as follows:
a. Related parties
Related Party
Relationship with the
Bank and Its Subsidiaries
Fubon Financial Holdings Co., Ltd. (FFH) Parent company
Fubon Real Estate Management Co., Ltd. Equity-method investee of the Bank
Fubon Insurance Co., Ltd. (“Fubon Insurance”) Subsidiary of FFH
Fubon Life Insurance Co., Ltd. (“Fubon Life Insurance”) Subsidiary of FFH
Fubon Securities Co., Ltd. (“Fubon Securities”) Subsidiary of FFH
Fubon Bank (Hong Kong) Limited (“Fubon Bank (Hong
Kong)”)
Subsidiary of FFH
Fubon Asset Management Co., Ltd. (“Fubon Asset
Management”)
Subsidiary of FFH
Taiwan Sports Lottery Co., Ltd. (“Taiwan Sports
Lottery”)
Subsidiary of FFH
Fubon Securities Investment Trust Co., Ltd. (“Fubon
Securities Investment Trust”)
Equity-method investee of FFH’s subsidiary
Taipei City Government (TCG) and its departments Major shareholder of parent company
Chung Hsing Land Development Co., Ltd. (CHLDC) Major shareholder of parent company
Ming Tong Co., Ltd. Major shareholder of parent company
Tao Yin Co., Ltd. Major shareholder of parent company
Fubon Land Development Co., Ltd. (“Fubon Land
Development”)
Related party in substance
Taiwan High Speed Rail Corp. (“Taiwan High Speed
Rail”)
Related party in substance
Taiwan Mobile Co., Ltd. (“Taiwan Mobile”) Related party in substance
Taipei Fubon Charitable Foundation Related party in substance
Fuji Investment Co., Ltd. Related party in substance
Taipei New Horizon Co., Ltd. Related party in substance
Capital Securities Co., Ltd. (“Capital Securities”) Related party in substance
Formosa Petrochemical Co., Ltd. (“Formosa
Petrochemical”)
Related party in substance
Taipei Young Women’s Christian Association
(TYWCA)
Related party in substance
Shanghai Ruidong Hospital Related party in substance
Shanghai Pudoug Development Bank (“SPD Bank”) Related party in substance
Beijing Founder Fubon Asset Management Related party in substance
Others Directors, supervisors, managers and their
relatives within the second degree of
consanguinity
b. Significant transactions with related parties are summarized as follows:
For the Year Ended December 31, 2015
Ending Balance
Highest
Balance for the
Year
% of the
Account
Balance
Allowance for
Credit Loss Rate (%) Interest Income
Allowance for
Credit Loss
1) Loans $ 6,379,051 $ 41,502,395 0.47 $ 78,554 0-19.98 $ 336,274 $ 4,258
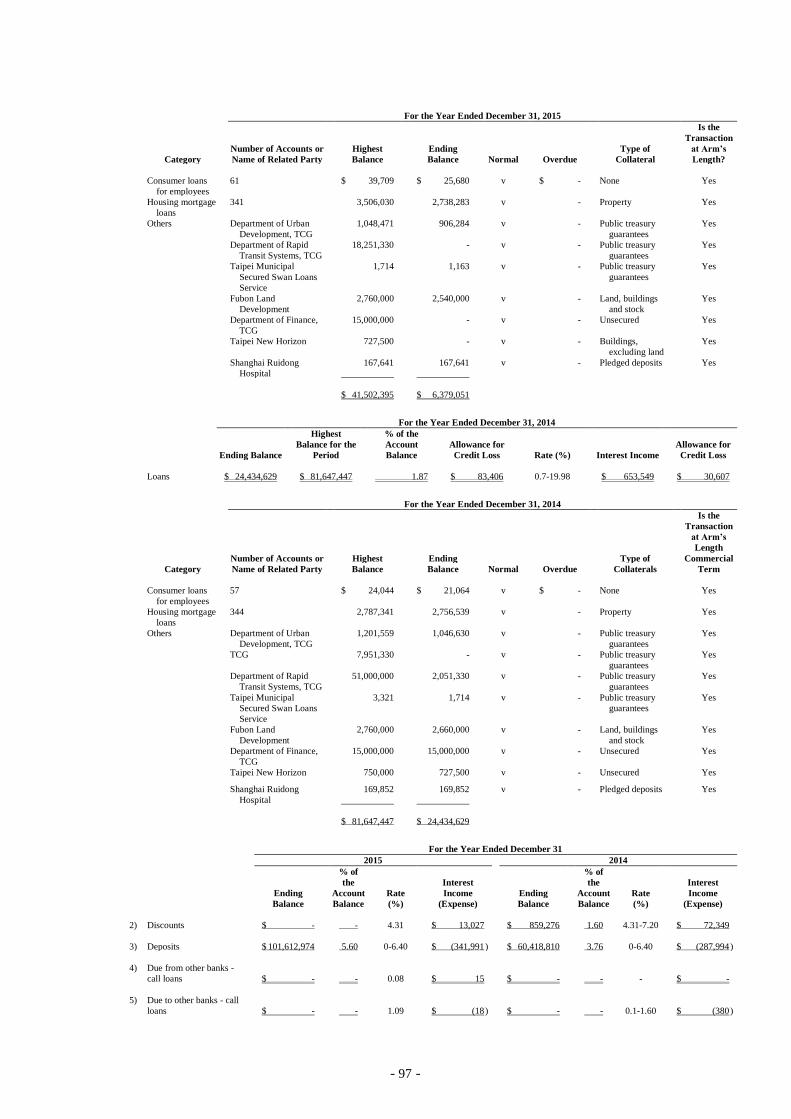
- 97 -
For the Year Ended December 31, 2015
Number of Accounts or Highest Ending Type of
Is the
Transaction
at Arm’s
Category Name of Related Party Balance Balance Normal Overdue Collateral Length?
Consumer loans
for employees
61 $ 39,709 $ 25,680 v $ - None Yes
Housing mortgage
loans
341 3,506,030 2,738,283 v - Property Yes
Others Department of Urban
Development, TCG
1,048,471 906,284 v - Public treasury
guarantees
Yes
Department of Rapid
Transit Systems, TCG
18,251,330 - v - Public treasury
guarantees
Yes
Taipei Municipal
Secured Swan Loans
Service
1,714 1,163 v - Public treasury
guarantees
Yes
Fubon Land
Development
2,760,000 2,540,000 v - Land, buildings
and stock
Yes
Department of Finance,
TCG
15,000,000 - v - Unsecured Yes
Taipei New Horizon 727,500 - v - Buildings,
excluding land
Yes
Shanghai Ruidong
Hospital
167,641
167,641
v - Pledged deposits Yes
$ 41,502,395 $ 6,379,051
For the Year Ended December 31, 2014
Ending Balance
Highest
Balance for the
Period
% of the
Account
Balance
Allowance for
Credit Loss Rate (%) Interest Income
Allowance for
Credit Loss
Loans $ 24,434,629 $ 81,647,447 1.87 $ 83,406 0.7-19.98 $ 653,549 $ 30,607
For the Year Ended December 31, 2014
Number of Accounts or Highest Ending Type of
Is the
Transaction
at Arm’s
Length
Commercial
Category Name of Related Party Balance Balance Normal Overdue Collaterals Term
Consumer loans
for employees
57 $ 24,044 $ 21,064 v $ - None Yes
Housing mortgage
loans
344 2,787,341 2,756,539 v - Property Yes
Others Department of Urban
Development, TCG
1,201,559 1,046,630 v - Public treasury
guarantees
Yes
TCG 7,951,330 - v - Public treasury
guarantees
Yes
Department of Rapid
Transit Systems, TCG
51,000,000 2,051,330 v - Public treasury
guarantees
Yes
Taipei Municipal
Secured Swan Loans
Service
3,321 1,714 v - Public treasury
guarantees
Yes
Fubon Land
Development
2,760,000 2,660,000 v - Land, buildings
and stock
Yes
Department of Finance,
TCG
15,000,000 15,000,000 v - Unsecured Yes
Taipei New Horizon 750,000 727,500 v - Unsecured Yes
Shanghai Ruidong
Hospital
169,852
169,852
v - Pledged deposits Yes
$ 81,647,447 $ 24,434,629
For the Year Ended December 31
2015 2014
% of
the Interest
% of
the Interest
Ending Account Rate Income Ending Account Rate Income
Balance Balance (%) (Expense) Balance Balance (%) (Expense)
2) Discounts $ - - 4.31 $ 13,027 $ 859,276 1.60 4.31-7.20 $ 72,349
3) Deposits $ 101,612,974 5.60 0-6.40 $ (341,991 ) $ 60,418,810 3.76 0-6.40 $ (287,994 )
4) Due from other banks -
call loans $ - - 0.08 $ 15 $ - - - $ -
5) Due to other banks - call
loans $ - - 1.09 $ (18 ) $ - - 0.1-1.60 $ (380 )
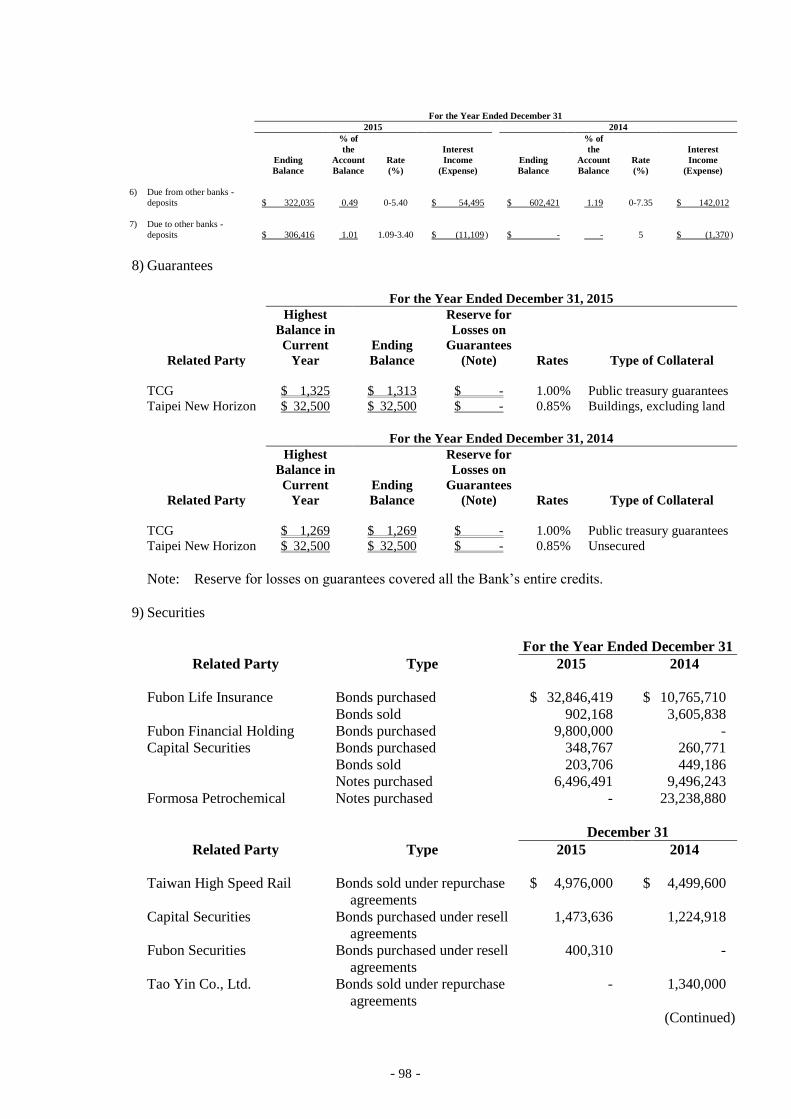
- 98 -
For the Year Ended December 31
2015 2014
% of
the Interest
% of
the Interest
Ending Account Rate Income Ending Account Rate Income
Balance Balance (%) (Expense) Balance Balance (%) (Expense)
6) Due from other banks -
deposits $ 322,035 0.49 0-5.40 $ 54,495 $ 602,421 1.19 0-7.35 $ 142,012
7) Due to other banks -
deposits $ 306,416 1.01 1.09-3.40 $ (11,109 ) $ - - 5 $ (1,370 )
8) Guarantees
For the Year Ended December 31, 2015
Related Party
Highest
Balance in
Current
Year
Ending
Balance
Reserve for
Losses on
Guarantees
(Note) Rates Type of Collateral
TCG $ 1,325 $ 1,313 $ - 1.00% Public treasury guarantees
Taipei New Horizon $ 32,500 $ 32,500 $ - 0.85% Buildings, excluding land
For the Year Ended December 31, 2014
Related Party
Highest
Balance in
Current
Year
Ending
Balance
Reserve for
Losses on
Guarantees
(Note) Rates Type of Collateral
TCG $ 1,269 $ 1,269 $ - 1.00% Public treasury guarantees
Taipei New Horizon $ 32,500 $ 32,500 $ - 0.85% Unsecured
Note: Reserve for losses on guarantees covered all the Bank’s entire credits.
9) Securities
For the Year Ended December 31
Related Party Type 2015 2014
Fubon Life Insurance Bonds purchased $ 32,846,419 $ 10,765,710
Bonds sold 902,168 3,605,838
Fubon Financial Holding Bonds purchased 9,800,000 -
Capital Securities Bonds purchased 348,767 260,771
Bonds sold 203,706 449,186
Notes purchased 6,496,491 9,496,243
Formosa Petrochemical Notes purchased - 23,238,880
December 31
Related Party Type 2015 2014
Taiwan High Speed Rail Bonds sold under repurchase
agreements
$ 4,976,000 $ 4,499,600
Capital Securities Bonds purchased under resell
agreements
1,473,636 1,224,918
Fubon Securities Bonds purchased under resell
agreements
400,310 -
Tao Yin Co., Ltd. Bonds sold under repurchase
agreements
- 1,340,000
(Continued)
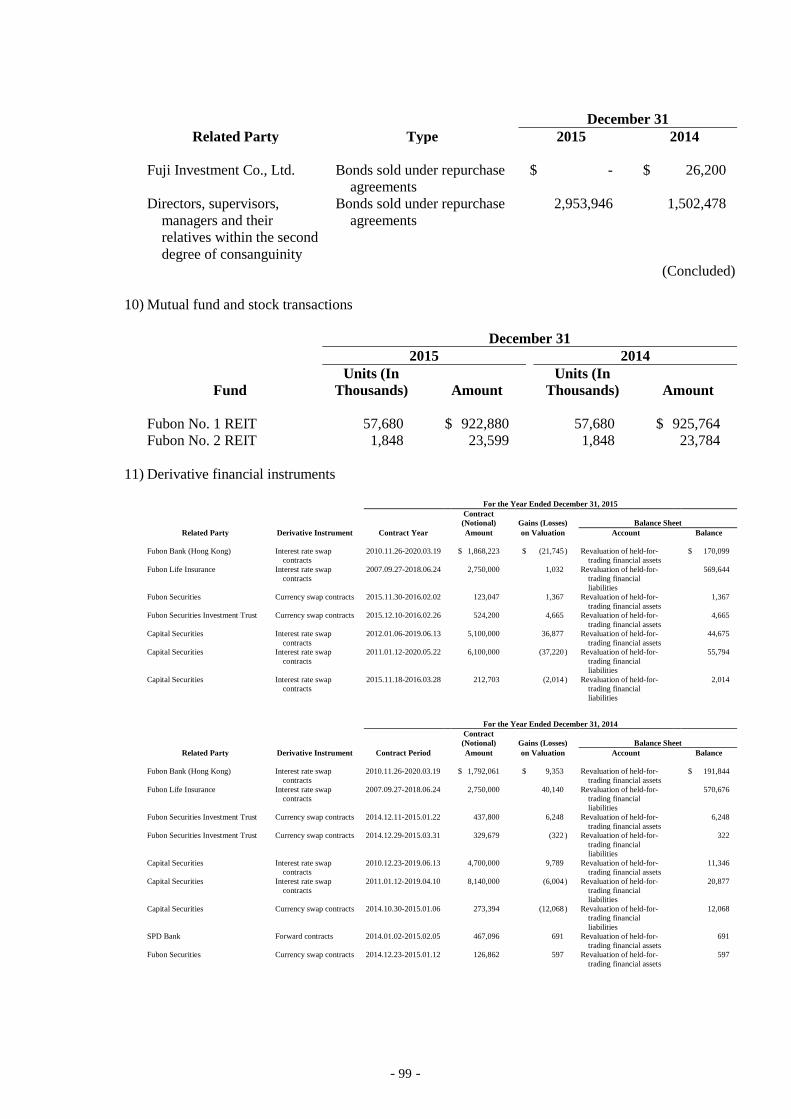
- 99 -
December 31
Related Party Type 2015 2014
Fuji Investment Co., Ltd. Bonds sold under repurchase
agreements
$ - $ 26,200
Directors, supervisors,
managers and their
relatives within the second
degree of consanguinity
Bonds sold under repurchase
agreements
2,953,946 1,502,478
(Concluded)
10) Mutual fund and stock transactions
December 31
2015 2014
Fund
Units (In
Thousands) Amount
Units (In
Thousands) Amount
Fubon No. 1 REIT 57,680 $ 922,880 57,680 $ 925,764
Fubon No. 2 REIT 1,848 23,599 1,848 23,784
11) Derivative financial instruments
For the Year Ended December 31, 2015
Contract
(Notional) Gains (Losses) Balance Sheet
Related Party Derivative Instrument Contract Year Amount on Valuation Account Balance
Fubon Bank (Hong Kong) Interest rate swap
contracts
2010.11.26-2020.03.19 $ 1,868,223 $ (21,745 ) Revaluation of held-for-
trading financial assets
$ 170,099
Fubon Life Insurance Interest rate swap
contracts
2007.09.27-2018.06.24 2,750,000 1,032 Revaluation of held-for-
trading financial
liabilities
569,644
Fubon Securities Currency swap contracts 2015.11.30-2016.02.02 123,047 1,367 Revaluation of held-for-
trading financial assets
1,367
Fubon Securities Investment Trust Currency swap contracts 2015.12.10-2016.02.26 524,200 4,665 Revaluation of held-for-
trading financial assets
4,665
Capital Securities Interest rate swap
contracts
2012.01.06-2019.06.13 5,100,000 36,877 Revaluation of held-for-
trading financial assets
44,675
Capital Securities Interest rate swap
contracts
2011.01.12-2020.05.22 6,100,000 (37,220 ) Revaluation of held-for-
trading financial
liabilities
55,794
Capital Securities Interest rate swap
contracts
2015.11.18-2016.03.28 212,703 (2,014 ) Revaluation of held-for-
trading financial
liabilities
2,014
For the Year Ended December 31, 2014
Contract
(Notional) Gains (Losses) Balance Sheet
Related Party Derivative Instrument Contract Period Amount on Valuation Account Balance
Fubon Bank (Hong Kong) Interest rate swap
contracts
2010.11.26-2020.03.19 $ 1,792,061 $ 9,353 Revaluation of held-for-
trading financial assets
$ 191,844
Fubon Life Insurance Interest rate swap
contracts
2007.09.27-2018.06.24 2,750,000 40,140 Revaluation of held-for-
trading financial
liabilities
570,676
Fubon Securities Investment Trust Currency swap contracts 2014.12.11-2015.01.22 437,800 6,248 Revaluation of held-for-
trading financial assets
6,248
Fubon Securities Investment Trust Currency swap contracts 2014.12.29-2015.03.31 329,679 (322 ) Revaluation of held-for-
trading financial
liabilities
322
Capital Securities Interest rate swap
contracts
2010.12.23-2019.06.13 4,700,000 9,789 Revaluation of held-for-
trading financial assets
11,346
Capital Securities Interest rate swap
contracts
2011.01.12-2019.04.10 8,140,000 (6,004 ) Revaluation of held-for-
trading financial
liabilities
20,877
Capital Securities Currency swap contracts 2014.10.30-2015.01.06 273,394 (12,068 ) Revaluation of held-for-
trading financial
liabilities
12,068
SPD Bank Forward contracts 2014.01.02-2015.02.05 467,096 691 Revaluation of held-for-
trading financial assets
691
Fubon Securities Currency swap contracts 2014.12.23-2015.01.12 126,862 597 Revaluation of held-for-
trading financial assets
597
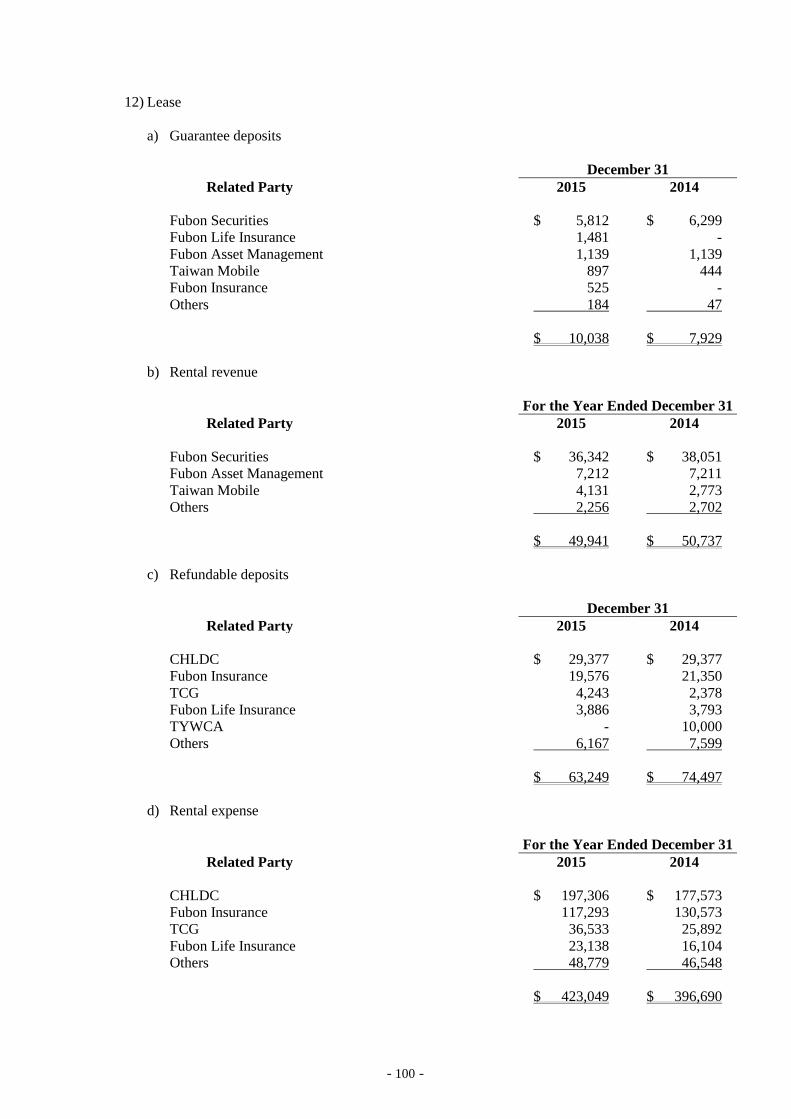
- 100 -
12) Lease
a) Guarantee deposits
December 31
Related Party 2015 2014
Fubon Securities $ 5,812 $ 6,299
Fubon Life Insurance 1,481 -
Fubon Asset Management 1,139 1,139
Taiwan Mobile 897 444
Fubon Insurance 525 -
Others 184 47
$ 10,038 $ 7,929
b) Rental revenue
For the Year Ended December 31
Related Party 2015 2014
Fubon Securities $ 36,342 $ 38,051
Fubon Asset Management 7,212 7,211
Taiwan Mobile 4,131 2,773
Others 2,256 2,702
$ 49,941 $ 50,737
c) Refundable deposits
December 31
Related Party 2015 2014
CHLDC $ 29,377 $ 29,377
Fubon Insurance 19,576 21,350
TCG 4,243 2,378
Fubon Life Insurance 3,886 3,793
TYWCA - 10,000
Others 6,167 7,599
$ 63,249 $ 74,497
d) Rental expense
For the Year Ended December 31
Related Party 2015 2014
CHLDC $ 197,306 $ 177,573
Fubon Insurance 117,293 130,573
TCG 36,533 25,892
Fubon Life Insurance 23,138 16,104
Others 48,779 46,548
$ 423,049 $ 396,690
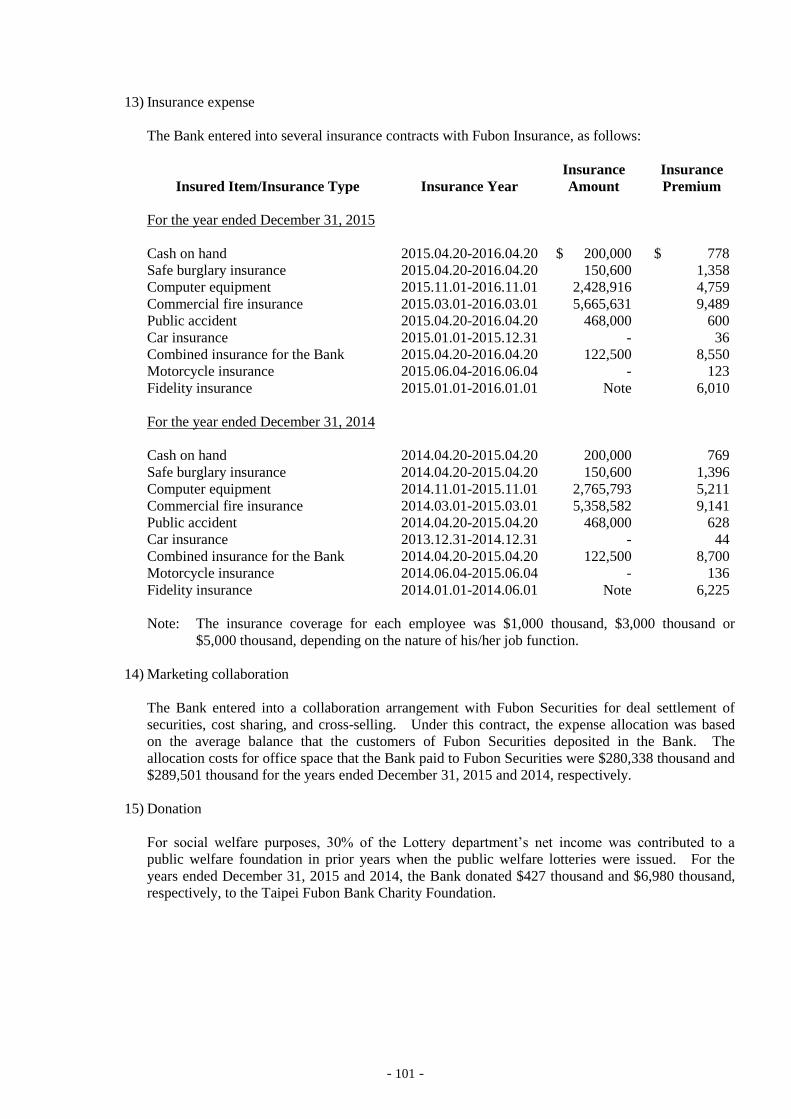
- 101 -
13) Insurance expense
The Bank entered into several insurance contracts with Fubon Insurance, as follows:
Insurance Insurance
Insured Item/Insurance Type Insurance Year Amount Premium
For the year ended December 31, 2015
Cash on hand 2015.04.20-2016.04.20 $ 200,000 $ 778
Safe burglary insurance 2015.04.20-2016.04.20 150,600 1,358
Computer equipment 2015.11.01-2016.11.01 2,428,916 4,759
Commercial fire insurance 2015.03.01-2016.03.01 5,665,631 9,489
Public accident 2015.04.20-2016.04.20 468,000 600
Car insurance 2015.01.01-2015.12.31 - 36
Combined insurance for the Bank 2015.04.20-2016.04.20 122,500 8,550
Motorcycle insurance 2015.06.04-2016.06.04 - 123
Fidelity insurance 2015.01.01-2016.01.01 Note 6,010
For the year ended December 31, 2014
Cash on hand 2014.04.20-2015.04.20 200,000 769
Safe burglary insurance 2014.04.20-2015.04.20 150,600 1,396
Computer equipment 2014.11.01-2015.11.01 2,765,793 5,211
Commercial fire insurance 2014.03.01-2015.03.01 5,358,582 9,141
Public accident 2014.04.20-2015.04.20 468,000 628
Car insurance 2013.12.31-2014.12.31 - 44
Combined insurance for the Bank 2014.04.20-2015.04.20 122,500 8,700
Motorcycle insurance 2014.06.04-2015.06.04 - 136
Fidelity insurance 2014.01.01-2014.06.01 Note 6,225
Note: The insurance coverage for each employee was $1,000 thousand, $3,000 thousand or
$5,000 thousand, depending on the nature of his/her job function.
14) Marketing collaboration
The Bank entered into a collaboration arrangement with Fubon Securities for deal settlement of
securities, cost sharing, and cross-selling. Under this contract, the expense allocation was based
on the average balance that the customers of Fubon Securities deposited in the Bank. The
allocation costs for office space that the Bank paid to Fubon Securities were $280,338 thousand and
$289,501 thousand for the years ended December 31, 2015 and 2014, respectively.
15) Donation
For social welfare purposes, 30% of the Lottery department’s net income was contributed to a
public welfare foundation in prior years when the public welfare lotteries were issued. For the
years ended December 31, 2015 and 2014, the Bank donated $427 thousand and $6,980 thousand,
respectively, to the Taipei Fubon Bank Charity Foundation.
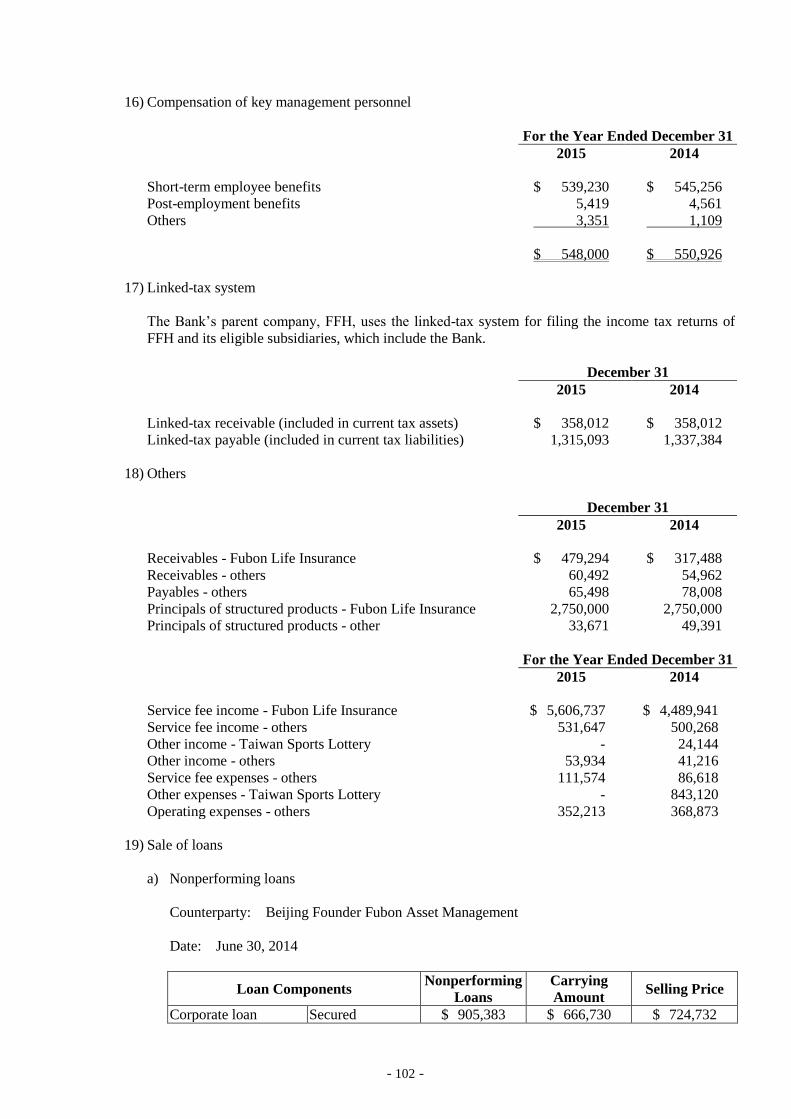
- 102 -
16) Compensation of key management personnel
For the Year Ended December 31
2015 2014
Short-term employee benefits $ 539,230 $ 545,256
Post-employment benefits 5,419 4,561
Others 3,351 1,109
$ 548,000 $ 550,926
17) Linked-tax system
The Bank’s parent company, FFH, uses the linked-tax system for filing the income tax returns of
FFH and its eligible subsidiaries, which include the Bank.
December 31
2015 2014
Linked-tax receivable (included in current tax assets) $ 358,012 $ 358,012
Linked-tax payable (included in current tax liabilities) 1,315,093 1,337,384
18) Others
December 31
2015 2014
Receivables - Fubon Life Insurance $ 479,294 $ 317,488
Receivables - others 60,492 54,962
Payables - others 65,498 78,008
Principals of structured products - Fubon Life Insurance 2,750,000 2,750,000
Principals of structured products - other 33,671 49,391
For the Year Ended December 31
2015 2014
Service fee income - Fubon Life Insurance $ 5,606,737 $ 4,489,941
Service fee income - others 531,647 500,268
Other income - Taiwan Sports Lottery - 24,144
Other income - others 53,934 41,216
Service fee expenses - others 111,574 86,618
Other expenses - Taiwan Sports Lottery - 843,120
Operating expenses - others 352,213 368,873
19) Sale of loans
a) Nonperforming loans
Counterparty: Beijing Founder Fubon Asset Management
Date: June 30, 2014
Loan Components Nonperforming
Loans
Carrying
Amount Selling Price
Corporate loan Secured $ 905,383 $ 666,730 $ 724,732
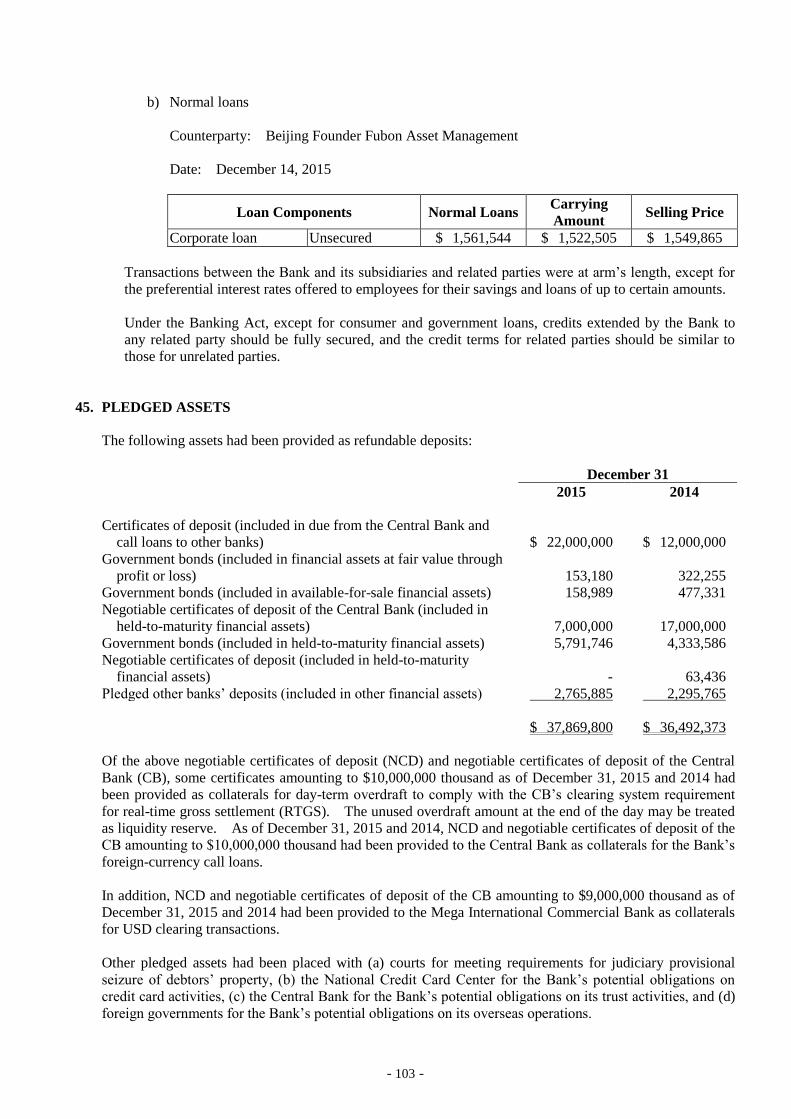
- 103 -
b) Normal loans
Counterparty: Beijing Founder Fubon Asset Management
Date: December 14, 2015
Loan Components Normal Loans Carrying
Amount Selling Price
Corporate loan Unsecured $ 1,561,544 $ 1,522,505 $ 1,549,865
Transactions between the Bank and its subsidiaries and related parties were at arm’s length, except for
the preferential interest rates offered to employees for their savings and loans of up to certain amounts.
Under the Banking Act, except for consumer and government loans, credits extended by the Bank to
any related party should be fully secured, and the credit terms for related parties should be similar to
those for unrelated parties.
45. PLEDGED ASSETS
The following assets had been provided as refundable deposits:
December 31
2015 2014
Certificates of deposit (included in due from the Central Bank and
call loans to other banks) $ 22,000,000 $ 12,000,000
Government bonds (included in financial assets at fair value through
profit or loss) 153,180 322,255
Government bonds (included in available-for-sale financial assets) 158,989 477,331
Negotiable certificates of deposit of the Central Bank (included in
held-to-maturity financial assets) 7,000,000 17,000,000
Government bonds (included in held-to-maturity financial assets) 5,791,746 4,333,586
Negotiable certificates of deposit (included in held-to-maturity
financial assets) - 63,436
Pledged other banks’ deposits (included in other financial assets) 2,765,885 2,295,765
$ 37,869,800 $ 36,492,373
Of the above negotiable certificates of deposit (NCD) and negotiable certificates of deposit of the Central
Bank (CB), some certificates amounting to $10,000,000 thousand as of December 31, 2015 and 2014 had
been provided as collaterals for day-term overdraft to comply with the CB’s clearing system requirement
for real-time gross settlement (RTGS). The unused overdraft amount at the end of the day may be treated
as liquidity reserve. As of December 31, 2015 and 2014, NCD and negotiable certificates of deposit of the
CB amounting to $10,000,000 thousand had been provided to the Central Bank as collaterals for the Bank’s
foreign-currency call loans.
In addition, NCD and negotiable certificates of deposit of the CB amounting to $9,000,000 thousand as of
December 31, 2015 and 2014 had been provided to the Mega International Commercial Bank as collaterals
for USD clearing transactions.
Other pledged assets had been placed with (a) courts for meeting requirements for judiciary provisional
seizure of debtors’ property, (b) the National Credit Card Center for the Bank’s potential obligations on
credit card activities, (c) the Central Bank for the Bank’s potential obligations on its trust activities, and (d)
foreign governments for the Bank’s potential obligations on its overseas operations.
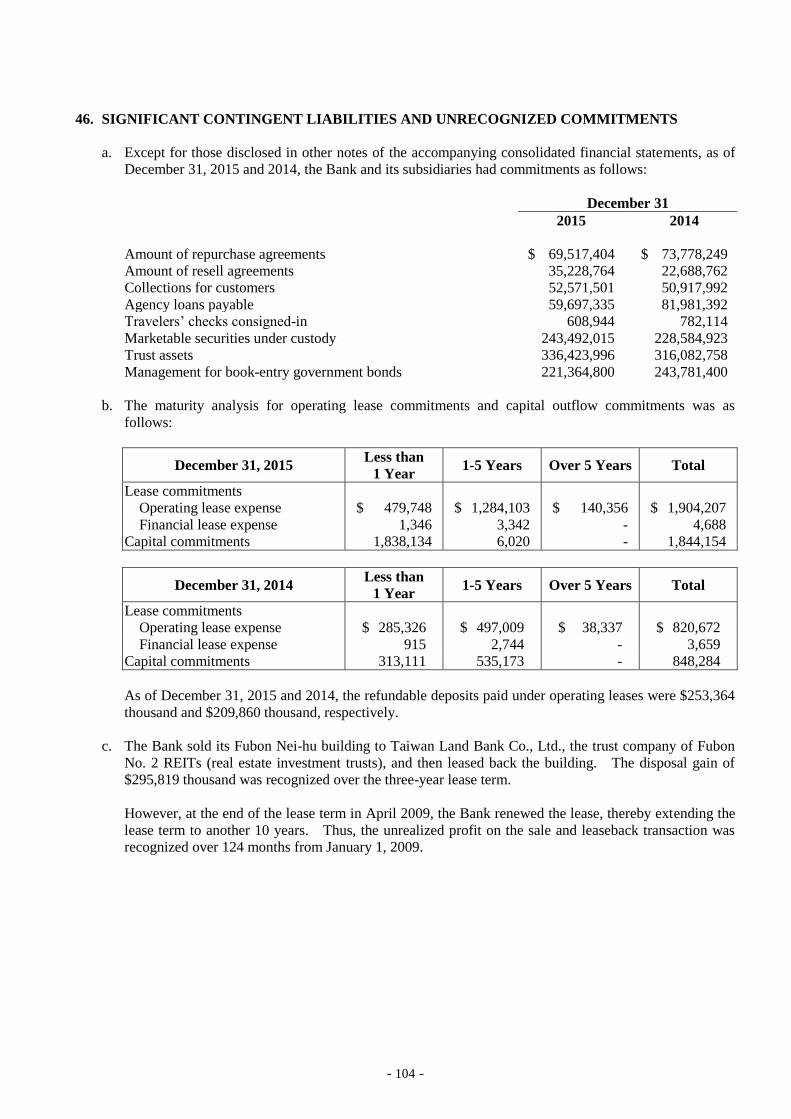
- 104 -
46. SIGNIFICANT CONTINGENT LIABILITIES AND UNRECOGNIZED COMMITMENTS
a. Except for those disclosed in other notes of the accompanying consolidated financial statements, as of
December 31, 2015 and 2014, the Bank and its subsidiaries had commitments as follows:
December 31
2015 2014
Amount of repurchase agreements $ 69,517,404 $ 73,778,249
Amount of resell agreements 35,228,764 22,688,762
Collections for customers 52,571,501 50,917,992
Agency loans payable 59,697,335 81,981,392
Travelers’ checks consigned-in 608,944 782,114
Marketable securities under custody 243,492,015 228,584,923
Trust assets 336,423,996 316,082,758
Management for book-entry government bonds 221,364,800 243,781,400
b. The maturity analysis for operating lease commitments and capital outflow commitments was as
follows:
December 31, 2015 Less than
1 Year 1-5 Years Over 5 Years Total
Lease commitments
Operating lease expense $ 479,748 $ 1,284,103 $ 140,356 $ 1,904,207
Financial lease expense 1,346 3,342 - 4,688
Capital commitments 1,838,134 6,020 - 1,844,154
December 31, 2014 Less than
1 Year 1-5 Years Over 5 Years Total
Lease commitments
Operating lease expense $ 285,326 $ 497,009 $ 38,337 $ 820,672
Financial lease expense 915 2,744 - 3,659
Capital commitments 313,111 535,173 - 848,284
As of December 31, 2015 and 2014, the refundable deposits paid under operating leases were $253,364
thousand and $209,860 thousand, respectively.
c. The Bank sold its Fubon Nei-hu building to Taiwan Land Bank Co., Ltd., the trust company of Fubon
No. 2 REITs (real estate investment trusts), and then leased back the building. The disposal gain of
$295,819 thousand was recognized over the three-year lease term.
However, at the end of the lease term in April 2009, the Bank renewed the lease, thereby extending the
lease term to another 10 years. Thus, the unrealized profit on the sale and leaseback transaction was
recognized over 124 months from January 1, 2009.
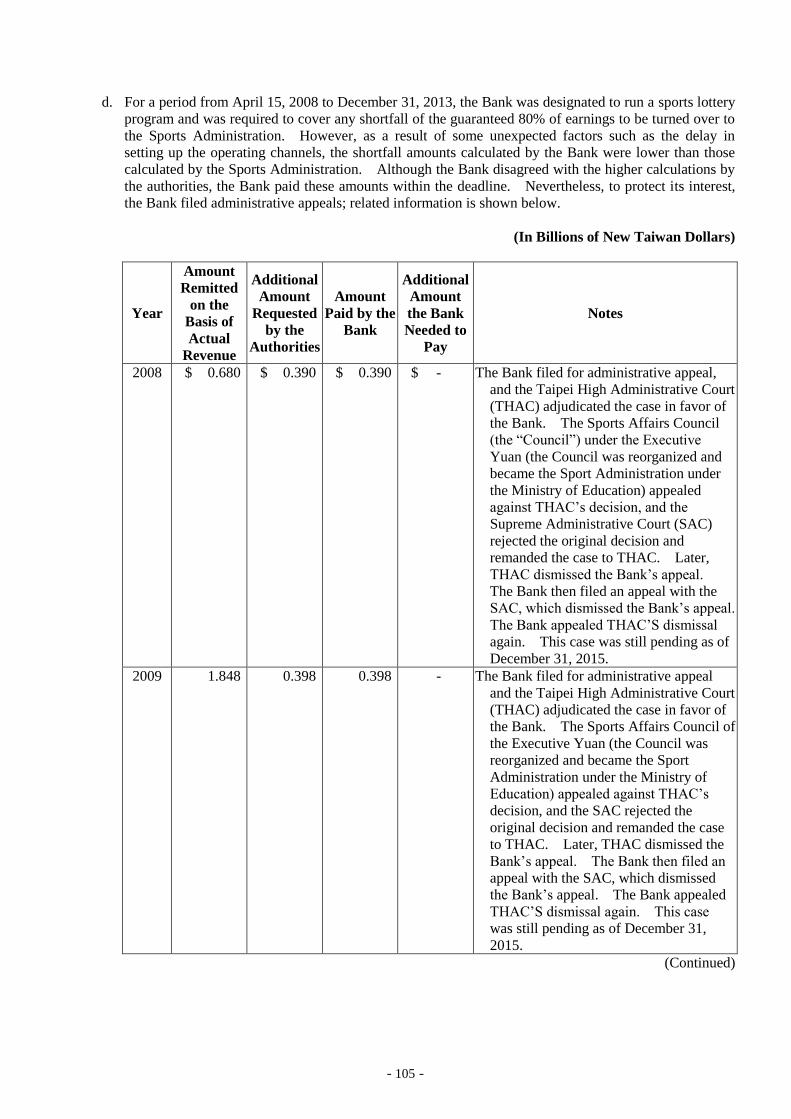
- 105 -
d. For a period from April 15, 2008 to December 31, 2013, the Bank was designated to run a sports lottery
program and was required to cover any shortfall of the guaranteed 80% of earnings to be turned over to
the Sports Administration. However, as a result of some unexpected factors such as the delay in
setting up the operating channels, the shortfall amounts calculated by the Bank were lower than those
calculated by the Sports Administration. Although the Bank disagreed with the higher calculations by
the authorities, the Bank paid these amounts within the deadline. Nevertheless, to protect its interest,
the Bank filed administrative appeals; related information is shown below.
(In Billions of New Taiwan Dollars)
Year
Amount
Remitted
on the
Basis of
Actual
Revenue
Additional
Amount
Requested
by the
Authorities
Amount
Paid by the
Bank
Additional
Amount
the Bank
Needed to
Pay
Notes
2008 $ 0.680 $ 0.390 $ 0.390 $ - The Bank filed for administrative appeal,
and the Taipei High Administrative Court
(THAC) adjudicated the case in favor of
the Bank. The Sports Affairs Council
(the “Council”) under the Executive
Yuan (the Council was reorganized and
became the Sport Administration under
the Ministry of Education) appealed
against THAC’s decision, and the
Supreme Administrative Court (SAC)
rejected the original decision and
remanded the case to THAC. Later,
THAC dismissed the Bank’s appeal.
The Bank then filed an appeal with the
SAC, which dismissed the Bank’s appeal.
The Bank appealed THAC’S dismissal
again. This case was still pending as of
December 31, 2015.
2009 1.848 0.398 0.398 - The Bank filed for administrative appeal
and the Taipei High Administrative Court
(THAC) adjudicated the case in favor of
the Bank. The Sports Affairs Council of
the Executive Yuan (the Council was
reorganized and became the Sport
Administration under the Ministry of
Education) appealed against THAC’s
decision, and the SAC rejected the
original decision and remanded the case
to THAC. Later, THAC dismissed the
Bank’s appeal. The Bank then filed an
appeal with the SAC, which dismissed
the Bank’s appeal. The Bank appealed
THAC’S dismissal again. This case
was still pending as of December 31,
2015.
(Continued)
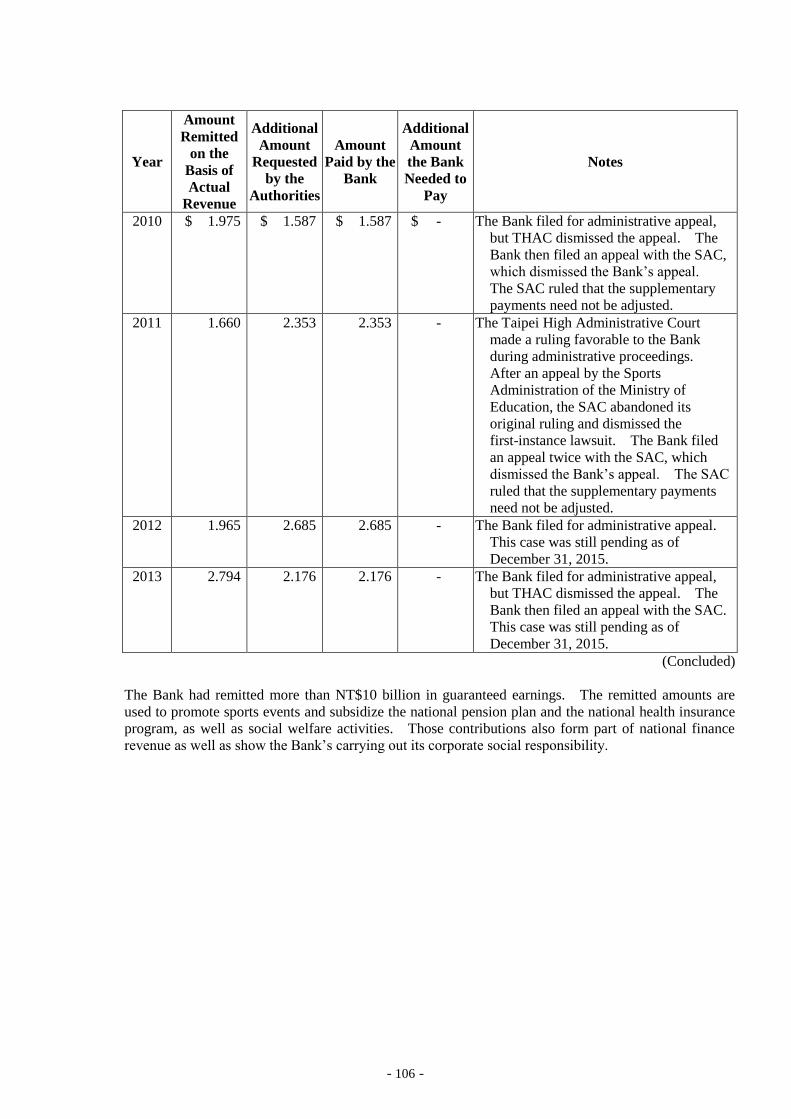
- 106 -
Year
Amount
Remitted
on the
Basis of
Actual
Revenue
Additional
Amount
Requested
by the
Authorities
Amount
Paid by the
Bank
Additional
Amount
the Bank
Needed to
Pay
Notes
2010 $ 1.975 $ 1.587 $ 1.587 $ - The Bank filed for administrative appeal,
but THAC dismissed the appeal. The
Bank then filed an appeal with the SAC,
which dismissed the Bank’s appeal.
The SAC ruled that the supplementary
payments need not be adjusted.
2011 1.660 2.353 2.353 - The Taipei High Administrative Court
made a ruling favorable to the Bank
during administrative proceedings.
After an appeal by the Sports
Administration of the Ministry of
Education, the SAC abandoned its
original ruling and dismissed the
first-instance lawsuit. The Bank filed
an appeal twice with the SAC, which
dismissed the Bank’s appeal. The SAC
ruled that the supplementary payments
need not be adjusted.
2012 1.965 2.685 2.685 - The Bank filed for administrative appeal.
This case was still pending as of
December 31, 2015.
2013 2.794 2.176 2.176 - The Bank filed for administrative appeal,
but THAC dismissed the appeal. The
Bank then filed an appeal with the SAC.
This case was still pending as of
December 31, 2015.
(Concluded)
The Bank had remitted more than NT$10 billion in guaranteed earnings. The remitted amounts are
used to promote sports events and subsidize the national pension plan and the national health insurance
program, as well as social welfare activities. Those contributions also form part of national finance
revenue as well as show the Bank’s carrying out its corporate social responsibility.
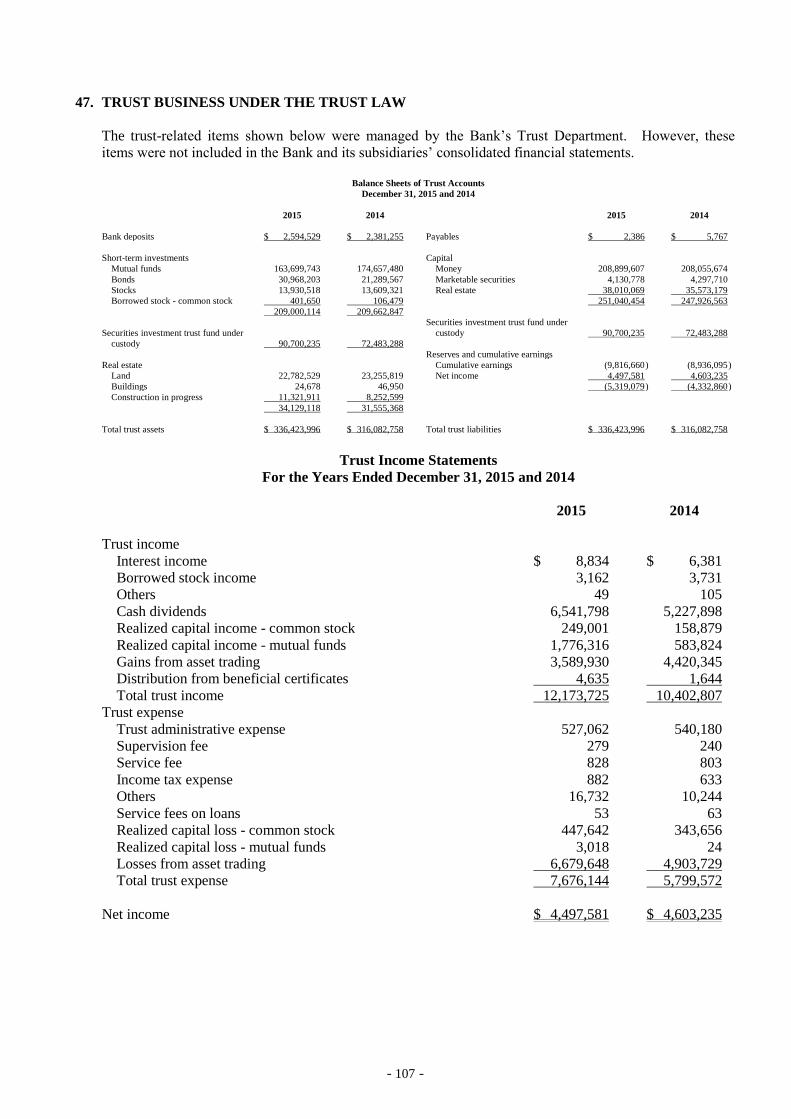
- 107 -
47. TRUST BUSINESS UNDER THE TRUST LAW
The trust-related items shown below were managed by the Bank’s Trust Department. However, these
items were not included in the Bank and its subsidiaries’ consolidated financial statements.
Balance Sheets of Trust Accounts
December 31, 2015 and 2014
2015 2014 2015 2014
Bank deposits $ 2,594,529 $ 2,381,255 Payables $ 2,386 $ 5,767
Short-term investments Capital
Mutual funds 163,699,743 174,657,480 Money 208,899,607 208,055,674
Bonds 30,968,203 21,289,567 Marketable securities 4,130,778 4,297,710
Stocks 13,930,518 13,609,321 Real estate 38,010,069 35,573,179
Borrowed stock - common stock 401,650 106,479 251,040,454 247,926,563
209,000,114 209,662,847
Securities investment trust fund under
Securities investment trust fund under custody 90,700,235 72,483,288
custody 90,700,235 72,483,288
Reserves and cumulative earnings
Real estate Cumulative earnings (9,816,660 ) (8,936,095 )
Land 22,782,529 23,255,819 Net income 4,497,581 4,603,235
Buildings 24,678 46,950 (5,319,079 ) (4,332,860 )
Construction in progress 11,321,911 8,252,599
34,129,118 31,555,368
Total trust assets $ 336,423,996 $ 316,082,758 Total trust liabilities $ 336,423,996 $ 316,082,758
Trust Income Statements
For the Years Ended December 31, 2015 and 2014
2015 2014
Trust income
Interest income $ 8,834 $ 6,381
Borrowed stock income 3,162 3,731
Others 49 105
Cash dividends 6,541,798 5,227,898
Realized capital income - common stock 249,001 158,879
Realized capital income - mutual funds 1,776,316 583,824
Gains from asset trading 3,589,930 4,420,345
Distribution from beneficial certificates 4,635 1,644
Total trust income 12,173,725 10,402,807
Trust expense
Trust administrative expense 527,062 540,180
Supervision fee 279 240
Service fee 828 803
Income tax expense 882 633
Others 16,732 10,244
Service fees on loans 53 63
Realized capital loss - common stock 447,642 343,656
Realized capital loss - mutual funds 3,018 24
Losses from asset trading 6,679,648 4,903,729
Total trust expense 7,676,144 5,799,572
Net income $ 4,497,581 $ 4,603,235
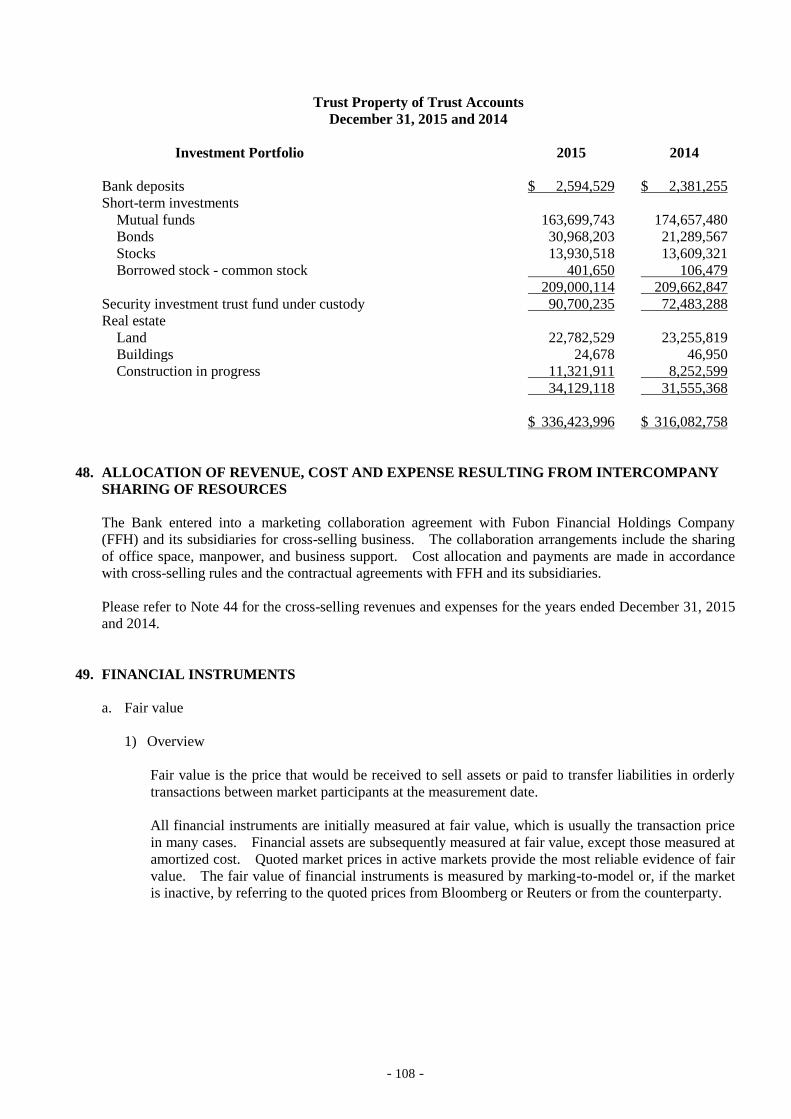
- 108 -
Trust Property of Trust Accounts
December 31, 2015 and 2014
Investment Portfolio 2015 2014
Bank deposits $ 2,594,529 $ 2,381,255
Short-term investments
Mutual funds 163,699,743 174,657,480
Bonds 30,968,203 21,289,567
Stocks 13,930,518 13,609,321
Borrowed stock - common stock 401,650 106,479
209,000,114 209,662,847
Security investment trust fund under custody 90,700,235 72,483,288
Real estate
Land 22,782,529 23,255,819
Buildings 24,678 46,950
Construction in progress 11,321,911 8,252,599
34,129,118 31,555,368
$ 336,423,996 $ 316,082,758
48. ALLOCATION OF REVENUE, COST AND EXPENSE RESULTING FROM INTERCOMPANY
SHARING OF RESOURCES
The Bank entered into a marketing collaboration agreement with Fubon Financial Holdings Company
(FFH) and its subsidiaries for cross-selling business. The collaboration arrangements include the sharing
of office space, manpower, and business support. Cost allocation and payments are made in accordance
with cross-selling rules and the contractual agreements with FFH and its subsidiaries.
Please refer to Note 44 for the cross-selling revenues and expenses for the years ended December 31, 2015
and 2014.
49. FINANCIAL INSTRUMENTS
a. Fair value
1) Overview
Fair value is the price that would be received to sell assets or paid to transfer liabilities in orderly
transactions between market participants at the measurement date.
All financial instruments are initially measured at fair value, which is usually the transaction price
in many cases. Financial assets are subsequently measured at fair value, except those measured at
amortized cost. Quoted market prices in active markets provide the most reliable evidence of fair
value. The fair value of financial instruments is measured by marking-to-model or, if the market
is inactive, by referring to the quoted prices from Bloomberg or Reuters or from the counterparty.
- 109 -
2) The levels of the fair value hierarchy are described below:
a) Level 1
Level 1 financial instruments are traded in an active market and have quoted prices for identical
assets or liabilities. An active market has the following conditions:
i. All financial instruments traded in the market are homogeneous.
ii. Willing buyers and sellers are found in the market all the time.
iii. The public can access the price information easily.
The products categorized in this level usually have high liquidity or are traded in the futures
market or exchanges, such as the spot foreign exchange, listed stocks and Taiwan treasury
benchmark index bond.
b) Level 2
The products categorized in this level have the prices that can be inferred from either direct or
indirect observable inputs other than active market prices. Examples of these inputs are:
i. Quoted prices of similar products in the active market. This means the fair value can be
derived from the current trading prices of similar products. The determination of product
similarity is based on the financial instrument characteristics and the trading rules. The
fair price valuation is subject to adjustments due to differences in prices over time and
between market participants and in trading rules;
ii. Quoted prices of identical or similar financial instruments in inactive markets;
iii. When marking-to-model, observable inputs other than quoted prices (such as interest rates
and yield curves observable at commonly quoted intervals, and implied volatilities), i.e., the
inputs can be observed in the market and can reflect the expectation of market participants;
iv. Inputs derived from or corroborated by observable market data by correlation or other
means.
The fair values of the products categorized in this level are based on inputs used for a simple
model or valuation model generally accepted by the market. Examples of these products are
forward contracts, cross-currency swap, simple interest-earning bonds and simple foreign
exchange options.
c) Level 3
The fair prices of Level 3 products, which include financial instruments and investment
properties, are based on inputs other than direct market data. For example, historical volatility
used in valuing options is an unobservable input because it cannot represent the entire market
participants’ expectation of future volatility.
The products categorized in this level are complex derivative financial instruments or products
with prices provided by brokers, such as complex foreign exchange options, commodity
options, and complex interest rate options.
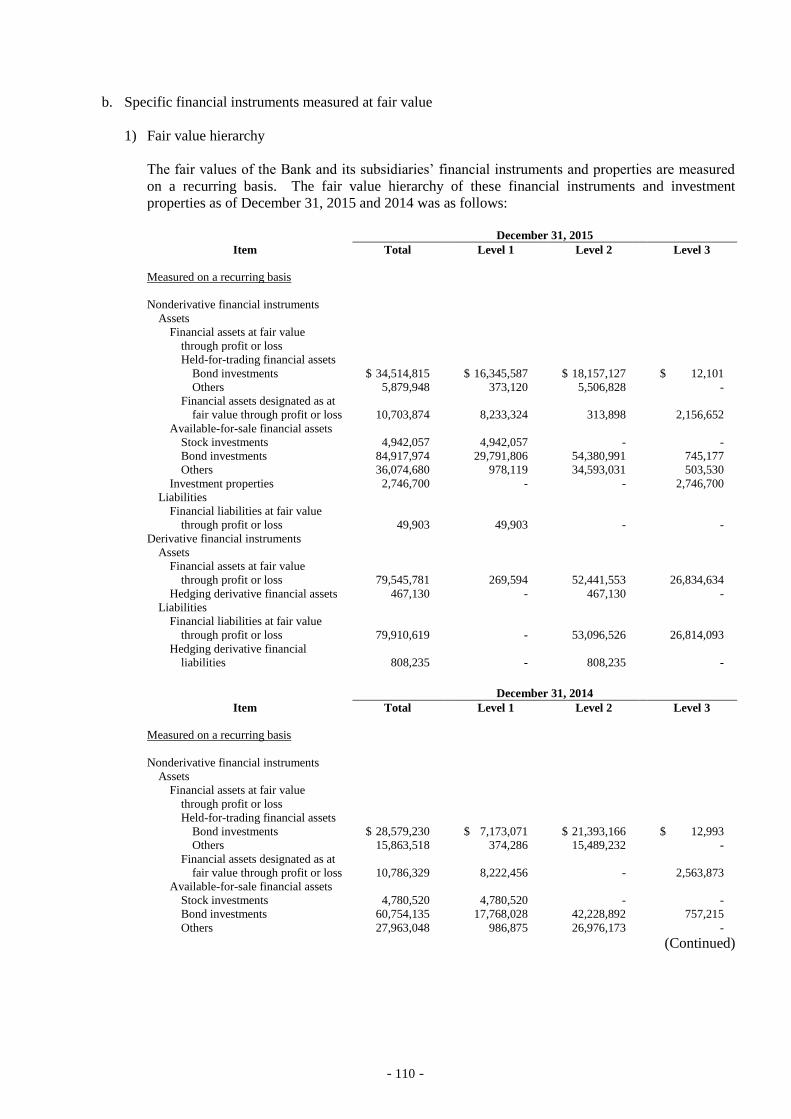
- 110 -
b. Specific financial instruments measured at fair value
1) Fair value hierarchy
The fair values of the Bank and its subsidiaries’ financial instruments and properties are measured
on a recurring basis. The fair value hierarchy of these financial instruments and investment
properties as of December 31, 2015 and 2014 was as follows:
December 31, 2015
Item Total Level 1 Level 2 Level 3
Measured on a recurring basis
Nonderivative financial instruments
Assets
Financial assets at fair value
through profit or loss
Held-for-trading financial assets
Bond investments $ 34,514,815 $ 16,345,587 $ 18,157,127 $ 12,101
Others 5,879,948 373,120 5,506,828 -
Financial assets designated as at
fair value through profit or loss 10,703,874 8,233,324 313,898 2,156,652
Available-for-sale financial assets
Stock investments 4,942,057 4,942,057 - -
Bond investments 84,917,974 29,791,806 54,380,991 745,177
Others 36,074,680 978,119 34,593,031 503,530
Investment properties 2,746,700 - - 2,746,700
Liabilities
Financial liabilities at fair value
through profit or loss 49,903 49,903 - -
Derivative financial instruments
Assets
Financial assets at fair value
through profit or loss 79,545,781 269,594 52,441,553 26,834,634
Hedging derivative financial assets 467,130 - 467,130 -
Liabilities
Financial liabilities at fair value
through profit or loss 79,910,619 - 53,096,526 26,814,093
Hedging derivative financial
liabilities 808,235 - 808,235 -
December 31, 2014
Item Total Level 1 Level 2 Level 3
Measured on a recurring basis
Nonderivative financial instruments
Assets
Financial assets at fair value
through profit or loss
Held-for-trading financial assets
Bond investments $ 28,579,230 $ 7,173,071 $ 21,393,166 $ 12,993
Others 15,863,518 374,286 15,489,232 -
Financial assets designated as at
fair value through profit or loss 10,786,329 8,222,456 - 2,563,873
Available-for-sale financial assets
Stock investments 4,780,520 4,780,520 - -
Bond investments 60,754,135 17,768,028 42,228,892 757,215
Others 27,963,048 986,875 26,976,173 -
(Continued)
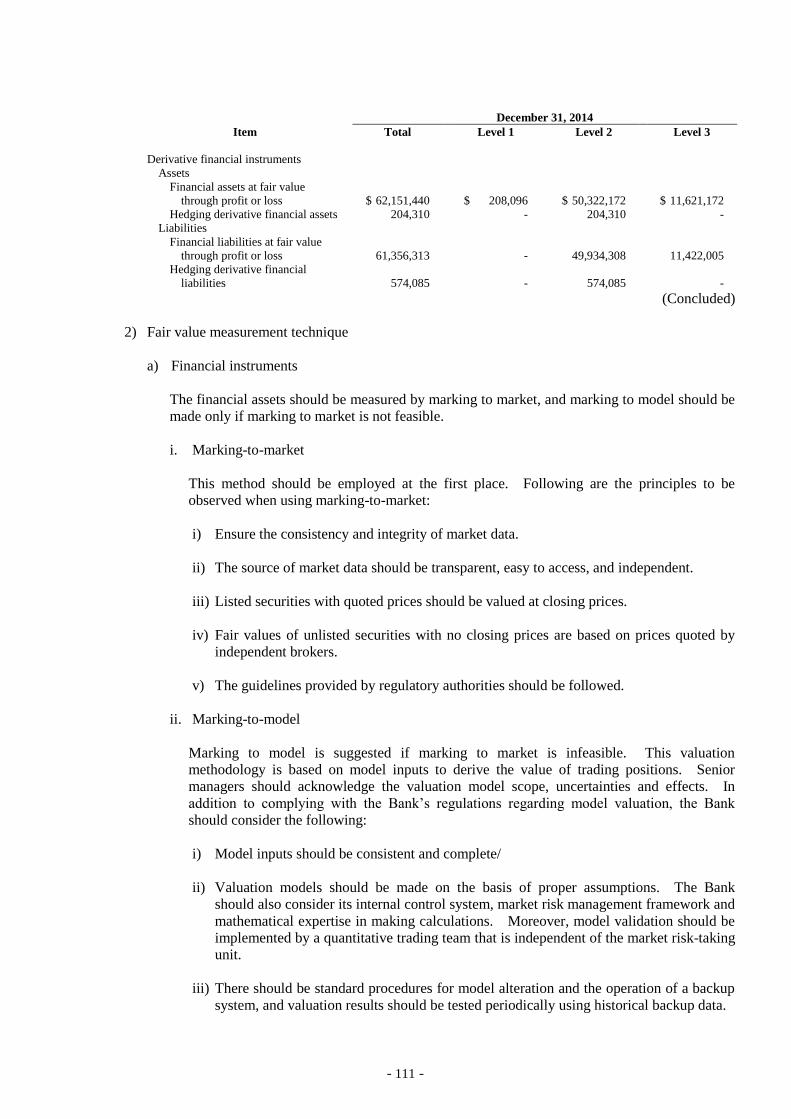
- 111 -
December 31, 2014
Item Total Level 1 Level 2 Level 3
Derivative financial instruments
Assets
Financial assets at fair value
through profit or loss $ 62,151,440 $ 208,096 $ 50,322,172 $ 11,621,172
Hedging derivative financial assets 204,310 - 204,310 -
Liabilities
Financial liabilities at fair value
through profit or loss 61,356,313 - 49,934,308 11,422,005
Hedging derivative financial
liabilities 574,085 - 574,085 -
(Concluded)
2) Fair value measurement technique
a) Financial instruments
The financial assets should be measured by marking to market, and marking to model should be
made only if marking to market is not feasible.
i. Marking-to-market
This method should be employed at the first place. Following are the principles to be
observed when using marking-to-market:
i) Ensure the consistency and integrity of market data.
ii) The source of market data should be transparent, easy to access, and independent.
iii) Listed securities with quoted prices should be valued at closing prices.
iv) Fair values of unlisted securities with no closing prices are based on prices quoted by
independent brokers.
v) The guidelines provided by regulatory authorities should be followed.
ii. Marking-to-model
Marking to model is suggested if marking to market is infeasible. This valuation
methodology is based on model inputs to derive the value of trading positions. Senior
managers should acknowledge the valuation model scope, uncertainties and effects. In
addition to complying with the Bank’s regulations regarding model valuation, the Bank
should consider the following:
i) Model inputs should be consistent and complete/
ii) Valuation models should be made on the basis of proper assumptions. The Bank
should also consider its internal control system, market risk management framework and
mathematical expertise in making calculations. Moreover, model validation should be
implemented by a quantitative trading team that is independent of the market risk-taking
unit.
iii) There should be standard procedures for model alteration and the operation of a backup
system, and valuation results should be tested periodically using historical backup data.
- 112 -
The Bank and its subsidiaries’ fair value measurement model - such as the Black-Scholes option
pricing model or Monte Carlo Simulation - is widely used in the industry. Some valuation
model parameters consist of unobservable information in markets. Thus, the Bank and its
subsidiaries must make proper fair value estimates based on assumptions. For estimating the
impact of parameters based on unobservable data, the Bank’s “Quantitive Information on
Significant Unobservable Inputs (Level 3)” is used as reference.
b) Non-financial instruments
Fair value of investment properties is measured using the income approach based on the
valuations carried out by independent qualified professional valuers. The related data and
inputs are as follows:
i. Cash flows The Bank and its subsidiaries evaluate market rentals of comparable properties
on the basis of current lease agreements, local rental prices and market similarity, and rule
out the values that are too high or too low. In addition, properties with terminal values
should add the present value of terminal value to their market rentals.
ii. Analysis period: The income is measured by 10 years.
iii. Discount rate: The discount rate is based on the interest rate for two-year time deposits as
posted by Chunghwa Post Co., Ltd., plus 0.75% and asset-specific risk premiums 2.5%.
3) Fair value adjustment
Credit risk value adjustments included in the calculation of the fair value of financial instruments
take into account the counterparties’ credit risk and the Bank and its subsidiaries’ credit quality.
Credit risk value adjustment means the fair value of derivative contracts reflecting the credit risks of
both parties to a transaction. It is mainly divided into credit value adjustments and debit value
adjustments.
a) Credit valuation adjustment (CVA) is used for derivative contracts that are traded over the
counter. It is the adjustment required for the value of a derivative asset to reflect the
counterparty’s credit risk.
b) Debit valuation adjustment (DVA) is used for derivative contracts that are traded over the
counter. It is the adjustment required for the value of a derivative liability to reflect
non-performance risk, including credit risk, of the Bank and its subsidiaries.
CVA and DVA are the tools for estimating losses, which are calculated using models with inputs of
Probability of Default (PD) and Loss Given Default (LGD) multiplying Exposure at Default (EAD).
The Bank and its subsidiaries calculate expected loss by multiplying the probability of default (PD)
by the loss given default (LGD) by the exposure at default (EAD).
The Bank and its subsidiaries calculate EAD using the mark-to-market fair value of OTC derivative
instruments.
The Bank and its subsidiaries uses 60% as the PD in accordance with “IFRS 13 CVA and
DVA-related Disclosure Guidelines” issued by the Taiwan Stock Exchange.
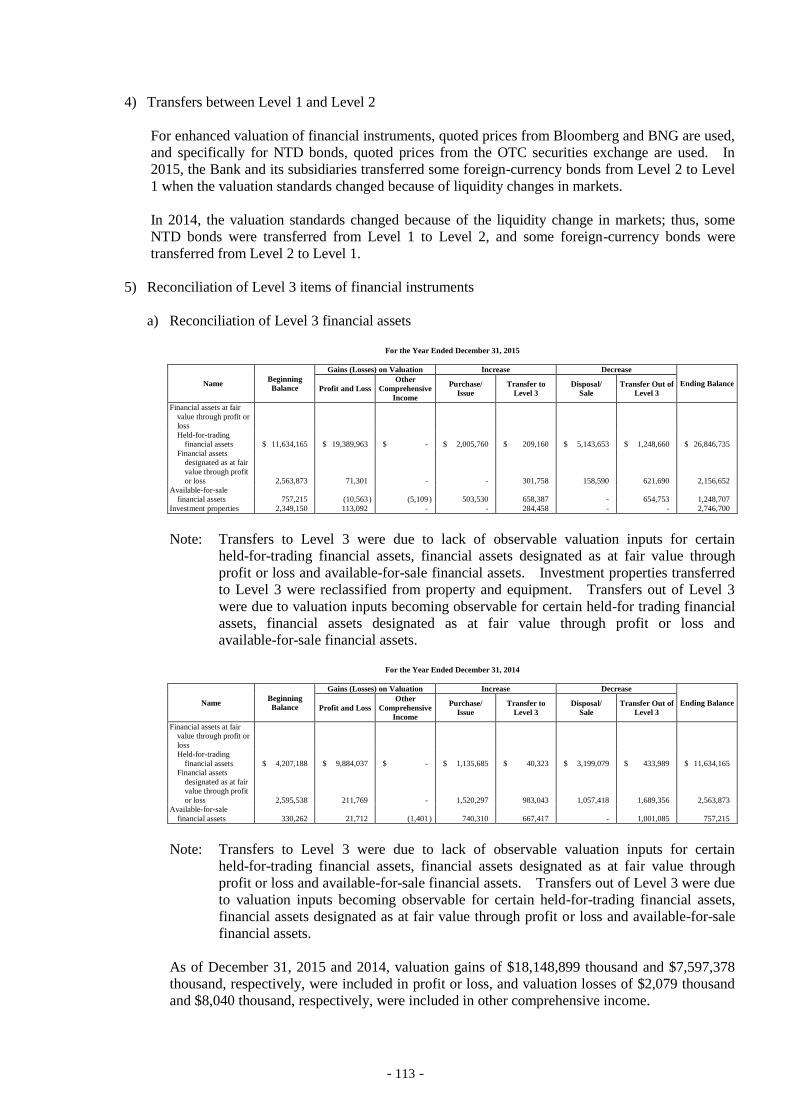
- 113 -
4) Transfers between Level 1 and Level 2
For enhanced valuation of financial instruments, quoted prices from Bloomberg and BNG are used,
and specifically for NTD bonds, quoted prices from the OTC securities exchange are used. In
2015, the Bank and its subsidiaries transferred some foreign-currency bonds from Level 2 to Level
1 when the valuation standards changed because of liquidity changes in markets.
In 2014, the valuation standards changed because of the liquidity change in markets; thus, some
NTD bonds were transferred from Level 1 to Level 2, and some foreign-currency bonds were
transferred from Level 2 to Level 1.
5) Reconciliation of Level 3 items of financial instruments
a) Reconciliation of Level 3 financial assets
For the Year Ended December 31, 2015
Name Beginning
Balance
Gains (Losses) on Valuation Increase Decrease
Ending Balance Profit and Loss
Other
Comprehensive
Income
Purchase/
Issue
Transfer to
Level 3
Disposal/
Sale
Transfer Out of
Level 3
Financial assets at fair
value through profit or
loss
Held-for-trading
financial assets $ 11,634,165 $ 19,389,963 $ - $ 2,005,760 $ 209,160 $ 5,143,653 $ 1,248,660 $ 26,846,735
Financial assets
designated as at fair
value through profit
or loss 2,563,873 71,301 - - 301,758 158,590 621,690 2,156,652
Available-for-sale
financial assets 757,215 (10,563 ) (5,109 ) 503,530 658,387 - 654,753 1,248,707
Investment properties 2,349,150 113,092 - - 284,458 - - 2,746,700
Note: Transfers to Level 3 were due to lack of observable valuation inputs for certain
held-for-trading financial assets, financial assets designated as at fair value through
profit or loss and available-for-sale financial assets. Investment properties transferred
to Level 3 were reclassified from property and equipment. Transfers out of Level 3
were due to valuation inputs becoming observable for certain held-for trading financial
assets, financial assets designated as at fair value through profit or loss and
available-for-sale financial assets.
For the Year Ended December 31, 2014
Name Beginning
Balance
Gains (Losses) on Valuation Increase Decrease
Ending Balance Profit and Loss
Other
Comprehensive
Income
Purchase/
Issue
Transfer to
Level 3
Disposal/
Sale
Transfer Out of
Level 3
Financial assets at fair
value through profit or
loss
Held-for-trading
financial assets $ 4,207,188 $ 9,884,037 $ - $ 1,135,685 $ 40,323 $ 3,199,079 $ 433,989 $ 11,634,165
Financial assets
designated as at fair
value through profit
or loss 2,595,538 211,769 - 1,520,297 983,043 1,057,418 1,689,356 2,563,873
Available-for-sale
financial assets 330,262 21,712 (1,401 ) 740,310 667,417 - 1,001,085 757,215
Note: Transfers to Level 3 were due to lack of observable valuation inputs for certain
held-for-trading financial assets, financial assets designated as at fair value through
profit or loss and available-for-sale financial assets. Transfers out of Level 3 were due
to valuation inputs becoming observable for certain held-for-trading financial assets,
financial assets designated as at fair value through profit or loss and available-for-sale
financial assets.
As of December 31, 2015 and 2014, valuation gains of $18,148,899 thousand and $7,597,378
thousand, respectively, were included in profit or loss, and valuation losses of $2,079 thousand
and $8,040 thousand, respectively, were included in other comprehensive income.
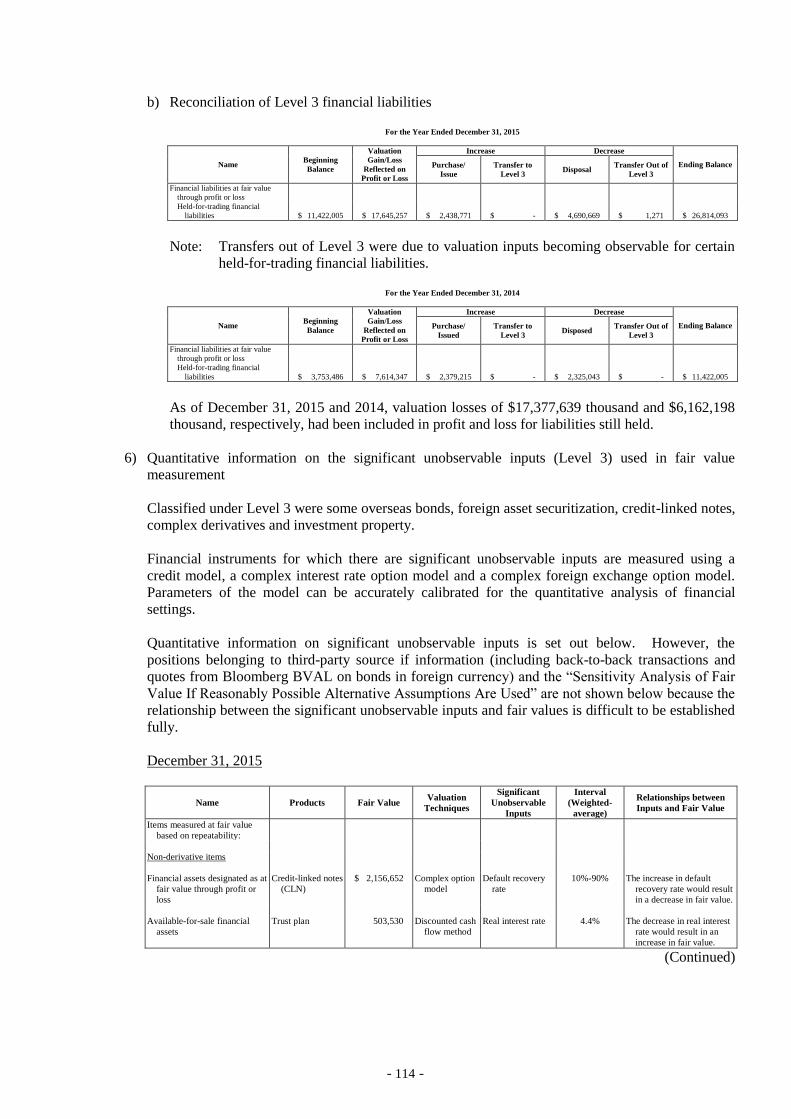
- 114 -
b) Reconciliation of Level 3 financial liabilities
For the Year Ended December 31, 2015
Name Beginning
Balance
Valuation
Gain/Loss
Reflected on
Profit or Loss
Increase Decrease
Ending Balance Purchase/
Issue
Transfer to
Level 3 Disposal
Transfer Out of
Level 3
Financial liabilities at fair value
through profit or loss
Held-for-trading financial
liabilities $ 11,422,005 $ 17,645,257 $ 2,438,771 $ - $ 4,690,669 $ 1,271 $ 26,814,093
Note: Transfers out of Level 3 were due to valuation inputs becoming observable for certain
held-for-trading financial liabilities.
For the Year Ended December 31, 2014
Name Beginning
Balance
Valuation
Gain/Loss
Reflected on
Profit or Loss
Increase Decrease
Ending Balance Purchase/
Issued
Transfer to
Level 3 Disposed
Transfer Out of
Level 3
Financial liabilities at fair value
through profit or loss
Held-for-trading financial
liabilities $ 3,753,486 $ 7,614,347 $ 2,379,215 $ - $ 2,325,043 $ - $ 11,422,005
As of December 31, 2015 and 2014, valuation losses of $17,377,639 thousand and $6,162,198
thousand, respectively, had been included in profit and loss for liabilities still held.
6) Quantitative information on the significant unobservable inputs (Level 3) used in fair value
measurement
Classified under Level 3 were some overseas bonds, foreign asset securitization, credit-linked notes,
complex derivatives and investment property.
Financial instruments for which there are significant unobservable inputs are measured using a
credit model, a complex interest rate option model and a complex foreign exchange option model.
Parameters of the model can be accurately calibrated for the quantitative analysis of financial
settings.
Quantitative information on significant unobservable inputs is set out below. However, the
positions belonging to third-party source if information (including back-to-back transactions and
quotes from Bloomberg BVAL on bonds in foreign currency) and the “Sensitivity Analysis of Fair
Value If Reasonably Possible Alternative Assumptions Are Used” are not shown below because the
relationship between the significant unobservable inputs and fair values is difficult to be established
fully.
December 31, 2015
Name Products Fair Value Valuation
Techniques
Significant
Unobservable
Inputs
Interval
(Weighted-
average)
Relationships between
Inputs and Fair Value
Items measured at fair value
based on repeatability:
Non-derivative items
Financial assets designated as at
fair value through profit or
loss
Credit-linked notes
(CLN)
$ 2,156,652 Complex option
model
Default recovery
rate
10%-90% The increase in default
recovery rate would result
in a decrease in fair value.
Available-for-sale financial
assets
Trust plan 503,530 Discounted cash
flow method
Real interest rate 4.4% The decrease in real interest
rate would result in an
increase in fair value.
(Continued)
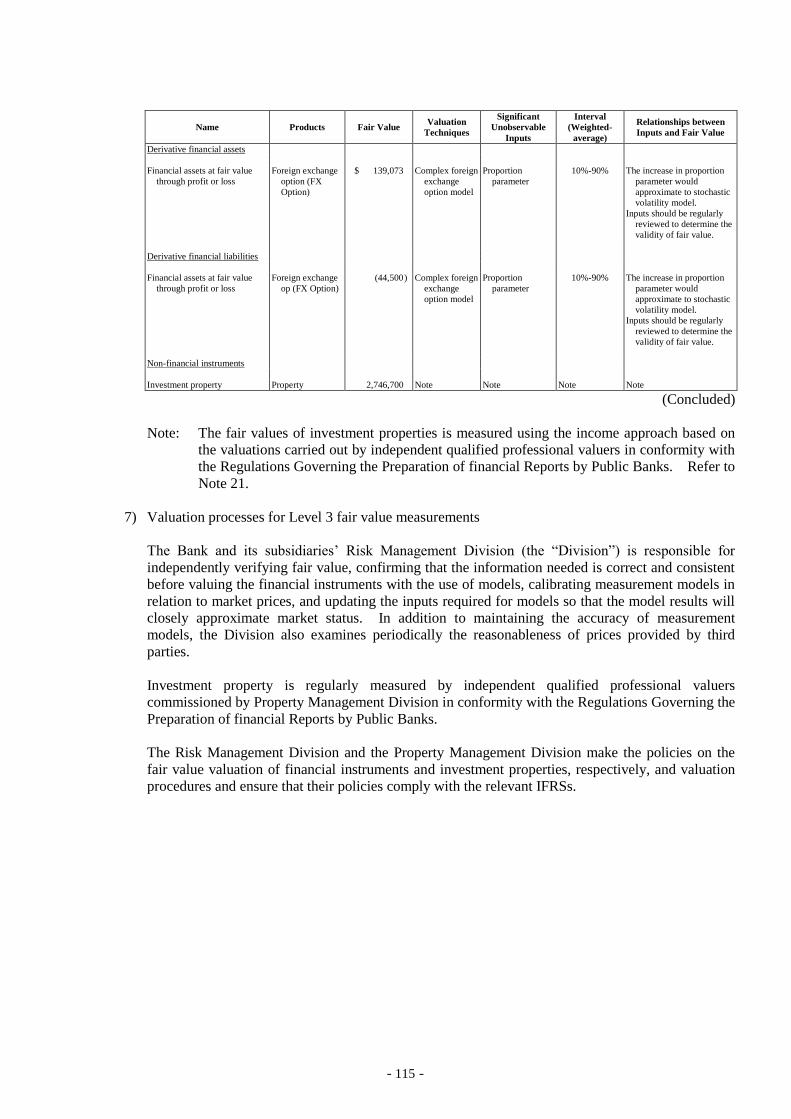
- 115 -
Name Products Fair Value Valuation
Techniques
Significant
Unobservable
Inputs
Interval
(Weighted-
average)
Relationships between
Inputs and Fair Value
Derivative financial assets
Financial assets at fair value
through profit or loss
Foreign exchange
option (FX
Option)
$ 139,073 Complex foreign
exchange
option model
Proportion
parameter
10%-90% The increase in proportion
parameter would
approximate to stochastic
volatility model.
Inputs should be regularly
reviewed to determine the
validity of fair value.
Derivative financial liabilities
Financial assets at fair value
through profit or loss
Foreign exchange
op (FX Option)
(44,500 ) Complex foreign
exchange
option model
Proportion
parameter
10%-90% The increase in proportion
parameter would
approximate to stochastic
volatility model.
Inputs should be regularly
reviewed to determine the
validity of fair value.
Non-financial instruments
Investment property Property 2,746,700 Note Note Note Note
(Concluded)
Note: The fair values of investment properties is measured using the income approach based on
the valuations carried out by independent qualified professional valuers in conformity with
the Regulations Governing the Preparation of financial Reports by Public Banks. Refer to
Note 21.
7) Valuation processes for Level 3 fair value measurements
The Bank and its subsidiaries’ Risk Management Division (the “Division”) is responsible for
independently verifying fair value, confirming that the information needed is correct and consistent
before valuing the financial instruments with the use of models, calibrating measurement models in
relation to market prices, and updating the inputs required for models so that the model results will
closely approximate market status. In addition to maintaining the accuracy of measurement
models, the Division also examines periodically the reasonableness of prices provided by third
parties.
Investment property is regularly measured by independent qualified professional valuers
commissioned by Property Management Division in conformity with the Regulations Governing the
Preparation of financial Reports by Public Banks.
The Risk Management Division and the Property Management Division make the policies on the
fair value valuation of financial instruments and investment properties, respectively, and valuation
procedures and ensure that their policies comply with the relevant IFRSs.
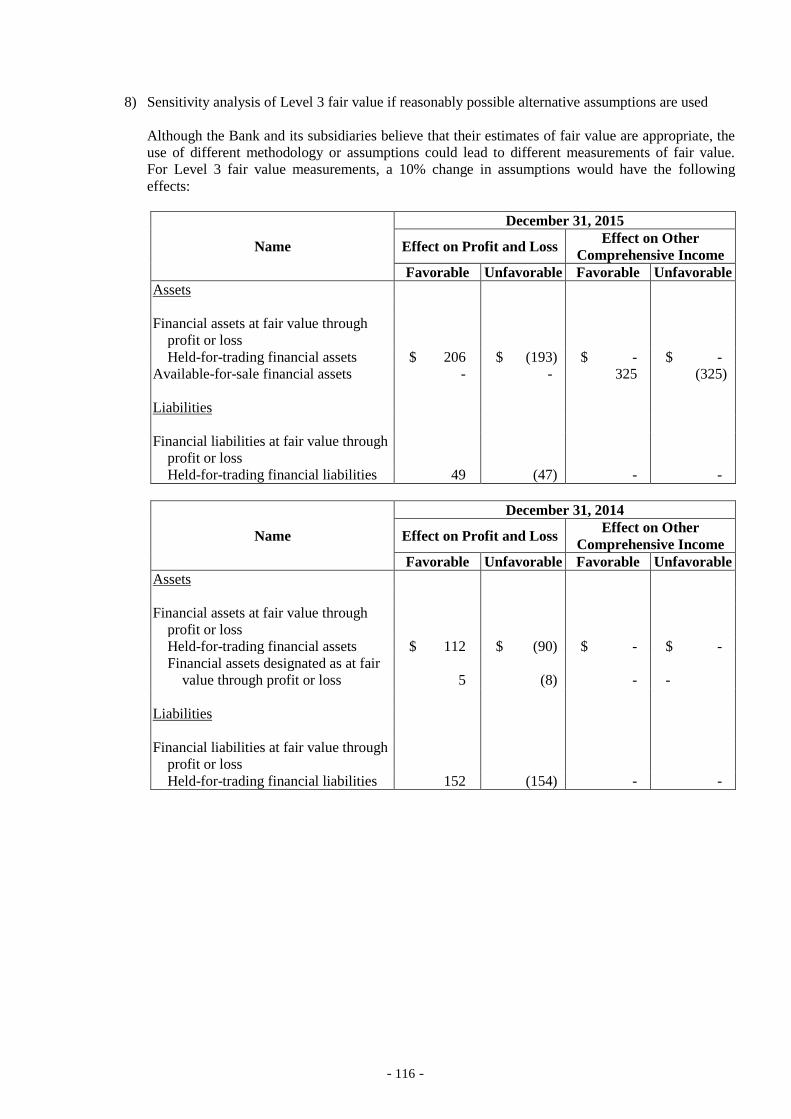
- 116 -
8) Sensitivity analysis of Level 3 fair value if reasonably possible alternative assumptions are used
Although the Bank and its subsidiaries believe that their estimates of fair value are appropriate, the
use of different methodology or assumptions could lead to different measurements of fair value.
For Level 3 fair value measurements, a 10% change in assumptions would have the following
effects:
Name
December 31, 2015
Effect on Profit and Loss Effect on Other
Comprehensive Income
Favorable Unfavorable Favorable Unfavorable
Assets
Financial assets at fair value through
profit or loss
Held-for-trading financial assets $ 206 $ (193) $ - $ -
Available-for-sale financial assets - - 325 (325)
Liabilities
Financial liabilities at fair value through
profit or loss
Held-for-trading financial liabilities 49 (47) - -
Name
December 31, 2014
Effect on Profit and Loss Effect on Other
Comprehensive Income
Favorable Unfavorable Favorable Unfavorable
Assets
Financial assets at fair value through
profit or loss
Held-for-trading financial assets $ 112 $ (90) $ - $ -
Financial assets designated as at fair
value through profit or loss 5 (8) - -
Liabilities
Financial liabilities at fair value through
profit or loss
Held-for-trading financial liabilities 152 (154) - -
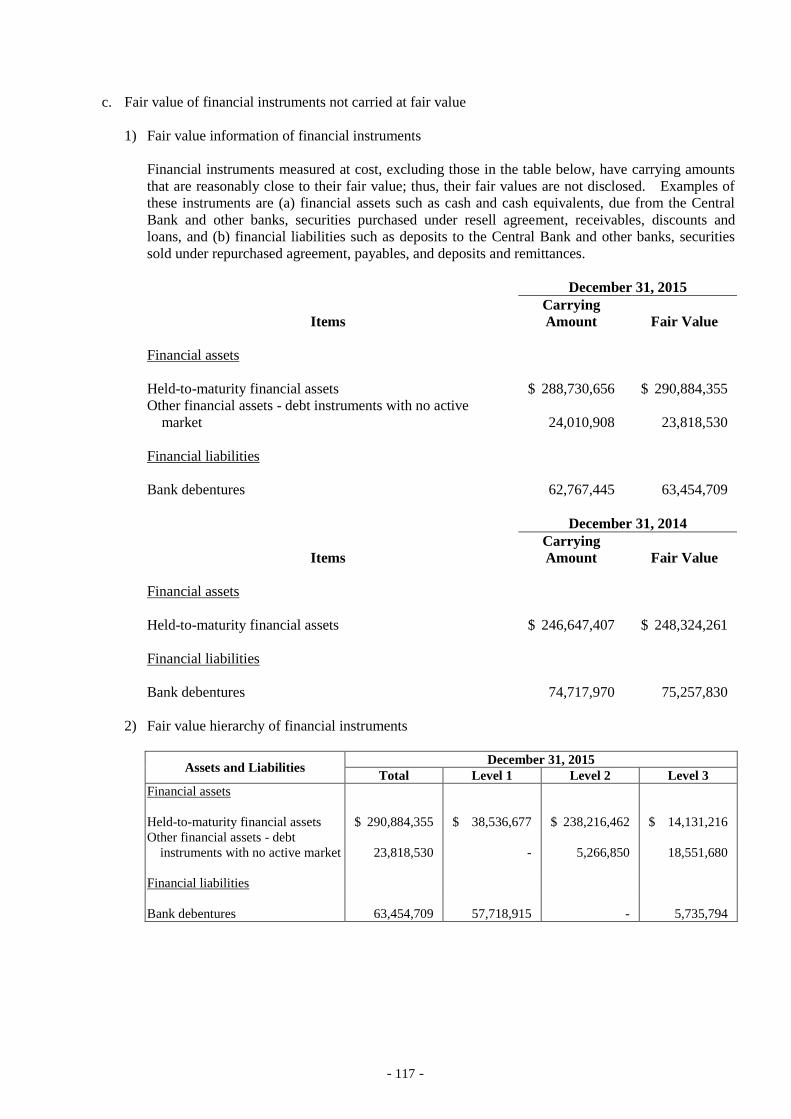
- 117 -
c. Fair value of financial instruments not carried at fair value
1) Fair value information of financial instruments
Financial instruments measured at cost, excluding those in the table below, have carrying amounts
that are reasonably close to their fair value; thus, their fair values are not disclosed. Examples of
these instruments are (a) financial assets such as cash and cash equivalents, due from the Central
Bank and other banks, securities purchased under resell agreement, receivables, discounts and
loans, and (b) financial liabilities such as deposits to the Central Bank and other banks, securities
sold under repurchased agreement, payables, and deposits and remittances.
December 31, 2015
Items
Carrying
Amount Fair Value
Financial assets
Held-to-maturity financial assets $ 288,730,656 $ 290,884,355
Other financial assets - debt instruments with no active
market 24,010,908 23,818,530
Financial liabilities
Bank debentures 62,767,445 63,454,709
December 31, 2014
Items
Carrying
Amount Fair Value
Financial assets
Held-to-maturity financial assets $ 246,647,407 $ 248,324,261
Financial liabilities
Bank debentures 74,717,970 75,257,830
2) Fair value hierarchy of financial instruments
Assets and Liabilities December 31, 2015
Total Level 1 Level 2 Level 3
Financial assets
Held-to-maturity financial assets $ 290,884,355 $ 38,536,677 $ 238,216,462 $ 14,131,216
Other financial assets - debt
instruments with no active market 23,818,530 - 5,266,850 18,551,680
Financial liabilities
Bank debentures 63,454,709 57,718,915 - 5,735,794
- 118 -
3) Measurement technique
Methods and assumptions applied in estimating the fair values of financial instruments not carried
at fair value are as follows:
a) The carrying amounts of financial instruments such as cash and cash equivalents, due from the
Central Bank and call loans to other banks, securities purchased under resell agreements,
receivables, part of other financial assets, due to the Central Bank and other banks, funds
borrowed from the Central Bank and other banks, securities sold under repurchase agreements,
payables, and some funds obtained from the government intended for specific types of loans and
remittances approximate their fair values because of the short maturities of these instruments.
b) Discounts and loans, deposits, and principals of structured products are interest-earning
financial assets/interest-bearing financial liabilities; thus, their carrying amounts approximate
their fair values. The carrying amounts of nonperforming loans are estimated at their
recoverable amounts after considering the reserve for credit losses; thus the carrying amounts
are regarded as fair value.
c) Held-to-maturity financial assets, debt instruments with no active market and bank debentures
are based on their quoted prices in an active market. For those instruments with no quoted
market prices, their fair values are determined using valuation techniques incorporating
estimates and assumptions consistent with those generally used by other market participants to
price financial instruments.
d) Equity investments accounted for as financial assets carried at cost have no quoted prices in an
active market and have a wide range of fair value measurements; hence, their carrying amounts
are considered their fair value.
50. FINANCIAL RISK MANAGEMENT
a. Overview
The Bank and its subsidiaries have been fully devoted to establishing a robust risk management culture
and environment, improving the comprehensive risk management system, pursuing the optimization of
risks and rewards, formulating faultless risk management procedures and related business hedging
strategies, complying with the risk management requirements of the Basel Accord framework,
continually elevating professional level in risk management, assisting business sustainable growth, and
optimizing shareholder’s value.
The major risks faced by the Bank and its subsidiaries on and off balance sheet include credit risk,
market risk (including interest rate, foreign exchange, equity and commodity risks) and liquidity risk.
The Bank and its subsidiaries have duly established risk management policies, principles, rules and
regulations approved by the Board of Directors, to ensure consistent compliance with the
comprehensive risk management systems, and to identify, measure, monitor, transfer, and mitigate the
Bank and its subsidiaries’ credit, market, and liquidity risks.
- 119 -
b. Risk management framework
Taipei Fubon Bank
The Bank adopts three lines of defense in its risk management framework to ensure operating
effectiveness of risk management system. Business, operation, and management units each undertake
the first line of defense role to ensure compliance with risk management requirements and
implementation of the risk control procedures while performing their job functions. Risk management
units assume an independent role in enacting the second line of defense, and is responsible for
designing a risk management system, monitoring risk exposures and submitting risk reports. The audit
department conducts the third defense line by independently examining the compliance of various risk
management system and requirements.
The Board of Directors oversees the establishment of the Bank’s effective risk management system and
mechanism; approves risk management policies, principles, regulations and rules; and reviews
important risk management reports. The Bank has established an Asset/Liability Management
Committee under the Chairman. This Committee is in charge of the Bank’s business strategy,
manages assets and liabilities and capital adequacy, and sustains liquidity and enhances the
management of the sources and use of capital to pursue the Bank’s best interests under acceptable risks.
The Committee is chaired by the Bank’s Chairman and of its members are the Vice Chairman, President
and senior managers of relevant departments. The Committee meetings are held monthly and at other
times depending on business needs.
To strengthen risk management functions, the Credit Risk Management Committee, Market Risk
Management Committee, and Operational Risk Management Committee under the Bank’s Chairman
have been established. The members of the committees include the President and senior managers of
relevant departments. The committees are chaired by the Bank President. The committees’ meetings
are held monthly and at other times depending on business needs to review the mechanism for credit,
market and operational risk management; review credit risk and country risk exposures, changes in
positions and asset quality; monitor market risk limits and exposures; inspect operational loss events;
and carry out relevant remedial courses of action.
Furthermore, the Bank has established the Risk Management Division independent of business units,
and this Division is responsible for monitoring and managing risks and submitting risk management
reports to the Board periodically.
Fubon Bank (China)
FBC’s comprehensive risk management is being led by its Board of directors and senior management
and features an independent risk department that maintains a close connection with each business unit.
The Board, as the highest decision-making body, takes the ultimate responsibility for risk management
and decides FBC’s overall risk tolerance. The Risk & Related Party Transaction Committee,
Supervisory Committee, Strategy Committee and Audit Committee under the Board monitor evaluate
the effectiveness of risk management practices.
The senior management and its subcommittees are responsible for implementing risk policies
authorized by the Board. They define individual risk management levels using a certain coding
system, enhance the effectivity of risk management practices, optimize workflow, and take timely risk
prevention measures. The Risk Management Department identifies, quantifies and monitors risk
factors and reports FBC’s overall risks to senior management and the Board. The Internal Audit
Department independently evaluates the internal control codes for effectiveness, comprehensiveness,
and accuracy.
- 120 -
c. Credit risk
1) Credit risk definitions and sources
Taipei Fubon Bank
Credit risk refers to the risk of losses caused by borrowers, debtors, or counterparties’ failure to
fulfill their contractual obligations because of deteriorating financial position or other factors. It
arises principally from businesses such as discounts, loans, credit cards, due from or call loans to
banks, debt investments, derivatives etc., but also from off-balance sheet products such as
guarantees, acceptance, letters of credit and other commitments.
Fubon Bank (China)
Credit risk is the primary risk faced by Fubon Bank (China), and it mainly comes from commercial
lending (discounts, negotiations, acceptance bills, issued letters of credit, standby letters of credit,
bank guarantees, etc.), financial derivative contracts, and bond investments.
2) Strategy/objectives/policies and procedures
Taipei Fubon Bank
The Bank has established solid credit risk policies and procedures. A robust credit risk strategy
taking into account the economic environment, industry sector and financial sector as well as
corporate business plan is in place. The Bank pursues the optimization of risks and rewards.
Comprehensive credit risk management systems and tools have been deployed effectively to
identify, evaluate, monitor and report credit risks including default, counterparty and concentration
risks.
Fubon Bank (China)
The credit risk management of Fubon Bank (China) FBC is based on its comprehensive risk
management system. Under this system is the Risk & Related Party Transaction Committee,
which the Board oversees. This Committee supervises the implementation of credit risk policies,
evaluates risk tolerances and makes recommendations on the strengthening of credit risk
management practices. The Credit Committee, which is supervised by senior management,
reviews credit lines within a certain limit. The Supervisory Committee, which is also under the
Board’s oversight, approves FBC’s lending policies as well as authorizes credit lines that exceed the
Credit Committee’s authorized-approval limit to strengthen risk control over large credit lines.
FBC also has a Risk Management Department, which includes the Risk Control Division, Credit
Policy & Planning Division, Post-Disbursement Risk Management Division and Credit Approval &
Administration Division, which identify, quantify, monitor and control FBC’s credit risk.
3) Credit risk management framework
Taipei Fubon Bank
a) To strengthen risk management function, under the supervision of the Board of Directors, the
Bank has established the Credit Risk Management Committee, which is composed of senior
management and chaired by the President, to examine credit risk policies and quotas and to
monitor the Bank’s credit risk control, credit risk acceptance and management strategy on the
credit business, securities investments and transactions, and derivatives.
- 121 -
b) To enhance the independence of credit risk management, the Bank has established the Risk
Management Division, which is responsible for measuring the Bank’s risk exposures;
monitoring risk limits; reporting; and coordinating the development of the mechanism for
managing credit risk and validating risk models.
c) In business lines, the Bank has business units that ensure compliance with control requirements
while performing daily business operations.
d) The Bank has established an Institutional Credit Review Committee and a Retail Credit Review
Committee to review credit above a certain limit to strengthen control over cases involving large
credit amounts.
e) The audit department, which is under the supervision of the Board of Directors, conducts the
third defense line of examining independently the effectiveness of internal control functions.
Fubon Bank (China)
The bank’s current credit risk management is based on its comprehensive risk management system.
Divisions under the Risk Management including Department including Risk Control Division,
Credit Policy & Planning Division, Post-Disbursement Risk Management Division and Credit
Approval & Administration Division are to identify, quantify, monitor and control bank’s credit
risk.
4) Credit risk measurement, control and reporting
Taipei Fubon Bank
a) The Taipei Fubon Bank (TFB) has established credit risk measurements and control procedures,
including underwriting, risk rating, limit control, account maintenance, pre-settlement limit
control and collection management systems, which enable TFB to manage and limit the country
risk, single legal entity and group exposure risk, and industry concentration risk effectively.
TFB has also established a vigorous review and early warning mechanism to ensure that there
are proper actions taken for effective credit risk management.
b) TFB regularly performs credit risk stress testing based on the guideline issued by the Financial
Supervisory Commission. It continues to develop scenario analysis and stress testing to
provide senior management with an assessment of risk tolerance, as well as to provide a sound
basis for credit portfolio management.
c) The Bank has completed several Basel Accord credit risk management projects, including risk
data warehousing system, internal risk rating system, and the risk-weighted asset calculation
system. The development and revision of score card and rating models are validated
independently by the Risk Management Division to monitor the model performance and
stability.
Fubon Bank (China)
a) The credit risk control process includes credit policy development, credit approval, early
warning and collection. Credit risk supervision includes the regular follow-up of high-risk
cases, exposure limit control of country risk, and customer credit grading management; and
real-estate loan monitoring and other monthly monitoring, which includes industry
concentration and the concentration of single clients/group clients and its affiliated parties.
- 122 -
b) Fubon Bank (China) makes a regular credit portfolio stress test for industry, products, regions,
and customers based on the actual status of the credit portfolio. The stress test results,
including changes in results due to differences in risk triggers, will be reported at the board
meeting and serve as reference for risk management and decision-making.
c) The credit management system of Fubon Bank (China) has modules for credit approval, loan
ledger management, collateral information maintenance, customer grading management and -
five-category asset classification for bank loans. The system can support credit risk
management effectively.
5) Credit risk mitigation
Taipei Fubon Bank
Taipei Fubon Bank (TFB) has established sophisticated limits in controlling concentration risks on
credit, securities investment and counterparty exposures. Risk rating is assessed for each borrower
on the basis of the stringent evaluation of obligor risk and facility risk. Further, TFB has set a
centralized approval process with documented guidelines and dual authorizations. Appropriate
collaterals are required on the basis of borrowers’ financials and debt service capabilities to mitigate
credit risk.
Fubon Bank (China)
Fubon Bank (China) (FBC) has credit and approval authorization limits based on a customer risk
grading and loan classification and guarantee and sub-guarantee criteria, and investment portfolio
management is based on the “Institutional Banking Risk Policy and SOP”. FBC also strengthens
risk identification on the basis of a customer’s risk grading and the Central Bank’s customer
selection criteria and classification. Credit quality control is done through strict and highly
thorough due diligence and approval procedures, which include having the credit officers from both
the sales department and the risk department sign credit approval documents. FBC also requires
appropriate collaterals to enhance loan risk mitigation. In addition, there is post-loan management,
which includes continual loan monitoring and taking note of any early risk-warning signals.
6) Maximum exposure to credit risk
The maximum exposure to credit risk is represented by the carrying amount of each financial asset
in the balance sheet without taking into consideration any collateral held or other credit
enhancements. The maximum credit exposures of the off-balance sheet financial instruments
(before taking account of any collateral held or other credit enhancements) are summarized as
follows:
Taipei Fubon Bank
Off-Balance Sheet Item
Maximum Exposure Amount
December 31
2015 2014
Irrevocable credit commitments $ 98,224,407 $ 117,641,148
Standby letters of credit 8,736,101 9,883,422
Financial guarantees 34,537,974 39,968,920
Total $ 141,498,482 $ 167,493,490
- 123 -
Fubon Bank (China)
(In Thousands of RMB)
Off-Balance Sheet Item
Maximum Exposure Amount
December 31
2015 2014
Standby letters of credit $ 255,277 $ 125,047
Financial guarantees 1,574,208 1,816,172
Total $ 1,829,485 $ 1,941,219
The maximum exposures of the on and off balance sheet financial pledged as collateral or other
credit enhancements are carrying amount are summarized as follows:
Taipei Fubon Bank
December 31, 2015 Financial
Instrument Property Guarantee Others
Category of asset
Loans 2.76% 50.11% 4.10% 3.08%
Guarantees receivable 4.86% 6.26% 0.70% 0.71%
Acceptances 11.49% 6.86% 0.10% 0.60%
Available-for-sale financial assets - - 27.77% -
Held-to-maturity financial assets - - 1.61% -
Other financial assets-debt
instruments with no active market - - 14.91% -
December 31, 2014 Financial
Instrument Property Guarantee Others
Category of asset
Loans 2.86% 47.21% 5.30% 3.75%
Guarantees receivable 1.88% 4.53% 0.64% 0.99%
Acceptances 4.46% 12.79% 0.17% 0.40%
Available-for-sale financial assets - - 13.23% -
Held-to-maturity financial assets - - 1.42% -
Fubon Bank (China)
December 31, 2015 Financial
Instrument Property Guarantee Others
Category of asset
Loans 12.85% 15.65% - 2.03%
Guarantees receivable 73.70% 25.46% 0.67% -
Acceptances 69.91% 5.02% 24.01% -
Other financial assets-debt
instruments with no active market - - - 100.00%
- 124 -
December 31, 2014 Financial
Instrument Property Guarantee
Category of asset
Loans 8.82% 27.42% 2.39%
Guarantees receivable 73.66% 19.33% 5.17%
Acceptances 70.09% 8.57% 19.04%
7) Concentrations of credit risk exposure
Concentrations of credit risk arise when a number of counterparties or exposures have similar
economic characteristics, or counterparties are engaged in similar activities, or operate in the same
geographical areas or industry sectors, so that their collective ability to meet contractual obligations
is uniformly affected by changes in economic or other conditions.
Credit risk concentrations can arise in the Bank and its subsidiaries’ assets, liabilities, or off-balance
sheet items, through the execution or processing of transactions (either product or service), or
through a combination of exposures across these broad categories. It includes credits, loans and
deposits, call loans to banks, investments, receivables and derivatives. To manage credit risk, the
Bank and subsidiaries maintain a diversified portfolio, limit their exposure to any one geographic
region, country or individual creditor, and monitor their exposure continually. The Bank and
subsidiaries’ most significant concentrations of credit risk are summarized as follows:
Taipei Fubon Bank
a) By industry
By Industry
December 31
2015 2014
Amount % Amount %
Private enterprise $ 465,176,747 38.53 $ 467,740,485 39.84
Public enterprise 77,318,833 6.40 83,226,683 7.09
Government organization 78,328,851 6.49 101,028,964 8.61
Non-profit organization 299,693 0.02 274,322 0.02
Private 532,752,122 44.12 484,304,550 41.26
Financial Institution 53,584,107 4.44 37,303,545 3.18
Total $ 1,207,460,353 100.00 $ 1,173,878,549 100.00
b) By geographical area
Geographical Area
December 31
2015 2014
Amount % Amount %
Domestic $ 1,111,184,351 92.03 $ 1,084,396,763 92.38
North America 16,477,293 1.36 14,491,799 1.23
Asia 79,798,709 6.61 74,989,987 6.39
Total $ 1,207,460,353 100.00 $ 1,173,878,549 100.00
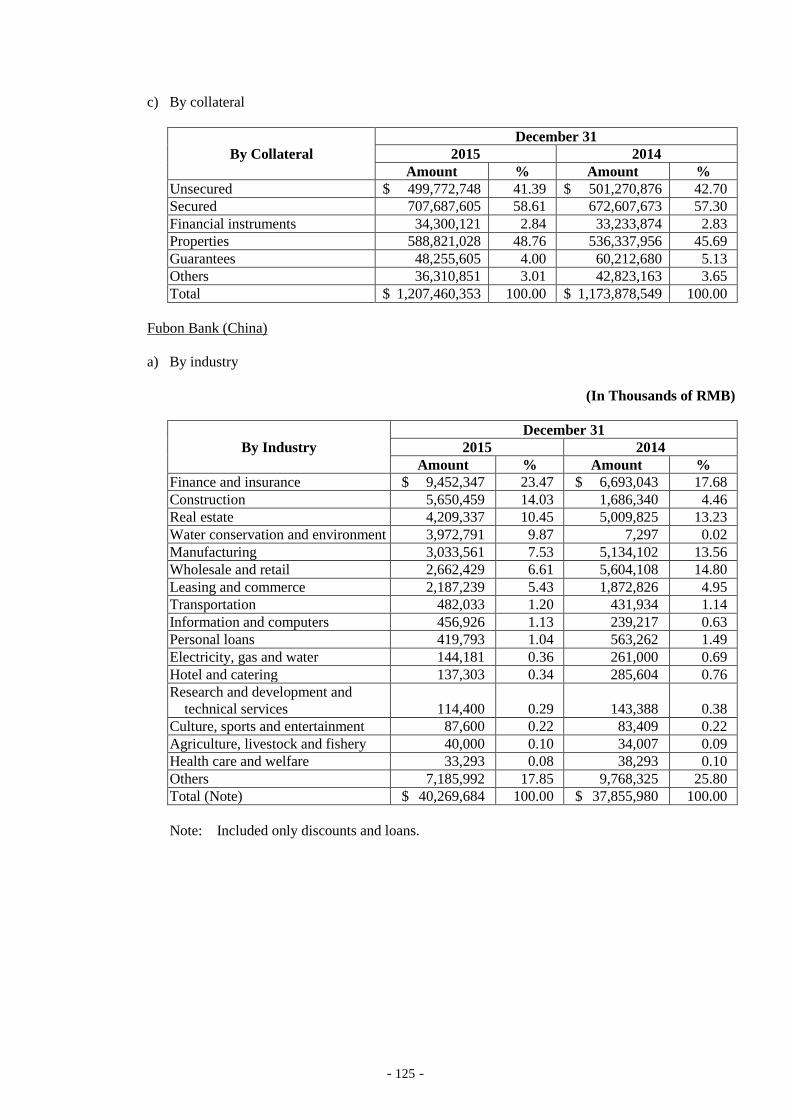
- 125 -
c) By collateral
By Collateral
December 31
2015 2014
Amount % Amount %
Unsecured $ 499,772,748 41.39 $ 501,270,876 42.70
Secured 707,687,605 58.61 672,607,673 57.30
Financial instruments 34,300,121 2.84 33,233,874 2.83
Properties 588,821,028 48.76 536,337,956 45.69
Guarantees 48,255,605 4.00 60,212,680 5.13
Others 36,310,851 3.01 42,823,163 3.65
Total $ 1,207,460,353 100.00 $ 1,173,878,549 100.00
Fubon Bank (China)
a) By industry
(In Thousands of RMB)
By Industry
December 31
2015 2014
Amount % Amount %
Finance and insurance $ 9,452,347 23.47 $ 6,693,043 17.68
Construction 5,650,459 14.03 1,686,340 4.46
Real estate 4,209,337 10.45 5,009,825 13.23
Water conservation and environment 3,972,791 9.87 7,297 0.02
Manufacturing 3,033,561 7.53 5,134,102 13.56
Wholesale and retail 2,662,429 6.61 5,604,108 14.80
Leasing and commerce 2,187,239 5.43 1,872,826 4.95
Transportation 482,033 1.20 431,934 1.14
Information and computers 456,926 1.13 239,217 0.63
Personal loans 419,793 1.04 563,262 1.49
Electricity, gas and water 144,181 0.36 261,000 0.69
Hotel and catering 137,303 0.34 285,604 0.76
Research and development and
technical services 114,400 0.29 143,388 0.38
Culture, sports and entertainment 87,600 0.22 83,409 0.22
Agriculture, livestock and fishery 40,000 0.10 34,007 0.09
Health care and welfare 33,293 0.08 38,293 0.10
Others 7,185,992 17.85 9,768,325 25.80
Total (Note) $ 40,269,684 100.00 $ 37,855,980 100.00
Note: Included only discounts and loans.
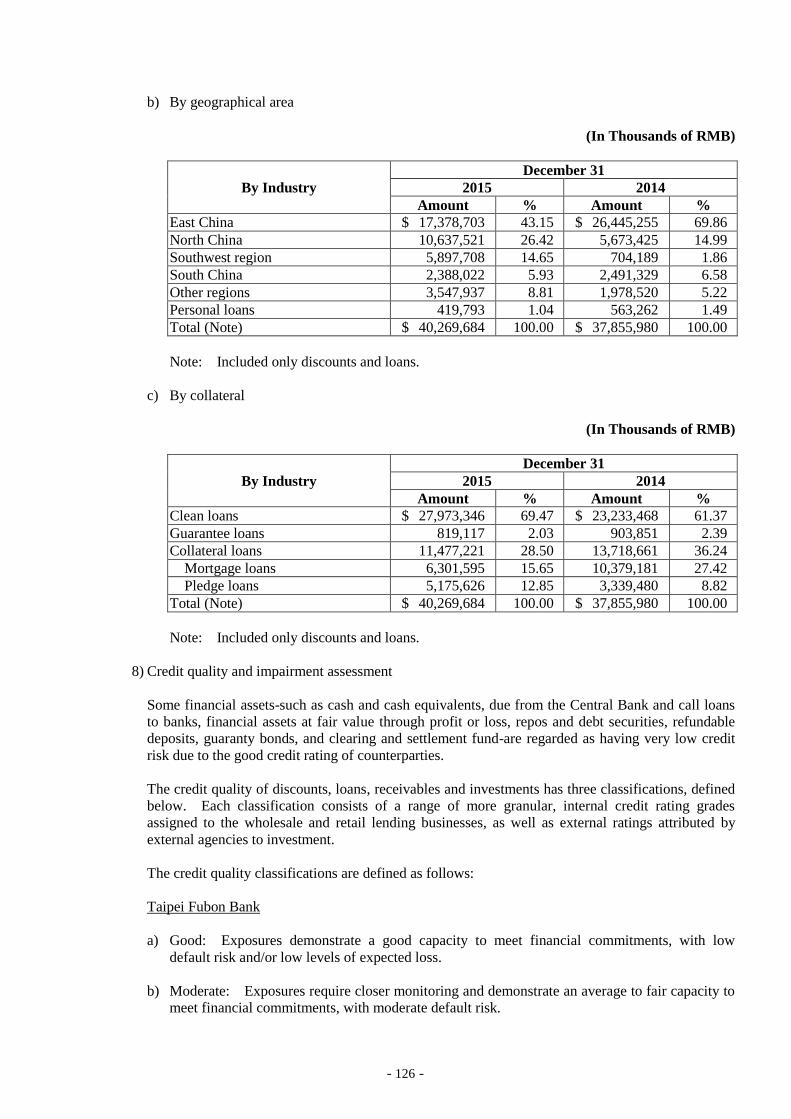
- 126 -
b) By geographical area
(In Thousands of RMB)
By Industry
December 31
2015 2014
Amount % Amount %
East China $ 17,378,703 43.15 $ 26,445,255 69.86
North China 10,637,521 26.42 5,673,425 14.99
Southwest region 5,897,708 14.65 704,189 1.86
South China 2,388,022 5.93 2,491,329 6.58
Other regions 3,547,937 8.81 1,978,520 5.22
Personal loans 419,793 1.04 563,262 1.49
Total (Note) $ 40,269,684 100.00 $ 37,855,980 100.00
Note: Included only discounts and loans.
c) By collateral
(In Thousands of RMB)
By Industry
December 31
2015 2014
Amount % Amount %
Clean loans $ 27,973,346 69.47 $ 23,233,468 61.37
Guarantee loans 819,117 2.03 903,851 2.39
Collateral loans 11,477,221 28.50 13,718,661 36.24
Mortgage loans 6,301,595 15.65 10,379,181 27.42
Pledge loans 5,175,626 12.85 3,339,480 8.82
Total (Note) $ 40,269,684 100.00 $ 37,855,980 100.00
Note: Included only discounts and loans.
8) Credit quality and impairment assessment
Some financial assets-such as cash and cash equivalents, due from the Central Bank and call loans
to banks, financial assets at fair value through profit or loss, repos and debt securities, refundable
deposits, guaranty bonds, and clearing and settlement fund-are regarded as having very low credit
risk due to the good credit rating of counterparties.
The credit quality of discounts, loans, receivables and investments has three classifications, defined
below. Each classification consists of a range of more granular, internal credit rating grades
assigned to the wholesale and retail lending businesses, as well as external ratings attributed by
external agencies to investment.
The credit quality classifications are defined as follows:
Taipei Fubon Bank
a) Good: Exposures demonstrate a good capacity to meet financial commitments, with low
default risk and/or low levels of expected loss.
b) Moderate: Exposures require closer monitoring and demonstrate an average to fair capacity to
meet financial commitments, with moderate default risk.
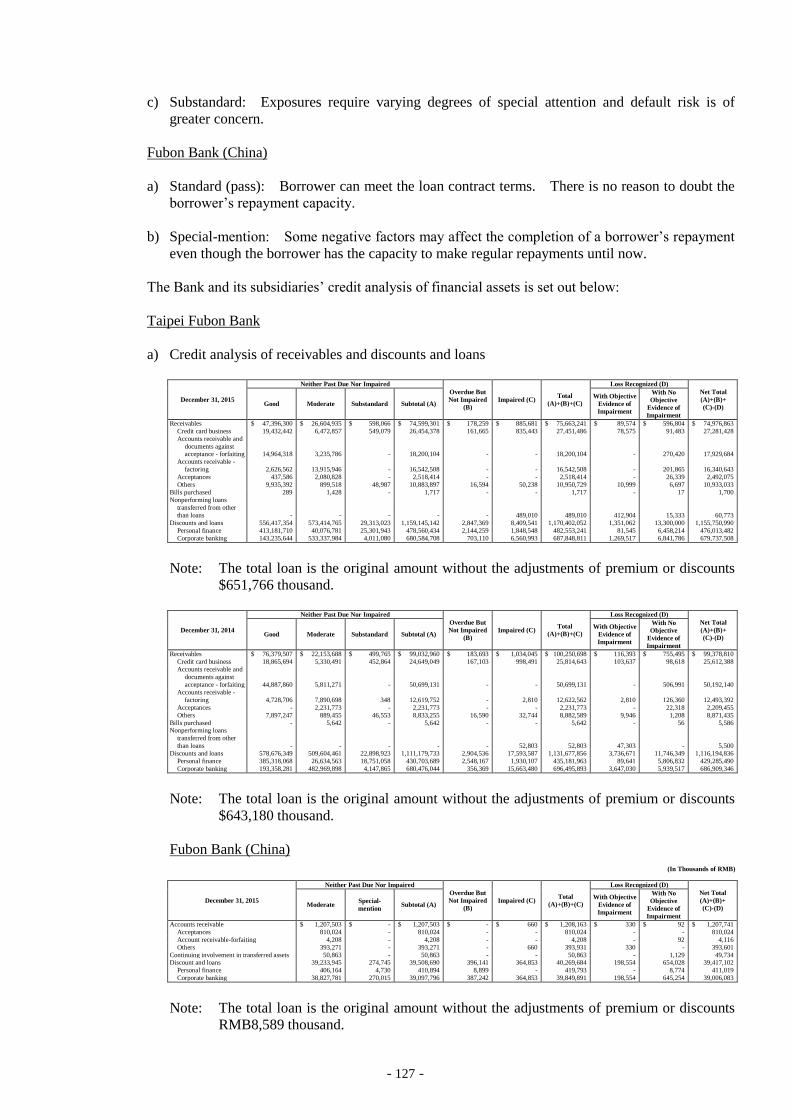
- 127 -
c) Substandard: Exposures require varying degrees of special attention and default risk is of
greater concern.
Fubon Bank (China)
a) Standard (pass): Borrower can meet the loan contract terms. There is no reason to doubt the
borrower’s repayment capacity.
b) Special-mention: Some negative factors may affect the completion of a borrower’s repayment
even though the borrower has the capacity to make regular repayments until now.
The Bank and its subsidiaries’ credit analysis of financial assets is set out below:
Taipei Fubon Bank
a) Credit analysis of receivables and discounts and loans
December 31, 2015
Neither Past Due Nor Impaired
Overdue But
Not Impaired
(B)
Impaired (C) Total
(A)+(B)+(C)
Loss Recognized (D)
Net Total
(A)+(B)+
(C)-(D) Good Moderate Substandard Subtotal (A)
With Objective
Evidence of
Impairment
With No
Objective
Evidence of
Impairment
Receivables $ 47,396,300 $ 26,604,935 $ 598,066 $ 74,599,301 $ 178,259 $ 885,681 $ 75,663,241 $ 89,574 $ 596,804 $ 74,976,863
Credit card business 19,432,442 6,472,857 549,079 26,454,378 161,665 835,443 27,451,486 78,575 91,483 27,281,428
Accounts receivable and
documents against acceptance - forfaiting 14,964,318 3,235,786 - 18,200,104 - - 18,200,104 - 270,420 17,929,684
Accounts receivable -
factoring 2,626,562 13,915,946 - 16,542,508 - - 16,542,508 - 201,865 16,340,643
Acceptances 437,586 2,080,828 - 2,518,414 - - 2,518,414 - 26,339 2,492,075
Others 9,935,392 899,518 48,987 10,883,897 16,594 50,238 10,950,729 10,999 6,697 10,933,033
Bills purchased 289 1,428 - 1,717 - - 1,717 - 17 1,700
Nonperforming loans
transferred from other
than loans - - - - - 489,010 489,010 412,904 15,333 60,773
Discounts and loans 556,417,354 573,414,765 29,313,023 1,159,145,142 2,847,369 8,409,541 1,170,402,052 1,351,062 13,300,000 1,155,750,990
Personal finance 413,181,710 40,076,781 25,301,943 478,560,434 2,144,259 1,848,548 482,553,241 81,545 6,458,214 476,013,482
Corporate banking 143,235,644 533,337,984 4,011,080 680,584,708 703,110 6,560,993 687,848,811 1,269,517 6,841,786 679,737,508
Note: The total loan is the original amount without the adjustments of premium or discounts
$651,766 thousand.
December 31, 2014
Neither Past Due Nor Impaired
Overdue But
Not Impaired
(B)
Impaired (C) Total
(A)+(B)+(C)
Loss Recognized (D)
Net Total
(A)+(B)+
(C)-(D) Good Moderate Substandard Subtotal (A)
With Objective
Evidence of
Impairment
With No
Objective
Evidence of
Impairment
Receivables $ 76,379,507 $ 22,153,688 $ 499,765 $ 99,032,960 $ 183,693 $ 1,034,045 $ 100,250,698 $ 116,393 $ 755,495 $ 99,378,810
Credit card business 18,865,694 5,330,491 452,864 24,649,049 167,103 998,491 25,814,643 103,637 98,618 25,612,388
Accounts receivable and
documents against
acceptance - forfaiting 44,887,860 5,811,271 - 50,699,131 - - 50,699,131 - 506,991 50,192,140
Accounts receivable -
factoring 4,728,706 7,890,698 348 12,619,752 - 2,810 12,622,562 2,810 126,360 12,493,392
Acceptances - 2,231,773 - 2,231,773 - - 2,231,773 - 22,318 2,209,455
Others 7,897,247 889,455 46,553 8,833,255 16,590 32,744 8,882,589 9,946 1,208 8,871,435
Bills purchased - 5,642 - 5,642 - - 5,642 - 56 5,586 Nonperforming loans
transferred from other
than loans - - - - - 52,803 52,803 47,303 - 5,500
Discounts and loans 578,676,349 509,604,461 22,898,923 1,111,179,733 2,904,536 17,593,587 1,131,677,856 3,736,671 11,746,349 1,116,194,836
Personal finance 385,318,068 26,634,563 18,751,058 430,703,689 2,548,167 1,930,107 435,181,963 89,641 5,806,832 429,285,490
Corporate banking 193,358,281 482,969,898 4,147,865 680,476,044 356,369 15,663,480 696,495,893 3,647,030 5,939,517 686,909,346
Note: The total loan is the original amount without the adjustments of premium or discounts
$643,180 thousand.
Fubon Bank (China)
(In Thousands of RMB)
December 31, 2015
Neither Past Due Nor Impaired
Overdue But
Not Impaired
(B)
Impaired (C) Total
(A)+(B)+(C)
Loss Recognized (D)
Net Total
(A)+(B)+
(C)-(D) Moderate
Special-
mention Subtotal (A)
With Objective
Evidence of
Impairment
With No
Objective
Evidence of
Impairment
Accounts receivable $ 1,207,503 $ - $ 1,207,503 $ - $ 660 $ 1,208,163 $ 330 $ 92 $ 1,207,741
Acceptances 810,024 - 810,024 - - 810,024 - - 810,024
Account receivable-forfaiting 4,208 - 4,208 - - 4,208 - 92 4,116
Others 393,271 - 393,271 - 660 393,931 330 - 393,601
Continuing involvement in transferred assets 50,863 - 50,863 - - 50,863 - 1,129 49,734 Discount and loans 39,233,945 274,745 39,508,690 396,141 364,853 40,269,684 198,554 654,028 39,417,102
Personal finance 406,164 4,730 410,894 8,899 - 419,793 - 8,774 411,019
Corporate banking 38,827,781 270,015 39,097,796 387,242 364,853 39,849,891 198,554 645,254 39,006,083
Note: The total loan is the original amount without the adjustments of premium or discounts
RMB8,589 thousand.
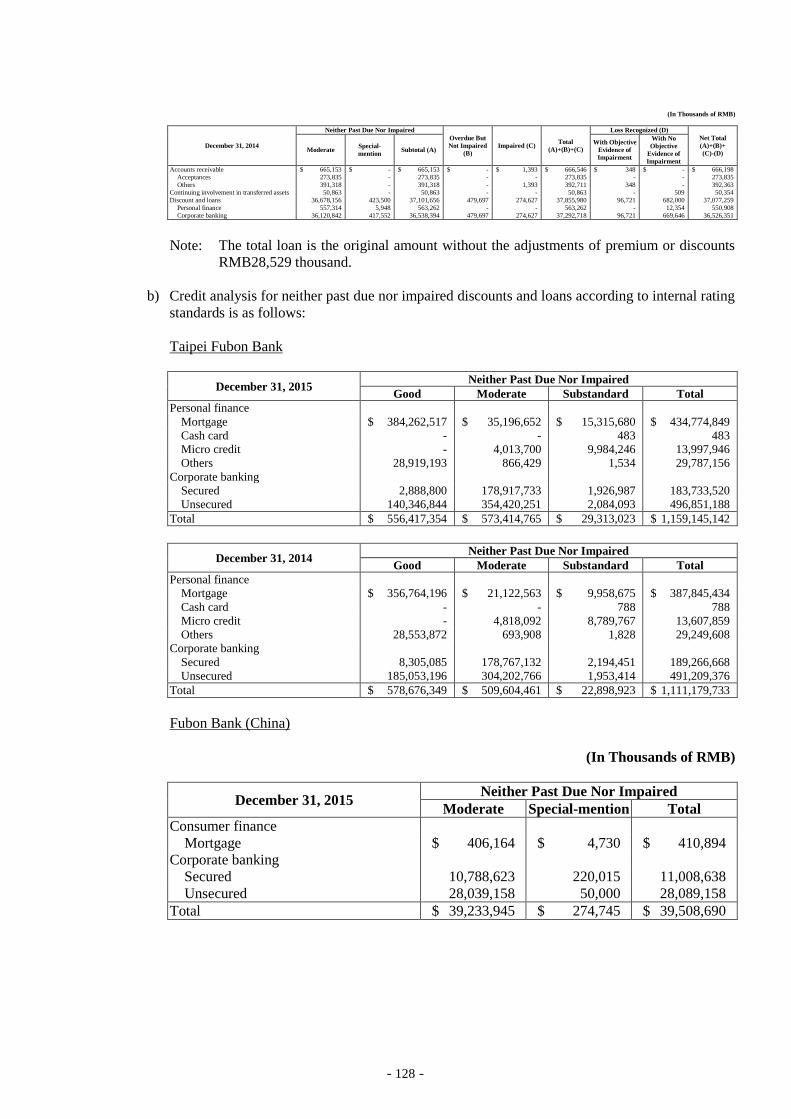
- 128 -
(In Thousands of RMB)
December 31, 2014
Neither Past Due Nor Impaired
Overdue But
Not Impaired
(B)
Impaired (C) Total
(A)+(B)+(C)
Loss Recognized (D)
Net Total
(A)+(B)+
(C)-(D) Moderate
Special-
mention Subtotal (A)
With Objective
Evidence of
Impairment
With No
Objective
Evidence of
Impairment
Accounts receivable $ 665,153 $ - $ 665,153 $ - $ 1,393 $ 666,546 $ 348 $ - $ 666,198
Acceptances 273,835 - 273,835 - - 273,835 - - 273,835
Others 391,318 - 391,318 - 1,393 392,711 348 - 392,363
Continuing involvement in transferred assets 50,863 - 50,863 - - 50,863 - 509 50,354
Discount and loans 36,678,156 423,500 37,101,656 479,697 274,627 37,855,980 96,721 682,000 37,077,259
Personal finance 557,314 5,948 563,262 - - 563,262 - 12,354 550,908
Corporate banking 36,120,842 417,552 36,538,394 479,697 274,627 37,292,718 96,721 669,646 36,526,351
Note: The total loan is the original amount without the adjustments of premium or discounts
RMB28,529 thousand.
b) Credit analysis for neither past due nor impaired discounts and loans according to internal rating
standards is as follows:
Taipei Fubon Bank
December 31, 2015 Neither Past Due Nor Impaired
Good Moderate Substandard Total
Personal finance
Mortgage $ 384,262,517 $ 35,196,652 $ 15,315,680 $ 434,774,849
Cash card - - 483 483
Micro credit - 4,013,700 9,984,246 13,997,946
Others 28,919,193 866,429 1,534 29,787,156
Corporate banking
Secured 2,888,800 178,917,733 1,926,987 183,733,520
Unsecured 140,346,844 354,420,251 2,084,093 496,851,188
Total $ 556,417,354 $ 573,414,765 $ 29,313,023 $ 1,159,145,142
December 31, 2014 Neither Past Due Nor Impaired
Good Moderate Substandard Total
Personal finance
Mortgage $ 356,764,196 $ 21,122,563 $ 9,958,675 $ 387,845,434
Cash card - - 788 788
Micro credit - 4,818,092 8,789,767 13,607,859
Others 28,553,872 693,908 1,828 29,249,608
Corporate banking
Secured 8,305,085 178,767,132 2,194,451 189,266,668
Unsecured 185,053,196 304,202,766 1,953,414 491,209,376
Total $ 578,676,349 $ 509,604,461 $ 22,898,923 $ 1,111,179,733
Fubon Bank (China)
(In Thousands of RMB)
December 31, 2015 Neither Past Due Nor Impaired
Moderate Special-mention Total
Consumer finance
Mortgage $ 406,164 $ 4,730 $ 410,894
Corporate banking
Secured 10,788,623 220,015 11,008,638
Unsecured 28,039,158 50,000 28,089,158
Total $ 39,233,945 $ 274,745 $ 39,508,690
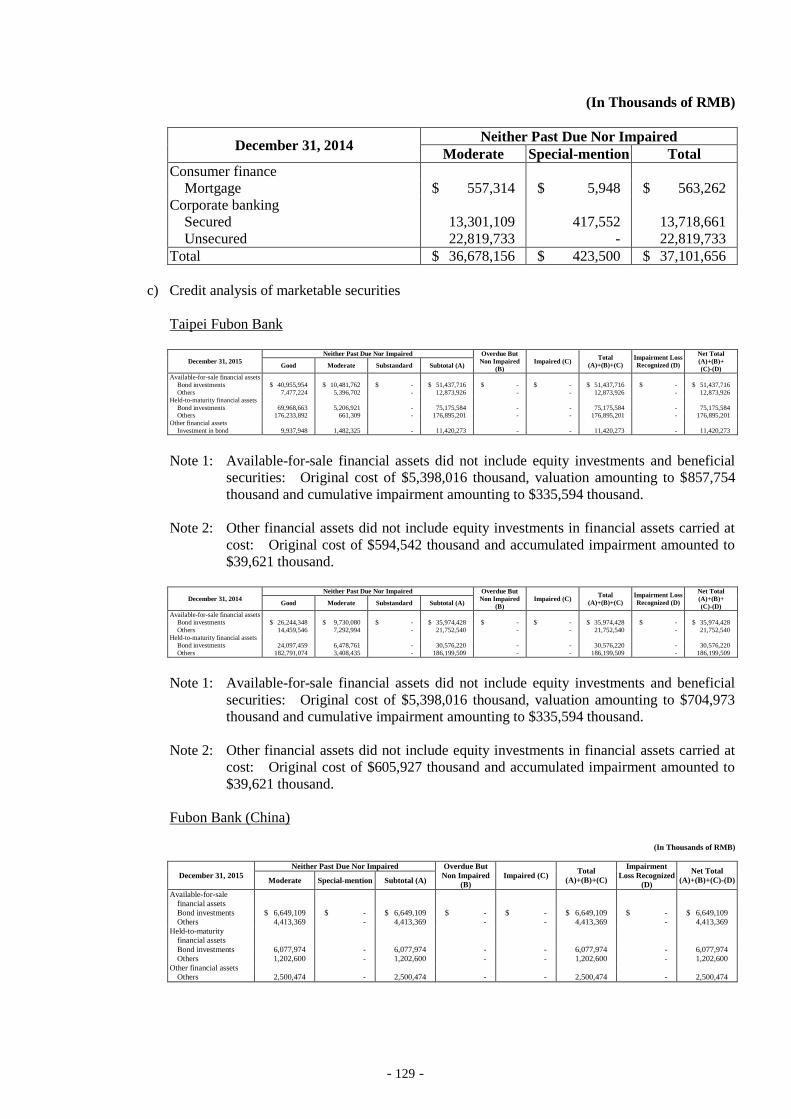
- 129 -
(In Thousands of RMB)
December 31, 2014 Neither Past Due Nor Impaired
Moderate Special-mention Total
Consumer finance
Mortgage $ 557,314 $ 5,948 $ 563,262
Corporate banking
Secured 13,301,109 417,552 13,718,661
Unsecured 22,819,733 - 22,819,733
Total $ 36,678,156 $ 423,500 $ 37,101,656
c) Credit analysis of marketable securities
Taipei Fubon Bank
December 31, 2015
Neither Past Due Nor Impaired Overdue But
Non Impaired
(B)
Impaired (C) Total
(A)+(B)+(C)
Impairment Loss
Recognized (D)
Net Total
(A)+(B)+
(C)-(D) Good Moderate Substandard Subtotal (A)
Available-for-sale financial assets
Bond investments $ 40,955,954 $ 10,481,762 $ - $ 51,437,716 $ - $ - $ 51,437,716 $ - $ 51,437,716
Others 7,477,224 5,396,702 - 12,873,926 - - 12,873,926 - 12,873,926
Held-to-maturity financial assets
Bond investments 69,968,663 5,206,921 - 75,175,584 - - 75,175,584 - 75,175,584 Others 176,233,892 661,309 - 176,895,201 - - 176,895,201 - 176,895,201
Other financial assets
Investment in bond 9,937,948 1,482,325 - 11,420,273 - - 11,420,273 - 11,420,273
Note 1: Available-for-sale financial assets did not include equity investments and beneficial
securities: Original cost of $5,398,016 thousand, valuation amounting to $857,754
thousand and cumulative impairment amounting to $335,594 thousand.
Note 2: Other financial assets did not include equity investments in financial assets carried at
cost: Original cost of $594,542 thousand and accumulated impairment amounted to
$39,621 thousand.
December 31, 2014
Neither Past Due Nor Impaired Overdue But
Non Impaired
(B)
Impaired (C) Total
(A)+(B)+(C)
Impairment Loss
Recognized (D)
Net Total
(A)+(B)+
(C)-(D) Good Moderate Substandard Subtotal (A)
Available-for-sale financial assets
Bond investments $ 26,244,348 $ 9,730,080 $ - $ 35,974,428 $ - $ - $ 35,974,428 $ - $ 35,974,428
Others 14,459,546 7,292,994 - 21,752,540 - - 21,752,540 - 21,752,540
Held-to-maturity financial assets
Bond investments 24,097,459 6,478,761 - 30,576,220 - - 30,576,220 - 30,576,220
Others 182,791,074 3,408,435 - 186,199,509 - - 186,199,509 - 186,199,509
Note 1: Available-for-sale financial assets did not include equity investments and beneficial
securities: Original cost of $5,398,016 thousand, valuation amounting to $704,973
thousand and cumulative impairment amounting to $335,594 thousand.
Note 2: Other financial assets did not include equity investments in financial assets carried at
cost: Original cost of $605,927 thousand and accumulated impairment amounted to
$39,621 thousand.
Fubon Bank (China)
(In Thousands of RMB)
December 31, 2015
Neither Past Due Nor Impaired Overdue But
Non Impaired
(B)
Impaired (C) Total
(A)+(B)+(C)
Impairment
Loss Recognized
(D)
Net Total
(A)+(B)+(C)-(D) Moderate Special-mention Subtotal (A)
Available-for-sale
financial assets
Bond investments $ 6,649,109 $ - $ 6,649,109 $ - $ - $ 6,649,109 $ - $ 6,649,109
Others 4,413,369 - 4,413,369 - - 4,413,369 - 4,413,369
Held-to-maturity
financial assets
Bond investments 6,077,974 - 6,077,974 - - 6,077,974 - 6,077,974
Others 1,202,600 - 1,202,600 - - 1,202,600 - 1,202,600
Other financial assets
Others 2,500,474 - 2,500,474 - - 2,500,474 - 2,500,474
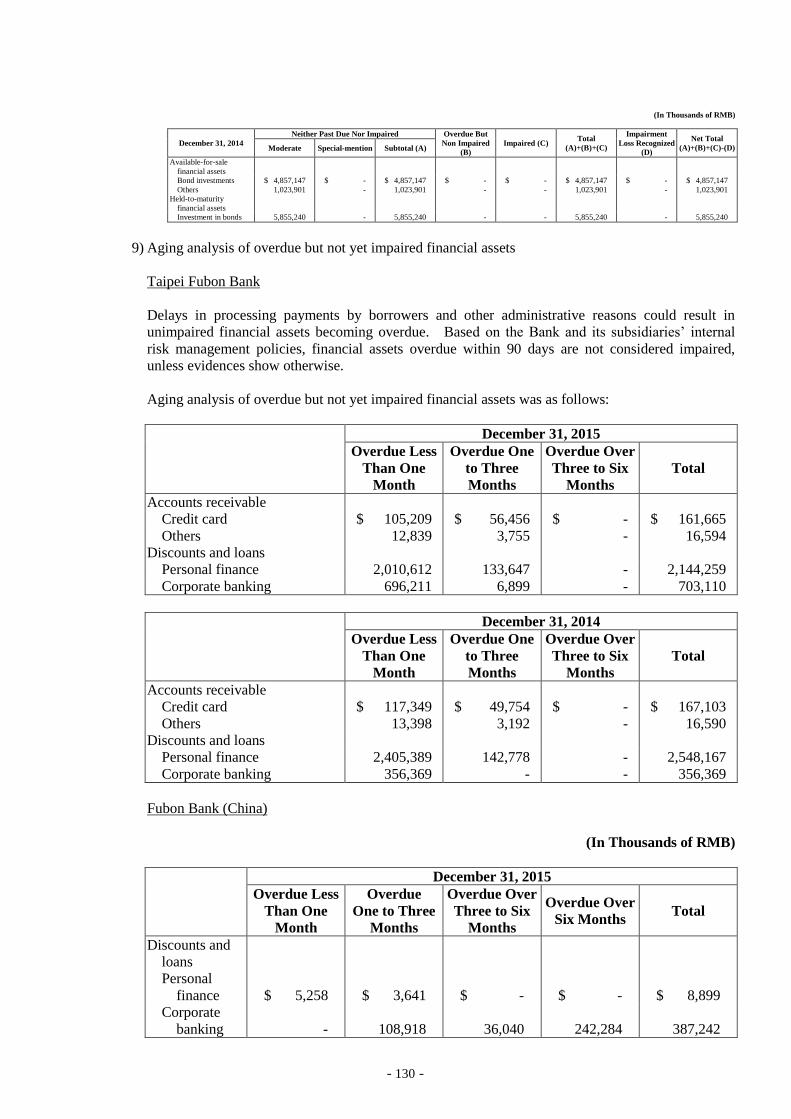
- 130 -
(In Thousands of RMB)
December 31, 2014
Neither Past Due Nor Impaired Overdue But
Non Impaired
(B)
Impaired (C) Total
(A)+(B)+(C)
Impairment
Loss Recognized
(D)
Net Total
(A)+(B)+(C)-(D) Moderate Special-mention Subtotal (A)
Available-for-sale
financial assets
Bond investments $ 4,857,147 $ - $ 4,857,147 $ - $ - $ 4,857,147 $ - $ 4,857,147
Others 1,023,901 - 1,023,901 - - 1,023,901 - 1,023,901
Held-to-maturity
financial assets
Investment in bonds 5,855,240 - 5,855,240 - - 5,855,240 - 5,855,240
9) Aging analysis of overdue but not yet impaired financial assets
Taipei Fubon Bank
Delays in processing payments by borrowers and other administrative reasons could result in
unimpaired financial assets becoming overdue. Based on the Bank and its subsidiaries’ internal
risk management policies, financial assets overdue within 90 days are not considered impaired,
unless evidences show otherwise.
Aging analysis of overdue but not yet impaired financial assets was as follows:
December 31, 2015
Overdue Less
Than One
Month
Overdue One
to Three
Months
Overdue Over
Three to Six
Months
Total
Accounts receivable
Credit card $ 105,209 $ 56,456 $ - $ 161,665
Others 12,839 3,755 - 16,594
Discounts and loans
Personal finance 2,010,612 133,647 - 2,144,259
Corporate banking 696,211 6,899 - 703,110
December 31, 2014
Overdue Less
Than One
Month
Overdue One
to Three
Months
Overdue Over
Three to Six
Months
Total
Accounts receivable
Credit card $ 117,349 $ 49,754 $ - $ 167,103
Others 13,398 3,192 - 16,590
Discounts and loans
Personal finance 2,405,389 142,778 - 2,548,167
Corporate banking 356,369 - - 356,369
Fubon Bank (China)
(In Thousands of RMB)
December 31, 2015
Overdue Less
Than One
Month
Overdue
One to Three
Months
Overdue Over
Three to Six
Months
Overdue Over
Six Months Total
Discounts and
loans
Personal
finance $ 5,258 $ 3,641 $ - $ - $ 8,899
Corporate
banking - 108,918 36,040 242,284 387,242
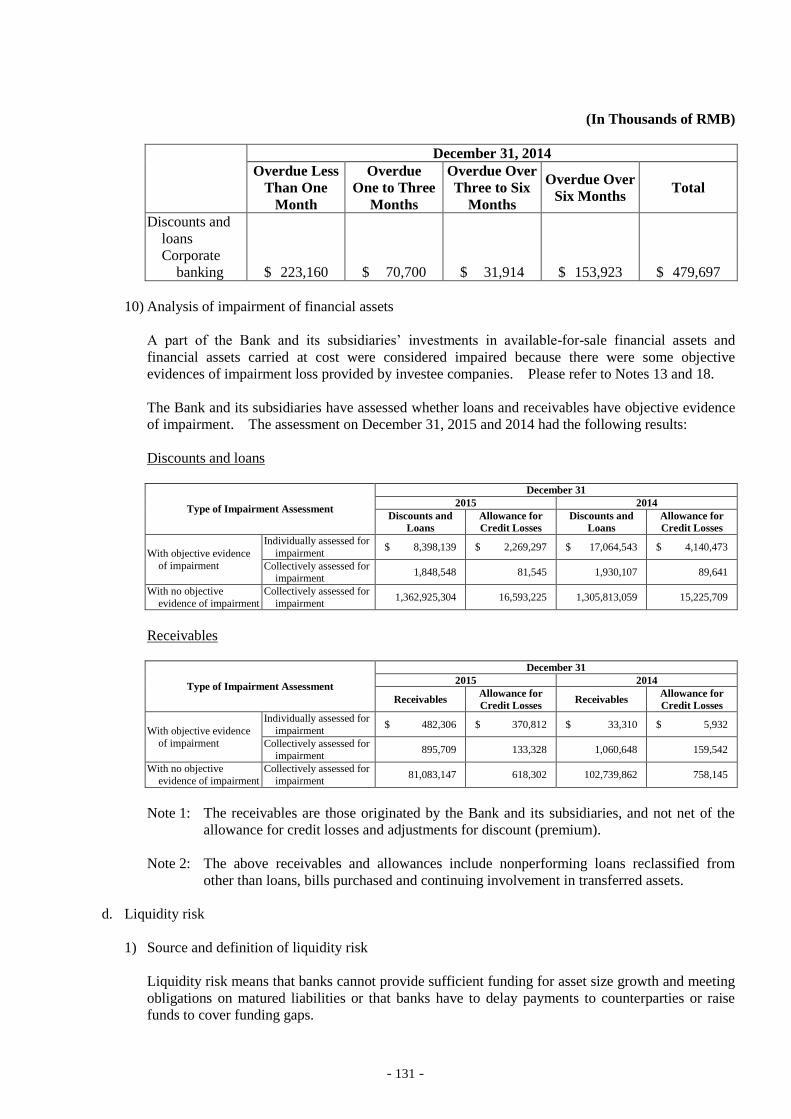
- 131 -
(In Thousands of RMB)
December 31, 2014
Overdue Less
Than One
Month
Overdue
One to Three
Months
Overdue Over
Three to Six
Months
Overdue Over
Six Months Total
Discounts and
loans
Corporate
banking $ 223,160 $ 70,700 $ 31,914 $ 153,923 $ 479,697
10) Analysis of impairment of financial assets
A part of the Bank and its subsidiaries’ investments in available-for-sale financial assets and
financial assets carried at cost were considered impaired because there were some objective
evidences of impairment loss provided by investee companies. Please refer to Notes 13 and 18.
The Bank and its subsidiaries have assessed whether loans and receivables have objective evidence
of impairment. The assessment on December 31, 2015 and 2014 had the following results:
Discounts and loans
Type of Impairment Assessment
December 31
2015 2014
Discounts and
Loans
Allowance for
Credit Losses
Discounts and
Loans
Allowance for
Credit Losses
With objective evidence
of impairment
Individually assessed for
impairment $ 8,398,139 $ 2,269,297 $ 17,064,543 $ 4,140,473
Collectively assessed for
impairment 1,848,548 81,545 1,930,107 89,641
With no objective
evidence of impairment
Collectively assessed for
impairment 1,362,925,304 16,593,225 1,305,813,059 15,225,709
Receivables
Type of Impairment Assessment
December 31
2015 2014
Receivables Allowance for
Credit Losses Receivables
Allowance for
Credit Losses
With objective evidence
of impairment
Individually assessed for
impairment $ 482,306 $ 370,812 $ 33,310 $ 5,932
Collectively assessed for impairment
895,709 133,328 1,060,648 159,542
With no objective
evidence of impairment
Collectively assessed for
impairment 81,083,147 618,302 102,739,862 758,145
Note 1: The receivables are those originated by the Bank and its subsidiaries, and not net of the
allowance for credit losses and adjustments for discount (premium).
Note 2: The above receivables and allowances include nonperforming loans reclassified from
other than loans, bills purchased and continuing involvement in transferred assets.
d. Liquidity risk
1) Source and definition of liquidity risk
Liquidity risk means that banks cannot provide sufficient funding for asset size growth and meeting
obligations on matured liabilities or that banks have to delay payments to counterparties or raise
funds to cover funding gaps.
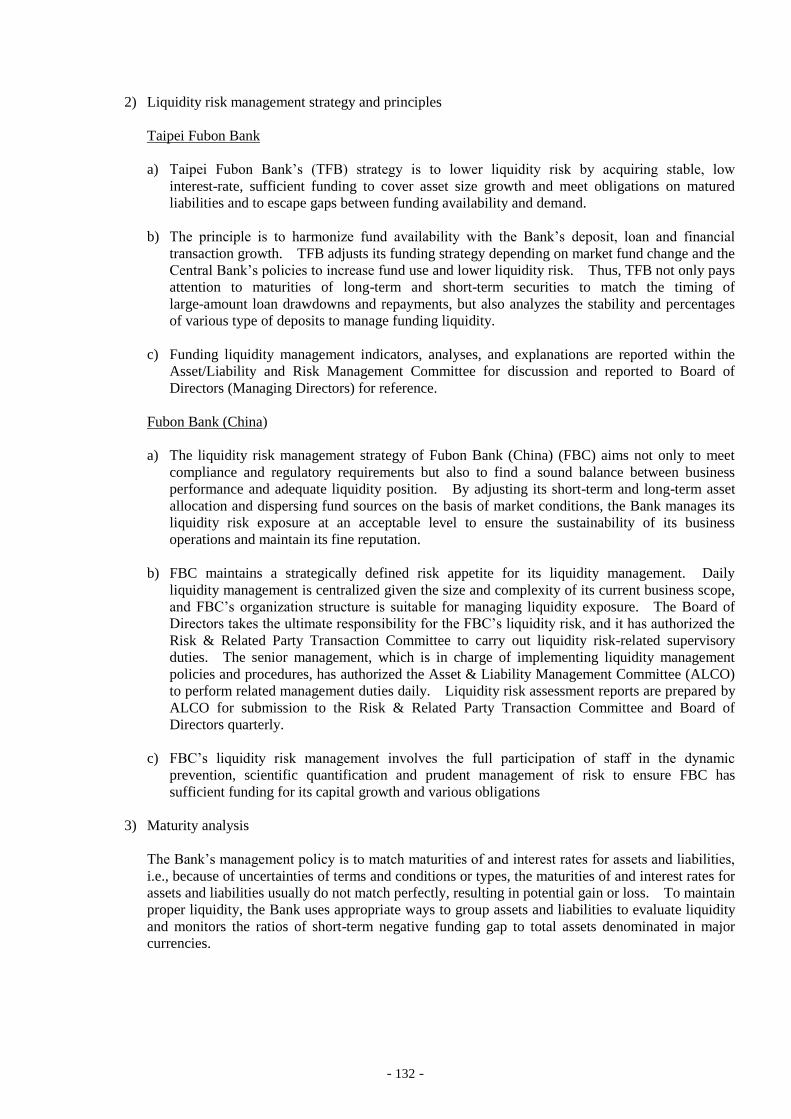
- 132 -
2) Liquidity risk management strategy and principles
Taipei Fubon Bank
a) Taipei Fubon Bank’s (TFB) strategy is to lower liquidity risk by acquiring stable, low
interest-rate, sufficient funding to cover asset size growth and meet obligations on matured
liabilities and to escape gaps between funding availability and demand.
b) The principle is to harmonize fund availability with the Bank’s deposit, loan and financial
transaction growth. TFB adjusts its funding strategy depending on market fund change and the
Central Bank’s policies to increase fund use and lower liquidity risk. Thus, TFB not only pays
attention to maturities of long-term and short-term securities to match the timing of
large-amount loan drawdowns and repayments, but also analyzes the stability and percentages
of various type of deposits to manage funding liquidity.
c) Funding liquidity management indicators, analyses, and explanations are reported within the
Asset/Liability and Risk Management Committee for discussion and reported to Board of
Directors (Managing Directors) for reference.
Fubon Bank (China)
a) The liquidity risk management strategy of Fubon Bank (China) (FBC) aims not only to meet
compliance and regulatory requirements but also to find a sound balance between business
performance and adequate liquidity position. By adjusting its short-term and long-term asset
allocation and dispersing fund sources on the basis of market conditions, the Bank manages its
liquidity risk exposure at an acceptable level to ensure the sustainability of its business
operations and maintain its fine reputation.
b) FBC maintains a strategically defined risk appetite for its liquidity management. Daily
liquidity management is centralized given the size and complexity of its current business scope,
and FBC’s organization structure is suitable for managing liquidity exposure. The Board of
Directors takes the ultimate responsibility for the FBC’s liquidity risk, and it has authorized the
Risk & Related Party Transaction Committee to carry out liquidity risk-related supervisory
duties. The senior management, which is in charge of implementing liquidity management
policies and procedures, has authorized the Asset & Liability Management Committee (ALCO)
to perform related management duties daily. Liquidity risk assessment reports are prepared by
ALCO for submission to the Risk & Related Party Transaction Committee and Board of
Directors quarterly.
c) FBC’s liquidity risk management involves the full participation of staff in the dynamic
prevention, scientific quantification and prudent management of risk to ensure FBC has
sufficient funding for its capital growth and various obligations
3) Maturity analysis
The Bank’s management policy is to match maturities of and interest rates for assets and liabilities,
i.e., because of uncertainties of terms and conditions or types, the maturities of and interest rates for
assets and liabilities usually do not match perfectly, resulting in potential gain or loss. To maintain
proper liquidity, the Bank uses appropriate ways to group assets and liabilities to evaluate liquidity
and monitors the ratios of short-term negative funding gap to total assets denominated in major
currencies.
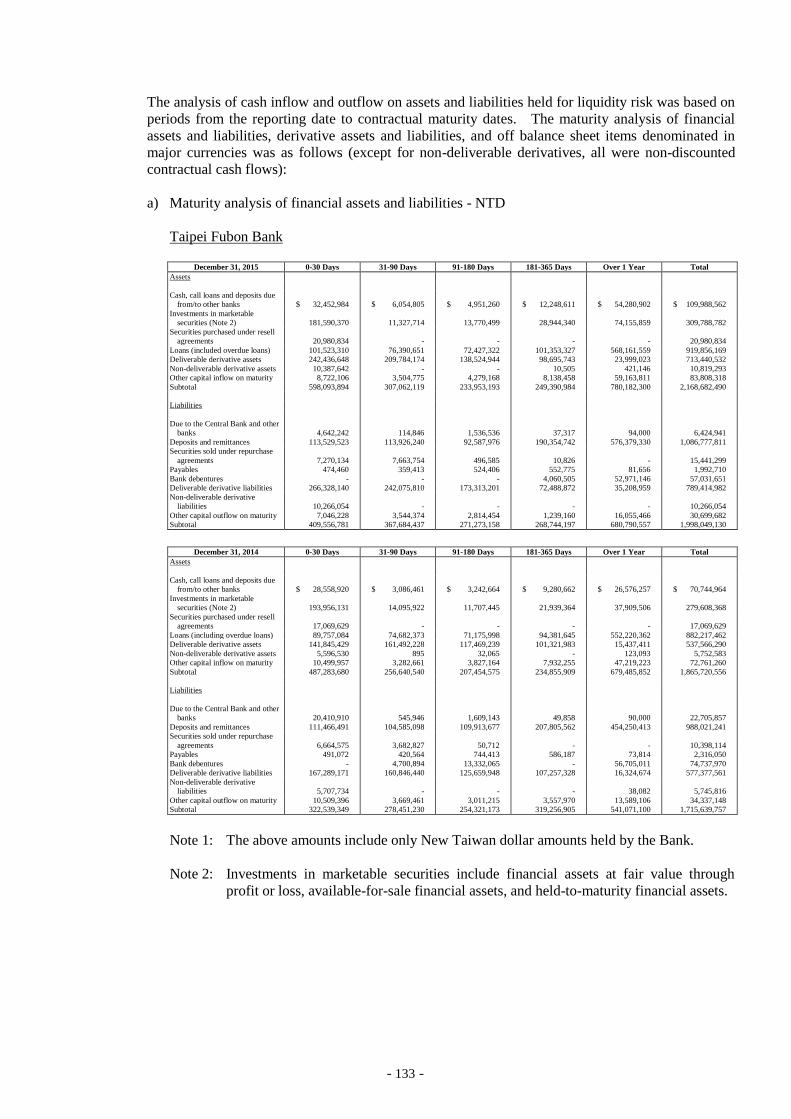
- 133 -
The analysis of cash inflow and outflow on assets and liabilities held for liquidity risk was based on
periods from the reporting date to contractual maturity dates. The maturity analysis of financial
assets and liabilities, derivative assets and liabilities, and off balance sheet items denominated in
major currencies was as follows (except for non-deliverable derivatives, all were non-discounted
contractual cash flows):
a) Maturity analysis of financial assets and liabilities - NTD
Taipei Fubon Bank
December 31, 2015 0-30 Days 31-90 Days 91-180 Days 181-365 Days Over 1 Year Total
Assets
Cash, call loans and deposits due
from/to other banks $ 32,452,984 $ 6,054,805 $ 4,951,260 $ 12,248,611 $ 54,280,902 $ 109,988,562
Investments in marketable
securities (Note 2) 181,590,370 11,327,714 13,770,499 28,944,340 74,155,859 309,788,782
Securities purchased under resell
agreements 20,980,834 - - - - 20,980,834
Loans (included overdue loans) 101,523,310 76,390,651 72,427,322 101,353,327 568,161,559 919,856,169
Deliverable derivative assets 242,436,648 209,784,174 138,524,944 98,695,743 23,999,023 713,440,532
Non-deliverable derivative assets 10,387,642 - - 10,505 421,146 10,819,293
Other capital inflow on maturity 8,722,106 3,504,775 4,279,168 8,138,458 59,163,811 83,808,318
Subtotal 598,093,894 307,062,119 233,953,193 249,390,984 780,182,300 2,168,682,490
Liabilities
Due to the Central Bank and other
banks 4,642,242 114,846 1,536,536 37,317 94,000 6,424,941
Deposits and remittances 113,529,523 113,926,240 92,587,976 190,354,742 576,379,330 1,086,777,811
Securities sold under repurchase
agreements 7,270,134 7,663,754 496,585 10,826 - 15,441,299
Payables 474,460 359,413 524,406 552,775 81,656 1,992,710
Bank debentures - - - 4,060,505 52,971,146 57,031,651
Deliverable derivative liabilities 266,328,140 242,075,810 173,313,201 72,488,872 35,208,959 789,414,982
Non-deliverable derivative
liabilities 10,266,054 - - - - 10,266,054
Other capital outflow on maturity 7,046,228 3,544,374 2,814,454 1,239,160 16,055,466 30,699,682
Subtotal 409,556,781 367,684,437 271,273,158 268,744,197 680,790,557 1,998,049,130
December 31, 2014 0-30 Days 31-90 Days 91-180 Days 181-365 Days Over 1 Year Total
Assets
Cash, call loans and deposits due
from/to other banks $ 28,558,920 $ 3,086,461 $ 3,242,664 $ 9,280,662 $ 26,576,257 $ 70,744,964
Investments in marketable
securities (Note 2) 193,956,131 14,095,922 11,707,445 21,939,364 37,909,506 279,608,368
Securities purchased under resell
agreements 17,069,629 - - - - 17,069,629
Loans (including overdue loans) 89,757,084 74,682,373 71,175,998 94,381,645 552,220,362 882,217,462
Deliverable derivative assets 141,845,429 161,492,228 117,469,239 101,321,983 15,437,411 537,566,290
Non-deliverable derivative assets 5,596,530 895 32,065 - 123,093 5,752,583
Other capital inflow on maturity 10,499,957 3,282,661 3,827,164 7,932,255 47,219,223 72,761,260
Subtotal 487,283,680 256,640,540 207,454,575 234,855,909 679,485,852 1,865,720,556
Liabilities
Due to the Central Bank and other
banks 20,410,910 545,946 1,609,143 49,858 90,000 22,705,857
Deposits and remittances 111,466,491 104,585,098 109,913,677 207,805,562 454,250,413 988,021,241
Securities sold under repurchase
agreements 6,664,575 3,682,827 50,712 - - 10,398,114
Payables 491,072 420,564 744,413 586,187 73,814 2,316,050
Bank debentures - 4,700,894 13,332,065 - 56,705,011 74,737,970
Deliverable derivative liabilities 167,289,171 160,846,440 125,659,948 107,257,328 16,324,674 577,377,561
Non-deliverable derivative
liabilities 5,707,734 - - - 38,082 5,745,816
Other capital outflow on maturity 10,509,396 3,669,461 3,011,215 3,557,970 13,589,106 34,337,148
Subtotal 322,539,349 278,451,230 254,321,173 319,256,905 541,071,100 1,715,639,757
Note 1: The above amounts include only New Taiwan dollar amounts held by the Bank.
Note 2: Investments in marketable securities include financial assets at fair value through
profit or loss, available-for-sale financial assets, and held-to-maturity financial assets.
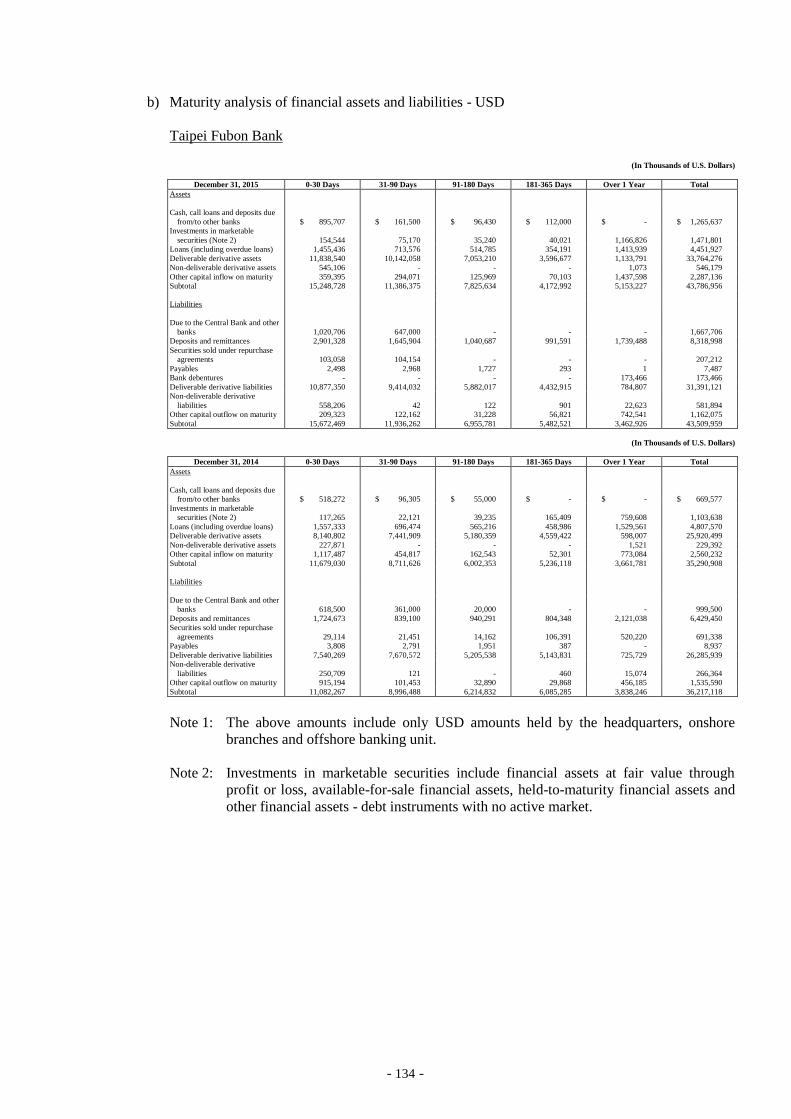
- 134 -
b) Maturity analysis of financial assets and liabilities - USD
Taipei Fubon Bank
(In Thousands of U.S. Dollars)
December 31, 2015 0-30 Days 31-90 Days 91-180 Days 181-365 Days Over 1 Year Total
Assets
Cash, call loans and deposits due
from/to other banks $ 895,707 $ 161,500 $ 96,430 $ 112,000 $ - $ 1,265,637
Investments in marketable
securities (Note 2) 154,544 75,170 35,240 40,021 1,166,826 1,471,801
Loans (including overdue loans) 1,455,436 713,576 514,785 354,191 1,413,939 4,451,927
Deliverable derivative assets 11,838,540 10,142,058 7,053,210 3,596,677 1,133,791 33,764,276
Non-deliverable derivative assets 545,106 - - - 1,073 546,179
Other capital inflow on maturity 359,395 294,071 125,969 70,103 1,437,598 2,287,136
Subtotal 15,248,728 11,386,375 7,825,634 4,172,992 5,153,227 43,786,956
Liabilities
Due to the Central Bank and other
banks 1,020,706 647,000 - - - 1,667,706
Deposits and remittances 2,901,328 1,645,904 1,040,687 991,591 1,739,488 8,318,998
Securities sold under repurchase
agreements 103,058 104,154 - - - 207,212
Payables 2,498 2,968 1,727 293 1 7,487
Bank debentures - - - - 173,466 173,466
Deliverable derivative liabilities 10,877,350 9,414,032 5,882,017 4,432,915 784,807 31,391,121
Non-deliverable derivative
liabilities 558,206 42 122 901 22,623 581,894
Other capital outflow on maturity 209,323 122,162 31,228 56,821 742,541 1,162,075
Subtotal 15,672,469 11,936,262 6,955,781 5,482,521 3,462,926 43,509,959
(In Thousands of U.S. Dollars)
December 31, 2014 0-30 Days 31-90 Days 91-180 Days 181-365 Days Over 1 Year Total
Assets
Cash, call loans and deposits due
from/to other banks $ 518,272 $ 96,305 $ 55,000 $ - $ - $ 669,577
Investments in marketable
securities (Note 2) 117,265 22,121 39,235 165,409 759,608 1,103,638
Loans (including overdue loans) 1,557,333 696,474 565,216 458,986 1,529,561 4,807,570
Deliverable derivative assets 8,140,802 7,441,909 5,180,359 4,559,422 598,007 25,920,499
Non-deliverable derivative assets 227,871 - - - 1,521 229,392
Other capital inflow on maturity 1,117,487 454,817 162,543 52,301 773,084 2,560,232
Subtotal 11,679,030 8,711,626 6,002,353 5,236,118 3,661,781 35,290,908
Liabilities
Due to the Central Bank and other
banks 618,500 361,000 20,000 - - 999,500
Deposits and remittances 1,724,673 839,100 940,291 804,348 2,121,038 6,429,450
Securities sold under repurchase
agreements 29,114 21,451 14,162 106,391 520,220 691,338
Payables 3,808 2,791 1,951 387 - 8,937
Deliverable derivative liabilities 7,540,269 7,670,572 5,205,538 5,143,831 725,729 26,285,939
Non-deliverable derivative
liabilities 250,709 121 - 460 15,074 266,364
Other capital outflow on maturity 915,194 101,453 32,890 29,868 456,185 1,535,590
Subtotal 11,082,267 8,996,488 6,214,832 6,085,285 3,838,246 36,217,118
Note 1: The above amounts include only USD amounts held by the headquarters, onshore
branches and offshore banking unit.
Note 2: Investments in marketable securities include financial assets at fair value through
profit or loss, available-for-sale financial assets, held-to-maturity financial assets and
other financial assets - debt instruments with no active market.
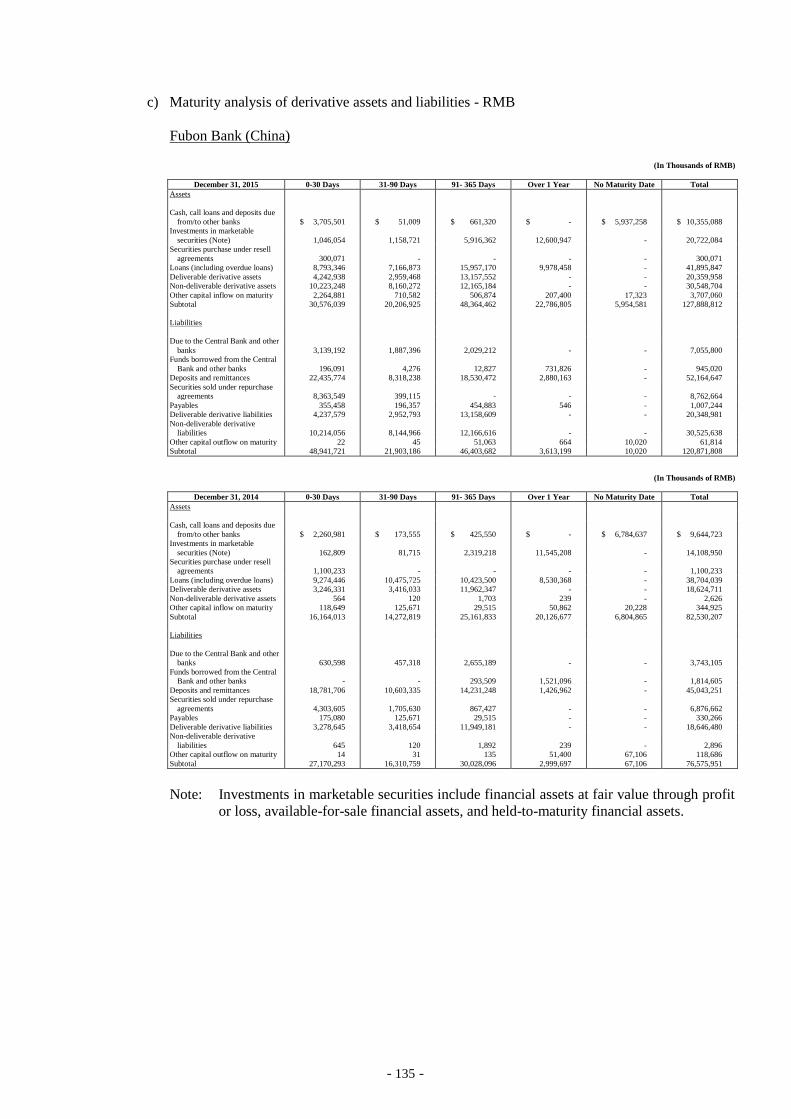
- 135 -
c) Maturity analysis of derivative assets and liabilities - RMB
Fubon Bank (China)
(In Thousands of RMB)
December 31, 2015 0-30 Days 31-90 Days 91- 365 Days Over 1 Year No Maturity Date Total
Assets
Cash, call loans and deposits due
from/to other banks $ 3,705,501 $ 51,009 $ 661,320 $ - $ 5,937,258 $ 10,355,088
Investments in marketable
securities (Note) 1,046,054 1,158,721 5,916,362 12,600,947 - 20,722,084
Securities purchase under resell
agreements 300,071 - - - - 300,071
Loans (including overdue loans) 8,793,346 7,166,873 15,957,170 9,978,458 - 41,895,847
Deliverable derivative assets 4,242,938 2,959,468 13,157,552 - - 20,359,958
Non-deliverable derivative assets 10,223,248 8,160,272 12,165,184 - - 30,548,704
Other capital inflow on maturity 2,264,881 710,582 506,874 207,400 17,323 3,707,060
Subtotal 30,576,039 20,206,925 48,364,462 22,786,805 5,954,581 127,888,812
Liabilities
Due to the Central Bank and other
banks 3,139,192 1,887,396 2,029,212 - - 7,055,800
Funds borrowed from the Central
Bank and other banks 196,091 4,276 12,827 731,826 - 945,020
Deposits and remittances 22,435,774 8,318,238 18,530,472 2,880,163 - 52,164,647
Securities sold under repurchase
agreements 8,363,549 399,115 - - - 8,762,664
Payables 355,458 196,357 454,883 546 - 1,007,244
Deliverable derivative liabilities 4,237,579 2,952,793 13,158,609 - - 20,348,981
Non-deliverable derivative
liabilities 10,214,056 8,144,966 12,166,616 - - 30,525,638
Other capital outflow on maturity 22 45 51,063 664 10,020 61,814
Subtotal 48,941,721 21,903,186 46,403,682 3,613,199 10,020 120,871,808
(In Thousands of RMB)
December 31, 2014 0-30 Days 31-90 Days 91- 365 Days Over 1 Year No Maturity Date Total
Assets
Cash, call loans and deposits due
from/to other banks $ 2,260,981 $ 173,555 $ 425,550 $ - $ 6,784,637 $ 9,644,723
Investments in marketable
securities (Note) 162,809 81,715 2,319,218 11,545,208 - 14,108,950
Securities purchase under resell
agreements 1,100,233 - - - - 1,100,233
Loans (including overdue loans) 9,274,446 10,475,725 10,423,500 8,530,368 - 38,704,039
Deliverable derivative assets 3,246,331 3,416,033 11,962,347 - - 18,624,711
Non-deliverable derivative assets 564 120 1,703 239 - 2,626
Other capital inflow on maturity 118,649 125,671 29,515 50,862 20,228 344,925
Subtotal 16,164,013 14,272,819 25,161,833 20,126,677 6,804,865 82,530,207
Liabilities
Due to the Central Bank and other
banks 630,598 457,318 2,655,189 - - 3,743,105
Funds borrowed from the Central
Bank and other banks - - 293,509 1,521,096 - 1,814,605
Deposits and remittances 18,781,706 10,603,335 14,231,248 1,426,962 - 45,043,251
Securities sold under repurchase
agreements 4,303,605 1,705,630 867,427 - - 6,876,662
Payables 175,080 125,671 29,515 - - 330,266
Deliverable derivative liabilities 3,278,645 3,418,654 11,949,181 - - 18,646,480
Non-deliverable derivative
liabilities 645 120 1,892 239 - 2,896
Other capital outflow on maturity 14 31 135 51,400 67,106 118,686
Subtotal 27,170,293 16,310,759 30,028,096 2,999,697 67,106 76,575,951
Note: Investments in marketable securities include financial assets at fair value through profit
or loss, available-for-sale financial assets, and held-to-maturity financial assets.
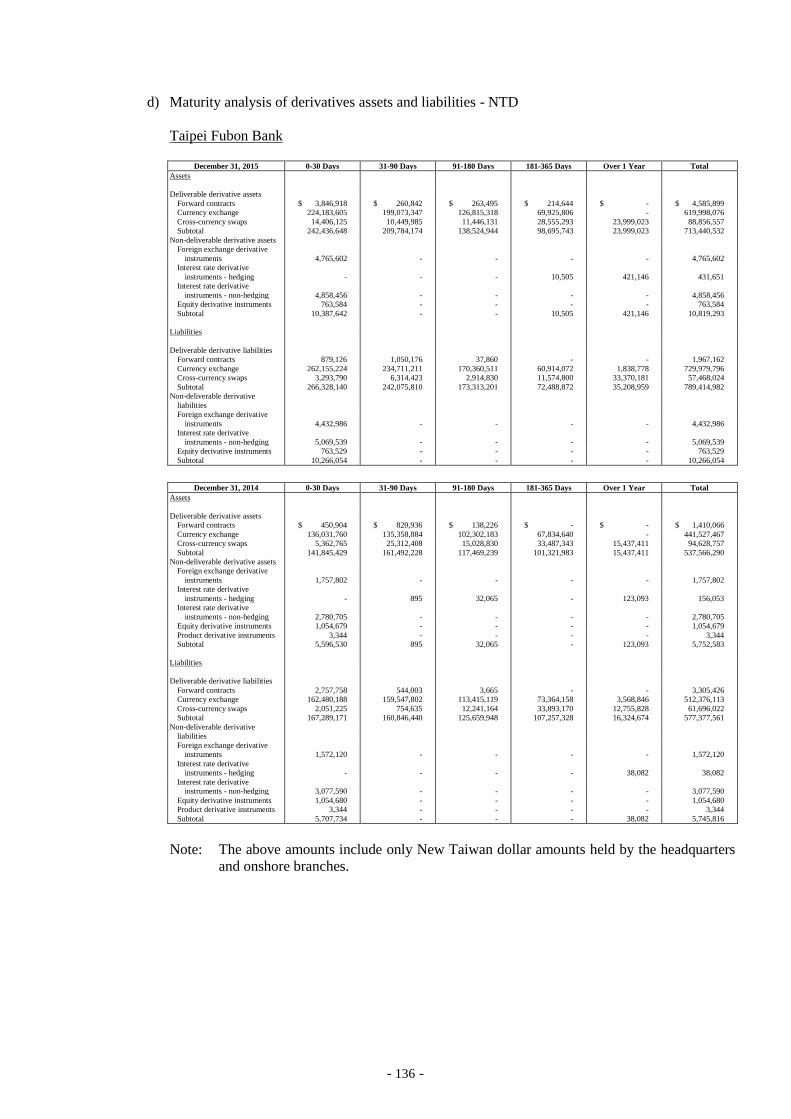
- 136 -
d) Maturity analysis of derivatives assets and liabilities - NTD
Taipei Fubon Bank
December 31, 2015 0-30 Days 31-90 Days 91-180 Days 181-365 Days Over 1 Year Total
Assets
Deliverable derivative assets
Forward contracts $ 3,846,918 $ 260,842 $ 263,495 $ 214,644 $ - $ 4,585,899
Currency exchange 224,183,605 199,073,347 126,815,318 69,925,806 - 619,998,076
Cross-currency swaps 14,406,125 10,449,985 11,446,131 28,555,293 23,999,023 88,856,557
Subtotal 242,436,648 209,784,174 138,524,944 98,695,743 23,999,023 713,440,532
Non-deliverable derivative assets
Foreign exchange derivative
instruments 4,765,602 - - - - 4,765,602
Interest rate derivative
instruments - hedging - - - 10,505 421,146 431,651
Interest rate derivative
instruments - non-hedging 4,858,456 - - - - 4,858,456
Equity derivative instruments 763,584 - - - - 763,584
Subtotal 10,387,642 - - 10,505 421,146 10,819,293
Liabilities
Deliverable derivative liabilities
Forward contracts 879,126 1,050,176 37,860 - - 1,967,162
Currency exchange 262,155,224 234,711,211 170,360,511 60,914,072 1,838,778 729,979,796
Cross-currency swaps 3,293,790 6,314,423 2,914,830 11,574,800 33,370,181 57,468,024
Subtotal 266,328,140 242,075,810 173,313,201 72,488,872 35,208,959 789,414,982
Non-deliverable derivative
liabilities
Foreign exchange derivative
instruments 4,432,986 - - - - 4,432,986
Interest rate derivative
instruments - non-hedging 5,069,539 - - - - 5,069,539
Equity derivative instruments 763,529 - - - - 763,529
Subtotal 10,266,054 - - - - 10,266,054
December 31, 2014 0-30 Days 31-90 Days 91-180 Days 181-365 Days Over 1 Year Total
Assets
Deliverable derivative assets
Forward contracts $ 450,904 $ 820,936 $ 138,226 $ - $ - $ 1,410,066
Currency exchange 136,031,760 135,358,884 102,302,183 67,834,640 - 441,527,467
Cross-currency swaps 5,362,765 25,312,408 15,028,830 33,487,343 15,437,411 94,628,757
Subtotal 141,845,429 161,492,228 117,469,239 101,321,983 15,437,411 537,566,290
Non-deliverable derivative assets
Foreign exchange derivative
instruments 1,757,802 - - - - 1,757,802
Interest rate derivative
instruments - hedging - 895 32,065 - 123,093 156,053
Interest rate derivative
instruments - non-hedging 2,780,705 - - - - 2,780,705
Equity derivative instruments 1,054,679 - - - - 1,054,679
Product derivative instruments 3,344 - - - - 3,344
Subtotal 5,596,530 895 32,065 - 123,093 5,752,583
Liabilities
Deliverable derivative liabilities
Forward contracts 2,757,758 544,003 3,665 - - 3,305,426
Currency exchange 162,480,188 159,547,802 113,415,119 73,364,158 3,568,846 512,376,113
Cross-currency swaps 2,051,225 754,635 12,241,164 33,893,170 12,755,828 61,696,022
Subtotal 167,289,171 160,846,440 125,659,948 107,257,328 16,324,674 577,377,561
Non-deliverable derivative
liabilities
Foreign exchange derivative
instruments 1,572,120 - - - - 1,572,120
Interest rate derivative
instruments - hedging - - - - 38,082 38,082
Interest rate derivative
instruments - non-hedging 3,077,590 - - - - 3,077,590
Equity derivative instruments 1,054,680 - - - - 1,054,680
Product derivative instruments 3,344 - - - - 3,344
Subtotal 5,707,734 - - - 38,082 5,745,816
Note: The above amounts include only New Taiwan dollar amounts held by the headquarters
and onshore branches.
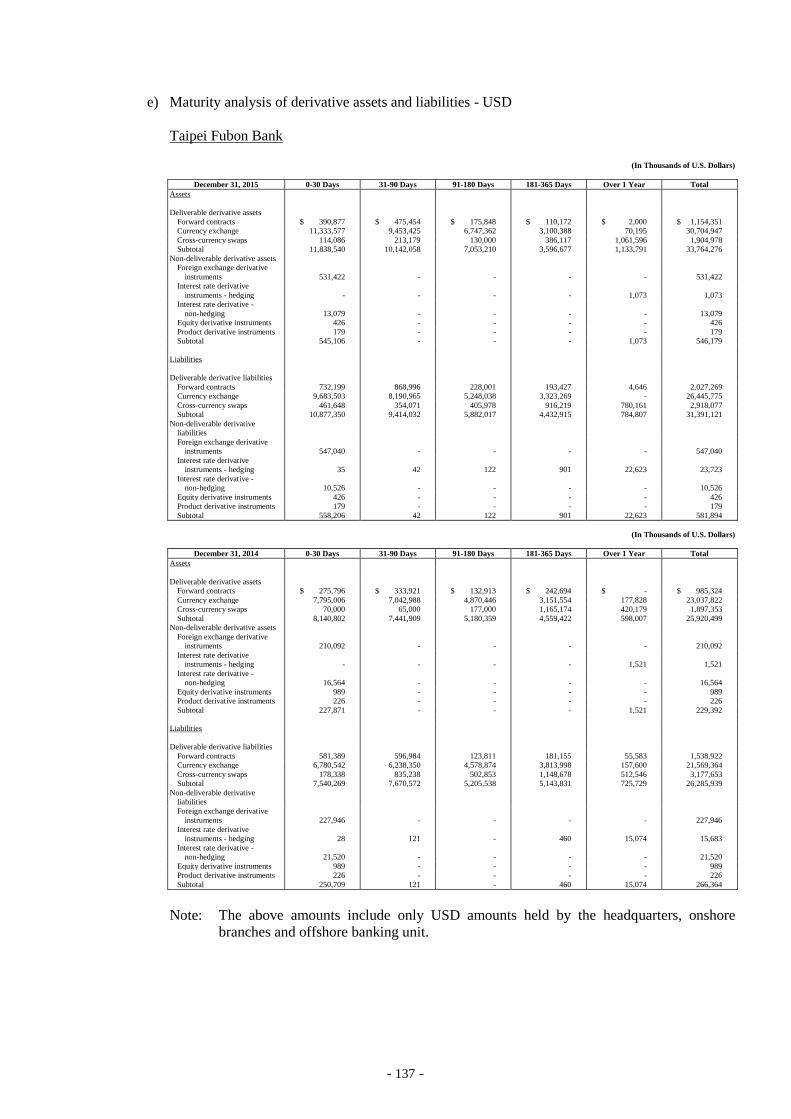
- 137 -
e) Maturity analysis of derivative assets and liabilities - USD
Taipei Fubon Bank
(In Thousands of U.S. Dollars)
December 31, 2015 0-30 Days 31-90 Days 91-180 Days 181-365 Days Over 1 Year Total
Assets
Deliverable derivative assets
Forward contracts $ 390,877 $ 475,454 $ 175,848 $ 110,172 $ 2,000 $ 1,154,351
Currency exchange 11,333,577 9,453,425 6,747,362 3,100,388 70,195 30,704,947
Cross-currency swaps 114,086 213,179 130,000 386,117 1,061,596 1,904,978
Subtotal 11,838,540 10,142,058 7,053,210 3,596,677 1,133,791 33,764,276
Non-deliverable derivative assets
Foreign exchange derivative
instruments 531,422 - - - - 531,422
Interest rate derivative
instruments - hedging - - - - 1,073 1,073
Interest rate derivative -
non-hedging 13,079 - - - - 13,079
Equity derivative instruments 426 - - - - 426
Product derivative instruments 179 - - - - 179
Subtotal 545,106 - - - 1,073 546,179
Liabilities
Deliverable derivative liabilities
Forward contracts 732,199 868,996 228,001 193,427 4,646 2,027,269
Currency exchange 9,683,503 8,190,965 5,248,038 3,323,269 - 26,445,775
Cross-currency swaps 461,648 354,071 405,978 916,219 780,161 2,918,077
Subtotal 10,877,350 9,414,032 5,882,017 4,432,915 784,807 31,391,121
Non-deliverable derivative
liabilities
Foreign exchange derivative
instruments 547,040 - - - - 547,040
Interest rate derivative
instruments - hedging 35 42 122 901 22,623 23,723
Interest rate derivative -
non-hedging 10,526 - - - - 10,526
Equity derivative instruments 426 - - - - 426
Product derivative instruments 179 - - - - 179
Subtotal 558,206 42 122 901 22,623 581,894
(In Thousands of U.S. Dollars)
December 31, 2014 0-30 Days 31-90 Days 91-180 Days 181-365 Days Over 1 Year Total
Assets
Deliverable derivative assets
Forward contracts $ 275,796 $ 333,921 $ 132,913 $ 242,694 $ - $ 985,324
Currency exchange 7,795,006 7,042,988 4,870,446 3,151,554 177,828 23,037,822
Cross-currency swaps 70,000 65,000 177,000 1,165,174 420,179 1,897,353
Subtotal 8,140,802 7,441,909 5,180,359 4,559,422 598,007 25,920,499
Non-deliverable derivative assets
Foreign exchange derivative
instruments 210,092 - - - - 210,092
Interest rate derivative
instruments - hedging - - - - 1,521 1,521
Interest rate derivative -
non-hedging 16,564 - - - - 16,564
Equity derivative instruments 989 - - - - 989
Product derivative instruments 226 - - - - 226
Subtotal 227,871 - - - 1,521 229,392
Liabilities
Deliverable derivative liabilities
Forward contracts 581,389 596,984 123,811 181,155 55,583 1,538,922
Currency exchange 6,780,542 6,238,350 4,578,874 3,813,998 157,600 21,569,364
Cross-currency swaps 178,338 835,238 502,853 1,148,678 512,546 3,177,653
Subtotal 7,540,269 7,670,572 5,205,538 5,143,831 725,729 26,285,939
Non-deliverable derivative
liabilities
Foreign exchange derivative
instruments 227,946 - - - - 227,946
Interest rate derivative
instruments - hedging 28 121 - 460 15,074 15,683
Interest rate derivative -
non-hedging 21,520 - - - - 21,520
Equity derivative instruments 989 - - - - 989
Product derivative instruments 226 - - - - 226
Subtotal 250,709 121 - 460 15,074 266,364
Note: The above amounts include only USD amounts held by the headquarters, onshore
branches and offshore banking unit.
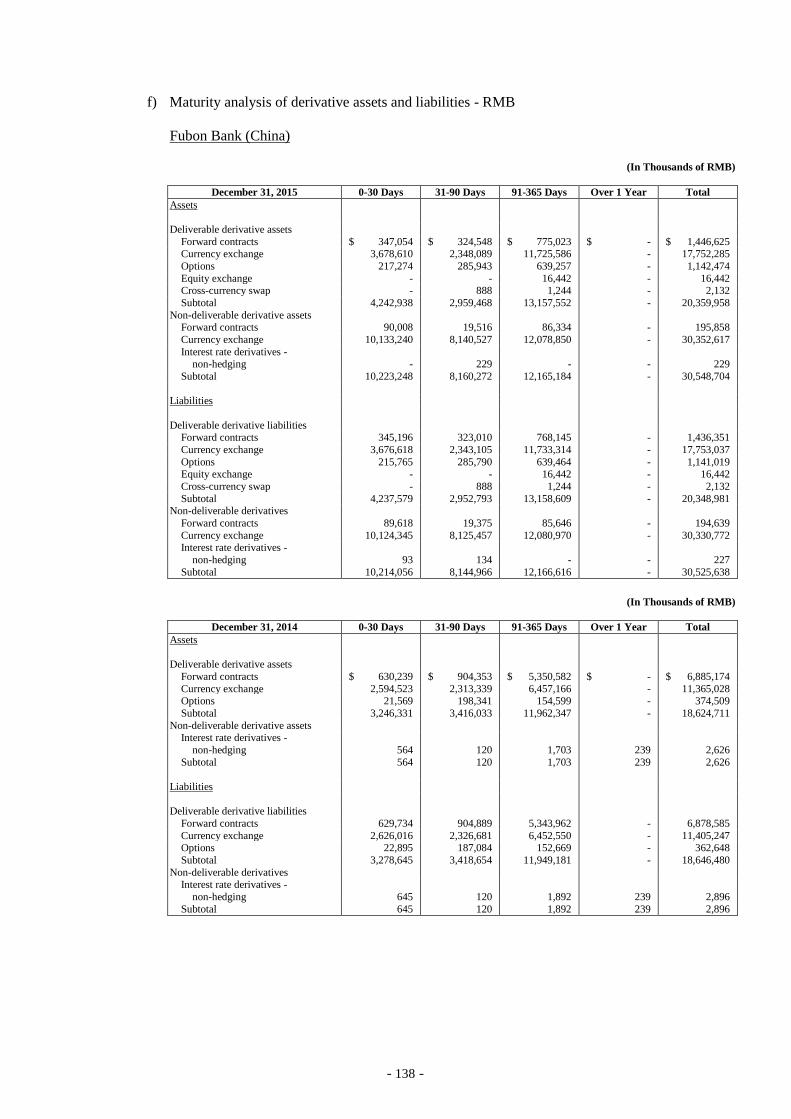
- 138 -
f) Maturity analysis of derivative assets and liabilities - RMB
Fubon Bank (China)
(In Thousands of RMB)
December 31, 2015 0-30 Days 31-90 Days 91-365 Days Over 1 Year Total
Assets
Deliverable derivative assets
Forward contracts $ 347,054 $ 324,548 $ 775,023 $ - $ 1,446,625 Currency exchange 3,678,610 2,348,089 11,725,586 - 17,752,285
Options 217,274 285,943 639,257 - 1,142,474
Equity exchange - - 16,442 - 16,442 Cross-currency swap - 888 1,244 - 2,132
Subtotal 4,242,938 2,959,468 13,157,552 - 20,359,958
Non-deliverable derivative assets Forward contracts 90,008 19,516 86,334 - 195,858
Currency exchange 10,133,240 8,140,527 12,078,850 - 30,352,617
Interest rate derivatives - non-hedging - 229 - - 229
Subtotal 10,223,248 8,160,272 12,165,184 - 30,548,704
Liabilities
Deliverable derivative liabilities Forward contracts 345,196 323,010 768,145 - 1,436,351
Currency exchange 3,676,618 2,343,105 11,733,314 - 17,753,037
Options 215,765 285,790 639,464 - 1,141,019 Equity exchange - - 16,442 - 16,442
Cross-currency swap - 888 1,244 - 2,132
Subtotal 4,237,579 2,952,793 13,158,609 - 20,348,981 Non-deliverable derivatives
Forward contracts 89,618 19,375 85,646 - 194,639
Currency exchange 10,124,345 8,125,457 12,080,970 - 30,330,772 Interest rate derivatives -
non-hedging 93 134 - - 227
Subtotal 10,214,056 8,144,966 12,166,616 - 30,525,638
(In Thousands of RMB)
December 31, 2014 0-30 Days 31-90 Days 91-365 Days Over 1 Year Total
Assets
Deliverable derivative assets
Forward contracts $ 630,239 $ 904,353 $ 5,350,582 $ - $ 6,885,174
Currency exchange 2,594,523 2,313,339 6,457,166 - 11,365,028 Options 21,569 198,341 154,599 - 374,509
Subtotal 3,246,331 3,416,033 11,962,347 - 18,624,711
Non-deliverable derivative assets Interest rate derivatives -
non-hedging 564 120 1,703 239 2,626
Subtotal 564 120 1,703 239 2,626
Liabilities
Deliverable derivative liabilities
Forward contracts 629,734 904,889 5,343,962 - 6,878,585
Currency exchange 2,626,016 2,326,681 6,452,550 - 11,405,247 Options 22,895 187,084 152,669 - 362,648
Subtotal 3,278,645 3,418,654 11,949,181 - 18,646,480
Non-deliverable derivatives Interest rate derivatives -
non-hedging 645 120 1,892 239 2,896
Subtotal 645 120 1,892 239 2,896
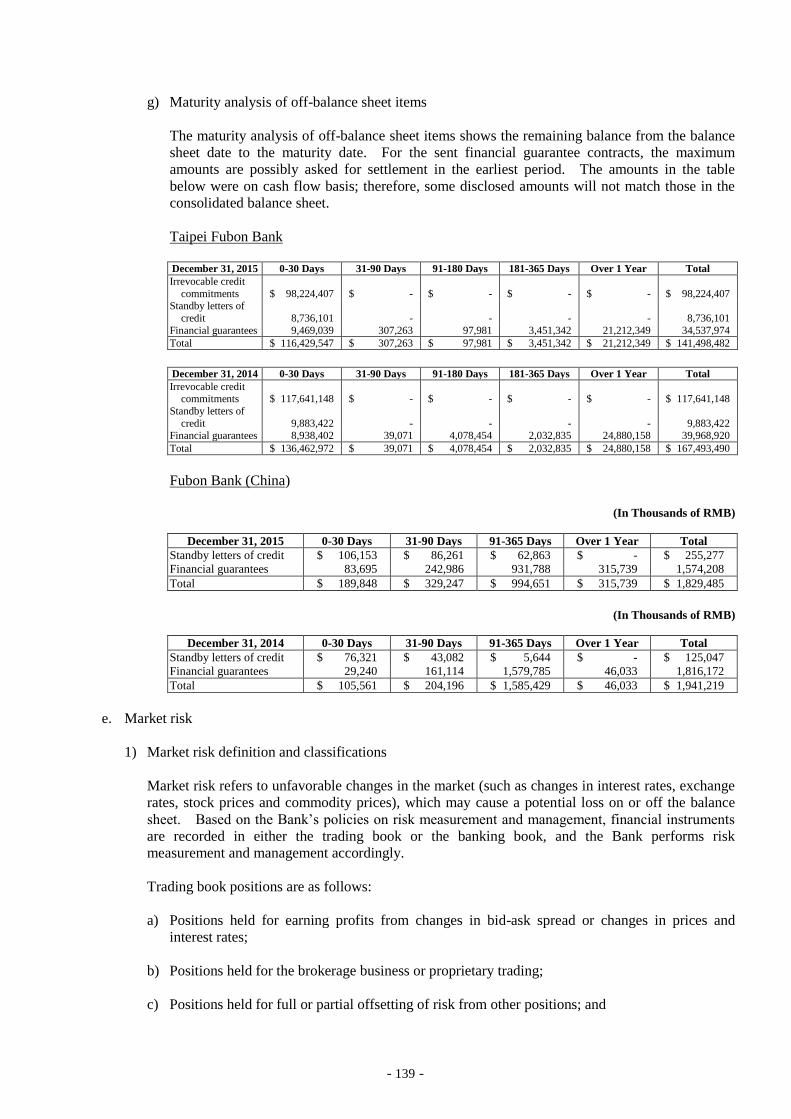
- 139 -
g) Maturity analysis of off-balance sheet items
The maturity analysis of off-balance sheet items shows the remaining balance from the balance
sheet date to the maturity date. For the sent financial guarantee contracts, the maximum
amounts are possibly asked for settlement in the earliest period. The amounts in the table
below were on cash flow basis; therefore, some disclosed amounts will not match those in the
consolidated balance sheet.
Taipei Fubon Bank
December 31, 2015 0-30 Days 31-90 Days 91-180 Days 181-365 Days Over 1 Year Total
Irrevocable credit
commitments $ 98,224,407 $ - $ - $ - $ - $ 98,224,407 Standby letters of
credit 8,736,101 - - - - 8,736,101
Financial guarantees 9,469,039 307,263 97,981 3,451,342 21,212,349 34,537,974
Total $ 116,429,547 $ 307,263 $ 97,981 $ 3,451,342 $ 21,212,349 $ 141,498,482
December 31, 2014 0-30 Days 31-90 Days 91-180 Days 181-365 Days Over 1 Year Total
Irrevocable credit commitments $ 117,641,148 $ - $ - $ - $ - $ 117,641,148
Standby letters of
credit 9,883,422 - - - - 9,883,422 Financial guarantees 8,938,402 39,071 4,078,454 2,032,835 24,880,158 39,968,920
Total $ 136,462,972 $ 39,071 $ 4,078,454 $ 2,032,835 $ 24,880,158 $ 167,493,490
Fubon Bank (China)
(In Thousands of RMB)
December 31, 2015 0-30 Days 31-90 Days 91-365 Days Over 1 Year Total
Standby letters of credit $ 106,153 $ 86,261 $ 62,863 $ - $ 255,277
Financial guarantees 83,695 242,986 931,788 315,739 1,574,208
Total $ 189,848 $ 329,247 $ 994,651 $ 315,739 $ 1,829,485
(In Thousands of RMB)
December 31, 2014 0-30 Days 31-90 Days 91-365 Days Over 1 Year Total
Standby letters of credit $ 76,321 $ 43,082 $ 5,644 $ - $ 125,047
Financial guarantees 29,240 161,114 1,579,785 46,033 1,816,172
Total $ 105,561 $ 204,196 $ 1,585,429 $ 46,033 $ 1,941,219
e. Market risk
1) Market risk definition and classifications
Market risk refers to unfavorable changes in the market (such as changes in interest rates, exchange
rates, stock prices and commodity prices), which may cause a potential loss on or off the balance
sheet. Based on the Bank’s policies on risk measurement and management, financial instruments
are recorded in either the trading book or the banking book, and the Bank performs risk
measurement and management accordingly.
Trading book positions are as follows:
a) Positions held for earning profits from changes in bid-ask spread or changes in prices and
interest rates;
b) Positions held for the brokerage business or proprietary trading;
c) Positions held for full or partial offsetting of risk from other positions; and
- 140 -
d) Positions held for trading within approved market risk limits.
Trading book positions should not be under any restrictive trading contracts and should be
completely hedged against risks. Positions that do not qualify for recording in the trading book are
recorded in the banking book.
2) Market risk strategy and procedures
Taipei Fubon Bank
Taipei Fubon Bank (TFB) has comprehensive policies on market risk management and has a
systematic mechanism for deal execution, clearing and settlement. The trading book instruments,
which are exposed to risk factors, are as follows: interest rate-related instruments, exchange
rate-related instruments, securities and commodities. The risk management systems apply TFB’s
management policies and market risk limits to identify, measure, monitor and control market risks.
Fubon Bank (China)
Based on relevant laws and regulations, various policies and procedures on market risk management
and valuation of financial instruments have been established for the internal control of market risks
as well as the strategic development of trading strategies and limits. IT systems have also been set
up to identify, quantify, monitor and control market risks to ensure that the market risk exposures of
Fubon Bank (China) are managed strongly and effectively.
3) Market risk management framework
Taipei Fubon Bank
Under the supervision of its Board of Directors, Taipei Fubon (TFB) Bank has established the
Market Risk Management Committee, which is composed of senior management and chaired by
TFB’s President to monitor TFB’s market risk control, risk acceptance and management strategies
for the trading business, securities investments and transactions, and derivatives.
The Risk Management Department under the Chief Risk Officer is responsible for formulating
policies on and procedures for market risk management, enforcing market risk limits, reporting
market risk events timely and validating valuation models independently. The independent audit
department under TFB’s Board of Directors is an added support for the market risk management
framework.
Fubon Bank (China)
The Board of Directors of Fubon Bank (China) (FBC), which is at the highest level of supervising
market risk management, approves the market risk management strategies and trading limits of this
bank. The Risk & Related Party Transaction Committee under the board is responsible for
supervising the implementation of market risk management policies. Market risk assessment
reports are submitted quarterly by the Market Risk Department to senior management, the Risk &
Related Party Transaction Committee and Board of Directors.
The Risk management Department under the Risk Management Division, which is independent of
the front trading desk and back settlement desk, is responsible for implementing market risk
management policies authorized by FBC’s Board and the senior management. The Internal Audit
Department is responsible for reviewing and evaluating the effectiveness and independence of the
risk management system. The Compliance Department is in charge of monitoring compliance
risks and submitting related reports to FBC’s Board and senior management.
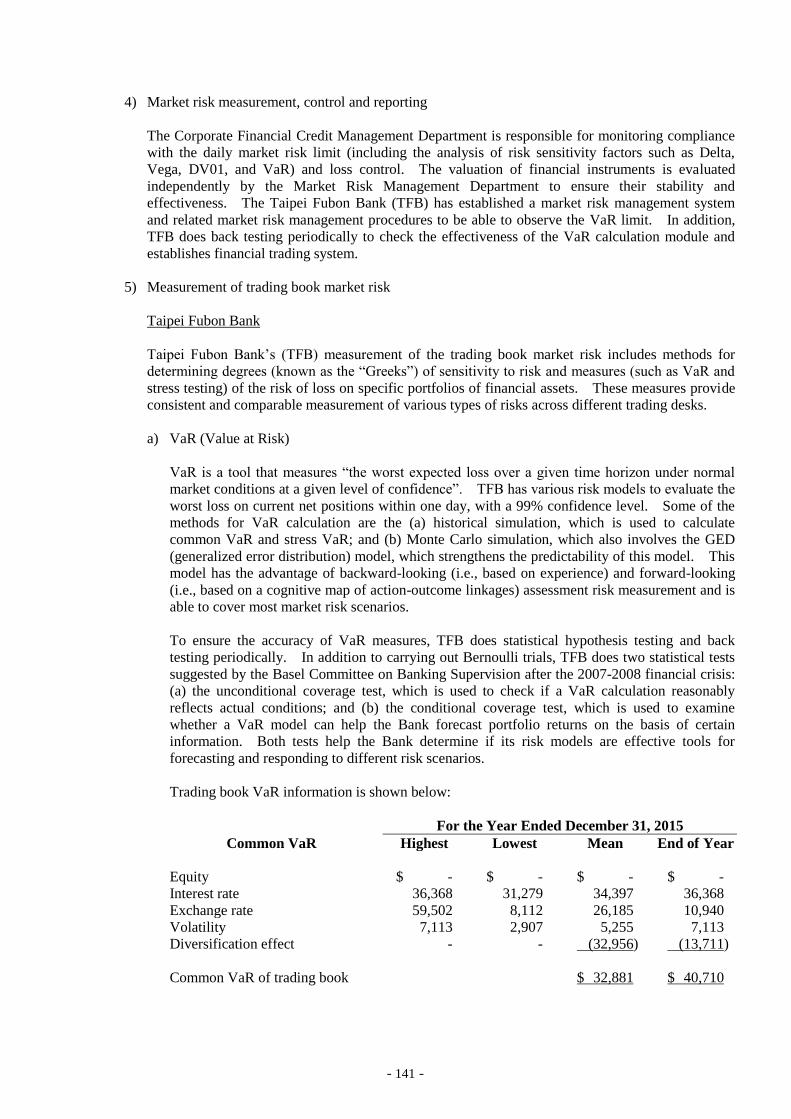
- 141 -
4) Market risk measurement, control and reporting
The Corporate Financial Credit Management Department is responsible for monitoring compliance
with the daily market risk limit (including the analysis of risk sensitivity factors such as Delta,
Vega, DV01, and VaR) and loss control. The valuation of financial instruments is evaluated
independently by the Market Risk Management Department to ensure their stability and
effectiveness. The Taipei Fubon Bank (TFB) has established a market risk management system
and related market risk management procedures to be able to observe the VaR limit. In addition,
TFB does back testing periodically to check the effectiveness of the VaR calculation module and
establishes financial trading system.
5) Measurement of trading book market risk
Taipei Fubon Bank
Taipei Fubon Bank’s (TFB) measurement of the trading book market risk includes methods for
determining degrees (known as the “Greeks”) of sensitivity to risk and measures (such as VaR and
stress testing) of the risk of loss on specific portfolios of financial assets. These measures provide
consistent and comparable measurement of various types of risks across different trading desks.
a) VaR (Value at Risk)
VaR is a tool that measures “the worst expected loss over a given time horizon under normal
market conditions at a given level of confidence”. TFB has various risk models to evaluate the
worst loss on current net positions within one day, with a 99% confidence level. Some of the
methods for VaR calculation are the (a) historical simulation, which is used to calculate
common VaR and stress VaR; and (b) Monte Carlo simulation, which also involves the GED
(generalized error distribution) model, which strengthens the predictability of this model. This
model has the advantage of backward-looking (i.e., based on experience) and forward-looking
(i.e., based on a cognitive map of action-outcome linkages) assessment risk measurement and is
able to cover most market risk scenarios.
To ensure the accuracy of VaR measures, TFB does statistical hypothesis testing and back
testing periodically. In addition to carrying out Bernoulli trials, TFB does two statistical tests
suggested by the Basel Committee on Banking Supervision after the 2007-2008 financial crisis:
(a) the unconditional coverage test, which is used to check if a VaR calculation reasonably
reflects actual conditions; and (b) the conditional coverage test, which is used to examine
whether a VaR model can help the Bank forecast portfolio returns on the basis of certain
information. Both tests help the Bank determine if its risk models are effective tools for
forecasting and responding to different risk scenarios.
Trading book VaR information is shown below:
For the Year Ended December 31, 2015
Common VaR Highest Lowest Mean End of Year
Equity $ - $ - $ - $ -
Interest rate 36,368 31,279 34,397 36,368
Exchange rate 59,502 8,112 26,185 10,940
Volatility 7,113 2,907 5,255 7,113
Diversification effect - - (32,956) (13,711)
Common VaR of trading book $ 32,881 $ 40,710
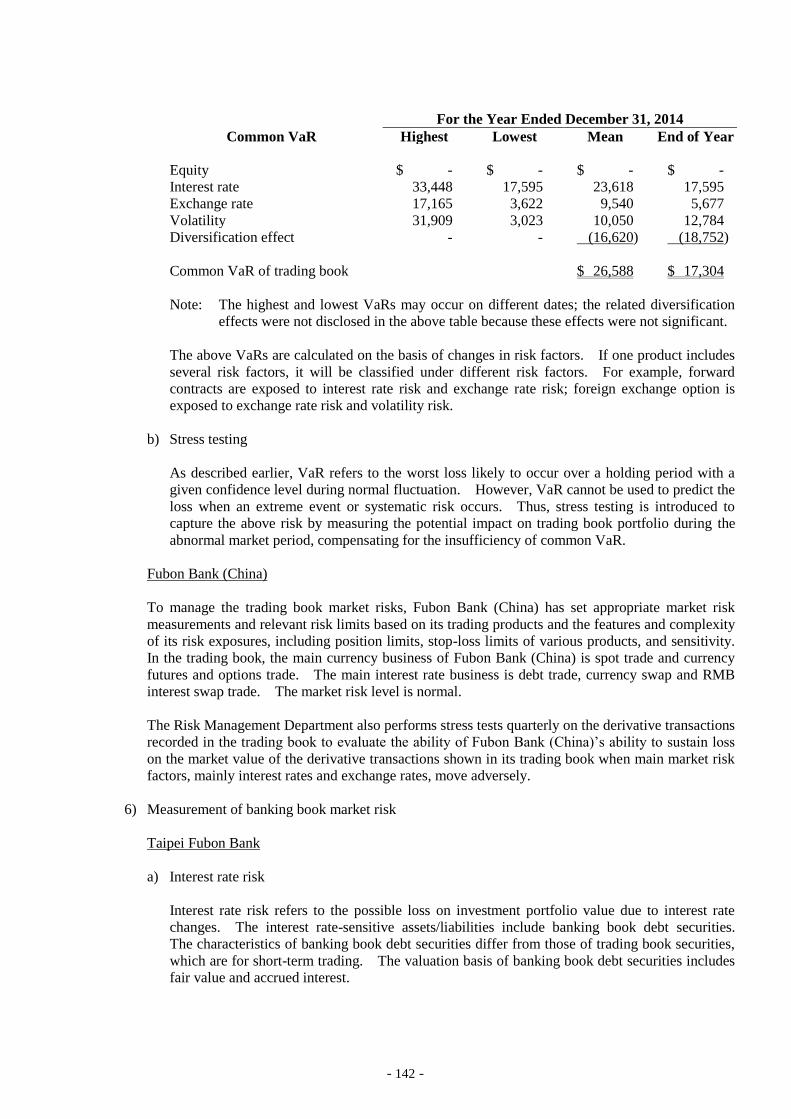
- 142 -
For the Year Ended December 31, 2014
Common VaR Highest Lowest Mean End of Year
Equity $ - $ - $ - $ -
Interest rate 33,448 17,595 23,618 17,595
Exchange rate 17,165 3,622 9,540 5,677
Volatility 31,909 3,023 10,050 12,784
Diversification effect - - (16,620) (18,752)
Common VaR of trading book $ 26,588 $ 17,304
Note: The highest and lowest VaRs may occur on different dates; the related diversification
effects were not disclosed in the above table because these effects were not significant.
The above VaRs are calculated on the basis of changes in risk factors. If one product includes
several risk factors, it will be classified under different risk factors. For example, forward
contracts are exposed to interest rate risk and exchange rate risk; foreign exchange option is
exposed to exchange rate risk and volatility risk.
b) Stress testing
As described earlier, VaR refers to the worst loss likely to occur over a holding period with a
given confidence level during normal fluctuation. However, VaR cannot be used to predict the
loss when an extreme event or systematic risk occurs. Thus, stress testing is introduced to
capture the above risk by measuring the potential impact on trading book portfolio during the
abnormal market period, compensating for the insufficiency of common VaR.
Fubon Bank (China)
To manage the trading book market risks, Fubon Bank (China) has set appropriate market risk
measurements and relevant risk limits based on its trading products and the features and complexity
of its risk exposures, including position limits, stop-loss limits of various products, and sensitivity.
In the trading book, the main currency business of Fubon Bank (China) is spot trade and currency
futures and options trade. The main interest rate business is debt trade, currency swap and RMB
interest swap trade. The market risk level is normal.
The Risk Management Department also performs stress tests quarterly on the derivative transactions
recorded in the trading book to evaluate the ability of Fubon Bank (China)’s ability to sustain loss
on the market value of the derivative transactions shown in its trading book when main market risk
factors, mainly interest rates and exchange rates, move adversely.
6) Measurement of banking book market risk
Taipei Fubon Bank
a) Interest rate risk
Interest rate risk refers to the possible loss on investment portfolio value due to interest rate
changes. The interest rate-sensitive assets/liabilities include banking book debt securities.
The characteristics of banking book debt securities differ from those of trading book securities,
which are for short-term trading. The valuation basis of banking book debt securities includes
fair value and accrued interest.
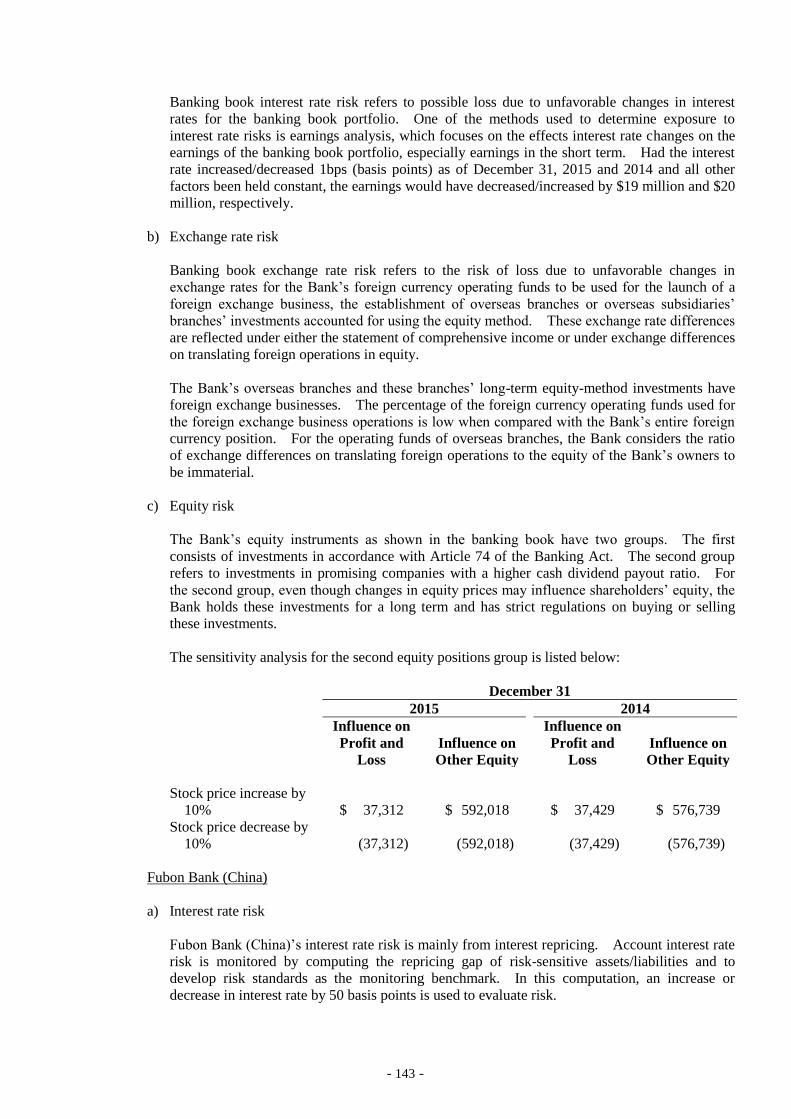
- 143 -
Banking book interest rate risk refers to possible loss due to unfavorable changes in interest
rates for the banking book portfolio. One of the methods used to determine exposure to
interest rate risks is earnings analysis, which focuses on the effects interest rate changes on the
earnings of the banking book portfolio, especially earnings in the short term. Had the interest
rate increased/decreased 1bps (basis points) as of December 31, 2015 and 2014 and all other
factors been held constant, the earnings would have decreased/increased by $19 million and $20
million, respectively.
b) Exchange rate risk
Banking book exchange rate risk refers to the risk of loss due to unfavorable changes in
exchange rates for the Bank’s foreign currency operating funds to be used for the launch of a
foreign exchange business, the establishment of overseas branches or overseas subsidiaries’
branches’ investments accounted for using the equity method. These exchange rate differences
are reflected under either the statement of comprehensive income or under exchange differences
on translating foreign operations in equity.
The Bank’s overseas branches and these branches’ long-term equity-method investments have
foreign exchange businesses. The percentage of the foreign currency operating funds used for
the foreign exchange business operations is low when compared with the Bank’s entire foreign
currency position. For the operating funds of overseas branches, the Bank considers the ratio
of exchange differences on translating foreign operations to the equity of the Bank’s owners to
be immaterial.
c) Equity risk
The Bank’s equity instruments as shown in the banking book have two groups. The first
consists of investments in accordance with Article 74 of the Banking Act. The second group
refers to investments in promising companies with a higher cash dividend payout ratio. For
the second group, even though changes in equity prices may influence shareholders’ equity, the
Bank holds these investments for a long term and has strict regulations on buying or selling
these investments.
The sensitivity analysis for the second equity positions group is listed below:
December 31
2015 2014
Influence on
Profit and
Loss
Influence on
Other Equity
Influence on
Profit and
Loss
Influence on
Other Equity
Stock price increase by
10% $ 37,312 $ 592,018 $ 37,429 $ 576,739
Stock price decrease by
10% (37,312) (592,018) (37,429) (576,739)
Fubon Bank (China)
a) Interest rate risk
Fubon Bank (China)’s interest rate risk is mainly from interest repricing. Account interest rate
risk is monitored by computing the repricing gap of risk-sensitive assets/liabilities and to
develop risk standards as the monitoring benchmark. In this computation, an increase or
decrease in interest rate by 50 basis points is used to evaluate risk.
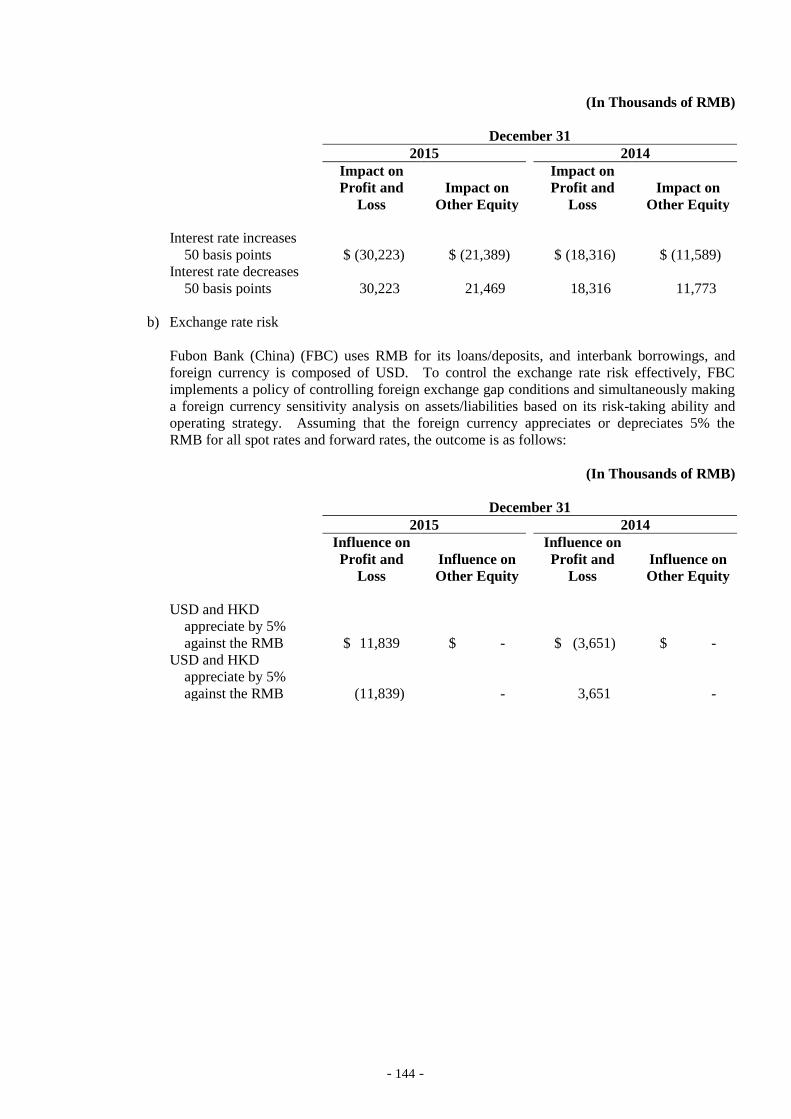
- 144 -
(In Thousands of RMB)
December 31
2015 2014
Impact on
Profit and
Loss
Impact on
Other Equity
Impact on
Profit and
Loss
Impact on
Other Equity
Interest rate increases
50 basis points $ (30,223) $ (21,389) $ (18,316) $ (11,589)
Interest rate decreases
50 basis points 30,223 21,469 18,316 11,773
b) Exchange rate risk
Fubon Bank (China) (FBC) uses RMB for its loans/deposits, and interbank borrowings, and
foreign currency is composed of USD. To control the exchange rate risk effectively, FBC
implements a policy of controlling foreign exchange gap conditions and simultaneously making
a foreign currency sensitivity analysis on assets/liabilities based on its risk-taking ability and
operating strategy. Assuming that the foreign currency appreciates or depreciates 5% the
RMB for all spot rates and forward rates, the outcome is as follows:
(In Thousands of RMB)
December 31
2015 2014
Influence on
Profit and
Loss
Influence on
Other Equity
Influence on
Profit and
Loss
Influence on
Other Equity
USD and HKD
appreciate by 5%
against the RMB $ 11,839 $ - $ (3,651) $ -
USD and HKD
appreciate by 5%
against the RMB (11,839) - 3,651 -
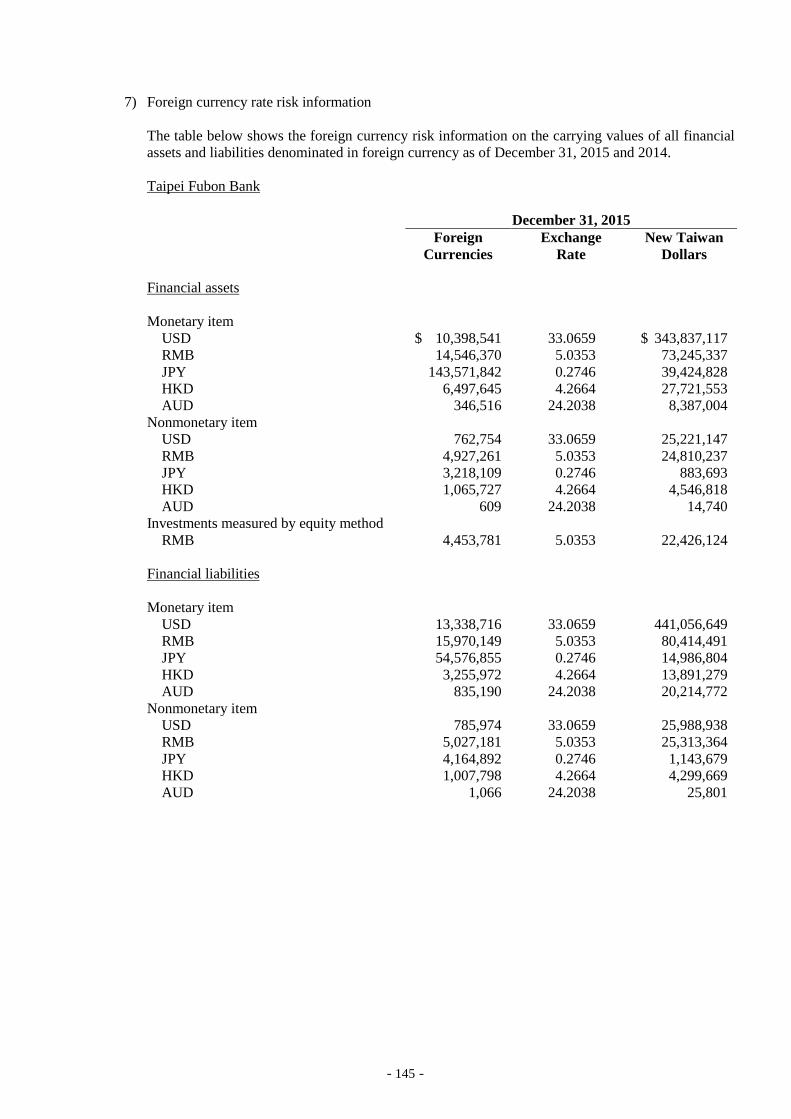
- 145 -
7) Foreign currency rate risk information
The table below shows the foreign currency risk information on the carrying values of all financial
assets and liabilities denominated in foreign currency as of December 31, 2015 and 2014.
Taipei Fubon Bank
December 31, 2015
Foreign
Currencies
Exchange
Rate
New Taiwan
Dollars
Financial assets
Monetary item
USD $ 10,398,541 33.0659 $ 343,837,117
RMB 14,546,370 5.0353 73,245,337
JPY 143,571,842 0.2746 39,424,828
HKD 6,497,645 4.2664 27,721,553
AUD 346,516 24.2038 8,387,004
Nonmonetary item
USD 762,754 33.0659 25,221,147
RMB 4,927,261 5.0353 24,810,237
JPY 3,218,109 0.2746 883,693
HKD 1,065,727 4.2664 4,546,818
AUD 609 24.2038 14,740
Investments measured by equity method
RMB 4,453,781 5.0353 22,426,124
Financial liabilities
Monetary item
USD 13,338,716 33.0659 441,056,649
RMB 15,970,149 5.0353 80,414,491
JPY 54,576,855 0.2746 14,986,804
HKD 3,255,972 4.2664 13,891,279
AUD 835,190 24.2038 20,214,772
Nonmonetary item
USD 785,974 33.0659 25,988,938
RMB 5,027,181 5.0353 25,313,364
JPY 4,164,892 0.2746 1,143,679
HKD 1,007,798 4.2664 4,299,669
AUD 1,066 24.2038 25,801
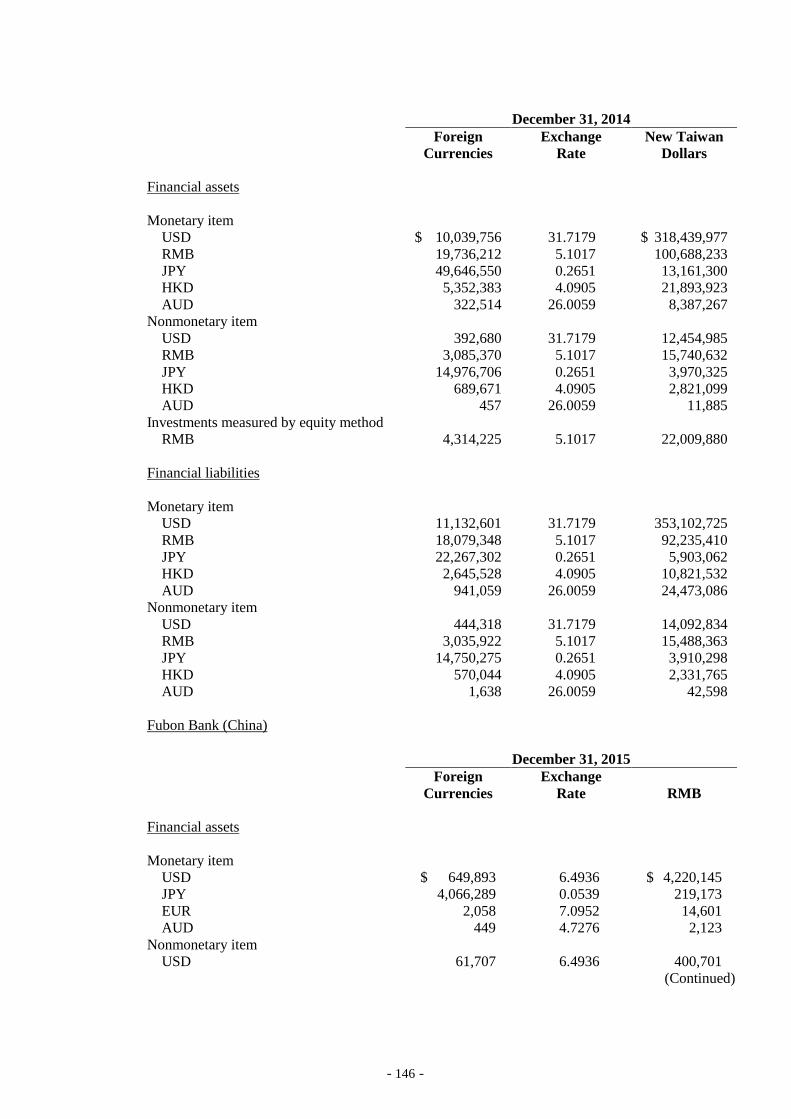
- 146 -
December 31, 2014
Foreign
Currencies
Exchange
Rate
New Taiwan
Dollars
Financial assets
Monetary item
USD $ 10,039,756 31.7179 $ 318,439,977
RMB 19,736,212 5.1017 100,688,233
JPY 49,646,550 0.2651 13,161,300
HKD 5,352,383 4.0905 21,893,923
AUD 322,514 26.0059 8,387,267
Nonmonetary item
USD 392,680 31.7179 12,454,985
RMB 3,085,370 5.1017 15,740,632
JPY 14,976,706 0.2651 3,970,325
HKD 689,671 4.0905 2,821,099
AUD 457 26.0059 11,885
Investments measured by equity method
RMB 4,314,225 5.1017 22,009,880
Financial liabilities
Monetary item
USD 11,132,601 31.7179 353,102,725
RMB 18,079,348 5.1017 92,235,410
JPY 22,267,302 0.2651 5,903,062
HKD 2,645,528 4.0905 10,821,532
AUD 941,059 26.0059 24,473,086
Nonmonetary item
USD 444,318 31.7179 14,092,834
RMB 3,035,922 5.1017 15,488,363
JPY 14,750,275 0.2651 3,910,298
HKD 570,044 4.0905 2,331,765
AUD 1,638 26.0059 42,598
Fubon Bank (China)
December 31, 2015
Foreign
Currencies
Exchange
Rate RMB
Financial assets
Monetary item
USD $ 649,893 6.4936 $ 4,220,145
JPY 4,066,289 0.0539 219,173
EUR 2,058 7.0952 14,601
AUD 449 4.7276 2,123
Nonmonetary item
USD 61,707 6.4936 400,701
(Continued)
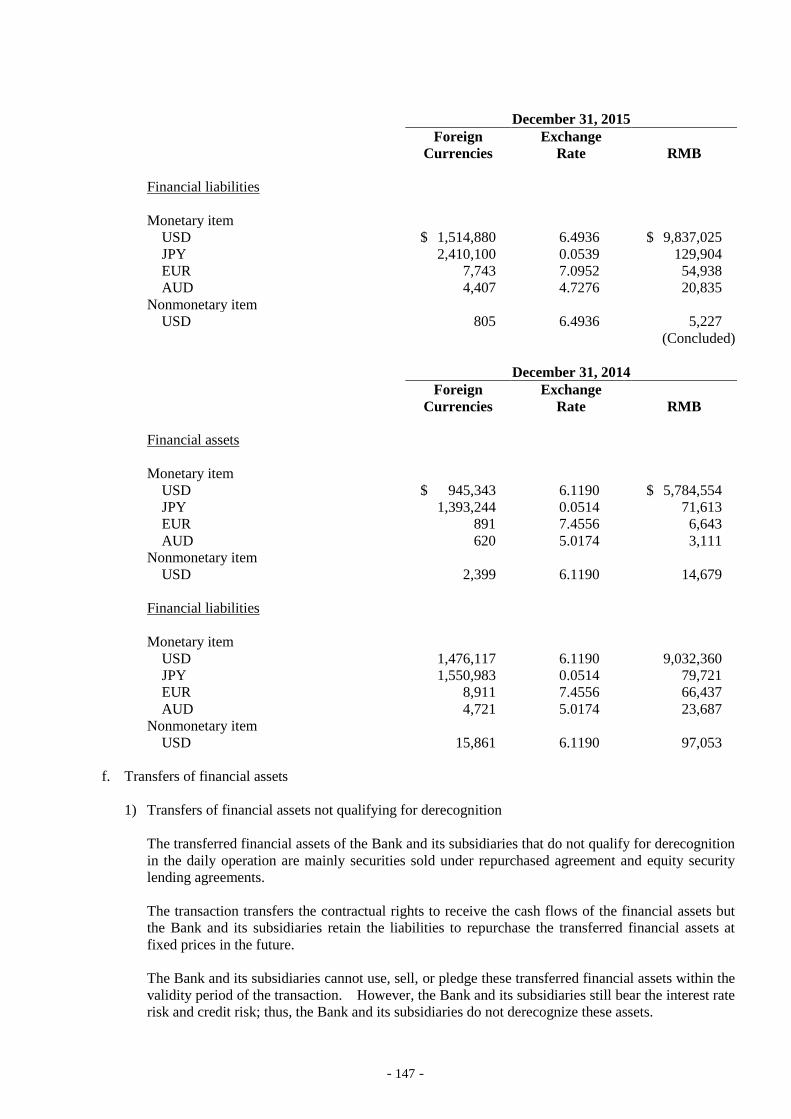
- 147 -
December 31, 2015
Foreign
Currencies
Exchange
Rate RMB
Financial liabilities
Monetary item
USD $ 1,514,880 6.4936 $ 9,837,025
JPY 2,410,100 0.0539 129,904
EUR 7,743 7.0952 54,938
AUD 4,407 4.7276 20,835
Nonmonetary item
USD 805 6.4936 5,227
(Concluded)
December 31, 2014
Foreign
Currencies
Exchange
Rate RMB
Financial assets
Monetary item
USD $ 945,343 6.1190 $ 5,784,554
JPY 1,393,244 0.0514 71,613
EUR 891 7.4556 6,643
AUD 620 5.0174 3,111
Nonmonetary item
USD 2,399 6.1190 14,679
Financial liabilities
Monetary item
USD 1,476,117 6.1190 9,032,360
JPY 1,550,983 0.0514 79,721
EUR 8,911 7.4556 66,437
AUD 4,721 5.0174 23,687
Nonmonetary item
USD 15,861 6.1190 97,053
f. Transfers of financial assets
1) Transfers of financial assets not qualifying for derecognition
The transferred financial assets of the Bank and its subsidiaries that do not qualify for derecognition
in the daily operation are mainly securities sold under repurchased agreement and equity security
lending agreements.
The transaction transfers the contractual rights to receive the cash flows of the financial assets but
the Bank and its subsidiaries retain the liabilities to repurchase the transferred financial assets at
fixed prices in the future.
The Bank and its subsidiaries cannot use, sell, or pledge these transferred financial assets within the
validity period of the transaction. However, the Bank and its subsidiaries still bear the interest rate
risk and credit risk; thus, the Bank and its subsidiaries do not derecognize these assets.
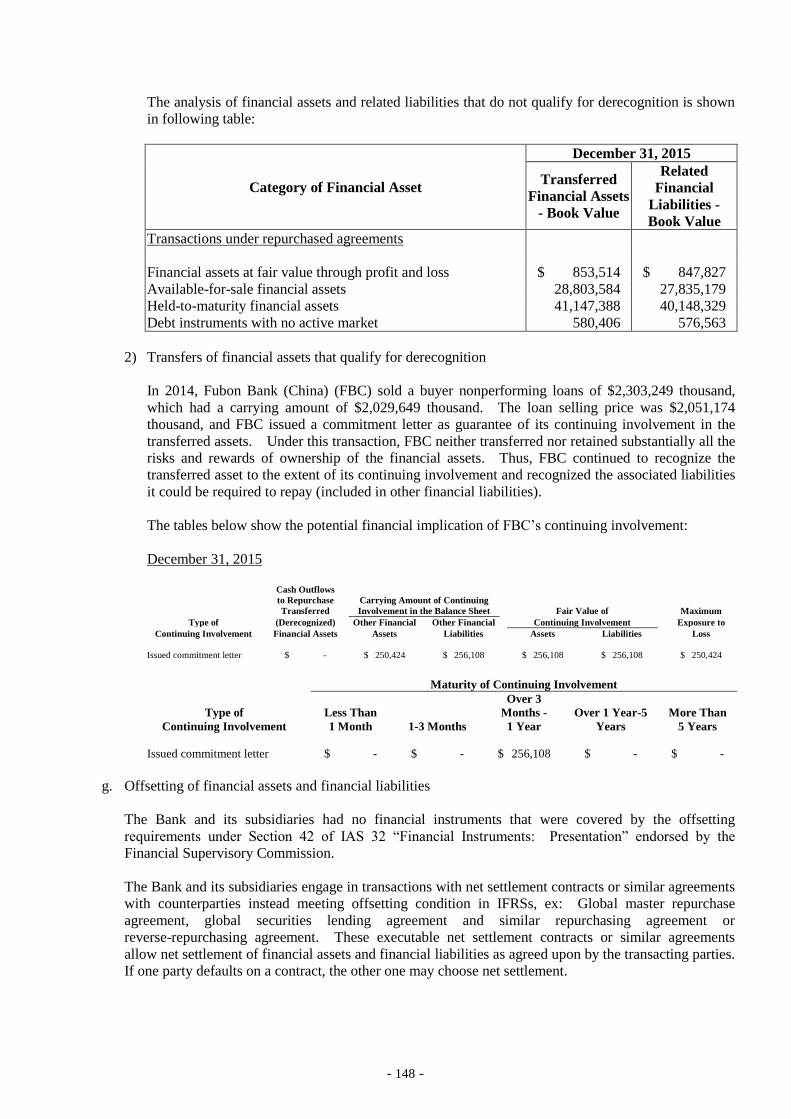
- 148 -
The analysis of financial assets and related liabilities that do not qualify for derecognition is shown
in following table:
Category of Financial Asset
December 31, 2015
Transferred
Financial Assets
- Book Value
Related
Financial
Liabilities -
Book Value
Transactions under repurchased agreements
Financial assets at fair value through profit and loss $ 853,514 $ 847,827
Available-for-sale financial assets 28,803,584 27,835,179
Held-to-maturity financial assets 41,147,388 40,148,329
Debt instruments with no active market 580,406 576,563
2) Transfers of financial assets that qualify for derecognition
In 2014, Fubon Bank (China) (FBC) sold a buyer nonperforming loans of $2,303,249 thousand,
which had a carrying amount of $2,029,649 thousand. The loan selling price was $2,051,174
thousand, and FBC issued a commitment letter as guarantee of its continuing involvement in the
transferred assets. Under this transaction, FBC neither transferred nor retained substantially all the
risks and rewards of ownership of the financial assets. Thus, FBC continued to recognize the
transferred asset to the extent of its continuing involvement and recognized the associated liabilities
it could be required to repay (included in other financial liabilities).
The tables below show the potential financial implication of FBC’s continuing involvement:
December 31, 2015
Cash Outflows
to Repurchase
Transferred
Carrying Amount of Continuing
Involvement in the Balance Sheet Fair Value of Maximum
Type of (Derecognized) Other Financial Other Financial Continuing Involvement Exposure to
Continuing Involvement Financial Assets Assets Liabilities Assets Liabilities Loss
Issued commitment letter $ - $ 250,424 $ 256,108 $ 256,108 $ 256,108 $ 250,424
Maturity of Continuing Involvement
Type of
Continuing Involvement
Less Than
1 Month 1-3 Months
Over 3
Months -
1 Year
Over 1 Year-5
Years
More Than
5 Years
Issued commitment letter $ - $ - $ 256,108 $ - $ -
g. Offsetting of financial assets and financial liabilities
The Bank and its subsidiaries had no financial instruments that were covered by the offsetting
requirements under Section 42 of IAS 32 “Financial Instruments: Presentation” endorsed by the
Financial Supervisory Commission.
The Bank and its subsidiaries engage in transactions with net settlement contracts or similar agreements
with counterparties instead meeting offsetting condition in IFRSs, ex: Global master repurchase
agreement, global securities lending agreement and similar repurchasing agreement or
reverse-repurchasing agreement. These executable net settlement contracts or similar agreements
allow net settlement of financial assets and financial liabilities as agreed upon by the transacting parties.
If one party defaults on a contract, the other one may choose net settlement.
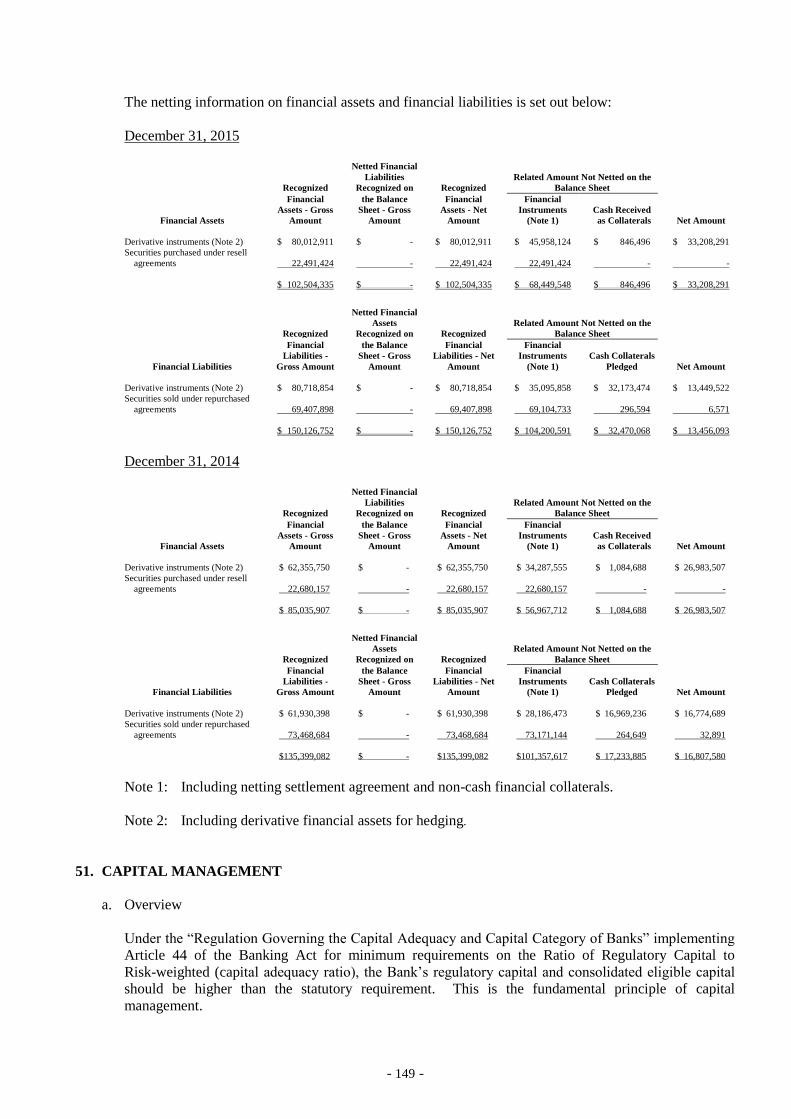
- 149 -
The netting information on financial assets and financial liabilities is set out below:
December 31, 2015
Recognized
Netted Financial
Liabilities
Recognized on Recognized
Related Amount Not Netted on the
Balance Sheet
Financial Assets
Financial
Assets - Gross
Amount
the Balance
Sheet - Gross
Amount
Financial
Assets - Net
Amount
Financial
Instruments
(Note 1)
Cash Received
as Collaterals Net Amount
Derivative instruments (Note 2) $ 80,012,911 $ - $ 80,012,911 $ 45,958,124 $ 846,496 $ 33,208,291
Securities purchased under resell
agreements 22,491,424 - 22,491,424 22,491,424 - -
$ 102,504,335 $ - $ 102,504,335 $ 68,449,548 $ 846,496 $ 33,208,291
Recognized
Netted Financial
Assets
Recognized on Recognized
Related Amount Not Netted on the
Balance Sheet
Financial Liabilities
Financial
Liabilities -
Gross Amount
the Balance
Sheet - Gross
Amount
Financial
Liabilities - Net
Amount
Financial
Instruments
(Note 1)
Cash Collaterals
Pledged Net Amount
Derivative instruments (Note 2) $ 80,718,854 $ - $ 80,718,854 $ 35,095,858 $ 32,173,474 $ 13,449,522
Securities sold under repurchased
agreements 69,407,898 - 69,407,898 69,104,733 296,594 6,571
$ 150,126,752 $ - $ 150,126,752 $ 104,200,591 $ 32,470,068 $ 13,456,093
December 31, 2014
Recognized
Netted Financial
Liabilities
Recognized on Recognized
Related Amount Not Netted on the
Balance Sheet
Financial Assets
Financial
Assets - Gross
Amount
the Balance
Sheet - Gross
Amount
Financial
Assets - Net
Amount
Financial
Instruments
(Note 1)
Cash Received
as Collaterals Net Amount
Derivative instruments (Note 2) $ 62,355,750 $ - $ 62,355,750 $ 34,287,555 $ 1,084,688 $ 26,983,507
Securities purchased under resell
agreements 22,680,157 - 22,680,157 22,680,157 - -
$ 85,035,907 $ - $ 85,035,907 $ 56,967,712 $ 1,084,688 $ 26,983,507
Recognized
Netted Financial
Assets
Recognized on Recognized
Related Amount Not Netted on the
Balance Sheet
Financial Liabilities
Financial
Liabilities -
Gross Amount
the Balance
Sheet - Gross
Amount
Financial
Liabilities - Net
Amount
Financial
Instruments
(Note 1)
Cash Collaterals
Pledged Net Amount
Derivative instruments (Note 2) $ 61,930,398 $ - $ 61,930,398 $ 28,186,473 $ 16,969,236 $ 16,774,689
Securities sold under repurchased
agreements 73,468,684 - 73,468,684 73,171,144 264,649 32,891
$135,399,082 $ - $135,399,082 $101,357,617 $ 17,233,885 $ 16,807,580
Note 1: Including netting settlement agreement and non-cash financial collaterals.
Note 2: Including derivative financial assets for hedging.
51. CAPITAL MANAGEMENT
a. Overview
Under the “Regulation Governing the Capital Adequacy and Capital Category of Banks” implementing
Article 44 of the Banking Act for minimum requirements on the Ratio of Regulatory Capital to
Risk-weighted (capital adequacy ratio), the Bank’s regulatory capital and consolidated eligible capital
should be higher than the statutory requirement. This is the fundamental principle of capital
management.
- 150 -
For sound operations, the Bank has established internal control policies to ensure its capital adequacy
ratio meets the minimum regulatory requirement.
b. Capital management procedures
The Bank’s capital is managed by the planning department in the administrative division under the
Bank’s Capital Adequacy Management Policy, which was approved by the Board of Directors.
Regulatory capital is calculated in accordance with the “Regulations Governing the Capital Adequacy
and Capital Category of Banks,” and reported to the authority quarterly. Regulatory capital is
classified into net Tier 1 Capital (the aggregate amount of net common equity Tier 1 and net additional
Tier 1 Capital) and net Tier 2 Capital. In additional, adjust items: The change in credit risk of
financial liability recognize unrealized gains and losses (Gains should be deducted, and losses should be
added back).
1) Net Tier 1 capital
a) Net common equity Tier 1 capital: Common equity mainly includes common shares, capital
surplus, retained earnings, other equity, and non-controlling interests, with the total net of the
following items: Intangible assets, unrealized gains on available-for-sale financial assets,
revaluation gains on investment properties subsequently measured using the fair value model,
the revaluation surplus on real estate, and 25% of the amount of investments related to financial
industry booked in banking book.
b) Net additional Tier 1 capital: The capital issued by the Bank’s subsidiaries but not held by the
Bank minus 25% of the investment related to the financial industry is recorded in the banking
book.
2) Net Tier 2 capital
This capital base comprises the total amount of long-term subordinated bank debentures that the
Bank’s subsidiaries issued but not held by the Bank’s capital, the increase in retained earnings
resulting from using fair value or revaluation as the deemed cost of the real estate on the translation
date of IFRSs, and 45% of the amount of unrealized gain on available-for-sale financial assets, 45%
of the revaluation gains on investment properties subsequently measured using the fair value model,
operating reserves and loan loss provision allowance (the amount is determined when the allowance
the Bank recognized is more than the expected loss based on the historical experience) less 50% of
the amount of investments related to the financial industry as shown in the banking book.
The Bank evaluates capital adequacy quarterly as well as the future demand for capital and raises
the capital if needed to maintain capital adequacy.
c. Statement of capital adequacy
As of December 31, 2015, the Bank had met the authorities’ minimum requirements for capital
adequacy ratio. Refer to Note 54.
- 151 -
52. RECLASSIFICATIONS
On January 1, 2012, the Bank reclassified its financial assets. The fair values at the reclassification date
were as follows:
Before
Reclassification
After
Reclassification
Available-for-sale financial assets $ 12,052,604 $ -
Held-to-maturity financial assets - 12,052,604
$ 12,052,604 $ 12,052,604
The effective interest rates for the available-for-sale financial assets that have been reclassified to
held-to-maturity financial assets ranged from 0.52% to 9.95%. The estimated recoverable cash flows
amounted to $13,966,953 thousand.
The carrying amounts and fair values of the reclassified financial assets (excluding those that had been
derecognized) as of December 31, 2015 and 2014 were as follows:
December 31
2015 2014
Held-to-maturity financial assets
Carrying amounts $ 1,176,836 $ 3,044,081
Fair value 1,189,341 3,104,158
The gains or losses recorded for the reclassified financial assets (excluding those that had been
derecognized before December 31, 2015 and 2014) for the years ended December 31, 2015 and 2014 and
the pro forma adjustments recognized in other equity assuming no reclassifications had been made were as
follows:
For the Year Ended December 31
2015 2014
Held-to-maturity financial assets
Gains recognized $ 66,731 $ 126,762
Pro forma adjustments recognized in other equity 57,599 149,808
53. ASSET QUALITY, CONCENTRATION OF CREDIT EXTENSIONS, INTEREST RATE
SENSITIVITY, PROFITABILITY AND MATURITY ANALYSIS OF ASSETS AND LIABILITIES
Except for profitability described in item (d) below, the following information only refers to the Bank.
a. Asset quality
See Table 1.
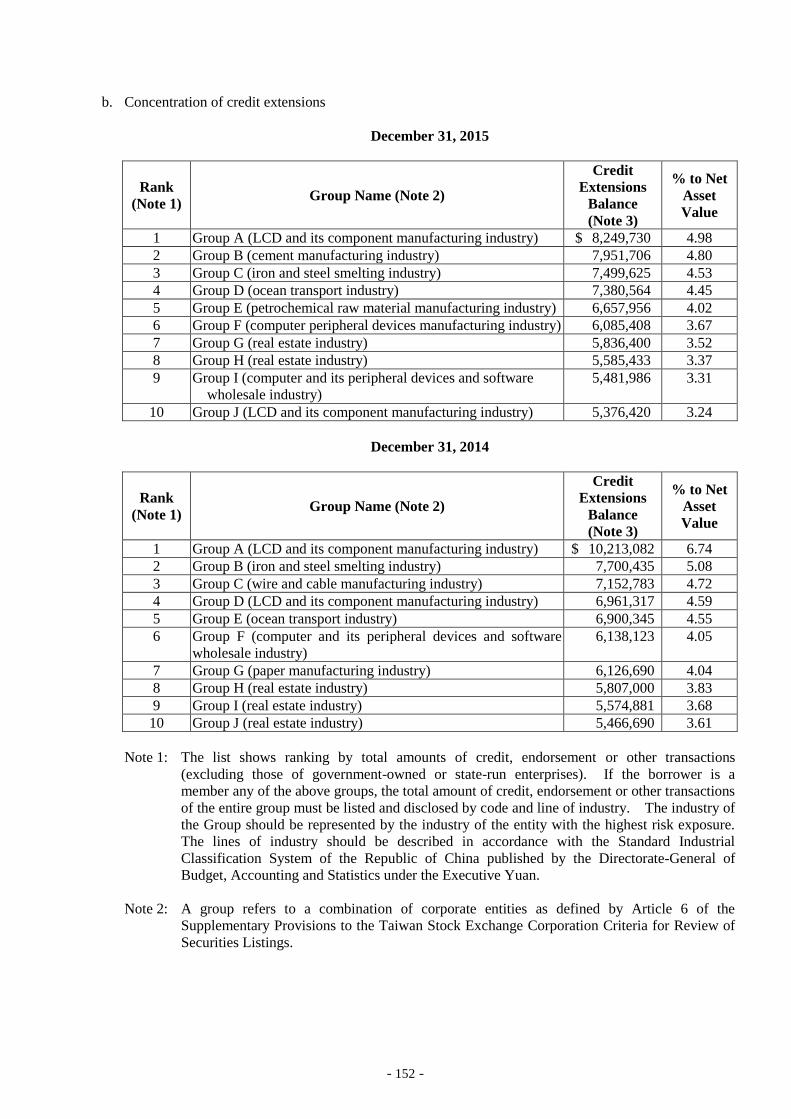
- 152 -
b. Concentration of credit extensions
December 31, 2015
Rank
(Note 1) Group Name (Note 2)
Credit
Extensions
Balance
(Note 3)
% to Net
Asset
Value
1 Group A (LCD and its component manufacturing industry) $ 8,249,730 4.98
2 Group B (cement manufacturing industry) 7,951,706 4.80
3 Group C (iron and steel smelting industry) 7,499,625 4.53
4 Group D (ocean transport industry) 7,380,564 4.45
5 Group E (petrochemical raw material manufacturing industry) 6,657,956 4.02
6 Group F (computer peripheral devices manufacturing industry) 6,085,408 3.67
7 Group G (real estate industry) 5,836,400 3.52
8 Group H (real estate industry) 5,585,433 3.37
9 Group I (computer and its peripheral devices and software
wholesale industry)
5,481,986 3.31
10 Group J (LCD and its component manufacturing industry) 5,376,420 3.24
December 31, 2014
Rank
(Note 1) Group Name (Note 2)
Credit
Extensions
Balance
(Note 3)
% to Net
Asset
Value
1 Group A (LCD and its component manufacturing industry) $ 10,213,082 6.74
2 Group B (iron and steel smelting industry) 7,700,435 5.08
3 Group C (wire and cable manufacturing industry) 7,152,783 4.72
4 Group D (LCD and its component manufacturing industry) 6,961,317 4.59
5 Group E (ocean transport industry) 6,900,345 4.55
6 Group F (computer and its peripheral devices and software
wholesale industry)
6,138,123 4.05
7 Group G (paper manufacturing industry) 6,126,690 4.04
8 Group H (real estate industry) 5,807,000 3.83
9 Group I (real estate industry) 5,574,881 3.68
10 Group J (real estate industry) 5,466,690 3.61
Note 1: The list shows ranking by total amounts of credit, endorsement or other transactions
(excluding those of government-owned or state-run enterprises). If the borrower is a
member any of the above groups, the total amount of credit, endorsement or other transactions
of the entire group must be listed and disclosed by code and line of industry. The industry of
the Group should be represented by the industry of the entity with the highest risk exposure.
The lines of industry should be described in accordance with the Standard Industrial
Classification System of the Republic of China published by the Directorate-General of
Budget, Accounting and Statistics under the Executive Yuan.
Note 2: A group refers to a combination of corporate entities as defined by Article 6 of the
Supplementary Provisions to the Taiwan Stock Exchange Corporation Criteria for Review of
Securities Listings.
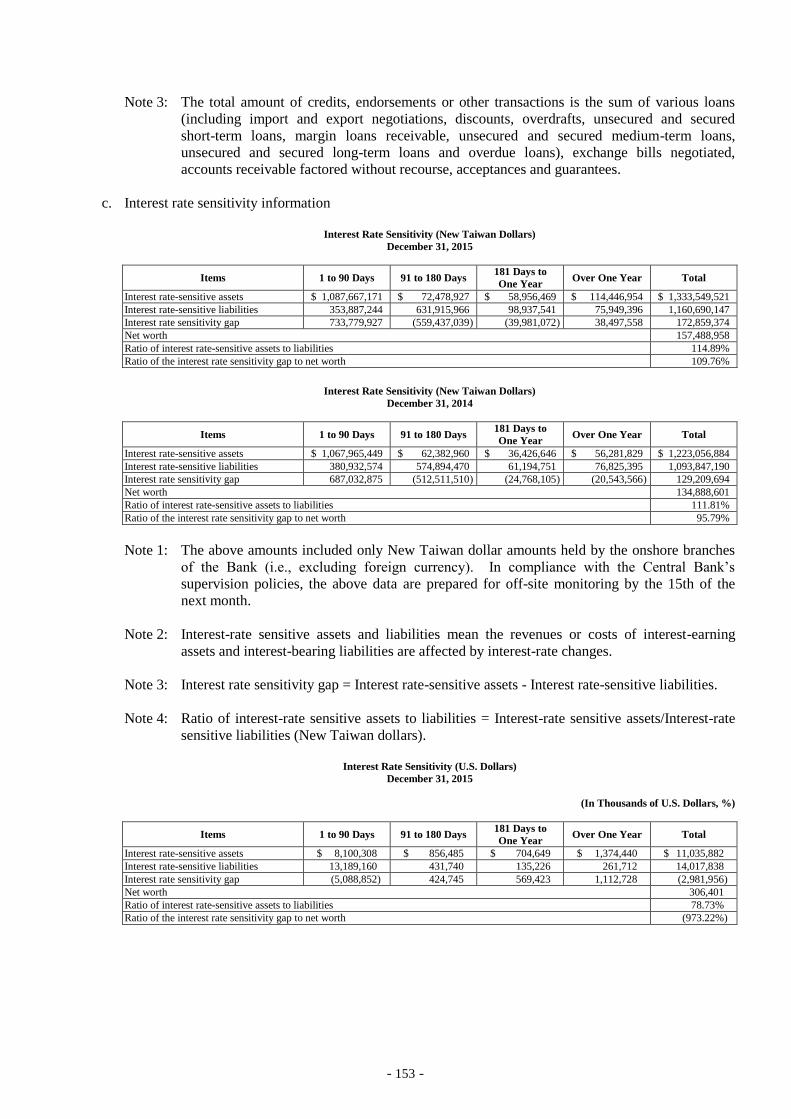
- 153 -
Note 3: The total amount of credits, endorsements or other transactions is the sum of various loans
(including import and export negotiations, discounts, overdrafts, unsecured and secured
short-term loans, margin loans receivable, unsecured and secured medium-term loans,
unsecured and secured long-term loans and overdue loans), exchange bills negotiated,
accounts receivable factored without recourse, acceptances and guarantees.
c. Interest rate sensitivity information
Interest Rate Sensitivity (New Taiwan Dollars)
December 31, 2015
Items 1 to 90 Days 91 to 180 Days 181 Days to
One Year Over One Year Total
Interest rate-sensitive assets $ 1,087,667,171 $ 72,478,927 $ 58,956,469 $ 114,446,954 $ 1,333,549,521
Interest rate-sensitive liabilities 353,887,244 631,915,966 98,937,541 75,949,396 1,160,690,147
Interest rate sensitivity gap 733,779,927 (559,437,039 ) (39,981,072 ) 38,497,558 172,859,374
Net worth 157,488,958
Ratio of interest rate-sensitive assets to liabilities 114.89%
Ratio of the interest rate sensitivity gap to net worth 109.76%
Interest Rate Sensitivity (New Taiwan Dollars)
December 31, 2014
Items 1 to 90 Days 91 to 180 Days 181 Days to
One Year Over One Year Total
Interest rate-sensitive assets $ 1,067,965,449 $ 62,382,960 $ 36,426,646 $ 56,281,829 $ 1,223,056,884
Interest rate-sensitive liabilities 380,932,574 574,894,470 61,194,751 76,825,395 1,093,847,190
Interest rate sensitivity gap 687,032,875 (512,511,510 ) (24,768,105 ) (20,543,566 ) 129,209,694
Net worth 134,888,601
Ratio of interest rate-sensitive assets to liabilities 111.81%
Ratio of the interest rate sensitivity gap to net worth 95.79%
Note 1: The above amounts included only New Taiwan dollar amounts held by the onshore branches
of the Bank (i.e., excluding foreign currency). In compliance with the Central Bank’s
supervision policies, the above data are prepared for off-site monitoring by the 15th of the
next month.
Note 2: Interest-rate sensitive assets and liabilities mean the revenues or costs of interest-earning
assets and interest-bearing liabilities are affected by interest-rate changes.
Note 3: Interest rate sensitivity gap = Interest rate-sensitive assets - Interest rate-sensitive liabilities.
Note 4: Ratio of interest-rate sensitive assets to liabilities = Interest-rate sensitive assets/Interest-rate
sensitive liabilities (New Taiwan dollars).
Interest Rate Sensitivity (U.S. Dollars)
December 31, 2015
(In Thousands of U.S. Dollars, %)
Items 1 to 90 Days 91 to 180 Days 181 Days to
One Year Over One Year Total
Interest rate-sensitive assets $ 8,100,308 $ 856,485 $ 704,649 $ 1,374,440 $ 11,035,882
Interest rate-sensitive liabilities 13,189,160 431,740 135,226 261,712 14,017,838
Interest rate sensitivity gap (5,088,852 ) 424,745 569,423 1,112,728 (2,981,956 )
Net worth 306,401
Ratio of interest rate-sensitive assets to liabilities 78.73%
Ratio of the interest rate sensitivity gap to net worth (973.22% )
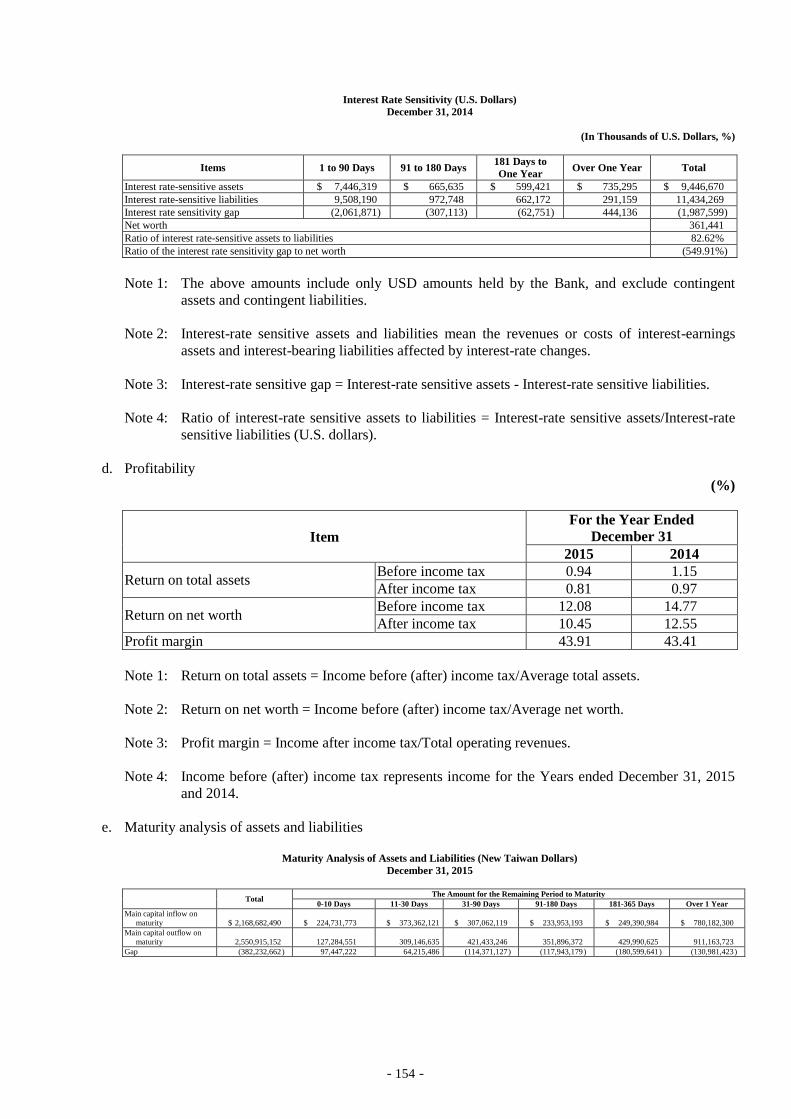
- 154 -
Interest Rate Sensitivity (U.S. Dollars)
December 31, 2014
(In Thousands of U.S. Dollars, %)
Items 1 to 90 Days 91 to 180 Days 181 Days to
One Year Over One Year Total
Interest rate-sensitive assets $ 7,446,319 $ 665,635 $ 599,421 $ 735,295 $ 9,446,670
Interest rate-sensitive liabilities 9,508,190 972,748 662,172 291,159 11,434,269
Interest rate sensitivity gap (2,061,871 ) (307,113 ) (62,751 ) 444,136 (1,987,599 )
Net worth 361,441
Ratio of interest rate-sensitive assets to liabilities 82.62%
Ratio of the interest rate sensitivity gap to net worth (549.91% )
Note 1: The above amounts include only USD amounts held by the Bank, and exclude contingent
assets and contingent liabilities.
Note 2: Interest-rate sensitive assets and liabilities mean the revenues or costs of interest-earnings
assets and interest-bearing liabilities affected by interest-rate changes.
Note 3: Interest-rate sensitive gap = Interest-rate sensitive assets - Interest-rate sensitive liabilities.
Note 4: Ratio of interest-rate sensitive assets to liabilities = Interest-rate sensitive assets/Interest-rate
sensitive liabilities (U.S. dollars).
d. Profitability
(%)
Item
For the Year Ended
December 31
2015 2014
Return on total assets Before income tax 0.94 1.15
After income tax 0.81 0.97
Return on net worth Before income tax 12.08 14.77
After income tax 10.45 12.55
Profit margin 43.91 43.41
Note 1: Return on total assets = Income before (after) income tax/Average total assets.
Note 2: Return on net worth = Income before (after) income tax/Average net worth.
Note 3: Profit margin = Income after income tax/Total operating revenues.
Note 4: Income before (after) income tax represents income for the Years ended December 31, 2015
and 2014.
e. Maturity analysis of assets and liabilities
Maturity Analysis of Assets and Liabilities (New Taiwan Dollars)
December 31, 2015
Total The Amount for the Remaining Period to Maturity
0-10 Days 11-30 Days 31-90 Days 91-180 Days 181-365 Days Over 1 Year
Main capital inflow on
maturity $ 2,168,682,490 $ 224,731,773 $ 373,362,121 $ 307,062,119 $ 233,953,193 $ 249,390,984 $ 780,182,300
Main capital outflow on
maturity 2,550,915,152 127,284,551 309,146,635 421,433,246 351,896,372 429,990,625 911,163,723
Gap (382,232,662 ) 97,447,222 64,215,486 (114,371,127 ) (117,943,179 ) (180,599,641 ) (130,981,423 )
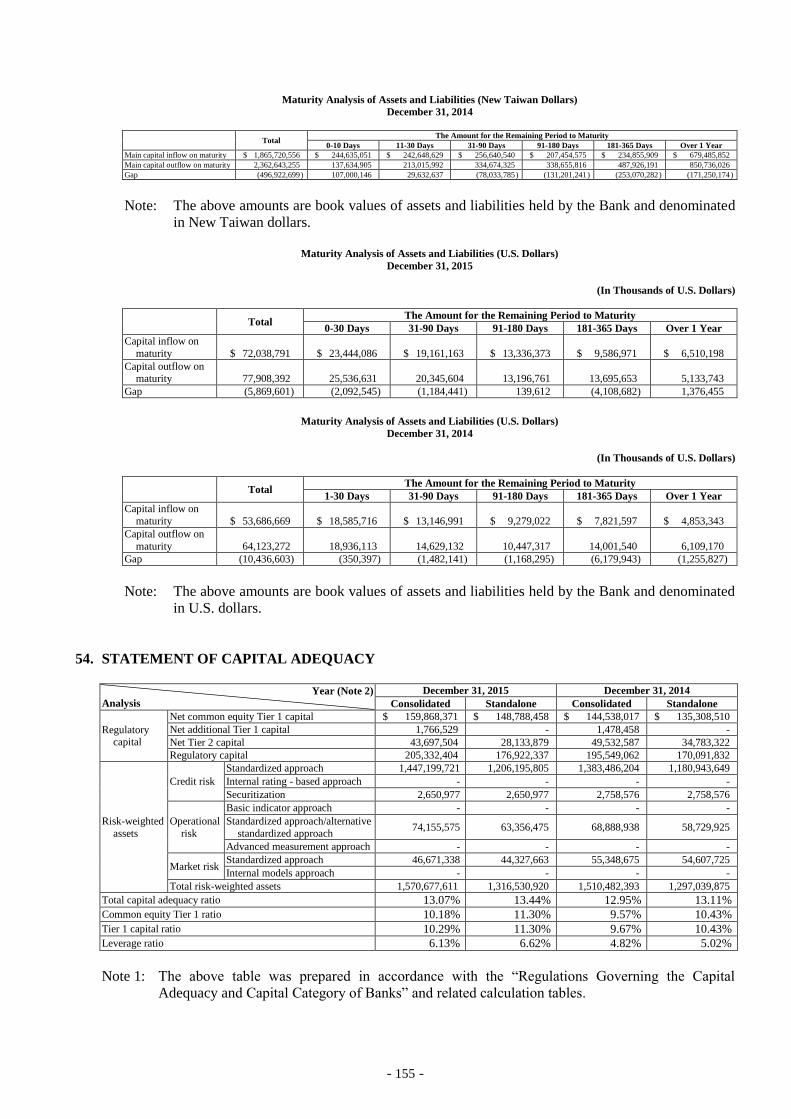
- 155 -
Maturity Analysis of Assets and Liabilities (New Taiwan Dollars)
December 31, 2014
Total The Amount for the Remaining Period to Maturity
0-10 Days 11-30 Days 31-90 Days 91-180 Days 181-365 Days Over 1 Year
Main capital inflow on maturity $ 1,865,720,556 $ 244,635,051 $ 242,648,629 $ 256,640,540 $ 207,454,575 $ 234,855,909 $ 679,485,852
Main capital outflow on maturity 2,362,643,255 137,634,905 213,015,992 334,674,325 338,655,816 487,926,191 850,736,026
Gap (496,922,699 ) 107,000,146 29,632,637 (78,033,785 ) (131,201,241 ) (253,070,282 ) (171,250,174 )
Note: The above amounts are book values of assets and liabilities held by the Bank and denominated
in New Taiwan dollars.
Maturity Analysis of Assets and Liabilities (U.S. Dollars)
December 31, 2015
(In Thousands of U.S. Dollars)
Total The Amount for the Remaining Period to Maturity
0-30 Days 31-90 Days 91-180 Days 181-365 Days Over 1 Year
Capital inflow on
maturity $ 72,038,791 $ 23,444,086 $ 19,161,163 $ 13,336,373 $ 9,586,971 $ 6,510,198
Capital outflow on maturity 77,908,392 25,536,631 20,345,604 13,196,761 13,695,653 5,133,743
Gap (5,869,601 ) (2,092,545 ) (1,184,441 ) 139,612 (4,108,682 ) 1,376,455
Maturity Analysis of Assets and Liabilities (U.S. Dollars)
December 31, 2014
(In Thousands of U.S. Dollars)
Total The Amount for the Remaining Period to Maturity
1-30 Days 31-90 Days 91-180 Days 181-365 Days Over 1 Year
Capital inflow on
maturity $ 53,686,669 $ 18,585,716 $ 13,146,991 $ 9,279,022 $ 7,821,597 $ 4,853,343
Capital outflow on
maturity 64,123,272 18,936,113 14,629,132 10,447,317 14,001,540 6,109,170
Gap (10,436,603 ) (350,397 ) (1,482,141 ) (1,168,295 ) (6,179,943 ) (1,255,827 )
Note: The above amounts are book values of assets and liabilities held by the Bank and denominated
in U.S. dollars.
54. STATEMENT OF CAPITAL ADEQUACY
Year (Note 2)
Analysis
December 31, 2015 December 31, 2014
Consolidated Standalone Consolidated Standalone
Regulatory capital
Net common equity Tier 1 capital $ 159,868,371 $ 148,788,458 $ 144,538,017 $ 135,308,510
Net additional Tier 1 capital 1,766,529 - 1,478,458 -
Net Tier 2 capital 43,697,504 28,133,879 49,532,587 34,783,322
Regulatory capital 205,332,404 176,922,337 195,549,062 170,091,832
Risk-weighted
assets
Credit risk
Standardized approach 1,447,199,721 1,206,195,805 1,383,486,204 1,180,943,649
Internal rating - based approach - - - -
Securitization 2,650,977 2,650,977 2,758,576 2,758,576
Operational
risk
Basic indicator approach - - - -
Standardized approach/alternative
standardized approach 74,155,575 63,356,475 68,888,938 58,729,925
Advanced measurement approach - - - -
Market risk Standardized approach 46,671,338 44,327,663 55,348,675 54,607,725
Internal models approach - - - -
Total risk-weighted assets 1,570,677,611 1,316,530,920 1,510,482,393 1,297,039,875
Total capital adequacy ratio 13.07% 13.44% 12.95% 13.11%
Common equity Tier 1 ratio 10.18% 11.30% 9.57% 10.43%
Tier 1 capital ratio 10.29% 11.30% 9.67% 10.43%
Leverage ratio 6.13% 6.62% 4.82% 5.02%
Note 1: The above table was prepared in accordance with the “Regulations Governing the Capital
Adequacy and Capital Category of Banks” and related calculation tables.
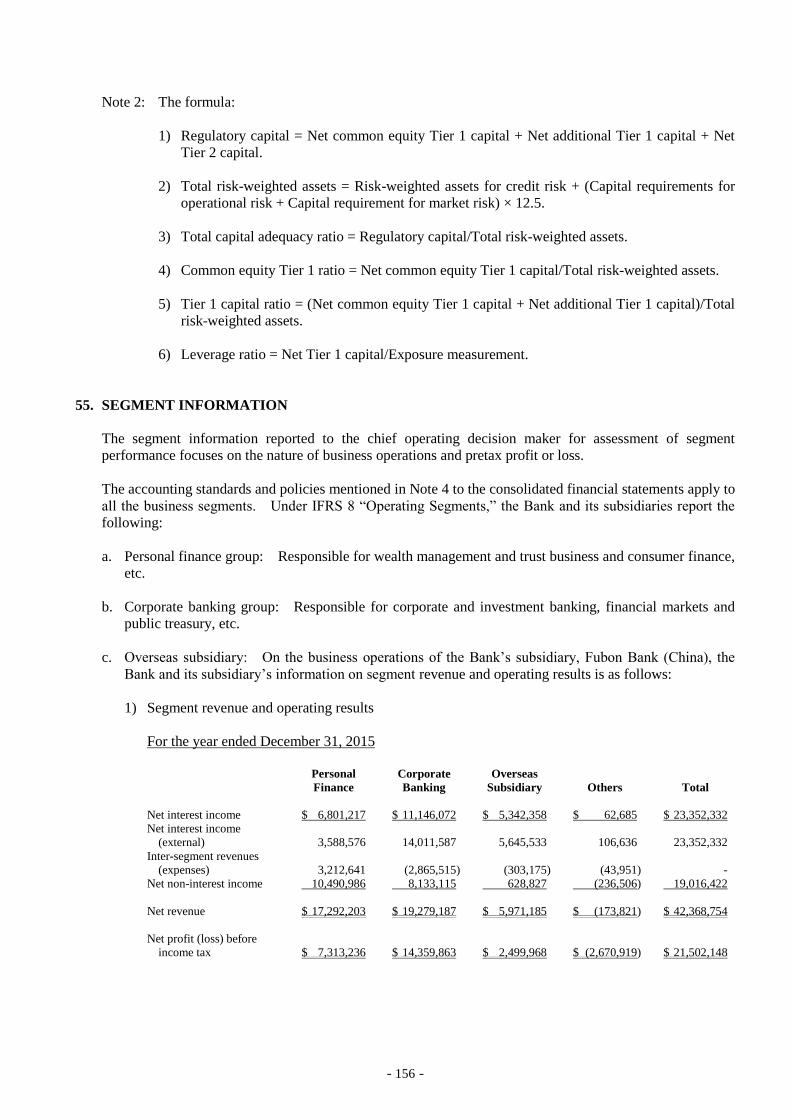
- 156 -
Note 2: The formula:
1) Regulatory capital = Net common equity Tier 1 capital + Net additional Tier 1 capital + Net
Tier 2 capital.
2) Total risk-weighted assets = Risk-weighted assets for credit risk + (Capital requirements for
operational risk + Capital requirement for market risk) × 12.5.
3) Total capital adequacy ratio = Regulatory capital/Total risk-weighted assets.
4) Common equity Tier 1 ratio = Net common equity Tier 1 capital/Total risk-weighted assets.
5) Tier 1 capital ratio = (Net common equity Tier 1 capital + Net additional Tier 1 capital)/Total
risk-weighted assets.
6) Leverage ratio = Net Tier 1 capital/Exposure measurement.
55. SEGMENT INFORMATION
The segment information reported to the chief operating decision maker for assessment of segment
performance focuses on the nature of business operations and pretax profit or loss.
The accounting standards and policies mentioned in Note 4 to the consolidated financial statements apply to
all the business segments. Under IFRS 8 “Operating Segments,” the Bank and its subsidiaries report the
following:
a. Personal finance group: Responsible for wealth management and trust business and consumer finance,
etc.
b. Corporate banking group: Responsible for corporate and investment banking, financial markets and
public treasury, etc.
c. Overseas subsidiary: On the business operations of the Bank’s subsidiary, Fubon Bank (China), the
Bank and its subsidiary’s information on segment revenue and operating results is as follows:
1) Segment revenue and operating results
For the year ended December 31, 2015
Personal
Finance
Corporate
Banking
Overseas
Subsidiary Others Total
Net interest income $ 6,801,217 $ 11,146,072 $ 5,342,358 $ 62,685 $ 23,352,332
Net interest income
(external) 3,588,576 14,011,587 5,645,533 106,636 23,352,332
Inter-segment revenues
(expenses) 3,212,641 (2,865,515) (303,175) (43,951) -
Net non-interest income 10,490,986 8,133,115 628,827 (236,506) 19,016,422
Net revenue $ 17,292,203 $ 19,279,187 $ 5,971,185 $ (173,821) $ 42,368,754
Net profit (loss) before
income tax $ 7,313,236 $ 14,359,863 $ 2,499,968 $ (2,670,919) $ 21,502,148
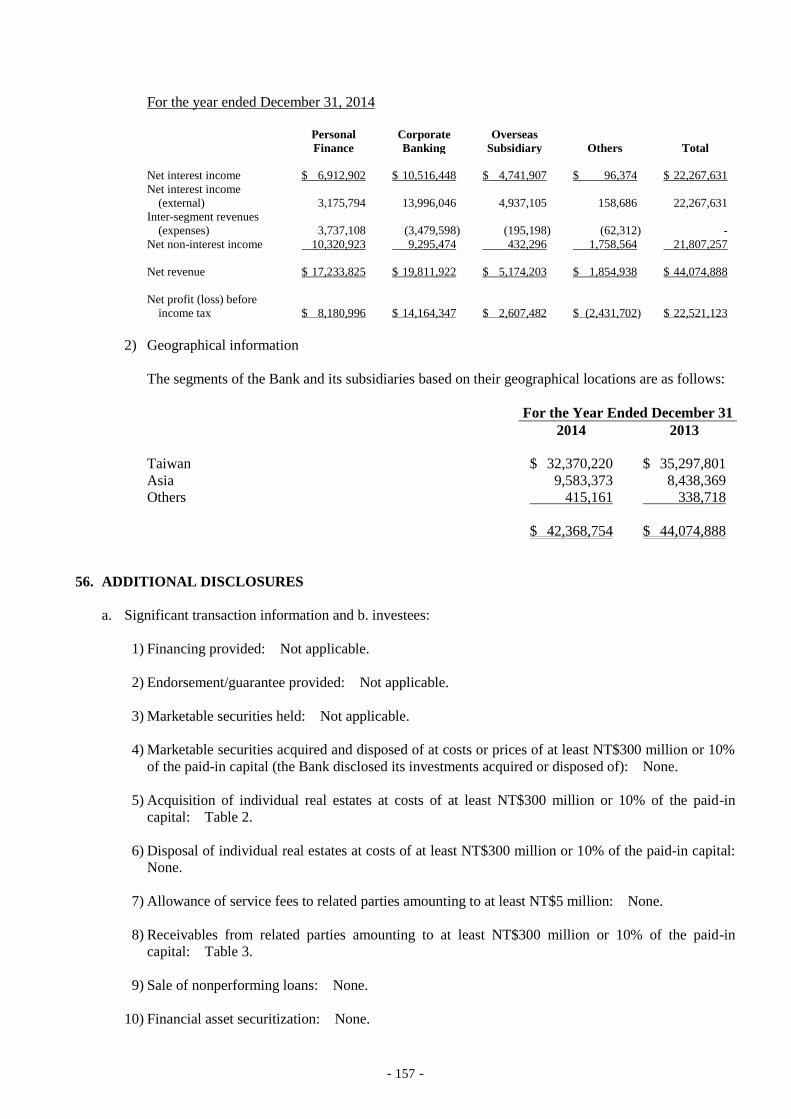
- 157 -
For the year ended December 31, 2014
Personal
Finance
Corporate
Banking
Overseas
Subsidiary Others Total
Net interest income $ 6,912,902 $ 10,516,448 $ 4,741,907 $ 96,374 $ 22,267,631
Net interest income
(external) 3,175,794 13,996,046 4,937,105 158,686 22,267,631
Inter-segment revenues
(expenses) 3,737,108 (3,479,598) (195,198) (62,312) -
Net non-interest income 10,320,923 9,295,474 432,296 1,758,564 21,807,257
Net revenue $ 17,233,825 $ 19,811,922 $ 5,174,203 $ 1,854,938 $ 44,074,888
Net profit (loss) before
income tax $ 8,180,996 $ 14,164,347 $ 2,607,482 $ (2,431,702) $ 22,521,123
2) Geographical information
The segments of the Bank and its subsidiaries based on their geographical locations are as follows:
For the Year Ended December 31
2014 2013
Taiwan $ 32,370,220 $ 35,297,801
Asia 9,583,373 8,438,369
Others 415,161 338,718
$ 42,368,754 $ 44,074,888
56. ADDITIONAL DISCLOSURES
a. Significant transaction information and b. investees:
1) Financing provided: Not applicable.
2) Endorsement/guarantee provided: Not applicable.
3) Marketable securities held: Not applicable.
4) Marketable securities acquired and disposed of at costs or prices of at least NT$300 million or 10%
of the paid-in capital (the Bank disclosed its investments acquired or disposed of): None.
5) Acquisition of individual real estates at costs of at least NT$300 million or 10% of the paid-in
capital: Table 2.
6) Disposal of individual real estates at costs of at least NT$300 million or 10% of the paid-in capital:
None.
7) Allowance of service fees to related parties amounting to at least NT$5 million: None.
8) Receivables from related parties amounting to at least NT$300 million or 10% of the paid-in
capital: Table 3.
9) Sale of nonperforming loans: None.
10) Financial asset securitization: None.

- 158 -
11) Other significant transactions which may affect the decisions of users of financial reports: None.
12) The related information and proportionate share in investees: Table 5.
13) Derivative transactions: Note 8.
c. Information on investment in Mainland China: Table 6.
d. Business relationship and significant transactions among the parent company and subsidiaries:
Table 4.
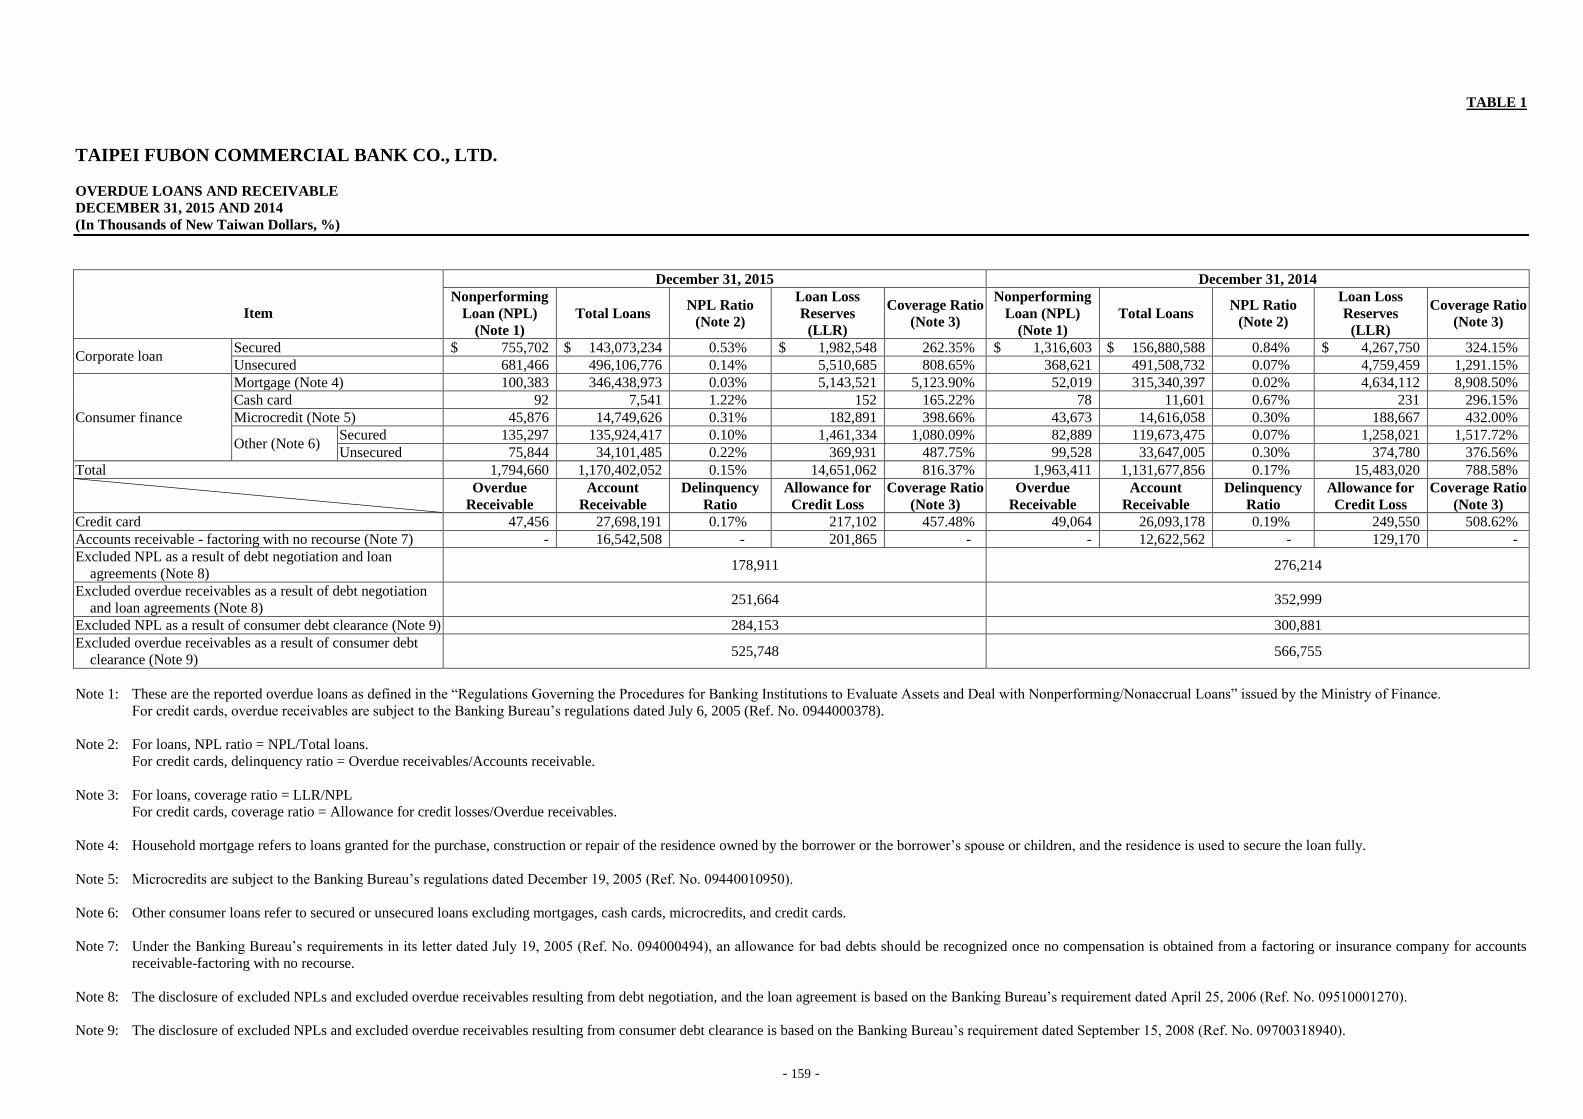
- 159 -
TABLE 1
TAIPEI FUBON COMMERCIAL BANK CO., LTD.
OVERDUE LOANS AND RECEIVABLE
DECEMBER 31, 2015 AND 2014
(In Thousands of New Taiwan Dollars, %)
Item
December 31, 2015 December 31, 2014
Nonperforming
Loan (NPL)
(Note 1)
Total Loans NPL Ratio
(Note 2)
Loan Loss
Reserves
(LLR)
Coverage Ratio
(Note 3)
Nonperforming
Loan (NPL)
(Note 1)
Total Loans NPL Ratio
(Note 2)
Loan Loss
Reserves
(LLR)
Coverage Ratio
(Note 3)
Corporate loan Secured $ 755,702 $ 143,073,234 0.53% $ 1,982,548 262.35% $ 1,316,603 $ 156,880,588 0.84% $ 4,267,750 324.15%
Unsecured 681,466 496,106,776 0.14% 5,510,685 808.65% 368,621 491,508,732 0.07% 4,759,459 1,291.15%
Consumer finance
Mortgage (Note 4) 100,383 346,438,973 0.03% 5,143,521 5,123.90% 52,019 315,340,397 0.02% 4,634,112 8,908.50%
Cash card 92 7,541 1.22% 152 165.22% 78 11,601 0.67% 231 296.15%
Microcredit (Note 5) 45,876 14,749,626 0.31% 182,891 398.66% 43,673 14,616,058 0.30% 188,667 432.00%
Other (Note 6) Secured 135,297 135,924,417 0.10% 1,461,334 1,080.09% 82,889 119,673,475 0.07% 1,258,021 1,517.72%
Unsecured 75,844 34,101,485 0.22% 369,931 487.75% 99,528 33,647,005 0.30% 374,780 376.56%
Total 1,794,660 1,170,402,052 0.15% 14,651,062 816.37% 1,963,411 1,131,677,856 0.17% 15,483,020 788.58%
Overdue
Receivable
Account
Receivable
Delinquency
Ratio
Allowance for
Credit Loss
Coverage Ratio
(Note 3)
Overdue
Receivable
Account
Receivable
Delinquency
Ratio
Allowance for
Credit Loss
Coverage Ratio
(Note 3)
Credit card 47,456 27,698,191 0.17% 217,102 457.48% 49,064 26,093,178 0.19% 249,550 508.62%
Accounts receivable - factoring with no recourse (Note 7) - 16,542,508 - 201,865 - - 12,622,562 - 129,170 -
Excluded NPL as a result of debt negotiation and loan
agreements (Note 8) 178,911 276,214
Excluded overdue receivables as a result of debt negotiation
and loan agreements (Note 8) 251,664 352,999
Excluded NPL as a result of consumer debt clearance (Note 9) 284,153 300,881
Excluded overdue receivables as a result of consumer debt
clearance (Note 9) 525,748 566,755
Note 1: These are the reported overdue loans as defined in the “Regulations Governing the Procedures for Banking Institutions to Evaluate Assets and Deal with Nonperforming/Nonaccrual Loans” issued by the Ministry of Finance.
For credit cards, overdue receivables are subject to the Banking Bureau’s regulations dated July 6, 2005 (Ref. No. 0944000378).
Note 2: For loans, NPL ratio = NPL/Total loans.
For credit cards, delinquency ratio = Overdue receivables/Accounts receivable.
Note 3: For loans, coverage ratio = LLR/NPL
For credit cards, coverage ratio = Allowance for credit losses/Overdue receivables.
Note 4: Household mortgage refers to loans granted for the purchase, construction or repair of the residence owned by the borrower or the borrower’s spouse or children, and the residence is used to secure the loan fully.
Note 5: Microcredits are subject to the Banking Bureau’s regulations dated December 19, 2005 (Ref. No. 09440010950).
Note 6: Other consumer loans refer to secured or unsecured loans excluding mortgages, cash cards, microcredits, and credit cards.
Note 7: Under the Banking Bureau’s requirements in its letter dated July 19, 2005 (Ref. No. 094000494), an allowance for bad debts should be recognized once no compensation is obtained from a factoring or insurance company for accounts
receivable-factoring with no recourse.
Note 8: The disclosure of excluded NPLs and excluded overdue receivables resulting from debt negotiation, and the loan agreement is based on the Banking Bureau’s requirement dated April 25, 2006 (Ref. No. 09510001270).
Note 9: The disclosure of excluded NPLs and excluded overdue receivables resulting from consumer debt clearance is based on the Banking Bureau’s requirement dated September 15, 2008 (Ref. No. 09700318940).
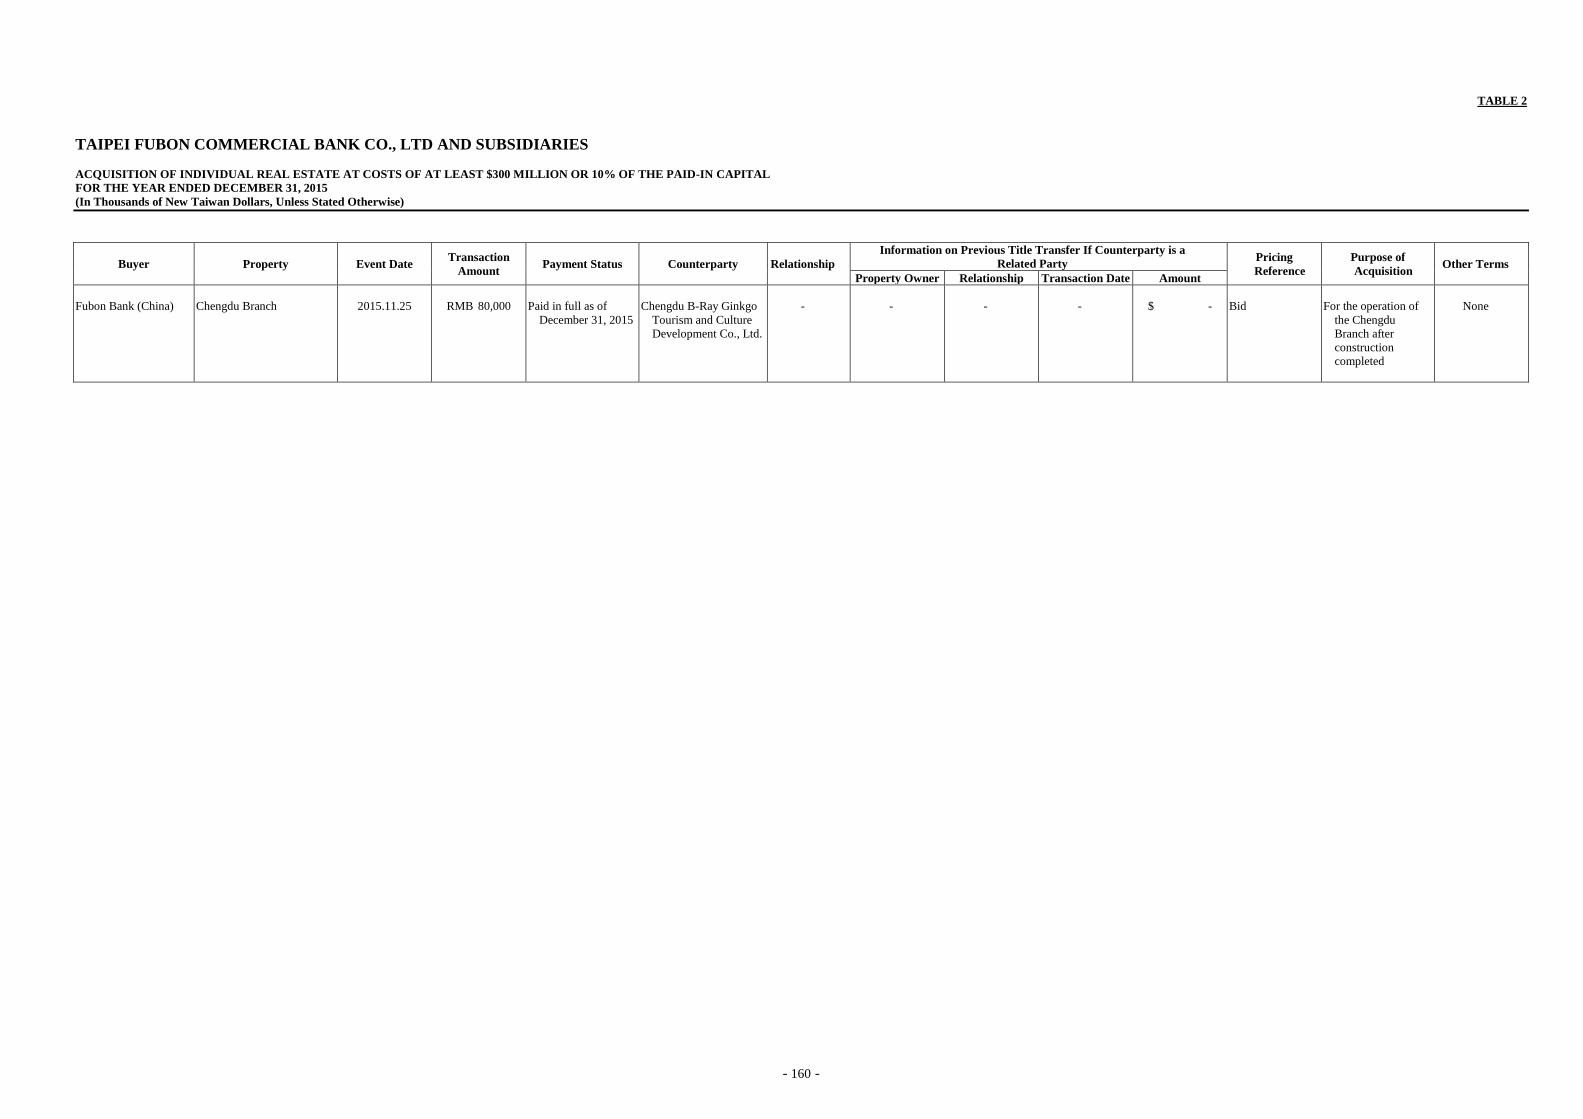
- 160 -
TABLE 2
TAIPEI FUBON COMMERCIAL BANK CO., LTD AND SUBSIDIARIES
ACQUISITION OF INDIVIDUAL REAL ESTATE AT COSTS OF AT LEAST $300 MILLION OR 10% OF THE PAID-IN CAPITAL
FOR THE YEAR ENDED DECEMBER 31, 2015
(In Thousands of New Taiwan Dollars, Unless Stated Otherwise)
Buyer Property Event Date Transaction
Amount Payment Status Counterparty Relationship
Information on Previous Title Transfer If Counterparty is a
Related Party Pricing
Reference
Purpose of
Acquisition Other Terms
Property Owner Relationship Transaction Date Amount
Fubon Bank (China) Chengdu Branch 2015.11.25 RMB 80,000 Paid in full as of
December 31, 2015
Chengdu B-Ray Ginkgo
Tourism and Culture
Development Co., Ltd.
- - - - $ - Bid For the operation of
the Chengdu
Branch after
construction
completed
None
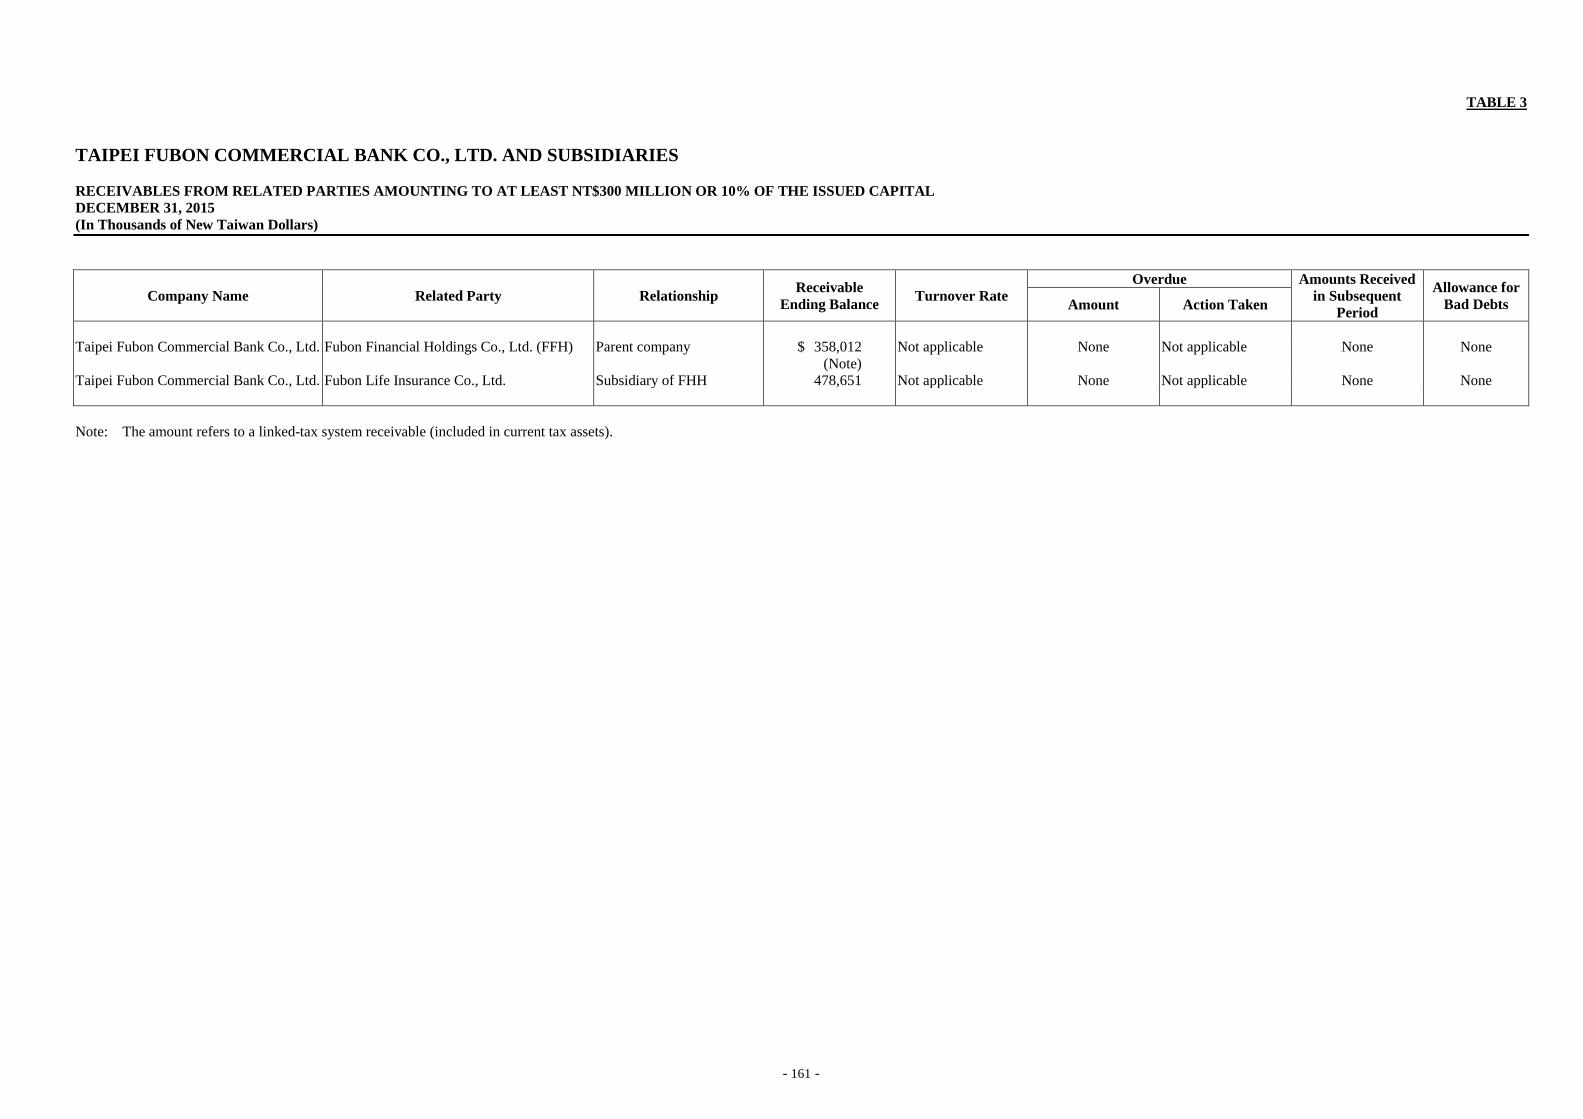
- 161 -
TABLE 3
TAIPEI FUBON COMMERCIAL BANK CO., LTD. AND SUBSIDIARIES
RECEIVABLES FROM RELATED PARTIES AMOUNTING TO AT LEAST NT$300 MILLION OR 10% OF THE ISSUED CAPITAL
DECEMBER 31, 2015
(In Thousands of New Taiwan Dollars)
Company Name Related Party Relationship Receivable
Ending Balance Turnover Rate
Overdue Amounts Received
in Subsequent
Period
Allowance for
Bad Debts Amount Action Taken
Taipei Fubon Commercial Bank Co., Ltd. Fubon Financial Holdings Co., Ltd. (FFH) Parent company $ 358,012
(Note)
Not applicable None Not applicable None None
Taipei Fubon Commercial Bank Co., Ltd. Fubon Life Insurance Co., Ltd. Subsidiary of FHH 478,651 Not applicable None Not applicable None None
Note: The amount refers to a linked-tax system receivable (included in current tax assets).
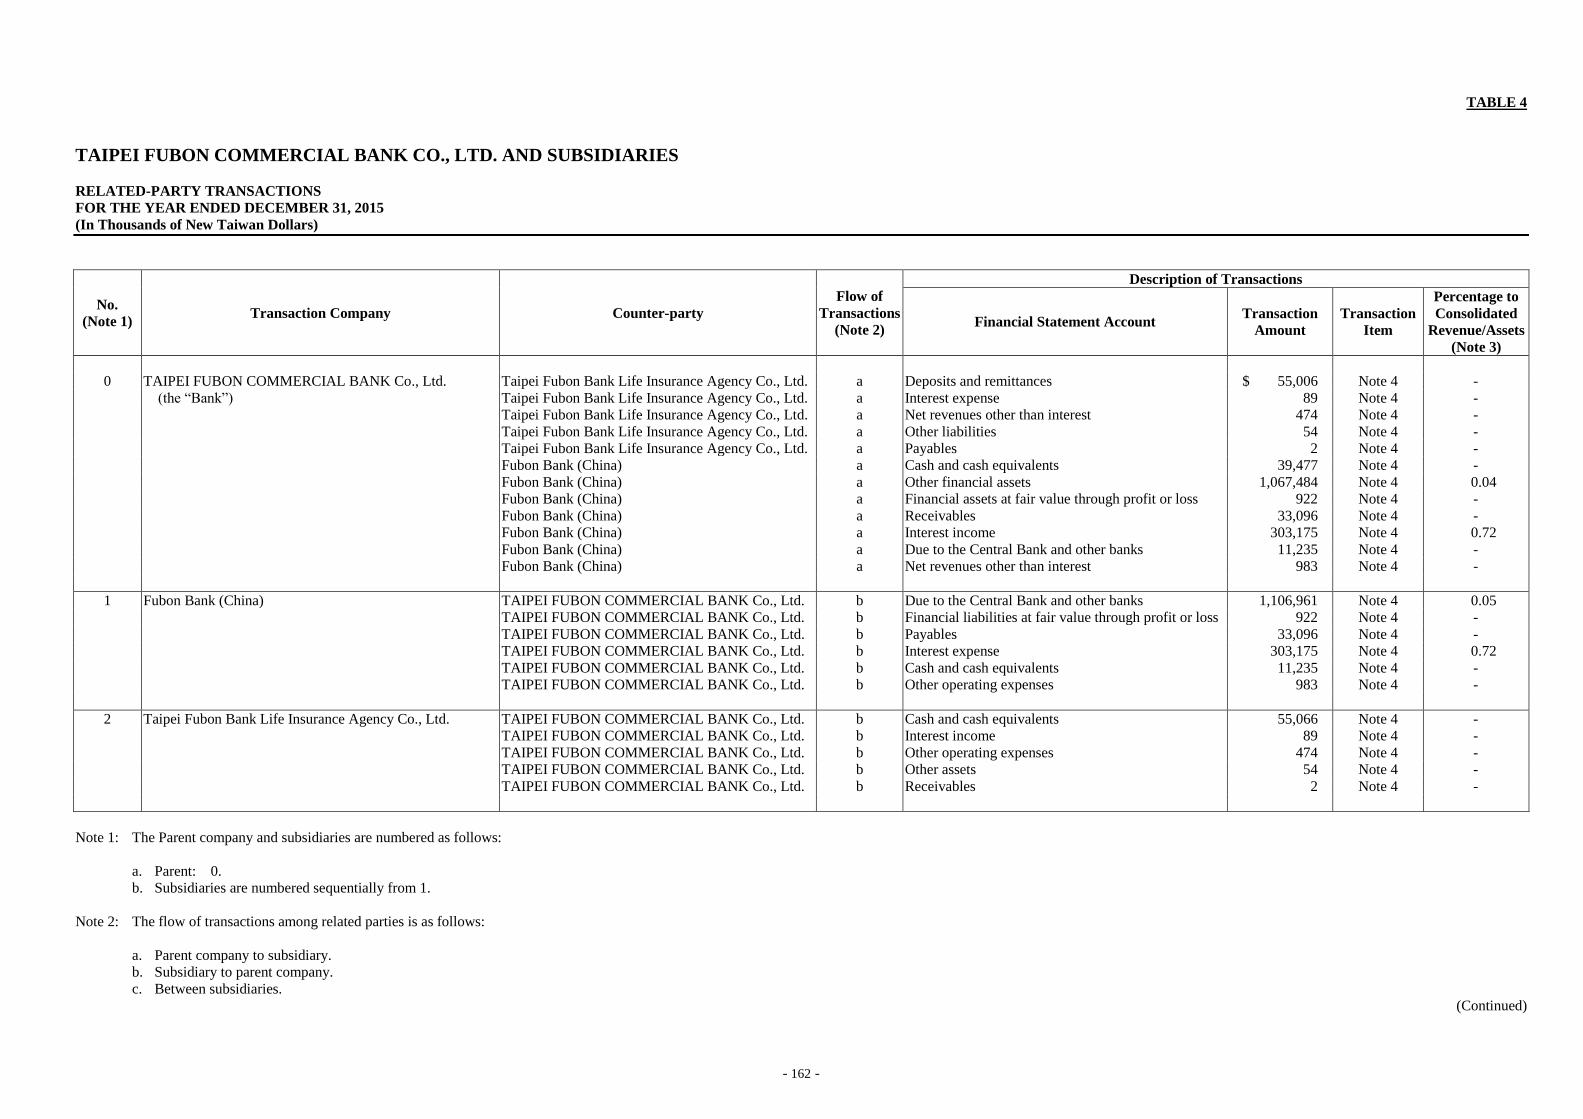
- 162 -
TABLE 4
TAIPEI FUBON COMMERCIAL BANK CO., LTD. AND SUBSIDIARIES
RELATED-PARTY TRANSACTIONS
FOR THE YEAR ENDED DECEMBER 31, 2015
(In Thousands of New Taiwan Dollars)
No.
(Note 1) Transaction Company Counter-party
Flow of
Transactions
(Note 2)
Description of Transactions
Financial Statement Account Transaction
Amount
Transaction
Item
Percentage to
Consolidated
Revenue/Assets
(Note 3)
0 TAIPEI FUBON COMMERCIAL BANK Co., Ltd. Taipei Fubon Bank Life Insurance Agency Co., Ltd. a Deposits and remittances $ 55,006 Note 4 -
(the “Bank”) Taipei Fubon Bank Life Insurance Agency Co., Ltd. a Interest expense 89 Note 4 -
Taipei Fubon Bank Life Insurance Agency Co., Ltd. a Net revenues other than interest 474 Note 4 -
Taipei Fubon Bank Life Insurance Agency Co., Ltd. a Other liabilities 54 Note 4 -
Taipei Fubon Bank Life Insurance Agency Co., Ltd. a Payables 2 Note 4 -
Fubon Bank (China) a Cash and cash equivalents 39,477 Note 4 -
Fubon Bank (China) a Other financial assets 1,067,484 Note 4 0.04
Fubon Bank (China) a Financial assets at fair value through profit or loss 922 Note 4 -
Fubon Bank (China) a Receivables 33,096 Note 4 -
Fubon Bank (China) a Interest income 303,175 Note 4 0.72
Fubon Bank (China) a Due to the Central Bank and other banks 11,235 Note 4 -
Fubon Bank (China) a Net revenues other than interest 983 Note 4 -
1 Fubon Bank (China) TAIPEI FUBON COMMERCIAL BANK Co., Ltd. b Due to the Central Bank and other banks 1,106,961 Note 4 0.05
TAIPEI FUBON COMMERCIAL BANK Co., Ltd. b Financial liabilities at fair value through profit or loss 922 Note 4 -
TAIPEI FUBON COMMERCIAL BANK Co., Ltd. b Payables 33,096 Note 4 -
TAIPEI FUBON COMMERCIAL BANK Co., Ltd. b Interest expense 303,175 Note 4 0.72
TAIPEI FUBON COMMERCIAL BANK Co., Ltd. b Cash and cash equivalents 11,235 Note 4 -
TAIPEI FUBON COMMERCIAL BANK Co., Ltd. b Other operating expenses 983 Note 4 -
2 Taipei Fubon Bank Life Insurance Agency Co., Ltd. TAIPEI FUBON COMMERCIAL BANK Co., Ltd. b Cash and cash equivalents 55,066 Note 4 -
TAIPEI FUBON COMMERCIAL BANK Co., Ltd. b Interest income 89 Note 4 -
TAIPEI FUBON COMMERCIAL BANK Co., Ltd. b Other operating expenses 474 Note 4 -
TAIPEI FUBON COMMERCIAL BANK Co., Ltd. b Other assets 54 Note 4 -
TAIPEI FUBON COMMERCIAL BANK Co., Ltd. b Receivables 2 Note 4 -
Note 1: The Parent company and subsidiaries are numbered as follows:
a. Parent: 0.
b. Subsidiaries are numbered sequentially from 1.
Note 2: The flow of transactions among related parties is as follows:
a. Parent company to subsidiary.
b. Subsidiary to parent company.
c. Between subsidiaries.
(Continued)

- 163 -
Note 3: For calculating the percentages, the asset or liability account is divided by total consolidated assets, and the revenue or expense account is divided by the total consolidated net revenue of the year.
Note 4: For the transactions between the Bank and related parties, the terms are similar to those transacted with unrelated parties.
Note 5: The transactions and balances above had been eliminated in the preparation of consolidated financial statement.
(Concluded)
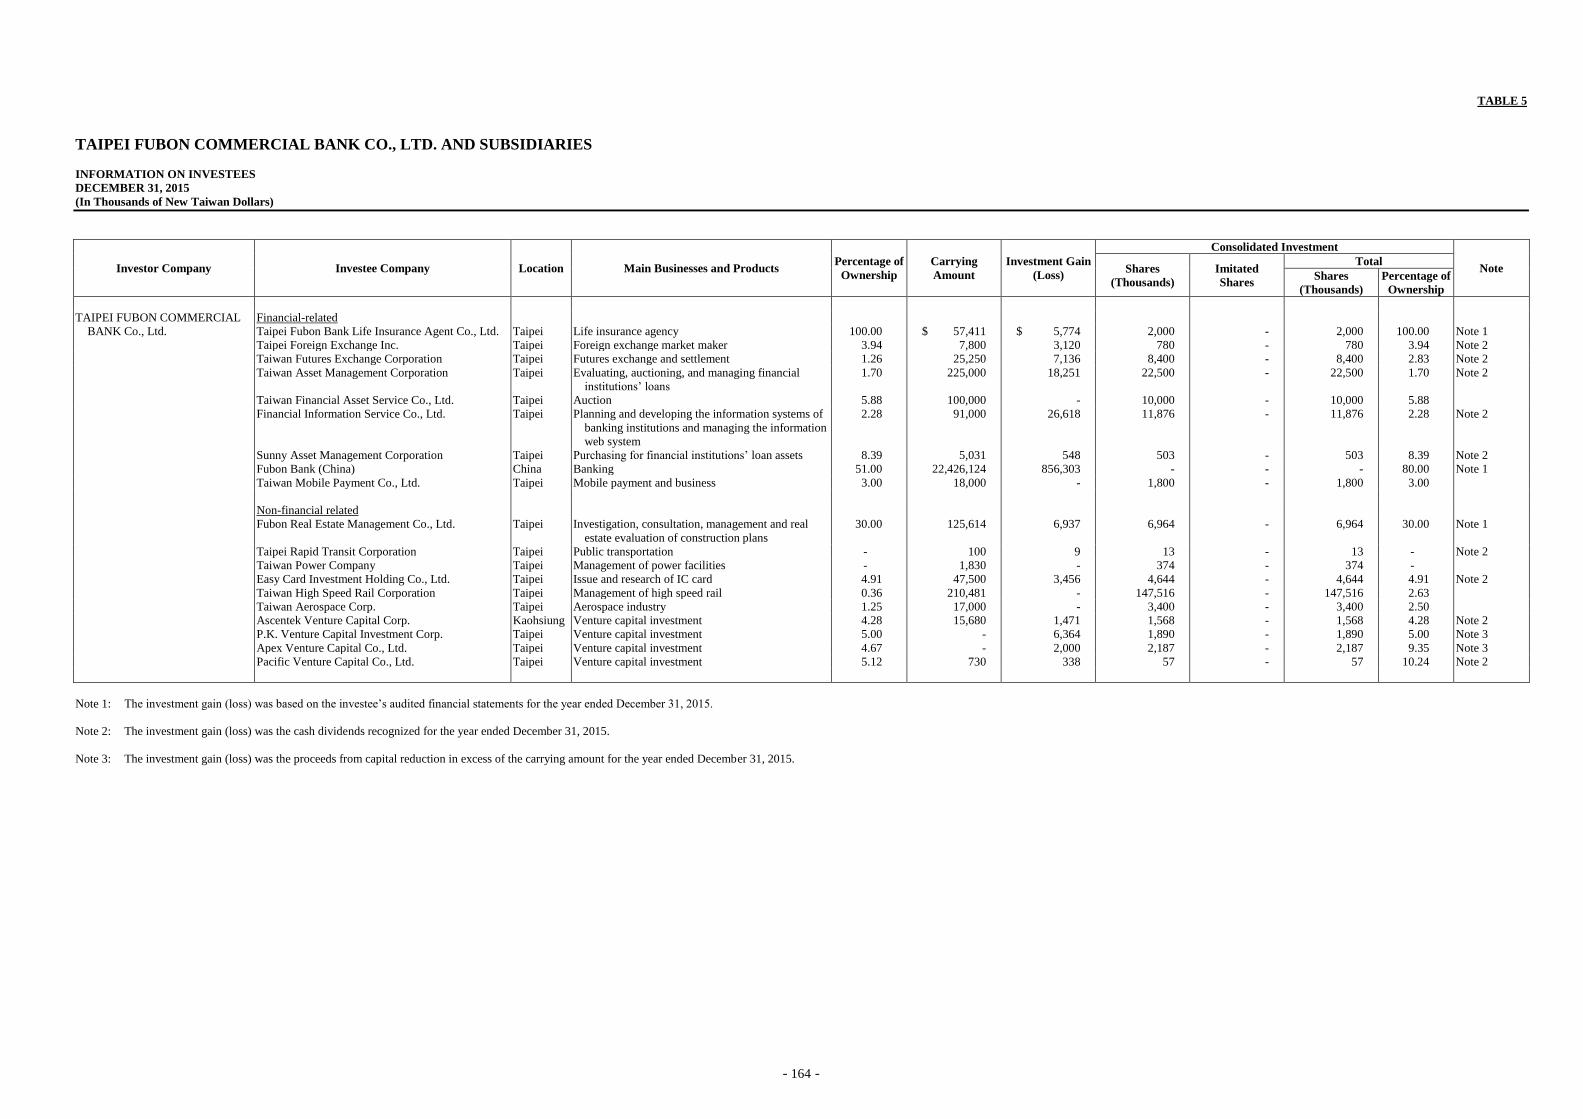
- 164 -
TABLE 5
TAIPEI FUBON COMMERCIAL BANK CO., LTD. AND SUBSIDIARIES
INFORMATION ON INVESTEES
DECEMBER 31, 2015
(In Thousands of New Taiwan Dollars)
Investor Company Investee Company Location Main Businesses and Products Percentage of
Ownership
Carrying
Amount
Investment Gain
(Loss)
Consolidated Investment
Note Shares
(Thousands)
Imitated
Shares
Total
Shares
(Thousands)
Percentage of
Ownership
TAIPEI FUBON COMMERCIAL Financial-related
BANK Co., Ltd. Taipei Fubon Bank Life Insurance Agent Co., Ltd. Taipei Life insurance agency 100.00 $ 57,411 $ 5,774 2,000 - 2,000 100.00 Note 1
Taipei Foreign Exchange Inc. Taipei Foreign exchange market maker 3.94 7,800 3,120 780 - 780 3.94 Note 2
Taiwan Futures Exchange Corporation Taipei Futures exchange and settlement 1.26 25,250 7,136 8,400 - 8,400 2.83 Note 2
Taiwan Asset Management Corporation Taipei Evaluating, auctioning, and managing financial
institutions’ loans
1.70 225,000 18,251 22,500 - 22,500 1.70 Note 2
Taiwan Financial Asset Service Co., Ltd. Taipei Auction 5.88 100,000 - 10,000 - 10,000 5.88
Financial Information Service Co., Ltd. Taipei Planning and developing the information systems of
banking institutions and managing the information
web system
2.28 91,000 26,618 11,876 - 11,876 2.28 Note 2
Sunny Asset Management Corporation Taipei Purchasing for financial institutions’ loan assets 8.39 5,031 548 503 - 503 8.39 Note 2
Fubon Bank (China) China Banking 51.00 22,426,124 856,303 - - - 80.00 Note 1
Taiwan Mobile Payment Co., Ltd. Taipei Mobile payment and business 3.00 18,000 - 1,800 - 1,800 3.00
Non-financial related
Fubon Real Estate Management Co., Ltd. Taipei Investigation, consultation, management and real
estate evaluation of construction plans
30.00 125,614 6,937 6,964 - 6,964 30.00 Note 1
Taipei Rapid Transit Corporation Taipei Public transportation - 100 9 13 - 13 - Note 2
Taiwan Power Company Taipei Management of power facilities - 1,830 - 374 - 374 -
Easy Card Investment Holding Co., Ltd. Taipei Issue and research of IC card 4.91 47,500 3,456 4,644 - 4,644 4.91 Note 2
Taiwan High Speed Rail Corporation Taipei Management of high speed rail 0.36 210,481 - 147,516 - 147,516 2.63
Taiwan Aerospace Corp. Taipei Aerospace industry 1.25 17,000 - 3,400 - 3,400 2.50
Ascentek Venture Capital Corp. Kaohsiung Venture capital investment 4.28 15,680 1,471 1,568 - 1,568 4.28 Note 2
P.K. Venture Capital Investment Corp. Taipei Venture capital investment 5.00 - 6,364 1,890 - 1,890 5.00 Note 3
Apex Venture Capital Co., Ltd. Taipei Venture capital investment 4.67 - 2,000 2,187 - 2,187 9.35 Note 3
Pacific Venture Capital Co., Ltd. Taipei Venture capital investment 5.12 730 338 57 - 57 10.24 Note 2
Note 1: The investment gain (loss) was based on the investee’s audited financial statements for the year ended December 31, 2015.
Note 2: The investment gain (loss) was the cash dividends recognized for the year ended December 31, 2015.
Note 3: The investment gain (loss) was the proceeds from capital reduction in excess of the carrying amount for the year ended December 31, 2015.
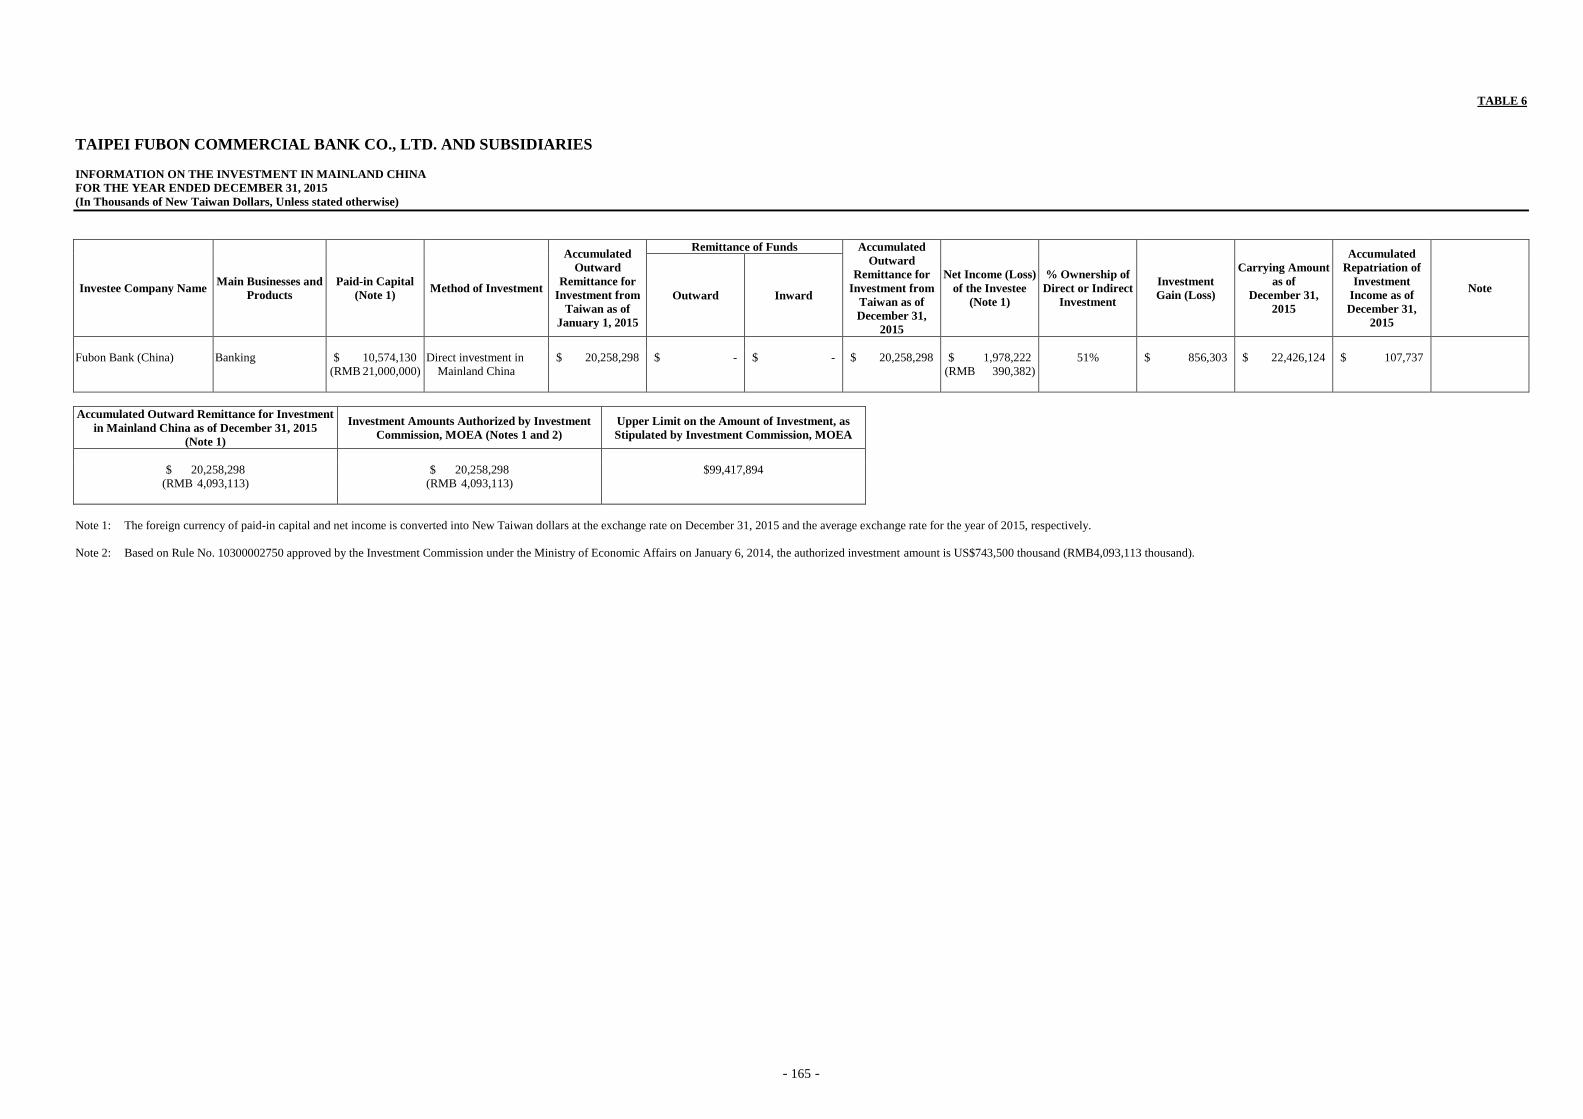
- 165 -
TABLE 6
TAIPEI FUBON COMMERCIAL BANK CO., LTD. AND SUBSIDIARIES
INFORMATION ON THE INVESTMENT IN MAINLAND CHINA
FOR THE YEAR ENDED DECEMBER 31, 2015
(In Thousands of New Taiwan Dollars, Unless stated otherwise)
Investee Company Name Main Businesses and
Products
Paid-in Capital
(Note 1) Method of Investment
Accumulated
Outward
Remittance for
Investment from
Taiwan as of
January 1, 2015
Remittance of Funds Accumulated
Outward
Remittance for
Investment from
Taiwan as of
December 31,
2015
Net Income (Loss)
of the Investee
(Note 1)
% Ownership of
Direct or Indirect
Investment
Investment
Gain (Loss)
Carrying Amount
as of
December 31,
2015
Accumulated
Repatriation of
Investment
Income as of
December 31,
2015
Note Outward Inward
Fubon Bank (China) Banking $ 10,574,130
(RMB 21,000,000)
Direct investment in
Mainland China
$ 20,258,298 $ - $ - $ 20,258,298 $ 1,978,222
(RMB 390,382)
51% $ 856,303 $ 22,426,124 $ 107,737
Accumulated Outward Remittance for Investment
in Mainland China as of December 31, 2015
(Note 1)
Investment Amounts Authorized by Investment
Commission, MOEA (Notes 1 and 2)
Upper Limit on the Amount of Investment, as
Stipulated by Investment Commission, MOEA
$ 20,258,298
(RMB 4,093,113)
$ 20,258,298
(RMB 4,093,113)
$99,417,894
Note 1: The foreign currency of paid-in capital and net income is converted into New Taiwan dollars at the exchange rate on December 31, 2015 and the average exchange rate for the year of 2015, respectively.
Note 2: Based on Rule No. 10300002750 approved by the Investment Commission under the Ministry of Economic Affairs on January 6, 2014, the authorized investment amount is US$743,500 thousand (RMB4,093,113 thousand).