Embed Size (px)
Citation preview

Accepted Manuscript
Title: Tailoring Green and Sintered Density of Pure Iron Partsusing Binder Jetting Additive Manufacturing
Authors: Issa Rishmawi, Mehrnaz Salarian, Mihaela Vlasea
PII: S2214-8604(18)30473-1DOI: https://doi.org/10.1016/j.addma.2018.10.015Reference: ADDMA 538
To appear in:
Received date: 1-7-2018Revised date: 21-9-2018Accepted date: 5-10-2018
Please cite this article as: Rishmawi I, Salarian M, Vlasea M, Tailoring Green andSintered Density of Pure Iron Parts using Binder Jetting Additive Manufacturing,Additive Manufacturing (2018), https://doi.org/10.1016/j.addma.2018.10.015
This is a PDF file of an unedited manuscript that has been accepted for publication.As a service to our customers we are providing this early version of the manuscript.The manuscript will undergo copyediting, typesetting, and review of the resulting proofbefore it is published in its final form. Please note that during the production processerrors may be discovered which could affect the content, and all legal disclaimers thatapply to the journal pertain.
The final publication is available at Elsevier via https://dx.doi.org/10.1016/j.addma.2018.10.015 © 2018. This manuscript version is made available under the CC-BY-NC-ND 4.0 license https://creativecommons.org/licenses/by-nc-nd/4.0/

1
Tailoring Green and Sintered Density of Pure Iron Parts using
Binder Jetting Additive Manufacturing
Issa Rishmawi1, Mehrnaz Salarian1, Mihaela Vlasea1
1-University of Waterloo, Department of Mechanical and Mechatronics Engineering, Waterloo, Ontario, Canada N2L
3G1
Submitted Electronically to: Journal of Additive Manufacturing
Note to Journal Editor:
Submission Date: 20 / 09 / 2018
Number of Pages: 39
Number of Figures: 14
Number of Tables: 6
Corresponding Author: Mehrnaz Salarian, PhD
Address: Department of Mechanical and Mechatronics Engineering,
University of Waterloo, Waterloo, Ontario, N2L 3G1
Canada, e-mail: [email protected]
Graphical abstract
ACCEPTED MANUSCRIP
T

2
ACCEPTED MANUSCRIP
T

3
Abstract:
Binder jetting additive manufacturing (BJAM) is a comparatively low-cost process that enables
manufacturing of complex and customizable metal parts. This process is applied to low-cost water-
atomized iron powder with the goal of understanding the effects of printing parameters and
sintering schedule on maximizing the green and sintered densities of manufactured samples
respectively. The powder is characterized by using scanning electron microscopy (SEM) and
particle size analysis (Camsizer X2). In the AM process, the effects of powder compaction, layer
thickness and liquid binder level on green part density are investigated. Post-process heat treatment
is applied to select samples, and suitable debinding parameters are studied by using thermo-
gravimetric analysis (TGA). Sintering at various temperatures and durations results in densities of
up to 91.3%. Image processing of x-ray computed tomography (μCT) scans of the samples reveals
that porosity distribution is affected by powder spreading, and gradients in pore distribution in the
sample are largely reduced after sintering. The resulting shrinkage ranges between 6.7 3.0% and
25.3 2.8%, while surface roughness ranges between 11.6 5.0 μm and 32.1 3.4 μm. The results
indicate that the sintering temperature and time might be tailored to achieve target densities
anywhere in the range of 64% and 91%, with possibly higher densities by increasing sintering
time.
Key words:
Binder jetting; additive manufacturing; irregular iron powder; sintering schedule; part density.
1 Introduction
Binder Jetting Additive Manufacturing (BJAM), also known as 3D Printing (3DP), is a powder
bed additive manufacturing (AM) process, where the fabricated product is a “green” part that
consists of the powder material adhered by the binder in a particular geometry, with generally low
densities. Depending on the material system and final application, the green parts are infiltrated or
sintered to impart the target functional material properties. Green parts are sintered in controlled
conditions, which results in the burnout of all the binder and the formation of sinter necks between
the powder particles, leading to a higher density part. BJAM of metals has been receiving lower
ACCEPTED MANUSCRIP
T

4
attention in comparison with other AM techniques, primarily because it results in comparatively
lower part densities, in the range of 50 – 99% [1–9]. The BJAM technology has been used with a
wide range of metals and alloys, such as iron or steel [2–5, 7, 10–24], titanium [6, 8, 25–31], nickel
[9, 32–35], copper [1,15], lead [36,37], zirconium [38], zinc [39], gold [40] and magnetic
neodymium-iron-boron [41], in addition to composite metal materials [42–45]. One major focus
of BJAM applications for metals has typically been intentionally porous structures, such as
biomedical implants [4,8,10,19,25,26,46]. Some of these applications have leveraged the special
capabilities of BJAM, such as functionally graded properties [47–49]. Applications of BJAM with
iron-based alloys include craniofacial bone implants [10], metal-ceramic-matrix materials for
biomedical applications [44], hip and knee implants [4], as well as hot forging dies [11], injection
molding tooling [12,13], and sound waveguides [14].
There are several advantages attributed to the BJAM technology, including scalability, ease of
customization, minimal support structure requirements, and mitigation of residual stresses in parts
due to the absence of high thermal gradients in metal sintering. One of the unique BJAM features
is that it is an inherently inexpensive process, owing to its fast layer-by-layer manufacturing speed,
low energy input to create geometries, and minimal environment atmospheric controls required
to run the AM process. The costs are generally incurred in the secondary phase, when parts are
sintered to fuse and consolidate the metal powder constituents and impart mechanical properties
to the final part. To further leverage low-cost metal part production, it is useful to try to utilize the
technology with inexpensive feedstock materials in order to maximize its economic potential.
Exploiting this aspect of the technology can lead to increased industrial adoption. Water
atomization is a much less expensive process used to produce metal powders than gas atomization.
Schade et al. [50] compared water-atomized with gas-atomized powder characteristics as required
for AM processes. The authors demonstrate that water-atomized powders are theoretically fit for
use in AM processes. In general, water-atomization leads to an irregular particle shape, while gas
atomization leads to a highly spherical shape. This is primarily attributed to the cooling rate the
metal experiences. However, it is argued that a low water-to-metal ratio and a high water pressure
can increase particle sphericity.
Typically, spherical powders allow for a higher packing density in the powder bed, thereby
increasing the attainable density of a printed sample [9]. Inaekyan et al. [7] have utilized BJAM
ACCEPTED MANUSCRIP
T

5
with water-atomized iron powder and examined the densities and mechanical properties that can
be obtained. The authors reported a green density nearing 40%, a sintered density of nearly 45%
after sintering at 1100 °C for 2 hours and a volume shrinkage of nearly 8%. Further sintered
densities of nearly 43% 80% under various Hot Isostatic Pressing (HIP) or bronze infiltration
regimes are reported. The low sintered density value (45%) is due to the low sintering temperature
used, since the melting point of the iron powder is approximately 1538°C [51]. Densification
through sintering is difficult to achieve at such low temperatures, since sinter neck formation is
expected to be poor. However, the low temperature was deliberately selected in order to directly
compare BJAM samples with those produced via Powder Metallurgy (PM) with similar sintering
regimes. Mostafaei et al. [9] studied the microstructure and mechanical properties of BJAM
samples made with water-atomized Inconel 625. The authors report a green density of near 50%.
A maximum sintered density of 95% is achieved after sintering at 1270 °C for 4 hours, while a
maximum shrinkage of 57% occurred after sintering at 1285 °C for 4 hours. Microstructural
analysis shows that the samples contained pronounced precipitate formation and zones depleted of
certain alloying elements, and tensile tests revealed comparatively low tensile strengths.
In general, the primary incentive for using water-atomized powder is its significantly lower cost
compared to gas-atomized powders (the extent of cost reduction varies depending on suppliers),
since water-atomization is currently the most common and economical means of producing metal
powders [50]. Another possible incentive is that high-pressure water-atomization can lead to a
higher yield of finer particles [50], which is useful for powder bed AM processes to increase
packing density and part density [9].
In this study, the effects of BJAM in-process printing parameters and post-process sintering
parameters on part density are studied with water-atomized iron powder. In-process, the effect of
powder compaction on green part density is examined by the action of the rotating roller (powder
spreader). The motion of a counter-rotating roller is typically shown to improve compaction and
spreading of the powder, in contrast to a static spreader. To examine the extent of its impact on
this powder, a comparison will be drawn between parts printed with the roller rotating and those
printed with the roller in a static position. In addition, the effects of varying the layer thickness and
liquid binder level on green part density are studied as well. Post-process, four sintering schedules
are developed, and the effect of the heat treatment parameters on binder pyrolysis and final sample
ACCEPTED MANUSCRIP
T
6
density is studied. This study offers an analysis of the debinding and sintering schedule
considerations for water-atomized iron powder in BJAM. Since water-atomized powders in AM
typically produce lower powder packing density [50] and part density [9], studying the heat
treatment considerations on part quality is helpful for understanding the potential of deploying
water-atomized powders instead of gas-atomized powders at a significantly reduced feedstock
cost. The approach derived in this study can serve as a starting point for more high-demand alloys
such as steels. This is particularly useful for deploying BJAM in industry sectors currently relevant
to PM, which are projected to be the first to benefit from disruptive adoption of the BJAM
technology.
2 Materials and Methods
2.1 Material system
The powder material used is water-atomized pure iron powder (AT-1001-HP, Rio Tinto QMP,
QC). The powder is sieved down to size < 45μm (USA Standard Test Sieve No. 325, Hogentogler
& Co., Columbia, MD). The powder is characterized for size distribution (Retsch Camsizer X2,
Newtown, PA) and surface morphology via scanning electron microscopy (SEM, LEO 1530, NY).
The iron powder is blended with polyvinyl alcohol (PVA) powder (Alfa Aesar, Ward Hill, MA)
with a particle size of < 63 μm, forming a blend of 99 wt% iron and 1 wt% PVA. Blending is
performed by using a rotary tumbler (Thumler’s A-R12, Auburn, WA) for 30 min. The PVA acts
as a solid-state binding agent during the 3DP process. A water-based solvent (ZbTM 60, Z
Corporation, Burlington, MA) is used as a liquid-state binding agent. While the exact composition
of the material is proprietary, the binder is an aqueous solution (approximately 85%-95% water)
with some glycerol polymer content as the binding agent.
2.2 Additive manufacturing of samples
The 3DP process is conducted by using the above materials on the BJAM system ZPrint 310 Plus
(3D Systems, Rock Hill, SC). In this study, three AM process variables are varied: roller actuation,
layer thickness and liquid binder level. The roller actuation is varied from ON to OFF by manually
disconnecting the roller pulley and taping the roller in place, thereby remaining static during
printing. Layer thickness and liquid binder level are varied by changing the printing settings in the
ACCEPTED MANUSCRIP
T

7
machine. Cylindrical samples are printed, measuring 5 mm in diameter and 8 mm in height, with
each printing batch containing 16 replicates. The build bed and feed bed have been modified from
the original size using inserts to fit an xyz envelope of 32 × 32 × 50 mm3 respectively. The
experimental design levels for print parameters are summarized in Table 1. Liquid binder levels
are presented in terms of saturation percentage per the machine setup – a value of 200%
corresponds to a droplet size of 70 pL, and similarly, 300% to 105 pL.
2.3 Green samples density measurements
Initial estimations of the green density of the printed samples are first determined via geometrical
and mass measurements. Geometrical measurements using calipers (Mitutoyo Absolute Digimatic
Caliper, Mississauga, ON) and mass measurements using a scale (Sartorius Secura 225D,
Göttingen, Germany) of the samples are performed, and the green density is estimated by using
Equation (1), in which 𝑚 is the mass of the sample, ℎ is the sample height, and 𝑎 and 𝑏 are the
major and minor diameters of the cylindrical samples. (The two different diameters are taken to
reduce error in the measurement by avoiding the assumption of a uniform circular cross-section.)
𝜌𝑠𝑎𝑚𝑝𝑙𝑒 = 𝑚
𝜋ℎ𝑎𝑏/4 (1)
Green densities are determined through x-ray computed tomography (μCT) (ZEISS Xradia 520
Versa 3D X-ray Microscope, Pleasanton, CA) by using the parameters in Table 2. The system
provides a true spatial resolution of 700 nm with minimum achievable voxel size of 70 nm.
Samples are stacked vertically in a sample holder. Cone beam X-rays illuminate the samples
throughout the measurement. X-rays are transmitted through the samples, converted to photons in
the visible light spectrum by a scintillator, magnified using an objective lens (4X), and finally
detected by a charge-coupled detector (CCD). The sample is rotated over 360° while a sequence
of two-dimensional images is taken. Once the scan is complete, reconstruction of the projection
images is completed using ZEISS Scout-and-ScanTM Control System Reconstructor Software
package, and a series of gray-scale images with 16-bit intensity ranges is produced.
Advanced image processing and porosity analysis are performed using Dragonfly Pro v3.1
(Object Research Systems Inc., Montréal, QC). The reconstructed dataset is denoised and filtered
using the Non Local Means 3D filter. By using routine image processing steps such as grayscale
ACCEPTED MANUSCRIP
T

8
thresholding, the cropped dataset is segmented into the solid material and pores. Binarized images
obtained following segmentation and morphological operations are used for relative density
measurements. The binarized datasets are manually aligned with the Z axis of the μCT scanner
corresponding to the build direction in ImageJ (Fiji, version 1.51) by using the “Rotate” function
with bilinear interpolation. Relative density shows the distribution of porosity through the part,
and is calculated by dividing 2D projections of the binarized porous dataset by a binary mask in
which each pore is closed using the ImageJ plugin, “Fill Holes”.
2.4 Debinding and sintering of samples
The framework for debinding and sintering can be developed based on previous work with this
technology [6,7,9,52,53] and with similar materials [7]. The processes generally consist of three
stages: curing (where water is evaporated from the samples by drying) at a comparatively low
temperature, debinding (where the binder is removed) at medium temperature, and finally sintering
at high temperature where densification occurs. There is typically a steady ramp up between the
last two stages. The ramp up can be multi-staged where temperature is held for short intervals,
which is typically not for metals [6,7,9], but for ceramics [52,53] in order to alleviate thermal
stresses. This is the general approach taken in this study. Curing is performed by drying the
samples in the build bed for a consistent duration at 40°C. Four post-process variables are studied:
debinding temperature, debinding duration, sintering temperature and sintering duration. The
rationale behind the selection of these parameters is described in depth in section 3.3. Debinding
is performed under air starting from room temperature and ramping up at a rate of 5°C/min up to
250350°C. The samples are kept at this temperature for 540 min, depending on liquid binder
level and layer thickness, to facilitate burnout of the binder. To achieve sintering, the temperature
is subsequently ramped up at 10°C/min up to 1390°C or 1490°C under 95%Ar–5%H2 atmosphere
and held for 2 hours or 6 hours. These temperatures correspond to 90% and 97% of the powder’s
melting point respectively. The temperature and duration of debinding are studied using thermo-
gravimetric analysis (TGA) (Netzsch Jupiter STA 449 F1, Burlington, MA), which is presented in
section 3.3. Sintering is performed by using the same TGA system (Netzsch Jupiter STA 449 F1,
Burlington, MA). Inert Nitrogen gas is used as a protective gas in all heat treatment procedures.
The TGA system is used for heat treatments instead of a curing oven and tube furnace in order to
study mass change.
ACCEPTED MANUSCRIP
T

9
2.5 Sintered samples density measurements
Density analysis of the sintered sample is accomplished using μCT analysis, with a similar
methodology as described for the green density analysis.
2.6 Sintered samples shrinkage measurements
The shrinkage incurred by the sintering process is quantified by using Equation (2), where 𝑥𝐺is
the measured dimensional feature of a green sample and 𝑥𝑆is that of the sample after sintering.
Shrinkage measurements were estimated in the radial and z-axis directions by using calipers
(Mitutoyo Absolute Digimatic Caliper, Mississauga, ON).
𝑆ℎ𝑟𝑖𝑛𝑘𝑎𝑔𝑒 𝑖𝑛 𝑥 =𝑥𝐺−𝑥𝑆
𝑥𝐺× 100% (2)
2.7 Uniaxial compression testing of sintered samples
For the purpose of this study, sintering is performed in a TGA system as opposed to a furnace, to
study the effect of the sintering schedule on densification and mass change. As such, a limited
yield of sintered samples could be reasonably produced. Uniaxial compression testing is performed
on sintered samples as a preliminary test for mechanical properties. A uniaxial compression test
system (MTS Criterion Model 43, Eden Prairie, MN) is utilized according to the ASTM E9 – 09
standard [54]. Samples are gently filed on the top and bottom surfaces to ensure flatness for the
compression test. Testing is conducted at room temperature by using a 30-kN load cell at a strain
rate of 0.001 s-1. Three (n = 3) replicates of each sample are used for the compression test. In this
study, the Weibull modulus described in Equation (3) is utilized as a means of quantifying the
reproducibility of the sintered samples. Weibull moduli are typically used for brittle materials such
as ceramics, or with ultimate tensile strengths in metals [55,56]. Since compression testing is
performed in this study, yield strength is taken as the failure characteristic.
𝑃(𝜎) = 1 − exp [− (𝜎
𝜎0)
𝑚
] (3)
where P is the failure probability, 𝜎 is the measured stress, 𝜎0 is the scale parameter of the Weibull
characteristic strength and m is the Weibull modulus. The probability of failure is calculated as
described in Equation (4) [57], in which 𝑖 is the measurement rank and 𝑛 is the number of samples.
The linearized form of the Weibull distribution is described in Equation (5).
ACCEPTED MANUSCRIP
T

10
𝑃(𝜎) = 1 − (𝑖−0.375
𝑛+0.4) (4)
𝑙𝑛(𝜎) = 𝑙𝑛 [𝑙𝑛 (1
𝑃(𝜎))] (5)
2.8 Surface roughness measurements
Surface roughness is characterized via laser confocal microscopy (Keyence VK-X250, Osaka,
Japan). Image processing and measurements are completed by using the microscope scan
processing software (Keyence VK-H1XME, Osaka, Japan). The roughness is measured in two
locations: along the sides of the samples near the middle, and at the top of the samples near the
center. The measurements are taken from approximately the same surface location on all samples
for both side and top surface roughness. A scanning area of nearly 1400 × 1000 μm is taken in
each surface scan, at a vertical z-axis resolution of 1 μm.
3 Results and Discussion
3.1 Powder characterization
The powder size distribution is determined to be 18 54 μm with a D50 of 34.1 0.5 μm. The size
distribution informed the selection of layer thickness levels in the study. Particle sphericity is found
to be 0.9 0.75 for the size range, with larger particles showing decreasing sphericity. Sphericity
at the D50 size is 0.8. Figure 1(ab) illustrates SEM images of the powder, showing its irregular
and angular shape.
3.2 Effect of AM process parameters on green density
The green densities are first estimated by dividing the measured masses of the samples by their
caliper-measured volumes. The measured mass values are used to help threshold the μCT datasets
associated with green parts in the image processing practice. The green densities of the samples
are then obtained through further processing of μCT scans of the samples, as explained in section
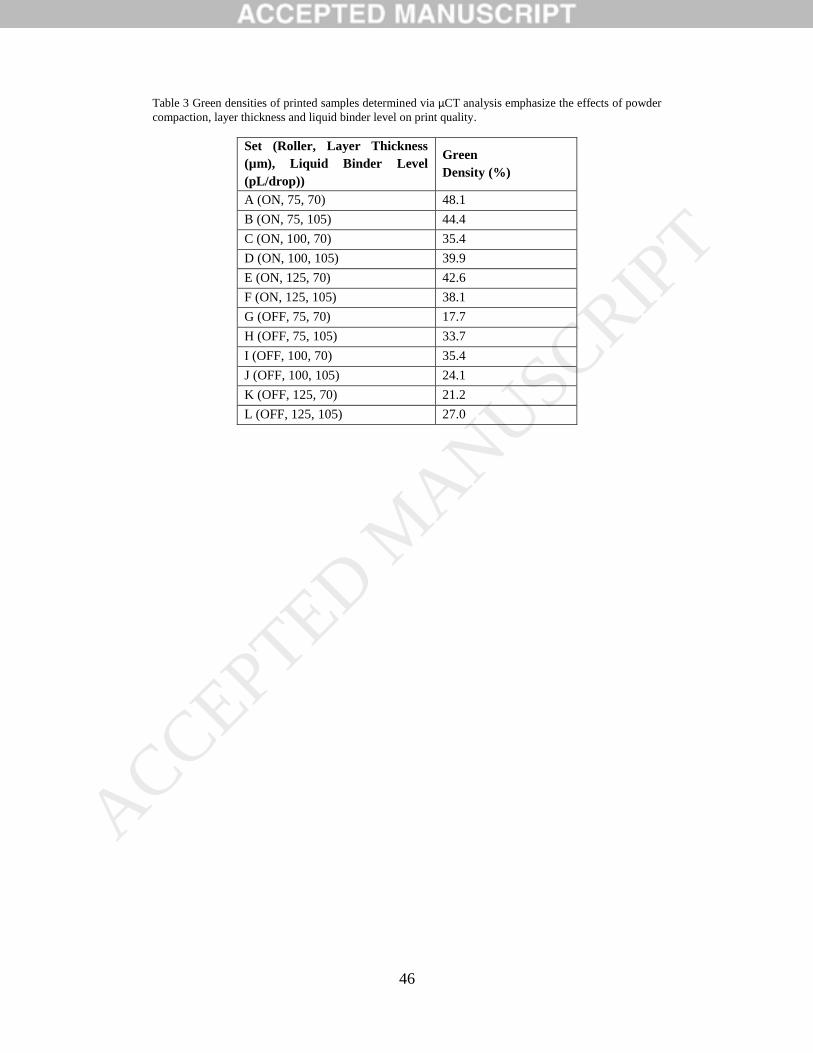
2.3. The µCT-derived density values are summarized in Table 3. The highest green density
obtained is 48.1% (sample set A, Table 1), with the roller actuated and with the lowest levels of
layer thickness and liquid binder.
ACCEPTED MANUSCRIP
T

11
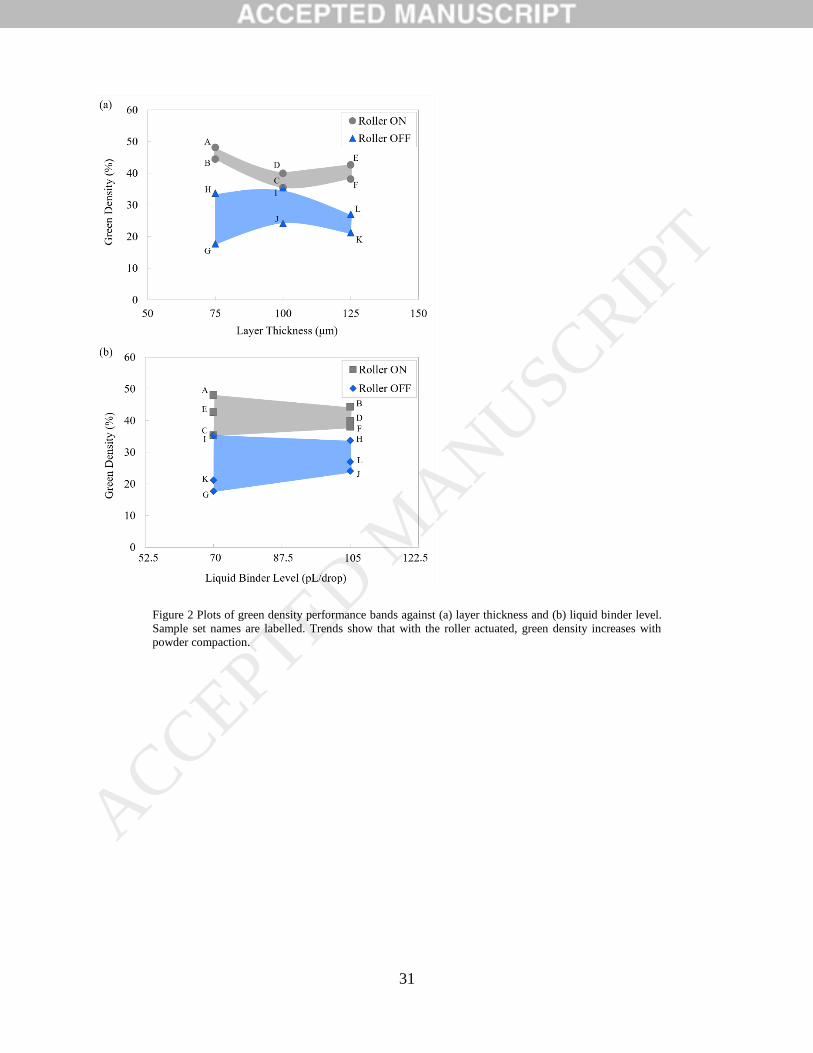
A visual representation of the green density results is presented in Figure 2(ab) as a function
of BJAM process parameters. The highest green density obtained is 48.1%, obtained at a layer
thickness of 75 μm and a liquid binder level of 70 pL/drop. Based on the density values, it is seen
that powder compaction through roller rotation plays an important role in increasing green density,
warranting further studies on optimizing the roller rotational and translational velocity for this
powder type. In addition, the results indicate that 75 μm layer thickness leads to higher green
densities when the roller is actuated.
A lower layer thickness leads to a tighter powder packing in the bed, since the roller pushes
down a thinner layer of particles onto the powder bed – in this case a thickness nearly twice the
powder size [58]. In BJAM, a lower layer thickness also leads to a larger total volume of liquid
binder deposited per unit of powder in the sample, since the liquid binder is jetted on a larger
number of layers. The material system used in this study employed a solid powder binder, which
is intended to dissolve when exposed to the liquid binder and thus create stronger adhesive bonds
between metal particles in the green state. If an appropriate amount of binder is used, these bonding
sites can promote sinter neck initiation during the metal sintering process [5,59].
A larger liquid binder volume can result in better dissolution of the solid state binder and
stronger adhesive bonds between metal powder constituents. A balance must be reached in terms
of the allowable ratio of binder constituents in the green state required to impart green part strength,
and at the same time avoiding issues related to cracking and void formation during debinding and
sintering, where binders are typically decomposed through pyrolysis.
The results in this study indicate that liquid binder level must be carefully controlled in order
to increase green density. The results show that liquid binder-powder interaction is indeed
complex, and there is an interplay of the powder compaction, layer thickness and liquid binder
level process variables. Certainly a larger data set would be needed to study the interaction and to
allow binder level optimization. The liquid binder occupies space in between the powder particles,
therefore minimizing the binder level should increase density. However, too low of a binder level
should be avoided, since an insufficient presence of the binder can lead to lack of adhesion and
part crumbling. Having the binder level too high can cause layer shifting and lead to part geometry
distortion. A larger study of liquid binder levels can be investigated as a future study for detecting
ACCEPTED MANUSCRIP
T

12
the threshold for maximizing green part density while avoiding green part crumbling. The range
studied here is typical for the machine system used.
The total binder content in each sample set is calculated based on the liquid binder level and
layer thickness. This is determined by multiplying the binder volume jetted in each layer by the
number of layers. The print-head jets at 600 dpi (x,y), and the cross-sectional area of the samples
in each layer is taken into account. The results are illustrated in Figure 3, and they reaffirm that
liquid binder content has to be carefully controlled in correlation with the layer thickness, and
other parameters of interest that may come into play and have not been considered in this study.
This is shown in the shape of the distribution where the roller is activated, where the highest green
density is obtained at the middle range. The deactivated roller samples suffer from spreading and
compaction defects, and cannot be used to draw conclusions about total binder content. A wider
selection of binder levels and layer thicknesses are useful for optimization and deeper conclusions.
The rotation of the roller has an impact on print quality. It is observed, during printing, that
spreading of the powder is significantly less uniform when the roller is deactivated. Streaks of
uneven spreading are noted, which is due to powder clinging to the static roller during spreading.
In general, printing with the roller deactivated results in more noticeable layer shifting. This is
reflected in the lower green densities obtained with the roller deactivated. The rotation of the roller
results in a compaction force onto the powder. The powder particles are pushed closer together
with each spread. The compaction of the powder layers is also beneficial in minimizing the seeping
of the liquid binder outside the intended print area. This seeping out effect can be detrimental as it
can lead to layer shifting. In fact, layer shifting is consistently observed in many of the samples
printed with the deactivated roller rotation. It is also more noticeable with the higher liquid binder
level of 105 pL/drop than with 70 pL/drop. No layer shifting is observed with any of the parts
printed with the roller actuated.
3.3 Debinding analysis
As the green samples undergo heat treatment, the mixture of liquid binder and PVA constituents
begins to disintegrate, leaving behind trace materials and pores. This process is known as “binder
burnout” or pyrolysis [8]. Eventually, as the temperature elevates to just below the melting point
of the metal, densification through sintering occurs, as sinter necks form and grow. Ideally, two
ACCEPTED MANUSCRIP
T

13
aspects of binder burnout must be ensured. First, complete binder pyrolysis should occur, such that
no binder remains in the sample after debinding is complete. Second, oxidation of the metal should
be avoided during debinding, as the binder disintegrates. Oxidation during debinding, specifically
for iron, can impede densification during the sintering heat treatment, as well as impact phase
changes, microstructure and mechanical performance. These two aspects can be tracked by
monitoring the mass change in the sample during the debinding heat treatment through TGA. First,
a test to determine the decomposition onset temperature of PVA alone is performed. Subsequently,
the green samples are subjected to the complete heat treatment protocol to confirm a suitable
debinding temperature, and if debinding time is an influential factor to consider for the debinding
schedule. The suitability of the debinding temperature is judged by (1) suitable binder burnout,
which would be evidenced by sample mass loss down to approximately 99% (in this case), and (2)
minimal oxidation, which would be evidenced by minimal sample mass gain during debinding.
However, understanding the full details of oxidation and pyrolysis products lies outside the scope
of this test.
3.3.1 Pyrolysis of the binder material
Most of the binder by mass fraction present in the samples consists of PVA. On average, the
PVA constitutes 0.98 0.09 % of the green sample mass. The jetted liquid binder consists of
mostly water, which is evaporated as the samples are dried, and glycerol. The glycerol completely
decomposes between approximately 150°C and 230°C [60], which is below the debinding
temperature threshold used in this study, and thus not considered critical. As such, TGA is
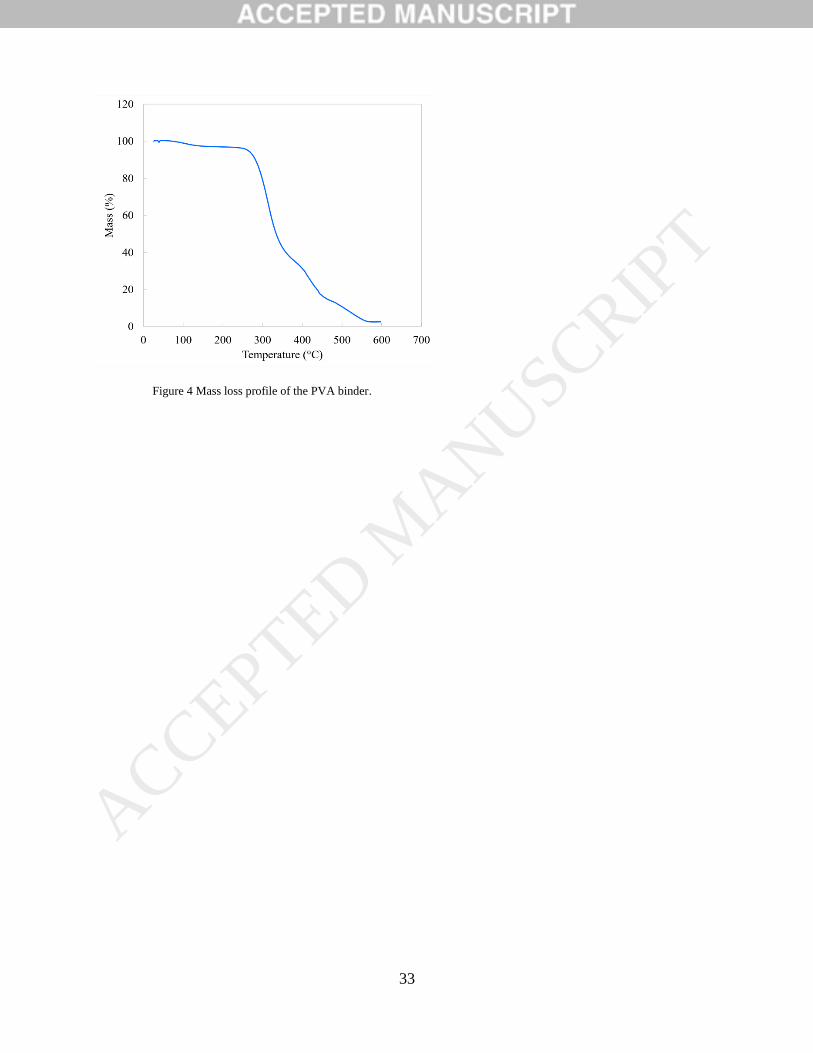
conducted on the PVA alone in order to examine its decomposition temperature. The mass loss
profile of the PVA binder is illustrated in Figure 4. This allows tracking of its thermal degradation
behavior. Temperature is ramped up from ambient conditions to 600°C. It is evident that
decomposition starts at nearly 270°C and continues until nearly 570°C, with rapid decomposition
occurring between 270°C and roughly 360°C. These results are in agreement with PVA
decomposition analysis in the literature [61]. Based on this analysis, 300°C is expected to be a
suitable temperature for debinding of the green samples.
The burning process of the binder can result in complete and incomplete combustion products
as well as the formation of various oxides. When sintering the printed samples, some of these
ACCEPTED MANUSCRIP
T

14
oxides could remain in the samples after debinding and only completely burn out before the onset
of sintering.
Debinding analysis
Based on the pyrolysis analysis of the binder in the previous section, debinding is studied on
the green samples (sample set A, Table 1) via TGA at 300°C, as well as 250°C and 350°C for
comparison. In each case, the conditions of the heat treatment are kept constant as described in
section 2.4 except for the debinding temperature. Samples are held at the respective temperature
for 30 min. Figure 5 shows the mass change profiles of sample A undergoing the three heat
treatments. The region of the first significant mass drop in the curves reveals differences between
debinding at 300°C and 350°C. While the 300°C curve stabilizes after the drop, the 350°C curve
displays a mass gain. This is taken as an indicator of significant oxidation of the metal taking place,
which is not desirable. The second significant mass drop occurs as temperatures increase and
sintering takes place. In this region, the curve of 300°C shows a steady drop in mass and a plateau
at approximately 99% relative mass, which is an indication that the binder is largely burnt off. At
250°C, the PVA does not decompose readily as it is below the decomposition onset temperature
shown in Figure 4. With this temperature, there is a higher chance of incomplete binder burnout.
If incomplete burnout occurs, residual binder compounds may burn off as temperature increases
prior to sintering, or in this case may lower the melting point of the iron powder because of the
presence of carbon. Based on these observations, 300°C is taken to be a suitable temperature for
debinding. Further studies on debinding via analytical techniques such as Fourier-transform
spectroscopy (FTIR) can reveal the functional groups and exact chemistry of the compounds
formed during pyrolysis.
Unlike temperature, the time of debinding is found to be dependent on process parameters.
Three samples A, B, C (Table 1) are analyzed in this context according to the conditions described
in section 2.4, with a debinding temperature of 300°C and variable debinding time and constant
sintering temperature of 1390°C for 2 hours. Figure 6 illustrates the effect of layer thickness and
liquid binder level on the required debinding time. Since the total number of layers affects the
total volume of binder in the sample, the total binder volume is also considered.
ACCEPTED MANUSCRIP
T

15
For a given layer thickness, a higher binder level indicates that a larger volume of binder is
jetted and hence requires a longer time for complete burnout. In Figure 6, comparing the curves A
(70 pL/drop binder level) and B (105 pL/drop binder level) shows this trend. The total binder
volume jetted in sample A is 82.1 L, while in B it is 123.1 L. Similarly, samples with a larger
layer thickness have fewer layers than those with a smaller layer thickness – therefore they contain
a smaller amount of binder and require a shorter time to completely burnout all the binder. This is
reflected in the curves A (75 μm layer thickness) compared to C (100 μm layer thickness). Sample
C takes a shorter time than A to burn out the binder since it contains only 61.4 L of liquid binder,
compared to the large volume contained in A. Overall, the results show that debinding time is an
influential factor that should be considered to ensure a correct heat treatment, and that it is
influenced by layer thickness and liquid binder level. It is therefore necessary to tailor the
debinding process with special care to the BJAM process parameter selection, not just based on
the material system constituents selected.
3.4 Sintering analysis
As the highest green density is obtained with sample set A (Table 1), sintering is performed on
replicates of this sample set to analyze the final density after sintering for different sintering
schedules. Sintered density is determined through μCT analysis, and is presented in Table 4.
The sintered density values indicate that obtaining high-density parts with water-atomized pure
iron powder is possible, while maintaining shape fidelity. For the range of temperatures selected,
sintered density increases with both higher sintering temperature and higher sintering time. A
higher sintering temperature that is closer to the melting point of the powder, as well as a longer
sintering duration can maximize the formation of sinter necks across the powder particles, thereby
increasing the final density. The formation of sinter necks is driven by reduction of energy in the
material system on a particulate level, which in turn depends on particle size [8]. The driving force
behind sintering is dependent on crossing the activation energy barrier that promotes volumetric
diffusion [8], such that keeping the system at one temperature for longer and longer durations will
enable sintering until the total system energy is reduced to the minimum. In the temperature range
for sintering studied here, volumetric diffusion is occurring as the activation energy for pure iron
is in the range of 1000 1200°C [62]. Overall, these results indicate that tailoring of the final
ACCEPTED MANUSCRIP
T

16
density is possible by careful control of the sintering schedule. Increasing sintering time beyond
6 hours is expected to result in even higher densities based on the trend observed.
A parallel can be drawn between the work presented in this paper and that performed by
Inaekyan et al. [7], as both use the same feedstock powder with the same technology to achieve a
similar goal. In [7], the same water-atomized pure iron powder is used as in this work, but with a
size distribution of 15 to 51 µm. The goal of that research is to investigate the viability of using
water-atomized powders with BJAM technology. A commercial machine (ExOne M-Flex) is
utilized in the study. Debinding is performed at 195 °C for 6 hours, which differs from the approach
taken in this paper in that debinding is performed here at 300 °C for 5 40 min. In [7], sintering
is completed under various conditions in Argon for 2 hours – including unassisted sintering at
1100 °C, bronze infiltration, and hot isostatic pressing (HIP) sintering at various temperatures and
pressures. To provide a fair comparison, this work’s results are compared to those of [7] that are
performed under unassisted sintering at 1100 °C in Argon for 2 hours. Densities reported in [7] are
nearly 40% for green samples and nearly 45% for sintered samples. The results of this paper
contrast with the results of [7], in that sintering is performed at much higher temperatures for
longer durations, which results in final densities between 64.5% (1390°C, 2 hours) and 91.3%
(1490°C, 6 hours). The differences in the results stem from the differences in the debinding and
sintering schedules. In particular, debinding at 300 °C is experimentally observed by the authors
to completely facilitate binder burnout, and a sintering temperature of 1490°C is much closer to
the melting point of the pure iron powder, and thus allows for more effective sintering.
Furthermore, sintering under a 95%Ar – 5%H2 environment mitigates the formation of a metal
oxide layer in the samples. The hydrogen acts as a reducing agent as it strips any oxide layer that
is formed, thereby improving the formation of sinter necks among iron particles. Furthermore, the
duration of sintering greatly enhances the total energy absorbed by metal particles during sintering,
as the 6-hour sintering leads to large increases in density in both temperatures.
This research provides an examination of the possible part densities that can be achieved with
water-atomized iron powder in a BJAM system. Ultimately, the creation of a Master Sinter Curve
(MSC) [8] is necessary in order to establish a robust framework that allows reliable and predictive
tailoring of part densities based on established heat treatment regimes. The MSC would enable the
selection of appropriate sintering schedules that can achieve high densities relevant to metal part
ACCEPTED MANUSCRIP
T

17
production (>90%) at lower temperatures than the temperature presented in this work (1490 °C),
at the expense of higher time required to sinter components. Lower temperature furnaces with
environment gas control are more economical, and generally preferred by industry.
3.5 Relative density, spatial porosity and pore shape analysis
A consistent voxel size for both green and sintered part scans is ensured to enable performing
the same μCT analysis both before and after sintering. Due to the voxel size at which the parts are
scanned, features with diameter below 16.5 µm cannot be reliably resolved. However, it has been
reported that small size pores with negligible volumes have no significant impact on macro-level
properties such as density [63]. For this study, 5.5 µm is deemed to be a reasonable voxel size in
which μCT scanning of the part is completed in approximately 5-6 hours.
In general, thresholding values for segmentation are manually established by examining images
prior to and after imposing the threshold to show the best contrast. Manual determination of the
threshold values is not found to be practicable for green parts due to the small powder particle size
of iron powder, high particle density, and interconnection of pore networks. Therefore, for the
green parts, segmentation of the images is completed by using the estimated sample masses and
material density. Based on the known density value of the iron powder (7.752 g/cm3), the
segmented sample volumes are multiplied by this density value to obtain the sample mass. The
mass is assumed to be 99% iron for the green parts. For the sintered parts, the lack of
interconnection seen in the pore network simplifies the analysis. As a result, thresholding values
can be manually established by inspecting images before and after thresholding.
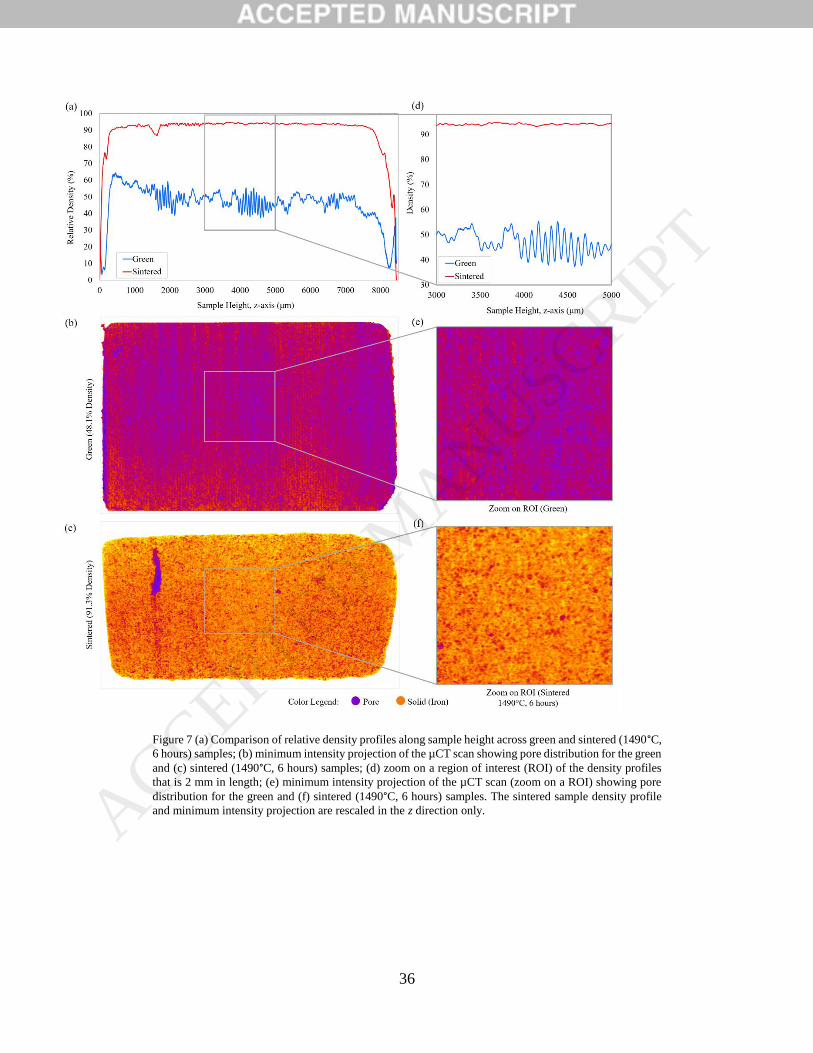
The filtered grayscale dataset is also resliced to an orthogonal view that can be flattened by
using the Minimum Intensity Projection (MinIP) method to visualize the distribution of low
density regions in the sample, and visually aligned with the relative density data in Figure 7(a-f).
MinIP projects the voxel with the lowest attenuation value onto a single 2D image for the entire
data set. It is assumed that PVA and liquid binder are not visible in any of the grayscale images
owing to their significantly lower attenuation value. Therefore, they do not contribute to the size
of the segmented section of the green parts. Slice-wise relative density calculation of the sample
(sample set A, Table 1) before and after sintering is shown in Figure 7(a–f).
ACCEPTED MANUSCRIP
T

18
The relative density profiles of the green and sintered (1490°C, 6 hours) samples are shown in
Figure 7(a), and they reveal the porosity distribution in the build direction (z-axis). In the green
sample, porosity distribution shows variation in the build direction. In general, the large variation
of relative density throughout the green sample is attributed to the BJAM process itself with a
more in-depth analysis offered in prior work [8]. There is a periodicity of density variation, which
can be seen as vertical bands in Figure 7(b) and (e), with the bands being almost equivalent to the
layer thickness. In the regions of high variability (Figure 7(a) along the z-axis: 1347 µm to 2320
µm, and 3926 µm to 4921 µm shown also in Figure 7(d)), the bands correspond to a periodicity of
75.7 5.7 µm, which reflects the layer thickness. This suggests that particle packing across a layer
is tighter than in between layers. The high variation is mostly absent in the sintered samples, which
is reflected in the absence of the vertical bands in Figure 7(c) and (f).
The overall lower regions (along the z-axis) of the green sample exhibit higher local densities
approaching 65%, while in the central regions local density varies between approximately 40%
and 55%. At the top of the sample, local density is at its lowest value. This trend is indicative of a
powder compaction effect, either due to the roller or gravity. The repeated motion of the spreader
in the AM system compacts the powder bed; topmost layers receive less compaction, resulting in
reduced local density. Such effects, as well as the periodicity described above, are largely absent
after sintering to 91.3% density. This is due to the fact that the sample is sintered at a high enough
temperature, where such effects are essentially dampened by aggressive sintering and
densification. To some extent, pore distribution is least concentrated near the central region of the
sintered sample. A large collection of pores near the bottom of the sintered sample indicate a defect
or a crack, shown by the dark “gash” in Figure 7(c) and the drop in local density in Figure 7(a).
Porosity also varies in the layer-wise (radial) direction, and this suggests a build orientation
effect. In the green sample, a larger pore distribution is present at one side of the sample (top of
Figure 7(b)). Specifically, powder spreading can lead to preferential packing of the build bed,
where powder packing density varies in the bed during the AM process itself. This pattern is
ACCEPTED MANUSCRIP
T

19
echoed to some extent in the sintered sample, but is reduced with high temperature sintering and
densification. This phenomenon is of interest and should be studied in more depth.
A comparison is also drawn across the four sintering schedules in terms of density profile. The
density profiles are plotted in Figure 8. Variability in the density profile is observed in the cases
of sintering at 1390°C, and to a much lesser extent at 1490°C. The profile of (1390°C, 2 hours)
shows high variability in local density over small regions as well as over the entire sample height.
This bears similarity to the green sample profile, except that local density is highest near the
sample’s center and lowest at the bottom. The profiles of (1390°C, 6 hours) and (1490°C, 2 hours)
also show some variability in local density, which is attributed to periodic regions of poorer powder
packing and thus poorer sinter neck formation. This trend is mostly not observed in the (1490°C,
6 hours) profile, where advanced sintering and densification overcome the effect of regions of poor
powder packing.
The distribution of the number of pores is illustrated against pore volume in Figure 9(a) and
against pore sphericity in Figure 9(b) for green and sintered (91.3% density) samples. Pore
sphericity refers to the aspect ratio of the pores, where a value of 1 indicates a perfect sphere. The
pore count is normalized against the total number of pores detected. The overall number of isolated
pores is much higher in sintered samples than in green samples, but the pores are of lower volume
(Figure 9(ab)). Interconnected porosity is detected in the green samples, denoted by a pore
volume greater than 1 × 1011 µm3. It is not detected in the 91.3% density sintered samples, as pores
become isolated after sintering to such a high density. In general, the distribution of pore volumes
is narrower after sintering, particularly in the presence of interconnected porosity that dominates
the volume (but not count) of pores in the green samples. Sphericity of the pores increases after
sintering and approaches 1, with the majority of pores attaining values 0.6 and 0.7.
Three-dimensional render images from the μCT analysis of the sintered sample (1490°C, 6
hours) are presented, highlighting the distribution of pores by volume in Figure 10(a) and the
distribution of pore sphericity in Figure 10(b).
ACCEPTED MANUSCRIP
T

20
3.6 Shrinkage analysis
The dimensional shrinkage of sample A (Table 1) is quantified by comparing the major and minor
diameters a and b and height h before and after sintering. Maximum shrinkage occurred in the case
of sintering at 1490°C for 6 hours, with a height shrinkage of 24.8 3.5% and diametrical
shrinkages of 25.3 2.8% and 24.2 2.1% respectively. A photographic representation of sample
A in the green state and in the various states of sintering is shown in Figure 11(ae7).
Shrinkage trends with respect to sintering temperature and time are illustrated in Figure
12(ad). In general, larger shrinkage is associated with higher sintering temperature. Increasing
the sintering temperature incurs much higher shrinkage (Figure 12(ab)) than does increasing the
sintering time (Figure 12(cd)). No meaningful trend can be extracted from the shrinkage analysis
about shrinkage in build direction (sample height h) compared to the horizontal direction (sample
diameters a and b). A more expansive experimental design can be created with various sample
geometries to reveal such trends, as they can reveal information about anisotropy or pore collapse
in various directions. Other studies on BJAM of metals typically show shrinkage values of 2%
32%, depending on powder, process and post-process parameters [1,6,7,13,19,24,25,27,28,40,64].
Radial uniformity in shrinkage is quantified by comparing shrinkage of the major and minor
diameters. Shrinkage in the major and minor diameters vary by 5 33%, where sintering at 1490°C
for 6 hours gives the best uniformity. Vertical uniformity in shrinkage is qualified by visual
inspection of the samples. Shrinkage is generally uniform vertical direction for all sintering
protocols, notwithstanding the dimensional accuracy of the AM process itself.
Consistency in shrinkage is assessed across multiple samples undergoing identical sintering
protocols. This is quantified through the standard deviation in shrinkage (refer to Figure 12). The
deviation is consistently low when sintering at 1390°C for 6 hours, which might suggest that
sintering at a comparatively lower temperature for longer durations can boost consistency.
Shrinkage is often an undesired outcome of densification through sintering. However, it can be
compensated for if it is more or less consistent, such as in the case of sintering at 1390°C for 6
hours. Shrinkage can be accounted for through calculated dimensional compensation in the design
ACCEPTED MANUSCRIP
T

21
of a part. A more comprehensive experimental study can be designed to better assess shrinkage
consistency in future research.
Mechanical properties
Uniaxial compression testing is performed on sintered samples. Weibull moduli and Young’s
moduli values are obtained from the results. The results are tabulated in Table 5. The highest yield
strength obtained is 30.6 15.8 MPa (1490°C, 2 hours), whereas the maximum Young’s modulus
obtained is 9.9 0.3 GPa (1490°C, 6 hours). The Weibull moduli are low in comparison with
typical metals [56], which reflects the high standard deviation in the yield strength values. Figure
13 shows the yield strength and Young’s modulus plotted against density. Mechanical strength
displays a trend with sample density. Samples at 79.1% density display higher Young’s modulus
than those with 84.0% density. However, the 79.1% density samples (1490°C, 2 hours) show a
very high standard deviation in yield strength, which indicates that one of the measurement results
is an outlier. Sintering in the TGA system limited the number of samples sintered for analysis, and
further test could not be completed. The poor mechanical performance can be partially attributed
to irregularly shaped pores in the samples (section 3.5), where larger pores can behave as notches
(as in Figure 7(c)) that impact mechanical performance. Mechanical properties also depend on
microstructure and grain size, which are influenced by the sintering conditions.
3.7 Surface roughness analysis
Surface roughness characterization is performed on the samples along the build direction (side
surface) and perpendicular to the build direction (top surface). Surface correction for curvature is
employed for scans along the side surface. The “arithmetical mean height” surface roughness
metric 𝑆𝑎 is utilized. The roughness values are summarized in Table 6. The lowest side surface
roughness obtained corresponds to the samples sintered at 1490°C for 6 hours, with a value of 19.6
3.4 μm. The lowest top surface roughness is 11.6 5.0 μm, obtained at 1490°C for 2 hours.
Surface roughness improves significantly after sintering. Roughness drops by 8% 29% after
sintering at 1390°C and by 16% 46% at 1490°C. Surface roughness measurements are plotted
against density in Figure 14. Generally, sintering for a longer duration results in better surface
finish in both cases of 1390°C and 1490°C. Sintering at higher temperatures for a fixed duration
ACCEPTED MANUSCRIP
T
22
also improves surface finish. In the green and all sintered states, top surfaces are smoother than
side surfaces. This suggests a build orientation effect, where interlayer bonding or sintering results
in rougher surfaces than across one layer. This might suggest that powder packing across one
single layer is tighter than that in between layers due to the counter-rotating roller, resulting in
superior sinter necking and thus better surface finish across the top layer.
Overall, BJAM process parameters and post-processing sintering parameters have a significant
effect on final part qualities such as density, pore spatial distribution, pore morphology, pore
interconnectivity, surface roughness, and mechanical characteristics. Depending on the
application, an appropriate combination of process parameters and post-processing thermal
treatment have to be carefully and holistically selected to achieve the target desired properties.
4 Conclusions
In this study, the effects of AM process parameters and post-process heat treatment on part density
are studied on water-atomized pure iron samples printed with BJAM. The main findings are
outlined as follows:
1. Density analysis through μCT scans reveals that green density is increased by minimizing
layer thickness and carefully controlling liquid binder level. Liquid binder-powder
interaction is complex and needs to be understood in further studies with larger datasets.
Powder compaction in the bed allows for improved powder spreading and higher green
densities, and optimization of powder spreading and compaction is of interest for future
research. Overall, ranges of parameters wider than those included in this work can be
studied for full exploration of the process map. Green densities of up to 48.1% are
obtainable with water-atomized iron powder.
2. Optimization of the debinding process is a critical step to ensuring correct sintering. In this
study, a suitable debinding temperature and duration are determined for the binder used,
which results in complete binder burnout. However, complete binder burnout does not
occur at the debinding temperature, Sintering can achieve densities of up to 91.3%.
3. This work demonstrates the viability of producing high density parts using water-atomized
iron powder. Ultimately, an MSC is needed to enable complete tailoring of densities based
on post-process heat treatment.
ACCEPTED MANUSCRIP
T

23
4. Pore distribution is affected by powder spreading. Green samples contain a higher pore
concentration near the topmost regions and near one side of the sample, due to powder
packing effects. The action of sintering reduces this trend. The density profile is reasonably
consistent throughout the height of the sample.
5. The results obtained in this research might be used to tailor post-process heat treatment on
BJAM parts in order to achieve a wide range of densities depending on target applications.
Increasing the sintering time over 6 hours at temperatures nearing the melting point is
expected to result in densities above 91.3%. Custom sintering schedules have to be
developed for lower temperature furnaces to achieve appropriate densification.
6. Mechanical properties generally improve with higher sintering temperatures, due to more
progressed sintering. A study that is more focused on mechanical characterization is needed
for further analysis.
7. Shrinkage is drastically increased by increasing sintering temperature, and a more
comprehensive study on consistency and uniformity in shrinkage might allow
compensation for shrinkage by design.
Acknowledgments
This work was supported by funding from the Federal Economic Development Agency for Sothern
Ontario (FedDev Ontario), in partnership with Rio Tinto. The authors would like to acknowledge
the contribution of Rio Tinto for their support and mentorship throughout the completion of work.
The authors also acknowledge the assistance of Dr. H. Asghari in SEM image procurement and
Dr. E. Marzbanrad in TGA.
References
[1] Y. Bai, C.B. Williams, An exploration of binder jetting of copper, Rapid Prototyp. J. 21
(2015) 177–185. doi:10.1108/RPJ-12-2014-0180.
[2] Y. Tang, Y. Zhou, T. Hoff, M. Garon, Y.F. Zhao, Elastic modulus of 316 stainless steel lattice
structure fabricated via binder jetting process, Mater. Sci. Technol. 32 (2016) 648–656.
doi:10.1179/1743284715Y.0000000084.
ACCEPTED MANUSCRIP
T
24
[3] R. Frykholm, Y. Takeda, B.-G. Andersson, R. CarlströM, Solid State Sintered 3-D Printing
Component by Using Inkjet (Binder) Method, J. Jpn. Soc. Powder Powder Metall. 63 (2016)
421–426. doi:10.2497/jjspm.63.421.
[4] M. Dourandish, D. Godlinski, A. Simchi, 3D Printing of Biocompatible PM-Materials,
Mater. Sci. Forum. 534–536 (2007) 453–456. doi:10.4028/www.scientific.net/MSF.534-
536.453.
[5] T. Do, C.S. Shin, D. Stetsko, G. VanConant, A. Vartanian, S. Pei, P. Kwon, Improving
Structural Integrity with Boron-based Additives for 3D Printed 420 Stainless Steel, Procedia
Manuf. 1 (2015) 263–272. doi:10.1016/j.promfg.2015.09.019.
[6] A. Basalah, Y. Shanjani, S. Esmaeili, E. Toyserkani, Characterizations of additive
manufactured porous titanium implants, J. Biomed. Mater. Res. B Appl. Biomater. 100B
(2012) 1970–1979. doi:10.1002/jbm.b.32764.
[7] K. Inaekyan, V. Paserin, I. Bailon-Poujol, V. Brailovski, Binder-jetting additive
manufacturing with water atomized iron powders, APMI International Conference on Powder
Metallurgy & Particulate Materials (2016).
[8] E. Wheat, Process Mapping and Optimization of Titanium Parts Made by Binder Jetting
Additive Manufacturing, MASc thesis, University of Waterloo (2018).
[9] A. Mostafaei, J. Toman, E.L. Stevens, E.T. Hughes, Y.L. Krimer, M. Chmielus,
Microstructural evolution and mechanical properties of differently heat-treated binder jet
printed samples from gas- and water-atomized alloy 625 powders, Acta Mater. 124 (2017)
280–289. doi:10.1016/j.actamat.2016.11.021.
[10] D.-T. Chou, D. Wells, D. Hong, B. Lee, H. Kuhn, P.N. Kumta, Novel processing of iron–
manganese alloy-based biomaterials by inkjet 3-D printing, Acta Biomater. 9 (2013) 8593–
8603. doi:10.1016/j.actbio.2013.04.016.
[11] K. Agarwal, D. Mathur, R. Shivpuri, J. Lembo, Evaluation of ProMetal technique for
application to dies for short run forgings, Solid Free. Fab Proc. Austin TX. (2002) 376–83.
[12] E. Sachs, E. Wylonis, S. Allen, M. Cima, H. Guo, Production of injection molding tooling
with conformal cooling channels using the three dimensional printing process, Polym. Eng.
Sci. 40 (2000) 1232–1247. doi:10.1002/pen.11251.
[13] S.M. Allen, E.M. Sachs, Three-dimensional printing of metal parts for tooling and other
applications, Met. Mater. 6 (2000) 589–594. doi:10.1007/BF03028104.
[14] E.A. Rojas-Nastrucci, J. Nussbaum, T.M. Weller, N.B. Crane, Meshed rectangular
waveguide for high power, low loss and reduced weight applications, in: IEEE, 2016: pp. 1–
4. doi:10.1109/MWSYM.2016.7540079.
ACCEPTED MANUSCRIP
T

25
[15] A.C. Bailey, A. Merriman, A. Elliott, M.M. Basti, Preliminary Testing of Nanoparticle
Effectiveness in Binder Jetting Applications, 27th Annual International Solid Freeform
Fabrication Symposium (2016).
[16] H. Chen, Y.F. Zhao, Process parameters optimization for improving surface quality and
manufacturing accuracy of binder jetting additive manufacturing process, Rapid Prototyp. J.
22 (2016) 527–538. doi:10.1108/RPJ-11-2014-0149.
[17] N.B. Crane, J. Wilkes, E. Sachs, S.M. Allen, Improving accuracy of powder‐ based SFF
processes by metal deposition from a nanoparticle dispersion, Rapid Prototyp. J. 12 (2006)
266–274. doi:10.1108/13552540610707022.
[18] A. Elliott, S. AlSalihi, A.L. Merriman, M.M. Basti, Infiltration of Nanoparticles into Porous
Binder Jet Printed Parts, Am. J. Eng. Appl. Sci. 9 (2016) 128–133.
doi:10.3844/ajeassp.2016.128.133.
[19] D. Hong, D.-T. Chou, O.I. Velikokhatnyi, A. Roy, B. Lee, I. Swink, I. Issaev, H.A. Kuhn,
P.N. Kumta, Binder-jetting 3D printing and alloy development of new biodegradable Fe-Mn-
Ca/Mg alloys, Acta Biomater. 45 (2016) 375–386. doi:10.1016/j.actbio.2016.08.032.
[20] E. Sachs, M. Cima, J. Cornie, D. Brancazio, J. Bredt, A. Curodeau, T. Fan, S. Khanuja, A.
Lauder, J. Lee, Three-dimensional printing: the physics and implications of additive
manufacturing, CIRP Ann.-Manuf. Technol. 42 (1993) 257–260.
[21] C.B. Williams, J.K. Cochran, D.W. Rosen, Additive manufacturing of metallic cellular
materials via three-dimensional printing, Int. J. Adv. Manuf. Technol. 53 (2011) 231–239.
doi:10.1007/s00170-010-2812-2.
[22] H.J. Yoo, Reactive Binders for Metal Parts Produced By Three Dimensional Printing,
Master's Thesis, MIT (1997).
[23] M. Ziaee, E.M. Tridas, N.B. Crane, Binder-Jet Printing of Fine Stainless Steel Powder with
Varied Final Density, JOM. 69 (2017) 592–596. doi:10.1007/s11837-016-2177-6.
[24] D. Godlinski, S. Morvan, Steel Parts with Tailored Material Gradients by 3D-Printing Using
Nano-Particulate Ink, Mater. Sci. Forum. 492–493 (2005) 679–684.
doi:10.4028/www.scientific.net/MSF.492-493.679.
[25] A. Basalah, S. Esmaeili, E. Toyserkani, On the influence of sintering protocols and layer
thickness on the physical and mechanical properties of additive manufactured titanium
porous bio-structures, J. Mater. Process. Technol. 238 (2016) 341–351.
doi:10.1016/j.jmatprotec.2016.07.037.
[26] F.E. Wiria, J.Y.M. Shyan, P.N. Lim, F.G.C. Wen, J.F. Yeo, T. Cao, Printing of Titanium
implant prototype, Mater. Des. 31 (2010) S101–S105. doi:10.1016/j.matdes.2009.12.050.
ACCEPTED MANUSCRIP
T

26
[27] A. Basalah, S. Esmaeili, E. Toyserkani, Mechanical properties of additive-manufactured
porous titanium bio-structures with oriented macro-scale channels, Int. J. Adv. Manuf.
Technol. 84 (2016) 2239–2246. doi:10.1007/s00170-015-7849-9.
[28] S.M. Gaytan, M.A. Cadena, H. Karim, D. Delfin, Y. Lin, D. Espalin, E. MacDonald, R.B.
Wicker, Fabrication of barium titanate by binder jetting additive manufacturing technology,
Ceram. Int. 41 (2015) 6610–6619. doi:10.1016/j.ceramint.2015.01.108.
[29] J. Isaza, C. Aumund-Kopp, S. Wieland, F. Petzoldt, M. Bauschulte, D. Godlinski, New
Materials and Applications by 3D-Printing for Innovative Approaches, Euro PM (2015).
[30] S. Maleksaeedi, J.K. Wang, A. El-Hajje, L. Harb, V. Guneta, Z. He, F.E. Wiria, C. Choong,
A.J. Ruys, Toward 3D Printed Bioactive Titanium Scaffolds with Bimodal Pore Size
Distribution for Bone Ingrowth, Procedia CIRP. 5 (2013) 158–163.
doi:10.1016/j.procir.2013.01.032.
[31] F.E. Wiria, S. Maleksaeedi, Z. He, Manufacturing and characterization of porous titanium
components, Prog. Cryst. Growth Charact. Mater. 60 (2014) 94–98.
doi:10.1016/j.pcrysgrow.2014.09.001.
[32] A. Mostafaei, E.L. Stevens, E.T. Hughes, S.D. Biery, C. Hilla, M. Chmielus, Powder bed
binder jet printed alloy 625: Densification, microstructure and mechanical properties, Mater.
Des. 108 (2016) 126–135. doi:10.1016/j.matdes.2016.06.067.
[33] A. Mostafaei, Y. Behnamian, Y.L. Krimer, E.L. Stevens, J.L. Luo, M. Chmielus, Effect of
solutionizing and aging on the microstructure and mechanical properties of powder bed
binder jet printed nickel-based superalloy 625, Mater. Des. 111 (2016) 482–491.
doi:10.1016/j.matdes.2016.08.083.
[34] P. Nandwana, A.M. Elliott, D. Siddel, A. Merriman, W.H. Peter, S.S. Babu, Powder bed
binder jet 3D printing of Inconel 718: Densification, microstructural evolution and
challenges☆, Curr. Opin. Solid State Mater. Sci. 21 (2017) 207–218.
doi:10.1016/j.cossms.2016.12.002.
[35] M. Turker, D. Godlinski, F. Petzoldt, Effect of production parameters on the properties of IN
718 superalloy by three-dimensional printing, Mater. Charact. 59 (2008) 1728–1735.
doi:10.1016/j.matchar.2008.03.017.
[36] J.P. Singh, R. Singh, Investigations for a statistically controlled rapid casting solution of lead
alloys using three-dimensional printing, Proc. Inst. Mech. Eng. Part C J. Mech. Eng. Sci. 223
(2009) 2125–2134. doi:10.1243/09544062JMES1337.
[37] R. Singh, J.P. Singh, Comparison of rapid casting solutions for lead and brass alloys using
three-dimensional printing, Proc. Inst. Mech. Eng. Part C J. Mech. Eng. Sci. 223 (2009)
2117–2123. doi:10.1243/09544062JMES1387.
[38] D.W. Lipke, Y. Zhang, Y. Liu, B.C. Church, K.H. Sandhage, Near net-shape/net-dimension
ZrC/W-based composites with complex geometries via rapid prototyping and Displacive
ACCEPTED MANUSCRIP
T

27
Compensation of Porosity, J. Eur. Ceram. Soc. 30 (2010) 2265–2277.
doi:10.1016/j.jeurceramsoc.2010.01.011.
[39] M. Kaplas, R. Singh, Experimental investigations for reducing wall thickness in zinc shell
casting using three-dimensional printing, Proc. Inst. Mech. Eng. Part C J. Mech. Eng. Sci.
222 (2008) 2427–2431. doi:10.1243/09544062JMES1131.
[40] M. Lanzetta, M. Santochi, Liquid-phase Infiltration of Thermal Sintered Skeletons by Low-
temperature Gold Eutectic Alloys, CIRP Ann. 55 (2006) 213–216. doi:10.1016/S0007-
8506(07)60401-6.
[41] M.P. Paranthaman, C.S. Shafer, A.M. Elliott, D.H. Siddel, M.A. McGuire, R.M. Springfield,
J. Martin, R. Fredette, J. Ormerod, Binder Jetting: A Novel NdFeB Bonded Magnet
Fabrication Process, JOM. 68 (2016) 1978–1982. doi:10.1007/s11837-016-1883-4.
[42] J. Moon, A.C. Caballero, L. Hozer, Y.-M. Chiang, M.J. Cima, Fabrication of functionally
graded reaction infiltrated SiC–Si composite by three-dimensional printing (3DP) process,
Mater. Sci. Eng. A. 298 (2001) 110–119. doi:10.1016/S0921-5093(00)01282-X.
[43] U. Scheithauer, A. Bergner, E. Schwarzer, H.-J. Richter, T. Moritz, Studies on thermoplastic
3D printing of steel–zirconia composites, J. Mater. Res. 29 (2014) 1931–1940.
doi:10.1557/jmr.2014.209.
[44] U. Scheithauer, Additive Manufacturing of Metal-Ceramic-Composites by Thermoplastic
3D-Printing (3DTP), (2015). doi:10.4416/JCST2014-00045.
[45] R. Soundararajan, G. Kuhn, R. Atisivan, S. Bose, A. Bandyopadhyay, Processing of Mullite-
Aluminum Composites, J. Am. Ceram. Soc. 84 (2001) 509–513. doi:10.1111/j.1151-
2916.2001.tb00691.x.
[46] J. Zhang, S. Zhao, Y. Zhu, Y. Huang, M. Zhu, C. Tao, C. Zhang, Three-dimensional printing
of strontium-containing mesoporous bioactive glass scaffolds for bone regeneration, Acta
Biomater. 10 (2014) 2269–2281. doi:10.1016/j.actbio.2014.01.001.
[47] A. Curodeau, E. Sachs, S. Caldarise, Design and fabrication of cast orthopedic implants with
freeform surface textures from 3-D printed ceramic shell, J. Biomed. Mater. Res. 53 (2000)
525–535. doi:10.1002/1097-4636(200009)53:5<525::AID-JBM12>3.0.CO;2-1.
[48] M.C. Melican, M.C. Zimmerman, M.S. Dhillon, A.R. Ponnambalam, A. Curodeau, J.R.
Parsons, Three-dimensional printing and porous metallic surfaces: A new orthopedic
application, J. Biomed. Mater. Res. 55 (2001) 194–202. doi:10.1002/1097-
4636(200105)55:2<194::AID-JBM1006>3.0.CO;2-K.
[49] A. Levy, A. Miriyev, A. Elliott, S.S. Babu, N. Frage, Additive manufacturing of complex-
shaped graded TiC/steel composites, Mater. Des. 118 (2017) 198–203.
doi:10.1016/j.matdes.2017.01.024.
ACCEPTED MANUSCRIP
T

28
[50] C.T. Schade, T.F. Murphy, C. Walton, Development of atomized powders for additive
manufacturing, Powder Metallurgy Word Congress (2014).
[51] D. R. Askeland, P. P. Fulay, and W. J. Wright. The science and engineering of materials 6th
edition, Cengage learning Inc (2010) pp. 889.
[52] M. Vlasea, R. Pilliar, E. Toyserkani, Control of structural and mechanical properties in
bioceramic bone substitutes via additive manufacturing layer stacking orientation, Addit.
Manuf. 6 (2015) 30–38. doi:10.1016/j.addma.2015.03.001.
[53] M. Vlasea, E. Toyserkani, R. Pilliar, Effect of Gray Scale Binder Levels on Additive
Manufacturing of Porous Scaffolds with Heterogeneous Properties, Int. J. Appl. Ceram.
Technol. 12 (2015) 62–70. doi:10.1111/ijac.12316.
[54] Standard Test Methods of Compression Testing of Metallic Materials at Room Temperature,
ASTM E9 - 09, 2018
[55] S. Guo, R. Liu, X. Jiang, H. Zhang, D. Zhang, J. Wang, F. Pan, Statistical Analysis on the
Mechanical Properties of Magnesium Alloys, Materials. 10 (2017) 1271.
doi:10.3390/ma10111271.
[56] G. Straffelini, A. Molinari, Analysis of reliability of powder metallurgy steels by means of
weibull statistics, Qual. Reliab. Eng. 8 (1992) 3–8. doi:10.1002/qre.4680080103.
[57] J. Absi, P. Fournier, J.C. Glandus, Influence of experimental parameters on the estimated
value of Weibull’s modulus, Journal of Materials Science 34.6 (1999) 1219-1227.
[58] S. Haeri, Y. Wang, O. Ghita, J. Sun, Discrete element simulation and experimental study of
powder spreading process in additive manufacturing, Powder Technol. 306 (2017) 45–54.
doi:10.1016/j.powtec.2016.11.002.
[59] R. Chumnanklang, T. Panyathanmaporn, K. Sitthiseripratip, J. Suwanprateeb, 3D printing of
hydroxyapatite: Effect of binder concentration in pre-coated particle on part strength, Mater.
Sci. Eng. C. 27 (2007) 914–921. doi:10.1016/j.msec.2006.11.004.
[60] B. Dou, V. Dupont, P.T. Williams, H. Chen, Y. Ding, Thermogravimetric kinetics of crude
glycerol, Bioresour. Technol. 100 (2009) 2613–2620. doi:10.1016/j.biortech.2008.11.037.
[61] M. Vlasea, Additive Manufacturing Methodology and System for Fabrication of Porous
Structures with Functionally Graded Properties, PhD thesis, University of Waterloo (2014).
[62] P. S. Liu, G. F. Chen, “Making porous metals” in Porous Materials: Processing and
Applications, Elsevier (2014) 21 – 112.
https://www.sciencedirect.com/science/article/pii/B9780124077881000022 (accessed June
26, 2018).
ACCEPTED MANUSCRIP
T

29
[63] M. Salarian, E. Toyserkani, The use of nano-computed tomography (nano-CT) in non-
destructive testing of metallic parts made by laser powder-bed fusion additive manufacturing,
Int. J. Adv. Manuf. Technol. 98 (2018) 3147–3153. doi:10.1007/s00170-018-2421-z.
[64] M. Dourandish, D. Godlinski, A. Simchi, V. Firouzdor, Sintering of biocompatible P/M Co–
Cr–Mo alloy (F-75) for fabrication of porosity-graded composite structures, Mater. Sci. Eng.
A. 472 (2008) 338–346. doi:10.1016/j.msea.2007.03.043.
ACCEPTED MANUSCRIP
T

30
Figure 1 SEM images of the water atomized iron powder showing particle irregular morphology at
magnifications of (a) 200× and (b) 500×
ACCEPTED MANUSCRIP
T
31
Figure 2 Plots of green density performance bands against (a) layer thickness and (b) liquid binder level.
Sample set names are labelled. Trends show that with the roller actuated, green density increases with
powder compaction.
ACCEPTED MANUSCRIP
T

32
Figure 3 Green density against total binder volume in the samples, considering binder level and layer
thickness. Highest density is achieved at the middle range of total binder content when the roller is activated
(sample A).
ACCEPTED MANUSCRIP
T
33
Figure 4 Mass loss profile of the PVA binder.
ACCEPTED MANUSCRIP
T

34
Figure 5 Mass loss of the green samples shows that 300 °C is a suitable debinding temperature. The regions
of debinding and sintering are annotated for the 300°C curve.
ACCEPTED MANUSCRIP
T

35
Figure 6 Effect of process parameters on debinding time. Comparing the curves of samples A and B shows
that a higher binder level increases the time required for complete binder burnout; comparing the curves of
samples A and C shows that a higher layer thickness decreases it.
ACCEPTED MANUSCRIP
T
36
Figure 7 (a) Comparison of relative density profiles along sample height across green and sintered (1490°C,
6 hours) samples; (b) minimum intensity projection of the µCT scan showing pore distribution for the green
and (c) sintered (1490°C, 6 hours) samples; (d) zoom on a region of interest (ROI) of the density profiles
that is 2 mm in length; (e) minimum intensity projection of the µCT scan (zoom on a ROI) showing pore
distribution for the green and (f) sintered (1490°C, 6 hours) samples. The sintered sample density profile
and minimum intensity projection are rescaled in the z direction only.
ACCEPTED MANUSCRIP
T

37
Figure 8 Relative density profile comparison across sintering schedules (average density value shown in
dotted lines).
ACCEPTED MANUSCRIP
T

38
Figure 9 Histograms of pore count against (a) pore volume, and (b) pore sphericity for green and sintered
(91.3% density), evaluated via µCT scan image processing. Pore volumes greater than 1 × 1011 µm3 refer
to an interconnected pore network that is detected only in the green samples.
ACCEPTED MANUSCRIP
T

39
Figure 10 Three-dimensional rendering of μCT scans of a sintered sample (1490°C, 6 h) showing the
distributions of (a) pore volume and (b) pore sphericity.
ACCEPTED MANUSCRIP
T

40
Figure 11 Dimensional shrinkage due to sintering. Sample A in (a) green state, and sintered at (b) 1390°C,
2 hours, (c) 1390°C, 6 hours, (d) 1490°C, 2 hours and (e) 1490°C, 6 hours. The extent of dimensional
shrinkage correlates with density
ACCEPTED MANUSCRIP
T

41
Figure 12 Shrinkage analysis shows that sintering temperature has a very drastic impact on shrinkage in
both cases of (a) 2 hours and (b) 6 hours. Whereas sintering time has a slight effect on shrinkage in both
cases of (c) 1390°C and (d) 1490°C. In this figure, a is the minimum cylinder diameter, b is the maximum
cylinder diameter, and h is the cylinder height.
ACCEPTED MANUSCRIP
T

42
Figure 13 Plots of yield strength and Young’s modulus against sample density; mechanical performance
generally improves with higher sintering temperature due to more progressed sintering.
ACCEPTED MANUSCRIP
T

43
Figure 14 Higher densities generally result in smoother surfaces due to more progressed sintering. Top
surfaces are smoother than side surfaces, suggesting a build orientation effect.
ACCEPTED MANUSCRIP
T

44
Table 1 The experimental design varies three variables: roller actuation, layer thickness and liquid binder
level
Set
Name
Roller
Actuation
Layer
Thickness
(μm)
Liquid Binder
Level
(pL/drop)*
A ON 75 70
B ON 75 105
C ON 100 70
D ON 100 105
E ON 125 70
F ON 125 105
G OFF 75 70
H OFF 75 105
I OFF 100 70
J OFF 100 105
K OFF 125 70
L OFF 125 105
*70 pL/drop ≡ 200%, 105 pL/drop ≡ 300% saturation level.
ACCEPTED MANUSCRIP
T

45
Table 2 Parameters of μCT measurements
Parameters
Source-to-detector distance (mm) 66.89
Voxel size (µm) 5.5
Voltage (kV) 140
Power (W) 10
Current (µA) 70
Source filter HE2
Exposure time (s) 5.5
Optical magnification 4X
Camera binning 2
Number of projections 1201
ACCEPTED MANUSCRIP
T
46
Table 3 Green densities of printed samples determined via μCT analysis emphasize the effects of powder
compaction, layer thickness and liquid binder level on print quality.
Set (Roller, Layer Thickness
(µm), Liquid Binder Level
(pL/drop))
Green
Density (%)
A (ON, 75, 70) 48.1
B (ON, 75, 105) 44.4
C (ON, 100, 70) 35.4
D (ON, 100, 105) 39.9
E (ON, 125, 70) 42.6
F (ON, 125, 105) 38.1
G (OFF, 75, 70) 17.7
H (OFF, 75, 105) 33.7
I (OFF, 100, 70) 35.4
J (OFF, 100, 105) 24.1
K (OFF, 125, 70) 21.2
L (OFF, 125, 105) 27.0
ACCEPTED MANUSCRIP
T

47
Table 4 Sintered density values of the sample with the highest green density (sample A), under various
sintering temperatures and durations.
Sintering
Temperature (°C)
Sintering
Time (h)
Sintered Density
(%)
1390 (90% of Tm) 2 64.5
1390 (90% of Tm) 6 84.0
1490 (97% of Tm) 2 79.1
1490 (97% of Tm) 6 91.3
ACCEPTED MANUSCRIP
T

48
Table 5 Values of 0.2% offset yield strength, corresponding Weibull moduli and Young’s moduli of the
various samples, based on uniaxial compression testing.
Sintering
Protocol 𝝈𝒚 (MPa) m (R2) 𝑬 (GPa)
1390°C, 2h 5.1 1.8 2.60 (0.74) 6.1 0.2
1390°C, 6h 7.5 2.9 2.40 (0.69) 8.3 0.5
1490°C, 2h 30.6 15.8 1.95 (0.98) 9.2 0.1
1490°C, 6h 20.6 5.5 2.60 (0.50) 9.9 0.3
ACCEPTED MANUSCRIP
T

49
Table 6 Average surface roughness results for side surfaces and top surfaces of sample A.
Sample Side Surface
𝑺𝒂 (μm)
Top Surface
𝑺𝒂 (μm)
Green 32.1 3.4 21.4 5.7
Sintered 1390°C, 2h 24.5 4.3 17.4 3.0
Sintered 1390°C, 6h 22.7 4.3 19.6 6.8
Sintered 1490°C, 2h 20.7 2.5 11.6 5.0
Sintered 1490°C, 6h 19.6 3.4 18.0 2.5
ACCEPTED MANUSCRIP
T

50
ACCEPTED MANUSCRIP
T