Embed Size (px)
Citation preview

TAHOE:STATE OF THE LAKE REPORT2019Tahoe Environmental Research Center

2
TAHOE STATE OF THE LAKE REPORT 2019
TAHOE.UCDAVIS.EDU
FUNDING TO ASSEMBLE AND DISTRIBUTE THIS REPORT WAS PROVIDED BY THE FOLLOWING SPONSORS:
$5000 and above
$1000 to $2500
under $1000
League to Save Lake Tahoe

1
TAHOE STATE OF THE LAKE REPORT 2019
TAHOE.UCDAVIS.EDU
1. Introduction
2. Executive Summary
3. About Lake Tahoe
4. About the UC Davis Tahoe Environmental Research Center
5. Map of Tahoe Basin Data Collection Sites
6. Current Directions 6.1 Current research synopsis 6.3 An ecological solution for Tahoe’s clarity 6.7 Future climate conditions 6.10 The role of Cyclotella in Lake Tahoe’s changing summer clarity 6.11 Three new insights from the nearshore network 6.18 Forest health: heritage aspens and the threat of white satin moth 6.19 The secrets held in lakes 6.20 Taking the pulse of small lakes throughout the Sierra Nevada 6.22 TERC globally
7. Meteorology 7.1 Air temperature (since 1911) 7.2 Air temperature - annual average maximum and minimum (since 1910) 7.3 Below-freezing air temperatures (since 1910) 7.4 Monthly air temperature (since 1910) 7.5 Annual precipitation (since 1910) 7.6 Monthly precipitation (2016, 2017, 2018 and 1910 to 2018 average) 7.7 Snow as a fraction of annual precipitation (since 1910) 7.8 April snowpack (since 1916) 7.9 Daily solar radiation (2018)
8. Physical properties 8.1 Lake surface level (since 1900) 8.2 Lake surface level, continued (daily since 2016) 8.3 Water temperature profile (2018) 8.4 Average water temperature (since 1970) 8.5 Annual average water temperature (since 1970) 8.6 Surface water temperature (since 1968) 8.7 Maximum daily surface water temperature (since 1999) 8.8 July average surface water temperature (since 1999) 8.9 Deep water temperature (since 1970) 8.10 Depth of mixing (since 1973) 8.11 Lake stability (since 1968) 8.12 Stratified season length (since 1968) 8.13 Beginning of the stratification season (since 1968) 8.14 End of stratification season (since 1968) 8.15 Peak stratification season (since 1968) 8.16 Onset of snowmelt pulse (since 1961)
9. Nutrients and Particles 9.1 Sources of clarity-reducing and blueness-reducing pollutants (2018) 9.2 Pollutant loads from seven watersheds (2018) 9.3 Notrogen contribution by Upper Truckee River (since 1989) 9.4 Phosphorus contribution by Upper Truckee River (since 1989) 9.5 Suspended sediment contribution by Upper Truckee River (since 1989) 9.6 Lake nitrate concentration (since 1980) 9.7 Lake phosphorus concentration (since 1980) 9.8 Nitrate distribution (2018) 9.9 Phosphorus distribution (2018) 9.10 Fine particle distribution (2018)
TABLE OF CONTENTS
(C O NTI N U E D O N N E X T PAG E )

2
TAHOE STATE OF THE LAKE REPORT 2019
TAHOE.UCDAVIS.EDU
10. Biology 10.1 Algae growth (primary productivity) (since 1959) 10.2 Algae abundance (since 1984) 10.3 Chlorophyll-a distribution (2018) 10.4 Annual distribution of algal groups (since 1982) 10.5 Abundance of dominant diatom species (2018) 10.6 Algal groups as a fraction of total biovolume (2018) 10.7 Distribution of Cyclotella gordonensis (2018) 10.8 Peak shoreline algae concentrations (since 2000) 10.9 Shoreline algae populations (2018)
11. Clarity 11.1 Annual average Secchi depth (since 1968) 11.2 Winter Secchi depth (since 1968) 11.3 Summer Secchi depth (since 1968) 11.4 Individual Secchi depths (2016, 2017, and 2018)
12. Education and outreach 12.1 TERC education and outreach (2018) 12.2 TERC educational exhibits (2018) 12.3 TERC outreach (2018) 12.4 TERC educational programs (2018) 12.6 TERC special events (2018)
TABLE OF CONTENTS, CONTINUED

1
TAHOE STATE OF THE LAKE REPORT 2019
TAHOE.UCDAVIS.EDU
The University of California, Davis has conducted continuous monitoring of Lake Tahoe since 1968, amassing a unique record of change for one of the world’s most beautiful and vulnerable lakes. In the UC Davis Tahoe: State of the Lake Report, we summarize how natural variability, long-term change and human activity are affecting the lake’s clarity, physics, chemistry, and biology. We also present part of the data collected in 2018 – presenting all of it would be a monumental task. While Lake Tahoe is unique, the forces and processes that shape it are the same as those acting in most natural ecosystems. As such, Lake Tahoe is an indicator for other systems both in the western United States and worldwide. Our goal is to understand the lake’s complexity and to use the knowledge gained to provide the scientific underpinnings for ecosystem restoration and management actions. Choosing among those options and implementing them is the role of management agencies that also need to take into account a host of other considerations. This annual report is intended to inform non-scientists about variables that affect lake health. One indicator of Lake Tahoe’s health status, the annual clarity is reported earlier each year. In this report we publish many other environmental and water quality factors that all provide indications of the lake’s condition and help explain the lake’s changing clarity.
This report sets the context for understanding the changes that are seen from year to year and those that are observed over time scales of decades. We also present updates on current research taking place independently of the long-term monitoring. This highlights some of the most exciting and promising findings of work that is still in progress, and will be reported on fully in the months and years to come. The data we present are the result of efforts by a great many scientists, engineers, students, and technicians who have worked at Lake Tahoe throughout the decades since sampling commenced. I would, however, like to acknowledge (in alphabetical order) the contributions of Brant Allen, Jonathan Arthur, Karen Atkins, Brandon Berry, Brooke Boeger, Mike Bruno, Tom Burt, Luciana Cardoso, Sudeep Chandra, Danny Cluck, Bob Coats, Stephanie Coppeto, Mark Enders, MJ Farruggia, Alex Forrest, Nick Framsted, Susan Frankel, Drew Friedrichs, Charles Goldman, Nick Gomez, Cordie Goodrich, Scott Hackley, Karen Hagerman, Tina Hammell, Bruce Hargreaves, Simon Hook, Camille Jensen, Yufang Jin, Jackson Kuzmik, Kwungwoo Lee, Anne Liston, Patricia Maloney, George Malyj, Elisa Marini, Jasmin McInerney, Devin Middlebrook, Patricio Moreno, Siya Phillips, John Reuter, Bob Richards, Will Richardson, Gerardo Rivera, Derek Roberts, Steve Sadro, Goloka Sahoo, Heather Segale,
Katie Senft, Steven Sesma, Samantha Sharp, Roland Shaw, David Smith, Sheri Smith, Adrianne Smits, Drew Stang, Erin Suenaga, Jae Sung, Micah Swann, Lidia Tanaka, Raph Townsend, Alison Toy, Sean Trommer, Seung Tae, Sergio Valbuena, Aaron Vanderpool, Shohei Watanabe, Andy Wong, and Carmen Woods to this year’s report. In particular, Shohei Watanabe was responsible for the majority of the data analysis and Alison Toy led the compilation of the final report. Funding for the actual data collection and analysis has come from many sources over the decades. While many additional water quality variables could be tracked, funding ultimately limits what we measure and report on. Current funding for the long-term monitoring and analysis is provided by the the California Tahoe Conservancy, Lahontan Regional Water Quality Control Board, Tahoe Regional Planning Agency, U.S. Geological Survey, and UC Davis. Funders for current projects include the following: California Tahoe Conservancy, Institute for Museum and Library Services, Nevada Department of Tourism and Cultural Affairs, Nevada Division of Environmental Protection, Nevada Division of State Lands, Tahoe Fund, and Tahoe Truckee Community Foundation. Our monitoring is frequently done in collaboration with other research institutions and agencies. In particular,
we would like to acknowledge the Desert Research Institute (DRI), the National Aeronautics and Space Administration (NASA), the Tahoe Resource Conservation District (TRCD), the U.S. Forest Service (USFS), the U.S. Geological Survey (USGS), and the University of Nevada, Reno (UNR). We are very proud to recognize the funding support for the actual production of this annual report from the following organizations: California Tahoe Conservancy, Incline Village Waste Not Program, Lahontan Regional Water Quality Control Board, Lake Tahoe Marina Association, League to Save Lake Tahoe, Nevada Division of Environmental Protection, Parasol, Tahoe Fund, Tahoe Lakefront Owners Association, Tahoe Regional Planning Agency, and Tahoe Water Suppliers Association. We sincerely thank these organizations for their dedication in supporting science to save the lake.
Sincerely,
Geoffrey Schladow, director UC Davis Tahoe Environmental Research Center 291 Country Club Drive
INTRODUCTION

2.1
TAHOE STATE OF THE LAKE REPORT 2019
TAHOE.UCDAVIS.EDU
The long-term data set collected on the Lake Tahoe ecosystem by the University of California, Davis and its research collaborators is an invaluable tool for understanding ecosystem function and change. It has become essential for responsible management by elected officials and public agencies tasked with restoring and managing the Tahoe ecosystem. This is in large part because it provides an independent basis for assessing the progress toward attainment of Tahoe’s restoration goals and desired conditions, while at the same time building our understanding of the natural processes that drive the ecosystem.
The UC Davis Tahoe Environmental Research Center (TERC) is increasingly using new approaches to enrich the long-term data record for Lake Tahoe. These
include real-time measurements at over 25 stations around the basin; remote sensing from autonomous underwater vehicles, satellites, and aerial drones; and the deployment of a suite of numerical models. These tools are all focused on quantifying the changes that are happening; and, at the same time, understanding what actions and measures will be most effective for control, mitigation, and management.
This annual Tahoe: State of the Lake Report presents data from 2018 in the context of the long-term record. While we report on the data collected as part of our ongoing, decades-long measurement programs, we also include sections summarizing current research that is being driven by the important questions of the day. These include: the continuing decline of lake clarity during the
summer months and a potential ecological approach to restoring it; the vastly different climate that Tahoe basin will experience in the coming decades and what this could mean for current planning and management activities; the direct linkage between the alga Cyclotella and clarity; new findings on the physical processes that occur in the lake based real-time measurements in the nearshore; and growing threats to Lake Tahoe’s aspens. The impact that TERC’s researchers are having at locations far from Tahoe are also highlighted.
Summer clarity has been declining in the long term at Lake Tahoe, and largely offsetting the gains made in winter clarity. With projections of future climate change indicating accelerating warming and earlier runoff from streams, the decline in summer clarity is expected to
continue, threatening the progress that has been made in the last 20 years. Recent results suggests that a novel ecological approach, focused on the removal of the Mysis shrimp that was introduced in the 1960s, may be able to restore the lake’s native zooplankton, increase the clarity at to levels not seen in decades, and in the process “climate proof” the clarity of the lake. Increased clarity and the return of the native zooplankton carries with it the additional benefits of rapid growth of native fish and a natural impediment to the growth of invasive fish and plants.
Climate change is expected to impact all aspects of the Tahoe basin in the coming decades. The most serious of these changes are likely to be driven by changes in the physical processes, not simply the change in air temperature. The temperature
EXECUTIVE SUMMARY
1“Previous year” for some parameters means data collated in terms of the water year, which runs from October 1 through September 30; for other parameters, it means data for the calendar year, January 1 through December 31. Therefore, for this 2019 report, water year data are from Oct. 1, 2017 through Sept. 30, 2018. Calendar year data are from Jan. 1, 2018 through Dec. 31, 2018.
(C O N T I N U E D O N N E X T PAG E )

2.2
TAHOE STATE OF THE LAKE REPORT 2019
TAHOE.UCDAVIS.EDU
EXECUTIVE SUMMARY
distribution in the lake will suppress mixing, critical for oxygenation of the deep waters. At the same time, the continuing transition from a snow-based to a rain-based climate will result in the peak stream-flows occurring months earlier than they historically have. Aside from consequences for fish spawning, the loss of snowpack water storage will also mean a drying of the forests and the consequent elevated wildfire risk.
In 2018 the tiny diatom, a type of algal cell, Cyclotella again impacted summertime clarity levels. Even though Cyclotella biomass was relatively smaller in 2018, its small size and its dominance in the surface waters means that it comprises the largest number of algal cells above the level of the Secchi disk.
Five years ago, a novel monitoring
program was commenced with the installation of eleven real-time water quality stations around the periphery of the lake. Over that time, an entirely new set of insights and knowledge about Lake Tahoe have been developed. Aside from quantifying water quality in different parts of the nearshore, we have been able to create predictive tools for turbidity and periphyton sloughing all around the lake, better understand the conditions under which stream inflows mix as they enter the lake, and– most importantly– have discovered a new “wave” that propagates around the boundary of Lake Tahoe. The existence of this wave had previously been inferred, but now the measurements and the model results have confirmed its existence and its importance.
Though the devastation wrought
on Tahoe’s forests by the recent drought seem to have passed from our memory, new threats to the health of the forests have emerged. The most prominent of these is the threats white satin moth, which is defoliating stands of Aspen in parts of the basin. Some of these trees are considered “heritage trees” as carvings on their trunks can be dated to an earlier era when Basque sheepherders brought their flocks into the basin. With successive cycles of defoliation these trees will eventually die.
Meteorologically, 2018 was a very uneventful year. Air temperature and precipitation were similar to what the long-term trend lines. Similarly, the percentage of snow in the total precipitation was 31.5 percent, almost identical to the previous year, but down from one hundred years ago when it was closer to 50 percent. The
snow depth on March 29, 2018 was 121 inches, a very average year, far below the values this year when on March 29, 2019 it was 198 inches.
Lake Tahoe has been warming since regular measurements commenced in 1968. Surface water temperatures in particular have been increasing. For 2018, the average surface water temperature was 53.2 °F (11.8 °C). This is the second warmest surface temperature year recorded. The maximum daily summer surface water temperature was one of the highest observed at 77.5 °F, which was recorded on August 6, 2018. Over the month of July, surface water temperature averaged 67.3 °F, the third warmest July on record. The warming of the surface prevents the lake from fully mixing in winter. In 2018, Lake Tahoe mixed to a depth of 935 feet. This lack of deep
(C O N T I N U E D F R O M PAG E 2 .1 )
(C O N T I N U E D O N N E X T PAG E )

2.3
TAHOE STATE OF THE LAKE REPORT 2019
TAHOE.UCDAVIS.EDU
mixing most likely contributed to the warm surface temperatures, and the continuing buildup of nitrate in the lake.
Nutrient inputs via streams are a major source for nitrogen and phosphorus, and the total load typically varies with the annual precipitation. With 2018 being an average precipitation year, nutrient inputs were closer to average than the previous very wet year. Within the lake, nitrate concentration was at an all-time high of 20.9 micrograms per liter, the result of the seventh successive year in which deep mixing did not occur. Phosphorus, measured as total hydrolysable phosphorus (THP), was at its highest level since 1989 for the same reason.
Biologically, the primary productivity of the lake has increased
dramatically since 1959. By contrast, the biomass (concentration) of algae in the lake has remained relatively steady over time. The annual average concentration for 2018 was 0.65 micrograms per liter. For the period of 1984-2018, the average annual chlorophyll-a concentration in Lake Tahoe was 0.70 micrograms per liter. From an abundance viewpoint, diatoms were the most common algal group (60 percent of the cells). Of these, Synedra and Nitzschia were the most common during every month of the year. Cyclotella was a lower fraction of the diatoms in 2018, but it still had a large impact on clarity. The peak biovolume in 2018 was 320 cubic millimeters per cubic meter, almost double the biovolume in the last three years, a reflection of the increase in Synedra and Nitzschia. The attached algae (periphyton) on the rocks around the lake were
particularly heavy in 2018, based on a synoptic survey of 53 observations. This was in part due to the relatively steady water level. Ironically, the four individual sites that are annually used to compare year to year variations were all abnormally low.
In 2018, the annual average Secchi depth was 70.9 feet (21.6 m), a 10.5 foot increase over the previous year. The highest individual value recorded in 2018 was 100.0 feet (30.5 m) on March 6 and the lowest was 50.0 feet (15.2 m) on July 27. The increase this year is attributed to a return to more normal conditions, following the five-year drought and the heavy snow year that ended it. While the average annual clarity is now better than in preceding decades, it is still short of the clarity restoration target of 97.4 feet. The winter (December - March) clarity value of 73.5 feet
was a decrease of 5.2 feet. This was largely the result of the previous year’s extremely low clarity conditions. Summer (June-September) clarity was 61.7 feet, an 8.2 foot increase from 2017. The cause of the improvement was a return to more normal summer conditions.
This report is available on the UC Davis Tahoe Environmental Research Center website (http://tahoe.ucdavis.edu/stateofthelake).
EXECUTIVE SUMMARY
(C O N T I N U E D F R O M PAG E 2 . 2 )

3
TAHOE STATE OF THE LAKE REPORT 2019
TAHOE.UCDAVIS.EDU
• Maximum depth: 1,645 feet (501 meters), making it one of the deepest lakes in the world and second deepest lake in the United States
• Average depth: 1,000 feet (305 meters)
• Lake surface area: 191 square miles (495 square kilometers)
• Watershed area: 312 square miles (800 square kilometers)
• Length: 22 miles (35 kilometers)
• Width: 12 miles (19 kilometers)
• Length of shoreline: approximately 75 miles (120 kilometers)
• Volume of water: 39 trillion gallons, plus or minus
• The daily evaporation from Lake Tahoe (half a billion gallons) would meet the daily water needs of 5 million Americans
• The number of algal cells in Lake Tahoe is approximately 30 million trillion
• Number of inflowing streams: 63, the largest being the Upper Truckee River
• Number of large lakes worldwide with annual clarity exceeding Tahoe’s: 0
• Number of outflowing streams: one, the Truckee River, which exits at Tahoe City, California, flows through Truckee and Reno, and terminates in Pyramid Lake, Nevada.
• Length of time it would take to refill the lake: about 600 years
• Average elevation of lake surface: 6,225 feet (1,897 meters)
• Highest peak in basin: Freel Peak, 10,891 feet (3,320 meters)
• Latitude: 39 degrees North
• Longitude: 120 degrees West
ABOUT LAKE TAHOE AND THE TAHOE BASIN

4
TAHOE STATE OF THE LAKE REPORT 2019
TAHOE.UCDAVIS.EDU
The UC Davis Tahoe Environmental Research Center (TERC) is a world leader in research, education and public outreach on lakes and watersheds, providing critical scientific information to help understand, restore, and sustain the Lake Tahoe Basin and other systems worldwide. Since 1968 UC Davis has undertaken the continuous scientific monitoring of Lake Tahoe, creating the foundation on which to base restoration and stewardship efforts.
TERC’s activities are based at permanent research facilities in the Tahoe Basin and at the University’s main campus in Davis, California, about 90 miles west of the lake.
Our main laboratories and offices are in Incline Village, Nevada, on the third floor of the Tahoe Center for Environmental Sciences building.
On the first floor, we operate the Tahoe Science Center, an educational resource for K-12 students and
learners of all ages, that is free and open to the public.
In Tahoe City, California, we operate a field station (housed in a fully renovated, former state fish hatchery) and the Eriksson Education Center. Tahoe City is also the mooring site for our research vessels, the John LeConte and the Bob Richards.
Our secondary laboratories and offices are located on the UC Davis campus at the Center for Watershed Sciences and in Wickson Hall.
At locations throughout the basin, we have sensors continuously reporting on the health and well-being of the lake and its environs, making Lake Tahoe the smartest lake in the world.
Our website (http://tahoe.ucdavis.edu) has more information about our programs, including:
• Information for potential students, staff, faculty, research collaborators and visitors;
• Access to near-real-time data gathered by our growing network of sensors;
• An extensive list of Tahoe research publications;
• Exhibits and events at the Education Centers; and
• Information about supporting our research and learning programs.
ABOUT THE UC DAVIS TAHOE ENVIRONMENTAL RESEARCH CENTER (TERC)

ooo
ooo
ooo
ooo
ooo
ooo
ooo
ooo
ooo
ooo
ooo
ooo
ooo
ooo
oooooo
oooooo
ooo
ooo
ooo
ooo
ooo
ooo
ooo
ooo
ooo
oo
o
!(
!(
!(
!(
!(
!(
!(
!(
!(
!(
!(
!(
!( !( !(!(
!(
!(
#*#*
#*
#*
#*
#*#*#*#*
#*#*
#*
#* #*
#*
!H
!H
!H
!H
k
kk
k
kk
k
k
k
k
k
kk
k
k
k
k
k
kk k
k
k
k
k
k
k
k
k
k
k
k
kk
k
k
k
k
k
k
k
k
k
k
k
k
k
k
k
k
k
k
k
k
!H
!H
!(
!(
!(!(!(
!(
!(
!(
!(
!(
!(
!(
!(
!(
!(
!(
$+
$+
$+$+
$+$+
$+
kj
kj
_̂
_̂
XY
XY
®"
®"
®"
LegendXYContinuous W
ater Quality
_̂
TERC Facility
®"
TERC Lake Monitoring Station
kj
TERC Alert Tahoe Camera
$+
LTIMP Stream Monitoring Stations
!H
TERC Buoy
k
Periphyton Stations
!H
NASA/TERC Buoy
#*
Stormwater Stations
!(
MET Stations
!(
TERC Nearshore Stations
oForestry Plots
Watershed Boundary
100 m Depth Contours
LTIMP Streams
q
0
4
8
12
16
2
Miles
0
5
10
15
20
2.5
Kilometers
5
TAHOE STATE OF THE LAKE REPORT 2019
TAHOE.UCDAVIS.EDU
ooo
ooo
ooo
ooo
ooo
ooo
ooo
ooo
ooo
ooo
ooo
ooo
oooooo
ooo
ooo
ooo
ooo
ooo
ooo
ooo
ooo
ooo
ooo
ooo
ooo
ooo
ooo
!(
!(
!(
!(!(
!(
!(
!(
!(
!(
!(
!(
!(
!(
!(!(
!(
!(
#*
#*
#*#*
#*
#*#*#*#*
#*#*
#*#* #*
#*
!H
!H!H
!H
k
k
k
k
k
k
k
k
k
k
k
kk
k
k
k
k
k
kk
k
k
k
k
k
k
k
k
k
k
k
k
k
k
k
k
k
k
k
k
kk
k
k
k
k
k
k
k
k
k
k
k
k
!H
!H !(
!(!(
!(
!(
!(
!(
!(!(
!(
!( !(!(
!(
!(
!(
$+
$+
$+$+
$+$+
$+
kj
kj
_̂
_̂
XY
XY®"
®"
®"
Legend
XY Continuous Water Quality
_̂ TERC Facility
®" TERC Lake Monitoring Station
kj TERC Alert Tahoe Camera
$+ LTIMP Stream Monitoring Stations
!H TERC Buoy
k Periphyton Stations
!H NASA/TERC Buoy
#* Stormwater Stations
!( MET Stations
!( TERC Nearshore Stations
o Forestry Plots
Watershed Boundary
100 m Depth Contours
LTIMP Streams
q
0 4 8 12 162Miles
0 5 10 15 202.5Kilometers
TAHOE BASIN DATA COLLECTION SITES
ooo
ooo
ooo
ooo
ooo
ooo
ooo
ooo
ooo
ooo
ooo
ooo
oooooo
ooo
ooo
ooo
ooo
ooo
ooo
ooo
ooo
ooo
ooo
ooo
ooo
ooo
ooo
!(
!(
!(
!(!(
!(
!(
!(
!(
!(
!(
!(
!(
!(
!(!(
!(
!(
#*
#*
#*#*
#*
#*#*#*#*
#*#*
#*#* #*
#*
!H
!H!H
!H
k
k
k
k
k
k
k
k
k
k
k
kk
k
k
k
k
k
kk
k
k
k
k
k
k
k
k
k
k
k
k
k
k
k
k
k
k
k
k
kk
k
k
k
k
k
k
k
k
k
k
k
k
!H
!H !(
!(!(
!(
!(
!(
!(
!(!(
!(
!( !(!(
!(
!(
!(
$+
$+
$+$+
$+$+
$+
kj
kj
_̂
_̂
XY
XY®"
®"
®"
Legend
XY Continuous Water Quality
_̂ TERC Facility
®" TERC Lake Monitoring Station
kj TERC Alert Tahoe Camera
$+ LTIMP Stream Monitoring Stations
!H TERC Buoy
k Periphyton Stations
!H NASA/TERC Buoy
#* Stormwater Stations
!( MET Stations
!( TERC Nearshore Stations
o Forestry Plots
Watershed Boundary
100 m Depth Contours
LTIMP Streams
q
0 4 8 12 162Miles
0 5 10 15 202.5Kilometers

6
CURRENT DIRECTIONS
tahoe.ucdavis.edu
TAHOE:STATE OF THE LAKE REPORT2019

6.1
CURRENT DIRECTIONS
Tahoe: State of the Lake Report 2019
Current Research Synthesis
Since 1959, UC Davis has been engaged in monitoring the status and health of Lake Tahoe and its watershed. That trove of monitoring data is an invaluable resource for assessing the impact of changes that have occurred due to anthropogenic factors and to natural variability. Additionally, we engage in shorter-term research that seek to answer specific questions or to gain understanding of processes and events. This research relies on the long-term monitoring data to provide a context, but it is very much separate. The results of this research – conducted by TERC’s students, postdoctoral researchers, faculty,
and staff, and often in collaboration with other institutions and colleagues – has made Lake Tahoe the smartest lake in the world, and arguably the most influential.
Photos: J. McInerney, K. Senft, and A. Toy

6.2
CURRENT DIRECTIONS
Tahoe: State of the Lake Report 2019
Current Research Synthesis, continued
This year, our current research synthesis covers a broad range of areas, much of it, the result of work conducted over the last five years. Some of the research is now complete and the results are starting to influence management and decision-making. Much of it is still underway or in its initial stages. The topics we are focusing on are:
Photos: B. Allen and A. Toy
• Are there solutions for avoiding the impacts of climate change on the lake’s clarity? Monitoring has shown that removing the introduced Mysis shrimp can rapidly restore clarity and could climate-proof it against future changes.• The future climate of the Tahoe basin and the huge changes in store for the basin’s hydrology.• The continuing impact of the tiny algal cell, Cyclotella on the summer clarity at Lake Tahoe in 2018.• The linkages between the nearshore and the mid-lake regions. This work is the culmination of five years of development of the Nearshore Water Quality Network. Three specific findings are described. These findings include the variations in nearshore turbidity; the detection of lake upwellings and the “Tahoe Wave”; and new revelations about the influence of climate change on the fate of stream water entering the lake.• The emerging threat to the aspens of the Tahoe basin posed by the white satin moth.• Lakes and other water bodies are sometimes the final resting place of vessels from a previous era. TERC students are actively searching for these wrecks using advanced technologies both at Tahoe and elsewhere. • The California Mountain Lake Observatory Network that monitors over 15 lakes throughout the Sierra Nevada. These data can be compared with the long-term Tahoe data. • Taking the lessons of Lake Tahoe global. What is learned at Tahoe is noticed and applied around the world. This is happening at the Poles and in northern Patagonia in Chile.

6.3
CURRENT DIRECTIONS
Tahoe: State of the Lake Report 2019
An Ecological Solution for Tahoe’s Clarity
In the 1960s, the California Department of Fish and Game (now California Department of Fish and Wildlife) introduced the non-native shrimp Mysis relicta to Lake Tahoe and Emerald Bay as a food source of intermediate size for the lake’s trout
population. Early TERC monitoring found that this introduction was an ecological tragedy. The Mysis would migrate vertically to the depths of the lake to avoid light during the day, and then rise to the surface at night where they would consume
native zooplankton, the trout’s natural food source. The net result was that the average trout size diminished and the two dominant zooplankton, Daphnia and Bosmina, largely disappeared from the Tahoe system.
From left to right: Mysis relicta, Bosmina, and Daphnia (not to scale).
6.4
CURRENT DIRECTIONS
Tahoe: State of the Lake Report 2019
An Ecological Solution for Tahoe’s Clarity, continued
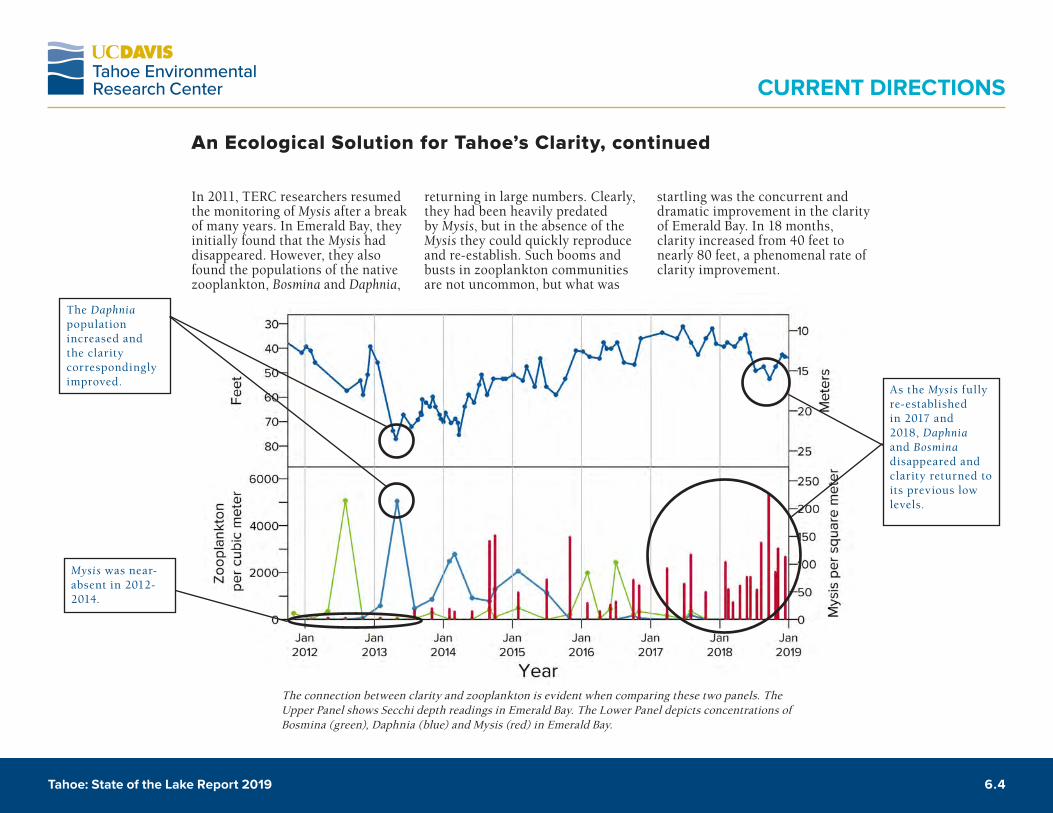
In 2011, TERC researchers resumed the monitoring of Mysis after a break of many years. In Emerald Bay, they initially found that the Mysis had disappeared. However, they also found the populations of the native zooplankton, Bosmina and Daphnia,
returning in large numbers. Clearly, they had been heavily predated by Mysis, but in the absence of the Mysis they could quickly reproduce and re-establish. Such booms and busts in zooplankton communities are not uncommon, but what was
startling was the concurrent and dramatic improvement in the clarity of Emerald Bay. In 18 months, clarity increased from 40 feet to nearly 80 feet, a phenomenal rate of clarity improvement.
The connection between clarity and zooplankton is evident when comparing these two panels. The Upper Panel shows Secchi depth readings in Emerald Bay. The Lower Panel depicts concentrations of Bosmina (green), Daphnia (blue) and Mysis (red) in Emerald Bay.
As the Mysis fully re-established in 2017 and 2018, Daphnia and Bosmina disappeared and clarity returned to its previous low levels.
The Daphnia population increased and the clarity correspondingly improved.
Mysis was near-absent in 2012-2014.

6.5
CURRENT DIRECTIONS
Tahoe: State of the Lake Report 2019
An Ecological Solution for Tahoe’s Clarity
These results demonstrate unambiguously that when the invasive Mysis shrimp is not present, native zooplankton can return and flourish, and when they do so the clarity rapidly improves to a level not seen in decades. Why does this occur? The native zooplankton have the ability to rapidly ingest small particles and either use them for growth, or excrete them as large fecal pellets. These small particles
include the tiny diatom (a type of single-celled algae), Cyclotella, which is currently considered the major climate change-induced threat to long-term clarity in Lake Tahoe (see 6.10). This raised an interesting possibility. Land-use practices and urbanization, which grew rapidly starting in the 1960s, are considered the major cause of clarity decline, and all efforts to restore clarity
have been directed at mitigating those impacts. The role that the introduction of Mysis had, which occurred at exactly the same time, has never been seriously considered. Could a program to remove Mysis rapidly improve the clarity of Lake Tahoe? As their removal ultimately results in a reduction of Cyclotella, could this be an ecological approach to “climate proof” Lake Tahoe’s clarity?
The Research Vessel John LeConte testing the Mysis trawl net in Lake Tahoe in 2018. Photo: B. Allen

6.6
CURRENT DIRECTIONS
Tahoe: State of the Lake Report 2019
An Ecological Solution for Tahoe’s Clarity
In 2016, a pilot project funded by the California Tahoe Conservancy and the Nevada Division of Environmental Protection sought to answer this question through a small-scale pilot project in Emerald Bay. Using a bio-acoustic echosounder, it was possible to locate the position of Mysis in Emerald Bay, quantify them, and remove them with a trawl net. Could Mysis populations be reduced to a level at which Daphnia and Bosmina could thrive?
With one year of the project remaining, the answer appears to be YES! With TERC’s research vessel, we can locate and remove Mysis, and also provide information on their distribution, size, and concentration in both Emerald Bay and Lake Tahoe. To better characterize the Mysis distribution in Lake Tahoe itself, we will use a miniaturized echosounder on our autonomous underwater vehicle.
We are currently designing a full-scale approach for Mysis removal and working on the commercialization of the Mysis catch. Collaboratively, a team from UNR is investigating the diets of Daphnia and Bosmina to corroborate that they are removing both fine particles and Cyclotella.
The distribution of Mysis in Emerald Bay on May 29, 2019. The gray depth contours are at 50 foot intervals.
The distribution of Mysis shrimp along a transect of Lake Tahoe on November 13, 2018. Note the patchiness of the Mysis distribution across the deep portion of the lake.

6.7
CURRENT DIRECTIONS
Tahoe: State of the Lake Report 2019
Future Climate Conditions
With support from the California Tahoe Conservancy, TERC has developed projections of future climate conditions and indicators specific to the Lake Tahoe Basin that serve as a resource to agencies and stakeholders. The projections are based on four General Circulation Models (GCMs) and two emission scenarios from the Intergovernmental Panel on Climate Change (IPCC) Assessment Reports. For the Lake Tahoe Basin, the GCM results were statistically
downscaled to an approximately 4-mile pixel size. Just two of the ICPP CO2 emission scenarios (RCPs) were used, as they were considered to span the range of currently plausible CO2 scenarios. RCP 4.5 is considered to be at the lower end of what we may experience, while RCP 8.5 is considered to be at the higher end. Temperature projections have the highest degree of certainty of any of the forecast climatic variables. The average of all 4 models’ maximum and minimum
annual air temperatures are shown through the end of the century for both RCP 4.5 and RCP 8.5. Under RCP 4.5, both minimum and maximum temperatures increase by 2-3°C (3.6-5.4 °F) from 2010 – 2100. Under RCP 8.5, minimum and maximum temperatures are projected to increase by more than 5°C (9 °F) (Figure on the right), with the shape of the curves indicating an accelerating warming rate.
Basin-wide averages of annual maximum daily (Red) and minimum daily temperature (Blue), for RCP 4.5 (left) and RCP 8.5 (right).

6.8
CURRENT DIRECTIONS
Tahoe: State of the Lake Report 2019
Future Climate Conditions, continued
Annual average and basin-wide averaging, while effective in showing the overall trends, don’t reveal the changes that are expected in different seasons. The figure (top right) shows average warming trends for average daily temperature by season under RCP 8.5. The warming rate is highest in the summer (1.2 °F/decade) and lowest in the winter (0.7 °F/decade). Total precipitation in the Lake Tahoe Basin is not expected to change significantly through 2100, however the fraction of snow and location of the snow level will change. The two figures (bottom right) shows the declining percent of precipitation falling as snow, averaged over the Lake Tahoe basin, under the two emissions scenarios.
Projected future percent of precipitation falling as snow in the Tahoe basin under (a) RCP 4.5 and (b) RCP 8.5.
Average daily temperature by season, 2000 – 2100, under RCP 8.5.

6.9
CURRENT DIRECTIONS
Tahoe: State of the Lake Report 2019
Future Climate Conditions, continued
In the Lake Tahoe Basin, little trend in runoff magnitude was observed under either scenario. However, the timing of runoff will change dramatically. Figure shows the shift in monthly runoff from mean of the modeled historic conditions to the mean of the 2070-2099 period, under RCP 4.5 and RCP 8.5. The month of maximum runoff shifts from
May to June under RCP 4.5, and to January under RCP 8.5. Under RCP 8.5, the negligible values of late summer flow will approach the time of year where we currently experience the highest flows. This phase alteration of the hydrology of the streams may have large ecological consequences. The average magnitude of peak
runoff for the historic data and projected data under RCP 8.5 are similar, although instantaneous flow rates are likely to increase significantly. The shift in runoff is most likely related to the transition from a snowfall to a rainfall regime, with an increase in rain-on-snow events.
Historic and projected timing of monthly runoff in the Tahoe basin. Note: the x-axis spans the water year; the first month of a water year is October.
Ave
rag
e M
onth
ly R
unof
f, m
m
Oct Dec Feb Apr Jun Jul Month of Water Year

6.10
CURRENT DIRECTIONS
Tahoe: State of the Lake Report 2019
Cyclotella gordonensis
The Role of Cyclotella in Lake Tahoe’s changing summer clarityOne of the known consequences of climate change is the warming of the surface of Lake Tahoe. As the lake water warms, it thermally stratifies, which reduces the natural action of the wind to stir the lake and keep algal cells suspended in the high light region of the lake. When stirring is reduced, algal cells will sink. Why is size important? On account of their smaller volumes, Cyclotella sink far slower than larger phytoplankton – up to 100-1000 times slower – allowing them uncontested access to the nutrients and light needed for growth. Also due to their small size (less than 4 micron or 0.1 thousandths of an inch in diameter), they scatter light and reduce the measured Secchi depth value, just like fine inorganic particles. In 2018, even though clarity had returned to its recent range, following the record low values of 2017, the impact of Cyclotella on summer clarity was abundantly clear as evident in the Figure right.
From late May through September, the low Secchi depth coincided with high abundance of Cyclotella. It is becoming very evident that the improvement in Tahoe’s summer time clarity is intimately linked to controlling the development of Cyclotella blooms.
Secchi depth measurements at the LTP station (pale blue dots) in 2018. The pie charts indicate the relative contribution of Cyclotella (dark green) to total phytoplankton assemblage smaller than 20 μm (excluding picoplankton smaller than 1 μm, chain forming algae, detritus and empty cells. Each pie chart represents the combination of algal counts from samples taken from 5 m (16.5 ft) and 20 m (66 ft) depth.
Size Really Does Matter

6.11
CURRENT DIRECTIONS
Tahoe: State of the Lake Report 2019
Three New Insights from the Nearshore Network
In 2014, TERC installed the first Nearshore Water Station at Homewood, California. Since then, an additional ten Stations have been added all around Lake Tahoe and in adjacent Cascade Lake. The idea was simple – work with property owners who have direct access to the lake, install underwater cables from their docks to an instrument located in seven feet of water, and monitor water quality every 30 seconds. The measurements provide the data needed to distinguish water quality around the lake. That has been achieved, but more importantly the data have revealed a new understanding of processes that occur lake-wide and in the nearshore. The following pages will highlight some of this new knowledge. We thank those who have financially supported this project and/or provided access to their docks, the Glenbrook Homeowners Association, and the Lahontan Regional Water Quality Control Board.
A Nearshore Station on the sandy bottom at Rubicon,
CA. Photo: B. Allen
The red dots indicate locations of Nearshore Stations around Lake Tahoe

6.12
CURRENT DIRECTIONS
Tahoe: State of the Lake Report 2019
The number of hours each year when sediment is
resuspended around Lake Tahoe’s shore.
Courtesy of D. Roberts
1. Predicting Sediment Resuspension in the NearshoreData from the stations allowed the establishment of the relationship between the water’s turbidity (cloudiness) and the measured wave height. Similarly, a relationship was developed between wind strength and wave height. Combining this information in our Wind-Wave model produced a tool for predicting turbidity at any point along Tahoe’s shore for any combination of wind speed and direction. We have learned that most of the east shore of Lake Tahoe exceeds turbidity standards over 40% of the time. This is not due to the inflow of any contaminants, but simply natural waves breaking on the downwind side of the lake and resuspending lake sediments. This new tool allows for a more informed discussion of what turbidity standards should be around the lake, that will both serve to protect the lake and not unduly restrict activities. The same forces that cause sediment resuspension and turbidity, also impact the algae attached to rocks around the lake. The wave-induced forces help to “slough” algae off the rocks. This information is forming part of our periphyton modeling. The boxed figure displays a typical wave height distribution for Lake Tahoe in response to the prevailing south-west winds.
Courtesy of D. Roberts and P. Moreno
Three New Insights from the Nearshore Network

6.13
CURRENT DIRECTIONS
Tahoe: State of the Lake Report 2019
2. Upwelling and the “Tahoe Wave”When strong winds blow across the surface of the lake, warm surface water gets blown downwind, typically warming the beaches on the east shore. At the same time, cold water rises up from the depths to replace this water, resulting in what is referred to as an upwelling.Under extreme wind conditions,
these upwellings can be as large as 600 feet high. As the cold water rises in the west it simultaneously brings up nutrients from deep in the lake, that can stimulate algal growth. The Nearshore Network has allowed us to readily see when these upwellings occur and their
magnitudes. Typically, with south-west winds, water temperatures drop suddenly on the west shore and rise on the east shore. As shown in the Nearshore station data below, temperature differences as large as 18 °F (10 °C) can occur within a few hours.
Three New Insights from the Nearshore Network
0
An upwelling at Lake Tahoe, as measured by an autonomous glider. Wind was generally from left to right. The figure shows a lake cross section with Homewood to the left and Glenbrook to the right. This upwelling has an amplitude of 160 ft. Courtesy of K. LeeTemperature (°C)
0 5 10 15Distance (west to east, km)
0
50
100
150
Depth (m)
5
6
7
8
9
1010
9
8
7
250
500
Tem
pera
ture
(°C
)
Dep
th (f
eet)
Distance (west to east, km)0 5 10 15
6 5
Temperature (°C)
0 5 10 15Distance (west to east, km)
0
50
100
150
Depth (m)
5
6
7
8
9
10

6.14
CURRENT DIRECTIONS
Tahoe: State of the Lake Report 2019
2. Upwelling and the “Tahoe Wave”, continuedThis happens numerous times in the spring (indicated by the boxed areas on the figure) when temperature stratification is small and less energy is required to move the lighter, warmed surface waters. To better understand this ubiquitous process, a multi-University experiment was conducted in 2018. A “curtain”
of temperature and velocity instruments were installed across the lake. What we found was truly remarkable. The first discovery was that the upwelling process itself occurred gradually and slowly built up energy on the east side of the lake.
Nearshore temperatures from Homewood (blue) and Glenbrook (red) show the magnitude and the frequency of upwelling events. Courtesy of D. Roberts
A chain of temperature and velocity instruments that was one of many used to compose a five-mile wide “curtain” of instruments stretching across Lake Tahoe. Photo: B. Allen
Three New Insights from the Nearshore Network

6.15
CURRENT DIRECTIONS
Tahoe: State of the Lake Report 2019
When the wind dropped, all that energy was released very suddenly, producing high velocity (2 ft/sec and larger) flows as the water rushed back across the lake. This returning water produced an even larger “downwelling” on the west shore. Most remarkable of all, is that the accumulation of warm water on the north-east shore simultaneously initiates a trapped internal wave (or Kelvin wave). Due to the earth’s rotation, this wave– the “Tahoe Wave”– is
forced to hug Tahoe’s shoreline as it travels counter-clockwise around the entire lake in a journey of 4-5 days. As the front of the wave moves by, it produces strong, jet-like currents along the coast. Once it passes, those currents are reversed. The role these currents have on nearshore water quality is still being studied.
Images from a computer simulation of a Kelvin wave traveling around Lake Tahoe following the upwelling of June 10-11, 2018. The colors show water temperature at a depth of 66 feet. The current velocities indicated by black arrows are shown in the nearshore region. The progress of the high velocity jet produced by the front of the wave is indicated with a blue circle. Courtesy of K. Lee
2. Upwelling and the “Tahoe Wave”, continuedThree New Insights from the Nearshore Network
10-Jun 07:00 10-Jun 15:00 11-Jun 11:00 12-Jun 4:00 12-Jun 22:00
0
5
10
15
Temperature (
°C)
051015
05/31 06/01 06/02 06/03 06/04 06/05 06/06 06/07 06/08 06/09 06/100
180
360
10-Jun07:00
Wind Speed
Wind Direction
3.22 m/s
220 °
0
5
10
15
Temperature (
°C)
051015
06/08 06/09 06/100
180
360
10-Jun15:00
Wind Speed
Wind Direction
0.39 m/s
168 °
0
5
10
15
Temperature (
°C)
051015
06/09 06/10 06/110
180
360
11-Jun11:00
Wind Speed
Wind Direction
2.24 m/s
257 °
0
5
10
15
Temperature (
°C)
051015
06/09 06/10 06/11 06/120
180
360
12-Jun04:00
Wind Speed
Wind Direction
0.75 m/s
233 °
0
5
10
15
Temperature (
°C)
051015
06/09 06/10 06/11 06/120
180
360
12-Jun22:00
Wind Speed
Wind Direction
0.94 m/s
225 °

6.16
CURRENT DIRECTIONS
Tahoe: State of the Lake Report 2019
3. Climate change and lake clarityThe changing climate has affected many aspects of Lake Tahoe. These changes raised the following key question: what effect could climate change have on clarity? The Nearshore Network is helping us address this question as well. The warming air temperatures have been decreasing the fraction of snow in our precipitation from 50%
to 30% over the last 100 years. It has also been advancing the timing of peak streamflow into the lake. At the same time, the lake has been warming and stratifying earlier. We have been able to explore the relationship between the snowpack, the lake’s temperature stratification, and the conditions of the streams as they enter the lake. The data are
showing two important trends: (1) As the annual snowpack decreases, more of the stream inflows enter the lake before thermal stratification; and (2) As the annual snowpack decreases more of the stream inflow is warmer relative to the lake and therefore buoyant or lighter than the lake’s surface water.
The relationship between snowpack size, the amount of inflow prior to lake stratification and the percentage of the streamflow that is lighter than the surface lake water. Courtesy of D. Roberts
Three New Insights from the Nearshore Network

6.17
CURRENT DIRECTIONS
Tahoe: State of the Lake Report 2019
3. Climate change and lake clarity, continued
Schematic showing the surface mixing of early and small snowmelt years into a homogeneous lake (left), compared with a late and large snowmelt plunging deeply into a thermally stratified lake. Courtesy of D. Roberts
The consequence of this is troubling. As the snowpack continues to decrease in the future, it would seem that there is an increasing tendency for
inflows not to plunge, but to mix into the surface water. This not only places nutrients high in the photic zone, encouraging algae to grow, but also introduces fine
particles above the historical Secchi disk depths. Both impacts have the potential to diminish clarity.
Three New Insights from the Nearshore Network

6.18
CURRENT DIRECTIONS
Tahoe: State of the Lake Report 2019
Heritage Aspens and the Threat of White Satin MothIn 2011, white satin moth (Leucoma salicis) was first detected in North Canyon within the Lake Tahoe Nevada State Park. The moth’s (caterpillar’s) preferred hosts are native aspen trees (Populus tremuloides). Since 2011, the moth has spread northward and southward. Currently, there are numerous aspens stands that are experiencing severe defoliation as a result of these moths. Some of these highly defoliated stands are in heritage sites that document the rich history of Basque sheepherding and resource management in the Lake Tahoe Basin. The TERC Forest and Conservation Biology team has been surveying stands around the Lake Tahoe Basin. Through this process they have identified the presence of the moth in a new location on the west shore– in the lower Blackwood Canyon area. We are quantifying levels of defoliation in aspen stands throughout the Lake Tahoe basin, as well as examining host chemistry which may be an indicator of white satin moth susceptibility or tolerance. Additionly, we will be developing early detection monitoring and conservation strategies for aspens in the basin.
Forest Health
The larval caterpillar stage of the white satin moth. Photo: A. Vanderpool
Photo: Marc Enders (Nevada Department of Wildlife)
An adult white satin moth. Photo: A. Toy
Basque tree carving on aspen in the Genoa/Montreal Canyon area. Photo: P. Maloney

6.19
CURRENT DIRECTIONS
Tahoe: State of the Lake Report 2019
On November 24, 1918, two French minesweepers, the Inkerman and the Cerisoles were lost in Lake Superior on their maiden voyages from Thunder Bay, Ontario. It is believed that they now lie 900-1000 feet below the surface. One hundred years later, researchers from TERC partnered with the University of Delaware and the Great Lakes Research Center at Michigan Technological University to use new sonar mapping techniques to try find their final resting places. Starting with a large search area of 150 square miles, the team managed to cover a quarter of the area in a week of mapping.
While they did not find the target wrecks, they did locate another previously undocumented wreck lying at a depth of 400 feet. Our current plan is to return to this site with a Remotely Operated Vehicle (ROV), to dive to the vessel, and to collect high definition images and videos of the wreck. Plans are also being made to use Autonomous Underwater Vehicles (AUVs) to map this site in greater detail. The experience gained on this mission will be put to good use in TERC’s plans to find the S.S. Meteor, which was scuttled in Lake Tahoe on April 21, 1939. We will also use an AUV with side scan sonar.
Our AUVs have also been used in a collaboration with the Royal Australian Navy (RAN) and the Australian Maritime College Search (AMCS). In 2017, TERC and AMCS started developing a training program for the RAN to use AUVs to detect underwater mines. Emerging underwater technologies are changing the way we conduct research in all types of aquatic environments. Lakes are ideal testing grounds as they provide conditions that are generally more benign to work in than the open ocean. Lake Tahoe is particularly well-suited as its great depth is representative of ocean conditions.
UCDavis and TERC student Micah Swann on R/V Agassiz ready to search for sunken ships in Lake Superior.
The Secrets Held in Lakes
The view from the classroom while deploying an AUV with the Royal Australian Navy in Lake St. Clair, Tasmania, Australia.
6.20
CURRENT DIRECTIONS
Tahoe: State of the Lake Report 2019
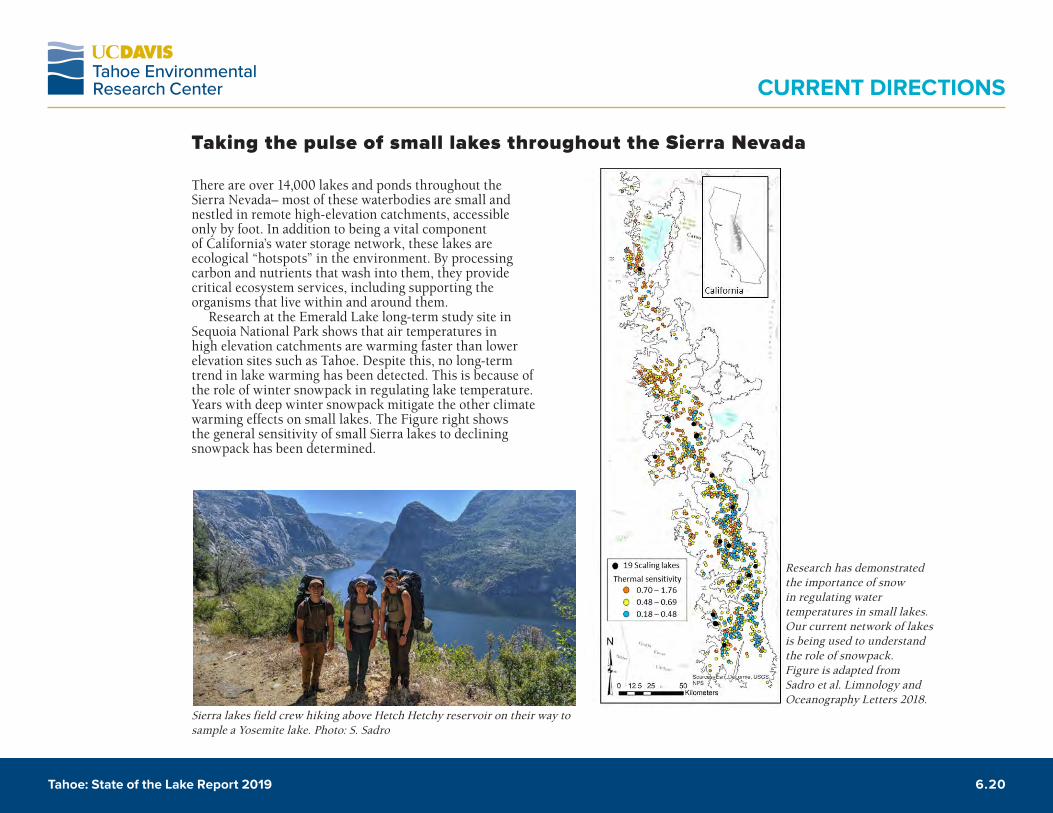
There are over 14,000 lakes and ponds throughout the Sierra Nevada– most of these waterbodies are small and nestled in remote high-elevation catchments, accessible only by foot. In addition to being a vital component of California’s water storage network, these lakes are ecological “hotspots” in the environment. By processing carbon and nutrients that wash into them, they provide critical ecosystem services, including supporting the organisms that live within and around them. Research at the Emerald Lake long-term study site in Sequoia National Park shows that air temperatures in high elevation catchments are warming faster than lower elevation sites such as Tahoe. Despite this, no long-term trend in lake warming has been detected. This is because of the role of winter snowpack in regulating lake temperature. Years with deep winter snowpack mitigate the other climate warming effects on small lakes. The Figure right shows the general sensitivity of small Sierra lakes to declining snowpack has been determined.
Taking the pulse of small lakes throughout the Sierra Nevada
Research has demonstrated the importance of snow in regulating water temperatures in small lakes. Our current network of lakes is being used to understand the role of snowpack. Figure is adapted from Sadro et al. Limnology and Oceanography Letters 2018.
Sierra lakes field crew hiking above Hetch Hetchy reservoir on their way to sample a Yosemite lake. Photo: S. Sadro

6.21
CURRENT DIRECTIONS
Tahoe: State of the Lake Report 2019
These results provided the inspiration for the California Mountain Lake Observatory Network– a network of over 15 lakes located throughout the mountain range, each instrumented with high-frequency sensors to measure temperature and other water quality parameters with the accuracy necessary to make stronger predictions. We chose lakes spanning gradients in all factors that are expected to modulate the effects of climate: latitude, elevation, lake size and depth, and local topographic relief. The network was initially deployed during the summer of 2017. Every summer since then, a field crew backpacks anywhere from 5 to 20 miles to reach each lake, spending 4-5 days at each site downloading instruments, conducting experiments, measuring the productivity of the nearshore and open water areas of the lake, and collecting water samples for water quality analysis. This research will help us understand the mechanisms through which climate affects the physical, chemical, and biological conditions of these lakes, and allow us to develop models to more accurately predict specific lake responses to climate change.
Benthic chambers measure productivity of the nearshore
sediments in a small Sierra Nevada lake in August 2018.
Photo: E. Suenaga
Taking the pulse of small lakes throughout the Sierra Nevada
Deployment of a mooring in a Yosemite lake. Photo: E. Suenaga

6.22
CURRENT DIRECTIONS
Tahoe: State of the Lake Report 2019
UC Davis and TERC are transferring the lessons and approaches that are being developed at home to the far corners of the world to address the big problems of our time. Current projects in Antartica, Canada, and Chile illustrate the global implications of Tahoe research.
A fragment of the Petermann Glacier melting in the Baffin Sea, Photo: Canadian High Arctic (2011).
TERC Globally
Lake Panguipulli nestled at the base of Volcan Shosheunco is in a state of rapid transition due to development pressures. Photo: G. Schladow

6.23
CURRENT DIRECTIONS
Tahoe: State of the Lake Report 2019
The cryosphere, the frozen parts of the Earth, is melting at an unprecedented rate. While the scientific community is trying to predict this rate, it has consistently underestimated how quickly these remote areas are changing. These changes have implications for global weather patterns, sea level rise, and ecosystem management. What causes large ice shelves to collapse? Researchers from UC Davis and TERC have partnered with the University of British Columbia and Carleton University to study the Milne Ice Shelf, the last remaining Canadian ice shelf in northern Ellesmere Island. In recent years, a subglacial channel has formed draining melted
freshwater out to the Arctic Ocean. To understand the heightened flow, we have adapted methods that we are using at Lake Tahoe, installing instruments in this channel to measure temperature, salinity and flow velocities throughout the year. Initial results are showing that the outflow underneath the ice shelf is occurring on a year-round basis, not just during the summer as initially hypothesized, and is melting the polar ice faster than initially expected. The same processes are believed to be occurring in Antarctica. To study them, a team from UCDavis and TERC, the École Polytéchnique Fédérale de Lausanne (Switzerland) and the Korean Polar Research
Institute (KOPRI) have mounted a special turbulence sensor on an underwater glider to go beneath the much larger Nansen Ice Shelf in Antarctica. This glider has been deployed in Lake Tahoe for the last 2 years. In the span of nine days, the glider completed a 50 mile return trip under the ice shelf, a location impossible to survey without this type of technology. This is the third time that our glider has been run under an Antarctic ice shelf; however, it was the first time in which we measured turbulence. These new measurements will contribute to a better physical understanding of the causes of accelerated polar melting.
Installing instruments in the subglacial channel on the Milne Ice. Photo: J. McInerney
Calibrating the glider compass at Jang Bogo Station, Antarctica. Photo: J. McInerney
Melting of Polar IceTERC Globally

6.24
CURRENT DIRECTIONS
Tahoe: State of the Lake Report 2019
The symbiotic relationship that has evolved over 50 years between Tahoe management agencies and scientists often goes unnoticed at home. But around the world, Lake Tahoe is seen as a shining example of how lake management has been informed and guided by science. Chile, a country that is geographically very similar to California, is recognizing that its pristine northern Patagonia lakes are now prone to the risk of increased development and visitation, the same challenge that Tahoe faced over 50 years ago. Building on Tahoe’s lesson, they are looking to partner and to rapidly transfer the knowledge acquired at
Tahoe and apply it in Chile. TERC, along with the Tahoe Regional Planning Agency and the League to Save Lake Tahoe, are engaged in bringing “the Tahoe Process” to the northern Patagonia lakes. Through a newly formed Foundation, Chile Lagos Limpios (“Chile Clean Lakes”), we are bringing the concept of research informing government and stakeholder action to Chile. A consortium of Chilean universities, as well as local and national stakeholders, are also part of the endeavor. The first monitoring station was installed at Lake Panguipulli by
TERC in December 2018. Another nine lakes will also be outfitted with instrumentation in 2019. The data from these instruments, along with data from frequent water quality sampling, will accomplish two things. First, it will be the initiation of a long-term data set, that will help evaluate how each lake is changing and the underlying causes. Second, it will permit the development of new predictive models that will enable Chilean agencies to understand the impacts of management practices and the future impact of factors such as climate change on the lakes.
Lake Panguipulli, the first northern Patagonia lake that has been instrumented. Photo: G. Schladow
Managing the Lakes of Northern Patagonia, ChileTERC Globally
Installation of the first monitoring station at Lake Panguipulli. Photo: D. Middlebrook)

7Tahoe: State of the Lake Report 2019TAHOE.UCDAVIS.EDU 7
METEOROLOGY
tahoe.ucdavis.edu
TAHOE:STATE OF THE LAKE REPORT2019

7.1
METEOROLOGY
Tahoe: State of the Lake Report 2019
Air temperature - smoothed daily maximum and minimumDaily since 1911
Over the last 107 years, daily air temperatures measured at Tahoe City have increased. The long-term trend in average daily minimum temperature (bottom figure) has increased by 4.43 °F (2.46 °C), and the long-term trend
in average daily maximum temperature (upper figure) has risen by 2.25 °F (1.25 °C). The trend line for the minimum air temperature now exceeds the freezing temperature of water, which is leading to more rain and less snow as well as earlier
snowmelt at Lake Tahoe. These data have been smoothed by using a two-year running average to remove daily and seasonal fluctuations. Data source: the long-term NOAA daily maximum and minimum temperatures data set.
(° )
( ° )

7.2
METEOROLOGY
Tahoe: State of the Lake Report 2019
Air temperature - annual average maximum and minimumSince 1910
(° )
( ° )
Annual average maximum (upper figure) and minimum (lower figure) air temperatures in 2018 were both well above the long-term average (dashed line). The 2018 annual average minimum
was 32.7 °F (0.4 °C) almost unchanged from the previous year. The maximum temperature was 58.2 °F (14.6 °C) an increase of 1.1 °F over the previous year. The long-term means for the minimum
and the maximum are 30.3 °F (-0.96 °C) and 56.4 °F (13.6 °C), respectively. Data source: the long-term NOAA daily maximum and minimum temperatures data set.

7.3
METEOROLOGY
Tahoe: State of the Lake Report 2019
Below-freezing air temperaturesYearly since 1910
The method used for this analysis sums the number of days with daily average temperatures below freezing between December 1 and March 31 for each Water Year (WY). Although year-to-year variability is high, the number of days
when air temperatures averaged below freezing has declined by about 30 days since 1911. In WY 2018, the number of freezing days was 45, slightly below the declining long-term trend-line.
Data source: the long-term NOAA daily maximum and minimum temperatures data set.
Note: The Water Year extends from October 1 through September 30.
7.4
METEOROLOGY
Tahoe: State of the Lake Report 2019
Monthly air temperatureSince 1910
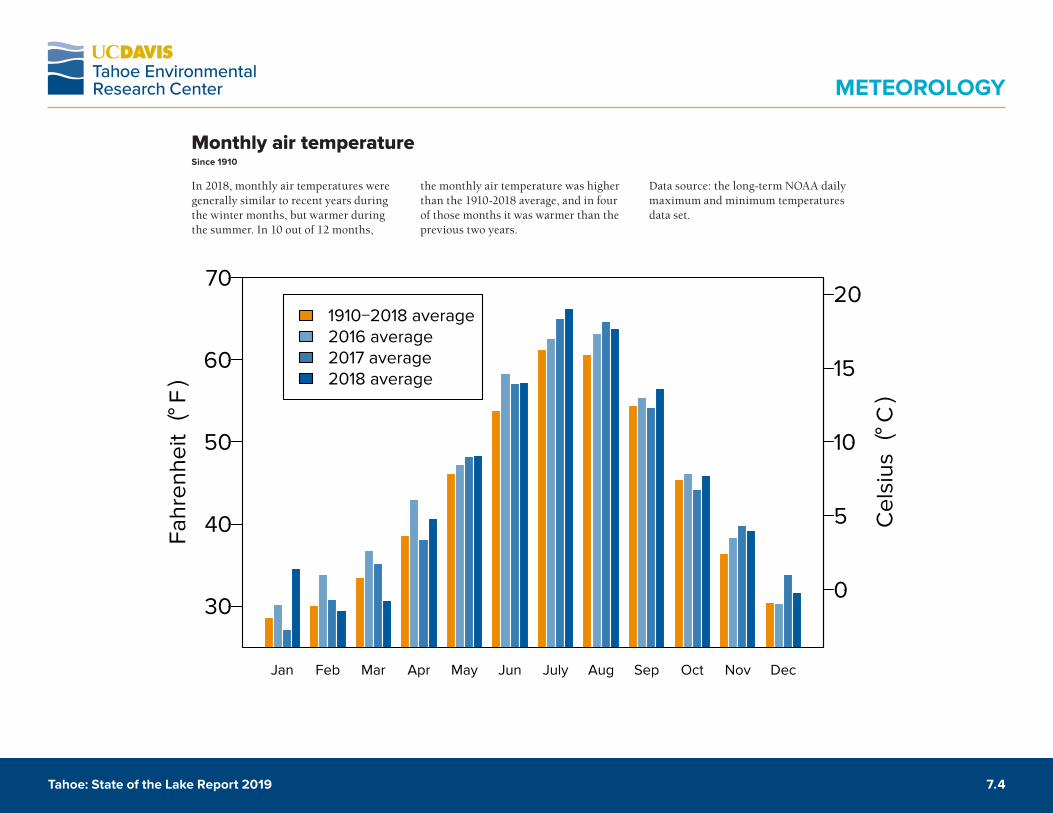
In 2018, monthly air temperatures were generally similar to recent years during the winter months, but warmer during the summer. In 10 out of 12 months,
the monthly air temperature was higher than the 1910-2018 average, and in four of those months it was warmer than the previous two years.
Data source: the long-term NOAA daily maximum and minimum temperatures data set.
(° )
( ° )

7.5
METEOROLOGY
Tahoe: State of the Lake Report 2019
Annual precipitationYearly since 1910
From 1910 to 2018, average annual precipitation (water equivalent of rain and snow) at Tahoe City was 31.6 inches. The maximum was 69.2 inches in 1982. The minimum was 9.2 inches in 1977. 2018 was very close to the long-term average,
with 32.0 inches, following the previous very wet year. The long-term average is shown by the dashed line. Generally, there is a gradient in precipitation from west to east across Lake Tahoe, with almost twice as much precipitation falling on the west
side of the lake. Precipitation is summed over the Water Year, which extends from October 1 through September 30. Data source: the long-term NOAA daily precipitation data set.

7.6
METEOROLOGY
Tahoe: State of the Lake Report 2019
Monthly precipitation 2016, 2017, 2018 and 1910 to 2018
2018 was close to the long-term average in total precipitation at 32.0 inches over the Water Year, compared with the long-term average of 31.6 inches. Monthly precipitation was above the long-term
average in only four months of the year. The monthly precipitation for November, March and May were particularly high precipitation months. Months with more than 25 percent of data missing are
omitted from the figure below. The 2018 Water Year extended from October 1, 2017 through September 30, 2018. Data source: the long-term NOAA daily precipitation data set.

7.7
METEOROLOGY
Tahoe: State of the Lake Report 2019
Snow as a fraction of annual precipitationYearly since 1910
Snow has declined as a fraction of total precipitation, from an average of 52 percent in 1910 to 32 percent in present times, according to the line of best fit. In Tahoe City, snow represented 31.5 percent of the 2018 total precipitation,
almost an identical fraction to the previous high precipitation year. These data are calculated based on the assumption that precipitation falls as snow whenever the average daily temperature (the average of the daily maximum and minimum
temperatures) is below-freezing. (Precipitation is summed over the Water Year, which extends from October 1 through September 30.) Data source: long-term NOAA daily air temperature and precipitation data sets.

7.8
METEOROLOGY
Tahoe: State of the Lake Report 2019
April snowpack Since 1916
The depth of the snowpack is measured at multiple locations throughout the Sierra over the year. Shown here are the readings taken on approximately April 1 since 1916 at the Lake Lucille Snow Course Station (located in Desolation Wilderness, elevation 8,188 feet (Lat. 38.86, Long.
-120.11). Note: April snow depth data are not available for 1917 and 1989. The snow depth on March 29, 2018 was 121 inches, a very average year. The value on March 29, 2019 was 198 inches, indicative of the very wet winter. The highest value on record is 267 inches on April 5, 1983. The average
snow depth over the period 1916-2019 was 142.9 inches as shown by the dashed line.
Data source: USDA Natural Resources Conservation Service, California Monthly Snow Data.

7.9
METEOROLOGY
Tahoe: State of the Lake Report 2019
Daily solar radiationIn 2018
Solar radiation showed the typical annual pattern of increasing then decreasing sunlight, peaking at the summer solstice on June 21 or 22. Dips in daily solar radiation are due primarily to
clouds. Smoke and other atmospheric constituents play a smaller role. It is noteworthy that solar radiation on a clear day in mid-winter can exceed that of a cloudy day in mid-summer. The TERC
meteorological station where these data are collected is located on the U.S. Coast Guard dock at Tahoe City.

8
PHYSICAL PROPERTIES
tahoe.ucdavis.edu
TAHOE:STATE OF THE LAKE REPORT2019

8.1
PHYSICAL PROPERTIES
Tahoe: State of the Lake Report 2019
Lake surface levelDaily since 1900
Lake surface level varies throughout the year. Lake level rises due to high stream inflow, groundwater inflow, and precipitation directly onto the lake surface. It falls due to evaporation, in-basin water withdrawals, groundwater outflows, and outflow via the Truckee River at Tahoe
City. Overall, lake level fell over 13 inches during 2018. The highest lake level was 6229.03 feet on June 5, and the lowest was 6226.68 feet on December 31. The natural rim of the lake is at an elevation of 6223 feet. Lake Tahoe was above its rim for the entire year. When the lake is below its
rim, outflow via the Truckee River ceases. Several episodes of lake level falling below the natural rim are evident in the last 114 years. The frequency of such episodes appears to be increasing. Data source: US Geological Survey level recorder at Tahoe City.

8.2
PHYSICAL PROPERTIES
Tahoe: State of the Lake Report 2019
Lake surface level, continued Daily since 2016
Displayed below is the lake surface data for three years from 2016-2018 extracted from the same data on page 8.1. This more time restricted presentation of recent lake level data allows us to see the annual
patterns of rising and falling lake level in greater detail. Data clearly show the lake level falling below the natural rim in 2016 and the rapid rise in lake level that has been maintained in 2017 and 2018.

8.3
PHYSICAL PROPERTIES
Tahoe: State of the Lake Report 2019
(° )
Water temperature profileIn 2018
Water temperature profiles are measured in the lake using a Seabird CTD (conductivity, temperature, depth) profiler at the times indicated by the dashed vertical lines. The temperature is accurate to within 0.005 °F. Water temperature distribution is important, as
it represents lake density, with warmer, lighter water trapped at the surface during the summer months. Here the temperature in the upper 220 feet (70 m) is displayed as a color contour plot. In 2018, the lake temperature followed a typical seasonal pattern. In February-
March, the lake surface was at its coldest, while it was at its warmest in August. The deepening of the warm water zone toward the end of the year is the result of winter mixing, a process that is important in bringing oxygen to the deeper parts of the lake.

8.4
PHYSICAL PROPERTIES
Tahoe: State of the Lake Report 2019
(° )
(° )
Average water temperatureSince 1970
The trend in the volume-averaged temperature of Lake Tahoe (dashed line) has increased by approximately 0.95 °F since 1970. The annual rate of warming is 0.020 °F/year (0.011 °C/year). The monthly
temperature profile data from the top to the bottom of the lake has been smoothed and seasonal influences removed to best show the long-term trend. Up until the late 1990s the warming rate was high,
but a high number of deep mixing years between 1997 and 2011 caused the lake temperature to cool.

8.5
PHYSICAL PROPERTIES
Tahoe: State of the Lake Report 2019
(° )
(° )
Annual average water temperatureSince 1970
The volume-averaged temperature of the lake for each year since 1970 is shown. In 2018, the volume-averaged temperature decreased by 0.05 °F (0.03 °C) over the previous year. In the last 4 years the lake
has cooled slightly from its warmest year in 2015. Since 1970, the trend in annual temperature rise (dashed line) has increased by 0.94 °F.

8.6
PHYSICAL PROPERTIES
Tahoe: State of the Lake Report 2019
( ° )
( ° )
Surface water temperatureYearly since 1968
Surface water temperatures have been recorded monthly at the Mid-lake and Index stations since 1968 from the R/V John LeConte and the R/V Bob Richards. Despite year-to-year variability,
the annual average surface water temperatures show an increasing trend. The average temperature in 1968 was 50.3 °F (10.2 °C). For 2018, the average surface water temperature was 53.19 °F (11.8
°C). This is the second warmest surface temperature year recorded since 1968. The overall rate of warming of the lake surface is 0.038 °F (0.021 °C) per year.

8.7
PHYSICAL PROPERTIES
Tahoe: State of the Lake Report 2019
(° )
( ° )
Maximum daily surface water temperatureSurface temperature measured since 1999 every 2 minutes
The maximum daily summer surface water temperature in 2018 was one of the highest observed since continuous (every 2 min.) data collection commenced in 1999. The highest maximum daily surface
water temperature (summer) was 77.5 °F, which was recorded on August 6, 2018. The lowest maximum daily surface water temperature (winter) was 41.9 °F, which was recorded on March 16, 2018. These
data are collected in real-time by NASA-JPL and UC Davis from 4 buoys located over the deepest parts of the lake.

8.8
PHYSICAL PROPERTIES
Tahoe: State of the Lake Report 2019
(° )
( ° )
July average surface water temperatureMeasured since 1999 every 2 minutes
Since 1999, surface water temperature has been recorded every two minutes from four NASA/UC Davis buoys. Shown here are 18 years of average surface water
temperatures in the month of July when water temperatures are typically warmest. In 2018, July surface water temperature averaged 67.3 °F, the third warmest July
on record. The warmest July temperatures were 67.9 °F in 2006. The average July surface water temperature for the 18-year period is 65.1 °F.

8.9
PHYSICAL PROPERTIES
Tahoe: State of the Lake Report 2019
Deep water temperatureMonthly since 1970
The water temperature at a depth of 1,320 feet (400 m) is indicative of conditions in the deeper waters (hypolimnion) of Lake Tahoe. Since 1970, the deep water temperature has increased by 1.19 °F (0.66 °C), at an annual rate of 0.025 °F/yr
(0.014 °C/yr), a rate of warming that is less than that of the surface water. This increase has not been steady but is punctuated by occasional drops in temperature (highlighted with dashed vertical lines). These coincide with times when the lake
completely mixes to the bottom, an event which allows a huge amount of heat to escape from the lake. The short spikes of temperature increase are temporary effects caused by the motions of internal waves.
(° )
(° )
8.10
PHYSICAL PROPERTIES
Tahoe: State of the Lake Report 2019
Depth of mixingYearly since 1973
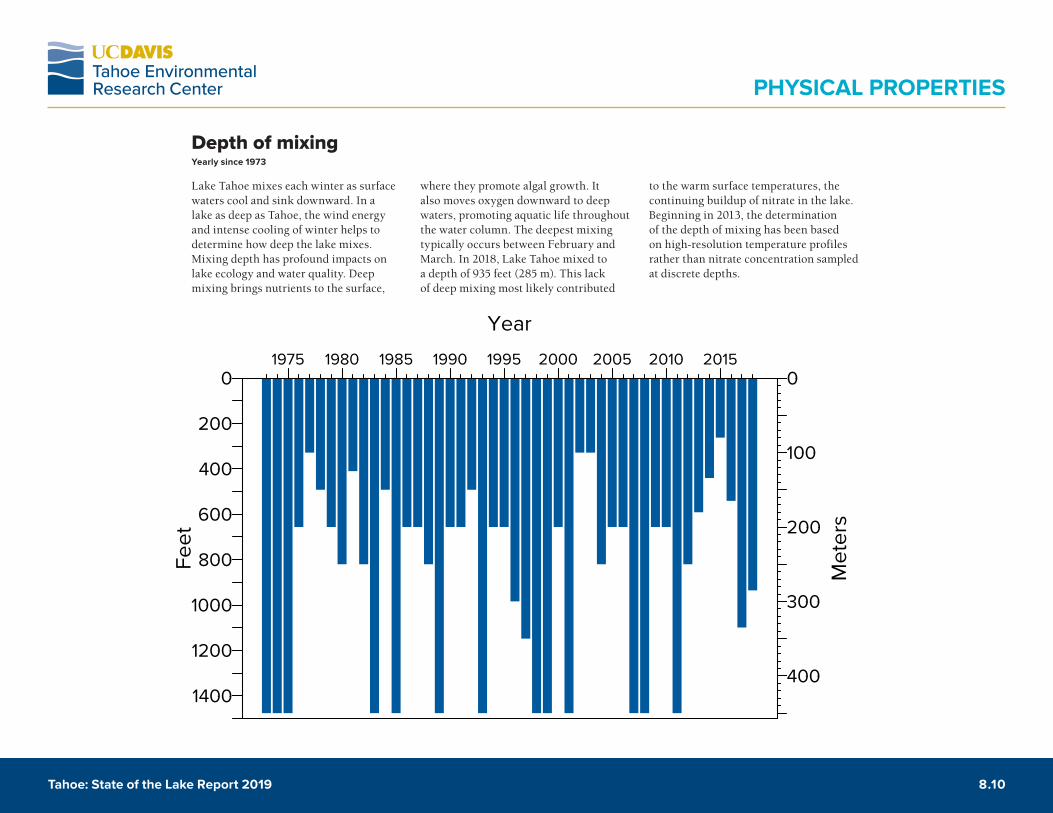
Lake Tahoe mixes each winter as surface waters cool and sink downward. In a lake as deep as Tahoe, the wind energy and intense cooling of winter helps to determine how deep the lake mixes. Mixing depth has profound impacts on lake ecology and water quality. Deep mixing brings nutrients to the surface,
where they promote algal growth. It also moves oxygen downward to deep waters, promoting aquatic life throughout the water column. The deepest mixing typically occurs between February and March. In 2018, Lake Tahoe mixed to a depth of 935 feet (285 m). This lack of deep mixing most likely contributed
to the warm surface temperatures, the continuing buildup of nitrate in the lake. Beginning in 2013, the determination of the depth of mixing has been based on high-resolution temperature profiles rather than nitrate concentration sampled at discrete depths.

8.11
PHYSICAL PROPERTIES
Tahoe: State of the Lake Report 2019
Lake stabilitySince 1968
When the lake has a vertical distribution of temperature, it has a corresponding density distribution, with warm and lighter water at the surface, and colder, denser water at depth. The stability index is a measure of the energy required to fully mix the water column when its
density is stratified. The average stability index for the upper 330 feet (100 m) of Lake Tahoe is plotted for the period of May through October each year. The values are derived from temperature profiles taken at the Index Station at approximately 10-20 day intervals. There
has been an overall increase in lake stability by over 10% in the last 50 years. In 2017 and 2018, the stability of the lake was at close to the highest vales on record.

8.12
PHYSICAL PROPERTIES
Tahoe: State of the Lake Report 2019
Stratified season lengthSince 1968
The stability index, a measure of the energy required to fully mix the lake, can be evaluated for every day of the year. We define the stratification season as the length of time when the stratification
index exceeds a value of 600 kilograms per square meter. Since 1968, the length of the stratification season has increased, albeit with considerable year-to-year variation. Overall, the stratification
season has lengthened by 29 days. In 2018, the length of the stratified season was 209 days.

8.13
PHYSICAL PROPERTIES
Tahoe: State of the Lake Report 2019
Beginning of the stratification season Since 1968
The amount of time that Lake Tahoe is stratified has been lengthening since 1968. One reason for this is the increasingly early arrival of spring as
evidenced by the earlier commencement of stratification. Stratification occurs approximately 12 days earlier than it did in 1968. The commencement of the
stratification season is typically in late May or early June. In 2018, stratification began on Day 135 (May 15).

8.14
PHYSICAL PROPERTIES
Tahoe: State of the Lake Report 2019
End of stratification season Since 1968
The amount of time that Lake Tahoe is stratified has lengthened since 1968 by almost a month. The end of stratification appears to have been extended by approximately 17 days on average. In
other words, the fall season for the lake has been considerably extended. In the late 1960’s stratification ended in mid-November. Now it often ends in December. In 2018, stratification ended
on Day 334 (December 10) This has important implications for lake mixing and water quality, such as the buildup of nitrate at the bottom of the lake.

8.15
PHYSICAL PROPERTIES
Tahoe: State of the Lake Report 2019
Peak of stratification season Since 1968
The day of the year when lake stratification reaches its maximum value has been plotted. There is considerable year-to-year variation, but over time there
has been only a slight advancement in when the peak occurs. In 2018, the peak occurred on August 29.

8.16
PHYSICAL PROPERTIES
Tahoe: State of the Lake Report 2019
Onset of snowmelt pulse Yearly since 1961
Although the date on which snowmelt commences varies from year to year, since 1961 it has shifted earlier an average of almost 18 days. The snowmelt pulse is calculated for five streams – the Upper Truckee River, Trout Creek, Ward Creek,
Blackwood Creek and Third Creek, and the results averaged This shift is statistically significant and is one effect of climate change at Lake Tahoe. In 2018, the average peak snowmelt occurred on March 23. The onset of the pulse is
calculated as the day when flow exceeds the mean flow for the period Jan. 1 to Jul 15. In the past, we used the peak of the stream hydrograph to estimate this property.

9
NUTRIENTS AND PARTICLES
tahoe.ucdavis.edu
TAHOE:STATE OF THE LAKE REPORT2019

9.1
NUTRIENTS AND PARTICLES
Tahoe: State of the Lake Report 2019
Sources of clarity-reducing and blueness-reducing pollutantsIn 2018
Research has quantified the primary sources of nutrients (nitrogen and phosphorus) and particulate material that are causing Lake Tahoe to lose clarity and blueness in its upper waters. One of the major contributors to clarity decline are extremely fine particles in stormwater that originate from the urban watershed (67 percent), even though these areas cover only 10 percent of the basin’s land
area. Part of the atmospheric particle load is from these urbanized areas. For nitrogen, atmospheric deposition is the major source (57 percent). Phosphorus is primarily introduced by the urban (18 percent) and non-urban (47 percent) watersheds. These categories of pollutant sources form the basis of a strategy to restore Lake Tahoe’s open-water clarity by agencies including the Lahontan
Regional Water Quality Control Board, the Nevada Division of Environmental Protection, and the Tahoe Regional Planning Agency. Data were originally generated for the Lake Tahoe TMDL Program. These results are revised from the original estimates as they are based on a longer time series of monitoring data.

9.2
NUTRIENTS AND PARTICLES
Tahoe: State of the Lake Report 2019
Pollutant loads from seven watershedsIn 2018
The Lake Tahoe Interagency Monitoring Program (LTIMP) measures nutrient and sediment input from seven of the 63 watershed streams – a reduction of three streams since 2011. The vast majority of
stream phosphorus and nitrogen comes from the Upper Truckee River, Trout Creek, Blackwood Creek and Ward Creek. The LTIMP stream water quality program is supported by the U.S. Geological Survey
in Carson City, Nevada, UC Davis TERC, the California Tahoe Conservancy, the Lahontan Regional Water Quality Control Board, and the Tahoe Regional Planning Agency.

9.3
NUTRIENTS AND PARTICLES
Tahoe: State of the Lake Report 2019
Nitrogen contribution by Upper Truckee RiverYearly since 1989
Nitrogen (N) is important because, it along with phosphorus (P), stimulates algal growth. The Upper Truckee River is the largest of the 63 streams that flow into Lake Tahoe, contributing about 25 percent of the inflowing water. The river’s contribution of dissolved nitrate and the
remainder of the total nitrogen load are shown here. The year-to-year variations primarily reflect changes in precipitation. For example, 1994 had 16.6 inches of precipitation and a low nitrogen load of 4.6 MT, while 2017 had 68.9 inches of precipitation and a very high nitrogen
load of 59.5 MT. 2018 had 32.0 inches of precipitation, and a total nitrogen load of 25.1 MT. The long-term mean nitrogen load is 14.9 MT/yr. (One metric ton (MT) = 2,205 pounds.)

9.4
NUTRIENTS AND PARTICLES
Tahoe: State of the Lake Report 2019
Phosphorus contribution by Upper Truckee RiverYearly since 1989
Soluble reactive phosphorus (SRP) is that fraction of phosphorus immediately available for algal growth. As with nitrogen (Fig. 9.3), the year-to-year variation in load largely reflects the changes in precipitation. Above average
precipitation in 2018 resulted in a Total Phosphorus level of 3.52 MT and a SRP load of 0.63 MT. These compare with the long-term averages of 2.44 and 0.37 MT respectively. Decreasing nutrient inputs is fundamental to restoring Lake Tahoe’s
iconic blueness. Total phosphorus is the sum of SRP and other phosphorus, which includes organic phosphorus and phosphorus associated with particles. (One metric ton (MT) = 2,205 pounds.)

9.5
NUTRIENTS AND PARTICLES
Tahoe: State of the Lake Report 2019
Suspended sediment contribution by Upper Truckee RiverYearly since 1989
The load of total suspended sediment delivered to the lake by the Upper Truckee River is related to landscape conditions and erosion as well as to precipitation and stream flow. Inter-annual variation in sediment load over shorter time scales is more related to
the latter. Plans to restore lake clarity emphasize reducing loads of very fine suspended sediment (less than 20 microns in diameter) from urbanized areas. Efforts to restore natural stream function and watershed condition focus on reducing loads of total sediment
regardless of size, as well as restoration of habitat for plants and wildlife. In 2018, the suspended sediment load from the Upper Truckee River was 1,807 MT. The highest load ever recorded was 6,100 MT in 2006. The average annual load is 2,430 MT.

9.6
NUTRIENTS AND PARTICLES
Tahoe: State of the Lake Report 2019
Lake nitrate concentrationYearly since 1980
Up through 2012, the volume-weighted annual average concentration of nitrate-nitrogen has remained relatively constant, ranging between 13 and 19 micrograms per liter. Since that time, however, the lake’s nitrate concentration
has been increasing. In 2018, the volume-weighted annual average concentration of nitrate-nitrogen was 20.9 micrograms per liter, the highest value on record. This high value is in part due to the seventh successive year in which deep mixing did
not take place, allowing for a continued buildup of nitrate in the deep water. The average annual concentration is 16.8 micrograms per liter. Water samples are taken at the MLTP (mid-lake) station at 13 depths from the surface to 450 meters.

9.7
NUTRIENTS AND PARTICLES
Tahoe: State of the Lake Report 2019
Lake phosphorus concentrationYearly since 1980
Phosphorus naturally occurs in Tahoe Basin soils and enters the lake from soil disturbance and erosion. Total hydrolyzable phosphorus, or THP, is a measure of the fraction of phosphorus that algae can use to grow. It is similar
to the SRP that is measured in the streams. Since 1980, THP has tended to decline, although in the last nine years the values have been increasing toward levels that were present in the 1980s. In 2018, the volume-weighted annual
average concentration of THP was 3.0 micrograms per liter. Water samples are taken at the MLTP (mid-lake) station at 13 depths from the surface to 450 meters.

9.8
NUTRIENTS AND PARTICLES
Tahoe: State of the Lake Report 2019
Nitrate distributionIn 2018
Water samples are collected approximately every month (on dates indicated by the dashed lines) at 13 depths (indicated by the dots) at the middle of the lake, and analyzed in the TERC laboratory for nutrient concentrations. Here the nitrate concentration is shown in the form of color contours. Most evident is the vertical distribution
of nitrate. Concentrations below a depth of about 350 feet are generally elevated. The surface waters, where there is sunlight to enable algae to grow, usually have low concentrations of nitrate. Although most of the nitrate enters at the surface through atmospheric deposition, it is rapidly taken up by the algae and surface concentrations are generally low. As algae sink and
decompose, the nitrate they consumed reappears deep in the lake. At these depths, however, there is insufficient light for algae to grow and use these nutrients. Deep lake mixing will bring the deep nitrate back to the surface. 2018 was a year with only partial mixing, and so most of the nitrate remained trapped in the deep water.
-
μg

9.9
NUTRIENTS AND PARTICLES
Tahoe: State of the Lake Report 2019
Orthophosphate distributionIn 2018
Water samples are collected approximately every month (on dates indicated by the dashed lines) at 13 depths (indicated by the dots) at the middle of the lake, and analyzed in the TERC laboratory for nutrient concentrations. Here the total hydrolyzable phosphorus (THP)
concentration (the fraction of phosphorus that can be readily used by algae) is shown in the form of color contours. Phosphorus mainly enters the lake in association with fine particles during runoff events. The higher values near the surface in spring and summer suggest
that in 2018 nitrogen was the nutrient that limited algal growth. The high concentrations of phosphorus deep in the lake during summer are the result of algae sinking and then decomposing. Eventually the THP attaches to particles and settles to the lake bottom.

9.10
NUTRIENTS AND PARTICLES
Tahoe: State of the Lake Report 2019
Fine particle distributionIn 2018
Water samples are collected approximately monthly (on dates indicated by the dashed lines) at 13 depths (indicated by the dots) at the middle of the lake, and analyzed in the TERC laboratory for the concentration of fine particles in 15 different bin sizes. Here the distributions of the finest
particles (in the range of 0.5 to 8 microns) are shown in the form of color contours. Clearly evident is that the highest concentrations of fine particles (orange tones) are concentrated in the upper part of the lake. In March (winter), when mixing is at its peak, clarity is generally greatest, as the surface concentration of
particles is the lowest due to mixing and dilution. The particle concentration is highest in May, July and August, which coincides with the annual variation in Secchi depth this year. The fine particles gradually clump together (aggregate) and allows them to more rapidly settle to the lake sediments at the bottom.
Log
Num
ber o
f par
ticle
s (<
16 M
icro
met
ers)
per
mill
ilite
r

10
BIOLOGY
tahoe.ucdavis.edu
TAHOE:STATE OF THE LAKE REPORT2019

10.1
BIOLOGY
Tahoe: State of the Lake Report 2019
Algae growth (primary productivity)Yearly since 1959
Primary productivity is a measure of the rate at which algae produce biomass through photosynthesis. It was first measured at Lake Tahoe in 1959 and has been continuously measured since
1968. Supported by nutrient loading into the lake, changes in the underwater light environment, and a succession of algal species, the trend shows primary productivity has increased substantially
over time. In 2017, there was an increase in primary productivity to 237.2 grams of carbon per square meter.*
*Please note: 2017 data show, data for 2018 currently not available
Car
bon,
gra
ms
per s
quar
e m
eter

10.2
BIOLOGY
Tahoe: State of the Lake Report 2019
Algae abundanceYearly since 1984
Algae (phytoplankton) are the base of the Lake Tahoe food web, and essential for lake health and the well-being of the entire ecosystem. The amount or biomass of free-floating algae in the water is determined by extracting
and measuring the concentration of chlorophyll-a, a photosynthetic pigment that allows plants to convert energy from the sun. Though the value varies annually, it has shown remarkable consistency over the last 30 years. The
average annual concentration for 2018 was 0.65 micrograms per liter. For the period of 1984-2018 the average annual chlorophyll-a concentration in Lake Tahoe was 0.70 micrograms per liter.
Mic
rogr
ams
per l
iter

10.3
BIOLOGY
Tahoe: State of the Lake Report 2019
m-
Chlorophyll-a distributionIn 2018
The distribution of algae (measured as chlorophyll-a) is the result of a combination of light availability, nutrient availability, mixing processes, and to a lesser extent, water temperature. This figure shows color contours of chlorophyll-a concentration down to a depth of 350 feet. Below this depth chlorophyll-a concentrations are near zero due to the absence of light. Lake Tahoe has a “deep chlorophyll maximum”
in the summer that occupies the range of 150-300 feet in the water column. In that depth range, the light and nutrient conditions are most favorable for algal growth. With the onset of thermal stratification in spring, the majority of the algae were confined to a discrete band. The time of maximum chlorophyll-a concentration was during late June, and centered at a depth of 150-200 feet. Later in
the year concentrations decreased as nutrients were depleted. In November and December, the commencement of mixing again redistributed the algae over a broader depth range. Note that the Cyclotella gordonesis at the surface have a very small chlorophyll expression. However, the large number of these tiny cells are what matters.
Chl
orop
hyll-
a (μ
g L-1
)
Dep
th (F
eet)

10.4
BIOLOGY
Tahoe: State of the Lake Report 2019
Annual distribution of algal groupsYearly since 1982
The amount of algal cells from different groups varies from year to year. Diatoms are the most common type of alga, comprising approximately 50 percent of the total abundance of algal cells in 2018. Green algae, Cryptomonads,
and Chrysophytes are next, each comprising less than 15 percent of the total. Interestingly, over the last 4 years, there has been an increase in the total fraction of “minor” algal groups. While the proportion of the major algal groups
show a degree of consistency from year-to-year, TERC research has shown that the composition of individual species within the major groups is changing both seasonally and annually, in response to lake conditions.
SOTL 2019 – 10.4
BIOLOGY
Annual Distribution of Algal GroupsYearly since 1982
1982
198
4
198
6
1988
199
0
1992
1994
1996
1998
200
0
2002
2004
200
6
200
8
2010
201
2
201
4
2016
201
8
0
20
40
60
80
100
Year
Perc
enta
ge
of a
nnua
l tot
al c
ells
SOTL2016 – Legend options for Figures 10.4 and 10.5:
Cryptomonads(Cryptophyta)
Dinoflagellates(Dinophyta)
Golden Algae(Chrysophyta)
Green Algae(Chlorophyta)
Blue-green Algae(Cyanophyta)
Diatoms(Bacillariophyta)
Other groupsPerc
enta
ge o
f ann
ual t
otal
cel
ls

10.5
BIOLOGY
Tahoe: State of the Lake Report 2019
Abundance of dominant diatom speciesMonthly in 2018
Since 1982, diatoms have been the dominant algal group at Lake Tahoe for all but a few years. Diatoms are unique in that they are enclosed within a cell wall made of silica, called a frustule. The
dominant diatom species at Lake Tahoe in 2018 are shown below. Large variations in the relative composition are evident by month. Synedra and Nitzschia were the dominant diatom species during every
month of the year, forming over 80% of the diatoms during spring. Although Cyclotella was a lower fraction of the diatoms in 2018, it still had a large impact on clarity.
SOTL 2019 – 10.6
BIOLOGY
Abundance of Dominant Diatom SpeciesMonthly in 2018
Jan Feb Mar Apr May Jun Jul Aug Sep Oct Nov Dec0
20
40
60
80
100
2018
Dia
tom
Bio
volu
me
(%)
Synedra
Nitzschia
Epithemia
Cyclotella
Aulacoseira
OthersDia
tom
Bio
volu
me
(%)

10.6
BIOLOGY
Tahoe: State of the Lake Report 2019
Algal groups as a fraction of total biovolumeMonthly in 2018
The biovolume of algal populations vary month to month, as well as year to year. In 2018, diatoms again dominated the biovolume of the phytoplankton community in every month, with the
exception of October. The peak in the biovolume occurred in May 2018, the same as in 2017 (the “spring bloom”). The peak biovolume in 2018 was 320 cubic millimeters per cubic meter, almost
double the biovolume in the last three years, a reflection of the increase of Synedra and Nitzschia.
SOTL 2019 – 10.5
BIOLOGY
Algal Groups as a Fraction of Total BiovolumeMonthly in 2018
Jan Feb Mar Apr May Jun Jul Aug Sep Oct Nov Dec0
50
100
150
200
250
300
350
2018
Biov
olum
e(c
ubic
mill
imet
ers
per
cub
ic m
eter
)
SOTL2016 – Legend options for Figures 10.4 and 10.5:
Cryptomonads(Cryptophyta)
Dinoflagellates(Dinophyta)
Golden Algae(Chrysophyta)
Green Algae(Chlorophyta)
Blue-green Algae(Cyanophyta)
Diatoms(Bacillariophyta)
Other groups
Bio
volu
me
(cub
ic m
illim
eter
s pe
r cub
ic m
eter
)

10.7
BIOLOGY
Tahoe: State of the Lake Report 2019
Distribution of Cyclotella gordonensis in the upper water columnIn 2018
This year the diatom Cyclotella gordonensis was again present in Lake Tahoe in high numbers, although it was not the dominant diatom on the basis of biovolume. Its extremely small size (2-4 microns) means that even with small
biovolume, there can be a large number of individual cells. The pie charts indicate the contribution of Cyclotella (dark green) to total phytoplankton assemblage (light green) smaller than 20 μm. Each pie chart is the average of values from 5 m
and 20 m, which corresponds to the data available to the layer above or close to the Secchi depth. Secchi depths recorded at the LTP station are also shown (small blue circles).
Feet
Met
ers

10.8
BIOLOGY
Tahoe: State of the Lake Report 2019
Peak shoreline algae concentrationsYearly since 2000
Periphyton, or attached algae, makes rocks around the shoreline of Lake Tahoe green and slimy, or sometimes like a very plush white carpet after they have been sun-bleached. Periphyton is measured five to eight times each year, and this graph shows the maximum
biomass measured 1.5 feet (0.5 m) below the surface at four sites from January to June. In 2018, concentrations at the four sites shown were well below their historic lows. One of the most urbanized sites, Pineland, historically one of the heaviest periphyton locations, was at
the lowest value recorded. Monitoring periphyton is an important indicator of near-shore health, but it is very challenging to characterize it on account of the variability inherent in the system, as Figure 10.9 makes evident.

10.9
BIOLOGY
Tahoe: State of the Lake Report 2019
Periphyton biomass was surveyed around the lake over a three-week period during the spring of 2018, when it was estimated to be at its annual maximum. 54 locations (shown as stars) were inspected by snorkel survey in 1.5 feet (0.5 m) of water. A Periphyton Biomass Index (PBI) is used as an indicator to rapidly assess levels of periphyton. The PBI is defined as the fraction of the local bottom area covered by periphyton multiplied by the average length (cm) of the algal filaments. A large number of sites had high PBI in 2018 (i.e. about a third of the sites had PBI > 1.5 indicated by red-shaded sections of shoreline in the map). Various factors may have contributed to this high PBI including contributions of nutrients associated with the occurance of multiple storms, sustained high lake levels, and possible effects associated with following an extremely wet year in 2017. Compared to previous years, this is considered to be a relatively heavy periphyton year, although specific measurements of chlorophyll concentration at four sites (Fig. 10.8) would suggest otherwise. The north-east shore has relatively low growth. This is in part a reflection of the high wave activity causing the periphyton to slough (see “Current Directions”), as well as generally lower amounts of precipitation and runoff along the east shore.
Note: The width of the colored band does not represent the actual dimension of the onshore-offshore distribution. Similarly, its length does not represent the precise longitudinal extent.
Shoreline algae distributionIn 2018

11
CLARITY
tahoe.ucdavis.edu
TAHOE:STATE OF THE LAKE REPORT2019

11.1
CLARITY
Tahoe: State of the Lake Report 2019
Annual average Secchi depthYearly since 1968
The Secchi depth is the depth at which a 10-inch white disk, called a Secchi disk, remains visible when lowered into the water. In 2018, the annual average Secchi depth was 70.9 feet (21.6 m), a 10.5-foot increase over the previous year. The annual average clarity in the past decade has been better than the prior decade.
The highest individual value recorded in 2018 was 100.0 feet (30.5 m) on March 6, and the lowest was 50.0 feet (15.2 m) on July 27. The increase this year is largely attributable to a return to more normal conditions, following the five-year drought and the heavy snow year that ended it. While the average annual clarity
is now better than in preceding decades, it is still short of the clarity restoration target of 97.4 feet (29.7 m) set by federal and state regulators, a goal agencies and the Tahoe Basin community continue to work toward.

11.2
CLARITY
Tahoe: State of the Lake Report 2019
Winter Secchi depthYearly since 1968
Annual winter (December-March) Secchi depth measurements from 1968 to the present indicate that winter clarity at Lake Tahoe is showing an overall improvement. In 2018, winter clarity
decreased by 5.2 feet. This was largely the result of the carryover of conditions from the previous year’s extremely low clarity. The winter average of 73.5 feet (22.4 m) was still well above the worst winter
average, 65.6 feet (20.0 m), seen in 1997. Winter precipitation was close to the long-term average.

11.3
CLARITY
Tahoe: State of the Lake Report 2019
Summer Secchi depthYearly since 1968
Summer (June-September) clarity in Lake Tahoe in 2018 was 61.7 feet (18.8 m), an 8.2-foot increase from 2017. The cause of the improvement was a return
to more normal summer conditions. Summer is typically the season of poorest clarity. The long-term summer trend is dominated by a consistent degradation
but with a noticeable 10-15 year cyclic pattern. The red dashed lines are linear regressions for the periods: a) 1976 to 1983, b) 1987-1998, and c) 2001 to 2011.

11.4
CLARITY
Tahoe: State of the Lake Report 2019
Individual Secchi depths2016, 2017, 2018
Here, the individual Secchi depth reading from the Index station on the west side of the lake for 2016, 2017, and 2018 are plotted.
Secchi values can be seen to sometimes vary considerably over short time intervals. This figure makes clear the abnormal conditions for 2017 that were
carried through into early 2018, and were responsible for the low Secchi depth values in winter.

12
EDUCATION AND OUTREACH
tahoe.ucdavis.edu
2019
TAHOE:STATE OF THE LAKE REPORT2019

12.1
EDUCATION AND OUTREACH
Tahoe: State of the Lake Report 2019
TERC education and outreachIn 2018
Part of TERC’s mission is education and outreach. Our public, K-12, teacher professional development, and volunteer programs are designed to provide science-based information about the Lake Tahoe region in order to foster responsible action and stewardship. During 2018, TERC recorded 14,477 individual visitor contacts. Student field trips and visitors to the Tahoe Science Center at Incline Village accounted for a little over 75% of these contacts. Additionally, TERC hosts monthly
public lectures and workshops, makes presentations to local community organizations, and takes a limited number of visitors out on our research vessels. TERC organizes and hosts annual events and programs including the North Lake Tahoe Science Expo, South Lake Tahoe Science Expo, Youth Science Institute, Trout in the Classroom teacher training program, Project WET workshops, High Elevation Garden workshops, Weird Wednesdays at the Incline Village Library, and a volunteer
docent training program. TERC also partners with numerous groups to deliver environmental science education in the Tahoe basin. In 2018, these included AmeriCorps, Lake Tahoe Outreach Committee, North Tahoe Environmental Education Coalition, Sierra Nevada College, Sierra Watershed Education Partnerships (SWEP), South Tahoe Environmental Education Coalition, Tahoe Institute for Natural Science (TINS), and many others.
Education Center Tours
Student Education
Workshops
Research Vessel
Community Presentations
Total Visitor Contacts = 14,477

12.2
EDUCATION AND OUTREACH
Tahoe: State of the Lake Report 2019
TERC educational exhibitsIn 2018
Every year, TERC works to increase UC Davis impact in the Tahoe Basin and heighten enrichment of visitor experience through educational offerings available in the UC Davis Tahoe Science Center. 85% of surveyed visitors expressed the increased connection between themselves and the environment after a visit to the Tahoe Science Center. We recently added UC Davis signage on the external area of the building and in the Tahoe Science Center lobby and created a Junior Limnologist booklet
and program. We also increased our hands-on, self-guided exhibit offerings with three new additions covering Albedo, Trees of Tahoe, and Properties of Light. These accomplishments and additions will continue to aid in our mission to increase knowledge and understanding of Tahoe basin ecosystems through engaging hands-on educational activities.
New signage was added to the outside of the Tahoe Science Center to increase visibility and direction for visitors.Photo: A. Toy
A dark t-shirt absorbs more heat than a white t-shirt, but why is that and what does that have to do with Tahoe? Learn about albedo, measure reflected light and heat, and discover how a decreased snow pack in a changing climate affects albedo in the Tahoe basin. Photo: A. Toy
Visitors at the Tahoe Science Center now have a new Properties of Light hands-on exhibit to display the full spectrum of visible light and to help explain why Lake Tahoe is blue.Photo: H. Segale
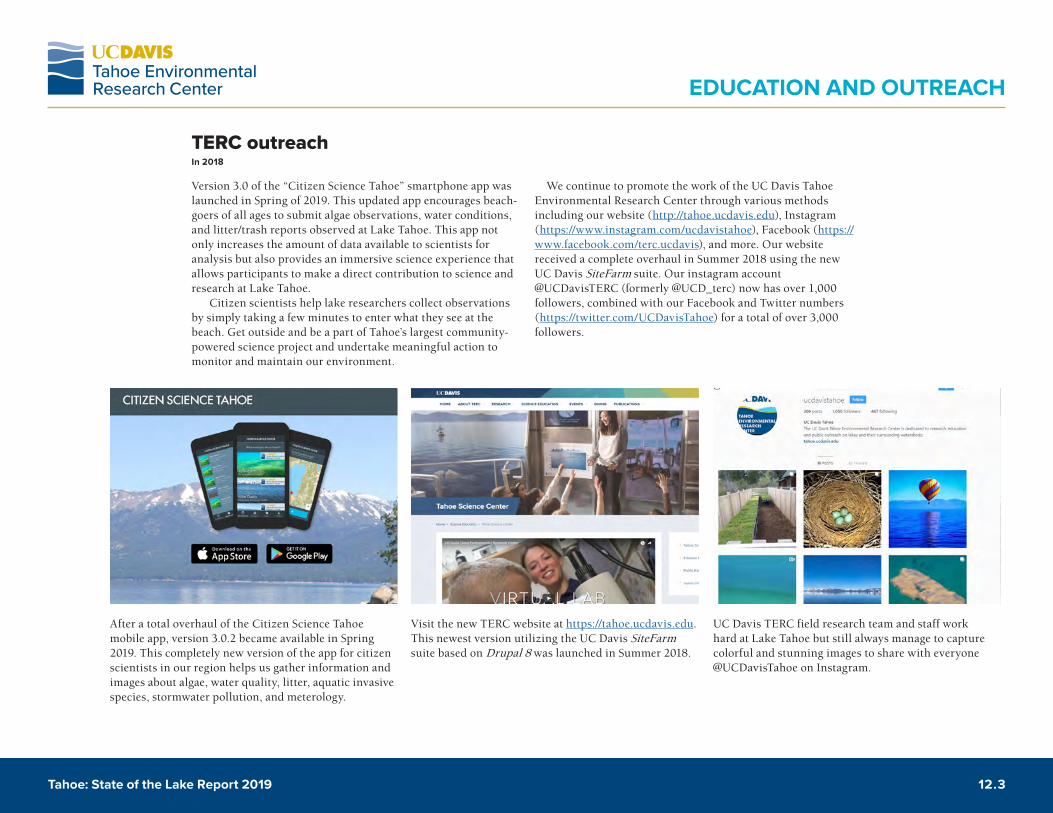
12.3
EDUCATION AND OUTREACH
Tahoe: State of the Lake Report 2019
TERC outreachIn 2018
Version 3.0 of the “Citizen Science Tahoe” smartphone app was launched in Spring of 2019. This updated app encourages beach-goers of all ages to submit algae observations, water conditions, and litter/trash reports observed at Lake Tahoe. This app not only increases the amount of data available to scientists for analysis but also provides an immersive science experience that allows participants to make a direct contribution to science and research at Lake Tahoe. Citizen scientists help lake researchers collect observations by simply taking a few minutes to enter what they see at the beach. Get outside and be a part of Tahoe’s largest community-powered science project and undertake meaningful action to monitor and maintain our environment.
We continue to promote the work of the UC Davis Tahoe Environmental Research Center through various methods including our website (http://tahoe.ucdavis.edu), Instagram (https://www.instagram.com/ucdavistahoe), Facebook (https://www.facebook.com/terc.ucdavis), and more. Our website received a complete overhaul in Summer 2018 using the new UC Davis SiteFarm suite. Our instagram account @UCDavisTERC (formerly @UCD_terc) now has over 1,000 followers, combined with our Facebook and Twitter numbers (https://twitter.com/UCDavisTahoe) for a total of over 3,000 followers.
After a total overhaul of the Citizen Science Tahoe mobile app, version 3.0.2 became available in Spring 2019. This completely new version of the app for citizen scientists in our region helps us gather information and images about algae, water quality, litter, aquatic invasive species, stormwater pollution, and meterology.
UC Davis TERC field research team and staff work hard at Lake Tahoe but still always manage to capture colorful and stunning images to share with everyone @UCDavisTahoe on Instagram.
Visit the new TERC website at https://tahoe.ucdavis.edu. This newest version utilizing the UC Davis SiteFarm suite based on Drupal 8 was launched in Summer 2018.

12.4
EDUCATION AND OUTREACH
Tahoe: State of the Lake Report 2019
TERC educational programsIn 2018
TERC provides various educational programs for the public, K-12 students, teachers, and volunteers. Public programs include science center tours, monthly lecture series, citizen science programs, and garden workshops. K-12 education efforts include school field trips, Trout in the Classroom, Youth Science Institute, Science Expo, and outdoor education programs. The TERC Education Team provided informal science education to more than 6,065 third- through eleventh-grade students, an increase of over 10% from the previous year.
Each year we train new volunteer docents at our annual Docent Training. Volunteer docents become local experts and lead public tours at our two science centers. Volunteers also participate in garden work each year to make the Tahoe City Field Station’s native plant demonstration garden a beautiful community and ecological resource. In 2018, we hosted the Solving Problems and Revitalizing Curriculum in Science (SPARCS) teacher training program. In this 3-day workshop, science teachers examine their teaching practices and improve their methods for teaching science.
As part of the TERC docent training program, new docents become experts on the history and research at Lake Tahoe by getting first-hand experiences. TERC boat captain Brant Allen leads a safety discussion before taking 39 new docents out on the water to collect field data including lake clarity and zooplankton sampling. Photo: A. Toy
The TERC Education team actively participated in the SPARC teacher’s workshop. In the activity pictured above, educators examine different models to teach lunar phases. By exploring the different methods of teaching, we create a learning community for teachers and increase active instruction. Photo: H. Segale
Our field trip activities are continually improved with the goal of increasing student engagement and linking learning goals to the NGSS science standards. AmeriCorps member Bre Harris, gets the students warmed up with a thought swap that promotes conscientious discourse. Photo: A. Toy

12.5
EDUCATION AND OUTREACH
Tahoe: State of the Lake Report 2019
TERC educational programs, continuedIn 2018
During the summer months, we offer programs at the Tahoe City Field Station. UC Davis TERC and Lake Tahoe Master Gardeners hosted the High Elevation Gardening workshop series and provided guidance on how to grow fruits and vegetables in the challenging Tahoe climate. This year’s featured crops included potatoes, raspberries, kale, lettuce, and tomatoes. Due to the popularity of this event and limited parking at this location, the participation numbers have been capped and we are exploring ways to expand our reach. Another popular program from TERC’s education and outreach was the outdoor education presented at the Junior Waterman’s camp in Carnelian Bay. Hosted by Waterman’s
founders Jay and Anik Wild, TERC’s education team members had the opportunity to incorporate science and stewardship into a primarily skills development program. We continued to update and modify available science activities and thematic field trips. Of the students surveyed using our pre-then-post survey instrument, 94 percent of the students had a 25 percent or more increase in knowledge. One-hundred percent of responding teachers indicated that they were satisfied with their overall field trip experience and that the activities presented were appropriate for the grade level being taught.
Thanks to a generous donation, the Tahoe City Field Station now has two additional raised beds to display a variety of vegetable seedlings under observation. Vail’s EpicPromise brought tools and over forty volunteers to participate in a garden work day that included the building and installation of these raised beds. Photo: A. Toy
The TERC education team teaches fun and engaging outdoor activities to the Junior Waterman’s camp over the course of three weeks. Topics included Citizen Science, watersheds, stream monitoring, and benthic macroinvertebrates.Photo: B. Harris
The High Elevation Gardening workshops at the Tahoe City Field Station and native plant demonstration garden were highly attended. Following a discussion of growing techniques and cultural anthropology, participants take home a selection of seedlings. Photo: A. Toy

12.6
EDUCATION AND OUTREACH
Tahoe: State of the Lake Report 2019
TERC special eventsIn 2018
TERC hosts monthly lectures throughout the year on various environmental issues, new scientific research, and related regional topics of interest. Some of the topics during 2018 included “The Psychology of Humor”, “How to Disagree with People About Climate Change”, “Memory: How the Brain remembers and how to make Memories Stick”, “Dark Side of the Universe”, “Evolution and Conservation of Salmon”, and “Is your shampoo bad for outdoor air quality?” This year featured a special Signature lecture with former EPA Region 9 Administrator Jared Blumenfeld entitled “Hiker’s Guide to the Galaxy” and a Science Speaks Luncheon featuring
Simon Hook, Manager of the Science Division at NASA’s Jet Propulsion Laboratory. Other special events hosted annually include the Science of Cocktails (February), North Tahoe Science Expo (March), South Tahoe Science Expo (April), Garden workshops (June - August), and Summer Teacher Institute (July). 2018 also had a few additional special events new this year including a visit from UC Davis Chancellor Gary May, an Art & Science reception, and an education collaboration with Innerspace Science submarines.
At the third annual Science of Cocktails event, visitors discovered connections between libations and science. A vapor-tini (shown here) taught the concept of cloud formation, a whiskey cocktail discussed fermentation, and an Irish coffee was layered to visualize density. Photo: A. Toy
At the 14th annual North Tahoe Science Expo (Physical Science) students learned about forces and motion, properties of matter, and energy. Fifth grade students from Glenshire Elementary (pictured above) use diffraction grating slides to learn about the visible light spectrum.Photo: A. Toy
Members of TERC’s education and outreach team, experienced a two-person submarine dive in Lake Tahoe. During these submarine missions we searched for Mysis shrimp at the bottom of the lake, submerged vegetated mounds off the south shore, and recorded visual demonstrations of deep water pressure. Photo: A. Toy

Full report available at tahoe.ucdavis.edu/stateofthelake