Embed Size (px)
Citation preview
Mavruz S., Ogulata R. T.; Taguchi Approach for the Optimisation of the Bursting Strength of Knitted Fabrics.FIBRES & TEXTILES in Eastern Europe 2010, Vol. 18, No. 2 (79) pp. 78-83.
78
Taguchi Approach for the Optimisation of the Bursting Strength of Knitted Fabrics
Serin Mavruz, R. Tugrul Ogulata
The University of Cukurova, Department of Textile Engineering,
01330 Adana, TurkeyE-mail: [email protected] [email protected]
AbstractIn this paper, the bursting strength of knitted fabrics was optimised using the Taguchi experiment design technique, which is a recently famous approach. In the evaluations, analyses of variance (ANOVA) and the signal to noise ratio were used. 9 experiments were performed with respect to the L9 orthogonal design for the Taguchi approach. The results show a considerable improvement in the S/N ratio as compared to the initial condition. With the Taguchi processes, we can easily determine optimum conditions for maximising the bursting strength of knitted fabrics with simple experiments.
Key words: knitted fabrics, bursting strength, experimental design, Taguchi design.
Taguchi views the design of a product or process as a three-phase program:1. System design: This phase deals with
innovative research. Here, one looks for what each factor and its level should be rather than how to combine many factors to obtain the best result in the selected domain [4].
2. Parameter design: The purpose of pa-rameter design is to investigate the overall variation caused by inner and outer noise when the levels of the con-trol factors are allowed to vary widely. Quality improvement is achievable without incurring much additional cost. This strategy is obviously well suited to the production floor [4, 5].
3. Tolerance design: This phase must be preceded by parameter design activi-ties. This is used to determine the best tolerances for the parameters [4, 6].
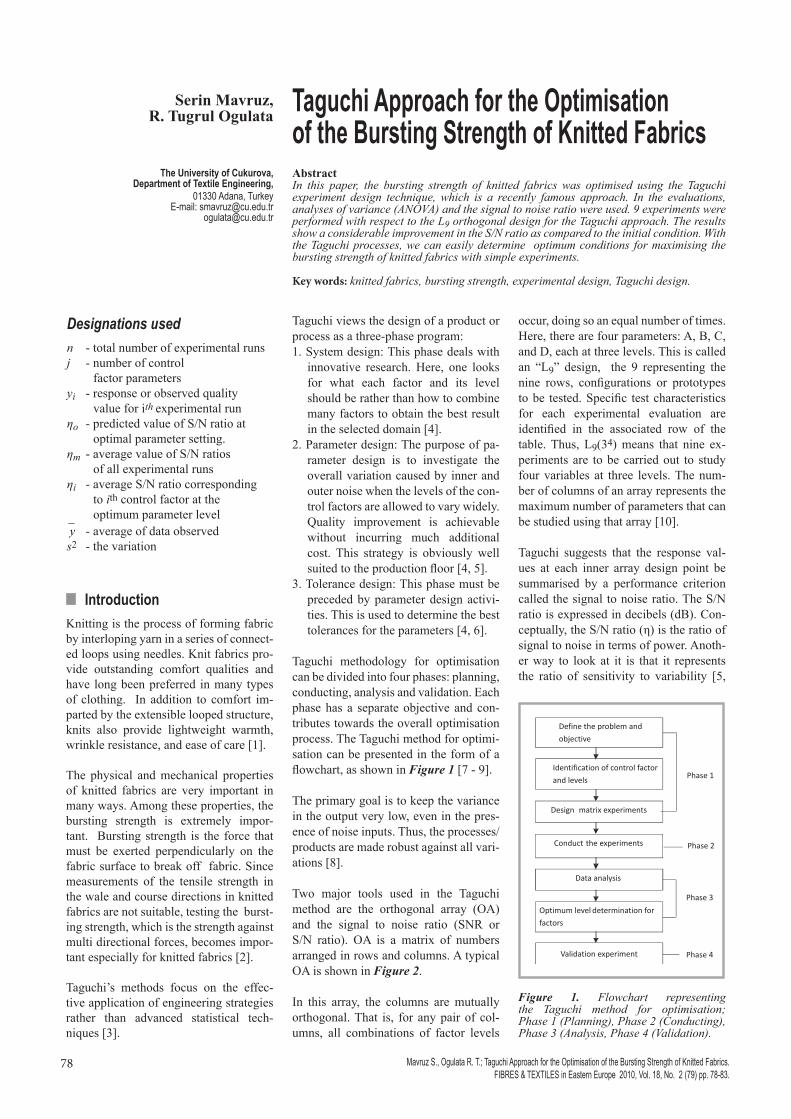
Taguchi methodology for optimisation can be divided into four phases: planning, conducting, analysis and validation. Each phase has a separate objective and con-tributes towards the overall optimisation process. The Taguchi method for optimi-sation can be presented in the form of a flowchart, as shown in Figure 1 [7 - 9].
The primary goal is to keep the variance in the output very low, even in the pres-ence of noise inputs. Thus, the processes/products are made robust against all vari-ations [8].
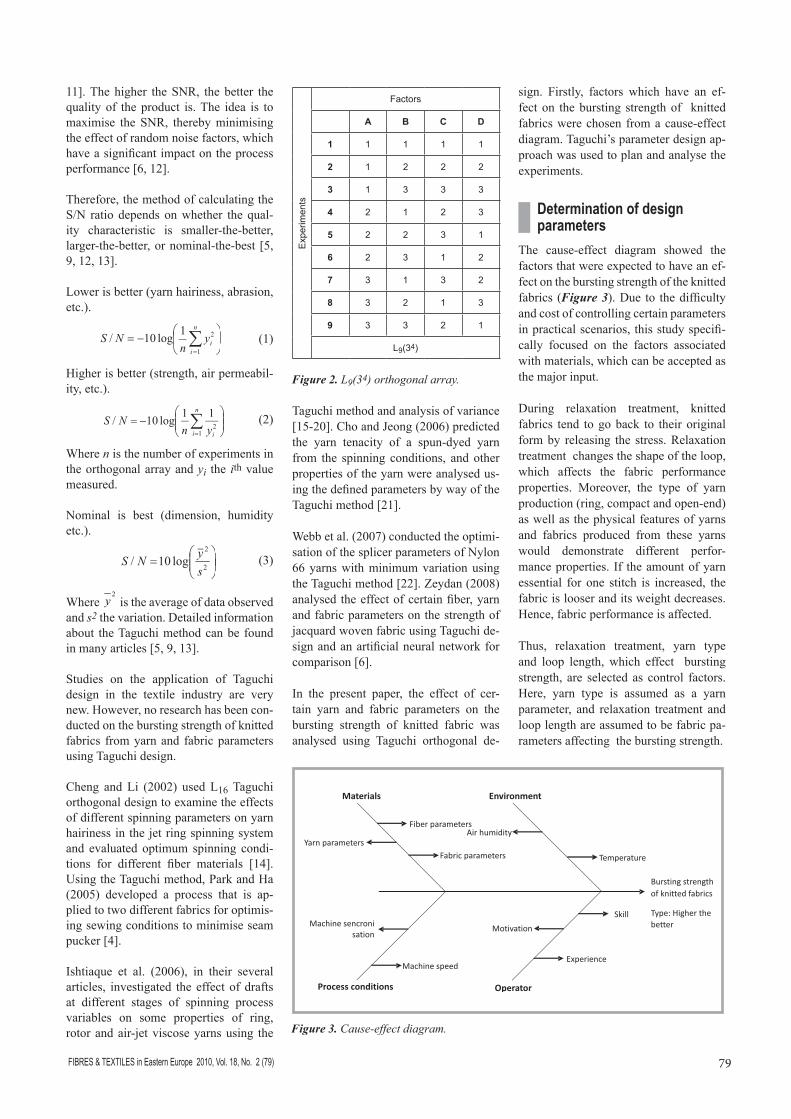
Two major tools used in the Taguchi method are the orthogonal array (OA) and the signal to noise ratio (SNR or S/N ratio). OA is a matrix of numbers arranged in rows and columns. A typical OA is shown in Figure 2.
In this array, the columns are mutually orthogonal. That is, for any pair of col-umns, all combinations of factor levels
occur, doing so an equal number of times. Here, there are four parameters: A, B, C, and D, each at three levels. This is called an “L9” design, the 9 representing the nine rows, configurations or prototypes to be tested. Specific test characteristics for each experimental evaluation are identified in the associated row of the table. Thus, L9(34) means that nine ex-periments are to be carried out to study four variables at three levels. The num-ber of columns of an array represents the maximum number of parameters that can be studied using that array [10].
Taguchi suggests that the response val-ues at each inner array design point be summarised by a performance criterion called the signal to noise ratio. The S/N ratio is expressed in decibels (dB). Con-ceptually, the S/N ratio (η) is the ratio of signal to noise in terms of power. Anoth-er way to look at it is that it represents the ratio of sensitivity to variability [5,
Figure 1. Flowchart representing the Taguchi method for optimisation; Phase 1 (Planning), Phase 2 (Conducting), Phase 3 (Analysis, Phase 4 (Validation).
Designations used n - total number of experimental runsj - number of control
factor parametersyi - response or observed quality
value for ith experimental runηo - predicted value of S/N ratio at
optimal parameter setting.ηm - average value of S/N ratios
of all experimental runs ηi - average S/N ratio corresponding
to ith control factor at the optimum parameter level
y - average of data observeds2 - the variation
n Introduction Knitting is the process of forming fabric by interloping yarn in a series of connect-ed loops using needles. Knit fabrics pro-vide outstanding comfort qualities and have long been preferred in many types of clothing. In addition to comfort im-parted by the extensible looped structure, knits also provide lightweight warmth, wrinkle resistance, and ease of care [1].
The physical and mechanical properties of knitted fabrics are very important in many ways. Among these properties, the bursting strength is extremely impor-tant. Bursting strength is the force that must be exerted perpendicularly on the fabric surface to break off fabric. Since measurements of the tensile strength in the wale and course directions in knitted fabrics are not suitable, testing the burst-ing strength, which is the strength against multi directional forces, becomes impor-tant especially for knitted fabrics [2].
Taguchi’s methods focus on the effec-tive application of engineering strategies rather than advanced statistical tech-niques [3].
79FIBRES & TEXTILES in Eastern Europe 2010, Vol. 18, No. 2 (79)
11]. The higher the SNR, the better the quality of the product is. The idea is to maximise the SNR, thereby minimising the effect of random noise factors, which have a significant impact on the process performance [6, 12].
Therefore, the method of calculating the S/N ratio depends on whether the qual-ity characteristic is smaller-the-better, larger-the-better, or nominal-the-best [5, 9, 12, 13].
Lower is better (yarn hairiness, abrasion, etc.).
(1)
Higher is better (strength, air permeabil-ity, etc.).
(2)
Where n is the number of experiments in the orthogonal array and yi the ith value measured.
Nominal is best (dimension, humidity etc.).
(3)
Where 2
y is the average of data observed and s2 the variation. Detailed information about the Taguchi method can be found in many articles [5, 9, 13].
Studies on the application of Taguchi design in the textile industry are very new. However, no research has been con-ducted on the bursting strength of knitted fabrics from yarn and fabric parameters using Taguchi design.
Cheng and Li (2002) used L16 Taguchi orthogonal design to examine the effects of different spinning parameters on yarn hairiness in the jet ring spinning system and evaluated optimum spinning condi-tions for different fiber materials [14]. Using the Taguchi method, Park and Ha (2005) developed a process that is ap-plied to two different fabrics for optimis-ing sewing conditions to minimise seam pucker [4].
Ishtiaque et al. (2006), in their several articles, investigated the effect of drafts at different stages of spinning process variables on some properties of ring, rotor and air-jet viscose yarns using the
Taguchi method and analysis of variance [15-20]. Cho and Jeong (2006) predicted the yarn tenacity of a spun-dyed yarn from the spinning conditions, and other properties of the yarn were analysed us-ing the defined parameters by way of the Taguchi method [21].
Webb et al. (2007) conducted the optimi-sation of the splicer parameters of Nylon 66 yarns with minimum variation using the Taguchi method [22]. Zeydan (2008) analysed the effect of certain fiber, yarn and fabric parameters on the strength of jacquard woven fabric using Taguchi de-sign and an artificial neural network for comparison [6].
In the present paper, the effect of cer-tain yarn and fabric parameters on the bursting strength of knitted fabric was analysed using Taguchi orthogonal de-
sign. Firstly, factors which have an ef-fect on the bursting strength of knitted fabrics were chosen from a cause-effect diagram. Taguchi’s parameter design ap-proach was used to plan and analyse the experiments.
Determination of design parameters
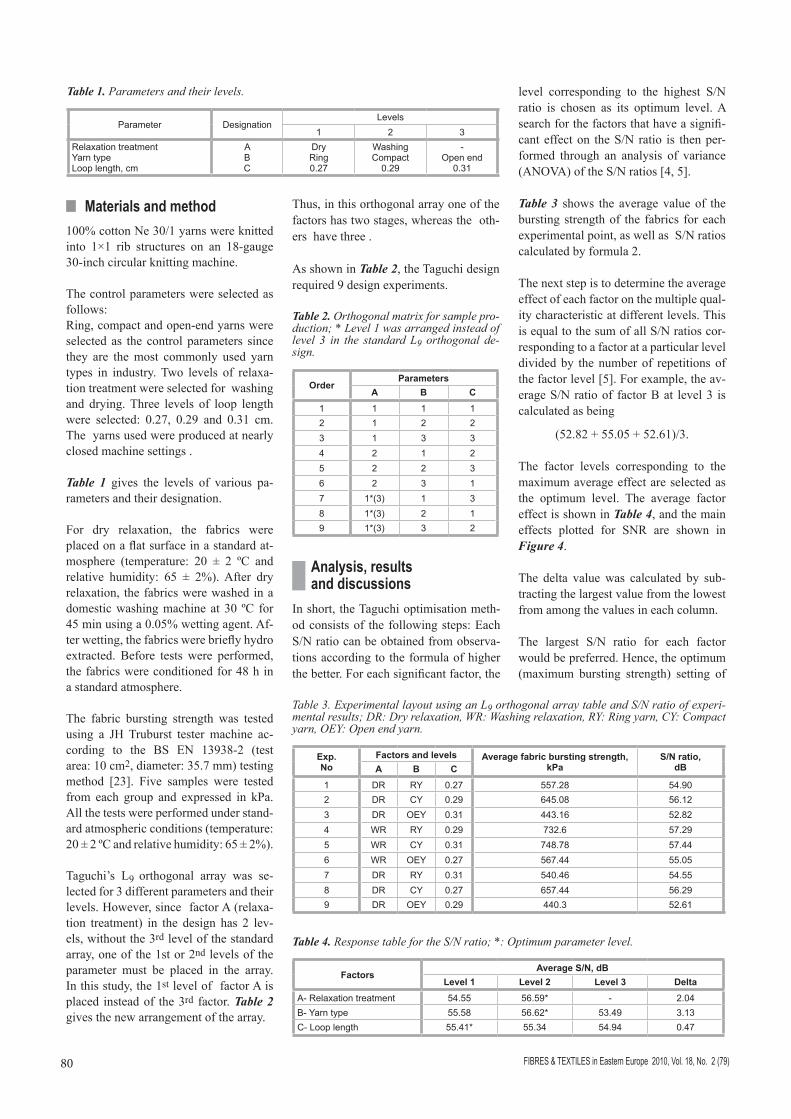
The cause-effect diagram showed the factors that were expected to have an ef-fect on the bursting strength of the knitted fabrics (Figure 3). Due to the difficulty and cost of controlling certain parameters in practical scenarios, this study specifi-cally focused on the factors associated with materials, which can be accepted as the major input.
During relaxation treatment, knitted fabrics tend to go back to their original form by releasing the stress. Relaxation treatment changes the shape of the loop, which affects the fabric performance properties. Moreover, the type of yarn production (ring, compact and open-end) as well as the physical features of yarns and fabrics produced from these yarns would demonstrate different perfor-mance properties. If the amount of yarn essential for one stitch is increased, the fabric is looser and its weight decreases. Hence, fabric performance is affected.
Thus, relaxation treatment, yarn type and loop length, which effect bursting strength, are selected as control factors. Here, yarn type is assumed as a yarn parameter, and relaxation treatment and loop length are assumed to be fabric pa-rameters affecting the bursting strength.
Exp
erim
ents
Factors
A B C D
1 1 1 1 1
2 1 2 2 2
3 1 3 3 3
4 2 1 2 3
5 2 2 3 1
6 2 3 1 2
7 3 1 3 2
8 3 2 1 3
9 3 3 2 1
L9(34)
Figure 2. L9(34) orthogonal array.
Figure 3. Cause-effect diagram.
FIBRES & TEXTILES in Eastern Europe 2010, Vol. 18, No. 2 (79)80
n Materials and method100% cotton Ne 30/1 yarns were knitted into 1×1 rib structures on an 18-gauge 30-inch circular knitting machine.
The control parameters were selected as follows:Ring, compact and open-end yarns were selected as the control parameters since they are the most commonly used yarn types in industry. Two levels of relaxa-tion treatment were selected for washing and drying. Three levels of loop length were selected: 0.27, 0.29 and 0.31 cm. The yarns used were produced at nearly closed machine settings .
Table 1 gives the levels of various pa-rameters and their designation.
For dry relaxation, the fabrics were placed on a flat surface in a standard at-mosphere (temperature: 20 ± 2 ºC and relative humidity: 65 ± 2%). After dry relaxation, the fabrics were washed in a domestic washing machine at 30 ºC for 45 min using a 0.05% wetting agent. Af-ter wetting, the fabrics were briefly hydro extracted. Before tests were performed, the fabrics were conditioned for 48 h in a standard atmosphere.
The fabric bursting strength was tested using a JH Truburst tester machine ac-cording to the BS EN 13938-2 (test area: 10 cm2, diameter: 35.7 mm) testing method [23]. Five samples were tested from each group and expressed in kPa. All the tests were performed under stand-ard atmospheric conditions (temperature: 20 ± 2 ºC and relative humidity: 65 ± 2%).
Taguchi’s L9 orthogonal array was se-lected for 3 different parameters and their levels. However, since factor A (relaxa-tion treatment) in the design has 2 lev-els, without the 3rd level of the standard array, one of the 1st or 2nd levels of the parameter must be placed in the array. In this study, the 1st level of factor A is placed instead of the 3rd factor. Table 2 gives the new arrangement of the array.
Thus, in this orthogonal array one of the factors has two stages, whereas the oth-ers have three .
As shown in Table 2, the Taguchi design required 9 design experiments.
level corresponding to the highest S/N ratio is chosen as its optimum level. A search for the factors that have a signifi-cant effect on the S/N ratio is then per-formed through an analysis of variance (ANOVA) of the S/N ratios [4, 5].
Table 3 shows the average value of the bursting strength of the fabrics for each experimental point, as well as S/N ratios calculated by formula 2.
The next step is to determine the average effect of each factor on the multiple qual-ity characteristic at different levels. This is equal to the sum of all S/N ratios cor-responding to a factor at a particular level divided by the number of repetitions of the factor level [5]. For example, the av-erage S/N ratio of factor B at level 3 is calculated as being
(52.82 + 55.05 + 52.61)/3.
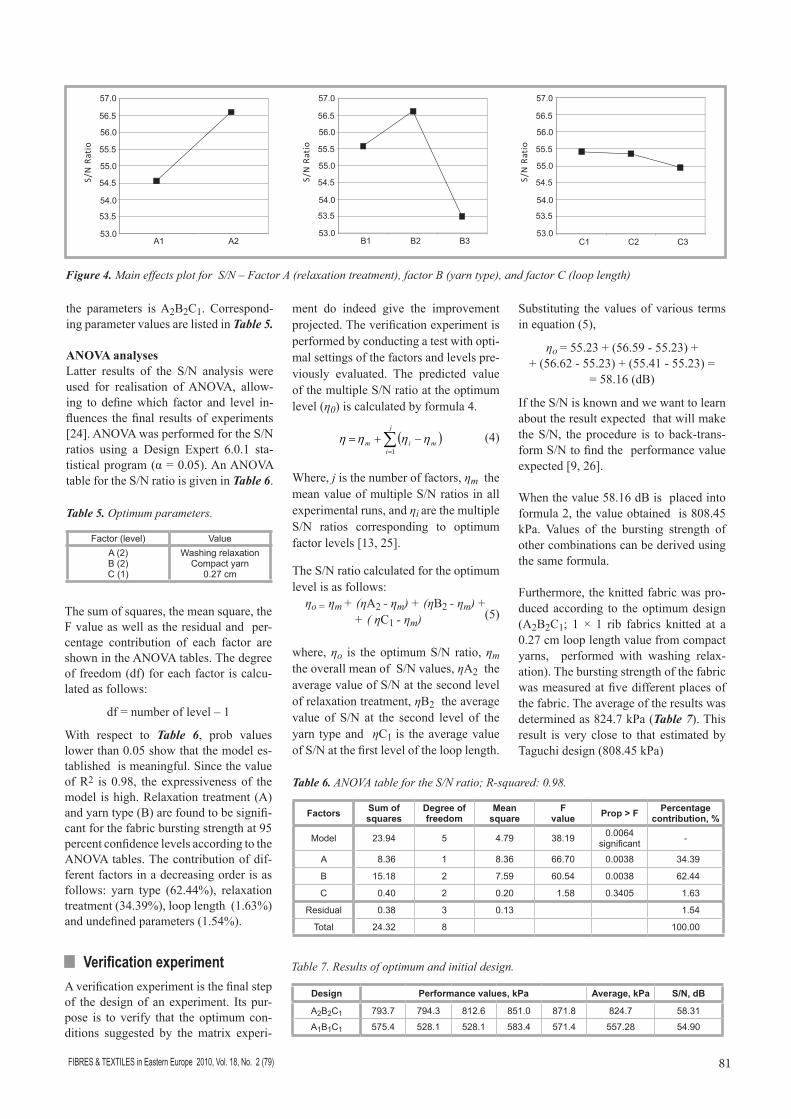
The factor levels corresponding to the maximum average effect are selected as the optimum level. The average factor effect is shown in Table 4, and the main effects plotted for SNR are shown in Figure 4.
The delta value was calculated by sub-tracting the largest value from the lowest from among the values in each column.
The largest S/N ratio for each factor would be preferred. Hence, the optimum (maximum bursting strength) setting of
Table 3. Experimental layout using an L9 orthogonal array table and S/N ratio of experi-mental results; DR: Dry relaxation, WR: Washing relaxation, RY: Ring yarn, CY: Compact yarn, OEY: Open end yarn.
Exp. No
Factors and levels Average fabric bursting strength, kPa
S/N ratio, dBA B C
1 DR RY 0.27 557.28 54.902 DR CY 0.29 645.08 56.123 DR OEY 0.31 443.16 52.824 WR RY 0.29 732.6 57.295 WR CY 0.31 748.78 57.446 WR OEY 0.27 567.44 55.057 DR RY 0.31 540.46 54.558 DR CY 0.27 657.44 56.299 DR OEY 0.29 440.3 52.61
Table 4. Response table for the S/N ratio; *: Optimum parameter level.
FactorsAverage S/N, dB
Level 1 Level 2 Level 3 Delta A- Relaxation treatment 54.55 56.59* - 2.04B- Yarn type 55.58 56.62* 53.49 3.13C- Loop length 55.41* 55.34 54.94 0.47
Table 1. Parameters and their levels.
Parameter Designation Levels
1 2 3Relaxation treatment Yarn type Loop length, cm
ABC
DryRing 0.27
Washing Compact
0.29
-Open end
0.31
Table 2. Orthogonal matrix for sample pro-duction; * Level 1 was arranged instead of level 3 in the standard L9 orthogonal de-sign.
Order Parameters
A B C1 1 1 12 1 2 23 1 3 34 2 1 25 2 2 36 2 3 17 1*(3) 1 38 1*(3) 2 19 1*(3) 3 2
Analysis, results and discussions
In short, the Taguchi optimisation meth-od consists of the following steps: Each S/N ratio can be obtained from observa-tions according to the formula of higher the better. For each significant factor, the
81FIBRES & TEXTILES in Eastern Europe 2010, Vol. 18, No. 2 (79)
the parameters is A2B2C1. Correspond-ing parameter values are listed in Table 5.
ANOVA analyses Latter results of the S/N analysis were used for realisation of ANOVA, allow-ing to define which factor and level in-fluences the final results of experiments [24]. ANOVA was performed for the S/N ratios using a Design Expert 6.0.1 sta-tistical program (α = 0.05). An ANOVA table for the S/N ratio is given in Table 6.
ment do indeed give the improvement projected. The verification experiment is performed by conducting a test with opti-mal settings of the factors and levels pre-viously evaluated. The predicted value of the multiple S/N ratio at the optimum level (η0) is calculated by formula 4.
( )∑=
−+=j
imim
1ηηηη (4)
Where, j is the number of factors, ηm the mean value of multiple S/N ratios in all experimental runs, and ηi are the multiple S/N ratios corresponding to optimum factor levels [13, 25].
The S/N ratio calculated for the optimum level is as follows:
ηo = ηm + (ηA2 - ηm) + (ηB2 - ηm) ++ ( ηC1 - ηm) (5)
where, ηo is the optimum S/N ratio, ηm the overall mean of S/N values, ηA2 the average value of S/N at the second level of relaxation treatment, ηB2 the average value of S/N at the second level of the yarn type and ηC1 is the average value of S/N at the first level of the loop length.
Substituting the values of various terms in equation (5),
ηo = 55.23 + (56.59 - 55.23) + + (56.62 - 55.23) + (55.41 - 55.23) =
= 58.16 (dB)
If the S/N is known and we want to learn about the result expected that will make the S/N, the procedure is to back-trans-form S/N to find the performance value expected [9, 26].
When the value 58.16 dB is placed into formula 2, the value obtained is 808.45 kPa. Values of the bursting strength of other combinations can be derived using the same formula.
Furthermore, the knitted fabric was pro-duced according to the optimum design (A2B2C1; 1 × 1 rib fabrics knitted at a 0.27 cm loop length value from compact yarns, performed with washing relax-ation). The bursting strength of the fabric was measured at five different places of the fabric. The average of the results was determined as 824.7 kPa (Table 7). This result is very close to that estimated by Taguchi design (808.45 kPa)
Table 5. Optimum parameters.
Factor (level) Value A (2)B (2)C (1)
Washing relaxationCompact yarn
0.27 cm
Table 6. ANOVA table for the S/N ratio; R-squared: 0.98.
Factors Sum of squares
Degree of freedom
Mean square
Fvalue Prop > F Percentage
contribution, %
Model 23.94 5 4.79 38.19 0.0064 significant -
A 8.36 1 8.36 66.70 0.0038 34.39
B 15.18 2 7.59 60.54 0.0038 62.44
C 0.40 2 0.20 1.58 0.3405 1.63
Residual 0.38 3 0.13 1.54
Total 24.32 8 100.00
Figure 4. Main effects plot for S/N – Factor A (relaxation treatment), factor B (yarn type), and factor C (loop length)
The sum of squares, the mean square, the F value as well as the residual and per-centage contribution of each factor are shown in the ANOVA tables. The degree of freedom (df) for each factor is calcu-lated as follows:
df = number of level – 1
With respect to Table 6, prob values lower than 0.05 show that the model es-tablished is meaningful. Since the value of R2 is 0.98, the expressiveness of the model is high. Relaxation treatment (A) and yarn type (B) are found to be signifi-cant for the fabric bursting strength at 95 percent confidence levels according to the ANOVA tables. The contribution of dif-ferent factors in a decreasing order is as follows: yarn type (62.44%), relaxation treatment (34.39%), loop length (1.63%) and undefined parameters (1.54%).
n Verification experiment A verification experiment is the final step of the design of an experiment. Its pur-pose is to verify that the optimum con-ditions suggested by the matrix experi-
Table 7. Results of optimum and initial design.
Design Performance values, kPa Average, kPa S/N, dB
A2B2C1 793.7 794.3 812.6 851.0 871.8 824.7 58.31
A1B1C1 575.4 528.1 528.1 583.4 571.4 557.28 54.90
FIBRES & TEXTILES in Eastern Europe 2010, Vol. 18, No. 2 (79)82
The initial design is accepted as A1B1C1, then the S/N ratio is obtained according to the initial and optimum design and how much profit is gained using the Ta-guchi design (Table 8).
As seen in Tables 7 and 8, the improve-ment in the S/N ratio at the optimum lev-el is found to be 3.41 dB. The value of the bursting strength in kPa at the optimum level is 824.7 against an initial parameter setting of 557.28.
Prediction of the bursting strength of other conditions using Taguchi design
According to the Taguchi design, values of the bursting strength of knitted fabrics for seven conditions (order) were pre-dicted using formula 2 and 4. The values
Table 8. Results of verification experiment.
DesignPrediction Verification
S/N S/NInitial design 55.08 54.90Optimum design 58.16 58.31Gain 3.08 3.41
predicted are given in Table 9 along with their experimental results.
Furthermore, values of percentage rela-tive error can be evaluated, and by short-ening the numbers using a computer, per-sonal mistakes are taken into considera-tion [27]. Figure 5 shows the measured and calculated values of bursting strength graphically.
As seen from Table 9 and Figure 5, the experimental results and values predict-ed are much closer.
n Conclusions In this research, we intended to create a process for optimising knitted fabric con-ditions using Taguchi design to maximise the bursting strength of knitted fabrics. We can conclude from this research that by using the Taguchi design to maximise the bursting strength of knitted fabrics, we can determine the optimal variables.
Based on the S/N ratio and ANOVA anal-yses, the optimum levels of the various parameters obtained in this study are:
Relaxation treatment: washing relaxationYarn type: compact yarnLoop length: 0.27 cm.
Moreover, the S/N ratio has been consid-erably improved as compared to the ini-tial parameter settings of the experiment.
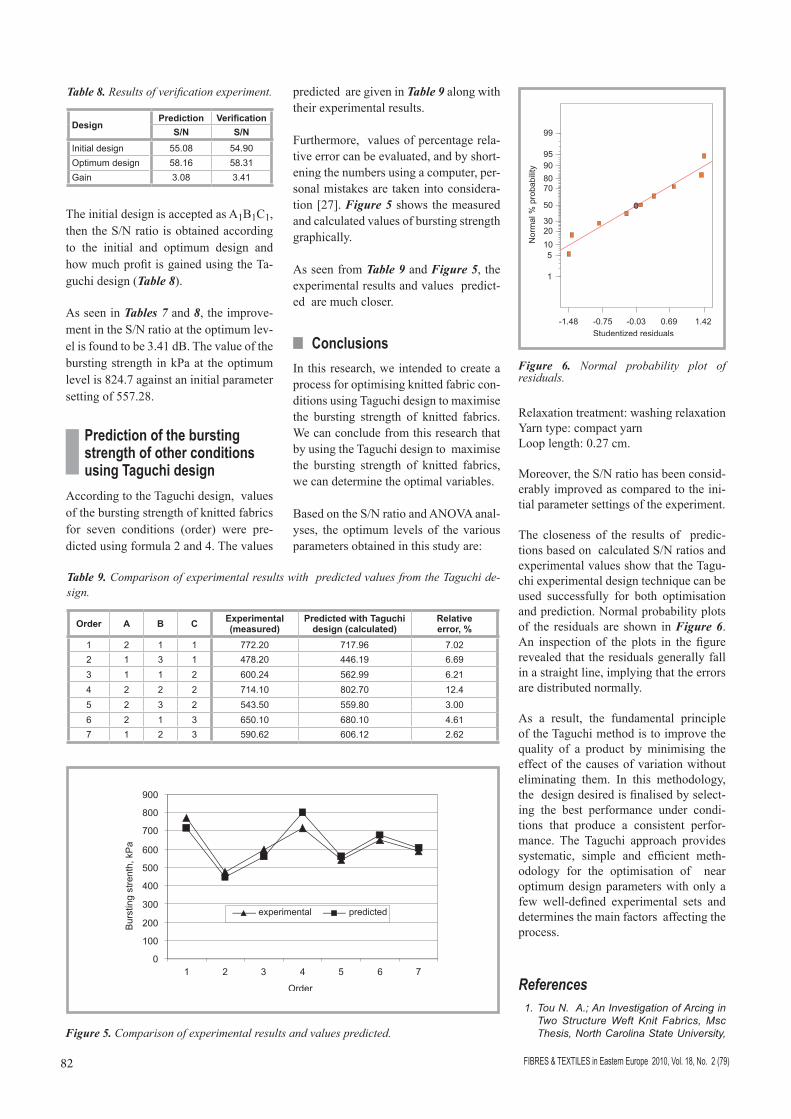
The closeness of the results of predic-tions based on calculated S/N ratios and experimental values show that the Tagu-chi experimental design technique can be used successfully for both optimisation and prediction. Normal probability plots of the residuals are shown in Figure 6. An inspection of the plots in the figure revealed that the residuals generally fall in a straight line, implying that the errors are distributed normally.
As a result, the fundamental principle of the Taguchi method is to improve the quality of a product by minimising the effect of the causes of variation without eliminating them. In this methodology, the design desired is finalised by select-ing the best performance under condi-tions that produce a consistent perfor-mance. The Taguchi approach provides systematic, simple and efficient meth-odology for the optimisation of near optimum design parameters with only a few well-defined experimental sets and determines the main factors affecting the process.
References 1. Tou N. A.; An Investigation of Arcing in
Two Structure Weft Knit Fabrics, Msc Thesis, North Carolina State University,
Table 9. Comparison of experimental results with predicted values from the Taguchi de-sign.
Order A B C Experimental (measured)
Predicted with Taguchi design (calculated)
Relative error, %
1 2 1 1 772.20 717.96 7.022 1 3 1 478.20 446.19 6.693 1 1 2 600.24 562.99 6.214 2 2 2 714.10 802.70 12.45 2 3 2 543.50 559.80 3.006 2 1 3 650.10 680.10 4.617 1 2 3 590.62 606.12 2.62
Figure 5. Comparison of experimental results and values predicted.
Figure 6. Normal probability plot of residuals.
83FIBRES & TEXTILES in Eastern Europe 2010, Vol. 18, No. 2 (79)
Received 27.08.2008 Reviewed 05.10.2009
Textile & Apparel Technology & Manage-ment, 2005.
2. Mavruz S., Oğulata R. T.; Statistical Investigation of Properties of Knitted Fab-rics Made of Ring and Compact Yarns, Journal of Knitting World, pp. 60-65, (in Turkish), September/October, 2007.
3. Singh S., Shan H. S., Kumar P.; Para-metric Optimization of Magnetic-Field-Assisted Abrasive Flow Machining by the Taguchi Method, Quality and Reliability Engineering International, 18, pp. 273-283, 2002.
4. Park C. K., Ha, J.Y.; “A Process for Opti-mizing Sewing Conditions to Minimize Seam Pucker Using the Taguchi Method, Textile Research Journal, 75(3), 2005, pp. 245-252.
5. Taguchi G., Chowdhury S., Wu Y.; Ta-guchi’s Quality Engineering Handbook. John Wiley&Sons, Inc. ISBN 0-471-41334-8. pp. 1662, 2005.
6. Zeydan M.; Modelling the Woven Fabric Strength Using Artificial Neural Network and Taguchi Methodologies, International Journal of Clothing Science and Techno-logy, Vol.20, No.2, p.104-118, 2008.
7. Khosla A., Kumar S., Aggarwal K. K.; Identification of Strategy Parameters for Particle Swarm Optimizer Through Taguchi Method, Journal of Zhejiang University Science A, 7(12), 2006, pp. 1989-1994.
8. Introduction the Taguchi Method, http://www.ee.iitb.ac.in/~apte/CV_PRA_TAGU-CHI_INTRO.htm., 2008.
9. Roy R. K.; Design of Experiments Using the Taguchi Approach, A Wiley-Interscien-ce Publication, ISBN 0-471-36101-1. p. 538, 2001.
10. Taguchi Approach to Design Optimization for Quality and Cost: An Overview, http://ame-lia.db.erau.edu/nasacds/200410Disc1/research/20040121019_2004117340.pdf, 2008.
11. Raymond H. M., Andre I. K., Geoffrey, V., Response Surface Alternatives to the Taguchi Robust Parameter Design Ap-proach, The American Statistician, Vol. 46, No. 2, 1992, pp. 131-139.
12. Palanikumar K.; Cutting Parameters Optimization for Surface Roughness in Machining of GFRP Composites Using Taguchi’s Method, Journal of Reinforced Plastics and Composites, Vol. 25, No. 16, 2006 pp. 1739-1751.
13. Ross P. J.; Taguchi Techniques for Quality Engineering. Mcgraw-Hill International Editions, ISBN 0-07-114663-6. p. 329, 1996.
14. Cheng K. P. S. Li C. H. L.; JetRing Spin-ning and Its Influence on Yarn Hairiness. Textile Research Journal, Vol. 72, 2002. pp. 1079-1087.
15. Ishtiaque S. M., Salhotra K. R.; Study of Effect of Spinning Process Variables on the Packing Density of Ring, Rotor and Air-Jet Yarns Using the Taguchi Method, Autex Research Journal, Vol. 6, No. 3, 2006, pp. 122-135.
16. Ishtiaque S. M., Salhotra K. R., Kumar A.; Analysis of Spinning Process Using the Taguchi Method. Part II: Effect of Spin-ning Process Variables on Fibre Extent and Fibre Overlap in Ring, Rotor and Air-
jet Yarns. Journal of the Textile Institute. Vol. 97. No. 4, 2006, pp. 285-294.
17. Kumar A., Ishtiaque S. M., Salhotra K. R.; Analysis of Spinning Process Using the Taguchi Method. Part III: Effect of Spinning Process Variables on Migration Parameters of Ring, Rotor and Air-jet Yarn. Journal of the Textile Institute. Vol. 97. No. 5, 2006, pp. 377-384.
18. Kumar A., Ishtiaque S. M., Salhotra K. R.; Analysis of Spinning Process Using the Taguchi Method. Part IV: Effect of Spinning Process Variables on Tensile Properties of Ring, Rotor and Air-jet Yarns. Journal of the Textile Institute. Vol.97. No.5. p.385-390, 2006.
19. Kumar A., Salhotra K. R., Ishtiaque S. M.; Analysis of Spinning Process Using the Taguchi Method. Part V: Effect of Spinning Process Variables on Physical Properties of Ring, Rotor and Air-jet Yarns. Journal of the Textile Institute. Vol. 97. No. 6, 2006 pp. 463-473.
20. Salhotra K. R., Ishtiaque S. M., Kumar A.; Analysis of Spinning Process Using the Taguchi Method. Part I: Effect of Spinning Process Variables on Fibre Orientation and Tenacities of Sliver and Roving. Jo-urnal of the Textile Institute. Vol. 97. No. 4, 2006, pp. 271-284.
21. Cho D. H., Jeong Y.; Analysis of Spinning Process Parameters on Development of Spun-Dyed PET Yarn Using the Taguchi Method. Journal of Applied Polymer Science, Vol. 102, 2006, pp. 1419-1427.
22. Webb C. J., Waters G. T., Thomas A. J., Liu G. P.; Thomas C.; The use of Taguchi Design of Experiment Method in Optimiz-ing Splicing Conditions for a Naylon 66 Yarn. Journal of the Textile Institute. Vol. 98. No. 4, 2007 pp. 327-336.
23. BS EN ISO 13938-2, Textiles – Bursting Properties of Fabrics, Part:2 Pneumatic Method for Determination of Bursting Strength and Bursting Distension, 1999.
24. Borecki J., Hackiewicz H., Koziol G., Sitek J., Codreanu N. C.; Parameters of UV Laser Microvia Formation Based on Taguchi Method of Experiment Design, 26th International Spring Seminar on Electronics Technology, pp. 112-116. May 8-11, Slovak Republic, 2003.
25. Dubey A. K., Yadava V.; Simultaneous Optimization of Multiple Quality Char-acteristics in Laser Beam Cutting Using Taguchi Method. International Journal of Precision Engineering and Manufactur-ing. Vol 8. No.4, 2007, pp. 10-15.
26. Savaşkan M.; Comparative Analysis of Design of Experiment Techniques on the Performance Evaluation and Optimization of Hard Ceramic Coated Drill Bits, Ph.D. Thesis. İstanbul Technical University, Inst. of Natural and Appl. Sci., (in Turkish), pp. 277, 2003.
27. Error and Type of Errors, jeofizik.ankara.edu.tr/download/notlar/JFM224/Konu1.pdf, (in Turkish), 2008.
9th Joint International Conference
CLOTECH’2010on
INNOVATIVE MATERIALS & TECHNOLOGIES
IN MADE-UP TEXTILE ARTICLES
AND FOOTWEARMay, 27th - 28th 2010
Radom, Polandorganized by:
nTechnical University of Łódź, Department of Clothing
Technology and TextronicsnKazimierz Pułaski Technical
University of Radom, Department of Shoes
and Clothing Materials Technology
Selected topics:n NEW RAW MATERIALS
IN CLOTHING PRODUCTION,n INTELLIGENT TEXTILES,n UTILITY COMFORT OF
CLOTHING,n COMPUTER TECHNIQUESn TEXTILE FINISHING,n CLOTHING FOR SPECIAL
APPLICATIONS.
Scientific committee:Presidents:Maria Pawłowa, (TUR), PolandIwona Frydrych, (TUŁ), PolandMembers:M. Bakar, (TUR), Poland; M. Bereznenko, Kiev National University of Technologies and Design, Ukraine; W. S. Biełgorocki, Moscow National University of Design and Technology, Russia; A. Firkowski, (TUR), Poland; W. A. Fukin, Moscow National University of Design and Technology, Russia; K. Gniotek, (TUŁ), Poland; Z. Kůs, (TUL), Czech Republic; R. Korycki, (TUŁ), Poland; S. Krzywinski, (TUD),Germany; J. Militký, (TUL), Czech Republic; J. Silberman, Jay & Patty Baker School of Business and Technology, Fashion Institute of Technology, USA; S. Stanys, (KTU), Lithuania; D. Ujević, University of Zagreb, Croatia; W. Więźlak, (TUŁ), Poland; A. Włochowicz, University of Bielsko-Biala, Poland
For more information please contact:
SecretaryIzabella Stanik tel. +48 48 361 75 07
e-mail: [email protected] Paździor tel. +48 48 361 75 84
e-mail: [email protected]. +48 48 361 75 76