Embed Size (px)
Citation preview

TACTICAL DATA ENGAGEMENT (BETA) Open Data + People + Action = Impact
TABLE OF CONTENTS
INTRODUCTION 3 The Challenge 5 The Opportunity 5 What is Tactical Data Engagement? 5
HOW-TO 7 The Process 8
1. Develop a problem statement 9 2. Embrace the dialogue 9 3. Update your tactical plan 10 4. Implement with 11 5. Measure success 12 6. Iterate 12
CASES 13 Demonstrating Tactical Data Engagement 14
Food Safety in King County 15 Housing Stabilization in Cleveland 17 Community Policing in Chicago 19 Public Transit Use in Portland 22 Teen Sexual Health in Washington 24
TACTICS 26 Framing tactics 27 Action tactics 28
2

PT. 1
INTRODUCTION - - - - X
3

About this guide...
This guide puts forth a vision for Tactical Data Engagement, an approach that unites city
open data with the people and pathways for action that can best address expressed local
needs. Tactical Data Engagement requires that cities recognize the value of leveraging
stakeholder expertise alongside data, particularly when seeking to address issues that most
directly involve and affect community residents. The ideology behind this approach relies on
the notion that residents are experts in their own lives, and that this expertise can and should
inform the use of open data. In every case, the Tactical Data Engagement approach requires
that cities work with external partners, from local universities, to community advocates, to
civic technologists, and to residents themselves.
By harnessing residents’ experiences to drive the sharing of open data and inform its use,
cities can make data-driven decisions to drive impact on shared goals. While cities may have
varying motivations for pursuing Tactical Data Engagement, from improving general
engagement processes to meeting departmental goals through innovation, its ultimate impact
always lives with community residents.
“No other expertise can substitute for locality
knowledge”
Jane Jacobs
4

The Challenge
Many cities have built open data portals or enacted policies as part of open data initiatives.
These efforts have fostered and proliferated access to city data. However, to fully meet their
goals, cities need to turn their sights beyond access alone. Most open data initiatives, after
all, aim for public stakeholders to use data productively. Cities want to do more with their
data by enlisting the help of community actors, and, most importantly, they want open data
to have an impact. An open data policy or portal on its own won’t necessarily bring out these
goals. It’s clear cities need to go further.
The Opportunity
Cities need strategies for leveraging open data to activate and empower community
practitioners, residents, and data users to take action. Since the beginning of the What Works
Cities project, the Sunlight Foundation has worked with nearly 50 US City Halls to enact open
data policies, and has tracked open data policy in over 100 cities, counties, and states
nationwide. We’ve worked closely with cities tracking their best practices for engaging users
around data and want to join those insights with actionable steps for cities to follow in
pursuit of successful data outreach. Our hope is to revolutionize the way city halls use open
data. The Sunlight Foundation seeks to provide technical assistance to cities to enable
solutions that leverage transparency and open data to tackle collaboratively identified
community challenges.
We designed Tactical Data Engagement to help cities go beyond simply making data legally
or technically public to actually connecting open data efforts to the community actors who
can help advance common goals.
What is Tactical Data Engagement? It’s an adaptable framework that cities can use regardless of experience level with data or
technology. This strategy contains clear steps in the form of an engagement process , use
cases , and a taxonomy of tactics that align with two discrete phases of the process, the
framing phase and the action phase. Cities can follow the process steps outlined in this guide
by deploying one or more of a broad range of tactics demonstrated to be effective in driving
toward open data outcomes via community participation.
5
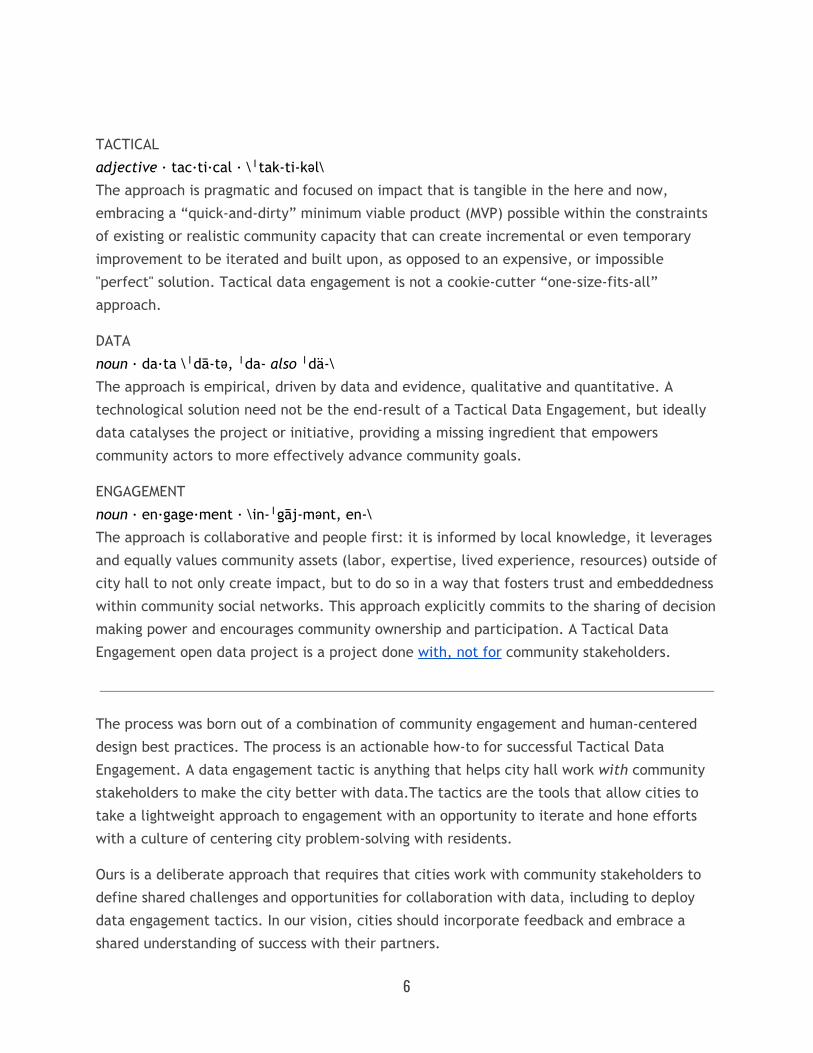
TACTICAL
adjective · tac·ti·cal · \ˈtak-ti-kəl\
The approach is pragmatic and focused on impact that is tangible in the here and now,
embracing a “quick-and-dirty” minimum viable product (MVP) possible within the constraints
of existing or realistic community capacity that can create incremental or even temporary
improvement to be iterated and built upon, as opposed to an expensive, or impossible
"perfect" solution. Tactical data engagement is not a cookie-cutter “one-size-fits-all”
approach.
DATA
noun · da·ta \ˈdā-tə, ˈda- also ˈdä-\
The approach is empirical, driven by data and evidence, qualitative and quantitative. A
technological solution need not be the end-result of a Tactical Data Engagement, but ideally
data catalyses the project or initiative, providing a missing ingredient that empowers
community actors to more effectively advance community goals.
ENGAGEMENT
noun · en·gage·ment · \in-ˈgāj-mənt, en-\
The approach is collaborative and people first: it is informed by local knowledge, it leverages
and equally values community assets (labor, expertise, lived experience, resources) outside of
city hall to not only create impact, but to do so in a way that fosters trust and embeddedness
within community social networks. This approach explicitly commits to the sharing of decision
making power and encourages community ownership and participation. A Tactical Data
Engagement open data project is a project done with, not for community stakeholders.
The process was born out of a combination of community engagement and human-centered
design best practices. The process is an actionable how-to for successful Tactical Data
Engagement. A data engagement tactic is anything that helps city hall work with community
stakeholders to make the city better with data.The tactics are the tools that allow cities to
take a lightweight approach to engagement with an opportunity to iterate and hone efforts
with a culture of centering city problem-solving with residents.
Ours is a deliberate approach that requires that cities work with community stakeholders to
define shared challenges and opportunities for collaboration with data, including to deploy
data engagement tactics. In our vision, cities should incorporate feedback and embrace a
shared understanding of success with their partners.
6

PT. 2
HOW-TO - - - - X
7

The Process
The Tactical Data Engagement process can be broken into two distinct phases, a framing
phase and an action phase . Each step we outline is flexible in nearly every sense of the word.
We believe cities should experiment with the chronology and implementation of each part of
this process. For example, each step’s completion can be driven by city officials, residents, or
a combination of both. Any tactic (for each respective phase, outlined later in this guide) can
be deployed to meet each step’s goals. We built flexibility into our model’s design so that any
city, regardless of its capacity or experience level with open data can lead a Tactical Data
Engagement project.
The framing phase of our process identifies steps that will help cities craft a problem
statement in the open with a resolute commitment to using open data as a conduit for
inclusivity and social equity. Some cities with limited capacity may pause after the framing
phase to plan for the action phase. The action phase requires cities to take direct
collaborative action to connect city data to locally driven outcomes.
There are a few prerequisites to starting this process. The most important prerequisite is that
cities understand and commit to identifying and understanding the needs of partners and
communities outside city walls. We understand that in some cases collaborating may be a
challenge due to political or financial barriers. However, we believe the tactics in this guide
allow for enough flexibility to make implementation easy and replicable for continuous
improvement. This process is built so that once completed in the context of a specific issue or
problem, you can start again with new problem statements or tactics, ensuring that you’re
able to iteratively work toward more inclusive solutions to local issues. The result will be a
culture of openness, transparency, and accountability that leads to civic impact through open
data and data-driven problem solving.
8

THE FRAMING PHASE
- - - - X 1. Develop a problem statement You’ll need to frame the opportunity and the relevant context by developing a realistic
problem statement after assessing city priorities and capacity. You may want to use a framing
tactic starting in this or any following framing phase step. This step requires formalizing
internal interests and determining which resources and capacities the city is willing to
contribute to a collaborative project with stakeholders. The result will be a problem
statement developed by city project members. Guide conversations with staff keeping in
mind the goals listed below.
Formulating a hypothesis for a problem statement is the key to beginning a process that will
lead to meaningful community collaboration with open data. This initial hypothesis will be
refined in the next step using feedback from stakeholders themselves, so focus on framing the
answer to each question as the city’s hypothesis.
Goal: Agree on a problem statement that answers these questions.
● What is the problem area?
● Who are the relevant city departments and staff?
● Who are the relevant community stakeholders?
○ Those with subject matter expertise?
○ Those with tech/data expertise?
○ Those with local context expertise (those who will be impacted)
● What are the relevant datasets from the city perspective?
○ To understanding the problem?
○ To measuring the problem?
● What will success or progress in this work look like?
2. Embrace the dialogue After framing your problem statement from the city perspective, communicate the
opportunity for collaboration to relevant community stakeholders and organizations. At this
stage in the Tactical Data Engagement process, cities should enter collaborative conversations
9

with a mindset of exploration and facilitation rather than with the intention to mine
information or serve process-driven interests. This step should allow residents to uniquely
identify local needs or suggest revisions based on technical skills, subject matter expertise, or
equally if not more important local knowledge and lived experience.
The result of this step should include the completion of interviews, surveys, focus groups, or
public events with community stakeholders. Cities will find that by opening their doors to
collaborative problem definition, and by confining conversations to the discussion of a
problem statement or target issue area, they may gain specific insights that can focus and
define the real needs of the issue as originally imagined. This feedback will ultimately inform
a redesign/reframing of the opportunity for open data collaboration in the next step. The key
to this process is revisiting the same relevant guiding questions from step 1 with community
stakeholders.
Goal: Revise the problem statement based on community-driven concerns to answer these
revised prompts from step 1. ● What is the resident-confirmed problem area?
● Who are the new relevant city departments and staff?
○ How can community stakeholders can plug in with these departments/staff?
● Who are the relevant community stakeholders? How will they participate?
○ Those with subject matter expertise?
○ Those with tech/data expertise?
○ Those with local context expertise (those who will be impacted)
● What are the resident-confirmed relevant datasets?
○ To understanding the problem?
○ To measuring the problem?
● What will success or progress for the community look like?
3. Update your tactical plan It is not enough to simply gather feedback from stakeholders; city officials must next
incorporate this feedback into a reframing and redesign of the collaborative opportunity. This
redesign will lay the foundation of a successful data collaboration in which stakeholders feel
equally invested.
This step should mark the completion of a successful framing phase through the adoption of a
final problem statement. In the most straightforward cases, feedback may indicate that
10

datasets not currently shared as open data could enable community residents to use data to
solve a particular issue and advance their mission. In more complex cases, redesign may
involve more expansive planning that may seem out of reach for day-to-day city operations,
for example: breaking new ground on public-private partnerships; developing and
implementing new technologies with local community hacker groups; or implementing
non-technical program changes.
Let this step be a moment in the process at which you begin thinking about ways to match
your problem statement to action tactics that could be implemented in the upcoming action
phase based on the resident feedback gathered in step two.
Goal: Understand the bottom line of an issue facing your community. Formally adopt a
problem statement as a dedicated, resident-informed city goal. The final problem statement
should:
● Identify a specific issue within a broader outcome area
● Name the departments and staff connected to the outcome area
● Communicate residents’ involvement in crafting the city goal
● Commit to recognizing key metrics for the given issue
● Open the problem statement for public comment
● [Optional] Identify next steps or a commitment to the action phase
THE ACTION PHASE - - - - X 4. Implement with With the problem area defined and framed and the opportunity for data collaboration
redesigned to leverage community expertise, the next step is to address the city’s challenge
identified and planned for in the framing phase. Implementing an action tactic may require
developing a tool or resource, or it may mean using existing resources in a new way. What’s
important is that the implementation connects to community need identified in step 1, workshopped in step 2, and verified/refined in step 3 above, and that the implementation is
done together with stakeholders.
11

Each of the action tactics is centered around an effort that requires active stakeholder
engagement with city data around an identified issue. Unlike any step in the framing phase,
this step in the action phase centers exclusively around implementing an action tactic.
Goal: Employ an action tactic alongside residents by adapting it to your city’s capacity using
available human, data, and technical resources. Answer these questions.
● Who will be the city champion to shepherd this project?
● How can I secure funding for this project?
● Who are my internal stakeholders who can make this work?
● Who are my external stakeholders who can make this work?
● How can I document what I’m doing to prepare for iteration/replication?
5. Measure success After implementing an action toward a community-informed solution in step four, it is critical
that city officials verify and measure impact. Questions of what success means, what it will
look like, and how it should be measured were discussed in step 1 and workshopped with
community experts in step 2. Ideally, project teams should work to identify a public dataset
that can measure success with the intention to track and share realistic markers of progress in
the open or with stakeholders involved. Measuring success is performance analysis that may
include tracking key neighborhood indicators generated by city data or gathering and tracking
new qualitative data by interviewing key stakeholders. In either case, open data collaboration
is only effective and sustainable when cities can show impact through demonstrable, concrete
metrics.
6. Iterate Tactical Data Engagement processes result in small scale interventions by design; they are
quick and dirty “minimum viable products” to connect community actors to the information
needed to address public challenges. By its very nature, this process is intended to be
iterated upon to continue to drive community-informed incremental improvements to an open
data program. With each replication and iteration, more community groups are brought into
the open data process and more opportunities are created for open data to drive impact.
Therefore, we recommend that cities plan for a process and culture of continued Tactical
Data Engagement.
12

(Kristina Alexanderson/ Flickr )
PT. 3
CASES - - - - X
13

Demonstrating Tactical Data Engagement The following cases demonstrate the process described in the section above and incorporate a
few of the replicable tactics that we’ve isolated as minimum viable solutions for cities to use
when using Tactical Data Engagement.
The case studies answer the question, “What does Tactical Data Engagement look like?” It looks like projects, programs, and initiatives that intensively mirror the following basic structure: City leaders frame a shared community challenge and invite community actors with relevant subject matter or local expertise to stake a claim in addressing that challenge through public data, thoughtfully shared. The use of public data, paired with stakeholder feedback and/or concrete contributions, results in tangible impact on the community or benefit to residents. To pare down this structure, we form this sentiment into a model with the following basic characteristics: (1) City department or specific person at city works with (2) specific community actors like nonprofits, residents, or businesses, (3) including by thoughtfully sharing relevant data, (4) to address a shared community challenge (5) resulting in tangible progress/impact/benefit for residents.
Projects that best captured the soul of Tactical Data Engagement inevitably fit this model.
This is the guiding feeling behind how to know successful data engagement when you see it.
The cases highlighted in this guide show the results of years, sometimes decades, of work to
engage communities with local government through data. We analyzed these cases to come
up with the tactics that make our process so adaptable to implement. Every city, regardless
of its unique needs, can use a tactic to replicate a version of the projects described below to
suit the individual needs of unique localities.
14

Food Safety in King County Data Restaurant ratings, incidence of foodborne illness
People King County’s Public Health Department, restaurant owners, community
leaders, health inspectors, residents
Action Informing resident decision-making and decreasing health risks
King County’s Public Health Department is reducing the risk of foodborne
illness by analyzing and sharing restaurant ratings data based extensively
on feedback from restaurant owners and community stakeholders.
( Public Health Department - King County )
Starting in January 2017, the Public Health Department of King County, WA — which includes
Seattle and many of its suburbs — began sharing a revamped set of restaurant ratings
complete with new resident-informed signage in restaurant windows developed from
conversations with restaurant owners, community members, restaurant inspectors, and health
experts. The Department employed innovative low-tech strategies like working groups and
quick surveys to get resident input on how to best improve restaurant ratings’ accessibility to
the public, thereby reducing the risk of foodborne illness. Embracing the idea that the best
idea is often the simplest one, the Department is meeting restaurant-goers and residents
where they are by using physical signs, meetings, and basic texting technology connect
communities to data.
15

In launching the ratings system’s redevelopment, the Public Health Department “gathered
recommendations, priorities and concerns from restaurant operators, food safety experts,
diverse language speaking communities and communities of color” early in their project
through stakeholder working groups that would continue after the new data release. They
unearthed issues like inconsistency among restaurant inspectors and incorporated those
findings into their ratings analysis. Then, the Department asked residents to review via online
survey a set of new, easy-to-understand signs to display health ratings in restaurants’
windows. From over 3,500 responses, the Department determined that residents preferred to
see signs with emojis due to the diversity of languages spoken in King County’s communities.
( Public Health Department - King County )
16

In addition to leveraging technology to open channels of communication, the Department
plans to continue engaging community members by holding quarterly stakeholder meetings
and posting a number for residents to text on physical ratings signs if they’re looking for more
information or the raw data itself. The key to the success of this groundbreaking work was to
combine a data-driven local government effort, providing ratings data to protect against
foodborne illness, with consistent communication with stakeholders through guerilla data
engagement strategies. The Department successfully adapted their ratings system to meet
resident needs by committing to data enagement and open communication, thus ensuring a
stronger impact on the Department’s goal of decreasing foodborne illness in the future.
Housing Stabilization in Cleveland
17

Data Linked code violations and other property data
People City of Cleveland, Cuyahoga County, Poverty Center at Case Western and CDCs
Action Tracking bad housing conditions and stabilizing neighborhoods
A CDC was able to create quality housing and evict negligent landlords in
the Detroit Shoreway neighborhood using property data from city
partners.
(Jakprints/ Flickr )
Since 2008, the Detroit Shoreway Community
Development Organization, a CDC in
Cleveland’s Detroit Shoreway neighborhood,
saved nearly 180 single-family homes from
demolition and undertook data-driven efforts
to identify and evict negligent housing owners. To do this, the Detroit Shoreway CDO leveraged
high-quality city and county property data
linked across geographies by the Poverty Center
at Case Western University. The linked data
was crucial for identifying and taking action
against landlords who owned multiple
properties and had multiple code violations.
But the data was only linked because the City
of Cleveland and Cuyahoga County engaged a
trusted university partner with sophisticated
data capacity to process their raw open data and connect the data to community needs.
For the City of Cleveland, providing open data on permits, code violations, ownership history,
and more was a key first step for beginning work with the Poverty Center on their
neighborhood data tool called NEO CANDO. Any community organization, in this case the
Detroit Shoreway CDO, could log onto the tool and see data on a single property in a single
search -- a task that used to take hours to complete when data was disaggregated by city or
county department and was much less effective for identifying problem housing owners. The
Poverty Center was a research organization outside of government with highly sophisticated
18

data capacity and had worked with local community organizations before, which is a
characteristic of intermediary partners with particular value to government agencies.
The city and county shared data with the Poverty Center as a trusted university partner so
that they might identify community connections and incorporate their needs into data
processing thus adding value to basic property data. The Poverty Center could then put
high-quality data into the hands of users like the Detroit Shoreway CDO to support ongoing
community development efforts. Without the city’s engagement of this trusted partner, the
Detroit Shoreway CDO would not have been able to take effective, impactful action against
vacancy and poor housing conditions to benefit residents of the Detroit Shoreway
neighborhood.
Houses in the Detroit-Shoreway neighborhood (Ray Dehler/ Flickr )
19

Community Policing in Chicago Data Neighborhood crime statistics, resident-provided 311 data
People Chicago Police Department and community members
Action Empowering residents and solving public safety issues as they arise
Police Accountability Task Force community meeting in February 2016
(Daniel O’Neil/ Flickr )
Officers and residents generated policing strategies that suited
community needs by discussing crime data at community meetings and
leveraging Chicago’s 311 system.
Police officers in Chicago have been meeting with community residents in their service areas
to discuss crime statistics and adjust their policing goals for over 20 years, and they are now
seeking data-driven improvements to the original innovative program. Chicago has long been
at the forefront of community policing, launching Chicago Alternative Policing Strategy
(CAPS), its community policing unit, in 1993 as a response to demonstrated need for
20

community-driven solutions in policing in Chicago and nationwide. CAPS, in its original form,
began grounding conversations between residents and police officers in data; police officers
arrived at meetings with a “top ten” set of crime charts to discuss with local stakeholders.
By allowing data to base community problem-solving in evidence and by asking residents to
lend their unique insights on idiosyncratic challenges that affect policing strategy, Chicago’s
Police Department has over time intended to understand a broader swath of issues affecting
residents than would be possible through traditional policing techniques.
As part of the work, police officers found that many of residents’ expressed concerns
resembled 311 service requests. Officers began gathering these concerns as qualitative data
and entering them in Chicago’s 311 system so that they could be tracked to completion. For
example, if officers shared data with residents on illegal drug activity in their neighborhood,
residents may identify their concerns about a specific abandoned building. Then officers could
log infrastructural or property ownership concerns from residents and respond to achievable
requests for building improvement by logging a request form. As of 2014, police accounted
for 3 to 4 percent of service requests filled, a task usually left to Public Works and 311 service
providers. One officer said he supplied about 100 service requests every day he was in the
field after this function was built into the CAPS program.
Chicago’s case rightly demonstrates that open data, in the form of 311 requests and crime
statistics, should be at the center of engaging residents around policing strategy, particularly
because the solutions to reducing crime numbers actually rely on meeting communities’
needs. While this project was innovative in its conception, Chicago’s Police Department has
recognized that there is room to grow. A set of recommendations provided by Chicago’s
Police Accountability Task Force in April 2016 suggests that data sharing be improved further
by asking that crime incidents be reported through the city’s open data portal. However, as in
years past, open data will not be the sole solution to tensions between residents and police.
Like so many social issues, the answers to Chicago’s policing challenges lie with residents, and
data serves as a conduit for actionable solutions grounded in good information and evidence.
21

22

Public Transit Use in Portland Data Transit authority data
People Portland’s TriMet transit authority, Google
Action Improving transportation access and use
(City of Portland / Flickr )
By facing a technical data challenge head-on with experts as partners,
TriMet was able to reach a trove of Google Maps users and improve
public transit use in Portland.
In 2005, a team of engineers from Google and staff from Portland’s TriMet transit authority
led by IT Manager Bibiana McHugh began work on a data standard that would allow open
transit data to flow into Google Maps in real-time. Though most of us take the technology for
granted today, the development of the Google Transit Feed Specification (GTFS) was
completely unprecedented in the field of open transit data and required a confluence of open
data, engagement, and action. Because Portland was already on board with open data
23

principles when McHugh first had the idea for this project, executing the schema on existing
transit data and sharing it with Google’s developers was not a major political barrier. Then,
experts at Google were able to co-create new technology alongside the city’s IT department
and the GTFS data standard was born.
McHugh had the idea for what became GTFS because she saw a fundamental issue with
TriMet’s existing open data practices with transit data. Data is essential for helping residents
to plan a trip using public transit. However, Portland didn’t have the technical capacity to
create a comprehensive transportation mapping tool, nor a wide enough audience to
significantly impact how residents moved throughout the city. By reaching out to her network
of research contacts and eventually landing in a partnership with Google, McHugh opened
TriMet’s doors to the co-creation of a service that would take transit data to a site where
users were already engaged.
Tapping local tech talent to assist with this issue was not only helpful in supplementing
technical needs, but necessary for identifying users and reaching them effectively. In other
cases, this may look like adopting open source technology or engaging civic hackers. In
McHugh’s case, reaching out to subject matter experts in the field of transportation led to a
connection that provided the skills and audience that TriMet needed to increase the use of
public transit. Since Portland’s initial effort, Google has improved resident access to public
transit around the world by adopted partnerships with over 100 transit providers nationwide
and 400 globally.
24

Teen Sexual Health in Washington Data Neighborhood data, resident insights
Partners Public housing residents, researchers, Department of Housing and Urban
Development, DC Housing Authority
Action Improving Public Housing Authority’s housing and social services
Researchers in Washington, DC were able to focus the DC Housing
Authority’s services to meet community needs by combining public data
with input from service recipients at an in-person data walk.
Researchers from the Urban Institute facilitated a data walk in 2014 for residents of the
Benning Terrace neighborhood in Washington, DC as part of the DC Housing Authority (DCHA)
Promoting Adolescent Sexual Health and Safety project. While the Urban Institute team had
been analyzing HUD data to direct DCHA on potential service improvements, they decided to
supplement their analysis with an in-person data walk to mine real feedback from teen
residents of local public housing to target teen sexual health issues. At the data walk,
residents perused visual aids like graphs, charts, or quotes posted around a room, providing
feedback at each station on whether they thought the data about their community was
accurate, complete, or helpful to know. Improving the quality of quantitative data by
combining it with resident input and community engagement was crucial for creating a
comprehensive evidence base that could accurately inform DCHA services.
(Ted Eytan / Flickr )
DCHA and researchers planned and hosted the data walk with input from a steering
committee consisting of subject matter experts, community residents, community leaders,
25

Housing Authority staff, and social service providers already working in Benning Terrace. They
invited some of the 300 youth in the service area and their families to participate and offer
suggestions to either the actual data or its interpretation. At the event, researchers shared
data on “health, substance abuse, risky behaviors, and neighborhood dynamics such as crime
and victimization” with residents to spark conversation and ground-truth research on the
community. They also interviewed the attendees at each station and collected quotes.
Important feedback made its way back to DCHA along with data analysis on teen sexual health
based on analysis by the subject matter experts. For example, one resident commented that
feedback surveys that DCHA provided assumed respondents were heterosexual, which limited
the information they could collect about sexual health. Other residents said that certain
indicators showed data points much lower or higher than they felt they should be. Because of
the collaborative way in which this form of resident engagement built upon public data,
DCHA was able to provide necessary sexual health education services and reduce risk for
youths in Benning Terrace by specifically focusing in on resident-identified data indicators. By
combining resident input with quantitative analysis, the impact of DCHA’s services would have
a particular focus on issues that matter most to its residents.
26
PT. 4
TACTICS - - - - X
27

Deploying Tactics
The focal point of the process outlined in Pt. 2 “How-To” of this guide is the deployment of
lightweight tactics that cities and government agencies can use to engage residents in
leveraging open data for good. This menu of framing and action tactics is an attempt to
categorize projects that city agencies or public servants have tried and tested to drive
community impact and empower residents using open data. Cities should be able to use this
menu, select a tactic, and implement it with variations depending on local idiosyncrasies. In
every case, we believe that cities should leverage the unique, local resources available to
them. We believe these tactics are a minimally intrusive, yet replicable and effective way for
cities to engage communities with data. Where possible, we’ve included examples of
applications for each tactic, but are open to refining and updating this catalog to mirror the
best practices being used in the open data community.
These tactics do not include products or developments that serve solely to improve local
government processes or performance, but the byproducts of a successful Tactical Data
Engagement may help cities by improving efficiency and generating innovative partnerships.
Positive results for the community go hand in hand with positive results for government,
including by reducing resource burdens on local governments and encouraging residents to
take stake in local government initiatives.
FRAMING TACTICS When cities set out to leverage their open data programs to address administrative or mayoral
goals, they may encounter difficulty in finding and facilitating the right partnerships or
stakeholders. When it comes to identifying and framing opportunities for collaboration, this
menu of tactics offers cities an answer to the question “Where should I start?” Some of the
tactics in this list fall under the wider umbrella of stakeholder mapping exercises and involve
seeking out new or neglected partners, or underserved communities. Tactics here can be
loosely applied to the framing phase steps outlined in Pt. 2 “How-To”. Some of the subjects
of the case studies demonstrated in Pt. 3 “Cases” used similar tactics as those described
below to engage residents in the preliminary stages of their projects. As identified in the
framing phase process description, these tactics should be implemented with a goal toward
honing and adopting a collaboratively-identified problem statement.
28

TACTIC DESCRIPTION
Participatory Problem Scoping
City hosts an in-person event to develop a problem
statement with residents based a shared challenge
on “donated” open data from city agencies with
agency staff present and breakout teams that
compete to propose the most actionable and
impactful problem statement.
Ex. Students at the Harris School for Public Policy
started an annual Civic Scope-a-thon in which
local agencies or nonprofits pose general
challenges and provide data to attendees, in this
case students, who proposed scopes of work for
future potential projects that would address the
agencies’ needs and promote innovation.
Information Demand
City or city department identifies the information
that is most requested or relevant to the most
frequently made requests and frames an impact
opportunity around the use cases driving the data
requests.
Ex. New York State used FOIL data requests from
residents and data users to identify opportunities
where opening data would reveal pathways for
users to more effectively access and use data.
They re-released “high value datasets” as open
data.
Use Who You’ve Got
City starts in framing a collaborative opportunity
for open data impact by engaging with existing
external partners by focusing on new or previously
unexplored data opportunities. Specifically, these
existing partnerships should be those most
connected to community needs and should
attempt connect needs to data-driven
opportunities for solutions.
29

Data Education/Open House
City hosts trainings or open houses for residents to
visit a physical space either at City Hall, City
Department’s offices/location, or communal
public spaces to participate in a data training and
have an informal conversation about potential
data improvements or data-driven solutions with
city officials. This tactic demonstrates the range
of opportunities to engage identified stakeholders,
but requires the structure of the development of a
problem statement.
Proven Dataset Use Case
City identifies datasets are not shared, or are
shared but not used, and builds a
problem/opportunity framing premised on these
use cases, particularly when use cases for city
datasets are already clear or known. This tactic
can take the form of a data inventory and
prioritization effort that involves community
input.
Open Data Roundtables
City engages data users with subject matter
expertise or demonstrated interest to collect
targeted feedback on open data releases and
potential data use cases. Leveraging user groups
or roundtables can lead to better data products
and more opportunities to ensure that data meets
users’ needs.
Ex: Pittsburgh Data User Groups host Data 101
meetings where county officials and local
research library staff are present to discuss data
challenges and data capacity goals.
ACTION TACTICS This menu of tactics was developed based on cases demonstrated by public agencies and
governments at all levels. These action tactics are intended to be used in Step 4 of Pt. 2
“How-To”. As for the framing tactics, the stories demonstrated in Pt. 3 “Cases” were the
30

inspiration for this set of action tactics, and thanks to the hard work of the subjects of those
cases, we believe these tactics have been proven to work well for communities. More than
the framing tactics, these action tactics are more resource-intensive, but they can and should
be adapted and adjusted based on local needs and capacities.
TACTIC DESCRIPTION
Guerilla Data Strategy
City uses low-tech solutions to improve residents’
experiences at physical places where they interact
with government services and drive positive
outcomes.
Ex: King County Public Health posting new
physical signage with user tested visuals and
increased access to data
Applied Problem Solving
City works consistently with engaged group of
stakeholders to address specific problems raised
through shared examination and conversations
around city data.
Ex: Chicago PD using community meetings to
discuss neighborhood data in effort to find
resident-led solutions for crime
Trusted Partnerships
City identifies external partners with advanced
data capacity and ties to community partners to
process existing city open data and connect it
community members or organizations.
Ex: Cleveland data intermediary parsing and
matching data across city/county levels and
reaching out to local housing advocacy groups to
encourage better landlord eviction practices and
neighborhood development
Co-creation with Civic Hackers
City identifies external partners with advanced
technical capacity and engages tech partners to
31

develop a product that both meets communities’
needs and brings city open data to its fullest
practical potential.
Ex: Portland IT department reaches out to Google
programmers and collaboratively develops an
innovative system for connecting city
transportation data to existing, widely used tech
platforms.
Data Quality Improvement
City undertakes extensive engagement effort to
add qualitative and/or quantitative input from
residents to either existing or new datasets within
city government.
Ex: DC Housing Authority uses data walks to
collect public housing residents’ input on sexual
health statistics to inform new programming
Ex: City of Riverside uses online portal for a data
collection effort around stray dogs and pets to
inform animal health initiatives
The "Hands-Free" Data Challenge
City releases specific datasets with an imperative
for users to build tools, deploy solutions, or create
new data products using city datasets. City
promotes and encourages development among
challenge participants.
Ex: Boston launched the Adopt-a-Hydrant
challenge which encourages residents to find local
hydrants using data and an interactive map from
the city to ensure that hydrants are dug out after
major snowfall.
...more to come!
32


![Tactical Combat Casualty Care [TCCC] Some reminders and ...€¦ · Tactical Combat Casualty Care Tactical Evacuation Care The term “Tactical Evacuation” includes both Casualty](https://img.pdfslide.us/doc/110x75/604ef4767ef6a83727287be2/tactical-combat-casualty-care-tccc-some-reminders-and-tactical-combat-casualty.jpg)