Embed Size (px)
Citation preview

Tactical and Financial
Analysis of Pre-Flight
and Inflight Uplink of
Weather dataBy
Captain Paul Wilson M.Eng
SAA/SITA DEW Analysis

SAA/SITA DEW Analysis

UPLINK FUNCTIONALITY Pre Departure
Route, City Pair, Alternate
Wind,
Climb 5 Flight Levels
Cruise 3 Flight Levels
Descent 4 Flight Levels plus destination surface wind
Cruise Temperature
Turbulence, CAT plus Convective
Inflight
DEW, Dynamic Enroute Wind
SAA/SITA DEW Analysis

UPLINK FUNCTIONALITY Improved AUTOMATED SYSTEM
MANUAL VS AUTOMATIC
Using the ACARS (Aircraft Communication and
Addressing System) to acquire and insert the later
wind prognosis and temperature.
PRE-FLIGHT
INFLIGHT
Routing of messages, VHF – SATCOM - HF
SAA/SITA DEW Analysis

SAA/SITA DEW Analysis
SAA/SITA DEW Analysis
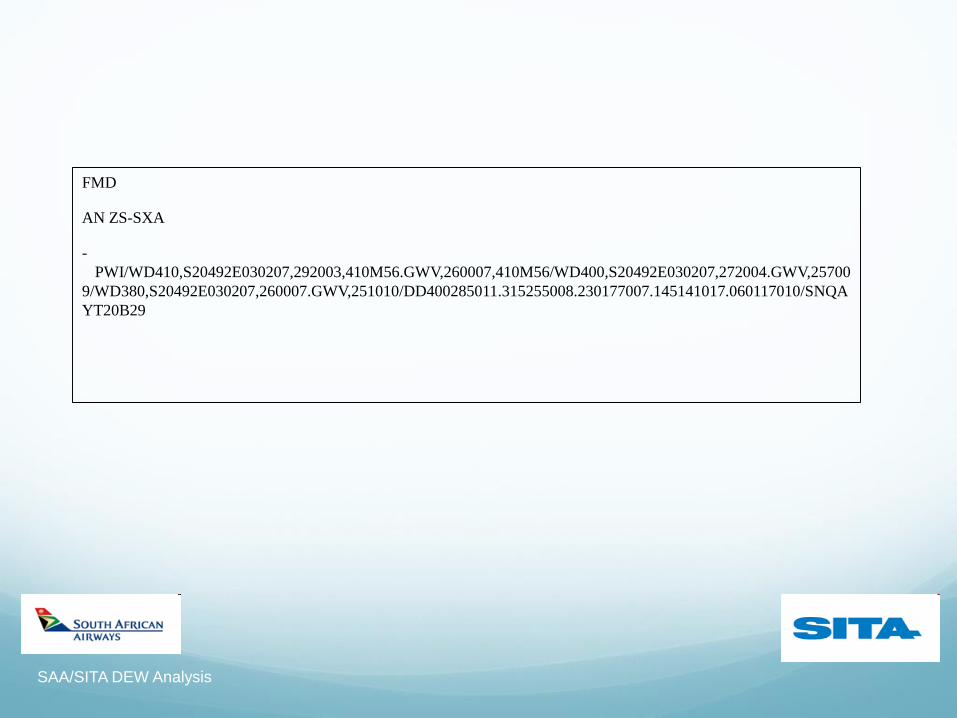
FMD
AN ZS-SXA
-
PWI/WD410,S20492E030207,292003,410M56.GWV,260007,410M56/WD400,S20492E030207,272004.GWV,25700
9/WD380,S20492E030207,260007.GWV,251010/DD400285011.315255008.230177007.145141017.060117010/SNQA
YT20B29
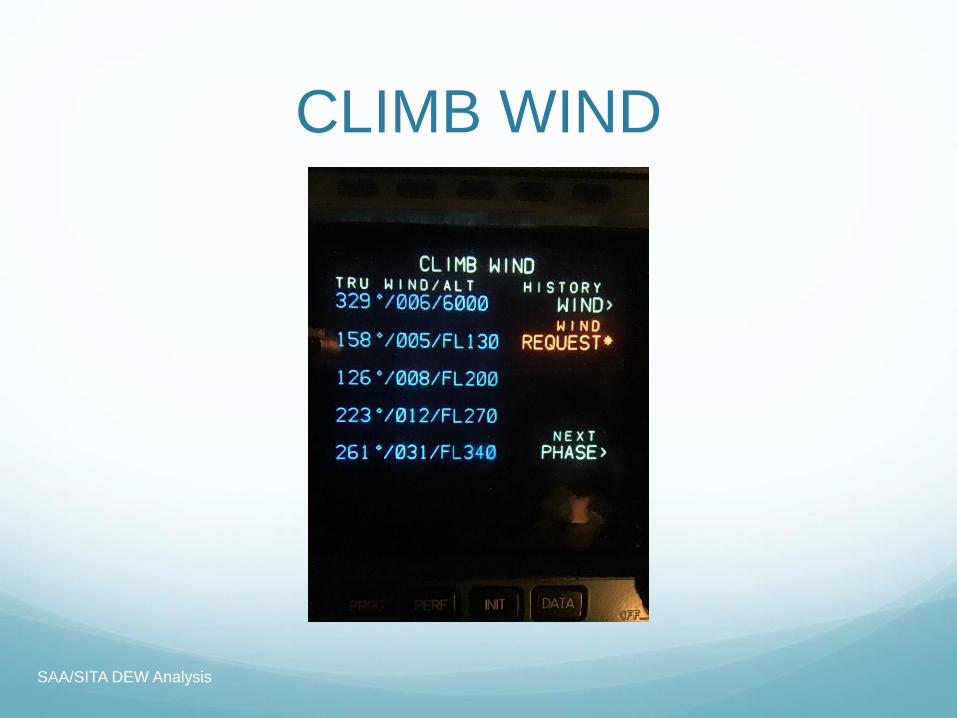
CLIMB WIND
SAA/SITA DEW Analysis

CRUISE WIND
SAA/SITA DEW Analysis

DESCENT WIND
SAA/SITA DEW Analysis

PROGNOSIS PERIODS Standard release prognosis period from WAFC
0000Z – 0600Z – 1200Z – 1800Z
Available to customer for flight planning purposes
0400Z = 0000 prognosis, 1000Z = 0400 prognosis
4 hour variance, pre-flight and inflight
Weather modeled to look forward for a number of
prognosis periods to cover the period of flight, ie up to
36 hours.
SAA/SITA DEW Analysis
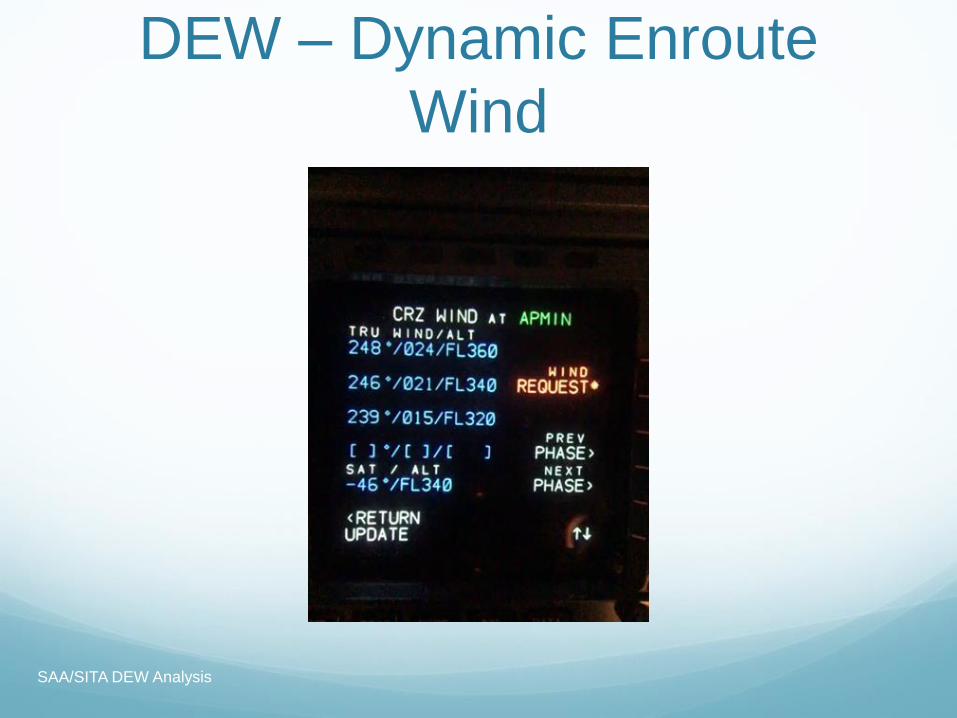
DEW – Dynamic Enroute
Wind
SAA/SITA DEW Analysis

DEW UPDATE
SAA/SITA DEW Analysis
UPDATE
Cruise and Descent ONLY – INFLIGHT ENHANCEMENT
FMS BASIC STANDARD Airbus A340 only
3 levels, 33 waypoints
4 levels, 24 waypoints
FMS STEP1A Airbus A320 and A330
3 levels > 50 waypoints
4 levels, 40 waypoints
SAA/SITA DEW Analysis
Three parameters will be indentified,
Fuel remaining before and after the DEW, determining
Δfuel.
ETA before and after the DEW, determining Δtime
Change in Optimum altitude.

SAA/SITA DEW Analysis
SAA/SITA DEW Analysis

SAA/SITA DEW Analysis

SAA/SITA DEW Analysis
Team of 7 slected Training and Check Captains,
A340, 31 Data sets.
A330, 76 Data sets.
96%, 1 or more changes to Fuel/Time/OPT ALT.
Change in FUEL. QUANTITATIVE.
Change in TIME. TACTICAL
Change in Optimum altitude. TACTICAL

SAA/SITA DEW Analysis
Airbus A330
76 DEW uplinks completed
FUEL, 45% 100kg or better.
TIME, 35% 1 min improvement or better.
ALTITUDE, 75% remained the same, or improved.
Decrease Stay Same Increase
Optimum
Altitude
13% 43% 43%
Fuel 24% 32% 45%
Time 36% 41% 24%

SAA/SITA DEW Analysis
Airbus A340
31 DEW uplinks completed
FUEL, 39% 100kg or better.
TIME, 39% 1 min improvement or better.
ALTITUDE, 68% remained the same, or improved.
Decrease Stay Same Increase
Optimum
Altitude
13% 39% 48%
Fuel 32% 29% 39%
Time 39% 32% 29%

Annual SavingsFUEL
$1.06/kg
A340
17 Sectors per day, 6205
sectors per year.
39% realise a fuel gain,
2172 sectors per year.
>217 200 kg Fuel/year
$230 232/year
COST <$1/Uplink
A330
6 Sectors per day, 2190
sectors per year.
45% realise a fuel gain, 986
sectors per year.
>98 600 kg Fuel/year
$104 516/year
COST <$1/Uplink
SAA/SITA DEW Analysis

Annual SavingsCARBON EMMISIONS
3.2kg CO2/kg JETA1
A340
17 Sectors per day, 6205
sectors per year.
39% realise a fuel gain,
2172 sectors per year.
>217 200 kg Fuel/year
CO2
217 200 @ 3.2kg
695 040 kg CO2
A330
6 Sectors per day, 2190
sectors per year.
45% realise a fuel gain, 986
sectors per year.
>98 600 kg Fuel/year
CO2
98 600 @ 3.2kg
315 520 kg CO2
SAA/SITA DEW Analysis
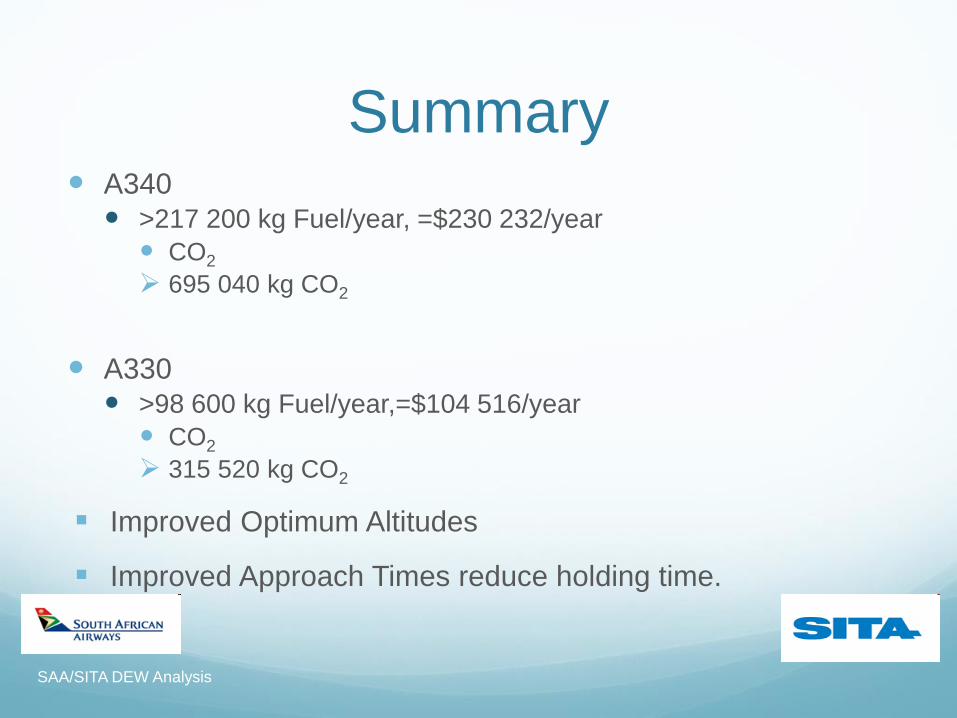
Summary A340
>217 200 kg Fuel/year, =$230 232/year
CO2
695 040 kg CO2
A330 >98 600 kg Fuel/year,=$104 516/year
CO2
315 520 kg CO2
Improved Optimum Altitudes
Improved Approach Times reduce holding time.
SAA/SITA DEW Analysis

SAA/SITA DEW Analysis
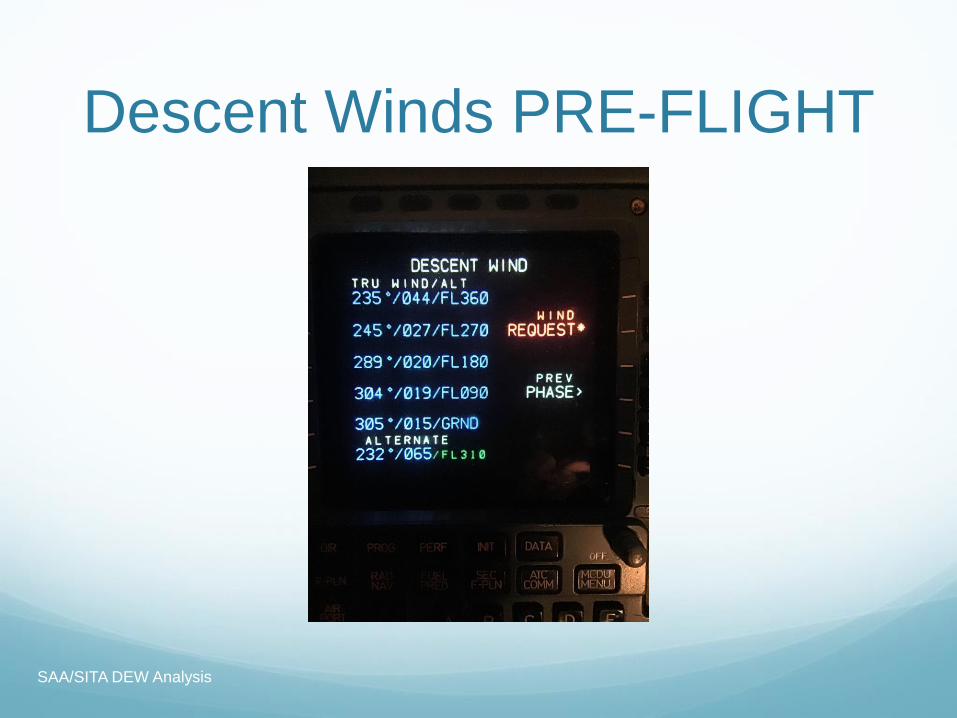
Descent Winds PRE-FLIGHT
SAA/SITA DEW Analysis

Amend Descent Levels
SAA/SITA DEW Analysis

Advantage of Improved
Descent Winds 1 cruise waypoint. PROG update prior to TOD
CONTINUOUS DESCENT PLANNING, to the
deceleration phase.
Airbus Geometric phase.
IDLE THRUST TO 1000ft above destination
aerodrome.
Bracketing of JET STREAMS
SAA/SITA DEW Analysis

TURBULENCE CAT – Clear Air Turbulence
Convective Turbulence, proximity to CB’s.
Cooperative between SAA/SITA/WAFC UK Exeter
Relationship of ‘predictability’ versus ‘actual’.
Seat belt SIGNS ON versus Turbulence, retrospective
assessment of inflight ‘g’
SAA/SITA DEW Analysis

SEAT BELTS ON
0-3 Light
4-7 Moderate
7< Severe
Altitude levels bracket
JET STREAMS
FL280-FL320
FL320-FL360
FL360-FL410
SAA/SITA DEW Analysis