Embed Size (px)
Citation preview
1
Tacoma Power Clean Energy Implementation Plan DRAFT
1 Background
In 2019, Governor Jay Inslee signed into law the Clean Energy Transformation Act (CETA), which
commits the State of Washington to a retail electricity supply comprised of 100 percent
renewable and nonemitting resources by 2045. The landmark law imposes new clean energy
mandates on electric utilities in Washington as well as planning and reporting requirements.
One of those new requirements is that utilities complete a Clean Energy Implementation Plan
(CEIP) by January 1, 2022 and every four years thereafter. The CEIP is a planning document with
the aim of making sure utilities are prepared to meet CETA’s clean energy requirements. Our
first-ever CEIP is due January 1, 2022 and every four years after that (in 2026, in 2030, etc.). In
the CEIP, we must:
(1) Establish targets for (a) how much of our customer’s electricity consumption will come
from renewable and nonemitting resources over the next four years and (b) the amount
of energy efficiency1, demand response and renewable energy we will acquire in the
next four years.
(2) Identify specific actions we will take to meet the above targets.
(3) Identify specific actions to ensure an equitable transition.
(4) Identify the resource adequacy standard and measurement metrics used to establish
our targets.
2 Interim and specific targets
2.1 Interim target In most years, we expect to have more than enough renewable and nonemiting energy to
serve 100% of our load and expect our portfolio to be 96% to 97% carbon-free.2
However, we face substantial uncertainty regarding what we will report for CETA starting in
2030 due primarily to uncertainty regarding CETA rules for calculating the percentage of retail
load served using renewable and nonemitting resources. The Department of Commerce has not
yet finalized this aspect of CETA rulemaking. Because the only source of carbon in our portfolio
1 For the purposes of the CEIP, we use the terms “conservation” and “energy efficiency” interchangeably. 2 The 2020 IRP determined that, on average, 97% of our power supply is from renewable and nonemitting resources. We expect this number to drop to 96% in 2026 once our Columbia Basin Hydro contracts fully expire and hold steady at that percentage through 2045.
2
comes from unspecified wholesale market purchases that we or BPA make to balance supply
and demand, rules regarding the treatment of unspecifed market purchases for operational
purposes are critical for us, as they are currently unavoidable3 and do not lend themselves to
CETA’s directive to demonstrate consistent progress towards meeting the 80 percent or 100
percent clean energy standards. Of particular importance are rules determining how purchases
through organized markets will be treated under CETA. Once we join the California Energy
Imbalance Market (EIM)4, it is likely that the volume of unspecified purchases we make will
increase. If an organized day-ahead market also develops within the next four years, it is likely
that we would join and see even more unspecified purchases enter our portfolio. It is vital that
CETA rules and accounting approaches to address REC double counting be flexible enough to
align with organized electricity markets. We believe that most stakeholders recognize that
participation in regional electricity markets will deliver significant advantages to Washington
electricity customers. These advantages are both financial (efficient dispatch) and
environmental (facilitating renewable integration over a broad region and reducing renewable
curtailment).In addition to uncertainty around CETA rulemaking, we have also seen growing
policymaker interest in electrification of energy uses now served by fossil fuels (transportation,
building heat, water heat, etc.). If our load grows more quickly than expected over the next four
years, we may find we need to rely more on market purchases. We did not specifically model
load growth due to electrification in our most recent (2020) IRP but will consider it in our 2022
IRP update.
Due to these uncertainties (particularly those around CETA rules), we set a slightly more
conservative interim target of 90% renewable and nonemitting for this first CEIP. Even with this
more conservative assumption, we expect to exceed the standard under RCW 19.405.040(1)
(80% by 2030) for the period covered by this CEIP (2022-2025) and meet all CETA standards
through 2044.
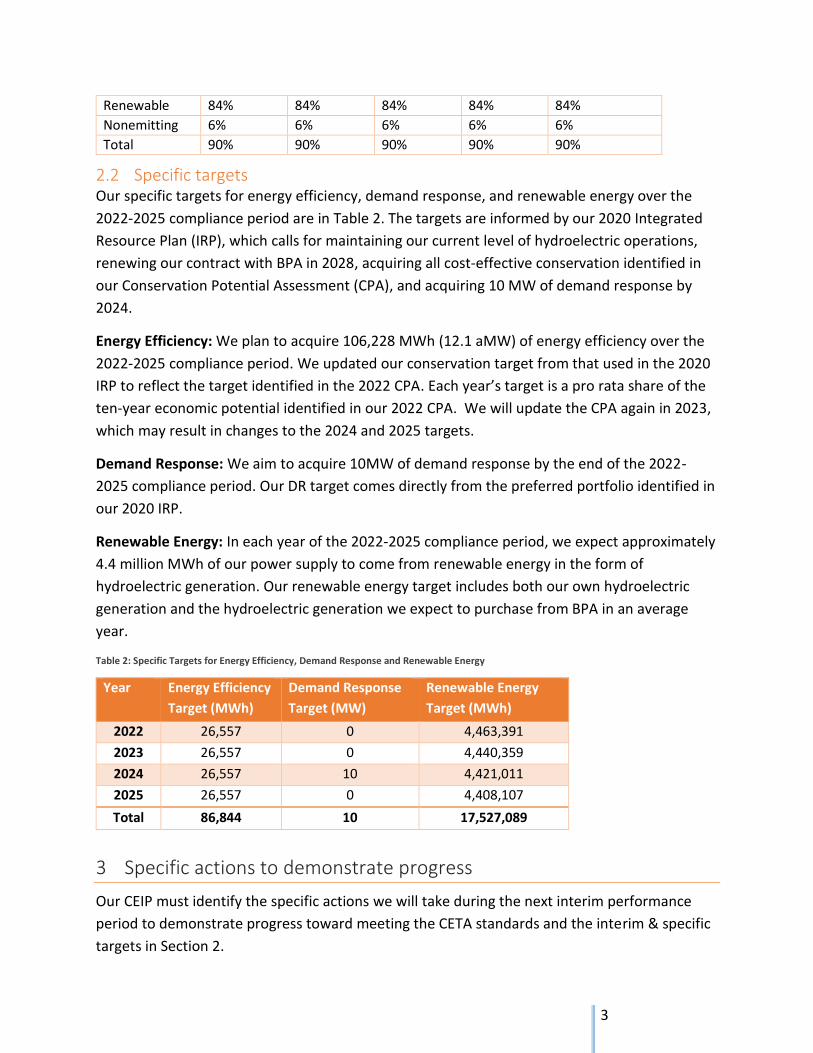
Currently, our portfolio mix is 90% renewable and 7% nonemitting (from nuclear generation
included in the generation we purchase from BPA). We estimate our renewable and
nonemitting targets by taking the current relative share of our portfolio that is renewable and
nonemitting (92.8% and 7.2%, respectively) and multiplying this relative share by our 90%
interim target. Table 8 shows the resulting breakdown of our targets for renewable and
nonemitting resources.
Table 1: Percentage of retail load served by renewable and nonemitting resources
Resource: 2022 2023 2024 2025 4-year Period
3 As the Western grid gets cleaner and new clean fuel technologies develop that allow us to reduce our reliance on the grid, it is possible that one day in the future we will be able to avoid market purchases from carbon emitting sources entirely. 4 CAISO’s EIM is not currently equipped to identify the source of generation that flows to each market participant.
3
Renewable 84% 84% 84% 84% 84% Nonemitting 6% 6% 6% 6% 6% Total 90% 90% 90% 90% 90%
2.2 Specific targets Our specific targets for energy efficiency, demand response, and renewable energy over the
2022-2025 compliance period are in Table 2. The targets are informed by our 2020 Integrated
Resource Plan (IRP), which calls for maintaining our current level of hydroelectric operations,
renewing our contract with BPA in 2028, acquiring all cost-effective conservation identified in
our Conservation Potential Assessment (CPA), and acquiring 10 MW of demand response by
2024.
Energy Efficiency: We plan to acquire 106,228 MWh (12.1 aMW) of energy efficiency over the
2022-2025 compliance period. We updated our conservation target from that used in the 2020
IRP to reflect the target identified in the 2022 CPA. Each year’s target is a pro rata share of the
ten-year economic potential identified in our 2022 CPA. We will update the CPA again in 2023,
which may result in changes to the 2024 and 2025 targets.
Demand Response: We aim to acquire 10MW of demand response by the end of the 2022-
2025 compliance period. Our DR target comes directly from the preferred portfolio identified in
our 2020 IRP.
Renewable Energy: In each year of the 2022-2025 compliance period, we expect approximately
4.4 million MWh of our power supply to come from renewable energy in the form of
hydroelectric generation. Our renewable energy target includes both our own hydroelectric
generation and the hydroelectric generation we expect to purchase from BPA in an average
year.
Table 2: Specific Targets for Energy Efficiency, Demand Response and Renewable Energy
Year Energy Efficiency
Target (MWh)
Demand Response
Target (MW)
Renewable Energy
Target (MWh)
2022 26,557 0 4,463,391
2023 26,557 0 4,440,359
2024 26,557 10 4,421,011
2025 26,557 0 4,408,107
Total 86,844 10 17,527,089
3 Specific actions to demonstrate progress
Our CEIP must identify the specific actions we will take during the next interim performance
period to demonstrate progress toward meeting the CETA standards and the interim & specific
targets in Section 2.
4
3.1 Specific actions to meet CETA standards Because all of our generation comes from our own hydroelectric plants and our BPA contract,
we expect to be able to comply with the CETA standards through at least 2044 by maintaining
our current resource portfolio and do not need to take any additional actions to make progress
toward meeting the carbon-neutral standard. Once the Department of Commerce has settled
on rules for how CETA will treat market purchases for operational purposes and participation in
organized markets and has defined in rule what in a utility’s portfolio is used to serve load, we
will be able to address CETA compliance post-2045.
3.2 Specific actions to meet interim & specific targets
3.2.1 Supply-side actions Our 2020 IRP recommends renewal of our BPA contract in September 2028 but does not
identify a need to acquire any supply-side resources over the 2022-2025 interim performance
period. As such, we do not plan to take any specific supply-side actions over the next four years.
3.2.2 Demand-side actions All of the specific actions we identify in this CEIP are demand-side actions. We identify three
specific actions: one action related to energy efficiency and two actions related to demand
response.
Specific Action 1: Acquire 86,844 MWh of energy conservation resources over the next four
years through a combination of programs for our residential, commercial and industrial
customers, as well as through some external programs.
Residential conservation programs: We have a variety of programs to help our
residential customers make their homes comfortable and save money on their electric
bills. Some of the key programs we plan to offer include insulation, windows and HVAC
upgrades for electrically heated homes, incentives on efficient equipment and custom
upgrade projects for homes with needs that fall outside of our standard programs. To
help those most in need, we will continue our long-standing efforts to reach low-income
customers by offering enhanced opportunities to meet their needs. We also plan to roll
out/pilot a new Home Energy Report (HER) program that encourage small behavioral
changes to save energy and increase awareness of available conservation programs.
Commercial and industrial conservation programs: We serve a diverse group of over
18,000 businesses. Businesses range from large facilities like industrial plants, health
care campuses, schools, and big-box retail, to small businesses such as restaurants,
clothing stores, and nail salons. To meet the needs of businesses, we offer business
owners a diverse set of conservation programs, including lighting upgrades, equipment
rebates, custom retrofits and a strategic energy management program focused on
improving efficiency in facility operations.
5
External programs: We plan to continue to collaborate with external organizations and
alliances like the Northwest Energy Efficiency Alliance to deliver energy efficiency
outside our traditional conservation programs. Other organizations implement these
“programs,” but we contribute funding or technical expertise and can claim savings they
help create.
Specific Action 2: Develop an industrial demand response rate construct by 2024.
Our 2020 IRP calls for 10 MW of demand response. We plan to work with industrial customers
to develop a mutually beneficial demand response rate construct by 2024. These industrial
demand response contracts will include necessary protocols to verify acquisition/participation
and to measure capacity resulting from demand response resources.
Specific Action 3: Complete residential demand response pilot by the end of 2024.
Because we believe that demand response will continue to be a promising resource in the
future, we are also conducting a pilot of residential demand response through smart water
heater controllers. Water heating is one of the ubiquitous electric loads in our service area, and
smart water heater controllers have the potential to provide a variety of energy services,
including load shed, load shaping, and frequency response. The pilot is in its early stages and
will help us build our capabilities to launch and manage demand response programs,
understand smart water heater controllers as a demand response resource, test customer
recruitment and maintenance strategies, and understand customer acceptance of demand
response programs.
4 Ensuring an equitable transition
In our CEIP, we must identify highly impacted communities and vulnerable populations in our
service area and report the forecasted distribution of energy and nonenergy benefits of the
specific actions we plan to take across these groups.
4.1 Highly impacted communities and vulnerable populations As directed by CETA, the Washington State Department of Health (DOH) developed a
cumulative impact analysis (CIA) to identify communities that are highly impacted by climate
change and fossil fuel pollution. Communities are identified based on census tract. DOH
provided utilities with the data that we must use to identify highly impacted communities
(HICs) within our service area. The DOH identifies 56 of the 111 (50%) census tracts in our
service area as highly impacted communities.
We use the City of Tacoma’s Equity Index to identify vulnerable populations. The Equity Index is
an interactive tool that visually highlights disparities in Tacoma and is one of the primary tools
6
that City staff, partners, and other decision makers use to help ensure they are making data-
informed decisions to improve access to opportunity for all community members. It uses 29
data points sorted into five broad categories (Accessibility, Economy, Education, Livability, and
Environmental Health) to assess where community members are less able to access services. To
create the calculations behind Tacoma Equity Index, the City of Tacoma collaborated with the
Kirwan Institute to select an array of community indicators of well-being, each of which has
been shown in the social sciences literature to influence one's ability to succeed in life. The data
for these indicators were collected at or aggregated to the census block group level, and roll up
to the overall Equity Index into a single measure based on several factors that can be compared
across the city. Census block groups are then grouped into five categories (Very Low
Opportunity, Low Opportunity, Moderate Opportunity, High Opportunity and Very High
Opportunity) based on their Equity Index score. The Equity Index originally covered only the
City of Tacoma but now covers all of Tacoma Public Utilities, including areas outside of
Tacoma’s city limits. For the purposes of the CEIP, we plan to identify vulnerable populations as
those located in “Very Low” and “Low” opportunity areas within Tacoma Power’s service area.
This approach identifies 110 of the 326 (34%) Census block groups in our service area as
vulnerable populations. A mapping of HICs and vulnerable populations for our service area is
available here.
4.2 Forecasted distribution of energy and nonenergy costs and benefits
4.2.1 Indicators to track the distribution of costs and benefits CETA directs us to identify one or more indicators applicable to our service area and associated
with energy benefits, nonenergy benefits, reduction of burdens, public health, environment,
reduction in cost, energy security, or resiliency developed through a public process. After
considering a large list of potential indicators and consulting with external stakeholders in a
public workshop, we chose to focus on three key indicators:
Energy Benefits: To track energy benefits, we will measure the share of electrically
heated homes built before 1989 that have received a high-touch conservation measure
(weatherization or HVAC). To create this indicator, we use a dataset that we update
every two years for our CPA. The dataset links customer account data, customer billing
data, county assessor data and conservation program records going back to the 1980’s.
We filter out homes built after 19885 and homes with energy consumption that appears
to indicate non-electric heat. We then use conservation program records to determine
whether each eligible home has received any weatherization or HVAC upgrades. We
calculate our indicator by dividing the total number of homes that have participated by
5 In 1989, Tacoma implemented an energy code requiring insulation in new construction homes. Thus, all homes built before then are potentially uninsulated.
7
the total number of eligible homes within a census area6. While our primary indicator
includes both single family and multifamily homes, we also look at participation among
each of these two groups separately.
Reduction of burdens: To track reduction of burdens, we measure the share of
households who are energy burdened. CETA defines energy burden as the share of
annual household income used to pay annual home energy bills. Homes for which this
share exceeds 6% are considered energy burdened. We use the US Department of
Energy’s Low-Income Energy Affordability Data (LEAD) at the census tract level to
determine the number of homes that are energy burdened. Because HICs are defined at
the census tract level, we apply tract-level data directly to each HIC. However, our
vulnerable populations are defined at the block group level, which is more granular than
a census tract. Due to this limitation, we assume that the share of energy burdened
homes within a census block group is equal to the share that are energy burdened
within the larger census tract.
Resiliency: To track resiliency, we measure the average number of service interruptions
and the average number of minutes of service interruption per year per year using
feeder-level reliability data from 2014 through 2020. Because our data are by
distribution feeder, we have to assign outage information to census areas. To do so, we
calculate a weighted average using the number of premises in each feeder and block
group area, then apply this population weight to the resiliency metrics and summarize
by census tract (for HICs) and census block group (for vulnerable popoulations). It is
important to note that these indicators, while useful, do not necessarily represent the
experience of any given customer in an area. Given the data available, we must assume
that everyone served by a feeder is affected by an outage in the same way. In reality,
however, outages can sometimes affect only a subset of customers on a feeder. As we
roll out advance metering infrastructure (AMI), our ability to represent the diversity of
customers’ reliability experience much more accurately.
Indicator development process
The process we used to develop our final list of indicators was:
1) Internal Brainstorm: We first went through an internal utility process to brainstorm
potential indicators that fit within the categories identified by CETA (energy benefits,
nonenergy benefits, reduction of burdens, public health, environment, reduction in cost,
energy security, or resiliency).
6 We calculate participation by census tract and census block group in order to look at participation among HICs and vulnerable populations, respectively.
8
2) Indicator Criteria: We then developed criteria for appropriate indicators and weeded
out indicators on the brainstorm list that did not meet our criteria. The principles we
developed were:
a. Measurable & mappable: The indicator can be measured using regionally
accepted numbers, processes and practices. We have the data to measure it and
disaggregate it by census block group and/or census tract.
b. Relevant: The indicator can be directly and substantively impacted by resource
acquisition decisions, utility expenditures or other specific actions identified in
our CEIP.
c. Timely: The indicator can be impacted within four years, and updated data are
available to measure any change over four years.
d. Meaningful: The indicator is aligned with Tacoma Power's strategy and values,
the Tacoma Public Utility Board’s Strategic Directives, and with what is important
to the community we serve.
3) Indicator Shortlist: We worked internally to further narrow down the list of potential
indicators that met the above criteria to a shortlist of the eight that we believed to be
most relevant and appropriate.
4) Public input: We held a public workshop to share our draft shortlist of potential
indicators. During the public workshop, we asked participants to (a) identify the top
indicator they would like to see added to the list of potential indicators and (b) provide
their input on which indicators we should prioritize. Each participant was given 100
points to assign however they chose across the list of potential indicators (the eight
identified by prior to the meeting plus the additions they suggested during the meeting).
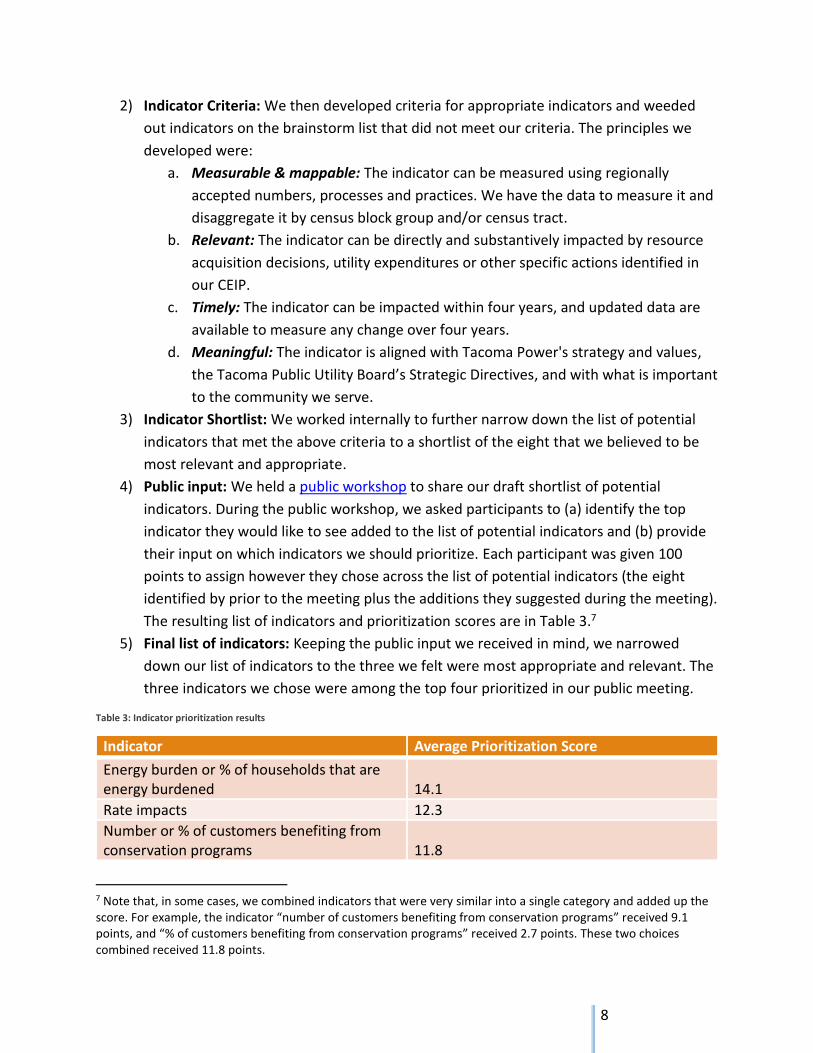
The resulting list of indicators and prioritization scores are in Table 3.7
5) Final list of indicators: Keeping the public input we received in mind, we narrowed
down our list of indicators to the three we felt were most appropriate and relevant. The
three indicators we chose were among the top four prioritized in our public meeting.
Table 3: Indicator prioritization results
Indicator Average Prioritization Score
Energy burden or % of households that are energy burdened 14.1
Rate impacts 12.3
Number or % of customers benefiting from conservation programs 11.8
7 Note that, in some cases, we combined indicators that were very similar into a single category and added up the score. For example, the indicator “number of customers benefiting from conservation programs” received 9.1 points, and “% of customers benefiting from conservation programs” received 2.7 points. These two choices combined received 11.8 points.
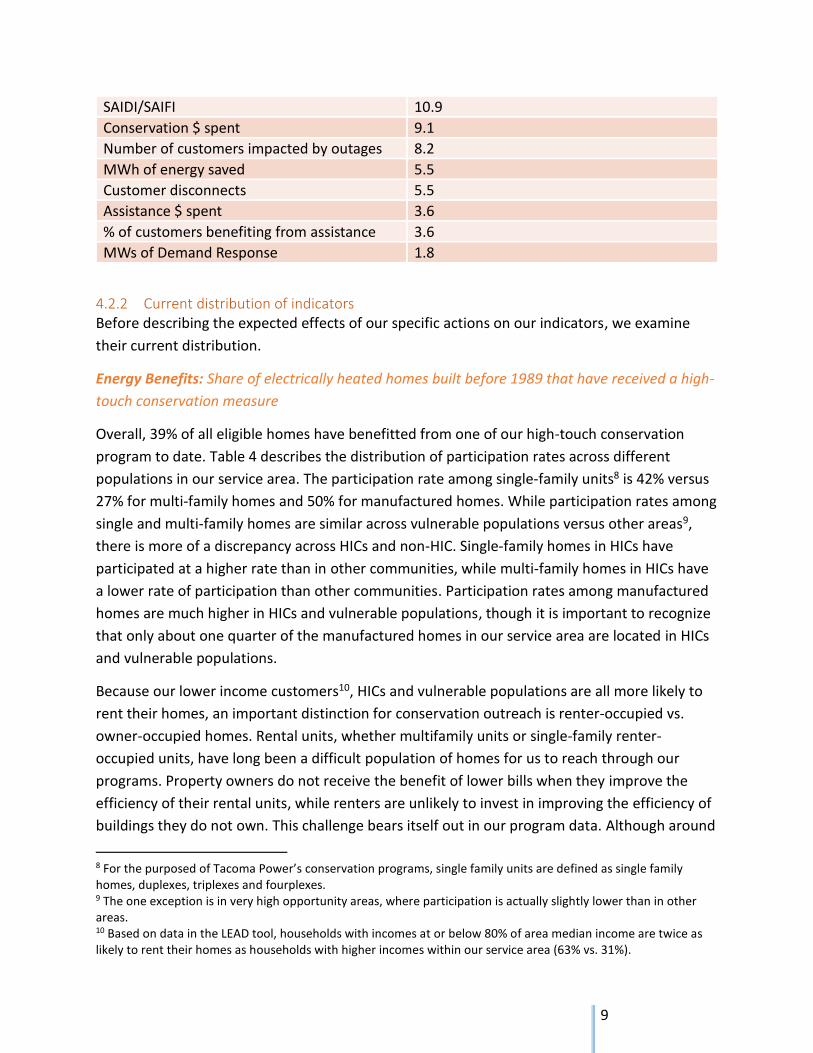
9
SAIDI/SAIFI 10.9
Conservation $ spent 9.1
Number of customers impacted by outages 8.2
MWh of energy saved 5.5
Customer disconnects 5.5
Assistance $ spent 3.6
% of customers benefiting from assistance 3.6
MWs of Demand Response 1.8
4.2.2 Current distribution of indicators Before describing the expected effects of our specific actions on our indicators, we examine
their current distribution.
Energy Benefits: Share of electrically heated homes built before 1989 that have received a high-
touch conservation measure
Overall, 39% of all eligible homes have benefitted from one of our high-touch conservation
program to date. Table 4 describes the distribution of participation rates across different
populations in our service area. The participation rate among single-family units8 is 42% versus
27% for multi-family homes and 50% for manufactured homes. While participation rates among
single and multi-family homes are similar across vulnerable populations versus other areas9,
there is more of a discrepancy across HICs and non-HIC. Single-family homes in HICs have
participated at a higher rate than in other communities, while multi-family homes in HICs have
a lower rate of participation than other communities. Participation rates among manufactured
homes are much higher in HICs and vulnerable populations, though it is important to recognize
that only about one quarter of the manufactured homes in our service area are located in HICs
and vulnerable populations.
Because our lower income customers10, HICs and vulnerable populations are all more likely to
rent their homes, an important distinction for conservation outreach is renter-occupied vs.
owner-occupied homes. Rental units, whether multifamily units or single-family renter-
occupied units, have long been a difficult population of homes for us to reach through our
programs. Property owners do not receive the benefit of lower bills when they improve the
efficiency of their rental units, while renters are unlikely to invest in improving the efficiency of
buildings they do not own. This challenge bears itself out in our program data. Although around
8 For the purposed of Tacoma Power’s conservation programs, single family units are defined as single family homes, duplexes, triplexes and fourplexes. 9 The one exception is in very high opportunity areas, where participation is actually slightly lower than in other areas. 10 Based on data in the LEAD tool, households with incomes at or below 80% of area median income are twice as likely to rent their homes as households with higher incomes within our service area (63% vs. 31%).
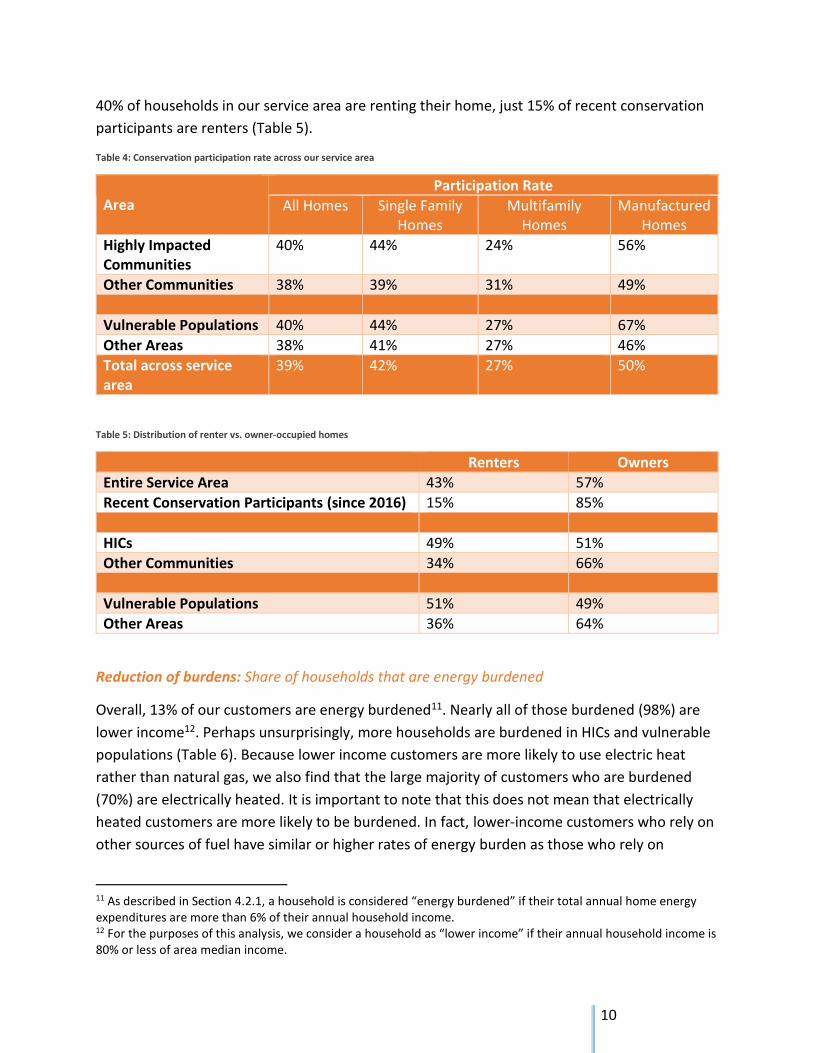
10
40% of households in our service area are renting their home, just 15% of recent conservation
participants are renters (Table 5).
Table 4: Conservation participation rate across our service area
Area
Participation Rate
All Homes Single Family Homes
Multifamily Homes
Manufactured Homes
Highly Impacted Communities
40% 44% 24% 56%
Other Communities 38% 39% 31% 49%
Vulnerable Populations 40% 44% 27% 67%
Other Areas 38% 41% 27% 46%
Total across service area
39% 42% 27% 50%
Table 5: Distribution of renter vs. owner-occupied homes
Renters Owners
Entire Service Area 43% 57%
Recent Conservation Participants (since 2016) 15% 85%
HICs 49% 51%
Other Communities 34% 66%
Vulnerable Populations 51% 49%
Other Areas 36% 64%
Reduction of burdens: Share of households that are energy burdened
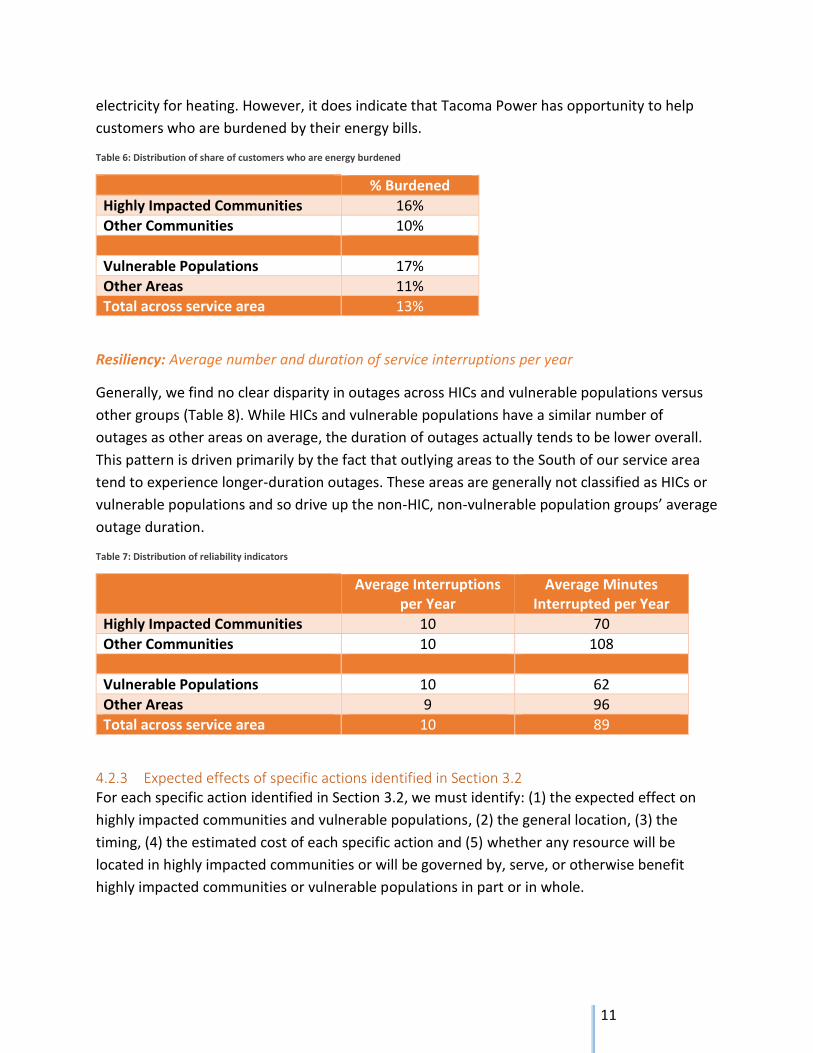
Overall, 13% of our customers are energy burdened11. Nearly all of those burdened (98%) are
lower income12. Perhaps unsurprisingly, more households are burdened in HICs and vulnerable
populations (Table 6). Because lower income customers are more likely to use electric heat
rather than natural gas, we also find that the large majority of customers who are burdened
(70%) are electrically heated. It is important to note that this does not mean that electrically
heated customers are more likely to be burdened. In fact, lower-income customers who rely on
other sources of fuel have similar or higher rates of energy burden as those who rely on
11 As described in Section 4.2.1, a household is considered “energy burdened” if their total annual home energy expenditures are more than 6% of their annual household income. 12 For the purposes of this analysis, we consider a household as “lower income” if their annual household income is 80% or less of area median income.
11
electricity for heating. However, it does indicate that Tacoma Power has opportunity to help
customers who are burdened by their energy bills.
Table 6: Distribution of share of customers who are energy burdened
% Burdened
Highly Impacted Communities 16%
Other Communities 10%
Vulnerable Populations 17%
Other Areas 11%
Total across service area 13%
Resiliency: Average number and duration of service interruptions per year
Generally, we find no clear disparity in outages across HICs and vulnerable populations versus
other groups (Table 8). While HICs and vulnerable populations have a similar number of
outages as other areas on average, the duration of outages actually tends to be lower overall.
This pattern is driven primarily by the fact that outlying areas to the South of our service area
tend to experience longer-duration outages. These areas are generally not classified as HICs or
vulnerable populations and so drive up the non-HIC, non-vulnerable population groups’ average
outage duration.
Table 7: Distribution of reliability indicators
Average Interruptions per Year
Average Minutes Interrupted per Year
Highly Impacted Communities 10 70
Other Communities 10 108
Vulnerable Populations 10 62
Other Areas 9 96
Total across service area 10 89
4.2.3 Expected effects of specific actions identified in Section 3.2 For each specific action identified in Section 3.2, we must identify: (1) the expected effect on
highly impacted communities and vulnerable populations, (2) the general location, (3) the
timing, (4) the estimated cost of each specific action and (5) whether any resource will be
located in highly impacted communities or will be governed by, serve, or otherwise benefit
highly impacted communities or vulnerable populations in part or in whole.
12
Specific Action 1: Acquire 86,844 MWh of energy conservation resources over the next four
years through a combination of programs for our residential, commercial and industrial
customers, as well as through some external programs.
Expected effect: We expect to see an increase in the share of eligible single and multi-
family homes that have received a high-touch conservation measure. Based on our best
available information from our 2022 CPA13, we estimate our conservation potential is
distributed evenly across HICs and non-HICs and across vulnerable populations and
other groups. We expect a similarly even split in the increase in the share of homes
receiving a high-touch conservation measure over the next four years.
Location: We plan to acquire conservation throughout our service area, including in
HICs and census block groups we consider vulnerable populations.
Cost: Our 2022 CPA estimates the average levelized cost of cost-effective conservation
to be approximately $138/MWh on average, which is approximately 33% higher than in
the last CPA. This is largely because many lower-cost conservation opportunities are no
longer available thanks to a combination of more rigorous codes and standards, higher
adoption of energy efficient products and past successes in acquiring energy efficiency
through our programs. The biggest contributor to that is commercial lighting. We only
have about 4 years left of this core lighting measures. It is important to note that the
total cost estimated in the CPA does not reflect the expected costs of the conservation
programs we develop to actually achieve our conservation targets. Our next two
conservation plans, which will not be complete in time to inform this CEIP, will develop
the budgets needed to meet our targets over the next four years.
Specific Action 2: Develop an industrial demand response rate construct by 2024.
Expected effect: Because we aim to acquire this DR in order to maintain resource
adequacy and we do not currently plan to use it as a distribution system resource, we
expect it to help maintain but not change our current reliability level. As a result, we do
not expect to see any change in the distribution of our reliability indicators within HICs
or vulnerable populations.
Location: We expect that the industrial DR would be located in the tideflats area of our
service area, which is within a census tract identified as a highly impacted community.
13 For the 2022 CPA, we assume that the distribution of potential was equal to the distribution of annual energy consumption across HICs versus non-HICs and across census block groups identified as vulnerable populations versus others. Energy consumption is evenly split across these categories, so we assume that the conservation potential is evenly split and that our energy efficiency acquisition will be as well. We recognize that this may not be the case and plan to conduct a potential assessment specifically for HICs and vulnerable populations in the next CPA as well as continue to evaluate the distribution of our acquisition across HICs and vulnerable populations.
13
Cost: Our 2020 IRP estimates that the incremental cost of adding 10MW of industrial DR
to be approximately $3.6 to $7.8 million over the 20-year IRP study period ($300,000 to
$700,000 annually).
Specific Action 3: Complete residential demand response pilot by the end of 2024.
Expected effect: Our residential DR pilot aims to oversample low-income customers in
order to understand how a potential DR program might work for them. However, this is
a small-scale pilot project with a one-time $80 incentive for participation. As such, we
do not expect it to have a direct impact on reliability or overall energy burden for any of
our customers, including HICs and vulnerable populations. However, we believe that
demand response presents a promising opportunity for customers in HICs and
vulnerable populations to participate in Washington’s clean energy transition and to
support service reliability within their communities. This pilot will help us build our
capabilities to be able to offer them demand response opportunities in the future.
Lessons learned from this pilot will also help us offer programs to customers in HICs and
vulnerable populations to help them manage their energy use under future time of use
rate constructs, potentially saving customers money on their bills.
Location: We plan to conduct this pilot throughout our service area, including in HICs
and census block groups we consider vulnerable populations.
Cost: We estimate that this pilot will cost between $142,000 and $192,000.
4.2.4 Consistency with utility’s long-term strategies With the exception of our conservation target, our interim and specific targets come directly
from our most recent (2020) Integrated Resource Plan. Our conservation target comes from our
most recent (2022) Conservation Potential Assessment.
4.2.5 Reducing risks to HICs and vulnerable populations We are already well positioned to comply with CETA’s standards and do not anticipate the
state’s transition to cleaner energy to increase risks to highly impacted communities and
vulnerable populations in our service area. Because we expect that the risks faced by highly
impacted communities and vulnerable populations in our service area will remain largely the
same as the state transitions to cleaner energy, we plan to build on our current tools to reduce
financial risks for low-income customers. We plan to continue to rely on a combination of bill
assistance programs and residential energy conservation programs targeted at low-income and
hard-to-reach homes to help mitigate risks to HICs and vulnerable populations and seek new
opportunities to help them participate in Washington’s energy transition. Certain of our Public
Utility Board’s Strategic Directives also commit the utility to take action to reduce risks to HICs
and vulnerable populations.
14
Bill assistance
We offer two programs to help our limited-income customers: a Discount Rate Program and a
Bill Credit Assistance Plan. Our discount rate program offers a discount on utility services14 to
income-qualified customers who are aged 62 years and older or currently qualify to receive
disability income. Our Bill Credit Assistance Plan (BCAP) provides a credit to income
participating customers’ bills each time their utility bill is paid in full and on time. Eligible
households can receive up to $252 per year for electric bill assistance.
In addition to our standard assistance programs, Tacoma Public Utilities and Environmental
Services funded an COVID Emergency Assistance Program in the amount of 2.4 million dollars.
Finally, in accordance with state law (RCW 35.21.300), we also offer a winter protection
program that avoids disconnects for qualifying customers between November 15 and March 15
and work with customers who get behind on bills to develop a payment arrangement.
Every two years, we take a close look at our assistance programs to determine whether we
need to adjust them. Our most recent round of program re-examination took place in 2020 and
resulted in us making three important changes to our assistance programs. First, we changed
our income eligibility requirement from 150% of the federal poverty line to 45% and 60% of
area median income for our rate discount and bill assistance programs, respectively. This
change means that approximately 5,000 more households can benefit from our rate discount
program and 15,000 more households can benefit from our bill assistance programs. Second,
we increased the credit amount available through our BCAP program from 30% of a customer’s
bill to 35%. Third, we plan to extend the length of time we allow customers to pay arrears
through installment plans from 12 weeks to 24 months. This change will take effect in 2022,
when we transition out of our COVID-related moratorium on disconnecting customers. We plan
to continue this biannual process of re-examining our assistance programs.
Targeted residential energy conservation
Tacoma Power is proud to be a regional leader in serving limited-income customers. We have a
long history of offering one of the most comprehensive and robust limited-income conservation
programs in the region. Our current program offering helps our limited-income customers by
combining our standard rebate with a zero-interest deferred loan. This combination allows
people to reduce bills now and pay for improvements through equity in their home when they
either sell, refinance, or when occupancy changes. We plan to continue this program and
continue to explore opportunities to help homeowners with limited incomes access efficiency
opportunities.
14 This program is a Tacoma Public Utilities-wide program and also offers discounts on drinking water, solid waste, recycling and surface water in addition to discounts on electricity.
15
We also plan to continue our work to increase the number of rental units served by our
programs. The efficiency industry has struggled since the 1970s to help renters because
property owners do not receive the benefit of lower bills when they invest in energy-saving
improvements, and renters do not make energy efficiency investments in buildings they do not
own. We will continue efforts to explore new ways to solve this “split incentive” problem.
New customer opportunities
We are committed to finding ways to ensure that all of our customers have access to new clean
energy opportunities, especially those who are at risk of being excluded from the state’s
transition due to financial or other barriers. Recently, we have initiated/explored several pilot
projects to improve access to electric vehicle charging in our community. We are currently
supporting projects for EV charging installations at homes, multifamily properties, and
businesses. We are also exploring an opportunity to support development of a car share pilot in
a continued effort to make EVs available in limited-income areas.
Public Utility Board Strategic Directives
Several years ago, the Tacoma Public Utility Board launched policy development of Government
Process, Board-Director Linkage, and Strategic Directives. The Strategic Directives capture the
performance for which the Board will hold TPU accountable on behalf of its ratepayers. At of
the completion of this CEIP, there are fourteen Strategic Directives adopted by the Board and
one directive related to affordability still in development. While many of them are relevant to
ensuring a successful transition to clean energy in the state of Washington, Strategic Directive 1
(SD1) focuses on equity and inclusion and is particularly relevant to ensuring that the transition
is equitable. SD1 formally commits TPU to achieving equity and inclusion in our workforce,
service delivery, policy decision making, and community/stakeholder engagement and measure
progress in part by tracking the number of projects, actions, and initiatives including an equity
lens in our analyses, planning, and implementation. We expect that a forthcoming Strategic
Directive related to affordability will also be particularly relevant.
5 Use of alternative compliance options
There is no compliance obligation under CETA until 2030. As a result, while we expect to retire
RECs to comply with the Energy Independence Act (EIA), we will not need to use any alternative
compliance options to comply with CETA during the 2022-2025 compliance period.
6 Resource adequacy standard
CETA also requires utilities that prepare IRPs to establish a standard for resource adequacy by
January 1, 2022 that addresses: (a) measures of adequacy, such as peak load standards and loss
16
of load probability or loss of load expectation, (b) methods of measurement, such as
probabilistic assessments of resource adequacy, and (c) measures of resource contribution to
resource adequacy, such as effective load carrying capability applicable to all resources
available to the utility including, but not limited to, renewable, storage, hybrid, and demand
response resources.
6.1 Measure of adequacy Our 2020 IRP adequacy standard is based on three probabilistic measures of adequacy:
1) Magnitude standard: Annual expected capacity shortage of no more than 0.001% of load
per year (NEUE of 0.001% per year). Error! Reference source not found. describes how
NEUE is calculated.
2) Duration standard: No more than 2.4 hour of capacity shortage per year (LOLH of 2.4
hours per year). Error! Reference source not found. describes how LOLH is calculated.
3) Frequency standard: No more than 2 days with a capacity shortage of any magnitude or
duration every ten years, or 0.2 events per year (LOLE of 0.2 per year). Error! Reference
source not found. describes how LOLE is calculated.
If a portfolio meets all three standards, we consider it adequate. If a portfolio fails to meet one
of the standards, we consider it inadequate.
6.2 Method of Measurement Our 2020 IRP uses a probabilistic approach to measure adequacy. We run each portfolio
through 58 different historic weather years (which includes both inflow conditions and
temperatures seen in a historical calendar year) and four alternative load growth trajectories
through scenario analysis (232 simulations total). We also run the preferred portfolio through
58 simulated water and temperature conditions under climate change (20 years’ worth of
projections from 3 separate sets of climate change projections).
6.3 Measures of resource contribution Tacoma Power’s system model is not currently capable of calculating Effective Load Carrying
Capability (ELCC). We are working to create that functionality and hope to have it in place
before the next CEIP is due in 2026. In the meantime, we have developed an interim approach
to help us to compare the relative contribution of different resources to adequacy. Our interim
approach simply compares shortfall size, duration and frequency of a base portfolio (Tacoma
Power generation + BPA Slice/Block) to portfolios that add one other resource (wind, solar and
demand response). We then calculate the average percent reduction in shortfall across years
and divide by the nameplate capacity of the added resource to calculate a percent shortfall
reduction per MW of a given resource. Table 8 presents those results.
17
Table 8: Measures of resource contribution
Resource % Reduction in UE per MW
% Reduction in LOLH per MW
% Reduction in LOLE per MW
Wind -0.5% -0.5% -0.4%
Solar 0.0% 0.0% 0.0%
Demand Response -3.2% -2.3% -1.7%
7 Public input process
Our public input process for the CEIP builds upon our existing IRP process and centers on public
workshops. Our workshops are open to the public, and anyone is welcome to participate. We
advertise the workshops to all of our customers on our website, through social media and via a
targeted mailing list. We make a concerted effort to secure participation from individuals
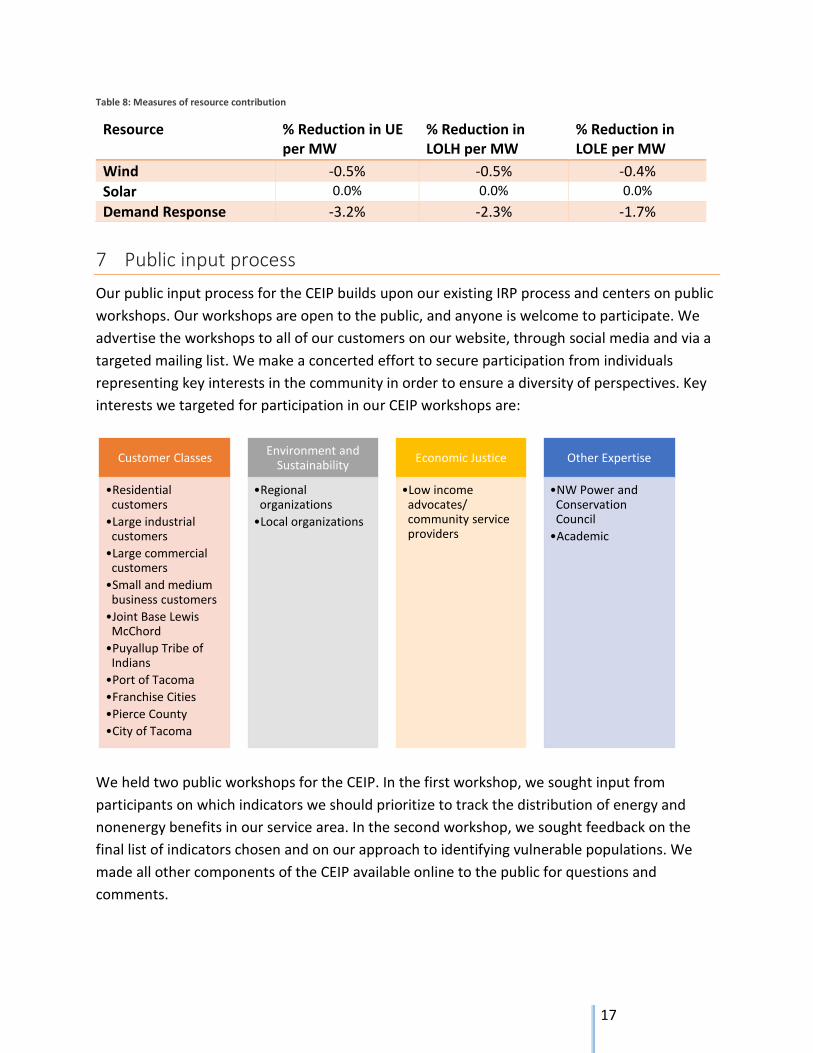
representing key interests in the community in order to ensure a diversity of perspectives. Key
interests we targeted for participation in our CEIP workshops are:
We held two public workshops for the CEIP. In the first workshop, we sought input from
participants on which indicators we should prioritize to track the distribution of energy and
nonenergy benefits in our service area. In the second workshop, we sought feedback on the
final list of indicators chosen and on our approach to identifying vulnerable populations. We
made all other components of the CEIP available online to the public for questions and
comments.
Customer Classes
•Residential customers
•Large industrial customers
•Large commercial customers
•Small and medium business customers
•Joint Base Lewis McChord
•Puyallup Tribe of Indians
•Port of Tacoma
•Franchise Cities
•Pierce County
•City of Tacoma
Environment and Sustainability
•Regional organizations
•Local organizations
Economic Justice
•Low income advocates/ community service providers
Other Expertise
•NW Power and Conservation Council
•Academic

18
We have also started to test out the use of occasional, one-question surveys via social media,
on our website and administered during community presentations outside of our normal
workshops to seek input from community members who are not able to participate in
workshops. We received a very small number of responses to our first mini-survey focused on
customer priorities for CEIP indicators but plan to continue to test out the use of mini-surveys
as part of our IRP and CEIP process.
We recognize that we still have more work to do to overcome barriers to participation, and we
are committed to continuing to improve our approach.