Embed Size (px)
Citation preview
1
Table Tennis Fault Serve Detection
Team 9 – Shraddha Dangi, Katelyn Riehl, and Vishesh Verma ECE445 Design Document – Spring 2017
TA: Zipeng Wang
Table Tennis Fault Serve Detection
Team 9 – Shraddha Dangi, Katelyn Riehl, and Vishesh Verma ECE445 Mock Design – Spring 2017
TA: Zipeng Wang
Table Tennis Fault Serve Detection
Team 9 – Shraddha Dangi, Katelyn Riehl, and Vishesh Verma ECE445 Mock Design – Spring 2017
TA: Zipeng Wang
Table Tennis Fault Serve Detection
Team 9 – Shraddha Dangi, Katelyn Riehl, and Vishesh Verma
2
Contents
Table Tennis Fault Serve Detection 1
1. Introduction 3
1.1 Objective 3
1.2 Background 3
1.3 High-Level Requirements 3
2 Design 4
2.1 Block Diagram 4
2.2 Physical Design 5
2.3 Sensor Module 7
2.3.1 Ultrasonic Sensor 7
2.3.3 ATMega Microcontroller 16
2.3.3 Bluetooth Transmitter 16
2.4 Camera Module 16
2.4.1 Camera 16
2.4.2 RPi Microcontroller 17
2.5 Output Display 19
2.5.1 Display LEDs 19
2.6 Power Supply 19
2.6.1 Battery 19
2.6.2 Power Converter 19
2.7 Tolerance Analysis 21
2.8 Requirements and Verification 22
3 Cost and Schedule 25
3.1 Cost Analysis 25
3.2 Schedule 27
4 Safety and Ethics 29
References 30
3
1. Introduction
1.1 Objective In table tennis, the service is the most crucial part of every point. It dictates the style and pace of
play for the point. In doubles, service becomes even more restrictive where the player can only
serve from the right half of his side to the diagonally opposite side of the opponent. Often players
try to “jam” the opponent with a serve along the centerline of the table. However, with the speed of
the ball and heavy spin generated, it is very difficult for the umpire to determine if a serve was “in”
or “out” since he or she is sitting at the side of the table. With organizations like the National
Collegiate Table Tennis Association (NCTTA), a doubles match is used as a tiebreaker between two
teams who had split results in the singles stage. In such high-stakes matches, even one mistaken
call can affect which teams move on in the competition.
Our goal for this semester is to design a table tennis fault serve detector. The detection system
must be integrated into the table and must not interfere with gameplay. This means that all
equipment must be confined to either the area on the net post or underneath the table. A camera
located near the umpire’s table will observe the table and determine when a ball is in the field of
play using image processing methods on a Raspberry Pi (RPi) microcontroller. Simultaneously,
there are two ultrasonic sensors connected to the net posts observing the table. The output from
these sensors will be transmitted to the RPi through Bluetooth from the AtMega controller under
the table. This data will include the correct call for the play. Once the ball’s height reaches a
threshold level as determined by the camera/image processing, the RPi will interpret sensor data
for that point in time and send the corresponding “in” or “out” signal to the display.
1.2 Background Currently, there are no devices on the market that detect the validity of the serve for specifically
table tennis. However, there are systems, such as Hawk-Eye, used in many sports including tennis
and cricket to track the position of the ball. Hawk-Eye technology combines the views from at least
six cameras to produce a 3D perspective of the ball’s trajectory [1]. Although Hawk-Eye is highly
accurate, it would not be practical to implement such a system in table tennis. These systems are
very expensive, and at times, there are several table tennis games occurring at once. This would
result in the need for many systems. By developing a cost-effective, compact serve detector,
implementation of such systems in table tennis would be more feasible.
1.3 High-Level Requirements
• Requirement 1: The device must not be placed anywhere on the table to minimize any hindrance to the game.
• Requirement 2: The system must be able to operate for at least 45 minutes. • Requirement 3: System must be accurate within 5 mm as the width of the middle white line
is 3mm.
4
2 Design
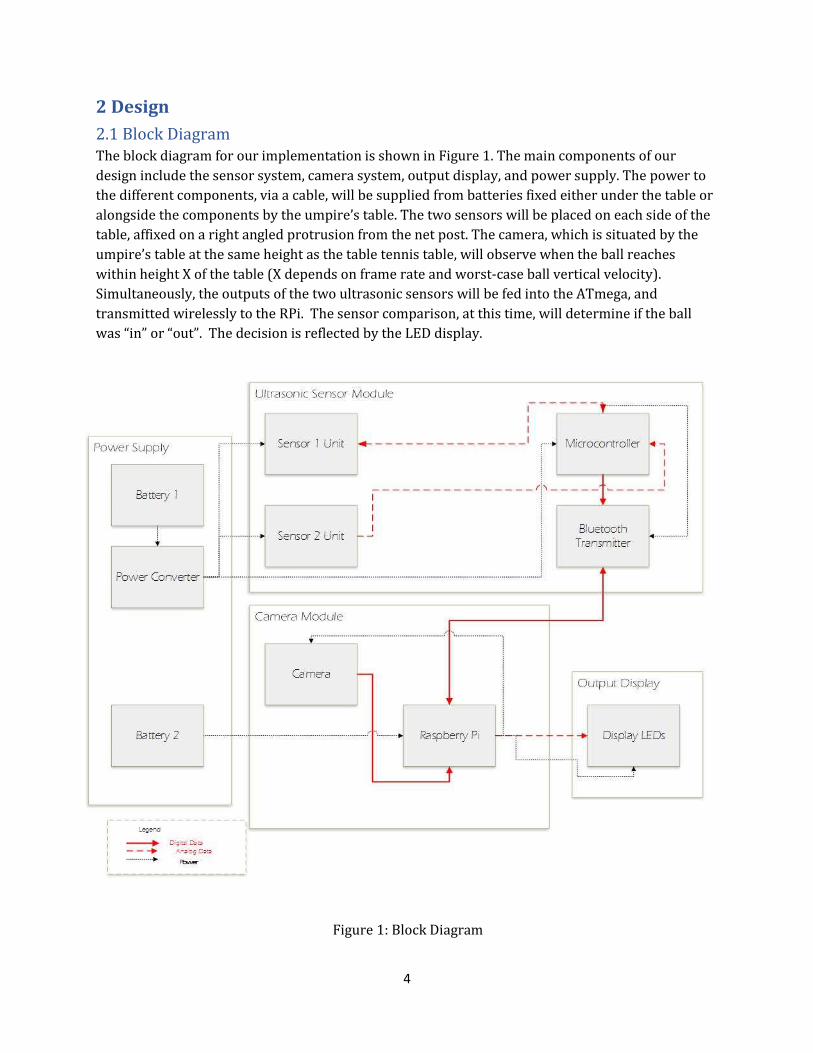
2.1 Block Diagram The block diagram for our implementation is shown in Figure 1. The main components of our
design include the sensor system, camera system, output display, and power supply. The power to
the different components, via a cable, will be supplied from batteries fixed either under the table or
alongside the components by the umpire’s table. The two sensors will be placed on each side of the
table, affixed on a right angled protrusion from the net post. The camera, which is situated by the
umpire’s table at the same height as the table tennis table, will observe when the ball reaches
within height X of the table (X depends on frame rate and worst-case ball vertical velocity).
Simultaneously, the outputs of the two ultrasonic sensors will be fed into the ATmega, and
transmitted wirelessly to the RPi. The sensor comparison, at this time, will determine if the ball
was “in” or “out”. The decision is reflected by the LED display.
Figure 1: Block Diagram
5
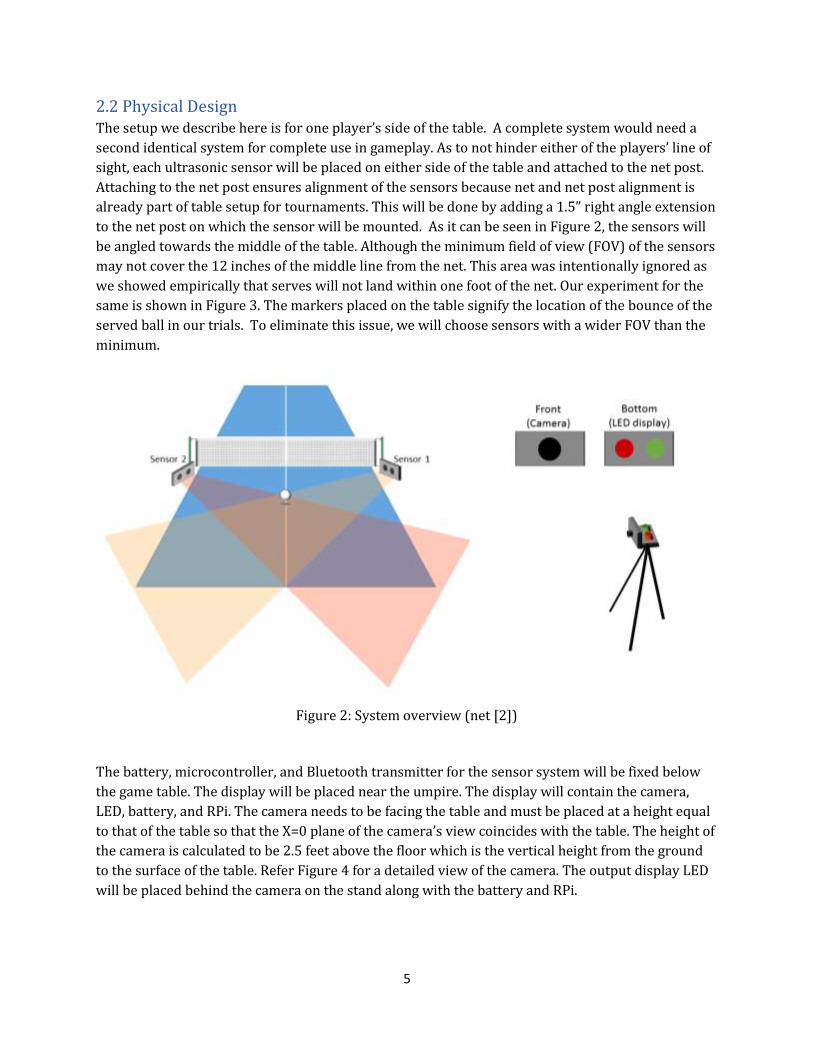
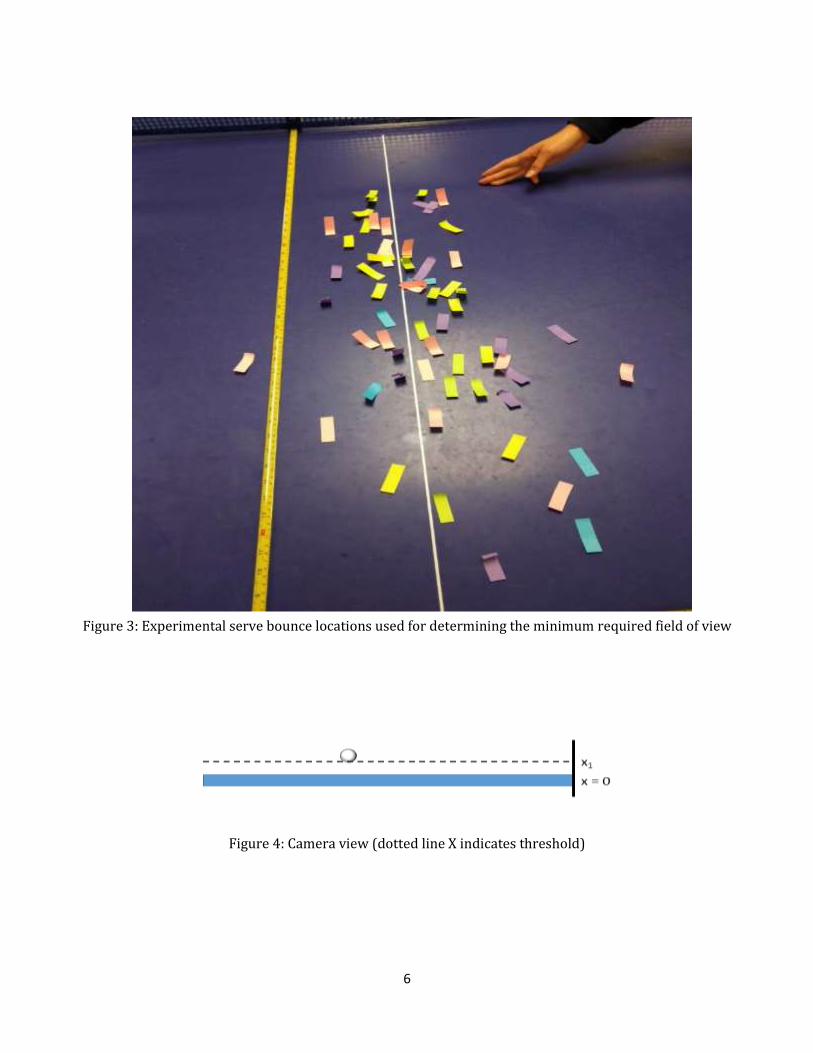
2.2 Physical Design The setup we describe here is for one player’s side of the table. A complete system would need a
second identical system for complete use in gameplay. As to not hinder either of the players’ line of
sight, each ultrasonic sensor will be placed on either side of the table and attached to the net post.
Attaching to the net post ensures alignment of the sensors because net and net post alignment is
already part of table setup for tournaments. This will be done by adding a 1.5” right angle extension
to the net post on which the sensor will be mounted. As it can be seen in Figure 2, the sensors will
be angled towards the middle of the table. Although the minimum field of view (FOV) of the sensors
may not cover the 12 inches of the middle line from the net. This area was intentionally ignored as
we showed empirically that serves will not land within one foot of the net. Our experiment for the
same is shown in Figure 3. The markers placed on the table signify the location of the bounce of the
served ball in our trials. To eliminate this issue, we will choose sensors with a wider FOV than the
minimum.
The battery, microcontroller, and Bluetooth transmitter for the sensor system will be fixed below
the game table. The display will be placed near the umpire. The display will contain the camera,
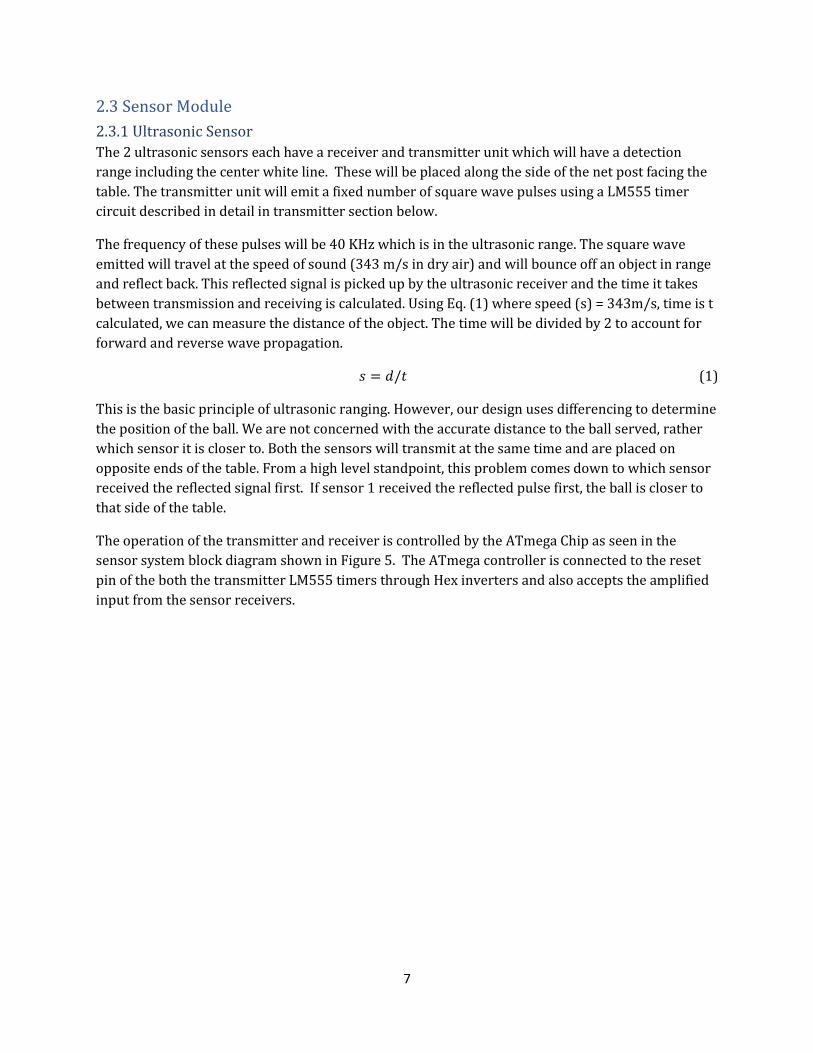
LED, battery, and RPi. The camera needs to be facing the table and must be placed at a height equal
to that of the table so that the X=0 plane of the camera’s view coincides with the table. The height of
the camera is calculated to be 2.5 feet above the floor which is the vertical height from the ground
to the surface of the table. Refer Figure 4 for a detailed view of the camera. The output display LED
will be placed behind the camera on the stand along with the battery and RPi.
Figure 2: System overview (net [2])
6
Figure 4: Camera view (dotted line X indicates threshold)
Figure 3: Experimental serve bounce locations used for determining the minimum required field of view
7
2.3 Sensor Module
2.3.1 Ultrasonic Sensor
The 2 ultrasonic sensors each have a receiver and transmitter unit which will have a detection
range including the center white line. These will be placed along the side of the net post facing the
table. The transmitter unit will emit a fixed number of square wave pulses using a LM555 timer
circuit described in detail in transmitter section below.
The frequency of these pulses will be 40 KHz which is in the ultrasonic range. The square wave
emitted will travel at the speed of sound (343 m/s in dry air) and will bounce off an object in range
and reflect back. This reflected signal is picked up by the ultrasonic receiver and the time it takes
between transmission and receiving is calculated. Using Eq. (1) where speed (s) = 343m/s, time is t
calculated, we can measure the distance of the object. The time will be divided by 2 to account for
forward and reverse wave propagation.
𝑠 = 𝑑/𝑡 (1)
This is the basic principle of ultrasonic ranging. However, our design uses differencing to determine
the position of the ball. We are not concerned with the accurate distance to the ball served, rather
which sensor it is closer to. Both the sensors will transmit at the same time and are placed on
opposite ends of the table. From a high level standpoint, this problem comes down to which sensor
received the reflected signal first. If sensor 1 received the reflected pulse first, the ball is closer to
that side of the table.
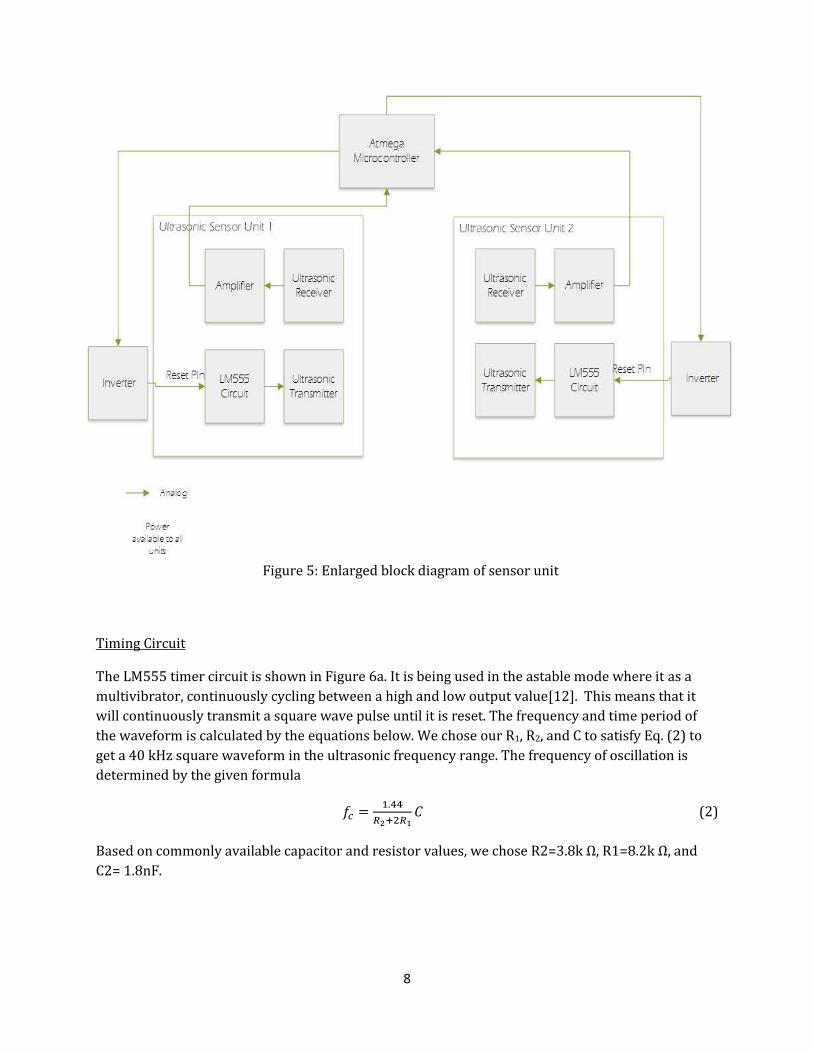
The operation of the transmitter and receiver is controlled by the ATmega Chip as seen in the
sensor system block diagram shown in Figure 5. The ATmega controller is connected to the reset
pin of the both the transmitter LM555 timers through Hex inverters and also accepts the amplified
input from the sensor receivers.
8
Timing Circuit
The LM555 timer circuit is shown in Figure 6a. It is being used in the astable mode where it as a
multivibrator, continuously cycling between a high and low output value[12]. This means that it
will continuously transmit a square wave pulse until it is reset. The frequency and time period of
the waveform is calculated by the equations below. We chose our R1, R2, and C to satisfy Eq. (2) to
get a 40 kHz square waveform in the ultrasonic frequency range. The frequency of oscillation is
determined by the given formula
𝑓𝑐 =1.44
𝑅2+2𝑅1𝐶 (2)
Based on commonly available capacitor and resistor values, we chose R2=3.8k Ω, R1=8.2k Ω, and
C2= 1.8nF.
Figure 5: Enlarged block diagram of sensor unit
9
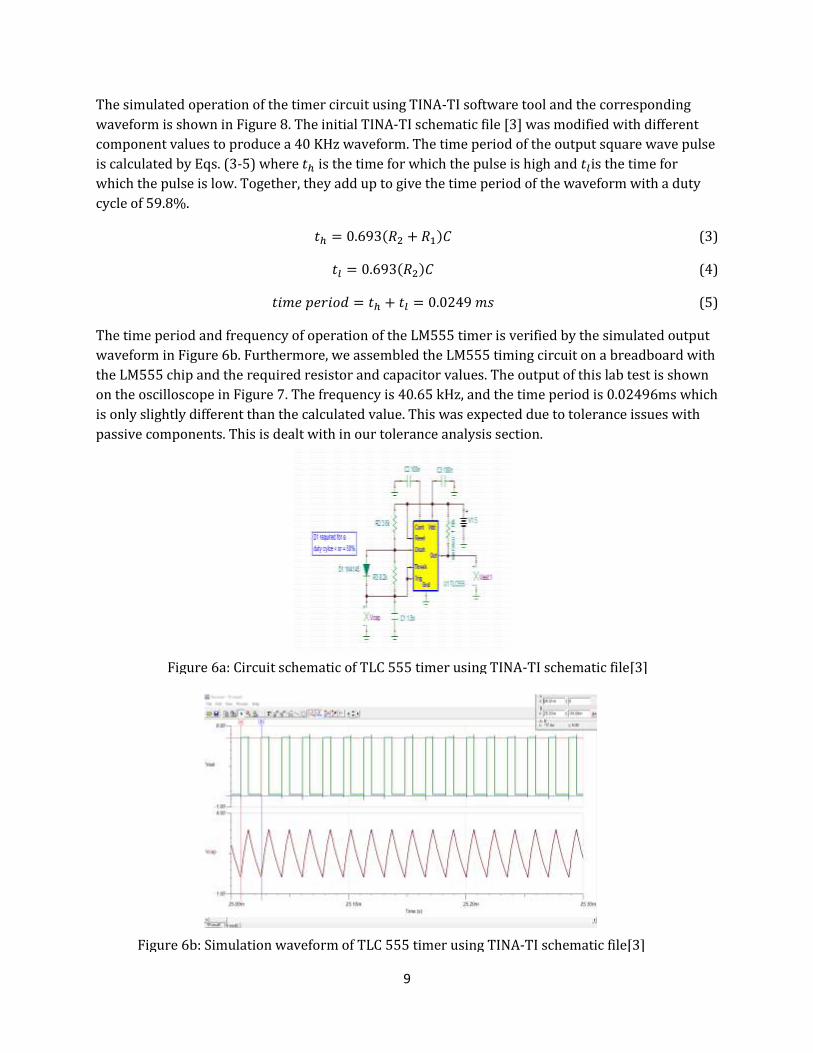
The simulated operation of the timer circuit using TINA-TI software tool and the corresponding
waveform is shown in Figure 8. The initial TINA-TI schematic file [3] was modified with different
component values to produce a 40 KHz waveform. The time period of the output square wave pulse
is calculated by Eqs. (3-5) where 𝑡ℎ is the time for which the pulse is high and 𝑡𝑙is the time for
which the pulse is low. Together, they add up to give the time period of the waveform with a duty
cycle of 59.8%.
𝑡ℎ = 0.693(𝑅2 + 𝑅1)𝐶 (3)
𝑡𝑙 = 0.693(𝑅2)𝐶 (4)
𝑡𝑖𝑚𝑒 𝑝𝑒𝑟𝑖𝑜𝑑 = 𝑡ℎ + 𝑡𝑙 = 0.0249 𝑚𝑠 (5)
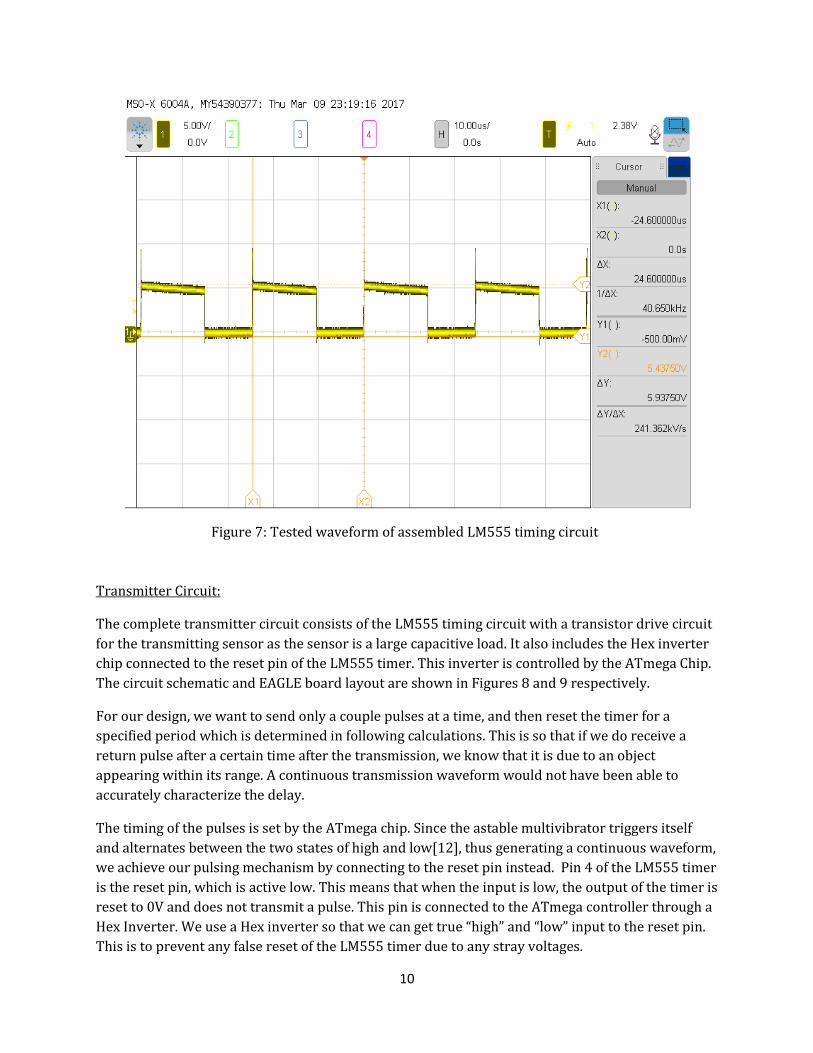
The time period and frequency of operation of the LM555 timer is verified by the simulated output
waveform in Figure 6b. Furthermore, we assembled the LM555 timing circuit on a breadboard with
the LM555 chip and the required resistor and capacitor values. The output of this lab test is shown
on the oscilloscope in Figure 7. The frequency is 40.65 kHz, and the time period is 0.02496ms which
is only slightly different than the calculated value. This was expected due to tolerance issues with
passive components. This is dealt with in our tolerance analysis section.
Figure 6a: Circuit schematic of TLC 555 timer using TINA-TI schematic file[3]
Figure 6b: Simulation waveform of TLC 555 timer using TINA-TI schematic file[3]
10
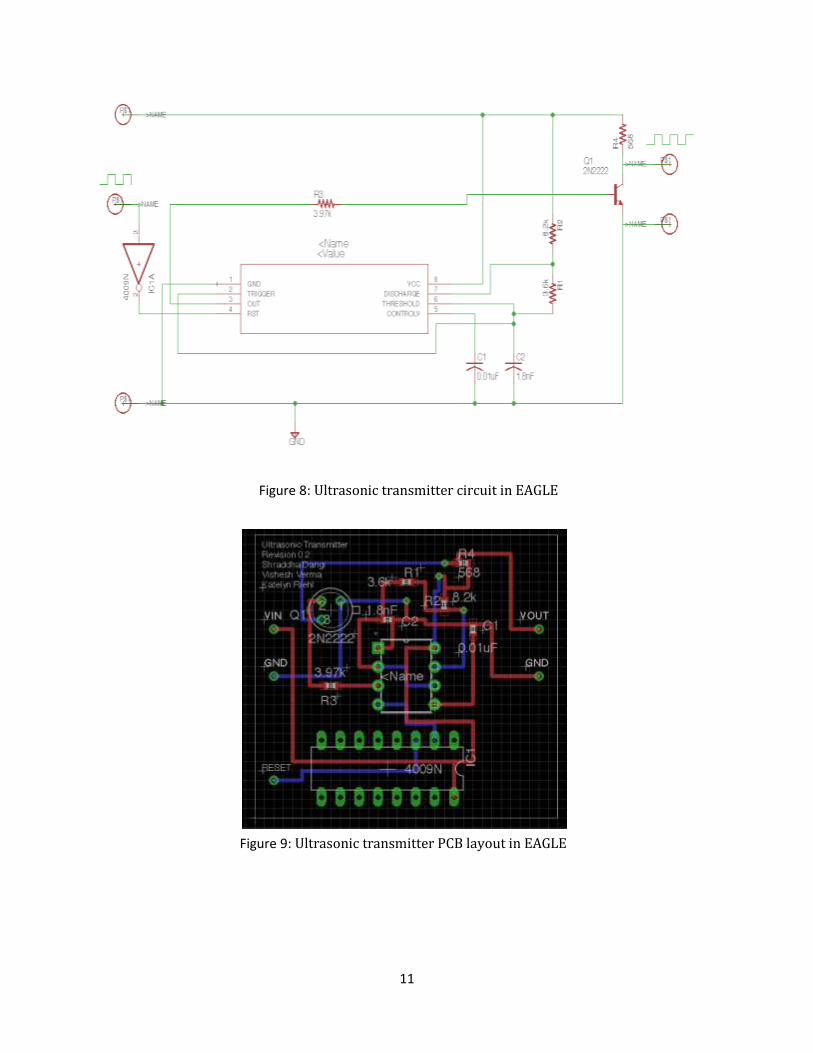
Transmitter Circuit:
The complete transmitter circuit consists of the LM555 timing circuit with a transistor drive circuit
for the transmitting sensor as the sensor is a large capacitive load. It also includes the Hex inverter
chip connected to the reset pin of the LM555 timer. This inverter is controlled by the ATmega Chip.
The circuit schematic and EAGLE board layout are shown in Figures 8 and 9 respectively.
For our design, we want to send only a couple pulses at a time, and then reset the timer for a
specified period which is determined in following calculations. This is so that if we do receive a
return pulse after a certain time after the transmission, we know that it is due to an object
appearing within its range. A continuous transmission waveform would not have been able to
accurately characterize the delay.
The timing of the pulses is set by the ATmega chip. Since the astable multivibrator triggers itself
and alternates between the two states of high and low[12], thus generating a continuous waveform,
we achieve our pulsing mechanism by connecting to the reset pin instead. Pin 4 of the LM555 timer
is the reset pin, which is active low. This means that when the input is low, the output of the timer is
reset to 0V and does not transmit a pulse. This pin is connected to the ATmega controller through a
Hex Inverter. We use a Hex inverter so that we can get true “high” and “low” input to the reset pin.
This is to prevent any false reset of the LM555 timer due to any stray voltages.
Figure 7: Tested waveform of assembled LM555 timing circuit
11
Figure 9: Ultrasonic transmitter PCB layout in EAGLE
Figure 8: Ultrasonic transmitter circuit in EAGLE
12
The time in between reset signals is determined by the furthest distance the sensor can “see”. For
example, if the ball is at the farthest corner of the table from the sensor diagonally 6.7ft away, a
wave reflected from that ball will reach the receiver in 11.9 ms at room temperature. We add a
buffer of 3 feet to this distance as the player stands within that range and his/her movements could
also reflect back to the sensor. Therefore, our total distance of concern is 9.7 feet, and the
corresponding time between transmit and receive for that distance is 17.2 ms at room temperature.
If our sensing timing is less than that, the sensor could detect delayed excitation at the receiver as a
newly transmitted pulse would have been sent in the time that we are still receiving the previous
transmission reflection. Therefore, we set our reset time to 17.2 ms.
As calculated before in Equation 5, the time period of one pulse emitted at 40 KHz by the LM555
timer is 24.5 microseconds. For testing purposes, we wanted to send 4 pulses and then reset for
100 microseconds. To send 4 pulses, we set the output of the ATmega controller low for 100 us
(roughly 4 pulses). This makes the output of the Hex inverter 1 and the LM555 transmits.
Subsequently, we set the output of the ATmega chip as high for 100 microseconds. The output from
the Hex inverter is then 0 and this resets the LM555 chip as the reset pin active low.
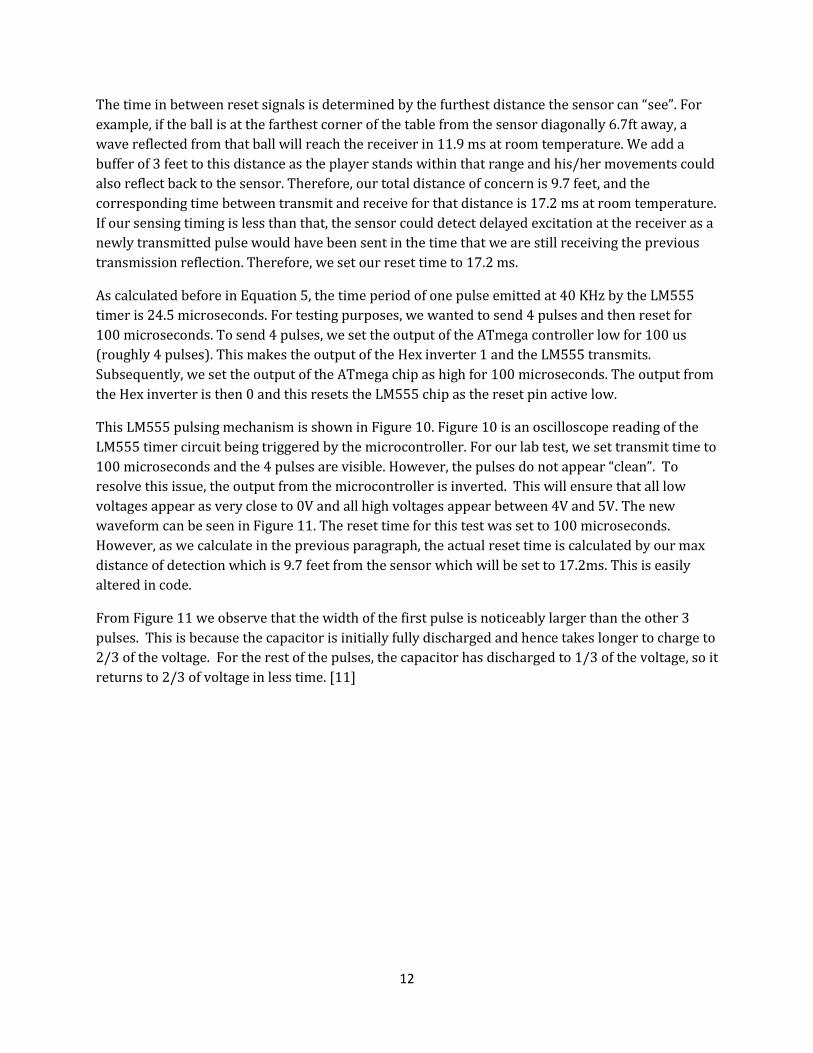
This LM555 pulsing mechanism is shown in Figure 10. Figure 10 is an oscilloscope reading of the
LM555 timer circuit being triggered by the microcontroller. For our lab test, we set transmit time to
100 microseconds and the 4 pulses are visible. However, the pulses do not appear “clean”. To
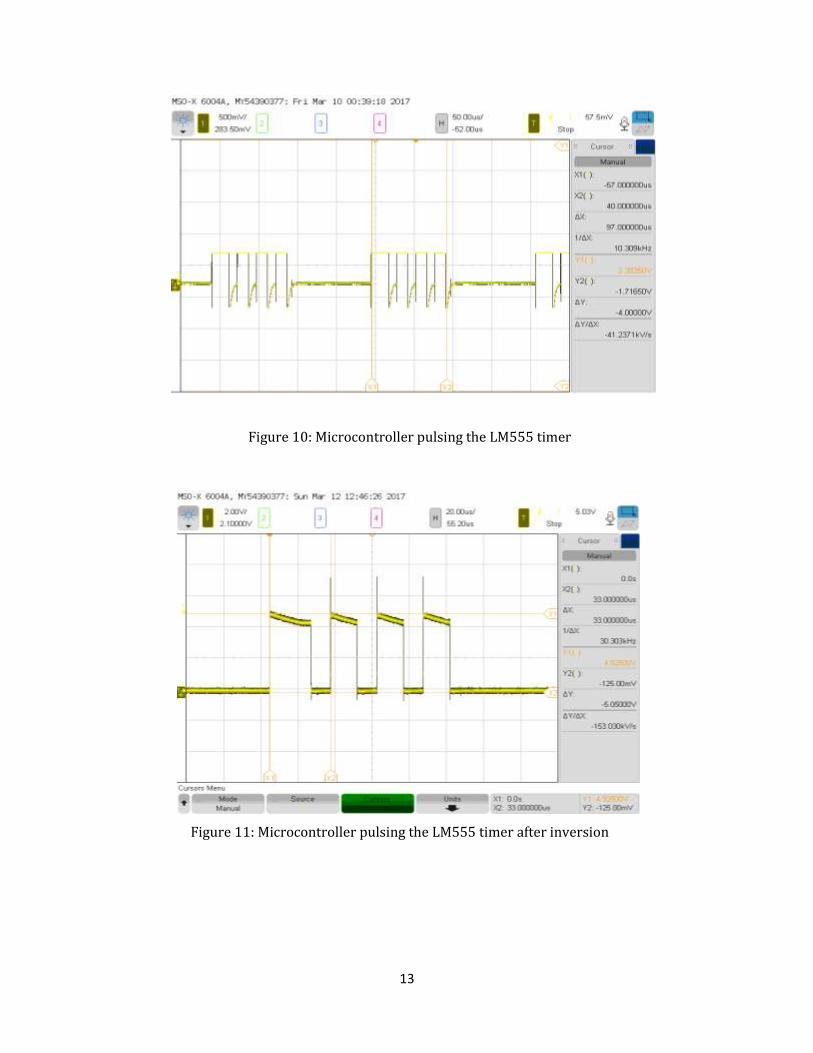
resolve this issue, the output from the microcontroller is inverted. This will ensure that all low
voltages appear as very close to 0V and all high voltages appear between 4V and 5V. The new
waveform can be seen in Figure 11. The reset time for this test was set to 100 microseconds.
However, as we calculate in the previous paragraph, the actual reset time is calculated by our max
distance of detection which is 9.7 feet from the sensor which will be set to 17.2ms. This is easily
altered in code.
From Figure 11 we observe that the width of the first pulse is noticeably larger than the other 3
pulses. This is because the capacitor is initially fully discharged and hence takes longer to charge to
2/3 of the voltage. For the rest of the pulses, the capacitor has discharged to 1/3 of the voltage, so it
returns to 2/3 of voltage in less time. [11]
13
Figure 10: Microcontroller pulsing the LM555 timer
Figure 11: Microcontroller pulsing the LM555 timer after inversion
14
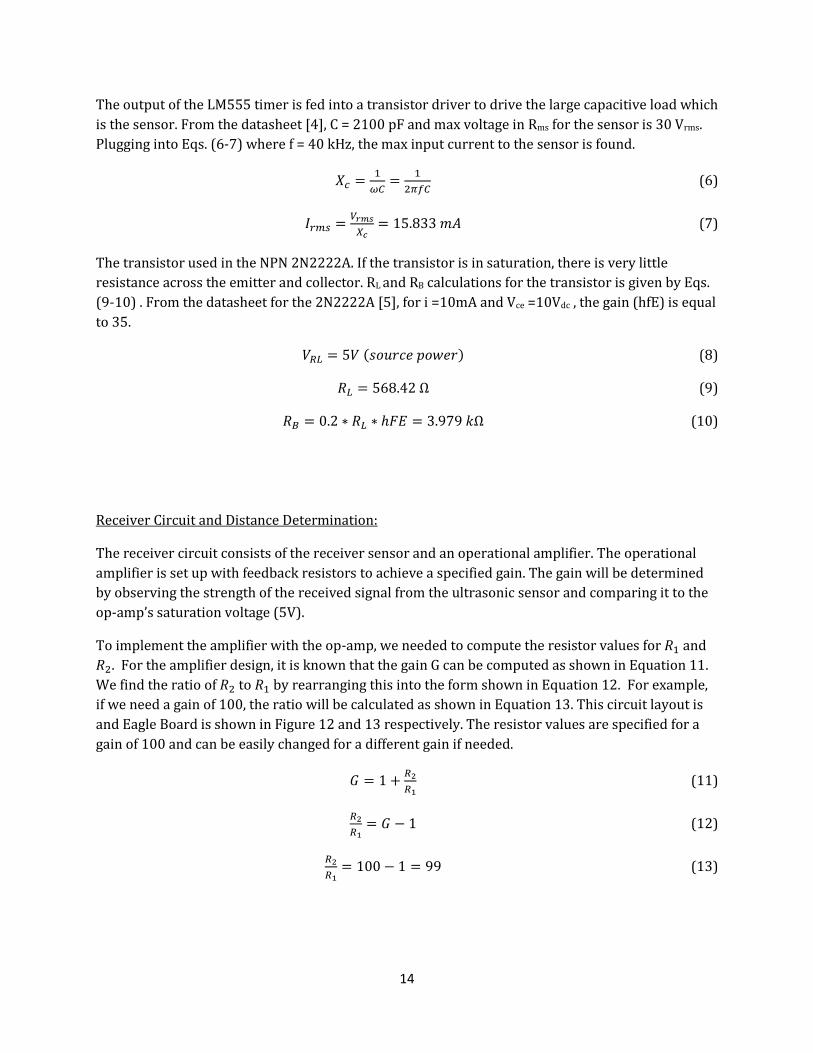
The output of the LM555 timer is fed into a transistor driver to drive the large capacitive load which
is the sensor. From the datasheet [4], C = 2100 pF and max voltage in Rms for the sensor is 30 Vrms.
Plugging into Eqs. (6-7) where f = 40 kHz, the max input current to the sensor is found.
𝑋𝑐 =1
𝜔𝐶=
1
2𝜋𝑓𝐶 (6)
𝐼𝑟𝑚𝑠 =𝑉𝑟𝑚𝑠
𝑋𝑐= 15.833 𝑚𝐴 (7)
The transistor used in the NPN 2N2222A. If the transistor is in saturation, there is very little
resistance across the emitter and collector. RL and RB calculations for the transistor is given by Eqs.
(9-10) . From the datasheet for the 2N2222A [5], for i =10mA and Vce =10Vdc , the gain (hfE) is equal
to 35.
𝑉𝑅𝐿 = 5𝑉 (𝑠𝑜𝑢𝑟𝑐𝑒 𝑝𝑜𝑤𝑒𝑟) (8)
𝑅𝐿 = 568.42 Ω (9)
𝑅𝐵 = 0.2 ∗ 𝑅𝐿 ∗ ℎ𝐹𝐸 = 3.979 𝑘Ω (10)
Receiver Circuit and Distance Determination:
The receiver circuit consists of the receiver sensor and an operational amplifier. The operational
amplifier is set up with feedback resistors to achieve a specified gain. The gain will be determined
by observing the strength of the received signal from the ultrasonic sensor and comparing it to the
op-amp’s saturation voltage (5V).
To implement the amplifier with the op-amp, we needed to compute the resistor values for 𝑅1 and
𝑅2. For the amplifier design, it is known that the gain G can be computed as shown in Equation 11.
We find the ratio of 𝑅2 to 𝑅1 by rearranging this into the form shown in Equation 12. For example,
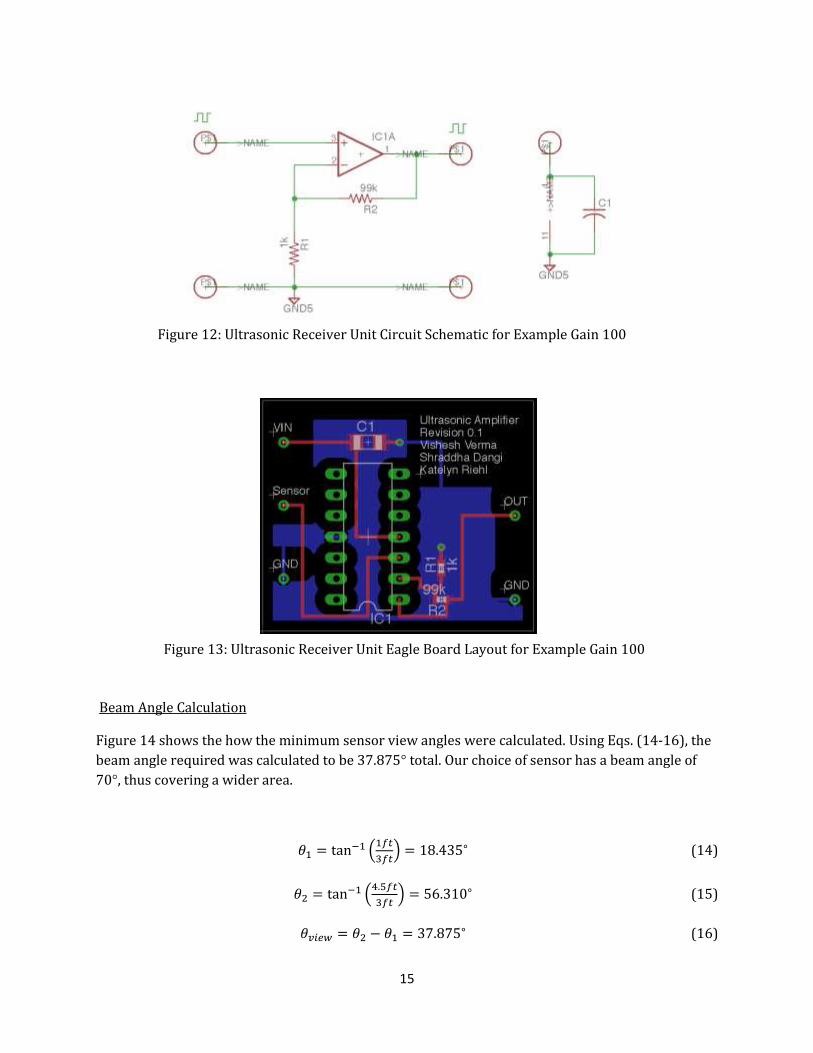
if we need a gain of 100, the ratio will be calculated as shown in Equation 13. This circuit layout is
and Eagle Board is shown in Figure 12 and 13 respectively. The resistor values are specified for a
gain of 100 and can be easily changed for a different gain if needed.
𝐺 = 1 +𝑅2
𝑅1 (11)
𝑅2
𝑅1= 𝐺 − 1 (12)
𝑅2
𝑅1= 100 − 1 = 99 (13)
15
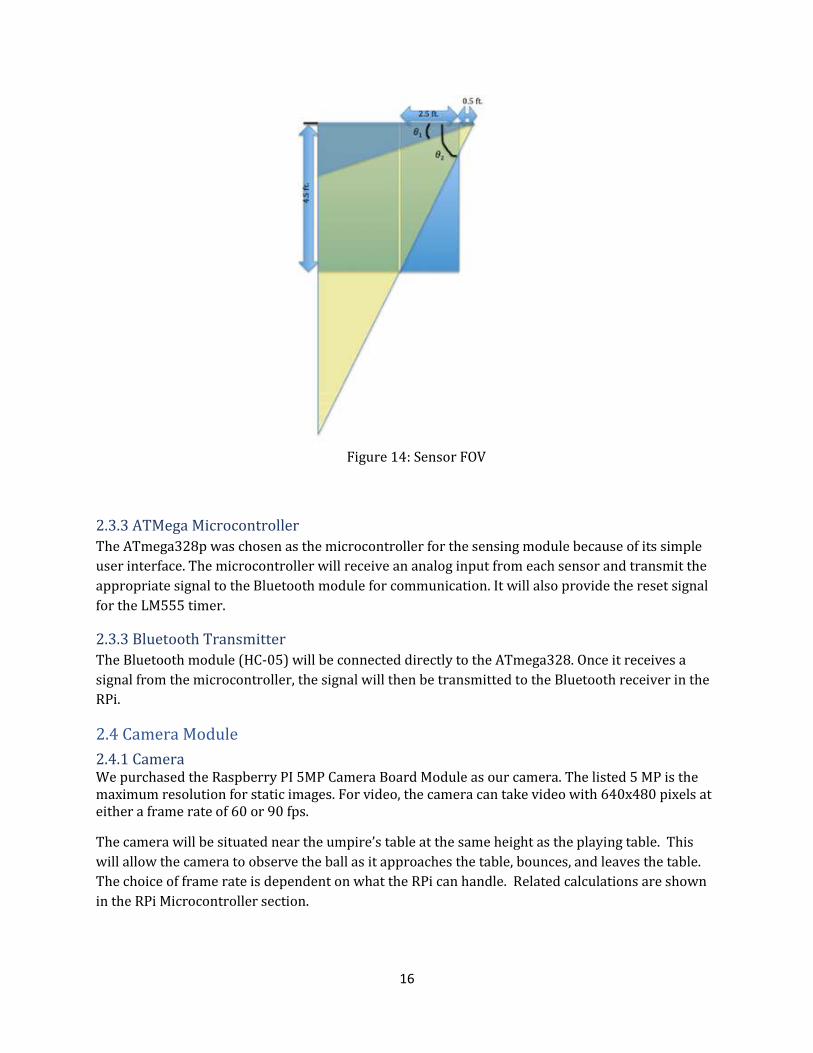
Beam Angle Calculation
Figure 14 shows the how the minimum sensor view angles were calculated. Using Eqs. (14-16), the
beam angle required was calculated to be 37.875° total. Our choice of sensor has a beam angle of
70°, thus covering a wider area.
𝜃1 = tan−1 (1𝑓𝑡
3𝑓𝑡) = 18.435∘ (14)
𝜃2 = tan−1 (4.5𝑓𝑡
3𝑓𝑡) = 56.310∘ (15)
𝜃𝑣𝑖𝑒𝑤 = 𝜃2 − 𝜃1 = 37.875∘ (16)
Figure 12: Ultrasonic Receiver Unit Circuit Schematic for Example Gain 100
Figure 13: Ultrasonic Receiver Unit Eagle Board Layout for Example Gain 100
16
2.3.3 ATMega Microcontroller
The ATmega328p was chosen as the microcontroller for the sensing module because of its simple
user interface. The microcontroller will receive an analog input from each sensor and transmit the
appropriate signal to the Bluetooth module for communication. It will also provide the reset signal
for the LM555 timer.
2.3.3 Bluetooth Transmitter
The Bluetooth module (HC-05) will be connected directly to the ATmega328. Once it receives a
signal from the microcontroller, the signal will then be transmitted to the Bluetooth receiver in the
RPi.
2.4 Camera Module
2.4.1 Camera We purchased the Raspberry PI 5MP Camera Board Module as our camera. The listed 5 MP is the maximum resolution for static images. For video, the camera can take video with 640x480 pixels at either a frame rate of 60 or 90 fps.
The camera will be situated near the umpire’s table at the same height as the playing table. This
will allow the camera to observe the ball as it approaches the table, bounces, and leaves the table.
The choice of frame rate is dependent on what the RPi can handle. Related calculations are shown
in the RPi Microcontroller section.
Figure 14: Sensor FOV
17
2.4.2 RPi Microcontroller
The RPi will have two inputs: the images captured by the camera and the output from the ultrasonic
sensors. The microcontroller performs blob detection to determine the location of the ball,
perspective calculations to determine when the ball is hitting or about to hit the table, and then
uses the sensor measurement input to relay whether or not the ball was “in” to the display. We can
compute the height of the ball off the table based on the position and size of the ball in the image.
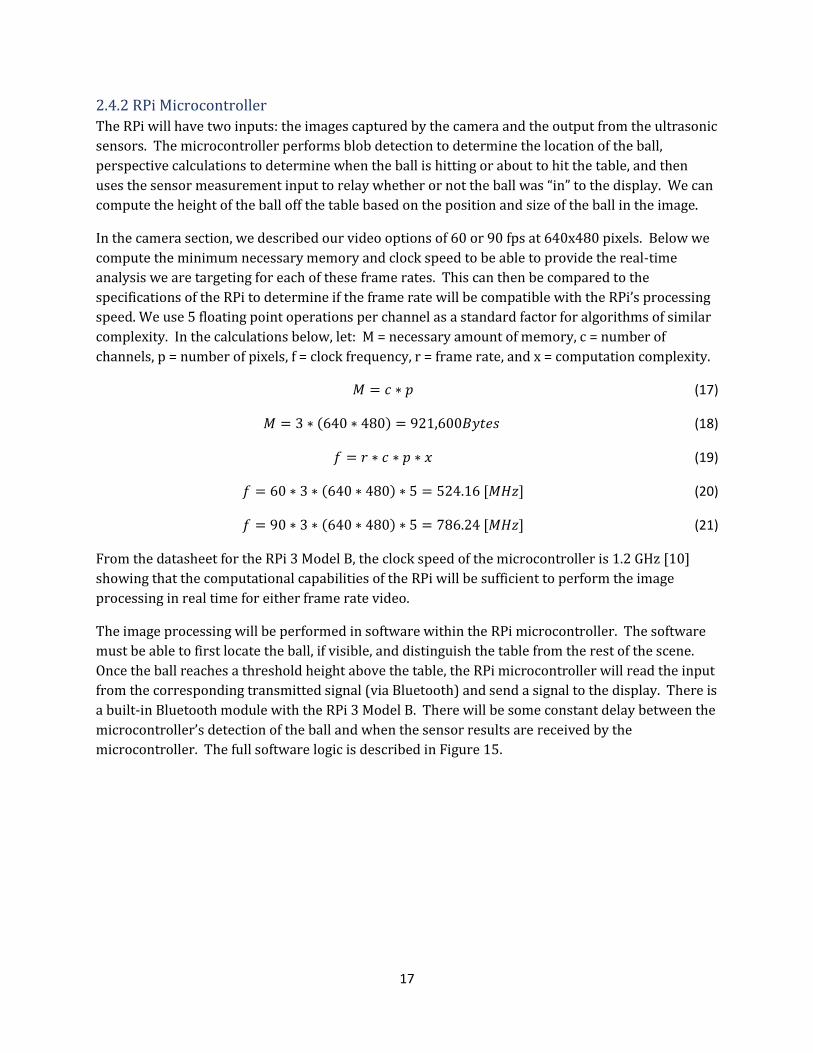
In the camera section, we described our video options of 60 or 90 fps at 640x480 pixels. Below we
compute the minimum necessary memory and clock speed to be able to provide the real-time
analysis we are targeting for each of these frame rates. This can then be compared to the
specifications of the RPi to determine if the frame rate will be compatible with the RPi’s processing
speed. We use 5 floating point operations per channel as a standard factor for algorithms of similar
complexity. In the calculations below, let: M = necessary amount of memory, c = number of
channels, p = number of pixels, f = clock frequency, r = frame rate, and x = computation complexity.
𝑀 = 𝑐 ∗ 𝑝 (17)
𝑀 = 3 ∗ (640 ∗ 480) = 921,600𝐵𝑦𝑡𝑒𝑠 (18)
𝑓 = 𝑟 ∗ 𝑐 ∗ 𝑝 ∗ 𝑥 (19)
𝑓 = 60 ∗ 3 ∗ (640 ∗ 480) ∗ 5 = 524.16 [𝑀𝐻𝑧] (20)
𝑓 = 90 ∗ 3 ∗ (640 ∗ 480) ∗ 5 = 786.24 [𝑀𝐻𝑧] (21)
From the datasheet for the RPi 3 Model B, the clock speed of the microcontroller is 1.2 GHz [10]
showing that the computational capabilities of the RPi will be sufficient to perform the image
processing in real time for either frame rate video.
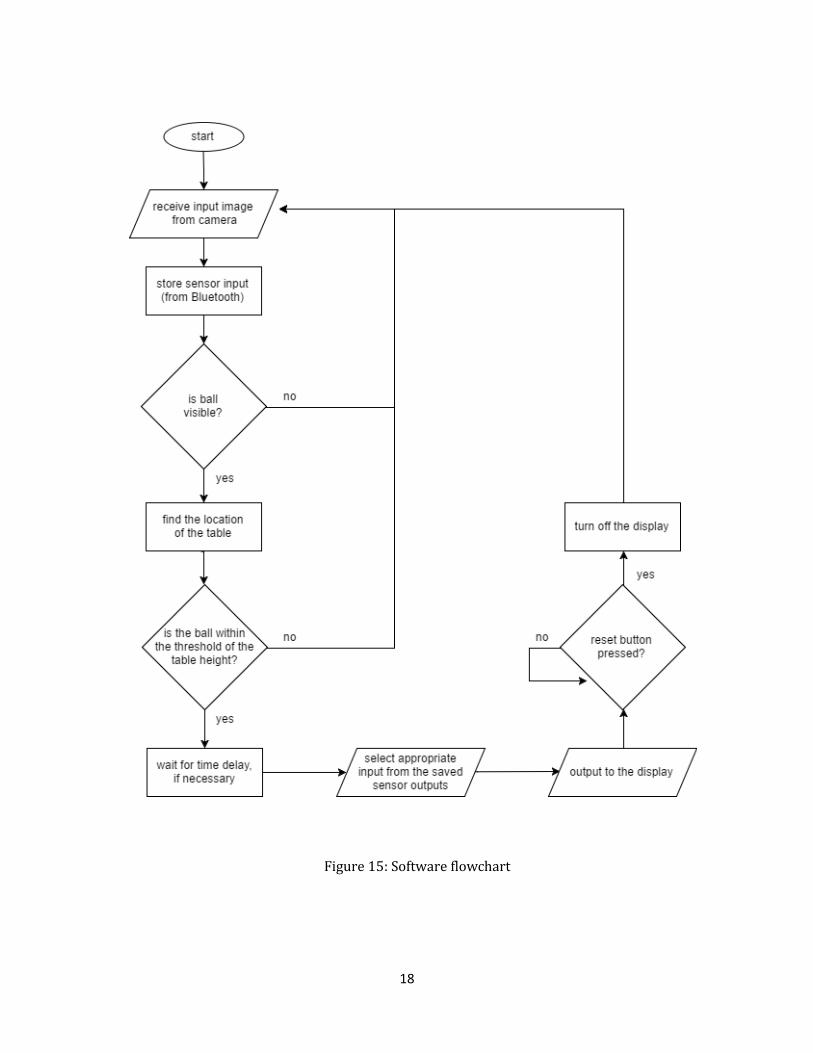
The image processing will be performed in software within the RPi microcontroller. The software
must be able to first locate the ball, if visible, and distinguish the table from the rest of the scene.
Once the ball reaches a threshold height above the table, the RPi microcontroller will read the input
from the corresponding transmitted signal (via Bluetooth) and send a signal to the display. There is
a built-in Bluetooth module with the RPi 3 Model B. There will be some constant delay between the
microcontroller’s detection of the ball and when the sensor results are received by the
microcontroller. The full software logic is described in Figure 15.
18
Figure 15: Software flowchart
19
2.5 Output Display
2.5.1 Display LEDs
The display will consist of a single LED that can emit both red and green. This LED will be connected directly to and powered by the RPi. Once a signal is received, the LED will light up green (“in”) or red (“out”) depending on the location the ball bounces. The umpire will have the ability to manually reset the LED after each play to prevent any confusion between serves.
2.6 Power Supply
2.6.1 Battery
The power source for the detection system consists of one 9V (500mAh) battery and a 5V/2A (5200
mAh) lithium-ion rechargeable battery power pack. The 9V battery will power the ATmega328
microcontroller located at the table tennis table and the two ultrasonic comparators. This battery
will last for approximately 7 hours. The rechargeable battery will be used to power the RPi as well
as the camera and LED attached to the RPi. It will provide enough power for approximately 2 hours.
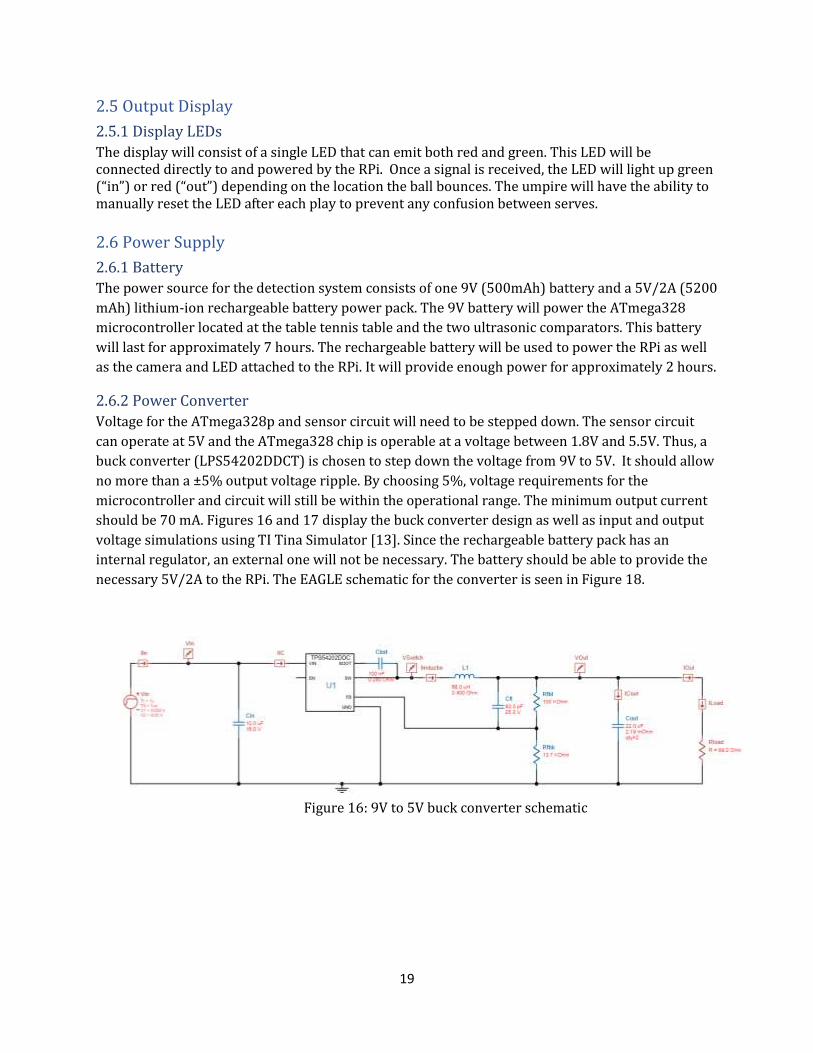
2.6.2 Power Converter
Voltage for the ATmega328p and sensor circuit will need to be stepped down. The sensor circuit
can operate at 5V and the ATmega328 chip is operable at a voltage between 1.8V and 5.5V. Thus, a
buck converter (LPS54202DDCT) is chosen to step down the voltage from 9V to 5V. It should allow
no more than a ±5% output voltage ripple. By choosing 5%, voltage requirements for the
microcontroller and circuit will still be within the operational range. The minimum output current
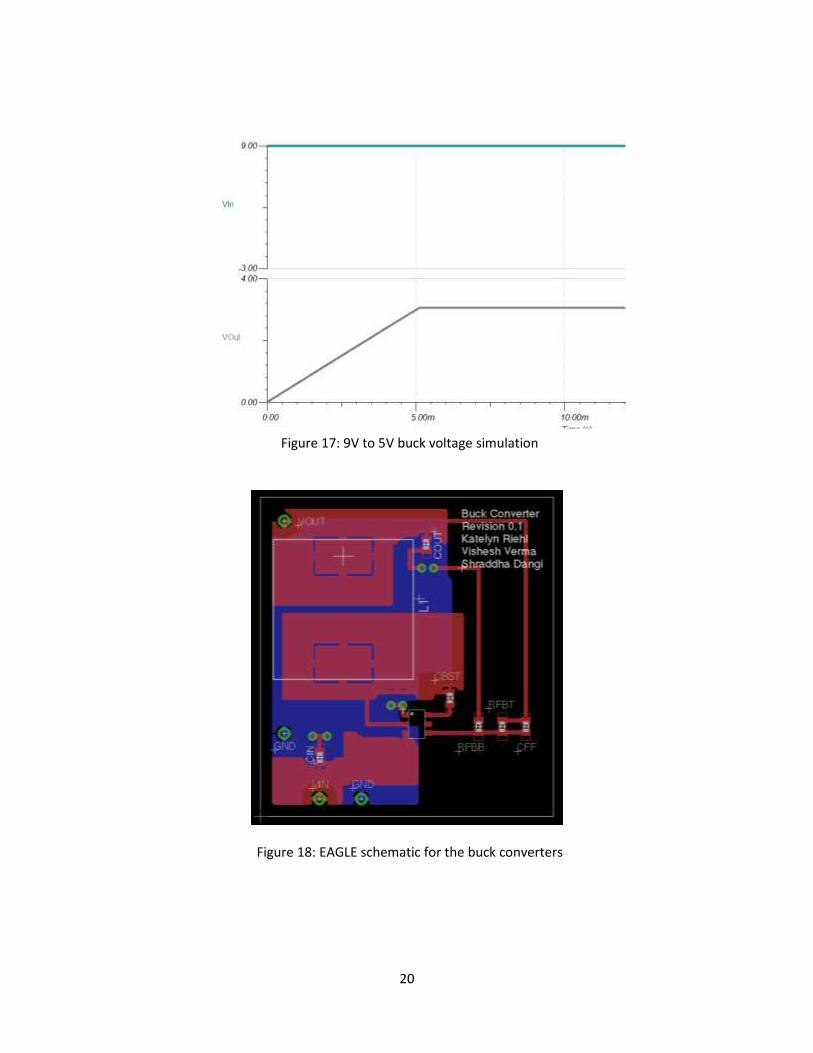
should be 70 mA. Figures 16 and 17 display the buck converter design as well as input and output
voltage simulations using TI Tina Simulator [13]. Since the rechargeable battery pack has an
internal regulator, an external one will not be necessary. The battery should be able to provide the
necessary 5V/2A to the RPi. The EAGLE schematic for the converter is seen in Figure 18.
Figure 16: 9V to 5V buck converter schematic
20
Figure 17: 9V to 5V buck voltage simulation
Figure 18: EAGLE schematic for the buck converters
21
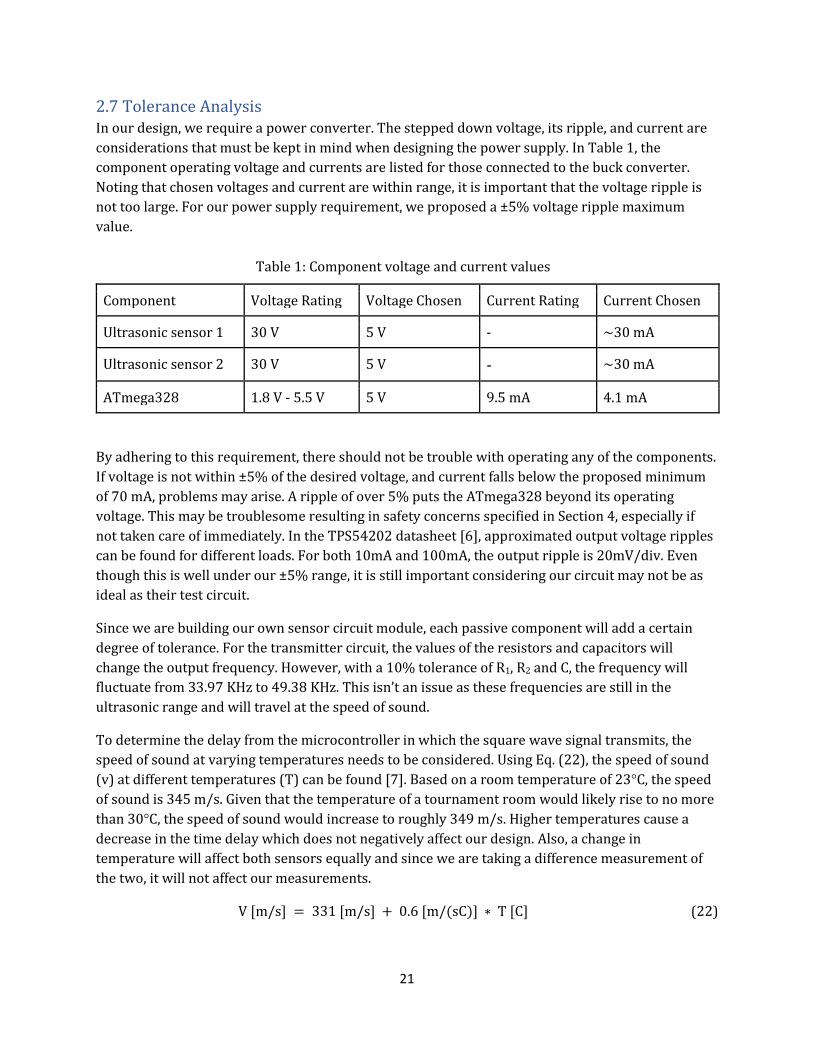
2.7 Tolerance Analysis In our design, we require a power converter. The stepped down voltage, its ripple, and current are
considerations that must be kept in mind when designing the power supply. In Table 1, the
component operating voltage and currents are listed for those connected to the buck converter.
Noting that chosen voltages and current are within range, it is important that the voltage ripple is
not too large. For our power supply requirement, we proposed a ±5% voltage ripple maximum
value.
Component Voltage Rating Voltage Chosen Current Rating Current Chosen
Ultrasonic sensor 1 30 V 5 V - ~30 mA
Ultrasonic sensor 2 30 V 5 V - ~30 mA
ATmega328 1.8 V - 5.5 V 5 V 9.5 mA 4.1 mA
By adhering to this requirement, there should not be trouble with operating any of the components.
If voltage is not within ±5% of the desired voltage, and current falls below the proposed minimum
of 70 mA, problems may arise. A ripple of over 5% puts the ATmega328 beyond its operating
voltage. This may be troublesome resulting in safety concerns specified in Section 4, especially if
not taken care of immediately. In the TPS54202 datasheet [6], approximated output voltage ripples
can be found for different loads. For both 10mA and 100mA, the output ripple is 20mV/div. Even
though this is well under our ±5% range, it is still important considering our circuit may not be as
ideal as their test circuit.
Since we are building our own sensor circuit module, each passive component will add a certain
degree of tolerance. For the transmitter circuit, the values of the resistors and capacitors will
change the output frequency. However, with a 10% tolerance of R1, R2 and C, the frequency will
fluctuate from 33.97 KHz to 49.38 KHz. This isn’t an issue as these frequencies are still in the
ultrasonic range and will travel at the speed of sound.
To determine the delay from the microcontroller in which the square wave signal transmits, the
speed of sound at varying temperatures needs to be considered. Using Eq. (22), the speed of sound
(v) at different temperatures (T) can be found [7]. Based on a room temperature of 23°C, the speed
of sound is 345 m/s. Given that the temperature of a tournament room would likely rise to no more
than 30°C, the speed of sound would increase to roughly 349 m/s. Higher temperatures cause a
decrease in the time delay which does not negatively affect our design. Also, a change in
temperature will affect both sensors equally and since we are taking a difference measurement of
the two, it will not affect our measurements.
V [m/s] = 331 [m/s] + 0.6 [m/(sC)] ∗ T [C] (22)
Table 1: Component voltage and current values
22
Additionally, we need to consider the uncertainty in the position of the ball from the camera. The
position of the ball is critical to determining which sensor measurement contains the result of the
comparison at the time of contact. There are two sources of this timing uncertainty: frame rate and
motion blur.
The camera we are using as a frame rate of 90 fps [10]. This means that there will be one image
available to analyze every 11.11 milliseconds. In between those 11.11 milliseconds, we do not have
any information on the location of the ball. Since it is unlikely that the ball will bounce exactly at
the time we capture an image, we will have to determine which image contains the ball at the
closest time to the time the ball contacts the table.
The image of the ball will also include motion blur. Motion blur is when objects in images appear to
have a tail or streak behind it due to the object moving within the exposure time. This tail will be
included in the “blob detection” component of the computer vision and will affect the ability of the
software to determine the true location of the ball and the size of the ball in the frame.
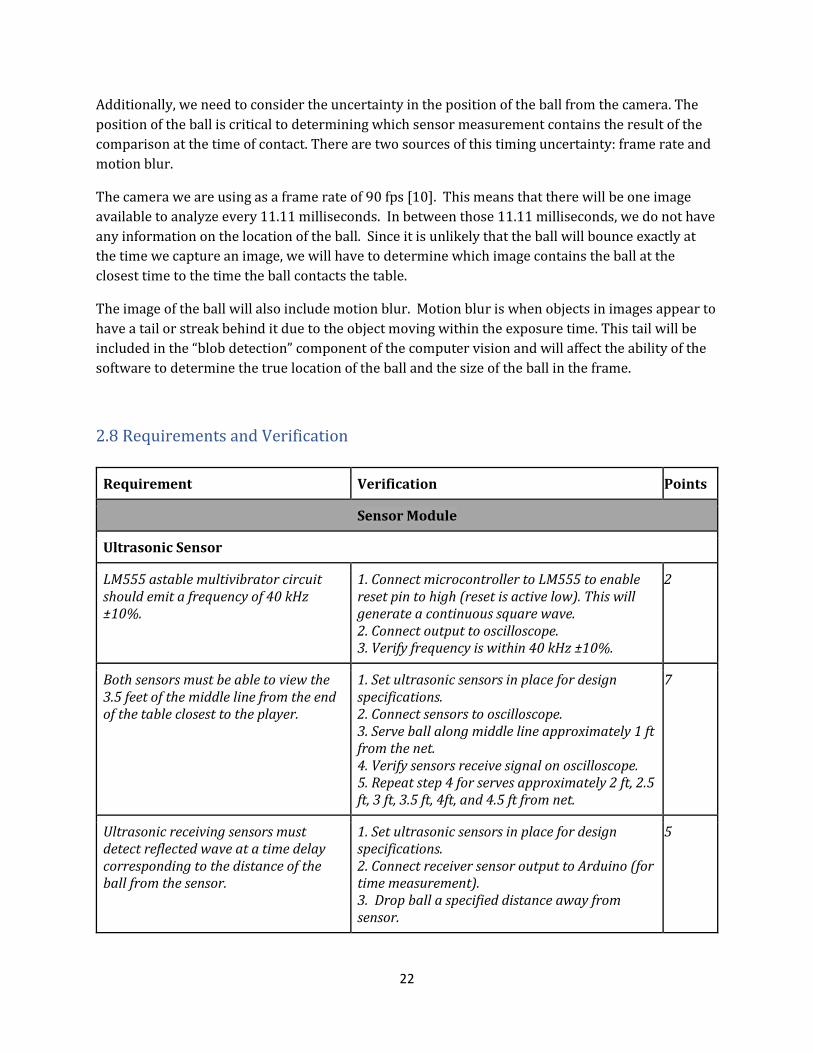
2.8 Requirements and Verification
Requirement Verification Points
Sensor Module
Ultrasonic Sensor
LM555 astable multivibrator circuit should emit a frequency of 40 kHz ±10%.
1. Connect microcontroller to LM555 to enable reset pin to high (reset is active low). This will generate a continuous square wave. 2. Connect output to oscilloscope. 3. Verify frequency is within 40 kHz ±10%.
2
Both sensors must be able to view the 3.5 feet of the middle line from the end of the table closest to the player.
1. Set ultrasonic sensors in place for design specifications. 2. Connect sensors to oscilloscope. 3. Serve ball along middle line approximately 1 ft from the net. 4. Verify sensors receive signal on oscilloscope. 5. Repeat step 4 for serves approximately 2 ft, 2.5 ft, 3 ft, 3.5 ft, 4ft, and 4.5 ft from net.
7
Ultrasonic receiving sensors must detect reflected wave at a time delay corresponding to the distance of the ball from the sensor.
1. Set ultrasonic sensors in place for design specifications. 2. Connect receiver sensor output to Arduino (for time measurement). 3. Drop ball a specified distance away from sensor.
5
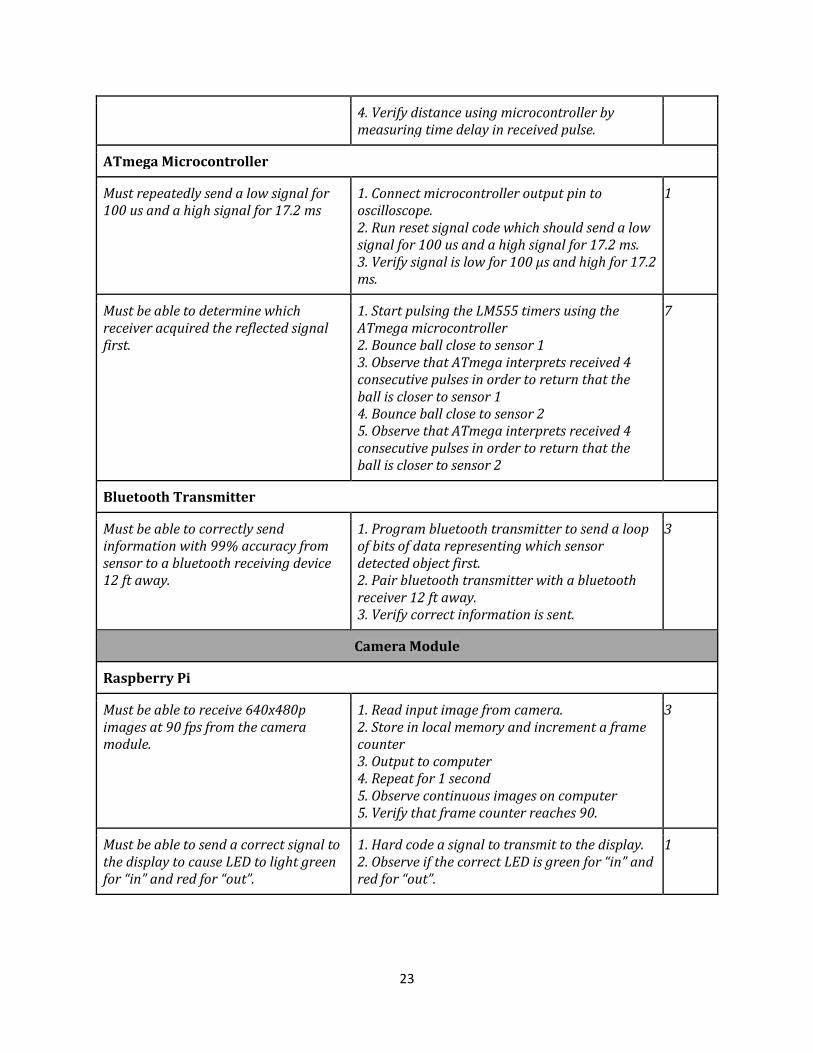
23
4. Verify distance using microcontroller by measuring time delay in received pulse.
ATmega Microcontroller
Must repeatedly send a low signal for 100 us and a high signal for 17.2 ms
1. Connect microcontroller output pin to oscilloscope. 2. Run reset signal code which should send a low signal for 100 us and a high signal for 17.2 ms. 3. Verify signal is low for 100 μs and high for 17.2 ms.
1
Must be able to determine which receiver acquired the reflected signal first.
1. Start pulsing the LM555 timers using the ATmega microcontroller 2. Bounce ball close to sensor 1 3. Observe that ATmega interprets received 4 consecutive pulses in order to return that the ball is closer to sensor 1 4. Bounce ball close to sensor 2 5. Observe that ATmega interprets received 4 consecutive pulses in order to return that the ball is closer to sensor 2
7
Bluetooth Transmitter
Must be able to correctly send information with 99% accuracy from sensor to a bluetooth receiving device 12 ft away.
1. Program bluetooth transmitter to send a loop of bits of data representing which sensor detected object first. 2. Pair bluetooth transmitter with a bluetooth receiver 12 ft away. 3. Verify correct information is sent.
3
Camera Module
Raspberry Pi
Must be able to receive 640x480p images at 90 fps from the camera module.
1. Read input image from camera. 2. Store in local memory and increment a frame counter 3. Output to computer 4. Repeat for 1 second 5. Observe continuous images on computer 5. Verify that frame counter reaches 90.
3
Must be able to send a correct signal to the display to cause LED to light green for “in” and red for “out”.
1. Hard code a signal to transmit to the display. 2. Observe if the correct LED is green for “in” and red for “out”.
1
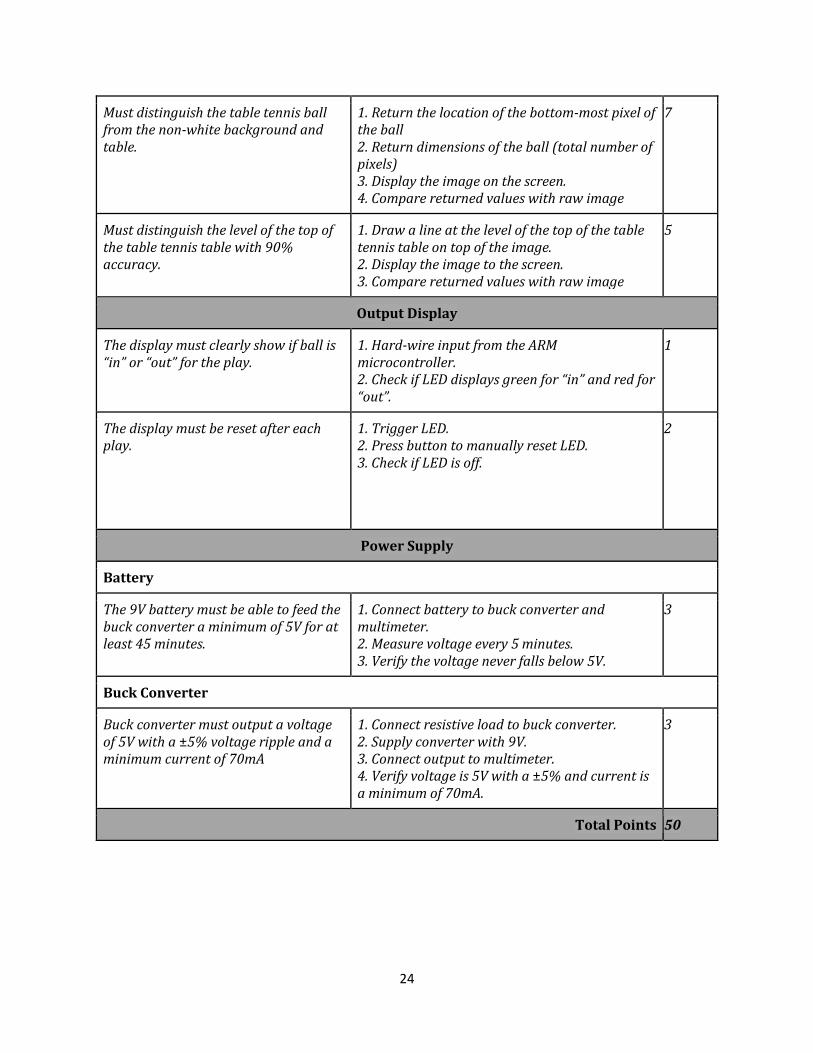
24
Must distinguish the table tennis ball from the non-white background and table.
1. Return the location of the bottom-most pixel of the ball 2. Return dimensions of the ball (total number of pixels) 3. Display the image on the screen. 4. Compare returned values with raw image
7
Must distinguish the level of the top of the table tennis table with 90% accuracy.
1. Draw a line at the level of the top of the table tennis table on top of the image. 2. Display the image to the screen. 3. Compare returned values with raw image
5
Output Display
The display must clearly show if ball is “in” or “out” for the play.
1. Hard-wire input from the ARM microcontroller. 2. Check if LED displays green for “in” and red for “out”.
1
The display must be reset after each play.
1. Trigger LED. 2. Press button to manually reset LED. 3. Check if LED is off.
2
Power Supply
Battery
The 9V battery must be able to feed the buck converter a minimum of 5V for at least 45 minutes.
1. Connect battery to buck converter and multimeter. 2. Measure voltage every 5 minutes. 3. Verify the voltage never falls below 5V.
3
Buck Converter
Buck converter must output a voltage of 5V with a ±5% voltage ripple and a minimum current of 70mA
1. Connect resistive load to buck converter. 2. Supply converter with 9V. 3. Connect output to multimeter. 4. Verify voltage is 5V with a ±5% and current is a minimum of 70mA.
3
Total Points 50
25
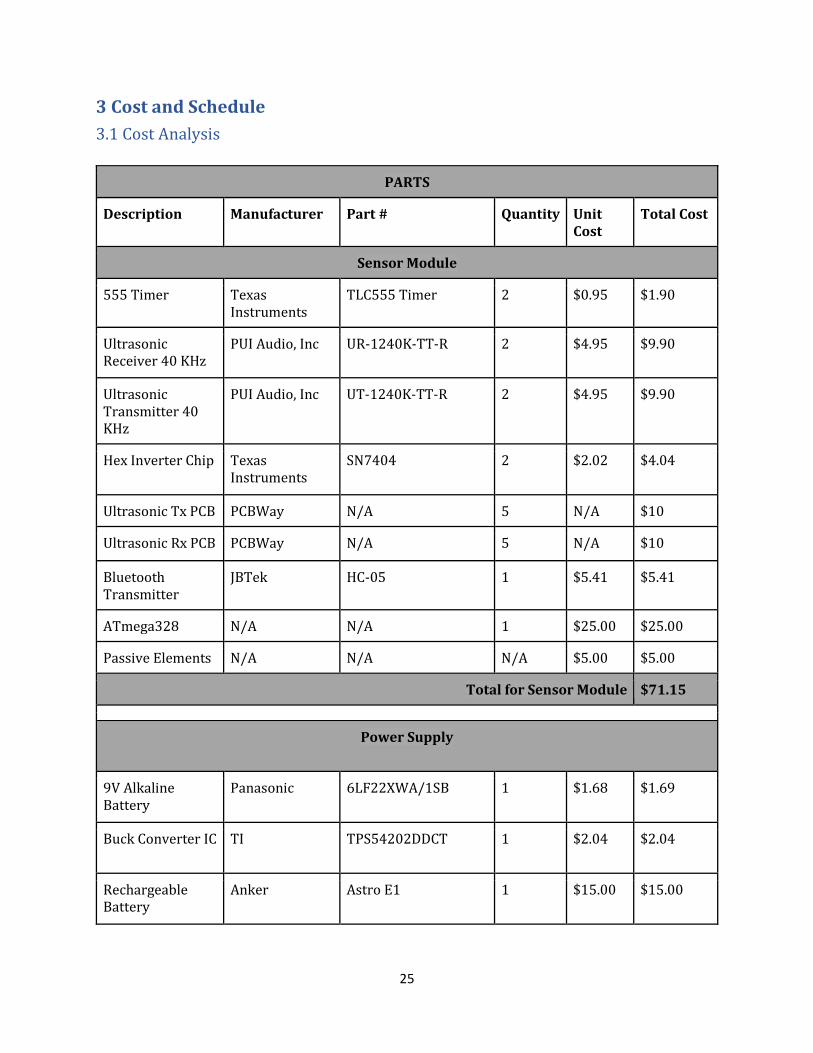
3 Cost and Schedule
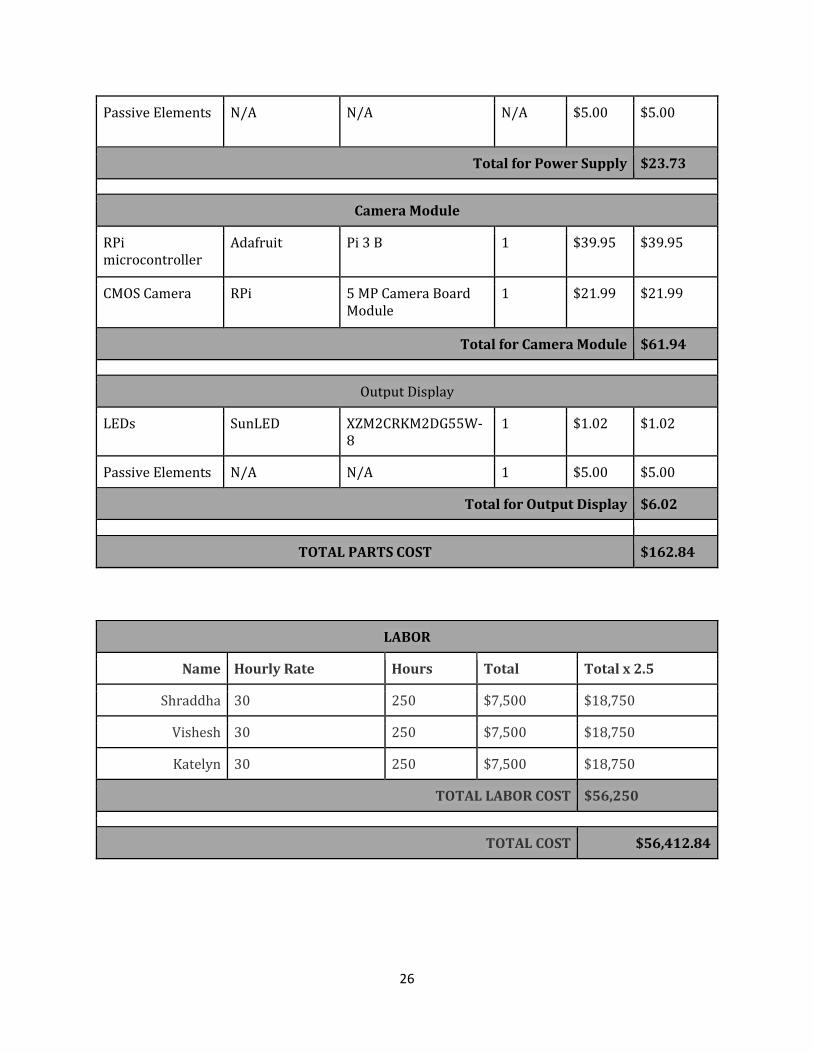
3.1 Cost Analysis
PARTS
Description Manufacturer Part # Quantity Unit Cost
Total Cost
Sensor Module
555 Timer Texas Instruments
TLC555 Timer 2 $0.95 $1.90
Ultrasonic Receiver 40 KHz
PUI Audio, Inc UR-1240K-TT-R
2 $4.95 $9.90
Ultrasonic Transmitter 40 KHz
PUI Audio, Inc UT-1240K-TT-R 2 $4.95 $9.90
Hex Inverter Chip Texas Instruments
SN7404 2 $2.02 $4.04
Ultrasonic Tx PCB PCBWay N/A 5 N/A $10
Ultrasonic Rx PCB PCBWay N/A 5 N/A $10
Bluetooth Transmitter
JBTek HC-05 1 $5.41 $5.41
ATmega328 N/A N/A 1 $25.00 $25.00
Passive Elements N/A N/A N/A $5.00 $5.00
Total for Sensor Module $71.15
Power Supply
9V Alkaline Battery
Panasonic 6LF22XWA/1SB 1 $1.68 $1.69
Buck Converter IC TI TPS54202DDCT 1 $2.04 $2.04
Rechargeable Battery
Anker Astro E1 1 $15.00 $15.00
26
Passive Elements N/A N/A N/A $5.00 $5.00
Total for Power Supply $23.73
Camera Module
RPi microcontroller
Adafruit Pi 3 B 1 $39.95 $39.95
CMOS Camera RPi 5 MP Camera Board Module
1 $21.99 $21.99
Total for Camera Module $61.94
Output Display
LEDs SunLED XZM2CRKM2DG55W-8
1 $1.02 $1.02
Passive Elements N/A N/A 1 $5.00 $5.00
Total for Output Display $6.02
TOTAL PARTS COST $162.84
LABOR
Name Hourly Rate Hours Total Total x 2.5
Shraddha 30 250 $7,500 $18,750
Vishesh 30 250 $7,500 $18,750
Katelyn 30 250 $7,500 $18,750
TOTAL LABOR COST $56,250
TOTAL COST $56,412.84
27
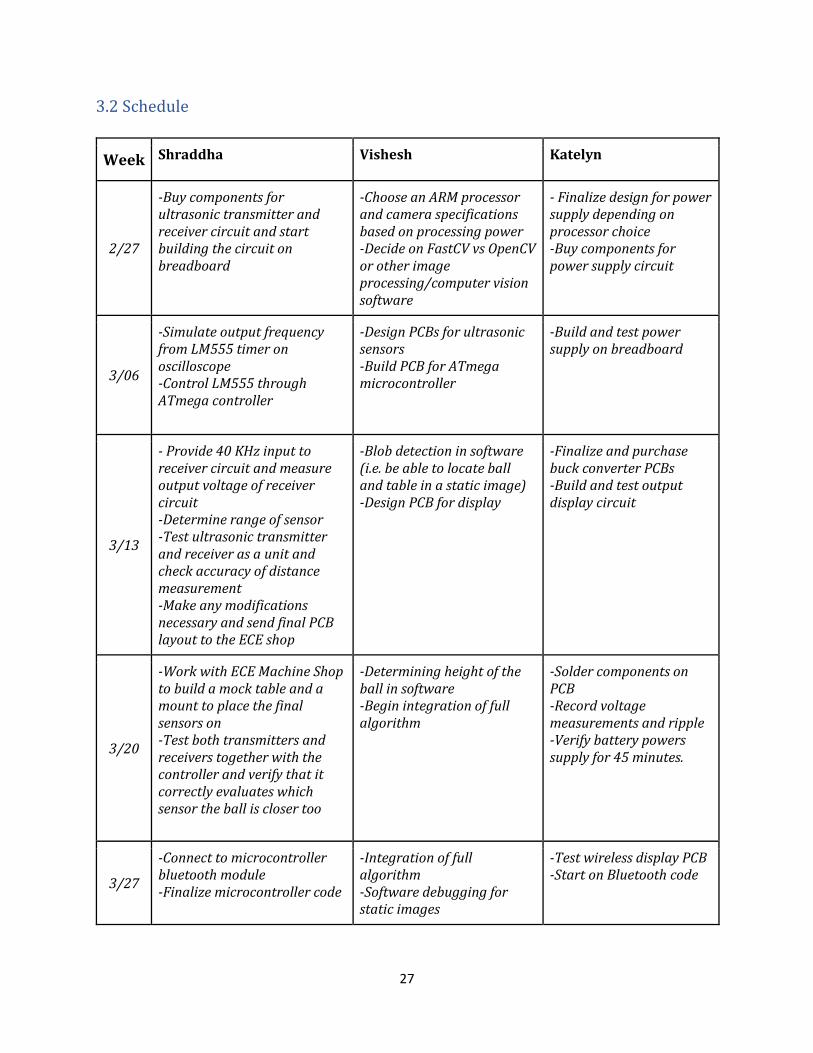
3.2 Schedule
Week Shraddha Vishesh Katelyn
2/27
-Buy components for ultrasonic transmitter and receiver circuit and start building the circuit on breadboard
-Choose an ARM processor and camera specifications based on processing power -Decide on FastCV vs OpenCV or other image processing/computer vision software
- Finalize design for power supply depending on processor choice -Buy components for power supply circuit
3/06
-Simulate output frequency from LM555 timer on oscilloscope -Control LM555 through ATmega controller
-Design PCBs for ultrasonic sensors -Build PCB for ATmega microcontroller
-Build and test power supply on breadboard
3/13
- Provide 40 KHz input to receiver circuit and measure output voltage of receiver circuit -Determine range of sensor -Test ultrasonic transmitter and receiver as a unit and check accuracy of distance measurement -Make any modifications necessary and send final PCB layout to the ECE shop
-Blob detection in software (i.e. be able to locate ball and table in a static image) -Design PCB for display
-Finalize and purchase buck converter PCBs -Build and test output display circuit
3/20
-Work with ECE Machine Shop to build a mock table and a mount to place the final sensors on -Test both transmitters and receivers together with the controller and verify that it correctly evaluates which sensor the ball is closer too
-Determining height of the ball in software -Begin integration of full algorithm
-Solder components on PCB -Record voltage measurements and ripple -Verify battery powers supply for 45 minutes.
3/27
-Connect to microcontroller bluetooth module -Finalize microcontroller code
-Integration of full algorithm -Software debugging for static images
-Test wireless display PCB -Start on Bluetooth code
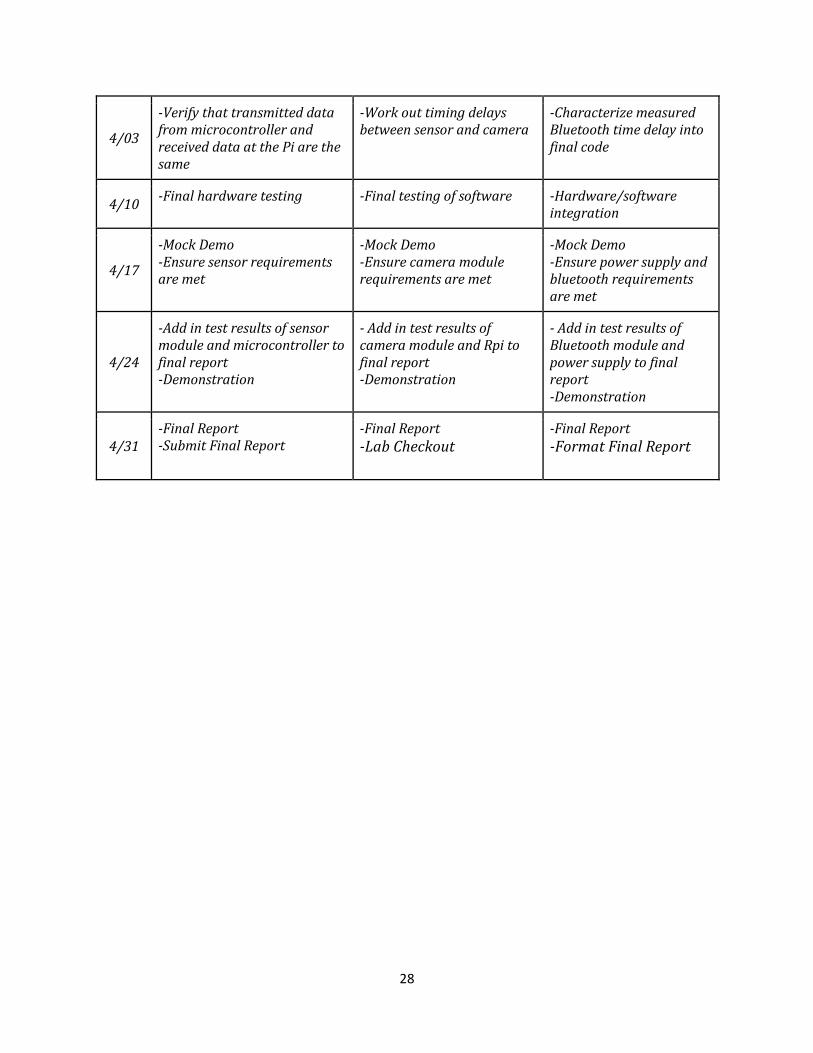
28
4/03
-Verify that transmitted data from microcontroller and received data at the Pi are the same
-Work out timing delays between sensor and camera
-Characterize measured Bluetooth time delay into final code
4/10 -Final hardware testing -Final testing of software -Hardware/software
integration
4/17
-Mock Demo -Ensure sensor requirements are met
-Mock Demo -Ensure camera module requirements are met
-Mock Demo -Ensure power supply and bluetooth requirements are met
4/24
-Add in test results of sensor module and microcontroller to final report -Demonstration
- Add in test results of camera module and Rpi to final report -Demonstration
- Add in test results of Bluetooth module and power supply to final report -Demonstration
4/31 -Final Report -Submit Final Report
-Final Report -Lab Checkout
-Final Report -Format Final Report
29
4 Safety and Ethics It is important that our fault serve detection system complies with the IEEE Code of Ethics not only
during the developmental stage but as well as after the design is implemented. There are a couple
safety concerns that need to be taken into consideration in order to abide by IEEE Code of Ethics,
#1 - “to accept responsibility in making decisions consistent with the safety, health, and welfare of
the public...” [9]. If voltage or current limits are exceeded for any of the components, such as the
passive elements as well as the microcontrollers, there is a possibility of the particular component
overheating and/or combusting. If such an occurrence were to happen, the equipment, particularly
the net and table, could be damaged. It also poses a risk to anyone near the system at the moment
including the players, the umpire, and/or any audience members nearby. To combat this issue,
correct calculations for the power supply are essential as well as thorough testing of the system.
There is also potential safety concerns with the use of the lithium-ion rechargeable battery
including both chemical and electrical hazards. Lithium-ion batteries consist of lithium for the
anode as well as a material for the cathode which is usually nickel or manganese and cobalt [8].
Although the battery should not release any chemicals, there is the potential risk of leakage. This
could be due to corrosion or damage to the battery. Another potential risk for the lithium-ion
battery is the possibility of overheating and/or combusting. This could occur if the battery is
charged and discharged too quickly. The excess charging increases internal temperature and could
also result in chemical unpredictability. A third issue could result if the components are not
securely fastened. Any loose components could act as projectiles if hit correctly. As a result, all parts
of the system will be able to be thoroughly secured.
To comply with IEEE Code of Ethics, #3 - “to be honest and realistic in stating claims or estimates
based on available data” [9], it must be reiterated that our system will likely not be 100% accurate.
The system should not be altered in any way as any changes could affect the accuracy if not
recalibrated.
The intended use of our design is for indoor table tennis games. Using the system in an outdoor
environment poses the risk of damaging components in the presence of hazardous weather
conditions.
30
References [1] Wood, Robert. “Hawk-Eye Line-Calling System.” Hawkeye Tennis Line-Calling System, Topend
Sports Network, 2008, www.topendsports.com/sport/tennis/hawkeye.htm.
[2] Can Stock Photo. http://cdn.xl.thumbs.canstockphoto.com/canstock14683148.jpg
[3] TLC555 TINA-TI Astable Reference Design (Rev. B), TINA-TI Reference Design, 12 October
2011. http://www.ti.com/product/TLC555/toolssoftware
[4] PUI Audio, Inc, ULTRASONIC TRANSMITTER 30VRMS, UT-1240K-TT-R Datasheet,June 1 2016.
http://media.digikey.com/pdf/Data%20Sheets/Projects%20Unlimited%20PDFs/UT-1240K-TT-
R.pdf
[5] ON Semiconductor. “2N222A: Small Signal Switching Transistor: NPN Silicon”. November 2013.
http://web.mit.edu/6.101/www/reference/2N2222A.pdf
[6] Texas Instruments. “TPS54202 4.5-V to 28-V Input, 2-A Output, EMI Friendly Synchronous Step
Down Converter”. TPS54202 datasheet. April 2016 [Revised January 2017].
http://www.ti.com/lit/ds/symlink/tps54202.pdf.
[7] "Temperature and the Speed of Sound." Temperature and the Speed of Sound,
https://www.nde-ed.org/EducationResources/HighSchool/Sound/tempandspeed.htm
[8] The European Association for Advanced Rechargeable Batteries. “Safety of lithium-ion
batteries”. June 2013.
[9] “IEEE IEEE Code of Ethics.” IEEE Code of Ethics, IEEE,
www.ieee.org/about/corporate/governance/p7-8.html.
[10] “Raspberry Pi 3 Model B.” Raspberry Pi, RASPBERRY PI FOUNDATION,
www.raspberrypi.org/products/raspberry-pi-3-model-b/.
[11] “555 Timer IC.” Wikipedia, Wikimedia Foundation, 6 Mar. 2017,
en.wikipedia.org/wiki/555_timer_IC. Accessed 12 Mar. 2017.
[12] "Astable Multivibrator and Astable Oscillator Circuit." Basic Electronics Tutorials, 26 July 2016,
http://www.electronics-tutorials.ws/waveforms/astable.html
[13] “TPS54202 (ACTIVE).” TPS54202 4.5-V to 28-V Input, 2-A Output, EMI Friendly Synchronous
Step Down Converter. www.ti.com/product/TPS54202