Embed Size (px)
Citation preview
TableS1:SummaryTable
Diagnostictestingforliverfibrosis(bybiopsy)
Categoricaloutcomes
PMID Author Year Typeofarticle Studydesign Population Samplesize Diagnostictest Referencestandard
(Sensitivitythreshold)
Timpoint
20357753 LiuCH.,LiangCC.,LiuCJ.,HsuSJ.,
LinJW.,ChenSI.,HungPH.,Tsai
HB.,LaiMY.,ChenPJ.,ChenJH.,
ChenDS.,KaoJH.
2010 Peer-reviewedpublication Cohortstudy,prospective HD 279 APRI(≥0.30)
Liverbiopsy(F2-F4)
0months
175 12-18months
HD 279 APRI(≥0.40)
Liverbiopsy(F2-F4)
0months
175 12-18months
HD 279 APRI(≥0.60)
Liverbiopsy(F2-F4)
0months
175 12-18months
HD 279 APRI(≥0.80)
Liverbiopsy(F2-F4)
0months
175 12-18months
HD 279 APRI(≥0.95)
Liverbiopsy(F2-F4)
0months
175 12-18months
17634962 SchiavonLL.,SchiavonJL.,Filho
RJ.,SampaioJP.,LanzoniVP.,Silva
AE.,FerrazML.
2007 Peer-reviewedpublication Cross-sectionalstudy HD 203 APRI(≥0.4)
Liverbiopsy(F2-F4)
nd
APRI(≥0.95)
Liverbiopsy(F2-F4)
DescriptionofDiagnosticTest
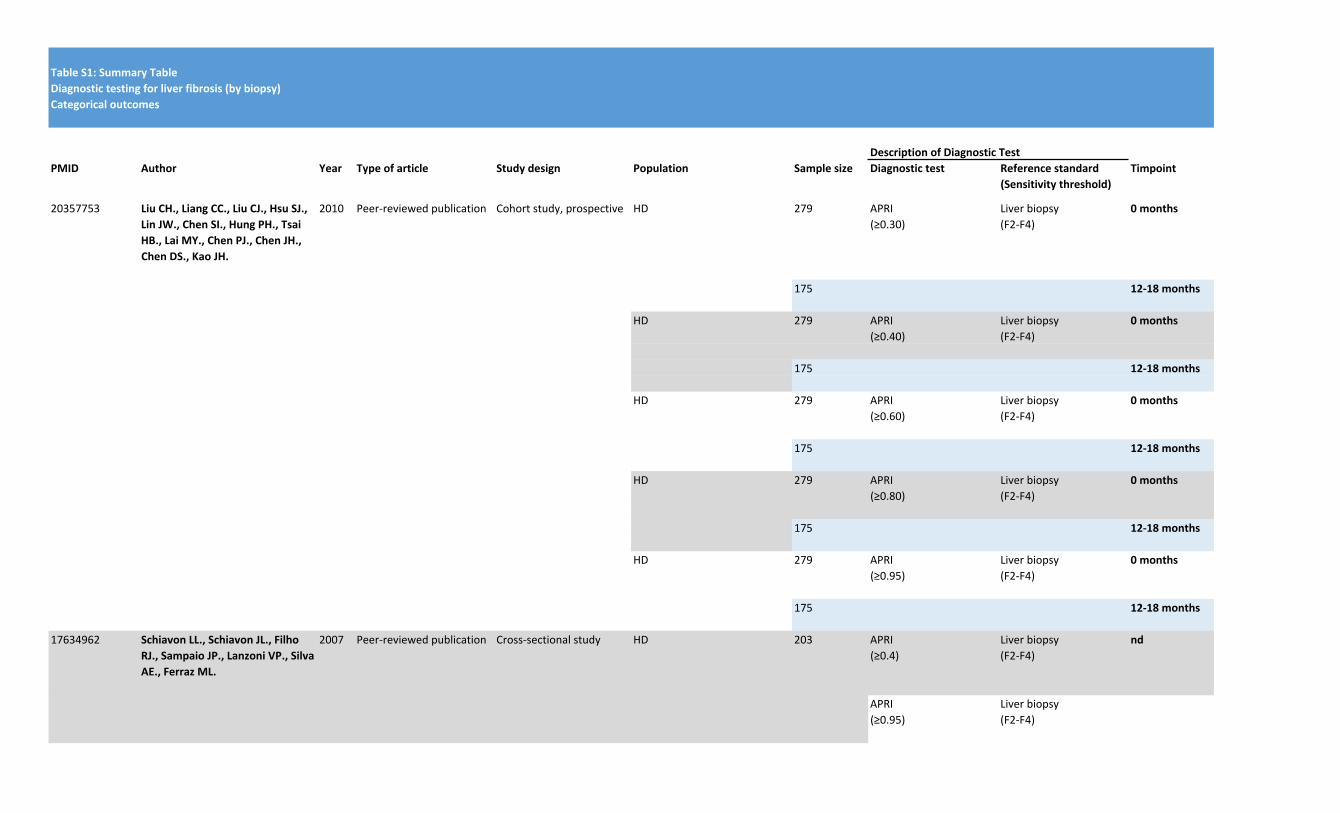
PMID Author Year Typeofarticle Studydesign Population Samplesize Diagnostictest Referencestandard
(Sensitivitythreshold)
Timpoint
DescriptionofDiagnosticTest
APRI(>0.55)
Liverbiopsy(F3-F4)
APRI(≥1.00)
Liverbiopsy(F3-F4)
19758273 SchiavonLL.,Carvalho-FilhoRJ.,
Narciso-SchiavonJL.,PinheiroSR.,
BarbosaDV.,LanzoniVP.,Ferraz
ML.,SilvaAE.
2010 Peer-reviewedpublication Cross-sectionalstudy Transplant 102 APRI(>0.50)
Liverbiopsy(F2-F4)
nd
APRI(>1.50)
Liverbiopsy(F2-F4)
ATC-abstract596 A.Brar,M.Salifu,M.Rampal,N.
Sumrani,D.John,F.Tedla.
2012 Abstract Cross-sectionalstudy HD 26 APRI Liverbiopsy(F2-F4)
nd
24353319 JiangY.,HuangE.,MehrniaA.,
KamgarM.,PhamPT.,
OgunorunyinkaO.,BrownI.,
DanovitchGM.,BunnapradistS.
2014 Peer-reviewedpublication Cross-sectionalstudy HD?(Transplantcandidates) 210 APRI(≥0.4)
Liverbiopsy(F3-F4)
nd
APRI(>0.95)
Liverbiopsy(F3-F4)
21393486 LiuCH.,LiangCC.,HuangKW.,Liu
CJ.,ChenSI.,LinJW.,HungPH.,
TsaiHB.,LaiMY.,ChenPJ.,Chen
JH.,ChenDS.,KaoJH.
2011 Peer-reviewedpublication Cross-sectionalstudy HD 304 APRI(1.5)
Liverbiopsy(≥F2)
nd
APRI(0.55)
Liverbiopsy(≥F2)
nd
APRI(0.5)
Liverbiopsy(≥F2)
nd
APRI(1.75)
Liverbiopsy(F3)
nd
APRI(0.75)
Liverbiopsy(F3)
nd
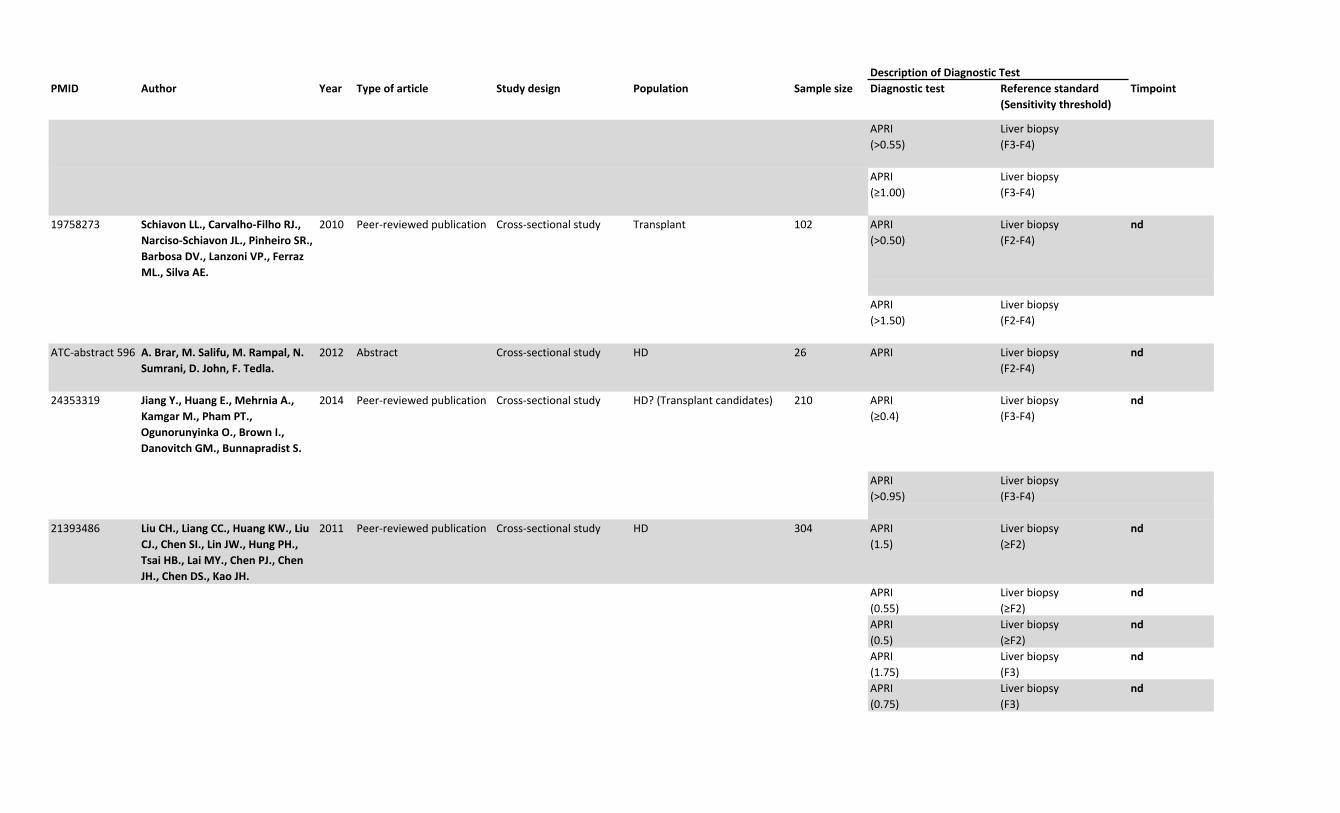
PMID Author Year Typeofarticle Studydesign Population Samplesize Diagnostictest Referencestandard
(Sensitivitythreshold)
Timpoint
DescriptionofDiagnosticTest
16371924 VarautA.,FontaineH.,SerpaggiJ.,
VerkarreV.,Vallet-PichardA.,
NalpasB.,ImbertbismuthF.,
LebrayP.,PolS.
2005 Peer-reviewedpublication Cross-sectionalstudy HD&Transplant 110 Fibrotest(>0.6)
Liverbiopsy(F2-F4)
nd
Fibrotest(≥0.2)
Liverbiopsy(F2-F4)
Fibrotest(>0.6)
Liverbiopsy(F3-F4)
Fibrotest(≥0.2)
Liverbiopsy(F3-F4)
HD 50 Fibrotest(>0.6)
Liverbiopsy(F2-F4)
Fibrotest(≥0.2)
Liverbiopsy(F2-F4)
Fibrotest(>0.6)
Liverbiopsy(F3-F4)
Fibrotest(≥0.2)
Liverbiopsy(F3-F4)
Transplant 60 Fibrotest(>0.6)
Liverbiopsy(F2-F4)
Fibrotest(≥0.2)
Liverbiopsy(F2-F4)
Fibrotest(>0.6)
Liverbiopsy(F3-F4)
Fibrotest(≥0.2)
Liverbiopsy(F3-F4)
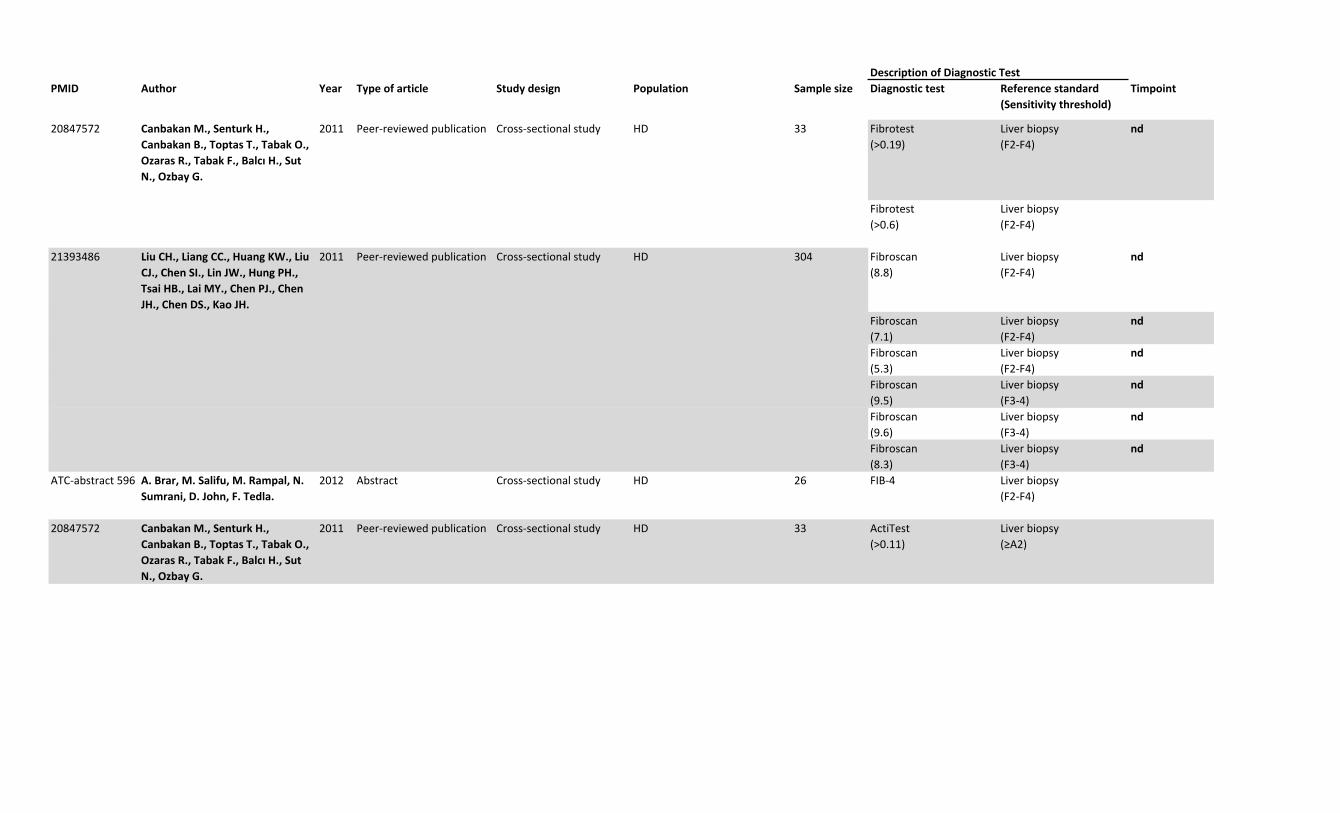
PMID Author Year Typeofarticle Studydesign Population Samplesize Diagnostictest Referencestandard
(Sensitivitythreshold)
Timpoint
DescriptionofDiagnosticTest
20847572 CanbakanM.,SenturkH.,
CanbakanB.,ToptasT.,TabakO.,
OzarasR.,TabakF.,BalcıH.,Sut
N.,OzbayG.
2011 Peer-reviewedpublication Cross-sectionalstudy HD 33 Fibrotest(>0.19)
Liverbiopsy(F2-F4)
nd
Fibrotest(>0.6)
Liverbiopsy(F2-F4)
21393486 LiuCH.,LiangCC.,HuangKW.,Liu
CJ.,ChenSI.,LinJW.,HungPH.,
TsaiHB.,LaiMY.,ChenPJ.,Chen
JH.,ChenDS.,KaoJH.
2011 Peer-reviewedpublication Cross-sectionalstudy HD 304 Fibroscan(8.8)
Liverbiopsy(F2-F4)
nd
Fibroscan(7.1)
Liverbiopsy(F2-F4)
nd
Fibroscan(5.3)
Liverbiopsy(F2-F4)
nd
Fibroscan(9.5)
Liverbiopsy(F3-4)
nd
Fibroscan(9.6)
Liverbiopsy(F3-4)
nd
Fibroscan(8.3)
Liverbiopsy(F3-4)
nd
ATC-abstract596 A.Brar,M.Salifu,M.Rampal,N.
Sumrani,D.John,F.Tedla.
2012 Abstract Cross-sectionalstudy HD 26 FIB-4 Liverbiopsy(F2-F4)
20847572 CanbakanM.,SenturkH.,
CanbakanB.,ToptasT.,TabakO.,
OzarasR.,TabakF.,BalcıH.,Sut
N.,OzbayG.
2011 Peer-reviewedpublication Cross-sectionalstudy HD 33 ActiTest(>0.11)
Liverbiopsy(≥A2)
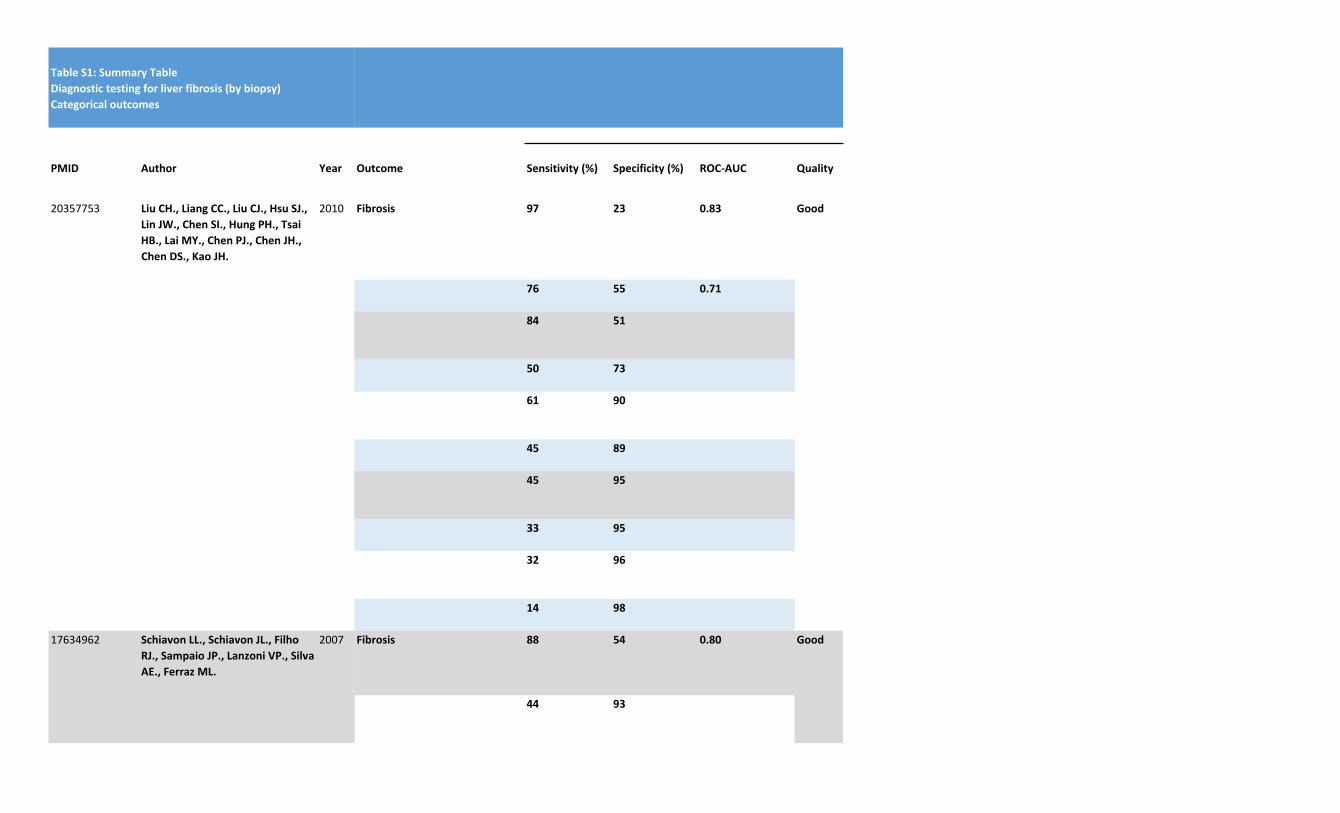
TableS1:SummaryTable
Diagnostictestingforliverfibrosis(bybiopsy)
Categoricaloutcomes
PMID Author Year
20357753 LiuCH.,LiangCC.,LiuCJ.,HsuSJ.,
LinJW.,ChenSI.,HungPH.,Tsai
HB.,LaiMY.,ChenPJ.,ChenJH.,
ChenDS.,KaoJH.
2010
17634962 SchiavonLL.,SchiavonJL.,Filho
RJ.,SampaioJP.,LanzoniVP.,Silva
AE.,FerrazML.
2007
Outcome Sensitivity(%) Specificity(%) ROC-AUC Quality
Fibrosis 97 23 0.83 Good
76 55 0.71
84 51
50 73
61 90
45 89
45 95
33 95
32 96
14 98
Fibrosis 88 54 0.80 Good
44 93
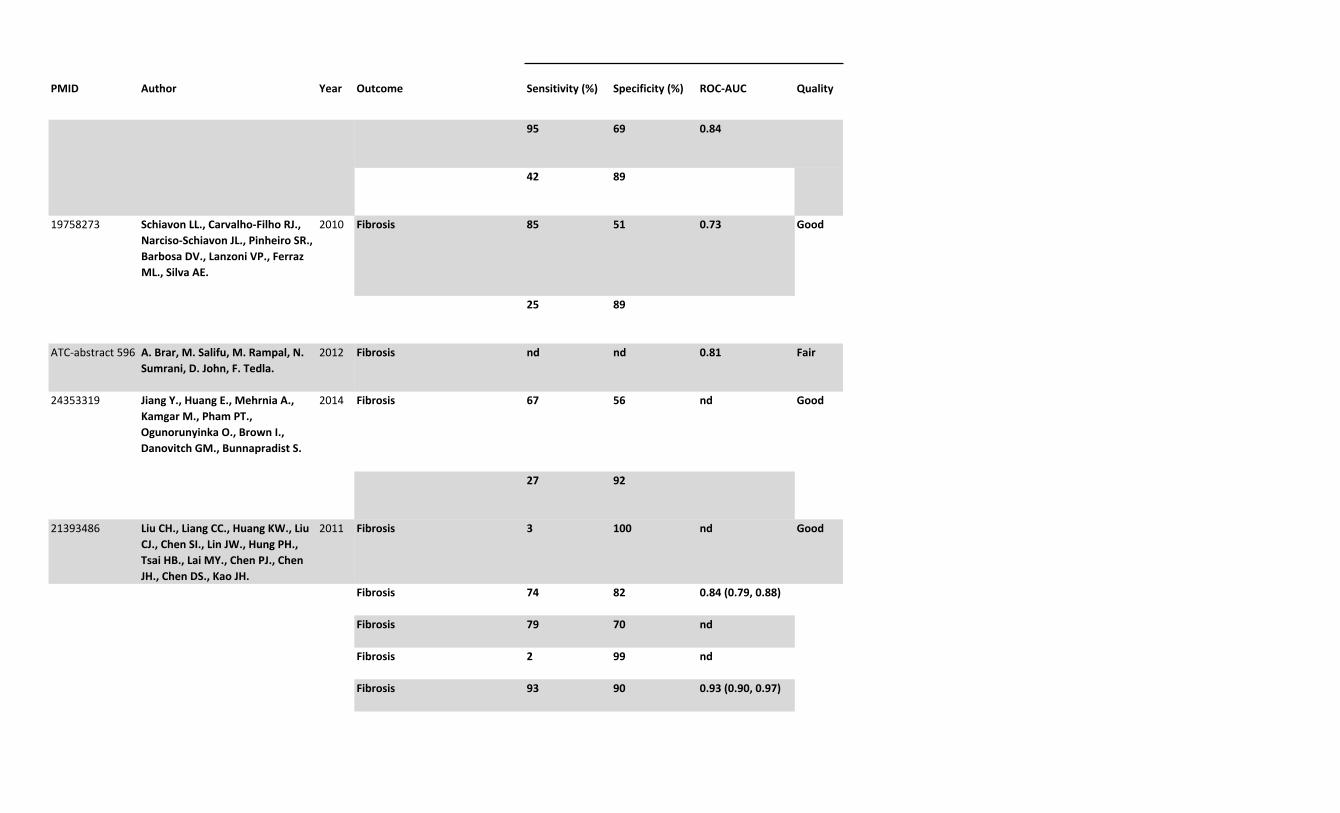
PMID Author Year
19758273 SchiavonLL.,Carvalho-FilhoRJ.,
Narciso-SchiavonJL.,PinheiroSR.,
BarbosaDV.,LanzoniVP.,Ferraz
ML.,SilvaAE.
2010
ATC-abstract596 A.Brar,M.Salifu,M.Rampal,N.
Sumrani,D.John,F.Tedla.
2012
24353319 JiangY.,HuangE.,MehrniaA.,
KamgarM.,PhamPT.,
OgunorunyinkaO.,BrownI.,
DanovitchGM.,BunnapradistS.
2014
21393486 LiuCH.,LiangCC.,HuangKW.,Liu
CJ.,ChenSI.,LinJW.,HungPH.,
TsaiHB.,LaiMY.,ChenPJ.,Chen
JH.,ChenDS.,KaoJH.
2011
Outcome Sensitivity(%) Specificity(%) ROC-AUC Quality
95 69 0.84
42 89
Fibrosis 85 51 0.73 Good
25 89
Fibrosis nd nd 0.81 Fair
Fibrosis 67 56 nd Good
27 92
Fibrosis 3 100 nd Good
Fibrosis 74 82 0.84(0.79,0.88)
Fibrosis 79 70 nd
Fibrosis 2 99 nd
Fibrosis 93 90 0.93(0.90,0.97)
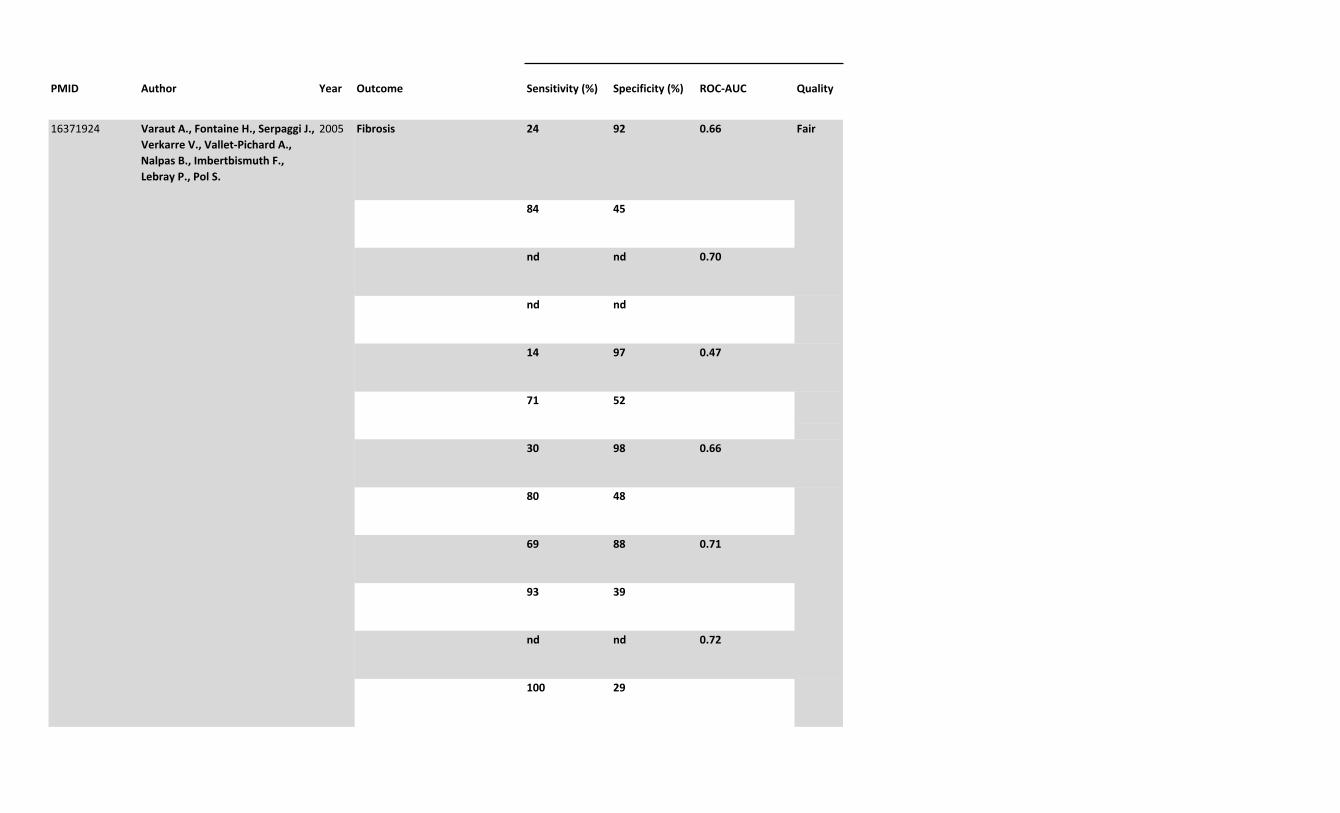
PMID Author Year
16371924 VarautA.,FontaineH.,SerpaggiJ.,
VerkarreV.,Vallet-PichardA.,
NalpasB.,ImbertbismuthF.,
LebrayP.,PolS.
2005
Outcome Sensitivity(%) Specificity(%) ROC-AUC Quality
Fibrosis 24 92 0.66 Fair
84 45
nd nd 0.70
nd nd
14 97 0.47
71 52
30 98 0.66
80 48
69 88 0.71
93 39
nd nd 0.72
100 29
PMID Author Year
20847572 CanbakanM.,SenturkH.,
CanbakanB.,ToptasT.,TabakO.,
OzarasR.,TabakF.,BalcıH.,Sut
N.,OzbayG.
2011
21393486 LiuCH.,LiangCC.,HuangKW.,Liu
CJ.,ChenSI.,LinJW.,HungPH.,
TsaiHB.,LaiMY.,ChenPJ.,Chen
JH.,ChenDS.,KaoJH.
2011
ATC-abstract596 A.Brar,M.Salifu,M.Rampal,N.
Sumrani,D.John,F.Tedla.
2012
20847572 CanbakanM.,SenturkH.,
CanbakanB.,ToptasT.,TabakO.,
OzarasR.,TabakF.,BalcıH.,Sut
N.,OzbayG.
2011
Outcome Sensitivity(%) Specificity(%) ROC-AUC Quality
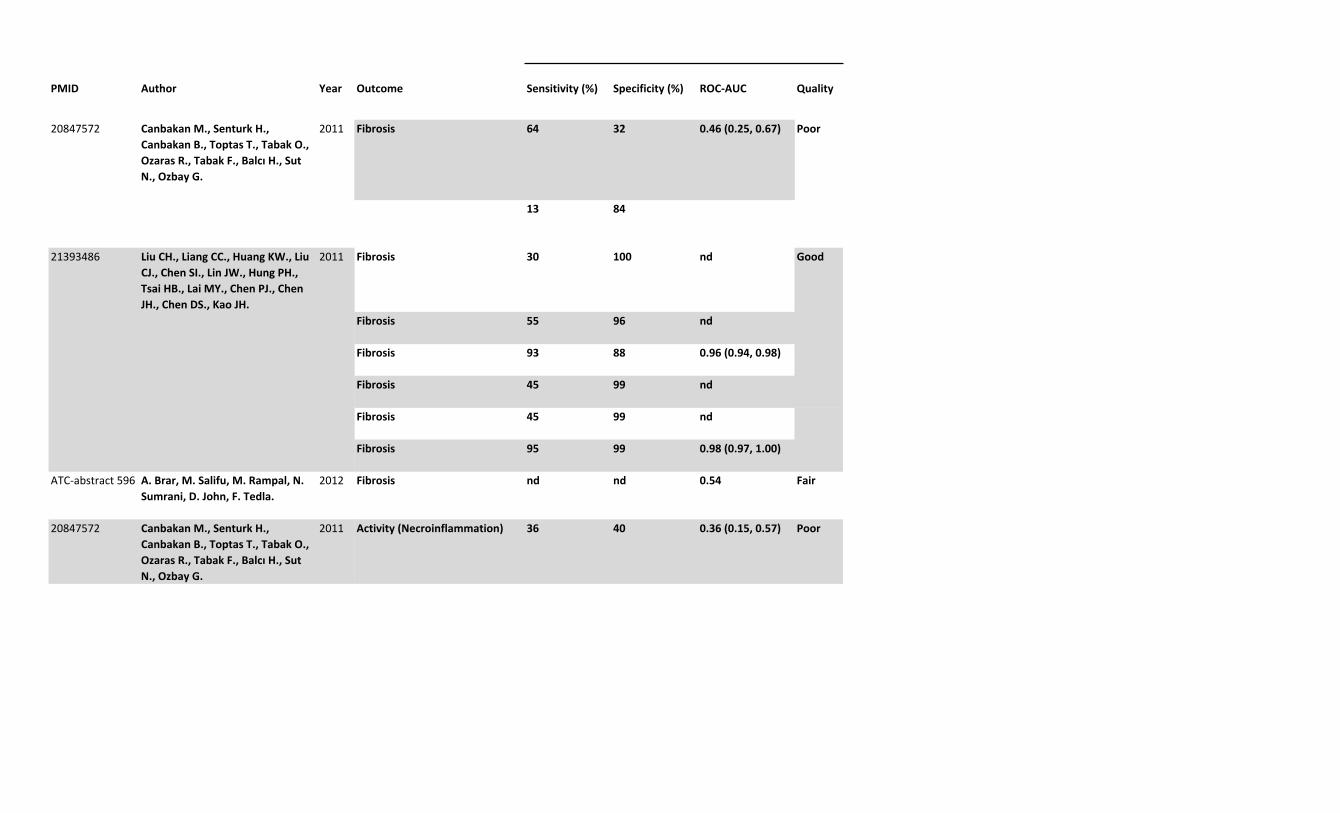
Fibrosis 64 32 0.46(0.25,0.67) Poor
13 84
Fibrosis 30 100 nd Good
Fibrosis 55 96 nd
Fibrosis 93 88 0.96(0.94,0.98)
Fibrosis 45 99 nd
Fibrosis 45 99 nd
Fibrosis 95 99 0.98(0.97,1.00)
Fibrosis nd nd 0.54 Fair
Activity(Necroinflammation) 36 40 0.36(0.15,0.57) Poor
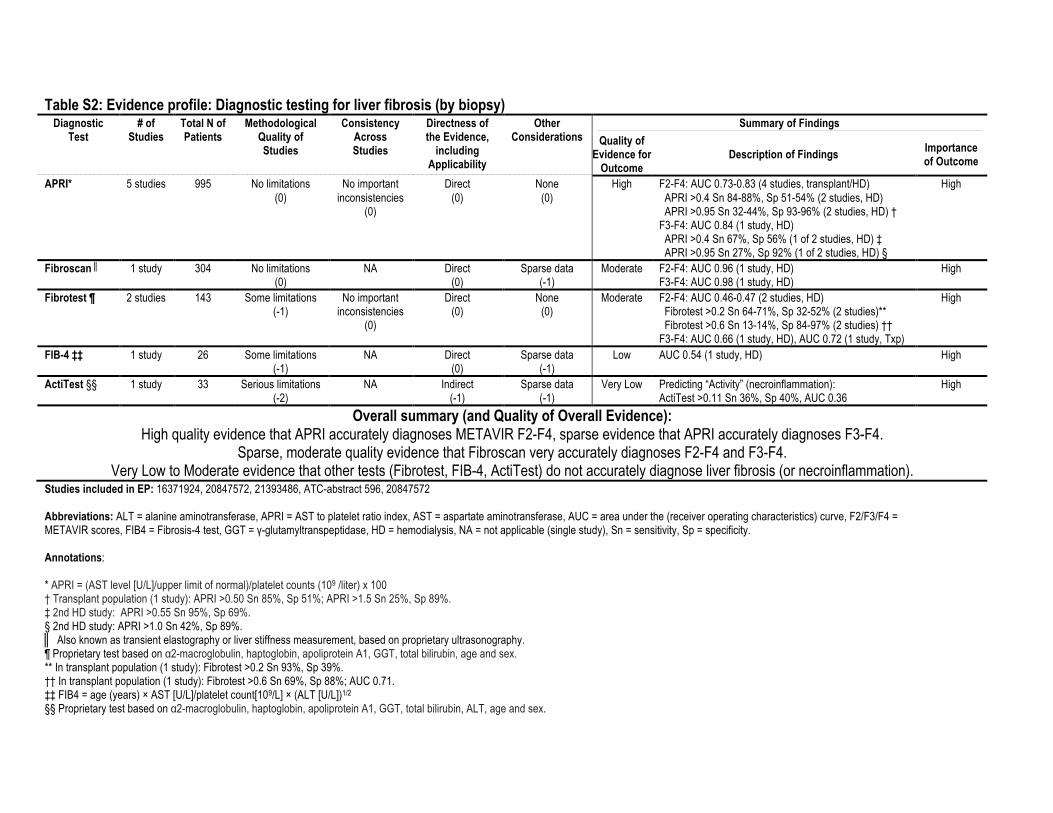
Table S2: Evidence profile: Diagnostic testing for liver fibrosis (by biopsy) Diagnostic
Test # of
Studies
Total N of Patients
Methodological Quality of Studies
Consistency Across Studies
Directness of the Evidence,
including Applicability
Other Considerations
Summary of Findings Quality of
Evidence for Outcome
Description of Findings Importance of Outcome
APRI* 5 studies 995 No limitations (0)
No important inconsistencies
(0)
Direct (0)
None (0)
High F2-F4: AUC 0.73-0.83 (4 studies, transplant/HD) APRI >0.4 Sn 84-88%, Sp 51-54% (2 studies, HD) APRI >0.95 Sn 32-44%, Sp 93-96% (2 studies, HD) † F3-F4: AUC 0.84 (1 study, HD) APRI >0.4 Sn 67%, Sp 56% (1 of 2 studies, HD) ‡ APRI >0.95 Sn 27%, Sp 92% (1 of 2 studies, HD) §
High
Fibroscan ║ 1 study 304 No limitations (0)
NA Direct (0)
Sparse data (-1)
Moderate F2-F4: AUC 0.96 (1 study, HD) F3-F4: AUC 0.98 (1 study, HD)
High
Fibrotest ¶ 2 studies 143 Some limitations (-1)
No important inconsistencies
(0)
Direct (0)
None (0)
Moderate F2-F4: AUC 0.46-0.47 (2 studies, HD) Fibrotest >0.2 Sn 64-71%, Sp 32-52% (2 studies)** Fibrotest >0.6 Sn 13-14%, Sp 84-97% (2 studies) †† F3-F4: AUC 0.66 (1 study, HD), AUC 0.72 (1 study, Txp)
High
FIB-4 ‡‡ 1 study 26 Some limitations (-1)
NA Direct (0)
Sparse data (-1)
Low AUC 0.54 (1 study, HD) High
ActiTest §§ 1 study 33 Serious limitations (-2)
NA Indirect (-1)
Sparse data (-1)
Very Low Predicting “Activity” (necroinflammation): ActiTest >0.11 Sn 36%, Sp 40%, AUC 0.36
High
Overall summary (and Quality of Overall Evidence): High quality evidence that APRI accurately diagnoses METAVIR F2-F4, sparse evidence that APRI accurately diagnoses F3-F4.
Sparse, moderate quality evidence that Fibroscan very accurately diagnoses F2-F4 and F3-F4. Very Low to Moderate evidence that other tests (Fibrotest, FIB-4, ActiTest) do not accurately diagnose liver fibrosis (or necroinflammation).
Studies included in EP: 16371924, 20847572, 21393486, ATC-abstract 596, 20847572 Abbreviations: ALT = alanine aminotransferase, APRI = AST to platelet ratio index, AST = aspartate aminotransferase, AUC = area under the (receiver operating characteristics) curve, F2/F3/F4 = METAVIR scores, FIB4 = Fibrosis-4 test, GGT = γ-glutamyltranspeptidase, HD = hemodialysis, NA = not applicable (single study), Sn = sensitivity, Sp = specificity. Annotations: * APRI = (AST level [U/L]/upper limit of normal)/platelet counts (109 /liter) x 100 † Transplant population (1 study): APRI >0.50 Sn 85%, Sp 51%; APRI >1.5 Sn 25%, Sp 89%. ‡ 2nd HD study: APRI >0.55 Sn 95%, Sp 69%. § 2nd HD study: APRI >1.0 Sn 42%, Sp 89%. ║ Also known as transient elastography or liver stiffness measurement, based on proprietary ultrasonography. ¶ Proprietary test based on α2-macroglobulin, haptoglobin, apoliprotein A1, GGT, total bilirubin, age and sex. ** In transplant population (1 study): Fibrotest >0.2 Sn 93%, Sp 39%. †† In transplant population (1 study): Fibrotest >0.6 Sn 69%, Sp 88%; AUC 0.71. ‡‡ FIB4 = age (years) × AST [U/L]/platelet count[109/L] × (ALT [U/L])1/2
§§ Proprietary test based on α2-macroglobulin, haptoglobin, apoliprotein A1, GGT, total bilirubin, ALT, age and sex.
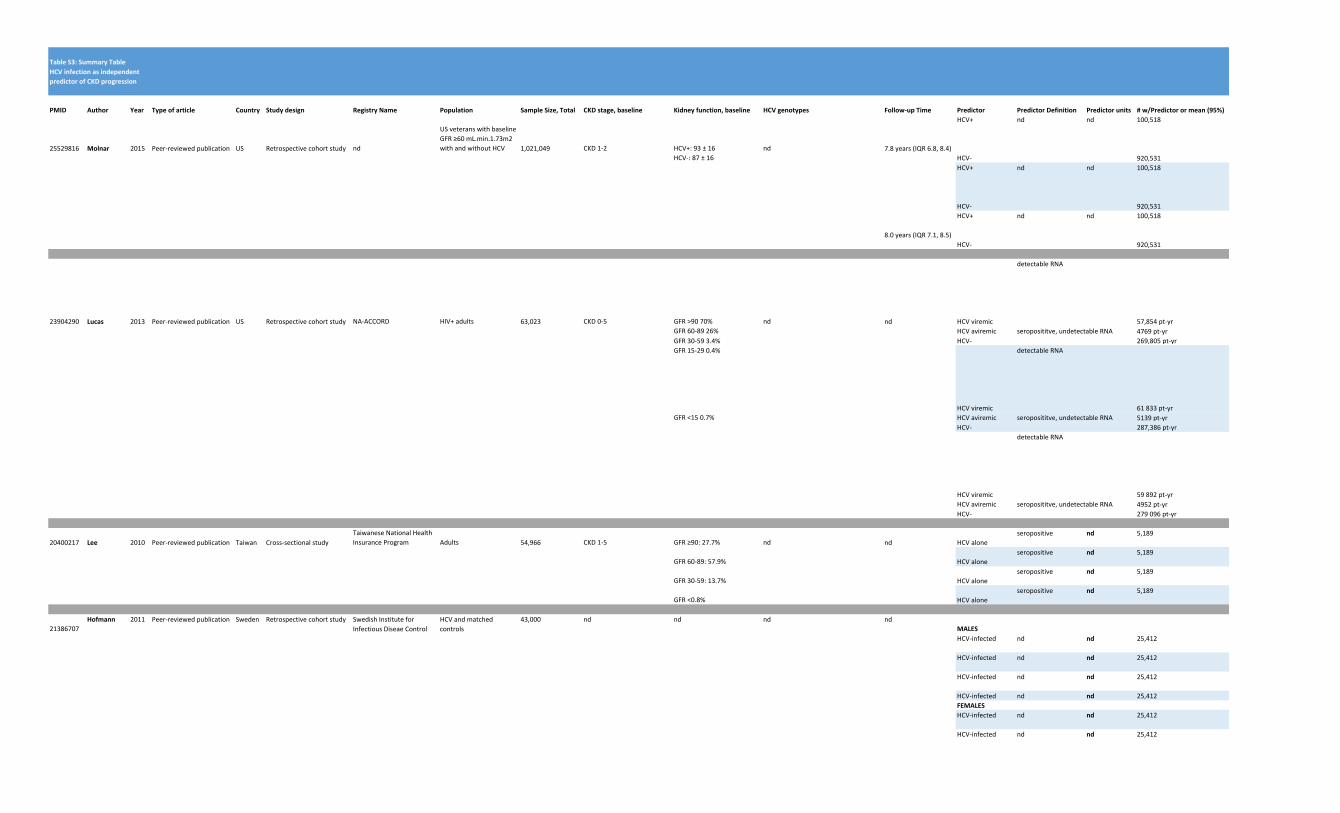
TableS3:SummaryTable
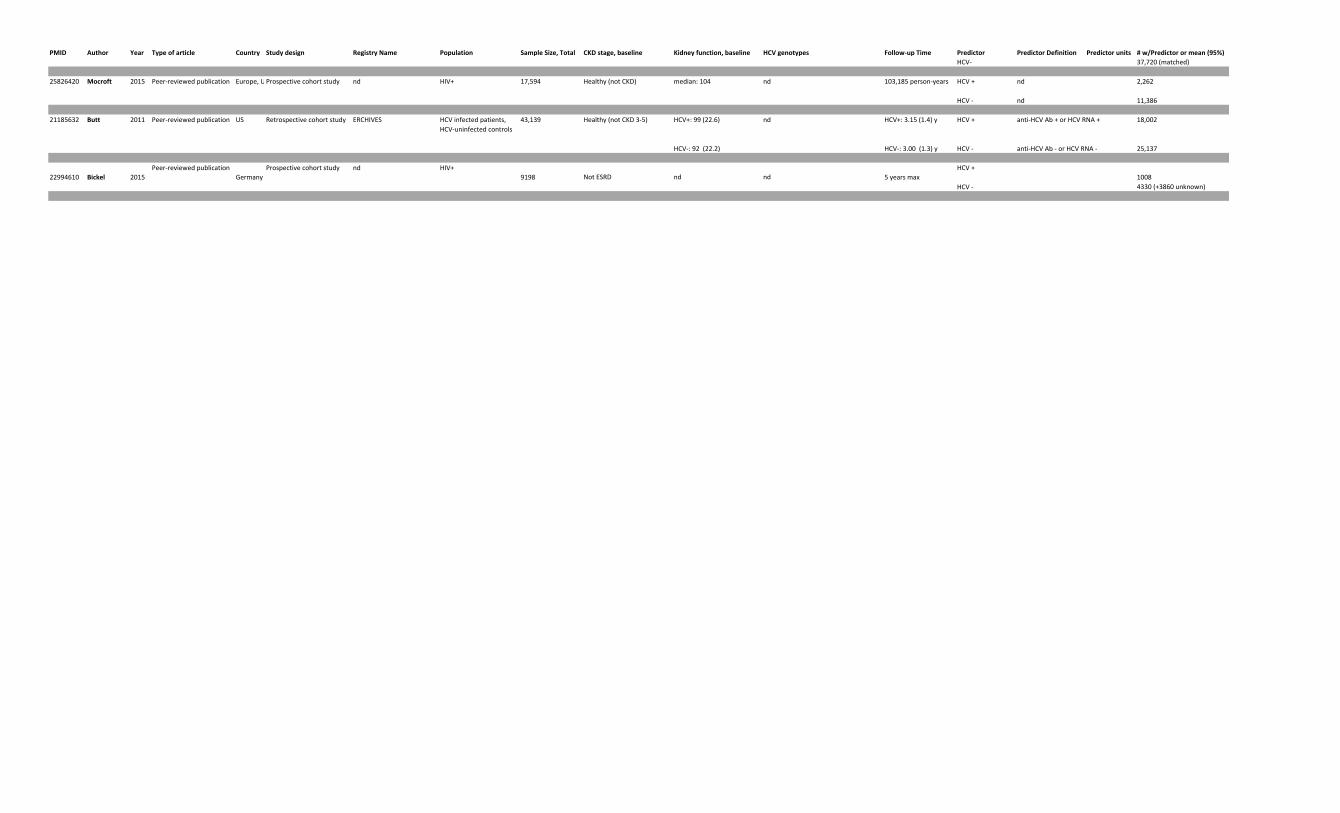
PMID Author Year Typeofarticle Country Studydesign RegistryName Population SampleSize,Total CKDstage,baseline Kidneyfunction,baseline HCVgenotypes Follow-upTime Predictor PredictorDefinition Predictorunits #w/Predictorormean(95%)
25529816 Molnar 2015 Peer-reviewedpublication US Retrospectivecohortstudy nd
USveteranswithbaselineGFR≥60mL.min.1.73m2withandwithoutHCV 1,021,049 CKD1-2 HCV+:93±16 nd 7.8years(IQR6.8,8.4)
HCV+ nd nd 100,518
HCV-:87±16 HCV- 920,531HCV+ nd nd 100,518
HCV- 920,531
8.0years(IQR7.1,8.5)
HCV+ nd nd 100,518
HCV- 920,531
23904290 Lucas 2013 Peer-reviewedpublication US Retrospectivecohortstudy NA-ACCORD HIV+adults 63,023 CKD0-5 GFR>9070% nd nd HCVviremic
detectableRNA
57,854pt-yrGFR60-8926% HCVaviremic seroposititve,undetectableRNA 4769pt-yrGFR30-593.4% HCV- 269,805pt-yrGFR15-290.4%
HCVviremic
detectableRNA
61833pt-yrGFR<150.7% HCVaviremic seroposititve,undetectableRNA 5139pt-yr
HCV- 287,386pt-yr
HCVviremic
detectableRNA
59892pt-yrHCVaviremic seroposititve,undetectableRNA 4952pt-yrHCV- 279096pt-yr
20400217 Lee 2010 Peer-reviewedpublication Taiwan Cross-sectionalstudyTaiwaneseNationalHealthInsuranceProgram Adults 54,966 CKD1-5 GFR≥90:27.7% nd nd HCValone
seropositive nd 5,189
GFR60-89:57.9% HCValoneseropositive nd 5,189
GFR30-59:13.7% HCValoneseropositive nd 5,189
GFR<0.8% HCValoneseropositive nd 5,189
21386707Hofmann 2011 Peer-reviewedpublication Sweden Retrospectivecohortstudy SwedishInstitutefor
InfectiousDiseaeControlHCVandmatchedcontrols
43,000 nd nd nd ndMALESHCV-infected nd nd 25,412
HCV-infected nd nd 25,412
HCV-infected nd nd 25,412
HCV-infected nd nd 25,412FEMALESHCV-infected nd nd 25,412
HCV-infected nd nd 25,412
HCVinfectionasindependentpredictorofCKDprogression
PMID Author Year Typeofarticle Country Studydesign RegistryName Population SampleSize,Total CKDstage,baseline Kidneyfunction,baseline HCVgenotypes Follow-upTime Predictor PredictorDefinition Predictorunits #w/Predictorormean(95%)HCV-infected nd nd 25,412
HCV-infected nd nd 25,412
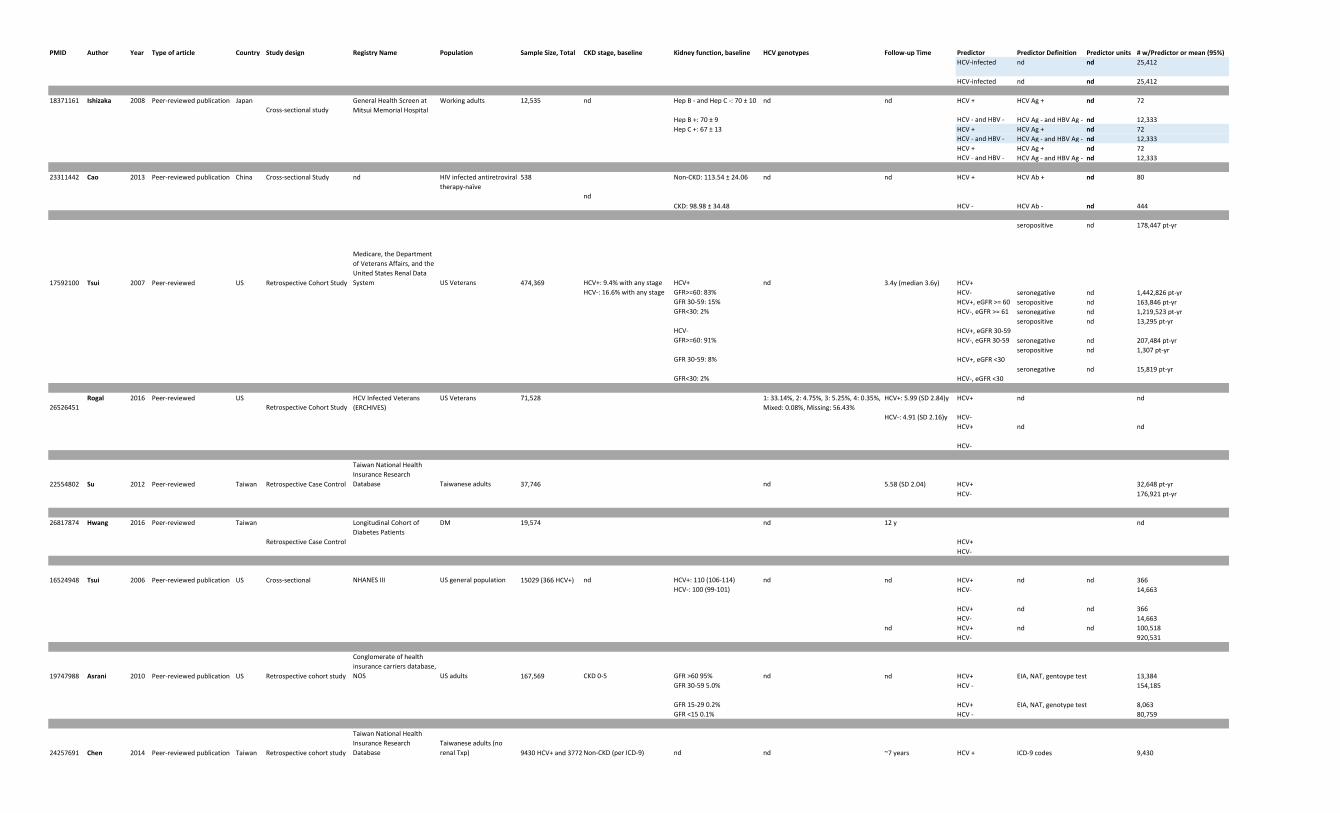
18371161 Ishizaka 2008 Peer-reviewedpublication JapanCross-sectionalstudy
GeneralHealthScreenatMitsuiMemorialHospital
Workingadults 12,535 nd HepB-andHepC-:70±10 nd nd HCV+ HCVAg+ nd 72
HepB+:70±9 HCV-andHBV- HCVAg-andHBVAg- nd 12,333HepC+:67±13 HCV+ HCVAg+ nd 72
HCV-andHBV- HCVAg-andHBVAg- nd 12,333HCV+ HCVAg+ nd 72HCV-andHBV- HCVAg-andHBVAg- nd 12,333
23311442 Cao 2013 Peer-reviewedpublication China Cross-sectionalStudy nd HIVinfectedantiretroviraltherapy-naïve
538
nd
Non-CKD:113.54±24.06 nd nd HCV+ HCVAb+ nd 80
CKD:98.98±34.48 HCV- HCVAb- nd 444
17592100 Tsui 2007 Peer-reviewed US RetrospectiveCohortStudy
Medicare,theDepartmentofVeteransAffairs,andtheUnitedStatesRenalDataSystem USVeterans 474,369 HCV+:9.4%withanystage HCV+ nd 3.4y(median3.6y) HCV+
seropositive nd 178,447pt-yr
HCV-:16.6%withanystage GFR>=60:83% HCV- seronegative nd 1,442,826pt-yrGFR30-59:15% HCV+,eGFR>=60 seropositive nd 163,846pt-yrGFR<30:2% HCV-,eGFR>=61 seronegative nd 1,219,523pt-yr
HCV- HCV+,eGFR30-59seropositive nd 13,295pt-yr
GFR>=60:91% HCV-,eGFR30-59 seronegative nd 207,484pt-yr
GFR30-59:8% HCV+,eGFR<30seropositive nd 1,307pt-yr
GFR<30:2% HCV-,eGFR<30seronegative nd 15,819pt-yr
26526451Rogal 2016 Peer-reviewed US
RetrospectiveCohortStudyHCVInfectedVeterans(ERCHIVES)
USVeterans 71,528 1:33.14%,2:4.75%,3:5.25%,4:0.35%,Mixed:0.08%,Missing:56.43%
HCV+:5.99(SD2.84)y HCV+ nd nd
HCV-:4.91(SD2.16)y HCV-HCV+ nd nd
HCV-
22554802 Su 2012 Peer-reviewed Taiwan RetrospectiveCaseControl
TaiwanNationalHealthInsuranceResearchDatabase Taiwaneseadults 37,746 nd 5.58(SD2.04) HCV+ 32,648pt-yr
HCV- 176,921pt-yr
26817874 Hwang 2016 Peer-reviewed Taiwan
RetrospectiveCaseControl
LongitudinalCohortofDiabetesPatients
DM 19,574 nd 12y
HCV+
nd
HCV-
16524948 Tsui 2006 Peer-reviewedpublication US Cross-sectional NHANESIII USgeneralpopulation 15029(366HCV+) nd HCV+:110(106-114) nd nd HCV+ nd nd 366HCV-:100(99-101) HCV- 14,663
HCV+ nd nd 366HCV- 14,663
nd HCV+ nd nd 100,518HCV- 920,531
19747988 Asrani 2010 Peer-reviewedpublication US Retrospectivecohortstudy
Conglomerateofhealthinsurancecarriersdatabase,NOS USadults 167,569 CKD0-5 GFR>6095% nd nd HCV+ EIA,NAT,gentoypetest 13,384
GFR30-595.0% HCV- 154,185
GFR15-290.2% HCV+ EIA,NAT,genotypetest 8,063GFR<150.1% HCV- 80,759
24257691 Chen 2014 Peer-reviewedpublication Taiwan Retrospectivecohortstudy
TaiwanNationalHealthInsuranceResearchDatabase
Taiwaneseadults(norenalTxp) 9430HCV+and37720matchedcontrolsNon-CKD(perICD-9) nd nd ~7years HCV+ ICD-9codes 9,430
PMID Author Year Typeofarticle Country Studydesign RegistryName Population SampleSize,Total CKDstage,baseline Kidneyfunction,baseline HCVgenotypes Follow-upTime Predictor PredictorDefinition Predictorunits #w/Predictorormean(95%)HCV- 37,720(matched)
25826420 Mocroft 2015 Peer-reviewedpublication Europe,US,AustraliaProspectivecohortstudy nd HIV+ 17,594 Healthy(notCKD) median:104 nd 103,185person-years HCV+ nd 2,262
HCV- nd 11,386
21185632 Butt 2011 Peer-reviewedpublication US Retrospectivecohortstudy ERCHIVES HCVinfectedpatients,HCV-uninfectedcontrols
43,139 Healthy(notCKD3-5) HCV+:99(22.6) nd HCV+:3.15(1.4)y HCV+ anti-HCVAb+orHCVRNA+ 18,002
HCV-:92(22.2) HCV-:3.00(1.3)y HCV- anti-HCVAb-orHCVRNA- 25,137
22994610 Bickel 2015Peer-reviewedpublication
GermanyProspectivecohortstudy nd HIV+
9198 NotESRD nd nd 5yearsmaxHCV+
1008HCV- 4330(+3860unknown)
TableS3:SummaryTable
PMID Author Year
25529816 Molnar 2015
23904290 Lucas 2013
20400217 Lee 2010
21386707Hofmann 2011
HCVinfectionasindependentpredictorofCKDprogression
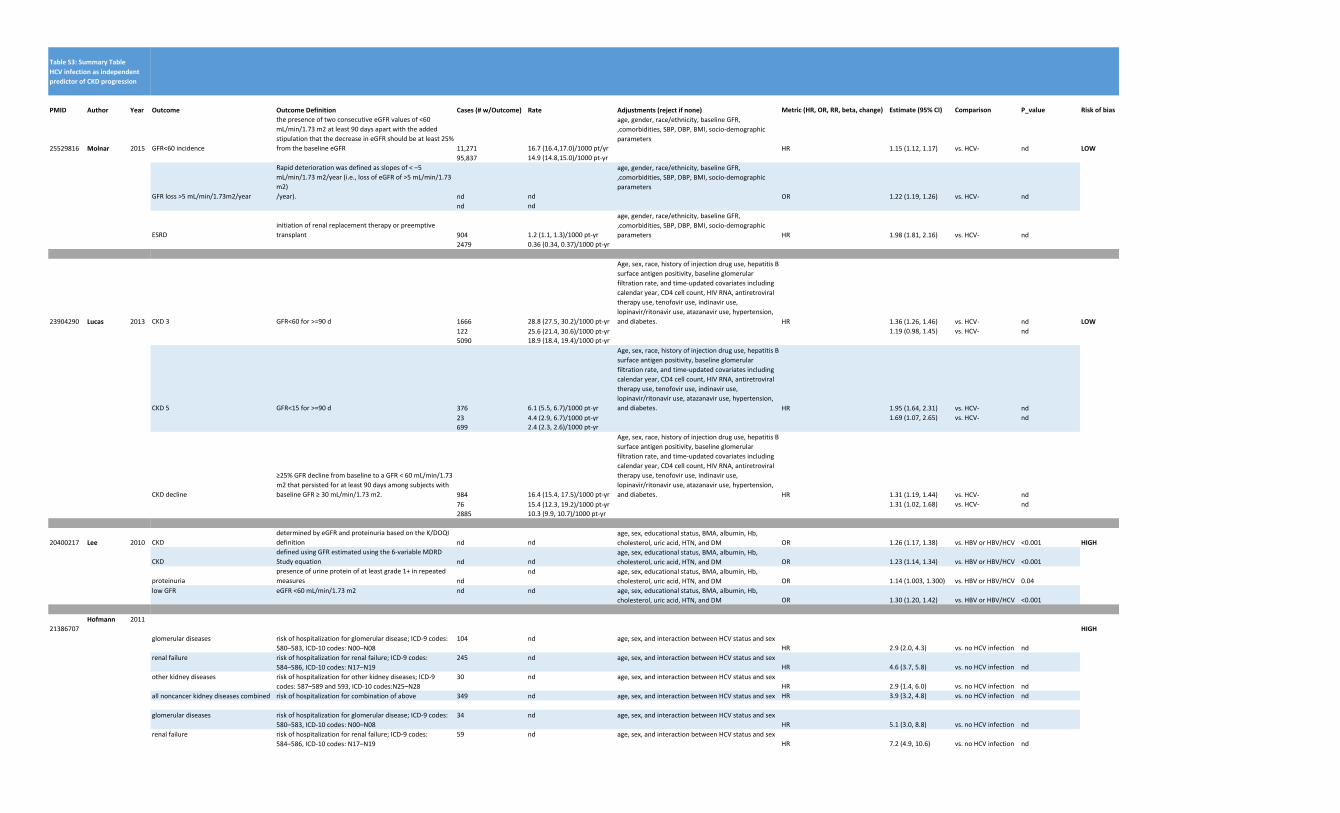
Outcome OutcomeDefinition Cases(#w/Outcome) Rate Adjustments(rejectifnone) Metric(HR,OR,RR,beta,change) Estimate(95%CI) Comparison P_value Riskofbias
GFR<60incidence
thepresenceoftwoconsecutiveeGFRvaluesof<60mL/min/1.73m2atleast90daysapartwiththeaddedstipulationthatthedecreaseineGFRshouldbeatleast25%fromthebaselineeGFR 11,271 16.7(16.4,17.0)/1000pt/yr
age,gender,race/ethnicity,baselineGFR,,comorbidities,SBP,DBP,BMI,socio-demographicparameters
HR 1.15(1.12,1.17) vs.HCV- nd LOW95,837 14.9(14.8,15.0)/1000pt-yr
GFRloss>5mL/min/1.73m2/year
Rapiddeteriorationwasdefinedasslopesof<–5mL/min/1.73m2/year(i.e.,lossofeGFRof>5mL/min/1.73m2)/year). nd nd
age,gender,race/ethnicity,baselineGFR,,comorbidities,SBP,DBP,BMI,socio-demographicparameters
OR 1.22(1.19,1.26) vs.HCV- ndnd nd
ESRDinitiationofrenalreplacementtherapyorpreemptivetransplant 904 1.2(1.1,1.3)/1000pt-yr
age,gender,race/ethnicity,baselineGFR,,comorbidities,SBP,DBP,BMI,socio-demographicparameters HR 1.98(1.81,2.16) vs.HCV- nd
2479 0.36(0.34,0.37)/1000pt-yr
CKD3 GFR<60for>=90d 1666 28.8(27.5,30.2)/1000pt-yr
Age,sex,race,historyofinjectiondruguse,hepatitisBsurfaceantigenpositivity,baselineglomerularfiltrationrate,andtime-updatedcovariatesincludingcalendaryear,CD4cellcount,HIVRNA,antiretroviraltherapyuse,tenofoviruse,indinaviruse,lopinavir/ritonaviruse,atazanaviruse,hypertension,anddiabetes. HR 1.36(1.26,1.46) vs.HCV- nd LOW
122 25.6(21.4,30.6)/1000pt-yr 1.19(0.98,1.45) vs.HCV- nd5090 18.9(18.4,19.4)/1000pt-yr
CKD5 GFR<15for>=90d 376 6.1(5.5,6.7)/1000pt-yr
Age,sex,race,historyofinjectiondruguse,hepatitisBsurfaceantigenpositivity,baselineglomerularfiltrationrate,andtime-updatedcovariatesincludingcalendaryear,CD4cellcount,HIVRNA,antiretroviraltherapyuse,tenofoviruse,indinaviruse,lopinavir/ritonaviruse,atazanaviruse,hypertension,anddiabetes. HR 1.95(1.64,2.31) vs.HCV- nd
23 4.4(2.9,6.7)/1000pt-yr 1.69(1.07,2.65) vs.HCV- nd699 2.4(2.3,2.6)/1000pt-yr
CKDdecline
≥25%GFRdeclinefrombaselinetoaGFR<60mL/min/1.73m2thatpersistedforatleast90daysamongsubjectswithbaselineGFR≥30mL/min/1.73m2. 984 16.4(15.4,17.5)/1000pt-yr
Age,sex,race,historyofinjectiondruguse,hepatitisBsurfaceantigenpositivity,baselineglomerularfiltrationrate,andtime-updatedcovariatesincludingcalendaryear,CD4cellcount,HIVRNA,antiretroviraltherapyuse,tenofoviruse,indinaviruse,lopinavir/ritonaviruse,atazanaviruse,hypertension,anddiabetes. HR 1.31(1.19,1.44) vs.HCV- nd
76 15.4(12.3,19.2)/1000pt-yr 1.31(1.02,1.68) vs.HCV- nd2885 10.3(9.9,10.7)/1000pt-yr
CKDdeterminedbyeGFRandproteinuriabasedontheK/DOQIdefinition nd nd
age,sex,educationalstatus,BMA,albumin,Hb,cholesterol,uricacid,HTN,andDM OR 1.26(1.17,1.38) vs.HBVorHBV/HCV <0.001 HIGH
CKDdefinedusingGFRestimatedusingthe6-variableMDRDStudyequation nd nd
age,sex,educationalstatus,BMA,albumin,Hb,cholesterol,uricacid,HTN,andDM OR 1.23(1.14,1.34) vs.HBVorHBV/HCV <0.001
proteinuriapresenceofurineproteinofatleastgrade1+inrepeatedmeasures nd
nd age,sex,educationalstatus,BMA,albumin,Hb,cholesterol,uricacid,HTN,andDM OR 1.14(1.003,1.300) vs.HBVorHBV/HCV 0.04
lowGFR eGFR<60mL/min/1.73m2 nd nd age,sex,educationalstatus,BMA,albumin,Hb,cholesterol,uricacid,HTN,andDM OR 1.30(1.20,1.42) vs.HBVorHBV/HCV <0.001
HIGHglomerulardiseases riskofhospitalizationforglomerulardisease;ICD-9codes:
580–583,ICD-10codes:N00–N08104 nd age,sex,andinteractionbetweenHCVstatusandsex
HR 2.9(2.0,4.3) vs.noHCVinfection ndrenalfailure riskofhospitalizationforrenalfailure;ICD-9codes:
584–586,ICD-10codes:N17–N19245 nd age,sex,andinteractionbetweenHCVstatusandsex
HR 4.6(3.7,5.8) vs.noHCVinfection ndotherkidneydiseases riskofhospitalizationforotherkidneydiseases;ICD-9
codes:587–589and593,ICD-10codes:N25–N2830 nd age,sex,andinteractionbetweenHCVstatusandsex
HR 2.9(1.4,6.0) vs.noHCVinfection ndallnoncancerkidneydiseasescombined riskofhospitalizationforcombinationofabove 349 nd age,sex,andinteractionbetweenHCVstatusandsex HR 3.9(3.2,4.8) vs.noHCVinfection nd
glomerulardiseases riskofhospitalizationforglomerulardisease;ICD-9codes:580–583,ICD-10codes:N00–N08
34 nd age,sex,andinteractionbetweenHCVstatusandsexHR 5.1(3.0,8.8) vs.noHCVinfection nd
renalfailure riskofhospitalizationforrenalfailure;ICD-9codes:584–586,ICD-10codes:N17–N19
59 nd age,sex,andinteractionbetweenHCVstatusandsexHR 7.2(4.9,10.6) vs.noHCVinfection nd

PMID Author Year
18371161 Ishizaka 2008
23311442 Cao 2013
17592100 Tsui 2007
26526451Rogal 2016
22554802 Su 2012
26817874 Hwang 2016
16524948 Tsui 2006
19747988 Asrani 2010
24257691 Chen 2014
Outcome OutcomeDefinition Cases(#w/Outcome) Rate Adjustments(rejectifnone) Metric(HR,OR,RR,beta,change) Estimate(95%CI) Comparison P_value Riskofbiasotherkidneydiseases riskofhospitalizationforotherkidneydiseases;ICD-9
codes:587–589and593,ICD-10codes:N25–N284 nd age,sex,andinteractionbetweenHCVstatusandsex
HR 10.0(2.7,37.2) vs.noHCVinfection ndallnoncancerkidneydiseasescombined riskofhospitalizationforcombinationofabove 94 nd age,sex,andinteractionbetweenHCVstatusandsex HR 5.8(4.2,7.9) vs.noHCVinfection nd
LoweGFR eGFR<60mL/min/1.73m2 22 31% age,sex,SBP,andFPGOR 1.63(0.95,2.80) vs.HCV-andHBV- 0.077 HIGH
1887 15%Albuminuria UAERof330mg/g 14 19% age,sex,SBP,andFPG OR 2.00(1.06,3.76) vs.HCV-andHBV- 0.034
1157 9%CKD eGFR<60mL/min/1.73m2,orUAERof330mg/g nd nd age,sex,SBP,andFPG OR 1.83(1.10,3.05) vs.HCV-andHBV- 0.02
nd nd
CKD GFR<60mL/minper1.73m2and/orisolatedproteinuria(>=1+onurinedipstick)for3months
20 25% age,HIVviralload
OR 2.074(1.036,4.149) vs.HCV- 0.011 HIGH64 14%
ESRD onsetofchronicdialysisorrenaltransplantation 760 4.26(3.97-4.57)/1000pt-yr
age,sex,race/ethnicity,diabetesmellitus,hypertension,humanimmunodeficiencyvirusinfection,congestiveheartfailure,coronaryheartdisease,peripheralvasculardisease,chronicobstructivepulmonarydisease,cerebrovasculardisease,substanceabuse,andbaselineeGFR,alsostratifiedbyage HR 1.68(1.54-1.82) vs.HCV- nd LOW
4393 3.05(2.96-3.14)/1000pt-yr106 0.65(0.54-0.78)/1000pt-yr HR 2.74(2.13-3.51) vs.HCV- nd308 0.25(0.23-0.28)/1000/pt-yr228 17.15(15.06-19.53)/1000pt-
yr HR 2.57(2.20-3.01) vs.HCV- nd1039 5.01(4.71-5.32)/1000pt-yr426 326.03(296.49-358.50)/1000
pt-yr HR 1.28(1.15-1.44) vs.HCV- nd3046 192.55(185.83-199.51)/1000
pt-yr
CKD3-5 nd nd baselineGFRwithFIB-4includedasatime-varyingcovariate HR 0.86(0.79,0.92) HCV+vs.HCV- <0.0001 LOW
ProgressiveCKD declineineGFRof>=30frombaseline nd nd baselineGFRwithFIB-4includedasatime-varyingcovariate HR 0.93(0.86,1.00) HCV+vs.HCV- 0.06
ESRD 77age,sex,occupation,urbanization,andCharlsonComorbidityIndexscore HR 1.53(1.17,2.01) vs.HCV- 0.002 LOW
196 resultsalsostratifiedbyage,sex,andfollowupinterval
ESRD nd nd sex,ageatindexdateandvariouscomorbiditiesincludinghypertension,CAD,hyperlipidemia,HBVinfection,goutandlivercirrhosis HR 1.47(1.11-1.93) vs.HCV- <0.05 LOW
GFR<60prevalence eGFR<60 366 2.0(1.1,3.6)%age,gender,race/ethnicity,educationalstatus,smokingstatus,DM,andHTN OR 0.89(0.49,1.62) vs.HCV- 0.7 LOW
14,663 4.3(3.7,4.9)%
Albuminuriaprevalence Albuminuria 366 ndage,gender,race/ethnicity,educationalstatus,smokingstatus,DM,andHTN OR 1.22(1.19,1.26) vs.HCV- nd
14,663 nd
CKDprevalence(baseline) GFR<60(singlemeasurement) 13,384 5.3%Age,sex,cirrhosis,DM,HTN,CHF,PVD,CAD,COPD,HIV,drug/alcoholabuse,depression OR 0.90(0.36,2.27) vs.HCV- 0.7 LOW
154,185 5.1%
ProgressiontoCKD GFR<60withoutbaselineCKD 8,063 3.8%Age,sex,cirrhosis,DM,HTN,CHF,PVD,CAD,COPD,HIV,drug/alcoholabuse,depression OR 0.92(0.79,1.08) vs.HCV-
80,759 3.5%
CKD,incident ICD-9code 367 3.9%(5.46/1000person-yr)
ageperyear,sex,comorbidities,geographicregion,urbanizationlevel,enrolleecategory,andnumberofmedicalvisitsin1yearbeforestudyentry HR 1.28(1.12,1.46) vsHCV- <0.001 LOW
PMID Author Year
25826420 Mocroft 2015
21185632 Butt 2011
22994610 Bickel 2015
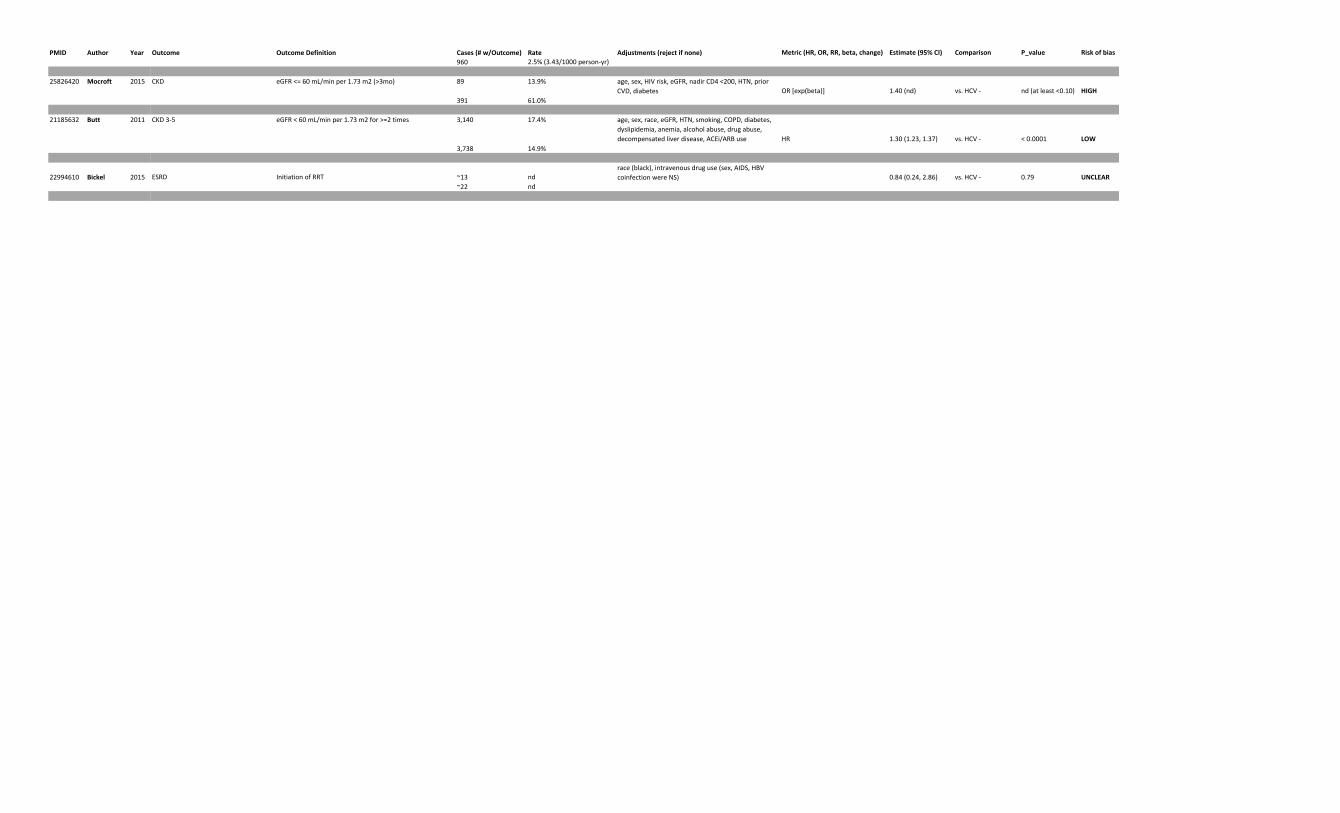
Outcome OutcomeDefinition Cases(#w/Outcome) Rate Adjustments(rejectifnone) Metric(HR,OR,RR,beta,change) Estimate(95%CI) Comparison P_value Riskofbias960 2.5%(3.43/1000person-yr)
CKD eGFR<=60mL/minper1.73m2(>3mo) 89 13.9% age,sex,HIVrisk,eGFR,nadirCD4<200,HTN,priorCVD,diabetes OR[exp(beta)] 1.40(nd) vs.HCV- nd(atleast<0.10) HIGH
391 61.0%
CKD3-5 eGFR<60mL/minper1.73m2for>=2times 3,140 17.4% age,sex,race,eGFR,HTN,smoking,COPD,diabetes,dyslipidemia,anemia,alcoholabuse,drugabuse,decompensatedliverdisease,ACEi/ARBuse HR 1.30(1.23,1.37) vs.HCV- <0.0001 LOW
3,738 14.9%
ESRD InitiationofRRT ~13 ndrace(black),intravenousdruguse(sex,AIDS,HBVcoinfectionwereNS) 0.84(0.24,2.86) vs.HCV- 0.79 UNCLEAR
~22 nd
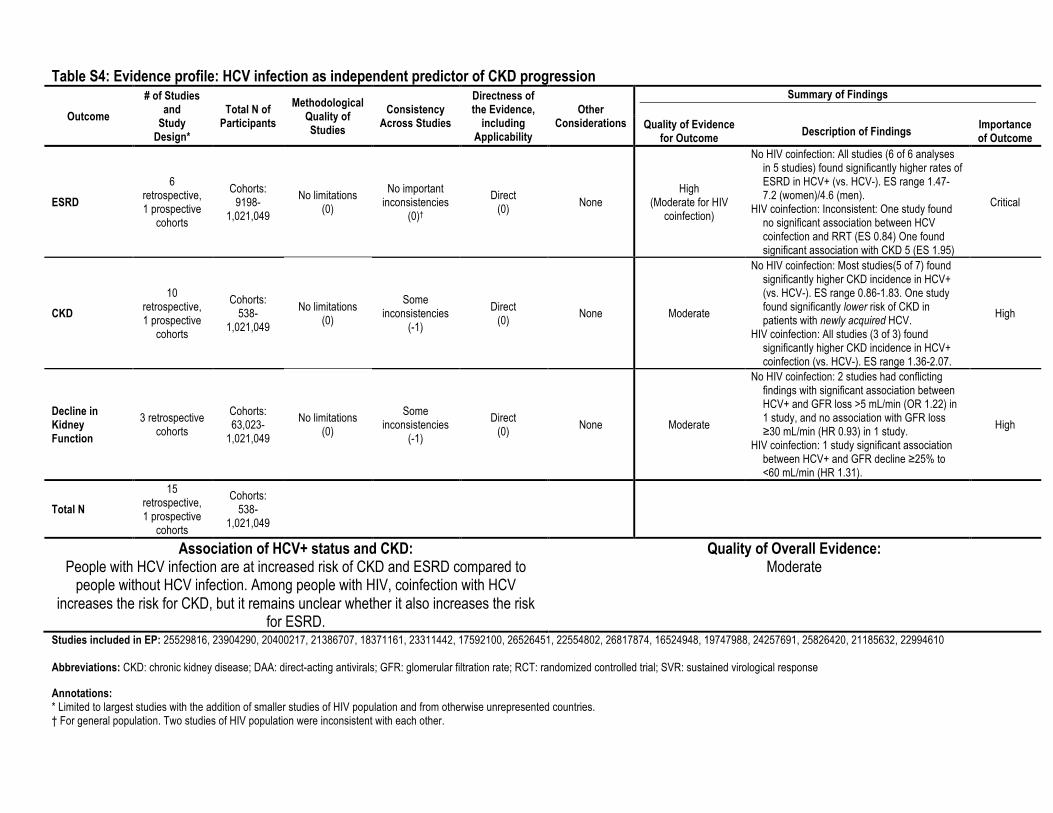
Table S4: Evidence profile: HCV infection as independent predictor of CKD progression
Outcome
# of Studies and
Study Design*
Total N of Participants
Methodological Quality of Studies
Consistency Across Studies
Directness of the Evidence,
including Applicability
Other Considerations
Summary of Findings
Quality of Evidence for Outcome Description of Findings Importance
of Outcome
ESRD
6 retrospective, 1 prospective
cohorts
Cohorts: 9198-
1,021,049
No limitations (0)
No important inconsistencies
(0)†
Direct (0) None
High (Moderate for HIV
coinfection)
No HIV coinfection: All studies (6 of 6 analyses in 5 studies) found significantly higher rates of ESRD in HCV+ (vs. HCV-). ES range 1.47-7.2 (women)/4.6 (men).
HIV coinfection: Inconsistent: One study found no significant association between HCV coinfection and RRT (ES 0.84) One found significant association with CKD 5 (ES 1.95)
Critical
CKD 10
retrospective, 1 prospective
cohorts
Cohorts: 538-
1,021,049 No limitations
(0)
Some inconsistencies
(-1) Direct
(0) None Moderate
No HIV coinfection: Most studies(5 of 7) found significantly higher CKD incidence in HCV+ (vs. HCV-). ES range 0.86-1.83. One study found significantly lower risk of CKD in patients with newly acquired HCV.
HIV coinfection: All studies (3 of 3) found significantly higher CKD incidence in HCV+ coinfection (vs. HCV-). ES range 1.36-2.07.
High
Decline in Kidney Function
3 retrospective cohorts
Cohorts: 63,023-
1,021,049
No limitations (0)
Some inconsistencies
(-1)
Direct (0) None Moderate
No HIV coinfection: 2 studies had conflicting findings with significant association between HCV+ and GFR loss >5 mL/min (OR 1.22) in 1 study, and no association with GFR loss ≥30 mL/min (HR 0.93) in 1 study.
HIV coinfection: 1 study significant association between HCV+ and GFR decline ≥25% to <60 mL/min (HR 1.31).
High
Total N 15
retrospective, 1 prospective
cohorts
Cohorts: 538-
1,021,049
Association of HCV+ status and CKD: People with HCV infection are at increased risk of CKD and ESRD compared to
people without HCV infection. Among people with HIV, coinfection with HCV increases the risk for CKD, but it remains unclear whether it also increases the risk
for ESRD.
Quality of Overall Evidence: Moderate
Studies included in EP: 25529816, 23904290, 20400217, 21386707, 18371161, 23311442, 17592100, 26526451, 22554802, 26817874, 16524948, 19747988, 24257691, 25826420, 21185632, 22994610 Abbreviations: CKD: chronic kidney disease; DAA: direct-acting antivirals; GFR: glomerular filtration rate; RCT: randomized controlled trial; SVR: sustained virological response Annotations: * Limited to largest studies with the addition of smaller studies of HIV population and from otherwise unrepresented countries. † For general population. Two studies of HIV population were inconsistent with each other.
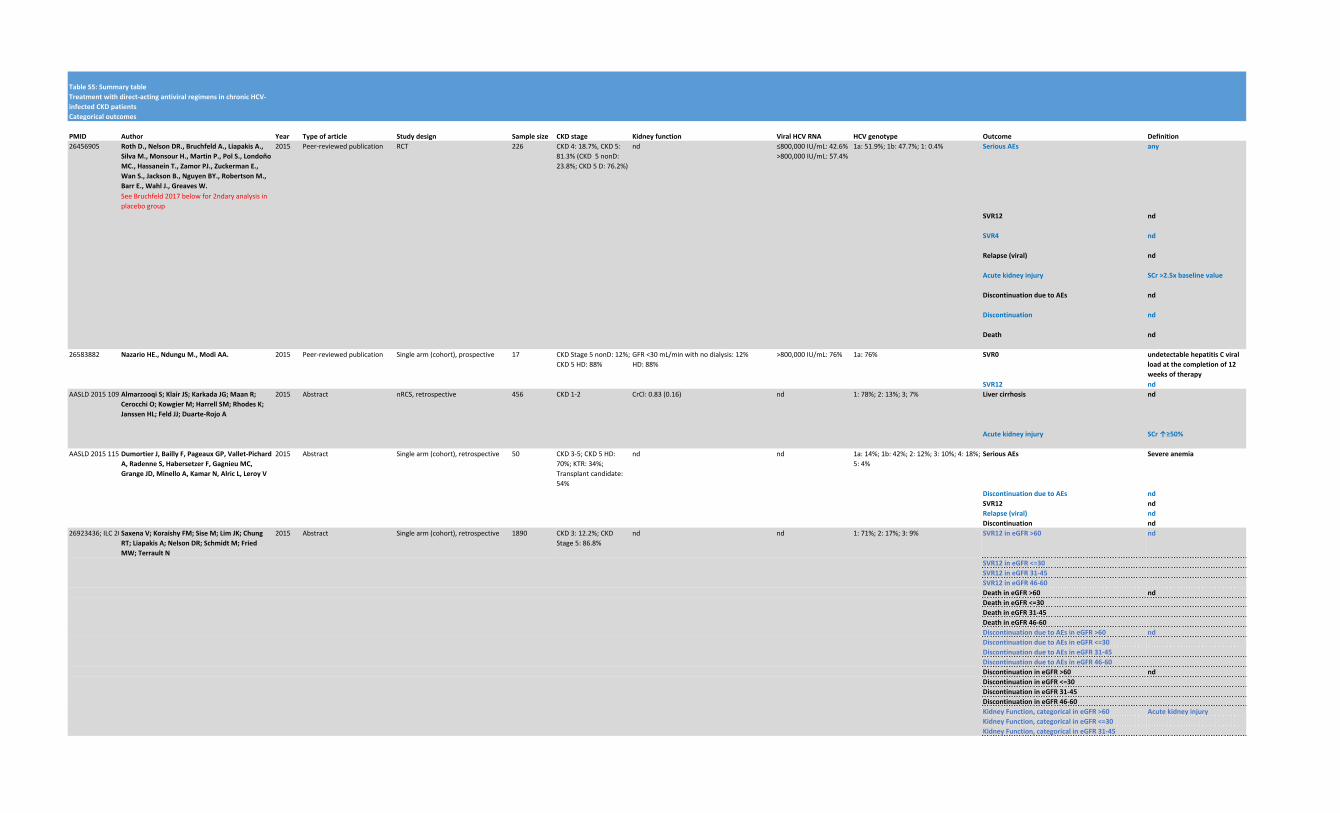
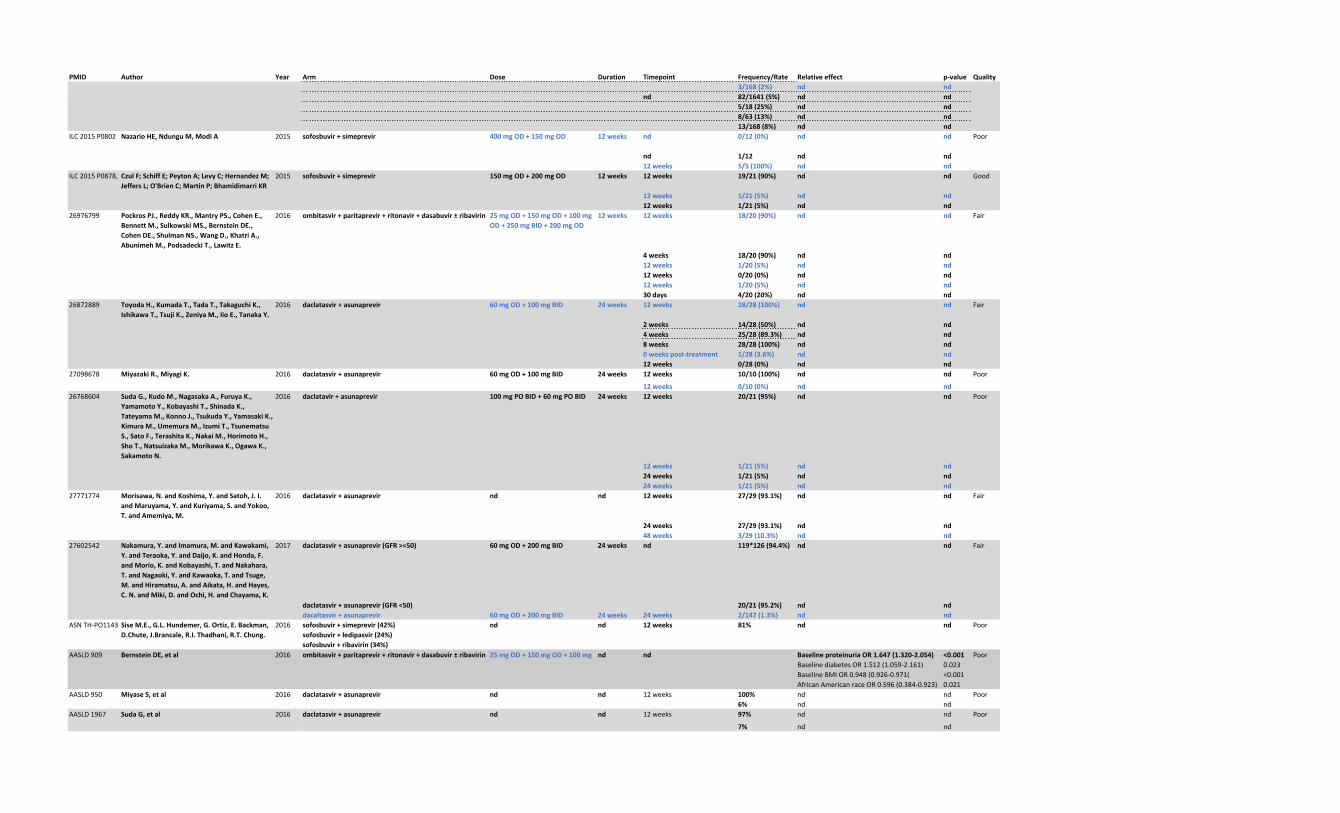
TableS5:Summarytable
Categoricaloutcomes
PMID Author Year Typeofarticle Studydesign Samplesize CKDstage Kidneyfunction ViralHCVRNA HCVgenotype Outcome Definition
26456905 RothD.,NelsonDR.,BruchfeldA.,LiapakisA.,
SilvaM.,MonsourH.,MartinP.,PolS.,Londoño
MC.,HassaneinT.,ZamorPJ.,ZuckermanE.,
WanS.,JacksonB.,NguyenBY.,RobertsonM.,
BarrE.,WahlJ.,GreavesW.
2015 Peer-reviewedpublication RCT 226 CKD4:18.7%,CKD5:81.3%(CKD5nonD:23.8%;CKD5D:76.2%)
nd ≤800,000IU/mL:42.6%>800,000IU/mL:57.4%
1a:51.9%;1b:47.7%;1:0.4% SeriousAEs any
SeeBruchfeld2017belowfor2ndaryanalysisinplacebogroup
SVR12 nd
SVR4 nd
Relapse(viral) nd
Acutekidneyinjury SCr>2.5xbaselinevalue
DiscontinuationduetoAEs nd
Discontinuation nd
Death nd
26583882 NazarioHE.,NdunguM.,ModiAA. 2015 Peer-reviewedpublication Singlearm(cohort),prospective 17 CKDStage5nonD:12%;CKD5HD:88%
GFR<30mL/minwithnodialysis:12%HD:88%
>800,000IU/mL:76% 1a:76% SVR0 undetectablehepatitisCviral
loadatthecompletionof12
weeksoftherapy
SVR12 nd
AASLD20151099AlmarzooqiS;KlairJS;KarkadaJG;MaanR;
CerocchiO;KowgierM;HarrellSM;RhodesK;
JanssenHL;FeldJJ;Duarte-RojoA
2015 Abstract nRCS,retrospective 456 CKD1-2 CrCl:0.83(0.16) nd 1:78%;2:13%;3;7% Livercirrhosis nd
Acutekidneyinjury SCr↑≥50%
AASLD20151158DumortierJ,BaillyF,PageauxGP,Vallet-Pichard
A,RadenneS,HabersetzerF,GagnieuMC,
GrangeJD,MinelloA,KamarN,AlricL,LeroyV
2015 Abstract Singlearm(cohort),retrospective 50 CKD3-5;CKD5HD:70%;KTR:34%;Transplantcandidate:54%
nd nd 1a:14%;1b:42%;2:12%;3:10%;4:18%;5:4%
SeriousAEs Severeanemia
DiscontinuationduetoAEs nd
SVR12 nd
Relapse(viral) nd
Discontinuation nd
26923436;ILC2015LP08SaxenaV;KoraishyFM;SiseM;LimJK;Chung
RT;LiapakisA;NelsonDR;SchmidtM;Fried
MW;TerraultN
2015 Abstract Singlearm(cohort),retrospective 1890 CKD3:12.2%;CKDStage5:86.8%
nd nd 1:71%;2:17%;3:9% SVR12ineGFR>60 nd
SVR12ineGFR<=30
SVR12ineGFR31-45
SVR12ineGFR46-60
DeathineGFR>60 nd
DeathineGFR<=30
DeathineGFR31-45
DeathineGFR46-60
DiscontinuationduetoAEsineGFR>60 nd
DiscontinuationduetoAEsineGFR<=30
DiscontinuationduetoAEsineGFR31-45
DiscontinuationduetoAEsineGFR46-60
DiscontinuationineGFR>60 nd
DiscontinuationineGFR<=30
DiscontinuationineGFR31-45
DiscontinuationineGFR46-60
KidneyFunction,categoricalineGFR>60 Acutekidneyinjury
KidneyFunction,categoricalineGFR<=30
KidneyFunction,categoricalineGFR31-45
Treatmentwithdirect-actingantiviralregimensinchronicHCV-
infectedCKDpatients
PMID Author Year Typeofarticle Studydesign Samplesize CKDstage Kidneyfunction ViralHCVRNA HCVgenotype Outcome Definition
KidneyFunction,categoricalineGFR46-60
KidneyFunction,categoricalineGFR>60 RenalorUrinarySystem
KidneyFunction,categoricalineGFR<=30
KidneyFunction,categoricalineGFR31-45
KidneyFunction,categoricalineGFR46-60
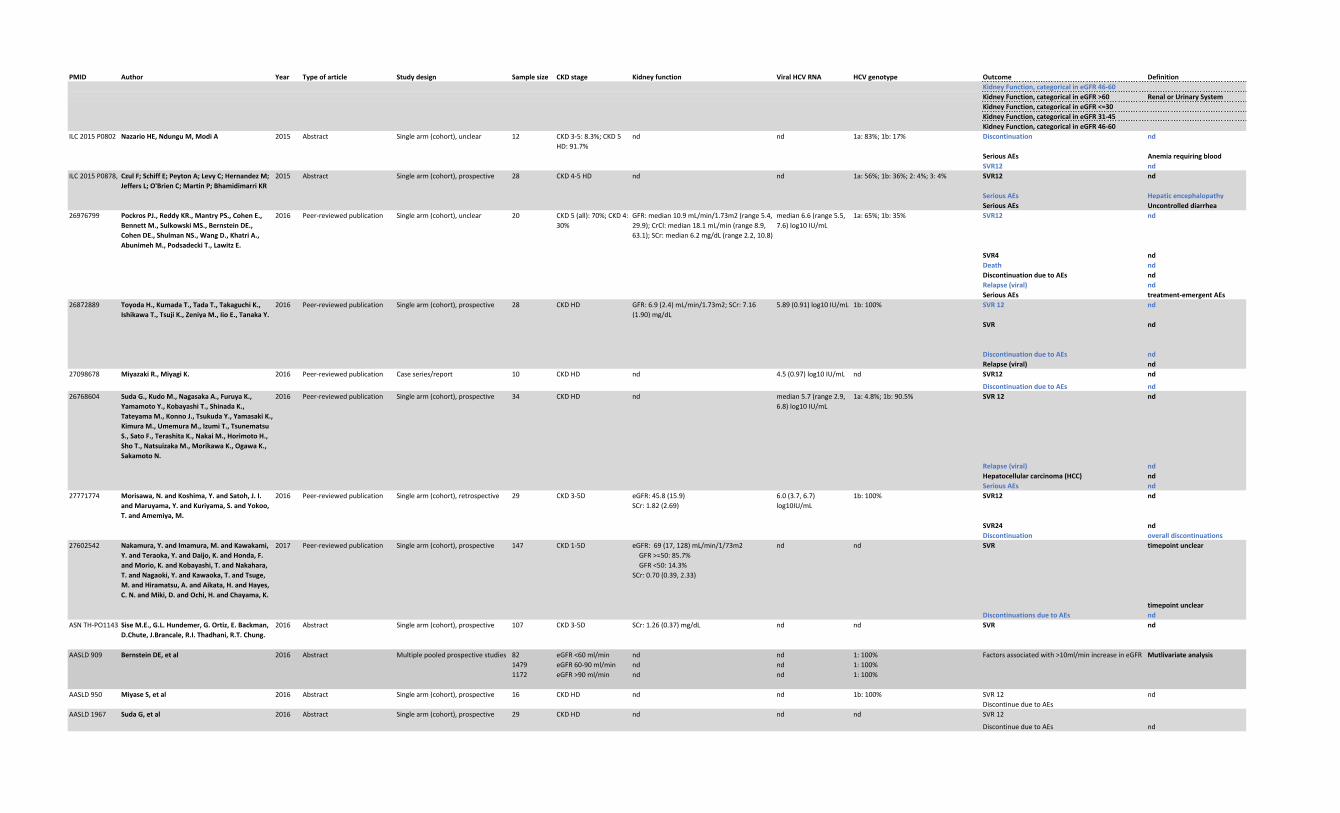
ILC2015P0802 NazarioHE,NdunguM,ModiA 2015 Abstract Singlearm(cohort),unclear 12 CKD3-5:8.3%;CKD5HD:91.7%
nd nd 1a:83%;1b:17% Discontinuation nd
SeriousAEs Anemiarequiringblood
SVR12 nd
ILC2015P0878,AASLD20152256CzulF;SchiffE;PeytonA;LevyC;HernandezM;
JeffersL;O'BrienC;MartinP;BhamidimarriKR
2015 Abstract Singlearm(cohort),prospective 28 CKD4-5HD nd nd 1a:56%;1b:36%;2:4%;3:4% SVR12 nd
SeriousAEs Hepaticencephalopathy
SeriousAEs Uncontrolleddiarrhea
26976799 PockrosPJ.,ReddyKR.,MantryPS.,CohenE.,
BennettM.,SulkowskiMS.,BernsteinDE.,
CohenDE.,ShulmanNS.,WangD.,KhatriA.,
AbunimehM.,PodsadeckiT.,LawitzE.
2016 Peer-reviewedpublication Singlearm(cohort),unclear 20 CKD5(all):70%;CKD4:30%
GFR:median10.9mL/min/1.73m2(range5.4,29.9);CrCl:median18.1mL/min(range8.9,63.1);SCr:median6.2mg/dL(range2.2,10.8)
median6.6(range5.5,7.6)log10IU/mL
1a:65%;1b:35% SVR12 nd
SVR4 nd
Death nd
DiscontinuationduetoAEs nd
Relapse(viral) nd
SeriousAEs treatment-emergentAEs
26872889 ToyodaH.,KumadaT.,TadaT.,TakaguchiK.,
IshikawaT.,TsujiK.,ZeniyaM.,IioE.,TanakaY.
2016 Peer-reviewedpublication Singlearm(cohort),prospective 28 CKDHD GFR:6.9(2.4)mL/min/1.73m2;SCr:7.16(1.90)mg/dL
5.89(0.91)log10IU/mL 1b:100% SVR12 nd
SVR nd
DiscontinuationduetoAEs nd
Relapse(viral) nd
27098678 MiyazakiR.,MiyagiK. 2016 Peer-reviewedpublication Caseseries/report 10 CKDHD nd 4.5(0.97)log10IU/mL nd SVR12 nd
DiscontinuationduetoAEs nd
26768604 SudaG.,KudoM.,NagasakaA.,FuruyaK.,
YamamotoY.,KobayashiT.,ShinadaK.,
TateyamaM.,KonnoJ.,TsukudaY.,YamasakiK.,
KimuraM.,UmemuraM.,IzumiT.,Tsunematsu
S.,SatoF.,TerashitaK.,NakaiM.,HorimotoH.,
ShoT.,NatsuizakaM.,MorikawaK.,OgawaK.,
SakamotoN.
2016 Peer-reviewedpublication Singlearm(cohort),prospective 34 CKDHD nd median5.7(range2.9,6.8)log10IU/mL
1a:4.8%;1b:90.5% SVR12 nd
Relapse(viral) nd
Hepatocellularcarcinoma(HCC) nd
SeriousAEs nd
27771774 Morisawa,N.andKoshima,Y.andSatoh,J.I.
andMaruyama,Y.andKuriyama,S.andYokoo,
T.andAmemiya,M.
2016 Peer-reviewedpublication Singlearm(cohort),retrospective 29 CKD3-5D eGFR:45.8(15.9)SCr:1.82(2.69)
6.0(3.7,6.7)log10IU/mL
1b:100% SVR12 nd
SVR24 nd
Discontinuation overalldiscontinuations
27602542 Nakamura,Y.andImamura,M.andKawakami,
Y.andTeraoka,Y.andDaijo,K.andHonda,F.
andMorio,K.andKobayashi,T.andNakahara,
T.andNagaoki,Y.andKawaoka,T.andTsuge,
M.andHiramatsu,A.andAikata,H.andHayes,
C.N.andMiki,D.andOchi,H.andChayama,K.
2017 Peer-reviewedpublication Singlearm(cohort),prospective 147 CKD1-5D eGFR:69(17,128)mL/min/1/73m2GFR>=50:85.7%GFR<50:14.3%SCr:0.70(0.39,2.33)
nd nd SVR timepointunclear
timepointunclear
DiscontinuationsduetoAEs nd
ASNTH-PO1143 SiseM.E.,G.L.Hundemer,G.Ortiz,E.Backman,
D.Chute,J.Brancale,R.I.Thadhani,R.T.Chung.
2016 Abstract Singlearm(cohort),prospective 107 CKD3-5D SCr:1.26(0.37)mg/dL nd nd SVR nd
AASLD909 BernsteinDE,etal 2016 Abstract Multiplepooledprospectivestudies 82 eGFR<60ml/min nd nd 1:100% Factorsassociatedwith>10ml/minincreaseineGFR Mutlivariateanalysis
1479 eGFR60-90ml/min nd nd 1:100%1172 eGFR>90ml/min nd nd 1:100%
AASLD950 MiyaseS,etal 2016 Abstract Singlearm(cohort),prospective 16 CKDHD nd nd 1b:100% SVR12 ndDiscontinueduetoAEs
AASLD1967 SudaG,etal 2016 Abstract Singlearm(cohort),prospective 29 CKDHD nd nd nd SVR12
DiscontinueduetoAEs nd
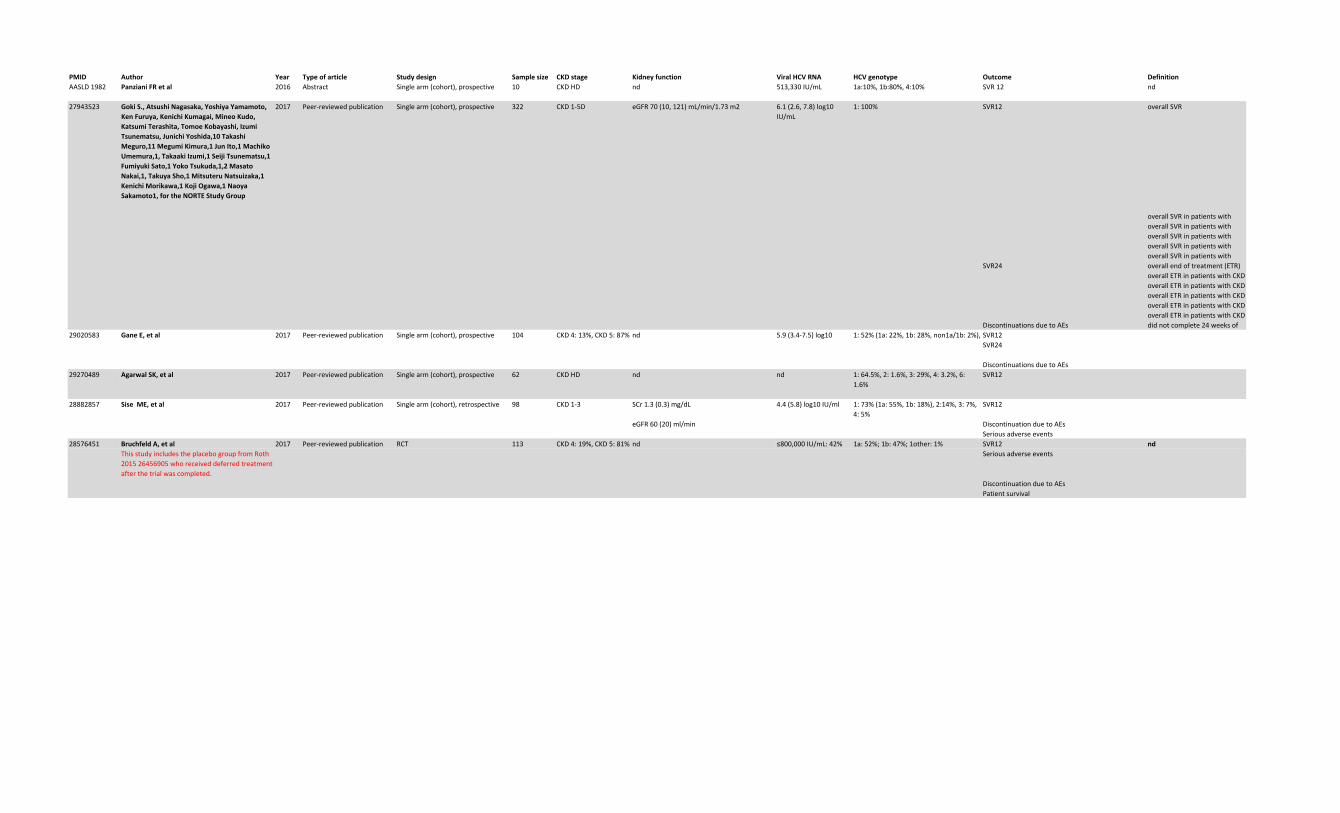
PMID Author Year Typeofarticle Studydesign Samplesize CKDstage Kidneyfunction ViralHCVRNA HCVgenotype Outcome Definition
AASLD1982 PanzianiFRetal 2016 Abstract Singlearm(cohort),prospective 10 CKDHD nd 513,330IU/mL 1a:10%,1b:80%,4:10% SVR12 nd
27943523 GokiS.,AtsushiNagasaka,YoshiyaYamamoto,
KenFuruya,KenichiKumagai,MineoKudo,
KatsumiTerashita,TomoeKobayashi,Izumi
Tsunematsu,JunichiYoshida,10Takashi
Meguro,11MegumiKimura,1JunIto,1Machiko
Umemura,1,TakaakiIzumi,1SeijiTsunematsu,1
FumiyukiSato,1YokoTsukuda,1,2Masato
Nakai,1,TakuyaSho,1MitsuteruNatsuizaka,1
KenichiMorikawa,1KojiOgawa,1Naoya
Sakamoto1,fortheNORTEStudyGroup
2017 Peer-reviewedpublication Singlearm(cohort),prospective 322 CKD1-5D eGFR70(10,121)mL/min/1.73m2 6.1(2.6,7.8)log10IU/mL
1:100% SVR12 overallSVR
overallSVRinpatientswithoverallSVRinpatientswithoverallSVRinpatientswithoverallSVRinpatientswithoverallSVRinpatientswith
SVR24 overallendoftreatment(ETR)overallETRinpatientswithCKDoverallETRinpatientswithCKDoverallETRinpatientswithCKDoverallETRinpatientswithCKDoverallETRinpatientswithCKD
DiscontinuationsduetoAEs didnotcomplete24weeksof29020583 GaneE,etal 2017 Peer-reviewedpublication Singlearm(cohort),prospective 104 CKD4:13%,CKD5:87%nd 5.9(3.4-7.5)log10 1:52%(1a:22%,1b:28%,non1a/1b:2%),SVR12
SVR24
DiscontinuationsduetoAEs29270489 AgarwalSK,etal 2017 Peer-reviewedpublication Singlearm(cohort),prospective 62 CKDHD nd nd 1:64.5%,2:1.6%,3:29%,4:3.2%,6:
1.6%SVR12
28882857 SiseME,etal 2017 Peer-reviewedpublication Singlearm(cohort),retrospective 98 CKD1-3 SCr1.3(0.3)mg/dL 4.4(5.8)log10IU/ml 1:73%(1a:55%,1b:18%),2:14%,3:7%,4:5%
SVR12
eGFR60(20)ml/min DiscontinuationduetoAEsSeriousadverseevents
28576451 BruchfeldA,etal 2017 Peer-reviewedpublication RCT 113 CKD4:19%,CKD5:81%nd ≤800,000IU/mL:42% 1a:52%;1b:47%;1other:1% SVR12 nd
ThisstudyincludestheplacebogroupfromRoth201526456905whoreceiveddeferredtreatmentafterthetrialwascompleted.
Seriousadverseevents
DiscontinuationduetoAEsPatientsurvival
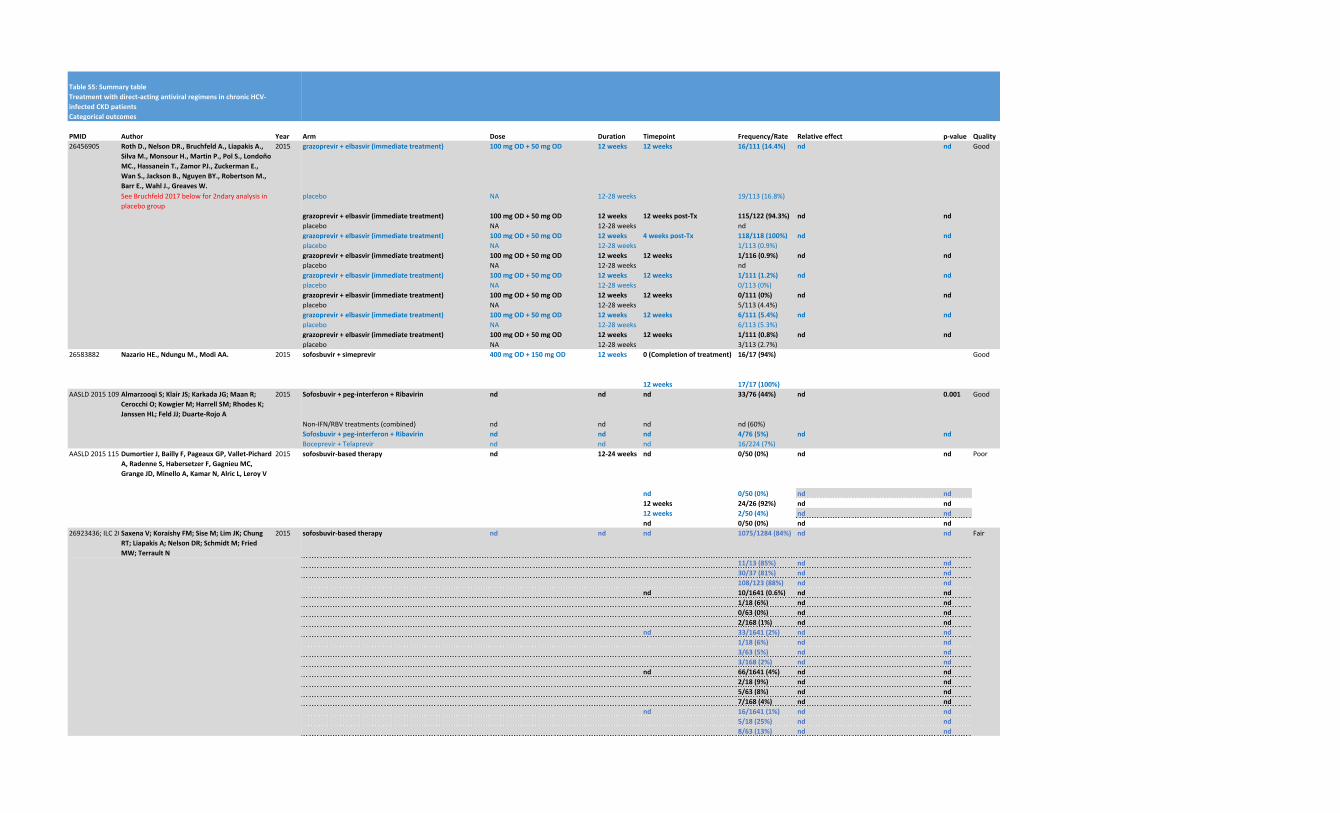
TableS5:Summarytable
Categoricaloutcomes
PMID Author Year
26456905 RothD.,NelsonDR.,BruchfeldA.,LiapakisA.,
SilvaM.,MonsourH.,MartinP.,PolS.,Londoño
MC.,HassaneinT.,ZamorPJ.,ZuckermanE.,
WanS.,JacksonB.,NguyenBY.,RobertsonM.,
BarrE.,WahlJ.,GreavesW.
2015
SeeBruchfeld2017belowfor2ndaryanalysisinplacebogroup
26583882 NazarioHE.,NdunguM.,ModiAA. 2015
AASLD20151099AlmarzooqiS;KlairJS;KarkadaJG;MaanR;
CerocchiO;KowgierM;HarrellSM;RhodesK;
JanssenHL;FeldJJ;Duarte-RojoA
2015
AASLD20151158DumortierJ,BaillyF,PageauxGP,Vallet-Pichard
A,RadenneS,HabersetzerF,GagnieuMC,
GrangeJD,MinelloA,KamarN,AlricL,LeroyV
2015
26923436;ILC2015LP08SaxenaV;KoraishyFM;SiseM;LimJK;Chung
RT;LiapakisA;NelsonDR;SchmidtM;Fried
MW;TerraultN
2015
Treatmentwithdirect-actingantiviralregimensinchronicHCV-
infectedCKDpatients
Arm Dose Duration Timepoint Frequency/Rate Relativeeffect p-value Quality
grazoprevir+elbasvir(immediatetreatment) 100mgOD+50mgOD 12weeks 12weeks 16/111(14.4%) nd nd Good
placebo NA 12-28weeks 19/113(16.8%)
grazoprevir+elbasvir(immediatetreatment) 100mgOD+50mgOD 12weeks 12weekspost-Tx 115/122(94.3%) nd nd
placebo NA 12-28weeks ndgrazoprevir+elbasvir(immediatetreatment) 100mgOD+50mgOD 12weeks 4weekspost-Tx 118/118(100%) nd nd
placebo NA 12-28weeks 1/113(0.9%)grazoprevir+elbasvir(immediatetreatment) 100mgOD+50mgOD 12weeks 12weeks 1/116(0.9%) nd nd
placebo NA 12-28weeks ndgrazoprevir+elbasvir(immediatetreatment) 100mgOD+50mgOD 12weeks 12weeks 1/111(1.2%) nd nd
placebo NA 12-28weeks 0/113(0%)grazoprevir+elbasvir(immediatetreatment) 100mgOD+50mgOD 12weeks 12weeks 0/111(0%) nd nd
placebo NA 12-28weeks 5/113(4.4%)grazoprevir+elbasvir(immediatetreatment) 100mgOD+50mgOD 12weeks 12weeks 6/111(5.4%) nd nd
placebo NA 12-28weeks 6/113(5.3%)grazoprevir+elbasvir(immediatetreatment) 100mgOD+50mgOD 12weeks 12weeks 1/111(0.8%) nd nd
placebo NA 12-28weeks 3/113(2.7%)sofosbuvir+simeprevir 400mgOD+150mgOD 12weeks 0(Completionoftreatment) 16/17(94%) Good
12weeks 17/17(100%)
Sofosbuvir+peg-interferon+Ribavirin nd nd nd 33/76(44%) nd 0.001 Good
Non-IFN/RBVtreatments(combined) nd nd nd nd(60%)Sofosbuvir+peg-interferon+Ribavirin nd nd nd 4/76(5%) nd nd
Boceprevir+Telaprevir nd nd nd 16/224(7%)sofosbuvir-basedtherapy nd 12-24weeks nd 0/50(0%) nd nd Poor
nd 0/50(0%) nd nd
12weeks 24/26(92%) nd nd
12weeks 2/50(4%) nd nd
nd 0/50(0%) nd nd
sofosbuvir-basedtherapy nd nd nd 1075/1284(84%) nd nd Fair
11/13(85%) nd nd
30/37(81%) nd nd
108/123(88%) nd nd
nd 10/1641(0.6%) nd nd
1/18(6%) nd nd
0/63(0%) nd nd
2/168(1%) nd nd
nd 33/1641(2%) nd nd
1/18(6%) nd nd
3/63(5%) nd nd
3/168(2%) nd nd
nd 66/1641(4%) nd nd
2/18(9%) nd nd
5/63(8%) nd nd
7/168(4%) nd nd
nd 16/1641(1%) nd nd
5/18(25%) nd nd
8/63(13%) nd nd
PMID Author Year
ILC2015P0802 NazarioHE,NdunguM,ModiA 2015
ILC2015P0878,AASLD20152256CzulF;SchiffE;PeytonA;LevyC;HernandezM;
JeffersL;O'BrienC;MartinP;BhamidimarriKR
2015
26976799 PockrosPJ.,ReddyKR.,MantryPS.,CohenE.,
BennettM.,SulkowskiMS.,BernsteinDE.,
CohenDE.,ShulmanNS.,WangD.,KhatriA.,
AbunimehM.,PodsadeckiT.,LawitzE.
2016
26872889 ToyodaH.,KumadaT.,TadaT.,TakaguchiK.,
IshikawaT.,TsujiK.,ZeniyaM.,IioE.,TanakaY.
2016
27098678 MiyazakiR.,MiyagiK. 2016
26768604 SudaG.,KudoM.,NagasakaA.,FuruyaK.,
YamamotoY.,KobayashiT.,ShinadaK.,
TateyamaM.,KonnoJ.,TsukudaY.,YamasakiK.,
KimuraM.,UmemuraM.,IzumiT.,Tsunematsu
S.,SatoF.,TerashitaK.,NakaiM.,HorimotoH.,
ShoT.,NatsuizakaM.,MorikawaK.,OgawaK.,
SakamotoN.
2016
27771774 Morisawa,N.andKoshima,Y.andSatoh,J.I.
andMaruyama,Y.andKuriyama,S.andYokoo,
T.andAmemiya,M.
2016
27602542 Nakamura,Y.andImamura,M.andKawakami,
Y.andTeraoka,Y.andDaijo,K.andHonda,F.
andMorio,K.andKobayashi,T.andNakahara,
T.andNagaoki,Y.andKawaoka,T.andTsuge,
M.andHiramatsu,A.andAikata,H.andHayes,
C.N.andMiki,D.andOchi,H.andChayama,K.
2017
ASNTH-PO1143 SiseM.E.,G.L.Hundemer,G.Ortiz,E.Backman,
D.Chute,J.Brancale,R.I.Thadhani,R.T.Chung.
2016
AASLD909 BernsteinDE,etal 2016
AASLD950 MiyaseS,etal 2016
AASLD1967 SudaG,etal 2016
Arm Dose Duration Timepoint Frequency/Rate Relativeeffect p-value Quality
3/168(2%) nd nd
nd 82/1641(5%) nd nd
5/18(25%) nd nd
8/63(13%) nd nd
13/168(8%) nd nd
sofosbuvir+simeprevir 400mgOD+150mgOD 12weeks nd 0/12(0%) nd nd Poor
nd 1/12 nd nd
12weeks 5/5(100%) nd nd
sofosbuvir+simeprevir 150mgOD+200mgOD 12weeks 12weeks 19/21(90%) nd nd Good
12weeks 1/21(5%) nd nd
12weeks 1/21(5%) nd nd
ombitasvir+paritaprevir+ritonavir+dasabuvir±ribavirin 25mgOD+150mgOD+100mg
OD+250mgBID+200mgOD
12weeks 12weeks 18/20(90%) nd nd Fair
4weeks 18/20(90%) nd nd
12weeks 1/20(5%) nd nd
12weeks 0/20(0%) nd nd
12weeks 1/20(5%) nd nd
30days 4/20(20%) nd nd
daclatasvir+asunaprevir 60mgOD+100mgBID 24weeks 12weeks 28/28(100%) nd nd Fair
2weeks 14/28(50%) nd nd
4weeks 25/28(89.3%) nd nd
8weeks 28/28(100%) nd nd
0weekspost-treatment 1/28(3.6%) nd nd
12weeks 0/28(0%) nd nd
daclatasvir+asunaprevir 60mgOD+100mgBID 24weeks 12weeks 10/10(100%) nd nd Poor
12weeks 0/10(0%) nd nd
daclatavir+asunaprevir 100mgPOBID+60mgPOBID 24weeks 12weeks 20/21(95%) nd nd Poor
12weeks 1/21(5%) nd nd
24weeks 1/21(5%) nd nd
24weeks 1/21(5%) nd nd
daclatasvir+asunaprevir nd nd 12weeks 27/29(93.1%) nd nd Fair
24weeks 27/29(93.1%) nd nd
48weeks 3/29(10.3%) nd nd
daclatasvir+asunaprevir(GFR>=50) 60mgOD+200mgBID 24weeks nd 119*126(94.4%) nd nd Fair
daclatasvir+asunaprevir(GFR<50) 20/21(95.2%) nd nd
dacaltasvir+asunaprevir 60mgOD+200mgBID 24weeks 24weeks 2/147(1.3%) nd nd
sofosbuvir+simeprevir(42%)
sofosbuvir+ledipasvir(24%)
sofosbuvir+ribavirin(34%)
nd nd 12weeks 81% nd nd Poor
ombitasvir+paritaprevir+ritonavir+dasabuvir±ribavirin 25mgOD+150mgOD+100mg nd nd BaselineproteinuriaOR1.647(1.320-2.054) <0.001 PoorBaselinediabetesOR1.512(1.059-2.161) 0.023BaselineBMIOR0.948(0.926-0.971( <0.001AfricanAmericanraceOR0.596(0.384-0.923) 0.021
daclatasvir+asunaprevir nd nd 12weeks 100% nd nd Poor6% nd nd
daclatasvir+asunaprevir nd nd 12weeks 97% nd nd Poor
7% nd nd
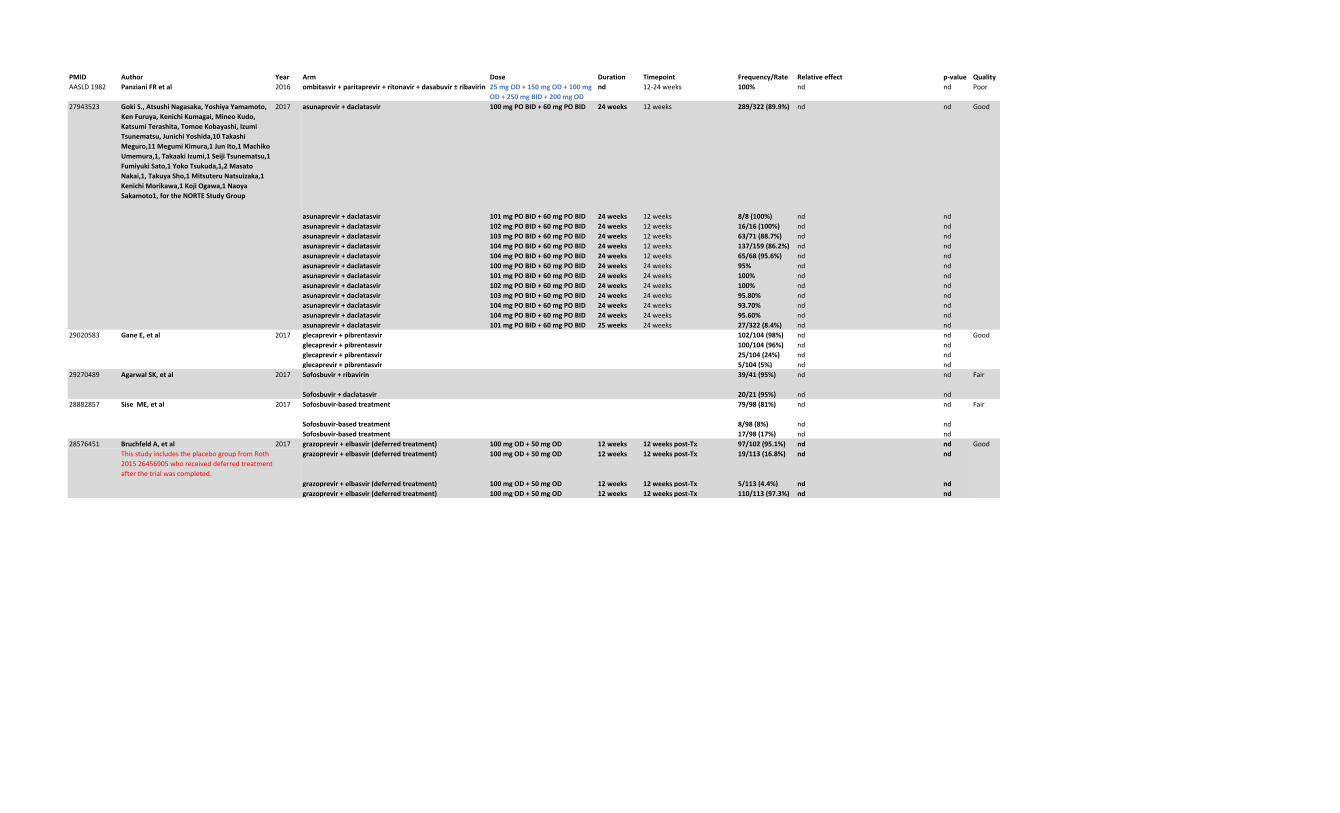
PMID Author Year
AASLD1982 PanzianiFRetal 2016
27943523 GokiS.,AtsushiNagasaka,YoshiyaYamamoto,
KenFuruya,KenichiKumagai,MineoKudo,
KatsumiTerashita,TomoeKobayashi,Izumi
Tsunematsu,JunichiYoshida,10Takashi
Meguro,11MegumiKimura,1JunIto,1Machiko
Umemura,1,TakaakiIzumi,1SeijiTsunematsu,1
FumiyukiSato,1YokoTsukuda,1,2Masato
Nakai,1,TakuyaSho,1MitsuteruNatsuizaka,1
KenichiMorikawa,1KojiOgawa,1Naoya
Sakamoto1,fortheNORTEStudyGroup
2017
29020583 GaneE,etal 2017
29270489 AgarwalSK,etal 2017
28882857 SiseME,etal 2017
28576451 BruchfeldA,etal 2017ThisstudyincludestheplacebogroupfromRoth201526456905whoreceiveddeferredtreatmentafterthetrialwascompleted.
Arm Dose Duration Timepoint Frequency/Rate Relativeeffect p-value Quality
ombitasvir+paritaprevir+ritonavir+dasabuvir±ribavirin 25mgOD+150mgOD+100mg
OD+250mgBID+200mgOD
nd 12-24weeks 100% nd nd Poor
asunaprevir+daclatasvir 100mgPOBID+60mgPOBID 24weeks 12weeks 289/322(89.9%) nd nd Good
asunaprevir+daclatasvir 101mgPOBID+60mgPOBID 24weeks 12weeks 8/8(100%) nd ndasunaprevir+daclatasvir 102mgPOBID+60mgPOBID 24weeks 12weeks 16/16(100%) nd ndasunaprevir+daclatasvir 103mgPOBID+60mgPOBID 24weeks 12weeks 63/71(88.7%) nd ndasunaprevir+daclatasvir 104mgPOBID+60mgPOBID 24weeks 12weeks 137/159(86.2%) nd ndasunaprevir+daclatasvir 104mgPOBID+60mgPOBID 24weeks 12weeks 65/68(95.6%) nd ndasunaprevir+daclatasvir 100mgPOBID+60mgPOBID 24weeks 24weeks 95% nd ndasunaprevir+daclatasvir 101mgPOBID+60mgPOBID 24weeks 24weeks 100% nd ndasunaprevir+daclatasvir 102mgPOBID+60mgPOBID 24weeks 24weeks 100% nd ndasunaprevir+daclatasvir 103mgPOBID+60mgPOBID 24weeks 24weeks 95.80% nd ndasunaprevir+daclatasvir 104mgPOBID+60mgPOBID 24weeks 24weeks 93.70% nd ndasunaprevir+daclatasvir 104mgPOBID+60mgPOBID 24weeks 24weeks 95.60% nd ndasunaprevir+daclatasvir 101mgPOBID+60mgPOBID 25weeks 24weeks 27/322(8.4%) nd ndglecaprevir+pibrentasvir 102/104(98%) nd nd Goodglecaprevir+pibrentasvir 100/104(96%) nd ndglecaprevir+pibrentasvir 25/104(24%) nd ndglecaprevir+pibrentasvir 5/104(5%) nd ndSofosbuvir+ribavirin 39/41(95%) nd nd Fair
Sofosbuvir+daclatasvir 20/21(95%) nd ndSofosbuvir-basedtreatment 79/98(81%) nd nd Fair
Sofosbuvir-basedtreatment 8/98(8%) nd ndSofosbuvir-basedtreatment 17/98(17%) nd ndgrazoprevir+elbasvir(deferredtreatment) 100mgOD+50mgOD 12weeks 12weekspost-Tx 97/102(95.1%) nd nd Goodgrazoprevir+elbasvir(deferredtreatment) 100mgOD+50mgOD 12weeks 12weekspost-Tx 19/113(16.8%) nd nd
grazoprevir+elbasvir(deferredtreatment) 100mgOD+50mgOD 12weeks 12weekspost-Tx 5/113(4.4%) nd nd
grazoprevir+elbasvir(deferredtreatment) 100mgOD+50mgOD 12weeks 12weekspost-Tx 110/113(97.3%) nd nd
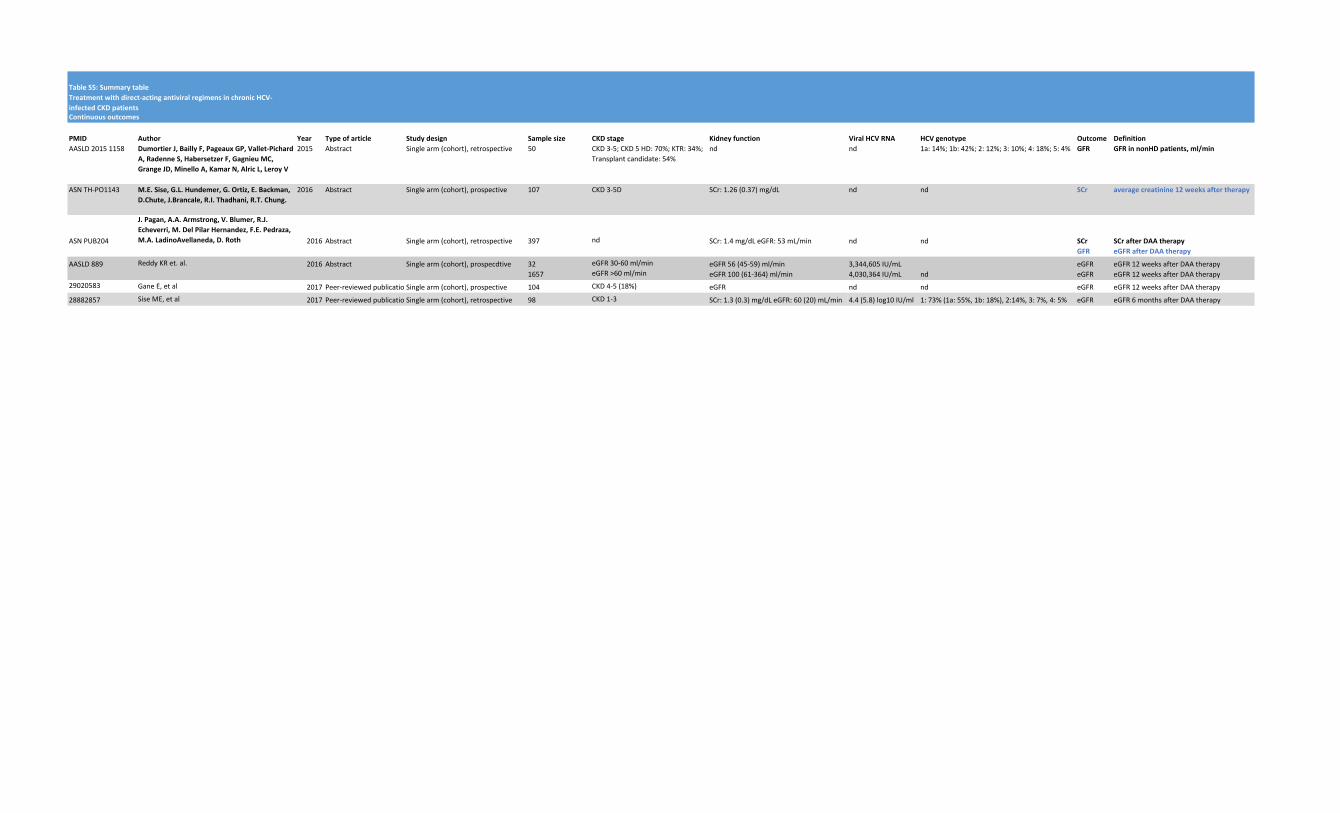
TableS5:Summarytable
Continuousoutcomes
PMID Author Year Typeofarticle Studydesign Samplesize CKDstage Kidneyfunction ViralHCVRNA HCVgenotype Outcome Definition
AASLD20151158 DumortierJ,BaillyF,PageauxGP,Vallet-Pichard
A,RadenneS,HabersetzerF,GagnieuMC,
GrangeJD,MinelloA,KamarN,AlricL,LeroyV
2015 Abstract Singlearm(cohort),retrospective 50 CKD3-5;CKD5HD:70%;KTR:34%;
Transplantcandidate:54%
nd nd 1a:14%;1b:42%;2:12%;3:10%;4:18%;5:4% GFR GFRinnonHDpatients,ml/min
ASNTH-PO1143 M.E.Sise,G.L.Hundemer,G.Ortiz,E.Backman,
D.Chute,J.Brancale,R.I.Thadhani,R.T.Chung.
2016 Abstract Singlearm(cohort),prospective 107 CKD3-5D SCr:1.26(0.37)mg/dL nd nd SCr averagecreatinine12weeksaftertherapy
ASNPUB204
J.Pagan,A.A.Armstrong,V.Blumer,R.J.
Echeverri,M.DelPilarHernandez,F.E.Pedraza,
M.A.LadinoAvellaneda,D.Roth 2016 Abstract Singlearm(cohort),retrospective 397 nd SCr:1.4mg/dLeGFR:53mL/min nd nd SCr SCrafterDAAtherapy
GFR eGFRafterDAAtherapy
AASLD889 ReddyKRet.al. 2016 Abstract Singlearm(cohort),prospecdtive 32 eGFR30-60ml/min eGFR56(45-59)ml/min 3,344,605IU/mL eGFR eGFR12weeksafterDAAtherapy
1657 eGFR>60ml/min eGFR100(61-364)ml/min 4,030,364IU/mL nd eGFR eGFR12weeksafterDAAtherapy
29020583 GaneE,etal 2017 Peer-reviewedpublicationSinglearm(cohort),prospective 104 CKD4-5(18%) eGFR nd nd eGFR eGFR12weeksafterDAAtherapy
28882857 SiseME,etal 2017 Peer-reviewedpublicationSinglearm(cohort),retrospective 98 CKD1-3 SCr:1.3(0.3)mg/dLeGFR:60(20)mL/min 4.4(5.8)log10IU/ml 1:73%(1a:55%,1b:18%),2:14%,3:7%,4:5% eGFR eGFR6monthsafterDAAtherapy
Treatmentwithdirect-actingantiviralregimensinchronicHCV-
infectedCKDpatients
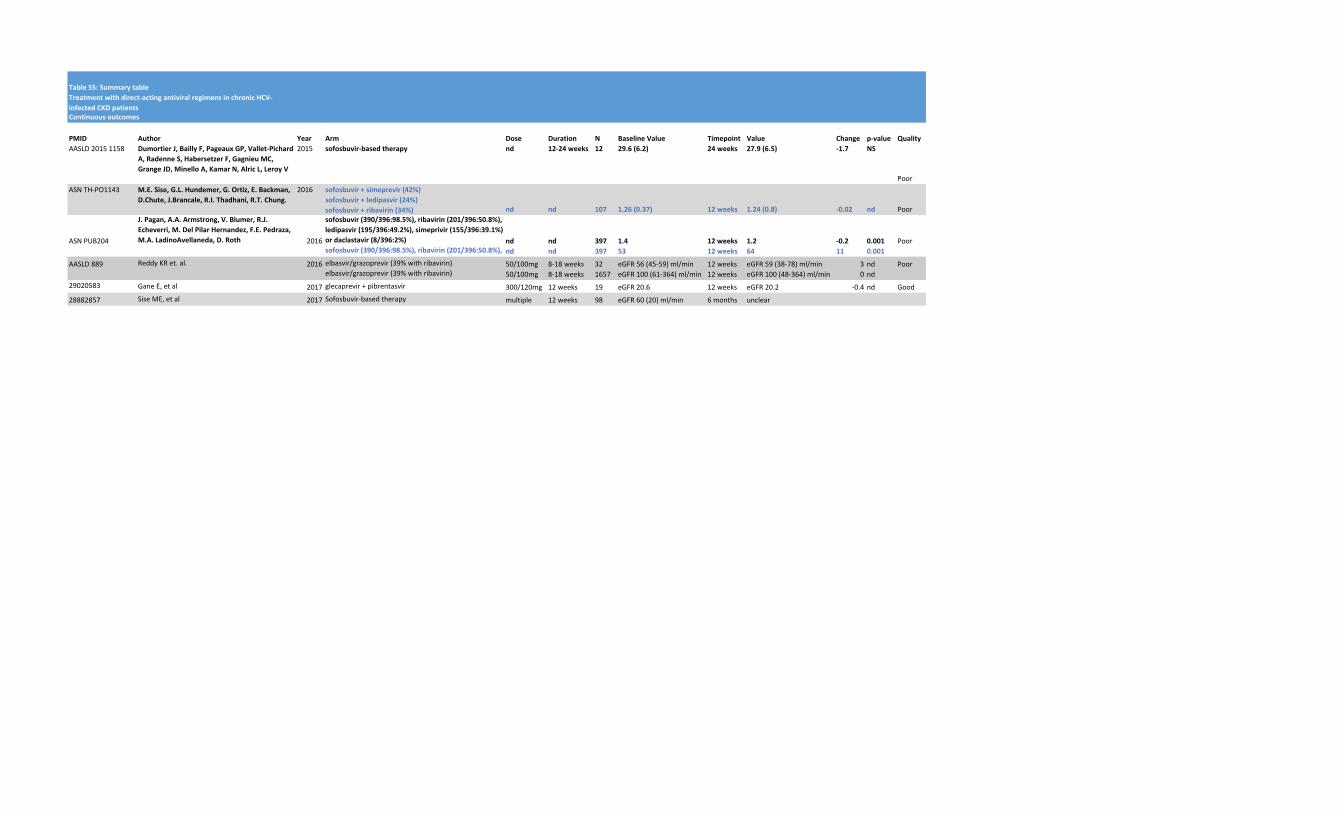
TableS5:Summarytable
Continuousoutcomes
PMID Author Year
AASLD20151158 DumortierJ,BaillyF,PageauxGP,Vallet-Pichard
A,RadenneS,HabersetzerF,GagnieuMC,
GrangeJD,MinelloA,KamarN,AlricL,LeroyV
2015
ASNTH-PO1143 M.E.Sise,G.L.Hundemer,G.Ortiz,E.Backman,
D.Chute,J.Brancale,R.I.Thadhani,R.T.Chung.
2016
ASNPUB204
J.Pagan,A.A.Armstrong,V.Blumer,R.J.
Echeverri,M.DelPilarHernandez,F.E.Pedraza,
M.A.LadinoAvellaneda,D.Roth 2016
AASLD889 ReddyKRet.al. 2016
29020583 GaneE,etal 2017
28882857 SiseME,etal 2017
Treatmentwithdirect-actingantiviralregimensinchronicHCV-
infectedCKDpatients
Arm Dose Duration N BaselineValue Timepoint Value Change p-value Quality
sofosbuvir-basedtherapy nd 12-24weeks 12 29.6(6.2) 24weeks 27.9(6.5) -1.7 NS
Poor
sofosbuvir+simeprevir(42%)
sofosbuvir+ledipasvir(24%)
sofosbuvir+ribavirin(34%) nd nd 107 1.26(0.37) 12weeks 1.24(0.8) -0.02 nd Poor
sofosbuvir(390/396:98.5%),ribavirin(201/396:50.8%),
ledipasvir(195/396:49.2%),simeprivir(155/396:39.1%)
ordaclastavir(8/396:2%) nd nd 397 1.4 12weeks 1.2 -0.2 0.001 Poor
sofosbuvir(390/396:98.5%),ribavirin(201/396:50.8%), nd nd 397 53 12weeks 64 11 0.001
elbasvir/grazoprevir(39%withribavirin) 50/100mg 8-18weeks 32 eGFR56(45-59)ml/min 12weeks eGFR59(38-78)ml/min 3 nd Poor
elbasvir/grazoprevir(39%withribavirin) 50/100mg 8-18weeks 1657 eGFR100(61-364)ml/min 12weeks eGFR100(48-364)ml/min 0 nd
glecaprevir+pibrentasvir 300/120mg 12weeks 19 eGFR20.6 12weeks eGFR20.2 -0.4 nd Good
Sofosbuvir-basedtherapy multiple 12weeks 98 eGFR60(20)ml/min 6months unclear
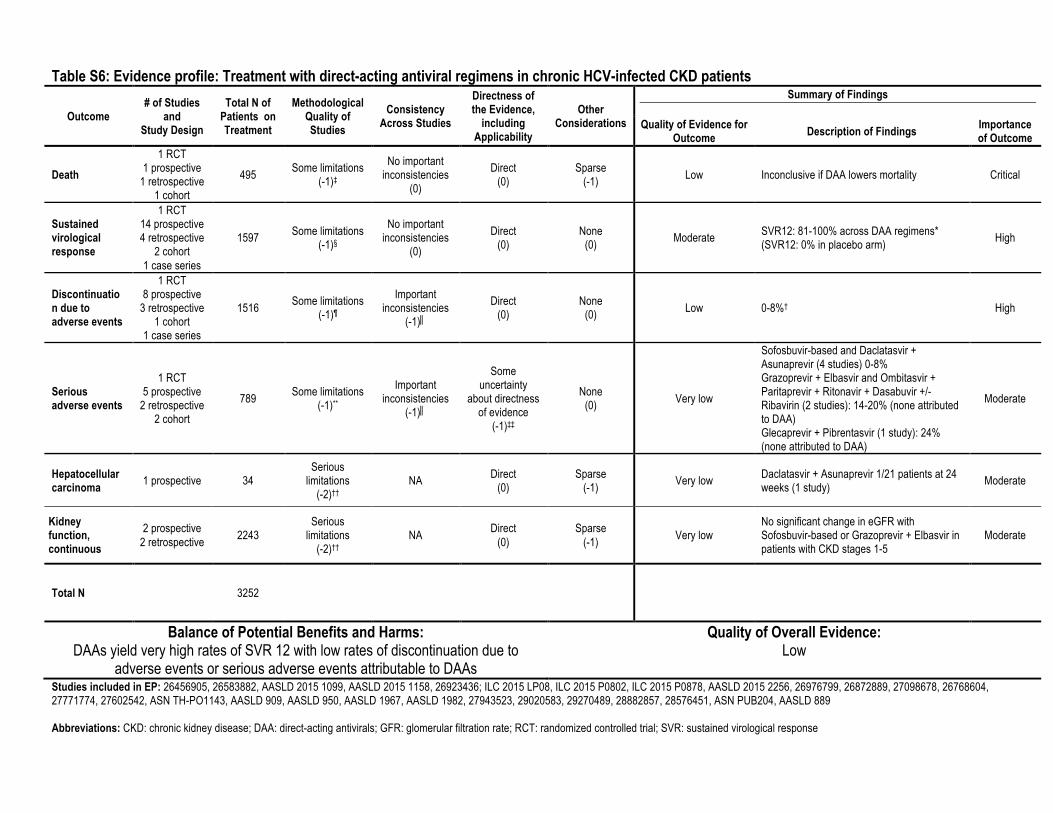
Table S6: Evidence profile: Treatment with direct-acting antiviral regimens in chronic HCV-infected CKD patients
Outcome # of Studies
and Study Design
Total N of Patients on Treatment
Methodological Quality of Studies
Consistency Across Studies
Directness of the Evidence,
including Applicability
Other Considerations
Summary of Findings
Quality of Evidence for Outcome Description of Findings Importance
of Outcome
Death
1 RCT 1 prospective
1 retrospective 1 cohort
495 Some limitations (-1)‡
No important inconsistencies
(0)
Direct (0)
Sparse (-1) Low Inconclusive if DAA lowers mortality Critical
Sustained virological response
1 RCT 14 prospective 4 retrospective
2 cohort 1 case series
1597 Some limitations (-1)§
No important inconsistencies
(0) Direct
(0) None
(0) Moderate SVR12: 81-100% across DAA regimens* (SVR12: 0% in placebo arm) High
Discontinuation due to adverse events
1 RCT 8 prospective
3 retrospective 1 cohort
1 case series
1516 Some limitations (-1)¶
Important inconsistencies
(-1)║
Direct (0)
None (0) Low 0-8%† High
Serious adverse events
1 RCT 5 prospective
2 retrospective 2 cohort
789 Some limitations (-1)**
Important inconsistencies
(-1)║
Some uncertainty
about directness of evidence
(-1)‡‡
None (0) Very low
Sofosbuvir-based and Daclatasvir + Asunaprevir (4 studies) 0-8% Grazoprevir + Elbasvir and Ombitasvir + Paritaprevir + Ritonavir + Dasabuvir +/- Ribavirin (2 studies): 14-20% (none attributed to DAA) Glecaprevir + Pibrentasvir (1 study): 24% (none attributed to DAA)
Moderate
Hepatocellular carcinoma 1 prospective 34
Serious limitations
(-2)†† NA Direct
(0) Sparse
(-1) Very low Daclatasvir + Asunaprevir 1/21 patients at 24 weeks (1 study) Moderate
Kidney function, continuous
2 prospective 2 retrospective 2243
Serious limitations
(-2)†† NA Direct
(0) Sparse
(-1) Very low No significant change in eGFR with Sofosbuvir-based or Grazoprevir + Elbasvir in patients with CKD stages 1-5
Moderate
Total N 3252
Balance of Potential Benefits and Harms: DAAs yield very high rates of SVR 12 with low rates of discontinuation due to
adverse events or serious adverse events attributable to DAAs
Quality of Overall Evidence: Low
Studies included in EP: 26456905, 26583882, AASLD 2015 1099, AASLD 2015 1158, 26923436; ILC 2015 LP08, ILC 2015 P0802, ILC 2015 P0878, AASLD 2015 2256, 26976799, 26872889, 27098678, 26768604, 27771774, 27602542, ASN TH-PO1143, AASLD 909, AASLD 950, AASLD 1967, AASLD 1982, 27943523, 29020583, 29270489, 28882857, 28576451, ASN PUB204, AASLD 889 Abbreviations: CKD: chronic kidney disease; DAA: direct-acting antivirals; GFR: glomerular filtration rate; RCT: randomized controlled trial; SVR: sustained virological response
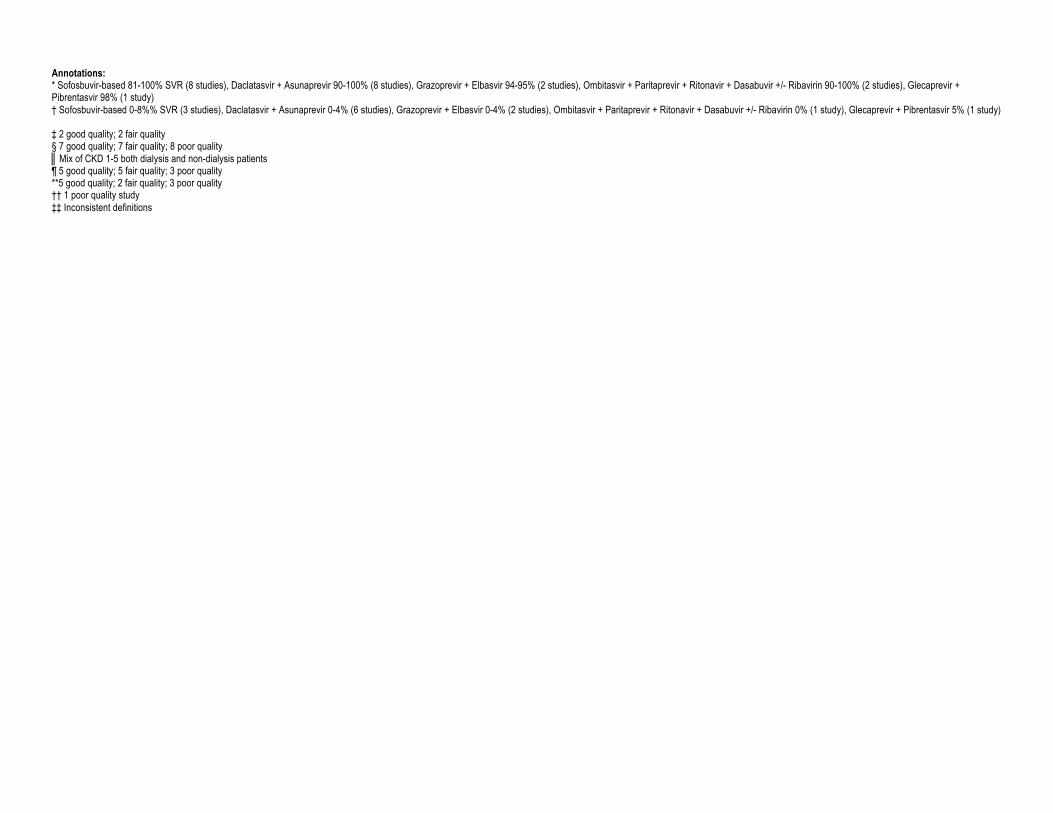
Annotations: * Sofosbuvir-based 81-100% SVR (8 studies), Daclatasvir + Asunaprevir 90-100% (8 studies), Grazoprevir + Elbasvir 94-95% (2 studies), Ombitasvir + Paritaprevir + Ritonavir + Dasabuvir +/- Ribavirin 90-100% (2 studies), Glecaprevir + Pibrentasvir 98% (1 study) † Sofosbuvir-based 0-8%% SVR (3 studies), Daclatasvir + Asunaprevir 0-4% (6 studies), Grazoprevir + Elbasvir 0-4% (2 studies), Ombitasvir + Paritaprevir + Ritonavir + Dasabuvir +/- Ribavirin 0% (1 study), Glecaprevir + Pibrentasvir 5% (1 study) ‡ 2 good quality; 2 fair quality § 7 good quality; 7 fair quality; 8 poor quality ║Mix of CKD 1-5 both dialysis and non-dialysis patients ¶ 5 good quality; 5 fair quality; 3 poor quality **5 good quality; 2 fair quality; 3 poor quality †† 1 poor quality study ‡‡ Inconsistent definitions
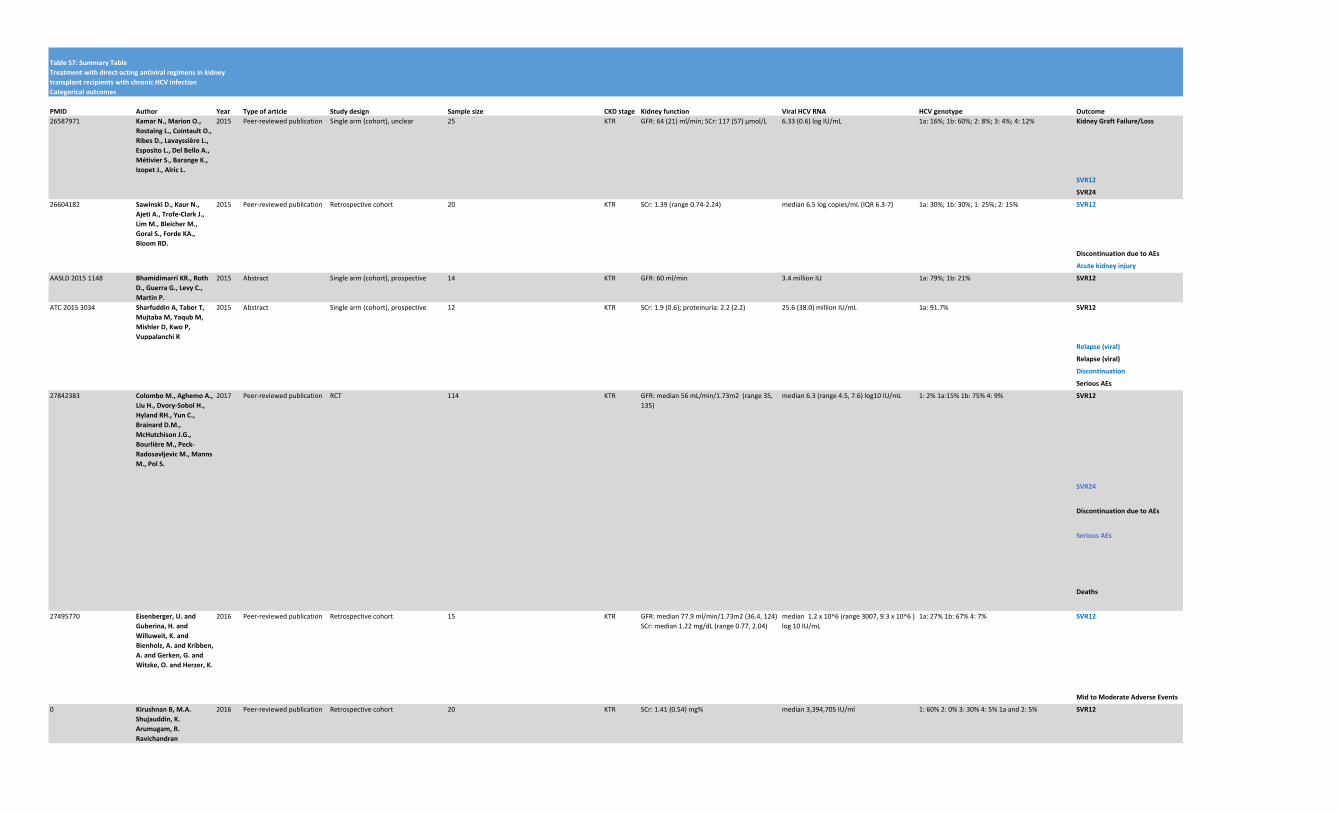
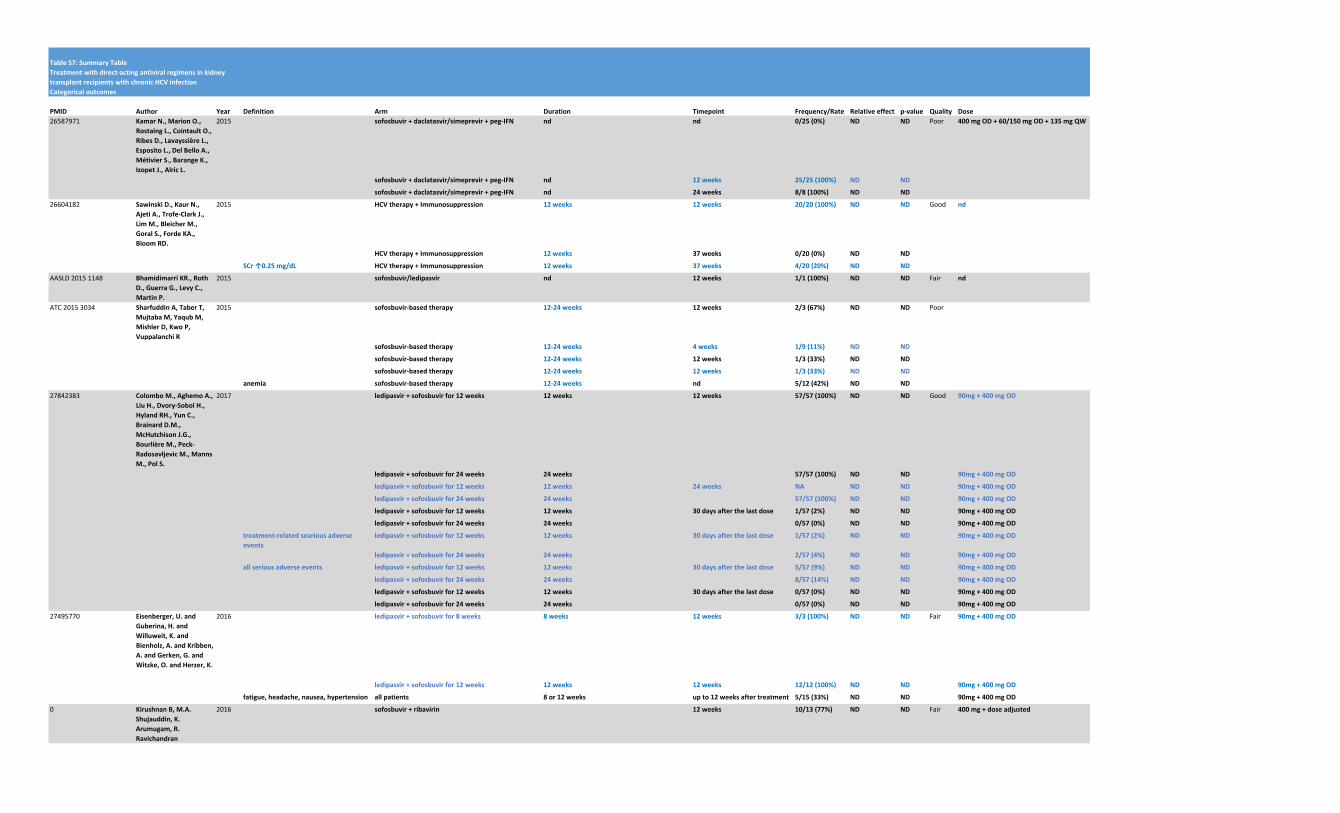
TableS7:SummaryTable
Categoricaloutcomes
PMID Author Year Typeofarticle Studydesign Samplesize CKDstage Kidneyfunction ViralHCVRNA HCVgenotype Outcome
26587971 KamarN.,MarionO.,
RostaingL.,CointaultO.,
RibesD.,LavayssièreL.,
EspositoL.,DelBelloA.,
MétivierS.,BarangeK.,
IzopetJ.,AlricL.
2015 Peer-reviewedpublication Singlearm(cohort),unclear 25 KTR GFR:64(21)ml/min;SCr:117(57)µmol/L 6.33(0.6)logIU/mL 1a:16%;1b:60%;2:8%;3:4%;4:12% KidneyGraftFailure/Loss
SVR12
SVR24
26604182 SawinskiD.,KaurN.,
AjetiA.,Trofe-ClarkJ.,
LimM.,BleicherM.,
GoralS.,FordeKA.,
BloomRD.
2015 Peer-reviewedpublication Retrospectivecohort 20 KTR SCr:1.39(range0.74-2.24) median6.5logcopies/mL(IQR6.3-7) 1a:30%;1b:30%;1:25%;2:15% SVR12
DiscontinuationduetoAEs
Acutekidneyinjury
AASLD20151148 BhamidimarriKR.,Roth
D.,GuerraG.,LevyC.,
MartinP.
2015 Abstract Singlearm(cohort),prospective 14 KTR GFR:60ml/min 3.4millionIU 1a:79%;1b:21% SVR12
ATC20153034 SharfuddinA,TaberT,
MujtabaM,YaqubM,
MishlerD,KwoP,
VuppalanchiR
2015 Abstract Singlearm(cohort),prospective 12 KTR SCr:1.9(0.6);proteinuria:2.2(2.2) 25.6(38.0)millionIU/mL 1a:91.7% SVR12
Relapse(viral)
Relapse(viral)
Discontinuation
SeriousAEs
27842383 ColomboM.,AghemoA.,
LiuH.,Dvory-SobolH.,
HylandRH.,YunC.,
BrainardD.M.,
McHutchisonJ.G.,
BourlièreM.,Peck-
RadosavljevicM.,Manns
M.,PolS.
2017 Peer-reviewedpublication RCT 114 KTR GFR:median56mL/min/1.73m2(range35,135)
median6.3(range4.5,7.6)log10IU/mL 1:2%1a:15%1b:75%4:9% SVR12
SVR24
DiscontinuationduetoAEs
SeriousAEs
Deaths
27495770 Eisenberger,U.and
Guberina,H.and
Willuweit,K.and
Bienholz,A.andKribben,
A.andGerken,G.and
Witzke,O.andHerzer,K.
2016 Peer-reviewedpublication Retrospectivecohort 15 KTR GFR:median77.9ml/min/1.73m2(36.4,124)SCr:median1.22mg/dL(range0.77,2.04)
median1.2x10^6(range3007,9.3x10^6)log10IU/mL
1a:27%1b:67%4:7% SVR12
MidtoModerateAdverseEvents
0 KirushnanB,M.A.
Shujauddin,K.
Arumugam,R.
Ravichandran
2016 Peer-reviewedpublication Retrospectivecohort 20 KTR SCr:1.41(0.54)mg% median3,394,705IU/ml 1:60%2:0%3:30%4:5%1aand2:5% SVR12
Treatmentwithdirect-actingantiviralregimensinkidney
transplantrecipientswithchronicHCVinfection
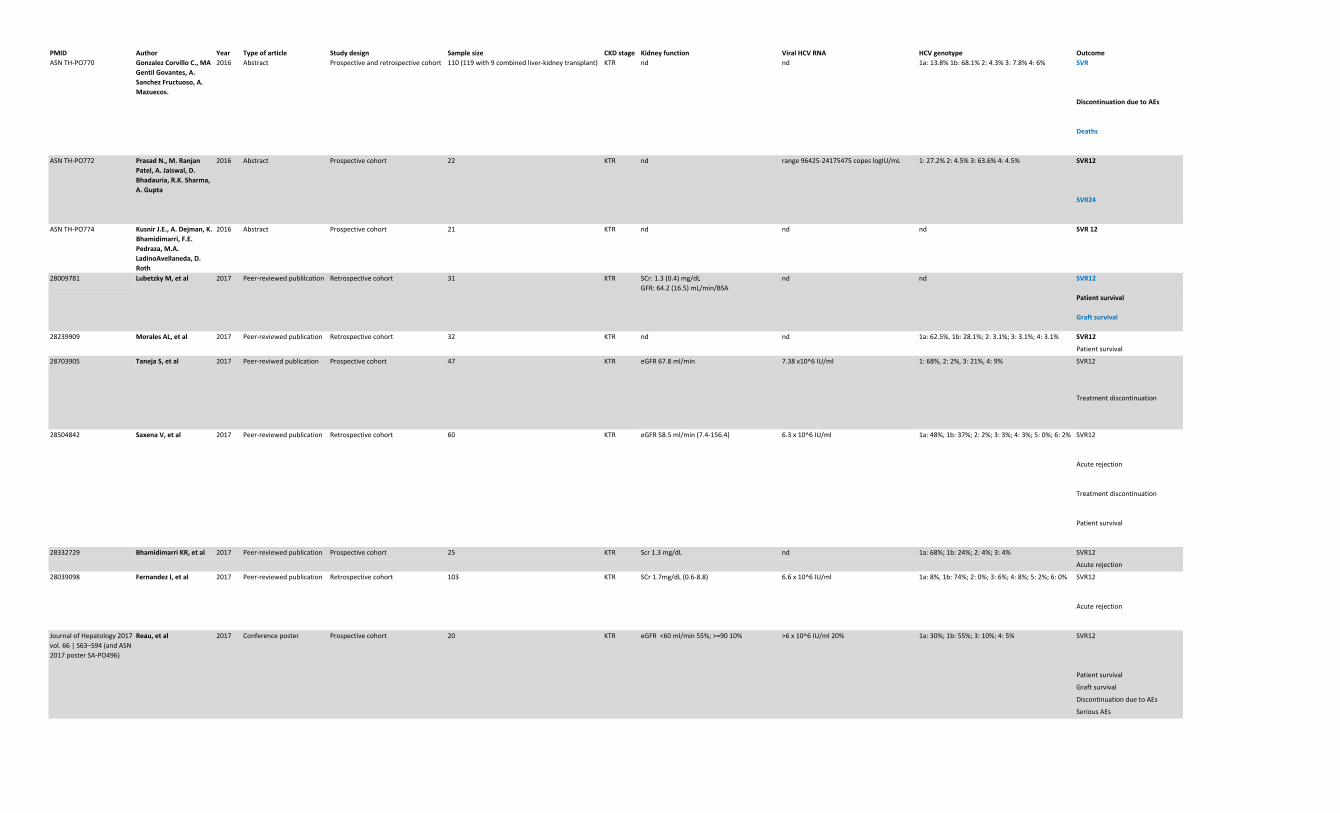
PMID Author Year Typeofarticle Studydesign Samplesize CKDstage Kidneyfunction ViralHCVRNA HCVgenotype Outcome
ASNTH-PO770 GonzalezCorvilloC.,MA
GentilGovantes,A.
SanchezFructuoso,A.
Mazuecos.
2016 Abstract Prospectiveandretrospectivecohort 110(119with9combinedliver-kidneytransplant) KTR nd nd 1a:13.8%1b:68.1%2:4.3%3:7.8%4:6% SVR
DiscontinuationduetoAEs
Deaths
ASNTH-PO772 PrasadN.,M.Ranjan
Patel,A.Jaiswal,D.
Bhadauria,R.K.Sharma,
A.Gupta
2016 Abstract Prospectivecohort 22 KTR nd range96425-24175475copeslogIU/mL 1:27.2%2:4.5%3:63.6%4:4.5% SVR12
SVR24
ASNTH-PO774 KusnirJ.E.,A.Dejman,K.
Bhamidimarri,F.E.
Pedraza,M.A.
LadinoAvellaneda,D.
Roth
2016 Abstract Prospectivecohort 21 KTR nd nd nd SVR12
28009781 LubetzkyM,etal 2017 Peer-reviewedpublilcation Retrospectivecohort 31 KTR SCr:1.3(0.4)mg/dLGFR:64.2(16.5)mL/min/BSA
nd nd SVR12
Patientsurvival
Graftsurvival
28239909 MoralesAL,etal 2017 Peer-reviewedpublication Retrospectivecohort 32 KTR nd nd 1a:62.5%,1b:28.1%;2:3.1%;3:3.1%;4:3.1% SVR12
Patientsurvival
28703905 TanejaS,etal 2017 Peer-reviwedpublication Prospectivecohort 47 KTR eGFR67.8ml/min 7.38x10^6IU/ml 1:68%,2:2%,3:21%,4:9% SVR12
Treatmentdiscontinuation
28504842 SaxenaV,etal 2017 Peer-reviewedpublication Retrospectivecohort 60 KTR eGFR58.5ml/min(7.4-156.4) 6.3x10^6IU/ml 1a:48%,1b:37%;2:2%;3:3%;4:3%;5:0%;6:2% SVR12
Acuterejection
Treatmentdiscontinuation
Patientsurvival
28332729 BhamidimarriKR,etal 2017 Peer-reviewedpublication Prospectivecohort 25 KTR Scr1.3mg/dL nd 1a:68%;1b:24%;2:4%;3:4% SVR12
Acuterejection
28039098 FernandezI,etal 2017 Peer-reviewedpublication Retrospectivecohort 103 KTR SCr1.7mg/dL(0.6-8.8) 6.6x10^6IU/ml 1a:8%,1b:74%;2:0%;3:6%;4:8%;5:2%;6:0% SVR12
Acuterejection
JournalofHepatology2017vol.66|S63–S94(andASN2017posterSA-PO496)
Reau,etal 2017 Conferenceposter Prospectivecohort 20 KTR eGFR<60ml/min55%;>=9010% >6x10^6IU/ml20% 1a:30%;1b:55%;3:10%;4:5% SVR12
Patientsurvival
Graftsurvival
DiscontinuationduetoAEs
SeriousAEs
TableS7:SummaryTable
Categoricaloutcomes
PMID Author Year
26587971 KamarN.,MarionO.,
RostaingL.,CointaultO.,
RibesD.,LavayssièreL.,
EspositoL.,DelBelloA.,
MétivierS.,BarangeK.,
IzopetJ.,AlricL.
2015
26604182 SawinskiD.,KaurN.,
AjetiA.,Trofe-ClarkJ.,
LimM.,BleicherM.,
GoralS.,FordeKA.,
BloomRD.
2015
AASLD20151148 BhamidimarriKR.,Roth
D.,GuerraG.,LevyC.,
MartinP.
2015
ATC20153034 SharfuddinA,TaberT,
MujtabaM,YaqubM,
MishlerD,KwoP,
VuppalanchiR
2015
27842383 ColomboM.,AghemoA.,
LiuH.,Dvory-SobolH.,
HylandRH.,YunC.,
BrainardD.M.,
McHutchisonJ.G.,
BourlièreM.,Peck-
RadosavljevicM.,Manns
M.,PolS.
2017
27495770 Eisenberger,U.and
Guberina,H.and
Willuweit,K.and
Bienholz,A.andKribben,
A.andGerken,G.and
Witzke,O.andHerzer,K.
2016
0 KirushnanB,M.A.
Shujauddin,K.
Arumugam,R.
Ravichandran
2016
Treatmentwithdirect-actingantiviralregimensinkidney
transplantrecipientswithchronicHCVinfection
Definition Arm Duration Timepoint Frequency/Rate Relativeeffect p-value Quality Dose
sofosbuvir+daclatasvir/simeprevir+peg-IFN nd nd 0/25(0%) ND ND Poor 400mgOD+60/150mgOD+135mgQW
sofosbuvir+daclatasvir/simeprevir+peg-IFN nd 12weeks 25/25(100%) ND ND
sofosbuvir+daclatasvir/simeprevir+peg-IFN nd 24weeks 8/8(100%) ND ND
HCVtherapy+Immunosuppression 12weeks 12weeks 20/20(100%) ND ND Good nd
HCVtherapy+Immunosuppression 12weeks 37weeks 0/20(0%) ND ND
SCr↑0.25mg/dL HCVtherapy+Immunosuppression 12weeks 37weeks 4/20(20%) ND ND
sofosbuvir/ledipasvir nd 12weeks 1/1(100%) ND ND Fair nd
sofosbuvir-basedtherapy 12-24weeks 12weeks 2/3(67%) ND ND Poor
sofosbuvir-basedtherapy 12-24weeks 4weeks 1/9(11%) ND ND
sofosbuvir-basedtherapy 12-24weeks 12weeks 1/3(33%) ND ND
sofosbuvir-basedtherapy 12-24weeks 12weeks 1/3(33%) ND ND
anemia sofosbuvir-basedtherapy 12-24weeks nd 5/12(42%) ND ND
ledipasvir+sofosbuvirfor12weeks 12weeks 12weeks 57/57(100%) ND ND Good 90mg+400mgOD
ledipasvir+sofosbuvirfor24weeks 24weeks 57/57(100%) ND ND 90mg+400mgOD
ledipasvir+sofosbuvirfor12weeks 12weeks 24weeks NA ND ND 90mg+400mgOD
ledipasvir+sofosbuvirfor24weeks 24weeks 57/57(100%) ND ND 90mg+400mgOD
ledipasvir+sofosbuvirfor12weeks 12weeks 30daysafterthelastdose 1/57(2%) ND ND 90mg+400mgOD
ledipasvir+sofosbuvirfor24weeks 24weeks 0/57(0%) ND ND 90mg+400mgOD
treatment-relatedseariousadverse
events
ledipasvir+sofosbuvirfor12weeks 12weeks 30daysafterthelastdose 1/57(2%) ND ND 90mg+400mgOD
ledipasvir+sofosbuvirfor24weeks 24weeks 2/57(4%) ND ND 90mg+400mgOD
allseriousadverseevents ledipasvir+sofosbuvirfor12weeks 12weeks 30daysafterthelastdose 5/57(9%) ND ND 90mg+400mgOD
ledipasvir+sofosbuvirfor24weeks 24weeks 8/57(14%) ND ND 90mg+400mgOD
ledipasvir+sofosbuvirfor12weeks 12weeks 30daysafterthelastdose 0/57(0%) ND ND 90mg+400mgOD
ledipasvir+sofosbuvirfor24weeks 24weeks 0/57(0%) ND ND 90mg+400mgOD
ledipasvir+sofosbuvirfor8weeks 8weeks 12weeks 3/3(100%) ND ND Fair 90mg+400mgOD
ledipasvir+sofosbuvirfor12weeks 12weeks 12weeks 12/12(100%) ND ND 90mg+400mgOD
fatigue,headache,nausea,hypertension allpatients 8or12weeks upto12weeksaftertreatment 5/15(33%) ND ND 90mg+400mgOD
sofosbuvir+ribavirin 12weeks 10/13(77%) ND ND Fair 400mg+doseadjusted
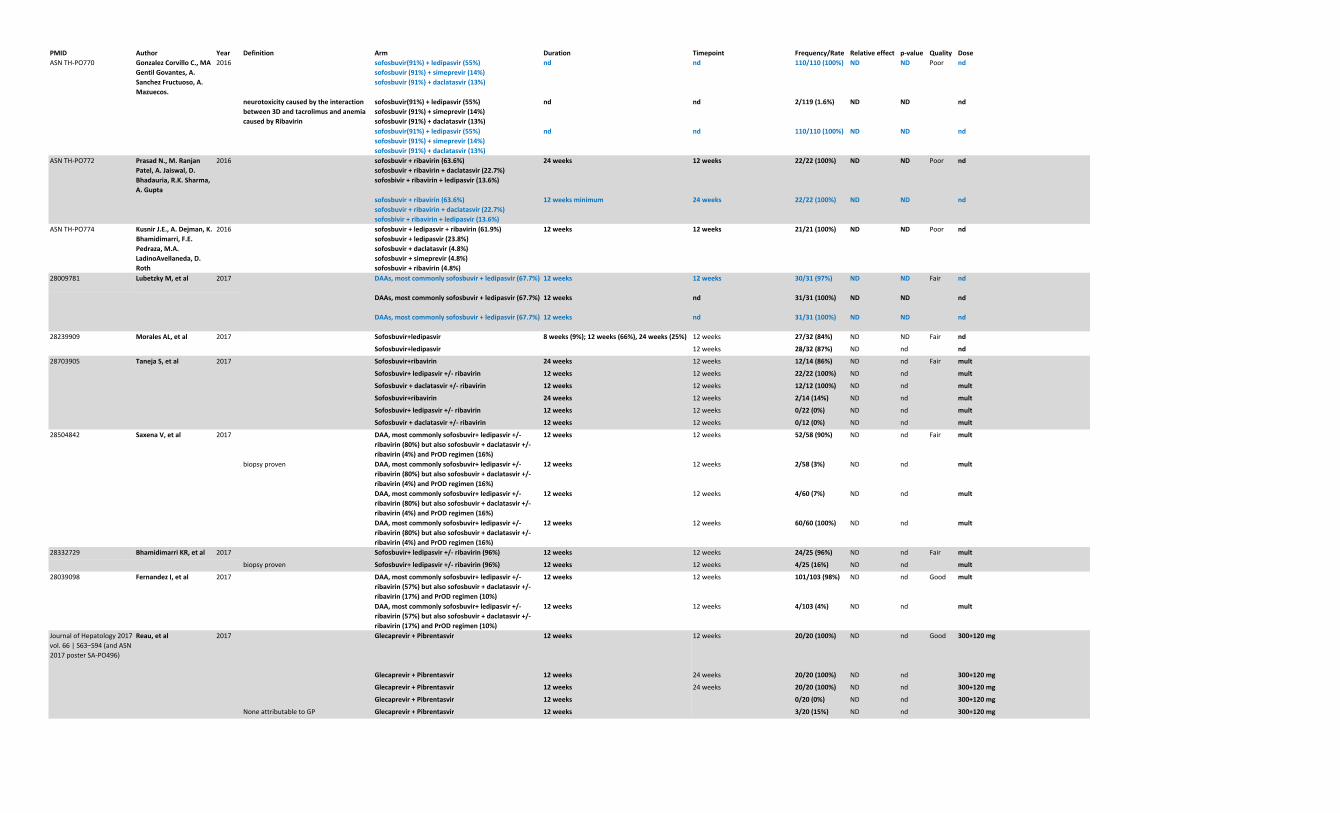
PMID Author Year
ASNTH-PO770 GonzalezCorvilloC.,MA
GentilGovantes,A.
SanchezFructuoso,A.
Mazuecos.
2016
ASNTH-PO772 PrasadN.,M.Ranjan
Patel,A.Jaiswal,D.
Bhadauria,R.K.Sharma,
A.Gupta
2016
ASNTH-PO774 KusnirJ.E.,A.Dejman,K.
Bhamidimarri,F.E.
Pedraza,M.A.
LadinoAvellaneda,D.
Roth
2016
28009781 LubetzkyM,etal 2017
28239909 MoralesAL,etal 2017
28703905 TanejaS,etal 2017
28504842 SaxenaV,etal 2017
28332729 BhamidimarriKR,etal 2017
28039098 FernandezI,etal 2017
JournalofHepatology2017vol.66|S63–S94(andASN2017posterSA-PO496)
Reau,etal 2017
Definition Arm Duration Timepoint Frequency/Rate Relativeeffect p-value Quality Dose
sofosbuvir(91%)+ledipasvir(55%)
sofosbuvir(91%)+simeprevir(14%)
sofosbuvir(91%)+daclatasvir(13%)
nd nd 110/110(100%) ND ND Poor nd
neurotoxicitycausedbytheinteraction
between3Dandtacrolimusandanemia
causedbyRibavirin
sofosbuvir(91%)+ledipasvir(55%)
sofosbuvir(91%)+simeprevir(14%)
sofosbuvir(91%)+daclatasvir(13%)
nd nd 2/119(1.6%) ND ND nd
sofosbuvir(91%)+ledipasvir(55%)
sofosbuvir(91%)+simeprevir(14%)
sofosbuvir(91%)+daclatasvir(13%)
nd nd 110/110(100%) ND ND nd
sofosbuvir+ribavirin(63.6%)
sofosbuvir+ribavirin+daclatasvir(22.7%)
sofosbivir+ribavirin+ledipasvir(13.6%)
24weeks 12weeks 22/22(100%) ND ND Poor nd
sofosbuvir+ribavirin(63.6%)
sofosbuvir+ribavirin+daclatasvir(22.7%)
sofosbivir+ribavirin+ledipasvir(13.6%)
12weeksminimum 24weeks 22/22(100%) ND ND nd
sofosbuvir+ledipasvir+ribavirin(61.9%)
sofosbuvir+ledipasvir(23.8%)
sofosbuvir+daclatasvir(4.8%)
sofosbuvir+simeprevir(4.8%)
sofosbuvir+ribavirin(4.8%)
12weeks 12weeks 21/21(100%) ND ND Poor nd
DAAs,mostcommonlysofosbuvir+ledipasvir(67.7%) 12weeks 12weeks 30/31(97%) ND ND Fair nd
DAAs,mostcommonlysofosbuvir+ledipasvir(67.7%) 12weeks nd 31/31(100%) ND ND nd
DAAs,mostcommonlysofosbuvir+ledipasvir(67.7%) 12weeks nd 31/31(100%) ND ND nd
Sofosbuvir+ledipasvir 8weeks(9%);12weeks(66%),24weeks(25%) 12weeks 27/32(84%) ND ND Fair nd
Sofosbuvir+ledipasvir 12weeks 28/32(87%) ND nd nd
Sofosbuvir+ribavirin 24weeks 12weeks 12/14(86%) ND nd Fair mult
Sofosbuvir+ledipasvir+/-ribavirin 12weeks 12weeks 22/22(100%) ND nd mult
Sofosbuvir+daclatasvir+/-ribavirin 12weeks 12weeks 12/12(100%) ND nd mult
Sofosbuvir+ribavirin 24weeks 12weeks 2/14(14%) ND nd mult
Sofosbuvir+ledipasvir+/-ribavirin 12weeks 12weeks 0/22(0%) ND nd mult
Sofosbuvir+daclatasvir+/-ribavirin 12weeks 12weeks 0/12(0%) ND nd mult
DAA,mostcommonlysofosbuvir+ledipasvir+/-
ribavirin(80%)butalsosofosbuvir+daclatasvir+/-
ribavirin(4%)andPrODregimen(16%)
12weeks 12weeks 52/58(90%) ND nd Fair mult
biopsyproven DAA,mostcommonlysofosbuvir+ledipasvir+/-
ribavirin(80%)butalsosofosbuvir+daclatasvir+/-
ribavirin(4%)andPrODregimen(16%)
12weeks 12weeks 2/58(3%) ND nd mult
DAA,mostcommonlysofosbuvir+ledipasvir+/-
ribavirin(80%)butalsosofosbuvir+daclatasvir+/-
ribavirin(4%)andPrODregimen(16%)
12weeks 12weeks 4/60(7%) ND nd mult
DAA,mostcommonlysofosbuvir+ledipasvir+/-
ribavirin(80%)butalsosofosbuvir+daclatasvir+/-
ribavirin(4%)andPrODregimen(16%)
12weeks 12weeks 60/60(100%) ND nd mult
Sofosbuvir+ledipasvir+/-ribavirin(96%) 12weeks 12weeks 24/25(96%) ND nd Fair mult
biopsyproven Sofosbuvir+ledipasvir+/-ribavirin(96%) 12weeks 12weeks 4/25(16%) ND nd mult
DAA,mostcommonlysofosbuvir+ledipasvir+/-
ribavirin(57%)butalsosofosbuvir+daclatasvir+/-
ribavirin(17%)andPrODregimen(10%)
12weeks 12weeks 101/103(98%) ND nd Good mult
DAA,mostcommonlysofosbuvir+ledipasvir+/-
ribavirin(57%)butalsosofosbuvir+daclatasvir+/-
ribavirin(17%)andPrODregimen(10%)
12weeks 12weeks 4/103(4%) ND nd mult
Glecaprevir+Pibrentasvir 12weeks 12weeks 20/20(100%) ND nd Good 300+120mg
Glecaprevir+Pibrentasvir 12weeks 24weeks 20/20(100%) ND nd 300+120mg
Glecaprevir+Pibrentasvir 12weeks 24weeks 20/20(100%) ND nd 300+120mg
Glecaprevir+Pibrentasvir 12weeks 0/20(0%) ND nd 300+120mg
NoneattributabletoGP Glecaprevir+Pibrentasvir 12weeks 3/20(15%) ND nd 300+120mg
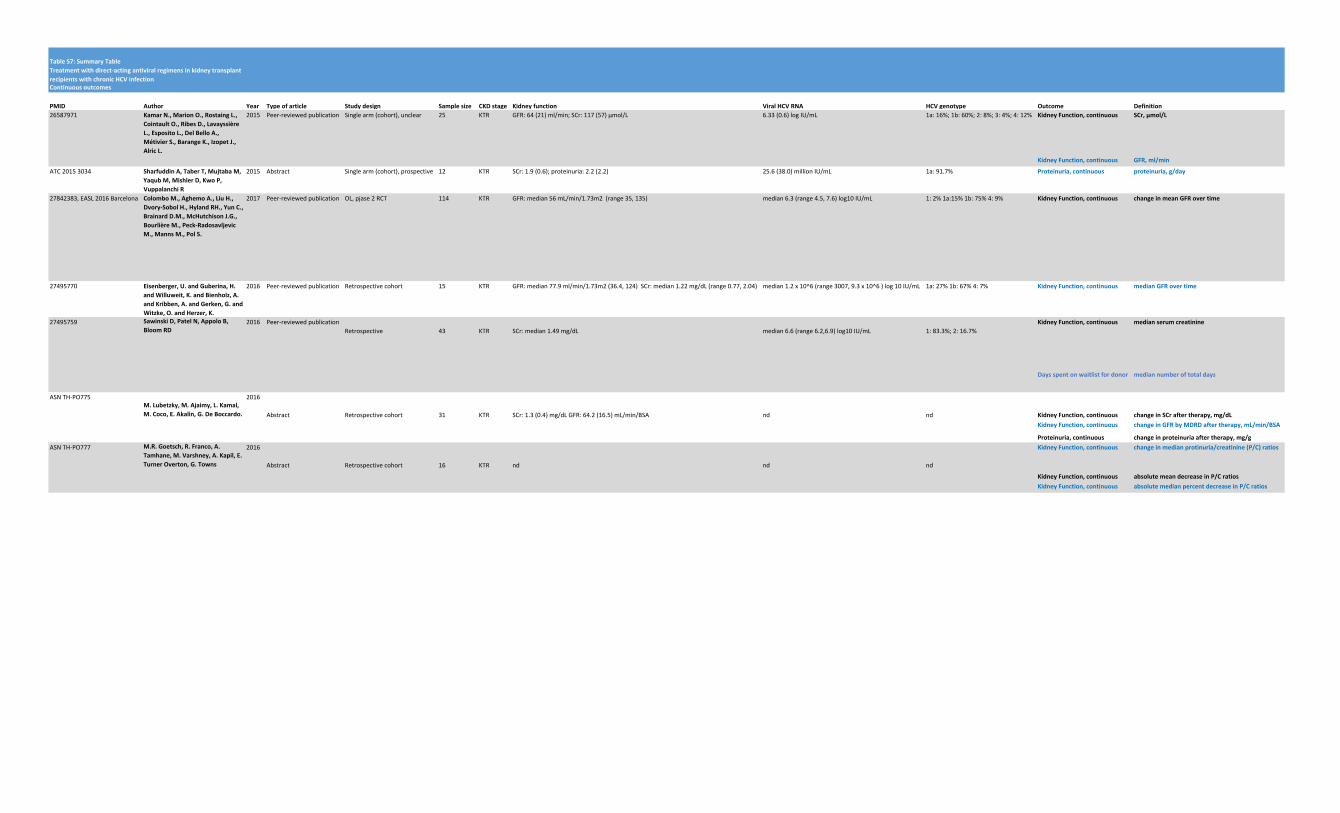
TableS7:SummaryTable
Continuousoutcomes
PMID Author Year Typeofarticle Studydesign Samplesize CKDstage Kidneyfunction ViralHCVRNA HCVgenotype Outcome Definition
26587971 KamarN.,MarionO.,RostaingL.,
CointaultO.,RibesD.,Lavayssière
L.,EspositoL.,DelBelloA.,
MétivierS.,BarangeK.,IzopetJ.,
AlricL.
2015 Peer-reviewedpublication Singlearm(cohort),unclear 25 KTR GFR:64(21)ml/min;SCr:117(57)µmol/L 6.33(0.6)logIU/mL 1a:16%;1b:60%;2:8%;3:4%;4:12% KidneyFunction,continuous SCr,µmol/L
KidneyFunction,continuous GFR,ml/min
ATC20153034 SharfuddinA,TaberT,MujtabaM,
YaqubM,MishlerD,KwoP,
VuppalanchiR
2015 Abstract Singlearm(cohort),prospective 12 KTR SCr:1.9(0.6);proteinuria:2.2(2.2) 25.6(38.0)millionIU/mL 1a:91.7% Proteinuria,continuous proteinuria,g/day
27842383,EASL2016Barcelona ColomboM.,AghemoA.,LiuH.,
Dvory-SobolH.,HylandRH.,YunC.,
BrainardD.M.,McHutchisonJ.G.,
BourlièreM.,Peck-Radosavljevic
M.,MannsM.,PolS.
2017 Peer-reviewedpublication OL,pjase2RCT 114 KTR GFR:median56mL/min/1.73m2(range35,135) median6.3(range4.5,7.6)log10IU/mL 1:2%1a:15%1b:75%4:9% KidneyFunction,continuous changeinmeanGFRovertime
27495770 Eisenberger,U.andGuberina,H.
andWilluweit,K.andBienholz,A.
andKribben,A.andGerken,G.and
Witzke,O.andHerzer,K.
2016 Peer-reviewedpublication Retrospectivecohort 15 KTR GFR:median77.9ml/min/1.73m2(36.4,124)SCr:median1.22mg/dL(range0.77,2.04) median1.2x10^6(range3007,9.3x10^6)log10IU/mL 1a:27%1b:67%4:7% KidneyFunction,continuous medianGFRovertime
27495759 SawinskiD,PatelN,AppoloB,
BloomRD
2016 Peer-reviewedpublicationRetrospective 43 KTR SCr:median1.49mg/dL median6.6(range6.2,6.9)log10IU/mL 1:83.3%;2:16.7%
KidneyFunction,continuous medianserumcreatinine
Daysspentonwaitlistfordonor mediannumberoftotaldays
ASNTH-PO775M.Lubetzky,M.Ajaimy,L.Kamal,
M.Coco,E.Akalin,G.DeBoccardo.
2016
Abstract Retrospectivecohort 31 KTR SCr:1.3(0.4)mg/dLGFR:64.2(16.5)mL/min/BSA nd nd KidneyFunction,continuous changeinSCraftertherapy,mg/dL
KidneyFunction,continuous changeinGFRbyMDRDaftertherapy,mL/min/BSA
Proteinuria,continuous changeinproteinuriaaftertherapy,mg/g
ASNTH-PO777 M.R.Goetsch,R.Franco,A.
Tamhane,M.Varshney,A.Kapil,E.
TurnerOverton,G.Towns
2016
Abstract Retrospectivecohort 16 KTR nd nd nd
KidneyFunction,continuous changeinmedianprotinuria/creatinine(P/C)ratios
KidneyFunction,continuous absolutemeandecreaseinP/Cratios
KidneyFunction,continuous absolutemedianpercentdecreaseinP/Cratios
Treatmentwithdirect-actingantiviralregimensinkidneytransplant
recipientswithchronicHCVinfection
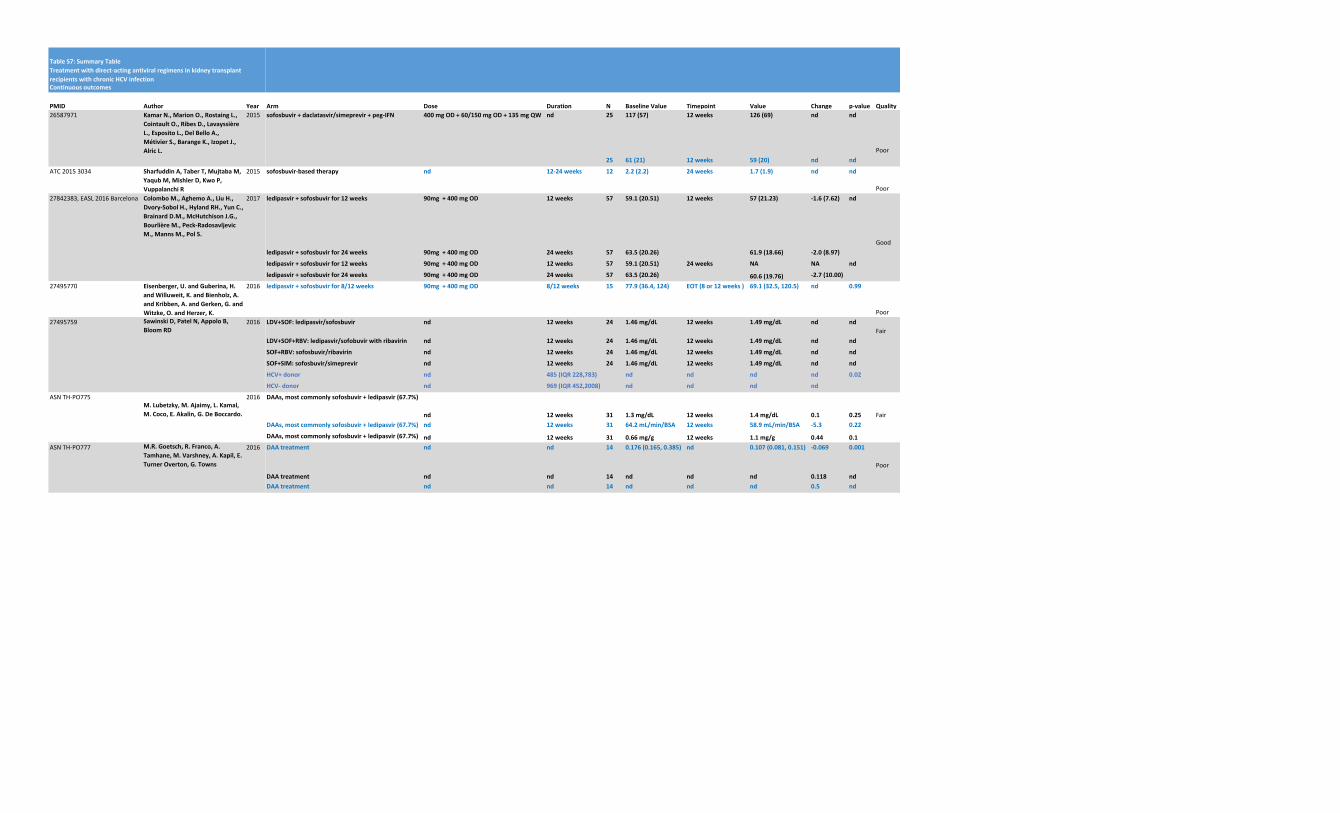
TableS7:SummaryTable
Continuousoutcomes
PMID Author Year
26587971 KamarN.,MarionO.,RostaingL.,
CointaultO.,RibesD.,Lavayssière
L.,EspositoL.,DelBelloA.,
MétivierS.,BarangeK.,IzopetJ.,
AlricL.
2015
ATC20153034 SharfuddinA,TaberT,MujtabaM,
YaqubM,MishlerD,KwoP,
VuppalanchiR
2015
27842383,EASL2016Barcelona ColomboM.,AghemoA.,LiuH.,
Dvory-SobolH.,HylandRH.,YunC.,
BrainardD.M.,McHutchisonJ.G.,
BourlièreM.,Peck-Radosavljevic
M.,MannsM.,PolS.
2017
27495770 Eisenberger,U.andGuberina,H.
andWilluweit,K.andBienholz,A.
andKribben,A.andGerken,G.and
Witzke,O.andHerzer,K.
2016
27495759 SawinskiD,PatelN,AppoloB,
BloomRD
2016
ASNTH-PO775M.Lubetzky,M.Ajaimy,L.Kamal,
M.Coco,E.Akalin,G.DeBoccardo.
2016
ASNTH-PO777 M.R.Goetsch,R.Franco,A.
Tamhane,M.Varshney,A.Kapil,E.
TurnerOverton,G.Towns
2016
Treatmentwithdirect-actingantiviralregimensinkidneytransplant
recipientswithchronicHCVinfection
Arm Dose Duration N BaselineValue Timepoint Value Change p-value Quality
sofosbuvir+daclatasvir/simeprevir+peg-IFN 400mgOD+60/150mgOD+135mgQW nd 25 117(57) 12weeks 126(69) nd nd
Poor25 61(21) 12weeks 59(20) nd nd
sofosbuvir-basedtherapy nd 12-24weeks 12 2.2(2.2) 24weeks 1.7(1.9) nd nd
Poorledipasvir+sofosbuvirfor12weeks 90mg+400mgOD 12weeks 57 59.1(20.51) 12weeks 57(21.23) -1.6(7.62) nd
Goodledipasvir+sofosbuvirfor24weeks 90mg+400mgOD 24weeks 57 63.5(20.26) 61.9(18.66) -2.0(8.97)
ledipasvir+sofosbuvirfor12weeks 90mg+400mgOD 12weeks 57 59.1(20.51) 24weeks NA NA nd
ledipasvir+sofosbuvirfor24weeks 90mg+400mgOD 24weeks 57 63.5(20.26) 60.6(19.76) -2.7(10.00)
ledipasvir+sofosbuvirfor8/12weeks 90mg+400mgOD 8/12weeks 15 77.9(36.4,124) EOT(8or12weeks) 69.1(32.5,120.5) nd 0.99
PoorLDV+SOF:ledipasvir/sofosbuvir nd 12weeks 24 1.46mg/dL 12weeks 1.49mg/dL nd nd
FairLDV+SOF+RBV:ledipasvir/sofobuvirwithribavirin nd 12weeks 24 1.46mg/dL 12weeks 1.49mg/dL nd nd
SOF+RBV:sofosbuvir/ribavirin nd 12weeks 24 1.46mg/dL 12weeks 1.49mg/dL nd nd
SOF+SIM:sofosbuvir/simeprevir nd 12weeks 24 1.46mg/dL 12weeks 1.49mg/dL nd nd
HCV+donor nd 485(IQR228,783) nd nd nd nd 0.02
HCV-donor nd 969(IQR452,2008) nd nd nd nd
DAAs,mostcommonlysofosbuvir+ledipasvir(67.7%)
nd 12weeks 31 1.3mg/dL 12weeks 1.4mg/dL 0.1 0.25 FairDAAs,mostcommonlysofosbuvir+ledipasvir(67.7%) nd 12weeks 31 64.2mL/min/BSA 12weeks 58.9mL/min/BSA -5.3 0.22
DAAs,mostcommonlysofosbuvir+ledipasvir(67.7%) nd 12weeks 31 0.66mg/g 12weeks 1.1mg/g 0.44 0.1
DAAtreatment nd nd 14 0.176(0.165,0.385) nd 0.107(0.081,0.151) -0.069 0.001
Poor
DAAtreatment nd nd 14 nd nd nd 0.118 nd
DAAtreatment nd nd 14 nd nd nd 0.5 nd
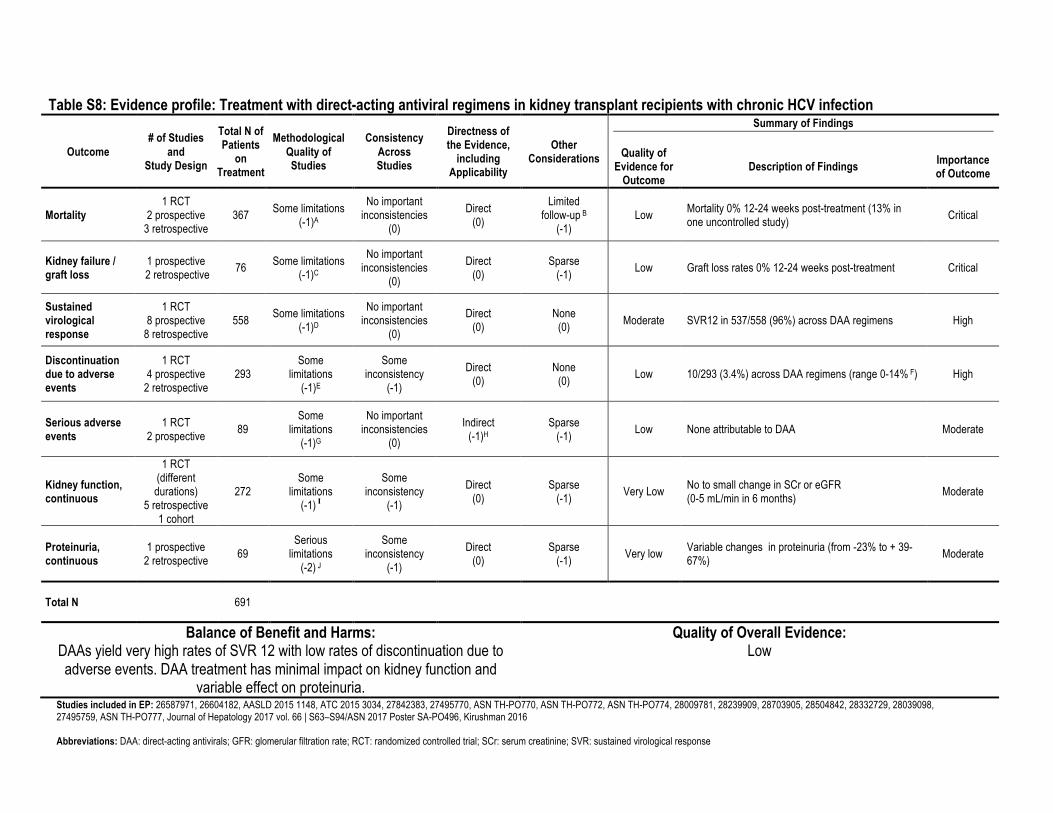
Table S8: Evidence profile: Treatment with direct-acting antiviral regimens in kidney transplant recipients with chronic HCV infection
Outcome # of Studies
and Study Design
Total N of Patients
on Treatment
Methodological Quality of Studies
Consistency Across Studies
Directness of the Evidence,
including Applicability
Other Considerations
Summary of Findings
Quality of Evidence for
Outcome Description of Findings Importance
of Outcome
Mortality 1 RCT
2 prospective 3 retrospective
367 Some limitations (-1)A
No important inconsistencies
(0)
Direct (0)
Limited follow-up B
(-1) Low Mortality 0% 12-24 weeks post-treatment (13% in
one uncontrolled study) Critical
Kidney failure / graft loss
1 prospective 2 retrospective 76 Some limitations
(-1)C
No important inconsistencies
(0) Direct
(0) Sparse
(-1) Low Graft loss rates 0% 12-24 weeks post-treatment Critical
Sustained virological response
1 RCT 8 prospective
8 retrospective 558 Some limitations
(-1)D No important
inconsistencies (0)
Direct (0)
None (0) Moderate SVR12 in 537/558 (96%) across DAA regimens High
Discontinuation due to adverse events
1 RCT 4 prospective
2 retrospective 293
Some limitations
(-1)E
Some inconsistency
(-1) Direct
(0) None
(0) Low 10/293 (3.4%) across DAA regimens (range 0-14% F) High
Serious adverse events
1 RCT 2 prospective 89
Some limitations
(-1)G
No important inconsistencies
(0) Indirect
(-1)H Sparse
(-1) Low None attributable to DAA Moderate
Kidney function, continuous
1 RCT (different durations)
5 retrospective 1 cohort
272 Some
limitations (-1) I
Some inconsistency
(-1) Direct
(0) Sparse
(-1) Very Low No to small change in SCr or eGFR (0-5 mL/min in 6 months) Moderate
Proteinuria, continuous
1 prospective 2 retrospective 69
Serious limitations
(-2) J
Some inconsistency
(-1) Direct
(0) Sparse
(-1) Very low Variable changes in proteinuria (from -23% to + 39-67%) Moderate
Total N 691
Balance of Benefit and Harms: DAAs yield very high rates of SVR 12 with low rates of discontinuation due to adverse events. DAA treatment has minimal impact on kidney function and
variable effect on proteinuria.
Quality of Overall Evidence: Low
Studies included in EP: 26587971, 26604182, AASLD 2015 1148, ATC 2015 3034, 27842383, 27495770, ASN TH-PO770, ASN TH-PO772, ASN TH-PO774, 28009781, 28239909, 28703905, 28504842, 28332729, 28039098, 27495759, ASN TH-PO777, Journal of Hepatology 2017 vol. 66 | S63–S94/ASN 2017 Poster SA-PO496, Kirushman 2016 Abbreviations: DAA: direct-acting antivirals; GFR: glomerular filtration rate; RCT: randomized controlled trial; SCr: serum creatinine; SVR: sustained virological response
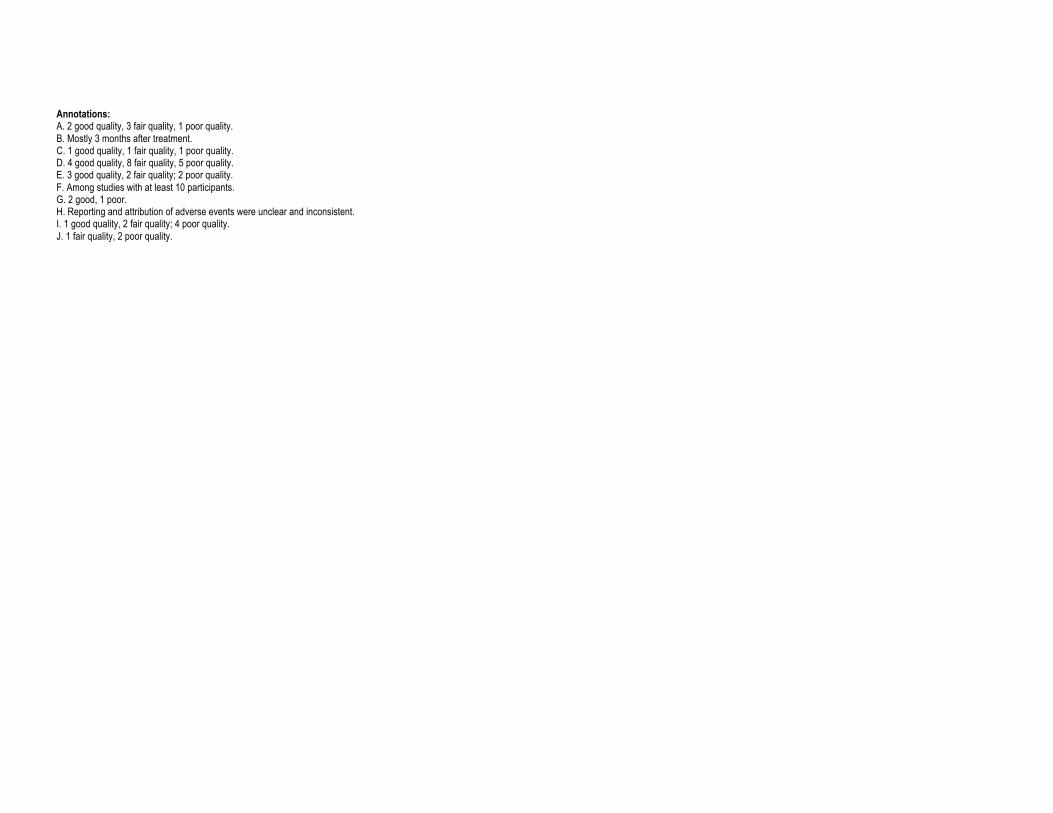
Annotations: A. 2 good quality, 3 fair quality, 1 poor quality. B. Mostly 3 months after treatment. C. 1 good quality, 1 fair quality, 1 poor quality. D. 4 good quality, 8 fair quality, 5 poor quality. E. 3 good quality, 2 fair quality; 2 poor quality. F. Among studies with at least 10 participants. G. 2 good, 1 poor. H. Reporting and attribution of adverse events were unclear and inconsistent. I. 1 good quality, 2 fair quality; 4 poor quality. J. 1 fair quality, 2 poor quality.
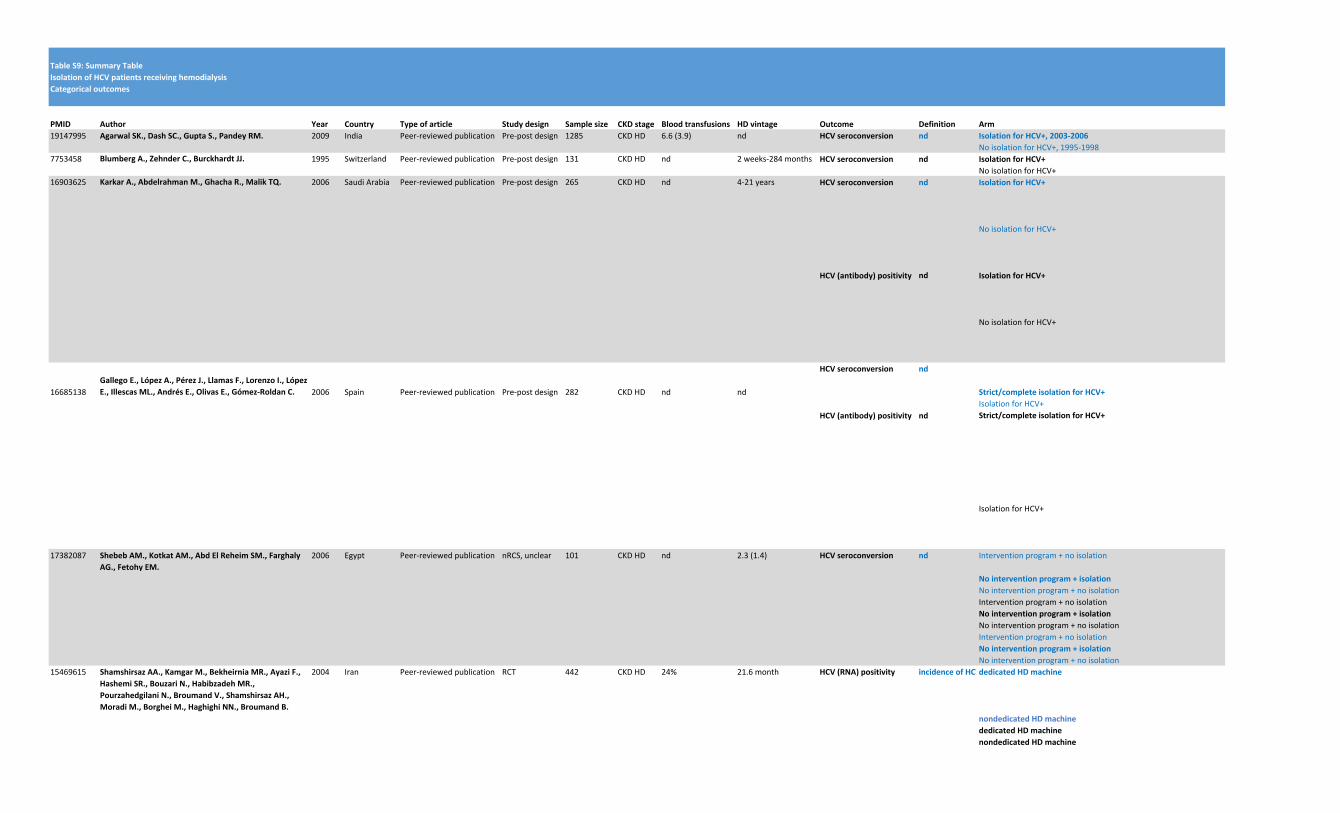
TableS9:SummaryTable
IsolationofHCVpatientsreceivinghemodialysis
Categoricaloutcomes
PMID Author Year Country Typeofarticle Studydesign Samplesize CKDstage Bloodtransfusions HDvintage Outcome Definition Arm
19147995 AgarwalSK.,DashSC.,GuptaS.,PandeyRM. 2009 India Peer-reviewedpublication Pre-postdesign 1285 CKDHD 6.6(3.9) nd HCVseroconversion nd IsolationforHCV+,2003-2006
NoisolationforHCV+,1995-19987753458 BlumbergA.,ZehnderC.,BurckhardtJJ. 1995 Switzerland Peer-reviewedpublication Pre-postdesign 131 CKDHD nd 2weeks-284months HCVseroconversion nd IsolationforHCV+
NoisolationforHCV+16903625 KarkarA.,AbdelrahmanM.,GhachaR.,MalikTQ. 2006 SaudiArabia Peer-reviewedpublication Pre-postdesign 265 CKDHD nd 4-21years HCVseroconversion nd IsolationforHCV+
NoisolationforHCV+
HCV(antibody)positivity nd IsolationforHCV+
NoisolationforHCV+
16685138GallegoE.,LópezA.,PérezJ.,LlamasF.,LorenzoI.,López
E.,IllescasML.,AndrésE.,OlivasE.,Gómez-RoldanC. 2006 Spain Peer-reviewedpublication Pre-postdesign 282 CKDHD nd nd
HCVseroconversion nd
Strict/completeisolationforHCV+
IsolationforHCV+HCV(antibody)positivity nd Strict/completeisolationforHCV+
IsolationforHCV+
17382087 ShebebAM.,KotkatAM.,AbdElReheimSM.,Farghaly
AG.,FetohyEM.
2006 Egypt Peer-reviewedpublication nRCS,unclear 101 CKDHD nd 2.3(1.4) HCVseroconversion nd Interventionprogram+noisolation
Nointerventionprogram+isolation
Nointerventionprogram+noisolationInterventionprogram+noisolationNointerventionprogram+isolation
Nointerventionprogram+noisolationInterventionprogram+noisolationNointerventionprogram+isolation
Nointerventionprogram+noisolation15469615 ShamshirsazAA.,KamgarM.,BekheirniaMR.,AyaziF.,
HashemiSR.,BouzariN.,HabibzadehMR.,
PourzahedgilaniN.,BroumandV.,ShamshirsazAH.,
MoradiM.,BorgheiM.,HaghighiNN.,BroumandB.
2004 Iran Peer-reviewedpublication RCT 442 CKDHD 24% 21.6month HCV(RNA)positivity incidenceofHCVpositive(PCR)casesdedicatedHDmachine
nondedicatedHDmachine
dedicatedHDmachine
nondedicatedHDmachine
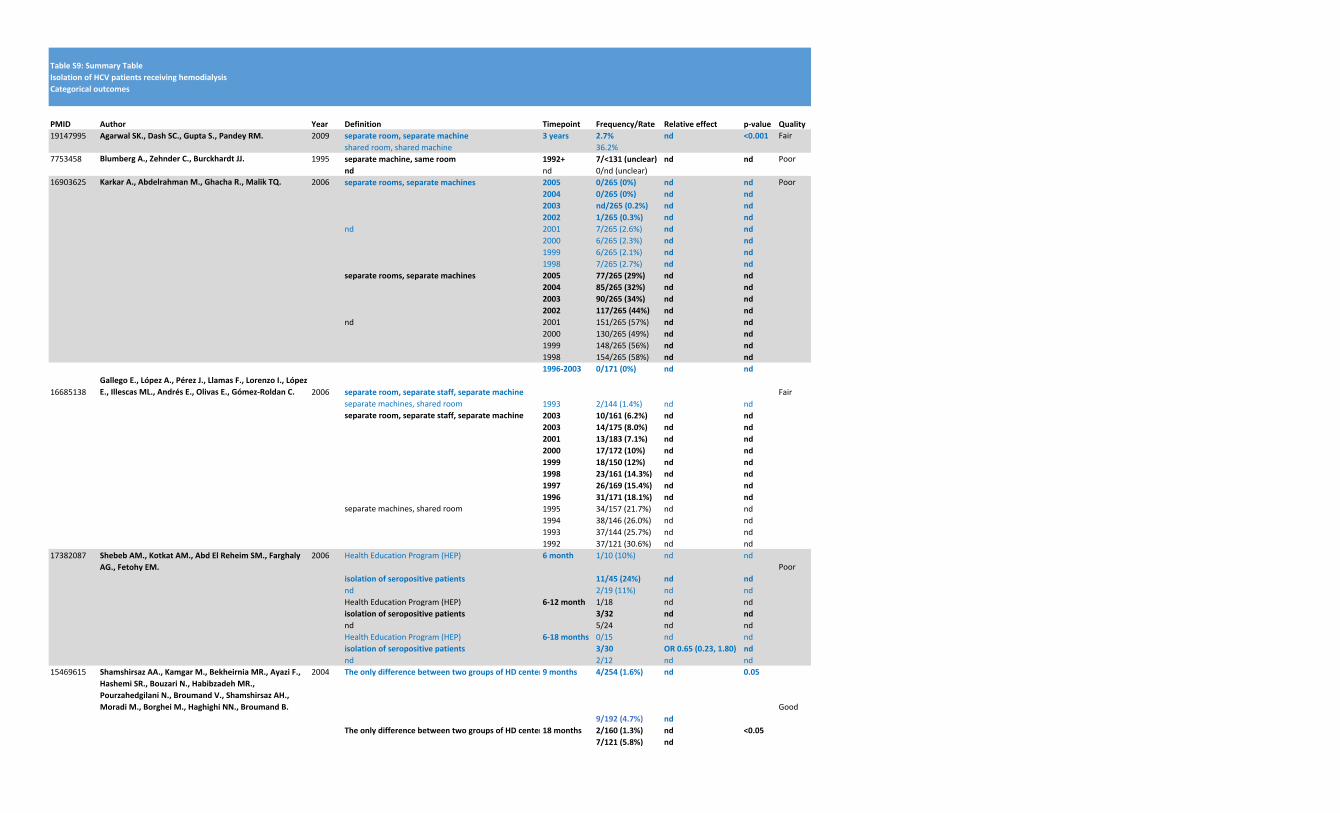
TableS9:SummaryTable
IsolationofHCVpatientsreceivinghemodialysis
Categoricaloutcomes
PMID Author Year
19147995 AgarwalSK.,DashSC.,GuptaS.,PandeyRM. 2009
7753458 BlumbergA.,ZehnderC.,BurckhardtJJ. 1995
16903625 KarkarA.,AbdelrahmanM.,GhachaR.,MalikTQ. 2006
16685138GallegoE.,LópezA.,PérezJ.,LlamasF.,LorenzoI.,López
E.,IllescasML.,AndrésE.,OlivasE.,Gómez-RoldanC. 2006
17382087 ShebebAM.,KotkatAM.,AbdElReheimSM.,Farghaly
AG.,FetohyEM.
2006
15469615 ShamshirsazAA.,KamgarM.,BekheirniaMR.,AyaziF.,
HashemiSR.,BouzariN.,HabibzadehMR.,
PourzahedgilaniN.,BroumandV.,ShamshirsazAH.,
MoradiM.,BorgheiM.,HaghighiNN.,BroumandB.
2004
Definition Timepoint Frequency/Rate Relativeeffect p-value Quality
separateroom,separatemachine 3years 2.7% nd <0.001 Fairsharedroom,sharedmachine 36.2%separatemachine,sameroom 1992+ 7/<131(unclear) nd nd Poornd nd 0/nd(unclear)separaterooms,separatemachines 2005 0/265(0%) nd nd Poor
2004 0/265(0%) nd nd
2003 nd/265(0.2%) nd nd
2002 1/265(0.3%) nd nd
nd 2001 7/265(2.6%) nd nd
2000 6/265(2.3%) nd nd
1999 6/265(2.1%) nd nd
1998 7/265(2.7%) nd nd
separaterooms,separatemachines 2005 77/265(29%) nd nd
2004 85/265(32%) nd nd
2003 90/265(34%) nd nd
2002 117/265(44%) nd nd
nd 2001 151/265(57%) nd nd
2000 130/265(49%) nd nd
1999 148/265(56%) nd nd
1998 154/265(58%) nd nd
separateroom,separatestaff,separatemachine
1996-2003 0/171(0%) nd nd
Fairseparatemachines,sharedroom 1993 2/144(1.4%) nd ndseparateroom,separatestaff,separatemachine 2003 10/161(6.2%) nd nd
2003 14/175(8.0%) nd nd
2001 13/183(7.1%) nd nd
2000 17/172(10%) nd nd
1999 18/150(12%) nd nd
1998 23/161(14.3%) nd nd
1997 26/169(15.4%) nd nd
1996 31/171(18.1%) nd nd
separatemachines,sharedroom 1995 34/157(21.7%) nd nd1994 38/146(26.0%) nd nd1993 37/144(25.7%) nd nd1992 37/121(30.6%) nd nd
HealthEducationProgram(HEP) 6month 1/10(10%) nd ndPoor
isolationofseropositivepatients 11/45(24%) nd nd
nd 2/19(11%) nd ndHealthEducationProgram(HEP) 6-12month 1/18 nd ndisolationofseropositivepatients 3/32 nd nd
nd 5/24 nd ndHealthEducationProgram(HEP) 6-18months 0/15 nd ndisolationofseropositivepatients 3/30 OR0.65(0.23,1.80) nd
nd 2/12 nd ndTheonlydifferencebetweentwogroupsofHDcenterswasthatin-groupD,HCVpositivepatientswereassignedtoadedicatedHDmachine,butin-groupND,HDHCVpositiveandnegativepatientswerenotassignedtodedicatedmachines.Allmachineswerelocatedindialysiswardsandnotinseparateroomsinbothgroups.9months 4/254(1.6%) nd 0.05
Good9/192(4.7%) nd
TheonlydifferencebetweentwogroupsofHDcenterswasthatin-groupD,HCVpositivepatientswereassignedtoadedicatedHDmachine,butin-groupND,HDHCVpositiveandnegativepatientswerenotassignedtodedicatedmachines.Allmachineswerelocatedindialysiswardsandnotinseparateroomsinbothgroups.18months 2/160(1.3%) nd <0.05
7/121(5.8%) nd
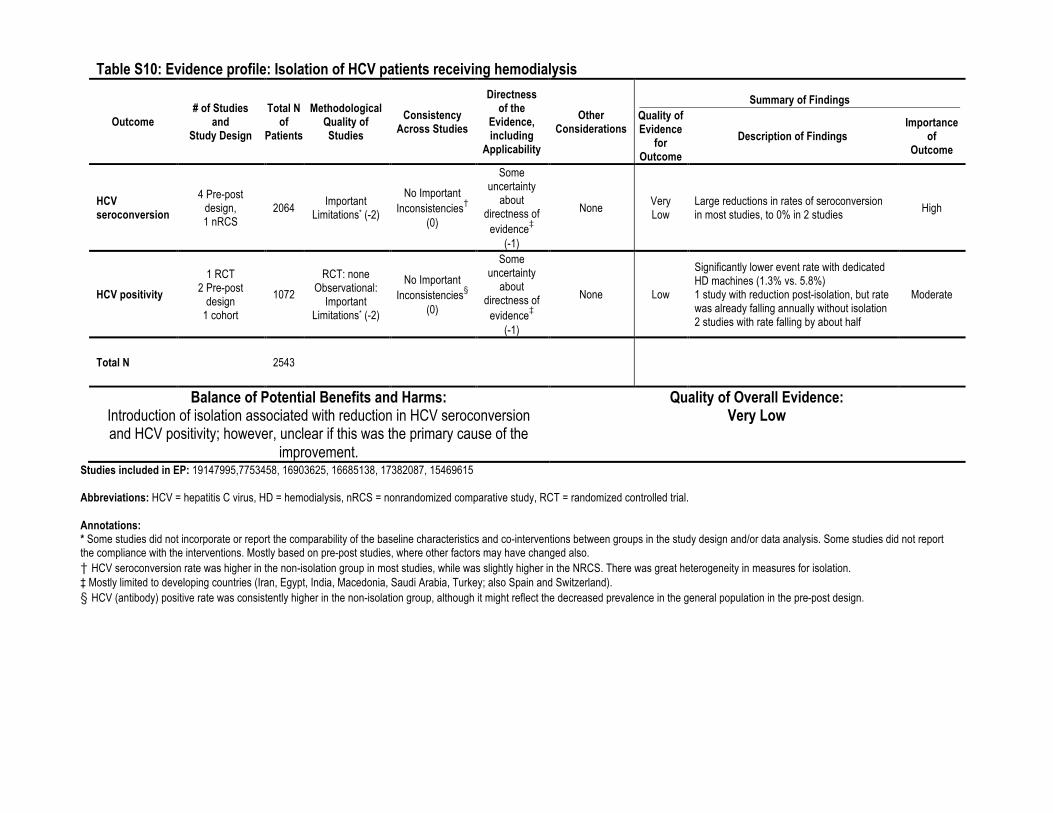
Table S10: Evidence profile: Isolation of HCV patients receiving hemodialysis
Outcome # of Studies
and Study Design
Total N of
Patients
Methodological Quality of Studies
Consistency Across Studies
Directness of the
Evidence, including
Applicability
Other Considerations
Summary of Findings Quality of Evidence
for Outcome
Description of Findings Importance
of Outcome
HCV seroconversion
4 Pre-post design, 1 nRCS
2064 Important Limitations* (-2)
No Important Inconsistencies†
(0)
Some uncertainty
about directness of
evidence‡
(-1)
None Very Low
Large reductions in rates of seroconversion in most studies, to 0% in 2 studies High
HCV positivity 1 RCT
2 Pre-post design
1 cohort
1072 RCT: none
Observational: Important
Limitations* (-2)
No Important Inconsistencies§
(0)
Some uncertainty
about directness of
evidence‡
(-1)
None Low
Significantly lower event rate with dedicated HD machines (1.3% vs. 5.8%) 1 study with reduction post-isolation, but rate was already falling annually without isolation 2 studies with rate falling by about half
Moderate
Total N 2543
Balance of Potential Benefits and Harms: Introduction of isolation associated with reduction in HCV seroconversion and HCV positivity; however, unclear if this was the primary cause of the
improvement.
Quality of Overall Evidence: Very Low
Studies included in EP: 19147995,7753458, 16903625, 16685138, 17382087, 15469615 Abbreviations: HCV = hepatitis C virus, HD = hemodialysis, nRCS = nonrandomized comparative study, RCT = randomized controlled trial. Annotations: * Some studies did not incorporate or report the comparability of the baseline characteristics and co-interventions between groups in the study design and/or data analysis. Some studies did not report the compliance with the interventions. Mostly based on pre-post studies, where other factors may have changed also. † HCV seroconversion rate was higher in the non-isolation group in most studies, while was slightly higher in the NRCS. There was great heterogeneity in measures for isolation. ‡ Mostly limited to developing countries (Iran, Egypt, India, Macedonia, Saudi Arabia, Turkey; also Spain and Switzerland). § HCV (antibody) positive rate was consistently higher in the non-isolation group, although it might reflect the decreased prevalence in the general population in the pre-post design.
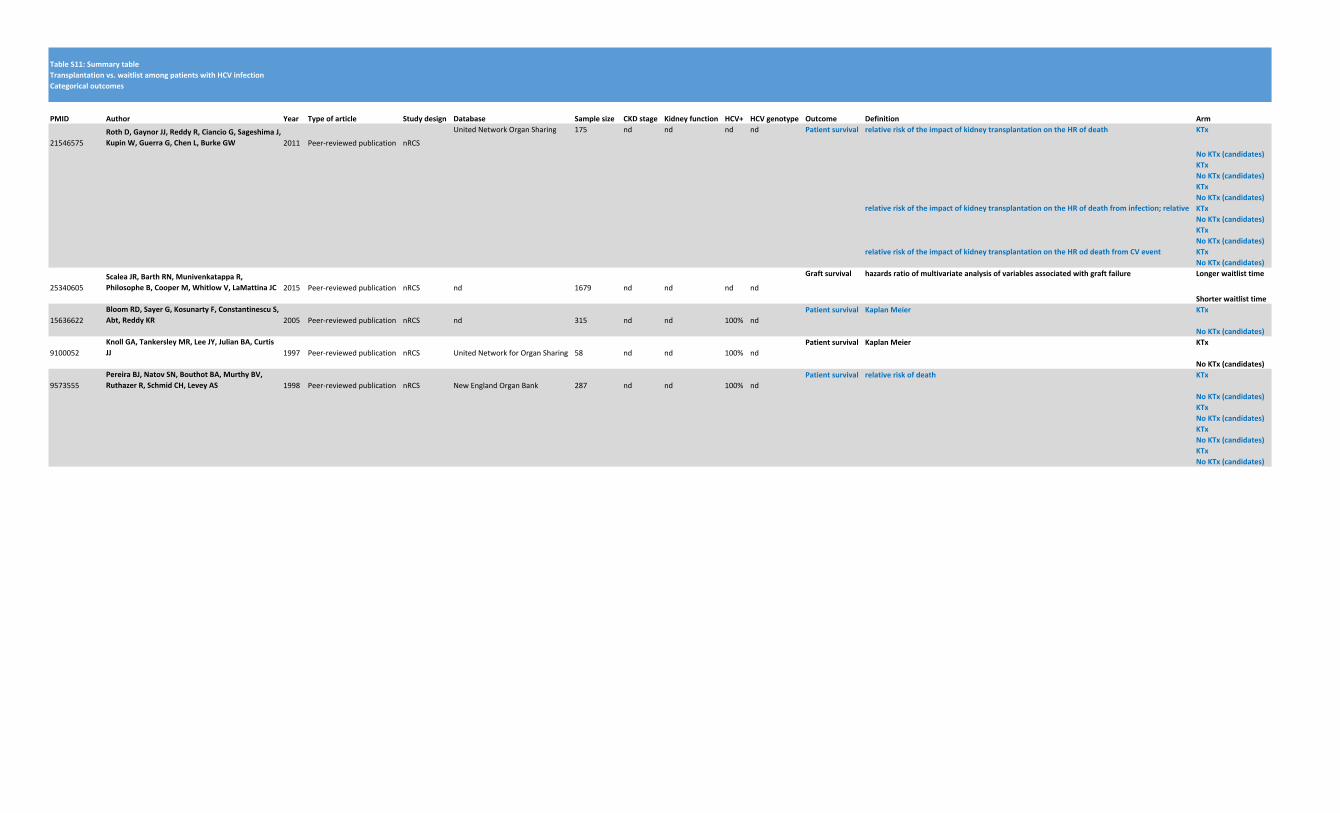
TableS11:SummarytableTransplantationvs.waitlistamongpatientswithHCVinfectionCategoricaloutcomes
PMID Author Year Typeofarticle Studydesign Database Samplesize CKDstage Kidneyfunction HCV+ HCVgenotype Outcome Definition Arm
21546575RothD,GaynorJJ,ReddyR,CiancioG,SageshimaJ,KupinW,GuerraG,ChenL,BurkeGW 2011 Peer-reviewedpublication nRCS
UnitedNetworkOrganSharing 175 nd nd nd nd Patientsurvival relativeriskoftheimpactofkidneytransplantationontheHRofdeath KTx
NoKTx(candidates)KTxNoKTx(candidates)KTxNoKTx(candidates)
relativeriskoftheimpactofkidneytransplantationontheHRofdeathfrominfection;relative KTxNoKTx(candidates)KTxNoKTx(candidates)
relativeriskoftheimpactofkidneytransplantationontheHRoddeathfromCVevent KTxNoKTx(candidates)
25340605ScaleaJR,BarthRN,MunivenkatappaR,PhilosopheB,CooperM,WhitlowV,LaMattinaJC 2015 Peer-reviewedpublication nRCS nd 1679 nd nd nd nd
Graftsurvival hazardsratioofmultivariateanalysisofvariablesassociatedwithgraftfailure Longerwaitlisttime
Shorterwaitlisttime
15636622BloomRD,SayerG,KosunartyF,ConstantinescuS,Abt,ReddyKR 2005 Peer-reviewedpublication nRCS nd 315 nd nd 100% nd
Patientsurvival KaplanMeier KTx
NoKTx(candidates)
9100052KnollGA,TankersleyMR,LeeJY,JulianBA,CurtisJJ 1997 Peer-reviewedpublication nRCS UnitedNetworkforOrganSharing 58 nd nd 100% nd
Patientsurvival KaplanMeier KTx
NoKTx(candidates)
9573555PereiraBJ,NatovSN,BouthotBA,MurthyBV,RuthazerR,SchmidCH,LeveyAS 1998 Peer-reviewedpublication nRCS NewEnglandOrganBank 287 nd nd 100% nd
Patientsurvival relativeriskofdeath KTx
NoKTx(candidates)KTxNoKTx(candidates)KTxNoKTx(candidates)KTxNoKTx(candidates)
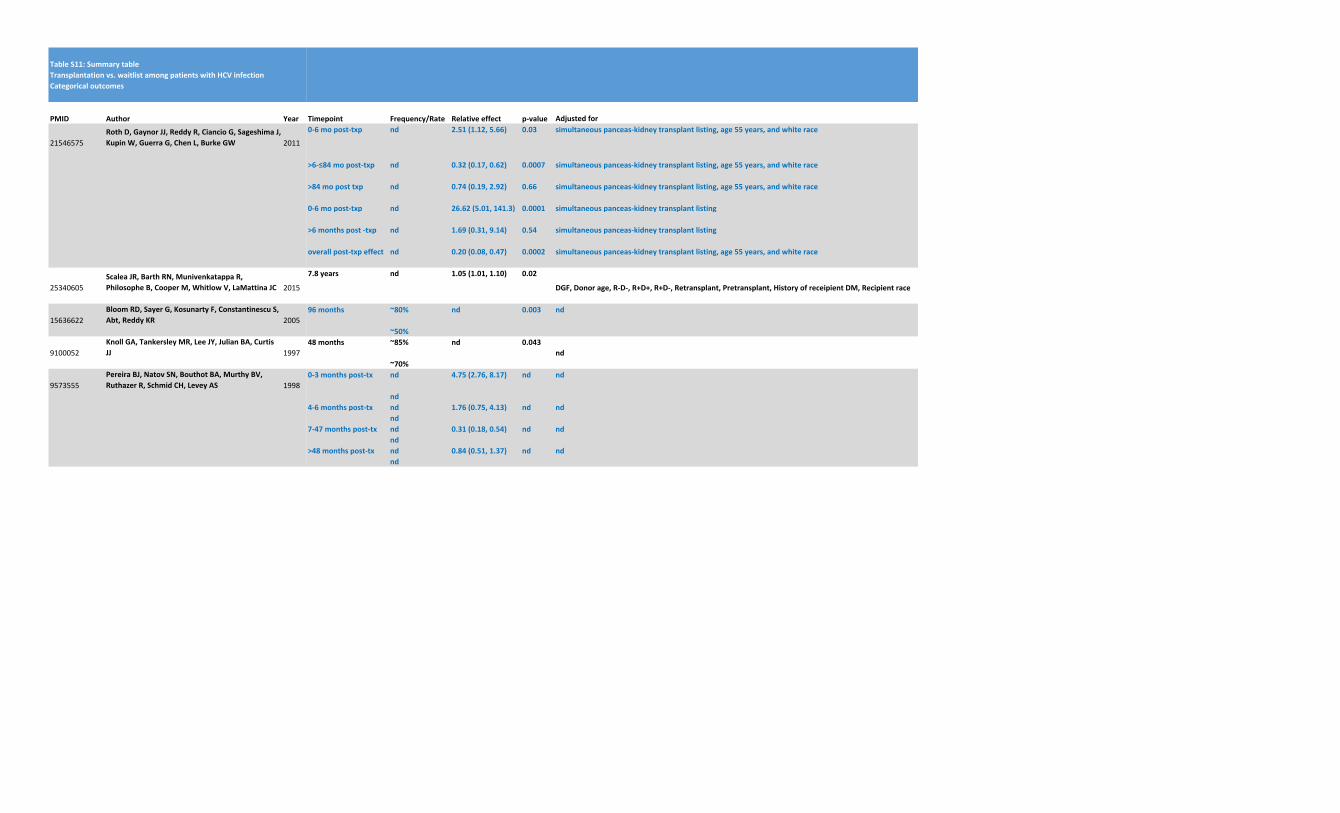
TableS11:SummarytableTransplantationvs.waitlistamongpatientswithHCVinfectionCategoricaloutcomes
PMID Author Year
21546575RothD,GaynorJJ,ReddyR,CiancioG,SageshimaJ,KupinW,GuerraG,ChenL,BurkeGW 2011
25340605ScaleaJR,BarthRN,MunivenkatappaR,PhilosopheB,CooperM,WhitlowV,LaMattinaJC 2015
15636622BloomRD,SayerG,KosunartyF,ConstantinescuS,Abt,ReddyKR 2005
9100052KnollGA,TankersleyMR,LeeJY,JulianBA,CurtisJJ 1997
9573555PereiraBJ,NatovSN,BouthotBA,MurthyBV,RuthazerR,SchmidCH,LeveyAS 1998
Timepoint Frequency/Rate Relativeeffect p-value Adjustedfor0-6mopost-txp nd 2.51(1.12,5.66) 0.03 simultaneouspanceas-kidneytransplantlisting,age55years,andwhiterace
>6-≤84mopost-txp nd 0.32(0.17,0.62) 0.0007 simultaneouspanceas-kidneytransplantlisting,age55years,andwhiterace
>84moposttxp nd 0.74(0.19,2.92) 0.66 simultaneouspanceas-kidneytransplantlisting,age55years,andwhiterace
0-6mopost-txp nd 26.62(5.01,141.3) 0.0001 simultaneouspanceas-kidneytransplantlisting
>6monthspost-txp nd 1.69(0.31,9.14) 0.54 simultaneouspanceas-kidneytransplantlisting
overallpost-txpeffect nd 0.20(0.08,0.47) 0.0002 simultaneouspanceas-kidneytransplantlisting,age55years,andwhiterace
7.8years nd 1.05(1.01,1.10) 0.02
DGF,Donorage,R-D-,R+D+,R+D-,Retransplant,Pretransplant,HistoryofreceipientDM,Recipientrace
96months ~80% nd 0.003 nd
~50%48months ~85% nd 0.043
nd~70%
0-3monthspost-tx nd 4.75(2.76,8.17) nd nd
nd4-6monthspost-tx nd 1.76(0.75,4.13) nd nd
nd7-47monthspost-tx nd 0.31(0.18,0.54) nd nd
nd>48monthspost-tx nd 0.84(0.51,1.37) nd nd
nd
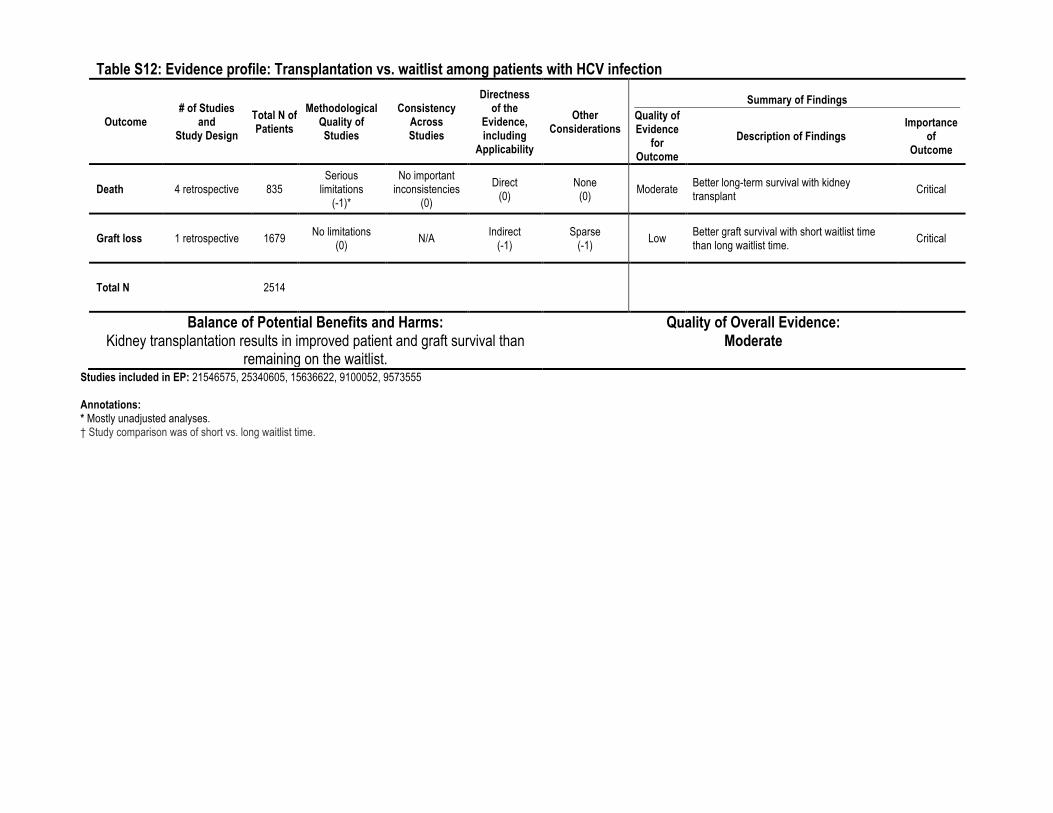
Table S12: Evidence profile: Transplantation vs. waitlist among patients with HCV infection
Outcome # of Studies
and Study Design
Total N of Patients
Methodological Quality of Studies
Consistency Across Studies
Directness of the
Evidence, including
Applicability
Other Considerations
Summary of Findings Quality of Evidence
for Outcome
Description of Findings Importance
of Outcome
Death 4 retrospective 835 Serious
limitations (-1)*
No important inconsistencies
(0)
Direct (0)
None (0) Moderate Better long-term survival with kidney
transplant Critical
Graft loss 1 retrospective 1679 No limitations (0) N/A Indirect
(-1) Sparse
(-1) Low Better graft survival with short waitlist time than long waitlist time. Critical
Total N 2514
Balance of Potential Benefits and Harms: Kidney transplantation results in improved patient and graft survival than
remaining on the waitlist.
Quality of Overall Evidence: Moderate
Studies included in EP: 21546575, 25340605, 15636622, 9100052, 9573555 Annotations: * Mostly unadjusted analyses. † Study comparison was of short vs. long waitlist time.
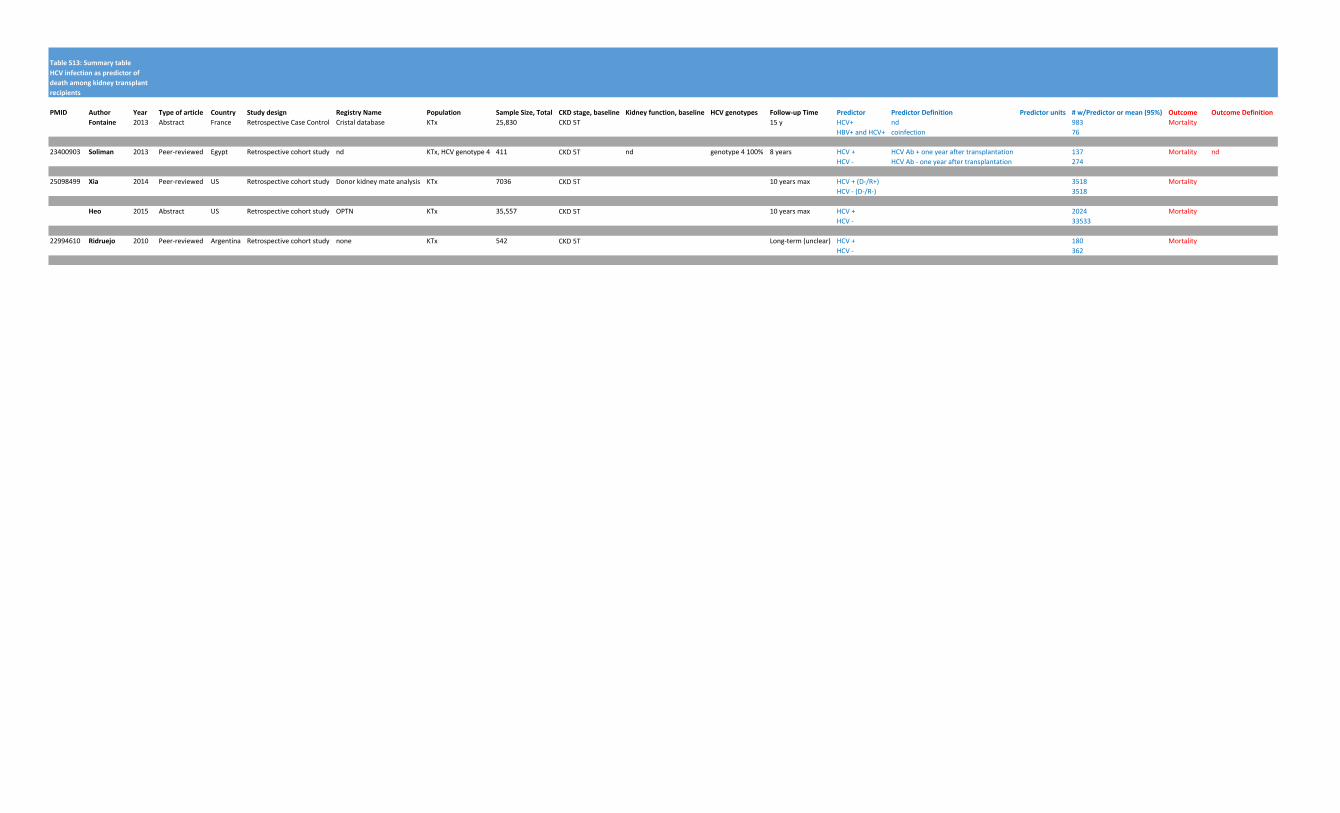
TableS13:Summarytable
PMID Author Year Typeofarticle Country Studydesign RegistryName Population SampleSize,Total CKDstage,baseline Kidneyfunction,baseline HCVgenotypes Follow-upTime Predictor PredictorDefinition Predictorunits #w/Predictorormean(95%) Outcome OutcomeDefinitionFontaine 2013 Abstract France RetrospectiveCaseControl Cristaldatabase KTx 25,830 CKD5T 15y HCV+ nd 983 Mortality
HBV+andHCV+ coinfection 76
23400903 Soliman 2013 Peer-reviewed Egypt Retrospectivecohortstudy nd KTx,HCVgenotype4 411 CKD5T nd genotype4100% 8years HCV+ HCVAb+oneyearaftertransplantation 137 Mortality ndHCV- HCVAb-oneyearaftertransplantation 274
25098499 Xia 2014 Peer-reviewed US Retrospectivecohortstudy Donorkidneymateanalysis KTx 7036 CKD5T 10yearsmax HCV+(D-/R+) 3518 MortalityHCV-(D-/R-) 3518
Heo 2015 Abstract US Retrospectivecohortstudy OPTN KTx 35,557 CKD5T 10yearsmax HCV+ 2024 MortalityHCV- 33533
22994610 Ridruejo 2010 Peer-reviewed Argentina Retrospectivecohortstudy none KTx 542 CKD5T Long-term(unclear) HCV+ 180 MortalityHCV- 362
HCVinfectionaspredictorofdeathamongkidneytransplantrecipients
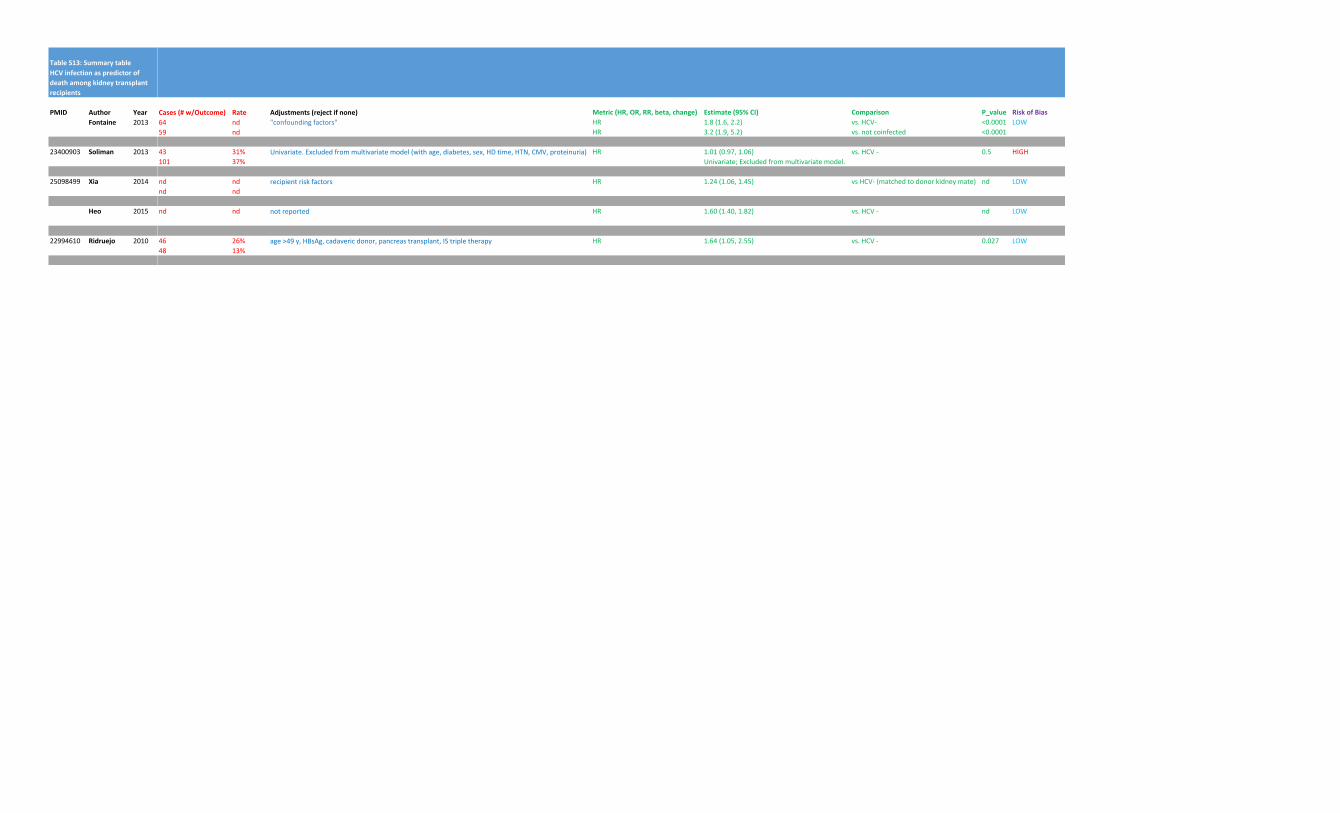
TableS13:Summarytable
PMID Author YearFontaine 2013
23400903 Soliman 2013
25098499 Xia 2014
Heo 2015
22994610 Ridruejo 2010
HCVinfectionaspredictorofdeathamongkidneytransplantrecipients
Cases(#w/Outcome) Rate Adjustments(rejectifnone) Metric(HR,OR,RR,beta,change) Estimate(95%CI) Comparison P_value RiskofBias64 nd "confoundingfactors" HR 1.8(1.6,2.2) vs.HCV- <0.0001 LOW59 nd HR 3.2(1.9,5.2) vs.notcoinfected <0.0001
43 31% Univariate.Excludedfrommultivariatemodel(withage,diabetes,sex,HDtime,HTN,CMV,proteinuria) HR 1.01(0.97,1.06) vs.HCV- 0.5 HIGH101 37% Univariate;Excludedfrommultivariatemodel.
nd nd recipientriskfactors HR 1.24(1.06,1.45) vsHCV-(matchedtodonorkidneymate) nd LOWnd nd
nd nd notreported HR 1.60(1.40,1.82) vs.HCV- nd LOW
46 26% age>49y,HBsAg,cadavericdonor,pancreastransplant,IStripletherapy HR 1.64(1.05,2.55) vs.HCV- 0.027 LOW48 13%
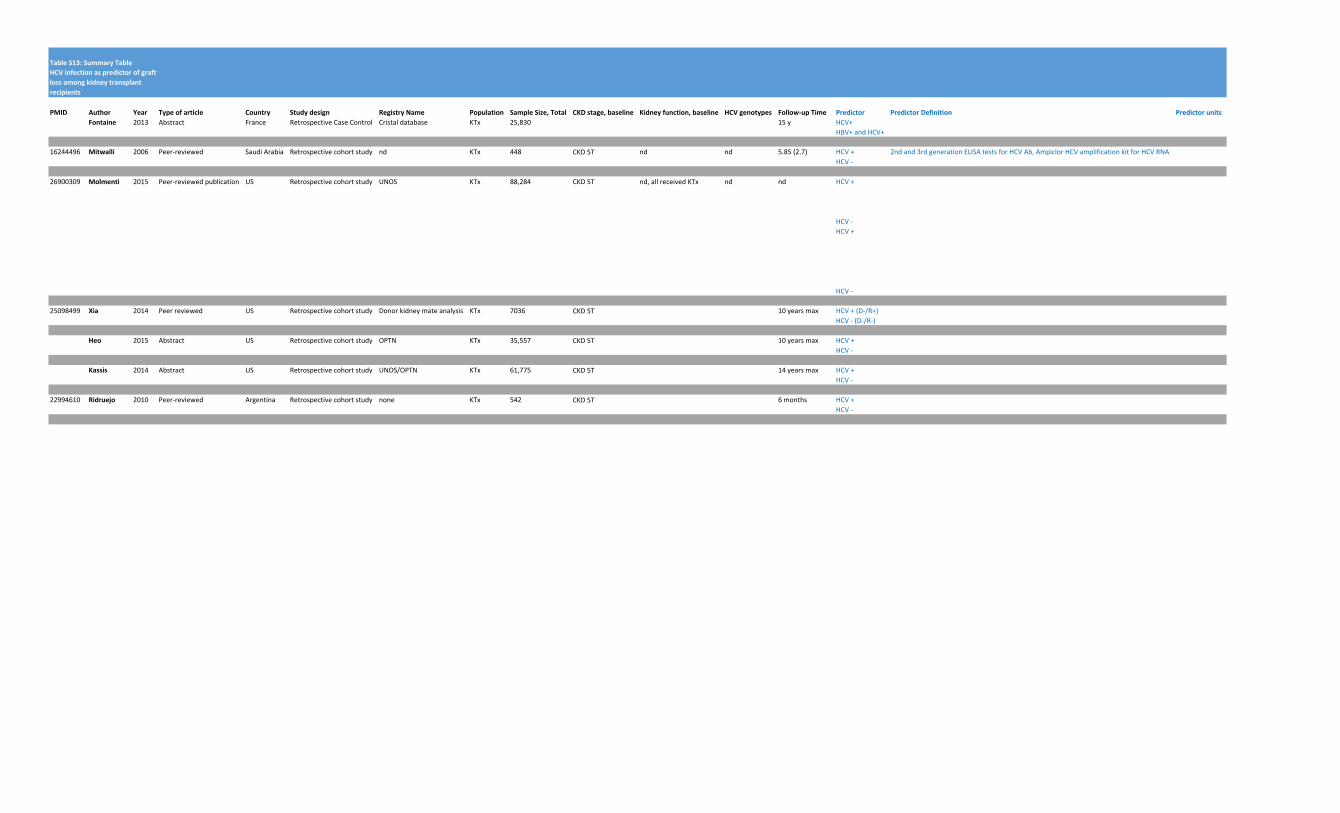
TableS13:SummaryTable
PMID Author Year Typeofarticle Country Studydesign RegistryName Population SampleSize,Total CKDstage,baseline Kidneyfunction,baseline HCVgenotypes Follow-upTime Predictor PredictorDefinition PredictorunitsFontaine 2013 Abstract France RetrospectiveCaseControl Cristaldatabase KTx 25,830 15y HCV+
HBV+andHCV+
16244496 Mitwalli 2006 Peer-reviewed SaudiArabia Retrospectivecohortstudy nd KTx 448 CKD5T nd nd 5.85(2.7) HCV+ 2ndand3rdgenerationELISAtestsforHCVAb,AmpiclorHCVamplificationkitforHCVRNAHCV-
26900309 Molmenti 2015 Peer-reviewedpublication US Retrospectivecohortstudy UNOS KTx 88,284 CKD5T nd,allreceivedKTx nd nd HCV+
HCV-HCV+
HCV-
25098499 Xia 2014 Peerreviewed US Retrospectivecohortstudy Donorkidneymateanalysis KTx 7036 CKD5T 10yearsmax HCV+(D-/R+)HCV-(D-/R-)
Heo 2015 Abstract US Retrospectivecohortstudy OPTN KTx 35,557 CKD5T 10yearsmax HCV+HCV-
Kassis 2014 Abstract US Retrospectivecohortstudy UNOS/OPTN KTx 61,775 CKD5T 14yearsmax HCV+HCV-
22994610 Ridruejo 2010 Peer-reviewed Argentina Retrospectivecohortstudy none KTx 542 CKD5T 6months HCV+HCV-
HCVinfectionaspredictorofgraftlossamongkidneytransplantrecipients
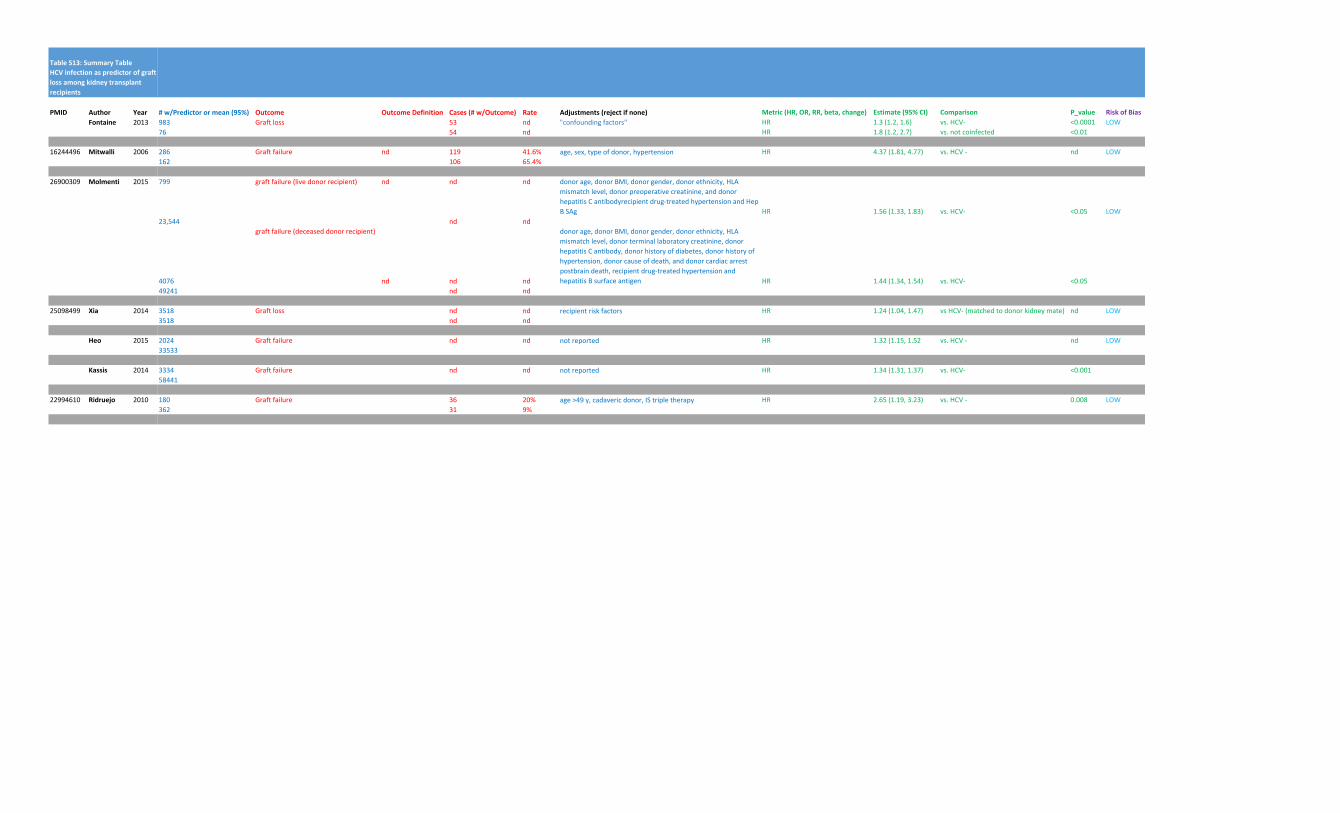
TableS13:SummaryTable
PMID Author YearFontaine 2013
16244496 Mitwalli 2006
26900309 Molmenti 2015
25098499 Xia 2014
Heo 2015
Kassis 2014
22994610 Ridruejo 2010
HCVinfectionaspredictorofgraftlossamongkidneytransplantrecipients
#w/Predictorormean(95%) Outcome OutcomeDefinition Cases(#w/Outcome) Rate Adjustments(rejectifnone) Metric(HR,OR,RR,beta,change) Estimate(95%CI) Comparison P_value RiskofBias983 Graftloss 53 nd "confoundingfactors" HR 1.3(1.2,1.6) vs.HCV- <0.0001 LOW76 54 nd HR 1.8(1.2,2.7) vs.notcoinfected <0.01
286 Graftfailure nd 119 41.6% age,sex,typeofdonor,hypertension HR 4.37(1.81,4.77) vs.HCV- nd LOW162 106 65.4%
799 graftfailure(livedonorrecipient) nd nd nd donorage,donorBMI,donorgender,donorethnicity,HLAmismatchlevel,donorpreoperativecreatinine,anddonorhepatitisCantibodyrecipientdrug-treatedhypertensionandHepBSAg HR 1.56(1.33,1.83) vs.HCV- <0.05 LOW
23,544 nd nd
4076
graftfailure(deceaseddonorrecipient)
nd nd nd
donorage,donorBMI,donorgender,donorethnicity,HLAmismatchlevel,donorterminallaboratorycreatinine,donorhepatitisCantibody,donorhistoryofdiabetes,donorhistoryofhypertension,donorcauseofdeath,anddonorcardiacarrestpostbraindeath,recipientdrug-treatedhypertensionandhepatitisBsurfaceantigen HR 1.44(1.34,1.54) vs.HCV- <0.05
49241 nd nd
3518 Graftloss nd nd recipientriskfactors HR 1.24(1.04,1.47) vsHCV-(matchedtodonorkidneymate) nd LOW3518 nd nd
2024 Graftfailure nd nd notreported HR 1.32(1.15,1.52 vs.HCV- nd LOW33533
3334 Graftfailure nd nd notreported HR 1.34(1.31,1.37) vs.HCV- <0.00158441
180 Graftfailure 36 20% age>49y,cadavericdonor,IStripletherapy HR 2.65(1.19,3.23) vs.HCV- 0.008 LOW362 31 9%
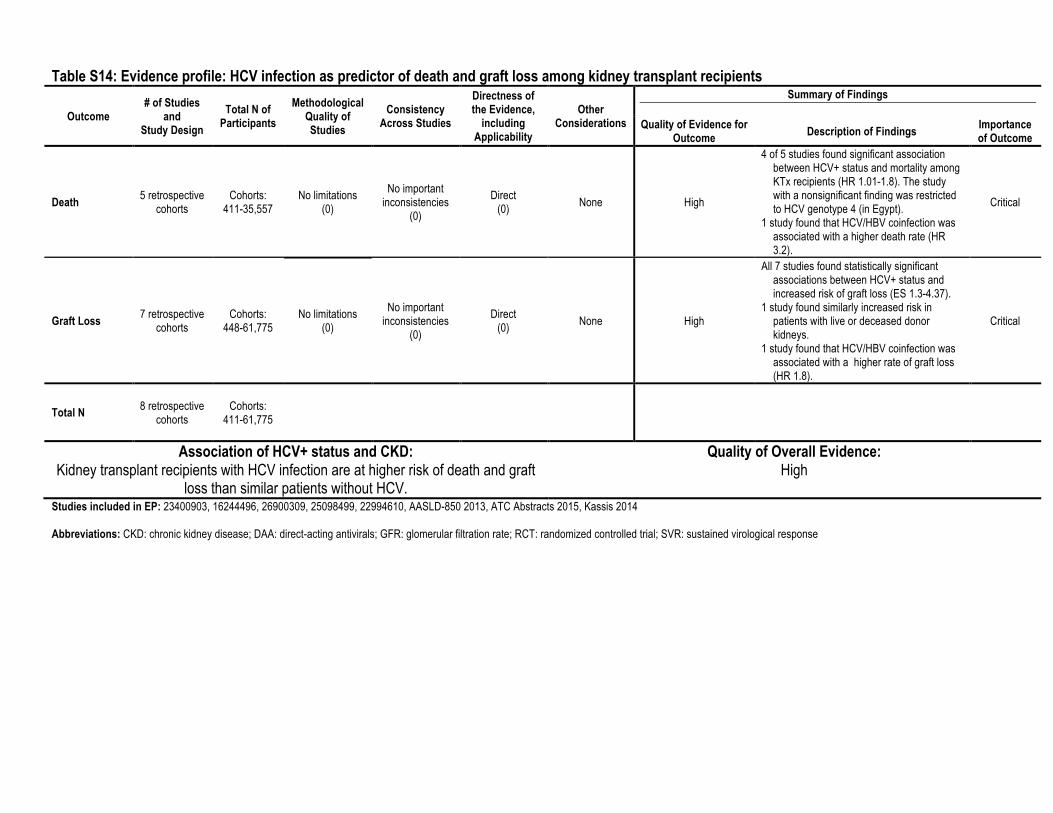
Table S14: Evidence profile: HCV infection as predictor of death and graft loss among kidney transplant recipients
Outcome # of Studies
and Study Design
Total N of Participants
Methodological Quality of Studies
Consistency Across Studies
Directness of the Evidence,
including Applicability
Other Considerations
Summary of Findings
Quality of Evidence for Outcome Description of Findings Importance
of Outcome
Death 5 retrospective cohorts
Cohorts: 411-35,557
No limitations (0)
No important inconsistencies
(0)
Direct (0) None High
4 of 5 studies found significant association between HCV+ status and mortality among KTx recipients (HR 1.01-1.8). The study with a nonsignificant finding was restricted to HCV genotype 4 (in Egypt).
1 study found that HCV/HBV coinfection was associated with a higher death rate (HR 3.2).
Critical
Graft Loss 7 retrospective cohorts
Cohorts: 448-61,775
No limitations (0)
No important inconsistencies
(0)
Direct (0) None High
All 7 studies found statistically significant associations between HCV+ status and increased risk of graft loss (ES 1.3-4.37).
1 study found similarly increased risk in patients with live or deceased donor kidneys.
1 study found that HCV/HBV coinfection was associated with a higher rate of graft loss (HR 1.8).
Critical
Total N 8 retrospective cohorts
Cohorts: 411-61,775
Association of HCV+ status and CKD: Kidney transplant recipients with HCV infection are at higher risk of death and graft
loss than similar patients without HCV.
Quality of Overall Evidence: High
Studies included in EP: 23400903, 16244496, 26900309, 25098499, 22994610, AASLD-850 2013, ATC Abstracts 2015, Kassis 2014 Abbreviations: CKD: chronic kidney disease; DAA: direct-acting antivirals; GFR: glomerular filtration rate; RCT: randomized controlled trial; SVR: sustained virological response
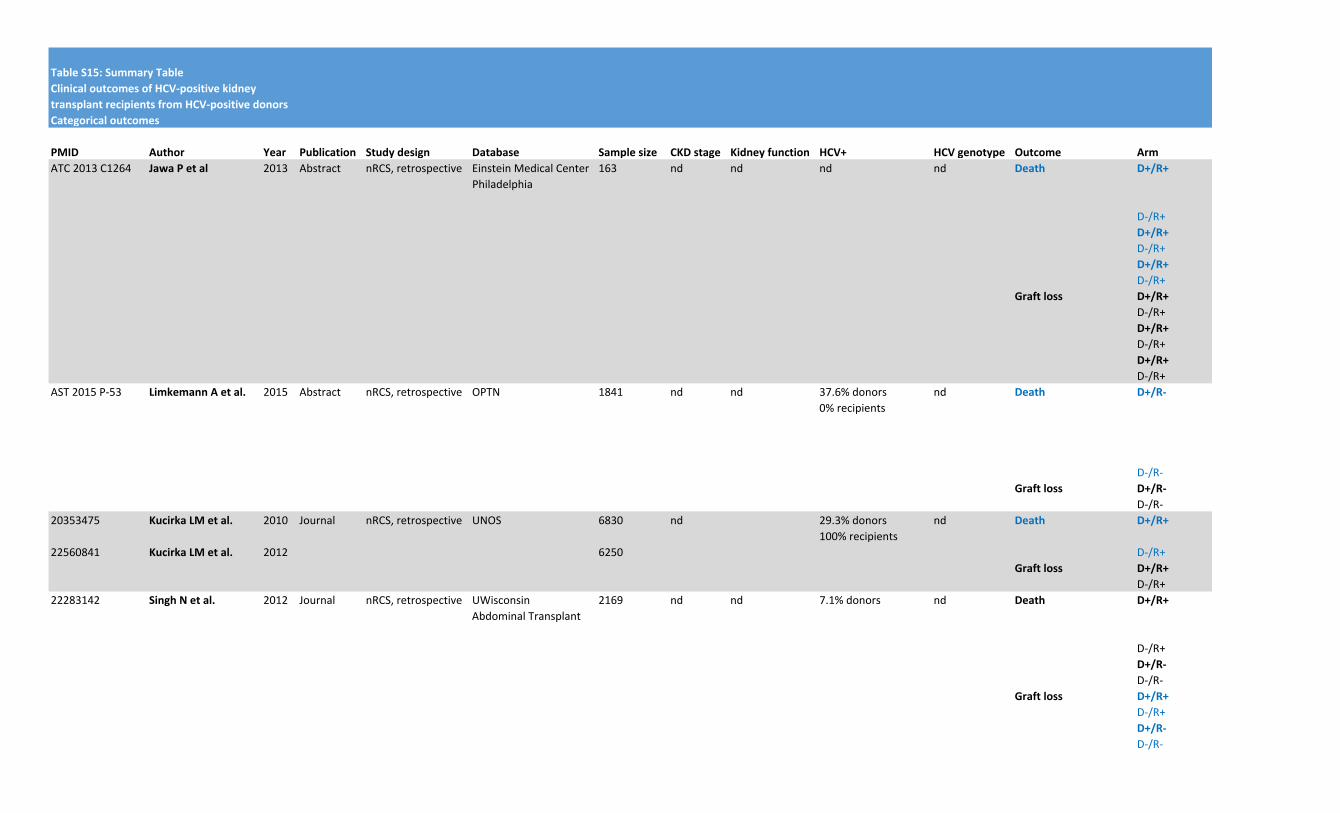
TableS15:SummaryTable
Categoricaloutcomes
PMID Author Year Publication Studydesign Database Samplesize CKDstage Kidneyfunction HCV+ HCVgenotype Outcome Arm
ATC2013C1264 JawaPetal 2013 Abstract nRCS,retrospective EinsteinMedicalCenterPhiladelphia
163 nd nd nd nd Death D+/R+
D-/R+D+/R+
D-/R+D+/R+
D-/R+Graftloss D+/R+
D-/R+D+/R+
D-/R+D+/R+
D-/R+AST2015P-53 LimkemannAetal. 2015 Abstract nRCS,retrospective OPTN 1841 nd nd 37.6%donors
0%recipientsnd Death D+/R-
D-/R-Graftloss D+/R-
D-/R-20353475 KucirkaLMetal. 2010 Journal nRCS,retrospective UNOS 6830 nd 29.3%donors
100%recipientsnd Death D+/R+
22560841 KucirkaLMetal. 2012 6250 D-/R+Graftloss D+/R+
D-/R+22283142 SinghNetal. 2012 Journal nRCS,retrospective UWisconsin
AbdominalTransplant2169 nd nd 7.1%donors nd Death D+/R+
D-/R+D+/R-
D-/R-Graftloss D+/R+
D-/R+D+/R-
D-/R-
ClinicaloutcomesofHCV-positivekidney
transplantrecipientsfromHCV-positivedonors
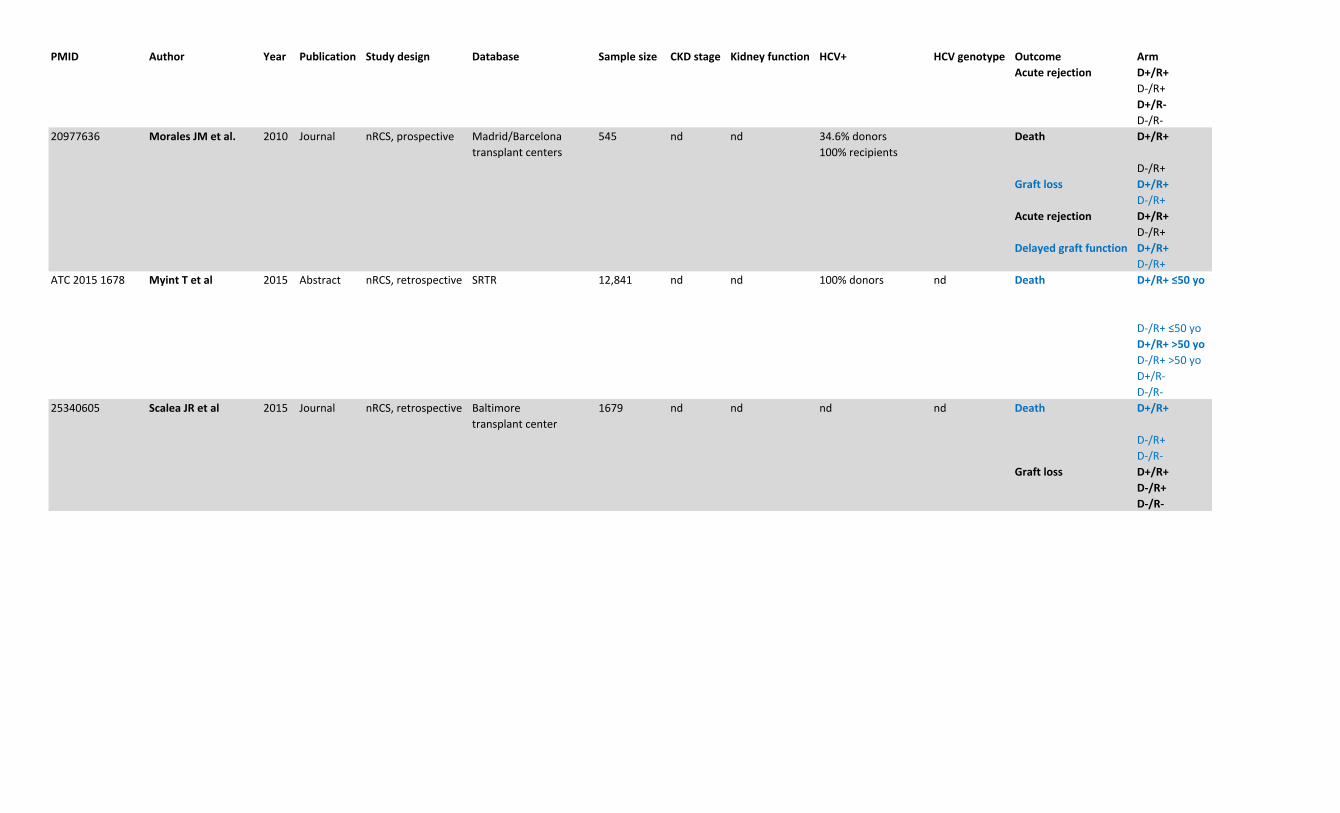
PMID Author Year Publication Studydesign Database Samplesize CKDstage Kidneyfunction HCV+ HCVgenotype Outcome Arm
Acuterejection D+/R+
D-/R+D+/R-
D-/R-20977636 MoralesJMetal. 2010 Journal nRCS,prospective Madrid/Barcelona
transplantcenters545 nd nd 34.6%donors
100%recipientsDeath D+/R+
D-/R+Graftloss D+/R+
D-/R+Acuterejection D+/R+
D-/R+Delayedgraftfunction D+/R+
D-/R+ATC20151678 MyintTetal 2015 Abstract nRCS,retrospective SRTR 12,841 nd nd 100%donors nd Death D+/R+≤50yo
D-/R+≤50yoD+/R+>50yo
D-/R+>50yoD+/R-D-/R-
25340605 ScaleaJRetal 2015 Journal nRCS,retrospective Baltimoretransplantcenter
1679 nd nd nd nd Death D+/R+
D-/R+D-/R-
Graftloss D+/R+
D-/R+
D-/R-
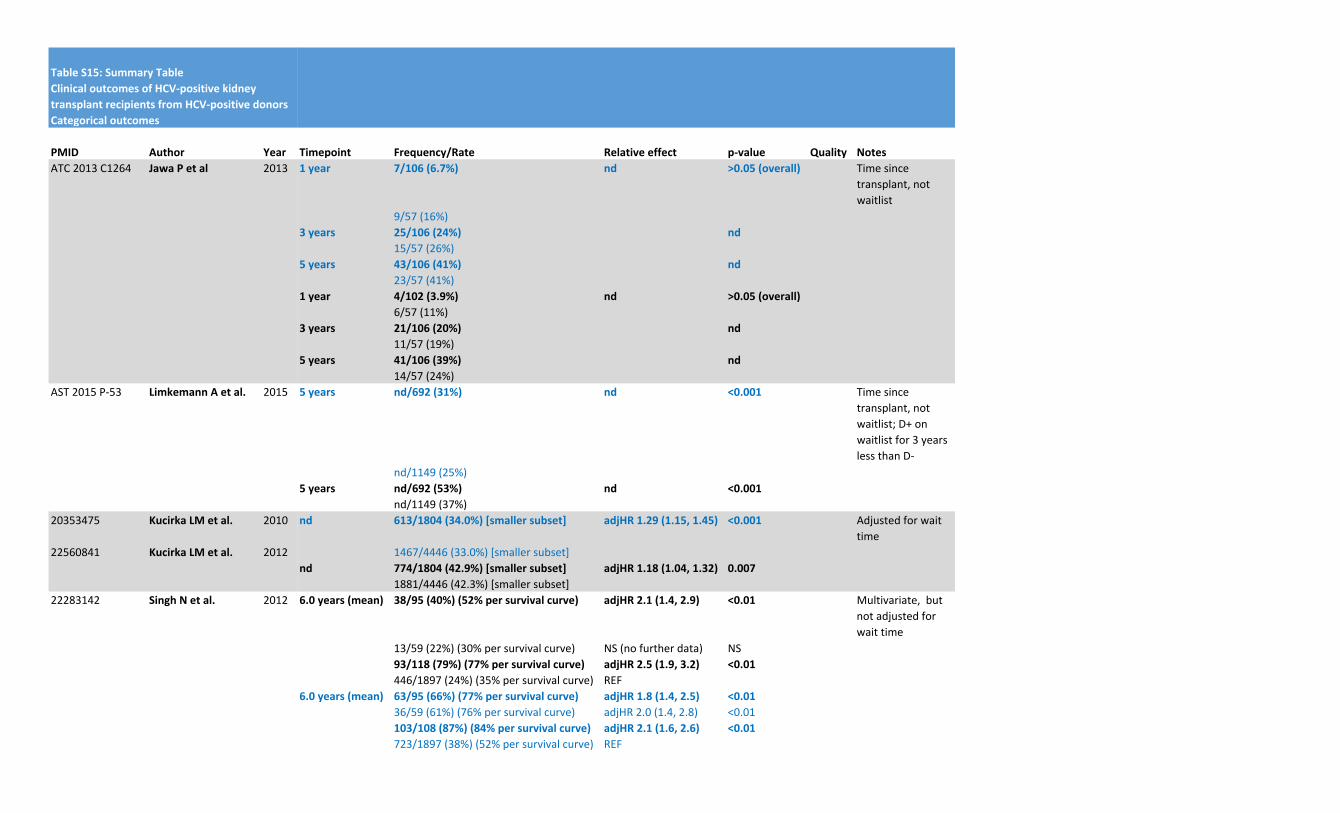
TableS15:SummaryTable
Categoricaloutcomes
PMID Author Year
ATC2013C1264 JawaPetal 2013
AST2015P-53 LimkemannAetal. 2015
20353475 KucirkaLMetal. 2010
22560841 KucirkaLMetal. 2012
22283142 SinghNetal. 2012
ClinicaloutcomesofHCV-positivekidney
transplantrecipientsfromHCV-positivedonors
Timepoint Frequency/Rate Relativeeffect p-value Quality Notes
1year 7/106(6.7%) nd >0.05(overall) Timesincetransplant,notwaitlist
9/57(16%)3years 25/106(24%) nd
15/57(26%)5years 43/106(41%) nd
23/57(41%)1year 4/102(3.9%) nd >0.05(overall)
6/57(11%)3years 21/106(20%) nd
11/57(19%)5years 41/106(39%) nd
14/57(24%)5years nd/692(31%) nd <0.001 Timesince
transplant,notwaitlist;D+onwaitlistfor3yearslessthanD-
nd/1149(25%)5years nd/692(53%) nd <0.001
nd/1149(37%)nd 613/1804(34.0%)[smallersubset] adjHR1.29(1.15,1.45) <0.001 Adjustedforwait
time1467/4446(33.0%)[smallersubset]
nd 774/1804(42.9%)[smallersubset] adjHR1.18(1.04,1.32) 0.007
1881/4446(42.3%)[smallersubset]6.0years(mean) 38/95(40%)(52%persurvivalcurve) adjHR2.1(1.4,2.9) <0.01 Multivariate,but
notadjustedforwaittime
13/59(22%)(30%persurvivalcurve) NS(nofurtherdata) NS93/118(79%)(77%persurvivalcurve) adjHR2.5(1.9,3.2) <0.01
446/1897(24%)(35%persurvivalcurve) REF6.0years(mean) 63/95(66%)(77%persurvivalcurve) adjHR1.8(1.4,2.5) <0.01
36/59(61%)(76%persurvivalcurve) adjHR2.0(1.4,2.8) <0.01103/108(87%)(84%persurvivalcurve) adjHR2.1(1.6,2.6) <0.01
723/1897(38%)(52%persurvivalcurve) REF
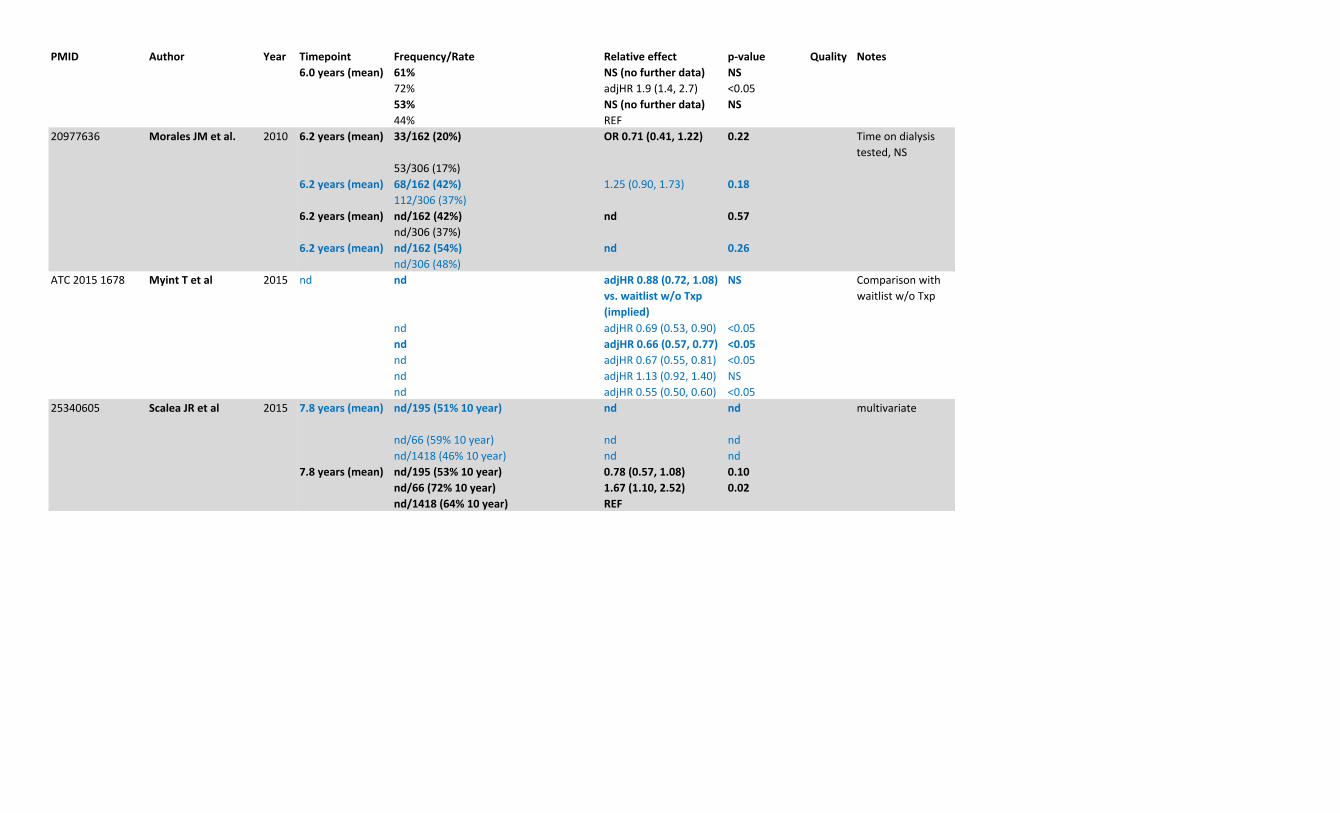
PMID Author Year
20977636 MoralesJMetal. 2010
ATC20151678 MyintTetal 2015
25340605 ScaleaJRetal 2015
Timepoint Frequency/Rate Relativeeffect p-value Quality Notes
6.0years(mean) 61% NS(nofurtherdata) NS
72% adjHR1.9(1.4,2.7) <0.0553% NS(nofurtherdata) NS
44% REF6.2years(mean) 33/162(20%) OR0.71(0.41,1.22) 0.22 Timeondialysis
tested,NS53/306(17%)
6.2years(mean) 68/162(42%) 1.25(0.90,1.73) 0.18
112/306(37%)6.2years(mean) nd/162(42%) nd 0.57
nd/306(37%)6.2years(mean) nd/162(54%) nd 0.26
nd/306(48%)nd nd adjHR0.88(0.72,1.08)
vs.waitlistw/oTxp
(implied)
NS Comparisonwithwaitlistw/oTxp
nd adjHR0.69(0.53,0.90) <0.05nd adjHR0.66(0.57,0.77) <0.05
nd adjHR0.67(0.55,0.81) <0.05nd adjHR1.13(0.92,1.40) NSnd adjHR0.55(0.50,0.60) <0.05
7.8years(mean) nd/195(51%10year) nd nd multivariate
nd/66(59%10year) nd ndnd/1418(46%10year) nd nd
7.8years(mean) nd/195(53%10year) 0.78(0.57,1.08) 0.10
nd/66(72%10year) 1.67(1.10,2.52) 0.02
nd/1418(64%10year) REF
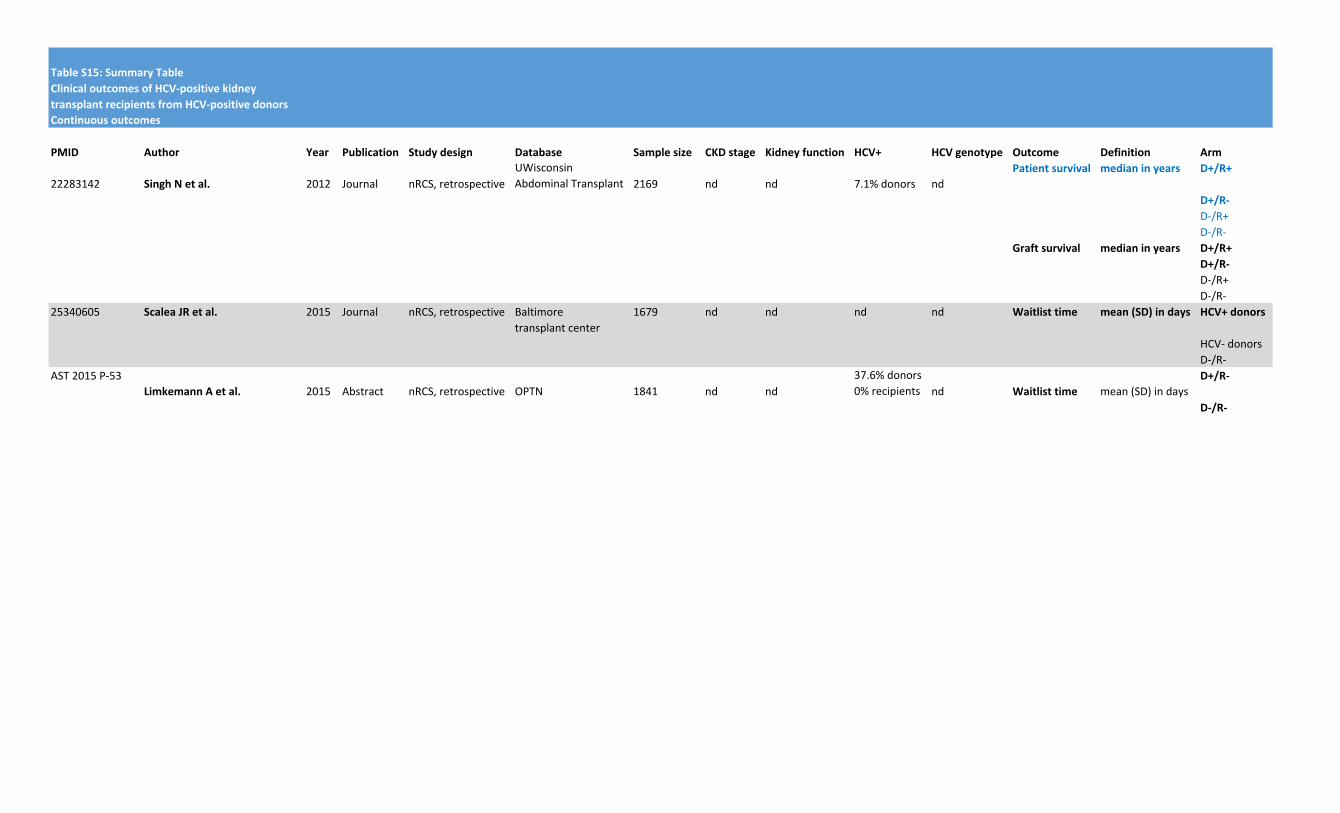
TableS15:SummaryTable
Continuousoutcomes
PMID Author Year Publication Studydesign Database Samplesize CKDstage Kidneyfunction HCV+ HCVgenotype Outcome Definition Arm
22283142 SinghNetal. 2012 Journal nRCS,retrospectiveUWisconsinAbdominalTransplant 2169 nd nd 7.1%donors nd
Patientsurvival medianinyears D+/R+
D+/R-
D-/R+D-/R-
Graftsurvival medianinyears D+/R+
D+/R-
D-/R+D-/R-
25340605 ScaleaJRetal. 2015 Journal nRCS,retrospective Baltimoretransplantcenter
1679 nd nd nd nd Waitlisttime mean(SD)indays HCV+donors
HCV-donorsD-/R-
AST2015P-53LimkemannAetal. 2015 Abstract nRCS,retrospective OPTN 1841 nd nd
37.6%donors0%recipients nd Waitlisttime mean(SD)indays
D+/R-
D-/R-
ClinicaloutcomesofHCV-positivekidney
transplantrecipientsfromHCV-positivedonors
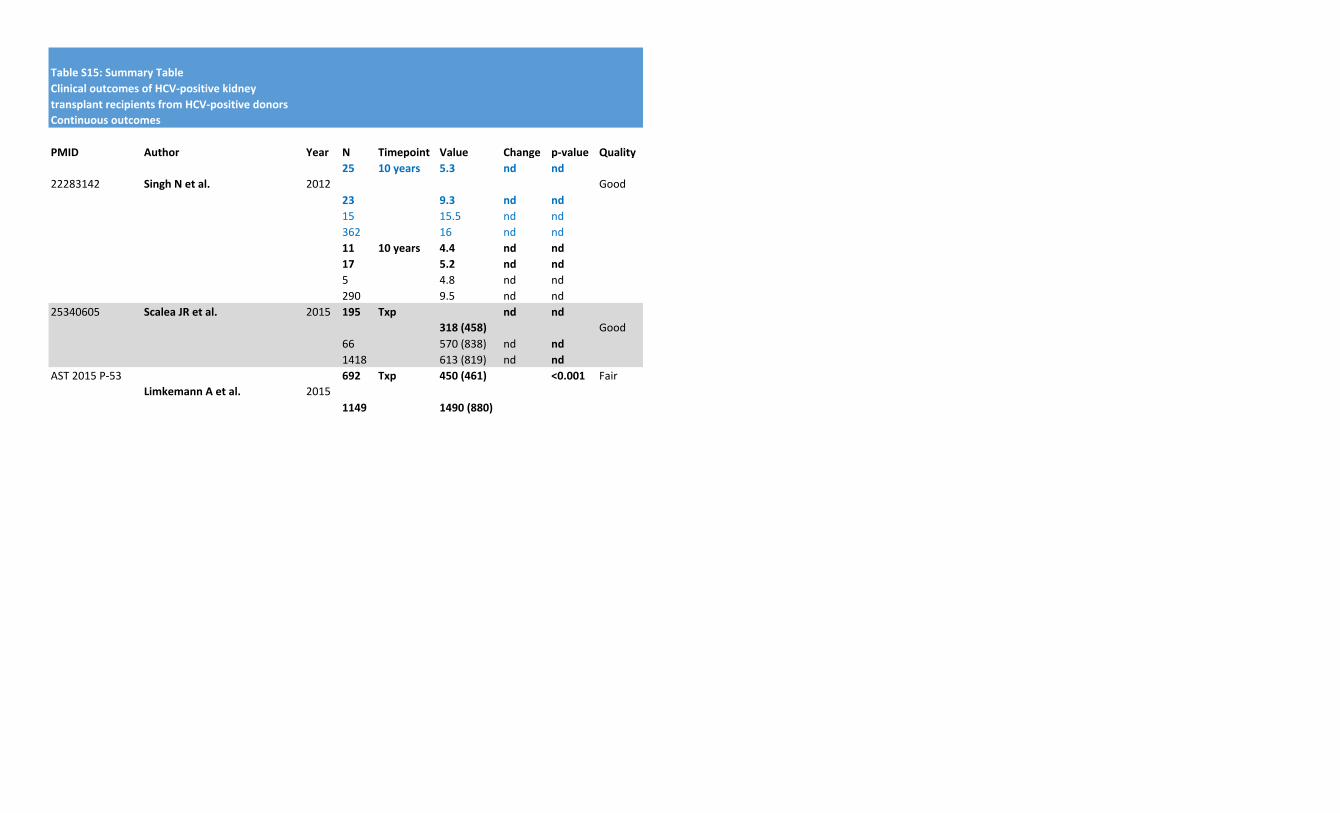
TableS15:SummaryTable
Continuousoutcomes
PMID Author Year
22283142 SinghNetal. 2012
25340605 ScaleaJRetal. 2015
AST2015P-53LimkemannAetal. 2015
ClinicaloutcomesofHCV-positivekidney
transplantrecipientsfromHCV-positivedonors
N Timepoint Value Change p-value Quality
25 10years 5.3 nd nd
Good23 9.3 nd nd
15 15.5 nd nd362 16 nd nd11 10years 4.4 nd nd
17 5.2 nd nd
5 4.8 nd nd290 9.5 nd nd195 Txp
318(458)
nd nd
Good66 570(838) nd nd
1418 613(819) nd nd
692 Txp 450(461) <0.001 Fair
1149 1490(880)
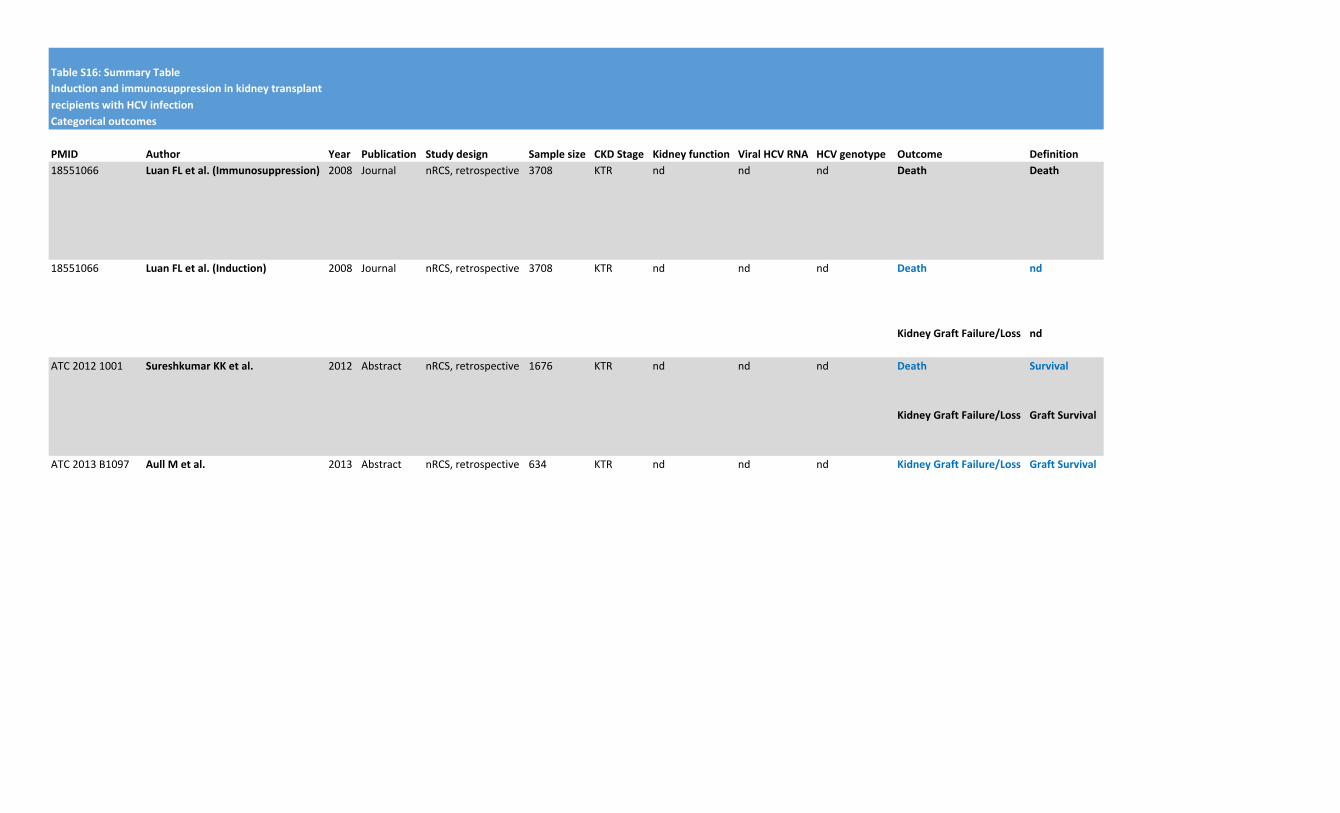
TableS16:SummaryTable
Categoricaloutcomes
PMID Author Year Publication Studydesign Samplesize CKDStage Kidneyfunction ViralHCVRNA HCVgenotype Outcome Definition18551066 LuanFLetal.(Immunosuppression) 2008 Journal nRCS,retrospective 3708 KTR nd nd nd Death Death
18551066 LuanFLetal.(Induction) 2008 Journal nRCS,retrospective 3708 KTR nd nd nd Death nd
KidneyGraftFailure/Loss nd
ATC20121001 SureshkumarKKetal. 2012 Abstract nRCS,retrospective 1676 KTR nd nd nd Death Survival
KidneyGraftFailure/Loss GraftSurvival
ATC2013B1097 AullMetal. 2013 Abstract nRCS,retrospective 634 KTR nd nd nd KidneyGraftFailure/Loss GraftSurvival
InductionandimmunosuppressioninkidneytransplantrecipientswithHCVinfection
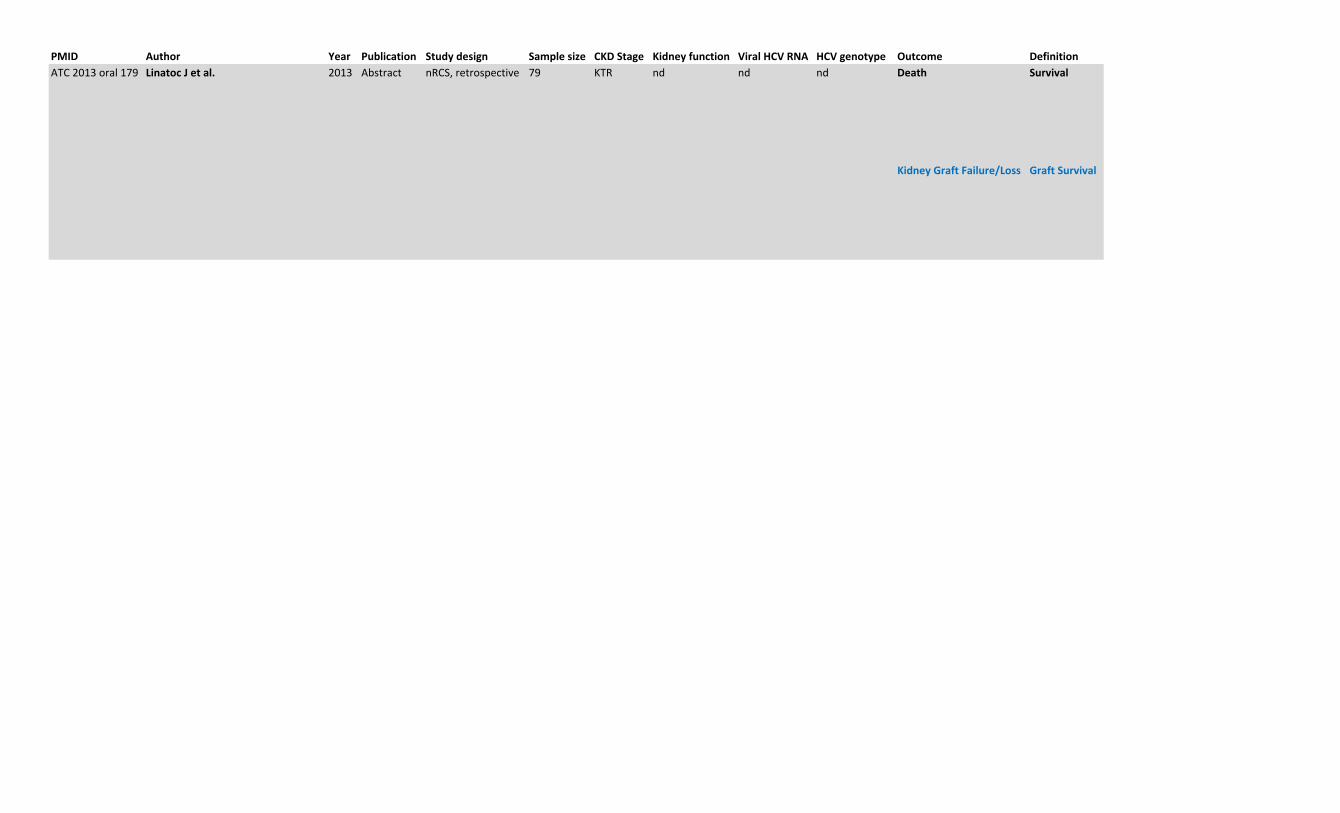
PMID Author Year Publication Studydesign Samplesize CKDStage Kidneyfunction ViralHCVRNA HCVgenotype Outcome DefinitionATC2013oral179 LinatocJetal. 2013 Abstract nRCS,retrospective 79 KTR nd nd nd Death Survival
KidneyGraftFailure/Loss GraftSurvival
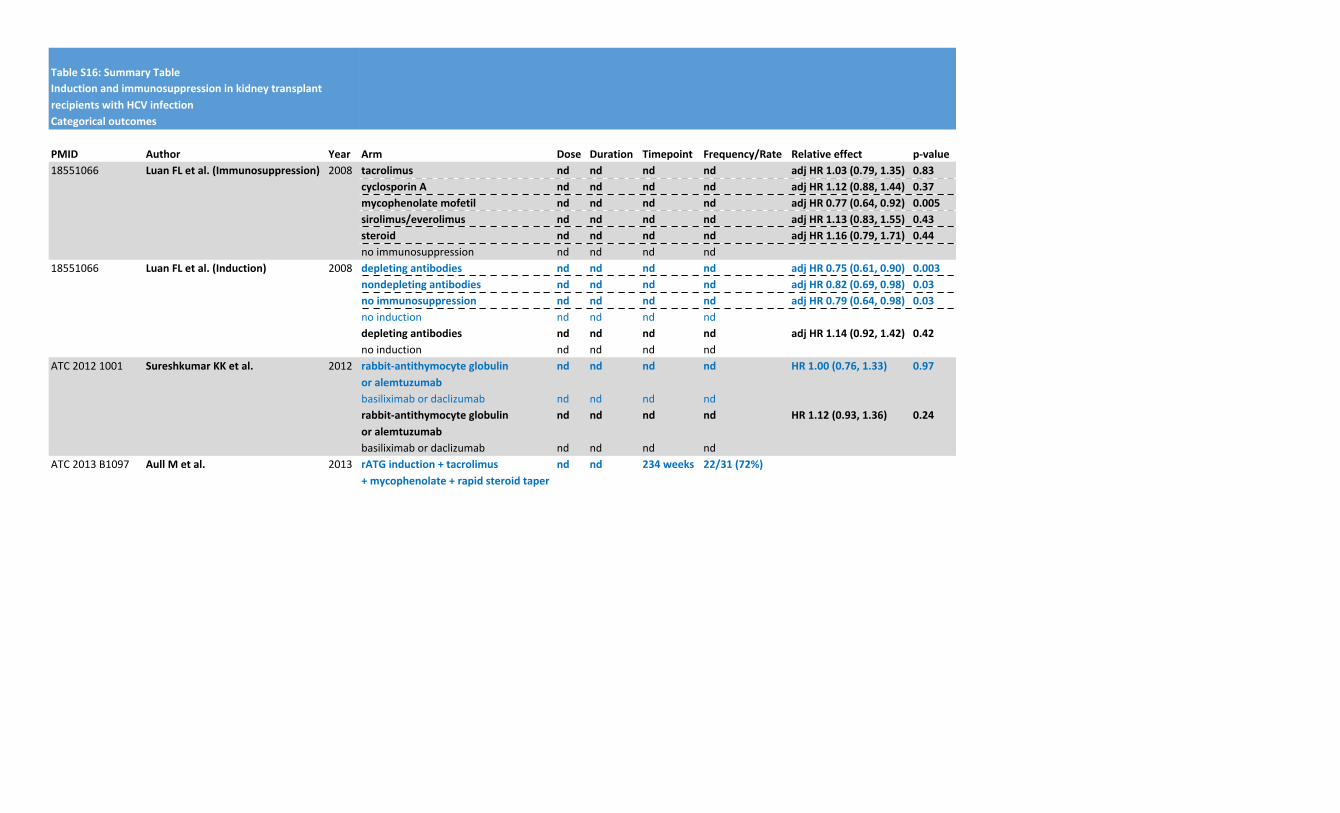
TableS16:SummaryTable
Categoricaloutcomes
PMID Author Year18551066 LuanFLetal.(Immunosuppression) 2008
18551066 LuanFLetal.(Induction) 2008
ATC20121001 SureshkumarKKetal. 2012
ATC2013B1097 AullMetal. 2013
InductionandimmunosuppressioninkidneytransplantrecipientswithHCVinfection
Arm Dose Duration Timepoint Frequency/Rate Relativeeffect p-valuetacrolimus nd nd nd nd adjHR1.03(0.79,1.35) 0.83cyclosporinA nd nd nd nd adjHR1.12(0.88,1.44) 0.37mycophenolatemofetil nd nd nd nd adjHR0.77(0.64,0.92) 0.005sirolimus/everolimus nd nd nd nd adjHR1.13(0.83,1.55) 0.43steroid nd nd nd nd adjHR1.16(0.79,1.71) 0.44noimmunosuppression nd nd nd nddepletingantibodies nd nd nd nd adjHR0.75(0.61,0.90) 0.003nondepletingantibodies nd nd nd nd adjHR0.82(0.69,0.98) 0.03noimmunosuppression nd nd nd nd adjHR0.79(0.64,0.98) 0.03noinduction nd nd nd nddepletingantibodies nd nd nd nd adjHR1.14(0.92,1.42) 0.42noinduction nd nd nd ndrabbit-antithymocyteglobulinoralemtuzumab
nd nd nd nd HR1.00(0.76,1.33) 0.97
basiliximabordaclizumab nd nd nd ndrabbit-antithymocyteglobulinoralemtuzumab
nd nd nd nd HR1.12(0.93,1.36) 0.24
basiliximabordaclizumab nd nd nd ndrATGinduction+tacrolimus+mycophenolate+rapidsteroidtaper
nd nd 234weeks 22/31(72%)
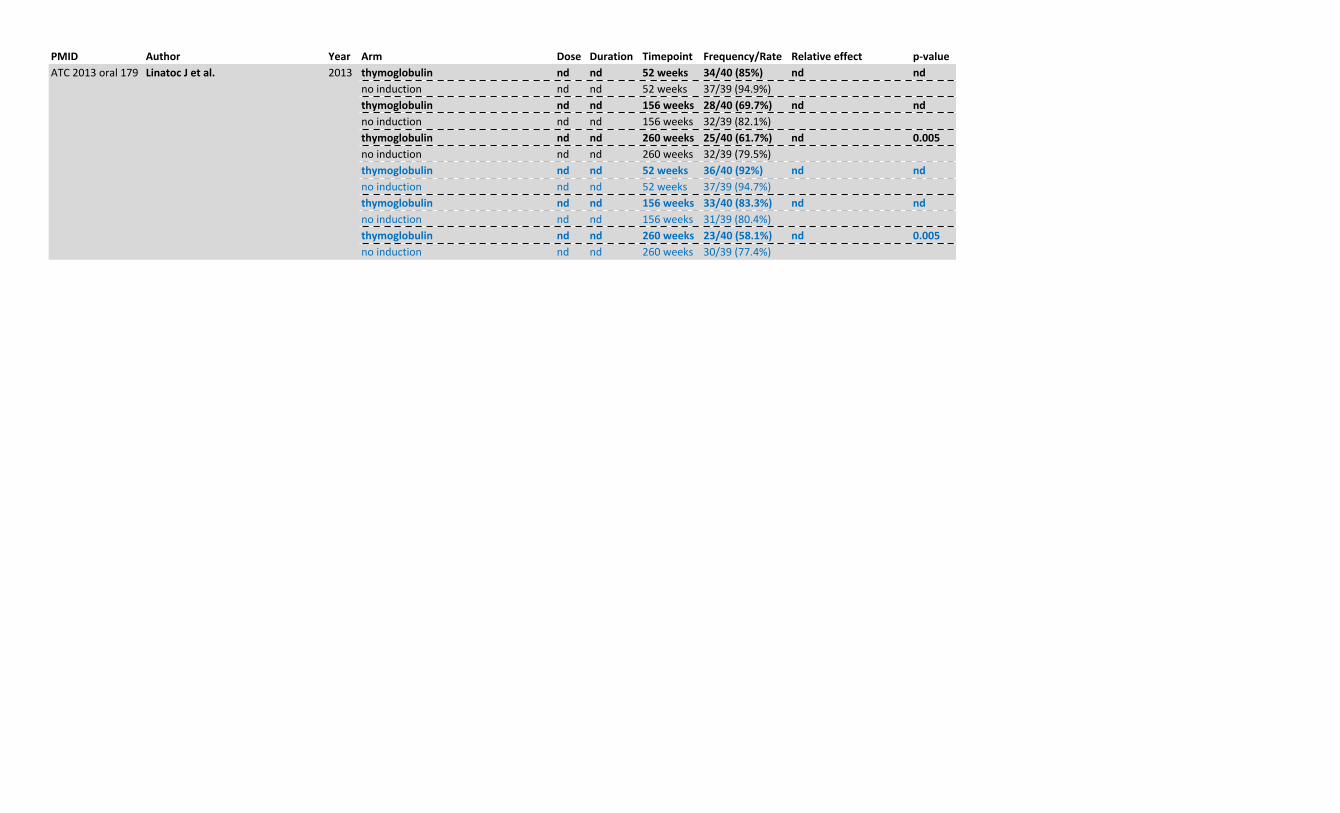
PMID Author YearATC2013oral179 LinatocJetal. 2013
Arm Dose Duration Timepoint Frequency/Rate Relativeeffect p-valuethymoglobulin nd nd 52weeks 34/40(85%) nd ndnoinduction nd nd 52weeks 37/39(94.9%)thymoglobulin nd nd 156weeks 28/40(69.7%) nd ndnoinduction nd nd 156weeks 32/39(82.1%)thymoglobulin nd nd 260weeks 25/40(61.7%) nd 0.005noinduction nd nd 260weeks 32/39(79.5%)thymoglobulin nd nd 52weeks 36/40(92%) nd ndnoinduction nd nd 52weeks 37/39(94.7%)thymoglobulin nd nd 156weeks 33/40(83.3%) nd ndnoinduction nd nd 156weeks 31/39(80.4%)thymoglobulin nd nd 260weeks 23/40(58.1%) nd 0.005noinduction nd nd 260weeks 30/39(77.4%)
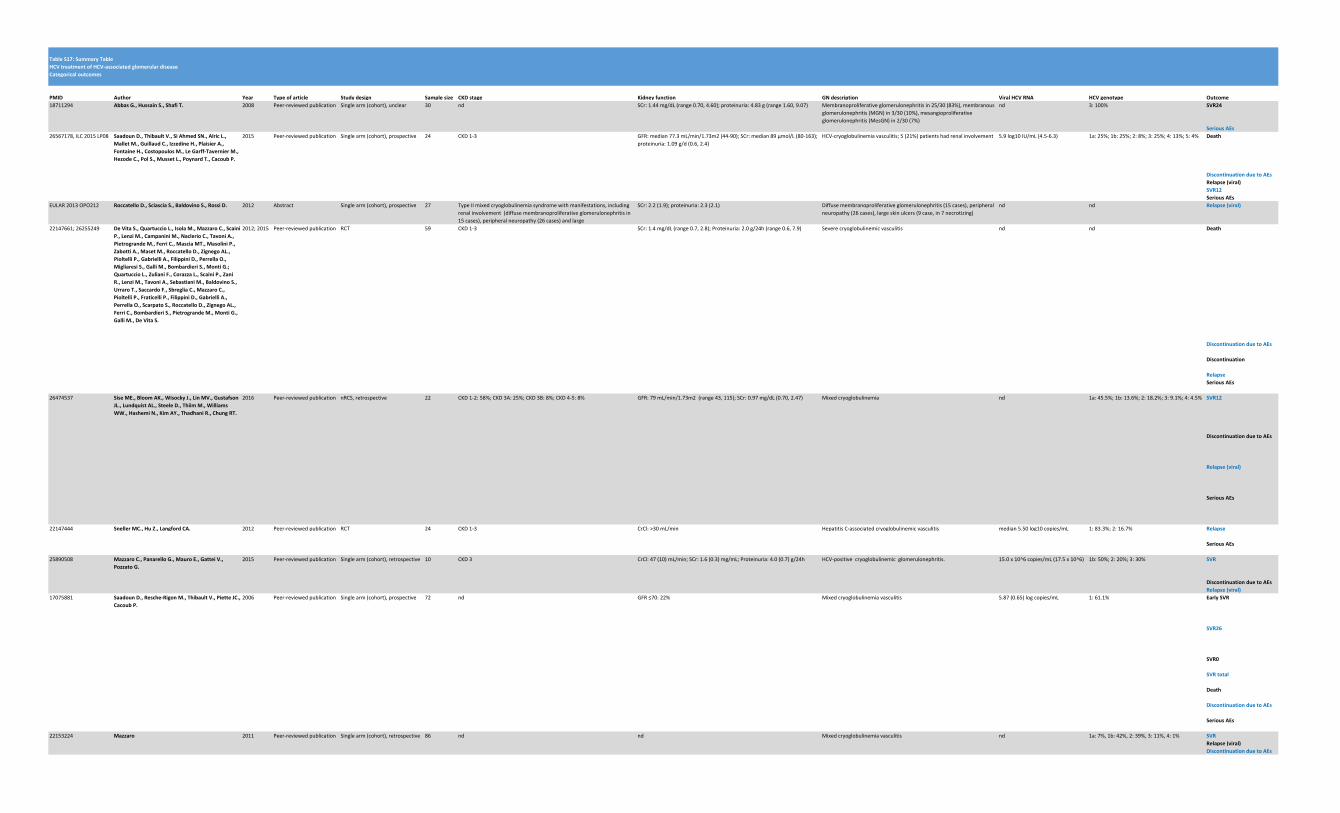
TableS17:SummaryTableHCVtreatmentofHCV-associatedglomerulardiseaseCategoricaloutcomes
PMID Author Year Typeofarticle Studydesign Samplesize CKDstage Kidneyfunction GNdescription ViralHCVRNA HCVgenotype Outcome18711294 AbbasG.,HussainS.,ShafiT. 2008 Peer-reviewedpublication Singlearm(cohort),unclear 30 nd SCr:1.44mg/dL(range0.70,4.60);proteinuria:4.83g(range1.60,9.07) Membranoproliferativeglomerulonephritisin25/30(83%),membranous
glomerulonephritis(MGN)in3/30(10%),mesangioproliferativeglomerulonephritis(MesGN)in2/30(7%)
nd 3:100% SVR24
SeriousAEs26567178,ILC2015LP08 SaadounD.,ThibaultV.,SiAhmedSN.,AlricL.,
MalletM.,GuillaudC.,IzzedineH.,PlaisierA.,FontaineH.,CostopoulosM.,LeGarff-TavernierM.,HezodeC.,PolS.,MussetL.,PoynardT.,CacoubP.
2015 Peer-reviewedpublication Singlearm(cohort),prospective 24 CKD1-3 GFR:median77.3mL/min/1.73m2(44-90);SCr:median89µmol/L(80-163);proteinuria:1.09g/d(0.6,2.4)
HCV-cryoglobulinemiavasculitis;5(21%)patientshadrenalinvolvement 5.9log10IU/mL(4.5-6.3) 1a:25%;1b:25%;2:8%;3:25%;4:13%;5:4% Death
DiscontinuationduetoAEsRelapse(viral)SVR12SeriousAEs
EULAR2013OPO212 RoccatelloD.,SciasciaS.,BaldovinoS.,RossiD. 2012 Abstract Singlearm(cohort),prospective 27 TypeIImixedcryoglobulinemiasyndromewithmanifestations,includingrenalinvolvement(diffusemembranoproliferativeglomerulonephritisin15cases),peripheralneuropathy(26cases)andlarge
SCr:2.2(1.9);proteinuria:2.3(2.1) Diffusemembranoproliferativeglomerulonephritis(15cases),peripheralneuropathy(26cases),largeskinulcers(9case,in7necrotizing)
nd nd Relapse(viral)
22147661;26255249 DeVitaS.,QuartuccioL.,IsolaM.,MazzaroC.,ScainiP.,LenziM.,CampaniniM.,NaclerioC.,TavoniA.,PietrograndeM.,FerriC.,MasciaMT.,MasoliniP.,ZabottiA.,MasetM.,RoccatelloD.,ZignegoAL.,PioltelliP.,GabrielliA.,FilippiniD.,PerrellaO.,MigliaresiS.,GalliM.,BombardieriS.,MontiG.;QuartuccioL.,ZulianiF.,CorazzaL.,ScainiP.,ZaniR.,LenziM.,TavoniA.,SebastianiM.,BaldovinoS.,UrraroT.,SaccardoF.,SbregliaC.,MazzaroC.,PioltelliP.,FraticelliP.,FilippiniD.,GabrielliA.,PerrellaO.,ScarpatoS.,RoccatelloD.,ZignegoAL.,FerriC.,BombardieriS.,PietrograndeM.,MontiG.,GalliM.,DeVitaS.
2012;2015 Peer-reviewedpublication RCT 59 CKD1-3 SCr:1.4mg/dL(range0.7,2.8);Proteinuria:2.0g/24h(range0.6,7.9) Severecryoglobulinemicvasculitis nd nd Death
DiscontinuationduetoAEs
Discontinuation
RelapseSeriousAEs
26474537 SiseME.,BloomAK.,WisockyJ.,LinMV.,GustafsonJL.,LundquistAL.,SteeleD.,ThiimM.,WilliamsWW.,HashemiN.,KimAY.,ThadhaniR.,ChungRT.
2016 Peer-reviewedpublication nRCS,retrospective 22 CKD1-2:58%;CKD3A:25%;CKD3B:8%;CKD4-5:8% GFR:79mL/min/1.73m2(range43,115);SCr:0.97mg/dL(0.70,2.47) Mixedcryoglobulinemia nd 1a:45.5%;1b:13.6%;2:18.2%;3:9.1%;4:4.5% SVR12
DiscontinuationduetoAEs
Relapse(viral)
SeriousAEs
22147444 SnellerMC.,HuZ.,LangfordCA. 2012 Peer-reviewedpublication RCT 24 CKD1-3 CrCl:>30mL/min HepatitisC-associatedcryoglobulinemicvasculitis median5.50log10copies/mL 1:83.3%;2:16.7% Relapse
SeriousAEs
25890508 MazzaroC.,PanarelloG.,MauroE.,GatteiV.,PozzatoG.
2015 Peer-reviewedpublication Singlearm(cohort),retrospective 10 CKD3 CrCl:47(10)mL/min;SCr:1.6(0.3)mg/mL;Proteinuria:4.0(0.7)g/24h HCV-positivecryoglobulinemicglomerulonephritis. 15.0x10^6copies/mL(17.5x10^6) 1b:50%;2:20%;3:30% SVR
DiscontinuationduetoAEsRelapse(viral)
17075881 SaadounD.,Resche-RigonM.,ThibaultV.,PietteJC.,CacoubP.
2006 Peer-reviewedpublication Singlearm(cohort),prospective 72 nd GFR≤70:22% Mixedcryoglobulinemiavasculitis 5.87(0.65)logcopies/mL 1:61.1% EarlySVR
SVR26
SVR0
SVRtotal
Death
DiscontinuationduetoAEs
SeriousAEs
22153224 Mazzaro 2011 Peer-reviewedpublication Singlearm(cohort),retrospective 86 nd nd Mixedcryoglobulinemiavasculitis nd 1a:7%,1b:42%,2:39%,3:11%,4:1% SVRRelapse(viral)DiscontinuationduetoAEs
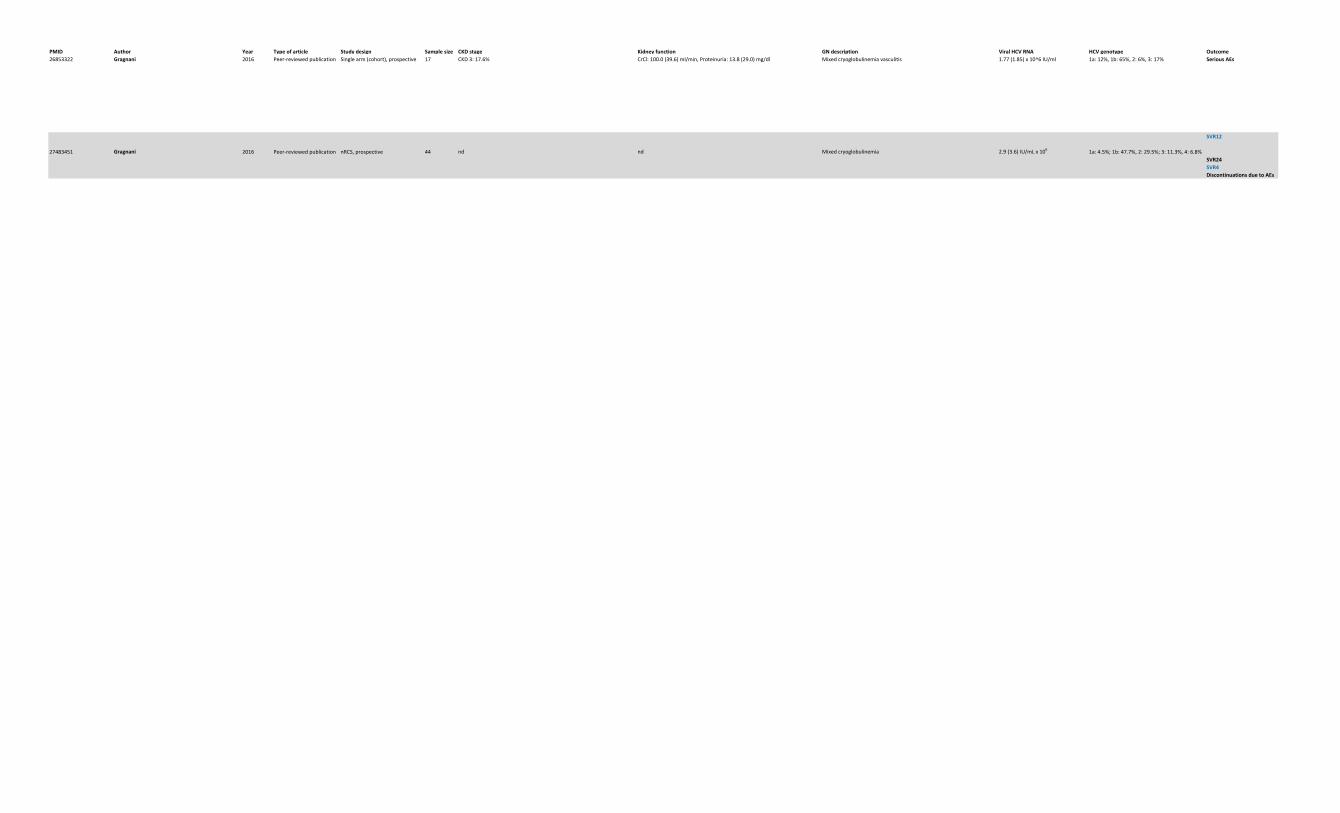
PMID Author Year Typeofarticle Studydesign Samplesize CKDstage Kidneyfunction GNdescription ViralHCVRNA HCVgenotype Outcome26853322 Gragnani 2016 Peer-reviewedpublication Singlearm(cohort),prospective 17 CKD3:17.6% CrCl:100.0(39.6)ml/min,Proteinuria:13.8(29.0)mg/dl Mixedcryoglobulinemiavasculitis 1.77(1.85)x10^6IU/ml 1a:12%,1b:65%,2:6%,3:17% SeriousAEs
27483451 Gragnani 2016 Peer-reviewedpublication nRCS,prospective 44 nd nd Mixedcryoglobulinemia 2.9(3.6)IU/mLx106 1a:4.5%;1b:47.7%,2:29.5%;3:11.3%,4:6.8%
SVR12
SVR24SVR4DiscontinuationsduetoAEs
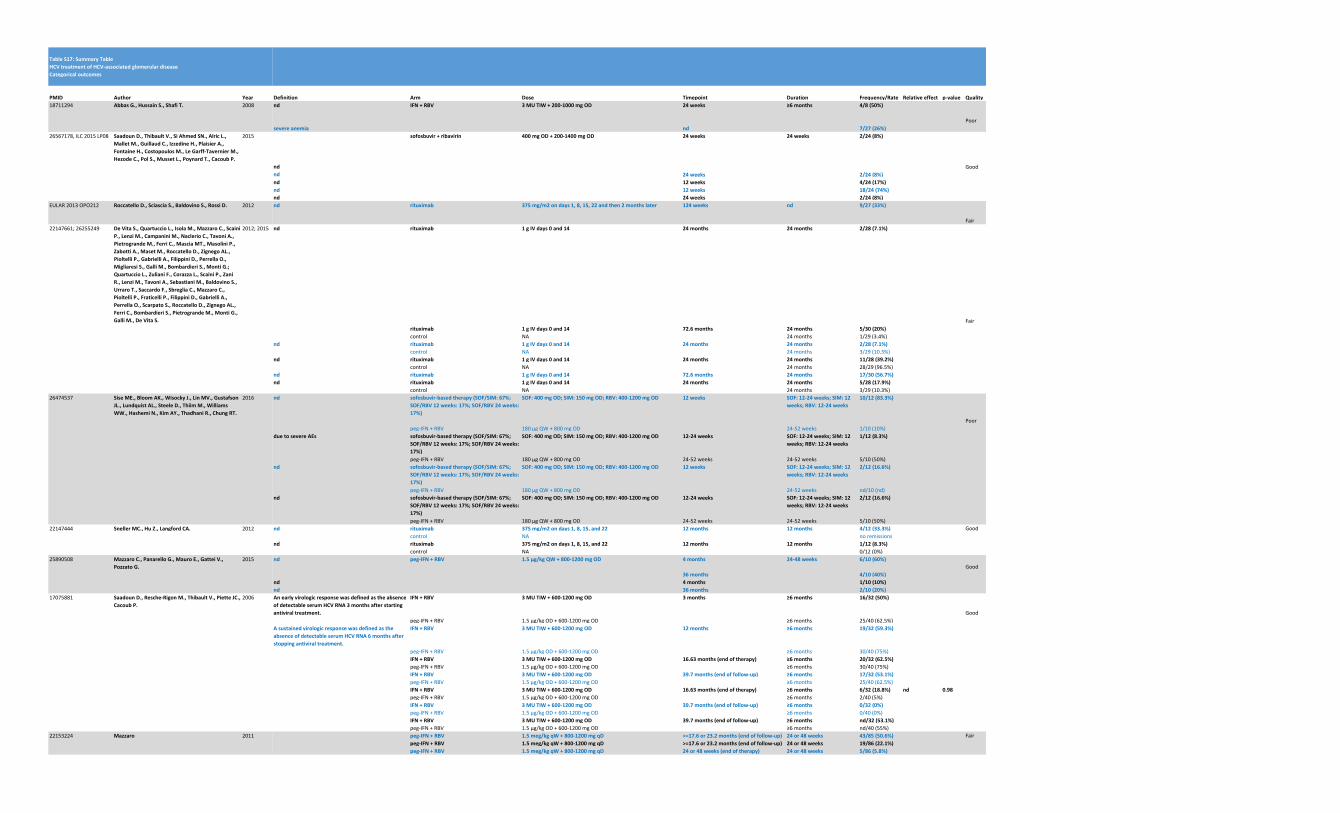
TableS17:SummaryTableHCVtreatmentofHCV-associatedglomerulardiseaseCategoricaloutcomes
PMID Author Year18711294 AbbasG.,HussainS.,ShafiT. 2008
26567178,ILC2015LP08 SaadounD.,ThibaultV.,SiAhmedSN.,AlricL.,MalletM.,GuillaudC.,IzzedineH.,PlaisierA.,FontaineH.,CostopoulosM.,LeGarff-TavernierM.,HezodeC.,PolS.,MussetL.,PoynardT.,CacoubP.
2015
EULAR2013OPO212 RoccatelloD.,SciasciaS.,BaldovinoS.,RossiD. 2012
22147661;26255249 DeVitaS.,QuartuccioL.,IsolaM.,MazzaroC.,ScainiP.,LenziM.,CampaniniM.,NaclerioC.,TavoniA.,PietrograndeM.,FerriC.,MasciaMT.,MasoliniP.,ZabottiA.,MasetM.,RoccatelloD.,ZignegoAL.,PioltelliP.,GabrielliA.,FilippiniD.,PerrellaO.,MigliaresiS.,GalliM.,BombardieriS.,MontiG.;QuartuccioL.,ZulianiF.,CorazzaL.,ScainiP.,ZaniR.,LenziM.,TavoniA.,SebastianiM.,BaldovinoS.,UrraroT.,SaccardoF.,SbregliaC.,MazzaroC.,PioltelliP.,FraticelliP.,FilippiniD.,GabrielliA.,PerrellaO.,ScarpatoS.,RoccatelloD.,ZignegoAL.,FerriC.,BombardieriS.,PietrograndeM.,MontiG.,GalliM.,DeVitaS.
2012;2015
26474537 SiseME.,BloomAK.,WisockyJ.,LinMV.,GustafsonJL.,LundquistAL.,SteeleD.,ThiimM.,WilliamsWW.,HashemiN.,KimAY.,ThadhaniR.,ChungRT.
2016
22147444 SnellerMC.,HuZ.,LangfordCA. 2012
25890508 MazzaroC.,PanarelloG.,MauroE.,GatteiV.,PozzatoG.
2015
17075881 SaadounD.,Resche-RigonM.,ThibaultV.,PietteJC.,CacoubP.
2006
22153224 Mazzaro 2011
Definition Arm Dose Timepoint Duration Frequency/Rate Relativeeffect p-value Qualitynd IFN+RBV 3MUTIW+200-1000mgOD 24weeks ≥6months 4/8(50%)
Poorsevereanemia nd 7/27(26%)
nd
sofosbuvir+ribavirin 400mgOD+200-1400mgOD 24weeks 24weeks 2/24(8%)
Goodnd 24weeks 2/24(8%)nd 12weeks 4/24(17%)nd 12weeks 18/24(74%)nd 24weeks 2/24(8%)nd rituximab 375mg/m2ondays1,8,15,22andthen2monthslater 124weeks nd 9/27(33%)
Fairnd rituximab 1gIVdays0and14 24months 24months 2/28(7.1%)
Fairrituximab 1gIVdays0and14 72.6months 24months 5/30(20%)control NA 24months 1/29(3.4%)
nd rituximab 1gIVdays0and14 24months 24months 2/28(7.1%)control NA 24months 3/29(10.3%)
nd rituximab 1gIVdays0and14 24months 24months 11/28(39.2%)control NA 24months 28/29(96.5%)
nd rituximab 1gIVdays0and14 72.6months 24months 17/30(56.7%)nd rituximab 1gIVdays0and14 24months 24months 5/28(17.9%)
control NA 24months 3/29(10.3%)nd sofosbuvir-basedtherapy(SOF/SIM:67%;
SOF/RBV12weeks:17%;SOF/RBV24weeks:17%)
SOF:400mgOD;SIM:150mgOD;RBV:400-1200mgOD 12weeks SOF:12-24weeks;SIM:12weeks;RBV:12-24weeks
10/12(83.3%)
Poorpeg-IFN+RBV 180µgQW+800mgOD 24-52weeks 1/10(10%)
duetosevereAEs sofosbuvir-basedtherapy(SOF/SIM:67%;SOF/RBV12weeks:17%;SOF/RBV24weeks:17%)
SOF:400mgOD;SIM:150mgOD;RBV:400-1200mgOD 12-24weeks SOF:12-24weeks;SIM:12weeks;RBV:12-24weeks
1/12(8.3%)
peg-IFN+RBV 180µgQW+800mgOD 24-52weeks 24-52weeks 5/10(50%)nd sofosbuvir-basedtherapy(SOF/SIM:67%;
SOF/RBV12weeks:17%;SOF/RBV24weeks:17%)
SOF:400mgOD;SIM:150mgOD;RBV:400-1200mgOD 12weeks SOF:12-24weeks;SIM:12weeks;RBV:12-24weeks
2/12(16.6%)
peg-IFN+RBV 180µgQW+800mgOD 24-52weeks nd/10(nd)nd sofosbuvir-basedtherapy(SOF/SIM:67%;
SOF/RBV12weeks:17%;SOF/RBV24weeks:17%)
SOF:400mgOD;SIM:150mgOD;RBV:400-1200mgOD 12-24weeks SOF:12-24weeks;SIM:12weeks;RBV:12-24weeks
2/12(16.6%)
peg-IFN+RBV 180µgQW+800mgOD 24-52weeks 24-52weeks 5/10(50%)nd rituximab 375mg/m2ondays1,8,15,and22 12months 12months 4/12(33.3%) Good
control NA noremissionsnd rituximab 375mg/m2ondays1,8,15,and22 12months 12months 1/12(8.3%)
control NA 0/12(0%)nd peg-IFN+RBV 1.5µg/kgQW+800-1200mgOD 4months 24-48weeks 6/10(60%)
Good36months 4/10(40%)
nd 4months 1/10(10%)nd 36months 2/10(20%)AnearlyvirologicresponsewasdefinedastheabsenceofdetectableserumHCVRNA3monthsafterstartingantiviraltreatment.
IFN+RBV 3MUTIW+600-1200mgOD 3months ≥6months 16/32(50%)
Goodpeg-IFN+RBV 1.5µg/kgOD+600-1200mgOD ≥6months 25/40(62.5%)
AsustainedvirologicresponsewasdefinedastheabsenceofdetectableserumHCVRNA6monthsafterstoppingantiviraltreatment.
IFN+RBV 3MUTIW+600-1200mgOD 12months ≥6months 19/32(59.3%)
peg-IFN+RBV 1.5µg/kgOD+600-1200mgOD ≥6months 30/40(75%)IFN+RBV 3MUTIW+600-1200mgOD 16.63months(endoftherapy) ≥6months 20/32(62.5%)peg-IFN+RBV 1.5µg/kgOD+600-1200mgOD ≥6months 30/40(75%)IFN+RBV 3MUTIW+600-1200mgOD 39.7months(endoffollow-up) ≥6months 17/32(53.1%)peg-IFN+RBV 1.5µg/kgOD+600-1200mgOD ≥6months 25/40(62.5%)IFN+RBV 3MUTIW+600-1200mgOD 16.63months(endoftherapy) ≥6months 6/32(18.8%) nd 0.98peg-IFN+RBV 1.5µg/kgOD+600-1200mgOD ≥6months 2/40(5%)IFN+RBV 3MUTIW+600-1200mgOD 39.7months(endoffollow-up) ≥6months 0/32(0%)peg-IFN+RBV 1.5µg/kgOD+600-1200mgOD ≥6months 0/40(0%)IFN+RBV 3MUTIW+600-1200mgOD 39.7months(endoffollow-up) ≥6months nd/32(53.1%)peg-IFN+RBV 1.5µg/kgOD+600-1200mgOD ≥6months nd/40(55%)peg-IFN+RBV 1.5meg/kgqW+800-1200mgqD >=17.6or23.2months(endoffollow-up) 24or48weeks 43/85(50.6%) Fairpeg-IFN+RBV 1.5meg/kgqW+800-1200mgqD >=17.6or23.2months(endoffollow-up) 24or48weeks 19/86(22.1%)peg-IFN+RBV 1.5meg/kgqW+800-1200mgqD 24or48weeks(endoftherapy) 24or48weeks 5/86(5.8%)
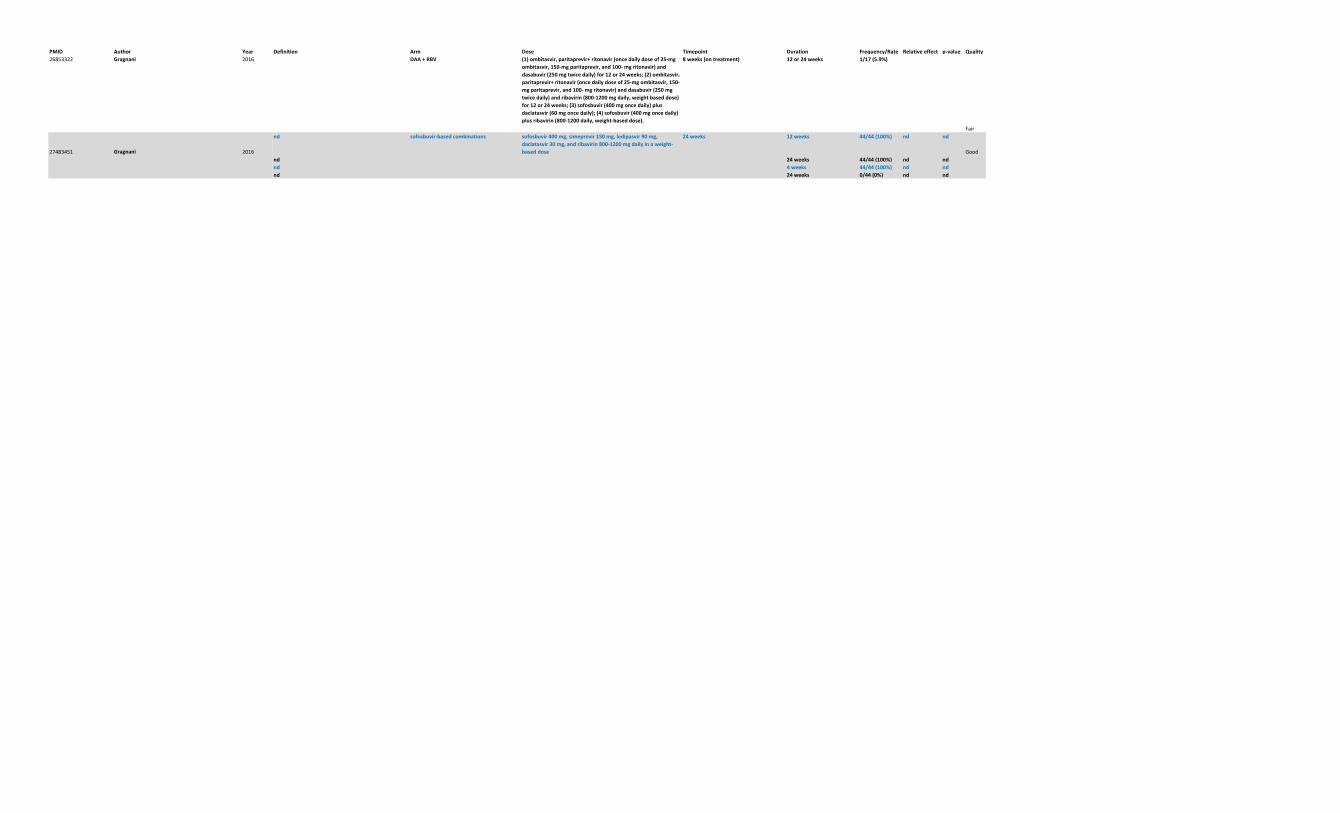
PMID Author Year26853322 Gragnani 2016
27483451 Gragnani 2016
Definition Arm Dose Timepoint Duration Frequency/Rate Relativeeffect p-value QualityDAA+RBV (1)ombitasvir,paritaprevir+ritonavir(oncedailydoseof25-mg
ombitasvir,150-mgparitaprevir,and100-mgritonavir)anddasabuvir(250mgtwicedaily)for12or24weeks;(2)ombitasvir,paritaprevir+ritonavir(oncedailydoseof25-mgombitasvir,150-mgparitaprevir,and100-mgritonavir)anddasabuvir(250mgtwicedaily)andribavirin(800-1200mgdaily,weightbaseddose)for12or24weeks;(3)sofosbuvir(400mgoncedaily)plusdaclatasvir(60mgoncedaily);(4)sofosbuvir(400mgoncedaily)plusribavirin(800-1200daily,weight-baseddose).
8weeks(ontreatment) 12or24weeks 1/17(5.9%)
Fairnd sofosbuvir-basedcombinations sofosbuvir400mg,simeprevir150mg,ledipasvir90mg,
daclatasvir30mg,andribavirin800-1200mgdailyinaweight-baseddose
24weeks 12weeks 44/44(100%) nd nd
Goodnd 24weeks 44/44(100%) nd ndnd 4weeks 44/44(100%) nd ndnd 24weeks 0/44(0%) nd nd
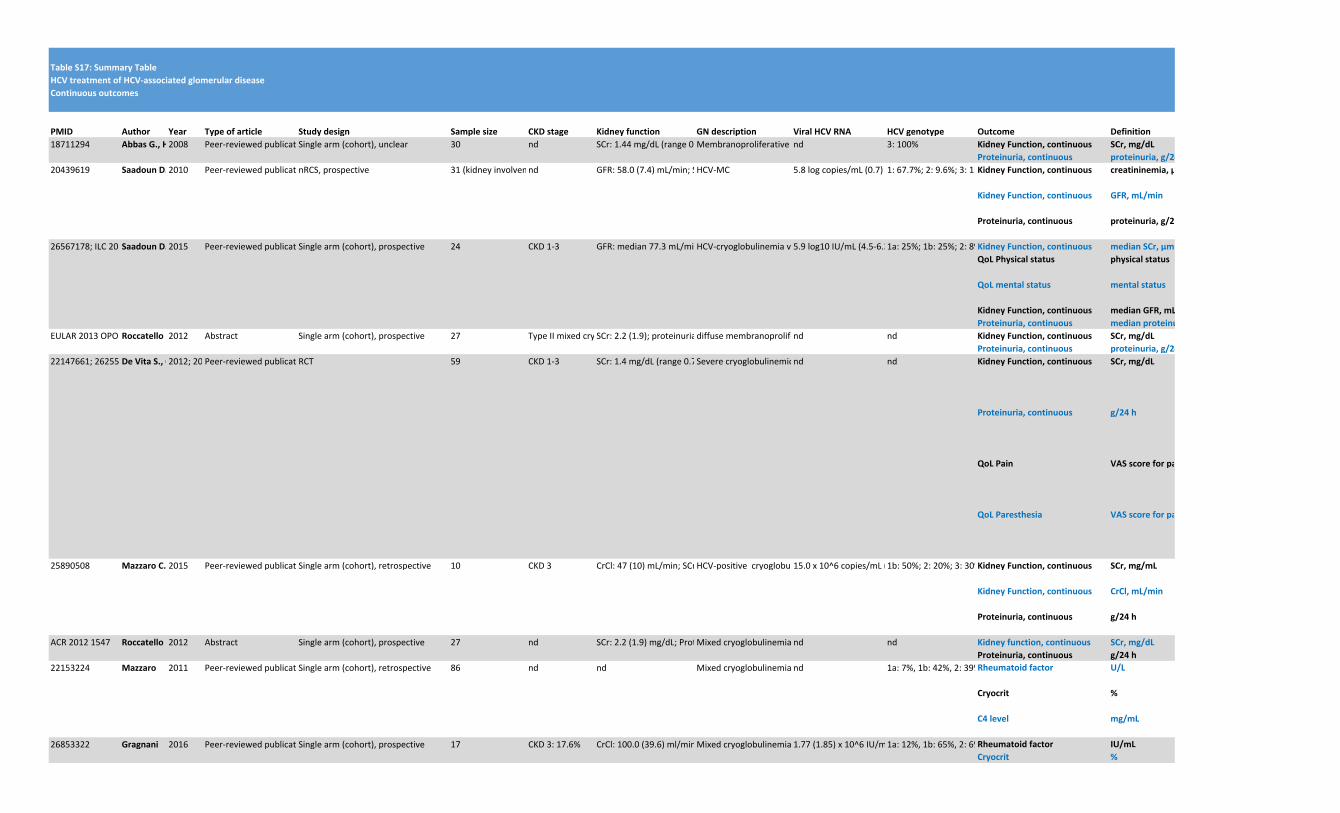
TableS17:SummaryTableHCVtreatmentofHCV-associatedglomerulardiseaseContinuousoutcomes
PMID Author Year Typeofarticle Studydesign Samplesize CKDstage Kidneyfunction GNdescription ViralHCVRNA HCVgenotype Outcome Definition18711294 AbbasG.,HussainS.,ShafiT.2008 Peer-reviewedpublicationSinglearm(cohort),unclear 30 nd SCr:1.44mg/dL(range0.70,4.60);proteinuria:4.83g(range1.60,9.07)Membranoproliferativeglomerulonephritisin25/30(83%),membranousglomerulonephritis(MGN)in3/30(10%),mesangioproliferativeglomerulonephritis(MesGN)in2/30(7%)nd 3:100% KidneyFunction,continuous SCr,mg/dL
Proteinuria,continuous proteinuria,g/24hours20439619 SaadounD.,RescheRigonM.,SeneD.,TerrierB.,KarrasA.,PerardL.,SchoindreY.,CoppéréB.,BlancF.,MussetL.,PietteJC.,RosenzwajgM.,CacoubP.2010 Peer-reviewedpublicationnRCS,prospective 31(kidneyinvolvement)/93(total)nd GFR:58.0(7.4)mL/min;SCr:150.0(30.6)µmol/L;proteinuria:3.1(0.9)gHCV-MC 5.8logcopies/mL(0.7)(total)1:67.7%;2:9.6%;3:11.8%;4:4.3%;5:6.4%KidneyFunction,continuous creatininemia,µmol/L
KidneyFunction,continuous GFR,mL/min
Proteinuria,continuous proteinuria,g/24hours
26567178;ILC2015LP08SaadounD.,ThibaultV.,SiAhmedSN.,AlricL.,MalletM.,GuillaudC.,IzzedineH.,PlaisierA.,FontaineH.,CostopoulosM.,LeGarff-TavernierM.,HezodeC.,PolS.,MussetL.,PoynardT.,CacoubP.2015 Peer-reviewedpublicationSinglearm(cohort),prospective 24 CKD1-3 GFR:median77.3mL/min/1.73m2(44-90);SCr:median89µmol/L(80-163);proteinuria:1.09g/d(0.6,2.4)HCV-cryoglobulinemiavasculitis;5(21%)patientshadrenalinvolvement5.9log10IU/mL(4.5-6.3)1a:25%;1b:25%;2:8%;3:25%;4:13%;5:4%KidneyFunction,continuous medianSCr,µmol/LQoLPhysicalstatus physicalstatus
QoLmentalstatus mentalstatus
KidneyFunction,continuous medianGFR,mL/min/1.73m2Proteinuria,continuous medianproteinuria,g/24hours
EULAR2013OPO212RoccatelloD.,SciasciaS.,BaldovinoS.,RossiD.2012 Abstract Singlearm(cohort),prospective 27 TypeIImixedcryoglobulinemiasyndromewithmanifestations,includingrenalinvolvement(diffusemembranoproliferativeglomerulonephritisin15cases),peripheralneuropathy(26cases)andlargeSCr:2.2(1.9);proteinuria:2.3(2.1)diffusemembranoproliferativeglomerulonephritis(15cases),peripheralneuropathy(26cases),largeskinulcers(9case,in7necrotizing)nd nd KidneyFunction,continuous SCr,mg/dLProteinuria,continuous proteinuria,g/24hours
22147661;26255249DeVitaS.,QuartuccioL.,IsolaM.,MazzaroC.,ScainiP.,LenziM.,CampaniniM.,NaclerioC.,TavoniA.,PietrograndeM.,FerriC.,MasciaMT.,MasoliniP.,ZabottiA.,MasetM.,RoccatelloD.,ZignegoAL.,PioltelliP.,GabrielliA.,FilippiniD.,PerrellaO.,MigliaresiS.,GalliM.,BombardieriS.,MontiG.;QuartuccioL.,ZulianiF.,CorazzaL.,ScainiP.,ZaniR.,LenziM.,TavoniA.,SebastianiM.,BaldovinoS.,UrraroT.,SaccardoF.,SbregliaC.,MazzaroC.,PioltelliP.,FraticelliP.,FilippiniD.,GabrielliA.,PerrellaO.,ScarpatoS.,RoccatelloD.,ZignegoAL.,FerriC.,BombardieriS.,PietrograndeM.,MontiG.,GalliM.,DeVitaS.2012;2015Peer-reviewedpublicationRCT 59 CKD1-3 SCr:1.4mg/dL(range0.7,2.8);Proteinuria:2.0g/24h(range0.6,7.9)Severecryoglobulinemicvasculitisnd nd KidneyFunction,continuous SCr,mg/dL
Proteinuria,continuous g/24h
QoLPain VASscoreforpain
QoLParesthesia VASscoreforparesthesias
25890508 MazzaroC.,PanarelloG.,MauroE.,GatteiV.,PozzatoG.2015 Peer-reviewedpublicationSinglearm(cohort),retrospective 10 CKD3 CrCl:47(10)mL/min;SCr:1.6(0.3)mg/mL;Proteinuria:4.0(0.7)g/24hHCV-positivecryoglobulinemicglomerulonephritis.15.0x10^6copies/mL(17.5x10^6)1b:50%;2:20%;3:30%KidneyFunction,continuous SCr,mg/mL
KidneyFunction,continuous CrCl,mL/min
Proteinuria,continuous g/24h
ACR20121547 RoccatelloD.,SciasciaS.,BaldovinoS.,RossiD.2012 Abstract Singlearm(cohort),prospective 27 nd SCr:2.2(1.9)mg/dL;Proteinuria:2.3(2.1)g/24hMixedcryoglobulinemiasyndromend nd Kidneyfunction,continuous SCr,mg/dLProteinuria,continuous g/24h
22153224 Mazzaro 2011 Peer-reviewedpublicationSinglearm(cohort),retrospective 86 nd nd Mixedcryoglobulinemiavasculitisnd 1a:7%,1b:42%,2:39%,3:11%,4:1%Rheumatoidfactor U/L
Cryocrit %
C4level mg/mL
26853322 Gragnani 2016 Peer-reviewedpublicationSinglearm(cohort),prospective 17 CKD3:17.6% CrCl:100.0(39.6)ml/min,Proteinuria:13.8(29.0)mg/dlMixedcryoglobulinemiavasculitis1.77(1.85)x10^6IU/ml1a:12%,1b:65%,2:6%,3:17%Rheumatoidfactor IU/mLCryocrit %
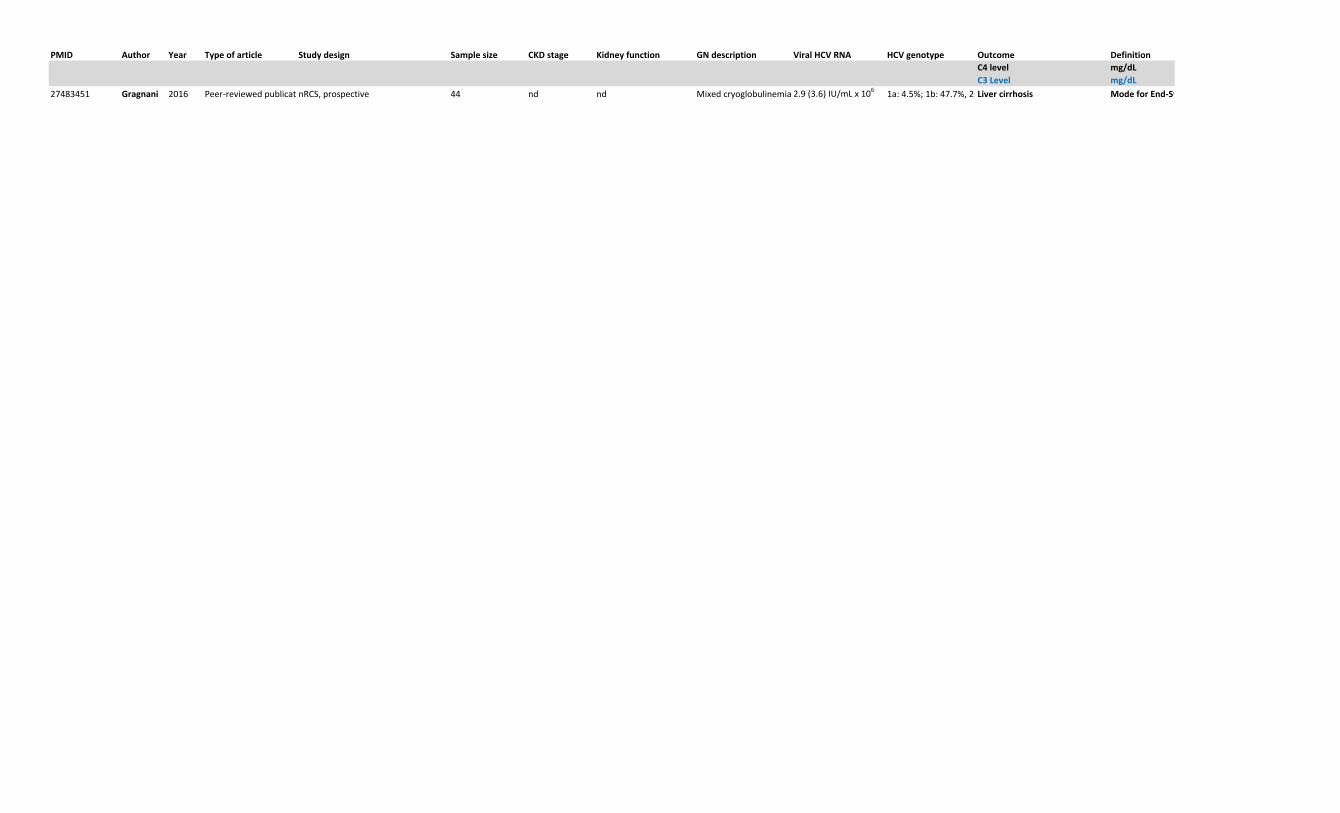
PMID Author Year Typeofarticle Studydesign Samplesize CKDstage Kidneyfunction GNdescription ViralHCVRNA HCVgenotype Outcome DefinitionC4level mg/dLC3Level mg/dL
27483451 Gragnani 2016 Peer-reviewedpublicationnRCS,prospective 44 nd nd Mixedcryoglobulinemia 2.9(3.6)IU/mLx106 1a:4.5%;1b:47.7%,2:29.5%;3:11.3%,4:6.8%Livercirrhosis ModeforEnd-StageLiverDiseasescore
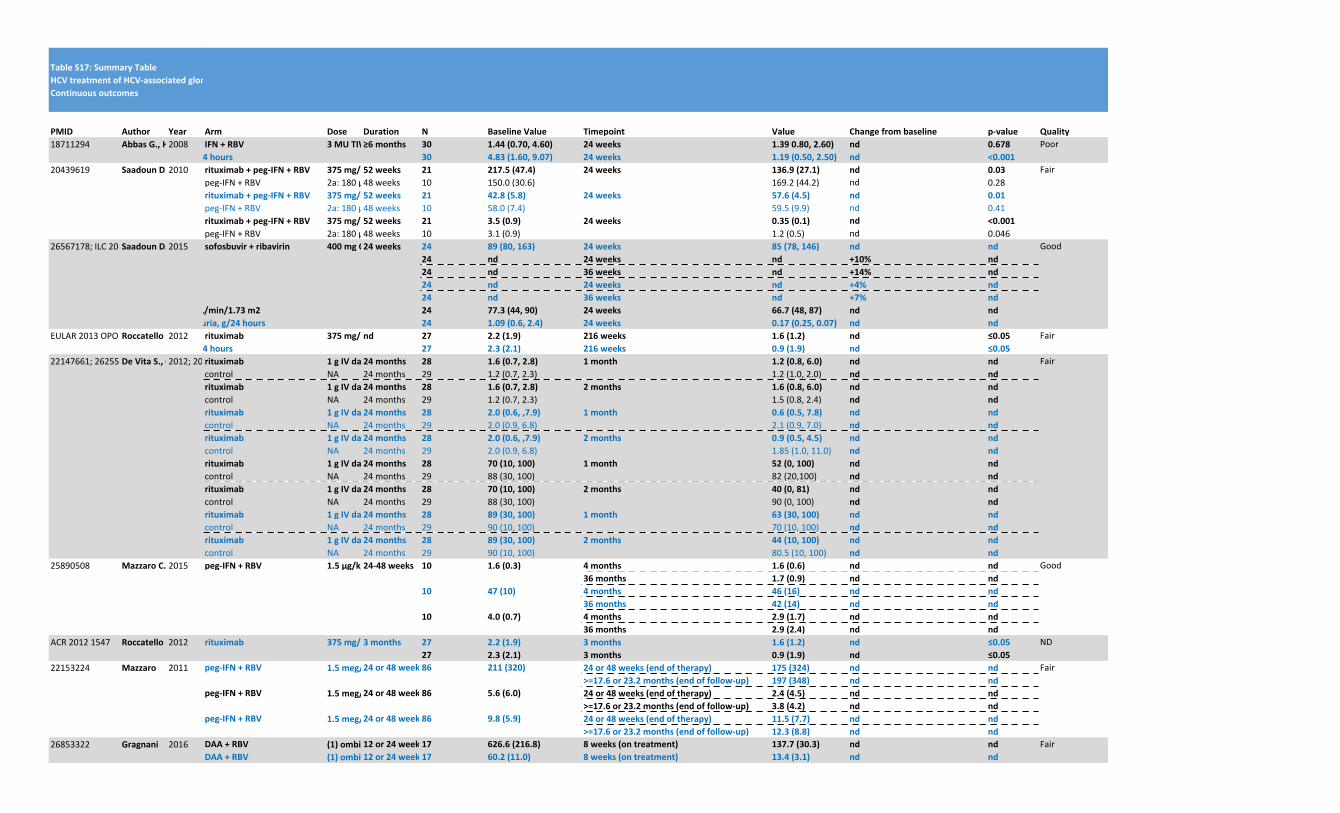
TableS17:SummaryTableHCVtreatmentofHCV-associatedglomerulardiseaseContinuousoutcomes
PMID Author Year18711294 AbbasG.,HussainS.,ShafiT.2008
20439619 SaadounD.,RescheRigonM.,SeneD.,TerrierB.,KarrasA.,PerardL.,SchoindreY.,CoppéréB.,BlancF.,MussetL.,PietteJC.,RosenzwajgM.,CacoubP.2010
26567178;ILC2015LP08SaadounD.,ThibaultV.,SiAhmedSN.,AlricL.,MalletM.,GuillaudC.,IzzedineH.,PlaisierA.,FontaineH.,CostopoulosM.,LeGarff-TavernierM.,HezodeC.,PolS.,MussetL.,PoynardT.,CacoubP.2015
EULAR2013OPO212RoccatelloD.,SciasciaS.,BaldovinoS.,RossiD.2012
22147661;26255249DeVitaS.,QuartuccioL.,IsolaM.,MazzaroC.,ScainiP.,LenziM.,CampaniniM.,NaclerioC.,TavoniA.,PietrograndeM.,FerriC.,MasciaMT.,MasoliniP.,ZabottiA.,MasetM.,RoccatelloD.,ZignegoAL.,PioltelliP.,GabrielliA.,FilippiniD.,PerrellaO.,MigliaresiS.,GalliM.,BombardieriS.,MontiG.;QuartuccioL.,ZulianiF.,CorazzaL.,ScainiP.,ZaniR.,LenziM.,TavoniA.,SebastianiM.,BaldovinoS.,UrraroT.,SaccardoF.,SbregliaC.,MazzaroC.,PioltelliP.,FraticelliP.,FilippiniD.,GabrielliA.,PerrellaO.,ScarpatoS.,RoccatelloD.,ZignegoAL.,FerriC.,BombardieriS.,PietrograndeM.,MontiG.,GalliM.,DeVitaS.2012;2015
25890508 MazzaroC.,PanarelloG.,MauroE.,GatteiV.,PozzatoG.2015
ACR20121547 RoccatelloD.,SciasciaS.,BaldovinoS.,RossiD.2012
22153224 Mazzaro 2011
26853322 Gragnani 2016
Arm Dose Duration N BaselineValue Timepoint Value Changefrombaseline p-value QualityIFN+RBV 3MUTIW+200-1000mgOD≥6months 30 1.44(0.70,4.60) 24weeks 1.390.80,2.60) nd 0.678 Poor
proteinuria,g/24hours 30 4.83(1.60,9.07) 24weeks 1.19(0.50,2.50) nd <0.001rituximab+peg-IFN+RBV 375mg/m2QWor1000mgQ2W+2a:180µg/kgor2b:1.5µg/kgQW+600-1200mgOD52weeks 21 217.5(47.4) 24weeks 136.9(27.1) nd 0.03 Fairpeg-IFN+RBV 2a:180µg/kgor2b:1.5µg/kgQW+600-1200mgOD48weeks 10 150.0(30.6) 169.2(44.2) nd 0.28rituximab+peg-IFN+RBV 375mg/m2QWor1000mgQ2W+2a:180µg/kgor2b:1.5µg/kgQW+600-1200mgOD52weeks 21 42.8(5.8) 24weeks 57.6(4.5) nd 0.01peg-IFN+RBV 2a:180µg/kgor2b:1.5µg/kgQW+600-1200mgOD48weeks 10 58.0(7.4) 59.5(9.9) nd 0.41rituximab+peg-IFN+RBV 375mg/m2QWor1000mgQ2W+2a:180µg/kgor2b:1.5µg/kgQW+600-1200mgOD52weeks 21 3.5(0.9) 24weeks 0.35(0.1) nd <0.001peg-IFN+RBV 2a:180µg/kgor2b:1.5µg/kgQW+600-1200mgOD48weeks 10 3.1(0.9) 1.2(0.5) nd 0.046sofosbuvir+ribavirin 400mgOD+200-1400mgOD24weeks 24 89(80,163) 24weeks 85(78,146) nd nd Good
24 nd 24weeks nd +10% nd24 nd 36weeks nd +14% nd24 nd 24weeks nd +4% nd24 nd 36weeks nd +7% nd
medianGFR,mL/min/1.73m2 24 77.3(44,90) 24weeks 66.7(48,87) nd ndmedianproteinuria,g/24hours 24 1.09(0.6,2.4) 24weeks 0.17(0.25,0.07) nd nd
rituximab 375mg/m2ondays1,8,15,22andthen2monthslaternd 27 2.2(1.9) 216weeks 1.6(1.2) nd ≤0.05 Fairproteinuria,g/24hours 27 2.3(2.1) 216weeks 0.9(1.9) nd ≤0.05
rituximab 1gIVdays0and1424months 28 1.6(0.7,2.8) 1month 1.2(0.8,6.0) nd nd Faircontrol NA 24months 29 1.2(0.7,2.3) 1.2(1.0,2.0) nd ndrituximab 1gIVdays0and1424months 28 1.6(0.7,2.8) 2months 1.6(0.8,6.0) nd ndcontrol NA 24months 29 1.2(0.7,2.3) 1.5(0.8,2.4) nd ndrituximab 1gIVdays0and1424months 28 2.0(0.6,,7.9) 1month 0.6(0.5,7.8) nd ndcontrol NA 24months 29 2.0(0.9,6.8) 2.1(0.9,7.0) nd ndrituximab 1gIVdays0and1424months 28 2.0(0.6,,7.9) 2months 0.9(0.5,4.5) nd ndcontrol NA 24months 29 2.0(0.9,6.8) 1.85(1.0,11.0) nd ndrituximab 1gIVdays0and1424months 28 70(10,100) 1month 52(0,100) nd ndcontrol NA 24months 29 88(30,100) 82(20,100) nd ndrituximab 1gIVdays0and1424months 28 70(10,100) 2months 40(0,81) nd ndcontrol NA 24months 29 88(30,100) 90(0,100) nd ndrituximab 1gIVdays0and1424months 28 89(30,100) 1month 63(30,100) nd ndcontrol NA 24months 29 90(10,100) 70(10,100) nd ndrituximab 1gIVdays0and1424months 28 89(30,100) 2months 44(10,100) nd ndcontrol NA 24months 29 90(10,100) 80.5(10,100) nd ndpeg-IFN+RBV 1.5µg/kgQW+800-1200mgOD24-48weeks 10 1.6(0.3) 4months 1.6(0.6) nd nd Good
36months 1.7(0.9) nd nd10 47(10) 4months 46(16) nd nd
36months 42(14) nd nd10 4.0(0.7) 4months 2.9(1.7) nd nd
36months 2.9(2.4) nd ndrituximab 375mg/m2days1,8,15,and223months 27 2.2(1.9) 3months 1.6(1.2) nd ≤0.05 ND
27 2.3(2.1) 3months 0.9(1.9) nd ≤0.05peg-IFN+RBV 1.5meg/kgqW+800-1200mgqD24or48weeks86 211(320) 24or48weeks(endoftherapy) 175(324) nd nd Fair
>=17.6or23.2months(endoffollow-up) 197(348) nd ndpeg-IFN+RBV 1.5meg/kgqW+800-1200mgqD24or48weeks86 5.6(6.0) 24or48weeks(endoftherapy) 2.4(4.5) nd nd
>=17.6or23.2months(endoffollow-up) 3.8(4.2) nd ndpeg-IFN+RBV 1.5meg/kgqW+800-1200mgqD24or48weeks86 9.8(5.9) 24or48weeks(endoftherapy) 11.5(7.7) nd nd
>=17.6or23.2months(endoffollow-up) 12.3(8.8) nd ndDAA+RBV (1)ombitasvir,paritaprevir+ritonavir(oncedailydoseof25-mgombitasvir,150-mgparitaprevir,and100-mgritonavir)anddasabuvir(250mgtwicedaily)for12or24weeks;(2)ombitasvir,paritaprevir+ritonavir(oncedailydoseof25-mgombitasvir,150-mgparitaprevir,and100-mgritonavir)anddasabuvir(250mgtwicedaily)andribavirin(800-1200mgdaily,weightbaseddose)for12or24weeks;(3)sofosbuvir(400mgoncedaily)plusdaclatasvir(60mgoncedaily);(4)sofosbuvir(400mgoncedaily)plusribavirin(800-1200daily,weight-baseddose).12or24weeks17 626.6(216.8) 8weeks(ontreatment) 137.7(30.3) nd nd FairDAA+RBV (1)ombitasvir,paritaprevir+ritonavir(oncedailydoseof25-mgombitasvir,150-mgparitaprevir,and100-mgritonavir)anddasabuvir(250mgtwicedaily)for12or24weeks;(2)ombitasvir,paritaprevir+ritonavir(oncedailydoseof25-mgombitasvir,150-mgparitaprevir,and100-mgritonavir)anddasabuvir(250mgtwicedaily)andribavirin(800-1200mgdaily,weightbaseddose)for12or24weeks;(3)sofosbuvir(400mgoncedaily)plusdaclatasvir(60mgoncedaily);(4)sofosbuvir(400mgoncedaily)plusribavirin(800-1200daily,weight-baseddose).12or24weeks17 60.2(11.0) 8weeks(ontreatment) 13.4(3.1) nd nd
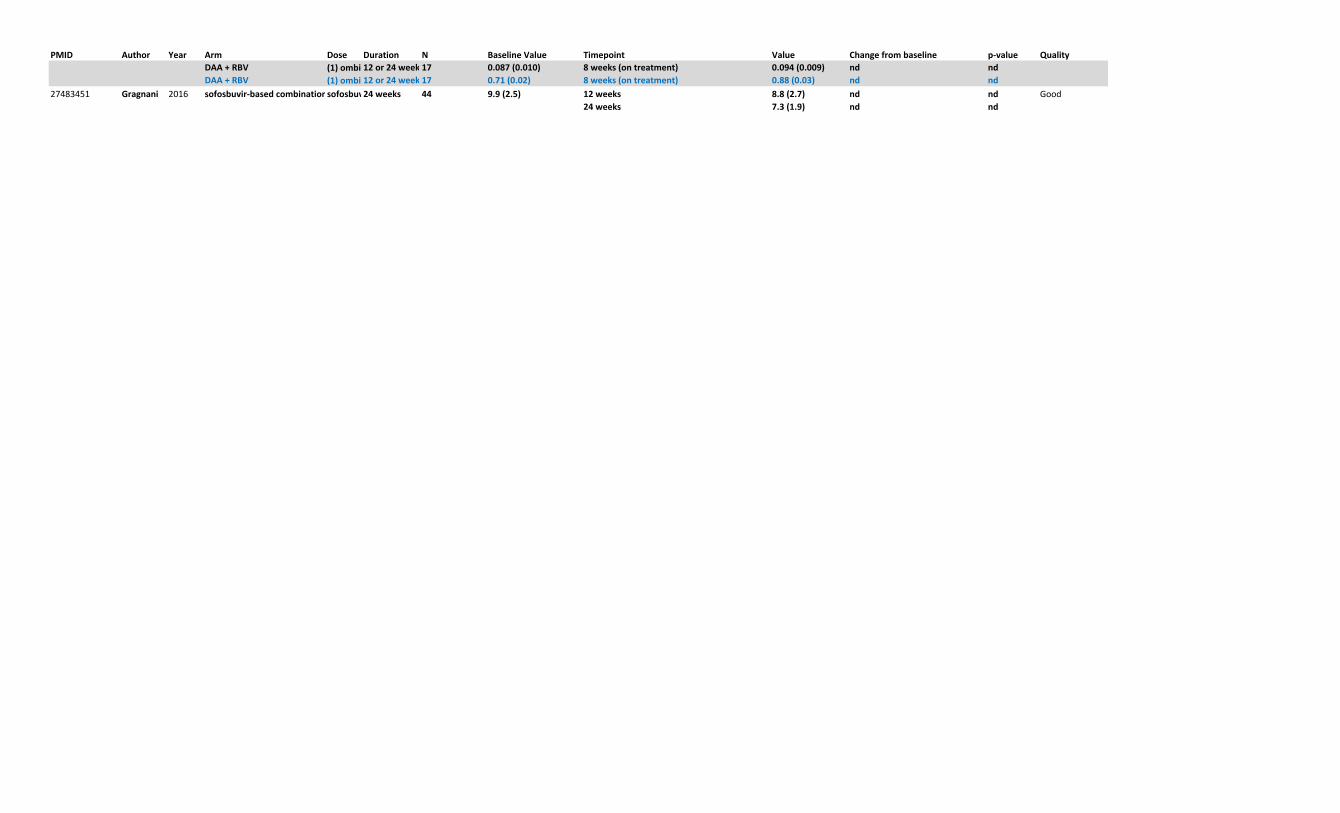
PMID Author Year
27483451 Gragnani 2016
Arm Dose Duration N BaselineValue Timepoint Value Changefrombaseline p-value QualityDAA+RBV (1)ombitasvir,paritaprevir+ritonavir(oncedailydoseof25-mgombitasvir,150-mgparitaprevir,and100-mgritonavir)anddasabuvir(250mgtwicedaily)for12or24weeks;(2)ombitasvir,paritaprevir+ritonavir(oncedailydoseof25-mgombitasvir,150-mgparitaprevir,and100-mgritonavir)anddasabuvir(250mgtwicedaily)andribavirin(800-1200mgdaily,weightbaseddose)for12or24weeks;(3)sofosbuvir(400mgoncedaily)plusdaclatasvir(60mgoncedaily);(4)sofosbuvir(400mgoncedaily)plusribavirin(800-1200daily,weight-baseddose).12or24weeks17 0.087(0.010) 8weeks(ontreatment) 0.094(0.009) nd ndDAA+RBV (1)ombitasvir,paritaprevir+ritonavir(oncedailydoseof25-mgombitasvir,150-mgparitaprevir,and100-mgritonavir)anddasabuvir(250mgtwicedaily)for12or24weeks;(2)ombitasvir,paritaprevir+ritonavir(oncedailydoseof25-mgombitasvir,150-mgparitaprevir,and100-mgritonavir)anddasabuvir(250mgtwicedaily)andribavirin(800-1200mgdaily,weightbaseddose)for12or24weeks;(3)sofosbuvir(400mgoncedaily)plusdaclatasvir(60mgoncedaily);(4)sofosbuvir(400mgoncedaily)plusribavirin(800-1200daily,weight-baseddose).12or24weeks17 0.71(0.02) 8weeks(ontreatment) 0.88(0.03) nd ndsofosbuvir-basedcombinationssofosbuvir400mg,simeprevir150mg,ledipasvir90mg,daclatasvir30mg,andribavirin800-1200mgdailyinaweight-baseddose24weeks 44 9.9(2.5) 12weeks 8.8(2.7) nd nd Good
24weeks 7.3(1.9) nd nd
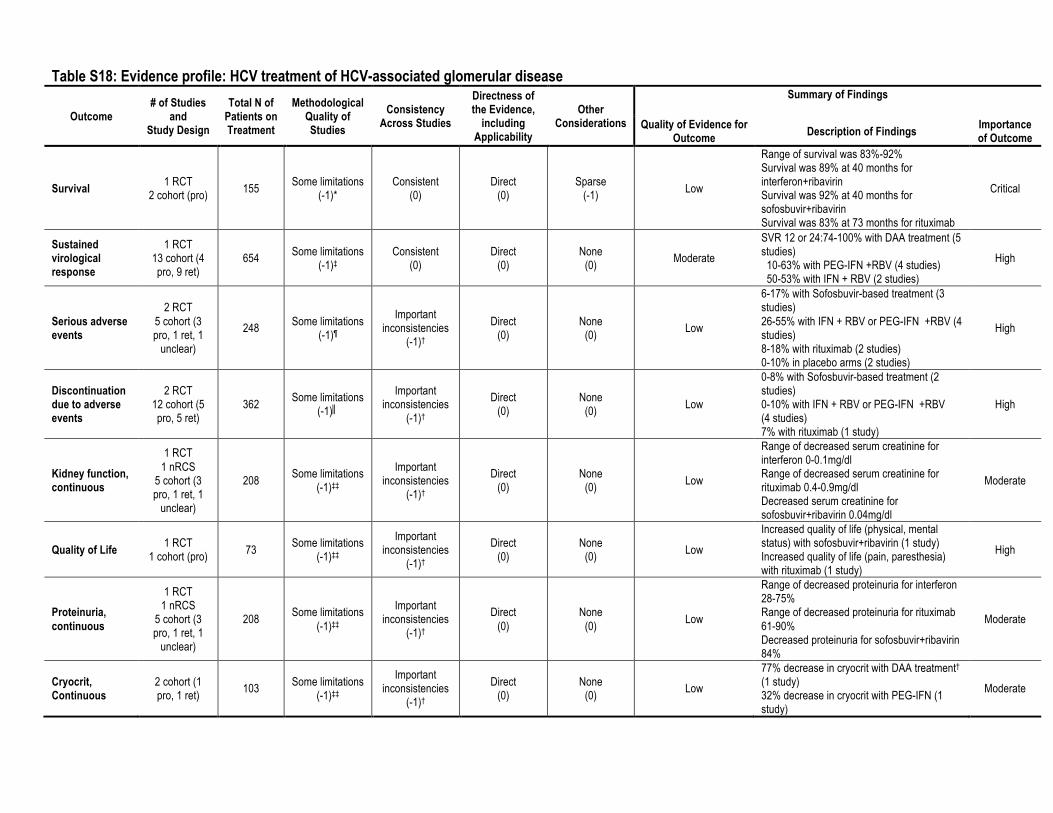
Table S18: Evidence profile: HCV treatment of HCV-associated glomerular disease
Outcome # of Studies
and Study Design
Total N of Patients on Treatment
Methodological Quality of Studies
Consistency Across Studies
Directness of the Evidence,
including Applicability
Other Considerations
Summary of Findings
Quality of Evidence for Outcome Description of Findings Importance
of Outcome
Survival 1 RCT 2 cohort (pro) 155 Some limitations
(-1)* Consistent
(0) Direct
(0) Sparse
(-1) Low
Range of survival was 83%-92% Survival was 89% at 40 months for interferon+ribavirin Survival was 92% at 40 months for sofosbuvir+ribavirin Survival was 83% at 73 months for rituximab
Critical
Sustained virological response
1 RCT 13 cohort (4 pro, 9 ret)
654 Some limitations (-1)‡
Consistent (0)
Direct (0)
None (0) Moderate
SVR 12 or 24:74-100% with DAA treatment (5 studies) 10-63% with PEG-IFN +RBV (4 studies) 50-53% with IFN + RBV (2 studies)
High
Serious adverse events
2 RCT 5 cohort (3 pro, 1 ret, 1
unclear)
248 Some limitations (-1)¶
Important inconsistencies
(-1)†
Direct (0)
None (0) Low
6-17% with Sofosbuvir-based treatment (3 studies) 26-55% with IFN + RBV or PEG-IFN +RBV (4 studies) 8-18% with rituximab (2 studies) 0-10% in placebo arms (2 studies)
High
Discontinuation due to adverse events
2 RCT 12 cohort (5 pro, 5 ret)
362 Some limitations (-1)║
Important inconsistencies
(-1)†
Direct (0)
None (0) Low
0-8% with Sofosbuvir-based treatment (2 studies) 0-10% with IFN + RBV or PEG-IFN +RBV (4 studies) 7% with rituximab (1 study)
High
Kidney function, continuous
1 RCT 1 nRCS
5 cohort (3 pro, 1 ret, 1
unclear)
208 Some limitations (-1)‡‡
Important inconsistencies
(-1)†
Direct (0)
None (0) Low
Range of decreased serum creatinine for interferon 0-0.1mg/dl Range of decreased serum creatinine for rituximab 0.4-0.9mg/dl Decreased serum creatinine for sofosbuvir+ribavirin 0.04mg/dl
Moderate
Quality of Life 1 RCT 1 cohort (pro) 73 Some limitations
(-1)‡‡
Important inconsistencies
(-1)†
Direct (0)
None (0) Low
Increased quality of life (physical, mental status) with sofosbuvir+ribavirin (1 study) Increased quality of life (pain, paresthesia) with rituximab (1 study)
High
Proteinuria, continuous
1 RCT 1 nRCS
5 cohort (3 pro, 1 ret, 1
unclear)
208 Some limitations (-1)‡‡
Important inconsistencies
(-1)†
Direct (0)
None (0) Low
Range of decreased proteinuria for interferon 28-75% Range of decreased proteinuria for rituximab 61-90% Decreased proteinuria for sofosbuvir+ribavirin 84%
Moderate
Cryocrit, Continuous
2 cohort (1 pro, 1 ret) 103 Some limitations
(-1)‡‡
Important inconsistencies
(-1)†
Direct (0)
None (0) Low
77% decrease in cryocrit with DAA treatment† (1 study) 32% decrease in cryocrit with PEG-IFN (1 study)
Moderate
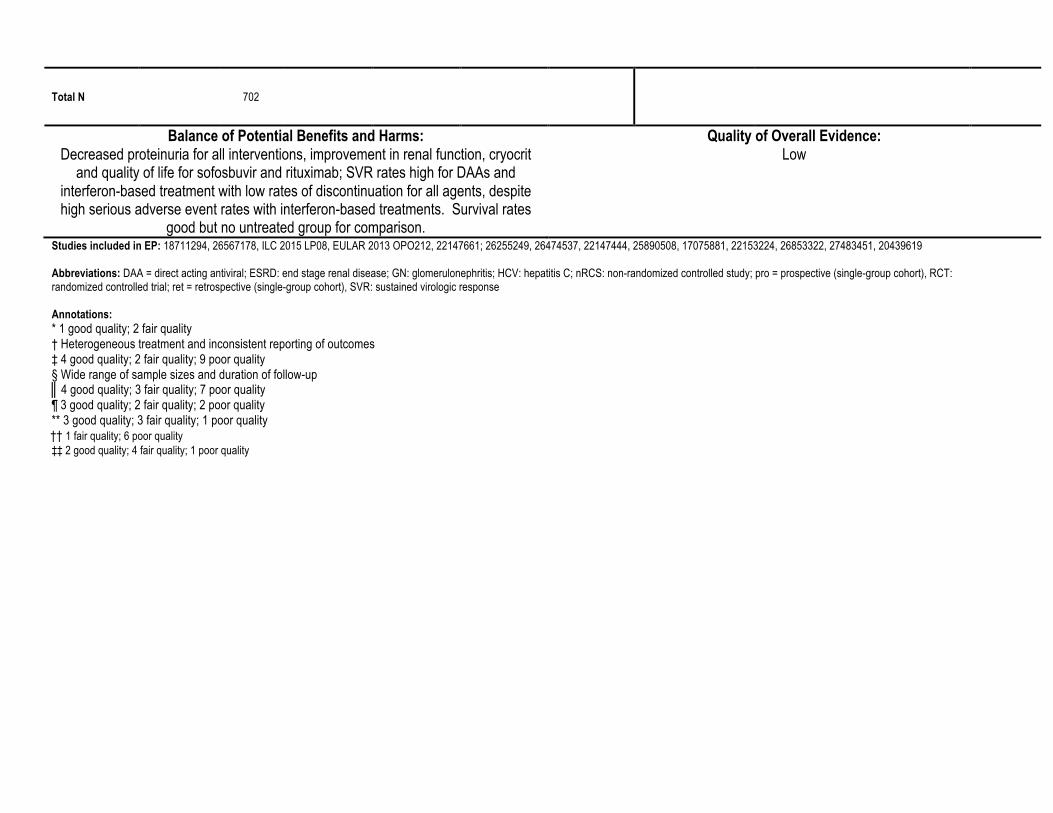
Total N 702
Balance of Potential Benefits and Harms: Decreased proteinuria for all interventions, improvement in renal function, cryocrit
and quality of life for sofosbuvir and rituximab; SVR rates high for DAAs and interferon-based treatment with low rates of discontinuation for all agents, despite high serious adverse event rates with interferon-based treatments. Survival rates
good but no untreated group for comparison.
Quality of Overall Evidence: Low
Studies included in EP: 18711294, 26567178, ILC 2015 LP08, EULAR 2013 OPO212, 22147661; 26255249, 26474537, 22147444, 25890508, 17075881, 22153224, 26853322, 27483451, 20439619 Abbreviations: DAA = direct acting antiviral; ESRD: end stage renal disease; GN: glomerulonephritis; HCV: hepatitis C; nRCS: non-randomized controlled study; pro = prospective (single-group cohort), RCT: randomized controlled trial; ret = retrospective (single-group cohort), SVR: sustained virologic response Annotations: * 1 good quality; 2 fair quality † Heterogeneous treatment and inconsistent reporting of outcomes ‡ 4 good quality; 2 fair quality; 9 poor quality § Wide range of sample sizes and duration of follow-up ║4 good quality; 3 fair quality; 7 poor quality ¶ 3 good quality; 2 fair quality; 2 poor quality ** 3 good quality; 3 fair quality; 1 poor quality †† 1 fair quality; 6 poor quality ‡‡ 2 good quality; 4 fair quality; 1 poor quality