Embed Size (px)
Citation preview

TABLE OF CONTENTS
I. Macroeconomic Performance . . . . . . . 1
Inflation . . . . . . . . . 1
Consumer Price Index . . . . . . . 1
Purchasing Power of Peso . . . . . . . 2
Labor and Employment . . . . . . . 2
II. Agriculture, Forestry and Fishery Sector Performance . . . 3
Crops . . . . . . . . . 3
Palay . . . . . . . . . 3
Corn . . . . . . . . . 4
Fruit Crops . . . . . . . . 5
Vegetables . . . . . . . . 6
Non-food and Industrial and Commercial Crops . . . . 7
Livestock and Poultry . . . . . . . . 7
Fishery . . . . . . . . . 7
Forestry . . . . . . . . . 8
III. Trade and Industry Services Sector Performance . . . . 9
Business Name Registration . . . . . . . 9
Export . . . . . . . . . . 9
Manufacturing . . . . . . . . . 10
Mining . . . . . . . . . . 10
IV. Services Sector Performance . . . . . . . 12
Financing . . . . . . . . . 12
Tourism . . . . . . . . . 12
Air Transport . . . . . . . . . 13
Sea Transport . . . . . . . . . 13
Land Transport . . . . . . . . 14
V. Peace and Security . . . . . . . . 16
VI. Development Prospects . . . . . . . 18
Page 1
MACROECONOMIC PERFORMANCE
Inflation Rate
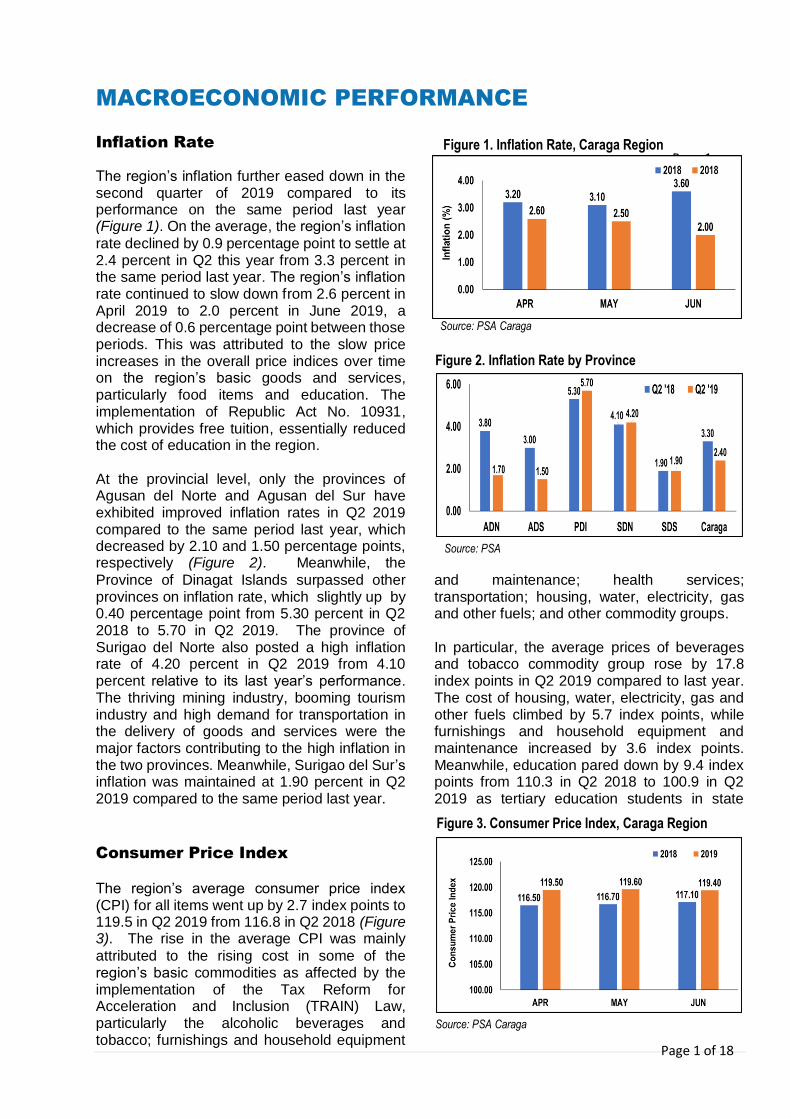
The region’s inflation further eased down in the second quarter of 2019 compared to its performance on the same period last year (Figure 1). On the average, the region’s inflation
rate declined by 0.9 percentage point to settle at 2.4 percent in Q2 this year from 3.3 percent in the same period last year. The region’s inflation rate continued to slow down from 2.6 percent in April 2019 to 2.0 percent in June 2019, a decrease of 0.6 percentage point between those periods. This was attributed to the slow price increases in the overall price indices over time on the region’s basic goods and services, particularly food items and education. The implementation of Republic Act No. 10931, which provides free tuition, essentially reduced the cost of education in the region. At the provincial level, only the provinces of Agusan del Norte and Agusan del Sur have exhibited improved inflation rates in Q2 2019 compared to the same period last year, which decreased by 2.10 and 1.50 percentage points, respectively (Figure 2). Meanwhile, the
Province of Dinagat Islands surpassed other provinces on inflation rate, which slightly up by 0.40 percentage point from 5.30 percent in Q2 2018 to 5.70 in Q2 2019. The province of Surigao del Norte also posted a high inflation rate of 4.20 percent in Q2 2019 from 4.10 percent relative to its last year’s performance. The thriving mining industry, booming tourism industry and high demand for transportation in the delivery of goods and services were the major factors contributing to the high inflation in the two provinces. Meanwhile, Surigao del Sur’s inflation was maintained at 1.90 percent in Q2 2019 compared to the same period last year.
Consumer Price Index The region’s average consumer price index (CPI) for all items went up by 2.7 index points to 119.5 in Q2 2019 from 116.8 in Q2 2018 (Figure 3). The rise in the average CPI was mainly
attributed to the rising cost in some of the region’s basic commodities as affected by the implementation of the Tax Reform for Acceleration and Inclusion (TRAIN) Law, particularly the alcoholic beverages and tobacco; furnishings and household equipment
and maintenance; health services; transportation; housing, water, electricity, gas and other fuels; and other commodity groups. In particular, the average prices of beverages and tobacco commodity group rose by 17.8 index points in Q2 2019 compared to last year. The cost of housing, water, electricity, gas and other fuels climbed by 5.7 index points, while furnishings and household equipment and maintenance increased by 3.6 index points. Meanwhile, education pared down by 9.4 index points from 110.3 in Q2 2018 to 100.9 in Q2 2019 as tertiary education students in state
Figure 2. Inflation Rate by Province
Source: PSA
Figure 1. Inflation Rate, Caraga Region
Source: PSA Caraga
Page 1 of 18
Figure 3. Consumer Price Index, Caraga Region
Source: PSA Caraga

universities and colleges continue to benefit free tuition fees as mandated by Republic Act 10931, otherwise known as the Universal Access to Quality Tertiary Education Act. As to provinces, Agusan del Norte and Agusan del Sur exhibited slow increase in the average price indices of basic goods by 1.9 and 1.7 index points, respectively (Figure 4). Both provinces are major producers of agricultural products, of which the prices of rice, corn, bread and cereals dropped during the period. Meanwhile, Surigao del Sur’s average price index posted an increase of 2.4 index points, which mainly attributed to the upswing in the prices of alcoholic beverages and tobacco commodity group. However, the province posted the lowest CPI in education with 70.5 compared to the region’s 100.9, which has been ascribed to the presence of Surigao del Sur State University with satellite campuses spread throughout the province. On the other hand, the Province of Dinagat Islands recorded the highest increase in CPI at 6.5 index points. Aside from high prices on tobacco and alcoholic beverages, the cost in transportation is high considering that it is an island province, importing mostly of its goods from the mainland Surigao e.g. agricultural products. In addition, the province cost for education surged at an average of 19.7 index points due to the absence of a state-run tertiary education institution, which has been benefiting the implementation of the free tuition policy of the government. Surigao del Norte’s CPI also rose by 4.9 index points due to high prices on food items, alcoholic beverages and tobacco, and non-food items, such as solid fuels, dental services and secondary education.
Purchasing Power of Peso
The region’s purchasing power of peso declined in Q2 2019 at 0.84 centavos or a drop of 2.33 percent from 0.86 centavos in the same period last year (Figure 5). Throughout the second
quarter of 2019, the PPP of the region steadily maintained at 0.84 centavos as inflation waned during the period. This implies that a consumer could only buy PhP 84.0 worth of goods for PhP 100.0 at 2012 constant prices. The rising prices of basic commodities in the region further reduced the amount of goods and services that can be bought by the consumers.
Labor and Employment The region’s labor force increased by 2.94 percent to 1.927 Million in Q2 2019 from 1.872 Million in the same period last year (Table 1).
However, participation rate slightly decreased by 0.8 percent percentage point, which recorded at 65.3 percent from 66.1 percent in Q2 last year. Employment rate slightly rose by 0.2 percentage point to reach 96.0 percent in Q2 2019, which resulted in the drop of the unemployment rate to 4.0 percent during period. Meanwhile, the region’s underemployment posted a significant drop by 10.4 percentage points. Table 1. Labor and Employment, Caraga Region
Indicator Q2 ‘18 Q2 ‘19 Percent (%)
Change
Labor Force (in Million)
1.872 1.927 2.94
Labor Force Participation Rate
66.1 65.3 (0.80)
Employment Rate 95.8 96.0 0.20
Unemployment Rate 4.2 4.0 (0.20)
Underemployment 29.4 19.0 (10.4) Source: PSA Caraga
Figure 5. Purchasing Power of Pesos, Caraga Region
Source: PSA Caraga
Page 2 of 18
Figure 4. Consumer Price Index by Province
Source: PSA Caraga

AGRICULTURE, FORESTRY AND FISHERY SECTOR
PERFORMANCEBOR AND EMPLOYMENT
Crops
Palay
The region’s volume of palay production shrunk by 2.16 percent, generating a total output of 271,230.48 MT in Q2 2019 compared to 277,219.00 MT in the same period last year (Figure 6). Surigao del Sur contributed largely to
the decline in the region’s overall palay production with the provincial output dropped by 14.68 percent during the period. Agusan del Norte also posted lower production output by 1.02 percent from previous year’s produce. Meanwhile, the other provinces registered growth in palay production with Surigao del Norte generated the highest increase of 7.33 percent. This was followed by the Province of Dinagat Islands at 5.92 percent. Being the food basket of the region, Agusan del Sur exhibited only a slight increase of less than 1.0 percent with its output totalled to 140,617.50 MT in Q2 2019 from 139,884 MT in the same period last year. The province’s palay production comprised more than half of the region’s total commodity output. Consequently, the low palay production output of the region was ascribed to the decline in the area harvested, particularly in the provinces of Surigao del Sur and Agusan del Norte by 6.30 percent and 2.84 percent, respectively (Figure 7). The expansion in the area harvested in
Agusan del Sur by 6.95 percent, Dinagat Islands by 1.84 percent and Surigao del Norte by 1.17 percent, failed to compensate the reduction in the aggregate area harvested in Agusan del Norte and Surigao del Sur. In terms of yield, the region’s average yield per hectare decreased by 3.94 percent to settle at 3.15 MT/ha. in Q2 2019 compared to 3.28 MT/ha. in Q2 2018 (Figure 8). Palay yield in the
provinces of Surigao del Sur and Agusan del Sur dropped by 8.94 percent and 6.01 percent, respectively. Meanwhile, the provinces of Dinagat Islands and Surigao del Norte generated an increase in palay yield at 4.0 percent and 6.08 percent, respectively.
Palay Farmgate Price The implementation of Republic Act No. 11203, liberalizing the importation, exportation and trading of rice, made a dint in the farmgate price of region’s locally produced palay. The region’s palay farmgate price declined by 21.39 percent from an average of PhP 19.82/kg. in Q2 2018 to PhP 15.58/kg. in the same period this year (Figure 9). Among the provinces, Surigao del Sur recorded the highest farmgate price at PhP
Figure 6. Palay Production by Province
Source: PSA Caraga
Figure 7. Palay Area Harvested by Province
Source: PSA Caraga
Figure 8. Palay Yield by Province
Source: PSA Caraga
Page 3 of 18

16.04/kg., while Surigao del Norte posted the lowest at PhP 14.00/kg. in Q2 2019.
Rice Stock Inventory, Procurement and Distribution The region exhibited high rice stock inventory in Q2 2019, representing roughly 508 percent increase of the aggregate rice stock in the same period last year (Figure 10). This was ascribed to early arrival of imported rice from Vietnam and Thailand in Q1 2019, which were subsequently distributed all throughout the provinces in the region in the following quarter to augment and supplement rice stock inventory and distribution in the local markets. Apart from it, there was also substantial volume of locally produced palay procured by NFA Caraga in Q2 2019.
The significant increase in the locally produced palay procured by NFA Caraga by 7,735 percent, which totalled to 167,828 bags in Q2 2019 compared to 2,142 bags in the same quarter last year (Figure 11), was attributed to the implementation of additional PhP 3.00/kg buffer stocking incentive, continuous implementation of drying, delivery and the cooperative development incentive fee (CDIF) and higher buying price offered by the agency compared to the rice traders. On the other hand, rice distribution in the local market went well in Q2 2019 compared to the
same period last year. The aggregate volume of rice distributed in the local market remarkably grew by roughly 134 percent, which totalled to 70,939 bags in Q2 2019 from 30,284 bags in Q2 2018 (Figure 12). The arrival of imported rice
early this year and the additional individual retailers’ outlets accredited by NFA Caraga to achieve its 10 percent market participation target were the contributing factors to the huge surge in the volume of rice distributed in the local markets.
Corn The region’s corn production remarkably grew by 16.20 percent, from 31,560 MT in Q2 2018 to 36,672.94 in the same period this year (Figure 13). Agusan del Sur displayed a significant increase in the volume of produced corn by 21.80 percent, from 27,707 MT in Q2 2018 to 33,746 MT in Q2 2019. The notable growth in the province’s production output, which comprised 92.0 percent of the region’s total corn production, even out the low output generated in Agusan del Norte and Surigao del Sur. The increase in the region’s overall corn production output was attributed to the expansion of the total area harvested, which grew by 9.90
Figure 9. Palay Farmgate Price by Province
Source: PSA Caraga
Figure 10. Rice Stock Inventory by Province
Source: NFA Caraga
Figure 12. Rice Distribution by Province
Source: NFA Caraga
Figure 11. Palay Procurement by Province
Source: NFA Caraga
Page 4 of 18

percent, from 8,615 has. in Q2 2018 to 9,468 has. of the same period this year (Figure 14). Except for Agusan de Norte, the rest of the provinces of the region managed to expand their corn production areas. In particular, a remarkable uprsurge in the total corn production area was noted in Agusan del Sur, which grew by 15.82 percent. On the other hand, Agusan del Norte’s aggregate area planted to corn plunged by 34.49 percent. On the other hand, the region’s corn yield improved by 5.73 percent in Q2 2019 to register at 3.87 MT/ha. from 3.66 MT/ha. of the same period last year (Figure 15). The province of
Surigao del Norte exhibited a significant increase in corn yield by 20.11 percent from 1.83 MT/ha. in Q2 2018 to 2.20 MT/ha. in Q2 2019. The provinces of Agusan del Norte and Agusan del Sur achieved higher corn yields posted at 7.42 percent and 5.16 percent, respectively. However, the Province of Dinagat Islands recorded a drop its corn yield by 2.29 percent, while Surigao del Sur exhibited a hefty decline of 15.85 percent yield.
Fruit Crops The region’s overall fruit crops production marginally grew by 1.61 percent in Q2 2019, from 80,128.96 MT in Q2 2018 to 81,419.79 MT (Figure 16). All fruit sectors generated better
production output in Q2 2019 led by priority fruits, which yielded an increase of 31.08 percent. The major fruits, which comprised about 96 percent of the total fruit crops production, generated only a slight increase of 0.97 percent. The other fruits eked out by 0.31 percent.
The major fruits comprised of banana, calamansi, mango and pineapple. All fruits under this category exhibited growth, except for calamansi, which production output declined by 11.05 percent. The banana commodity, which comprised roughly 92 percent of the region’s major fruit production, marginally rose by 0.70 percent. Mango and pineapple also expanded by 5.65 percent and 3.75 percent, respectively All provinces generated an increase in major fruit production, except for Agusan del Sur, which output declined by 8.56 percent in Q2 2019 (Figure 17). Surigao del Sur accounted
41.31 percent of the region’s total major fruit production, which comprised mainly by banana. This was followed by Agusan del Norte, which
posted 5.48 percent growth in production and contributed 29.30 percent of the region’s total output. The province of Dinagat Islands registered the highest increase with 8.49 percent, which comprised largely by banana.
Figure 13. Corn Production by Province
Source: PSA Caraga
Figure 14. Corn Area Harvested Production by Province
Source: PSA Caraga
Figure 15. Corn Yield by Province
Source: PSA Caraga
Figure 16. Fruit Crops Production, Caraga Region
Source: PSA Caraga
Page 5 of 18

However, the province contributed minimally (0.10 percent) to the region’s total output.
Vegetables
The region’s total vegetable production went up by only a margin of 0.90 percent in Q2 2019, generating a total volume of 24,068.54 MT from 23,853.72 MT in Q2 2018 (Figure 18). The
decline in the production volume of major and other vegetables by 0.90 percent and 2.03 percent affected the overall vegetable production output of the region. Nonetheless, the drop in the production performance of those commodity groups was compensated by the substantial increase in the priority vegetables output by 5.74 percent.
The major vegetable crops encompassed about 62 percent of the region’s total vegetable production. Except for peanut and cassava, which production output declined by 0.63 percent and 31.15 percent, the rest of the major vegetable crops generated growth in production outputs, such as camote (24.64%), mongo (20.58%), cabbage (20.00%) and eggplant (18.86%). The top three major vegetables products of the region in Q2 2019 were camote, cassava and eggplant, which accounted 60.94 percent of the region’s total vegetable produce.
Surigao del Sur recorded a major decline in vegetable production by 30.31 percent in Q2 2019 due to a 51.54 percent drop in cassava production (Figure 19). The Province of Dinagat
Islands and Surigao del Norte also exhibited low production output by 1.48 percent and 3.85 percent as cassava production contracted during the period. Meanwhile, the increase in the production output in Agusan del Norte by 19.32 percent was attributed to the increase in the volume of production of peanut and camote. The growth generated by Agusan del Sur by 11.18 percent was contributed by the improved production of eggplant and camote.
Non-Food Industrial and Commercial Crops
The production output of non-food industrial and commercial crops (NFICC) in the region dropped by 4.71 percent from 239,221.73 MT in Q2 2018 to 227,955.56 MT in Q2 2019 (Figure 20). This was due to the drop in the volume of production of major and priority NFICCs, which fell by 4.02 percent and 8.62 percent, respectively. The major NFICCs covered 85.04 percent of the region’s aggregate output, while priority NFICC accounted only 14.76 percent. Meanwhile, production of other NFICCs jumped by 8.91 percent. However, this commodity group contributed only 0.20 percent to the region’s total output. By commodity, coconut was the region’s top commercial produce in Q2 2019, comprising 81.64 percent. It is followed by rubber at 2.25 percent only. However, coconut production declined by 4.60 percent along with sugarcane by 3.57 percent. Production of rubber, abaca and cofee improved by 14.55 percent, 8.19 percent and 1.71 percent, respectively. The drop in the regional NFICC aggregate output was attributed to low coconut production
Figure 18. Vegetables Production, Caraga Region
Source: PSA Caraga
Figure 19. Major Vegetables Production, By Province
Source: PSA Caraga
Figure 17. Major Fruit Crops Production, By Province
Source: PSA Caraga
Page 6 of 18

in the provinces of Agusan del Sur, Dinagat Islands, Surigao del Norte and Surigao del Sur (Figure 21). Only Agusan del Norte exhibited an increase in coconut production by 11.34 percent. The coconut industry is still confronted by declining copra prices, which is dependent on the prices of the international market. On the other hand, the production performance of abaca substantially expanded as Surigao del Norte and Agusan del Sur’s production output grew by 95.52 percent and 87.96 percent, respectively. Moreover, substantial growth in rubber production was noted in Agusan del Sur by 14.29 percent, Agusan del Norte by 23.26 percent and Surigao del Norte by 30.56 percent, respectively. Surigao del Sur is the region’s top coffee producer, contributing 85.56 percent share of the region’s total output.
Livestock and Poultry The combined livestock and poultry production in the region slumped by 1.70 percent in Q2 2019 to reach 16,813 MT from 17,104 MT in Q2 2018 (Figures 22 and 23). Livestock production
slipped 0.33 percent due to huge decline in hog
production volume compared to other commodities despite a drop of 2.78 percent. Hog production contributed the lion’s share of the regional output by 87.19 percent in Q2 2019. Cattle and carabao production rose 31.68 percent and 20.76 percent, respectively. Despite the availability of locally grown corn and cassava, livestock production is declining due to diminishing margins for production in Caraga drove by rising prices of feeds. Poultry production also decreased by 4.12 percent across all commodities except for duck which increased 15.91 percent but with minute volume. The production of chicken and chicken eggs tapered down by 1.92 percent and 8.28 percent, respectively. Chicken encompassed the region’s share of 67.21 percent followed by chicken eggs which accounted for 29.32 percent in Q2 2019.
Fishery
The overall fishery output in the region slightly increased by 1.75 percent in Q2 2019, totalled to 20,060.85 MT from 19,716.50 MT in Q2 2018 (Figure 24) despite decline of the aquaculture by
4.02 percent. The commercial and municipal fisheries production generated a hefty increase by 11.69 percent and 2.50 percent, respectively. In Q2 2019, the region’s top fish catch under commercial fisheries were Bigeye Tuna (Tambakol/Bariles), Frigate Tuna (Tulingan),
Figure 22. Livestock Production, Caraga Region
Source: PSA Caraga
Figure 20. NFICC Production, Caraga Region
Source: PSA Caraga
Figure 21. Major NFICC Production, By Province
Source: PSA Caraga
Figure 23. Poultry Production, Caraga Region
Source: PSA Caraga
Page 7 of 18

Roundscad (Galunggong), Skipjack (Gulyasan) and Yellowfin Tuna (Tambakol/Bariles). Consequently, the region’s total fishery production value grew by 15.62 percent in Q2 2019 to reach PhP 1.65 Billion from PhP 1.78 Billion in Q2 2018 (Figure 25). Municipal
fisheries generated the highest growth at 8.92 percent. It is followed by commercial fisheries at 8.45 percent. Meanwhile, production value of aquaculture fishery commodities yielded an increase of 4.77 percent despite the decline in quantity outputs during the period. This was attributed to high market prices on aquaculture fishery fishery, specifically milkfish, mudcrab and seaweed. All provinces exhibited increase in fisheries production in Q2 2019, except for Agusan del Sur, which is a landlocked province (Figure 26).
The major fish producing provinces, Surigao del Norte and Surigao del Sur, generated production growths at 1.41 percent and 1.37 percent, respectively. Both provinces accounted 80.43 percent share of the region’s total fisheries production. The Province of Dinagat Islands, eked out a mere 0.66 percent growth. Agusan del Norte bettered other provinces with 5.84 percent hike in fishery production. Meanwhile, fishery production in Agusan del Sur fell by 8.50 percent.
Forestry The region’s log production in Q2 2019 slightly went up by 2.0 percent, generating a total volume of 138,707 cu.m. from 135,958 cu.m. in Q2 2018 (Figure 27) despite the notable decrease in the production outputs generated in Agusan del Sur and Surigao del Norte by 8.87 percent and 34.75 percent, respectively. Agusan del Sur produced 55.75 percent of the region’s total log production in Q2 2019. Nevertheless, the low forestry output in the said provinces were absorbed by the substantial increase in production generated in Agusan del Norte and Surigao del Sur by 9.0 percent and 36.09 percent, respectively. Surigao del Sur remarkably produced 10,745 cu.m. more logs in from 29,772 cu.m. in Q2 2018 to 40,517 cu.m in Q2 2019.
Figure 25. Fishery Value, Caraga Region
Source: PSA Caraga
Figure 26. Fishery Production, By Province
Source: PSA Caraga
Figure 27. Log Production, Caraga Region
Source: DENR Caraga
Figure 24. Fishery Production, Caraga Region
Source: PSA Caraga
Page 8 of 18

TRADE AND INDUSTRY SERVICES SECTOR
PERFORMANCE
Business Name Registration
Fewer business enterprises have registered through the Business Name Registration System (BNRS) in Q2 2019 as the business name registrants waned by 18.76 percent, which totalled to 1,771 registrants from 2,180 registrants in Q2 2018 (Table 2). All provinces
displayed lower number of business registrants compared to the same period last year. Table 2. New Business Name Registered, Caraga Region
Province Q2 2018
Q2 2019
Percent (%) Change
ADN 706 690 (2.27)
ADS 449 371 (17.37)
SDN 520 334 (35.77)
SDS 420 319* (24.05)
PDI 85 57 (32.94)
Caraga 2,180 1,771 (18.76) *Comprised only walk-in clients.
Source: DTI Caraga
On the average, jobs generated from registered business enterprises in Q2 2019 decreased by 13.88 percent, which totalled to 6,476 jobs from 7,520 jobs in Q2 2018 (Table 3). Among the provinces, only Surigao del Sur showed growth on jobs generated during the quarter by 30.70 percent, which include jobs monitored under the Comprehensive Agrarian Reform Program (CARP) and Industry Cluster Enhancement (ICE) Program of DTI Caraga. Table 3. Jobs Generated, Caraga Region
Province Q2 2018
Q2 2019
Percent (%) Change
ADN 3,707 3,303* (10.90)
ADS 1,683 1,266 (24.78)
SDN 1,183 791 (33.14) SDS 824 1,077 30.70
PDI 123 39 (68.29)
Caraga 7,520 6,476 (13.88) *Preliminary data only as some LGUs failed to submit reports on cut-off date.
Source: DTI Caraga
Despite the slumped figures in business registration and jobs generation, domestic sales and investments were significantly up in Q2 2019 by 16.85 percent (Table 4) and 38.10 percent (Table 5) compared to the same period
last year. The increase in domestic sales was attributed to the expansion of government
assistance to key industry players, particularly palm oil industry. Surigao del Sur topped among other provinces in the region on domestic sales, achieving 1,050.36 percent increase, which was ascribed to the implementation of CARP and ICE Program of DTI Caraga that provide financial support to micro, small and medium enterprises (MSMEs). Table 4. Domestic Sales, Caraga Region
Province Q2 2018
Q2 2019
Percent (%) Change
ADN 119.2 63.58 -46.66%
ADS 74.53 106.98 43.54%
SDN* - - -
SDS 6.95 79.95 1050.36%
PDI 18.50 5.60 -69.73%
Caraga 219.18 256.11 16.85% *No submission
Source: DTI Caraga
Moreover, the upsurge in the region’s investments in Q2 2019 was mainly contributed by the additional investments generated locally, particularly in Agusan del Sur and Surigao del Sur. The RC Square located in Trento, Agusan del Sur has expanded its store. The Tropics Hotel and Resort in Barobo in Surigao del Sur has expanded its facilities upon approval of local investment incentive by the Barobo Investment Promotion Unit (IPU). On the other hand, the CARP and ICE Program of DTI Caraga extended financial support to MSMEs at the local level. Table 5. Investment, Caraga Region
Province Q2 2018
Q2 2019
Percent (%) Change
ADN 156.11 155.74 -0.24% ADS 125.48 341.14 171.87%
SDN 228.22 136.18 -40.33%
SDS 29.83 138.34 363.76%
PDI 23.40 6.16 -73.68%
Caraga 563.04 777.56 38.10%
Source: DTI Caraga
Export The region’s aggregate volume of exported products jumped by 35.89 percent in Q2 2019 to 7.55 Billion kilograms from 5.56 Billion kilograms in Q2 2018 (Figure 28). The surge in the quantity of exported products was mainly attributed by
Page 9 of 18
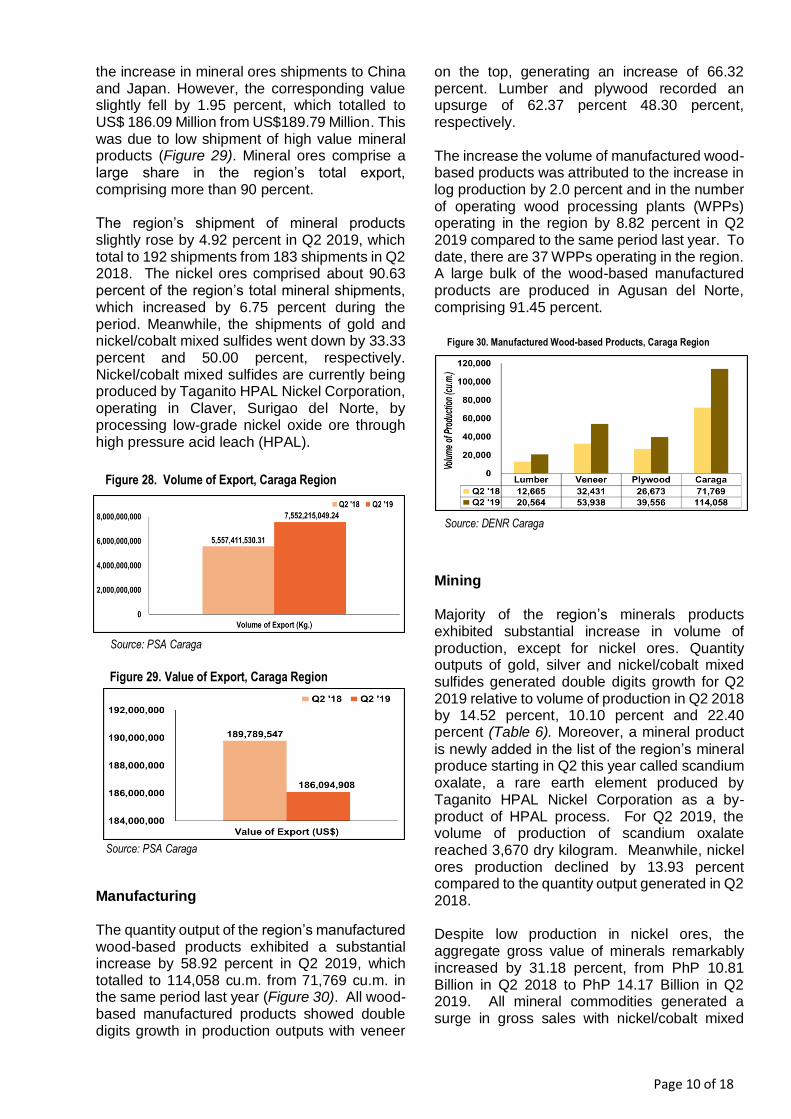
the increase in mineral ores shipments to China and Japan. However, the corresponding value slightly fell by 1.95 percent, which totalled to US$ 186.09 Million from US$189.79 Million. This was due to low shipment of high value mineral products (Figure 29). Mineral ores comprise a large share in the region’s total export, comprising more than 90 percent. The region’s shipment of mineral products slightly rose by 4.92 percent in Q2 2019, which total to 192 shipments from 183 shipments in Q2 2018. The nickel ores comprised about 90.63 percent of the region’s total mineral shipments, which increased by 6.75 percent during the period. Meanwhile, the shipments of gold and nickel/cobalt mixed sulfides went down by 33.33 percent and 50.00 percent, respectively. Nickel/cobalt mixed sulfides are currently being produced by Taganito HPAL Nickel Corporation, operating in Claver, Surigao del Norte, by processing low-grade nickel oxide ore through high pressure acid leach (HPAL).
Manufacturing The quantity output of the region’s manufactured wood-based products exhibited a substantial increase by 58.92 percent in Q2 2019, which totalled to 114,058 cu.m. from 71,769 cu.m. in the same period last year (Figure 30). All wood-based manufactured products showed double digits growth in production outputs with veneer
on the top, generating an increase of 66.32 percent. Lumber and plywood recorded an upsurge of 62.37 percent 48.30 percent, respectively. The increase the volume of manufactured wood-based products was attributed to the increase in log production by 2.0 percent and in the number of operating wood processing plants (WPPs) operating in the region by 8.82 percent in Q2 2019 compared to the same period last year. To date, there are 37 WPPs operating in the region. A large bulk of the wood-based manufactured products are produced in Agusan del Norte, comprising 91.45 percent.
Mining Majority of the region’s minerals products exhibited substantial increase in volume of production, except for nickel ores. Quantity outputs of gold, silver and nickel/cobalt mixed sulfides generated double digits growth for Q2 2019 relative to volume of production in Q2 2018 by 14.52 percent, 10.10 percent and 22.40 percent (Table 6). Moreover, a mineral product
is newly added in the list of the region’s mineral produce starting in Q2 this year called scandium oxalate, a rare earth element produced by Taganito HPAL Nickel Corporation as a by-product of HPAL process. For Q2 2019, the volume of production of scandium oxalate reached 3,670 dry kilogram. Meanwhile, nickel ores production declined by 13.93 percent compared to the quantity output generated in Q2 2018. Despite low production in nickel ores, the aggregate gross value of minerals remarkably increased by 31.18 percent, from PhP 10.81 Billion in Q2 2018 to PhP 14.17 Billion in Q2 2019. All mineral commodities generated a surge in gross sales with nickel/cobalt mixed
Figure 28. Volume of Export, Caraga Region
Source: PSA Caraga
Figure 29. Value of Export, Caraga Region
Source: PSA Caraga
Figure 30. Manufactured Wood-based Products, Caraga Region
Source: DENR Caraga
Page 10 of 18

sulphides posted the highest increase by 49.29 percent. On government revenue generated from mining development, collection of excise tax was up by 15.84 percent in Q2 2019, which totalled to PhP 408.35 Million from PhP 352.50 Million in Q2 2018. However, collection of royalty tax plummeted by 3.30 percent, from PhP 731.24 Million in Q2 2018 to PhP 707.12 Million in Q2 2019. Table 6. Mining Statistics, Caraga Region
Indicator
Q2 ‘18
Q12 ‘19
Percent (%)
Change
Production Volume
Gold (kg-1000 fineness)
710.24 813.38 14.52
Silver (kg) 146.98 161.83 10.10
Nickel Ore (in ‘000 Dry Metric Ton/DMT)
7,488.90 6,445.48 (13.93)
Nickel/Cobalt Mixed Sulfides (DMT)
12,848.50 15,726.50 22.40
Scandium Oxalate (dry kilogram)
- 3,670.20 -
Metallurgical Chromite - - -
Production Value (PhP Million)
Gold 1,526.63 1,793.11 17.53 Silver 4.00 4.01 0.13
Nickel Ore 5,704.01 6,941.47 21.69
Nickel/Cobalt Mixed Sulfides
3,571.45 5,331.94 49.29
Scandium Oxalate - 103.23 -
Metallurgical Chromite - - -
Total 10,805.10 14,173.76 31.18
Estimated Excise Tax (PhP Million)
Gold 69.79 76.28 9.31 Silver 0.14 0.17 26.51
Nickel Ore 282.58 331.90 17.45
Nickel/Cobalt Mixed Sulfides
- - -
Scandium Oxalate - - -
Metallurgical Chromite
Total 352.50 408.35 15.84
Estimated Royalty Tax (PhP Million)* Gold 87.23 95.35 9.31
Silver 0.17 0.22 26.51
Nickel Ore 643.84 385.41 (40.14)
Indicator
Q2 ‘18
Q12 ‘19
Percent (%)
Change
Nickel/Cobalt Mixed Sulfides
- 222.91 -
Scandium Oxalate - 3.22 -
Metallurgical Chromite
Total 731.24 707.12 (3.30)
Employment (Peak)
Gold 5,239 5,540 5.75
Silver
Nickel Ore 18,037 16,124 (10.61)
Nickel/Cobalt Mixed Sulfides
3,192 -
Scandium Oxalate - 3,501 -
Metallurgical Chromite 34 29 (14.71)
Total 26,502 25,194 (4.94)
*Preliminary data only Source: MGB Caraga
SERVICES SECTOR PERFORMANCE
Financing
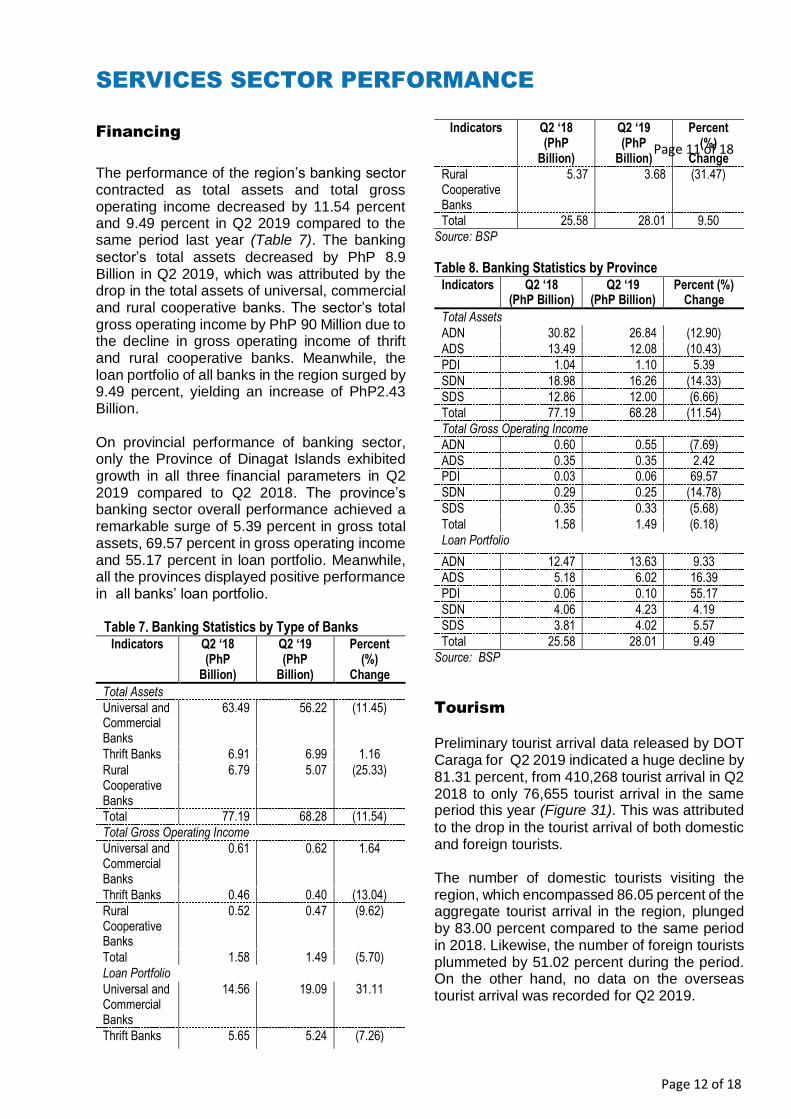
The performance of the region’s banking sector contracted as total assets and total gross operating income decreased by 11.54 percent and 9.49 percent in Q2 2019 compared to the same period last year (Table 7). The banking
sector’s total assets decreased by PhP 8.9 Billion in Q2 2019, which was attributed by the drop in the total assets of universal, commercial and rural cooperative banks. The sector’s total gross operating income by PhP 90 Million due to the decline in gross operating income of thrift and rural cooperative banks. Meanwhile, the loan portfolio of all banks in the region surged by 9.49 percent, yielding an increase of PhP2.43 Billion. On provincial performance of banking sector, only the Province of Dinagat Islands exhibited growth in all three financial parameters in Q2 2019 compared to Q2 2018. The province’s banking sector overall performance achieved a remarkable surge of 5.39 percent in gross total assets, 69.57 percent in gross operating income and 55.17 percent in loan portfolio. Meanwhile, all the provinces displayed positive performance in all banks’ loan portfolio. Table 7. Banking Statistics by Type of Banks
Indicators Q2 ‘18 (PhP
Billion)
Q2 ‘19 (PhP
Billion)
Percent (%)
Change
Total Assets
Universal and Commercial Banks
63.49 56.22 (11.45)
Thrift Banks 6.91 6.99 1.16
Rural Cooperative Banks
6.79 5.07 (25.33)
Total 77.19 68.28 (11.54)
Total Gross Operating Income
Universal and Commercial Banks
0.61 0.62 1.64
Thrift Banks 0.46 0.40 (13.04)
Rural Cooperative Banks
0.52 0.47 (9.62)
Total 1.58 1.49 (5.70)
Loan Portfolio
Universal and Commercial Banks
14.56 19.09 31.11
Thrift Banks 5.65 5.24 (7.26)
Indicators Q2 ‘18 (PhP
Billion)
Q2 ‘19 (PhP
Billion)
Percent (%)
Change
Rural Cooperative Banks
5.37 3.68 (31.47)
Total 25.58 28.01 9.50
Source: BSP
Table 8. Banking Statistics by Province Indicators Q2 ‘18
(PhP Billion) Q2 ‘19
(PhP Billion) Percent (%)
Change
Total Assets
ADN 30.82 26.84 (12.90)
ADS 13.49 12.08 (10.43)
PDI 1.04 1.10 5.39
SDN 18.98 16.26 (14.33)
SDS 12.86 12.00 (6.66)
Total 77.19 68.28 (11.54)
Total Gross Operating Income
ADN 0.60 0.55 (7.69)
ADS 0.35 0.35 2.42 PDI 0.03 0.06 69.57
SDN 0.29 0.25 (14.78)
SDS 0.35 0.33 (5.68)
Total 1.58 1.49 (6.18)
Loan Portfolio
ADN 12.47 13.63 9.33
ADS 5.18 6.02 16.39
PDI 0.06 0.10 55.17
SDN 4.06 4.23 4.19
SDS 3.81 4.02 5.57
Total 25.58 28.01 9.49
Source: BSP
Tourism Preliminary tourist arrival data released by DOT Caraga for Q2 2019 indicated a huge decline by 81.31 percent, from 410,268 tourist arrival in Q2 2018 to only 76,655 tourist arrival in the same period this year (Figure 31). This was attributed
to the drop in the tourist arrival of both domestic and foreign tourists. The number of domestic tourists visiting the region, which encompassed 86.05 percent of the aggregate tourist arrival in the region, plunged by 83.00 percent compared to the same period in 2018. Likewise, the number of foreign tourists plummeted by 51.02 percent during the period. On the other hand, no data on the overseas tourist arrival was recorded for Q2 2019.
Page 11 of 18
Page 12 of 18

Page 14
Moreover, the number of accredited tourism-related establishments (TREs) rose 53.75 percent in Q2 2019 relative to the same period in 2018 (Figure 32). Notable increase of
accredited TREs was noted in Surigao del Norte and Surigao del Sur, which was attributed by the continuous effort of DOT Caraga and the concerned LGUs on mandatory accreditation of primary tourism enterprises in the region.
Air Transportation
The recorded air traffic in the region for Q2 2019 declined by 6.42 percent, which totalled to 3,601 flights against 3,848 flights in the same period of 2018 (Figure 33). Consequently, a decline was
noted in the number of air passenger and the volume of cargoes during the period by 6.60 percent (Figure 34) and 3.0 percent (Figure 35),
respectively. In particular, there was a drop in the number of flights and air passengers recorded particularly in Butuan and Surigao Airports, while no recorded commercial operation in Tandag Airport since February of this year. Meanwhile, the Siargao Airport exhibited growth in the
number of flights and air passengers by 21.61 percent and 36.77 percent that was ascribed to the thriving tourism industry in Siargao Islands, Surigao del Norte.
Sea Transportation
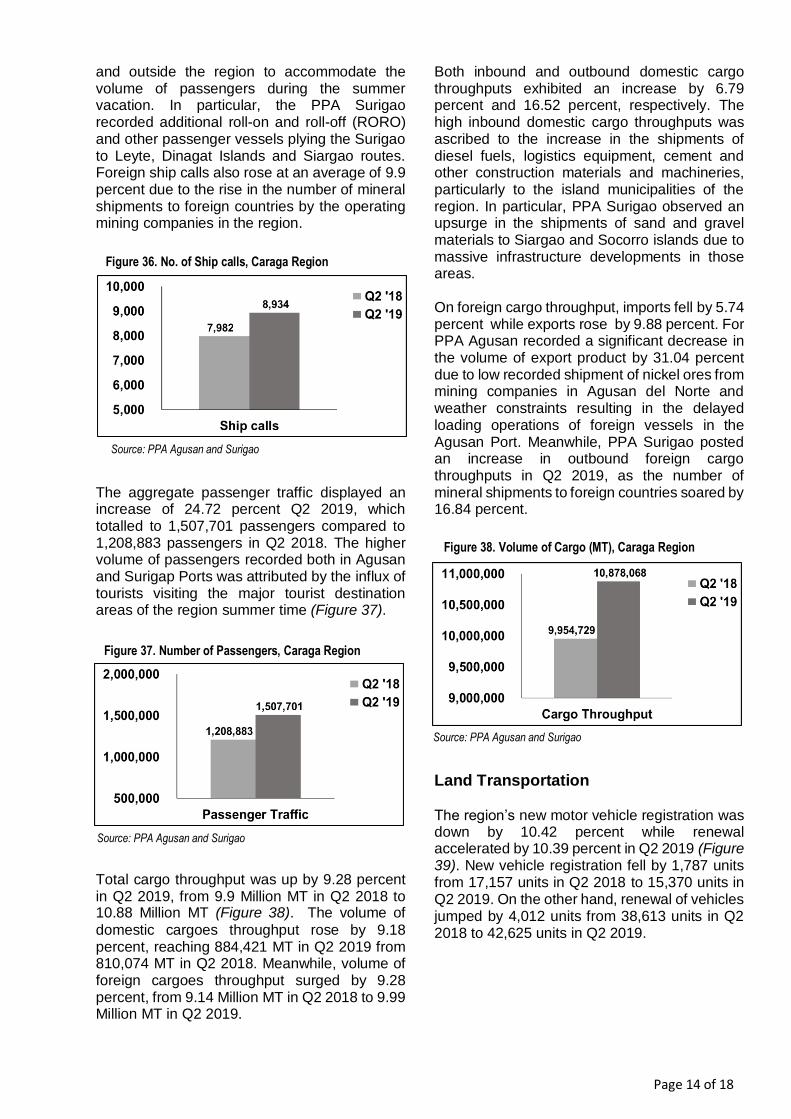
The region’s sea traffic significantly expanded in Q2 2019 as evident in the recorded number of ship calls, which grew by 11.93 percent from 7,982 in Q2 2018 to 8,934 ship calls (Figure 36). Both the Agusan and Surigao Ports exhibited a surge in domestic ship calls at an average of 12.0 percent, which comprised roughly 98 percent of the region’s sea traffic. This was attributed to the increase in the number of voyages of passenger vessels operating within
Figure 31. Tourist Arrivals, Caraga Region
Source: DOT Caraga
Figure 33. Number of Flights, Caraga Region
Source: CAAP Butuan, Surigao, Siargao and Tandag
Figure 34. Number of Passengers, Caraga Region
Source: CAAP Butuan, Surigao, Siargao and Tandag
Figure 35. Volume of Cargo, Caraga Region
Source: CAAP Butuan, Surigao, Siargao and Tandag
Figure 32. Accredited Tourism-Related Establishments
Caraga Region
Source: DOT Caraga
Page 13 of 18
Page 15
and outside the region to accommodate the volume of passengers during the summer vacation. In particular, the PPA Surigao recorded additional roll-on and roll-off (RORO) and other passenger vessels plying the Surigao to Leyte, Dinagat Islands and Siargao routes. Foreign ship calls also rose at an average of 9.9 percent due to the rise in the number of mineral shipments to foreign countries by the operating mining companies in the region. The aggregate passenger traffic displayed an increase of 24.72 percent Q2 2019, which totalled to 1,507,701 passengers compared to 1,208,883 passengers in Q2 2018. The higher volume of passengers recorded both in Agusan and Surigap Ports was attributed by the influx of tourists visiting the major tourist destination areas of the region summer time (Figure 37).
Total cargo throughput was up by 9.28 percent in Q2 2019, from 9.9 Million MT in Q2 2018 to 10.88 Million MT (Figure 38). The volume of
domestic cargoes throughput rose by 9.18 percent, reaching 884,421 MT in Q2 2019 from 810,074 MT in Q2 2018. Meanwhile, volume of foreign cargoes throughput surged by 9.28 percent, from 9.14 Million MT in Q2 2018 to 9.99 Million MT in Q2 2019.
Both inbound and outbound domestic cargo throughputs exhibited an increase by 6.79 percent and 16.52 percent, respectively. The high inbound domestic cargo throughputs was ascribed to the increase in the shipments of diesel fuels, logistics equipment, cement and other construction materials and machineries, particularly to the island municipalities of the region. In particular, PPA Surigao observed an upsurge in the shipments of sand and gravel materials to Siargao and Socorro islands due to massive infrastructure developments in those areas.
On foreign cargo throughput, imports fell by 5.74 percent while exports rose by 9.88 percent. For PPA Agusan recorded a significant decrease in the volume of export product by 31.04 percent due to low recorded shipment of nickel ores from mining companies in Agusan del Norte and weather constraints resulting in the delayed loading operations of foreign vessels in the Agusan Port. Meanwhile, PPA Surigao posted an increase in outbound foreign cargo throughputs in Q2 2019, as the number of mineral shipments to foreign countries soared by 16.84 percent.
Land Transportation The region’s new motor vehicle registration was down by 10.42 percent while renewal accelerated by 10.39 percent in Q2 2019 (Figure 39). New vehicle registration fell by 1,787 units from 17,157 units in Q2 2018 to 15,370 units in Q2 2019. On the other hand, renewal of vehicles jumped by 4,012 units from 38,613 units in Q2 2018 to 42,625 units in Q2 2019.
Figure 38. Volume of Cargo (MT), Caraga Region
Source: PPA Agusan and Surigao
Figure 37. Number of Passengers, Caraga Region
Source: PPA Agusan and Surigao
Figure 36. No. of Ship calls, Caraga Region
Source: PPA Agusan and Surigao
Page 14 of 18

About 93.00 percent of the newly registered vehicles were accounted in Agusan del Norte and the remaining 7.00 percent was contributed by Surigao del Sur. The bulk share of the region’s renewal of vehicles is situated in Agusan del Norte at 55.90 percent. This was followed by Surigao del Sur at 16.58 percent, Surigao del Norte at 15.94 percent and Agusan del Sur at 11.58 percent.
.
Figure 39. Motor Vehicle Registration, Caraga Region
Source: DOTr Caraga
Page 15 of 18

PEACE AND SECURITY
Criminality The region’s average monthly crime rate (AMCR)1 reduced by 1.75 percentage points in Q2 this year, which recorded at 27.31 percent compared to 29.06 in the same period last year. This implies that on the average, there were 27 crimes recorded per 100,000 population in the region from April to June of this year (Table 10).
The region’s incidents of index crimes2, which accounted 17.37 percent of the total crime volume substantially dropped by 15.43 percent in Q2 2019 due to substantial reduction in the reported incidents of murder (13.75 percent), physical injury (6.04 percent), rape (3.70 percent), robbery (29.41 percent) and theft (39.45 percent), particularly in Butuan City and the provinces Agusan del Sur, Surigao del Norte and Surigao del Sur. Meanwhile, both Agusan del Norte and the Province of Dinagat Islands recorded notable surge in index crimes, which posted at 22.03 percent and 15.38 percent, respectively. Higher incidents of murder and physical injuries were recorded in Agusan del Norte in Q2 this year, which grew by 15.38 percent and 12.5 percent compared to the same period last year. Moreover, the reported cases of rape and physical injuries in the Province of Dinagat Islands amplified by 133.33 percent and 300.0 percent relative to the recorded incidents in the same period last year. On the other hand, non-index crimes3 increased by 1.09 percent in Q2 2019 against the reported
incidents in the same period last year. This was attributed to the substantial increase in the reported cases of reckless imprudence resulting (RIR) to physical injuries and damage to properties by 15.30 percent and other non-index crimes by 23.81 percent, particularly in Butuan City and the provinces of Agusan del Norte and Surigao del Norte. The region achieved substantial improvement in crime clearance efficiency (CCE)4 and crime solution efficiency (CSE)5, with an average of 94 percent and 90 percent, respectively. Surigao del Norte topped other LGUs at 95 percent on CCE while the Province of Dinagat Islands obtained the highest CSE at 93 percent. The decrease of index crimes is attributed to the region’s intensified law enforcement and anti-criminality operations such as “Oplan Sita” and campaign against loose firearms particularly on crime prone areas. The continuous illegal-drug operations also contributed to the reduction on index crimes. Strengthened collaboration with the communities also played a significant role in the reduction of crimes and insurgency. Continuous trainings and seminars such as basic skills and techniques in criminal investigation made a positive impact on the successful solution of crimes and filing of cases in court. Proper and effective implementation of the Police Integrated Patrol System (PIPS).
) through foot and mobile patrols enhanced the region’s crime prevention and solution. Table 9. Crime Statistics, Caraga Region
Indicator Q2 ‘18 Q2‘19 Percent (%) Change
Index Crime
Butuan City 74 68 (8.11)
ADN 59 72 22.03
ADS 114 89 (21.93)
PDI 13 15 15.38
SDN 106 81 (23.58)
SDS 94 64 (31.91)
Caraga 460 389 (15.43)
1 AMCR is calculated as number of crimes over total population over number
of months multiplied by 100,000 population. 2 PNP defined index crimes as crimes which are sufficiently significant and
which occur with sufficient regularity to be meaningful, such as murder, physical injury, robbery, theft and rape. 3 PNP defined non-index crimes as all types of crimes not considered as
index crimes.
Indicator Q2 ‘18 Q2‘19 Percent (%) Change
Non-Index Crime
Butuan City 300 381 27.00
ADN 292 292 0.00
ADS 519 430 (17.15)
PDI 37 39 5.41
SDN 302 356 17.88
SDS 380 352 (7.37)
Caraga 1830 1820 1.09
Crime Volume
Butuan City 374 449 20.05 ADN 351 364 3.70
ADS 633 519 (18.01)
PDI 50 54 8.00
4 PNP defined CCE as the percentage of cleared cases out of the total
number of crime incidents handled by law enforcement agencies for a given period of time. 5 PNP defined CSC as the percentage of solved cases out of the total
number of crime incidents handled by law enforcement agencies for given
period of time.
Page 16 of 18

Indicator Q2 ‘18 Q2‘19 Percent (%) Change
SDN 408 437 7.11
SDS 474 416 (12.24)
Caraga 2290 2239 (2.23)
Crime Clearance Efficiency (%) Butuan City 85 93 8
ADN 90 93 3
ADS 88 94 6
PDI 85 94 9
SDN 83 95 12
SDS 84 93 9
Caraga 86 94 8
Crime Solution Efficiency (%)
Butuan City 70 87 17 ADN 85 90 5
ADS 82 87 5
PDI 78 93 15
SDN 74 91 17
SDS 76 89 13
Caraga 78 90 12
Source: PNP Caraga
Page 17 of 18

DEVELOPMENT PROSPECTS Agriculture Development
Ongoing construction of Integrated Rubber Production and Marketing in Km. 7, Tungao, Butuan City with a total project cost of PhP 22.46 Million. The project, which is funded under the Department of Agriculture’s Philippine Rural Development Project (DA-PRDP), involves the construction of a Nursery Seedling Production Facility, a Nursery Seed Bed and a Consolidation Warehouse, which would benefit 158 households. (Source:
Reports from RPCO-13, http://prdp.da.gov.ph/ensuring-project-quality-by-strict-monitoring-and-inspection/)
On-going construction of Warehouse and Multi-Purpose Drying Pavement for the Cassava Granules Processing and Marketing located in Brgy. Cayetano, Dinagat, Province of Dinagat Islands. The project has a total project cost amounting to PhP 2.93 Million. Said project is a component of a PhP 10.0 Million DA-PRDP-funded subproject that would benefit 1,069 beneficiaries in the province. (Source:
Reports from RPCO-13, http://prdp.da.gov.ph/ensuring-project-quality-by-strict-monitoring-and-inspection/)
Distribution of hauling trucks to farmers’ cooperatives in the region by DA Caraga with a total cost of PhP 10.9 Million. (Source: Philippine Information Agency – Caraga Facebook Page)
Implementation of a 3.6 km Concreting of R. Ecleo to Upper Laguna Farm-to-Market Road Project funded under the DA-PRDP, which is located in Cagdianao, Dinagat Islands with a total project cost amounting to PhP 108 Million. (Source: Department of
Agriculture – Caraga Facebook Page)
Distribution of 67 units of rice combine harvesters by DA-Caraga with a total worth of PhP 82 Million, which is funded under the Rice Competitiveness Enhancement Fund (RCEF). (Source: Department of Agriculture –
Caraga Facebook Page)
Distribution of farm machineries and equipment to 249 farmers associations by DA-Caraga with total project cost amounting to PhP 209 Million, which is
funded under RCEF. (Source: Department of
Agriculture – Caraga Facebook Page)
Infrastructure Development
On-going conduct of feasibility study on DOTR’s Mindanao Railway Project Phase 2, which is pipelined for China financing. The proposed project will encompass a construction of a 206.20 km. railway line that would extend from Tagum City to Butuan City with an estimated total project cost amounting to PhP 71.63 Billion. (Source: neda.gov.ph, infrastructure flagship projects as of July 2019, http://www.neda.gov.ph/infrastructure-flagship-projects)
Construction of new Anao-aon Bridge that is utilizing Corrugated Steel Plates (CSP), a support material to make bridges earthquake-resistant, with a total cost of PhP 179.92 Million. (Source: Department of
Public Works and Highways – Caraga Facebook Page)
On-going construction/maintenance of flood mitigation structures and drainage systems of Butuan City’s Lower Agusan Development Project - Flood Control Component with a total project cost amounting to PhP 101.87 Million. (Source:
Department of Public Works and Highways – Caraga Facebook Page)
Ongoing repair of Surigao City Airport runway wherein the initial 400 meters portion is on track to meet the deadline by November this year and the remaining 700 meters is on February 2020. (Source:
Jennifer P. Gaitano, https://pia.gov.ph/news/articles/1027008)
Business and Commercial Development
Sprouting of 7-Eleven convenience stores in Caraga Region.
Construction of Penong’s Butuan Restaurant along JC Aquino Avenue near Metrobank, Butuan City.
Page 18 of 18