Embed Size (px)
Citation preview

Table of Contents
Section 1
Introduction 1
Section 2
Regulatory Reform 2
Section 3
Capital 3Capital Adequacy 3Capital Structure 4Detailed Capital Disclosures 5Leverage Ratio 12
Section 4
Credit Risk 14General Disclosures 14Standardised and Supervisory Slotting Portfolios 27Internal Ratings-based Portfolios 28Credit Risk Mitigation 32Counterparty Credit Risk 34
Section 5
Securitisation 35
Section 6
Market Risk 38
Section 7
Balance Sheet and Liquidity Risk 41Interest Rate Risk in the Banking Book 41Equity Holdings in the Banking Book 41Liquidity Disclosures 42
Section 8
Glossary 47
Section 9
Reference to APS 330 49
Introduction
Section 1
Introduction
National Australia Bank Limited (NAB) is an Authorised Deposit-taking Institution (ADI) subject to regulation by the AustralianPrudential Regulation Authority (APRA) under the authority of the Banking Act 1959 (Cth). This document has been prepared inaccordance with APRA Prudential Standard APS 330 Public Disclosure.
APS 330 requires disclosure of information to the market relating to capital adequacy and risk management practices. APS 330was established to implement the third pillar of the Basel Committee on Banking Supervision’s (BCBS) framework for bankcapital adequacy. In simple terms, the framework consists of three mutually reinforcing pillars.
Pillar 1Minimum capital requirement
Pillar 2Supervisory review process
Pillar 3Market discipline
Minimum requirements for the level and quality ofcapital
Management’s responsibility for capital adequacyto support risks beyond the minimum requirements,including an Internal Capital Adequacy AssessmentProcess (ICAAP)
Disclosure to the market of qualitative and quantitativeaspects of risk management, capital adequacy andvarious risk metrics
This document provides information about risk exposures, capital adequacy and liquidity of the Group, being NAB and itscontrolled entities.
Amounts are presented in Australian dollars unless otherwise stated, and have been rounded to the nearest million dollars ($m)except where indicated.
Capital Adequacy Methodologies
The following illustration sets out the Group's approach to measuring capital adequacy as at 31 March 2019.
Credit Risk Operational Risk Non-traded Market Risk Traded Market RiskAdvanced
Internal Ratings-BasedApproach (IRB)
AdvancedMeasurement
Approach (AMA)
Internal ModelApproach (IMA)
Standardisedand Internal Model
Approach (IMA)
Bank of New Zealand (BNZ), is a wholly owned subsidiary of the Group and is a registered bank under the Reserve Bank ofNew Zealand Act 1989. BNZ is subject to capital adequacy requirements mandated by the Reserve Bank of New Zealand(RBNZ), under which BNZ applies the internal ratings-based approach. BNZ credit risk exposures consolidated in the Groupexposures are calculated under RBNZ requirements.
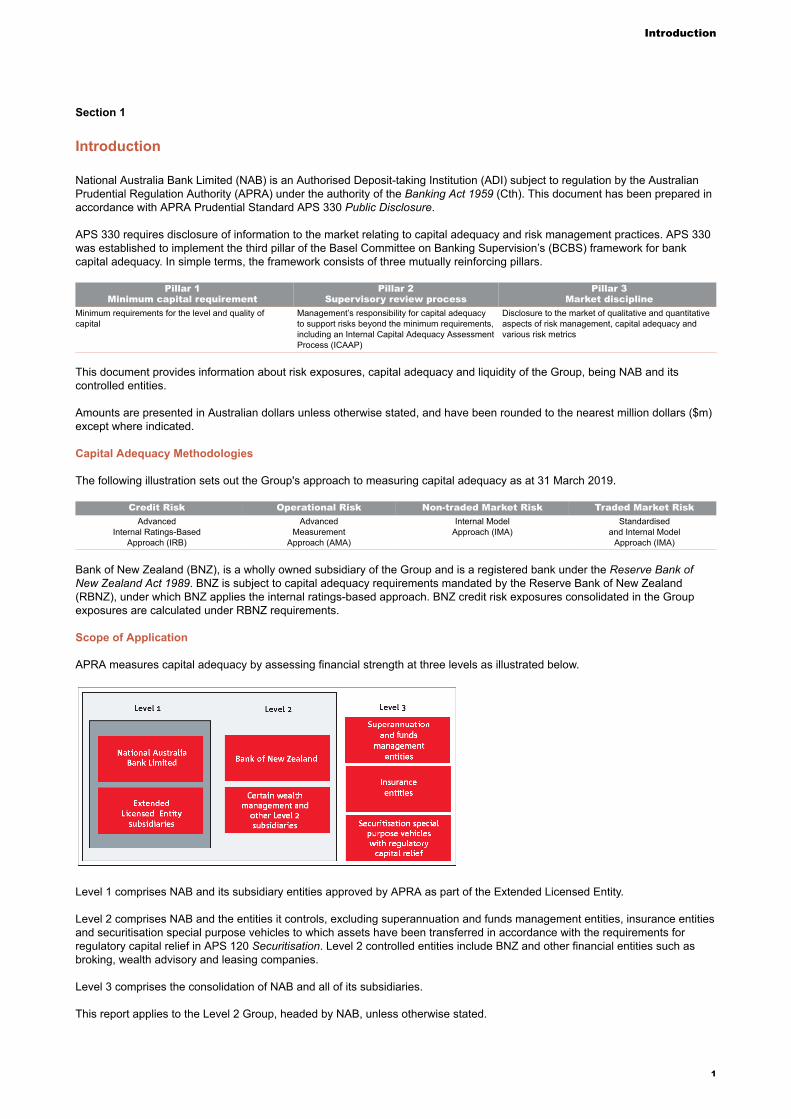
Scope of Application
APRA measures capital adequacy by assessing financial strength at three levels as illustrated below.
Level 1 comprises NAB and its subsidiary entities approved by APRA as part of the Extended Licensed Entity.
Level 2 comprises NAB and the entities it controls, excluding superannuation and funds management entities, insurance entitiesand securitisation special purpose vehicles to which assets have been transferred in accordance with the requirements forregulatory capital relief in APS 120 Securitisation. Level 2 controlled entities include BNZ and other financial entities such asbroking, wealth advisory and leasing companies.
Level 3 comprises the consolidation of NAB and all of its subsidiaries.
This report applies to the Level 2 Group, headed by NAB, unless otherwise stated.
1
Regulatory Reform
Section 2
Regulatory Reform
The Group remains focused on areas of regulatory change. Key reforms that may affect its capital and funding include:
‘Unquestionably Strong’ and Basel III Revisions
• In December 2017, the BCBS finalised the Basel III capital framework. APRA subsequently commenced consultation onrevisions to the domestic capital framework in February 2018 and reaffirmed its intention to strengthen banking systemresilience by establishing 'unquestionably strong' capital ratios. APRA expects major Australian banks to achieve CommonEquity Tier 1 (CET1) capital ratios of at least 10.5% by 1 January 2020 based on existing risk-weighted assets (RWA)methodologies.
• APRA’s consultation on revisions to the capital framework includes consideration of 'benchmarks for capital strength', 'risksensitivity of the capital framework' and 'transparency, comparability and flexibility of the capital framework'. Consultation willcontinue in 2019 and 2020 for proposed implementation by 1 January 2022.
• APRA has also proposed a minimum leverage ratio requirement of 3.5% for IRB ADIs and a revised leverage ratio exposuremeasurement methodology from 1 January 2022. The Group's leverage ratio as at 31 March 2019 of 5.48% (under currentmethodology) is disclosed in further detail in Table 3.1B Capital and Leverage Ratios.
• APRA has finalised its prudential requirements for the standardised approach to counterparty credit risk (SA-CCR), which areintroduced in the new Prudential Standard APS 180 Counterparty Credit Risk. These requirements will take effect from 1 July2019.
Increased Loss-absorbing Capacity for ADIs
In November 2018, APRA released its consultation on the implementation of an Australian loss-absorbing capacity regime.APRA has proposed an increase in Total capital of between 4% and 5% of RWA for Domestic Systemically Important Banks (D-SIBs). Finalisation of requirements is expected in 2019 with implementation by 2023.
RBNZ Capital Review
In New Zealand, the RBNZ is undertaking a review of the capital adequacy framework applying to registered banks incorporatedin New Zealand. In December 2018, the RBNZ proposed amendments to the amount of regulatory capital required of locallyincorporated banks, including:• increases in RWA for banks that use the internal ratings-based approach via internal ratings-based approach (IRB)
recalibration, increased scalars and the introduction of standardised output floors• an increase in the Tier 1 capital requirement to 16% of RWA.The RBNZ is proposing various dates for implementation of the proposed changes, including increases in the Tier 1 capitalrequirement over a five year period to 2023.
Other regulatory changes of note include:
• The BCBS announced its revised market risk framework, which is due to come into effect from 1 January 2022 globally.APRA has advised that domestic timing will not be confirmed prior to global rules being finalised. While the Credit ValueAdjustment (CVA) framework has been finalised by the BCBS, it may be subject to further recalibration as a result of themarket risk framework review. APRA will commence consultation on the CVA framework post recalibration.
• APRA's standards on the non-capital components of the supervision of conglomerate groups (Level 3 framework) took effecton 1 July 2017. Level 3 capital requirements are expected to be determined following the finalisation of other domestic andinternational policy initiatives, with APRA advising that implementation will be no earlier than 2019.
• APRA’s revised Related Entity framework will take effect from 2020.• A new Australian Accounting Standard AASB 16 Leases is applicable from 1 October 2019. AASB 16 requires lessees to
recognise leases (subject to certain exceptions) on-balance sheet in a manner comparable to the current accounting forfinance leases, which is expected to impact RWA for non-lending asset exposures.
2
Capital
Section 3
Capital
3.1 Capital Adequacy
Table 3.1A: Risk-weighted Assets
The following table provides RWA for each risk type.
As at31 Mar 19 30 Sep 18
$m $mCredit risk(1)
Subject to IRB approachCorporate (including Small and Medium Enterprises (SME)) 124,352 116,709Sovereign 1,351 1,293Bank 10,444 10,042Residential mortgage 105,979 103,868Qualifying revolving retail 3,822 3,993Retail SME 6,575 6,531Other retail 3,334 3,419
Total IRB approach 255,857 245,855Specialised lending 59,506 60,444Subject to standardised approach
Residential mortgage 1,645 1,558Corporate 4,733 4,670Other 483 493
Total standardised approach 6,861 6,721Other
Securitisation exposures 4,739 4,598Credit Value Adjustment 9,061 7,670Central counterparty default fund contribution guarantee 823 1,138Other(2) 8,550 4,955
Total other 23,173 18,361Total credit risk 345,397 331,381Market risk 9,190 9,460Operational risk 40,945 37,500Interest rate risk in the banking book(3) 7,673 11,343Total RWA 403,205 389,684
(1) Assets that are not subject to specific risk-weights incorporate a scaling factor of 1.06 in accordance with APS 113 Capital Adequacy: Internal Ratings-based Approach to Credit Risk.(2) Other includes non-lending assets and RWA overlay adjustments for regulatory prescribed methodology requirements. The increase over the period is largely driven by higher RWA
overlay adjustments reflecting a change in the recognition of certain off-balance sheet facilities.(3) The decrease over the period is largely due to a change in rate shock methodology.
Table 3.1B: Capital and Leverage Ratios
The following tables provide:• the key capital ratios for the Level 1 and Level 2 Group and for the Group's significant overseas bank subsidiary• the leverage ratio for the Level 2 Group as at 31 March 2019 and for the three previous quarters
As at31 Mar 19 30 Sep 18
Capital ratios % %Level 2 Common Equity Tier 1 capital ratio 10.40 10.20Level 2 Tier 1 capital ratio 12.45 12.38Level 2 Total capital ratio 14.00 14.12Level 1 Common Equity Tier 1 capital ratio 10.64 10.43Level 1 Tier 1 capital ratio 12.86 12.78Level 1 Total capital ratio 14.50 14.65Significant bank subsidiary(1)
BNZ Common Equity Tier 1 capital ratio 10.60 10.56BNZ Tier 1 capital ratio 11.96 11.96BNZ Total capital ratio 13.57 13.59
(1) BNZ’s capital ratios have been derived under the RBNZ's capital adequacy framework.
3
Capital
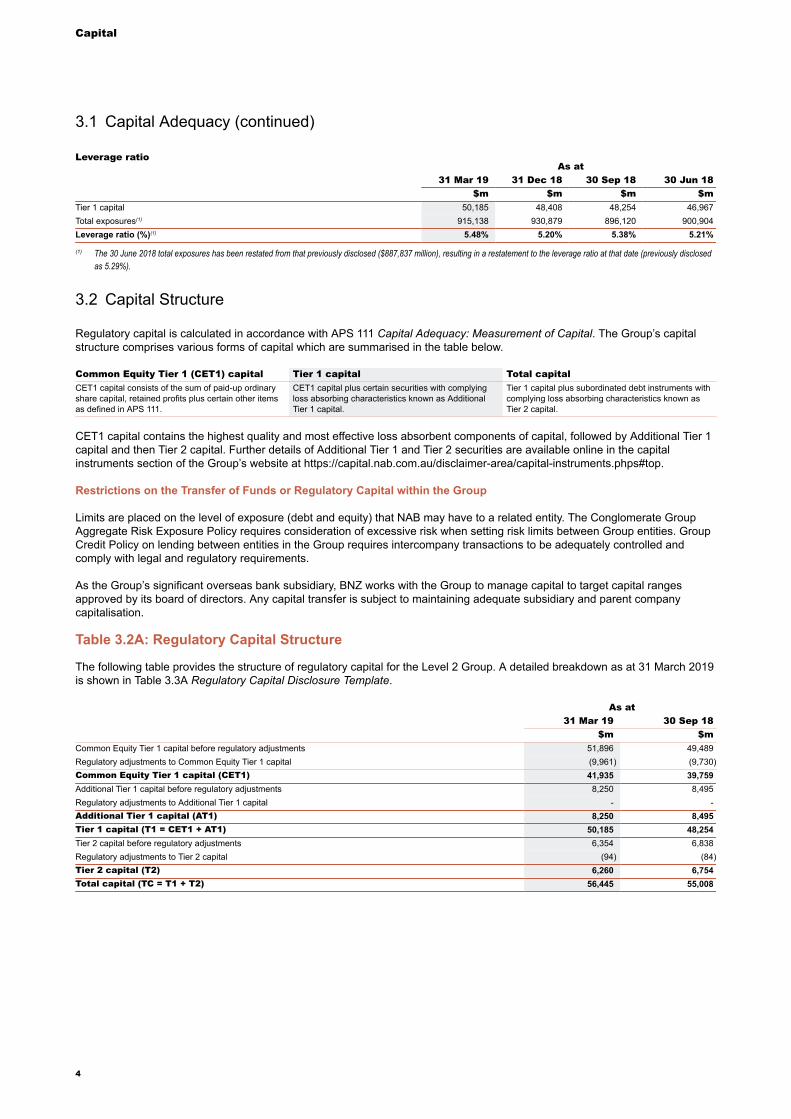
Leverage ratioAs at
31 Mar 19 31 Dec 18 30 Sep 18 30 Jun 18$m $m $m $m
Tier 1 capital 50,185 48,408 48,254 46,967Total exposures(1) 915,138 930,879 896,120 900,904Leverage ratio (%)(1) 5.48% 5.20% 5.38% 5.21%
(1) The 30 June 2018 total exposures has been restated from that previously disclosed ($887,837 million), resulting in a restatement to the leverage ratio at that date (previously disclosedas 5.29%).
3.2 Capital Structure
Regulatory capital is calculated in accordance with APS 111 Capital Adequacy: Measurement of Capital. The Group’s capitalstructure comprises various forms of capital which are summarised in the table below.
Common Equity Tier 1 (CET1) capital Tier 1 capital Total capitalCET1 capital consists of the sum of paid-up ordinaryshare capital, retained profits plus certain other itemsas defined in APS 111.
CET1 capital plus certain securities with complyingloss absorbing characteristics known as AdditionalTier 1 capital.
Tier 1 capital plus subordinated debt instruments withcomplying loss absorbing characteristics known asTier 2 capital.
CET1 capital contains the highest quality and most effective loss absorbent components of capital, followed by Additional Tier 1capital and then Tier 2 capital. Further details of Additional Tier 1 and Tier 2 securities are available online in the capitalinstruments section of the Group’s website at https://capital.nab.com.au/disclaimer-area/capital-instruments.phps#top.
Restrictions on the Transfer of Funds or Regulatory Capital within the Group
Limits are placed on the level of exposure (debt and equity) that NAB may have to a related entity. The Conglomerate GroupAggregate Risk Exposure Policy requires consideration of excessive risk when setting risk limits between Group entities. GroupCredit Policy on lending between entities in the Group requires intercompany transactions to be adequately controlled andcomply with legal and regulatory requirements.
As the Group’s significant overseas bank subsidiary, BNZ works with the Group to manage capital to target capital rangesapproved by its board of directors. Any capital transfer is subject to maintaining adequate subsidiary and parent companycapitalisation.
Table 3.2A: Regulatory Capital Structure
The following table provides the structure of regulatory capital for the Level 2 Group. A detailed breakdown as at 31 March 2019is shown in Table 3.3A Regulatory Capital Disclosure Template.
As at31 Mar 19 30 Sep 18
$m $mCommon Equity Tier 1 capital before regulatory adjustments 51,896 49,489Regulatory adjustments to Common Equity Tier 1 capital (9,961) (9,730)Common Equity Tier 1 capital (CET1) 41,935 39,759Additional Tier 1 capital before regulatory adjustments 8,250 8,495Regulatory adjustments to Additional Tier 1 capital - -Additional Tier 1 capital (AT1) 8,250 8,495Tier 1 capital (T1 = CET1 + AT1) 50,185 48,254Tier 2 capital before regulatory adjustments 6,354 6,838Regulatory adjustments to Tier 2 capital (94) (84)Tier 2 capital (T2) 6,260 6,754Total capital (TC = T1 + T2) 56,445 55,008
4
3.1 Capital Adequacy (continued)
Capital
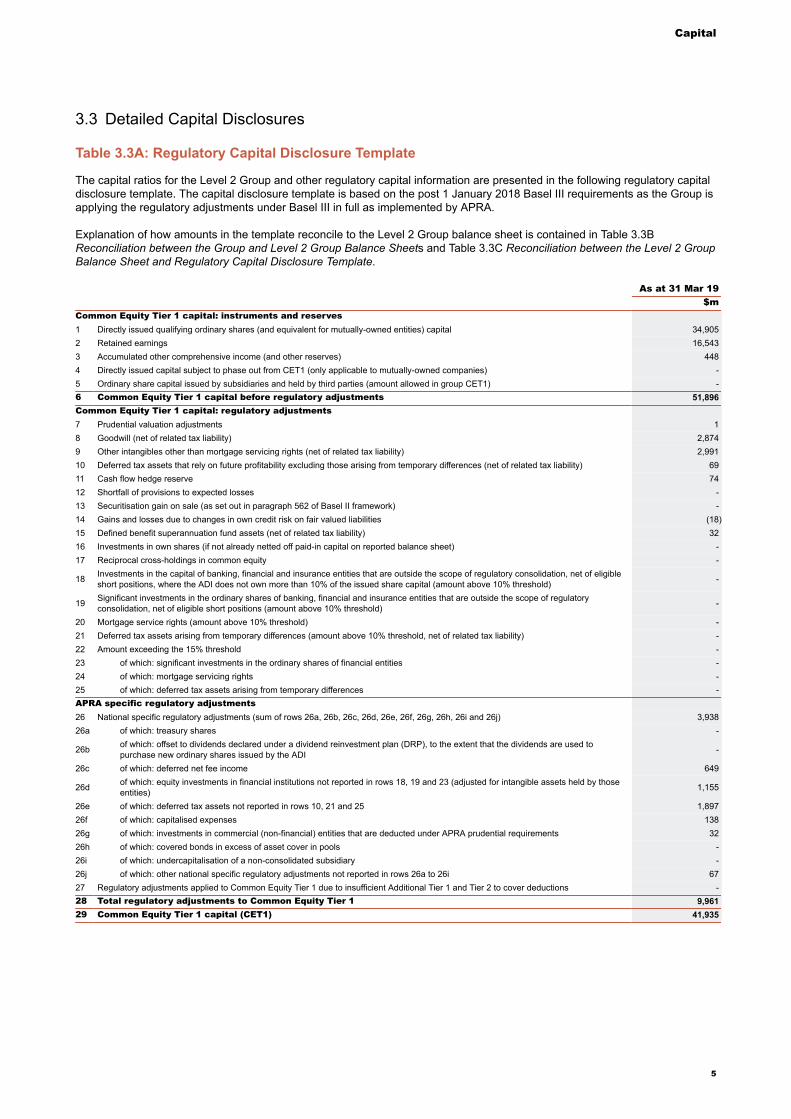
3.3 Detailed Capital Disclosures
Table 3.3A: Regulatory Capital Disclosure Template
The capital ratios for the Level 2 Group and other regulatory capital information are presented in the following regulatory capitaldisclosure template. The capital disclosure template is based on the post 1 January 2018 Basel III requirements as the Group isapplying the regulatory adjustments under Basel III in full as implemented by APRA.
Explanation of how amounts in the template reconcile to the Level 2 Group balance sheet is contained in Table 3.3BReconciliation between the Group and Level 2 Group Balance Sheets and Table 3.3C Reconciliation between the Level 2 GroupBalance Sheet and Regulatory Capital Disclosure Template.
As at 31 Mar 19$m
Common Equity Tier 1 capital: instruments and reserves1 Directly issued qualifying ordinary shares (and equivalent for mutually-owned entities) capital 34,9052 Retained earnings 16,5433 Accumulated other comprehensive income (and other reserves) 4484 Directly issued capital subject to phase out from CET1 (only applicable to mutually-owned companies) -5 Ordinary share capital issued by subsidiaries and held by third parties (amount allowed in group CET1) -6 Common Equity Tier 1 capital before regulatory adjustments 51,896Common Equity Tier 1 capital: regulatory adjustments7 Prudential valuation adjustments 18 Goodwill (net of related tax liability) 2,8749 Other intangibles other than mortgage servicing rights (net of related tax liability) 2,99110 Deferred tax assets that rely on future profitability excluding those arising from temporary differences (net of related tax liability) 6911 Cash flow hedge reserve 7412 Shortfall of provisions to expected losses -13 Securitisation gain on sale (as set out in paragraph 562 of Basel II framework) -14 Gains and losses due to changes in own credit risk on fair valued liabilities (18)15 Defined benefit superannuation fund assets (net of related tax liability) 3216 Investments in own shares (if not already netted off paid-in capital on reported balance sheet) -17 Reciprocal cross-holdings in common equity -
18 Investments in the capital of banking, financial and insurance entities that are outside the scope of regulatory consolidation, net of eligibleshort positions, where the ADI does not own more than 10% of the issued share capital (amount above 10% threshold) -
19 Significant investments in the ordinary shares of banking, financial and insurance entities that are outside the scope of regulatoryconsolidation, net of eligible short positions (amount above 10% threshold) -
20 Mortgage service rights (amount above 10% threshold) -21 Deferred tax assets arising from temporary differences (amount above 10% threshold, net of related tax liability) -22 Amount exceeding the 15% threshold -23 of which: significant investments in the ordinary shares of financial entities -24 of which: mortgage servicing rights -25 of which: deferred tax assets arising from temporary differences -APRA specific regulatory adjustments26 National specific regulatory adjustments (sum of rows 26a, 26b, 26c, 26d, 26e, 26f, 26g, 26h, 26i and 26j) 3,93826a of which: treasury shares -
26b of which: offset to dividends declared under a dividend reinvestment plan (DRP), to the extent that the dividends are used topurchase new ordinary shares issued by the ADI -
26c of which: deferred net fee income 649
26d of which: equity investments in financial institutions not reported in rows 18, 19 and 23 (adjusted for intangible assets held by thoseentities) 1,155
26e of which: deferred tax assets not reported in rows 10, 21 and 25 1,89726f of which: capitalised expenses 13826g of which: investments in commercial (non-financial) entities that are deducted under APRA prudential requirements 3226h of which: covered bonds in excess of asset cover in pools -26i of which: undercapitalisation of a non-consolidated subsidiary -26j of which: other national specific regulatory adjustments not reported in rows 26a to 26i 6727 Regulatory adjustments applied to Common Equity Tier 1 due to insufficient Additional Tier 1 and Tier 2 to cover deductions -28 Total regulatory adjustments to Common Equity Tier 1 9,96129 Common Equity Tier 1 capital (CET1) 41,935
5
Capital
As at 31 Mar 19$m
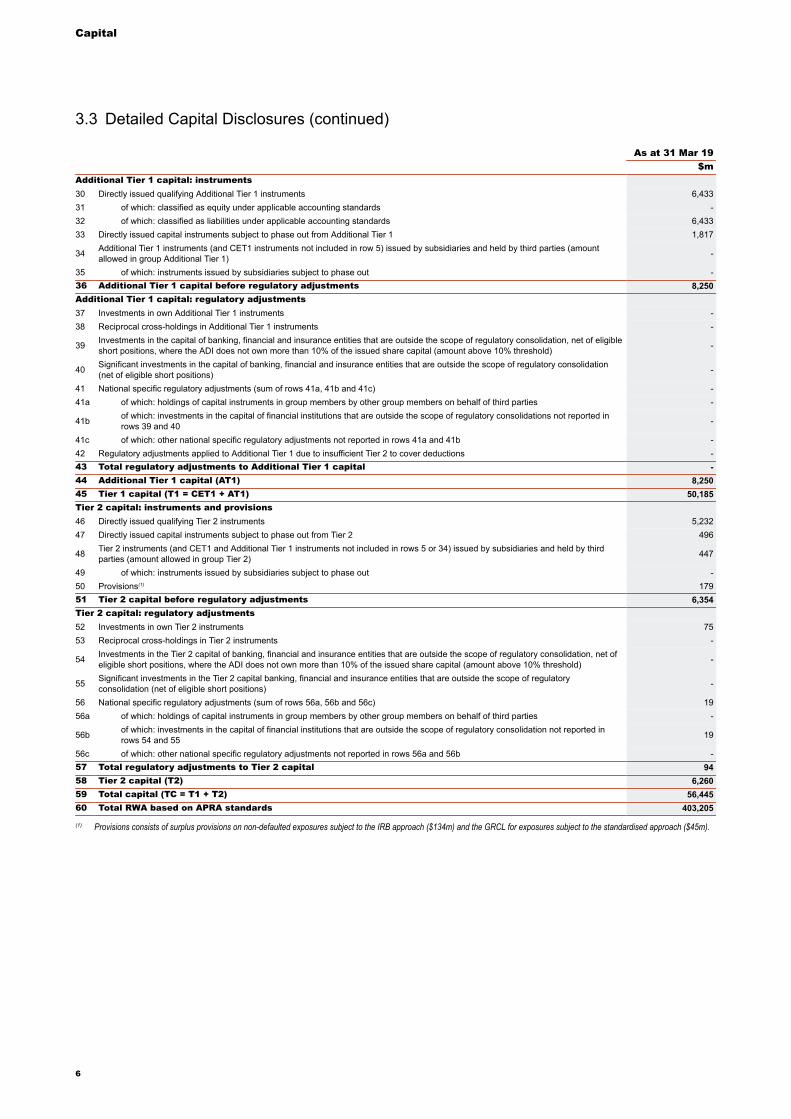
Additional Tier 1 capital: instruments30 Directly issued qualifying Additional Tier 1 instruments 6,43331 of which: classified as equity under applicable accounting standards -32 of which: classified as liabilities under applicable accounting standards 6,43333 Directly issued capital instruments subject to phase out from Additional Tier 1 1,817
34 Additional Tier 1 instruments (and CET1 instruments not included in row 5) issued by subsidiaries and held by third parties (amountallowed in group Additional Tier 1) -
35 of which: instruments issued by subsidiaries subject to phase out -36 Additional Tier 1 capital before regulatory adjustments 8,250Additional Tier 1 capital: regulatory adjustments37 Investments in own Additional Tier 1 instruments -38 Reciprocal cross-holdings in Additional Tier 1 instruments -
39 Investments in the capital of banking, financial and insurance entities that are outside the scope of regulatory consolidation, net of eligibleshort positions, where the ADI does not own more than 10% of the issued share capital (amount above 10% threshold) -
40 Significant investments in the capital of banking, financial and insurance entities that are outside the scope of regulatory consolidation(net of eligible short positions) -
41 National specific regulatory adjustments (sum of rows 41a, 41b and 41c) -41a of which: holdings of capital instruments in group members by other group members on behalf of third parties -
41b of which: investments in the capital of financial institutions that are outside the scope of regulatory consolidations not reported inrows 39 and 40 -
41c of which: other national specific regulatory adjustments not reported in rows 41a and 41b -42 Regulatory adjustments applied to Additional Tier 1 due to insufficient Tier 2 to cover deductions -43 Total regulatory adjustments to Additional Tier 1 capital -44 Additional Tier 1 capital (AT1) 8,25045 Tier 1 capital (T1 = CET1 + AT1) 50,185Tier 2 capital: instruments and provisions46 Directly issued qualifying Tier 2 instruments 5,23247 Directly issued capital instruments subject to phase out from Tier 2 496
48 Tier 2 instruments (and CET1 and Additional Tier 1 instruments not included in rows 5 or 34) issued by subsidiaries and held by thirdparties (amount allowed in group Tier 2) 447
49 of which: instruments issued by subsidiaries subject to phase out -50 Provisions(1) 17951 Tier 2 capital before regulatory adjustments 6,354Tier 2 capital: regulatory adjustments52 Investments in own Tier 2 instruments 7553 Reciprocal cross-holdings in Tier 2 instruments -
54 Investments in the Tier 2 capital of banking, financial and insurance entities that are outside the scope of regulatory consolidation, net ofeligible short positions, where the ADI does not own more than 10% of the issued share capital (amount above 10% threshold) -
55 Significant investments in the Tier 2 capital banking, financial and insurance entities that are outside the scope of regulatoryconsolidation (net of eligible short positions) -
56 National specific regulatory adjustments (sum of rows 56a, 56b and 56c) 1956a of which: holdings of capital instruments in group members by other group members on behalf of third parties -
56b of which: investments in the capital of financial institutions that are outside the scope of regulatory consolidation not reported inrows 54 and 55 19
56c of which: other national specific regulatory adjustments not reported in rows 56a and 56b -57 Total regulatory adjustments to Tier 2 capital 9458 Tier 2 capital (T2) 6,26059 Total capital (TC = T1 + T2) 56,44560 Total RWA based on APRA standards 403,205
(1) Provisions consists of surplus provisions on non-defaulted exposures subject to the IRB approach ($134m) and the GRCL for exposures subject to the standardised approach ($45m).
3.3 Detailed Capital Disclosures (continued)
6
Capital
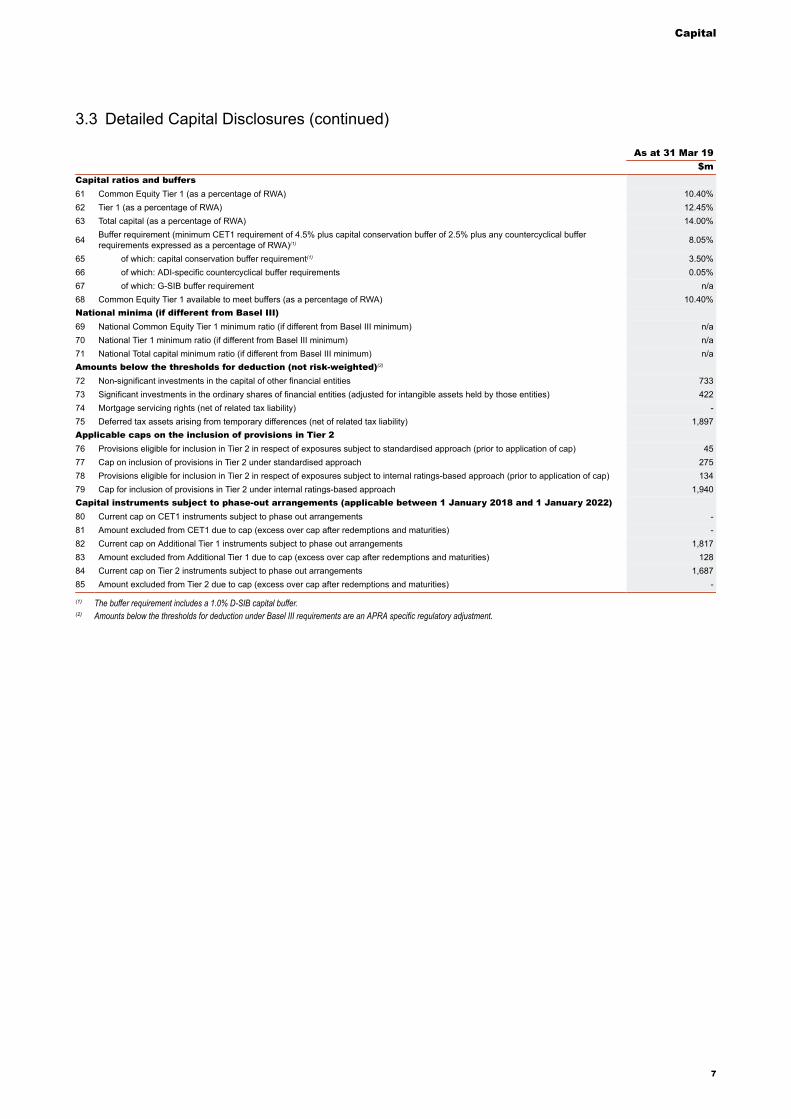
As at 31 Mar 19$m
Capital ratios and buffers61 Common Equity Tier 1 (as a percentage of RWA) 10.40%62 Tier 1 (as a percentage of RWA) 12.45%63 Total capital (as a percentage of RWA) 14.00%
64 Buffer requirement (minimum CET1 requirement of 4.5% plus capital conservation buffer of 2.5% plus any countercyclical bufferrequirements expressed as a percentage of RWA)(1) 8.05%
65 of which: capital conservation buffer requirement(1) 3.50%66 of which: ADI-specific countercyclical buffer requirements 0.05%67 of which: G-SIB buffer requirement n/a68 Common Equity Tier 1 available to meet buffers (as a percentage of RWA) 10.40%National minima (if different from Basel III)69 National Common Equity Tier 1 minimum ratio (if different from Basel III minimum) n/a70 National Tier 1 minimum ratio (if different from Basel III minimum) n/a71 National Total capital minimum ratio (if different from Basel III minimum) n/aAmounts below the thresholds for deduction (not risk-weighted)(2)
72 Non-significant investments in the capital of other financial entities 73373 Significant investments in the ordinary shares of financial entities (adjusted for intangible assets held by those entities) 42274 Mortgage servicing rights (net of related tax liability) -75 Deferred tax assets arising from temporary differences (net of related tax liability) 1,897Applicable caps on the inclusion of provisions in Tier 276 Provisions eligible for inclusion in Tier 2 in respect of exposures subject to standardised approach (prior to application of cap) 4577 Cap on inclusion of provisions in Tier 2 under standardised approach 27578 Provisions eligible for inclusion in Tier 2 in respect of exposures subject to internal ratings-based approach (prior to application of cap) 13479 Cap for inclusion of provisions in Tier 2 under internal ratings-based approach 1,940Capital instruments subject to phase-out arrangements (applicable between 1 January 2018 and 1 January 2022)80 Current cap on CET1 instruments subject to phase out arrangements -81 Amount excluded from CET1 due to cap (excess over cap after redemptions and maturities) -82 Current cap on Additional Tier 1 instruments subject to phase out arrangements 1,81783 Amount excluded from Additional Tier 1 due to cap (excess over cap after redemptions and maturities) 12884 Current cap on Tier 2 instruments subject to phase out arrangements 1,68785 Amount excluded from Tier 2 due to cap (excess over cap after redemptions and maturities) -
(1) The buffer requirement includes a 1.0% D-SIB capital buffer.(2) Amounts below the thresholds for deduction under Basel III requirements are an APRA specific regulatory adjustment.
3.3 Detailed Capital Disclosures (continued)
7
Capital
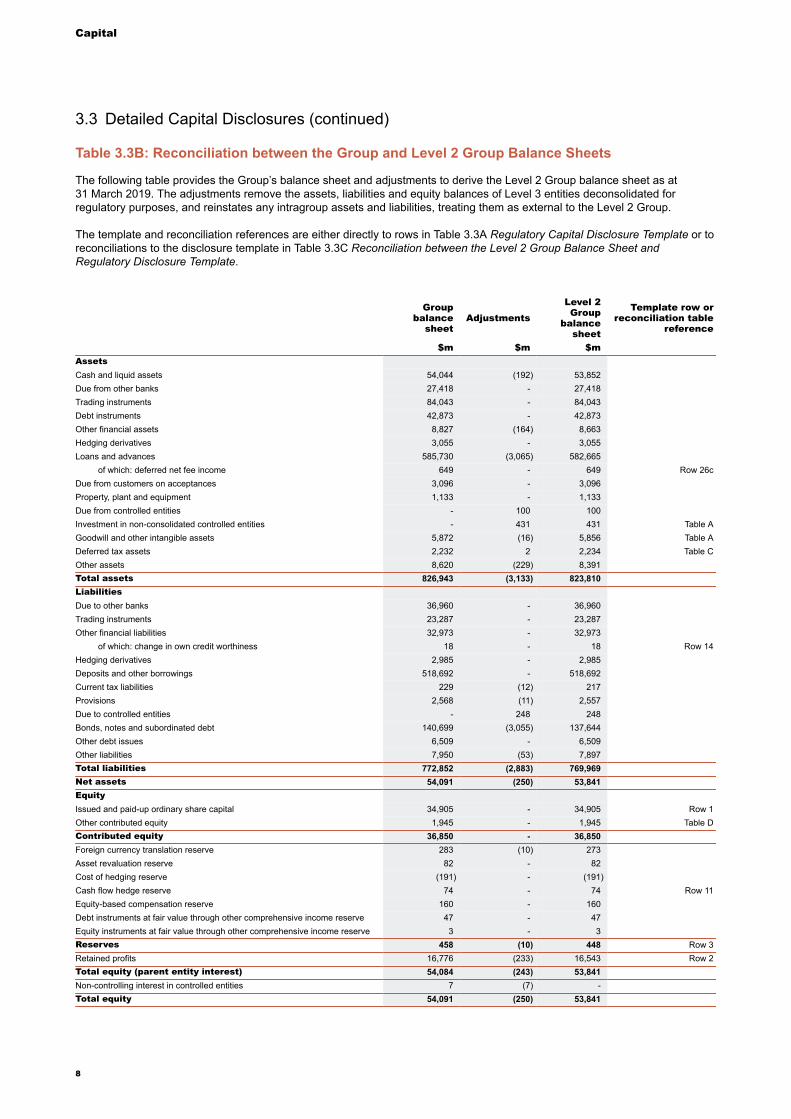
Table 3.3B: Reconciliation between the Group and Level 2 Group Balance Sheets
The following table provides the Group’s balance sheet and adjustments to derive the Level 2 Group balance sheet as at31 March 2019. The adjustments remove the assets, liabilities and equity balances of Level 3 entities deconsolidated forregulatory purposes, and reinstates any intragroup assets and liabilities, treating them as external to the Level 2 Group.
The template and reconciliation references are either directly to rows in Table 3.3A Regulatory Capital Disclosure Template or toreconciliations to the disclosure template in Table 3.3C Reconciliation between the Level 2 Group Balance Sheet andRegulatory Disclosure Template.
Groupbalance
sheetAdjustments
Level 2Group
balancesheet
Template row orreconciliation table
reference
$m $m $mAssetsCash and liquid assets 54,044 (192) 53,852Due from other banks 27,418 - 27,418Trading instruments 84,043 - 84,043Debt instruments 42,873 - 42,873Other financial assets 8,827 (164) 8,663Hedging derivatives 3,055 - 3,055Loans and advances 585,730 (3,065) 582,665
of which: deferred net fee income 649 - 649 Row 26cDue from customers on acceptances 3,096 - 3,096Property, plant and equipment 1,133 - 1,133Due from controlled entities - 100 100Investment in non-consolidated controlled entities - 431 431 Table AGoodwill and other intangible assets 5,872 (16) 5,856 Table ADeferred tax assets 2,232 2 2,234 Table COther assets 8,620 (229) 8,391Total assets 826,943 (3,133) 823,810LiabilitiesDue to other banks 36,960 - 36,960Trading instruments 23,287 - 23,287Other financial liabilities 32,973 - 32,973
of which: change in own credit worthiness 18 - 18 Row 14Hedging derivatives 2,985 - 2,985Deposits and other borrowings 518,692 - 518,692Current tax liabilities 229 (12) 217Provisions 2,568 (11) 2,557Due to controlled entities - 248 248Bonds, notes and subordinated debt 140,699 (3,055) 137,644Other debt issues 6,509 - 6,509Other liabilities 7,950 (53) 7,897Total liabilities 772,852 (2,883) 769,969Net assets 54,091 (250) 53,841EquityIssued and paid-up ordinary share capital 34,905 - 34,905 Row 1Other contributed equity 1,945 - 1,945 Table DContributed equity 36,850 - 36,850Foreign currency translation reserve 283 (10) 273Asset revaluation reserve 82 - 82Cost of hedging reserve (191) - (191)Cash flow hedge reserve 74 - 74 Row 11Equity-based compensation reserve 160 - 160Debt instruments at fair value through other comprehensive income reserve 47 - 47Equity instruments at fair value through other comprehensive income reserve 3 - 3Reserves 458 (10) 448 Row 3Retained profits 16,776 (233) 16,543 Row 2Total equity (parent entity interest) 54,084 (243) 53,841Non-controlling interest in controlled entities 7 (7) -Total equity 54,091 (250) 53,841
3.3 Detailed Capital Disclosures (continued)
8
Capital
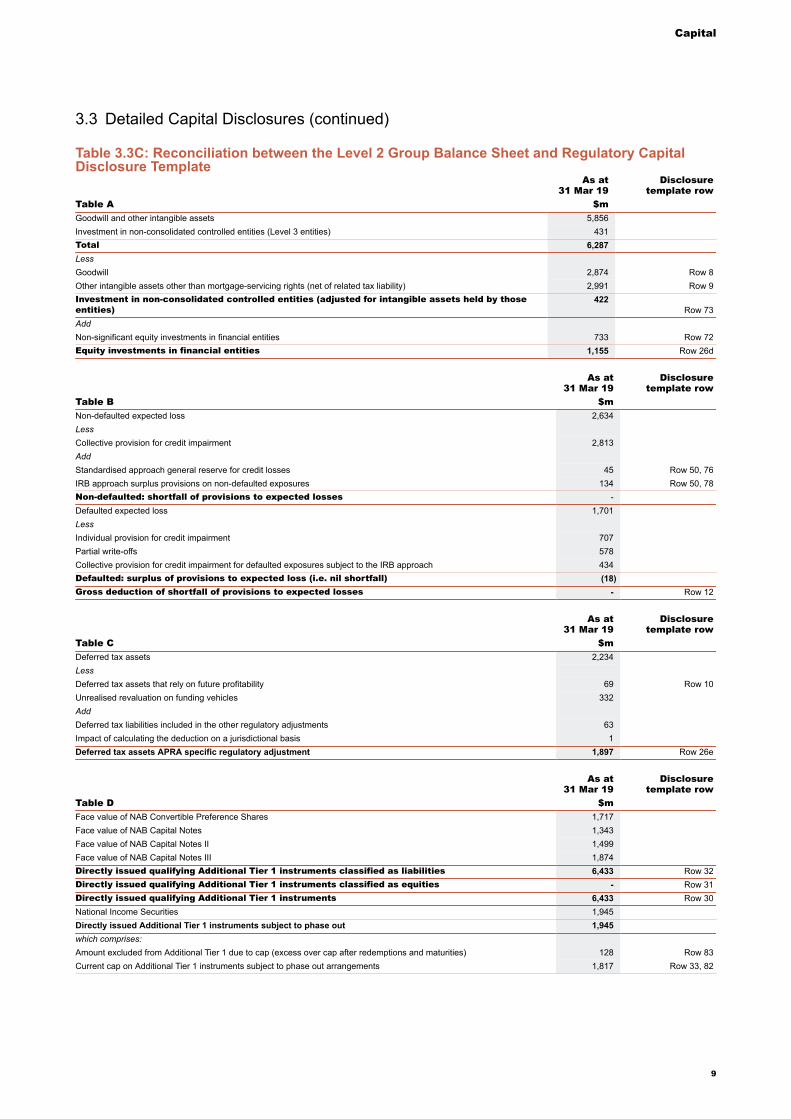
Table 3.3C: Reconciliation between the Level 2 Group Balance Sheet and Regulatory CapitalDisclosure Template
As at31 Mar 19
Disclosuretemplate row
Table A $mGoodwill and other intangible assets 5,856Investment in non-consolidated controlled entities (Level 3 entities) 431Total 6,287LessGoodwill 2,874 Row 8Other intangible assets other than mortgage-servicing rights (net of related tax liability) 2,991 Row 9Investment in non-consolidated controlled entities (adjusted for intangible assets held by thoseentities)
422Row 73
AddNon-significant equity investments in financial entities 733 Row 72Equity investments in financial entities 1,155 Row 26d
As at31 Mar 19
Disclosuretemplate row
Table B $mNon-defaulted expected loss 2,634LessCollective provision for credit impairment 2,813AddStandardised approach general reserve for credit losses 45 Row 50, 76IRB approach surplus provisions on non-defaulted exposures 134 Row 50, 78Non-defaulted: shortfall of provisions to expected losses -Defaulted expected loss 1,701LessIndividual provision for credit impairment 707Partial write-offs 578Collective provision for credit impairment for defaulted exposures subject to the IRB approach 434Defaulted: surplus of provisions to expected loss (i.e. nil shortfall) (18)Gross deduction of shortfall of provisions to expected losses - Row 12
As at31 Mar 19
Disclosuretemplate row
Table C $mDeferred tax assets 2,234LessDeferred tax assets that rely on future profitability 69 Row 10Unrealised revaluation on funding vehicles 332AddDeferred tax liabilities included in the other regulatory adjustments 63Impact of calculating the deduction on a jurisdictional basis 1Deferred tax assets APRA specific regulatory adjustment 1,897 Row 26e
As at31 Mar 19
Disclosuretemplate row
Table D $mFace value of NAB Convertible Preference Shares 1,717Face value of NAB Capital Notes 1,343Face value of NAB Capital Notes II 1,499Face value of NAB Capital Notes III 1,874Directly issued qualifying Additional Tier 1 instruments classified as liabilities 6,433 Row 32Directly issued qualifying Additional Tier 1 instruments classified as equities - Row 31Directly issued qualifying Additional Tier 1 instruments 6,433 Row 30National Income Securities 1,945Directly issued Additional Tier 1 instruments subject to phase out 1,945which comprises:Amount excluded from Additional Tier 1 due to cap (excess over cap after redemptions and maturities) 128 Row 83Current cap on Additional Tier 1 instruments subject to phase out arrangements 1,817 Row 33, 82
3.3 Detailed Capital Disclosures (continued)
9
Capital
As at31 Mar 19
Disclosuretemplate row
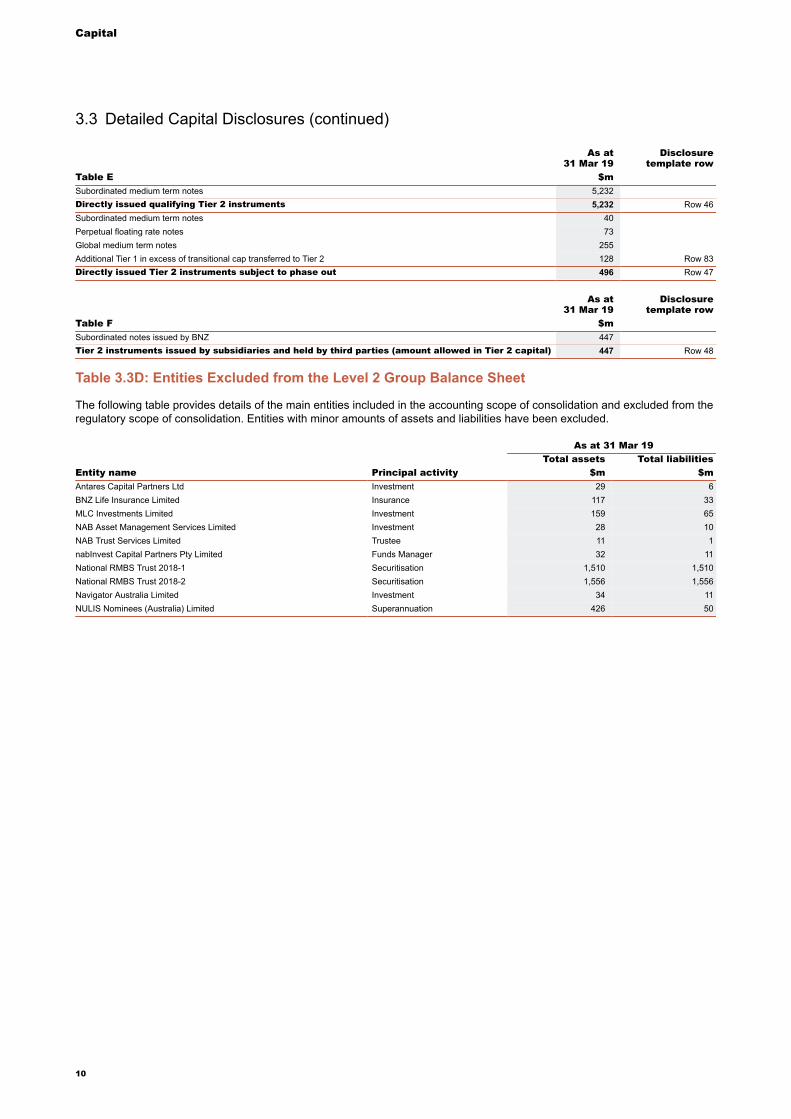
Table E $mSubordinated medium term notes 5,232Directly issued qualifying Tier 2 instruments 5,232 Row 46Subordinated medium term notes 40Perpetual floating rate notes 73Global medium term notes 255Additional Tier 1 in excess of transitional cap transferred to Tier 2 128 Row 83Directly issued Tier 2 instruments subject to phase out 496 Row 47
As at31 Mar 19
Disclosuretemplate row
Table F $mSubordinated notes issued by BNZ 447Tier 2 instruments issued by subsidiaries and held by third parties (amount allowed in Tier 2 capital) 447 Row 48
Table 3.3D: Entities Excluded from the Level 2 Group Balance Sheet
The following table provides details of the main entities included in the accounting scope of consolidation and excluded from theregulatory scope of consolidation. Entities with minor amounts of assets and liabilities have been excluded.
As at 31 Mar 19Total assets Total liabilities
Entity name Principal activity $m $mAntares Capital Partners Ltd Investment 29 6BNZ Life Insurance Limited Insurance 117 33MLC Investments Limited Investment 159 65NAB Asset Management Services Limited Investment 28 10NAB Trust Services Limited Trustee 11 1nabInvest Capital Partners Pty Limited Funds Manager 32 11National RMBS Trust 2018-1 Securitisation 1,510 1,510National RMBS Trust 2018-2 Securitisation 1,556 1,556Navigator Australia Limited Investment 34 11NULIS Nominees (Australia) Limited Superannuation 426 50
3.3 Detailed Capital Disclosures (continued)
10
Capital
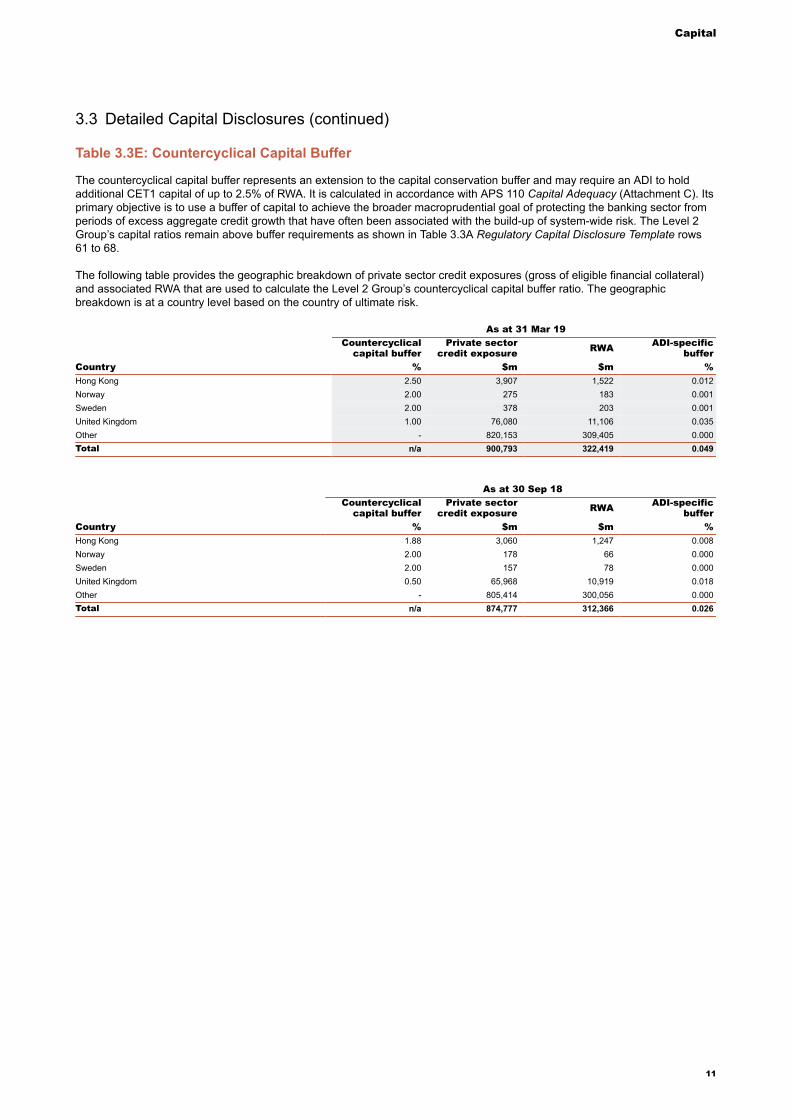
Table 3.3E: Countercyclical Capital Buffer
The countercyclical capital buffer represents an extension to the capital conservation buffer and may require an ADI to holdadditional CET1 capital of up to 2.5% of RWA. It is calculated in accordance with APS 110 Capital Adequacy (Attachment C). Itsprimary objective is to use a buffer of capital to achieve the broader macroprudential goal of protecting the banking sector fromperiods of excess aggregate credit growth that have often been associated with the build-up of system-wide risk. The Level 2Group’s capital ratios remain above buffer requirements as shown in Table 3.3A Regulatory Capital Disclosure Template rows61 to 68.
The following table provides the geographic breakdown of private sector credit exposures (gross of eligible financial collateral)and associated RWA that are used to calculate the Level 2 Group’s countercyclical capital buffer ratio. The geographicbreakdown is at a country level based on the country of ultimate risk.
As at 31 Mar 19Countercyclical
capital bufferPrivate sector
credit exposure RWA ADI-specificbuffer
Country % $m $m %Hong Kong 2.50 3,907 1,522 0.012Norway 2.00 275 183 0.001Sweden 2.00 378 203 0.001United Kingdom 1.00 76,080 11,106 0.035Other - 820,153 309,405 0.000Total n/a 900,793 322,419 0.049
As at 30 Sep 18Countercyclical
capital bufferPrivate sector
credit exposure RWA ADI-specificbuffer
Country % $m $m %Hong Kong 1.88 3,060 1,247 0.008Norway 2.00 178 66 0.000Sweden 2.00 157 78 0.000United Kingdom 0.50 65,968 10,919 0.018Other - 805,414 300,056 0.000Total n/a 874,777 312,366 0.026
3.3 Detailed Capital Disclosures (continued)
11
Capital
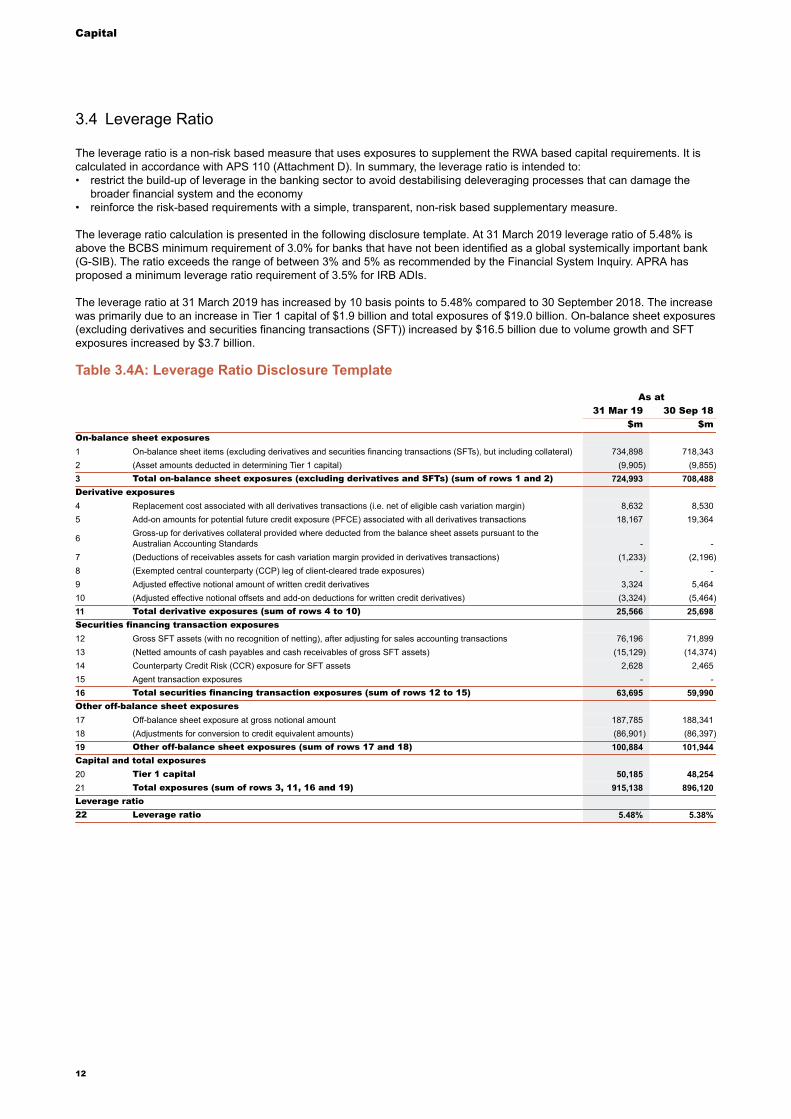
3.4 Leverage Ratio
The leverage ratio is a non-risk based measure that uses exposures to supplement the RWA based capital requirements. It iscalculated in accordance with APS 110 (Attachment D). In summary, the leverage ratio is intended to:• restrict the build-up of leverage in the banking sector to avoid destabilising deleveraging processes that can damage the
broader financial system and the economy• reinforce the risk-based requirements with a simple, transparent, non-risk based supplementary measure.
The leverage ratio calculation is presented in the following disclosure template. At 31 March 2019 leverage ratio of 5.48% is above the BCBS minimum requirement of 3.0% for banks that have not been identified as a global systemically important bank (G-SIB). The ratio exceeds the range of between 3% and 5% as recommended by the Financial System Inquiry. APRA has proposed a minimum leverage ratio requirement of 3.5% for IRB ADIs.
The leverage ratio at 31 March 2019 has increased by 10 basis points to 5.48% compared to 30 September 2018. The increase was primarily due to an increase in Tier 1 capital of $1.9 billion and total exposures of $19.0 billion. On-balance sheet exposures (excluding derivatives and securities financing transactions (SFT)) increased by $16.5 billion due to volume growth and SFT exposures increased by $3.7 billion.
Table 3.4A: Leverage Ratio Disclosure Template
As at31 Mar 19 30 Sep 18
$m $mOn-balance sheet exposures1 On-balance sheet items (excluding derivatives and securities financing transactions (SFTs), but including collateral) 734,898 718,3432 (Asset amounts deducted in determining Tier 1 capital) (9,905) (9,855)3 Total on-balance sheet exposures (excluding derivatives and SFTs) (sum of rows 1 and 2) 724,993 708,488Derivative exposures4 Replacement cost associated with all derivatives transactions (i.e. net of eligible cash variation margin) 8,632 8,5305 Add-on amounts for potential future credit exposure (PFCE) associated with all derivatives transactions 18,167 19,364
6 Gross-up for derivatives collateral provided where deducted from the balance sheet assets pursuant to theAustralian Accounting Standards - -
7 (Deductions of receivables assets for cash variation margin provided in derivatives transactions) (1,233) (2,196)8 (Exempted central counterparty (CCP) leg of client-cleared trade exposures) - -9 Adjusted effective notional amount of written credit derivatives 3,324 5,46410 (Adjusted effective notional offsets and add-on deductions for written credit derivatives) (3,324) (5,464)11 Total derivative exposures (sum of rows 4 to 10) 25,566 25,698Securities financing transaction exposures12 Gross SFT assets (with no recognition of netting), after adjusting for sales accounting transactions 76,196 71,89913 (Netted amounts of cash payables and cash receivables of gross SFT assets) (15,129) (14,374)14 Counterparty Credit Risk (CCR) exposure for SFT assets 2,628 2,46515 Agent transaction exposures - -16 Total securities financing transaction exposures (sum of rows 12 to 15) 63,695 59,990Other off-balance sheet exposures17 Off-balance sheet exposure at gross notional amount 187,785 188,34118 (Adjustments for conversion to credit equivalent amounts) (86,901) (86,397)19 Other off-balance sheet exposures (sum of rows 17 and 18) 100,884 101,944Capital and total exposures20 Tier 1 capital 50,185 48,25421 Total exposures (sum of rows 3, 11, 16 and 19) 915,138 896,120Leverage ratio22 Leverage ratio 5.48% 5.38%
12
Capital
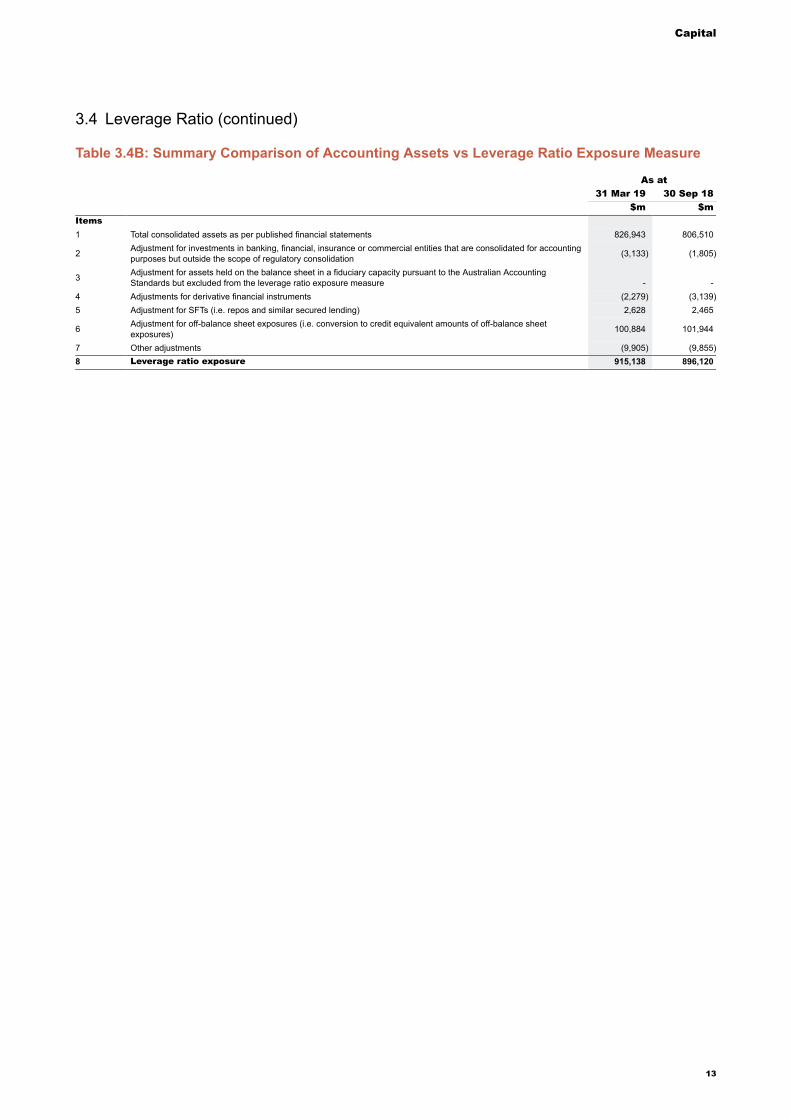
Table 3.4B: Summary Comparison of Accounting Assets vs Leverage Ratio Exposure Measure
As at31 Mar 19 30 Sep 18
$m $mItems1 Total consolidated assets as per published financial statements 826,943 806,510
2 Adjustment for investments in banking, financial, insurance or commercial entities that are consolidated for accountingpurposes but outside the scope of regulatory consolidation (3,133) (1,805)
3 Adjustment for assets held on the balance sheet in a fiduciary capacity pursuant to the Australian AccountingStandards but excluded from the leverage ratio exposure measure - -
4 Adjustments for derivative financial instruments (2,279) (3,139)5 Adjustment for SFTs (i.e. repos and similar secured lending) 2,628 2,465
6 Adjustment for off-balance sheet exposures (i.e. conversion to credit equivalent amounts of off-balance sheetexposures) 100,884 101,944
7 Other adjustments (9,905) (9,855)8 Leverage ratio exposure 915,138 896,120
3.4 Leverage Ratio (continued)
13
Credit Risk
Section 4
Credit Risk
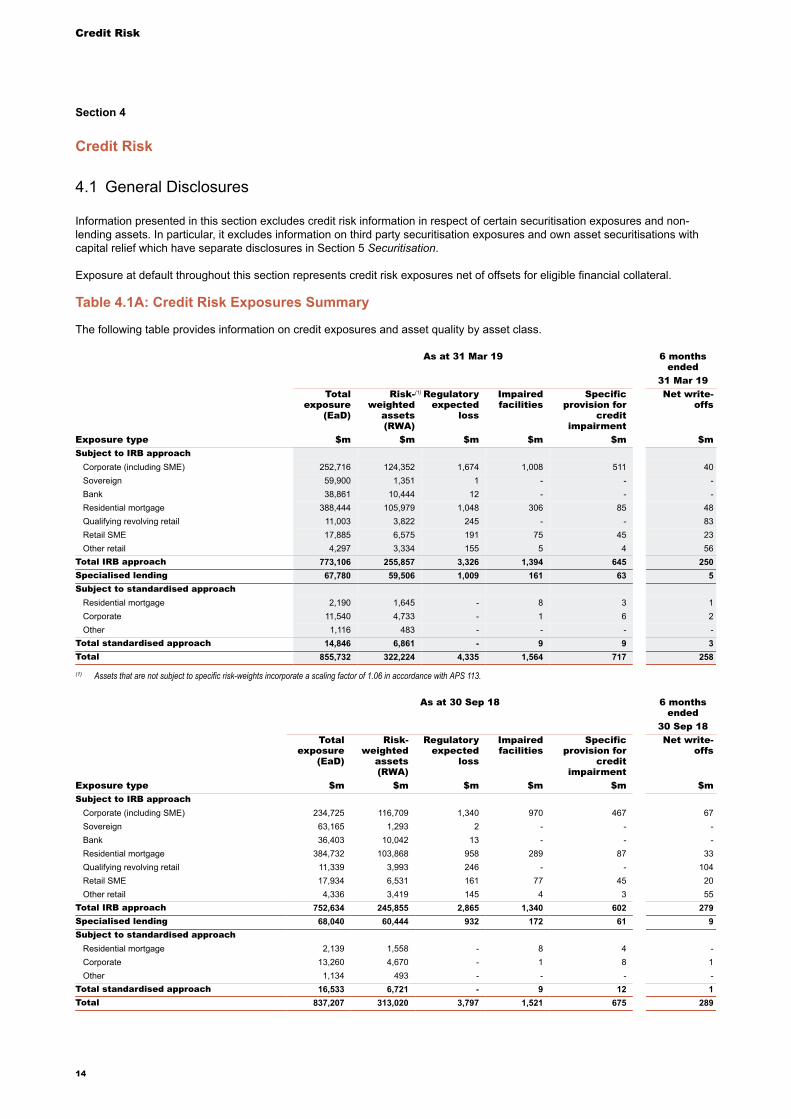
4.1 General Disclosures
Information presented in this section excludes credit risk information in respect of certain securitisation exposures and non-lending assets. In particular, it excludes information on third party securitisation exposures and own asset securitisations withcapital relief which have separate disclosures in Section 5 Securitisation.
Exposure at default throughout this section represents credit risk exposures net of offsets for eligible financial collateral.
Table 4.1A: Credit Risk Exposures Summary
The following table provides information on credit exposures and asset quality by asset class.
As at 31 Mar 19 6 monthsended
31 Mar 19Total
exposure(EaD)
Risk-weighted
assets(RWA)
(1) Regulatoryexpected
loss
Impairedfacilities
Specificprovision for
creditimpairment
Net write-offs
Exposure type $m $m $m $m $m $mSubject to IRB approach
Corporate (including SME) 252,716 124,352 1,674 1,008 511 40Sovereign 59,900 1,351 1 - - -Bank 38,861 10,444 12 - - -Residential mortgage 388,444 105,979 1,048 306 85 48Qualifying revolving retail 11,003 3,822 245 - - 83Retail SME 17,885 6,575 191 75 45 23Other retail 4,297 3,334 155 5 4 56
Total IRB approach 773,106 255,857 3,326 1,394 645 250Specialised lending 67,780 59,506 1,009 161 63 5Subject to standardised approach
Residential mortgage 2,190 1,645 - 8 3 1Corporate 11,540 4,733 - 1 6 2Other 1,116 483 - - - -
Total standardised approach 14,846 6,861 - 9 9 3Total 855,732 322,224 4,335 1,564 717 258
(1) Assets that are not subject to specific risk-weights incorporate a scaling factor of 1.06 in accordance with APS 113.
As at 30 Sep 18 6 monthsended
30 Sep 18Total
exposure(EaD)
Risk-weighted
assets(RWA)
Regulatoryexpected
loss
Impairedfacilities
Specificprovision for
creditimpairment
Net write-offs
Exposure type $m $m $m $m $m $mSubject to IRB approach
Corporate (including SME) 234,725 116,709 1,340 970 467 67Sovereign 63,165 1,293 2 - - -Bank 36,403 10,042 13 - - -Residential mortgage 384,732 103,868 958 289 87 33Qualifying revolving retail 11,339 3,993 246 - - 104Retail SME 17,934 6,531 161 77 45 20Other retail 4,336 3,419 145 4 3 55
Total IRB approach 752,634 245,855 2,865 1,340 602 279Specialised lending 68,040 60,444 932 172 61 9Subject to standardised approach
Residential mortgage 2,139 1,558 - 8 4 -Corporate 13,260 4,670 - 1 8 1Other 1,134 493 - - - -
Total standardised approach 16,533 6,721 - 9 12 1Total 837,207 313,020 3,797 1,521 675 289
14
Credit Risk
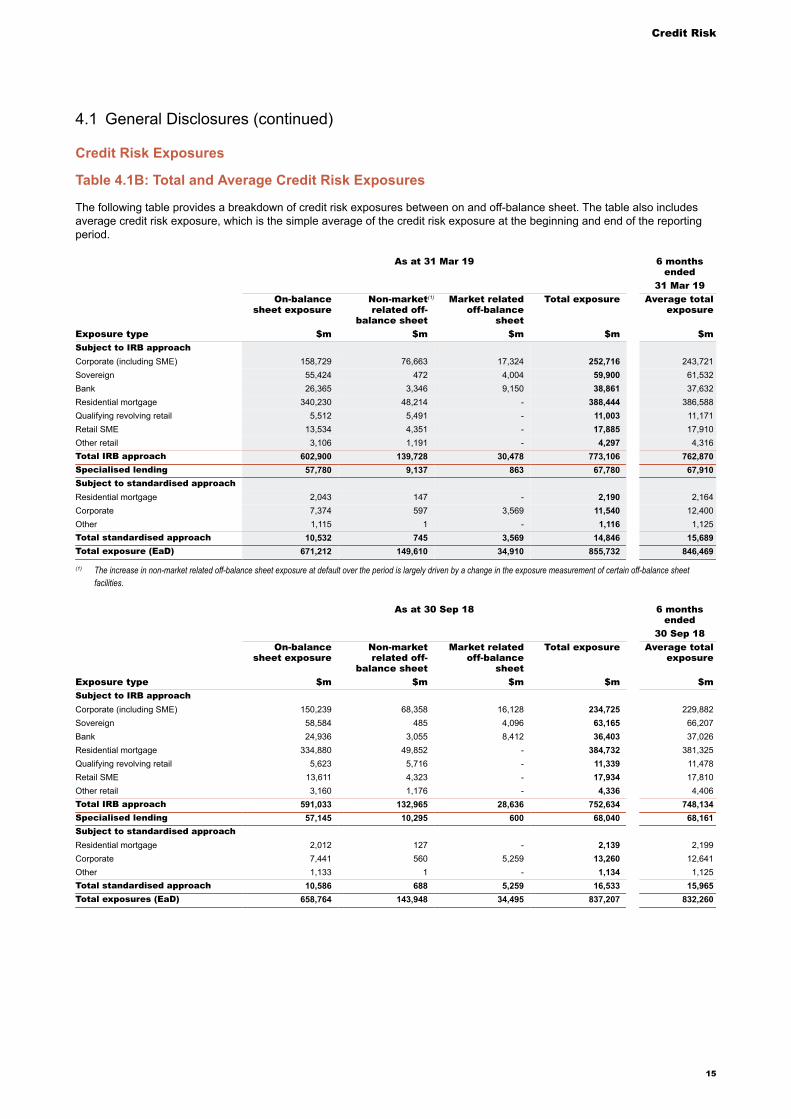
Credit Risk Exposures
Table 4.1B: Total and Average Credit Risk Exposures
The following table provides a breakdown of credit risk exposures between on and off-balance sheet. The table also includesaverage credit risk exposure, which is the simple average of the credit risk exposure at the beginning and end of the reportingperiod.
As at 31 Mar 19 6 monthsended
31 Mar 19On-balance
sheet exposureNon-marketrelated off-
balance sheet
(1) Market relatedoff-balance
sheet
Total exposure Average totalexposure
Exposure type $m $m $m $m $mSubject to IRB approachCorporate (including SME) 158,729 76,663 17,324 252,716 243,721Sovereign 55,424 472 4,004 59,900 61,532Bank 26,365 3,346 9,150 38,861 37,632Residential mortgage 340,230 48,214 - 388,444 386,588Qualifying revolving retail 5,512 5,491 - 11,003 11,171Retail SME 13,534 4,351 - 17,885 17,910Other retail 3,106 1,191 - 4,297 4,316Total IRB approach 602,900 139,728 30,478 773,106 762,870Specialised lending 57,780 9,137 863 67,780 67,910Subject to standardised approachResidential mortgage 2,043 147 - 2,190 2,164Corporate 7,374 597 3,569 11,540 12,400Other 1,115 1 - 1,116 1,125Total standardised approach 10,532 745 3,569 14,846 15,689Total exposure (EaD) 671,212 149,610 34,910 855,732 846,469
(1) The increase in non-market related off-balance sheet exposure at default over the period is largely driven by a change in the exposure measurement of certain off-balance sheetfacilities.
As at 30 Sep 18 6 monthsended
30 Sep 18On-balance
sheet exposureNon-marketrelated off-
balance sheet
Market relatedoff-balance
sheet
Total exposure Average totalexposure
Exposure type $m $m $m $m $mSubject to IRB approachCorporate (including SME) 150,239 68,358 16,128 234,725 229,882Sovereign 58,584 485 4,096 63,165 66,207Bank 24,936 3,055 8,412 36,403 37,026Residential mortgage 334,880 49,852 - 384,732 381,325Qualifying revolving retail 5,623 5,716 - 11,339 11,478Retail SME 13,611 4,323 - 17,934 17,810Other retail 3,160 1,176 - 4,336 4,406Total IRB approach 591,033 132,965 28,636 752,634 748,134Specialised lending 57,145 10,295 600 68,040 68,161Subject to standardised approachResidential mortgage 2,012 127 - 2,139 2,199Corporate 7,441 560 5,259 13,260 12,641Other 1,133 1 - 1,134 1,125Total standardised approach 10,586 688 5,259 16,533 15,965Total exposures (EaD) 658,764 143,948 34,495 837,207 832,260
4.1 General Disclosures (continued)
15
Credit Risk
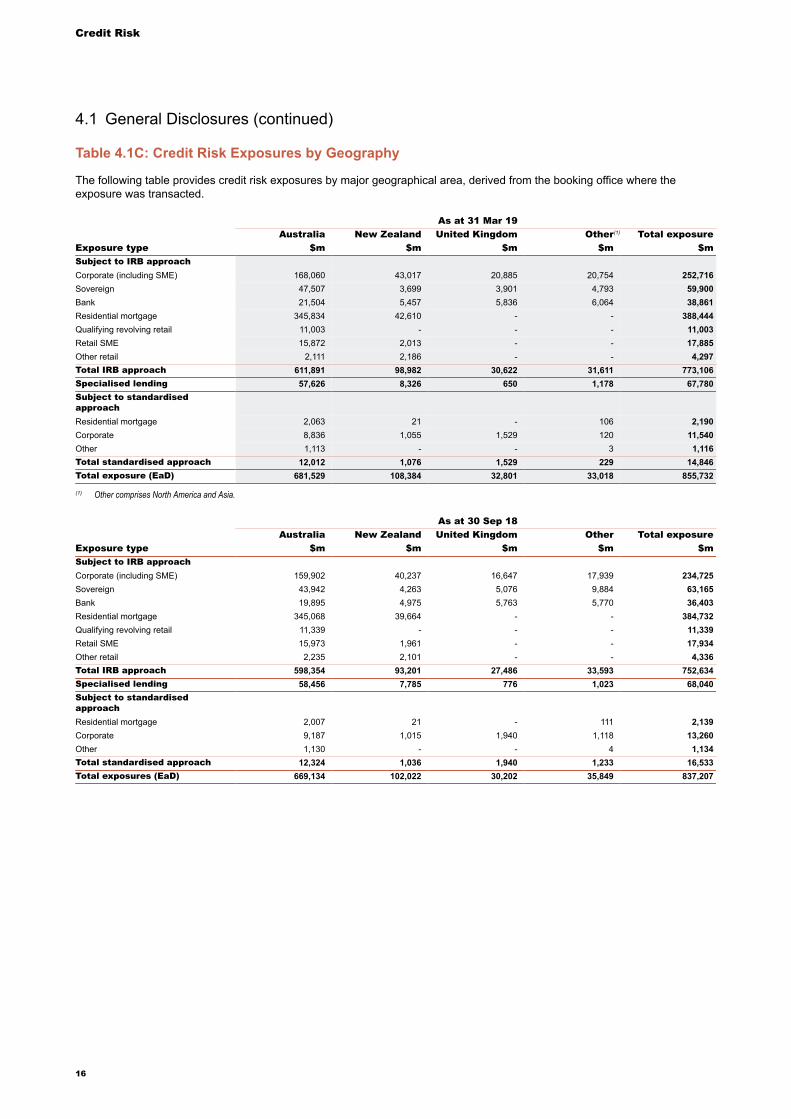
Table 4.1C: Credit Risk Exposures by Geography
The following table provides credit risk exposures by major geographical area, derived from the booking office where theexposure was transacted.
As at 31 Mar 19Australia New Zealand United Kingdom Other(1) Total exposure
Exposure type $m $m $m $m $mSubject to IRB approachCorporate (including SME) 168,060 43,017 20,885 20,754 252,716Sovereign 47,507 3,699 3,901 4,793 59,900Bank 21,504 5,457 5,836 6,064 38,861Residential mortgage 345,834 42,610 - - 388,444Qualifying revolving retail 11,003 - - - 11,003Retail SME 15,872 2,013 - - 17,885Other retail 2,111 2,186 - - 4,297Total IRB approach 611,891 98,982 30,622 31,611 773,106Specialised lending 57,626 8,326 650 1,178 67,780Subject to standardisedapproachResidential mortgage 2,063 21 - 106 2,190Corporate 8,836 1,055 1,529 120 11,540Other 1,113 - - 3 1,116Total standardised approach 12,012 1,076 1,529 229 14,846Total exposure (EaD) 681,529 108,384 32,801 33,018 855,732
(1) Other comprises North America and Asia.
As at 30 Sep 18Australia New Zealand United Kingdom Other Total exposure
Exposure type $m $m $m $m $mSubject to IRB approachCorporate (including SME) 159,902 40,237 16,647 17,939 234,725Sovereign 43,942 4,263 5,076 9,884 63,165Bank 19,895 4,975 5,763 5,770 36,403Residential mortgage 345,068 39,664 - - 384,732Qualifying revolving retail 11,339 - - - 11,339Retail SME 15,973 1,961 - - 17,934Other retail 2,235 2,101 - - 4,336Total IRB approach 598,354 93,201 27,486 33,593 752,634Specialised lending 58,456 7,785 776 1,023 68,040Subject to standardisedapproachResidential mortgage 2,007 21 - 111 2,139Corporate 9,187 1,015 1,940 1,118 13,260Other 1,130 - - 4 1,134Total standardised approach 12,324 1,036 1,940 1,233 16,533Total exposures (EaD) 669,134 102,022 30,202 35,849 837,207
4.1 General Disclosures (continued)
16
Credit Risk
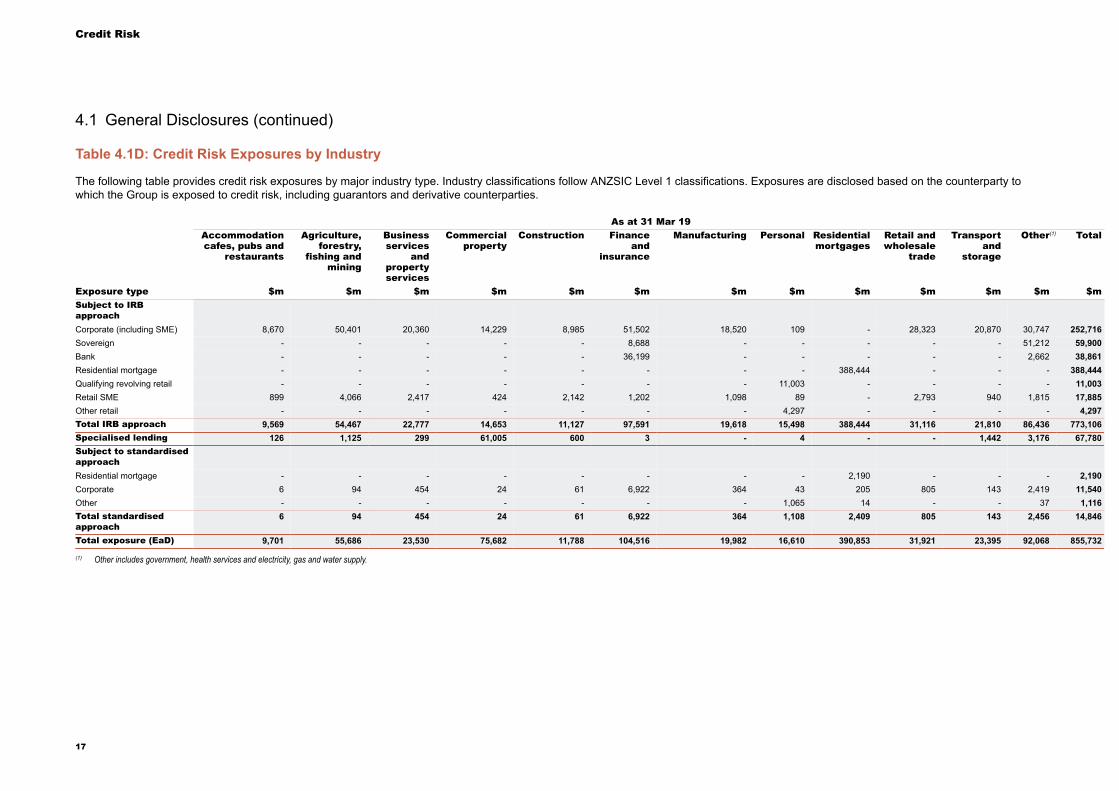
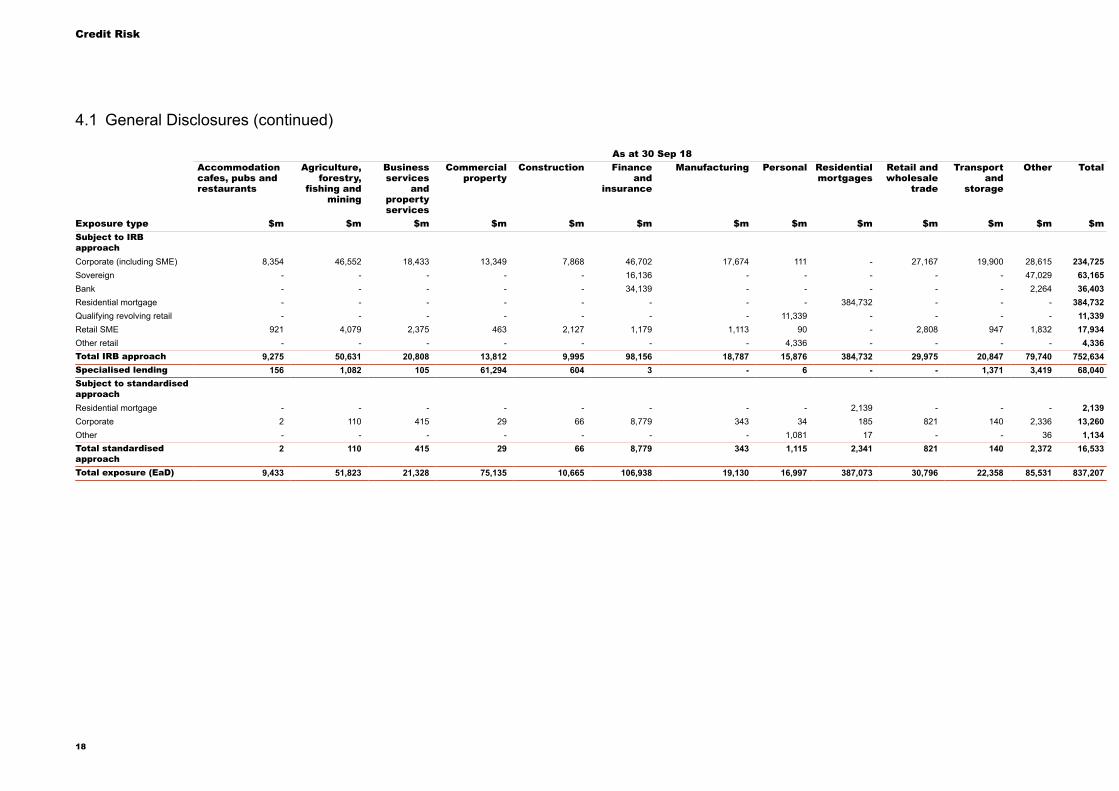
Table 4.1D: Credit Risk Exposures by Industry
The following table provides credit risk exposures by major industry type. Industry classifications follow ANZSIC Level 1 classifications. Exposures are disclosed based on the counterparty towhich the Group is exposed to credit risk, including guarantors and derivative counterparties.
As at 31 Mar 19Accommodationcafes, pubs and
restaurants
Agriculture,forestry,
fishing andmining
Businessservices
andpropertyservices
Commercialproperty
Construction Financeand
insurance
Manufacturing Personal Residentialmortgages
Retail andwholesale
trade
Transportand
storage
Other(1) Total
Exposure type $m $m $m $m $m $m $m $m $m $m $m $m $mSubject to IRBapproachCorporate (including SME) 8,670 50,401 20,360 14,229 8,985 51,502 18,520 109 - 28,323 20,870 30,747 252,716Sovereign - - - - - 8,688 - - - - - 51,212 59,900Bank - - - - - 36,199 - - - - - 2,662 38,861Residential mortgage - - - - - - - - 388,444 - - - 388,444Qualifying revolving retail - - - - - - - 11,003 - - - - 11,003Retail SME 899 4,066 2,417 424 2,142 1,202 1,098 89 - 2,793 940 1,815 17,885Other retail - - - - - - - 4,297 - - - - 4,297Total IRB approach 9,569 54,467 22,777 14,653 11,127 97,591 19,618 15,498 388,444 31,116 21,810 86,436 773,106Specialised lending 126 1,125 299 61,005 600 3 - 4 - - 1,442 3,176 67,780Subject to standardisedapproachResidential mortgage - - - - - - - - 2,190 - - - 2,190Corporate 6 94 454 24 61 6,922 364 43 205 805 143 2,419 11,540Other - - - - - - - 1,065 14 - - 37 1,116Total standardisedapproach
6 94 454 24 61 6,922 364 1,108 2,409 805 143 2,456 14,846
Total exposure (EaD) 9,701 55,686 23,530 75,682 11,788 104,516 19,982 16,610 390,853 31,921 23,395 92,068 855,732
(1) Other includes government, health services and electricity, gas and water supply.
4.1 General Disclosures (continued)
17
Credit Risk
As at 30 Sep 18Accommodationcafes, pubs andrestaurants
Agriculture,forestry,
fishing andmining
Businessservices
andpropertyservices
Commercialproperty
Construction Financeand
insurance
Manufacturing Personal Residentialmortgages
Retail andwholesale
trade
Transportand
storage
Other Total
Exposure type $m $m $m $m $m $m $m $m $m $m $m $m $mSubject to IRBapproachCorporate (including SME) 8,354 46,552 18,433 13,349 7,868 46,702 17,674 111 - 27,167 19,900 28,615 234,725Sovereign - - - - - 16,136 - - - - - 47,029 63,165Bank - - - - - 34,139 - - - - - 2,264 36,403Residential mortgage - - - - - - - - 384,732 - - - 384,732Qualifying revolving retail - - - - - - - 11,339 - - - - 11,339Retail SME 921 4,079 2,375 463 2,127 1,179 1,113 90 - 2,808 947 1,832 17,934Other retail - - - - - - - 4,336 - - - - 4,336Total IRB approach 9,275 50,631 20,808 13,812 9,995 98,156 18,787 15,876 384,732 29,975 20,847 79,740 752,634Specialised lending 156 1,082 105 61,294 604 3 - 6 - - 1,371 3,419 68,040Subject to standardisedapproachResidential mortgage - - - - - - - - 2,139 - - - 2,139Corporate 2 110 415 29 66 8,779 343 34 185 821 140 2,336 13,260Other - - - - - - - 1,081 17 - - 36 1,134Total standardisedapproach
2 110 415 29 66 8,779 343 1,115 2,341 821 140 2,372 16,533
Total exposure (EaD) 9,433 51,823 21,328 75,135 10,665 106,938 19,130 16,997 387,073 30,796 22,358 85,531 837,207
4.1 General Disclosures (continued)
18
Credit Risk
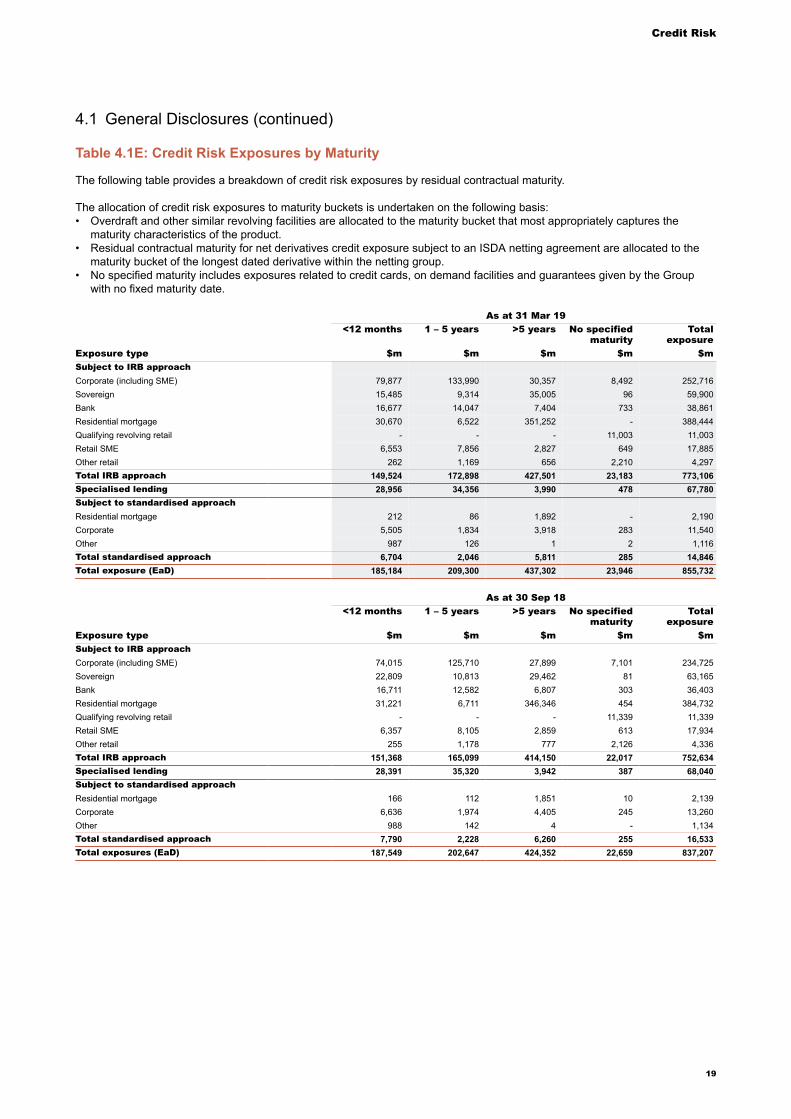
Table 4.1E: Credit Risk Exposures by Maturity
The following table provides a breakdown of credit risk exposures by residual contractual maturity.
The allocation of credit risk exposures to maturity buckets is undertaken on the following basis:• Overdraft and other similar revolving facilities are allocated to the maturity bucket that most appropriately captures the
maturity characteristics of the product.• Residual contractual maturity for net derivatives credit exposure subject to an ISDA netting agreement are allocated to the
maturity bucket of the longest dated derivative within the netting group.• No specified maturity includes exposures related to credit cards, on demand facilities and guarantees given by the Group
with no fixed maturity date.
As at 31 Mar 19<12 months 1 – 5 years >5 years No specified
maturityTotal
exposureExposure type $m $m $m $m $mSubject to IRB approachCorporate (including SME) 79,877 133,990 30,357 8,492 252,716Sovereign 15,485 9,314 35,005 96 59,900Bank 16,677 14,047 7,404 733 38,861Residential mortgage 30,670 6,522 351,252 - 388,444Qualifying revolving retail - - - 11,003 11,003Retail SME 6,553 7,856 2,827 649 17,885Other retail 262 1,169 656 2,210 4,297Total IRB approach 149,524 172,898 427,501 23,183 773,106Specialised lending 28,956 34,356 3,990 478 67,780Subject to standardised approachResidential mortgage 212 86 1,892 - 2,190Corporate 5,505 1,834 3,918 283 11,540Other 987 126 1 2 1,116Total standardised approach 6,704 2,046 5,811 285 14,846Total exposure (EaD) 185,184 209,300 437,302 23,946 855,732
As at 30 Sep 18<12 months 1 – 5 years >5 years No specified
maturityTotal
exposureExposure type $m $m $m $m $mSubject to IRB approachCorporate (including SME) 74,015 125,710 27,899 7,101 234,725Sovereign 22,809 10,813 29,462 81 63,165Bank 16,711 12,582 6,807 303 36,403Residential mortgage 31,221 6,711 346,346 454 384,732Qualifying revolving retail - - - 11,339 11,339Retail SME 6,357 8,105 2,859 613 17,934Other retail 255 1,178 777 2,126 4,336Total IRB approach 151,368 165,099 414,150 22,017 752,634Specialised lending 28,391 35,320 3,942 387 68,040Subject to standardised approachResidential mortgage 166 112 1,851 10 2,139Corporate 6,636 1,974 4,405 245 13,260Other 988 142 4 - 1,134Total standardised approach 7,790 2,228 6,260 255 16,533Total exposures (EaD) 187,549 202,647 424,352 22,659 837,207
4.1 General Disclosures (continued)
19
Credit Risk
Credit Provisions and Losses
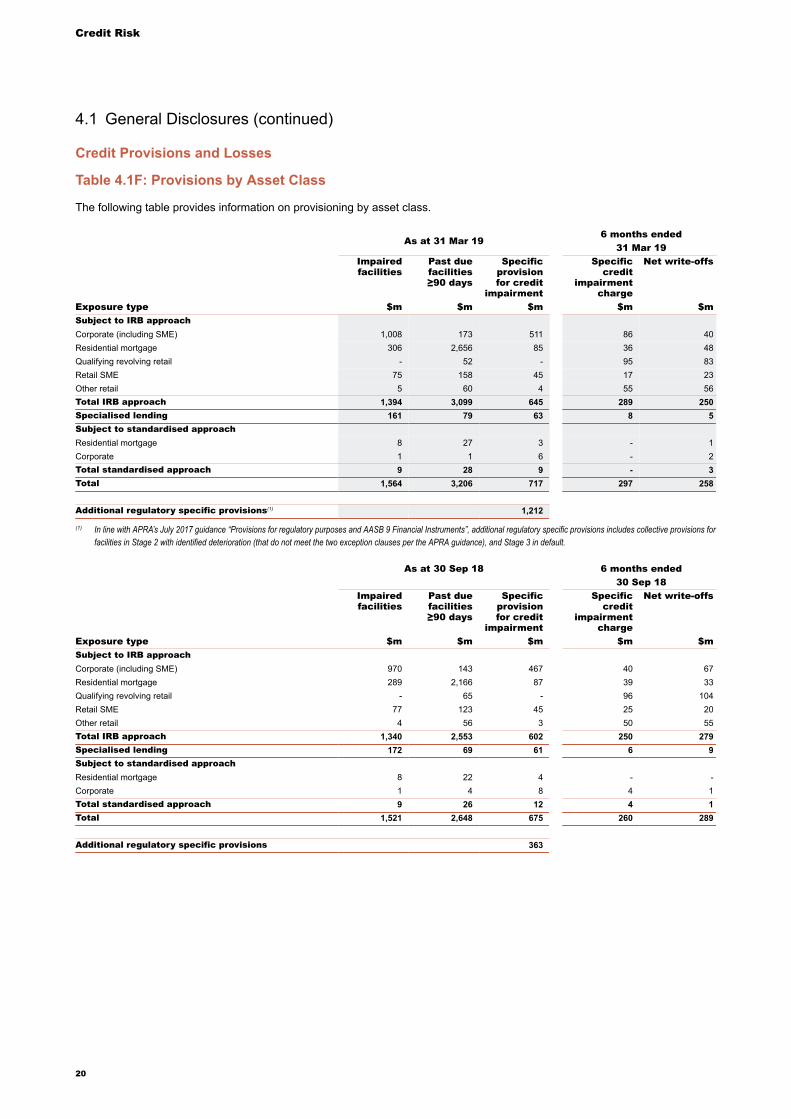
Table 4.1F: Provisions by Asset Class
The following table provides information on provisioning by asset class.
As at 31 Mar 196 months ended
31 Mar 19Impairedfacilities
Past duefacilities≥90 days
Specificprovisionfor credit
impairment
Specificcredit
impairmentcharge
Net write-offs
Exposure type $m $m $m $m $mSubject to IRB approachCorporate (including SME) 1,008 173 511 86 40Residential mortgage 306 2,656 85 36 48Qualifying revolving retail - 52 - 95 83Retail SME 75 158 45 17 23Other retail 5 60 4 55 56Total IRB approach 1,394 3,099 645 289 250Specialised lending 161 79 63 8 5Subject to standardised approachResidential mortgage 8 27 3 - 1Corporate 1 1 6 - 2Total standardised approach 9 28 9 - 3Total 1,564 3,206 717 297 258
Additional regulatory specific provisions(1) 1,212
(1) In line with APRA’s July 2017 guidance “Provisions for regulatory purposes and AASB 9 Financial Instruments”, additional regulatory specific provisions includes collective provisions forfacilities in Stage 2 with identified deterioration (that do not meet the two exception clauses per the APRA guidance), and Stage 3 in default.
As at 30 Sep 18 6 months ended30 Sep 18
Impairedfacilities
Past duefacilities≥90 days
Specificprovisionfor credit
impairment
Specificcredit
impairmentcharge
Net write-offs
Exposure type $m $m $m $m $mSubject to IRB approachCorporate (including SME) 970 143 467 40 67Residential mortgage 289 2,166 87 39 33Qualifying revolving retail - 65 - 96 104Retail SME 77 123 45 25 20Other retail 4 56 3 50 55Total IRB approach 1,340 2,553 602 250 279Specialised lending 172 69 61 6 9Subject to standardised approachResidential mortgage 8 22 4 - -Corporate 1 4 8 4 1Total standardised approach 9 26 12 4 1Total 1,521 2,648 675 260 289
Additional regulatory specific provisions 363
4.1 General Disclosures (continued)
20
Credit Risk
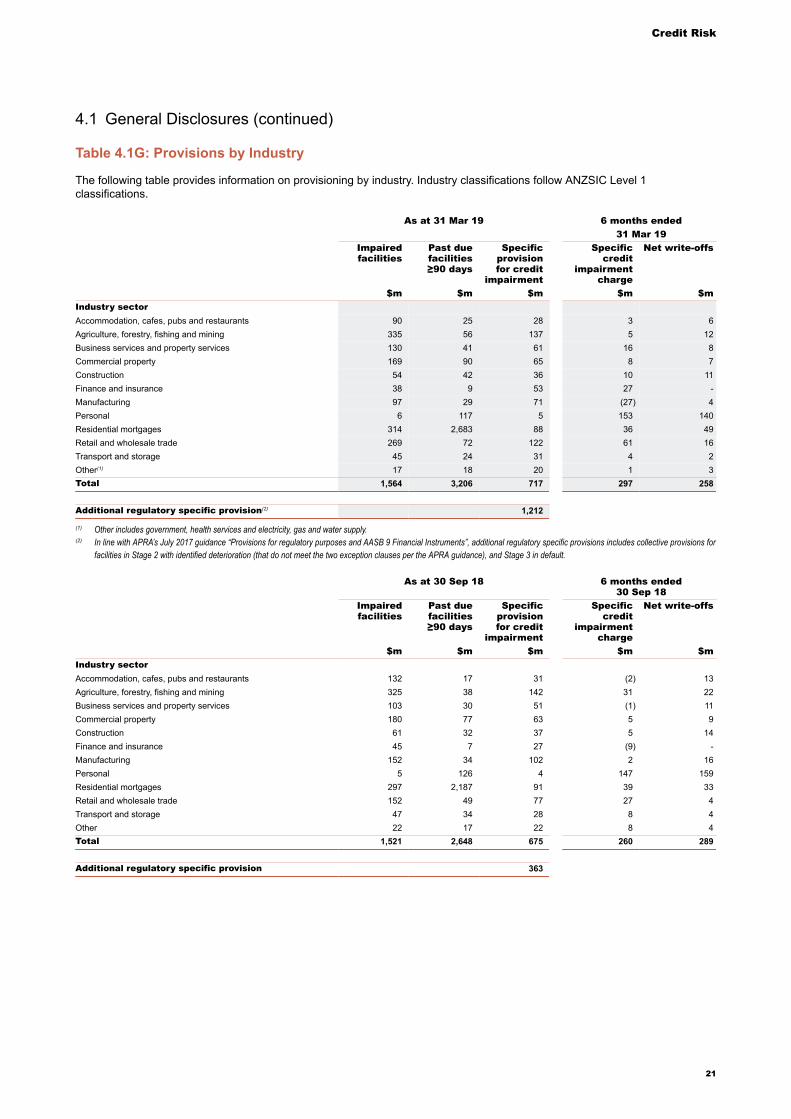
Table 4.1G: Provisions by Industry
The following table provides information on provisioning by industry. Industry classifications follow ANZSIC Level 1classifications.
As at 31 Mar 19 6 months ended31 Mar 19
Impairedfacilities
Past duefacilities≥90 days
Specificprovisionfor credit
impairment
Specificcredit
impairmentcharge
Net write-offs
$m $m $m $m $mIndustry sectorAccommodation, cafes, pubs and restaurants 90 25 28 3 6Agriculture, forestry, fishing and mining 335 56 137 5 12Business services and property services 130 41 61 16 8Commercial property 169 90 65 8 7Construction 54 42 36 10 11Finance and insurance 38 9 53 27 -Manufacturing 97 29 71 (27) 4Personal 6 117 5 153 140Residential mortgages 314 2,683 88 36 49Retail and wholesale trade 269 72 122 61 16Transport and storage 45 24 31 4 2Other(1) 17 18 20 1 3Total 1,564 3,206 717 297 258
Additional regulatory specific provision(2) 1,212
(1) Other includes government, health services and electricity, gas and water supply.(2) In line with APRA’s July 2017 guidance “Provisions for regulatory purposes and AASB 9 Financial Instruments”, additional regulatory specific provisions includes collective provisions for
facilities in Stage 2 with identified deterioration (that do not meet the two exception clauses per the APRA guidance), and Stage 3 in default.
As at 30 Sep 18 6 months ended30 Sep 18
Impairedfacilities
Past duefacilities≥90 days
Specificprovisionfor credit
impairment
Specificcredit
impairmentcharge
Net write-offs
$m $m $m $m $mIndustry sectorAccommodation, cafes, pubs and restaurants 132 17 31 (2) 13Agriculture, forestry, fishing and mining 325 38 142 31 22Business services and property services 103 30 51 (1) 11Commercial property 180 77 63 5 9Construction 61 32 37 5 14Finance and insurance 45 7 27 (9) -Manufacturing 152 34 102 2 16Personal 5 126 4 147 159Residential mortgages 297 2,187 91 39 33Retail and wholesale trade 152 49 77 27 4Transport and storage 47 34 28 8 4Other 22 17 22 8 4Total 1,521 2,648 675 260 289
Additional regulatory specific provision 363
4.1 General Disclosures (continued)
21
Credit Risk
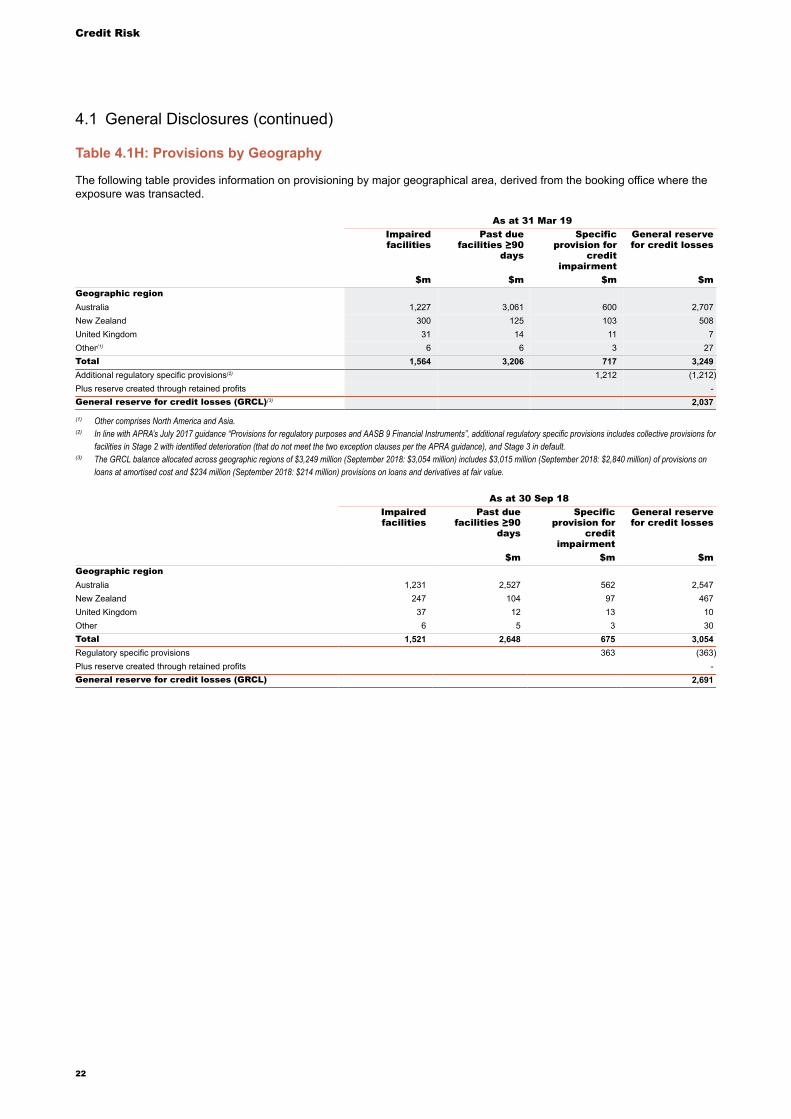
Table 4.1H: Provisions by Geography
The following table provides information on provisioning by major geographical area, derived from the booking office where theexposure was transacted.
As at 31 Mar 19Impairedfacilities
Past duefacilities ≥90
days
Specificprovision for
creditimpairment
General reservefor credit losses
$m $m $m $mGeographic regionAustralia 1,227 3,061 600 2,707New Zealand 300 125 103 508United Kingdom 31 14 11 7Other(1) 6 6 3 27Total 1,564 3,206 717 3,249Additional regulatory specific provisions(2) 1,212 (1,212)Plus reserve created through retained profits -General reserve for credit losses (GRCL)(3) 2,037
(1) Other comprises North America and Asia.(2) In line with APRA’s July 2017 guidance “Provisions for regulatory purposes and AASB 9 Financial Instruments”, additional regulatory specific provisions includes collective provisions for
facilities in Stage 2 with identified deterioration (that do not meet the two exception clauses per the APRA guidance), and Stage 3 in default.(3) The GRCL balance allocated across geographic regions of $3,249 million (September 2018: $3,054 million) includes $3,015 million (September 2018: $2,840 million) of provisions on
loans at amortised cost and $234 million (September 2018: $214 million) provisions on loans and derivatives at fair value.
As at 30 Sep 18Impairedfacilities
Past duefacilities ≥90
days
Specificprovision for
creditimpairment
General reservefor credit losses
$m $m $mGeographic regionAustralia 1,231 2,527 562 2,547New Zealand 247 104 97 467United Kingdom 37 12 13 10Other 6 5 3 30Total 1,521 2,648 675 3,054Regulatory specific provisions 363 (363)Plus reserve created through retained profits -General reserve for credit losses (GRCL) 2,691
4.1 General Disclosures (continued)
22
Credit Risk
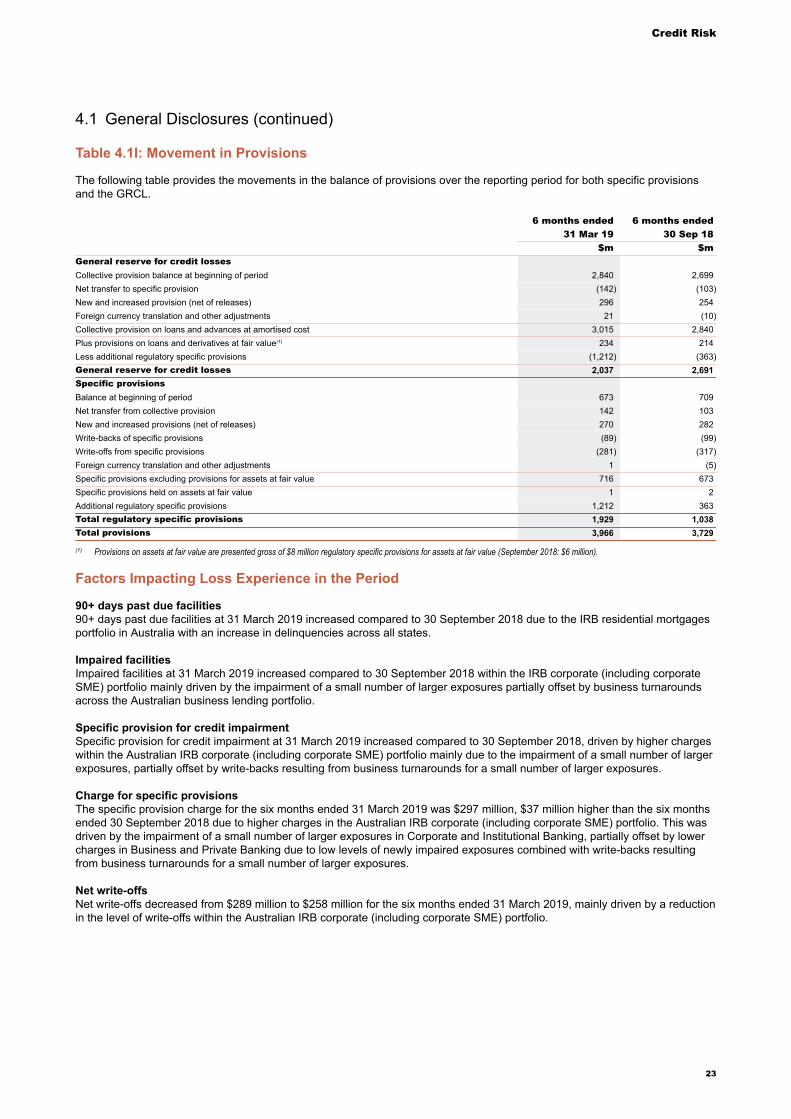
Table 4.1I: Movement in Provisions
The following table provides the movements in the balance of provisions over the reporting period for both specific provisionsand the GRCL.
6 months ended 6 months ended31 Mar 19 30 Sep 18
$m $mGeneral reserve for credit lossesCollective provision balance at beginning of period 2,840 2,699Net transfer to specific provision (142) (103)New and increased provision (net of releases) 296 254Foreign currency translation and other adjustments 21 (10)Collective provision on loans and advances at amortised cost 3,015 2,840Plus provisions on loans and derivatives at fair value(1) 234 214Less additional regulatory specific provisions (1,212) (363)General reserve for credit losses 2,037 2,691Specific provisionsBalance at beginning of period 673 709Net transfer from collective provision 142 103New and increased provisions (net of releases) 270 282Write-backs of specific provisions (89) (99)Write-offs from specific provisions (281) (317)Foreign currency translation and other adjustments 1 (5)Specific provisions excluding provisions for assets at fair value 716 673Specific provisions held on assets at fair value 1 2Additional regulatory specific provisions 1,212 363Total regulatory specific provisions 1,929 1,038Total provisions 3,966 3,729
(1) Provisions on assets at fair value are presented gross of $8 million regulatory specific provisions for assets at fair value (September 2018: $6 million).
Factors Impacting Loss Experience in the Period
90+ days past due facilities90+ days past due facilities at 31 March 2019 increased compared to 30 September 2018 due to the IRB residential mortgagesportfolio in Australia with an increase in delinquencies across all states.
Impaired facilitiesImpaired facilities at 31 March 2019 increased compared to 30 September 2018 within the IRB corporate (including corporateSME) portfolio mainly driven by the impairment of a small number of larger exposures partially offset by business turnaroundsacross the Australian business lending portfolio.
Specific provision for credit impairmentSpecific provision for credit impairment at 31 March 2019 increased compared to 30 September 2018, driven by higher chargeswithin the Australian IRB corporate (including corporate SME) portfolio mainly due to the impairment of a small number of largerexposures, partially offset by write-backs resulting from business turnarounds for a small number of larger exposures.
Charge for specific provisionsThe specific provision charge for the six months ended 31 March 2019 was $297 million, $37 million higher than the six monthsended 30 September 2018 due to higher charges in the Australian IRB corporate (including corporate SME) portfolio. This wasdriven by the impairment of a small number of larger exposures in Corporate and Institutional Banking, partially offset by lowercharges in Business and Private Banking due to low levels of newly impaired exposures combined with write-backs resultingfrom business turnarounds for a small number of larger exposures.
Net write-offsNet write-offs decreased from $289 million to $258 million for the six months ended 31 March 2019, mainly driven by a reductionin the level of write-offs within the Australian IRB corporate (including corporate SME) portfolio.
4.1 General Disclosures (continued)
23
Credit Risk
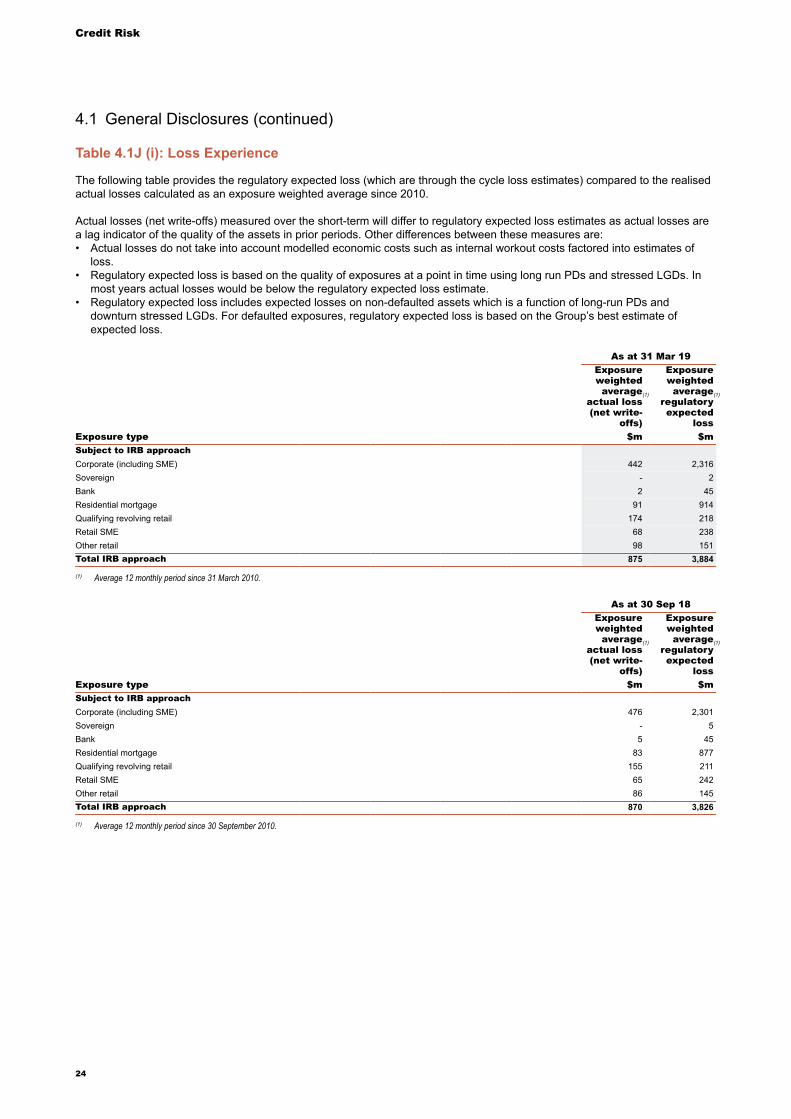
Table 4.1J (i): Loss Experience
The following table provides the regulatory expected loss (which are through the cycle loss estimates) compared to the realisedactual losses calculated as an exposure weighted average since 2010.
Actual losses (net write-offs) measured over the short-term will differ to regulatory expected loss estimates as actual losses area lag indicator of the quality of the assets in prior periods. Other differences between these measures are:• Actual losses do not take into account modelled economic costs such as internal workout costs factored into estimates of
loss.• Regulatory expected loss is based on the quality of exposures at a point in time using long run PDs and stressed LGDs. In
most years actual losses would be below the regulatory expected loss estimate.• Regulatory expected loss includes expected losses on non-defaulted assets which is a function of long-run PDs and
downturn stressed LGDs. For defaulted exposures, regulatory expected loss is based on the Group’s best estimate ofexpected loss.
As at 31 Mar 19Exposureweightedaverage
actual loss(net write-
offs)
(1)
Exposureweightedaverage
regulatoryexpected
loss
(1)
Exposure type $m $mSubject to IRB approachCorporate (including SME) 442 2,316Sovereign - 2Bank 2 45Residential mortgage 91 914Qualifying revolving retail 174 218Retail SME 68 238Other retail 98 151Total IRB approach 875 3,884
(1) Average 12 monthly period since 31 March 2010.
As at 30 Sep 18Exposureweightedaverage
actual loss(net write-
offs)
(1)
Exposureweightedaverage
regulatoryexpected
loss
(1)
Exposure type $m $mSubject to IRB approachCorporate (including SME) 476 2,301Sovereign - 5Bank 5 45Residential mortgage 83 877Qualifying revolving retail 155 211Retail SME 65 242Other retail 86 145Total IRB approach 870 3,826
(1) Average 12 monthly period since 30 September 2010.
4.1 General Disclosures (continued)
24
Credit Risk
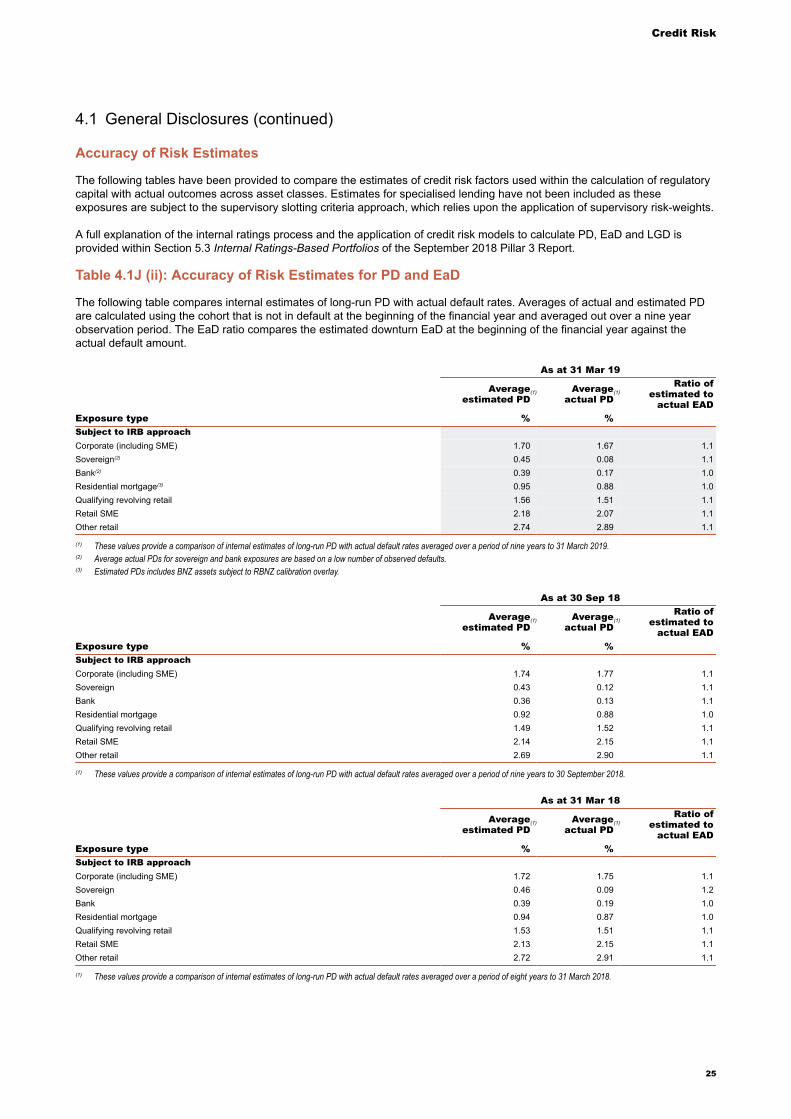
Accuracy of Risk Estimates
The following tables have been provided to compare the estimates of credit risk factors used within the calculation of regulatorycapital with actual outcomes across asset classes. Estimates for specialised lending have not been included as theseexposures are subject to the supervisory slotting criteria approach, which relies upon the application of supervisory risk-weights.
A full explanation of the internal ratings process and the application of credit risk models to calculate PD, EaD and LGD isprovided within Section 5.3 Internal Ratings-Based Portfolios of the September 2018 Pillar 3 Report.
Table 4.1J (ii): Accuracy of Risk Estimates for PD and EaD
The following table compares internal estimates of long-run PD with actual default rates. Averages of actual and estimated PDare calculated using the cohort that is not in default at the beginning of the financial year and averaged out over a nine yearobservation period. The EaD ratio compares the estimated downturn EaD at the beginning of the financial year against theactual default amount.
As at 31 Mar 19
Averageestimated PD
(1) Averageactual PD
(1)Ratio of
estimated toactual EAD
Exposure type % %Subject to IRB approachCorporate (including SME) 1.70 1.67 1.1Sovereign(2) 0.45 0.08 1.1Bank(2) 0.39 0.17 1.0Residential mortgage(3) 0.95 0.88 1.0Qualifying revolving retail 1.56 1.51 1.1Retail SME 2.18 2.07 1.1Other retail 2.74 2.89 1.1
(1) These values provide a comparison of internal estimates of long-run PD with actual default rates averaged over a period of nine years to 31 March 2019.(2) Average actual PDs for sovereign and bank exposures are based on a low number of observed defaults.(3) Estimated PDs includes BNZ assets subject to RBNZ calibration overlay.
As at 30 Sep 18
Averageestimated PD
(1) Averageactual PD
(1)Ratio of
estimated toactual EAD
Exposure type % %Subject to IRB approachCorporate (including SME) 1.74 1.77 1.1Sovereign 0.43 0.12 1.1Bank 0.36 0.13 1.1Residential mortgage 0.92 0.88 1.0Qualifying revolving retail 1.49 1.52 1.1Retail SME 2.14 2.15 1.1Other retail 2.69 2.90 1.1
(1) These values provide a comparison of internal estimates of long-run PD with actual default rates averaged over a period of nine years to 30 September 2018.
As at 31 Mar 18
Averageestimated PD
(1) Averageactual PD
(1)Ratio of
estimated toactual EAD
Exposure type % %Subject to IRB approachCorporate (including SME) 1.72 1.75 1.1Sovereign 0.46 0.09 1.2Bank 0.39 0.19 1.0Residential mortgage 0.94 0.87 1.0Qualifying revolving retail 1.53 1.51 1.1Retail SME 2.13 2.15 1.1Other retail 2.72 2.91 1.1
(1) These values provide a comparison of internal estimates of long-run PD with actual default rates averaged over a period of eight years to 31 March 2018.
4.1 General Disclosures (continued)
25
Credit Risk
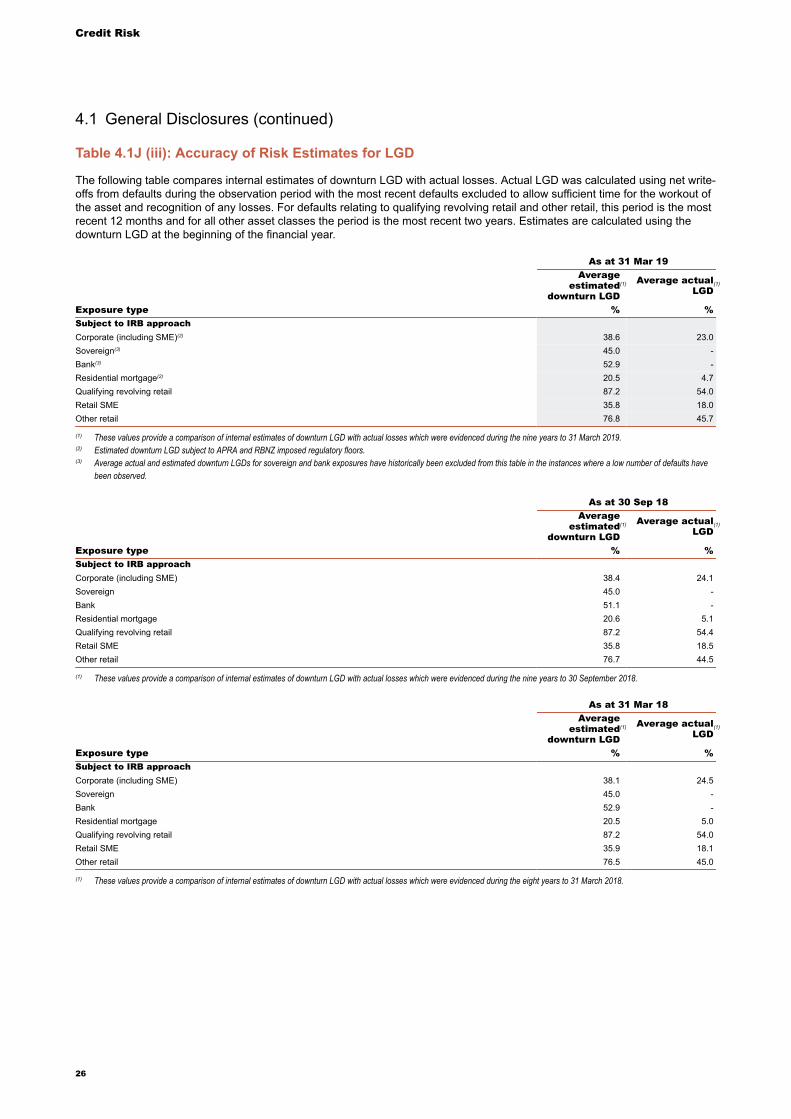
Table 4.1J (iii): Accuracy of Risk Estimates for LGD
The following table compares internal estimates of downturn LGD with actual losses. Actual LGD was calculated using net write-offs from defaults during the observation period with the most recent defaults excluded to allow sufficient time for the workout ofthe asset and recognition of any losses. For defaults relating to qualifying revolving retail and other retail, this period is the mostrecent 12 months and for all other asset classes the period is the most recent two years. Estimates are calculated using thedownturn LGD at the beginning of the financial year.
As at 31 Mar 19Average
estimateddownturn LGD
(1) Average actualLGD
(1)
Exposure type % %Subject to IRB approachCorporate (including SME)(2) 38.6 23.0Sovereign(3) 45.0 -Bank(3) 52.9 -Residential mortgage(2) 20.5 4.7Qualifying revolving retail 87.2 54.0Retail SME 35.8 18.0Other retail 76.8 45.7
(1) These values provide a comparison of internal estimates of downturn LGD with actual losses which were evidenced during the nine years to 31 March 2019.(2) Estimated downturn LGD subject to APRA and RBNZ imposed regulatory floors.(3) Average actual and estimated downturn LGDs for sovereign and bank exposures have historically been excluded from this table in the instances where a low number of defaults have
been observed.
As at 30 Sep 18Average
estimateddownturn LGD
(1) Average actualLGD
(1)
Exposure type % %Subject to IRB approachCorporate (including SME) 38.4 24.1Sovereign 45.0 -Bank 51.1 -Residential mortgage 20.6 5.1Qualifying revolving retail 87.2 54.4Retail SME 35.8 18.5Other retail 76.7 44.5
(1) These values provide a comparison of internal estimates of downturn LGD with actual losses which were evidenced during the nine years to 30 September 2018.
As at 31 Mar 18Average
estimateddownturn LGD
(1) Average actualLGD
(1)
Exposure type % %Subject to IRB approachCorporate (including SME) 38.1 24.5Sovereign 45.0 -Bank 52.9 -Residential mortgage 20.5 5.0Qualifying revolving retail 87.2 54.0Retail SME 35.9 18.1Other retail 76.5 45.0
(1) These values provide a comparison of internal estimates of downturn LGD with actual losses which were evidenced during the eight years to 31 March 2018.
4.1 General Disclosures (continued)
26
Credit Risk
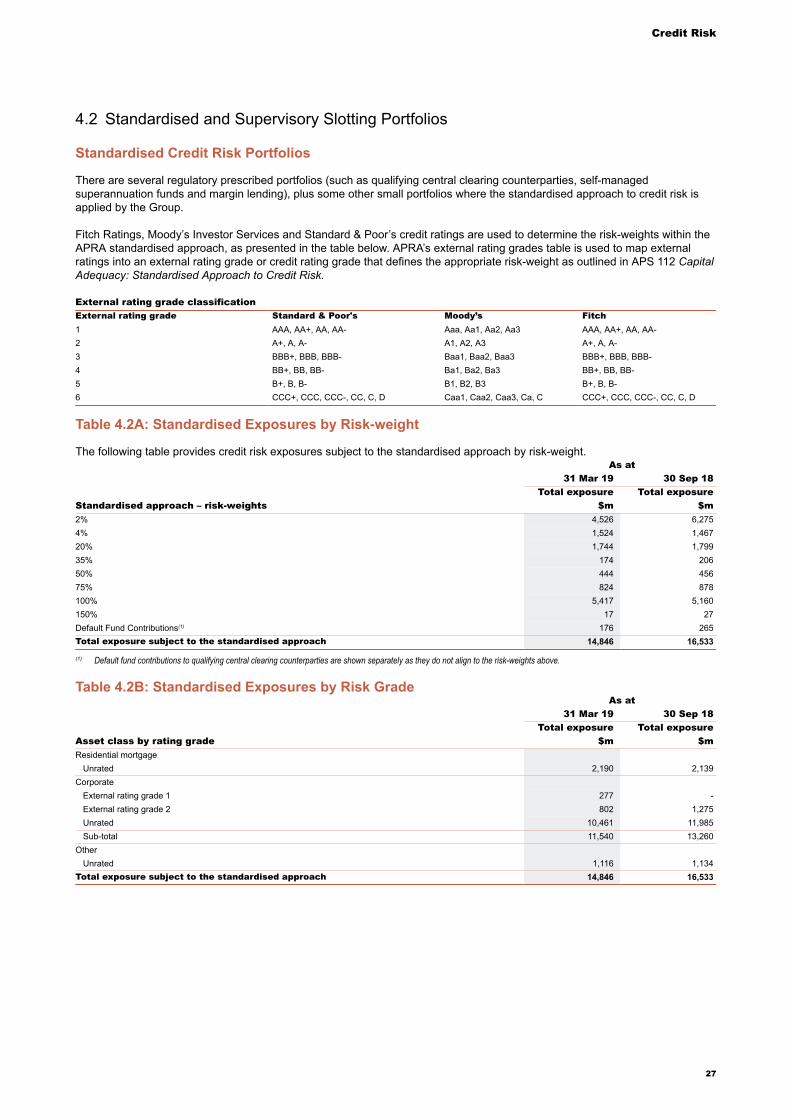
4.2 Standardised and Supervisory Slotting Portfolios
Standardised Credit Risk Portfolios
There are several regulatory prescribed portfolios (such as qualifying central clearing counterparties, self-managedsuperannuation funds and margin lending), plus some other small portfolios where the standardised approach to credit risk isapplied by the Group.
Fitch Ratings, Moody’s Investor Services and Standard & Poor’s credit ratings are used to determine the risk-weights within theAPRA standardised approach, as presented in the table below. APRA’s external rating grades table is used to map externalratings into an external rating grade or credit rating grade that defines the appropriate risk-weight as outlined in APS 112 CapitalAdequacy: Standardised Approach to Credit Risk.
External rating grade classificationExternal rating grade Standard & Poor's Moody’s Fitch1 AAA, AA+, AA, AA- Aaa, Aa1, Aa2, Aa3 AAA, AA+, AA, AA-2 A+, A, A- A1, A2, A3 A+, A, A-3 BBB+, BBB, BBB- Baa1, Baa2, Baa3 BBB+, BBB, BBB-4 BB+, BB, BB- Ba1, Ba2, Ba3 BB+, BB, BB-5 B+, B, B- B1, B2, B3 B+, B, B-6 CCC+, CCC, CCC-, CC, C, D Caa1, Caa2, Caa3, Ca, C CCC+, CCC, CCC-, CC, C, D
Table 4.2A: Standardised Exposures by Risk-weight
The following table provides credit risk exposures subject to the standardised approach by risk-weight.As at
31 Mar 19 30 Sep 18Total exposure Total exposure
Standardised approach – risk-weights $m $m2% 4,526 6,2754% 1,524 1,46720% 1,744 1,79935% 174 20650% 444 45675% 824 878100% 5,417 5,160150% 17 27Default Fund Contributions(1) 176 265Total exposure subject to the standardised approach 14,846 16,533
(1) Default fund contributions to qualifying central clearing counterparties are shown separately as they do not align to the risk-weights above.
Table 4.2B: Standardised Exposures by Risk GradeAs at
31 Mar 19 30 Sep 18Total exposure Total exposure
Asset class by rating grade $m $mResidential mortgage
Unrated 2,190 2,139Corporate
External rating grade 1 277 -External rating grade 2 802 1,275Unrated 10,461 11,985Sub-total 11,540 13,260
OtherUnrated 1,116 1,134
Total exposure subject to the standardised approach 14,846 16,533
27
Credit Risk
Portfolios Subject to Supervisory Risk-weights in the IRB Approach
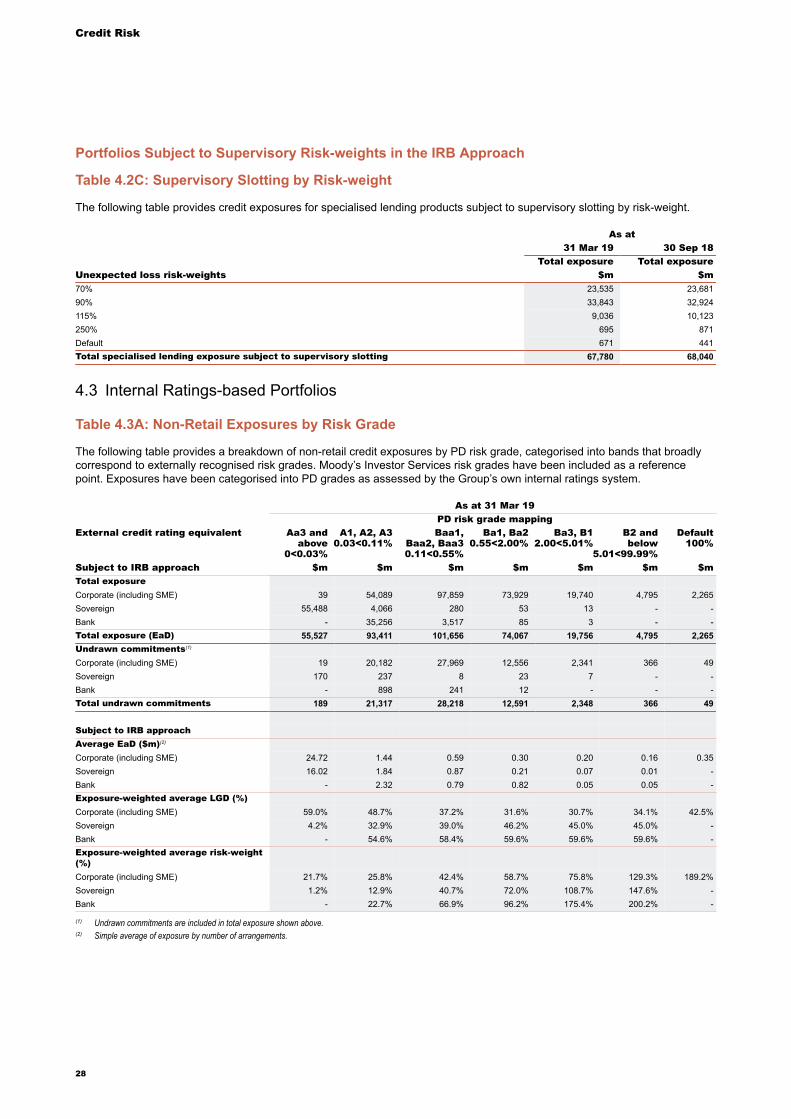
Table 4.2C: Supervisory Slotting by Risk-weight
The following table provides credit exposures for specialised lending products subject to supervisory slotting by risk-weight.
As at31 Mar 19 30 Sep 18
Total exposure Total exposureUnexpected loss risk-weights $m $m70% 23,535 23,68190% 33,843 32,924115% 9,036 10,123250% 695 871Default 671 441Total specialised lending exposure subject to supervisory slotting 67,780 68,040
4.3 Internal Ratings-based Portfolios
Table 4.3A: Non-Retail Exposures by Risk Grade
The following table provides a breakdown of non-retail credit exposures by PD risk grade, categorised into bands that broadlycorrespond to externally recognised risk grades. Moody’s Investor Services risk grades have been included as a referencepoint. Exposures have been categorised into PD grades as assessed by the Group’s own internal ratings system.
As at 31 Mar 19PD risk grade mapping
External credit rating equivalent Aa3 andabove
0<0.03%
A1, A2, A30.03<0.11%
Baa1,Baa2, Baa30.11<0.55%
Ba1, Ba20.55<2.00%
Ba3, B12.00<5.01%
B2 andbelow
5.01<99.99%
Default100%
Subject to IRB approach $m $m $m $m $m $m $mTotal exposureCorporate (including SME) 39 54,089 97,859 73,929 19,740 4,795 2,265Sovereign 55,488 4,066 280 53 13 - -Bank - 35,256 3,517 85 3 - -Total exposure (EaD) 55,527 93,411 101,656 74,067 19,756 4,795 2,265Undrawn commitments(1)
Corporate (including SME) 19 20,182 27,969 12,556 2,341 366 49Sovereign 170 237 8 23 7 - -Bank - 898 241 12 - - -Total undrawn commitments 189 21,317 28,218 12,591 2,348 366 49
Subject to IRB approachAverage EaD ($m)(2)
Corporate (including SME) 24.72 1.44 0.59 0.30 0.20 0.16 0.35Sovereign 16.02 1.84 0.87 0.21 0.07 0.01 -Bank - 2.32 0.79 0.82 0.05 0.05 -Exposure-weighted average LGD (%)Corporate (including SME) 59.0% 48.7% 37.2% 31.6% 30.7% 34.1% 42.5%Sovereign 4.2% 32.9% 39.0% 46.2% 45.0% 45.0% -Bank - 54.6% 58.4% 59.6% 59.6% 59.6% -Exposure-weighted average risk-weight(%)Corporate (including SME) 21.7% 25.8% 42.4% 58.7% 75.8% 129.3% 189.2%Sovereign 1.2% 12.9% 40.7% 72.0% 108.7% 147.6% -Bank - 22.7% 66.9% 96.2% 175.4% 200.2% -
(1) Undrawn commitments are included in total exposure shown above.(2) Simple average of exposure by number of arrangements.
28
Credit Risk
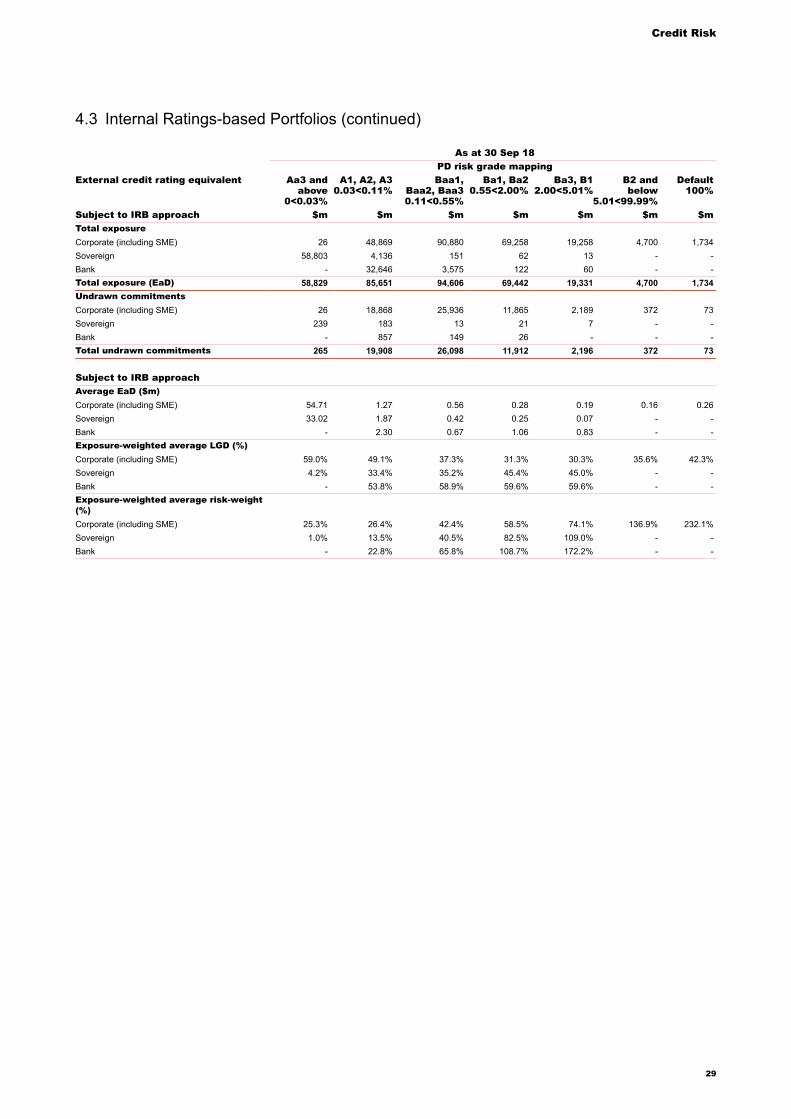
As at 30 Sep 18PD risk grade mapping
External credit rating equivalent Aa3 andabove
0<0.03%
A1, A2, A30.03<0.11%
Baa1,Baa2, Baa30.11<0.55%
Ba1, Ba20.55<2.00%
Ba3, B12.00<5.01%
B2 andbelow
5.01<99.99%
Default100%
Subject to IRB approach $m $m $m $m $m $m $mTotal exposureCorporate (including SME) 26 48,869 90,880 69,258 19,258 4,700 1,734Sovereign 58,803 4,136 151 62 13 - -Bank - 32,646 3,575 122 60 - -Total exposure (EaD) 58,829 85,651 94,606 69,442 19,331 4,700 1,734Undrawn commitmentsCorporate (including SME) 26 18,868 25,936 11,865 2,189 372 73Sovereign 239 183 13 21 7 - -Bank - 857 149 26 - - -Total undrawn commitments 265 19,908 26,098 11,912 2,196 372 73
Subject to IRB approachAverage EaD ($m)Corporate (including SME) 54.71 1.27 0.56 0.28 0.19 0.16 0.26Sovereign 33.02 1.87 0.42 0.25 0.07 - -Bank - 2.30 0.67 1.06 0.83 - -Exposure-weighted average LGD (%)Corporate (including SME) 59.0% 49.1% 37.3% 31.3% 30.3% 35.6% 42.3%Sovereign 4.2% 33.4% 35.2% 45.4% 45.0% - -Bank - 53.8% 58.9% 59.6% 59.6% - -Exposure-weighted average risk-weight(%)Corporate (including SME) 25.3% 26.4% 42.4% 58.5% 74.1% 136.9% 232.1%Sovereign 1.0% 13.5% 40.5% 82.5% 109.0% - -Bank - 22.8% 65.8% 108.7% 172.2% - -
4.3 Internal Ratings-based Portfolios (continued)
29
Credit Risk
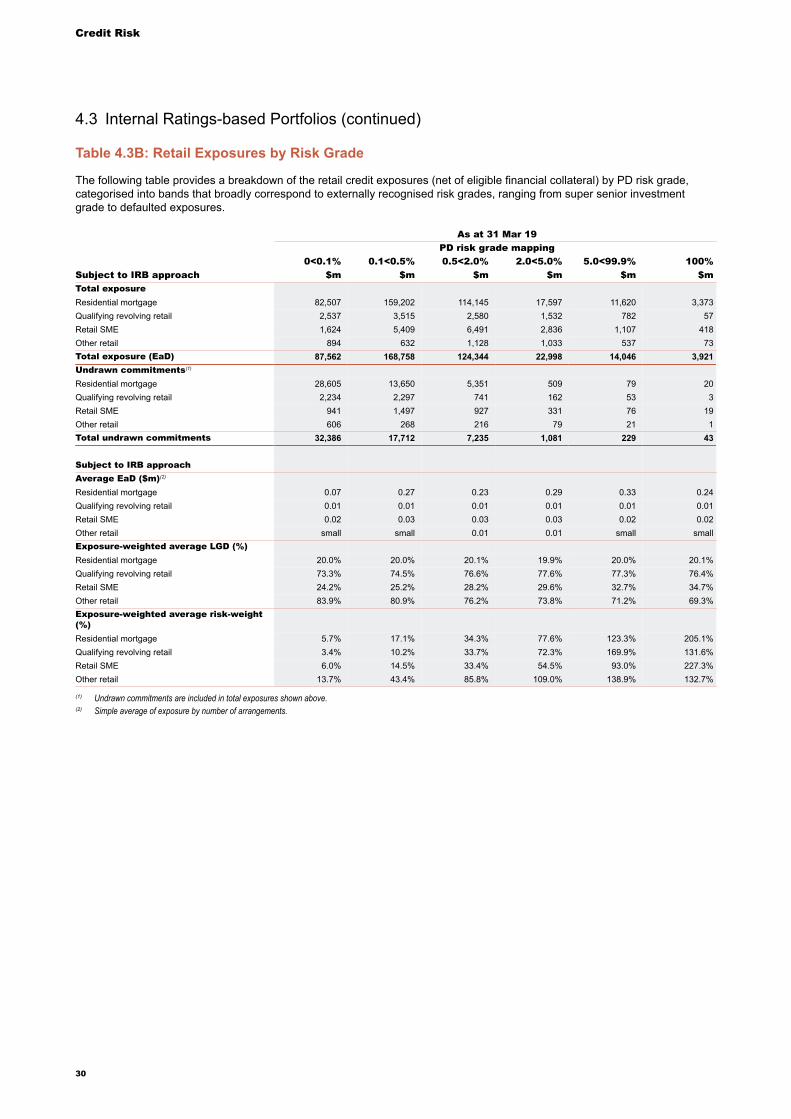
Table 4.3B: Retail Exposures by Risk Grade
The following table provides a breakdown of the retail credit exposures (net of eligible financial collateral) by PD risk grade,categorised into bands that broadly correspond to externally recognised risk grades, ranging from super senior investmentgrade to defaulted exposures.
As at 31 Mar 19PD risk grade mapping
0<0.1% 0.1<0.5% 0.5<2.0% 2.0<5.0% 5.0<99.9% 100%Subject to IRB approach $m $m $m $m $m $mTotal exposureResidential mortgage 82,507 159,202 114,145 17,597 11,620 3,373Qualifying revolving retail 2,537 3,515 2,580 1,532 782 57Retail SME 1,624 5,409 6,491 2,836 1,107 418Other retail 894 632 1,128 1,033 537 73Total exposure (EaD) 87,562 168,758 124,344 22,998 14,046 3,921Undrawn commitments(1)
Residential mortgage 28,605 13,650 5,351 509 79 20Qualifying revolving retail 2,234 2,297 741 162 53 3Retail SME 941 1,497 927 331 76 19Other retail 606 268 216 79 21 1Total undrawn commitments 32,386 17,712 7,235 1,081 229 43
Subject to IRB approachAverage EaD ($m)(2)
Residential mortgage 0.07 0.27 0.23 0.29 0.33 0.24Qualifying revolving retail 0.01 0.01 0.01 0.01 0.01 0.01Retail SME 0.02 0.03 0.03 0.03 0.02 0.02Other retail small small 0.01 0.01 small smallExposure-weighted average LGD (%)Residential mortgage 20.0% 20.0% 20.1% 19.9% 20.0% 20.1%Qualifying revolving retail 73.3% 74.5% 76.6% 77.6% 77.3% 76.4%Retail SME 24.2% 25.2% 28.2% 29.6% 32.7% 34.7%Other retail 83.9% 80.9% 76.2% 73.8% 71.2% 69.3%Exposure-weighted average risk-weight(%)Residential mortgage 5.7% 17.1% 34.3% 77.6% 123.3% 205.1%Qualifying revolving retail 3.4% 10.2% 33.7% 72.3% 169.9% 131.6%Retail SME 6.0% 14.5% 33.4% 54.5% 93.0% 227.3%Other retail 13.7% 43.4% 85.8% 109.0% 138.9% 132.7%
(1) Undrawn commitments are included in total exposures shown above.(2) Simple average of exposure by number of arrangements.
4.3 Internal Ratings-based Portfolios (continued)
30
Credit Risk
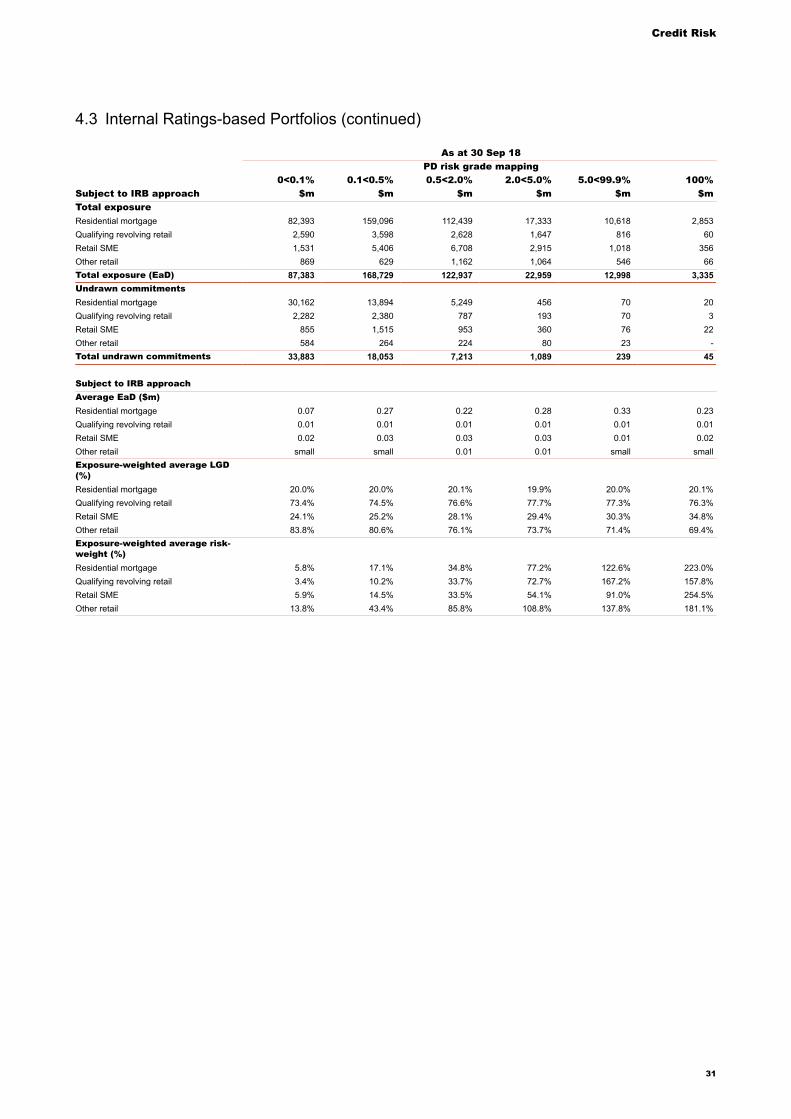
As at 30 Sep 18PD risk grade mapping
0<0.1% 0.1<0.5% 0.5<2.0% 2.0<5.0% 5.0<99.9% 100%Subject to IRB approach $m $m $m $m $m $mTotal exposureResidential mortgage 82,393 159,096 112,439 17,333 10,618 2,853Qualifying revolving retail 2,590 3,598 2,628 1,647 816 60Retail SME 1,531 5,406 6,708 2,915 1,018 356Other retail 869 629 1,162 1,064 546 66Total exposure (EaD) 87,383 168,729 122,937 22,959 12,998 3,335Undrawn commitmentsResidential mortgage 30,162 13,894 5,249 456 70 20Qualifying revolving retail 2,282 2,380 787 193 70 3Retail SME 855 1,515 953 360 76 22Other retail 584 264 224 80 23 -Total undrawn commitments 33,883 18,053 7,213 1,089 239 45
Subject to IRB approachAverage EaD ($m)Residential mortgage 0.07 0.27 0.22 0.28 0.33 0.23Qualifying revolving retail 0.01 0.01 0.01 0.01 0.01 0.01Retail SME 0.02 0.03 0.03 0.03 0.01 0.02Other retail small small 0.01 0.01 small smallExposure-weighted average LGD(%)Residential mortgage 20.0% 20.0% 20.1% 19.9% 20.0% 20.1%Qualifying revolving retail 73.4% 74.5% 76.6% 77.7% 77.3% 76.3%Retail SME 24.1% 25.2% 28.1% 29.4% 30.3% 34.8%Other retail 83.8% 80.6% 76.1% 73.7% 71.4% 69.4%Exposure-weighted average risk-weight (%)Residential mortgage 5.8% 17.1% 34.8% 77.2% 122.6% 223.0%Qualifying revolving retail 3.4% 10.2% 33.7% 72.7% 167.2% 157.8%Retail SME 5.9% 14.5% 33.5% 54.1% 91.0% 254.5%Other retail 13.8% 43.4% 85.8% 108.8% 137.8% 181.1%
4.3 Internal Ratings-based Portfolios (continued)
31
Credit Risk
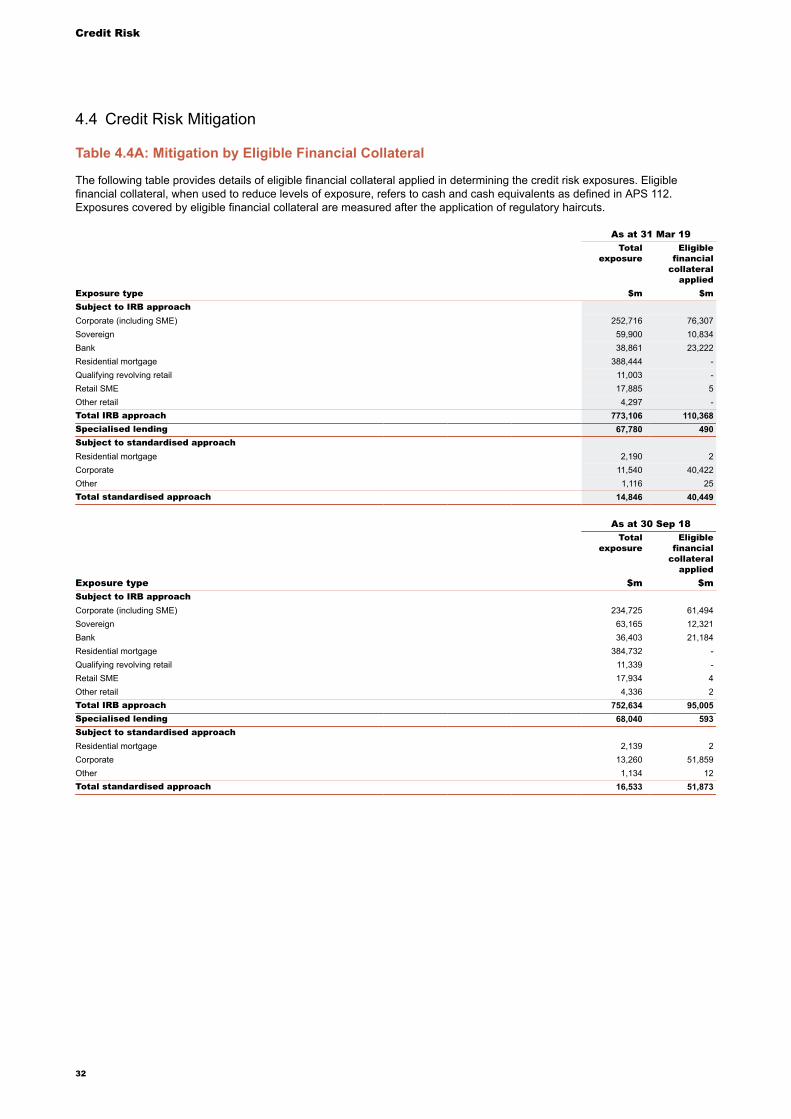
4.4 Credit Risk Mitigation
Table 4.4A: Mitigation by Eligible Financial Collateral
The following table provides details of eligible financial collateral applied in determining the credit risk exposures. Eligiblefinancial collateral, when used to reduce levels of exposure, refers to cash and cash equivalents as defined in APS 112.Exposures covered by eligible financial collateral are measured after the application of regulatory haircuts.
As at 31 Mar 19Total
exposureEligible
financialcollateral
appliedExposure type $m $mSubject to IRB approachCorporate (including SME) 252,716 76,307Sovereign 59,900 10,834Bank 38,861 23,222Residential mortgage 388,444 -Qualifying revolving retail 11,003 -Retail SME 17,885 5Other retail 4,297 -Total IRB approach 773,106 110,368Specialised lending 67,780 490Subject to standardised approachResidential mortgage 2,190 2Corporate 11,540 40,422Other 1,116 25Total standardised approach 14,846 40,449
As at 30 Sep 18Total
exposureEligible
financialcollateral
appliedExposure type $m $mSubject to IRB approachCorporate (including SME) 234,725 61,494Sovereign 63,165 12,321Bank 36,403 21,184Residential mortgage 384,732 -Qualifying revolving retail 11,339 -Retail SME 17,934 4Other retail 4,336 2Total IRB approach 752,634 95,005Specialised lending 68,040 593Subject to standardised approachResidential mortgage 2,139 2Corporate 13,260 51,859Other 1,134 12Total standardised approach 16,533 51,873
32
Credit Risk
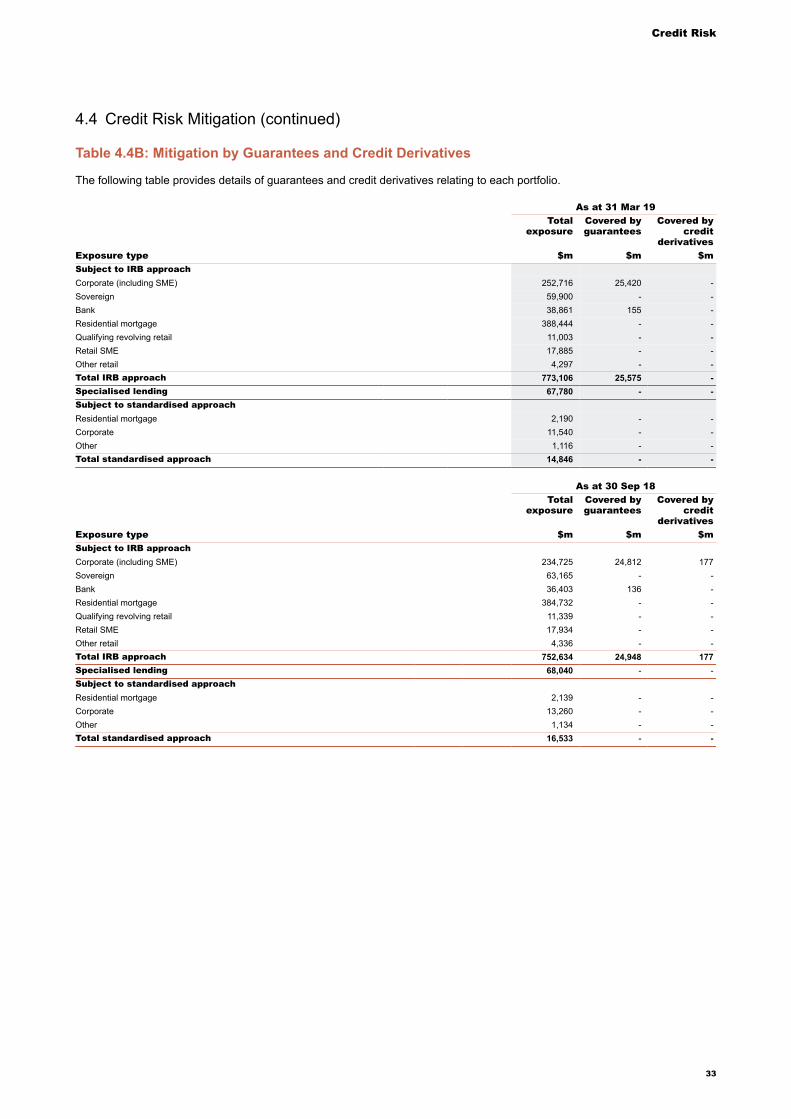
Table 4.4B: Mitigation by Guarantees and Credit Derivatives
The following table provides details of guarantees and credit derivatives relating to each portfolio.
As at 31 Mar 19Total
exposureCovered byguarantees
Covered bycredit
derivativesExposure type $m $m $mSubject to IRB approachCorporate (including SME) 252,716 25,420 -Sovereign 59,900 - -Bank 38,861 155 -Residential mortgage 388,444 - -Qualifying revolving retail 11,003 - -Retail SME 17,885 - -Other retail 4,297 - -Total IRB approach 773,106 25,575 -Specialised lending 67,780 - -Subject to standardised approachResidential mortgage 2,190 - -Corporate 11,540 - -Other 1,116 - -Total standardised approach 14,846 - -
As at 30 Sep 18Total
exposureCovered byguarantees
Covered bycredit
derivativesExposure type $m $m $mSubject to IRB approachCorporate (including SME) 234,725 24,812 177Sovereign 63,165 - -Bank 36,403 136 -Residential mortgage 384,732 - -Qualifying revolving retail 11,339 - -Retail SME 17,934 - -Other retail 4,336 - -Total IRB approach 752,634 24,948 177Specialised lending 68,040 - -Subject to standardised approachResidential mortgage 2,139 - -Corporate 13,260 - -Other 1,134 - -Total standardised approach 16,533 - -
4.4 Credit Risk Mitigation (continued)
33
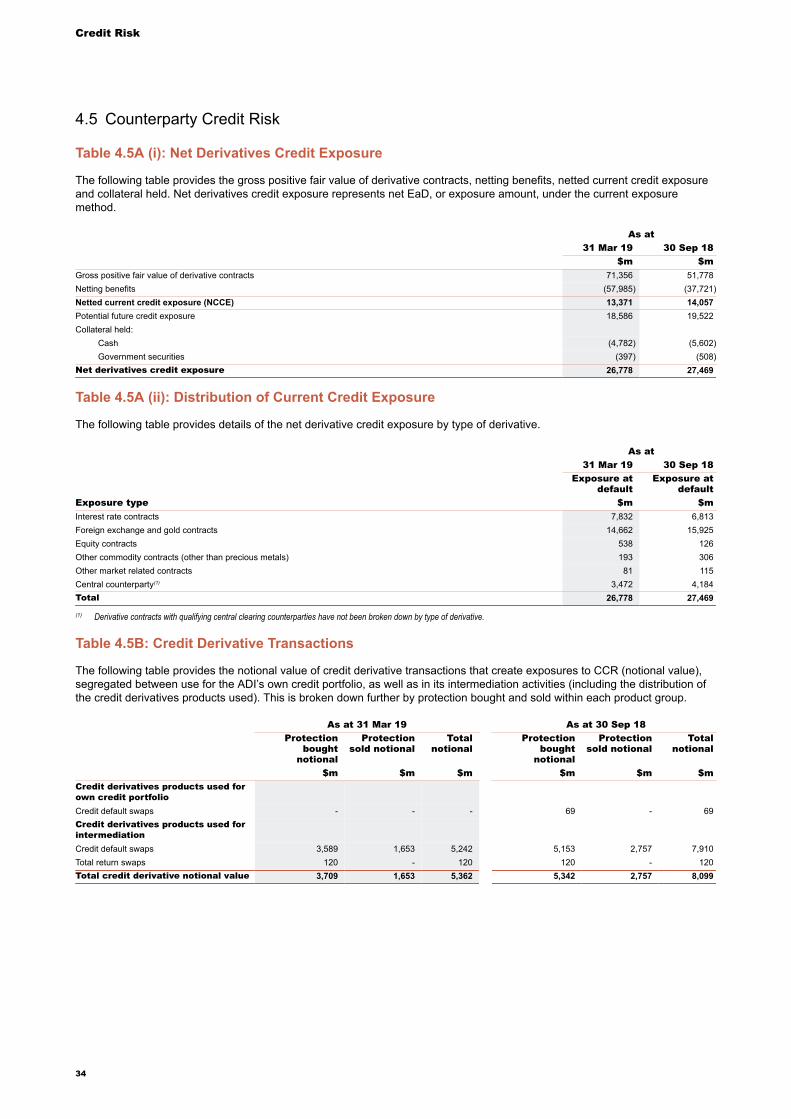
Credit Risk
4.5 Counterparty Credit Risk
Table 4.5A (i): Net Derivatives Credit Exposure
The following table provides the gross positive fair value of derivative contracts, netting benefits, netted current credit exposureand collateral held. Net derivatives credit exposure represents net EaD, or exposure amount, under the current exposuremethod.
As at31 Mar 19 30 Sep 18
$m $mGross positive fair value of derivative contracts 71,356 51,778Netting benefits (57,985) (37,721)Netted current credit exposure (NCCE) 13,371 14,057Potential future credit exposure 18,586 19,522Collateral held:
Cash (4,782) (5,602)Government securities (397) (508)
Net derivatives credit exposure 26,778 27,469
Table 4.5A (ii): Distribution of Current Credit Exposure
The following table provides details of the net derivative credit exposure by type of derivative.
As at31 Mar 19 30 Sep 18
Exposure atdefault
Exposure atdefault
Exposure type $m $mInterest rate contracts 7,832 6,813Foreign exchange and gold contracts 14,662 15,925Equity contracts 538 126Other commodity contracts (other than precious metals) 193 306Other market related contracts 81 115Central counterparty(1) 3,472 4,184Total 26,778 27,469
(1) Derivative contracts with qualifying central clearing counterparties have not been broken down by type of derivative.
Table 4.5B: Credit Derivative Transactions
The following table provides the notional value of credit derivative transactions that create exposures to CCR (notional value),segregated between use for the ADI’s own credit portfolio, as well as in its intermediation activities (including the distribution ofthe credit derivatives products used). This is broken down further by protection bought and sold within each product group.
As at 31 Mar 19 As at 30 Sep 18Protection
boughtnotional
Protectionsold notional
Totalnotional
Protectionbought
notional
Protectionsold notional
Totalnotional
$m $m $m $m $m $mCredit derivatives products used forown credit portfolioCredit default swaps - - - 69 - 69Credit derivatives products used forintermediationCredit default swaps 3,589 1,653 5,242 5,153 2,757 7,910Total return swaps 120 - 120 120 - 120Total credit derivative notional value 3,709 1,653 5,362 5,342 2,757 8,099
34
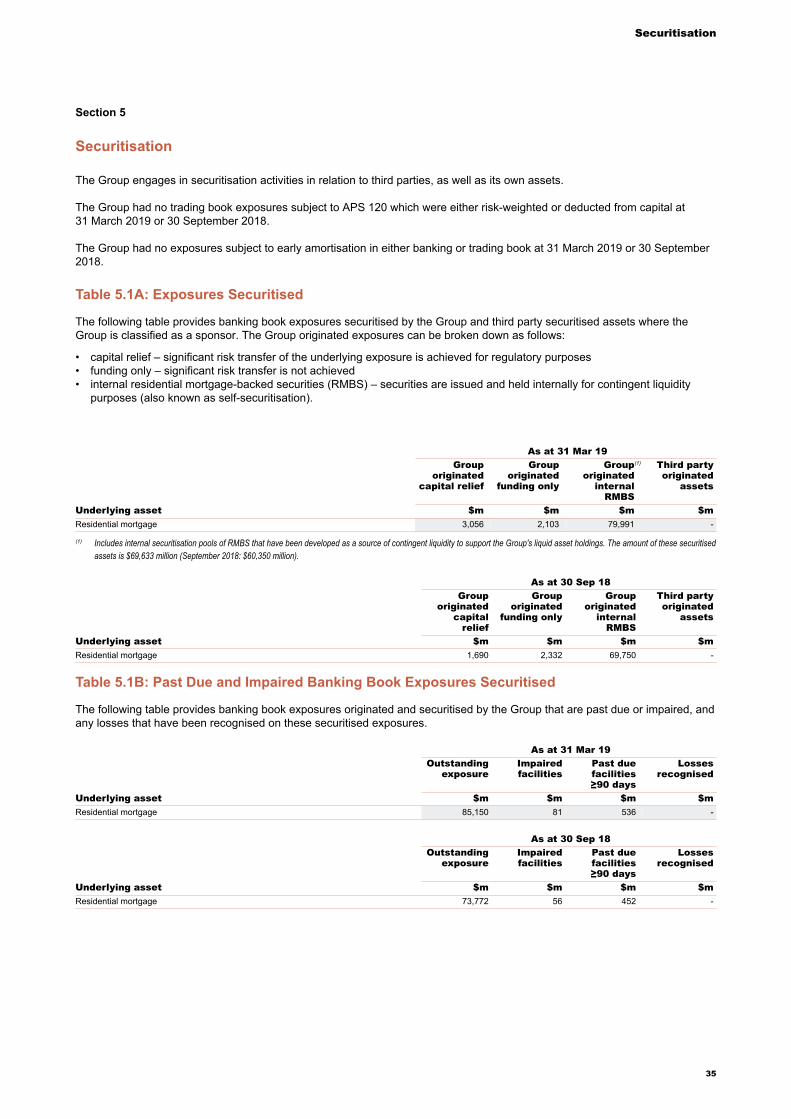
Securitisation
Section 5
Securitisation
The Group engages in securitisation activities in relation to third parties, as well as its own assets.
The Group had no trading book exposures subject to APS 120 which were either risk-weighted or deducted from capital at 31 March 2019 or 30 September 2018.
The Group had no exposures subject to early amortisation in either banking or trading book at 31 March 2019 or 30 September 2018.
Table 5.1A: Exposures Securitised
The following table provides banking book exposures securitised by the Group and third party securitised assets where the Group is classified as a sponsor. The Group originated exposures can be broken down as follows:
• capital relief – significant risk transfer of the underlying exposure is achieved for regulatory purposes• funding only – significant risk transfer is not achieved• internal residential mortgage-backed securities (RMBS) – securities are issued and held internally for contingent liquidity
purposes (also known as self-securitisation).
As at 31 Mar 19Group
originatedcapital relief
Grouporiginated
funding only
Grouporiginated
internalRMBS
(1) Third partyoriginated
assets
Underlying asset $m $m $m $mResidential mortgage 3,056 2,103 79,991 -
(1) Includes internal securitisation pools of RMBS that have been developed as a source of contingent liquidity to support the Group's liquid asset holdings. The amount of these securitisedassets is $69,633 million (September 2018: $60,350 million).
As at 30 Sep 18Group
originatedcapital
relief
Grouporiginated
funding only
Grouporiginated
internalRMBS
Third partyoriginated
assets
Underlying asset $m $m $m $mResidential mortgage 1,690 2,332 69,750 -
Table 5.1B: Past Due and Impaired Banking Book Exposures Securitised
The following table provides banking book exposures originated and securitised by the Group that are past due or impaired, andany losses that have been recognised on these securitised exposures.
As at 31 Mar 19Outstanding
exposureImpairedfacilities
Past duefacilities≥90 days
Lossesrecognised
Underlying asset $m $m $m $mResidential mortgage 85,150 81 536 -
As at 30 Sep 18Outstanding
exposureImpairedfacilities
Past duefacilities≥90 days
Lossesrecognised
Underlying asset $m $m $m $mResidential mortgage 73,772 56 452 -
35
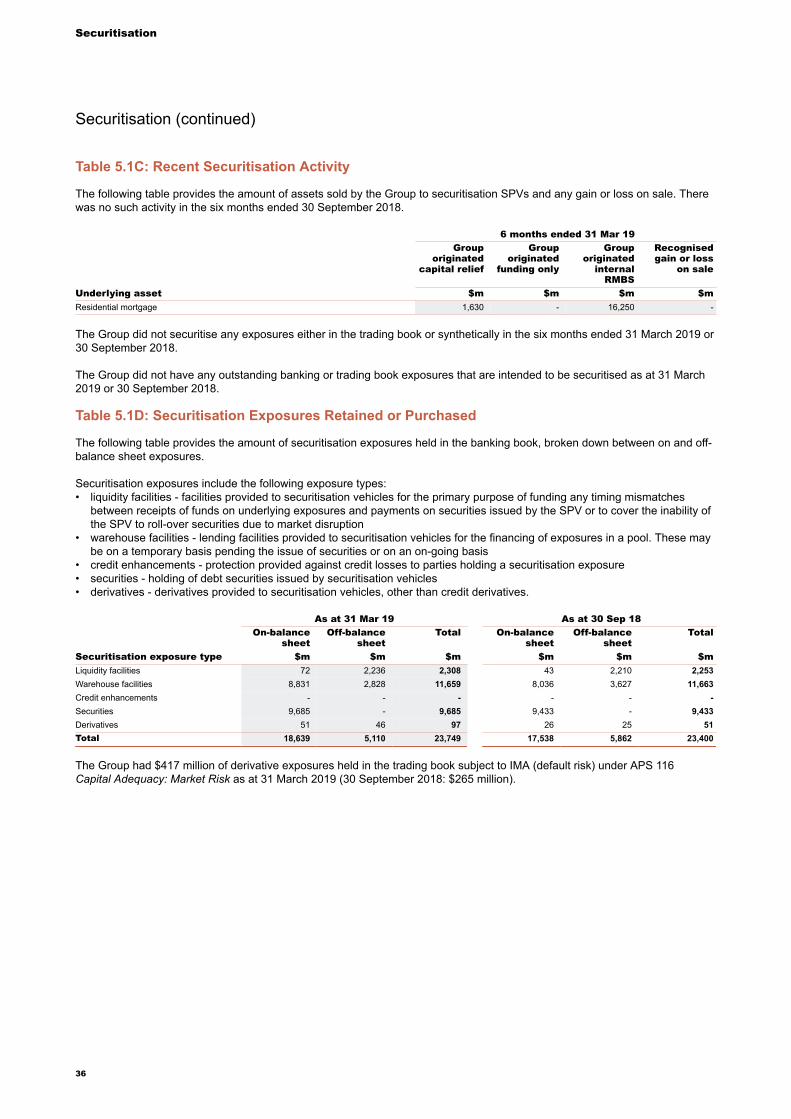
Securitisation
Table 5.1C: Recent Securitisation Activity
The following table provides the amount of assets sold by the Group to securitisation SPVs and any gain or loss on sale. Therewas no such activity in the six months ended 30 September 2018.
6 months ended 31 Mar 19Group
originatedcapital relief
Grouporiginated
funding only
Grouporiginated
internalRMBS
Recognisedgain or loss
on sale
Underlying asset $m $m $m $mResidential mortgage 1,630 - 16,250 -
The Group did not securitise any exposures either in the trading book or synthetically in the six months ended 31 March 2019 or30 September 2018.
The Group did not have any outstanding banking or trading book exposures that are intended to be securitised as at 31 March2019 or 30 September 2018.
Table 5.1D: Securitisation Exposures Retained or Purchased
The following table provides the amount of securitisation exposures held in the banking book, broken down between on and off-balance sheet exposures.
Securitisation exposures include the following exposure types:• liquidity facilities - facilities provided to securitisation vehicles for the primary purpose of funding any timing mismatches
between receipts of funds on underlying exposures and payments on securities issued by the SPV or to cover the inability ofthe SPV to roll-over securities due to market disruption
• warehouse facilities - lending facilities provided to securitisation vehicles for the financing of exposures in a pool. These maybe on a temporary basis pending the issue of securities or on an on-going basis
• credit enhancements - protection provided against credit losses to parties holding a securitisation exposure• securities - holding of debt securities issued by securitisation vehicles• derivatives - derivatives provided to securitisation vehicles, other than credit derivatives.
As at 31 Mar 19 As at 30 Sep 18On-balance
sheetOff-balance
sheetTotal On-balance
sheetOff-balance
sheetTotal
Securitisation exposure type $m $m $m $m $m $mLiquidity facilities 72 2,236 2,308 43 2,210 2,253Warehouse facilities 8,831 2,828 11,659 8,036 3,627 11,663Credit enhancements - - - - - -Securities 9,685 - 9,685 9,433 - 9,433Derivatives 51 46 97 26 25 51Total 18,639 5,110 23,749 17,538 5,862 23,400
The Group had $417 million of derivative exposures held in the trading book subject to IMA (default risk) under APS 116Capital Adequacy: Market Risk as at 31 March 2019 (30 September 2018: $265 million).
Securitisation (continued)
36
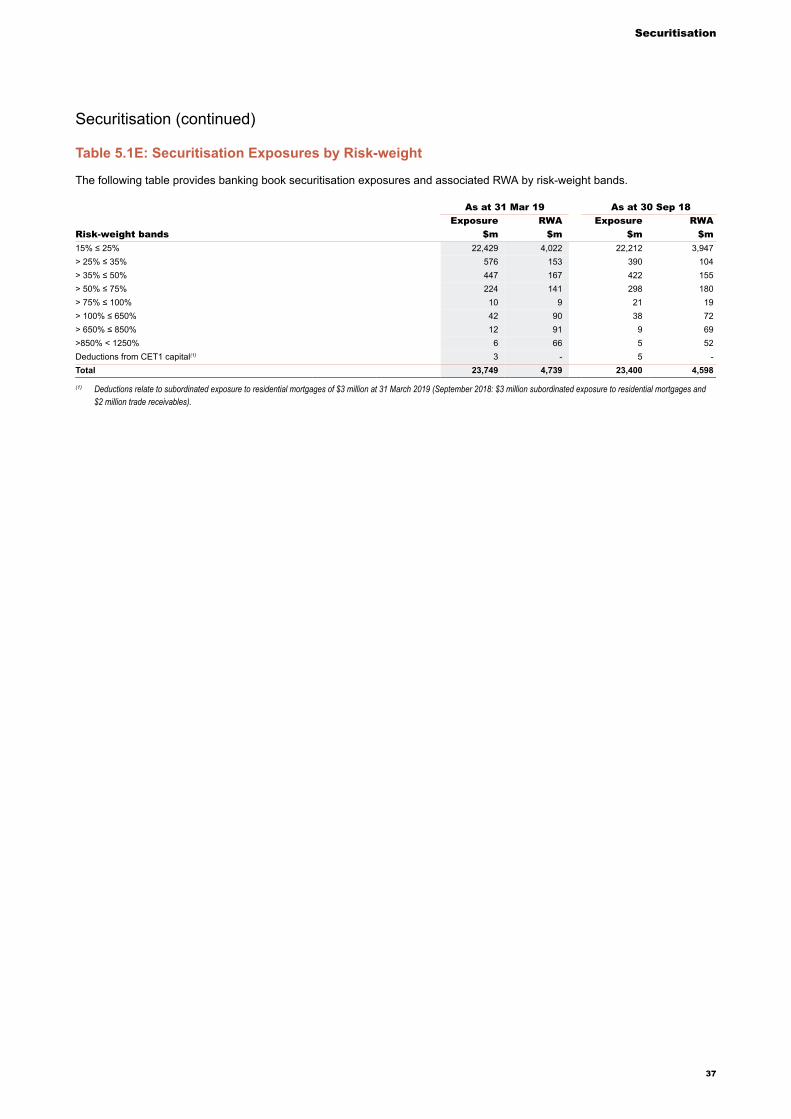
Securitisation
Table 5.1E: Securitisation Exposures by Risk-weight
The following table provides banking book securitisation exposures and associated RWA by risk-weight bands.
As at 31 Mar 19 As at 30 Sep 18Exposure RWA Exposure RWA
Risk-weight bands $m $m $m $m15% ≤ 25% 22,429 4,022 22,212 3,947> 25% ≤ 35% 576 153 390 104> 35% ≤ 50% 447 167 422 155> 50% ≤ 75% 224 141 298 180> 75% ≤ 100% 10 9 21 19> 100% ≤ 650% 42 90 38 72> 650% ≤ 850% 12 91 9 69>850% < 1250% 6 66 5 52Deductions from CET1 capital(1) 3 - 5 -Total 23,749 4,739 23,400 4,598
(1) Deductions relate to subordinated exposure to residential mortgages of $3 million at 31 March 2019 (September 2018: $3 million subordinated exposure to residential mortgages and$2 million trade receivables).
Securitisation (continued)
37
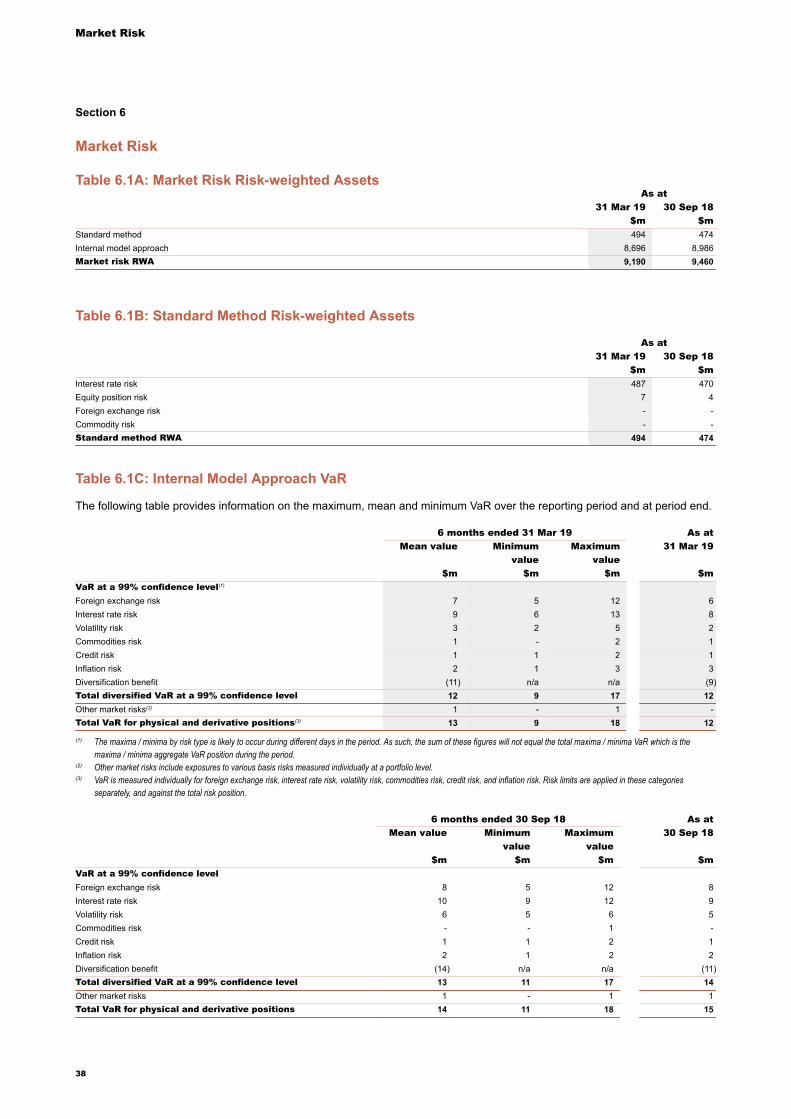
Market Risk
Section 6
Market Risk
Table 6.1A: Market Risk Risk-weighted AssetsAs at
31 Mar 19 30 Sep 18$m $m
Standard method 494 474Internal model approach 8,696 8,986Market risk RWA 9,190 9,460
Table 6.1B: Standard Method Risk-weighted Assets
As at31 Mar 19 30 Sep 18
$m $mInterest rate risk 487 470Equity position risk 7 4Foreign exchange risk - -Commodity risk - -Standard method RWA 494 474
Table 6.1C: Internal Model Approach VaR
The following table provides information on the maximum, mean and minimum VaR over the reporting period and at period end.
6 months ended 31 Mar 19 As atMean value Minimum Maximum 31 Mar 19
value value$m $m $m $m
VaR at a 99% confidence level(1)
Foreign exchange risk 7 5 12 6Interest rate risk 9 6 13 8Volatility risk 3 2 5 2Commodities risk 1 - 2 1Credit risk 1 1 2 1Inflation risk 2 1 3 3Diversification benefit (11) n/a n/a (9)Total diversified VaR at a 99% confidence level 12 9 17 12Other market risks(2) 1 - 1 -Total VaR for physical and derivative positions(3) 13 9 18 12
(1) The maxima / minima by risk type is likely to occur during different days in the period. As such, the sum of these figures will not equal the total maxima / minima VaR which is themaxima / minima aggregate VaR position during the period.
(2) Other market risks include exposures to various basis risks measured individually at a portfolio level.(3) VaR is measured individually for foreign exchange risk, interest rate risk, volatility risk, commodities risk, credit risk, and inflation risk. Risk limits are applied in these categories
separately, and against the total risk position.
6 months ended 30 Sep 18 As atMean value Minimum Maximum 30 Sep 18
value value$m $m $m $m
VaR at a 99% confidence levelForeign exchange risk 8 5 12 8Interest rate risk 10 9 12 9Volatility risk 6 5 6 5Commodities risk - - 1 -Credit risk 1 1 2 1Inflation risk 2 1 2 2Diversification benefit (14) n/a n/a (11)Total diversified VaR at a 99% confidence level 13 11 17 14Other market risks 1 - 1 1Total VaR for physical and derivative positions 14 11 18 15
38
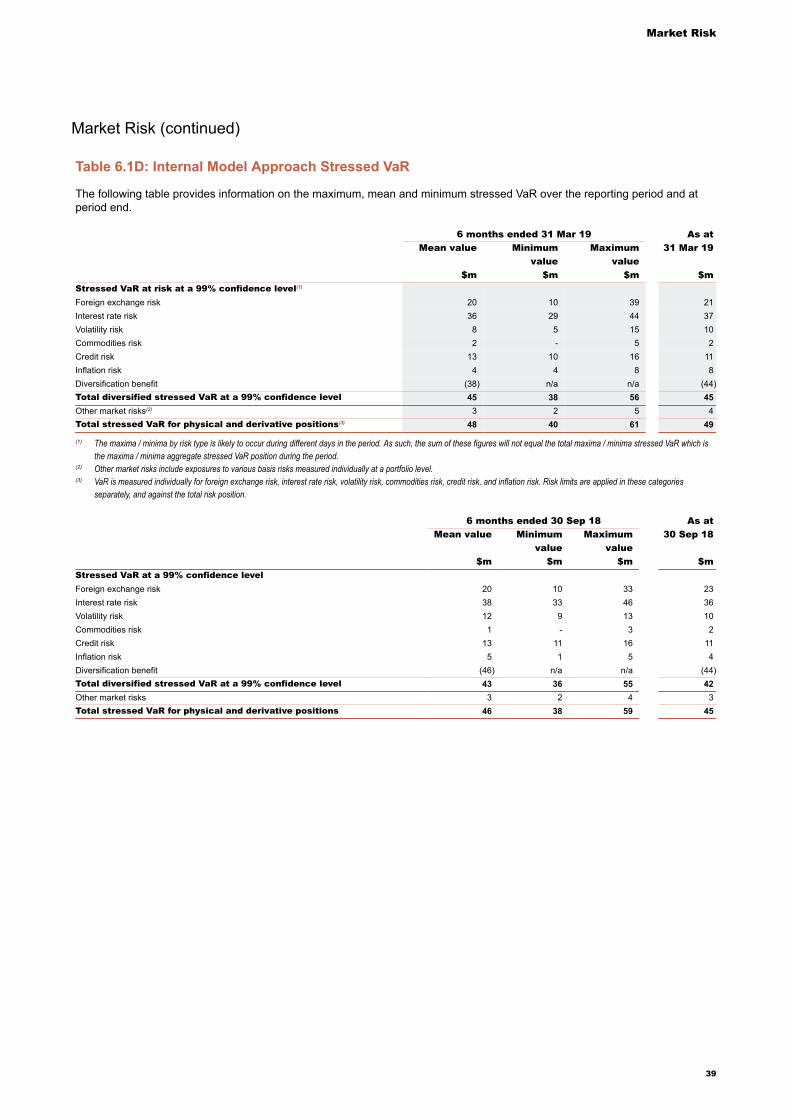
Market Risk
Table 6.1D: Internal Model Approach Stressed VaR
The following table provides information on the maximum, mean and minimum stressed VaR over the reporting period and atperiod end.
6 months ended 31 Mar 19 As atMean value Minimum Maximum 31 Mar 19
value value$m $m $m $m
Stressed VaR at risk at a 99% confidence level(1)
Foreign exchange risk 20 10 39 21Interest rate risk 36 29 44 37Volatility risk 8 5 15 10Commodities risk 2 - 5 2Credit risk 13 10 16 11Inflation risk 4 4 8 8Diversification benefit (38) n/a n/a (44)Total diversified stressed VaR at a 99% confidence level 45 38 56 45Other market risks(2) 3 2 5 4Total stressed VaR for physical and derivative positions(3) 48 40 61 49
(1) The maxima / minima by risk type is likely to occur during different days in the period. As such, the sum of these figures will not equal the total maxima / minima stressed VaR which isthe maxima / minima aggregate stressed VaR position during the period.
(2) Other market risks include exposures to various basis risks measured individually at a portfolio level.(3) VaR is measured individually for foreign exchange risk, interest rate risk, volatility risk, commodities risk, credit risk, and inflation risk. Risk limits are applied in these categories
separately, and against the total risk position.
6 months ended 30 Sep 18 As atMean value Minimum Maximum 30 Sep 18
value value$m $m $m $m
Stressed VaR at a 99% confidence levelForeign exchange risk 20 10 33 23Interest rate risk 38 33 46 36Volatility risk 12 9 13 10Commodities risk 1 - 3 2Credit risk 13 11 16 11Inflation risk 5 1 5 4Diversification benefit (46) n/a n/a (44)Total diversified stressed VaR at a 99% confidence level 43 36 55 42Other market risks 3 2 4 3Total stressed VaR for physical and derivative positions 46 38 59 45
39
Market Risk (continued)
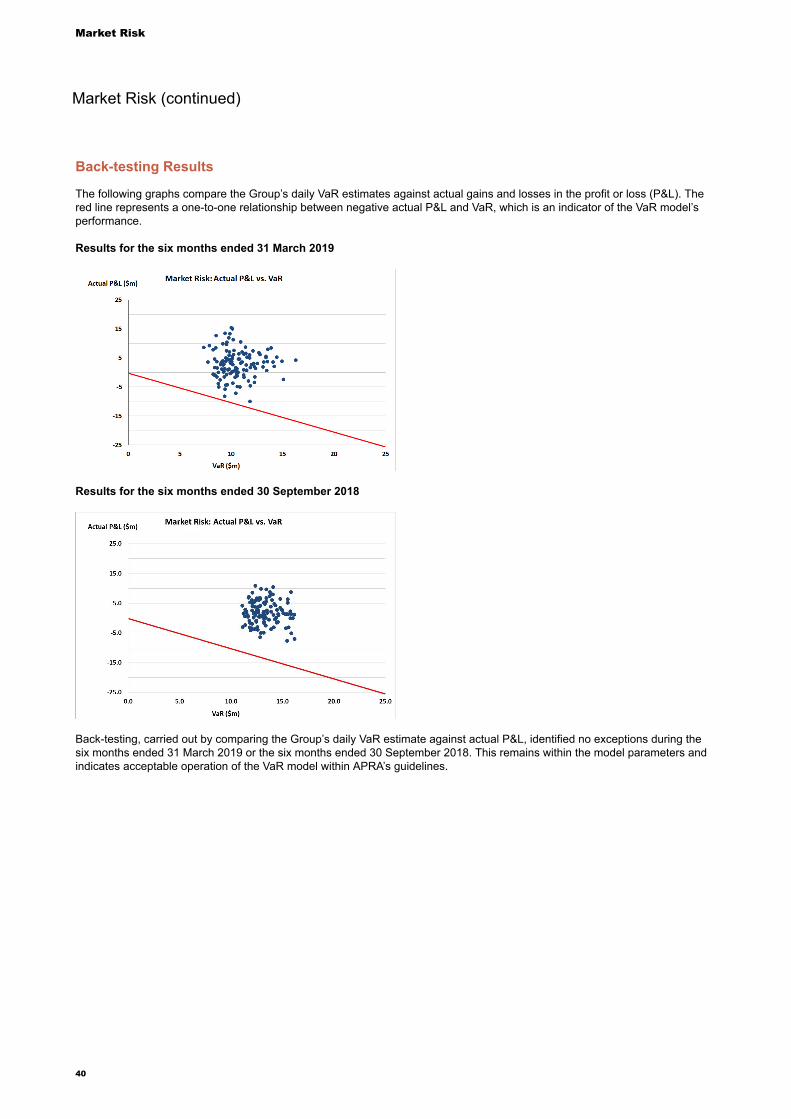
Market Risk
Back-testing Results
The following graphs compare the Group’s daily VaR estimates against actual gains and losses in the profit or loss (P&L). Thered line represents a one-to-one relationship between negative actual P&L and VaR, which is an indicator of the VaR model’sperformance.
Results for the six months ended 31 March 2019
Results for the six months ended 30 September 2018
Back-testing, carried out by comparing the Group’s daily VaR estimate against actual P&L, identified no exceptions during thesix months ended 31 March 2019 or the six months ended 30 September 2018. This remains within the model parameters andindicates acceptable operation of the VaR model within APRA’s guidelines.
40
Market Risk (continued)
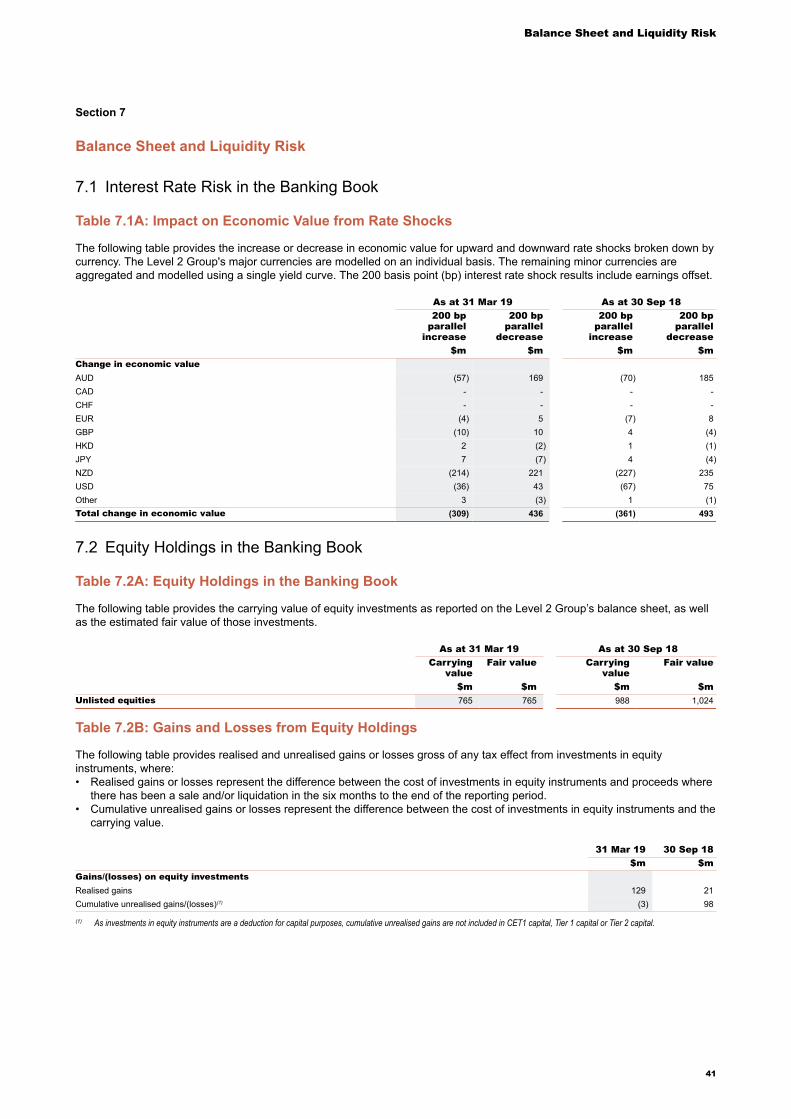
Balance Sheet and Liquidity Risk
Section 7
Balance Sheet and Liquidity Risk
7.1 Interest Rate Risk in the Banking Book
Table 7.1A: Impact on Economic Value from Rate Shocks
The following table provides the increase or decrease in economic value for upward and downward rate shocks broken down bycurrency. The Level 2 Group's major currencies are modelled on an individual basis. The remaining minor currencies areaggregated and modelled using a single yield curve. The 200 basis point (bp) interest rate shock results include earnings offset.
As at 31 Mar 19 As at 30 Sep 18200 bp
parallelincrease
200 bpparallel
decrease
200 bpparallel
increase
200 bpparallel
decrease$m $m $m $m
Change in economic valueAUD (57) 169 (70) 185CAD - - - -CHF - - - -EUR (4) 5 (7) 8GBP (10) 10 4 (4)HKD 2 (2) 1 (1)JPY 7 (7) 4 (4)NZD (214) 221 (227) 235USD (36) 43 (67) 75Other 3 (3) 1 (1)Total change in economic value (309) 436 (361) 493
7.2 Equity Holdings in the Banking Book
Table 7.2A: Equity Holdings in the Banking Book
The following table provides the carrying value of equity investments as reported on the Level 2 Group’s balance sheet, as wellas the estimated fair value of those investments.
As at 31 Mar 19 As at 30 Sep 18Carrying
valueFair value Carrying
valueFair value
$m $m $m $mUnlisted equities 765 765 988 1,024
Table 7.2B: Gains and Losses from Equity Holdings
The following table provides realised and unrealised gains or losses gross of any tax effect from investments in equityinstruments, where:• Realised gains or losses represent the difference between the cost of investments in equity instruments and proceeds where
there has been a sale and/or liquidation in the six months to the end of the reporting period.• Cumulative unrealised gains or losses represent the difference between the cost of investments in equity instruments and the
carrying value.
31 Mar 19 30 Sep 18$m $m
Gains/(losses) on equity investmentsRealised gains 129 21Cumulative unrealised gains/(losses)(1) (3) 98
(1) As investments in equity instruments are a deduction for capital purposes, cumulative unrealised gains are not included in CET1 capital, Tier 1 capital or Tier 2 capital.
41
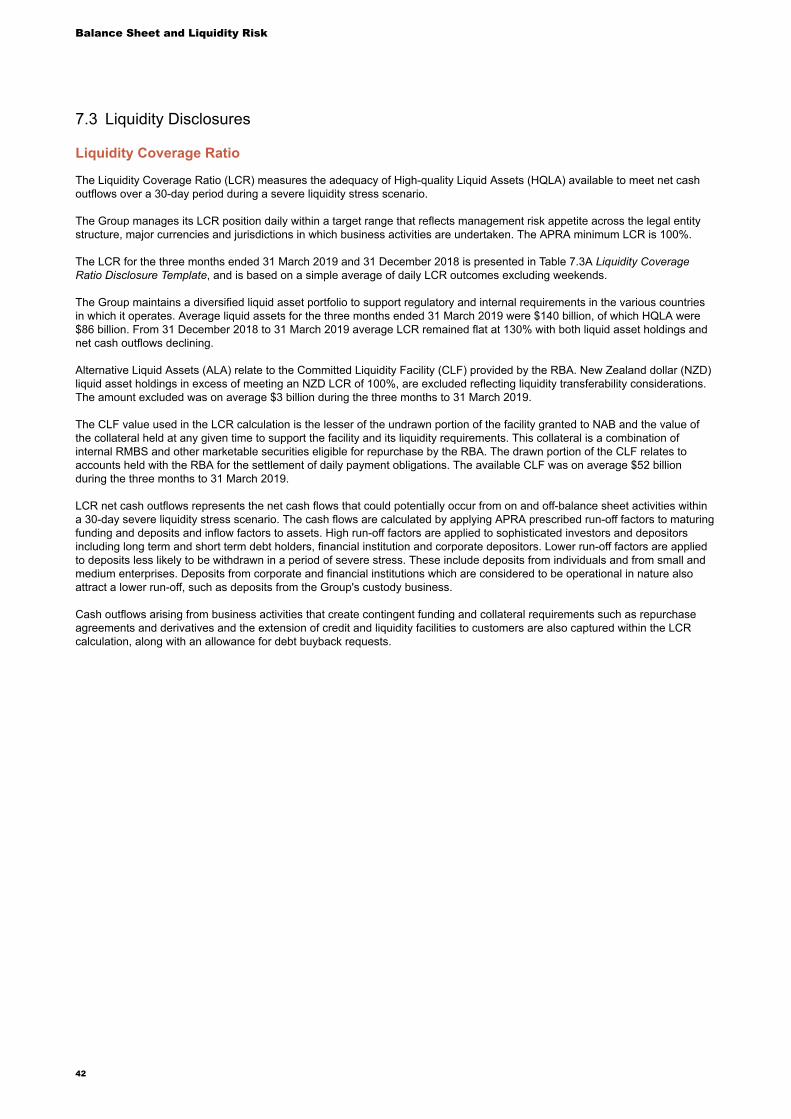
Balance Sheet and Liquidity Risk
7.3 Liquidity Disclosures
Liquidity Coverage Ratio
The Liquidity Coverage Ratio (LCR) measures the adequacy of High-quality Liquid Assets (HQLA) available to meet net cashoutflows over a 30-day period during a severe liquidity stress scenario.
The Group manages its LCR position daily within a target range that reflects management risk appetite across the legal entitystructure, major currencies and jurisdictions in which business activities are undertaken. The APRA minimum LCR is 100%.
The LCR for the three months ended 31 March 2019 and 31 December 2018 is presented in Table 7.3A Liquidity CoverageRatio Disclosure Template, and is based on a simple average of daily LCR outcomes excluding weekends.
The Group maintains a diversified liquid asset portfolio to support regulatory and internal requirements in the various countriesin which it operates. Average liquid assets for the three months ended 31 March 2019 were $140 billion, of which HQLA were$86 billion. From 31 December 2018 to 31 March 2019 average LCR remained flat at 130% with both liquid asset holdings andnet cash outflows declining.
Alternative Liquid Assets (ALA) relate to the Committed Liquidity Facility (CLF) provided by the RBA. New Zealand dollar (NZD)liquid asset holdings in excess of meeting an NZD LCR of 100%, are excluded reflecting liquidity transferability considerations.The amount excluded was on average $3 billion during the three months to 31 March 2019.
The CLF value used in the LCR calculation is the lesser of the undrawn portion of the facility granted to NAB and the value ofthe collateral held at any given time to support the facility and its liquidity requirements. This collateral is a combination ofinternal RMBS and other marketable securities eligible for repurchase by the RBA. The drawn portion of the CLF relates toaccounts held with the RBA for the settlement of daily payment obligations. The available CLF was on average $52 billionduring the three months to 31 March 2019.
LCR net cash outflows represents the net cash flows that could potentially occur from on and off-balance sheet activities withina 30-day severe liquidity stress scenario. The cash flows are calculated by applying APRA prescribed run-off factors to maturingfunding and deposits and inflow factors to assets. High run-off factors are applied to sophisticated investors and depositorsincluding long term and short term debt holders, financial institution and corporate depositors. Lower run-off factors are appliedto deposits less likely to be withdrawn in a period of severe stress. These include deposits from individuals and from small andmedium enterprises. Deposits from corporate and financial institutions which are considered to be operational in nature alsoattract a lower run-off, such as deposits from the Group's custody business.
Cash outflows arising from business activities that create contingent funding and collateral requirements such as repurchaseagreements and derivatives and the extension of credit and liquidity facilities to customers are also captured within the LCRcalculation, along with an allowance for debt buyback requests.
42
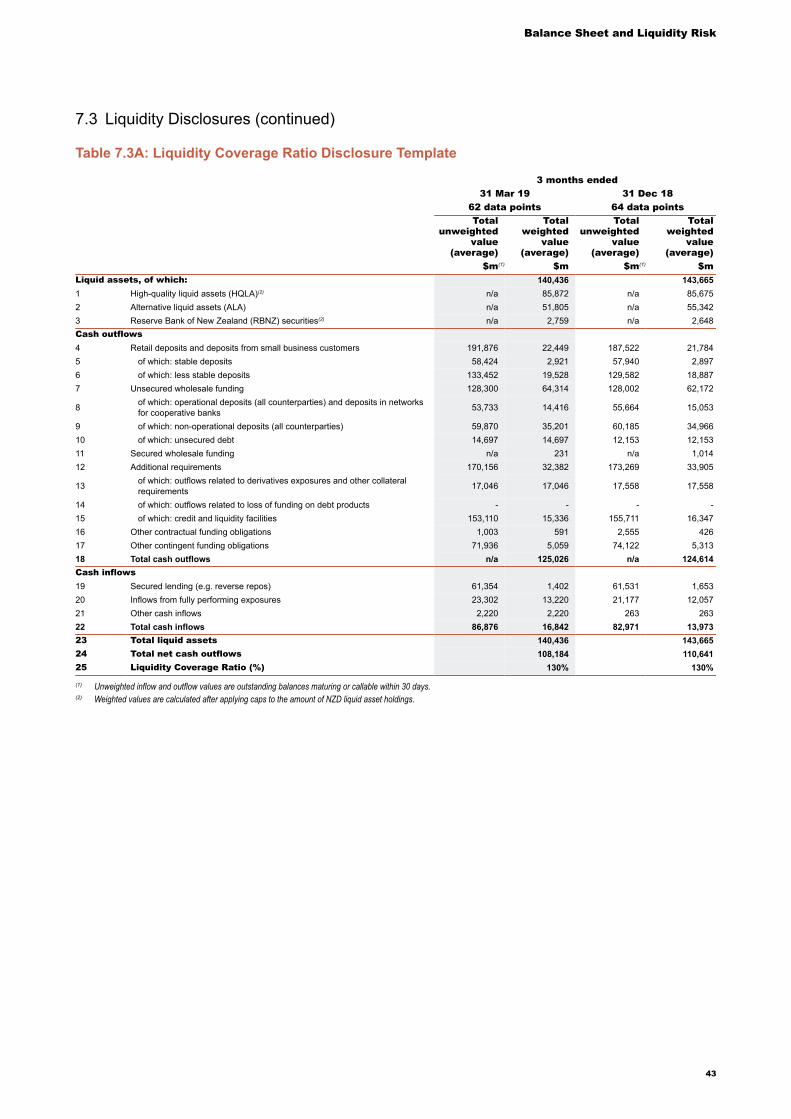
Balance Sheet and Liquidity Risk
Table 7.3A: Liquidity Coverage Ratio Disclosure Template
3 months ended31 Mar 19 31 Dec 18
62 data points 64 data pointsTotal
unweightedvalue
(average)
Totalweighted
value(average)
Totalunweighted
value(average)
Totalweighted
value(average)
$m(1) $m $m(1) $mLiquid assets, of which: 140,436 143,6651 High-quality liquid assets (HQLA)(2) n/a 85,872 n/a 85,6752 Alternative liquid assets (ALA) n/a 51,805 n/a 55,3423 Reserve Bank of New Zealand (RBNZ) securities(2) n/a 2,759 n/a 2,648Cash outflows4 Retail deposits and deposits from small business customers 191,876 22,449 187,522 21,7845 of which: stable deposits 58,424 2,921 57,940 2,8976 of which: less stable deposits 133,452 19,528 129,582 18,8877 Unsecured wholesale funding 128,300 64,314 128,002 62,172
8 of which: operational deposits (all counterparties) and deposits in networksfor cooperative banks 53,733 14,416 55,664 15,053
9 of which: non-operational deposits (all counterparties) 59,870 35,201 60,185 34,96610 of which: unsecured debt 14,697 14,697 12,153 12,15311 Secured wholesale funding n/a 231 n/a 1,01412 Additional requirements 170,156 32,382 173,269 33,905
13 of which: outflows related to derivatives exposures and other collateralrequirements 17,046 17,046 17,558 17,558
14 of which: outflows related to loss of funding on debt products - - - -15 of which: credit and liquidity facilities 153,110 15,336 155,711 16,34716 Other contractual funding obligations 1,003 591 2,555 42617 Other contingent funding obligations 71,936 5,059 74,122 5,31318 Total cash outflows n/a 125,026 n/a 124,614Cash inflows19 Secured lending (e.g. reverse repos) 61,354 1,402 61,531 1,65320 Inflows from fully performing exposures 23,302 13,220 21,177 12,05721 Other cash inflows 2,220 2,220 263 26322 Total cash inflows 86,876 16,842 82,971 13,97323 Total liquid assets 140,436 143,66524 Total net cash outflows 108,184 110,64125 Liquidity Coverage Ratio (%) 130% 130%
(1) Unweighted inflow and outflow values are outstanding balances maturing or callable within 30 days.(2) Weighted values are calculated after applying caps to the amount of NZD liquid asset holdings.
7.3 Liquidity Disclosures (continued)
43

Balance Sheet and Liquidity Risk
Net Stable Funding Ratio
The Net Stable Funding Ratio (NSFR) measures the extent to which assets are funded with stable sources of funding in order tomitigate the risk of future funding stress. The APRA minimum NSFR is 100%.
The NSFR as at 31 March 2019 and 31 December 2018 is presented in Table 7.3B Net Stable Funding Ratio DisclosureTemplate, and is based on spot balances. The NSFR was 112% as at 31 March 2019 with $515 billion of Available StableFunding (ASF) available to meet $460 billion of Required Stable Funding (RSF). The 31 March 2019 NSFR remained in linewith 31 December 2018 with higher RSF driven by new lending offset by increased stable funding in the form of term wholesalefunding and deposits.
ASF is calculated by applying weightings to capital and liabilities to reflect the portion that is expected to be available over a oneyear time horizon. The maturity of funding is taken as being the earliest date at which the funding can be withdrawn. RSFreflects the liquidity characteristics of the assets and the expectation that these assets and off-balance sheet exposures willrequire funding over the next year. The maturity of assets is taken as being the latest possible date at which the asset maymature.
7.3 Liquidity Disclosures (continued)
44
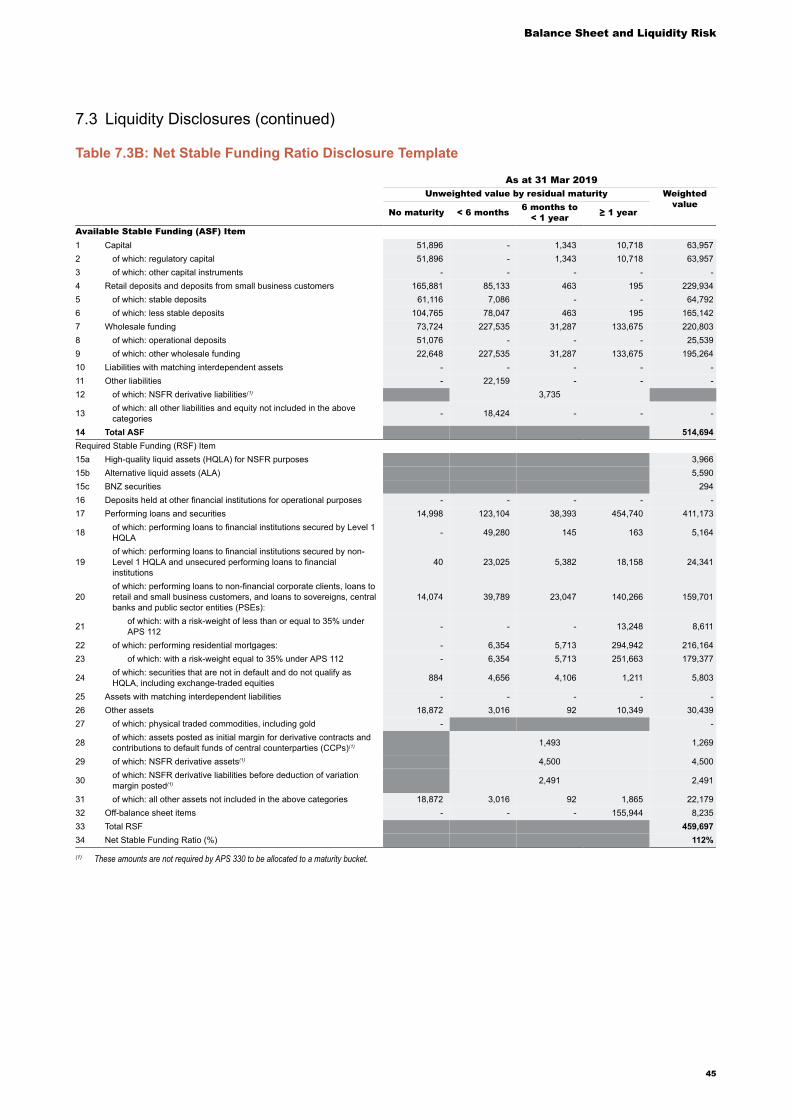
Balance Sheet and Liquidity Risk
Table 7.3B: Net Stable Funding Ratio Disclosure Template
As at 31 Mar 2019Unweighted value by residual maturity Weighted
valueNo maturity < 6 months 6 months to
< 1 year ≥ 1 year
Available Stable Funding (ASF) Item1 Capital 51,896 - 1,343 10,718 63,9572 of which: regulatory capital 51,896 - 1,343 10,718 63,9573 of which: other capital instruments - - - - -4 Retail deposits and deposits from small business customers 165,881 85,133 463 195 229,9345 of which: stable deposits 61,116 7,086 - - 64,7926 of which: less stable deposits 104,765 78,047 463 195 165,1427 Wholesale funding 73,724 227,535 31,287 133,675 220,8038 of which: operational deposits 51,076 - - - 25,5399 of which: other wholesale funding 22,648 227,535 31,287 133,675 195,26410 Liabilities with matching interdependent assets - - - - -11 Other liabilities - 22,159 - - -12 of which: NSFR derivative liabilities(1) 3,735
13 of which: all other liabilities and equity not included in the abovecategories - 18,424 - - -
14 Total ASF 514,694Required Stable Funding (RSF) Item15a High-quality liquid assets (HQLA) for NSFR purposes 3,96615b Alternative liquid assets (ALA) 5,59015c BNZ securities 29416 Deposits held at other financial institutions for operational purposes - - - - -17 Performing loans and securities 14,998 123,104 38,393 454,740 411,173
18 of which: performing loans to financial institutions secured by Level 1HQLA - 49,280 145 163 5,164
19of which: performing loans to financial institutions secured by non-Level 1 HQLA and unsecured performing loans to financialinstitutions
40 23,025 5,382 18,158 24,341
20of which: performing loans to non-financial corporate clients, loans toretail and small business customers, and loans to sovereigns, centralbanks and public sector entities (PSEs):
14,074 39,789 23,047 140,266 159,701
21 of which: with a risk-weight of less than or equal to 35% underAPS 112 - - - 13,248 8,611
22 of which: performing residential mortgages: - 6,354 5,713 294,942 216,16423 of which: with a risk-weight equal to 35% under APS 112 - 6,354 5,713 251,663 179,377
24 of which: securities that are not in default and do not qualify asHQLA, including exchange-traded equities 884 4,656 4,106 1,211 5,803
25 Assets with matching interdependent liabilities - - - - -26 Other assets 18,872 3,016 92 10,349 30,43927 of which: physical traded commodities, including gold - -
28 of which: assets posted as initial margin for derivative contracts andcontributions to default funds of central counterparties (CCPs)(1) 1,493 1,269
29 of which: NSFR derivative assets(1) 4,500 4,500
30 of which: NSFR derivative liabilities before deduction of variationmargin posted(1) 2,491 2,491
31 of which: all other assets not included in the above categories 18,872 3,016 92 1,865 22,17932 Off-balance sheet items - - - 155,944 8,23533 Total RSF 459,69734 Net Stable Funding Ratio (%) 112%
(1) These amounts are not required by APS 330 to be allocated to a maturity bucket.
7.3 Liquidity Disclosures (continued)
45
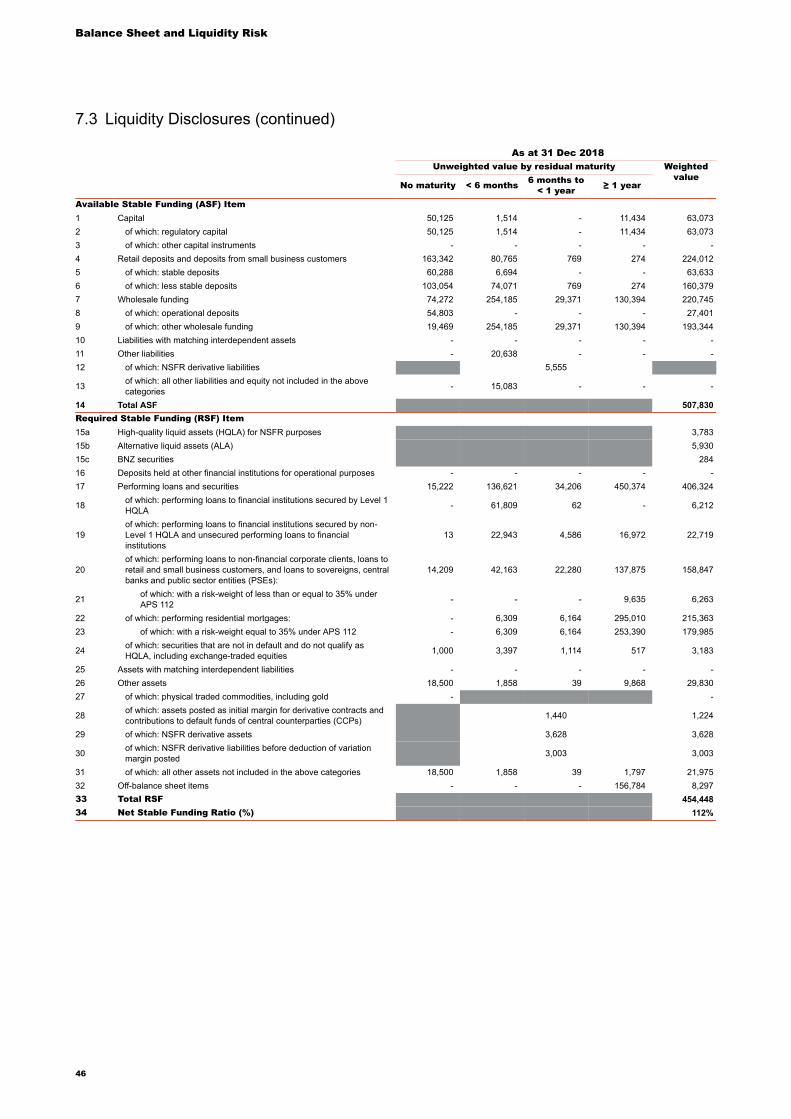
Balance Sheet and Liquidity Risk
As at 31 Dec 2018Unweighted value by residual maturity Weighted
valueNo maturity < 6 months 6 months to
< 1 year ≥ 1 year
Available Stable Funding (ASF) Item1 Capital 50,125 1,514 - 11,434 63,0732 of which: regulatory capital 50,125 1,514 - 11,434 63,0733 of which: other capital instruments - - - - -4 Retail deposits and deposits from small business customers 163,342 80,765 769 274 224,0125 of which: stable deposits 60,288 6,694 - - 63,6336 of which: less stable deposits 103,054 74,071 769 274 160,3797 Wholesale funding 74,272 254,185 29,371 130,394 220,7458 of which: operational deposits 54,803 - - - 27,4019 of which: other wholesale funding 19,469 254,185 29,371 130,394 193,34410 Liabilities with matching interdependent assets - - - - -11 Other liabilities - 20,638 - - -12 of which: NSFR derivative liabilities 5,555
13 of which: all other liabilities and equity not included in the abovecategories - 15,083 - - -
14 Total ASF 507,830Required Stable Funding (RSF) Item15a High-quality liquid assets (HQLA) for NSFR purposes 3,78315b Alternative liquid assets (ALA) 5,93015c BNZ securities 28416 Deposits held at other financial institutions for operational purposes - - - - -17 Performing loans and securities 15,222 136,621 34,206 450,374 406,324
18 of which: performing loans to financial institutions secured by Level 1HQLA - 61,809 62 - 6,212
19of which: performing loans to financial institutions secured by non-Level 1 HQLA and unsecured performing loans to financialinstitutions
13 22,943 4,586 16,972 22,719
20of which: performing loans to non-financial corporate clients, loans toretail and small business customers, and loans to sovereigns, centralbanks and public sector entities (PSEs):
14,209 42,163 22,280 137,875 158,847
21 of which: with a risk-weight of less than or equal to 35% underAPS 112 - - - 9,635 6,263
22 of which: performing residential mortgages: - 6,309 6,164 295,010 215,36323 of which: with a risk-weight equal to 35% under APS 112 - 6,309 6,164 253,390 179,985
24 of which: securities that are not in default and do not qualify asHQLA, including exchange-traded equities 1,000 3,397 1,114 517 3,183
25 Assets with matching interdependent liabilities - - - - -26 Other assets 18,500 1,858 39 9,868 29,83027 of which: physical traded commodities, including gold - -
28 of which: assets posted as initial margin for derivative contracts andcontributions to default funds of central counterparties (CCPs) 1,440 1,224
29 of which: NSFR derivative assets 3,628 3,628
30 of which: NSFR derivative liabilities before deduction of variationmargin posted 3,003 3,003
31 of which: all other assets not included in the above categories 18,500 1,858 39 1,797 21,97532 Off-balance sheet items - - - 156,784 8,29733 Total RSF 454,44834 Net Stable Funding Ratio (%) 112%
7.3 Liquidity Disclosures (continued)
46
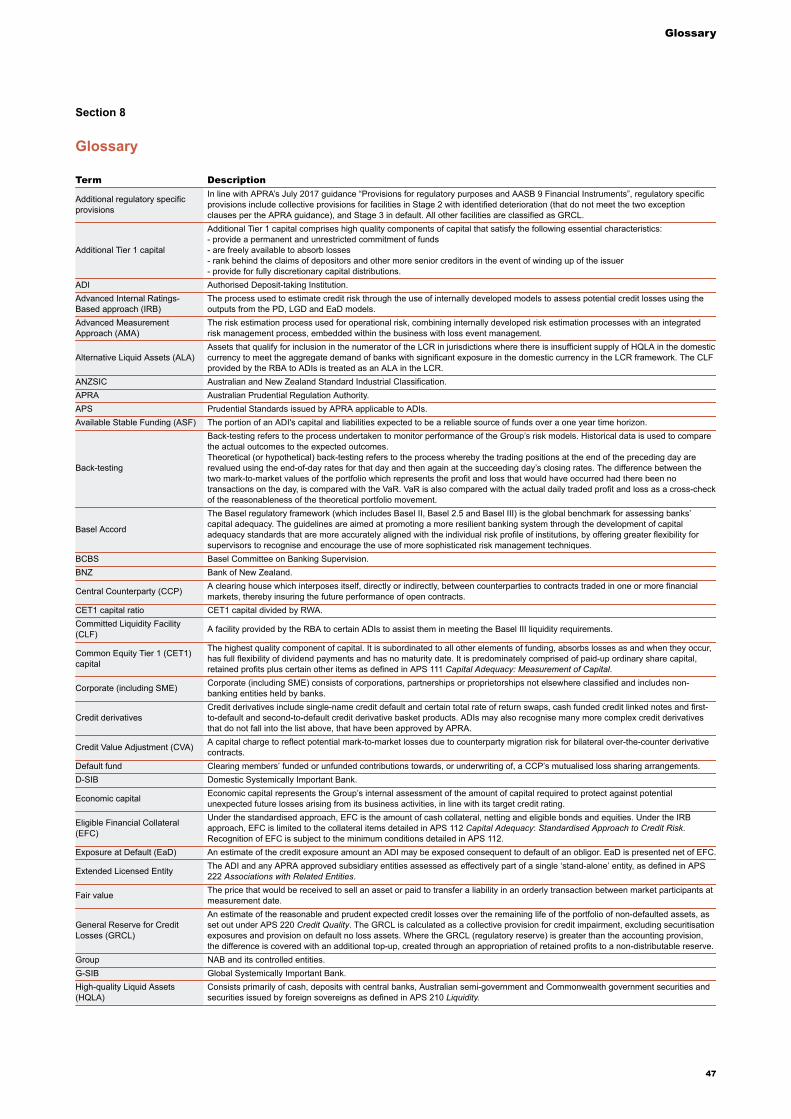
Glossary
Section 8
Glossary
Term Description
Additional regulatory specificprovisions
In line with APRA’s July 2017 guidance “Provisions for regulatory purposes and AASB 9 Financial Instruments”, regulatory specificprovisions include collective provisions for facilities in Stage 2 with identified deterioration (that do not meet the two exceptionclauses per the APRA guidance), and Stage 3 in default. All other facilities are classified as GRCL.
Additional Tier 1 capital
Additional Tier 1 capital comprises high quality components of capital that satisfy the following essential characteristics:- provide a permanent and unrestricted commitment of funds- are freely available to absorb losses- rank behind the claims of depositors and other more senior creditors in the event of winding up of the issuer- provide for fully discretionary capital distributions.
ADI Authorised Deposit-taking Institution.Advanced Internal Ratings-Based approach (IRB)
The process used to estimate credit risk through the use of internally developed models to assess potential credit losses using theoutputs from the PD, LGD and EaD models.
Advanced MeasurementApproach (AMA)
The risk estimation process used for operational risk, combining internally developed risk estimation processes with an integratedrisk management process, embedded within the business with loss event management.
Alternative Liquid Assets (ALA)Assets that qualify for inclusion in the numerator of the LCR in jurisdictions where there is insufficient supply of HQLA in the domesticcurrency to meet the aggregate demand of banks with significant exposure in the domestic currency in the LCR framework. The CLFprovided by the RBA to ADIs is treated as an ALA in the LCR.
ANZSIC Australian and New Zealand Standard Industrial Classification.APRA Australian Prudential Regulation Authority.APS Prudential Standards issued by APRA applicable to ADIs.Available Stable Funding (ASF) The portion of an ADI's capital and liabilities expected to be a reliable source of funds over a one year time horizon.
Back-testing
Back-testing refers to the process undertaken to monitor performance of the Group’s risk models. Historical data is used to comparethe actual outcomes to the expected outcomes.Theoretical (or hypothetical) back-testing refers to the process whereby the trading positions at the end of the preceding day arerevalued using the end-of-day rates for that day and then again at the succeeding day’s closing rates. The difference between thetwo mark-to-market values of the portfolio which represents the profit and loss that would have occurred had there been notransactions on the day, is compared with the VaR. VaR is also compared with the actual daily traded profit and loss as a cross-checkof the reasonableness of the theoretical portfolio movement.
Basel Accord
The Basel regulatory framework (which includes Basel II, Basel 2.5 and Basel III) is the global benchmark for assessing banks’capital adequacy. The guidelines are aimed at promoting a more resilient banking system through the development of capitaladequacy standards that are more accurately aligned with the individual risk profile of institutions, by offering greater flexibility forsupervisors to recognise and encourage the use of more sophisticated risk management techniques.
BCBS Basel Committee on Banking Supervision.BNZ Bank of New Zealand.
Central Counterparty (CCP) A clearing house which interposes itself, directly or indirectly, between counterparties to contracts traded in one or more financialmarkets, thereby insuring the future performance of open contracts.
CET1 capital ratio CET1 capital divided by RWA.Committed Liquidity Facility(CLF) A facility provided by the RBA to certain ADIs to assist them in meeting the Basel III liquidity requirements.
Common Equity Tier 1 (CET1)capital
The highest quality component of capital. It is subordinated to all other elements of funding, absorbs losses as and when they occur,has full flexibility of dividend payments and has no maturity date. It is predominately comprised of paid-up ordinary share capital,retained profits plus certain other items as defined in APS 111 Capital Adequacy: Measurement of Capital.
Corporate (including SME) Corporate (including SME) consists of corporations, partnerships or proprietorships not elsewhere classified and includes non-banking entities held by banks.
Credit derivativesCredit derivatives include single-name credit default and certain total rate of return swaps, cash funded credit linked notes and first-to-default and second-to-default credit derivative basket products. ADIs may also recognise many more complex credit derivativesthat do not fall into the list above, that have been approved by APRA.
Credit Value Adjustment (CVA) A capital charge to reflect potential mark-to-market losses due to counterparty migration risk for bilateral over-the-counter derivativecontracts.
Default fund Clearing members’ funded or unfunded contributions towards, or underwriting of, a CCP’s mutualised loss sharing arrangements.D-SIB Domestic Systemically Important Bank.
Economic capital Economic capital represents the Group’s internal assessment of the amount of capital required to protect against potentialunexpected future losses arising from its business activities, in line with its target credit rating.
Eligible Financial Collateral(EFC)
Under the standardised approach, EFC is the amount of cash collateral, netting and eligible bonds and equities. Under the IRBapproach, EFC is limited to the collateral items detailed in APS 112 Capital Adequacy: Standardised Approach to Credit Risk.Recognition of EFC is subject to the minimum conditions detailed in APS 112.
Exposure at Default (EaD) An estimate of the credit exposure amount an ADI may be exposed consequent to default of an obligor. EaD is presented net of EFC.
Extended Licensed Entity The ADI and any APRA approved subsidiary entities assessed as effectively part of a single ‘stand-alone’ entity, as defined in APS222 Associations with Related Entities.
Fair value The price that would be received to sell an asset or paid to transfer a liability in an orderly transaction between market participants atmeasurement date.
General Reserve for CreditLosses (GRCL)
An estimate of the reasonable and prudent expected credit losses over the remaining life of the portfolio of non-defaulted assets, asset out under APS 220 Credit Quality. The GRCL is calculated as a collective provision for credit impairment, excluding securitisationexposures and provision on default no loss assets. Where the GRCL (regulatory reserve) is greater than the accounting provision,the difference is covered with an additional top-up, created through an appropriation of retained profits to a non-distributable reserve.
Group NAB and its controlled entities.G-SIB Global Systemically Important Bank.High-quality Liquid Assets(HQLA)
Consists primarily of cash, deposits with central banks, Australian semi-government and Commonwealth government securities andsecurities issued by foreign sovereigns as defined in APS 210 Liquidity.
47
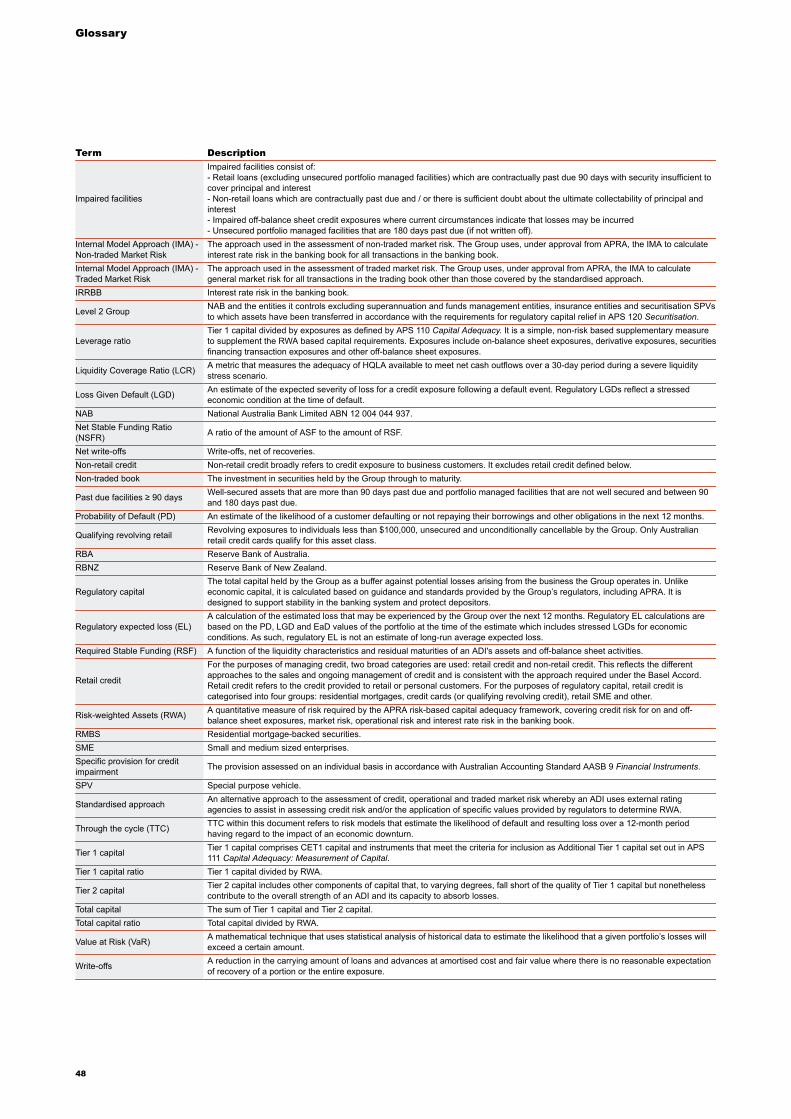
Glossary
Term Description
Impaired facilities
Impaired facilities consist of:- Retail loans (excluding unsecured portfolio managed facilities) which are contractually past due 90 days with security insufficient tocover principal and interest- Non-retail loans which are contractually past due and / or there is sufficient doubt about the ultimate collectability of principal andinterest- Impaired off-balance sheet credit exposures where current circumstances indicate that losses may be incurred- Unsecured portfolio managed facilities that are 180 days past due (if not written off).
Internal Model Approach (IMA) -Non-traded Market Risk
The approach used in the assessment of non-traded market risk. The Group uses, under approval from APRA, the IMA to calculateinterest rate risk in the banking book for all transactions in the banking book.
Internal Model Approach (IMA) -Traded Market Risk
The approach used in the assessment of traded market risk. The Group uses, under approval from APRA, the IMA to calculategeneral market risk for all transactions in the trading book other than those covered by the standardised approach.
IRRBB Interest rate risk in the banking book.
Level 2 Group NAB and the entities it controls excluding superannuation and funds management entities, insurance entities and securitisation SPVsto which assets have been transferred in accordance with the requirements for regulatory capital relief in APS 120 Securitisation.
Leverage ratioTier 1 capital divided by exposures as defined by APS 110 Capital Adequacy. It is a simple, non-risk based supplementary measureto supplement the RWA based capital requirements. Exposures include on-balance sheet exposures, derivative exposures, securitiesfinancing transaction exposures and other off-balance sheet exposures.
Liquidity Coverage Ratio (LCR) A metric that measures the adequacy of HQLA available to meet net cash outflows over a 30-day period during a severe liquiditystress scenario.
Loss Given Default (LGD) An estimate of the expected severity of loss for a credit exposure following a default event. Regulatory LGDs reflect a stressedeconomic condition at the time of default.
NAB National Australia Bank Limited ABN 12 004 044 937.Net Stable Funding Ratio(NSFR) A ratio of the amount of ASF to the amount of RSF.
Net write-offs Write-offs, net of recoveries.Non-retail credit Non-retail credit broadly refers to credit exposure to business customers. It excludes retail credit defined below.Non-traded book The investment in securities held by the Group through to maturity.
Past due facilities ≥ 90 days Well-secured assets that are more than 90 days past due and portfolio managed facilities that are not well secured and between 90and 180 days past due.
Probability of Default (PD) An estimate of the likelihood of a customer defaulting or not repaying their borrowings and other obligations in the next 12 months.
Qualifying revolving retail Revolving exposures to individuals less than $100,000, unsecured and unconditionally cancellable by the Group. Only Australianretail credit cards qualify for this asset class.
RBA Reserve Bank of Australia.RBNZ Reserve Bank of New Zealand.
Regulatory capitalThe total capital held by the Group as a buffer against potential losses arising from the business the Group operates in. Unlikeeconomic capital, it is calculated based on guidance and standards provided by the Group’s regulators, including APRA. It isdesigned to support stability in the banking system and protect depositors.
Regulatory expected loss (EL)A calculation of the estimated loss that may be experienced by the Group over the next 12 months. Regulatory EL calculations arebased on the PD, LGD and EaD values of the portfolio at the time of the estimate which includes stressed LGDs for economicconditions. As such, regulatory EL is not an estimate of long-run average expected loss.
Required Stable Funding (RSF) A function of the liquidity characteristics and residual maturities of an ADI's assets and off-balance sheet activities.
Retail credit
For the purposes of managing credit, two broad categories are used: retail credit and non-retail credit. This reflects the differentapproaches to the sales and ongoing management of credit and is consistent with the approach required under the Basel Accord.Retail credit refers to the credit provided to retail or personal customers. For the purposes of regulatory capital, retail credit iscategorised into four groups: residential mortgages, credit cards (or qualifying revolving credit), retail SME and other.
Risk-weighted Assets (RWA) A quantitative measure of risk required by the APRA risk-based capital adequacy framework, covering credit risk for on and off-balance sheet exposures, market risk, operational risk and interest rate risk in the banking book.
RMBS Residential mortgage-backed securities.SME Small and medium sized enterprises.Specific provision for creditimpairment The provision assessed on an individual basis in accordance with Australian Accounting Standard AASB 9 Financial Instruments.
SPV Special purpose vehicle.
Standardised approach An alternative approach to the assessment of credit, operational and traded market risk whereby an ADI uses external ratingagencies to assist in assessing credit risk and/or the application of specific values provided by regulators to determine RWA.
Through the cycle (TTC) TTC within this document refers to risk models that estimate the likelihood of default and resulting loss over a 12-month periodhaving regard to the impact of an economic downturn.
Tier 1 capital Tier 1 capital comprises CET1 capital and instruments that meet the criteria for inclusion as Additional Tier 1 capital set out in APS111 Capital Adequacy: Measurement of Capital.
Tier 1 capital ratio Tier 1 capital divided by RWA.
Tier 2 capital Tier 2 capital includes other components of capital that, to varying degrees, fall short of the quality of Tier 1 capital but nonethelesscontribute to the overall strength of an ADI and its capacity to absorb losses.
Total capital The sum of Tier 1 capital and Tier 2 capital.Total capital ratio Total capital divided by RWA.
Value at Risk (VaR) A mathematical technique that uses statistical analysis of historical data to estimate the likelihood that a given portfolio’s losses willexceed a certain amount.
Write-offs A reduction in the carrying amount of loans and advances at amortised cost and fair value where there is no reasonable expectationof recovery of a portion or the entire exposure.
48
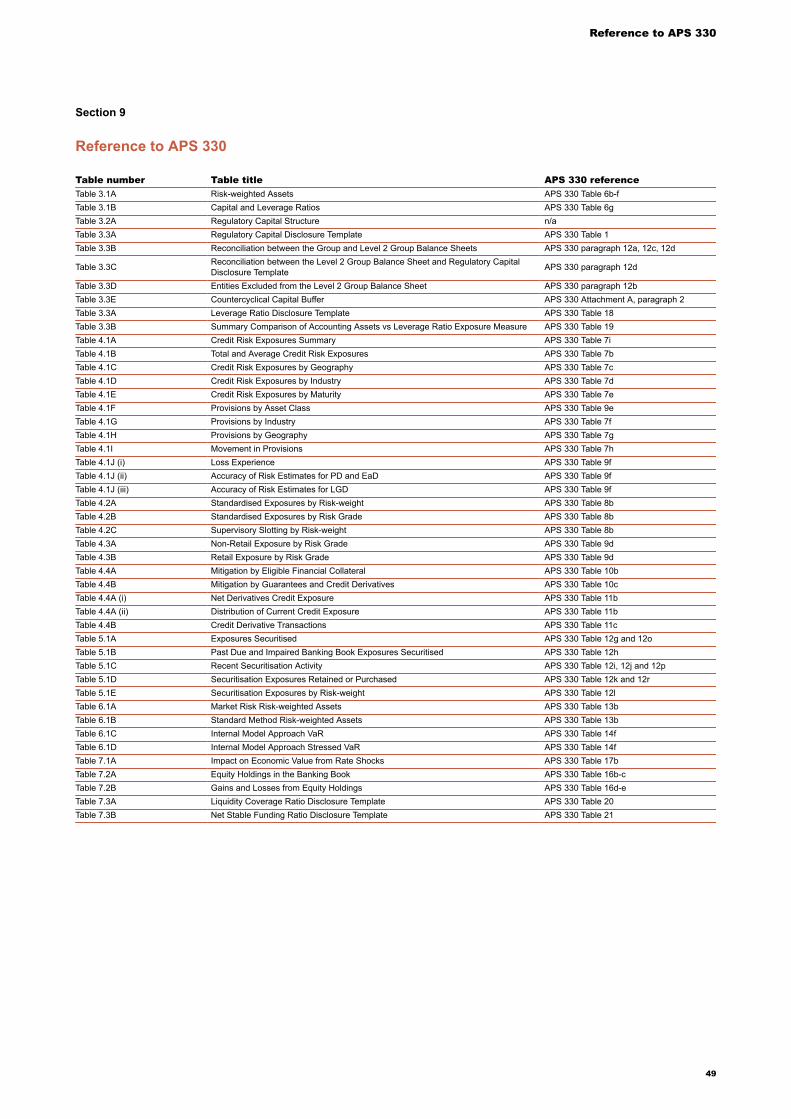
Reference to APS 330
Section 9
Reference to APS 330
Table number Table title APS 330 referenceTable 3.1A Risk-weighted Assets APS 330 Table 6b-fTable 3.1B Capital and Leverage Ratios APS 330 Table 6gTable 3.2A Regulatory Capital Structure n/aTable 3.3A Regulatory Capital Disclosure Template APS 330 Table 1Table 3.3B Reconciliation between the Group and Level 2 Group Balance Sheets APS 330 paragraph 12a, 12c, 12d
Table 3.3C Reconciliation between the Level 2 Group Balance Sheet and Regulatory CapitalDisclosure Template APS 330 paragraph 12d
Table 3.3D Entities Excluded from the Level 2 Group Balance Sheet APS 330 paragraph 12bTable 3.3E Countercyclical Capital Buffer APS 330 Attachment A, paragraph 2Table 3.3A Leverage Ratio Disclosure Template APS 330 Table 18Table 3.3B Summary Comparison of Accounting Assets vs Leverage Ratio Exposure Measure APS 330 Table 19Table 4.1A Credit Risk Exposures Summary APS 330 Table 7iTable 4.1B Total and Average Credit Risk Exposures APS 330 Table 7bTable 4.1C Credit Risk Exposures by Geography APS 330 Table 7cTable 4.1D Credit Risk Exposures by Industry APS 330 Table 7dTable 4.1E Credit Risk Exposures by Maturity APS 330 Table 7eTable 4.1F Provisions by Asset Class APS 330 Table 9eTable 4.1G Provisions by Industry APS 330 Table 7fTable 4.1H Provisions by Geography APS 330 Table 7gTable 4.1I Movement in Provisions APS 330 Table 7hTable 4.1J (i) Loss Experience APS 330 Table 9fTable 4.1J (ii) Accuracy of Risk Estimates for PD and EaD APS 330 Table 9fTable 4.1J (iii) Accuracy of Risk Estimates for LGD APS 330 Table 9fTable 4.2A Standardised Exposures by Risk-weight APS 330 Table 8bTable 4.2B Standardised Exposures by Risk Grade APS 330 Table 8bTable 4.2C Supervisory Slotting by Risk-weight APS 330 Table 8bTable 4.3A Non-Retail Exposure by Risk Grade APS 330 Table 9dTable 4.3B Retail Exposure by Risk Grade APS 330 Table 9dTable 4.4A Mitigation by Eligible Financial Collateral APS 330 Table 10bTable 4.4B Mitigation by Guarantees and Credit Derivatives APS 330 Table 10cTable 4.4A (i) Net Derivatives Credit Exposure APS 330 Table 11bTable 4.4A (ii) Distribution of Current Credit Exposure APS 330 Table 11bTable 4.4B Credit Derivative Transactions APS 330 Table 11cTable 5.1A Exposures Securitised APS 330 Table 12g and 12oTable 5.1B Past Due and Impaired Banking Book Exposures Securitised APS 330 Table 12hTable 5.1C Recent Securitisation Activity APS 330 Table 12i, 12j and 12pTable 5.1D Securitisation Exposures Retained or Purchased APS 330 Table 12k and 12rTable 5.1E Securitisation Exposures by Risk-weight APS 330 Table 12lTable 6.1A Market Risk Risk-weighted Assets APS 330 Table 13bTable 6.1B Standard Method Risk-weighted Assets APS 330 Table 13bTable 6.1C Internal Model Approach VaR APS 330 Table 14fTable 6.1D Internal Model Approach Stressed VaR APS 330 Table 14fTable 7.1A Impact on Economic Value from Rate Shocks APS 330 Table 17bTable 7.2A Equity Holdings in the Banking Book APS 330 Table 16b-cTable 7.2B Gains and Losses from Equity Holdings APS 330 Table 16d-eTable 7.3A Liquidity Coverage Ratio Disclosure Template APS 330 Table 20Table 7.3B Net Stable Funding Ratio Disclosure Template APS 330 Table 21
49