Embed Size (px)
Citation preview


B U D G E T H I G H L I G H T S | F I S CA L Y E A R 2 0 1 6 1
TABLE OF CONTENTS
2 SECRETARY FOXX’S PRIORITIES
3 THE GROW AMERICA ACT: THE ADMINISTRATION’S SURFACE TRANSPORTATION REAUTHORIZATION PROPOSAL
9 FEDERAL TRANSIT ADMINISTRATION
14 FEDERAL HIGHWAY ADMINISTRATION
19 FEDERAL MOTOR CARRIER SAFETY ADMINISTRATION
23 NATIONAL HIGHWAY TRAFFIC SAFETY ADMINISTRATION
28 FEDERAL RAILROAD ADMINISTRATION
32 FEDERAL AVIATION ADMINISTRATION
40 PIPELINE AND HAZARDOUS MATERIALS SAFETY ADMINISTRATION
43 MARITIME ADMINISTRATION
46 SAINT LAWRENCE SEAWAY DEVELOPMENT CORPORATION
48 OFFICE OF THE SECRETARY
52 OFFICE OF THE INSPECTOR GENERAL
54 SURFACE TRANSPORTATION BOARD
56 BUDGETARY RESOURCES
57 BUDGET AUTHORITY
58 OUTLAYS
59 FULL TIME EQUIVALENT EMPLOYMENT
TECHNICAL NOTES:
1 Tables presented in this document may not add due to differences in rounding.2 The use of brackets in tables indicates a “non-add” entry.3 Time frames in this document represent fiscal years (FY). 4 Full time equivalent employment is identified as FTE throughout this document. 5 The President’s Budget proposes to rename the “Highway Trust Fund” to the “Transportation Trust Fund” beginning in FY 2016 as
part of the Administration’s GROW AMERICA Act proposal.

U . S . D E PA R T M E N T O F T R A N S P O R TAT I O N2
THE GROW AMERICA ACT: THE ADMINISTRATION’S SURFACE TRANSPORTATION REAUTHORIZATION PROPOSAL
SECRETARY FOXX’S PRIORITIES
Building on DOT’s Legacy of Safety
► Consistently improving our safety mission across the Department
► Continuing the push to eliminate distracted driving
► Strengthening our focus on pedestrian and bicycle safety
Closing the Infrastructure Deficit
► Passing long-term reauthorization legislation for surface transportation
and aviation
► Increasing public-private partnerships through a Build America
Transportation Investment Center
► Creating Ladders of Opportunity through transportation programs
Modernizing the U.S. Transportation System Using Technology and Process Innovation
► Accelerating NextGen
► Increasing the use of data and analysis to improve performance
management
► Leading towards automation in transportation

THE GROW AMERICA ACT: THE ADMINISTRATION’S
SURFACE TRANSPORTATION REAUTHORIZATION PROPOSAL

U . S . D E PA R T M E N T O F T R A N S P O R TAT I O N4
THE GROW AMERICA ACT: THE ADMINISTRATION’S SURFACE TRANSPORTATION REAUTHORIZATION PROPOSAL
GROW AMERICA ACCOUNT TOTALS FY 2016–2021 BUDGETARY RESOURCES1
FY 2015Enacted
FY 2016Year 1
FY 2017Year 2
FY 2018Year 3
FY 2019Year 4
FY 2020Year 5
FY 2021Year 6
Total Years
1-6
Federal Highway AdministrationFederal-Aid Highways:
Administrative Expenses (GOE + ARC) $ 407 $ 442 $ 451 $ 460 $ 469 $ 479 $ 488 $ 2,790Apportioned Programs
SHRP2 Takedown (allocated) — 25 25 25 25 25 25 150HSIP Takedown (apportioned) — 100 100 80 80 70 70 500National Highway Program (Includes $639M
Exempt)21,908 22,313 22,761 23,218 23,684 24,158 24,643 140,777
Highway Safety Improvement Program 2,412 2,457 2,506 2,556 2,608 2,660 2,713 15,500Surface Transportation Program 10,077 10,263 10,469 10,680 10,894 11,112 11,335 64,753Congestion Mitigation & Air Quality
Improvement Program2,267 2,315 2,362 2,409 2,458 2,507 2,557 14,608
Metropolitan Transportation Planning 314 320 326 333 340 346 353 2,019Transportation Alternatives Program 820 847 864 880 896 913 931 5,332Critical Immediate Safety Investments — 7,450 6,250 5,000 3,800 3,550 3,350 29,400
Federal Lands and Tribal Transportation Programs 1,000 1,277 1,299 1,322 1,346 1,370 1,394 8,008Research, Technology and Education Programs 400 496 524 525 496 509 518 3,068
Intelligent Transportation Systems & Automa-tion Research Acceleration (non-add)
[100] [158] [179] [174] [137] [142] [145] [935]
Federal Allocation Programs (Includes $100M Exempt) 390 502 507 513 520 525 531 3,098Freight — 1,000 2,000 3,000 4,000 4,000 4,000 18,000TIFIA 1,0002 1,000 1,000 1,000 1,000 1,000 1,000 6,000
Fixing and Accelerating Surface Transportation (FAST) — 500 500 500 500 500 500 3,000
Total, FHWA 40,995 51,307 51,944 52,502 53,115 53,724 54,408 317,001
Federal Transit AdministrationTransit Formula Grants (Includes Administrative
Expenses in GROW AMERICA)8,595 13,914 14,140 14,372 14,610 14,902 15,200 87,138
Administrative Expenses (non-add) 1063, 4 [114] [120] [126] [132] [139] [146] [778]State of Good Repair (non-add) [2,165] [5,719] [5,775] [5,832] [5,890] [5,949] [6,008] [35,172]Bus and Bus Facilities (non-add) [428] [1,939] [1,950] [1,961] [1,972] [1,984] [1,996] [11,801]
Capital Investment Grants 2,1203 3,250 3,315 3,380 3,450 3,520 3,590 20,505Rapid Growth Area Transit Program — 500 525 550 600 612 624 3,411Public Transportation Emergency Relief — 25 25 25 25 25 25 150Transit Research and Training 383, 4 60 61 63 67 68 70 389Fixing and Accelerating Surface Transportation (FAST) — 500 500 500 500 500 500 3,000
Total, FTA 10,8585 18,249 18,566 18,890 19,252 19,627 20,009 114,594
Federal Motor Carrier Safety AdministrationMotor Carrier Safety Operations & Programs 271 329 376 400 392 400 407 2,303Motor Carrier Safety Grants 313 339 372 397 407 416 424 2,356
Total, FMCSA 584 669 748 797 799 816 831 4,659
National Highway Traffic Safety AdministrationOperations & Research (Including Vehicle Safety) 2693 331 346 362 378 396 414 2,227Highway Traffic Safety Grants 562 577 594 612 631 649 669 3,732
Total, NHTSA 830 908 940 974 1,009 1,045 1,083 5,959
Federal Railroad AdministrationCurrent Passenger Rail Service 1,3903, 4 2,450 2,400 2,350 2,300 2,300 2,300 14,100Rail Service Improvement Program — 2,325 2,405 2,370 2,450 2,450 2,450 14,450
Total, FRA 1,3905 4,775 4,805 4,720 4,750 4,750 4,750 28,550
Office of the SecretaryNational Infrastructure Investments (TIGER) 5003 1,250 1,250 1,250 1,250 1,250 1,250 7,500
Total, OST 500 1,250 1,250 1,250 1,250 1,250 1,250 7,500
Total Budgetary Resources $55,157 $77,158 $78,253 $79,133 $80,175 $81,213 $82,331 $478,264
Dollars in Millions
1 Totals may not add due to rounding.2 TIFIA will continue to be administered by the Office of the Secretary under GROW AMERICA.3 General Funded (or partially General Funded) in FY 2015.4 The table aligns FY 2015 enacted General Fund accounts with the corresponding FY 2016–2021 Trust Fund accounts included in GROW AMERICA for comparison purposes.5 FY 2015 totals do not include FTA and FRA accounts that are outside GROW AMERICA and included as General Funded in the FY 2016 President’s Budget.

B U D G E T H I G H L I G H T S | F I S CA L Y E A R 2 0 1 6 5
THE GROW AMERICA ACT: THE ADMINISTRATION’S SURFACE TRANSPORTATION REAUTHORIZATION PROPOSAL
The FY 2016 President’s Budget request includes $478 billion for a 6-year surface transportation reauthorization proposal to improve safety, support critical infrastructure projects, and create jobs while improving America’s roads, bridges, transit systems, and railways. This builds on the Administration’s 4-year proposal, the Generating Renewal, Opportu-nity, and Work with Accelerated Mobility, Efficiency, and Rebuilding of Infrastructure and Communities throughout America—or the GROW AMERICA Act—which was submitted to Congress last year and will be resubmitted within the coming weeks, reflecting a 6-year duration.
The GROW AMERICA Act will provide States, tribal and local governments, and transit agencies with the certainty needed to effectively plan and start construction on projects that will support millions
of jobs over the next several years. In recent years, numerous short-term spending “patches” have increased uncertainty for Federal surface transpor-tation programs. Since SAFETEA-LU expired at the end of September 2009, there have been 19 continu-ing resolutions over the last 5 years and 11 exten-sions of surface authorization bills.
Most importantly, the GROW AMERICA Act will put into place a program structure and funding stream focused on the transportation needs of the future. Through both funding increases and critical policy enhancements, the GROW AMERICA Act advances Secretary Foxx’s key priorities: protecting the safety of the traveling public, closing the Nation’s infra-structure deficit, and modernizing the U.S. trans-portation system through technology and process innovation.
OVERALL FUNDING LEVELS
Over 6 years, the GROW AMERICA proposal provides:
► $317 billion to invest in our Nation’s highway system: The proposal will increase the amount of highway funds by an average of nearly 29 per-cent above FY 2015 enacted levels, emphasizing policies and reforms that prioritize investments for much-needed repairs and improvements to the safety of our roads and transit services, with particular attention to investments in rural and tribal areas.
► Nearly $115 billion to invest in transit sys-tems and expand transportation options: The proposal increases average transit spending by nearly 76 percent above FY 2015 enacted levels, which will enable the expansion of new projects that improve connectivity, such as light rail, street cars, and bus rapid transit, in suburbs, fast-growing cities, small towns, and rural communities, while still maintaining existing transit systems.
► Predictable funding for rail investments: The GROW AMERICA Act provides $28.6 billion over 6 years to fund the development of high- performance rail and other passenger rail programs as part of an integrated national transportation strategy. This system will provide 80 percent of Americans with convenient access to a high- performance passenger rail system within 25 years.
► Encouraging competition and multi-modal in vestment: The Administration’s proposal provides $7.5 billion over 6 years to more than double the size of the highly successful TIGER grant program.
Within those overall funding levels, GROW AMER-ICA features smart investments and programmatic reforms to advance critical surface transportation priorities.

U . S . D E PA R T M E N T O F T R A N S P O R TAT I O N6
THE GROW AMERICA ACT: THE ADMINISTRATION’S SURFACE TRANSPORTATION REAUTHORIZATION PROPOSAL
PROTECTING THE SAFETY OF THE TRAVELING PUBLIC
In 2012, vehicle crashes killed 33,561 Americans and injured more than 2.3 million, making motor vehi-cle crashes one of the leading causes of death in the United States. Every life is precious, and one life lost on our roads is one too many. The GROW AMERICA Act addresses safety vulnerabilities on our transpor-tation network, both through increased investment in safety programs, and through policy changes that strengthen oversight and increase accountability. It includes:
► $7.35 billion to improve safety on local rural roads as part of the Critical Immediate Safety Investments Program: While local roads do not carry the majority of traffic, it is estimated that approximately 40 percent of all traffic fatalities occur on non-State owned roadways. This dedi-cated source of funding will help States improve safety on non-State owned roads that do not often benefit from Federal funding.
► $3.05 billion to assist with the implementation of Positive Train Control: This funding will focus on commuter rail PTC compliance to prevent collisions.
► $16 billion for the Highway Safety Improve-ment Program: The HSIP continues to save lives and prevent serious injuries for all road users, including pedestrians and bicyclists. This data- driven program has played a significant role in achieving the nearly 25-percent reduction in highway fatalities and serious injuries in 2013 when compared to 2005, the year that the HSIP was established.
► Nearly $6 billion over 6 years to increase the National Highway Traffic Safety Administra-tion’s capability to ensure that vehicles on the road meet the highest safety standards and that the agency has the personnel and tools to identify vehicle defects early and respond quickly.
The GROW AMERICA Act also includes a number of new safety proposals that build on lessons learned during the previous year and continue the Depart-ment’s focus on its safety mission.
Transportation is a critical engine of the Nation’s economy. Investments in our transportation network over the country’s history have been instrumental in developing our Nation into the world’s largest econ-omy and most mobile society. Over time, however, our level of investment as a percentage of GDP has dropped significantly, as it fails to keep pace with our growing economy and population or with our global competitors. The costs of inadequate
infrastructure investment are exhibited all around us. Americans spend 5.5 billion hours in traffic each year, costing families more than $120 billion in extra fuel and lost time. American businesses pay $27 billion a year in extra freight transportation costs, increasing shipping delays and raising prices on everyday prod-ucts. In addition, 65 percent of our Nation’s roads are in less than good condition; one in four bridges requires significant repair or can’t handle current
CLOSING THE NATION’S INFRASTRUCTURE DEFICIT

B U D G E T H I G H L I G H T S | F I S CA L Y E A R 2 0 1 6 7
THE GROW AMERICA ACT: THE ADMINISTRATION’S SURFACE TRANSPORTATION REAUTHORIZATION PROPOSAL
traffic demands, and 45 percent of Americans lack access to basic transit services. The GROW AMERICA Act makes critical investments to close this Nation’s infrastructure deficit, including:
► Expanding and strengthening of DOT credit programs to spur innovative financing and increase overall infrastructure investment: The GROW AMERICA Act expands financing options under the Transportation Infrastructure Finance and Innovation Act (TIFIA), which leverages Federal dollars by facilitating private participation in transportation projects and encouraging innovative financing mechanisms that help advance projects more quickly. The Act will provide $6 billion over 6 years, which will result in $60 billion of direct loans. In addition, the Act increases the accessibility of the Railroad Rehabilitation and Improvement Financing Pro-gram by reducing the cost of obtaining a loan for short line railroads and increases the availability of Private Activity Bonds by raising the existing $15 billion cap to $19 billion.
► Grants targeted to projects that benefit the Nation’s commerce: The U.S. transportation sys - tem moves more than 52 million tons of freight worth nearly $46 billion each day, or almost 40 tons of freight per person per year, and freight tonnage is expected to increase 62 percent by 2040. The GROW AMERICA Act includes $18 billion over 6 years for a multi-modal freight program that strengthens America’s exports and trade and gives freight stakeholders a meaningful seat at the table in selecting funded projects. The new initiative encourages better coordination of planning among the Federal Government, States, ports, and local communities to improve decision - making.
► Strengthening domestic manufacturing: The GROW AMERICA Act will strengthen existing “Buy America” requirements to ensure that tax - payer investments for public transportation translate into American jobs and opportunities for innovation. The Act allows for an orderly phase-in by transit suppliers by raising the cur-rent 60 percent threshold up to 100 percent over multiple years to bring the “Buy America” requirements for transit in line with the require-ments in other modes.
► Expanding access to markets and strengthening rural communities: America’s rural communities are the critical linkage in the Nation’s multi-modal transportation network. From manufacturing to farming, freight logistics to energy production, and more, rural America is home to many of the Nation’s most critical infrastructure assets includ ing 444,000 bridges, 2.98 million miles of roadways, and 30,500 miles of interstate high-ways. Specifically, the GROW AMERICA Act will help increase deployment of broadband use in rural areas and improve the Federal Lands Trans-portation Program to achieve a strategic, high-use transportation system on roads that directly access Federal lands.
► Modernizing the U.S. transportation system through technology and process innovation: DOT is committed to accelerating the identifica-tion and deployment of innovation. Technologi-cal changes and innovation have the potential to transform vehicles and infrastructure, logistics, and delivery of transportation services to promote efficiency and safety. Likewise, process innovation has the potential to improve the way that the Gov-ernment operates in the service of the American people. To that end, the GROW AMERICA Act is focused on:

U . S . D E PA R T M E N T O F T R A N S P O R TAT I O N8
THE GROW AMERICA ACT: THE ADMINISTRATION’S SURFACE TRANSPORTATION REAUTHORIZATION PROPOSAL
� Encouraging innovative solutions through competition: By increasing funding for TIGER grants and providing greater legisla-tive certainty for that program, the Act will encourage States and localities to bring more innovative, cross-modal proposals to the table and give the Department more resources to see that the most meritorious projects ultimately are constructed. In addition, the Act would dedicate $6 billion over 6 years to estab-lishing the Fixing and Accelerating Surface Transportation (FAST) program, designed to create incentives for State and local partners to adopt critical reforms in a variety of areas, including safety and peak traffic demand man - agement. Federally inspired safety reforms, such as seat belt and drunk-driving laws, have saved thousands of American lives and avoided billions in property losses.
� Advancing future technologies: Investing $935 million over 6 years in the future of vehicle safety and innovation, including the advancement of vehicle automation and vehicle-to-vehicle technologies.
� Improving project delivery and the Federal permitting process: The GROW AMERICA Act will help projects break ground faster
by expanding on successful Administration efforts to modernize the permitting process while protecting communities and the envi-ronment. The Act will institutionalize capacity within DOT to improve interagency coordi-nation and implement best practices, such as advancing concurrent, rather than sequential, project review, and using an online permitting dashboard to improve transparency and coor - dination and track project schedules. The Act will also increase flexibility for recipients to use Federal transportation funds to support environmental reviews and help to integrate overlapping requirements and eliminate unnecessary duplication.
� Encouraging regional coordination and local decisionmaking to improve outcomes: The Act includes policy reforms to incentivize improved regional coordination by Metropol - itan Planning Organizations (MPOs), which are local communities’ main voice in trans-portation planning. The GROW AMERICA Act also strengthens local decisionmaking in allocating Federal funding so that local communities can better realize their vision for improved mobility.
PAYING FOR THE GROW AMERICA ACT WITH $238 BILLION IN TRANSITIONAL REVENUE FROM COMPREHENSIVE, PRO-GROWTH BUSINESS TAX REFORM
Because rebuilding our transportation infrastructure is an urgent need, the Budget uses the Highway Trust Fund revenue anticipated under current law
in combination with revenues available from elimi-nating loopholes and rationalizing corporate tax rates to fully offset the cost of the GROW AMERICA Act.

B U D G E T H I G H L I G H T S | F I S CA L Y E A R 2 0 1 6 9
FEDERAL TRANSIT ADMINISTRATION
FEDERAL TRANSIT ADMINISTRATION
AccountFY 2014
ActualFY 2015 Enacted
FY 2016 President’s
Budget
Transit Formula Grants (TF)1 $ 8,595.0 $ 8,595.0 $13,914.4
Administrative Expenses (TF) (non-add)2 0 0 [114.4]
Administrative Expenses (GF) 105.9 105.9 0
Capital Investment Grants (TF) 1,942.9 2,120.0 3,250.0
Rapid Growth Area Transit (TF) 0 0 500.0
Washington Metropolitan Area Transit Authority (WMATA) (GF) 150.0 150.0 150.0
Fixing and Accelerating Surface Transportation (TF) 0 0 500.0
Transit Research and Training (TF) 0 0 60
Transit Research (GF) 43.0 33.0 0
Technical Assistance and Training (GF) 5.0 4.5 0
Public Transportation Emergency Relief (TF) 0 0 25.0
Total $10,841.8 $11,008.4 $18,399.4
Rescission – 97.2 – 121.5 0
Direct FTE 525 566 625
Dollars in Millions
OVERVIEW
The Federal Transit Administration (FTA) provides grant funding to State, local, and Tribal governments, public and private tran-sit operators, and other recipients to support public transit infrastructure and operations. The FY 2016 President’s Budget request of $18.4 billion will be used for grants to con-struct new public transit systems, purchase
and maintain transit vehicles and equipment, oversee transit safety, support regional transpor - tation planning efforts, improve the technology and service methods used in the delivery of public transportation services, and increase funding for states and rural transit providers to assist with the capital and operating costs in rural areas.
1 Due to the expiration of MAP-21 on May 31, 2015, only $5.722 billion of FY 2015 contract authority for Transit Formula Grants ($8.595 billion) is available. Does not include flexible funding from FHWA of approximately $1.3 billion in FY 2014, FY 2015, and FY 2016. 2 Administrative Expenses are requested in the FY 2016 President’s Budget in Transit Formula Grants.
U . S . D E PA R T M E N T O F T R A N S P O R TAT I O N1 0
FEDERAL TRANSIT ADMINISTRATION
SUMMARY OF REQUEST
The President is requesting $18.4 billion in FY 2016 to strengthen transit safety oversight, bring our Nation’s bus and rail transit infrastructure into a state of good repair, and provide new and expanded transit systems in many communities. This is an increase of $7.4 billion, or 67 percent above the FY 2015 enacted level. The President’s Budget request demonstrates a strong commitment to continue and strengthen the surface transportation authorization programs established under MAP-21 by proposing a new 6-year authorization. The next phase of Federal transit programs will continue the emphasis on mak - ing transit safer for all riders, improving the condition of transit assets for better performance and efficiency, and enabling new transit systems and system exten-sions. The President’s Budget request supports the following programs:
► Transit Formula Grants: The FY 2016 President’s Budget requests $13.9 billion to provide grants that support transit capital investment, state of good repair, safety, planning, bus and railcar pur - chases and maintenance, transit operations in small and rural areas, and agency operations.
� Included in this account is an increase of $5.1 billion above FTA’s current funding level to support strategic infrastructure investments. These funds will help bring our Nation’s rail transit infrastructure into a state of good repair (a $3.6 billion increase) as well as provide new buses and related facilities (a $1.5 billion increase) to transit systems across the country.
► Capital Investment Grants: The FY 2016 Pres-ident’s Budget requests $3.25 billion to support the construction of major capital projects that provides new and expanded transit service, brings
important economic benefits to communities, and helps address existing fixed-guideway transit corridors that are at or near capacity. This funding request includes $320 million for a new Acceler-ated Project Development and Delivery Incentive category.
► Rapid Growth Area Bus Rapid Transit Corridor Program: The FY 2016 President’s Budget requests $500 million for a new Bus Rapid Transit dis-cretionary grant program to help communities experiencing fast-growing populations. While population growth spurs economic development, it can also stress and strain existing infrastructure, cause congestion, and result in poor air quality. This program will help ease the stress and strain of rapid growth in communities and encourage multi-modal development along corridors, which will be aided by allowing Federal-Aid Highway funding to be used as part of the local funding match.
► Transit Research and Training: The 2016 Presi-dent’s Budget requests $60 million to support research activities that improve the safety, reli - ability, efficiency, and sustainability of public transportation systems by investing in the devel-opment, testing, and deployment of innovative technologies, materials, and processes. These activities will help to create “Ladders of Oppor - tunity” for transit-dependent populations that will help improve access to jobs and educational opportunities.
► Public Transportation Emergency Relief: The FY 2016 President’s Budget requests $25 million to provide capital and operating assistance to help transit agencies restore needed transporta-tion services immediately following disasters.
B U D G E T H I G H L I G H T S | F I S CA L Y E A R 2 0 1 6 1 1
FEDERAL TRANSIT ADMINISTRATION
► Washington Metropolitan Area Transit Author - ity (WMATA): The FY 2016 President’s Budget requests a total of $150 million to address WMATA’s reinvestment and maintenance backlog to improve the safety and reliability of service and to expand existing system capacity to meet growing demand. This funding contin-ues the 10-year, $3 billion capital improvement program in which Federal funding is matched dollar-for-dollar by local and State support.
► Fixing and Accelerating Surface Transporta-tion (FAST): The FY 2016 President’s Budget requests $500 million for a new competitive grant program that will encourage innovative solutions to our most pressing transportation challenges. State and local partners will be eval-uated on their willingness to commit to perfor-mance improvements in important areas such as safety or congestion management.

U . S . D E PA R T M E N T O F T R A N S P O R TAT I O N1 2
FEDERAL TRANSIT ADMINISTRATION
PROPOSED FY 2016 FUNDING FOR FTA CAPITAL INVESTMENT GRANT PROGRAM
FY 2016
Existing New Starts Full Funding Grant Agreements With Remaining Funding Needs—Projects Under Construction or Open for Service
CA Regional Connector Transit Corridor Los Angeles $ 115
CA Westside Subway Extension-Section 1 Los Angeles 115
CA Third Street Light Rail-Central Subway Project San Francisco 165
CA Silicon Valley Berryessa Extension San Jose 165
CO RTD Eagle, Denver Denver 165
HI High Capacity Transit Corridor Honolulu 265
MA Cambridge to Medford, Green Line Extension Boston area 165
NC Blue Line Extension-Northeast Corridor Charlotte 115
OR Portland-Milwaukie LRT Portland 115
Total Existing New Starts Full Funding Grant Agreements 1,385
New Starts Projects Recommended for Full Funding Grant Agreements
CA Westside Section 2 Los Angeles 100
CA Mid-Coast Corridor San Diego 150
CO Southeast Extension Denver 92
MD Red Line Baltimore 100
MD Maryland National Capital Purple Line Washington, DC area 100
MN Southwest LRT Minneapolis 150
TX TEX Rail Fort Worth 100
Total Recommended New Starts Projects 792
Core Capacity (project listed for illustrative purposes only, not yet ready for construction grants)
IL Red and Purple Line Modernization Project Chicago —
NY Canarsie Line Power Improvements New York —
TX DART Platform Extension Dallas —
351
Small Starts Projects Recommended for Small Starts Grant Agreements
CA FAX Blackstone/Kings Canyon BRT Fresno 11
CA Van Ness Avenue BRT San Francisco 30
CA San Rafael to Larkspur Regional Connector San Rafael 20
NC CityLYNX Gold Line Phase 2 Charlotte 75
NV 4th St/Prater Way Corridor Reno 6
OH Cleveland Avenue BRT Columbus 38
TX Montana Corridor BRT El Paso 27
UT Provo Orem BRT Provo 71
WA Tacoma Link Light Rail Expansion Tacoma 75
Total Small Starts 353
Accelerated Project Delivery and Development1 320
Oversight Activities 49
Grand Total $3,250
Dollars in Millions
1 For projects that may become ready for construction grant agreements during FY 2016, accelerated project development work including planning activities, and not less than $75 million for projects in Small Urban/Rural areas with less than 200,000 in population meeting a set of new eligibility parameters and streamlined evaluation criteria.

B U D G E T H I G H L I G H T S | F I S CA L Y E A R 2 0 1 6 1 3
FEDERAL TRANSIT ADMINISTRATION
FEDERAL TRANSIT ADMINISTRATION AMERICA BENEFITS BY…
� Public transportation ridership continues to grow. Last year, transit ridership exceeded 10.5 billion trips, the highest ridership level since 1956. Trends based on census and other demographic data sources indicate that we should expect strong transit rider-ship growth in the future. The United States will see a population increase of approxi-mately 80 million new residents by 2050, and in many cities transit service may not be able to handle many of the additional riders.
� Public transportation systems provide sub-stantial cost savings to Americans who use transit. According to American Public Trans-portation Association’s (APTA) December 2014 Transit Savings Report, an individual who commutes using public transportation instead of owning and driving a vehicle can save an average of more than $9,500 annu-ally on car payments, fuel, vehicle mainte-nance, insurance, and parking costs.
� FTA capital investment grants enable muni cipalities to invest in major transit infrastructure projects that yield additional benefits such as promoting more efficient land use patterns that connect people with jobs and services. Many investments promote higher density land use that help municipalities make better use of valuable real estate near urban centers and provide opportunities for transit operators to realize higher revenues from fares and from the sale
or rent of agency-owned properties. Street-car and bus rapid transit systems can benefit smaller cities that do not have ridership to support light or heavy rail service.
� FTA funding supports transit systems that provide substantial public benefits includ - ing reducing the need for roadway capacity for more automobiles, reducing conges-tion and pollution levels, and improving mobility and accessibility, particularly for low-income, the elderly, and disabled individuals. For example, in order to pro-vide enough roadway capacity for all of the riders currently using transit in the Wash-ington, D.C. region, 1,000 additional lane miles of arterials and highways would be needed to maintain current travel speeds. To accommodate the extra automobiles, the city would also have to approximately double the number of existing parking spaces.
� Several FTA programs provide funding for transit operators to improve the condition and performance of their systems and help bring our Nation’s infrastructure into a state of good repair. According to FTA research, the Nation’s transit systems have amassed an $86 billion maintenance back-log that continues to grow. These systems must be brought into a state of good repair in order to provide the high quality transit service our citizens expect.

U . S . D E PA R T M E N T O F T R A N S P O R TAT I O N1 4
THE GROW AMERICA ACT: THE ADMINISTRATION’S SURFACE TRANSPORTATION REAUTHORIZATION PROPOSAL
FEDERAL HIGHWAY ADMINISTRATION
FEDERAL HIGHWAY ADMINISTRATION
AccountFY 2014
ActualFY 2015 Enacted
FY 2016 President’s
Budget
Federal-Aid Highways Obligation Limitation (TF)1, 2 $40,256.0 $40,256.0 $50,068.2
Exempt Mandatory Federal-Aid Highways (TF)3 685.8 685.1 739.0
Limitation on Admin Expenses (non-add)4 [419.3] [415.0] [442.2]
Subtotal 40,941.8 40,941.1 50,807.2
Payment to the Transportation Trust Fund (GF) (non-add) [21,457.8] 0 [39,733.0]
Fixing and Accelerating Surface Transportation (TF) 0 0 500.0
Total $40,941.8 $40,941.1 $51,307.2
Direct FTE 2,655 2,560 2,652
Dollars in Millions
OVERVIEW
The Federal Highway Administration (FHWA)
promotes the development, operation, and
management of a safe, economically efficient,
and environmentally sound intermodal surface
transportation system that provides a founda-
tion for the Nation to compete in the global
economy. The FY 2016 President’s Budget
request of $51.3 billion provides FHWA
with the resources necessary for State, local,
and other Federal transportation agencies to
improve the condition and performance of
their highway and roadway systems in ways
that protect the environment, provide user
access and choices, and benefit from advances
in technology and innovation. The FY 2016
President’s Budget request reflects the first
year of the Administration’s 6-year surface
transportation reauthorization proposal.
1 Flexible funding transfers to/from FTA were $1.3 billion in FY 2014 and the Department estimates flexible funding transfers of $1.3 billion for FY 2015 and FY 2016. 2 Does not reflect penalty transfers to NHTSA, which were $100 million in FY 2014. 3 FY 2014 and FY 2015 exempt amounts are shown after reductions due to sequestration.4 FY 2015 annual appropriations (PL 113-235) provided $429,348,000 of obligation limitation for administrative expenses; however, the contract authority level provided by the authorization extension through May 31, 2015 (PL 113-159), when annualized for the full year, would be only $415,000,000.

B U D G E T H I G H L I G H T S | F I S CA L Y E A R 2 0 1 6 1 5
FEDERAL HIGHWAY ADMINISTRATION
SUMMARY OF REQUEST
The President is requesting $51.3 billion in FY 2016 to invest in our Nation’s highway and bridge infra - structure. This is a $10.3 billion increase above FY 2015 funding levels. The Federal Highway Admin - istration’s (FHWA) FY 2016 Budget continues the program structure established under MAP-21, but with several key additions that will enhance our Nation’s transportation infrastructure. Built on past successes, the structure strives to enhance the safety, performance, condition, and efficiency of the Nation’s highway system.
► Freight Program: The President’s Budget requests $1.0 billion for a new program providing a dedicated source of funding to improve the delivery of freight projects, which will foster economic growth. The program will incentivize regional planning by providing funding for multi- modal, multi-jurisdictional, and corridor-based projects, and by requiring the development of statewide freight plans with regional planning participation.
► The Critical Immediate Safety Investments Program (CISIP): The President’s Budget re quests $7.5 billion as part of the “Fix-it-First” initiative to focus on the reconstruction, res-toration, rehabilitation, preservation, or safety improvement of existing highway assets. The program will reduce the number of structurally deficient Interstate Highway System bridges, target safety investments and support a state of good repair on the National Highway System (NHS).
► Highway Safety Improvement Program: The President’s Budget requests $2.6 billion for the performance-based Highway Safety Improvement Program to provide funding to significantly reduce traffic fatalities and serious injuries on all
public roads for all road users including pedestrians and bicyclists. FHWA, through national leadership and innovation, focuses on improving the safety of roadway infrastructure on all public roads, including non-State-owned public roads and roads on Tribal lands, using a data- and performance-driven strategic approach.
► National Highway Performance Program: The President’s Budget requests $22.3 billion for the performance-based National Highway Performance Program (NHPP), which focuses significant Fed - eral resources on the National Highway System (NHS). The 220,000-mile NHS provides mobility to the vast majority of the Nation’s population and almost all of its commerce, carrying 55 percent of all vehicular traffic, serving 53 percent of U.S. highway border crossings, and handling 98 per-cent of total truck trade with Canada and Mexico. The NHPP will improve the condition and per - formance of the NHS; support the construction of new facilities on the NHS; and help ensure that investments of Federal-Aid Highway funds in highway construction support progress toward the achievement of performance targets. The pro - gram includes performance management features, holds States accountable for achieving perfor-mance targets, and provides flexibility to States for making transportation investment decisions.
► Surface Transportation Program: The President’s Budget requests $10.3 billion for the Surface Transportation Program (STP) which provides flexible funding that may be used by States and localities for projects to preserve and improve the condition and performance on Federal- Aid highways, bridges on any public road, transit capital projects (including intercity

U . S . D E PA R T M E N T O F T R A N S P O R TAT I O N1 6
FEDERAL HIGHWAY ADMINISTRATION
bus terminals), and bicycle and pedestrian facilities. The flexible nature of this program ensures States are able to direct funding to areas of greatest need while also fostering innovation. This program will give transportation agencies the ability to target funding to State and local priorities. States will identify projects for STP funding in consultation with local transportation officials in rural areas and in cooperation with the Metropolitan Planning Organization (MPO) in metropolitan areas.
► Congestion Mitigation and Air Quality Im-provement Program: The President’s Budget requests $2.3 billion for the Congestion Miti-gation and Air Quality (CMAQ) Improvement Program to help States, local governments, and private-sector sponsors reduce highway conges-tion and harmful emissions and assist many areas in reaching attainment of the National Ambient Air Quality Standards (NAAQS), a strong envi-ronmental priority. The CMAQ program provides a flexible funding source for State and local gov - ernments to fund transportation projects and programs that are designed to help States meet the requirements of the Clean Air Act and its amendments, and help reduce regional conges-tion on transportation networks.
► Metropolitan Transportation Planning Program: The President’s Budget requests $320 million for the Metropolitan Transportation Planning Program to provide funds for use by Metro-politan Planning Organizations (MPOs) for multi-modal transportation planning and programming in metropolitan areas. Metropoli-tan planning activities include the collection and analysis of data on demographics, trends, and system performance; travel demand and system performance forecasting; identification and pri-oritization of transportation system improvement
needs; and coordination of the planning process and decisionmaking with the public, elected officials, and stakeholder groups.
► Transportation Alternatives Program: The President’s Budget requests $847 million for the Transportation Alternatives Program to foster quality of life improvements through policies and investments that increase transportation choices and access to transportation services. The program creates safe, accessible, attractive, and environmentally sensitive communities where people want to live, work, and engage in recreation. This program provides resources to expand transportation choices and enhance the transportation experience.
► Federal Lands and Tribal Programs: The Pres-ident’s Budget requests $1.3 billion for trans-portation construction and engineering projects on Federal and Tribal Lands, including $150 million in “Fix-it-First” funding to support construction or reconstruction of large, nationally significant transportation infrastructure assets. This funding will be used for construction and engineering projects that will provide multi-modal access to basic community services including safer all-weather access to schools and healthcare facilities for 566 federally recognized sovereign Tribal governments, improve multi-modal access to recreational areas on public lands/national treasures, and expand economic development in and around Federal and Tribal lands while preserv - ing the environment and reducing congestion.
► Transportation Infrastructure Finance and Innovation Act (TIFIA) Program: The Presi-dent’s Budget requests $1 billion for the TIFIA Program to cover the subsidy cost of providing credit assistance for nationally or regionally significant transportation projects. The TIFIA

B U D G E T H I G H L I G H T S | F I S CA L Y E A R 2 0 1 6 1 7
FEDERAL HIGHWAY ADMINISTRATION
Program makes the most of scarce budgetary resources—by offering loans. The TIFIA Program leverages $1 billion in Federal funds to stimulate up to $30 billion in infrastructure investment. This program facilitates private participation in transportation projects and encourages inno-vative financing mechanisms that help advance projects sooner. The TIFIA loan portfolio is currently $21 billion.
► Research, Technology, and Education Program: The President’s Budget requests $496 million for the Research, Technology, and Education (RT&E) Program to provide for a comprehensive, nation - ally coordinated research, technology, and education program. The proposal carries forward the MAP-21 restructured FHWA research, devel-opment, and technology activities, which include a highway research and development program, a technology and innovation deployment program, and a training and education activities program. Research supporting innovative finance efforts is also included. In addition, there is up to $25
million for implementation of the Future Stra - tegic Highway Research Program to accelerate innovation delivery and technology implemen - tation.
► Federal Allocation Programs: The President’s Budget requests $502 million for eight impor-tant programs: Emergency Relief, Territorial and Puerto Rico Highways Program, Construction of Ferry Boats and Ferry Terminal Facilities, Ladders of Opportunity, On-the-Job Training, Disadvan-taged Business Enterprise, Highway Use Tax Evasion, and Performance Management Data Support.
► Fixing and Accelerating Surface Transportation (FAST): The FY 2016 President’s Budget requests $500 million for a new competitive grant pro-gram that will encourage innovative solutions to our most pressing transportation challenges. State and local partners will be evaluated on their willingness to commit to performance improve-ments in important areas such as safety or con-gestion management.
FEDERAL HIGHWAY ADMINISTRATION AMERICA BENEFITS BY…
� Making roads safer: The number of highway- related fatalities has decreased by about 25 percent between 2004 and 2013. The decrease coincides with, and is at least partly attributable to, the establishment and contin-uation of the Highway Safety Improvement Program as a core Federal-Aid Highway pro - gram and its integration with other safety programs across the Department.
� Spurring the U.S. economy: The highway program is a key driver of the U.S. economy. Our Nation’s highways and bridges are crit - ical to the effective movement of people and goods, including food, energy, and manufactured goods. An efficient, reliable freight network allows people and goods to be moved more quickly and reliably to their destinations, lowering costs and improving productivity across the Nation.

U . S . D E PA R T M E N T O F T R A N S P O R TAT I O N1 8
FEDERAL HIGHWAY ADMINISTRATION
FEDERAL HIGHWAY ADMINISTRATION AMERICA BENEFITS BY…(continued)
� Improving highway conditions and perfor-mance: The share of Federal-Aid Highway travel occurring on pavements with good ride quality rose significantly from 48 per-cent in 2001 to 59 percent in 2014 despite an increase in NHS mileage of over 50,000 miles due to MAP-21. Bringing pavements up to a state of good repair yields benefits to system users in the form of decreased wear and tear on vehicles and resulting repair costs, reduced traveler delays, and lower crash rates.
� Improving bridge condition and perfor-mance: Over the last decade, even as the total number of bridges in the Nation’s inventory increased from 594,100 to 607,751, the per-centage of bridges classified as structurally deficient dropped from 13.5 percent in 2004 to 10.5 percent in 2013. Similarly, the percentage of the deck area (considering bridge size) on bridges classified as structur-ally deficient has dropped from 10.1 percent in 2004 to 7.7 percent in 2013.
� Moving people and goods more efficiently: FHWA provides national leadership in the areas of congestion management, Intelligent Transportation Systems, traffic operations, emergency management, and freight man-agement and operations.
� Creating jobs: Besides allowing for crucial investments in America’s highway and bridge infrastructure, the Federal-Aid Highway Pro-gram also puts tens of thousands of Americans to work. Currently, there are approximately 115,000 open projects, resulting in annual highway expenditures of over $150 billion. This investment creates and supports good- paying jobs in the construction industry throughout the Nation.
� Spurring innovation: The Every Day Counts (EDC) initiative seeks to increase innova-tion at every stage of the highway project lifecycle. Launched in 2010 as a partnership with State and local agencies, EDC has now moved into a third phase focusing on “effi-ciency through collaboration and technol-ogy.” These innovations continue the goal of shortening project delivery, enhancing roadway safety, reducing congestion, and improving environmental sustainability.
� Safeguarding taxpayer funds: FHWA’s risk- based stewardship and oversight program include program reviews, quality assurance reviews, project and process evaluations, and performance management indicators. Additionally, our Financial Integrity Review and Evaluation (FIRE) program helps ensure that Federal funds are properly managed and safeguarded from fraud, waste, and abuse.

B U D G E T H I G H L I G H T S | F I S CA L Y E A R 2 0 1 6 1 9
FEDERAL MOTOR CARRIER SAFETY ADMINISTRATION
FEDERAL MOTOR CARRIER SAFETY ADMINISTRATION
AccountFY 2014
ActualFY 2015 Enacted
FY 2016 President’s
Budget
Motor Carrier Safety Operations and Programs (TF) (Direct Only)1
$259.0 $271.0 $329.2
Motor Carrier Safety Grants (TF) 313.0 313.0 339.3
National Motor Carrier Safety for Border Facilities2 13.0 0 0
Total $585.0 $584.0 $668.5
Direct FTE 1,039 1,114 1,215
Dollars in Millions
OVERVIEW
The Federal Motor Carrier Safety Administra-
tion (FMCSA) promotes safety and provides
resources to support State efforts to reduce
severe and fatal commercial motor vehicles
crashes. FMCSA accomplishes its mission by
raising the bar to enter into the commercial
motor vehicle industry, by requiring opera-
tors to maintain standards to remain in the
industry and by removing high-risk carriers,
vehicles, drivers, and service providers from
operation. The FY 2016 President’s Budget
request of $669 million provides the resources
necessary to support nationwide motor carrier
safety and consumer enforcement efforts,
including the continuation of the Compliance,
Safety and Accountability (CSA) Program;
household goods regulation and enforcement;
and Federal safety enforcement activities at
the borders to ensure that foreign-domiciled
carriers entering the United States are in com -
pliance with FMSCA Regulations.
1 The Consolidated and Further Continuing Appropriations Act, 2015, made $12 million in unobligated balances available in this account to fund additional grants, a study related to service hours, and information technology enhancements related to new carrier vetting, among other purposes.2 The FY 2014 Omnibus Appropriations Act made available $13 million in expired authority from this account to fund renovation and maintenance of border facilities.

U . S . D E PA R T M E N T O F T R A N S P O R TAT I O N2 0
FEDERAL MOTOR CARRIER SAFETY ADMINISTRATION
SUMMARY OF REQUEST
The President is requesting $669 million in FY 2016 to invest in safe motor carrier and commercial motor vehicle (CMV) operations and to reduce large truck and bus crashes, injuries, and fatalities. The Budget also requests an increase of 101 FTEs primarily to support Safety Intervention Programs, and information technology infrastructure improve-ments.
► Motor Carrier Safety Operations and Programs: The President’s Budget requests $329 million in FY 2016 to fund research, technology, and pro - grams that reduce serious injuries and deaths resulting from commercial motor vehicle crashes. Funds will also be used for administrative expenses in support of FMCSA’s efforts to develop, imple-ment, and enforce safety programs. The following programs are funded accordingly:
� Research: $10 million is requested for multi-year Research and Technology programs focused on producing safer drivers and carriers.
� Information Technology (IT) Development and Sustainment: $43 million is requested for the operations, maintenance, and logis-tical support of the safety mission critical systems and to continue building out the modernized IT architecture.
� General Operations: $277 million is requested to carry out the Agency’s predominate safety mission and affiliated support functions. This includes $9 million for the Motorcoach Safety Oversight Program as well as a request of $22 million for the implementation of FMCSA’s Capital Improvement Plan, $3 million to
continue enhancements to FMCSA’s Safety Fitness Determination model for newly register - ing carriers, and $2 million for the enhance-ment of safe transportation of energy products.
► Motor Carrier Safety Grants: The FY 2016 President’s Budget requests $339 million for the Motor Carrier Safety Grants program. The Agency’s proposed reauthorization reengineers our existing programs to reduce the applica-tion and compliance burden on our grantees and to reduce the Federal cost of administer-ing Agency grant programs, allowing savings to be redirected to FMCSA’s safety mission. This request bolsters the resources available to award grants that are used to support investigations and interventions in States, identify and apprehend traffic violators, and conduct roadside inspections:
� Motor Carrier Safety Assistance Program (MCSAP): $284 million is requested for both formula and discretionary funding to support programs that improve motor carrier com-pliance and safety through State and local law enforcement programs. Formula grants fund roadside inspections, interventions, com - pliance reviews, and targeted enforcement, while discretionary funds support FMCSA’s High Priority program, which encourages best practices and innovative enforcement of safety initiatives at the State and local level. FMCSA’s reauthorization proposal combines our existing Basic and Incentive MCSAP grants with legacy grant programs. Condensing these programs reduces administrative burdens on our State partner agencies.

B U D G E T H I G H L I G H T S | F I S CA L Y E A R 2 0 1 6 2 1
FEDERAL MOTOR CARRIER SAFETY ADMINISTRATION
� Commercial Driver’s License (CDL) Program Improvement: $34 million is requested to provide funding for grants to States that focus on the operator’s role in commercial vehicle safety and CDL improvement programs. The requested increase will assist States to create uniform CDL compliance plans.
� Innovative Technology Deployment (ITD): As part of the proposed reauthorization,
FMCSA intends to alter the existing Com-mercial Vehicle Information Systems and Networks (CVISN) program into the Inno-vative Technology Deployment program, requesting $20 million. With CVISN type systems deployed in 47 States, the program can shift to fund the most innovative propos-als to enhance the safety and productivity of America’s motor carriers.
FEDERAL MOTOR CARRIER SAFETY ADMINISTRATION AMERICA BENEFITS BY…
The FMCSA regulates approximately 539,000 active interstate freight motor carriers, 12,000 passenger carriers, 5,000 intrastate hazardous materials carriers, and approximately 4 million active CDL holders. In 2013, the Department estimates that:
� There were over 11 million U.S.-registered large trucks and buses, traveling more than 290 billion vehicle miles.
� The total miles traveled by all vehicles grew 7 percent from 2002 to 2013.
� Large truck- and bus-related mileage grew 31 percent from 2002 to 2013, while regis-trations for large trucks and buses increased by about 32 percent.
Despite this continued growth in commercial vehicle traffic, there was a 23-percent reduction in fatalities in crashes involving large trucks and buses, from 5,539 in 2005 to 4,251 in 2013. This reflects a 40-percent reduction from
1979, the year with the most fatalities involving large trucks and buses. The rate of injuries in crashes involving large trucks and buses has also declined over the last two decades. The decline in injuries and fatalities is due in part to the safety efforts of FMCSA and its partners:
� In FY 2013, FMCSA conducted approxi-mately 3.5 million truck and bus roadside inspections. 21 percent of trucks inspected were put out of service, 7 percent of buses inspected were put out of service, and 5 percent of drivers inspected were put out of service.
� Safety Investigators conducted more than 17,000 investigations in FY 2013. As a result of these investigations, 4,985 Notice of Claims (NOC), 771 Unsatisfactory/Unfit Out-of-Service (OOS) Orders, and 37 Imminent Hazard OOS Orders were issued.
� Safety Auditors also conducted 32,890 new entrant safety audits.

U . S . D E PA R T M E N T O F T R A N S P O R TAT I O N2 2
FEDERAL MOTOR CARRIER SAFETY ADMINISTRATION
FEDERAL MOTOR CARRIER SAFETY ADMINISTRATION AMERICA BENEFITS BY…(continued)
FMCSA’s roadside inspection and traffic enforce-ment programs are premised on the notion that correcting serious driver and vehicle violations at the roadside prevents future crashes and hence saves lives. Based on models that assess the num-ber and type of violations found each year at the roadside, the agency estimates that it prevents roughly 19,000 crashes per year as a result of these programs and saves about 600 lives per year. External factors such as demographics, eco-nomic conditions, gas prices, and the increased use of public transportation have also had an impact on the reduction of injuries and fatalities.
More than 3 million inspections are done annually. If FMCSA’s grant programs were not in place, it is estimated that less than 600,000 inspections could be conducted each year, which could result in 80 percent more unsafe vehicles on the roadway (this is based on State inspection behavior data prior to 1985).
In 2013, 4,251 people were killed in large truck and bus crashes and approximately 133,000 individuals were injured. The estimated costs of commercial motor vehicle crashes resulting in fatalities and injuries exceeded $81 billion in 2013.
B U D G E T H I G H L I G H T S | F I S CA L Y E A R 2 0 1 6 2 3
NATIONAL HIGHWAY TRAFFIC SAFETY ADMINISTRATION
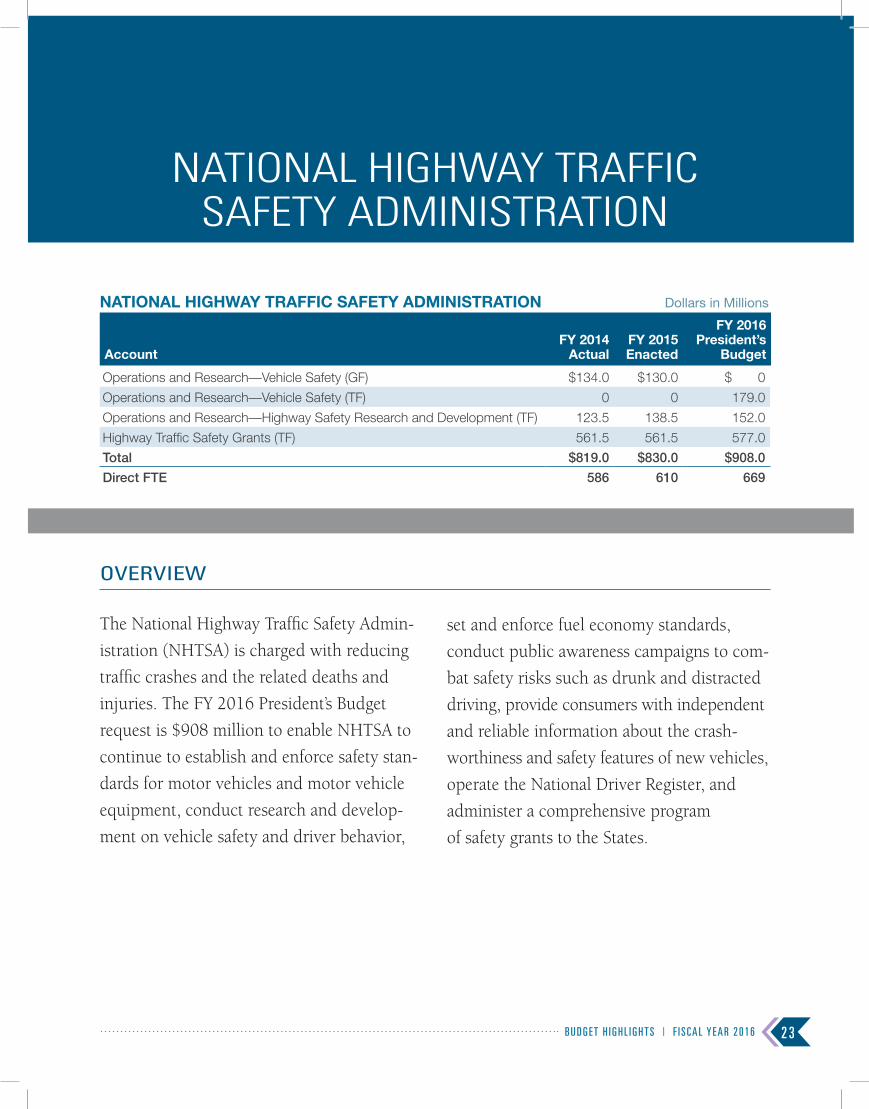
NATIONAL HIGHWAY TRAFFIC SAFETY ADMINISTRATION
AccountFY 2014
ActualFY 2015 Enacted
FY 2016 President’s
Budget
Operations and Research—Vehicle Safety (GF) $134.0 $130.0 $ 0
Operations and Research—Vehicle Safety (TF) 0 0 179.0
Operations and Research—Highway Safety Research and Development (TF) 123.5 138.5 152.0
Highway Traffic Safety Grants (TF) 561.5 561.5 577.0
Total $819.0 $830.0 $908.0
Direct FTE 586 610 669
Dollars in Millions
OVERVIEW
The National Highway Traffic Safety Admin-
istration (NHTSA) is charged with reducing
traffic crashes and the related deaths and
injuries. The FY 2016 President’s Budget
request is $908 million to enable NHTSA to
continue to establish and enforce safety stan-
dards for motor vehicles and motor vehicle
equipment, conduct research and develop-
ment on vehicle safety and driver behavior,
set and enforce fuel economy standards,
conduct public awareness campaigns to com-
bat safety risks such as drunk and distracted
driving, provide consumers with independent
and reliable information about the crash-
worthiness and safety features of new vehicles,
operate the National Driver Register, and
administer a comprehensive program
of safety grants to the States.

U . S . D E PA R T M E N T O F T R A N S P O R TAT I O N2 4
NATIONAL HIGHWAY TRAFFIC SAFETY ADMINISTRATION
SUMMARY OF REQUEST
The President is requesting $908 million for the National Highway Traffic Safety Administration (NHTSA) to invest in initiatives that reduce traffic crashes and the 30,000 deaths that result each year. The President’s Budget request proposes this increased level to address emerging traffic and vehicle safety issues, promote new technologies, and address safety defects that present a risk to the driving public. The FY 2016 President’s Budget request will support NHTSA’s ongoing effort to improve traffic safety. Pedestrian safety will continue to be a priority area. NHTSA plans to work with the States to implement education and enforcement components of the Pedes - trian Safety Action Plans and will work with other DOT Operating Administrations to conduct safety assessments in every State. NHTSA will continue its public awareness campaigns proven to save lives and reduce crashes and address the needs of hard-to-reach segments of the American public.
NHTSA also recognizes the enormous role technology can play in vehicle safety. The President’s Budget request will support NHTSA’s plans to expand the Agency’s focus on technology, especially on crash avoidance technologies and distracted driving issues.
The President’s Budget request reflects changes to the Agency’s program consistent with the Admin-istration’s proposed GROW AMERICA Act. These changes include clarifying a number of vehicle-related provisions to strengthen the oversight and enforcement of safety regulations, increasing civil penalty limits and adding imminent hazard authority, funding dis - tracted driving grants to promote enactment and enforcement of State distracted-driving laws, streamlin-ing State grant application processes, and expanding the scope of the National Emergency Medical State Information Systems technical assistance center.
► Operations and Research: The FY 2016 Presi-dent’s Budget requests $331 million in Opera-tions and Research activities. Specific initiatives include:
� Office of Safety Defects Investigation: $31.3 million is requested to enable NHTSA’s Office of Defects Investigation (ODI) to improve its effectiveness and meet growing chal-lenges to identify safety defects quickly, ensure remedies are implemented promptly, and ensure the public is informed of critical information in an effective manner. This re-quest would more than double the number of personnel currently working in the Office of Safety Defects Investigation.
� Highway Safety Research and Analysis: $152 million is requested to support NHTSA’s safety goals through behavioral research, dem - onstrations, and technical assistance to States. NHTSA activities emphasize national leader-ship relating to alcohol and drugged driving countermeasures, occupant protection, dis-traction, traffic law enforcement, motorcycle riders, pedestrian and bicycle safety, and young and older driver safety programs. NHTSA coordinates these efforts with numerous Fed-eral partners, State and local governments, and other organizations and safety associations.
� Crash Data Collection: $41.7 million is requested to support NHTSA’s crash data collection activities in two major areas: continuing three legacy systems—the Fatality Analysis Reporting System (FARS), State Data Systems (SDS), and Special Crash Investigations (SCI)—as well as the imple-mentation of the two newly modernized

B U D G E T H I G H L I G H T S | F I S CA L Y E A R 2 0 1 6 2 5
NATIONAL HIGHWAY TRAFFIC SAFETY ADMINISTRATION
systems—the Crash Report Sampling System (CRSS) and the Crash Investigation Sampling System (CISS)—that will increase data reli-ability, expand data collection, and improve information technology.
� New Car Assessment Program (NCAP): $14 million is requested to maintain test coverage at 85 percent of the new cars consumers buy and to plan and implement enhancements including expansion of the advanced crash avoidance technologies incorporated in the program.
� Corporate Average Fuel Economy (CAFE): $7.9 million is requested to support future rulemaking programs, including rulemak-ing activity for the post-2018 Medium- and Heavy-Duty Vehicle fuel efficiency program and comprehensive rulemaking for the CAFE program addressing model year 2022 and beyond.
� Emerging Technologies, Electronics, and Alternative Fuels: $7.1 million is requested to conduct research on advanced and emerg - ing technologies and alternative fuel vehi-cles that require thorough testing to ensure their level of safety for vehicle occupants is comparable to that of other vehicles.
► Highway Traffic Safety Grants: The FY 2016 President’s Budget requests $577 million for Highway Traffic Safety Grants. The request is consistent with the proposed GROW AMERICA Act, which authorizes Section 402 Formula Grants and the consolidated Section 405 National Prior-ity Safety Programs that now include additional programs such as distracted driving grants and State-graduated driver licensing laws.
� State and Community Highway Safety Grants (Section 402): $241.1 million is requested for the State and Community Highway Safety grants program that is the foundation of NHTSA’s State highway safety initiatives. These formula grants directly support the Department’s safety goals by providing flexibil-ity to States to address pervasive and emerging highway safety problems. This program also provides funding for a comprehensive State traffic safety enforcement program critical to maintaining State traffic safety improvements.
� National Priority Safety Programs (Section 405): $278.7 million is requested to continue NHTSA’s focus on occupant protection and impaired driving; improve State traffic safety information systems; and, oversee authorized grant programs aimed at incentiv-izing the distracted driving laws and gradu-ated driver licensing laws. This request will also allow the States to increase the deploy-ment of ignition interlocks, establish driving while intoxicated (DWI) Courts, expand the use of Traffic Safety Resource Prosecutors, and expand Advanced Roadside Interdiction and Detection training and drug recognition expert (DRE) training for law enforcement.
� High-Visibility Enforcement: $29 million is requested for the promotion and adminis-tration of the highly successful annual Click It or Ticket effort to increase seatbelt use, the Labor Day and December anti-distracted driving campaigns, and the Drive Sober or Get Pulled Over impaired driving initiative.

U . S . D E PA R T M E N T O F T R A N S P O R TAT I O N2 6
NATIONAL HIGHWAY TRAFFIC SAFETY ADMINISTRATION
FY 2016 HIGHWAY TRAFFIC SAFETY GRANTS
Grant Programs FY 2016 Request
Section 402 Formula Grants $241.10
Section 405 Occupant Protection 44.60
Section 405 State Traffic Safety Information Systems Grants 40.40
Section 405 Impaired Driving Countermeasures Grants 146.30
Section 405 Distracted Driving Grants 23.70
Section 405 Motorcyclist Safety Grants 4.20
Section 405 State Graduated Driver Licensing Laws 13.90
Section 403h In-Vehicle Alcohol Detection Device Research 5.60
Section 2009 High Visibility Enforcement 29.00
Administrative Expenses 28.20
TOTAL $577.00
Dollars in Millions
SAFETY PERSONNEL
Additional Safety-Related Personnel: Within the President’s FY 2016 budget for NHTSA, 59 addi-tional safety-related FTEs are requested—43.5 FTEs are requested for Vehicle Safety, 8.5 FTEs for Highway Safety, and 7 FTEs for the Highway Safety Grants program. This request will improve NHTSA’s ability to identify defective vehicles and equipment and implement recalls. It includes electrical and
systems engineers to conduct research on emerging issues including battery and hybrid technologies and new vehicle propulsion systems. This FTE level will also support development of safety and fuel econ-omy standards and efforts to address emerging safety issues, such as distraction and electronic controls, and development and implementation of strategies to encourage safe driving.

B U D G E T H I G H L I G H T S | F I S CA L Y E A R 2 0 1 6 2 7
NATIONAL HIGHWAY TRAFFIC SAFETY ADMINISTRATION
NATIONAL HIGHWAY TRAFFIC SAFETY ADMINISTRATION AMERICA BENEFITS BY…
� Saving Lives: NHTSA is responsible for reducing deaths, injuries, and economic losses resulting from motor vehicle crashes. This is accomplished by setting and enforcing safety performance standards for motor vehicles and motor vehicle equipment and through grants to State and local governments to enable them to conduct effective local high-way safety programs. NHTSA has helped reduce roadway fatalities nearly 25 per-cent over the past decade.
� Driver Safety and State Grant Programs: NHTSA improved State oversight of Highway Traffic Safety Grant programs, which support State efforts to enforce traffic safety laws. NHTSA continues to operate a menu of high profile public awareness campaigns such as Click It or Tick It combating drunk and drugged driving, promoting seat belt use, and encouraging other behaviors proven to reduce deaths and injuries, while implementing new programs for Distracted Driving, Graduated Driver Licensing, and pedestrian/bicycle safety. NHTSA leads the way in working with States to measure State safety program performance and is now working with other DOT Operating Administrations to expand this data-driven approach.
� Vehicle Safety Recalls: Over the past decade, NHTSA investigations have led to the recall of nearly 100 million vehicles and items of motor vehicle equipment. In the last year alone, NHTSA initiated the largest child seat recall in history and issued more than
$126 million in fines against automakers that failed to meet their reporting and recall requirements—more than the Agency has issued in its entire history. NHTSA will con tinue to make this a high priority area, pushing automakers to act quickly on safety defects, launching investigations when automakers fail to do so, and gathering all necessary data to protect the motoring public.
� 5-Star Safety Ratings: NHTSA enhanced the 5-Star crash test/rating initiative under the New Car Assessment Program (NCAP) to make the test criteria more stringent and to include identification of new vehicle safety technologies and best-fit information on child safety seats.
� Improving Fuel Economy: NHTSA finalized groundbreaking fuel economy standards in conjunction with the EPA through the Corporate Average Fuel Economy Program (CAFE) to nearly double efficiency for new cars and light-duty trucks by Model Year 2025, saving consumers $1.7 trillion at the gas pump and reducing U.S. oil consumption by 12 billion barrels.
� World-Class Safety Data: NHTSA continues the revision of our statistical methodology and information technology infrastructure to collect crash data in the future to reflect shifting demographics and the need to collect different and more data, and initiated the development of a more streamlined data collection system including a modern data-base and enhanced data analytical techniques.
U . S . D E PA R T M E N T O F T R A N S P O R TAT I O N2 8
FEDERAL RAILROAD ADMINISTRATION
FEDERAL RAILROAD ADMINISTRATION
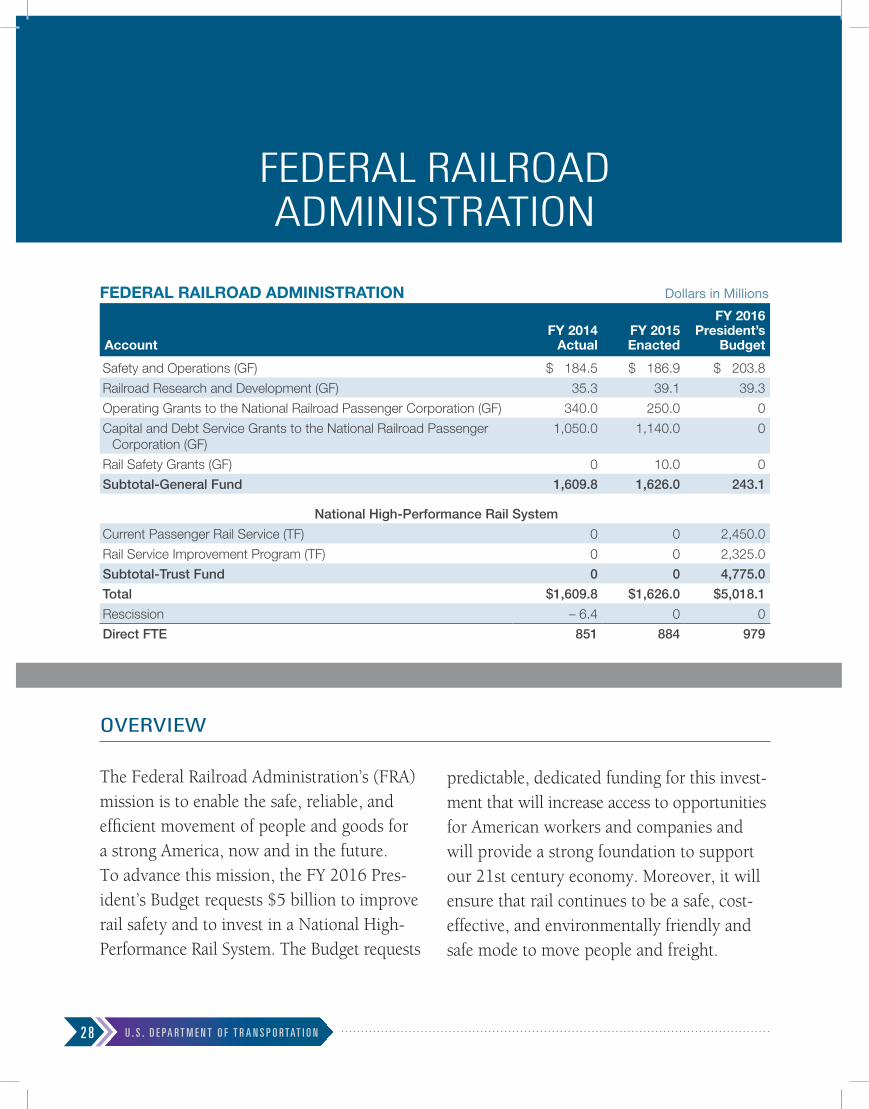
FEDERAL RAILROAD ADMINISTRATION
AccountFY 2014
ActualFY 2015 Enacted
FY 2016 President’s
Budget
Safety and Operations (GF) $ 184.5 $ 186.9 $ 203.8
Railroad Research and Development (GF) 35.3 39.1 39.3
Operating Grants to the National Railroad Passenger Corporation (GF) 340.0 250.0 0
Capital and Debt Service Grants to the National Railroad Passenger Corporation (GF)
1,050.0 1,140.0 0
Rail Safety Grants (GF) 0 10.0 0
Subtotal-General Fund 1,609.8 1,626.0 243.1
National High-Performance Rail System
Current Passenger Rail Service (TF) 0 0 2,450.0
Rail Service Improvement Program (TF) 0 0 2,325.0
Subtotal-Trust Fund 0 0 4,775.0
Total $1,609.8 $1,626.0 $5,018.1
Rescission – 6.4 0 0
Direct FTE 851 884 979
Dollars in Millions
OVERVIEW
The Federal Railroad Administration’s (FRA) mission is to enable the safe, reliable, and efficient movement of people and goods for a strong America, now and in the future. To advance this mission, the FY 2016 Pres - ident’s Budget requests $5 billion to improve rail safety and to invest in a National High- Performance Rail System. The Budget requests
predictable, dedicated funding for this invest - ment that will increase access to opportunities for American workers and companies and will provide a strong foundation to support our 21st century economy. Moreover, it will ensure that rail continues to be a safe, cost- effective, and environmentally friendly and safe mode to move people and freight.

B U D G E T H I G H L I G H T S | F I S CA L Y E A R 2 0 1 6 2 9
FEDERAL RAILROAD ADMINISTRATION
SUMMARY OF REQUEST
The President is requesting $5 billion in FY 2016 to invest in rail safety and development programs, an increase of nearly $3.4 billion above FY 2015 enacted levels.
NATIONAL HIGH-PERFORMANCE RAIL SYS-TEM: Consistent with the President’s comprehen-sive surface transportation legislative proposal, the FY 2016 Budget requests $4.8 billion to establish a National High-Performance Rail System (NHPRS) to support current operations and to improve the rail system for the future. FY 2016 is the first year of a proposed 6-year $28.55 billion rail reauthorization proposal, which includes two major new programs: Current Passenger Rail Service and the Rail Service Improvement Program. These activities will be fund-ed from a proposed new Rail Account to be included in the proposed Transportation Trust Fund.
► Current Passenger Rail Service: The President’s Budget requests $2.5 billion to return public rail assets to a state of good repair and to make other critical investments needed to maintain current rail services.
FRA proposes providing grant assistance orga-nized according to Amtrak’s lines of business to improve transparency and cost management.
� Northeast Corridor: $550 million is requested to bring Amtrak’s Northeast Corridor infra-structure and equipment into a state of good repair to enable future growth and service improvements.
� State Corridors: $225 million is requested to replace obsolete equipment on State- supported routes and to help States pay for capital expenses as required by the existing statute.
� Long-Distance Routes: $850 million is requested to continue operations of Amtrak’s long-distance routes.
� National Assets, Legacy Debt, and Amtrak Positive Train Control: $475 million is requested to improve the efficiency of Amtrak’s “back -bone” rail facilities and operations, make payments on Amtrak’s legacy debt, and implement Positive Train Control on Amtrak routes.
� Stations—Americans with Disabilities Act Compliance: $350 million is requested to bring stations into compliance with require - ments of the Americans with Disabilities Act.
To continue the decades-long progress in rail safety performance, FRA is requesting $3.4 billion in additional resources to focus on today’s three most pressing rail safety issues:
► Increasing rail transportation of crude oil, ethanol, and liquefied natural gas.
► Passenger rail safety issues that surfaced in the wake of the Metro-North accidents.
► Highway-rail grade crossing and pedestrian safety.

U . S . D E PA R T M E N T O F T R A N S P O R TAT I O N3 0
FEDERAL RAILROAD ADMINISTRATION
► Rail Service Improvement Program: The Pres-ident’s Budget requests $2.3 billion to expand and improve the rail networks throughout the United States. The program will also fund Positive Train Control for commuter railroads and support network development planning.
� Passenger Corridors: $1.3 billion is requested to develop high-performance passenger rail networks through construction of new cor-ridors, substantial improvements to existing corridors, and mitigation of passenger train congestion at critical chokepoints.
� Commuter Railroads—PTC Compliance: $825 million is requested to implement positive train control systems on commuter railroads. This funding will phase out by FY 2018 as these activities are completed.
� Local Rail Facilities and Safety: $125 million is requested to reduce the impact of rail transportation in local communities through rail line relocation projects, highway-rail grade crossing enhancements, and investments in short line railroad infrastructure.
� Planning and Workforce: $75 million is requested to plan for future investments and to develop the workforce and tech - nology for advancing America’s rail industry.
► Safety and Operations: The President’s Budget requests nearly $204 million to support FRA’s rail safety and development programs, an
increase of nearly $17 million from FY 2015 enacted. This request will allow FRA to address today’s three most pressing issues:
� Increasing movement of crude oil and other energy products including ethanol and lique-fied natural gas: FRA requests 45 new staff dedicated to the Department’s Safety Trans-portation of Energy Products program, funds to continue automated track inspections of crude routes, and resources to train employees of short line railroad that haul energy products.
� Passenger rail safety issues that surface in the wake of the Metro-North accidents: FRA requests 15 new staff to implement legisla-tively mandated risk reduction programs for the Nation’s commuter and intercity passenger rail operators and to conduct comprehensive compliance and safety culture reviews of passenger railroads.
� Highway-rail grade crossing and pedestrian safety: FRA requests 24 new safety staff to conduct nationwide community outreach to reduce grade crossing and trespassing deaths, which account for 98 percent of rail-related fatalities.
► Research and Development: The President’s Budget requests $39.2 million for safety-related research and development activities, including continued support for the Short Line Safety Institute and research on the safe transportation of liquefied natural gas.

B U D G E T H I G H L I G H T S | F I S CA L Y E A R 2 0 1 6 3 1
FEDERAL RAILROAD ADMINISTRATION
FEDERAL RAILROAD ADMINISTRATION AMERICA BENEFITS BY…
� Making rail safer: Safety is the FRA’s top priority. Since FY 2005, total train accidents have declined by 46 percent, total derail-ments have declined by 47 percent, and total highway-rail grade crossing accidents have declined by 24 percent. This is due in large part to FRA’s comprehensive safety strategy, which fosters a strong railroad safety culture and continuous safety improvement.
� Improving passenger rail service: Because of FRA’s recent investments, 6,000 rail cor-ridor miles are being improved, 30 stations are being upgraded, and hundreds of new passenger cars and locomotives are being procured. These projects will improve the customer experience by reducing trip times, improving reliability, adding additional fre - quencies, and making stations and equipment more comfortable and accessible. These proj - ects represent the foundational elements to fulfill the long-term vision for sustainable rail improvements envisioned by the States, Amtrak, and other stakeholders. The FRA
and its partners have strategically invested in planning studies to establish a pipeline of much-needed future rail projects. The FY 2016 President’s Budget request will support market-based investments to turn these studies into additional improved and new services.
� Supporting freight rail: The Nation’s 140,000-mile freight rail network is the most well-developed and cost-efficient in the world. Freight rail is also significantly more energy-efficient per ton-mile than truck. As the U.S. population grows, the U.S. freight systems will be called upon to meet the demands of a larger population. Between 2010 and 2035, the U.S. freight system is expected to move 22 percent more freight. FRA implements innovative programs that provide for community mit-igation, research and development, policy analysis, and guidance for the freight rail industry and its stakeholders.

U . S . D E PA R T M E N T O F T R A N S P O R TAT I O N3 2
FEDERAL AVIATION ADMINISTRATION
FEDERAL AVIATION ADMINISTRATION
FEDERAL AVIATION ADMINISTRATION
AccountFY 2014
ActualFY 2015 Enacted
FY 2016 President’s
Budget
Operations $ 9,651.4 $ 9,740.7 $ 9,915.0
General Fund (non-add) [3,156.2] [1,145.7] [1,368.0]
Trust Fund (non-add) [6,495.2] [8,595.0 ] [8,547.0]
Facilities & Equipment (TF) 2,600.0 2,600.0 2,855.0
Research, Engineering & Development (TF) 158.8 156.8 166.0
Grants-in-Aid for Airports (TF) 3,350.0 3,350.0 2,900.0
Total $15,760.2 $15,847.5 $15,836.0
Rescission – 26.2 0 0
Direct FTE 42,878 44,213 44,333
Dollars in Millions
OVERVIEW
The Federal Aviation Administration (FAA)
maintains and operates the National Airspace
System (NAS) and regulates its safety. The
FY 2016 President’s Budget request of $15.8
billion supports FAA’s current programs in
the areas of air traffic controller and safety
staffing, research and development, and
capital investment. The Budget also advances
the modernization of our air traffic system
through “NextGen”—the next generation of
air traffic control technology. NextGen will
enable the FAA to build upon current capa-
bilities and lay the groundwork for future
technologies that will improve the safety,
capacity, and efficiency of air travel by replac-
ing ground-based radar surveillance with a
modern satellite-based system. NextGen also
capitalizes on the latest in aircraft technology.

B U D G E T H I G H L I G H T S | F I S CA L Y E A R 2 0 1 6 3 3
FEDERAL AVIATION ADMINISTRATION
SUMMARY OF REQUEST
The President is requesting $15.8 billion in FY 2016 to invest in the safest, most efficient aerospace system in the world. This request is an investment in the future of aviation, an industry that accounts for more than 5 percent of our Nation’s gross domestic prod-uct. It is a responsible and necessary investment in critical capital infrastructure and the ongoing deploy - ment of NextGen technologies. This allows FAA to safely integrate new entrants such as unmanned vehicles and increasing numbers of commercial space launches into the NAS. The proposal will increase capital investments while decreasing FAA’s overall Budget by reshaping the airport financing system. This transformation focuses Federal grant dollars on airports that need it most, while providing for increased investment opportunity in airport infra-structure. Major program highlights of the FAA’s Budget request include:
► Operations: The President’s Budget requests $9.92 billion for the operation, maintenance, communications, and logistical support of the air traffic control and air navigation systems. This represents an increase of 2 percent above the FY 2015 enacted level. Included in the Oper-ations request are the following:
� Air Traffic Organization (ATO): ATO accounts for $7.5 billion of the total Operations request, of which $5.4 billion is associated with pay-roll costs. The Budget request includes $11.7 million for discretionary increases, including $7.5 million for transition costs associated with the Terminal Automation Modernization and Replacement (TAMR) program.
� Aviation Safety Oversight (AVS): $1.3 billion is requested overall for aviation safety. Within this amount, $21.3 million and 85 FTEs are requested to hire additional aviation
safety inspectors and engineers for sur-veillance and certification services, as well as to provide continued support for develop-ment and implementation of procedures and training for Unmanned Aircraft, Risk Based Decision Making, and Designee Management Oversight. The request includes $11.5 million and 54 FTEs for increased surveillance and oversight of commuter and on-demand operators, repair stations, and manufac-turers; $5.3 million and 29 FTEs to support the increased demand for FAA aircraft, oper - ator, and airmen certification services; and $4.5 million and 2 FTEs for FAA’s Safety Management System. The AVS request also includes funding for oversight and training for designee supervision and the integration of manned and unmanned aircraft into the NAS. The staffing request is aligned with the forecasted staffing requirements included in the AVS Workforce Plan.
� Security Review: As a result of the compre-hensive security review conducted after the Chicago Air Route Traffic Control Center (ZAU) fire incident on September 26, 2014, FAA is requesting $8.8 million and 18 FTEs to implement facility and personnel security recommendations for FAA’s critical opera-tional facilities.
� Commercial Space: In FY 2015, FAA antic-ipates there will be up to 30 commercial space launches, an increase of 11 over the 19 that occurred in FY 2014. The FAA believes that this industry will continue to grow, and this Budget includes one program increase for the Office of Commercial Space Transporta-tion (AST). The request includes an increase

U . S . D E PA R T M E N T O F T R A N S P O R TAT I O N3 4
FEDERAL AVIATION ADMINISTRATION
of $1.3 million and 13 FTE for license and permit determinations, certifications, and technical outreach.
� NextGen Organization (ANG): The NextGen organization represents $60.6 million of the request. There are no programmatic increases in the Operations Appropriation for this organization.
► Facilities and Equipment (F&E): The President’s Budget requests $2.86 billion to enable FAA to meet the challenge of both maintaining the capacity and safety of the current NAS while continuing its comprehensive system modern-ization and transformation. This request is an almost 10-percent increase over the FY 2015 enacted level, to bolster our investments in the Nation’s aviation infrastructure.
� Within these funds, the FY 2016 President’s Budget requests $845 million for NextGen capital related investments, an increase of $53 million above FY 2015 enacted levels. The requested funding will enable FAA to continue its ongoing modernization efforts. Examples of specific projects include:
§ Performance-Based Navigation: $13 million is requested to optimize the use of airspace and procedures in the metroplex areas.
§ En Route Automation Modernization System Enhancements and Technology Refresh: $79 million is requested to provide enhance-ments to the automation system that are based upon user experience. Improve-ments in the efficiency and effectiveness of air traffic management and reduction in operational errors are the expected outcomes of this investment.
§ Automatic Dependent Surveillance Broadcast (ADS-B): $45 million is requested for the continued implementation of satellite- based surveillance capabilities in the Con - tinental United States, the Gulf of Mexi-co, and Alaska. This will provide a more complete picture of airspace conditions and more accurate position data that will result in increased capacity, fewer delays, and more optimal routing for aircraft. $139 million will provide the funding for the satellite subscription services.
§ Air-to-Ground Data Communications (DataComm): $235 million is requested for data communications, to deploy a text-based data communication system in both the Terminal and En Route domains. This program will enable air traffic con-troller productivity improvements and will permit capacity growth without requisite cost growth associated with equipment, maintenance, and labor.
§ System-Wide Information Management (SWIM): $37 million is requested to con-tinue the implementation of an informa-tion management and data sharing system for improved data sharing for FAA’s internal and external stakeholders. This program will provide policies and stand-ards to support data management, secure its integrity, and control its access and use.
§ Time Based Flow Management (TBFM): $43 million is requested to maximize traffic flow and airport usage by improv-ing flow management into and out of the busy metropolitan airspaces and corre-sponding airports. Operations will achieve maximum throughput while facilitating efficient arrival and departure.

B U D G E T H I G H L I G H T S | F I S CA L Y E A R 2 0 1 6 3 5
FEDERAL AVIATION ADMINISTRATION
§ Flight and Interfacility Air Traffic Control Data Interface Modernization: $9 million is requested for the first year of funding to modernize the exchange of flight data between the En Route Automation System and other Terminal and Oceanic systems. The funding recommendation for this program originated from the 30-day com - prehensive review conducted after the Chicago Air Route Traffic Control Center (ZAU) fire incident on September 26.
� The remainder of the investment, $2.0 billion, will be in legacy areas to sustain current systems, including maintaining aging infra-structure, power systems, information tech-nology, navigational aids, communications, surveillance, and weather systems. Examples of specific projects include:
§ Air Traffic Control Facilities Strategic Sus-tainment Plan: $464 million is requested for an effort that will advance the state of good repair for FAA infrastructure facilities. This undertaking will target funding toward a portfolio of programs that include FAA Air Route Traffic Control Centers (ARTCCs), Air Traffic Control Facilities (ATCTs), and Terminal Radar Approach Control Facilities (TRACONs). Electrical Power Systems, Unmanned Infrastructure Facilities, Employee Pro-tection, Environmental Programs at FAA Facilities, and temporary facilities used for responses to emergency and heavy air traffic situations are also included. The funding under this portfolio of programs will improve and maintain the facility condition index ratings at FAA facilities that provide the backbone for the NAS systems and functionality.
§ Terminal Automation Modernization/ Replacement: $159 million is requested to modernize and standardize the auto-mation systems at the FAA’s TRACON facilities and their associated ATCT throughout the NAS.
► Research, Engineering and Development: The President’s Budget requests $166 million for Research, Engineering, and Development in FY 2016 to support the continuation of work in both NextGen and other research areas such as environmental impacts, safety, propulsion and fuel systems, unmanned aircraft, advanced mate-rials, and weather. This represents an increase of 5.7 percent over the FY 2015 enacted level.
� NextGen Alternative Fuels for General Aviation: $6 million is requested to support continued efforts and industry partnerships to transition from current aviation 100 low-lead fuel to an unleaded replacement fuel that will have the least impact on the General Aviation Fleet.
� Unmanned Aircraft System Research: $9.6 million is requested to support research on UAS technologies, which directly impact the safety of the NAS. As detailed in the UAS Roadmap for Integration and the interagency UAS Integration Comprehensive Plan, FAA’s FY 2016 research will be focused on detect-ing and avoiding, control and communica-tions, systems safety criteria, modeling and simulation requirements and research that will support the safe, efficient, and timely integration of UAS in the NAS.
� NextGen—Environmental Research— Aircraft Technologies, Fuels, and Metrics: $24 million is requested to achieve NextGen goals of increased mobility by reducing

U . S . D E PA R T M E N T O F T R A N S P O R TAT I O N3 6
FEDERAL AVIATION ADMINISTRATION
environmental impacts of aviation in absolute terms, including those relating to community noise, air quality, and global climate change. The program is focused on maturing aircraft technologies that can reduce aircraft noise, emissions that degrade air quality, green-house gas emissions, and energy use and advancing alternative jet fuels.
� Commercial Space Transportation Safety: $3 million is requested for this effort, requir-ing several aspects of safety to be defined and studies to be completed. Researchers are developing methodologies and tools to estab-lish regulatory standards on the Commercial Space Transportation programs to address hazards to the public that could result from catastrophic failures, human space flight participants’ responses to space flight, the introduced use of new materials, the novel use of existing materials, and integration of space flight into the NAS.
► Grants-in-Aid for Airports (AIP): The Presi-dent’s Budget requests a $2.9 billion obligation limitation for AIP, a decrease of $450 million from the FY 2015 enacted level.
� To assist those airports that need the most help, the Budget proposes to focus Federal grants to support smaller commercial and general aviation airports that do not have access to additional revenue or other out-side sources of capital.
� At the same time, the Budget proposes to increase the Passenger Facility Charge (PFC) limit from $4.50 to $8.00 for all commercial service airports and eliminate guaranteed AIP entitlement funding for large hub airports, giving them greater flexibility to generate their own revenue.
� The combination of these two proposed changes to the AIP and PFC programs will allow for higher levels of infrastructure fund-ing at our Nation’s airports.

B U D G E T H I G H L I G H T S | F I S CA L Y E A R 2 0 1 6 3 7
FEDERAL AVIATION ADMINISTRATION
FACILITIES & EQUIPMENT PROGRAMS
FY 2014Enacted
FY 2015Enacted
FY 2016President’s
Budget
Activity 1—Engineering, Development, Test and Evaluation $ 347 $ 178 $ 151
Advanced Technology Development and Prototyping 32 30 21Performance Based Navigation & Metroplex Portfolio 0 27 13Performance Based Navigation/RNAV/RNP 32 0 0William J. Hughes Technical Center Programs 17 25 32Data Communications (Moved to Activity 2 in FY2015) 115 0 0Other NextGen Portfolios 151 96 85
Activity 2—Air Traffic Control Facilities and Equipment 1,437 1,578 1,671
En Route Automation Modernization (ERAM) 67 11 0En Route Automation Modernization (ERAM)—System Enhancements & TR 35 45 79System-Wide Information Management 67 60 37ADS-B NAS Wide Implementation 282 255 45Oceanic Automation System 5 4 20Facilities Infrastructure Sustainment 295 336 418Terminal Automation 201 197 240Air Traffic Management (ATM)—including Commercial Space 14 6 14Data Communications in Support of NG Air Transportation System 0 150 235Improved Voice Communications 56 61 72National Airspace System Voice System (NVS) 16 21 54Runway Status Lights 35 42 24Wide Area Augmentation System (WAAS) for GPS 84 99 81Runway Safety Areas—Navigational Mitigation 38 35 30GPS Civil Requirements 6 10 27Collaborative Air Traffic Management Technologies WP2 & WP3 28 13 10Time Based Flow Management Portfolio 11 21 43Surveillance Interface Modernization 6 4 23Contingency Funding—Flight and Interfacility ATC Data Interface Modernization 0 0 9Improve Weather Systems 30 42 32Improve Surveillance Systems 53 48 35Landing and Navigation 37 39 34Other 73 81 111
Activity 3—Non-Air Traffic Control Facilities and Equipment 147 158 171
Hazardous Materials Management 19 22 26National Air Space (NAS) Recovery Communications (RCOM) 12 12 12Facility Security Risk Management 15 14 15Information Security 13 12 12Aeronautical Center Infrastructure Modernization 9 13 15Safety Database and Computer Systems 66 70 75Other 13 15 16
Activity 4—Facilities and Equipment Mission Support 218 226 226
Center for Advanced Aviation System Development (CAASD) 60 60 60Facility Leases 60 62 66Technical Support Contracts 74 74 77Logistics and Acquisition Support Services 12 12 11Other 13 19 12
Activity 5—Personnel and Related Expenses 450 460 470
Activity 6—ADS-B Services and WAAS GEOs 0 0 166
Total $2,600 $2,600 $2,855
Dollars in Millions

U . S . D E PA R T M E N T O F T R A N S P O R TAT I O N3 8
FEDERAL AVIATION ADMINISTRATION
NEXTGEN PROGRAMS
FY 2014Enacted
FY 2015Enacted
FY 2016President’s
Budget
Facilities and Equipment $828 $792 $845
NextGen—Separation Management Portfolio — 13 27NextGen—Improved Surface/TFDM Portfolio — 39 17NextGen—On Demand NAS Portfolio — 6 11NextGen—Environment Portfolio — 6 1NextGen—Improved Multiple Runway Operations Portfolio — 6 8NextGen—NAS Infrastructure Portfolio — 14 11NextGen—Support (NIAC, Test Bed) Portfolio — 13 10NextGen—System Safety Management Portfolio — 19 17Performance Based Navigation and Metroplex Portfolio — 27 13Collaborative Air Traffic Management Technology (CATMT) Portfolio 28 13 10Tactical Flow Time Based Flow Management (TBFM) Portfolio 11 21 43NextGen—Communications in Support of NextGen 115 150 235NextGen—Demonstration and Infrastructure Development 20 — —NextGen—System Development 58 — —NextGen—Trajectory Based Operations 16 — —NextGen—Reduce Weather Impact 3 — —NextGen—High Density Arrivals/Departures 5 — —NextGen—Collaborative ATM 20 — —NextGen—Flexible Terminals and Airports 13 — —NextGen—System Network Facilities 5 — —NextGen—Future Facilities 10 — —Performance Based Navigation—Optimization of Airspace and Procedures for Metroplex (OAPM) 32 — —En Route Automation Modernization (ERAM)—System Enhancements and Tech Refresh 35 45 79System-Wide Information Management (SWIM) 67 60 37ADS-B NAS Wide Implementation 282 255 45Colorado ADS-B WAM Cost Share 3 — —Next Generation Weather Processor (NWP) 11 23 7NAS Voice System (NVS) 16 21 54Terminal Flight Data Manger (TFDM) 19 — —Aviation Safety Information Analysis and Sharing (ASIAS) 15 — —Aeronautical Information Management Program (AIM Segment 2) 9 13 5Cross Agency NextGen Management — 2 3Flight and Interfacility ATC Data Interface Modernization (FIADIM) — — 9ADS-B Subscription Costs (separate line item for the first time in FY2016) — — 139Activity 5 F&E PCB&T—NextGen Staffing * 33 47 64
Research Engineering and Development (RE&D) 58 51 61
Unmanned Aircraft Systems Research — — 10NextGen—Alternative Fuels for General Aviation 6 6 6NextGen—Advanced Systems and Software Validation 1 — —NextGen—Wake Turbulence 9 9 9NextGen—Air Ground Integration 11 10 9NextGen—Weather in the Cockpit 4 4 4NextGen—Environmental Research, Aircraft Technologies, Fuels and Metrics 27 23 24
Operations 15 14 51
Performance Based Navigation (PBN) Metroplex Activities — — 14Unmanned Aircraft System Certification and Integration — — 8Integrate Environmental Performance into NextGen 1 1 —NextGen Environmental/Noise Studies 2 2 —NextGen Staffing * 12 12 29
Total NextGen Programs $901 $857 $956
Dollars in Millions
Note: NextGen PC&B has been increased by a rebaselining of staffing and the inclusion of 26 AVS and 4 ATO UAS positions that have been moved under the NextGen Portfolio for the first time in FY2016.

B U D G E T H I G H L I G H T S | F I S CA L Y E A R 2 0 1 6 3 9
FEDERAL AVIATION ADMINISTRATION
FEDERAL AVIATION ADMINISTRATIONAMERICA BENEFITS BY…
The FAA serves the flying public by operating a system that:
� Operates 24 hours a day, 7 days a week, 365 days a year.
� Operates and maintains facilities and equip-ment at almost 13,000 sites nationwide.
� Maintains FAA-operated or FAA-contracted towers at more than 500 airports.
� Inspects and certifies approximately 202,000 U.S. civil aircraft, and 600,000 pilots and 540 commercial airports.
� Transports more than 739 million passen-gers annually on U.S. carriers.
� Safely guides approximately 25 million flights every year.
� Generates more than 11.8 million jobs, with earnings of $459 billion.
� Contributes $1.5 trillion annually to the national economy and constitutes 5.4 per-cent of the gross domestic product.
The FAA provides:
� A workforce of more than 45,000 profes-sionals to operate and maintain the busiest, most complex air traffic control system in the world.
� Grants to improve 3,330 eligible public-use airports in the United States.
� Protection of the public, property, and the national security and foreign policy interests of the United States during commercial space launch and reentry activities.

U . S . D E PA R T M E N T O F T R A N S P O R TAT I O N4 0
PIPELINE AND HAZARDOUS MATERIALS SAFETY ADMINISTRATION
PIPELINE AND HAZARDOUS MATERIALS SAFETY ADMINISTRATION
AccountFY 2014
ActualFY 2015 Enacted
FY 2016 President’s
Budget
Pipeline Safety (PSF/GF/TF) $118.6 $145.5 $175.1
Hazardous Materials Safety (GF) 45.0 52.0 64.3
Emergency Preparedness Grants (TF) 26.3 26.2 28.3
Operational Expenses (GF) 20.2 20.7 21.0
Total $210.0 $244.5 $288.7
Direct FTE 418 548 635
Dollars in Millions
OVERVIEW
The Pipeline and Hazardous Materials Safety
Administration (PHMSA) ensures the safe
transportation of hazardous materials through
regulation and oversight. This includes liquids
and natural gas traveling through a network
of 2.6 million miles of pipelines, serving over
69 million residential and commercial cus-
tomers. PHMSA also oversees the safe and
secure shipment of approximately 1 million
daily movements of explosive, poisonous,
corrosive, flammable, and radioactive hazard-
ous materials carried by rail, air carriers, and
other modes of transportation. On any given
day, more than 6 million tons of hazardous
materials safely move millions of miles across
the Nation’s land, water, and air transporta-
tion corridors. The FY 2016 President’s Budget
requests $289 million to support PHMSA’s
mission to safeguard the movement of these
materials.

B U D G E T H I G H L I G H T S | F I S CA L Y E A R 2 0 1 6 4 1
PIPELINE AND HAZARDOUS MATERIALS SAFETY ADMINISTRATION
SUMMARY OF REQUEST
The President is requesting $289 million in FY 2016 to invest in the safe transportation of hazardous materials including energy products through PHMSA’s oversight. This is an increase of $44.2 million and 87 FTEs above the FY 2015 enacted funding level. This funding will support Pipeline Safety, Hazardous Materials Safety, Emergency Preparedness Grants, and Operational Expenses as follows:
► Pipeline Safety: The FY 2016 President’s Budget overall pipeline safety request of $175 million would allow PHMSA to carry out activities to re duce pipeline failures and their consequences. These include:
� $2 million for the Design Review Fund as an offset for discretionary spending on program costs for review of pipeline facilities projects with design and construction costs of $2.5 billion or more, or uses new or novel tech-nologies or design. This is a change to the current legislation to make this a discretion-ary offsetting collection.
� $12 million for the National Pipeline Information Exchange (NPIX) initiative to integrate Federal and State inspection data into a consolidated repository facilitating improvements in pipeline material integrity and assisting in pinpointing vulnerabilities and trends.
► Hazardous Materials Safety: The President’s Budget requests $64 million to sustain the essential safe and efficient movement of haz-ardous materials across the country and to respond to emerging threats such as transport of energy products by rail, movement of liquefied
natural gas, last year’s disposal of waste from the Ebola epidemic, and the containment and movement of highly explosive byproducts of fracking and other energy production methods. The request includes:
� $4.4 million for 20 FTEs to include addi-tional inspection and enforcement personnel to continue regular hazardous materials inspection activities while also addressing the safe transport of energy products and preparing for new risks that will emerge in the future.
� $1.7 million for training and outreach to enhance the safe transport of flammable liquids by ensuring shippers and carriers are taking all the required precautions to trans-port these liquids safely.
� $3.3 million for the Risk Management Frame - work and 6 FTEs to enhance risk management capabilities in Phase 2 of the RMF, focusing on GAO and industry group concerns regarding rulemakings, policy, and enforcement actions that rely on the agency’s incident data and risk management methodology.
� $500 thousand to develop inspection methods for manufacturing analysis and requalifica-tion of composite packaging. In addition this funding will support research toward eval-uating package integrity, filling procedures, and equipment.
� $12 million in fees to offset current costs of administering the Special Permits and Approval process for transporters seeking exemptions to the Hazardous Materials Regulations.

U . S . D E PA R T M E N T O F T R A N S P O R TAT I O N4 2
PIPELINE AND HAZARDOUS MATERIALS SAFETY ADMINISTRATION
PIPELINE AND HAZARDOUS MATERIALS SAFETY ADMINISTRATION AMERICA BENEFITS BY…
� In FY 2014, the Pipeline Safety program con - ducted 1,405 pipeline inspections, issued 234 enforcement actions, including propos - ing a total of $5,731,000 in civil penalties, awarded 138 grants to 50 States and other entities, provided training to students in pipeline inspection, funded 18 research and development projects, opened 162 enforcement cases, and collected penalties of nearly $4 million.
� In FY 2014, the Hazardous Materials Safety program focused on high-risk safety issues and conducted 1,227 hazmat inspections, educated over 3,000 State and local partners through multi-modal seminars, awarded 67 grants to 50 States and other entities including tribes, and funded 11 research and development projects. The program opened 120 new enforcement cases dur-ing the year and closed 415 enforcement actions with a total penalty amount of $1.7 million.
► Emergency Preparedness Grants: The Presi-dent’s Budget requests $28 million for Emergency Preparedness Grants for those first responders engaged in reducing the risks of incidents involv - ing the transport of hazardous materials through our communities.
► Operational Expenses: The President’s Budget requests $21 million for operational expenses to support the administrative functions that assist both the pipeline safety and hazardous materials safety programs in their day-to-day activities.

B U D G E T H I G H L I G H T S | F I S CA L Y E A R 2 0 1 6 4 3
THE GROW AMERICA ACT: THE ADMINISTRATION’S SURFACE TRANSPORTATION REAUTHORIZATION PROPOSAL
MARITIME ADMINISTRATION
MARITIME ADMINISTRATION
AccountFY 2014
ActualFY 2015 Enacted
FY 2016 President’s
Budget
Operations and Training (GF) $148.0 $148.1 $184.6
Ship Disposal Program (GF) 4.8 4.0 8.0
Maritime Security Program (GF) 186.0 186.0 186.0
Food Aid Reform 0 0 25.0
Maritime Guaranteed Loan Program (GF) 38.5 3.1 3.1
Total $377.3 $341.2 $406.8
Direct FTE 463 507 514
Dollars in Millions
OVERVIEW
The Maritime Administration (MARAD) im ple -
ments programs that promote the viability
of the U.S. Merchant Marine and strengthen
the U.S. maritime transportation system to
support the national security needs of the
Nation. The FY 2016 President’s Budget
requests $406.8 million to support MARAD
activities in ships and shipping, port
operations, vessel operations, national secu-
rity and strategic mobility, ship disposal, the
environment, and education. Through the
United States Merchant Marine Academy and
support for six State maritime schools, MARAD
educates most of the new skilled merchant
marine officers committed to national service
in both peace and war.

U . S . D E PA R T M E N T O F T R A N S P O R TAT I O N4 4
MARITIME ADMINISTRATION
SUMMARY OF REQUEST
The President is requesting $406.8 million in FY 2016 to invest in continued support for MARAD’s coordinated program of activities and initiatives as described below:
► Operations and Training: The FY 2016 Presi-dent’s Budget requests $184.6 million to sup-port the United States Merchant Marine Academy (USMMA), the State Maritime Academies (SMAs), and MARAD Operations and Programs.
� United States Merchant Marine Academy: $96 million is requested to continue to sup-port the highest standards of excellence in education for the Midshipmen, including $71.3 million for operating expenses and $24.7 million to make major capital repairs and improvements to the Academy’s physical campus.
� State Maritime Academies (SMAs): $34.6 million is requested to support the SMAs, including $22 million for maintenance and repair of the school ships, $5 million for national security multi-mission vessel design, $3 million for direct support payments to each of the six schools, $2.4 million for student tuition support, $1.8 million for training ship fuel assistance payments, and $350 thousand for the Mariner Service Compliance System.
� MARAD Operations and Programs: $54.1 million is requested to provide operational support for the agency’s programs. This request includes $4 million to maintain envi - ronmental program and technical assistance.
► Ship Disposal Program: The FY 2016 President’s Budget requests $8 million to support continued obsolete vessel disposal actions, with priority emphasis on the worst condition non-retention vessels in MARAD’s three reserve fleet sites.
► Maritime Security Program: The FY 2016 Pres - ident’s Budget requests $186 million for the Maritime Security Program (MSP) to ensure the maintenance of a commercial fleet capable of supporting a U.S. presence in foreign commerce, while also ensuring the military’s ability to obtain assured access to these commercial vessels, inter-modal facilities, and mariners. The $186 million authorized level will fund $3.1 million for each of the 60 ships enrolled in the program.
► Food Aid Reform: $25 million is also included as a component of reforms proposed for P.L. 480 Title II Food Assistance to mitigate the impact these reforms could have on sealift capacity and mariner jobs. If enacted, this new initiative would provide funds to preserve mari-ner employment on U.S.-flag vessels and identify other innovative means to encourage retention of U.S. mariners and vessels.
► Maritime Guaranteed Loan Program (Title XI): The FY 2016 President’s Budget requests $3.1 million to maintain staff salaries and benefits for administration of the Title XI loan portfolio.

B U D G E T H I G H L I G H T S | F I S CA L Y E A R 2 0 1 6 4 5
MARITIME ADMINISTRATION
MARITIME ADMINISTRATIONAMERICA BENEFITS BY…
� The Maritime Security Program (MSP) is a cost-effective way to provide assured access to sealift capability during times of war, national emergencies, and other national requirements. The $186 million program cost provides access to over $52 billion of assets that would be required to replicate the sealift capability. Additionally, the MSP fleet provides employment for 2,400 mer-chant mariners.
� MARAD’s U.S. Merchant Marine Acad - emy (USMMA) and the six State Maritime Academies (SMA) provide the training and education to ensure qualified person-nel are available to maintain the Nation’s pool of U.S. Coast Guard licensed mer-chant marine officers to serve the national security needs of the Nation. All of the
Department of Defense’s sealift cargo is carried on U.S. flagged vessels when avail-able, which are crewed by civilian mariners. Additionally, approximately 25 percent of USMMA graduates and 4 percent of SMA graduates serve on active duty in the U.S. Armed Forces.
� MARAD Ship Disposal program provides the timely disposition of Government- owned obsolete ships. Timely disposal of deteriorating ships lessens public environ-mental risk and reduces costly environmental cleanup.
� MARAD maintains a fleet of cargo ships in reserve to provide surge sealift for the Department of Defense during war and national emergencies.

U . S . D E PA R T M E N T O F T R A N S P O R TAT I O N4 6
SAINT LAWRENCE SEAWAY DEVELOPMENT CORPORATION
SAINT LAWRENCE SEAWAY DEVELOPMENT CORPORATION
AccountFY 2014
ActualFY 2015 Enacted
FY 2016 President’s
Budget
Operations and Maintenance (Harbor Maintenance Trust Fund) $31.0 $32.0 $36.4
Total $31.0 $32.0 $36.4
Direct FTE 131 144 144
Dollars in Millions
OVERVIEW
The Saint Lawrence Seaway Development
Corporation (SLSDC) is responsible for opera -
ting and maintaining the U.S. portion of the
binational St. Lawrence Seaway, including
two U.S. Seaway locks, while also performing
environmental management activities and
promoting regional economic development.
The St. Lawrence Seaway, connecting the Great
Lakes to the Atlantic Ocean for commercial
trade, is jointly operated by the United States
(SLSDC) and Canada (St. Lawrence Seaway
Management Corporation). The President’s
Budget request of $36.4 million will provide
funds necessary for the SLSDC to perform its
core mission of serving the U.S. intermodal
and international transportation system while
providing and promoting a safe, reliable,
efficient, and environmentally responsible
deep-draft waterway.

B U D G E T H I G H L I G H T S | F I S CA L Y E A R 2 0 1 6 4 7
SAINT LAWRENCE SEAWAY DEVELOPMENT CORPORATION
SUMMARY OF REQUEST
The President is requesting $36.4 million in FY 2016 to support the continued safe and efficient opera - tion of the U.S. portion of the St. Lawrence Seaway, including the two U.S. Seaway locks in Massena, New York. This request provides an increase of $4.4 million above the FY 2015 enacted level.
► The FY 2015 President’s Budget request will con-tinue the SLSDC’s multi-year Asset Renewal Program (ARP) at a level of $18.2 million and
fund expenses associated with operating and maintaining the U.S. portion of the binational St. Lawrence Seaway at $18.3 million.
► Major ARP projects proposed include the instal - lation of a new hands-free vessel vacuum moor - ing system that will use similar technology to what is currently being installed at the Canadian Seaway locks (at a cost of $8 million).
SAINT LAWRENCE SEAWAY DEVELOPMENT CORPORATIONAMERICA BENEFITS BY…
� The Saint Lawrence Seaway Development Corporation programs impact 227,000 U.S. and Canadian jobs, $35 billion in transportation-related business revenue, $14 billion in personal income, and $5 bil lion in Federal, State, provincial, and local taxes each year.
� The Saint Lawrence Seaway directly serves an eight-State region that accounts for 28 per - cent of the U.S. gross domestic product (GDP), accounts for 50 percent of North America’s manufacturing and service industries, and is home to nearly one-quarter of the conti-nent’s population. The Great Lakes region is the world’s fourth largest economy with annual economic output of nearly $5 trillion.
� Annual commerce on the Great Lakes Seaway System typically exceeds 180 million metric tons and serves U.S. miners, farmers, factory workers, and commercial interests from the Great Lakes region. Virtually every type of
bulk and general cargo commodity moves on the Great Lakes Seaway System, includ - ing iron ore for the U.S. steel industry; lime - stone for construction and steel industries; coal for power generation and steel produc-tion; grain exports from U.S. farms; general cargo, such as iron and steel products and heavy machinery; and cement, salt, and stone aggregates for agriculture and industry.
� The Great Lakes Seaway System is America’s green transportation corridor. With superior fuel efficiency and fewer greenhouse gas emis - sions per metric ton than trucking or rail, Seaway shipping leads the way in environ-mentally smart transportation. The Great Lakes/Seaway fleet is nearly 7 times more fuel-efficient than trucks and 1.14 times more fuel-efficient than rail. Moreover, it would take 3 million railcars or 7.1 million trucks to carry the total cargo transported by the Great Lakes/Seaway fleet.

U . S . D E PA R T M E N T O F T R A N S P O R TAT I O N4 8
OFFICE OF THE SECRETARY
OFFICE OF THE SECRETARY
OFFICE OF THE SECRETARY
AccountFY 2014
ActualFY 2015 Enacted
FY 2016 President’s
Budget
Salaries and Expenses (GF) $ 107.0 $ 105.0 $ 113.7
Office of Civil Rights (GF) 9.6 9.6 9.7
Transportation, Planning, Research and Development (GF) 7.0 6.0 10.0
Minority Business Resource Center (GF) 1.0 1.1 0.9
Small and Disadvantaged Business Utilization and Outreach (GF) (formerly Minority Business Outreach)
3.1 3.1 4.5
Payments to Air Carriers/Essential Air Service (estimated obligations) (GF/TF)
267.9 263.2 283.4
Financial Management Capital (GF) 7.0 5.0 5.0
Cyber Security (GF) 4.5 5.0 8.0
Research and Technology (GF) 14.8 13.0 14.6
Safe Transportation of Energy Products (GF) 0 0 5.0
Interagency Infrastructure Permitting Improvement Center (GF) 0 0 4.0
U.S. Digital Services (GF) 0 0 9.0
DATA Act Compliance (GF) 0 0 3.0
Transportation Investments Generating Economic Recovery Grants (TIGER) (GF/TF)
600.0 500.0 1,250.0
Total $1,021.9 $911.0 $1,720.8Transportation Planning, Research and Development (Cancellation of Budget Authority)
– 2.8 0 0
Direct FTE 569 669 773
Dollars in Millions
OVERVIEW
The Office of the Secretary (OST) is responsi-
ble for overall policy development, planning,
direction, and oversight of the Department
as well as administration of a broad array of
programs, ranging in size from the TIGER
grant program to the Minority Business
Resource Center loan guarantee program.
The FY 2016 President’s Budget request of
$1.7 billion includes funding for all existing
OST programs as well as several new ones.

B U D G E T H I G H L I G H T S | F I S CA L Y E A R 2 0 1 6 4 9
OFFICE OF THE SECRETARY
SUMMARY OF REQUEST
The FY 2016 President’s Budget requests $1.7 billion for the programs and activities of the Office of the Secretary (OST), which is $810 million above the FY 2015 enacted funding level. The request assumes $1.36 billion of mandatory funding, including con tract authority for the TIGER grant program that previously has been funded with discretionary appro - priations. It also requests $362 million of discretion - ary funding, including funding for infrastructure permitting process improvements and safe transpor-tation of energy products as well as establishment of a new Safety Oversight Office and a new Assistant Secretary for Infrastructure Investment.
► TIGER Grant Program: $1.25 billion of mandatory contract authority is included in the Administra-tion’s GROW AMERICA surface transportation reauthorization proposal for the TIGER grant program, a $750 million increase over the FY 2015 enacted appropriation. The program will continue to fund infrastructure projects of national and regional significance, planning grants, and award and oversight expenses. Included in the President’s Budget is a $1.25 billion obli-gation limitation on the TIGER grant program as well as a $1.25 billion liquidating cash appropri-ation.
► Research and Technology: $14.6 million is requested for the Office of the Assistant Secre-tary for Research and Technology to strengthen research functions across the Department by providing a prominent centralized focus on research and technology to improve col-laboration and coordination among Operating Administrations. The GROW AMERICA surface transportation proposal includes $29 million for
the Bureau of Transportation Statistics, which is housed within this Office, as well as $82 million for the University Transportation Centers grant program, which is administered by this Office.
► Safe Transportation of Energy Products: $5 million is requested to support the oversight and coordination of multi-modal prevention and response activities associated with the safe transportation of energy products. Additional funding for operational activities is included in the FY 2016 requests for the Federal Railroad Administration, Pipeline and Hazardous Mate-rials Safety Administration, and Federal Motor Carrier Safety Administration.
► Transportation Planning, Research and Devel-opment: $10 million is requested for activities and studies to support the Secretary’s responsi-bilities in the formulation of national transpor-tation policy. The FY 2016 President’s Budget includes $1 million for resilience planning technical assistance to provide assistance for incorporating climate resilience into State, local, and tribal community plans and $0.5 million to study future trends in shale development.
► Interagency Infrastructure Permitting Improve - ment Center: $4 million is requested for the Interagency Infrastructure Permitting Improve-ment Center to focus on reducing infrastructure permitting and review timelines by producing a faster, more efficient process with better, meas-urable outcomes. The President’s Budget also includes appropriations language allowing for the transfer of additional funding from other agencies to OST.
U . S . D E PA R T M E N T O F T R A N S P O R TAT I O N5 0
OFFICE OF THE SECRETARY
► Salaries and Expenses: $113.7 million is requested for the salaries and expenses of the Office of the Secretary. Included within this request is $2 million for a new Office of the Assistant Secretary for Innovative Finance that will assume responsibility for managing the Department’s credit programs. The request also includes $1 million for a new Office of Safety Oversight within the Office of the Under Sec-retary for Policy that will have oversight over all safety-related activity in the Department’s Oper-ating Administrations, with a particular focus on better integrating their safety activities.
► Small and Disadvantaged Business Utilization and Outreach: $4.5 million is requested for the activities of the Office of Small and Disadvantaged Business Utilization (OSDBU). This reflects the merger of $1.4 million previously included within the Salaries and Expenses appropria-tion and the $3.1 million Minority Business Outreach appropriation, both of which are administered by OSDBU.
► Essential Air Service: $175 million of discre-tionary funding is requested for the Essential Air Service program to supplement $108.4 million of mandatory funding from overflight fees col-lected by FAA. The Essential Air Service program ensures rural and isolated communities have access to the national air transportation system.
► Financial Management Capital: $5 million is requested to complete the final phase of its modernization initiative through the deploy-ment of a new reporting solution.
► Cyber Security: $8 million is requested to con - tinue improvements to the Department’s cyber security posture, planned security enhance-ments to the Department’s infrastructure, planned upgrades to DOT’s Wide Area Network, and maintenance and operation of the Department’s Continuous Monitoring solution.
► U.S. Digital Services: $9 million is requested to fund the cost of hiring digital service experts from outside the Government to form a digital services team to focus on transforming the Department’s digital services with the great-est impact on citizens and businesses so they are easier to use and more cost-effective to build and maintain.
► DATA Act Compliance: $3 million is requested to assist the Department in meeting the require - ments of the Digital Accountability and Trans-parency Act of 2014 (DATA Act), which include establishing and implementing Government-wide data standards for financial data to provide con sistent, reliable, and searchable data for easy public consumption.

B U D G E T H I G H L I G H T S | F I S CA L Y E A R 2 0 1 6 5 1
OFFICE OF THE SECRETARY
OFFICE OF THE SECRETARYAMERICA BENEFITS BY…
TIGER GRANT PROGRAM
� In 2014, DOT awarded the sixth round of funding from our TIGER program. In all, 72 projects from 46 States were selected for a total of $584 million in grants. These TIGER grants will help get innovative, multi-modal projects off the ground that would otherwise struggle to find support from traditional fund - ing sources. Awardees faced stiff competition; for this one round of funding, DOT received 797 applications requesting more than $9.5 billion. That’s an indication of the strong demand for innovative transportation in vest-ment across the Nation.
� Overall DOT has awarded approximately $4.1 billion in grants to 342 projects in all 50 States, the District of Columbia, and Puerto Rico. Each project is multi-modal, multi-jurisdictional or otherwise challeng-ing to fund through existing programs. The TIGER program enables DOT to use a rigor-ous process to select projects with exceptional benefits, explore ways to deliver projects faster and save on construction costs, and make investments in our Nation’s infrastructure that make communities more livable and sustainable.
ESSENTIAL AIR SERVICE
� The Essential Air Service (EAS) provides subsidized commercial air service to over 150 small and rural communities in the United States.
AVIATION ENFORCEMENT PROTECTION
� The Department of Transportation enforces aviation consumer protection and civil rights requirements by monitoring air carrier and ticket agent compliance and investigating and taking appropriate enforcement action for violations. For example, in 2014, the Aviation Enforcement Office took action resulting in over 35 enforcement orders assessing civil penalties of over $5.5 million.
� In addition, the Aviation Enforcement Office educates air consumers through publica-tions and responses to inquiries and accepts complaints. For example, in 2014, we received 13,079 complaints from consumers which were monitored, forwarded to air carriers and ticket agents for response, and, where appropriate, involved further investigation and enforcement action.
MINORITY BUSINESS RESOURCE CENTER
� Helps small business gain access to financ-ing to participate in transportation-related contracts. Provides firms with access to capital to grow and compete in the transportation marketplace.
MINORITY BUSINESS OUTREACH
� Works closely with prime contractors, pro-gram officials, and procurement officials to ensure maximum opportunities for small businesses to participate in DOT contracts and subcontracts.

U . S . D E PA R T M E N T O F T R A N S P O R TAT I O N5 2
OFFICE OF THE SECRETARY
OFFICE OF THE INSPECTOR GENERAL
OFFICE OF THE INSPECTOR GENERAL
AccountFY 2014
ActualFY 2015
Appropriated
FY 2016 President’s
Budget
Salaries and Expenses $85.6 $86.2 $87.5
Total $85.6 $86.2 $87.5
Direct FTE 393 422 425
Dollars in Millions
OVERVIEW
The Office of Inspector General (OIG) oper-
ates as an independent organization within the
Department of Transportation (the Department)
under the authority of The Inspector General
Act of 1978, as amended. The FY 2016 Presi-
dent’s Budget request of $87.5 million sup-
ports the OIG’s commitment to fully inform
Congress, the Department, and the public
of pressing transportation concerns and to
aggressively pursue individuals who defraud
the Government. The OIG’s independent and
objective oversight of the Department’s pro-
grams and activities provides the Secretary,
Congress, and the public with relevant anal-
yses necessary to improve the efficiency and
effectiveness of the Department’s operations.
The OIG’s work yields valuable recommen-
dations and findings that lead to better uses
of limited budgetary resources and supports
the Department in its objectives to achieve
and maintain a safe, efficient, and effective
transportation system.

B U D G E T H I G H L I G H T S | F I S CA L Y E A R 2 0 1 6 5 3
OFFICE OF THE INSPECTOR GENERAL
SUMMARY OF REQUEST
The President is requesting $87.5 million in FY 2016 to support the Office of Inspector General. This is $1.3 million above the enacted level for FY 2015. These additional funds will be used to cover anticipated increases in base costs including inflation, mandated pay adjustments, and will fund 3 additional FTEs to
enhance oversight of the Department’s safety programs. The amount requested for FY 2016 will support 410 base-funded FTEs, with carryover balances from the Disaster Relief Appropriations Act of 2013 estimated to fund an additional 15 personnel.
OFFICE OF THE INSPECTOR GENERAL AMERICA BENEFITS BY…
�In FY 2014, the Office of the Inspector General’s audit work resulted in 129 reports, 411 recommendations, and financial recom - mendations valued at more than $550 mil-lion. The OIG’s investigative work resulted in 58 indictments, 64 convictions, and more than $1.3 billion in fines, restitution, and recoveries. In total, OIG achieved a return on investment of $22 for every dollar appropriated to our office in FY 2014.
� In addition to these monetary recoveries, many of the OIG’s audits and investigations are aimed at achieving nonfinancial benefits—including improved transportation safety,
the Department of Transportation’s number one priority. For example, the OIG’s audit work includes the assessment of key safety areas, ranging from the Federal Railroad Administration’s oversight of hazardous materials transport by rail, the National High - way Traffic Safety Administration’s efforts to identify safety-related vehicle defects, and the Federal Aviation Administration’s air traffic controller staffing and productivity. Typical investigations supporting improved trans-portation safety include criminal evasion of commercial trucking out-of-service orders, substandard aviation parts, and transport of hazardous materials.

U . S . D E PA R T M E N T O F T R A N S P O R TAT I O N5 4
OFFICE OF THE INSPECTOR GENERAL
SURFACE TRANSPORTATION BOARD
SURFACE TRANSPORTATION BOARD
AccountFY 2014
ActualFY 2015 Enacted
FY 2016 President’s
Budget
Salaries and Expenses (GF) $29.7 $30.2 $31.3
Fees 1.3 1.3 1.3
Total $31.0 $31.4 $32.6
Direct FTE 124 147 152
Dollars in Millions
OVERVIEW
The Surface Transportation Board (STB) is
charged with promoting substantive and
procedural regulatory reform in the economic
regulation of surface transportation, provid-
ing an efficient and effective forum for the
resolution of disputes, and the facilitation of
appropriate business transactions.
The FY 2016 President’s Budget request of
$32.5 million will enable the STB to continue
its economic oversight of the rail industry
and the transportation of commodities by
pipeline other than oil and gas. The STB is
also responsible for certain non-licensing
regulation of motor and water carriers.

B U D G E T H I G H L I G H T S | F I S CA L Y E A R 2 0 1 6 5 5
SURFACE TRANSPORTATION BOARD
SUMMARY OF REQUEST
The President is requesting $32.5 million in FY 2016 for the Surface Transportation Board, to be financed by appropriations and the offsetting
collection of user fees. Of this amount, $1.25 mil -lion are user fees credited to the appropriation.
SURFACE TRANSPORTATION BOARD AMERICA BENEFITS BY…
� The Surface Transportation Board helps the public receive reliable service on Amtrak and helps the customers of the freight rail-roads receive reasonable rates and services.
� The Surface Transportation Board enables the public to influence changes in the rail industry by offering an opportunity for their comments in its proceedings.
� In order to ensure the development and continuation of a sound transportation system, the Surface Transportation Board adjudicates complaints about railroad rates and practices, reviews mergers and acquisi-tions, licenses the construction of new lines, and has regulatory oversight on the abandon - ment of old lines.
� The Surface Transportation Board provides the public with a forum for informal reso-lution of disputes, including mediation, arbitration, and a robust rail customer assis-tance program.
� The Surface Transportation Board protects the public interest in its regulation of certain non-rail matters: mergers and acquisitions in the intercity bus industry; rates charged by pipelines (except oil pipelines); household goods carrier tariffs; and rates and practices of ocean carriers hauling freight between the continental United States and Alaska, Puerto Rico, and other U.S. territories and posses-sions.

U . S . D E PA R T M E N T O F T R A N S P O R TAT I O N5 6
SURFACE TRANSPORTATION BOARD
BUDGETARY RESOURCES
APPROPRIATIONS, OBLIGATION LIMITATIONS, USER FEES, ASSET SALES, AND FHWA EXEMPT OBLIGATIONS
AdministrationFY 2014
ActualFY 2015
EstimateFY 2016 Request
Federal Aviation Administration $15,760 $15,848 $15,836
Federal Highway Administration 40,9421, 2 40,9411 51,3071
Federal Motor Carrier Safety Administration 585 584 669
National Highway Traffic Safety Administration 8192 830 908
Federal Transit Administration 10,8411 11,0081 18,3991
Federal Railroad Administration 1,610 1,626 5,018
Pipeline and Hazardous Materials Safety Administration 210 245 289
Maritime Administration 377 341 407
Saint Lawrence Seaway Development Corporation 31 32 36
Office of the Secretary 1,022 911 1,721
Office of the Inspector General 86 86 87
Surface Transportation Board 31 31 32
Total DOT Budgetary Resources $72,313 $72,483 $94,710
Dollars in Millions
Totals may not add due to rounding. 1 Does not include net flex funding transfers from the Federal Highway Administration to the Federal Transit Administration.2 Does not include funding transfers from the Federal Highway Administration to the National Highway Traffic Safety Administration.

B U D G E T H I G H L I G H T S | F I S CA L Y E A R 2 0 1 6 5 7
SURFACE TRANSPORTATION BOARD
BUDGET AUTHORITY
AdministrationFY 2014
ActualFY 2015
EstimateFY 2016 Request
Federal Aviation Administration $15,866 $15,848 $15,836
Federal Highway Administration 41,3561, 2 41,1251 51,3321
Federal Motor Carrier Safety Administration 572 584 669
National Highway Traffic Safety Administration 8192 830 908
Federal Transit Administration 10,7441 10,8871 18,3991
Federal Railroad Administration 1,647 1,657 5,018
Pipeline and Hazardous Materials Safety Administration 210 245 289
Maritime Administration 412 341 408
Saint Lawrence Seaway Development Corporation 31 32 36
Office of the Secretary 1,019 911 1,721
Office of the Inspector General 86 86 88
Surface Transportation Board 30 30 31
Total DOT Budget Authority $72,790 $72,576 $94,734
Dollars in Millions
Totals may not add due to rounding. 1 Does not include net flex funding transfers from the Federal Highway Administration to the Federal Transit Administration.2 Does not include funding transfers from the Federal Highway Administration to the National Highway Traffic Safety Administration.

U . S . D E PA R T M E N T O F T R A N S P O R TAT I O N5 8
SURFACE TRANSPORTATION BOARD
OUTLAYS
AdministrationFY 2014
ActualFY 2015
EstimateFY 2016 Request
Federal Aviation Administration $15,497 $16,551 $16,690
Federal Highway Administration 44,014 43,808 45,876
Federal Motor Carrier Safety Administration 534 601 662
National Highway Traffic Safety Administration 882 849 1,045
Federal Transit Administration 12,279 12,790 14,682
Federal Railroad Administration 2,811 3,602 5,018
Pipeline and Hazardous Materials Safety Administration 191 257 285
Maritime Administration 430 676 403
Saint Lawrence Seaway Development Corporation 31 41 44
Office of the Secretary 876 1,344 964
Office of the Inspector General 83 89 90
Surface Transportation Board 28 31 32
Total DOT Outlays $77,657 $80,638 $85,790
Dollars in Millions
Totals may not add due to rounding.

B U D G E T H I G H L I G H T S | F I S CA L Y E A R 2 0 1 6 5 9
SURFACE TRANSPORTATION BOARD
FULL TIME EQUIVALENT EMPLOYMENT
TOTAL
AdministrationFY 2014
ActualFY 2015
EstimateFY 2016 Request
Federal Aviation Administration 44,932 46,575 46,990
Federal Highway Administration 2,872 2,777 2,869
Federal Motor Carrier Safety Administration 1,100 1,175 1,276
National Highway Traffic Safety Administration 588 612 669
Federal Transit Administration 525 566 625
Federal Railroad Administration 851 884 979
Pipeline and Hazardous Materials Safety Administration 421 548 635
Maritime Administration 791 842 842
Saint Lawrence Seaway Development Corporation 131 144 144
Office of the Secretary 1,172 1,279 1,383
Working Capital Fund 223 282 350
Office of the Inspector General 395 422 425
Surface Transportation Board 131 156 161
Total DOT Full Time Equivalent Employment 54,132 56,262 57,348
DIRECT
AdministrationFY 2014
ActualFY 2015
EstimateFY 2016 Request
Federal Aviation Administration 42,878 44,213 44,333
Federal Highway Administration 2,655 2,560 2,652
Federal Motor Carrier Safety Administration 1,039 1,114 1,215
National Highway Traffic Safety Administration 586 610 669
Federal Transit Administration 525 566 625
Federal Railroad Administration 851 884 979
Pipeline and Hazardous Materials Safety Administration 418 548 635
Maritime Administration 463 507 514
Saint Lawrence Seaway Development Corporation 0 0 0
Office of the Secretary 569 669 773
Working Capital Fund 0 0 0
Office of the Inspector General 393 422 425
Surface Transportation Board 124 147 152
Total DOT Full Time Equivalent Employment 50,501 52,240 52,972