Embed Size (px)
Citation preview

TABLE OF CONTENTS Technical Appendix: Vol.1 Geology, Hydrogeology and Global Stability Foreword Applied Ground Engineering Consultants Letter ARUP Consulting Engineers Report
For
insp
ectio
n pur
pose
s only
.
Conse
nt of
copy
right
owne
r req
uired
for a
ny ot
her u
se.
EPA Export 12-11-2014:23:31:42

Bellanaboy Bridge Terminal Shell E&P Ireland Limited Environmental Impact Statement
1
Foreword to technical appendices The three reports comprising the technical appendices have been prepared by Arup Consulting Engineers. They present detailed discussions on the following topics: • Geology, Hydrogeology and Global Stability; • Earthworks; and • Drainage These documents are in the form of technical reports with associated appendices. In addition the Earthworks and Drainage reports contain calculations to support the specific designs that have been carried out for the terminal site. Each of the technical reports is split into sections, some of which have their own appendices. There are also main appendices, which are generally large format drawings. Estimated quantities of materials to be exported from and imported to the site relating to the earthworks activities have been calculated in the Earthworks report. These figures plus a contingency have been used in the respective sections of the Environmental Impact Statement. Letter from AGEC The letter from Applied Ground Engineering Consultants (AGEC), which is presented in the Geology, Hydrogeology and Global Stability Volume (Volume 1) is provided to demonstrate that AGEC has reviewed and confirmed the proposed geotechnical design. The reports referred to in AGEC’s letter are incorporated in the Technical Appendices, RP004 in Volume 1, and RP005 in the Earthworks Volume (Volume 2).
For
insp
ectio
n pur
pose
s only
.
Conse
nt of
copy
right
owne
r req
uired
for a
ny ot
her u
se.
EPA Export 12-11-2014:23:31:42

Shell E & P Ireland Ltd
Corrib Terminal: Bellanaboy Bridge
Geology, Hydrogeology and Global Stability Report
For
insp
ectio
n pur
pose
s only
.
Conse
nt of
copy
right
owne
r req
uired
for a
ny ot
her u
se.
EPA Export 12-11-2014:23:31:42

Shell E & P Ireland Ltd
Corrib Terminal: Bellanaboy Bridge
Geology, Hydrogeology and Global Stability Report
December 2003
Arup Consulting Engineers 15 Oliver Plunkett Street, Cork
Tel +353 021 4277670 Fax +353 021 4272345 www.arup.ie
Job number C1157.10
For
insp
ectio
n pur
pose
s only
.
Conse
nt of
copy
right
owne
r req
uired
for a
ny ot
her u
se.
EPA Export 12-11-2014:23:31:42

For
insp
ectio
n pur
pose
s only
.
Conse
nt of
copy
right
owne
r req
uired
for a
ny ot
her u
se.
EPA Export 12-11-2014:23:31:42

Shell E & P Ireland Ltd Corrib Terminal: Bellanaboy BridgeGeology, Hydrogeology and Global Stability Planning Report
J:\C-1100\C1157\(2) DOCUMENTS\10\REPORTS\RP004_ISSUE2_C1157-10_GEOLOGY HYDROGEOLOGY GLOBAL STABILITY.DOC RP004
Arup Consulting EngineersIssue 2 8 December 2003
CONTENTS Page
1. INTRODUCTION........................................................................................................................1
2. METHODOLOGY USED ...........................................................................................................2
3. GROUND PROFILE ..................................................................................................................3
4. GROUND INVESTIGATION DATABASE.................................................................................4
5. SOLID GEOLOGY.....................................................................................................................5
6. SUPERFICIAL DEPOSITS........................................................................................................7 6.1 Peat ............................................................................................................................................7 6.2 Hillwash and Glacial Till .............................................................................................................8 6.3 Bedrock Terrace and Overlying Head Deposits ........................................................................9
7. BEDROCK WEATHERING AND ROCK QUALITY................................................................12
8. HYDROGEOLOGY..................................................................................................................14 8.1 Bedrock Groundwater Unit.......................................................................................................14 8.2 ‘A’ Horizon Groundwater Unit ..................................................................................................16 8.3 Peat Groundwater Unit ............................................................................................................17 8.4 Sub-Surface Springs................................................................................................................19
9. HYDROCHEMISTRY...............................................................................................................21 9.1 Iron and Manganese ................................................................................................................21 9.2 Calcium and Magnesium .........................................................................................................21 9.3 Chloride....................................................................................................................................22 9.4 Alkalinity ...................................................................................................................................22
10. GLOBAL STABILITY ..............................................................................................................23 10.1 Historic Review of Peat Slope Instability and Mass Movement...............................................23 10.2 Morphological Study ................................................................................................................29 10.3 Stability Analyses .....................................................................................................................33
11. IMPLICATIONS FOR TERMINAL SITE DEVELOPMENT .....................................................41 11.1 Terminal Geology and Hydrogeology ......................................................................................41 11.2 Platform Level ..........................................................................................................................42 11.3 Earthworks ...............................................................................................................................43 11.4 Cut-Slope Stability ...................................................................................................................43 11.5 Foundations .............................................................................................................................44 11.6 Trenches in Peat ......................................................................................................................44 11.7 Drainage and Dewatering ........................................................................................................44 11.8 Re-Use of Materials .................................................................................................................47 REFERENCES
For
insp
ectio
n pur
pose
s only
.
Conse
nt of
copy
right
owne
r req
uired
for a
ny ot
her u
se.
EPA Export 12-11-2014:23:31:42

Shell E & P Ireland Ltd Corrib Terminal: Bellanaboy BridgeGeology, Hydrogeology and Global Stability Planning Report
J:\C-1100\C1157\(2) DOCUMENTS\10\REPORTS\RP004_ISSUE2_C1157-10_GEOLOGY HYDROGEOLOGY GLOBAL STABILITY.DOC RP004
Arup Consulting EngineersIssue 2 8 December 2003
APPENDICES
APPENDIX A Figures
APPENDIX B Geological Cross Sections
APPENDIX C von Post Humification Index
APPENDIX D Selected Photographs (see Figure 22 for locations)
APPENDIX E Derivation of Equation for Factor of Safety against Sliding
APPENDIX F Calibration Calculations of Wedge Analysis Method
APPENDIX G Stability Calculations for Existing Slopes
APPENDIX H Stability Calculations for Slopes below Sheet Pile Walls
For
insp
ectio
n pur
pose
s only
.
Conse
nt of
copy
right
owne
r req
uired
for a
ny ot
her u
se.
EPA Export 12-11-2014:23:31:42

Shell E & P Ireland Ltd Corrib Terminal: Bellanaboy BridgeGeology, Hydrogeology and Global Stability Planning Report
J:\C-1100\C1157\(2) DOCUMENTS\10\REPORTS\RP004_ISSUE2_C1157-10_GEOLOGY HYDROGEOLOGY GLOBAL STABILITY.DOC RP004
Page 1 Arup Consulting EngineersIssue 2 8 December 2003
1. INTRODUCTION The purpose of this report is four-fold:
a) To present a geological and hydrogeological model of the entire terminal site at Bellanaboy Bridge incorporating all relevant ground investigation data.
b) With the benefit of the model, consider in detail the ground conditions within the terminal footprint area.
c) From a review of historic peat slope instability, a morphological study of the area surrounding the terminal site, geotechnical analyses and supported by the above model, consider the global stability of the site.
d) Stemming from the above, examine the impact of the terminal construction on the geology, hydrogeology and global stability, and review appropriate mitigation measures.
Salient features of the site-wide geological model are summarised in a map (Figure 1a and 1b) and an idealised cross section (Figure 2); while salient features of the hydrogeological model are presented in the form of an annotated version of the geological cross section (Figure 11).
The model is intended to provide a distillation and synthesis of what has become a very large body of ground investigation data, incorporating these data into a rational and easily readable format. By means of the model it is possible to look at any specific location, area or alignment on the site with the benefit of an understanding drawn from the site as a whole. The model can thus be used to both interrogate individual items of ground investigation data and to guide extrapolation between data points.
The report describes the methodology used in compiling the model and then summarises its principle features. Although the geology and hydrogeology are described in different sections of the report, they are in fact part of a single integrated geological/hydrogeological model.
The section of the report covering Global Stability is essentially a stand-alone section, but it derives information from the model and has also helped to inform the model. For these reasons it has been included within the body of the present report.
At the time of writing this report (November 2003) further ground investigation is on-going at the terminal site. None of these ground investigation data points are included within this report, although some of the preliminary findings are referred to and the specific reason for undertaking this additional work is discussed where relevant.
For
insp
ectio
n pur
pose
s only
.
Conse
nt of
copy
right
owne
r req
uired
for a
ny ot
her u
se.
EPA Export 12-11-2014:23:31:42

Shell E & P Ireland Ltd Corrib Terminal: Bellanaboy BridgeGeology, Hydrogeology and Global Stability Planning Report
J:\C-1100\C1157\(2) DOCUMENTS\10\REPORTS\RP004_ISSUE2_C1157-10_GEOLOGY HYDROGEOLOGY GLOBAL STABILITY.DOC RP004
Page 2 Arup Consulting EngineersIssue 2 8 December 2003
2. METHODOLOGY USED In compiling the model, datasets characterising particular features of the geology and hydrogeology are plotted graphically in order to derive a relationship between the feature and depth below ground level and/or elevation on the site. The relationship derived may be either a regression, or best-fit, mean line, or a line representing an envelope to the data set.
There is an implicit assumption in this approach (which also underpins the whole of statistics), which is that the mean of a sample population (in this case the ground investigation database) is an accurate descriptor of the population as a whole (i.e. the whole site).
A fundamental assertion of the modelling technique is that there is a linear or quasi-linear relationship between particular geological and hydrogeological features and the topography. The validity of this assertion is borne out by the graphical representations, which are included in support of the model.
The modelling approach described has certain limitations, however, which result from local variations in the geology and hydrogeology that are not captured by or do not conform to the average trend. These variations and their implications are discussed, where relevant, in the text.
For
insp
ectio
n pur
pose
s only
.
Conse
nt of
copy
right
owne
r req
uired
for a
ny ot
her u
se.
EPA Export 12-11-2014:23:31:42

Shell E & P Ireland Ltd Corrib Terminal: Bellanaboy BridgeGeology, Hydrogeology and Global Stability Planning Report
J:\C-1100\C1157\(2) DOCUMENTS\10\REPORTS\RP004_ISSUE2_C1157-10_GEOLOGY HYDROGEOLOGY GLOBAL STABILITY.DOC RP004
Page 3 Arup Consulting EngineersIssue 2 8 December 2003
3. GROUND PROFILE An idealised ground profile, shown in cross-section in Figures 2 and 11, has been compiled from a digital ground model (DGM) of the site. The DGM is modelled in Inroads SelectCAD (a software package typically used for road and embankment design) and incorporates all of the ground level survey information for the site. The vertical axis on each of the profiles represents ground elevation, as in a conventional section, but the horizontal axis represents cumulative percentage of the total site area lying above a certain elevation. In effect, the profile represents a statistical mean ground profile for the site as a whole. Thus Figures 2 and 11 are not true cross sections, and do not indicate the actual slope of the site.
The ground profile shown in Figures 2 and 11 has been used as a datum for plotting the underlying geological layers, as well as groundwater levels and permeability data.
Figures 3 shows ground surface contours at 1m intervals plotted from the DGM.
For
insp
ectio
n pur
pose
s only
.
Conse
nt of
copy
right
owne
r req
uired
for a
ny ot
her u
se.
EPA Export 12-11-2014:23:31:42

Shell E & P Ireland Ltd Corrib Terminal: Bellanaboy BridgeGeology, Hydrogeology and Global Stability Planning Report
J:\C-1100\C1157\(2) DOCUMENTS\10\REPORTS\RP004_ISSUE2_C1157-10_GEOLOGY HYDROGEOLOGY GLOBAL STABILITY.DOC RP004
Page 4 Arup Consulting EngineersIssue 2 8 December 2003
4. GROUND INVESTIGATION DATABASE The positions of all ground investigation data points available across the site are shown in Figure 3. Note that the data points used specifically in compiling the model, are distinguished by a label; the coding system being the same as that in the later graphical plots.
As indicated later in the report there are certain sets of data, such as cone penetration tests (CPTs), Mackintosh probes and in situ shear vane tests (unlabelled in Figure 3) that have not been used directly in compiling the model, this is due to uncertainty about geological interpretation of these data. However, with the benefit of the model, the CPTs have been used to provide additional information on the elevation and morphology of the sub-peat surface, which is shown in Figure 16. The in situ shear vane tests have been used in the global stability analyses, and their locations are shown separately in Figure 30. Thus the only data set to be completely excluded is the Mackintosh probes.
For
insp
ectio
n pur
pose
s only
.
Conse
nt of
copy
right
owne
r req
uired
for a
ny ot
her u
se.
EPA Export 12-11-2014:23:31:42

Shell E & P Ireland Ltd Corrib Terminal: Bellanaboy BridgeGeology, Hydrogeology and Global Stability Planning Report
J:\C-1100\C1157\(2) DOCUMENTS\10\REPORTS\RP004_ISSUE2_C1157-10_GEOLOGY HYDROGEOLOGY GLOBAL STABILITY.DOC RP004
Page 5 Arup Consulting EngineersIssue 2 8 December 2003
5. SOLID GEOLOGY The solid (i.e. bedrock) geology is shown as a base layer to Figure 1b. It has been compiled using published geological map information, but incorporating lithological data from the various rotary-cored boreholes on the site.
The mapped solid geology shown in Figure 1b differs somewhat from the published geological map (Sheet 6, North Mayo: Reference 1). This is because in compiling the published map, the Geological Survey had very little in the way of rock outcrops to work with; much of the area being extensively cover by blanket bog. The published map (Sheet 6, North Mayo) was thus built up using available rock exposures (in coastal cliffs, in incised river valleys and in quarries) and extrapolating the geology into non-outcrop areas using ground features as a guide.
At the time of mapping Sheet 6 (Reference 1, 2 and 3), only one small bedrock exposure was available within a 1km radius of the site (a small quarry to the east of the site), with earlier documentary evidence of a former exposure in the stream-bed beneath Bellanaboy Bridge. The rotary core bedrock samples collected from the site thus represent a significant improvement on the available local bedrock geology information (C.B. Long, personal communication).
Apart from changes to the subcrop pattern, the main departure from the published map is that the thin formations lying between the Srahlaghy Quartzite and the Inver Schist are not recognised at the terminal site. This is probably due to pinching out on thrust faults, which are a feature of the contacts between these formations where seen at outcrop.
All of the formations present represent different sedimentary rocks that have been affected, to varying degrees, by regional metamorphism. Metamorphism has changed the lithology and fabric of the rock, requiring a different set of descriptors to characterise the individual rock types. Table 5.1 shows the rock descriptions used by the Geological Survey to characterise the various meta-sedimentary rock types in North Mayo (taken from Reference 4). The following gives a general geological description for each formation present on the site compiled by the Geological Survey (in quotation marks), together with a description compiled from rotary core samples.
The Benmore Formation comprises “A monotonous sequence of massive to banded psammitic quartzite and quartzite, with rare very thin heavy mineral bands and thin orthoquartzite beds. Cross-bedding is common”. The formation is well exposed in the (now much enlarged) quarry just to the east of the site (see location in Figure 1b), where it can be seen to comprise a strong, thinly bedded, fine to medium grained quartzitic sandstone. In the quarry the bedding dips westwards at about 500 (see Plate 2., in Appendix D)
Table 5.1. Metasedimentary Rock Descriptions
ROCK TYPE COMPOSITION
Orthoquartzite More than 95% quartz
Quartzite More than 80% quartz; mica and feldspar commonly present
Psammitic quartzite 60 to 80% quartz with the remainder largely feldspar and mica
Psammite 40 to 60% quartz with the remainder dominantly feldspar and mica
Semi-pellite 10 to 40% quartz with the remainder largely mica. Feldspar often up to 50%
Pellite Less than 10% quartz with mica very prominent. Feldspar occurs
Marble Composed of dolomite and/or calcite with minor amounts of quartz, feldspar and mica
For
insp
ectio
n pur
pose
s only
.
Conse
nt of
copy
right
owne
r req
uired
for a
ny ot
her u
se.
EPA Export 12-11-2014:23:31:42

Shell E & P Ireland Ltd Corrib Terminal: Bellanaboy BridgeGeology, Hydrogeology and Global Stability Planning Report
J:\C-1100\C1157\(2) DOCUMENTS\10\REPORTS\RP004_ISSUE2_C1157-10_GEOLOGY HYDROGEOLOGY GLOBAL STABILITY.DOC RP004
Page 6 Arup Consulting EngineersIssue 2 8 December 2003
The Srahlaghy Formation comprises “Massive pale-coloured vitreous quartzites, lacking heavy mineral bands and with cross-bedding locally preserved”. In corehole samples it is seen as a strong medium- to coarse-grained quartzite.
The Inver Schist Formation comprises “Dark, graphitic, semi-pellitic schists, with occasional discontinuous grey marbles, and bands of psammitic schist. Quartzite is absent”. This formation underlies by far the greater proportion of the site and, based on corehole evidence, seems to contain roughly equal proportions of psammite, semi-pellite and pellite. Quartzite is only occasionally present. The varying amounts of quartz and mica give the rock a varying strength and susceptibility to weathering.
Bedrock weathering is discussed in more detail in Section 8.
For
insp
ectio
n pur
pose
s only
.
Conse
nt of
copy
right
owne
r req
uired
for a
ny ot
her u
se.
EPA Export 12-11-2014:23:31:42

Shell E & P Ireland Ltd Corrib Terminal: Bellanaboy BridgeGeology, Hydrogeology and Global Stability Planning Report
J:\C-1100\C1157\(2) DOCUMENTS\10\REPORTS\RP004_ISSUE2_C1157-10_GEOLOGY HYDROGEOLOGY GLOBAL STABILITY.DOC RP004
Page 7 Arup Consulting EngineersIssue 2 8 December 2003
6. SUPERFICIAL DEPOSITS
6.1 Peat Peat is the uppermost of the superficial deposits and is present over the whole of the site, mantling the other superficial deposits and solid strata to a varying thickness. Any engineering development on the site will thus have to contend with a certain thickness of peat.
Peat thickness, taken from shell and auger boreholes, gouge core holes and trial pits, is plotted against ground surface elevation in Figure 4. The reason that other ground investigation data sources (CPTs and Mackintosh probes) have been excluded from this plot is that they do not always provide a wholly accurate and reliable measure of peat thickness, as they may not distinguish between peat and soft underlying material.
It is clear from Figure 4 that there is an inverse relationship between peat thickness and ground elevation, although this is not a simple linear relationship. Figure 4 shows the best-fit mean line drawn through the data points. Note that on the lower parts of the site, where the data points are less numerous, there appears to be a wider variation in thickness. The reasons for these local variations in peat thickness are discussed later in the report. The best-fit mean line shown in Figure 4 has been used to draw the base of the peat on the idealised cross-section in Figure 2.
The degree of decomposition (humification) of the peat is an important measure of its mechanical behaviour. To identify how the degree of decomposition of the peat varies with depth and position on the slope, values of von Post humification index (H) taken from the gouge core holes have been plotted against ground elevation in Figure 5. The full von Post humification scale (taken from Reference 5) is included in Appendix C. Two values of humification index were chosen for this purpose, namely H4 and H8. These values were chosen for the following reasons:
• Both are well represented within the data set as a whole.
• Both represent significant transitional boundaries within the peat profile.
H4 represents the boundary between relatively un-decomposed peat and decomposed peat, while H8 represents the boundary between peat with remnant fibres and non-fibrous, essentially gelatinous, peat. Thus, a three-layer peat profile is defined, which roughly equates to the three layers recognised by AGEC (Reference 6) from CPT data on the eastern part of the site.
In the case of the H4 data set, the points plotted (in Figure 5) represent average values for each 2m interval of elevation. Because there are fewer values in the H8 data set all of the data points have been plotted, hence the greater scatter. In both cases, there is a clear trend of increasing depth with increasing ground elevation and this is represented in each case by a mean best-fit line. The rate of increase is less, however, in the case of H4.
The depth/ground elevation relationships represented by the mean best-fit lines in Figure 5 have been used to plot profiles of H4 and H8 on the idealised geological cross-section in Figure 2.
Several interesting features, stemming from the relationships defined in Figure 5, are evident in the peat profile shown in Figure 2.
• The thickness of less decomposed (H1 – H4) peat increases progressively upslope.
• Highly decomposed peat >H8 thins to nothing upslope and is not present above a ground elevation of about 38mOD.
For
insp
ectio
n pur
pose
s only
.
Conse
nt of
copy
right
owne
r req
uired
for a
ny ot
her u
se.
EPA Export 12-11-2014:23:31:42

Shell E & P Ireland Ltd Corrib Terminal: Bellanaboy BridgeGeology, Hydrogeology and Global Stability Planning Report
J:\C-1100\C1157\(2) DOCUMENTS\10\REPORTS\RP004_ISSUE2_C1157-10_GEOLOGY HYDROGEOLOGY GLOBAL STABILITY.DOC RP004
Page 8 Arup Consulting EngineersIssue 2 8 December 2003
• Moderately decomposed (H4 – H8), but still fibrous, peat reaches a maximum thickness (of about 2m) on the middle part of the slope, but thins upslope and downslope.
• Because of the additional presence of highly decomposed (>H8) peat on the lower part of the slope (whose downslope thickness is increasing at a greater rate than the less decomposed peat) the combined rate of downslope peat thickness increase is much greater on the lower part of the slope.
The variation in peat thickness in progressing upslope is presumed to be due to the invasive way in which peat grew: starting in low-lying wet hollows and gradually spreading to higher ground (see, for instance: Reference 7). The greater thickness on the lower slope thus represents a longer time period of overall accumulation and decay. However, the additional thickness of highly decomposed peat beneath the lower part of the slope is considered to be not simply due to age; rather it is thought to represent a slightly different type of peat. This is fen peat, which grew in wetter, more nutrient-rich, environments and was less fibrous in character.
6.2 Hillwash and Glacial Till These two mineral soil deposits are treated together for the purposes of model description. In many of the boreholes on the site they are not clearly distinguished, although in reality they are of different origins and ages.
The data set used to derive layer thicknesses is shown in Figure 6. Note that layer thickness has been derived, principally, from shell and auger boreholes, with a few trial pits providing additional data. The CPTs, gouge core holes and Mackintosh probes have been excluded from this data plot because of uncertainty over interpretation of the two layers. On the basis of improved understanding derived from the model it should be possible to selectively incorporate these additional data into the model.
Unlike the other graphical data plots, layer thicknesses in Figure 6 are plotted relative to elevation of the sub-peat surface. A contour plot of the sub-peat surface compiled using all available data is shown in Figure 16. Because of their comparative thinness (particularly the hillwash layer), thickness variations of these mineral soils can be easily masked by variations in overlying peat thickness, when plotted against ground surface elevation; hence, the different vertical axis in Figure 6.
Notwithstanding the overall scatter of data points in Figure 6, there is a clear grouping into two distinct data sets, which have been represented by intersecting best-fit mean lines, labelled Hillwash Alone and Hillwash and Glacial Till.
6.2.1 Hillwash
The Hillwash layer can be see to extend across the whole site, increasing in thickness downslope at a rate defined by the best-fit mean line. This line has been used to plot the layer thickness on the idealised cross section in Figure 2.
The glacial till can be seen to be truncated by the hillwash layer and to be present only on the lower part of the site, below an average sub-peat elevation of about 30.5mOD. This corresponds to an upslope ground surface elevation limit of about 33.5mOD (shown in Figure 2), assuming an average thickness of 3m of peat on the mid-level part of the site taken from Figure 4.
The Hillwash layer, as the name implies, is thought to represent mainly local material that has been transported down slope by run-off and slope washing processes at a time when the site was devoid of vegetation. Because of its thinness and lack of previous recognition, very few (pre-2003) samples have been retrieved from this layer and so very few laboratory tests have
For
insp
ectio
n pur
pose
s only
.
Conse
nt of
copy
right
owne
r req
uired
for a
ny ot
her u
se.
EPA Export 12-11-2014:23:31:42

Shell E & P Ireland Ltd Corrib Terminal: Bellanaboy BridgeGeology, Hydrogeology and Global Stability Planning Report
J:\C-1100\C1157\(2) DOCUMENTS\10\REPORTS\RP004_ISSUE2_C1157-10_GEOLOGY HYDROGEOLOGY GLOBAL STABILITY.DOC RP004
Page 9 Arup Consulting EngineersIssue 2 8 December 2003
been performed that would enable the material to be fully characterised1. On the middle and upper part of the slope, where the hillwash layer is less than 1m thick, it generally appears to be rather clayey in character, which probably reflects derivation from the underlying deeply weathered Inver Schist bedrock and head, with only limited transport and segregation downslope. In fact on this part of the slope the layer may represent a condensed residual soil (in the pedogenic sense), which has formed in situ. It would thus be equivalent to the ‘A’ horizon discussed in Section 8.2 (see also Plate 1., in Appendix D). Typically the material is described as a firm to stiff grey sandy gravelly clay, with boulders. The boulders, both angular and well-rounded, are of quartzite and sandstone.
Further downslope, where the hillwash is more than 1m thick, it appears to become more differentiated into discrete sand and silt layers. To this extent, it is more typical of a hillwash: being the product, rather than the residue, of downslope transport. Based on CPT signature the material is mainly a silty sand or sandy silt of variable density, but generally loose to medium dense. Two grading and plasticity tests (in IGSL boreholes P6 and W5) indicate this lower slope hillwash to be a non-plastic, silty, slightly gravely, sand.
The increase in thickness (to greater than 1m) and segregation into sand and silt layers seems to be particularly marked downslope from a present ground elevation of about 33mOD. This is interpreted as being due to the presence of a significant spring line (at this present ground elevation) at the time when this layer was being formed (see Hydrogeology Section). The spring line would have provided the additional water for transporting and segregating the hillwash material.
Deposition of the Hillwash layer is presumed to have been initiated towards the end of the last glacial period when the climate was not only significantly wetter and colder than present, but the area was largely devoid of vegetation. However, downslope washing of mineral soil appears to have continued until relatively recent times, as evidenced by the presence of sand/silt layers within the lower part of the peat profile, as seen in the CPTs on the lower part of the slope in the eastern area of the site.
Note that hillwash processes would have ceased once blanket bog had enveloped the whole hillside.
6.2.2 Glacial Till
The Glacial Till is thought to be a much older deposit, which probably dates from the penultimate glacial (Munsterian) period. A younger age is deemed to be unlikely since (Midlandian) glacial till per se was not deposited in the present area; Midlandian ice sheets not having extended into this part of NW Mayo (see Figure 6, and Reference 8).
The Glacial Till is a very stiff slightly cohesive mineral soil, which is variously described as a gravelly silty sand or gravelly silty clay. Five grading curves (from boreholes P7, P10, W7 and W9) indicate the material to be widely graded within the silt- to gravel-size range (which is typical of glacial tills), although with a preponderance of material in the sand-size range. The latter may indicate a water-laid origin for the till.
As noted in the previous section, the glacial till seems to thin to nothing upslope and is not present above a ground elevation of 30.5mOD. Locally, on the low-lying part of the site to the east of the terminal footprint, a much increased thickness of glacial till (greater than 3m) is present, evidently infilling a buried valley feature. This area is indicated in Figure 1a.
6.3 Bedrock Terrace and Overlying Head Deposits The presence of a buried terrace feature has been identified, mainly from rotary-cored boreholes (Irish Drilling coreholes) on the terminal site. This identification is based on a
1 Note this geotechnical information will be augmented by the ongoing investigation.
For
insp
ectio
n pur
pose
s only
.
Conse
nt of
copy
right
owne
r req
uired
for a
ny ot
her u
se.
EPA Export 12-11-2014:23:31:42

Shell E & P Ireland Ltd Corrib Terminal: Bellanaboy BridgeGeology, Hydrogeology and Global Stability Planning Report
J:\C-1100\C1157\(2) DOCUMENTS\10\REPORTS\RP004_ISSUE2_C1157-10_GEOLOGY HYDROGEOLOGY GLOBAL STABILITY.DOC RP004
Page 10 Arup Consulting EngineersIssue 2 8 December 2003
coincidence of drilled depths to the top of the underlying weathered bedrock surface, which is interpreted to correspond to the 50% core recovery value (see Figure 8). The terrace has been cut in bedrock (Inver Schist), with the back of the terrace forming a subdued buried cliff in rock. The terrace extends over an elevation range of 29.5-32.5mOD, and has a slight outward slope of 1 in 80.
The approximate extent of the terrace is shown in Figure 1a. This extent is based partly on a correspondence between the back and front of the terrace with the present 40mOD and 33.5mOD ground surface contours, respectively (as defined in Figure 8), and partly on specific borehole evidence.
Formation of the terrace is thought to post-date deposition of the previously described glacial till, since the latter does not appear to extend above the elevation of the front of the terrace. One of the many possible interpretations of the origin of the terrace is that the terrace was cut by a marine transgression at the end of the Munsterian glacial period. Isostatic rebound (following unloading by ice) is known to have lagged behind eustatic rise in sea level (due to ice melting), following the more recent Midlandian glaciation. As a result, late-Midlandian (Drumlin substage) raised marine terraces and glacio-marine deposits were formed, and extend up to 2km inland, along the North Mayo coast (Reference 9). Because of the more extensive ice cover during the Munsterian glaciation (see Figure 7) and the (presumed) much greater ice thickness, eustatic rise in sea level is expected to have penetrated further inland.
The material overlying the terrace is considered to have originated as a Head deposit, derived by downslope gravitational mass transport (solifluction) of surface rock debris from the hill above. Head is common in Ireland, but is mainly confined, as would be expected, to periglacial areas (i.e. areas lying outside the limits of glaciation; see, for instance: Reference 10). Plates 1 and 2, in Appendix D show examples of Head overlying Benmore Formation bedrock in the nearby quarry. Note particularly in Plate 2 the downslope curvature (cambering) of the bedding, which is symptomatic of down-slope mass movement of the overlying material under freeze-thaw conditions.
The Head material is under-represented in the terminal site ground investigation data set2, however. This is because shell and auger boreholes and other soft-ground drilling methods tend to meet refusal at shallow depth in this layer, while rotary-cored boreholes experience significant loss of core recovery. However, the consistent description of this material in shell and auger boreholes on the terminal site as: “very dense, light green, slightly gravely SAND (Possible weathered Rock)” would fit the perceived origin and the wedge-like profile to this layer (up to 5m thick) as indicated in Figure 2. As seen in the trial pits of the on-going (November 2003) investigation, the material comprises a chaotic mixture of gravel- to cobble-size schist, sandstone and quartzite rock fragments in a micaceous earthy soil matrix, which would be the breakdown product of the Inver Schist. It is thus not surprising that the material has previously been characterised as weathered rock, as this is essentially what it is, although not in situ.
Note that if the terrace extends all the way around the hill to the north of the terminal site, as suspected, and the terrace is buried by Head material derived from up-slope, then the hill would have needed to have formerly extended to at least 60mOD to supply sufficient volume of material to completely bury the terrace. Deep weathering has affected the Head deposit, as well as the rock underlying the terrace (see following section), and so any original depositional fabric has been obliterated. Note, however, that Head rarely has much in the way of primary depositional character.
2 Note this geological understanding is being augmented by the ongoing investigation.
For
insp
ectio
n pur
pose
s only
.
Conse
nt of
copy
right
owne
r req
uired
for a
ny ot
her u
se.
EPA Export 12-11-2014:23:31:42

Shell E & P Ireland Ltd Corrib Terminal: Bellanaboy BridgeGeology, Hydrogeology and Global Stability Planning Report
J:\C-1100\C1157\(2) DOCUMENTS\10\REPORTS\RP004_ISSUE2_C1157-10_GEOLOGY HYDROGEOLOGY GLOBAL STABILITY.DOC RP004
Page 11 Arup Consulting EngineersIssue 2 8 December 2003
Although a number of moisture condition value and CBR tests were performed on samples of this material from the earlier shell and auger boreholes on the terminal site, no grading tests were done3.
3 Note this geotechnical information will be augmented by the ongoing investigation.
For
insp
ectio
n pur
pose
s only
.
Conse
nt of
copy
right
owne
r req
uired
for a
ny ot
her u
se.
EPA Export 12-11-2014:23:31:42

Shell E & P Ireland Ltd Corrib Terminal: Bellanaboy BridgeGeology, Hydrogeology and Global Stability Planning Report
J:\C-1100\C1157\(2) DOCUMENTS\10\REPORTS\RP004_ISSUE2_C1157-10_GEOLOGY HYDROGEOLOGY GLOBAL STABILITY.DOC RP004
Page 12 Arup Consulting EngineersIssue 2 8 December 2003
7. BEDROCK WEATHERING AND ROCK QUALITY Two of the consequences of the present area not having been covered by moving ice sheets during the last (Midlandian) glacial period are that:
• The area experienced a much longer period of weathering under peri-glacial and temperate climatic conditions.
• The products of weathering remained largely in situ, and were not removed by glacial scour.
Bare rock surfaces (not otherwise protected by a covering of low-permeability Munsterian glacial till), as well as surfaces covered by loose rock debris, thus experienced deep weathering (see Reference 8). This weathering appears to have affected the Inver Schist Formation much more profoundly than the other formations because of the proneness of the schist to both chemical and mechanical alteration. Leaching of calcium carbonate in particular, which is thought to be an important cementing agent, appears to have had a significant impact on rock strength.
Surface weathering has resulted in a loss of both strength and intactness of the rock and this has been incorporated into the model by virtue of its effect on total core recovery in the rotary-cored boreholes. Since the effect of rotary coring is to impose mechanical stresses on the rock and also subject the rock to pressurised water flow, any inherent weakness or friability will result in a reduction in core recovery.
In addition to the 50% recovery level noted earlier, two other values of core recovery have been utilised, namely 75% and 90%, which are plotted as a data set in Figure 8. Envelope lines have been added to this data plot to indicate the depth limits of each of these recovery values. The envelope lines have been plotted onto the idealised geological cross-section in Figure 2 to indicate how rock weathering might be expected to extend at depth beneath the terminal site.
There is an evident absence of significant bedrock weathering in the area, downslope of the terminal, underlain by glacial till. Conversely, there is a very significant increase in depth of weathering beneath the terrace. This probably relates to the fact that the terrace and the overlying head material formerly acted as a local reservoir for groundwater, which was the main agency for weathering.
Weathering also extends upslope of the terrace into the hill, but it is evident that the bedrock underlying the uppermost part of the hill (above a surface elevation of 45mOD) is largely un-weathered. This is probably due to the fact that the hill, which (as previously noted) was formerly much higher, progressively shed its weathered mantle onto the terrace. To this extent the hill crest can be seen as having developed as a subdued tor (i.e. a pinnacle of unweathered rock; see, for instance: Reference 10).
That the terrace extends around the hill at least on the eastern side is indicated by a similar plot of core recoveries against ground elevation compiled from the recently acquired (LSO) ground investigation data. This is shown in Figure 9. Although the data set is less complete in terms of extent across the terrace area there is a clear trend of deep bedrock weathering downslope of the 41.5mOD surface contour.
The effect of weathering on rock strength, as well as the intrinsic differences in strength between the different rock types making up the Inver Schist, can be seen in Figure 10. This shows a plot of measured unconfined compressive strength (UCS), derived from UCS tests and point load strength tests, against core recovery. Note that data for this plot were derived from measured core recoveries for individual core runs and any associated strength tests that were performed on the recovered core. Where more than one strength test was performed on core from a single core run, the test results were averaged.
For
insp
ectio
n pur
pose
s only
.
Conse
nt of
copy
right
owne
r req
uired
for a
ny ot
her u
se.
EPA Export 12-11-2014:23:31:42

Shell E & P Ireland Ltd Corrib Terminal: Bellanaboy BridgeGeology, Hydrogeology and Global Stability Planning Report
J:\C-1100\C1157\(2) DOCUMENTS\10\REPORTS\RP004_ISSUE2_C1157-10_GEOLOGY HYDROGEOLOGY GLOBAL STABILITY.DOC RP004
Page 13 Arup Consulting EngineersIssue 2 8 December 2003
The full data set represents 173 strength tests, on 136.5m of recovered core, in 225m of bedrock core run, in 20 boreholes, distributed roughly equally over the terminal footprint area. Ignoring for the moment the lost core, which as indicated below is likely to represent the very weakest material, the data points in Figure 10 are considered to be representative of the Inver Schist rock mass as a whole. The plot has been divided into areas, each of which corresponds to a different lithology making up the Inver Schist. This correspondence has been confirmed by comparing the individual test results with the rock descriptions given on the borehole logs. Since 100% on the x-axis of this plot represents the summation of all recovered core, a projection of the individual rock types areas onto the x-axis provides a measure of the proportion of each lithology within the rock mass as a whole. The Inver Schist can thus be seen to be made up of the following lithologies: Quartzite 15%: Psammite 25%: Semi-Pellite 30%; Pellite 30%, by volume (see Table 5.1 for rock type descriptions).
Between the different rock types there is a very wide range of strength, from over 100MPa to as little as 5MPa, with strength generally decreasing progressively through the sequence: Quartzite (strongest), Psammite, Semi-Pellite and Pellite (weakest). This is what would be expected given that the sequence reflects an increase in primary clay (now mica) content. Very weak rock material (less than 5MPa) appears to be under-represented in the data set, and this is thought to be due both to its absence in the intact un-weathered rock and the fact that weathered rock with a strength of less than 5MPa is easily lost during the coring process.
Figure 10 shows that weathering, resulting in a progressive loss of strength, affects all four rock types making up the Inver Schist and that this in turn impacts on core recovery. The core recovery values 50%, 75% and 90% can thus be seen to have particular significance in this regard. At a core recovery value of 50%, or less, all of the Semi-Pellite and Pellite have been weathered to a strength of less than 5MPa and are not recovered as solid core. Only the Quartzite maintains its strength; the strength of the Psammite is reduced to 20MPa or less. Between 50-75% core recovery Semi-Pellite is represented but its strength is generally less than 10MPa. The Psammite has an average strength of 20MPa. Between 75-90% core recovery all four rock types are represented although the Pellite is very weak and probably contributes most to lost core. The Semi-Pellite has an average strength of 10MPa and the Psammite an average strength of 20MPa. Above 90% core recovery the rock mass is effectively un-weathered, and while the Pellite still has a strength of less than 10MPa, the average Semi-Pellite strength is 15MPa and that of the Psammite is 40MPa.
Weathering and variations in rock strength are of particular relevance in relation to the following:
• Ease of excavation and stability of rock slopes;
• Potential for re-use as rockfill and aggregate;
• Implications for foundations;
• Effects on hydrogeology.
These issues are addressed in later sections of the report.
For
insp
ectio
n pur
pose
s only
.
Conse
nt of
copy
right
owne
r req
uired
for a
ny ot
her u
se.
EPA Export 12-11-2014:23:31:42

Shell E & P Ireland Ltd Corrib Terminal: Bellanaboy BridgeGeology, Hydrogeology and Global Stability Planning Report
J:\C-1100\C1157\(2) DOCUMENTS\10\REPORTS\RP004_ISSUE2_C1157-10_GEOLOGY HYDROGEOLOGY GLOBAL STABILITY.DOC RP004
Page 14 Arup Consulting EngineersIssue 2 8 December 2003
8. HYDROGEOLOGY The purpose of this section is to show how the groundwater, contained within the various superficial deposits and bedrock, fits into the geological model and, likewise, how the bedrock and the various superficial deposits influence groundwater levels and groundwater flows at different locations and depths on the site.
For the purposes of the following description three groundwater units are recognised. These are referred to as:
a) The bedrock groundwater unit (which also includes the terrace deposits, glacial till and hillwash),
b) A unit referred to as the ‘A’ horizon groundwater unit, and c) The peat groundwater unit.
A similar three-fold division of the groundwater has previously been proposed (Reference 11), although the nature of each of the present units is rather different from that previously envisaged.
Note that further pumping tests and in situ permeability tests are being carried out as part of the ongoing investigation work. These tests are intended to provide additional information for increased hydrogeological understanding of the site, as well as specific data for design of dewatering wells to be used during construction (see Section 11.7.2).
8.1 Bedrock Groundwater Unit Figure 12 shows depths to groundwater recorded in piezometers variously installed in bedrock and in the overlying mineral soils. Notwithstanding the scatter of data points there is, above a surface elevation of about 31mOD, a clear trend of increasing depth to ground water in progressing upslope. The data points generally lie on or between two converging lines, as shown, and a best-fit average line is also indicated. Significantly, sub-peat groundwater can be seen to come very close to the surface between a ground elevation of 31-33.5mOD, and to remain at relatively shallow depth beneath the lower part of the slope.
To understand the significance of the water level data envelope defined by the converging lines in Figure 12 it is necessary to refer to the idealised hydrogeological cross-section (Figure 11). The converging lines have been plotted onto this section, together with the mean line (referred to in Figure 11 as the average bedrock piezometric level). The section also shows all of the in situ permeability measurements made in various boreholes, and the depth interval over which the measurements were made. The deeper measurements were obtained from packer tests carried out during drilling of the IDL cored boreholes on the terminal site; while the shallower group was derived from falling head tests in piezometers installed on completion of the drilling in both rotary core and shell and auger boreholes.
It can be seen that a uniformly low permeability (typically in the range 1 to 9 x 10⁻⁷ m/s) is indicated for the head deposits and the very weathered bedrock (50 – 75% core recovery zone). It is also evident that neither of these units can be separately distinguished purely on the basis of permeability. However, a higher permeability (in the range 1 to 5 x 10⁻⁶ m/s) is indicated for the less weathered (but still highly fractured, 75 – 90/100% core recovery) bedrock. The permeability of the bedrock can be seen as reducing again at deeper levels, and also downslope where it is overlain by glacial till. In these two latter situations the bedrock is largely un-weathered and un-fractured.
Reduction in permeability within the highly weathered rock and head deposits can be assumed to be associated with an increase in clay content, resulting from breakdown of more pellitic rock types. Collectively, these low permeability materials act as a thick (up to 15m) confining wedge to the more permeable underlying fractured bedrock. However, their permeability is
For
insp
ectio
n pur
pose
s only
.
Conse
nt of
copy
right
owne
r req
uired
for a
ny ot
her u
se.
EPA Export 12-11-2014:23:31:42

Shell E & P Ireland Ltd Corrib Terminal: Bellanaboy BridgeGeology, Hydrogeology and Global Stability Planning Report
J:\C-1100\C1157\(2) DOCUMENTS\10\REPORTS\RP004_ISSUE2_C1157-10_GEOLOGY HYDROGEOLOGY GLOBAL STABILITY.DOC RP004
Page 15 Arup Consulting EngineersIssue 2 8 December 2003
not so low that they act as a complete aquiclude; bedrock groundwater is still able to migrate through these materials as evidenced by groundwater strikes during drilling and water levels in shallow piezometers that respond to the deeper bedrock water level. The presumption is that while weathering results in a low permeability, the porosity of the material may actually be increased (due to leaching of soluble mineral constituents, see Section 9).
Towards the crest of the hill, where (because of recharge) water levels reach their highest level, the rock is less weathered but still rather fractured. Only a relatively small vertical range of water levels is evident. Bedrock groundwater cannot flow laterally from the hill crest, however, because of the thick wedge of low permeability material (head and deeply weathered bedrock). Note that this is another reason for thinking that the hydrogeological profile represented by Figure 11 extends all the way around the hill. Flow thus takes place underneath the thick wedge, through the more fractured (10-6 m/s permeability) rock. Since this higher permeability rock zone rises again towards the surface on those parts of the site lying between about 32.5-33.5mOD, the latter is an area of potential outflow (upwelling) of bedrock groundwater. This preferential flow path for bedrock groundwater is indicated diagrammatically in Figure 11, by arrows.
This rather complex bedrock hydrogeology is further subtly complicated by the fact that the bedrock surface profile does not remain uniform across the site. As noted in Section 11.1, a shallow bedrock ridge extends NNW-SSE through the eastern part of the terminal footprint. Since this ridge runs essentially parallel to the line of section in Figure 11 its topographic expression is subsumed by the averaging effect of the section construction. The peat is also thinner across the ridge and so groundwater recharge to the bedrock is faster in this area.
The combined effect is that bedrock groundwater levels are higher (relative to the average) beneath this ridge, while elsewhere they are lower (relative to the average). That this is the case is shown in Figure 16, where an area circumscribing all of the data point locations, which in Figure 12, fall between the average line and the upper-bound line. Elsewhere on the site (i.e. outside of this area) measured bedrock groundwater levels fall between the average line and the lower-bound line in Figure 12.
In Section 6.2 it was noted that the zone of upwelling of bedrock groundwater probably equates to a former (pre-peat) spring line and that the hillwash layer changes character downslope from this point. Also it was noted that the glacial till thickens downslope. Based on limited permeability data (indicated on the cross-section in Figure 12) the glacial till would seem to have a rather low permeability (similar to that of the aforementioned thick wedge of head and deeply weathered bedrock). It too will act as a potential confining layer to the higher (10-6 m/s) permeability bedrock. The position of the upslope feather edge of the glacial till, together with the permeability of the hillwash, thus seem to play a key role in determining bedrock water levels beneath the lower part of the slope. If the shallow high permeability bedrock is completely confined by glacial till, or the hillwash has low permeability, bedrock groundwater levels are at shallow depth beneath the lower part of the slope. If, on the other hand, the shallow high permeability bedrock is not fully confined by glacial till and the hillwash layer has higher permeability, then leakage takes place and water pressures are relieved by downslope flow into and through the sandy hillwash layer. The lower of the two water level profiles is thus developed, or some intermediate profile determined by the actual degree of confinement and the permeability of the hillwash.
Note that these two scenarios essentially recapitulate the situation that would have pertained before the peat was deposited: with local springs arising at a particular elevation and issuing bedrock groundwater, separated by areas with no springs, but probably seepages extending higher up the slope due to the higher upslope bedrock groundwater levels.
It is of interest to note that the very shallow (sub-artesian) bedrock groundwater zone that occurs between 31-34.5mOD (as seen in Figure 12) is also manifested in the peat groundwater unit at this elevation, as discussed in Section 8.3.
For
insp
ectio
n pur
pose
s only
.
Conse
nt of
copy
right
owne
r req
uired
for a
ny ot
her u
se.
EPA Export 12-11-2014:23:31:42

Shell E & P Ireland Ltd Corrib Terminal: Bellanaboy BridgeGeology, Hydrogeology and Global Stability Planning Report
J:\C-1100\C1157\(2) DOCUMENTS\10\REPORTS\RP004_ISSUE2_C1157-10_GEOLOGY HYDROGEOLOGY GLOBAL STABILITY.DOC RP004
Page 16 Arup Consulting EngineersIssue 2 8 December 2003
How this complicated hydrogeology translates into actual bedrock groundwater levels beneath the terminal footprint area is shown in Figure 18, which has been constructed from available bedrock piezometers installed in boreholes in the terminal footprint area. The 32mOD contour marks the point of inflection on the average bedrock groundwater line in Figures 11 and 12. Downslope of the 32mOD contour, the bedrock groundwater surface essentially parallels the ground surface, upslope it rises but at a shallower angle than the ground slope. However, the fact that the bedrock groundwater contours are orientated at an acute angle to both the ground surface and the sub-peat surface contours (compare Figure 18 to Figures 3 and 16), indicates that the bedrock groundwater piezometric surface is declining westwards across the terminal footprint (i.e. away from the shallow bedrock ridge). Since the bedrock groundwater contours are essentially equipotential lines they enable the direction of groundwater flow to be determined, as indicated in Figure 16.
On the lowermost parts of the site (below 30mOD) only limited bedrock unit groundwater level data are available. Although these low-lying areas are of less direct consequence since the main development will take place further upslope, nevertheless it is important to consider the hydrogeology in these areas both from the point of view of global stability and for construction of the settlement ponds and the associated drainage pipe.
Compared to higher up the slope, the permeability profile is different. Now the bedrock and the glacial till are of uniformly low (10-7m/s) permeability and the hillwash is of higher (10-6m/s) permeability. What little water does migrate through the bedrock is not confined by the glacial till (because of the latter’s equivalent permeability), but leaks directly into the higher permeability hillwash and pressures are dissipated downslope within this layer. An important factor in terms of the hydrogeological behaviour of the hillwash layer is that despite being covered by much lower (10-8m/s) permeability peat, this covering is not fully water-tight over the whole site. Deep drains (such as drain D22) either expose the hillwash layer or come close to exposing it, allowing sub-peat groundwater to reach the surface. The hillwash thus sets a limit on bedrock groundwater level rise on the lowermost parts of the site, as is shown tentatively in Figure 12 and in the cross-section (Figure 11), where the mean bedrock groundwater level is indicated as being 1.5m below existing ground level.
If relief of bedrock groundwater pressures, via the hillwash layer to surface drainage, does not occur then sub-artesian or even artesian conditions may exist down slope: IGSL borehole BH W7 being an example. Such non-relief of bedrock groundwater pressures may occur for a variety of reasons: the hillwash may not be very permeable locally; surface drains may not be effective.
Alternatively, relief of bedrock groundwater pressures may be very effective; in which case lower than average bedrock groundwater levels may be experienced, as in IGSL BHP12 and MIN BH OB3.
Note that the site is somewhat unusual in having had a large number of surface drains installed, some of them quite deep and cutting into the underlying mineral soil, which influence the shallow (peat) hydrogeology. Elsewhere (i.e. off-site), where undrained virgin blanket bog occurs at lower levels (below 30mOD), bedrock groundwater levels may be much closer to, or even above, ground level.
8.2 ‘A’ Horizon Groundwater Unit In Figure 12 there is a group of water level data points, identified by an oval-shaped envelope, that do not relate to the previously described bedrock groundwater unit. These data points, which occur above a ground elevation of 37mOD, relate to water levels recorded at relatively shallow depth within weathered bedrock and head deposit. As a group, the water levels can be considered as representing a perched water table.
For
insp
ectio
n pur
pose
s only
.
Conse
nt of
copy
right
owne
r req
uired
for a
ny ot
her u
se.
EPA Export 12-11-2014:23:31:42
Shell E & P Ireland Ltd Corrib Terminal: Bellanaboy BridgeGeology, Hydrogeology and Global Stability Planning Report
J:\C-1100\C1157\(2) DOCUMENTS\10\REPORTS\RP004_ISSUE2_C1157-10_GEOLOGY HYDROGEOLOGY GLOBAL STABILITY.DOC RP004
Page 17 Arup Consulting EngineersIssue 2 8 December 2003
While the group seems to form a trend, as indicated by the long axis of the oval, the alignment is at an acute angle to the existing ground surface, as can be seen in the cross-section in Figure 11. A downslope extrapolation of this trend would intersect the existing ground surface at about 36mOD.
The various piezometers in which this perched groundwater has been identified have their response zones within the mineral soil strata immediately underlying the peat. The sub-peat surface is known from visible exposures in the nearby quarry (see Plate 1., in Appendix D) and in IGSL trial pit TP E1 to exhibit a leached ‘A’ horizon. Soil leaching and podsolization (see, for instance: Reference 12) is known to have occurred extensively in this part of Ireland, and was a precursor to peat formation. The base of the ‘A’ horizon is often marked by a thin iron pan layer, in which iron oxides and other minerals become concentrated to form a rather impermeable cemented layer. Leaching also often involves downward movement of clay minerals, so that the ‘A’ horizon becomes preferentially more permeable compared to the underlying substrate.
The above explanation would thus appear to offer a compelling argument for the perched groundwater being associated with pedogenic (‘A’ horizon) soil development, essentially within the residual hillwash layer. Clearly, in progressing down slope this perched water (which receives recharge from the hillcrest area and from water draining downwards through the peat) becomes progressively more confined by the overlying peat, particularly the highly humified (H8-10) peat.
It is expected that the ‘A’ horizon will peter out down slope in the area where bedrock groundwater up-welling takes place: upward groundwater movement effectively supplanting downward leaching. The fact that the ‘A’ horizon does not connect downslope with the more permeable hillwash explains why groundwater levels within the ‘A’ horizon approach the surface downslope: the water effectively being trapped in this sloping wedge-like layer.
8.3 Peat Groundwater Unit It is difficult to consider peat as a groundwater unit, in the same sense as a bedrock or mineral soil. This is because, volumetrically, peat is 95% water, whereas in a bedrock or mineral soil, water typically represents less than 40% of the total volume. However, in peat the majority of the water is rather firmly bound to the decomposing plant matter, fixed by humic acids and other water-absorbing complexes.
It might be expected, therefore, that peat permeability would somehow be related to degree of humification (and thereby depth below ground level). To evaluate this possibility, permeability measurements made by falling head tests in push-in piezometers have been compared to von Post humification values measured in the corresponding gouge core holes. The plot of permeability against humification is shown in Figure 13, with measurements made in pairs of piezometers being indicated by a connecting line. Note that some suspect measurements have been excluded from this plot: these being ones where the permeability was higher in the lower piezometer.
Despite a general trend of increasing permeability with decreasing degree of humification, it is evident from Figure 13 that no simple relationship exists. It would appear, in fact, as if two trends are present, with MIN GC 13 and MIN GC 22 indicating a steeper and more linear (log linear) rate of increase, than the other data points. For reasons explained below it is thought that in many cases the calculated peat permeabilities may be in error; the falling head test having been affected by vertical pore pressure gradients, and the calculations by false assumptions about water levels and degree of saturation of the peat. It is further thought that only MIN GC 13 and MIN GC 22 give an accurate measure of the variation of permeability with humification. These results have been used to derive a notional relationship (shown by a thick black line in Figure 13) between permeability and humification. From this it can be seen that the near-surface (<H4) peat has a permeability greater than 2 x10⁻⁷m/s; the H4 – H8 peat
For
insp
ectio
n pur
pose
s only
.
Conse
nt of
copy
right
owne
r req
uired
for a
ny ot
her u
se.
EPA Export 12-11-2014:23:31:42

Shell E & P Ireland Ltd Corrib Terminal: Bellanaboy BridgeGeology, Hydrogeology and Global Stability Planning Report
J:\C-1100\C1157\(2) DOCUMENTS\10\REPORTS\RP004_ISSUE2_C1157-10_GEOLOGY HYDROGEOLOGY GLOBAL STABILITY.DOC RP004
Page 18 Arup Consulting EngineersIssue 2 8 December 2003
has a permeability in the range 2 x 10⁻⁷ to 6 x 10⁻⁹m/s range; while >H8 peat has a permeability of less than 6 x 10⁻⁹m/s range (i.e. virtually impermeable). These permeabilities are broadly in line with those quoted in Reference 5, from a variety of source references on peat.
How these permeabilities relate to the humification profile for the peat developed for the geological model is shown on the cross-section in Figure 11. The variation in permeability as indicated by the cross-section has a number of important consequences:
• The thinnest and most permeable peat occurs towards the top of the site, in the area of the hillcrest. Recharge, as a result of surface precipitation, is thus higher (by orders of magnitude) in the hill crest area compared to the low-lying parts of the site.
• On the higher parts of the site the lower section of the peat profile is only slightly less permeable than the underlying mineral soils and very weathered bedrock. Downward percolation of water is thus likely to be a continuous process resulting in near full saturation of the ground above the bedrock water table, due to capillary rise. Note that the sub-peat ground is only likely to be unsaturated in the hillcrest area, where higher permeability (10-6 m/s) fractured bedrock is present.
• Downslope of a ground elevation of about 37.5mOD, which marks the upslope limit of H8 – H10 peat, all the underlying materials are effectively confined by the peat, due to the significantly lower permeability of the basal, highly humified, part of the peat. Consequently, if the hillwash is locally defective as a drainage layer, bedrock water levels may be elevated.
On-site permeability measurements are not available for the uppermost 0.5m of the peat profile, which is typically taken to be the approximate depth of the acrotelum - the living part of the peat profile. Permeabilities in excess of 10-5m/s are, however, quoted in Reference 5, as being typical for the acrotelum of raised bog peat.
It is this higher permeability layer within the uppermost part of the peat profile that enables a separate, near-surface, perched water table to develop. A perched water table is only sustained, however, if precipitation exceeds run-off and evapo-transpiration. From measurements made on site this generally appears to be the case throughout much of the year (see also Reference 13).
Water level measurements made in shallow piezometers installed into the peat are shown collectively in Figure 14. In this figure, depth to peat groundwater is shown relative to ground elevation, as with previous plots. A number of interesting features are evident:
• The majority of measurements fall within 0.3m of the ground surface, indicating that the peat water table is very shallow. For this reason, it is not practical to represent it on the hydrogeological cross-section in Figure 11.
• There is a distinct clustering of points at or very near the ground surface between a ground elevation of 30mOD and 35.5mOD. At higher ground elevations the depth to water declines slowly, and more quickly at lower elevations.
The near-surface clustering of water level data points corresponds almost exactly in terms of ground elevation to the zone where the ‘A’ horizon groundwater levels and the upper half of the bedrock groundwater profile intersects the ground surface, as shown in Figure 12. Very shallow groundwater levels in the peat thus appear to reflect either subartesian (or possibly artesian) ‘A’ horizon water pressures or the zone of up-welling of bedrock groundwater, or both.
The decline in peat groundwater levels both upslope and downslope of this zone is the result of peat being under-drained in these areas. That is, peat groundwater can drain freely downwards into the underlying strata because sub-peat water pressures are less than
For
insp
ectio
n pur
pose
s only
.
Conse
nt of
copy
right
owne
r req
uired
for a
ny ot
her u
se.
EPA Export 12-11-2014:23:31:42
Shell E & P Ireland Ltd Corrib Terminal: Bellanaboy BridgeGeology, Hydrogeology and Global Stability Planning Report
J:\C-1100\C1157\(2) DOCUMENTS\10\REPORTS\RP004_ISSUE2_C1157-10_GEOLOGY HYDROGEOLOGY GLOBAL STABILITY.DOC RP004
Page 19 Arup Consulting EngineersIssue 2 8 December 2003
hydrostatic and the substrate is more permeable. In the upslope area direction under-drainage is in response to declining water levels in both the ‘A’ horizon groundwater unit and in the bedrock groundwater unit. In the downslope direction under-drainage is in response to lower water levels in the hillwash layer.
Under-drainage of the peat, except in the 30-35.5mOD elevation range, is further confirmed by Figure 15, which shows a plot of vertical pore pressure gradient within the peat, versus ground elevation. Vertical pore pressure gradient has been calculated from measurements of water level made in pairs of piezometers installed to different depths into the peat. If the lower piezometer records a lower water level than the upper piezometer, this indicates a downward gradient of pressure and, therefore, a potential for downward water movement.
This is what is indicated in the majority of pairs of piezometers, with the downward gradient increasing both upslope and downslope from a ground elevation of about 33mOD. At the latter elevation the gradient is minimal, indicating a lack of downward flow of groundwater; except that is for a group of points (to be discussed in the following section) that are to the right of the enveloping lines. High vertical gradients of pore pressure are thought to explain the anomalous permeability measurements, as discussed earlier.
The reason that peat groundwater levels appear decline much more rapidly downslope from 30mOD than upslope from 35.5mOD is thought to be due to negative pressures developed in the hillwash as a result of this layer discharging at atmospheric pressure into deep drains further downslope. However, this is not reflected in the vertical pore pressure gradients in the peat (in Figure 15), as might be expected.
8.4 Sub-Surface Springs Previous reference has been made to areas on the site where up-welling of bedrock groundwater seems to take place; these areas being where former surface springs existed.
Figure 11 indicates that within a sub-peat elevation range of 34.5mOD to 30mOD, bedrock groundwater unit water levels may be expected to emerge onto the sub-peat surface. Downslope of the lower of these two elevations, the model indicates springs are unlikely because of:
• An increasing thickness of confining glacial till.
• The bedrock has too low a permeability.
• The hillwash acts as an effective drainage layer.
Figure 15 indicates that the peat is a sensitive indicator of vertical groundwater flow, responding to confined water pressures in the underlying bedrock groundwater unit. At an elevation where bedrock groundwater levels are otherwise high (resulting in a low average pore pressure gradient in the peat), pore pressure gradient values, which are high would suggest that that bedrock water pressures are being dissipated e.g. by outflow from springs into the hillwash layer. Gouge core holes MIN GC 25 and MIN GC 18 (and to a lesser extent MIN GC 6) are cases in point.
Similarly, in Figure 12 at surface elevations where bedrock unit groundwater levels are otherwise at shallow depth, piezometers recording deeper water levels may indicate proximity to springs. Boreholes IGSL BH W5 and LAN BH 5 are cases in point.
When these two sets of locations are seen in plan, on a map showing the sub-peat surface (Figure 16), IGSL BH W5 and MIN GC 25 can be seen to be virtually coincident, and all three separate location appear to correspond to minor valleys developed on the sub-peat surface. In the case of MIN GC 18 the downslope CPTs confirm very well-developed sand layers within the hillwash.
For
insp
ectio
n pur
pose
s only
.
Conse
nt of
copy
right
owne
r req
uired
for a
ny ot
her u
se.
EPA Export 12-11-2014:23:31:42

Shell E & P Ireland Ltd Corrib Terminal: Bellanaboy BridgeGeology, Hydrogeology and Global Stability Planning Report
J:\C-1100\C1157\(2) DOCUMENTS\10\REPORTS\RP004_ISSUE2_C1157-10_GEOLOGY HYDROGEOLOGY GLOBAL STABILITY.DOC RP004
Page 20 Arup Consulting EngineersIssue 2 8 December 2003
At the other extreme, MIN GC 23, which records the lowest vertical pore pressure gradient (see Figure 15), corresponds approximately in location to IGSL BH P7, which shows a very high bedrock groundwater level. Figure 16 shows that this location corresponds to a shallow bedrock ridge. Note that this location is referred to again in Section 10.1 in terms of implications for site development.
For
insp
ectio
n pur
pose
s only
.
Conse
nt of
copy
right
owne
r req
uired
for a
ny ot
her u
se.
EPA Export 12-11-2014:23:31:42
Shell E & P Ireland Ltd Corrib Terminal: Bellanaboy BridgeGeology, Hydrogeology and Global Stability Planning Report
J:\C-1100\C1157\(2) DOCUMENTS\10\REPORTS\RP004_ISSUE2_C1157-10_GEOLOGY HYDROGEOLOGY GLOBAL STABILITY.DOC RP004
Page 21 Arup Consulting EngineersIssue 2 8 December 2003
9. HYDROCHEMISTRY This section of the report explores the link between the chemistry of the groundwater and particular features of the geology and hydrogeology relevant to the model. All of the hydrochemical data relating to the site are summarised in Reference 14.
Groundwater hydrochemical data is presented as a series of graphical plots in Figure 17. The following determinands have been selected: iron, manganese, calcium, magnesium, chloride and total alkalinity. The metal ions can be considered as having been derived from the medium through which the groundwater passes and similarly with the alkalinity. Given the proximity of the site to the coast and the prevailing westerly wind direction, chloride is most likely to be an extraneous ion derived directly from seawater as an aerosol spray and precipitated onto the site as rainwater.
The data relate to two sampling events in May and November 2002. Not all the boreholes were sampled on both occasions, but where they were the results have been averaged for the purpose of plotting. The results are plotted against ground elevation at the point of sampling; no attempt has been made to incorporate depth below ground level at which the water sample was taken.
The data points have been grouped according to water samples derived from peat (in this case shallow water samples from within 0.5m of the ground surface), mineral soil and bedrock.
Note that further hydrochemical testing will be undertaken as part of the ongoing investigation work. These tests are intended to increase the understanding of the hydrochemistry of the groundwater.
9.1 Iron and Manganese As might be expected (see Figures 17a and 17b), iron and manganese exhibit similar behaviour. Both ions are present at very low concentrations in the near-surface peat and in the mineral soil, but occur at relatively high concentrations in the bedrock (above current drinking water standards).
Within the bedrock there appears to be a trend of increasing concentration in progressing up slope, which would seem to extend all the way up the slope in the case of manganese, but is reversed at higher elevations in the case of iron. There are fewer data points on the middle part of the slope to confirm these diverging trends.
The data would seem to confirm that both iron and manganese are derived from the bedrock and are confined to the groundwater within the bedrock. The increase in concentration upslope would also seem to equate to a higher rate of leaching of iron and manganese towards the crest of the hill, where higher rates of recharge are presumed to occur as a result of the thinness and higher permeability of the peat (see Section 8.3). Note that the decrease in alkalinity (or, conversely, increase in acidity) on the upper half of the slope, as indicated by Figure 17f, would suggest that acidic groundwater percolating downwards through the peat is responsible for this leaching. It was noted earlier (Section 6.1) that bog peat appears to dominate the peat profile on the upper part of the slope, compared to fen peat on the lower part of the slope. Bog peat is known to produce more acidic groundwater (than fen peat, see Reference 5).
9.2 Calcium and Magnesium As indicated by Figures 17c and 17d, calcium and magnesium also exhibit similar behaviour. Both ions are present at very low concentrations in the near-surface peat, but occur at somewhat higher concentrations in the mineral soil and bedrock. In the latter case there is a
For
insp
ectio
n pur
pose
s only
.
Conse
nt of
copy
right
owne
r req
uired
for a
ny ot
her u
se.
EPA Export 12-11-2014:23:31:42
Shell E & P Ireland Ltd Corrib Terminal: Bellanaboy BridgeGeology, Hydrogeology and Global Stability Planning Report
J:\C-1100\C1157\(2) DOCUMENTS\10\REPORTS\RP004_ISSUE2_C1157-10_GEOLOGY HYDROGEOLOGY GLOBAL STABILITY.DOC RP004
Page 22 Arup Consulting EngineersIssue 2 8 December 2003
clear trend of increasing concentration at higher elevations on the site, but this is tempered by an increase in the range of concentrations present at higher elevations, as indicated by the diverging boundary lines.
In the case of calcium, higher concentrations are clearly associated with the mineral soil and lower concentrations with the bedrock. This in not quite so clear-cut in the case of magnesium.
As with iron and manganese, calcium and magnesium are thought to be derived by leaching from the bedrock and mineral soils, the increase in concentration upslope reflecting increased downward percolation of acidic groundwater from the peat. The trend of higher concentration in the mineral soil (particularly in the case of calcium) probably reflects a greater presence as carbonate minerals resulting from a tendency for calcium to move upwards in the soil profile under past atmospheric (pedogenic soil forming) conditions.
The slight increase in both calcium and magnesium noted in gouge core GC13 may reflect upwelling of groundwater at this elevation, although there are insufficient data points to confirm this.
9.3 Chloride Chloride (see Figure 17e) exhibits a very different behaviour from the other determinands, which reflects its extraneous introduction into the groundwater environment as noted earlier. Apart from the one very high value (borehole BR4), which is difficult to explain, all the other data points are grouped very closely together.
The near-surface peat values are the lowest and do not exhibit any clear trend of variation with elevation on the site. This is what would be expected given that concentration of chloride in rainwater is likely to be uniform across the site. A common trend of decreasing concentration of chloride with increasing elevation is exhibited by the mineral soil and bedrock, although the rate of decrease upslope is very slight. This trend is thought to reflect the increasing degree of confinement of the mineral soils and bedrock in progressing downslope due to the increased thickness and degree of humification of the overlying peat. Increase in chloride content with degree of confinement is a common feature of confined aquifers and reflects decreasing mobility of the groundwater.
9.4 Alkalinity As would be expected, alkalinity in the near-surface peat is uniformly very low (as indicated by Figure 17f). That of the mineral soil and bedrock, which together appear to exhibit a common trend, reaches a minimum at the highest elevation on the site, rises to a maximum concentration at an elevation of about 37mOD and then declines over the lower parts of the site.
On the lower parts of the site, rise in alkalinity with increasing elevation (with higher concentrations in the mineral soil than in the bedrock), mirrors the trend of concentration in calcium and magnesium. It probably reflects the increasing concentration of carbonate in the groundwater resulting from leaching of soluble carbonate minerals (mainly calcium carbonate) from the bedrock. At higher elevations on the site the downward percolation of acidic groundwater from the peat effectively neutralises the excess alkalinity, hence the trend of decreasing alkalinity at higher elevations.
For
insp
ectio
n pur
pose
s only
.
Conse
nt of
copy
right
owne
r req
uired
for a
ny ot
her u
se.
EPA Export 12-11-2014:23:31:42

Shell E & P Ireland Ltd Corrib Terminal: Bellanaboy BridgeGeology, Hydrogeology and Global Stability Planning Report
J:\C-1100\C1157\(2) DOCUMENTS\10\REPORTS\RP004_ISSUE2_C1157-10_GEOLOGY HYDROGEOLOGY GLOBAL STABILITY.DOC RP004
Page 23 Arup Consulting EngineersIssue 2 8 December 2003
10. GLOBAL STABILITY This section of the report considers the geotechnical stability of the terminal site, not just in terms of the stability of the site itself, but in relation to the stability of its surroundings; this is often referred to as global stability. There are three primary objectives of a global stability study:
• To demonstrate that the chosen site is acceptable from a geotechnical stability standpoint.
• To consider the potential of the development to impact adversely on the geotechnical stability of its surroundings, and vice versa.
• To identify any residual instability issues, so that these can be mitigated by engineering design.
By geotechnical stability is meant the stability associated with the ground, the materials forming the ground, the ground slope and the groundwater. It also encompasses changes in slope geometry and loads resulting from the development.
In a more global context, many natural agencies and processes, and some historic anthropogenic (i.e. man-made) factors, can be the trigger or direct cause of geotechnical instability - such as seismic activity, fault rupture, flooding, underground mining, karstification, deep-seated slips, to name but a few. Engineering site development can also initiate instability, either directly or indirectly, in situations where a potential for instability exists. Instability, once initiated, may be confined to the site, it may extend from neighbouring areas onto the site, or it may extend off-site to affect surrounding areas and property.
Global stability, in the context of the Bellanaboy Terminal site, has to do primarily with slope stability and the potential for mass movement, specifically in relation to the peat and the mineral soils immediately underlying the peat. To a lesser extent it has to do with ground bearing stability and settlement of the peat under surface loading.
Potential for slope instability and mass movement has been considered in three ways:
1. From a review of documentary records of peat slope instability and mass movement phenomena in various parts of Ireland, and their probable causes.
2. From a project-specific morphological study, using aerial photographs, topographic and geological maps, geological/hydrogeological data derived from the site, and supported by a reconnaissance survey of the area.
3. By geotechnical analysis.
10.1 Historic Review of Peat Slope Instability and Mass Movement An historic review of peat slope instability and mass movement was carried out by AGEC (Reference 6), in connection with an earlier terminal development scheme involving on-site retention of the peat in a repository. That review is reproduced here, with only slight modifications, since it is equally applicable to the present scheme.
The modifications that have been made involve reference to two recent (2003) slope failures at Pollatomish, Co. Mayo and Derrybrien, Co. Galway. Information on these slope failures has been extracted from public domain reports, OS maps, geological maps and aerial photographs available at the GSI.
For
insp
ectio
n pur
pose
s only
.
Conse
nt of
copy
right
owne
r req
uired
for a
ny ot
her u
se.
EPA Export 12-11-2014:23:31:42

Shell E & P Ireland Ltd Corrib Terminal: Bellanaboy BridgeGeology, Hydrogeology and Global Stability Planning Report
J:\C-1100\C1157\(2) DOCUMENTS\10\REPORTS\RP004_ISSUE2_C1157-10_GEOLOGY HYDROGEOLOGY GLOBAL STABILITY.DOC RP004
Page 24 Arup Consulting EngineersIssue 2 8 December 2003
10.1.1 Mass Movements of Irish Peat Bogs
The phenomenon of large-scale downslope movement of peat bogs is peculiar to Ireland and seems to rarely affect other countries with significant peat deposits (Reference 15). Over forty historical bog failures have been reported in the literature and these are summarised by Feehan and Donovan (Reference 16), see Table 10.1, which includes failures in both blanket bog and raised bog. The locations of these failures are shown in Figure 19.
Classification of mass movement defines two dominant types of failure in peat (Reference 17), namely:
• Bog flows, or bog bursts as they or more commonly referred to. This type of debris flow involves large quantities of water and peat debris, which flow down-slope usually following existing surface water channels. Large-scale bog bursts are usually associated with raised bogs where there is an upper fibrous layer over a lower body of weak amorphous peat.
• Bog slides. These, in contrast, appear to be much more localised in occurrence than bog bursts. Bog slides comprise a mass of intact bog that moves bodily downslope, usually over a comparatively short distance. Records indicate that slides usually affect blanket bogs.
Table 10.1 List of Selected Historical Bog Failures (after Reference 15)
Year and Date of Incident
Description of Incident Figure 3 Reference
Before 1640 Clogher, County Tyrone 1
1697, June 7 Kapanihane bog, County Limerick, near Charleville. Meadow and pasture adjoining the bog moved over land of similar nature, and was followed by a mass of the bog.
2
1708 Poulevard or Castlegarde bog, County Limerick, moved along a valley, burying houses and twenty-one people. It was over 1.5km long, 4km wide and about 6m deep in parts.
3
1712, March Clogher 4
1745, March 28 Bog of Addergoole, Dunmore, County Galway. Ten acres of bog moved down a stream course, covering 30 acres of pastures, and dammed water destroyed some 50 or 60 acres.
5
1786 Gorteenameale in Slieve Bloom. 33
1788, March 27 Bog near Dundrum, County Tipperary. A large bog of 1,500 acres burst, deluging a vast tract of fertile land with mud.
6
1788, May Knocklayd, County Antrim. 39
1809, December 16 Bog of Rine, Camlin river, County Longford. “Twenty acres of bog burst asunder in numerous places”. The debris dammed the drainage so as to submerge 170 acres.
7
1819, January Owenmore Valley, Erris, County Mayo. Overflow of a mountain tarn caused bursting of a large bog which confined the waters of the lake. The bog carried boulders, bog timber, as well as stones, roofs and inhabitants of houses in a small hamlet which lay in its path.
8
1821, June 19 and 26
Kilmaleady bog near Clara, County Offaly, 500 acres in area, and 50 feet deep in places. Part of this bog moved 3 miles, covering an area of about 150 acres when it came to rest.
9
1821, September Joyce Country, Galway. 10
1824, December Ballywindelland, County Derry. 11
1832, January Geevagh, County Sligo. 12
1840, January Kanturk, County Cork. 14
1835, September Randalstown, County Antrim. 13
For
insp
ectio
n pur
pose
s only
.
Conse
nt of
copy
right
owne
r req
uired
for a
ny ot
her u
se.
EPA Export 12-11-2014:23:31:42

Shell E & P Ireland Ltd Corrib Terminal: Bellanaboy BridgeGeology, Hydrogeology and Global Stability Planning Report
J:\C-1100\C1157\(2) DOCUMENTS\10\REPORTS\RP004_ISSUE2_C1157-10_GEOLOGY HYDROGEOLOGY GLOBAL STABILITY.DOC RP004
Page 25 Arup Consulting EngineersIssue 2 8 December 2003
Table 10.1 (cont’d) List of Selected Historical Bog Failures (after Reference 15)
Year and Date of Incident
Description of Incident Figure 3 Reference
1867 Glen Castle Hill, Belmullet, County Mayo. 15
1870, December 14 Tulla bog, near Castlereagh, County Roscommon. The deposit of mud left on the low ground extended six or seven miles along the valley of the Suck, covering 165 acres.
16
1873, October 1 A bog, near Dunmore, County Galway, slowly moved down the valley of the Dunmore river, burying 3 farmhouses and covering 300 acres of farm land under 2m of peat.
17
1883, January 25 A bog between Moor and Baslick, Castlereagh, County Roscommon. The bog flow covered 4,000 acres of land; three houses had to be abandoned, several roads blocked.
19
1883, January 30 A bog near Newtownforbes, County Longford, started to move. 18
1890, January 27 Bog at Loughatorick North, County Galway (Slieve Aughty Mountains). An area of 100 acres was covered with a foot of peat, the upper part of the bog subsiding 10 or 12 feet.
20
1896, August 9 Dungiven bog, County Derry, 10 to 30 feet deep, burst and flowed downstream without doing damage, the gradient being steep – one in twelve in the bog itself.
21
1896, December 28 Knocknageeha bog above the Ownacree Valley, County Kerry; eight people killed. 22
1900 Ballaghline, near Lisdoonvarna, County Clare. Two people killed, much damage to land.
23
1906, June County Offaly, near Ballycumber. 24
1909 Kilmore, County Galway; woman killed in her sleep when overwhelmed by liquid peat.
34
1931, February Lake Carrowmore near Bangor, County Mayo; loss of animals and damage to land. 25
1934, October Slieve Aughty Mountains, County Clare. 26
1937, spring On the slopes of Mullaghcleevaun, Wicklow Mountains. 27
1938, July Lough Bray, County Wicklow. 28
1945, January Glen valley, County Donegal. 29
1954 Derrylea, County Kildare. 35
1963, November Cushendum, County Antrim. 30
1963, November Barnesmore, County Donegal. 31
1965, January Slieve Rushen, County Cavan. 32
1973 Slieve Bloom, edge of plateau on Offaly side; many earlier flow scars in evidence. 36
1980 Seven sides in the Slieve-an-Orra hills, County Antrim, all at around the same time. 37
1984 Straduff, County Sligo; the fourth flow recorded here since 1831. This flow had a volume of 81,000m3.
38
1988 Above Gorteenameale, Slieve Bloom, County Laois. 33
10.1.2 Controlling Mechanisms of Bog Failures
To highlight likely failure mechanisms involved in the failure of peat bogs a number of case histories were collated where details such as the failure type, geometry of the slope, scale of failure and weather conditions were available. These case histories are listed in Table 10.2.
For
insp
ectio
n pur
pose
s only
.
Conse
nt of
copy
right
owne
r req
uired
for a
ny ot
her u
se.
EPA Export 12-11-2014:23:31:42
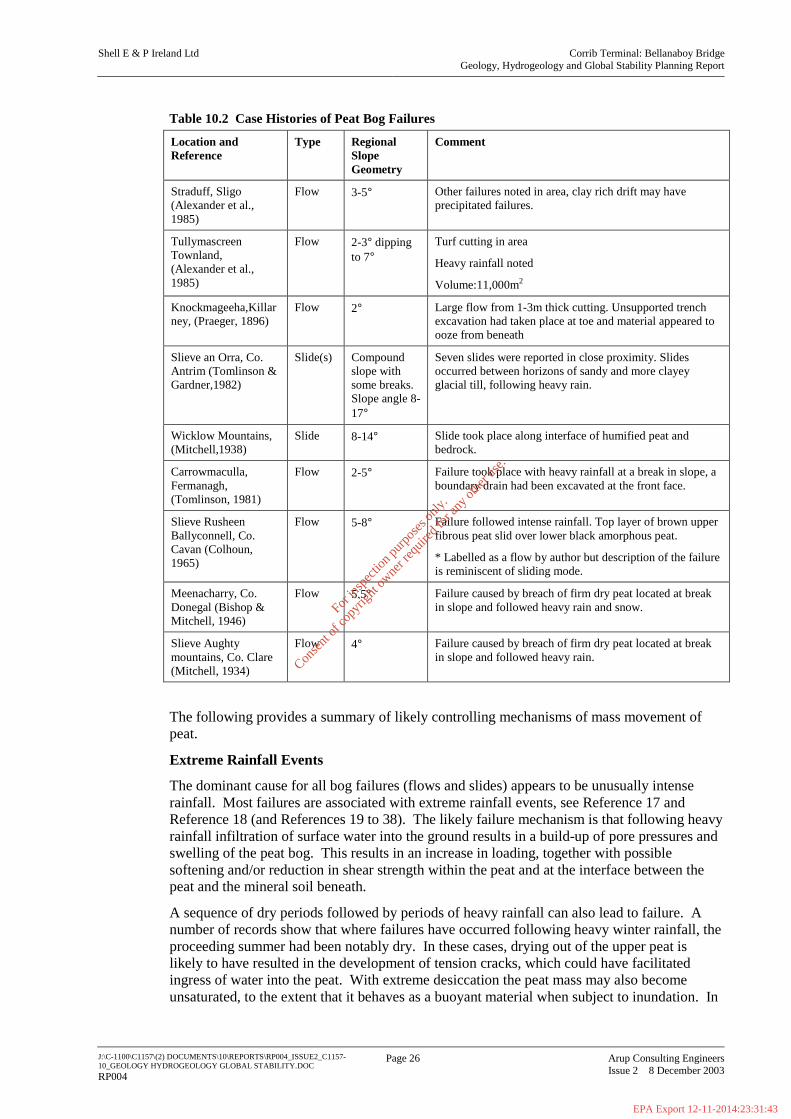
Shell E & P Ireland Ltd Corrib Terminal: Bellanaboy BridgeGeology, Hydrogeology and Global Stability Planning Report
J:\C-1100\C1157\(2) DOCUMENTS\10\REPORTS\RP004_ISSUE2_C1157-10_GEOLOGY HYDROGEOLOGY GLOBAL STABILITY.DOC RP004
Page 26 Arup Consulting EngineersIssue 2 8 December 2003
Table 10.2 Case Histories of Peat Bog Failures
Location and Reference
Type Regional Slope Geometry
Comment
Straduff, Sligo (Alexander et al., 1985)
Flow 3-5° Other failures noted in area, clay rich drift may have precipitated failures.
Tullymascreen Townland, (Alexander et al., 1985)
Flow 2-3° dipping to 7°
Turf cutting in area
Heavy rainfall noted
Volume:11,000m2
Knockmageeha,Killarney, (Praeger, 1896)
Flow 2° Large flow from 1-3m thick cutting. Unsupported trench excavation had taken place at toe and material appeared to ooze from beneath
Slieve an Orra, Co. Antrim (Tomlinson & Gardner,1982)
Slide(s) Compound slope with some breaks. Slope angle 8-17°
Seven slides were reported in close proximity. Slides occurred between horizons of sandy and more clayey glacial till, following heavy rain.
Wicklow Mountains, (Mitchell,1938)
Slide 8-14° Slide took place along interface of humified peat and bedrock.
Carrowmaculla, Fermanagh, (Tomlinson, 1981)
Flow 2-5° Failure took place with heavy rainfall at a break in slope, a boundary drain had been excavated at the front face.
Slieve Rusheen Ballyconnell, Co. Cavan (Colhoun, 1965)
Flow 5-8° Failure followed intense rainfall. Top layer of brown upper fibrous peat slid over lower black amorphous peat.
* Labelled as a flow by author but description of the failure is reminiscent of sliding mode.
Meenacharry, Co. Donegal (Bishop & Mitchell, 1946)
Flow 5.5° Failure caused by breach of firm dry peat located at break in slope and followed heavy rain and snow.
Slieve Aughty mountains, Co. Clare (Mitchell, 1934)
Flow 4° Failure caused by breach of firm dry peat located at break in slope and followed heavy rain.
The following provides a summary of likely controlling mechanisms of mass movement of peat.
Extreme Rainfall Events
The dominant cause for all bog failures (flows and slides) appears to be unusually intense rainfall. Most failures are associated with extreme rainfall events, see Reference 17 and Reference 18 (and References 19 to 38). The likely failure mechanism is that following heavy rainfall infiltration of surface water into the ground results in a build-up of pore pressures and swelling of the peat bog. This results in an increase in loading, together with possible softening and/or reduction in shear strength within the peat and at the interface between the peat and the mineral soil beneath.
A sequence of dry periods followed by periods of heavy rainfall can also lead to failure. A number of records show that where failures have occurred following heavy winter rainfall, the proceeding summer had been notably dry. In these cases, drying out of the upper peat is likely to have resulted in the development of tension cracks, which could have facilitated ingress of water into the peat. With extreme desiccation the peat mass may also become unsaturated, to the extent that it behaves as a buoyant material when subject to inundation. In
For
insp
ectio
n pur
pose
s only
.
Conse
nt of
copy
right
owne
r req
uired
for a
ny ot
her u
se.
EPA Export 12-11-2014:23:31:43

Shell E & P Ireland Ltd Corrib Terminal: Bellanaboy BridgeGeology, Hydrogeology and Global Stability Planning Report
J:\C-1100\C1157\(2) DOCUMENTS\10\REPORTS\RP004_ISSUE2_C1157-10_GEOLOGY HYDROGEOL OGY GLOBAL STABILITY.DOC RP004
Page 27 Arup Consulting Engineers Issue 2 8 December 2003
an unsaturated condition water entry into the peat mass is impeded by air in the pore spaces, so a condition of buoyancy may persist for some time.
In this respect, the recent landslides at Pollatomish are no exception. As the authors of the report on the landslides (Reference 39) note: “The primary cause of the more than 40 separate landslides in the Pollatomish area was exceptional rainfall, of such intensity as to overwhelm natural drainage systems in the peat and weathered rock, thereby mobilising sections of overburden through buoyancy and gravitational forces”. In this instance, the rainfall intensity, which was extremely localised, was equivalent to the 1 in a 100-year event and followed an exceptionally dry summer.
Slope Morphology A number of descriptions of bog failures, for example Reference 17 and Reference 32, note the presence of a convex break in slope at the source of the breach.
It appears that material gathers at the extremity of the upper slope and because of the favourable down-slope drainage conditions, a mound of well-drained, relatively strong peat material develops. This mound acts as a barrier providing containment for growth of peat upslope.
This mound can subsequently fail due to a build-up of lateral pressure on the upslope face. Alternatively, a failure mechanism, analogous to a piping failure underneath dams, has been noted where springs are present in locations immediately down-slope of the dried peat barrier. High pore pressure gradients within the peat can lead to hydraulic failure and undermining of the mound. Where the mound is breached, the peat bog upslope loses lateral support and moves downslope.
Slope Angle Figure 20 shows a plot of available data on pre-failure slope angles. The failures are grouped in terms of bogs slides, natural bog bursts and man-influenced bog bursts. The latter are caused through human intervention, such as peat removal at the downslope margin and excavation for drainage.
From Figure 20, it is seen that the various failure types occurred within different ranges of slope angles. Sliding failures are associated with regional slope angles above 60, natural bog flow failures occur within a narrow range of regional slope angle between 30 and 5.50. Bog flow failures with man interference have occurred on slopes as shallow as 20.
The data suggests that a natural failure, that is without man interference, in peat bogs has little chance of occurring on regional slopes below about 30.
Drainage Natural drainage and man-made drainage measures designed to reduce the water content in the peat have often been identified as a contributory cause of some failures. The drainage paths have allowed the migration of water to a failure site, thereby precipitating failure. In some instances, agricultural works led to the disturbance of an existing drainage network and eventually caused failure.
Man-made Interference Man-made interference of peat bogs includes trackways constructed across peat land and peat cutting for turf for use as domestic fuel. These cause, respectively, loading of the peat and removal of support. Peat cutting for turf has been a contributory cause in several documented failures.
For
insp
ectio
n pur
pose
s only
.
Conse
nt of
copy
right
owne
r req
uired
for a
ny ot
her u
se.
EPA Export 12-11-2014:23:31:43

Shell E & P Ireland Ltd Corrib Terminal: Bellanaboy BridgeGeology, Hydrogeology and Global Stability Planning Report
J:\C-1100\C1157\(2) DOCUMENTS\10\REPORTS\RP004_ISSUE2_C1157-10_GEOLOGY HYDROGEOLOGY GLOBAL STABILITY.DOC RP004
Page 28 Arup Consulting EngineersIssue 2 8 December 2003
Re-current Failures
The presence of relic failures is often noted at the sites of failures, indicating that particular site conditions exist that encourage the development of these failures. The combination of geological and climatic conditions that prevail at these sites is, therefore, somewhat unique. This suggests that the probability of first-time failures is less likely at sites with no previous history of failure.
Age and Condition
Peat, being an organic material, is susceptible to decomposition and decay by processes, which are collectively known as humification. Humification results in the progressive breakdown of plant structures to produce, in the limit, an amorphous, gelatinous, peat whose shear strength is dependent on cohesion, thixotropy and water content. This process progresses at different rates depending on the nature of the plant matter, the rate of peat accumulation, the water level in the peat, its acidity, and a host of other factors. Fen peats are more susceptible to advanced humification, than bog peats, because of their less fibrous and woody plant species.
Nevertheless all peat deposits allowed to develop under suitable natural conditions will, given time, reach a stage where they can be considered potentially “ripe for instability“. Time in this sense is measured in hundreds or thousands of years. Ripe for instability effectively means, in geotechnical terms, that the factor of safety against failure has fallen to less than 1. Whether instability is inevitable depends on the rate of consolidation (dewatering) of the peat, and the associated gain in strength, keeping pace with the rate of humification. It also depends on how the form of the peat deposit (its morphology and slope angle) changes with time.
While the concept of “ripeness” is both difficult to measure and quantify, it is evident that many spontaneous peat failures, particularly those of the bursting type, involve peat deposits that have reached an advanced stage of ripeness.
10.1.3 Historical Occurrence and Frequency of Slope Failures
A histogram detailing number of bog failures over 50-year periods since 1700AD is shown in Figure 21. Assuming that a lack of scientific interest and/or reporting resulted in the small number of reported events prior to 1800AD, it would appear that approximately eight such events occur every 50 years.
It is clearly far too early to judge the number that is likely to occur in the next 50-year period. It would also be wholly inappropriate to speculate that the two recent slips (at Pollatomish and Derrybrien), both of which would be considered as sizeable events on the basis of scale and damage to property and infrastructure, necessarily suggest a total higher than 8. This is because two events in the same year appear to be a common occurrence based on the historical record.
However, if the projections of climate change are correct (Reference 40) with the expectation of drier summers, wetter winters and more intense rainfall events, then the likelihood is that the frequency of bog failures will increase. Prudent engineering design of developments in peatland areas is, therefore, likely to be even more important in the future.
Although they are clearly an engineering phenomenon, the study of bog failures appears to be a research area confined to geographers and scientists. As such, the case histories tend not to include a great deal of information that would allow a detailed engineering analysis to be undertaken to examine the failure mechanisms and define the operational strength of materials. However, increased understanding of the form and mechanisms involved in bog failures in the last fifty years means that closer examination of the failures reported over that time-scale is a useful exercise.
For
insp
ectio
n pur
pose
s only
.
Conse
nt of
copy
right
owne
r req
uired
for a
ny ot
her u
se.
EPA Export 12-11-2014:23:31:43

Shell E & P Ireland Ltd Corrib Terminal: Bellanaboy BridgeGeology, Hydrogeology and Global Stability Planning Report
J:\C-1100\C1157\(2) DOCUMENTS\10\REPORTS\RP004_ISSUE2_C1157-10_GEOLOGY HYDROGEOLOGY GLOBAL STABILITY.DOC RP004
Page 29 Arup Consulting EngineersIssue 2 8 December 2003
Of the eight case histories, two (possibly three, see Table 10.2) can be described as bog slides. One case history (Reference 17) detailed the occurrence of seven approximately simultaneous slides within close geographical proximity to each other in the Antrim mountains. The latter appear very similar to the recent Pollatomish slides. Of the five occurrences of bog flows, two were clearly caused by human activity leaving three sites where examination showed no evidence of a human trigger to the flow. Of these three sites all displayed evidence of past failures in the form of (usually numerous) relic failure features.
10.1.4 Summary of Mass Movements of Irish Peat Bogs
A summary of the main points based on the review of mass movement of Irish peat is as follows:
1. Bog failures take the form of either bog flow (bursts) or bog slides. Records suggest that raised bogs may be more prone to bog bursts and that bog slides are possibly more common on blanket bogs.
2. Most, if not all, failures occur during or immediately following periods of heavy rainfall. Therefore, an understanding of local drainage patterns is essential in understanding the likely occurrence of a failure. Also an appreciation of the potential impact of climate change is important.
3. Sites that have experienced failure in the past are more likely to be affected by re-current failure. This suggests that the probability of first-time failures is less likely at sites with no previous history of failure.
4. Naturally occurring bog flows (not triggered by man-interference) appear to occur at regional slope angles of between 30 and 60.
5. Bog slides appear to occur at regional slope angles steeper than 60.
6. The data tends to suggest that natural failures in peat bogs are less likely to occur at regional slope angles below about 30.
7. A significant proportion of bog failures tend to be caused by human activity. Natural peat slopes at regional slope angles of about 20 have failed due to uncontrolled man interference. Important lessons can be learned from these failures and should be borne in mind when construction is being undertaken in the vicinity of these areas:
• Any excavation, which may tend to undermine or otherwise compromise the downslope support of a peat slope, should be sufficiently retained so as to resist movement of the slope. Consideration should be given to the potential for hydraulic (piping) failure.
• Loading of slopes e.g. by placing of spoil directly onto peat, should be avoided.
• Careful attention should be given to the existing drainage and how a structure or development may affect this.
10.2 Morphological Study
10.2.1 Study Area and Study Methodology
A morphological study has been carried out of an area surrounding the site; the area having been chosen on the basis of a commonality of landscape features with the terminal site itself. The area, which covers approximately 20km2, is shown in Figure 22. The natural boundaries to this area are: Sruwaddacon Bay and the Glenamoy River, to the north and east; the rising ground of Slieve Fyagh, to the south and the rising ground of Bellanaboy ridge and the expanse of Carrowmore Lake, to the west. An examination of the 1:50,000 Discovery Series
For
insp
ectio
n pur
pose
s only
.
Conse
nt of
copy
right
owne
r req
uired
for a
ny ot
her u
se.
EPA Export 12-11-2014:23:31:43

Shell E & P Ireland Ltd Corrib Terminal: Bellanaboy BridgeGeology, Hydrogeology and Global Stability Planning Report
J:\C-1100\C1157\(2) DOCUMENTS\10\REPORTS\RP004_ISSUE2_C1157-10_GEOLOGY HYDROGEOLOGY GLOBAL STABILITY.DOC RP004
Page 30 Arup Consulting EngineersIssue 2 8 December 2003
OS map (see Figure 22) shows that the surrounding areas differ quite significantly from the study area.
It should be noted that the study area also represents the area within which consideration of ‘acceptable stability’ is appropriate.
The basic methodology of the study has been to look at the area from the point of view of the occurrence of those factors or features that may contribute to, or be a manifestation of, instability. These factors and features have been discussed in the previous section. An attempt has then made to define the aerial extent of each factor or feature within the study area as a whole. By adding all of the factors/features together in map form the intention is to categorise and grade the area in terms of potential risk.
10.2.2 Aerial Photograph Study
Several dates and scales of aerial photography, as indicated in the following table, were examined stereoscopically:
Source Photography Image type Contact Scale Date of Photography
Corrib Project Colour 1:10,000 12/09/03
Corrib Project Colour 1:10,000 24/08/00
Geological Survey Ireland B & W 1:30,000 1973
The object of this examination was to determine:
• Specific instability features (slips, slip scars, etc.)
• Landscape changes that might increase/decrease potential for instability
• Landscape features and factors that might provide a mechanism for instability or indicate an increased risk of instability.
To assist with identification of landscape changes, reference has also been made to old geological and Ordnance Survey 6inch to 1mile maps, dating back to the 1800s.
Morphologically, the area is one of low relief, with the ground being virtually everywhere below 50mOD, but generally above 10mOD. Higher ground is present to the south-east (towards Slieve Fyagh) and to the west (on Bellanaboy ridge); generally in these areas, slope angles exceed 60. A regional slope angle of 60 has been used (for reasons outlined earlier) to define the edge of the study area where it is flanked by higher ground. Lower ground is present adjacent to Sruwaddacon Bay/Glenamoy River and Carrowmore Lake.
The study area is characterised by low slope angles, typically between 30 and 10, but the ground is generally not flat. As can be seen from Figure 22 areas with slope angles of less than 10 are often wetland in character, with numerous small lakes. The area to the north-east of the Glenamoy River (Bellagelly North), which lies outside of the study area as defined, is a good example; but note that a similar wetland area also extended along the left bank of the Glanamoy River from Sruwaddacon Bay to Bellagelly South. At Bellagelly South isolated shallow lakes are still evident, but along the left bank of the Glenamoy River former lakes and bog holes are only barely discernible on aerial photographs, the latter area having been drained for forestry.
Formerly, the whole of the study area was nearly completely covered in blanket bog. The only natural areas where the bog is absent are the narrow floodplains of the Glenamoy, Muigingaun and Bellanaboy Rivers, where the peat either never grew or was subsequently eroded through to the underlying mineral soil. Peat working, resulting in removal of most if not all of the peat, has also taken place locally, generally in the vicinity of groups of dwellings
For
insp
ectio
n pur
pose
s only
.
Conse
nt of
copy
right
owne
r req
uired
for a
ny ot
her u
se.
EPA Export 12-11-2014:23:31:43

Shell E & P Ireland Ltd Corrib Terminal: Bellanaboy BridgeGeology, Hydrogeology and Global Stability Planning Report
J:\C-1100\C1157\(2) DOCUMENTS\10\REPORTS\RP004_ISSUE2_C1157-10_GEOLOGY HYDROGEOLOGY GLOBAL STABILITY.DOC RP004
Page 31 Arup Consulting EngineersIssue 2 8 December 2003
or farms where the subsequent worked area has been reclaimed for agricultural use. Many of these worked/reclaimed areas also lie close to streams and rivers where the peat may originally have been of reduced thickness. Collectively, these areas with little or no peat, or reclaimed peat, are shown in Figure 22.
The outer edges of the latter areas are often, although not always, defined by steep slopes in peat. Such steep slopes can mark the cut edge of a working or the steep bank of a floodplain formed by stream erosion. Slopes are particularly steep along the edge of the Bellanaboy River floodplain north of Bellanaboy Bridge. Some slippage of the peat is evident in places where river meanders have undercut the peat slope. Other locations along the Glenamoy River and Sruwaddacon Bay where steep peat slopes are present are indicated in Figure 22. A notable raised bog area occurs near Bungurra, just east of Carrowmore Lake, with the lakeward-facing edge of the bog being defined by a steep slope.
Nowhere else within the study area have steep slopes in peat, or slip features or other manifestation of slope instability, been identified.
The aerial photographs have also been used to deduce patterns of surface drainage, both past and present, which are at a finer scale than shown on the base 1:50,000 OS map. These smaller drainage features, which generally take the form of winter-borne streams carrying water off the peat and discharging it into the larger streams and rivers, have been added to the base plan in Figure 22. Former drainage features have been added as dashed lines to indicate that they are no longer active. The role of these latter features has often been supplanted by later land drainage.
One of the primary objectives of this head-ward drainage study is to identify the locations and elevations at which water emanates from the peat. This is because, contrary to what might be expected considering the peat’s low vertical permeability, surface water does not run-off readily from peat areas. Rather surface water tends to be absorbed into the peat, which swells to accommodate the additional moisture. This fact can be readily seen from the area to the north-east of the Glenamoy River, where the intensity of drainage (that is the total length of drainage per km2) is not dissimilar to karst areas in Galway. Shallow surface drainage channels crossing peat areas are thus more than likely to be associated with groundwater emanating from the underlying mineral soil and bedrock, giving rise to upward seepage through the peat.
This stands to reason since peat invaded, creating a thin mantle to, a former landscape on which the drainage patterns were already firmly established. Peat, being the product of living plant communities, would have flourished in areas where mineral-rich springs and seepages occurred. Under these circumstances more fen-like, less fibrous, peat would have formed, giving rise to more humified peat.
It is evident from Figure 22 that within the study area the majority of the surface drainage lines start at an elevation between 20mOD and 30mOD and that wet areas often occur around or just upslope of the heads of the drainage lines. It was noted in the earlier sections of this report that because of the particular geology of the terminal site, bedrock groundwater tends to rise towards the surface at an elevation of 33.5mOD and below this elevation bedrock groundwater is within 1.5m of the surface. It was also noted in earlier sections of the report that the total peat thickness, and particularly the thickness of highly humified peat, increases downslope from 33.5mOD. These factors are not unconnected, and given the particular circumstances that gave rise to the geology/hydrogeology of the site, it would be surprising if a similar geology/hydrogeology were not widely present throughout the study area.
On this basis the ground below 30mOD, within the study area, might be considered more susceptible to instability for the following reasons, that do not apply higher upslope:
• Potentially greater thickness of peat and particularly highly humified peat
For
insp
ectio
n pur
pose
s only
.
Conse
nt of
copy
right
owne
r req
uired
for a
ny ot
her u
se.
EPA Export 12-11-2014:23:31:43

Shell E & P Ireland Ltd Corrib Terminal: Bellanaboy BridgeGeology, Hydrogeology and Global Stability Planning Report
J:\C-1100\C1157\(2) DOCUMENTS\10\REPORTS\RP004_ISSUE2_C1157-10_GEOLOGY HYDROGEOLOGY GLOBAL STABILITY.DOC RP004
Page 32 Arup Consulting EngineersIssue 2 8 December 2003
• Groundwater closer to the surface with higher risk of upward groundwater pressures
• Possibility of underground streams running through, or just below, the peat
• Steeper slopes likely, due to erosion adjacent to drainage channels
10.2.3 Reconnaissance Survey
The reconnaissance survey consisted of a combination of:
• Walking around the terminal site
• Driving around the study area using public roads and forestry tracks and viewing the study area and the site from various vantage points
• Looking at specific features
The purpose of the reconnaissance survey was to gain a general “feel” for the way that the site relates to the surrounding landscape, and to look at particular features identified from the aerial photographs. Special attention was paid to the area lying downslope from the terminal site, for two reasons:
1. This is the area most likely to be affected by any slope instability initiated by the development.
2. This is the area, which if off-site instability were to occur, would be most likely to impact on the development.
The area lying upslope from the terminal footprint is not considered to pose a risk to the development for three reasons:
1. The length of the slope (i.e. the distance to the crest of the hill) is less than 200m
2. The peat is generally less than 3m thick and gets thinner upslope.
3. Specific design measures are proposed to support the peat in the cutting that forms the upslope edge of the terminal footprint.
This issue is considered more fully in Sections 10.3 and 11.4.
Selected photographs showing views of the site, and downslope of the site, are shown in Plates 3 – 8, in Appendix D.
10.2.4 Summary of Morphological Study
The following is a summary of the main points stemming from the morphological study, which has considered a 20km2 area with common landscape characteristics centred on the terminal site. This summary also incorporates the findings of Sections 10.1 and 10.3.
1. Virtually the whole of the study area is underlain by blanket bog. The only exceptions are the floodplains of the various rivers and areas where the peat has been worked out; also one area of raised bog, which occurs at Bungurra adjacent to Carrowmore Lake.
2. Except for minor slippages of the peat along the edge of the Bellanaboy River floodplain, due to erosion by the river, there appear to be no manifestation of peat slope instability within the study area.
3. Potential for slope instability exists locally, however, along the upland margins of the study area where the ground slope exceeds 60. The areas considered at risk in this respect are along the southern margin, where high ground is associated with Sleive Fyagh, and along the western margin, where high ground is associated with Bellanaboy ridge. Any instability initiated in these upland areas could extend into the study area, but is unlikely to affect the terminal site. This is because the topography and natural drainage features
For
insp
ectio
n pur
pose
s only
.
Conse
nt of
copy
right
owne
r req
uired
for a
ny ot
her u
se.
EPA Export 12-11-2014:23:31:43

Shell E & P Ireland Ltd Corrib Terminal: Bellanaboy BridgeGeology, Hydrogeology and Global Stability Planning Report
J:\C-1100\C1157\(2) DOCUMENTS\10\REPORTS\RP004_ISSUE2_C1157-10_GEOLOGY HYDROGEOL OGY GLOBAL STABILITY.DOC RP004
Page 33 Arup Consulting Engineers Issue 2 8 December 2003
will constrain the run-out path, diverting any debris flow or slip material away from the terminal site.
4. Within the study area natural slopes are generally of the order of 10 to 30. On the basis of historical evidence, nature of the peat and geotechnical analysis (see Section 10.3), slopes generally within the area are judged to be stable provided that they are not disturbed or otherwise interfered with.
5. However, slopes steeper than 30 in peat occur adjacent to the rivers and areas of peat working. Minor instability might thus be expected in these areas, but is unlike to propagate any distance upslope because of the intrinsic stability of peat slopes within the area as a whole.
6. Notwithstanding the general comment (in 4. above) about slope stability, an area has been identified, which includes much of the study area, where the peat is generally thicker than 3.5m. The upslope limit of this area coincides approximately with the upslope limit of surface emergence of groundwater. The combination of thicker peat and upwelling of groundwater is considered to render this area potentially less stable than areas upslope, where the peat is thinner and not affected by upwelling groundwater.
7. Thickness of peat is important relative to stability. The thickness strongly influences the measures and costs necessary to ensure foundation stability and acceptable settlements.
8. By a process of elimination the terminal site can be seen as being located in an area (defined approximately by the 35mOD contour), which is intrinsically more stable than the remainder of the study area. Short of locating the terminal site at or closer to the crest of the hill, the chosen location is seen as being acceptable from the point of view of geotechnical stability.
9. Provided that normal engineering precautions are taken within the site development (as discussed in Section 11), stability of the site’s surroundings will not be adversely affected.
10.3 Stability Analyses Analyses have been carried out to assess the stability of the natural peat slopes within the site boundary, and to assess the impact of construction activities on overall stability of existing slopes. These analyses look predominantly at large scale global stability assuming translational sliding of the peat over the underlying mineral soil along a failure plane at the base of the peat.
The analyses presented in the following sections are based on lower bound estimates of the undrained shear strength (cu ) of the peat. There is limited data on drained effective stress strength parameters for peat from the Corrib site. A review of existing effective stress data is reported in Reference 6, and the test results are compared against published data for peat from other sites in Ireland. Reference 6 recommended effective stress design parameters of c′ = 3 kPa and ϕ′ = 32° for peat. The c′ value recommended is equal to, or greater than, the undrained shear strength cu values assumed for the analyses described below, and consequently an effective stress analysis would not give lower factors of safety than those determined from the analyses reported.
10.3.1 Relevant Codes
BS 6031:1981 Code of Practice for Earthworks (Reference 43) provides advice on design of both temporary and permanent slopes. It states that for a first time failure with a good standard of site investigation the design factor of safety should be between 1.3 and 1.4.
Eurocode 7: Geotechnical Design (Reference 44) is based on limit state design principles with partial factors applied to loads (actions) and resistances (soil strength). For ultimate limit state
For
insp
ectio
n pur
pose
s only
.
Conse
nt of
copy
right
owne
r req
uired
for a
ny ot
her u
se.
EPA Export 12-11-2014:23:31:43

Shell E & P Ireland Ltd Corrib Terminal: Bellanaboy BridgeGeology, Hydrogeology and Global Stability Planning Report
J:\C-1100\C1157\(2) DOCUMENTS\10\REPORTS\RP004_ISSUE2_C1157-10_GEOLOGY HYDROGEOLOGY GLOBAL STABILITY.DOC RP004
Page 34 Arup Consulting EngineersIssue 2 8 December 2003
slope stability design, where soil resistance is derived from the undrained shear strength cu , the latest version of EC7 recommends the use of a partial material factor γcu of 1.4 together with a weight density factor γγ of 1.0. As shown by the expressions given below the material factor γcu is equivalent to the overall factor of safety defined in BS 6031 for the sliding mechanisms proposed.
Based on the above a factor of safety of 1.4 has been adopted as the minimum acceptable value for stability analyses based on undrained shear strength values.
10.3.2 Stability Calculations
Typical cross sections across the site showing existing ground surface and base of peat levels are shown on Figures 23 to 28. The sections are drawn with an exaggerated vertical scale, that is the vertical scale is 10 times the horizontal scale. These sections show the depth of peat generally increasing from a minimum at the top of the slope to a maximum at the bottom. Variations in ground level and base of peat vary approximately linearly with distance down the slope, and for the purpose of the global stability analyses a tapered thickness of peat sliding on a planar surface has been assumed. The analysis is based on a simple sliding wedge method of analysis, as illustrated on Figure 29. Assuming that the peat has a constant undrained shear strength cu the following expression has been derived for the factor of safety against sliding (see Appendix E for derivation of this expression): -
FOS = L2 cu (cos θ + tan θ sin θ) + L1 cu (cos β - sin β tan θ) (1)
W1 (sin β cos β − sin2 β tan θ) – W2 tan θ + PA (cos2 β − sin β cos β tan θ)
Where
β = slope angle of base of peat
cu = undrained shear strength
W1 = weight is sliding block of peat
W2 = weight of passive wedge
L1 = length of sliding surface beneath sliding block
L2 = length of sliding surface beneath passive block
θ = angle of passive wedge base surface to horizontal
PA = total horizontal force from active wedge
If the support provided by the passive wedge is excluded, the expression for the factor of safety against sliding is: -
FOS = L1 cu cos β (2)
W1 sin β cos β + PA cos2 β
For the case of constant peat thickness, with active and passive pressures both excluded, this expression reduces to that for an infinite slope where the factor of safety against sliding is given by: -
FOS = cu (3)
γ z sin β cos β
Where
γ = bulk unit weight
z = depth of peat (sliding layer)
For
insp
ectio
n pur
pose
s only
.
Conse
nt of
copy
right
owne
r req
uired
for a
ny ot
her u
se.
EPA Export 12-11-2014:23:31:43
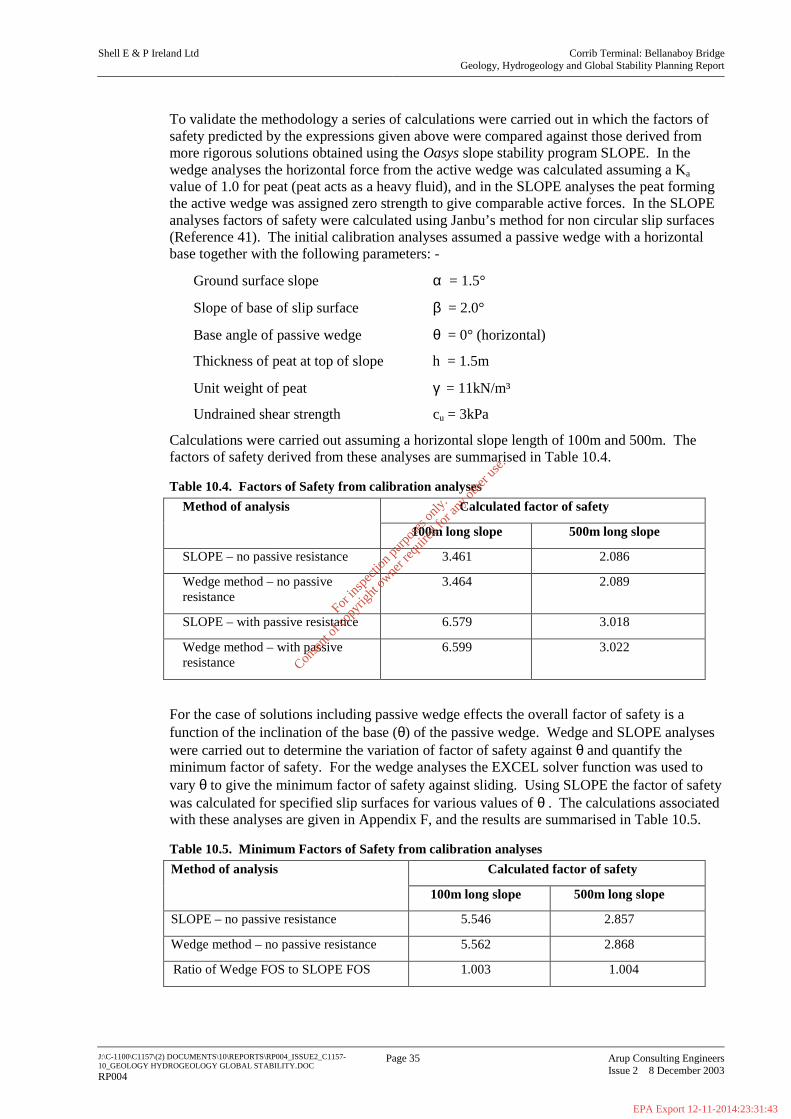
Shell E & P Ireland Ltd Corrib Terminal: Bellanaboy BridgeGeology, Hydrogeology and Global Stability Planning Report
J:\C-1100\C1157\(2) DOCUMENTS\10\REPORTS\RP004_ISSUE2_C1157-10_GEOLOGY HYDROGEOLOGY GLOBAL STABILITY.DOC RP004
Page 35 Arup Consulting EngineersIssue 2 8 December 2003
To validate the methodology a series of calculations were carried out in which the factors of safety predicted by the expressions given above were compared against those derived from more rigorous solutions obtained using the Oasys slope stability program SLOPE. In the wedge analyses the horizontal force from the active wedge was calculated assuming a Ka value of 1.0 for peat (peat acts as a heavy fluid), and in the SLOPE analyses the peat forming the active wedge was assigned zero strength to give comparable active forces. In the SLOPE analyses factors of safety were calculated using Janbu’s method for non circular slip surfaces (Reference 41). The initial calibration analyses assumed a passive wedge with a horizontal base together with the following parameters: -
Ground surface slope α = 1.5°
Slope of base of slip surface β = 2.0°
Base angle of passive wedge θ = 0° (horizontal)
Thickness of peat at top of slope h = 1.5m
Unit weight of peat γ = 11kN/m³
Undrained shear strength cu = 3kPa
Calculations were carried out assuming a horizontal slope length of 100m and 500m. The factors of safety derived from these analyses are summarised in Table 10.4.
Table 10.4. Factors of Safety from calibration analyses Calculated factor of safety Method of analysis
100m long slope 500m long slope
SLOPE – no passive resistance 3.461 2.086
Wedge method – no passive resistance
3.464 2.089
SLOPE – with passive resistance 6.579 3.018
Wedge method – with passive resistance
6.599 3.022
For the case of solutions including passive wedge effects the overall factor of safety is a function of the inclination of the base (θ) of the passive wedge. Wedge and SLOPE analyses were carried out to determine the variation of factor of safety against θ and quantify the minimum factor of safety. For the wedge analyses the EXCEL solver function was used to vary θ to give the minimum factor of safety against sliding. Using SLOPE the factor of safety was calculated for specified slip surfaces for various values of θ . The calculations associated with these analyses are given in Appendix F, and the results are summarised in Table 10.5.
Table 10.5. Minimum Factors of Safety from calibration analyses Calculated factor of safety Method of analysis
100m long slope 500m long slope
SLOPE – no passive resistance 5.546 2.857
Wedge method – no passive resistance 5.562 2.868
Ratio of Wedge FOS to SLOPE FOS 1.003 1.004
For
insp
ectio
n pur
pose
s only
.
Conse
nt of
copy
right
owne
r req
uired
for a
ny ot
her u
se.
EPA Export 12-11-2014:23:31:43

Shell E & P Ireland Ltd Corrib Terminal: Bellanaboy BridgeGeology, Hydrogeology and Global Stability Planning Report
J:\C-1100\C1157\(2) DOCUMENTS\10\REPORTS\RP004_ISSUE2_C1157-10_GEOLOGY HYDROGEOLOGY GLOBAL STABILITY.DOC RP004
Page 36 Arup Consulting EngineersIssue 2 8 December 2003
The results given in Tables 10.4 and 10.5 show that for the assumed slip surface geometry the simple wedge analyses give factor of safety values almost identical to more conventional slope stability analyses, and validate the wedge method as an appropriate method of analysis.
As shown by the spreadsheet results presented in Appendix F the wedge analysis method also allows the effect of varying geometric and strength parameters on overall factor of safety to be easily determined using the solver function. For example, the minimum strength for limiting stability can be determined by optimising the undrained shear strength to give a factor of safety of 1.0. Similarly, using the specified undrained shear strength, the ground surface slope angle (α) that gives a factor of safety of 1.0 can be calculated provided the base of peat angle (β) is know or assumed. In the spreadsheet analysis the maximum slope angle is calculated assuming that the difference between α and β remains constant. In the examples shown in Appendix F it can be seen that for the specified geometry the minimum undrained shear strength needed for limiting equilibrium (FOS = 1.0) is 0.54kPa for a 100m long slope and 1.05kPa for a 500m long slope. For the analyses that exclude the passive resistance, however, the corresponding minimum undrained shear strength necessary for equilibrium are 0.87kN/m² and 1.44kN/m². This type of analysis illustrates that the effect of reducing or removing the stabilising passive resistance, as could result for example from the excavation of a ditch at the bottom of the slope, will reduce the overall factor of safety of the slope. If the slope is stable, but with a factor of safety close to 1, the reduction in sliding resistance could be sufficient to result in instability of the whole slope.
Based on the findings of the calibration analyses described above the wedge analysis method was used to investigate the stability of the peat slopes on the terminal site.
10.3.3 Stability Calculations
Stability calculations have been undertaken for the sections shown on Figure23. Section details are shown on Figures 24 to 28. These sections were selected as being representative of the range of ground conditions and slope geometry on the site. The procedure adopted was as follows: -
• Using topographic and existing site investigation data draw section showing ground level and base of peat levels.
• Approximate ground surface profile and base of peat surface by planar surfaces inclined at angles α and β respectively to the horizontal.
• Select the ‘top of slope’ location as the point where the actual surface profile becomes approximately asymptotic to the straight line approximation of the ground surface.
• Determine depth of peat at the ‘top of slope’ location.
• Using lower bound undrained shear strength values calculate FOS of existing slopes.
• Based on planned construction activities calculate FOS during construction.
10.3.4 Geotechnical design parameters
The geotechnical design parameters needed for the stability analyses are the undrained shear strength and the bulk unit weight of peat. Stability reduces as the weight of the sliding block increases, as the greater the weight the greater the disturbing force to be stabilised. It is therefore conservative to take the depth of the sliding block of peat to be as deep as possible and to adopt an upper bound value for the unit weight of peat.
The stability calculations assume sliding at the base of the peat, thereby maximising the sliding weight. Laboratory bulk unit weight measurements give values of 10kN/m³ or less. A value of 11kN/m³ was used for the stability analyses.
For
insp
ectio
n pur
pose
s only
.
Conse
nt of
copy
right
owne
r req
uired
for a
ny ot
her u
se.
EPA Export 12-11-2014:23:31:43
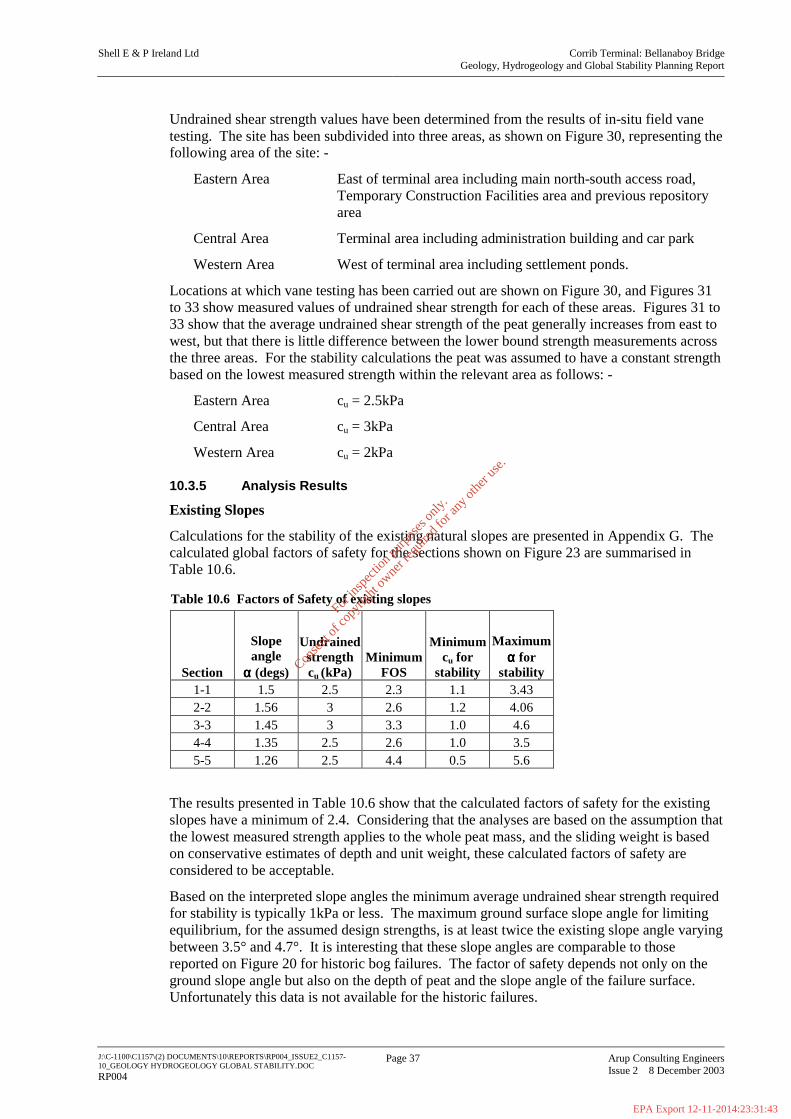
Shell E & P Ireland Ltd Corrib Terminal: Bellanaboy BridgeGeology, Hydrogeology and Global Stability Planning Report
J:\C-1100\C1157\(2) DOCUMENTS\10\REPORTS\RP004_ISSUE2_C1157-10_GEOLOGY HYDROGEOLOGY GLOBAL STABILITY.DOC RP004
Page 37 Arup Consulting EngineersIssue 2 8 December 2003
Undrained shear strength values have been determined from the results of in-situ field vane testing. The site has been subdivided into three areas, as shown on Figure 30, representing the following area of the site: -
Eastern Area East of terminal area including main north-south access road, Temporary Construction Facilities area and previous repository area
Central Area Terminal area including administration building and car park
Western Area West of terminal area including settlement ponds.
Locations at which vane testing has been carried out are shown on Figure 30, and Figures 31 to 33 show measured values of undrained shear strength for each of these areas. Figures 31 to 33 show that the average undrained shear strength of the peat generally increases from east to west, but that there is little difference between the lower bound strength measurements across the three areas. For the stability calculations the peat was assumed to have a constant strength based on the lowest measured strength within the relevant area as follows: -
Eastern Area cu = 2.5kPa
Central Area cu = 3kPa
Western Area cu = 2kPa
10.3.5 Analysis Results
Existing Slopes
Calculations for the stability of the existing natural slopes are presented in Appendix G. The calculated global factors of safety for the sections shown on Figure 23 are summarised in Table 10.6.
Table 10.6 Factors of Safety of existing slopes
Section
Slope angle
α α α α (degs)
Undrained strength cu (kPa)
Minimum FOS
Minimum cu for
stability
Maximum αααα for
stability 1-1 1.5 2.5 2.3 1.1 3.43 2-2 1.56 3 2.6 1.2 4.06 3-3 1.45 3 3.3 1.0 4.6 4-4 1.35 2.5 2.6 1.0 3.5 5-5 1.26 2.5 4.4 0.5 5.6
The results presented in Table 10.6 show that the calculated factors of safety for the existing slopes have a minimum of 2.4. Considering that the analyses are based on the assumption that the lowest measured strength applies to the whole peat mass, and the sliding weight is based on conservative estimates of depth and unit weight, these calculated factors of safety are considered to be acceptable.
Based on the interpreted slope angles the minimum average undrained shear strength required for stability is typically 1kPa or less. The maximum ground surface slope angle for limiting equilibrium, for the assumed design strengths, is at least twice the existing slope angle varying between 3.5° and 4.7°. It is interesting that these slope angles are comparable to those reported on Figure 20 for historic bog failures. The factor of safety depends not only on the ground slope angle but also on the depth of peat and the slope angle of the failure surface. Unfortunately this data is not available for the historic failures.
For
insp
ectio
n pur
pose
s only
.
Conse
nt of
copy
right
owne
r req
uired
for a
ny ot
her u
se.
EPA Export 12-11-2014:23:31:43

Shell E & P Ireland Ltd Corrib Terminal: Bellanaboy BridgeGeology, Hydrogeology and Global Stability Planning Report
J:\C-1100\C1157\(2) DOCUMENTS\10\REPORTS\RP004_ISSUE2_C1157-10_GEOLOGY HYDROGEOLOGY GLOBAL STABILITY.DOC RP004
Page 38 Arup Consulting EngineersIssue 2 8 December 2003
Stability during construction
In considering the stability during construction it is important to distinguish between global stability and local stability. Global stability is the stability of the overall site, or a large portion of it. Local stability refers to the stability of a few metres of an excavated face, but if not contained and controlled local stability could lead to progressive failures resulting in more extensive global stability problems.
The worst condition that could occur during construction would be if all the peat was removed at the toe of the slope without any compensatory external support being provided. In stability analysis terms this is the condition that would apply if no passive resistance is provided to the sliding block.
The global factors of safety calculated for this condition are summarised in Table 10.7.
Table 10.7 Factors of Safety during construction (no passive resistance)
Section
Slope angle
α α α α (degs)
Undrained strength cu (kPa)
Minimum FOS
1-1 1.5 2.5 2.0 2-2 1.56 3 2.1 3-3 1.45 3 2.5 4-4 1.35 2.5 2.1 5-5 1.26 2.5 3.6
For this extreme case the calculated lowest global factor of safety is 2.0, which is adequate. These results show that provided local stability is maintained overall global stability is acceptable.
For this worst case condition, however, local failure of the unsupported peat will occur for an excavated face greater than a certain height. The greatest height at which a vertical cut can stand is (Reference 42): -
Hmax = 4 cu / γ
For the undrained strengths given in Tables 10.6 and 10.7 Hmax varies between 0.7m and 1.1m. This is consistent with observations of collapses of the sides of trial pits observed during site investigation works.
Excavation and local collapse of peat will not have a significant effect on stability downslope of the excavation. The consequence of excavation will be the removal of the active driving force from the top of the slope and this will tend to improve stability. Upslope of the excavation, however, the excavation results in the removal of the stabilising passive resistance, with the result that stability of a potential sliding block upslope of the excavation is reduced. For sliding block mechanisms that extend a relatively short distances from the excavation the dominant disturbing force is the active force acting on the back of the sliding block. Resistance to sliding is provided by the shear strength of the peat along the bottom surface of the sliding block, and for some distance back from the excavation the sliding resistance will be less than the active force and movement of the sliding block could occur. If uncontrolled a progressive collapse mechanism could develop, gradually extending upslope from the excavation.
To prevent such mechanisms developing all excavations in to peat will be supported by sheet pile retaining walls. The sheet pile retaining walls will be installed through the peat and embedded in to the underlying mineral soil. They will provide temporary support during excavation in the peat during site preparation works, and they will also be used to contain the peat beneath road and hard standing areas. The sheet piles will provide restraint to the peat
For
insp
ectio
n pur
pose
s only
.
Conse
nt of
copy
right
owne
r req
uired
for a
ny ot
her u
se.
EPA Export 12-11-2014:23:31:43
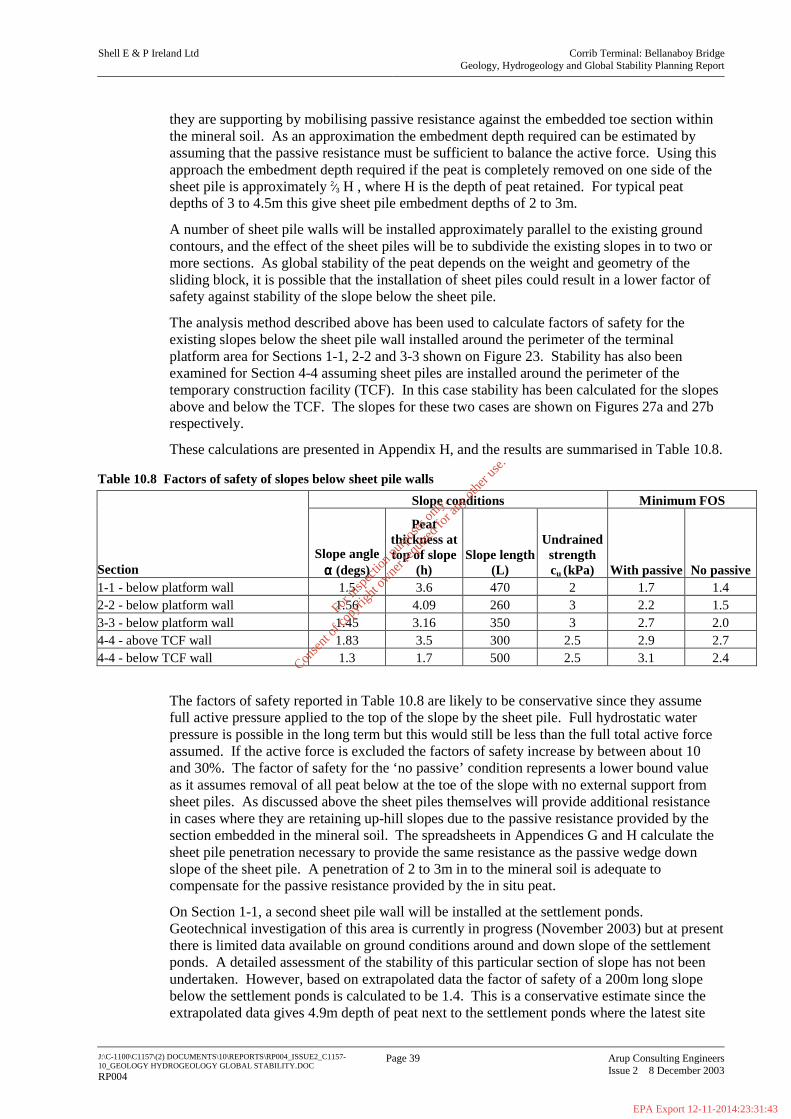
Shell E & P Ireland Ltd Corrib Terminal: Bellanaboy BridgeGeology, Hydrogeology and Global Stability Planning Report
J:\C-1100\C1157\(2) DOCUMENTS\10\REPORTS\RP004_ISSUE2_C1157-10_GEOLOGY HYDROGEOLOGY GLOBAL STABILITY.DOC RP004
Page 39 Arup Consulting EngineersIssue 2 8 December 2003
they are supporting by mobilising passive resistance against the embedded toe section within the mineral soil. As an approximation the embedment depth required can be estimated by assuming that the passive resistance must be sufficient to balance the active force. Using this approach the embedment depth required if the peat is completely removed on one side of the sheet pile is approximately 2⁄3 H , where H is the depth of peat retained. For typical peat depths of 3 to 4.5m this give sheet pile embedment depths of 2 to 3m.
A number of sheet pile walls will be installed approximately parallel to the existing ground contours, and the effect of the sheet piles will be to subdivide the existing slopes in to two or more sections. As global stability of the peat depends on the weight and geometry of the sliding block, it is possible that the installation of sheet piles could result in a lower factor of safety against stability of the slope below the sheet pile.
The analysis method described above has been used to calculate factors of safety for the existing slopes below the sheet pile wall installed around the perimeter of the terminal platform area for Sections 1-1, 2-2 and 3-3 shown on Figure 23. Stability has also been examined for Section 4-4 assuming sheet piles are installed around the perimeter of the temporary construction facility (TCF). In this case stability has been calculated for the slopes above and below the TCF. The slopes for these two cases are shown on Figures 27a and 27b respectively.
These calculations are presented in Appendix H, and the results are summarised in Table 10.8.
Table 10.8 Factors of safety of slopes below sheet pile walls Slope conditions Minimum FOS
Section Slope angle
α α α α (degs)
Peat thickness at top of slope
(h) Slope length
(L)
Undrained strength cu (kPa) With passive No passive
1-1 - below platform wall 1.5 3.6 470 2 1.7 1.4 2-2 - below platform wall 1.56 4.09 260 3 2.2 1.5 3-3 - below platform wall 1.45 3.16 350 3 2.7 2.0 4-4 - above TCF wall 1.83 3.5 300 2.5 2.9 2.7 4-4 - below TCF wall 1.3 1.7 500 2.5 3.1 2.4
The factors of safety reported in Table 10.8 are likely to be conservative since they assume full active pressure applied to the top of the slope by the sheet pile. Full hydrostatic water pressure is possible in the long term but this would still be less than the full total active force assumed. If the active force is excluded the factors of safety increase by between about 10 and 30%. The factor of safety for the ‘no passive’ condition represents a lower bound value as it assumes removal of all peat below at the toe of the slope with no external support from sheet piles. As discussed above the sheet piles themselves will provide additional resistance in cases where they are retaining up-hill slopes due to the passive resistance provided by the section embedded in the mineral soil. The spreadsheets in Appendices G and H calculate the sheet pile penetration necessary to provide the same resistance as the passive wedge down slope of the sheet pile. A penetration of 2 to 3m in to the mineral soil is adequate to compensate for the passive resistance provided by the in situ peat.
On Section 1-1, a second sheet pile wall will be installed at the settlement ponds. Geotechnical investigation of this area is currently in progress (November 2003) but at present there is limited data available on ground conditions around and down slope of the settlement ponds. A detailed assessment of the stability of this particular section of slope has not been undertaken. However, based on extrapolated data the factor of safety of a 200m long slope below the settlement ponds is calculated to be 1.4. This is a conservative estimate since the extrapolated data gives 4.9m depth of peat next to the settlement ponds where the latest site
For
insp
ectio
n pur
pose
s only
.
Conse
nt of
copy
right
owne
r req
uired
for a
ny ot
her u
se.
EPA Export 12-11-2014:23:31:43

Shell E & P Ireland Ltd Corrib Terminal: Bellanaboy BridgeGeology, Hydrogeology and Global Stability Planning Report
J:\C-1100\C1157\(2) DOCUMENTS\10\REPORTS\RP004_ISSUE2_C1157-10_GEOLOGY HYDROGEOLOGY GLOBAL STABILITY.DOC RP004
Page 40 Arup Consulting EngineersIssue 2 8 December 2003
investigation data shows peat depths in the range of 3 to 3.5m. A lower depth of peat will give a higher factor of safety.
Analyses show that although the installation of a sheet pile within the existing slopes may reduce the factor of safety of the section of slope down hill of the sheet pile, the factor of safety based on lower strength estimates will be greater than 1.4, and therefore acceptable.
For
insp
ectio
n pur
pose
s only
.
Conse
nt of
copy
right
owne
r req
uired
for a
ny ot
her u
se.
EPA Export 12-11-2014:23:31:43
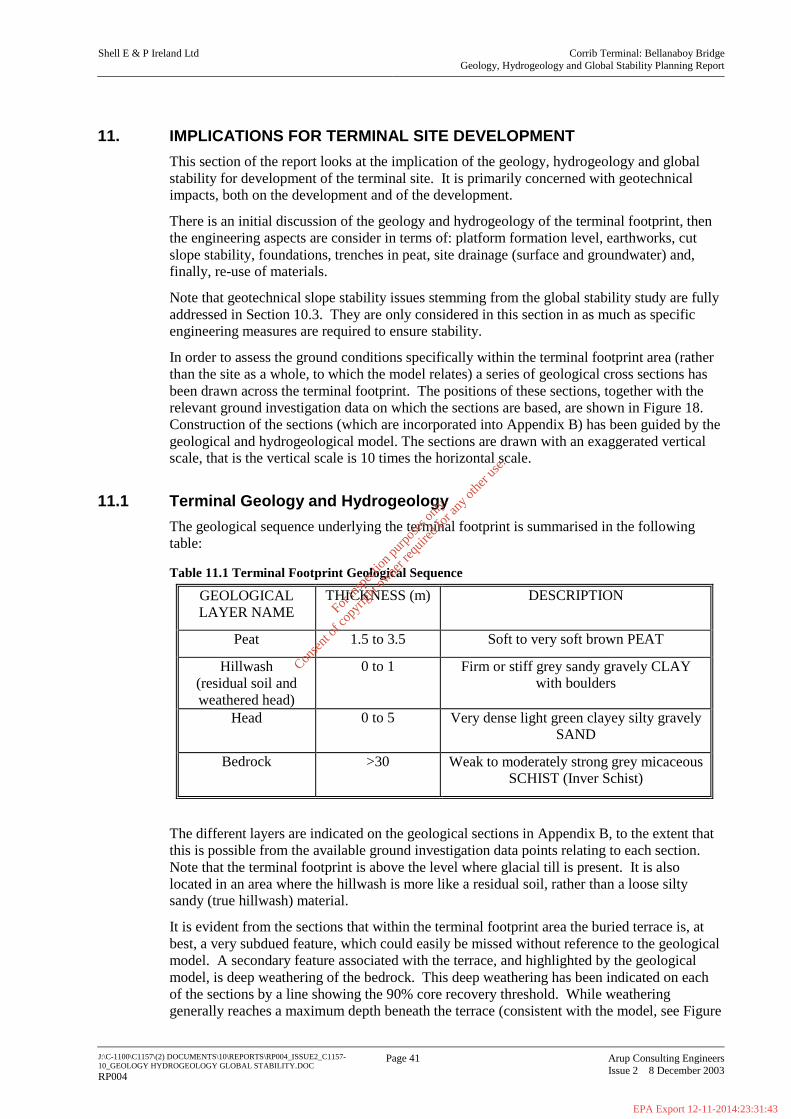
Shell E & P Ireland Ltd Corrib Terminal: Bellanaboy BridgeGeology, Hydrogeology and Global Stability Planning Report
J:\C-1100\C1157\(2) DOCUMENTS\10\REPORTS\RP004_ISSUE2_C1157-10_GEOLOGY HYDROGEOLOGY GLOBAL STABILITY.DOC RP004
Page 41 Arup Consulting EngineersIssue 2 8 December 2003
11. IMPLICATIONS FOR TERMINAL SITE DEVELOPMENT This section of the report looks at the implication of the geology, hydrogeology and global stability for development of the terminal site. It is primarily concerned with geotechnical impacts, both on the development and of the development.
There is an initial discussion of the geology and hydrogeology of the terminal footprint, then the engineering aspects are consider in terms of: platform formation level, earthworks, cut slope stability, foundations, trenches in peat, site drainage (surface and groundwater) and, finally, re-use of materials.
Note that geotechnical slope stability issues stemming from the global stability study are fully addressed in Section 10.3. They are only considered in this section in as much as specific engineering measures are required to ensure stability.
In order to assess the ground conditions specifically within the terminal footprint area (rather than the site as a whole, to which the model relates) a series of geological cross sections has been drawn across the terminal footprint. The positions of these sections, together with the relevant ground investigation data on which the sections are based, are shown in Figure 18. Construction of the sections (which are incorporated into Appendix B) has been guided by the geological and hydrogeological model. The sections are drawn with an exaggerated vertical scale, that is the vertical scale is 10 times the horizontal scale.
11.1 Terminal Geology and Hydrogeology The geological sequence underlying the terminal footprint is summarised in the following table:
Table 11.1 Terminal Footprint Geological Sequence
GEOLOGICAL LAYER NAME
THICKNESS (m) DESCRIPTION
Peat 1.5 to 3.5 Soft to very soft brown PEAT
Hillwash (residual soil and weathered head)
0 to 1 Firm or stiff grey sandy gravely CLAY with boulders
Head 0 to 5 Very dense light green clayey silty gravely SAND
Bedrock >30 Weak to moderately strong grey micaceous SCHIST (Inver Schist)
The different layers are indicated on the geological sections in Appendix B, to the extent that this is possible from the available ground investigation data points relating to each section. Note that the terminal footprint is above the level where glacial till is present. It is also located in an area where the hillwash is more like a residual soil, rather than a loose silty sandy (true hillwash) material.
It is evident from the sections that within the terminal footprint area the buried terrace is, at best, a very subdued feature, which could easily be missed without reference to the geological model. A secondary feature associated with the terrace, and highlighted by the geological model, is deep weathering of the bedrock. This deep weathering has been indicated on each of the sections by a line showing the 90% core recovery threshold. While weathering generally reaches a maximum depth beneath the terrace (consistent with the model, see Figure
For
insp
ectio
n pur
pose
s only
.
Conse
nt of
copy
right
owne
r req
uired
for a
ny ot
her u
se.
EPA Export 12-11-2014:23:31:43
Shell E & P Ireland Ltd Corrib Terminal: Bellanaboy BridgeGeology, Hydrogeology and Global Stability Planning Report
J:\C-1100\C1157\(2) DOCUMENTS\10\REPORTS\RP004_ISSUE2_C1157-10_GEOLOGY HYDROGEOLOGY GLOBAL STABILITY.DOC RP004
Page 42 Arup Consulting EngineersIssue 2 8 December 2003
11), the depth of weathering is not uniform, but increases progressively across the site in a westerly direction. While this is evident from the north-south sections when looked at in sequence, it is more clearly seen on the east-west sections.
The least depth of bedrock weathering appears to coincide with a NNW-SSE aligned ridge, which is evident from the surface topography but is slightly more obvious when seen on the sub-peat surface (see Figure 16). Across the ridge, the peat does not show the normal (as indicated by the model) downslope increase in thickness, but rather remains of uniform thickness downslope; hence the ridge being more evident on the sub-peat surface.
The ridge clearly extends from the crest of the hill north of the terminal footprint and links to the south of the R314 road with a corresponding ridge extending north-westwards from Slieve Fyagh. Together these ridge elements form a surface drainage divide between the Glenamore and Carrowmore catchments (see Figure 22 and Plate 6, in Appendix B).
The ridge is also thought to exert an important influence on the groundwater. It marks a groundwater drainage divide; and the same way that a downslope preferential flow path for groundwater exists from the hillcrest, through the moderately weathered (75-100% recovery) bedrock (as indicated in Figure 11), so fractured bedrock flow paths occur away from the ridge as indicated, diagrammatically, in Figure 16. This implies that bedrock groundwater levels are at a higher than average elevation beneath the ridge (represented by the upper line in Figure 12). A situation that would arise because of locally more rapid groundwater recharge (the peat being thinner across the ridge) and lateral continuity with the higher groundwater levels in the hillcrest area.
It was noted in Section 8.4, from the coincidence of high bedrock groundwater levels and low pore pressure gradients in the peat, that the area around borehole BH P7 corresponds with a non-spring area. Given the proximity of the ridge crest to this location (see Figure 16) a direct causal relationship between the ridge and the non-spring area would seem likely; springs being confined to the flanks of the ridge.
It is worth noting in this regard that despite its subdued topographic expression and narrow width, springs (giving rise to present-day streams) issue from both sides of this ridge to the south of the R314 road, suggesting that the ridge is an important source of water (see Figure 22).
How this translates into bedrock groundwater levels beneath the terminal footprint is shown by the bedrock groundwater contours in Figure 18 and the groundwater levels on the sections in Appendix B.
11.2 Platform Level Platform level for the terminal footprint has been set at 33.4mOD Malin Head and is indicated on the sections in Appendix B. Were this level to be imposed onto the present ground surface, it would mean that only the south-west corner of the site would be in fill, the remainder of the site would be in cut. However, since the peat is deemed to be an unsuitable medium in which to found the main terminal structures, it is proposed to dig out the peat and replace it with structural fill in areas where the sub-peat surface occurs below the 33.4mOD level. The position of cut-fill line on the sub-peat surface will thus be as indicated approximately in Figure 18.
As can be seen from the sections, platform formation level in cut areas will be variously on hillwash, terrace deposits and bedrock. Cut formation level will be slightly below finished platform level and the latter will be made up, as necessary in areas not otherwise occupied by buildings, structures, roads or paving, by topsoil or a dressing of imported stone.
For
insp
ectio
n pur
pose
s only
.
Conse
nt of
copy
right
owne
r req
uired
for a
ny ot
her u
se.
EPA Export 12-11-2014:23:31:43

Shell E & P Ireland Ltd Corrib Terminal: Bellanaboy BridgeGeology, Hydrogeology and Global Stability Planning Report
J:\C-1100\C1157\(2) DOCUMENTS\10\REPORTS\RP004_ISSUE2_C1157-10_GEOLOGY HYDROGEOLOGY GLOBAL STABILITY.DOC RP004
Page 43 Arup Consulting EngineersIssue 2 8 December 2003
11.3 Earthworks The initial phase of earthworks, in cut areas, will involve excavation in the various soil and rock materials to create the cut formation level. In fill areas (to the south of the cut-fill line indicated in Figure 18) peat will be dug out to expose the underlying mineral soil and the level will be made up using suitable structural fill (mainly excavated rock material) derived from the cut areas.
Excavation per se is expected to be straightforward in all the soil materials listed, because none is particularly hard or cemented. Rather the opposite is likely to be the case, with the intrinsic softness of the peat, and the potential for softening of the hillwash and terrace deposits, meaning that care will be required in both handling and trafficking of these materials. Control of the water contained in these materials is, therefore, expected to play a key role in determining the overall success of the earthworks (drainage and dewatering are discussed in Section 11.7).
Excavation in rock is not expected to present any particular problems. For the most part, rock that is encountered in cut areas will be deeply weathered and its reduced strength and increased fracture frequency will render it amenable to ripping and excavation using normal earth-moving plant. Only in the extreme north-east corner of the terminal footprint (as indicated in Figure 18) is relatively unweathered rock expected to be encountered. However, even in this area the fractures are generally closely spaced so that the rock is expected to be amenable to heavy ripping (perhaps with the assistance of a mechanical breaker).
Issues to do with material balance and sequencing of earthworks construction are covered in a separate report.
11.4 Cut-Slope Stability Cut slopes, designed to achieve long-term stability, are shown in the following table:
Table 11.2 Cut-Slope Angles
MATERIAL CUT-SLOPE ANGLE
Unweathered rock 1 in 1
Weathered rock and mineral soil 1 in 3
Peat Retained
Although battered slopes in peat could be designed to achieve long term stability, for reasons of: increased stability, reduction of land-take and to minimise the peat silt load in surface drainage channels, it is proposed to have no cut slopes in peat. Instead, were peat is to be excavated, the edge of the excavation will be fully supported. This will be achieve:
1. In areas where existing ground level is above platform level – by a gabion gravity wall.
2. In areas where platform level is above ground level – by a sheet pile retaining wall.
Depending on the amount of seepage from cut faces in weathered rock and mineral soil so counterfort drainage may need to be introduced into these faces to prevent seepage erosion. Drainage and dewatering are discussed in Section 10.7.
Bedrock fractures are generally recorded as dipping at 450 or steeper, so cut slopes of 1 in 1 in rock should ensure stability against sliding failure on fracture planes.
For
insp
ectio
n pur
pose
s only
.
Conse
nt of
copy
right
owne
r req
uired
for a
ny ot
her u
se.
EPA Export 12-11-2014:23:31:43

Shell E & P Ireland Ltd Corrib Terminal: Bellanaboy BridgeGeology, Hydrogeology and Global Stability Planning Report
J:\C-1100\C1157\(2) DOCUMENTS\10\REPORTS\RP004_ISSUE2_C1157-10_GEOLOGY HYDROGEOLOGY GLOBAL STABILITY.DOC RP004
Page 44 Arup Consulting EngineersIssue 2 8 December 2003
11.5 Foundations
11.5.1 In areas where peat is to be removed
The majority of structures in cut areas will be founded on shallow footings.
SPT “N” values, shown against the shell and auger borehole sticks on the cross sections in Appendix B, indicate the relative density and stiffness of mineral soils. Generally, the hillwash can be seen as being a firm to stiff Clay (SPT “N” value of 10 to 30) and the terrace deposits a dense to very dense Sand (SPT “N” value of 30 to >50). Given that in cut areas site formation will extend across these soil layers onto weathered and then relatively unweathered rock, a range of foundation conditions and ground stiffness conditions are likely.
As a matter of course, in cut areas, shallow footings will be taken down through any hillwash material into the underlying dense sand layer. In some cases where settlement-sensitive structures straddle rock and mineral soil it may be necessary to pile through the mineral soil to minimise differential settlement.
All structures located in areas where the ground is made up by filling will be piled.
11.5.2 In areas where the peat will remain in situ
In areas where structures will be founded on or constructed in peat, the peat will generally be stabilised by in situ soil strengthening methods. This is to ensure that construction can proceed without risk of bearing failure and/or lateral loads being transferred into the adjacent peat, which might otherwise lead to slope stability problems.
This will apply to the administration building area, the temporary construction facility area, the area of the settlement ponds and the main access roads. In addition, some of the buildings and above ground structures in these areas will be supported on piles.
11.6 Trenches in Peat The only significant trench in peat, to provide a permanent structure, will be that to the settlement ponds, to enable installation of the site drainage discharge pipe.
The trench will be dug in short sections and fully supported on both sides by sheet piles, which will be removed afterwards so as not to block groundwater drainage through the hillwash layer. The drainage pipe will be installed and backfilled with stone under and around the pipe and peat above the pipe, before moving on to the next section. A porous land drain will also be installed in the stone backfill and will discharge to the settlement ponds. This porous drain is intended to relieve any upward flow or pressure of groundwater from the underlying mineral soil/bedrock and hence prevent uplift of the site drainage discharge pipe when not carrying water.
11.7 Drainage and Dewatering The hydrogeology of the site has been considered in some detail because it is anticipated that control of the surface and groundwater is likely to play a key role in the successful execution of the earthworks.
Because of the presence of a near-surface water table in the peat and the potentially saturated (or near-saturated) condition of the underlying mineral soils and bedrock, groundwater may be expected to flow into any excavation that extends more than a few metres below the ground surface, unless prior dewatering of these soils is carried out. Construction of the terminal will involve up to 10m of excavation below existing ground level.
Inflow of groundwater may not of itself present a significant problem, because the volumes are likely to relatively small (given the low permeability of the materials), however, if the
For
insp
ectio
n pur
pose
s only
.
Conse
nt of
copy
right
owne
r req
uired
for a
ny ot
her u
se.
EPA Export 12-11-2014:23:31:43

Shell E & P Ireland Ltd Corrib Terminal: Bellanaboy BridgeGeology, Hydrogeology and Global Stability Planning Report
J:\C-1100\C1157\(2) DOCUMENTS\10\REPORTS\RP004_ISSUE2_C1157-10_GEOLOGY HYDROGEOLOGY GLOBAL STABILITY.DOC RP004
Page 45 Arup Consulting EngineersIssue 2 8 December 2003
water cannot immediately be removed it will tend to cause softening and deterioration of excavated materials and the cut formation. The mineral soils and highly weathered bedrock contain a significant quantity of fines, but are of low plasticity, which means that they may be susceptible to seepage erosion: whereby soil tends to flow with the water creating a slurry. Under these conditions the material will quickly become unusable, and normal drainage measures designed to remove the water will be rendered ineffective.
To avoid such a situation on a large construction site, consideration would probably be given to staged dewatering, using well-points, to control the groundwater; these being installed at different levels as the excavation proceeded downwards. However, staged dewatering will not be suitable for this site for the following reasons:
1. A large volume of peat (approximately 417,000m3) is to be removed off-site in trucks. Since excess water in the peat (that is water not directly bound to the plant material) will largely govern its behaviour, prior removal of this excess water and prevention of any additional water getting into the peat will greatly assist the excavation and transport operation.
2. At the same time as the peat is being removed, exposed mineral soil and rock will also be being excavated. In total some 184,000m3 of non-peat material will be excavated, with the majority being retained on site. Of this, some 143,000m3 will be used as fill to raise the platform level in areas south of the cut-fill line, and 8,000m³ will be used for other site works. Approximately 33,000m3 of the least suitable mineral soil will be exported from the site. Avoiding deterioration of excavated soil materials (by water) will be a key factor in material balance.
3. Although earthworks construction is likely to take place during the summer, the site is located in an area where heavy and persistent rainfall can be expected at any time of the year.
The following specific measures are, therefore proposed:
11.7.1 Pre-Drainage of the Peat
In advance of the removal of the peat from site, in order to improve the condition of the peat, it will be stripped and stock-piled to facilitate drying out.
Existing drains will also be upgraded to assist with the overall drainage of the site.
11.7.2 Dewatering Wells
In order to remove water from the underlying mineral soils and bedrock, as well as encourage additional under-drainage of the peat, it is proposed to install a series of dewatering wells prior to construction. In view of the relatively low permeabilities involved and the fact that the whole site is covered by a layer of water (peat), which will prevent air penetration, these will be vacuum assisted pumping wells designed to suck water out of the ground. Two groups of wells are proposed, as indicated in Figure 16. One, to capture the bedrock groundwater that emanates from the hillcrest and NNW-SSE aligned ridge, the other to intercept the zone of bedrock groundwater upwelling.
The wells will be drilled down into the zone of more highly permeable fractured bedrock, with plain cemented-in casing above this zone to the ground surface and open or screened within the zone. The wells will need to be developed, to stimulate fissure flow, and also sterilised to prevent pre-mature clogging by bacteria that cause precipitation of iron oxide.
The upper deeper group of wells will need to be pumped by means of submersible electric pumps. The lower group of wells may be pumped from the surface using self-priming suction pumps, because of the relatively shallow depth to groundwater and less than 10m drawdown level in the wells. The wells will be installed sufficiently in advance of the start of the
For
insp
ectio
n pur
pose
s only
.
Conse
nt of
copy
right
owne
r req
uired
for a
ny ot
her u
se.
EPA Export 12-11-2014:23:31:43

Shell E & P Ireland Ltd Corrib Terminal: Bellanaboy BridgeGeology, Hydrogeology and Global Stability Planning Report
J:\C-1100\C1157\(2) DOCUMENTS\10\REPORTS\RP004_ISSUE2_C1157-10_GEOLOGY HYDROGEOLOGY GLOBAL STABILITY.DOC RP004
Page 46 Arup Consulting EngineersIssue 2 8 December 2003
earthworks to achieve maximum effect. Once stripping of the peat commences, air will begin to penetrate the ground resulting in by-passing of groundwater flow to the wells. The wells will thus be gradually phased out as the permanent groundwater drainage measures are phased in.
As part of the on-going phase of ground investigation pumping tests will be carried out in order to provide specific information for the design of the proposed dewatering wells and to determine the timing of their installation prior to construction.
11.7.3 Permanent Surface and Groundwater Drainage Measures
During the earthworks, surface water will be dealt with by means of falls and grips to lead the water to sump areas. At the earliest opportunity, however, it is planned to install permanent surface drains along the top and toe of cut slopes. The cut slope toe drains will eventually form part of a continuous perimeter drain around the footprint of the terminal site.
It is anticipated that cut slope toe drainage will provide sufficient in the way of drawdown of water level to prevent seepage from the cut face. However, there are two situations where this may not be the case:
1. In the north-east corner of the site, where the cut slope will be in rock. Existing bedrock groundwater levels are highest in this area and localised seepage may occur from individual fissures. This will not affect the stability of the rock slope and the rate of flow will be relatively minor.
2. Anywhere where the cut slope is in hillwash and/or head deposits. Localised seepage may occur due to locally higher permeability zones.
In the latter case, some form of slope face drainage may need to be introduced (such as counterfort drains) to prevent seepage erosion of the cut face.
At intervals along the cut slope toe drain sumps will be installed with the inlet pipe slightly higher than the outlet pipe. In this way, water will cascade into the sump causing aeration and precipitation of iron and manganese. The sumps can be periodically cleaned out. Specific measures to remove iron and manganese from the upslope bedrock groundwater are appropriate because of the higher content of these ions in this source of groundwater (see Section 9.1).
At the base of the platform fill a higher permeability layer will be provided in the form of rock material derived on site. This layer will connect downslope with a groundwater drain installed along the line of sheet piles that defines the southern edge of the fill platform. The purpose of the sub-fill drainage layer and the southern perimeter groundwater drain is to prevent groundwater rise within the fill.
A subsurface groundwater drain will also be installed in the trench carrying the discharge drainage pipe to the settlement ponds. The purpose of this drain is to prevent any rise in groundwater that might cause flotation of the pipe or instability of the slope.
The combined effect of the permanent groundwater drainage measures can thus been seen as being to:
• Prevent groundwater issuing at the surface or rising to such a level that it would affect buried structures.
• Set a cap on the potential for groundwater level rise that might affect stability of the site or the surrounding area.
For
insp
ectio
n pur
pose
s only
.
Conse
nt of
copy
right
owne
r req
uired
for a
ny ot
her u
se.
EPA Export 12-11-2014:23:31:43

Shell E & P Ireland Ltd Corrib Terminal: Bellanaboy BridgeGeology, Hydrogeology and Global Stability Planning Report
J:\C-1100\C1157\(2) DOCUMENTS\10\REPORTS\RP004_ISSUE2_C1157-10_GEOLOGY HYDROGEOLOGY GLOBAL STABILITY.DOC RP004
Page 47 Arup Consulting EngineersIssue 2 8 December 2003
11.8 Re-Use of Materials It is not proposed to make use of any of the excavated peat on site. Excavate peat will be taken off-site to a deposition location, near Bangor Erris, owned by Bord na Mona. All of the excavated rock material and the bulk of the mineral soil excavated will be re-used, the quantities being indicated above.
All of the rock material, with a core recovery of 90% or better will be suitable as selected rockfill, although it is not likely to have sufficient durability or be of uniformly high strength to be suitable for surface stone dressing, or aggregate material. Weathered rock material (falling within the 50% to 90% core recovery zone) is likely to be suitable as common fill for raising the fill platform, although it is not intended to use this material as structural fill. Structures placed on the fill platform will be piled.
There is concern about the suitability of the mineral soil (mainly head deposits) for use as common fill. Although this material in situ is described as a dense to very dense sand, it appears to have a high fines content (indicated by its low permeability) and it is non-plastic. Re-compacted at natural moisture content this material appears to have a low CBR and it would require very little additional water to render it unsuitable as fill. It is primarily for this reason that it is proposed to carry out pre-earthworks dewatering. However, given its lack of plasticity and, primarily, granular composition, this material should be amenable to improvement, by allowing it to dry out and/or mixing it with a cement or lime binder.
The on-going investigation work is intended to provide information on the geotechnical behaviour and the potential for improvement of these soils.
For
insp
ectio
n pur
pose
s only
.
Conse
nt of
copy
right
owne
r req
uired
for a
ny ot
her u
se.
EPA Export 12-11-2014:23:31:43

REFERENCES
For
insp
ectio
n pur
pose
s only
.
Conse
nt of
copy
right
owne
r req
uired
for a
ny ot
her u
se.
EPA Export 12-11-2014:23:31:43

Shell E & P Ireland Ltd Corrib Terminal: Bellanaboy BridgeGeology, Hydrogeology and Global Stability Planning Report
J:\C-1100\C1157\(2) DOCUMENTS\10\REPORTS\RP004_ISSUE2_C1157-10_GEOLOGY HYDROGEOLOGY GLOBAL STABILITY.DOC RP004
Arup Consulting EngineersIssue 2 8 December 2003
1. Long, C.B., et al. Geology of North Mayo, A Geological Description to Accompany the Bedrock Geology Map Series: Sheet 6, North Mayo, Geological Survey of Ireland 1992.
2. Max, M.D. The Geology of a Part of Northwest County Mayo, Ireland, PhD. Thesis University of Dublin, Trinity College, 1969.
3. Max, M.D. Stratigraphy of some Metasediments in part of Northwest County Mayo, Ireland, Scientific Proceedings of the Royal Dublin Society, Series A, Vol. 3, No. 29, 1970, p303-317.
4. Long C.B. Brief Lithological Descriptions of all Cambro-Ordovician, Dalradian, Pre-Dalradian and Igneous Rock Units of Sheet 6, North Mayo, Geological Survey of Ireland, 1992.
5. Hobbs, N.B. Mire Morphology and the Properties of some British and Foreign Peats, Quarterly Journal of Engineering Geology, Vol. 19, 1986, p. 7-80
6. Applied Ground Engineering Consultants Ltd. Geotechnical Interpretive and Design Report (2 Volumes) East Deposition Area, 9 September 2002.
7. Edwards. K. J. The Anthropogenic Factor in Vegetational History. In: The Quaternary History of Ireland, Edwards K.J. and Warren W.P. (Eds), Academic Press, 1985.
8. Synge, F.M. The Glaciation of West Mayo, Irish Geography, Vol. 5, 1968, p372-386.
9. McCabe, A.M., Haynes, J.R. and MacMillan, N.F. Late-Pleistocene Tidewater Glaciers and Glaciomarine Sequences from North County Mayo, Republic of Ireland, Journal of Quaternary Science, Vol 1, (1), 1986, p73-84.
10. Lewis, C.A. Periglacial Features. In: The Quaternary History of Ireland, Edwards K.J. and Warren W.P. (Eds), Academic Press, 1985.
11. Minerex Environmental Limited. Groundwater and Subsoil Investigations at the Bellanaboy Bridge Terminal Site (2 Parts), 31 April 2002.
12. Culleton E.B. and Gardiner M.J. Soil Formation. In: The Quaternary History of Ireland, Edwards K.J. and Warren W.P. (Eds), Academic Press, 1985.
13. Mills, G. Modelling the Water Budget of Ireland – Evapotranspiration and Soil Moisture, Irish Geography, Vol. 33(2), 2000, p99-110.
14. Minerex Environmental Limited. Report on Surface Water, Groundwater and Meteorological Monitoring at the Bellanaboy Bridge Terminal Site, 25 July 2002.
15. Hungr, O. and Evans, S.G. An Example of a Peat Flow near Prince Rupert, British Colombia, Canadian Geotechnical Journal, Vol. 22, 1985, p246-249.
16. Feehan, J. and O’Donovan, G. The Bogs of Ireland – An Introduction to the Natural, Cultural and Industrial Heritage of Irish Peatlands, University College Dublin, The Environmental Institute, 1996.
17. Tomlinson, R.W. and Gardiner, T. Seven Bog Slides in the Sleive-an-Orra Hills, County Antrim, J.Earth Sci. R. Dubl. Soc. Vol. 5, 1982, p1-9.
For
insp
ectio
n pur
pose
s only
.
Conse
nt of
copy
right
owne
r req
uired
for a
ny ot
her u
se.
EPA Export 12-11-2014:23:31:43

Shell E & P Ireland Ltd Corrib Terminal: Bellanaboy BridgeGeology, Hydrogeology and Global Stability Planning Report
J:\C-1100\C1157\(2) DOCUMENTS\10\REPORTS\RP004_ISSUE2_C1157-10_GEOLOGY HYDROGEOLOGY GLOBAL STABILITY.DOC RP004
Arup Consulting EngineersIssue 2 8 December 2003
18. Alexander, R.W., Coxon, P. and Thorn, R.H. Bog Flows in South-East Sligo and South-West Leitrim. In: Sligo and West Leitrim, Field Guide No.8, Thorn, R.H. (Ed.) Irish Association for Quaternary Studies, 1986, p58-76.
19. Alexander, R.W., Coxon, P. and Thorn, R.H. A Bog Flow at Straduff Townland, County Sligo, Proc. R. Ir. Acad. B86, (4), 1986, p107-119.
20. Bishop, D.W. and Mitchell, G.F. On a Recent Bog-Flow in Meenacharvy Townland, Co. Donegal. Sci. Proc. R.. Dubl. Soc. Vol. 24, 1946, p151-156.
21. Burke, W. Effect of Drainage on the Hydrology of Blanket Bog, Ir. J. agric. Res. Vol. 14, 1975, p145-162.
22. Carling, P.A. Peat Slides in Teesdale and Weardale, Northern Pennines, July 1983: Description and Failure Mechanisms, Earth Processes and Landforms, Vol. 11, 1986, p193-206.
23. Cole, G.A.J. The Bog-Slide of Knocknageeha, in the County of Kerry, Nature, Vol.55, 1897. P254-256.
24. Colhoun, E.A. The Debris Flow at Glendalough, Co. Wicklow and the Bog-Flow at Slieve Rushen, Co. Cavan, January 1966, Irish Naturalists Journal, Vol.15, 1966, p199-206.
25. Colhoun, E.A., Common, R. and Cruickshank, M.M. Recent Bog Flows and Debris Slides in the North of Ireland, Proc. R. Dubl. Soc. A(2), 1965, p163-174.
26. Crisp, D.T., Rawes, M., and Welch, D. A Pennine Peat Slide, Geogr. J., Vol.130, 1964, P519-524.
27. Delap, A.D. et al. Report on the Recent Bog Flow at Glencullin, Co. Mayo, Sci. Proc. R. Dubl. Soc. Vol.20, 1932, p181-192.
28. Delap, A.D., and Mitchell, G.F. On a Recent Bog-Flow in Powerescourt Mountain Townland, Co. Wicklow, Sci. Proc. R. Dubl. Soc. Vol.22, 1939, P195-198.
29. Hanrahan, E.T. A Road Failure on Peat, Geotechnique, Vol.14, no.3, 1964, p185-202.
30. Latimer, J. Some Notes on the Recent Bog Slips in the County of Kerry, Trans. Institution of Civil Engineers of Ireland, Vol.26, 1897, p94-97.
31. Mitchell, G.F. On a Recent Bog-Flow in County Clare, Sci. Proc. R. Dubl. Soc. Vol.21, 1935, p247-252.
32. Mitchell, G.F. On a Recent Bog-Flow in County Wicklow, Sci. Proc. R. Dubl. Soc. Vol.22, 1938, p49-54.
33. Praeger, R.L. Bog-Bursts, with Special Reference to the Recent Disaster in Co. Kerry, The Irish Naturalist, Vol.6, 1897, p141-162.
34. Praeger, R.L. A Bog-Burst Seven Years After, The Irish Naturalist, Vol.6, 1897, p201-203.
35. Praeger, R.L. The Ballycumber Bog-Slide, The Irish Naturalist, Vol.(_), 1906, p(_).
36. Sollas, W.J. et al. Report of the Committee Appointed by the Royal Dublin Society to Investigate the Recent Bog-Flow in Kerry, Sci. Proc. R. Dubl. Soc. Vol.8, 1897, p475-508.
37. Standen, R. Bog Bursts, Irish Naturalist, Vol.6, 1897, p224.
For
insp
ectio
n pur
pose
s only
.
Conse
nt of
copy
right
owne
r req
uired
for a
ny ot
her u
se.
EPA Export 12-11-2014:23:31:43

Shell E & P Ireland Ltd Corrib Terminal: Bellanaboy BridgeGeology, Hydrogeology and Global Stability Planning Report
J:\C-1100\C1157\(2) DOCUMENTS\10\REPORTS\RP004_ISSUE2_C1157-10_GEOLOGY HYDROGEOLOGY GLOBAL STABILITY.DOC RP004
Arup Consulting EngineersIssue 2 8 December 2003
38. Tomlinson, R.W. A Preliminary Note on the Bog-Burst at Carrownaculla, Co. Fermanagh, November 1979, Ir. Nat. J. Vol.20, 1982, p313-316.
39. Patrick J.Tobin & Co. Ltd. Report on the Landslides at Dooncarton, Glenagad, Barnachuille and Pollatomais, County Mayo. Executive Summary, 2003, Document Ref. MFG/PG/MMcD 2033/1a.
40. EPA. Climate Change Scenarios & Impacts for Ireland (2000-LS-5.2.1-M1) Final Report, Environmental Protection Agency, 2003.
41. Janbu, N. Slope stability computations. In Embankment Dam Engineering, Casagrande Memorial Volume, Hirschfield, E., Poulos, S. eds. John Wiley, New York, 47-86, 1973
42. Terzaghi, K., Theoretical Soil Mechanics, John Wiley, New York, 1943 British Standards Institute (1981). BS 6031:1981 Code of Practice for Earthworks
43. Eurocode 7:Geotechnical Design – Part 1: General Rules. DD ENV 1997-1:1995. British Standards Institute.
For
insp
ectio
n pur
pose
s only
.
Conse
nt of
copy
right
owne
r req
uired
for a
ny ot
her u
se.
EPA Export 12-11-2014:23:31:43

APPENDIX A Figures
For
insp
ectio
n pur
pose
s only
.
Conse
nt of
copy
right
owne
r req
uired
for a
ny ot
her u
se.
EPA Export 12-11-2014:23:31:43
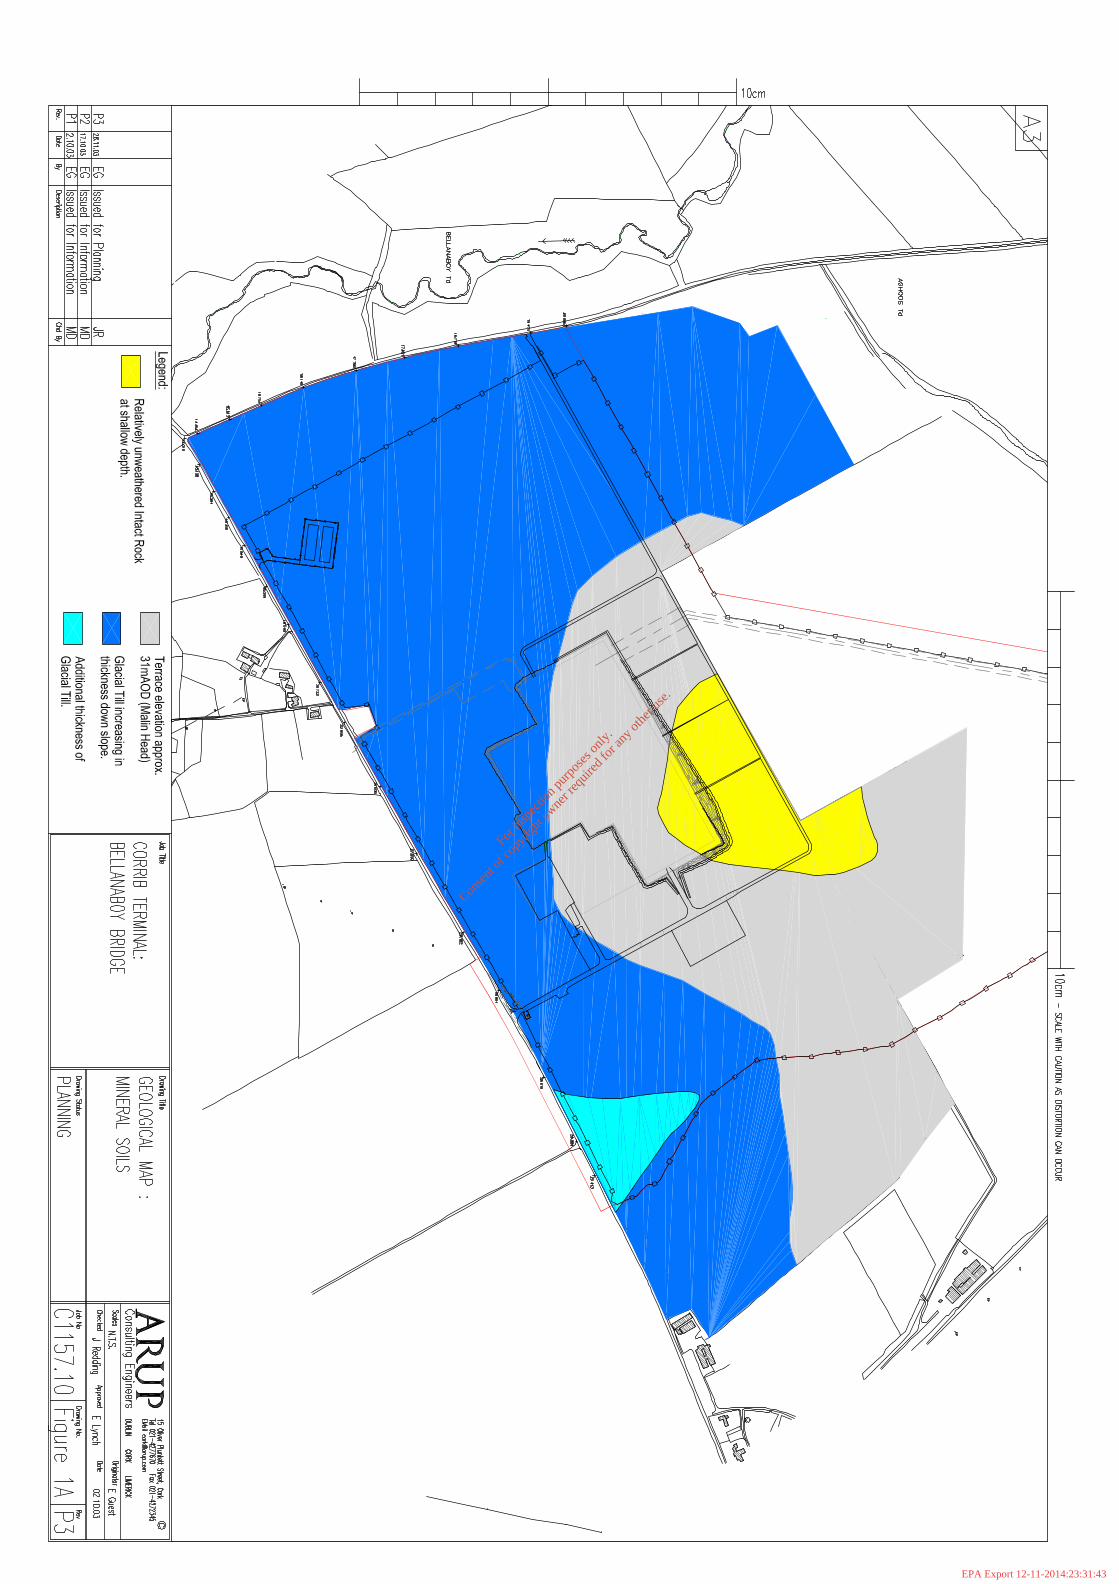
For
insp
ectio
n pur
pose
s only
.
Conse
nt of
copy
right
owne
r req
uired
for a
ny ot
her u
se.
EPA Export 12-11-2014:23:31:43

For
insp
ectio
n pur
pose
s only
.
Conse
nt of
copy
right
owne
r req
uired
for a
ny ot
her u
se.
EPA Export 12-11-2014:23:31:43

For
insp
ectio
n pur
pose
s only
.
Conse
nt of
copy
right
owne
r req
uired
for a
ny ot
her u
se.
EPA Export 12-11-2014:23:31:43

...\10\RP004-fig-3.dgn Dec. 09, 2003 15:25:59
For
insp
ectio
n pur
pose
s only
.
Conse
nt of
copy
right
owne
r req
uired
for a
ny ot
her u
se.
EPA Export 12-11-2014:23:31:43

Shell E and P Ireland Ltd Corrib Terminal: Bellanaboy Bridge
Location ID MAOD Depth of
Peat
MINGC7 44.23 1.25
IGSLBHW1 44.22 2.4
IGSLTE1 43.95 1.6
MINGC42 42.38 2.80
MINGC8 42.08 0.59
IGSLBHP14 41.73 2.2
MINGC4 41.53 2.35
MINGC16 41.38 1.80
IGSLTE5 41.26 2.8
IGSLBHP1A 40.96 2.6
MINGC31 40.93 2.18
IGSLBHP2 40.91 2.6
MINGC30 40.83 1.50
MINGC13 40.78 2.10
IGSLTE4 40.74 1.7
MINGC43 40.68 2.00
MINGC29 40.48 2.20
IGSLBHP1 40.37 2.6
IGSLBHW2 40.08 2.7
MINGC28 39.73 2.30
MINGC1 39.71 2.08
MINGC14 39.68 1.80
IGSLBHA8 39.59 2.8
MINGC15 39.38 1.80
IGSLBHA6 38.80 2.7
IGSLBH1 38.72 2.3
IGSLBHP3 38.58 2.6
IGSLTE7 38.56 2.8
IGSLTE3 38.54 2.9
MINGC32 38.53 2.80
MINGC33 38.53 3.40
MINGC44 38.48 2.00
MINGC2 38.08 2.20
IGSLBHP4 37.99 2.8
MINGC48 37.88 2.00
MINGC49 37.88 2.11
IGSLBHA4 37.73 2.8
MINGC50 37.28 3.00
IGSLTE6 37.24 2.7
IGSLBHP11 36.84 2.7
IGSLBHA9 36.77 2.9
MINGC3 36.48 3.20
IGSLBHA1 36.13 3.1
MINGC19 36.08 3.70
MINGC17 35.98 2.90
MINGC46 35.98 2.90
IGSLBHP5 35.95 2.8
IGSLBHP12 35.92 2.8
IGSLBHP15 35.87 3.6
IGSLBHA5 35.65 3.6
IGSLBHW3 35.02 2.8
IGSLBHW4 34.96 2.8
IGSLBHP13 34.91 3.0
MINGC26 34.78 2.65
IGSLBHA7 34.31 2.8
IGSLBHP16 34.14 3.0
MINGC20 33.83 4.20
IGSLBH2 33.72 2.2
IGSLBHP6 33.72 3.0
IGSLBHP9 33.51 2.8
MINGC6 33.08 2.63
MINGC25 32.98 2.35
MINGC47 32.88 3.60
IGSLBHW5 32.75 2.9
IGSLBHA2 32.74 2.9
MINGC18 32.58 2.90
IGSLBHP10 32.16 3.5
IGSLBHP7 32.03 2.8
IGSLTE2 31.82 3.0
IGSLBHW9 31.77 3.6
MINGC9 31.63 3.20
MINGC23 31.48 3.00
IGSLBHA3 31.38 3.3
MINGC39 31.38 3.70
IGSLBHW8 30.82 3.7
MINGC22 30.68 3.60
MINGC24 30.48 2.85
IGSLBHW6 30.47 2.8
MINGC21 29.73 3.80
IGSLBHW7 29.03 3.8
IGSLBHP17 28.99 3.7
MINGC36 27.88 5.10
MINGC10 27.48 2.35
MINGC5 25.88 4.75
MINGC12 24.03 3.65
MINGC11 22.83 4.70
Figure 4: Thickness of Peat v Ground Elevation
22.0
24.0
26.0
28.0
30.0
32.0
34.0
36.0
38.0
40.0
42.0
44.0
0.0 1.0 2.0 3.0 4.0 5.0 6.0
Thickness of Peat (m)
Gro
und
Elev
atio
n (m
)
Average Variation of Peat Thickness with Ground Elevation
Arup Consulting EngineersJ:\C-1100\C1157\(4) Design\10\
RP004_Figure 4_Thickness of peat v Ground elevation.xls Sheet1 29/11/2003
For
insp
ectio
n pur
pose
s only
.
Conse
nt of
copy
right
owne
r req
uired
for a
ny ot
her u
se.
EPA Export 12-11-2014:23:31:43

Shell E and P Ireland Ltd Corrib Terminal: Bellanaboy Bridge
Arup Consulting EngineersJ:\C-1100\C1157\(4) Design\10\
RP004_Figure 5_Peat Humification.xls \Chart_Range Ave_Best fit line 29/11/2003
Figure 5: Level of Peat Humification versus Ground Elevation
based on Von Post Classification
20
22
24
26
28
30
32
34
36
38
40
42
44
0.0 0.5 1.0 1.5 2.0 2.5 3.0 3.5Average Depth (mBGL)
Ave
rage
Gro
und
Elev
atio
n (m
AO
D)
Average Approx. Depth (mBGL) at which Humification Obtains a Value of H4 over 2 m Range in Ground ElevationAverage Approx. Depth (mBGL) at which Humification Obtains a Value of H8 over 2 m Range in Ground Elevation
Upslope limit of H8
Material
For
insp
ectio
n pur
pose
s only
.
Conse
nt of
copy
right
owne
r req
uired
for a
ny ot
her u
se.
EPA Export 12-11-2014:23:31:43

Shell E and P Ireland Ltd Corrib Terminal: Bellanaboy Bridge
Arup Consulting EngineersJ:\C-1100\C1157\(4) Design\10\
RP004_Figure 6_Site Investigation Information.xls Mineral Soils_Chart 29/11/2003
Figure 6: Thickness of Mineral Soil Deposits versus Elevation of Base of Peat
20
22
24
26
28
30
32
34
36
38
40
42
44
0.0 0.5 1.0 1.5 2.0 2.5 3.0 3.5
Thickness of Mineral Soils (m)
Elev
atio
n of
Bas
e of
Pea
t (m
AO
D)
Hillwash and Glacial Till
Hillwash alone
For
insp
ectio
n pur
pose
s only
.
Conse
nt of
copy
right
owne
r req
uired
for a
ny ot
her u
se.
EPA Export 12-11-2014:23:31:43

For
insp
ectio
n pur
pose
s only
.
Conse
nt of
copy
right
owne
r req
uired
for a
ny ot
her u
se.
EPA Export 12-11-2014:23:31:43

Shell E and P Ireland Ltd Corrib Terminal: Bellanaboy Bridge
Arup Consulting EngineersJ:\C-1100\C1157\(4) Design\10\
RP004_Figure 8 & 9_rotary cores.xls Chart1 04/12/2003
Figure 8: Core Recovery in Rotary Coreholes from Terminal Site versus Ground Elevation
25
26
27
28
29
30
31
32
33
34
35
36
37
38
39
40
41
42
43
44
45
46
0 5 10 15 20 25
Depth (mBGL)
Gro
und
surf
ace
elev
atio
n (m
AO
D)
core recovery exceeds 50%core recovery exceeds 75%core recovery exceeds 90%
Average Depth to Rockhead
IDBH-3IDBH-6IDBH-P14IDBH-11IDBH-P2IDBH-8IDBH-7IDBH-2IDBH-9IDBH-10IDBH-P3IDBH-12IDBH-4IDBH-5IDBH-P5IDBH-P15IDBH-P13IDBH-P16IDBH-P10Te
rrace
For
insp
ectio
n pur
pose
s only
.
Conse
nt of
copy
right
owne
r req
uired
for a
ny ot
her u
se.
EPA Export 12-11-2014:23:31:43

Shell E and P Ireland Ltd Corrib Terminal: Bellanaboy Bridge
Arup Consulting EngineersJ:\C-1100\C1157\(4) Design\10\
RP004_Figure 8 & 9_rotary cores.xls Chart2 04/12/2003
Figure 9: Core Recovery in Rotary Coreholes from Repository Location versus Ground Elevation
25
26
27
28
29
30
31
32
33
34
35
36
37
38
39
40
41
42
43
44
45
46
47
48
0 2 4 6 8 10 12 14 16
Depth (mBGL)
Gro
und
surf
ace
elev
atio
n (m
AO
D)
core recovery exceeds 50%core recovery exceeds 75%core recovery exceeds 90%
CH-26CH-9CH-12CH-1CH-24CH-11CH-10CH-2
For
insp
ectio
n pur
pose
s only
.
Conse
nt of
copy
right
owne
r req
uired
for a
ny ot
her u
se.
EPA Export 12-11-2014:23:31:43

Shell E and P Ireland Ltd Corrib Terminal: Bellanaboy Bridge
Arup Consulting EngineersJ:\C-100\C1157\(4) Design\10\Sheet1 Chart 2Sheet1 Chart 2 04/12/2003
Figure 10: UCS and PL Strength Versus Core Recovery
0
20
40
60
80
100
120
0 10 20 30 40 50 60 70 80 90 100Core Recovery (%)
UC
S an
d PL
Str
engt
h (M
Pa)
ID BH1ID BH2ID BH3ID BH5ID BH6ID BH7ID BH8ID BH9ID BH10ID BH11ID BH12ID BHP2ID BHP3ID BHP5ID BHP10ID BHP13ID BHP14ID BHP15ID BHP16
Quartzite
Psammite
Pellite
Semi-Pellite
not present as solid core
For
insp
ectio
n pur
pose
s only
.
Conse
nt of
copy
right
owne
r req
uired
for a
ny ot
her u
se.
EPA Export 12-11-2014:23:31:43

For
insp
ectio
n pur
pose
s only
.
Conse
nt of
copy
right
owne
r req
uired
for a
ny ot
her u
se.
EPA Export 12-11-2014:23:31:43

APPENDIX B Geological Cross Sections
For
insp
ectio
n pur
pose
s only
.
Conse
nt of
copy
right
owne
r req
uired
for a
ny ot
her u
se.
EPA Export 12-11-2014:23:31:43

For
insp
ectio
n pur
pose
s only
.
Conse
nt of
copy
right
owne
r req
uired
for a
ny ot
her u
se.
EPA Export 12-11-2014:23:31:43
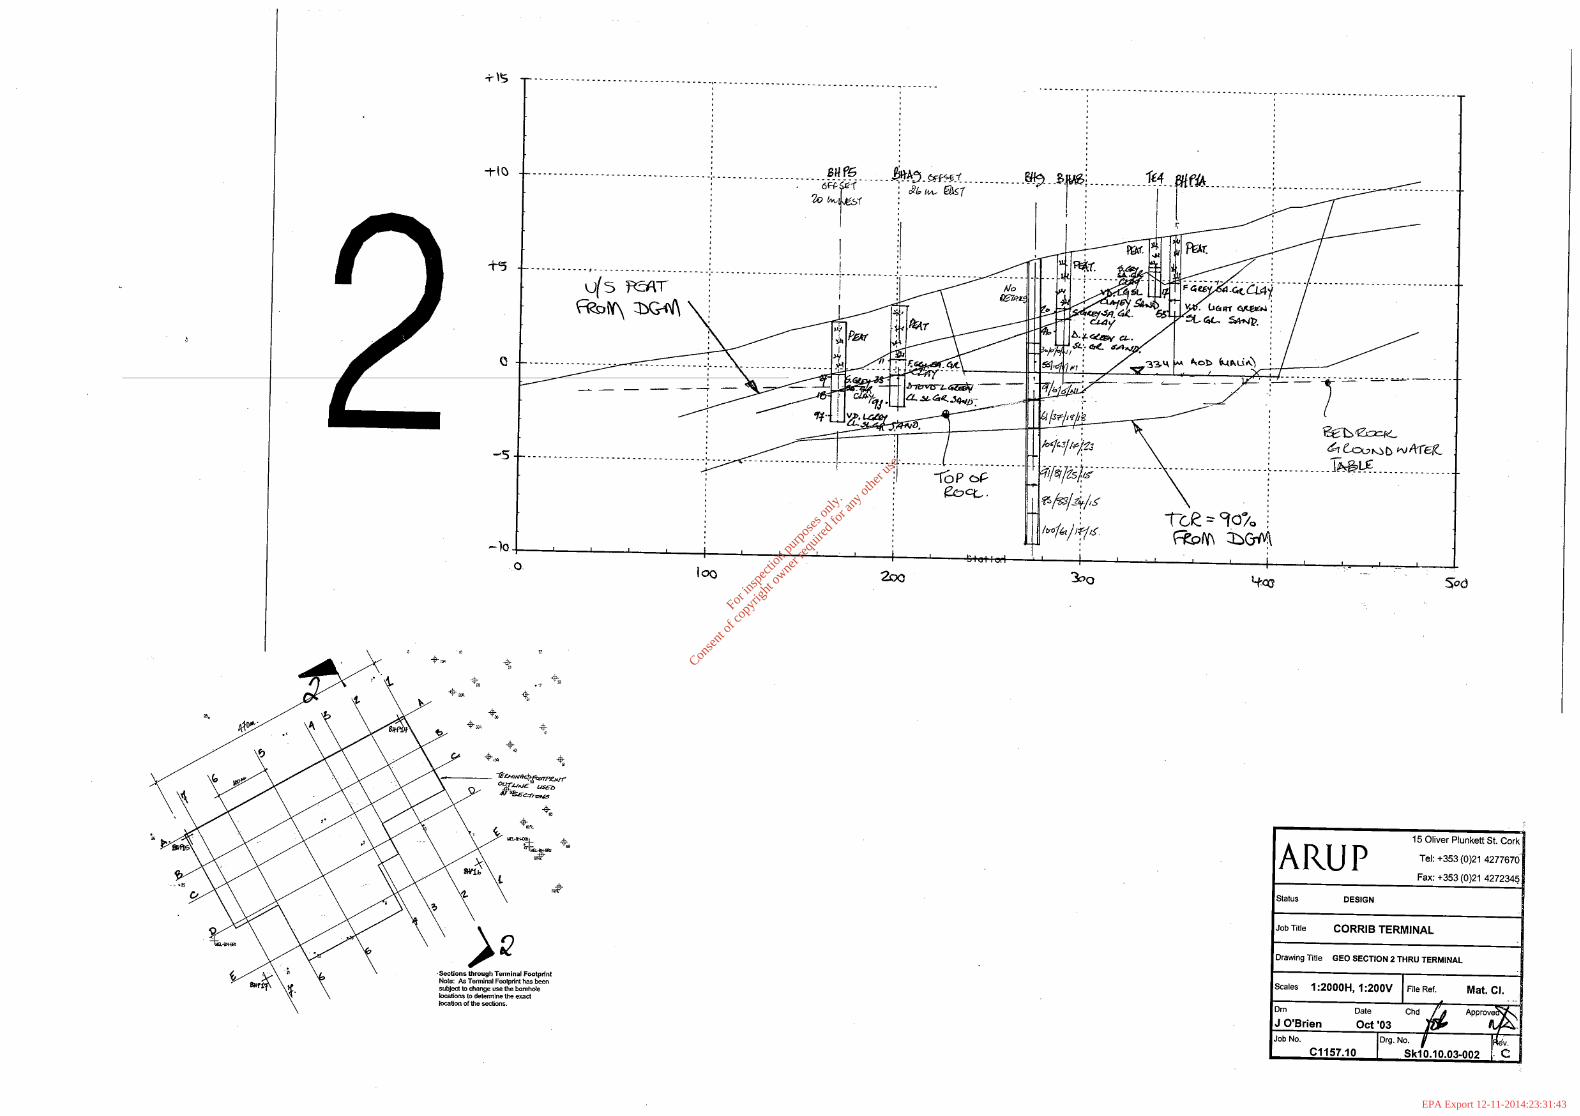
For
insp
ectio
n pur
pose
s only
.
Conse
nt of
copy
right
owne
r req
uired
for a
ny ot
her u
se.
EPA Export 12-11-2014:23:31:43

For
insp
ectio
n pur
pose
s only
.
Conse
nt of
copy
right
owne
r req
uired
for a
ny ot
her u
se.
EPA Export 12-11-2014:23:31:43

For
insp
ectio
n pur
pose
s only
.
Conse
nt of
copy
right
owne
r req
uired
for a
ny ot
her u
se.
EPA Export 12-11-2014:23:31:43
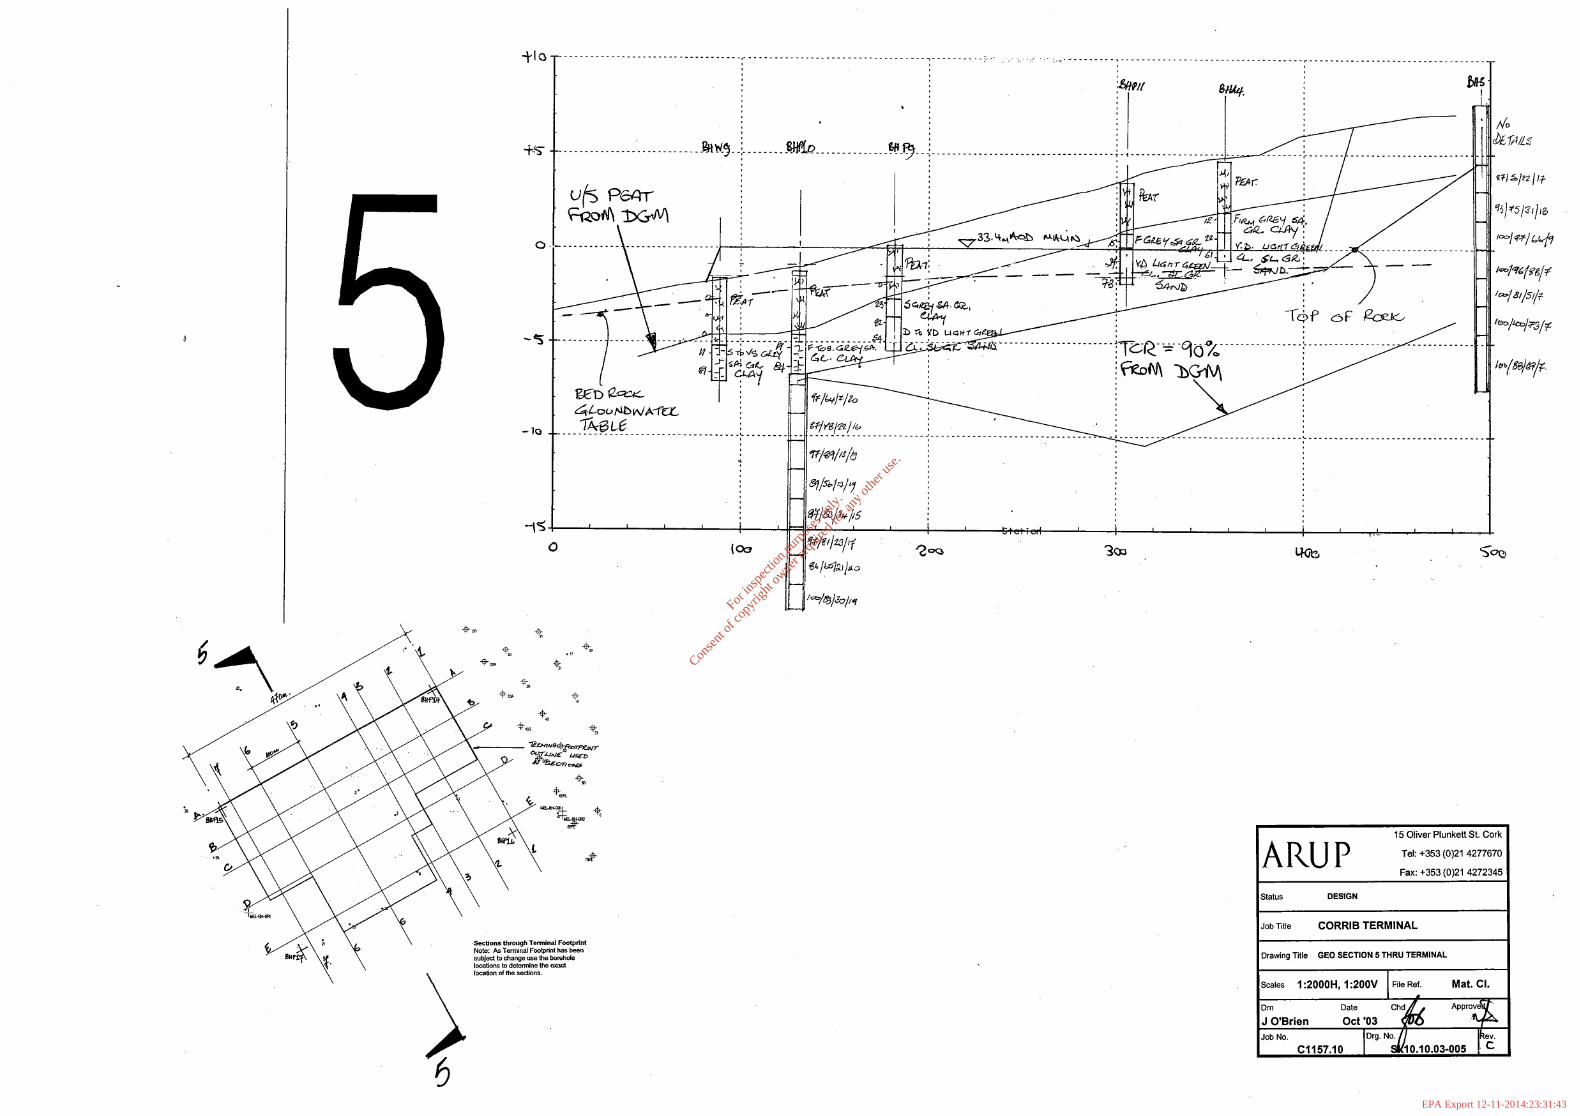
For
insp
ectio
n pur
pose
s only
.
Conse
nt of
copy
right
owne
r req
uired
for a
ny ot
her u
se.
EPA Export 12-11-2014:23:31:43

For
insp
ectio
n pur
pose
s only
.
Conse
nt of
copy
right
owne
r req
uired
for a
ny ot
her u
se.
EPA Export 12-11-2014:23:31:43

For
insp
ectio
n pur
pose
s only
.
Conse
nt of
copy
right
owne
r req
uired
for a
ny ot
her u
se.
EPA Export 12-11-2014:23:31:43
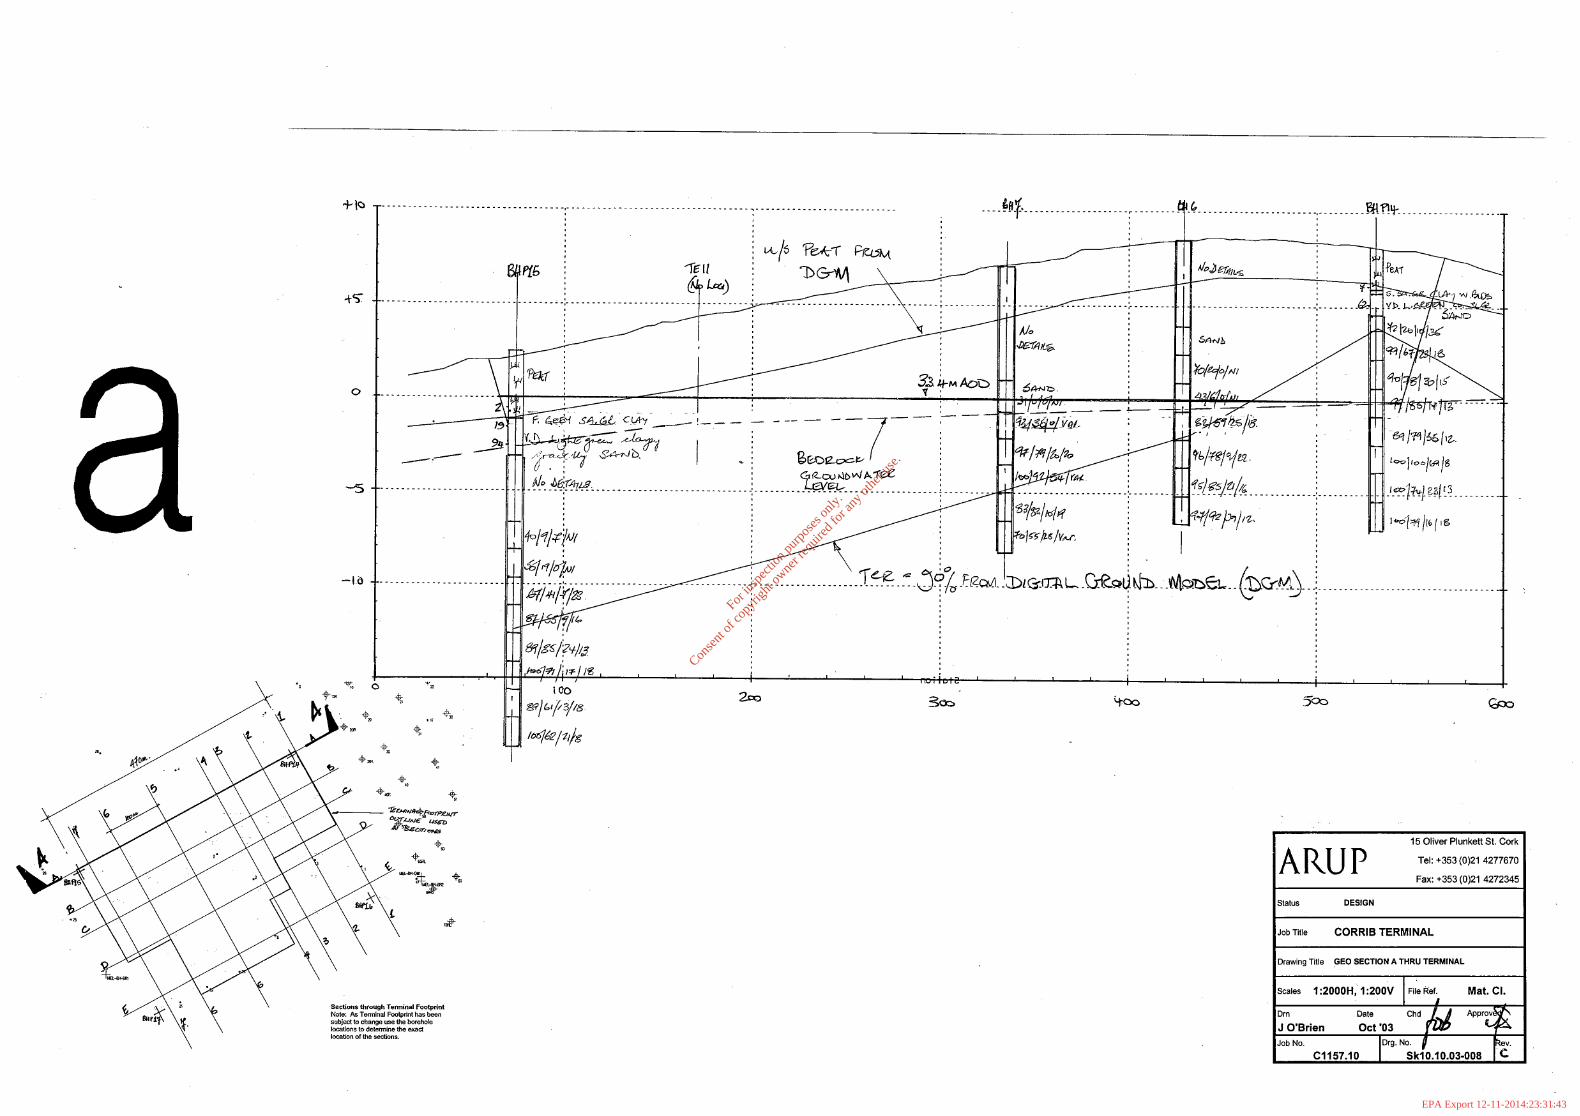
For
insp
ectio
n pur
pose
s only
.
Conse
nt of
copy
right
owne
r req
uired
for a
ny ot
her u
se.
EPA Export 12-11-2014:23:31:43
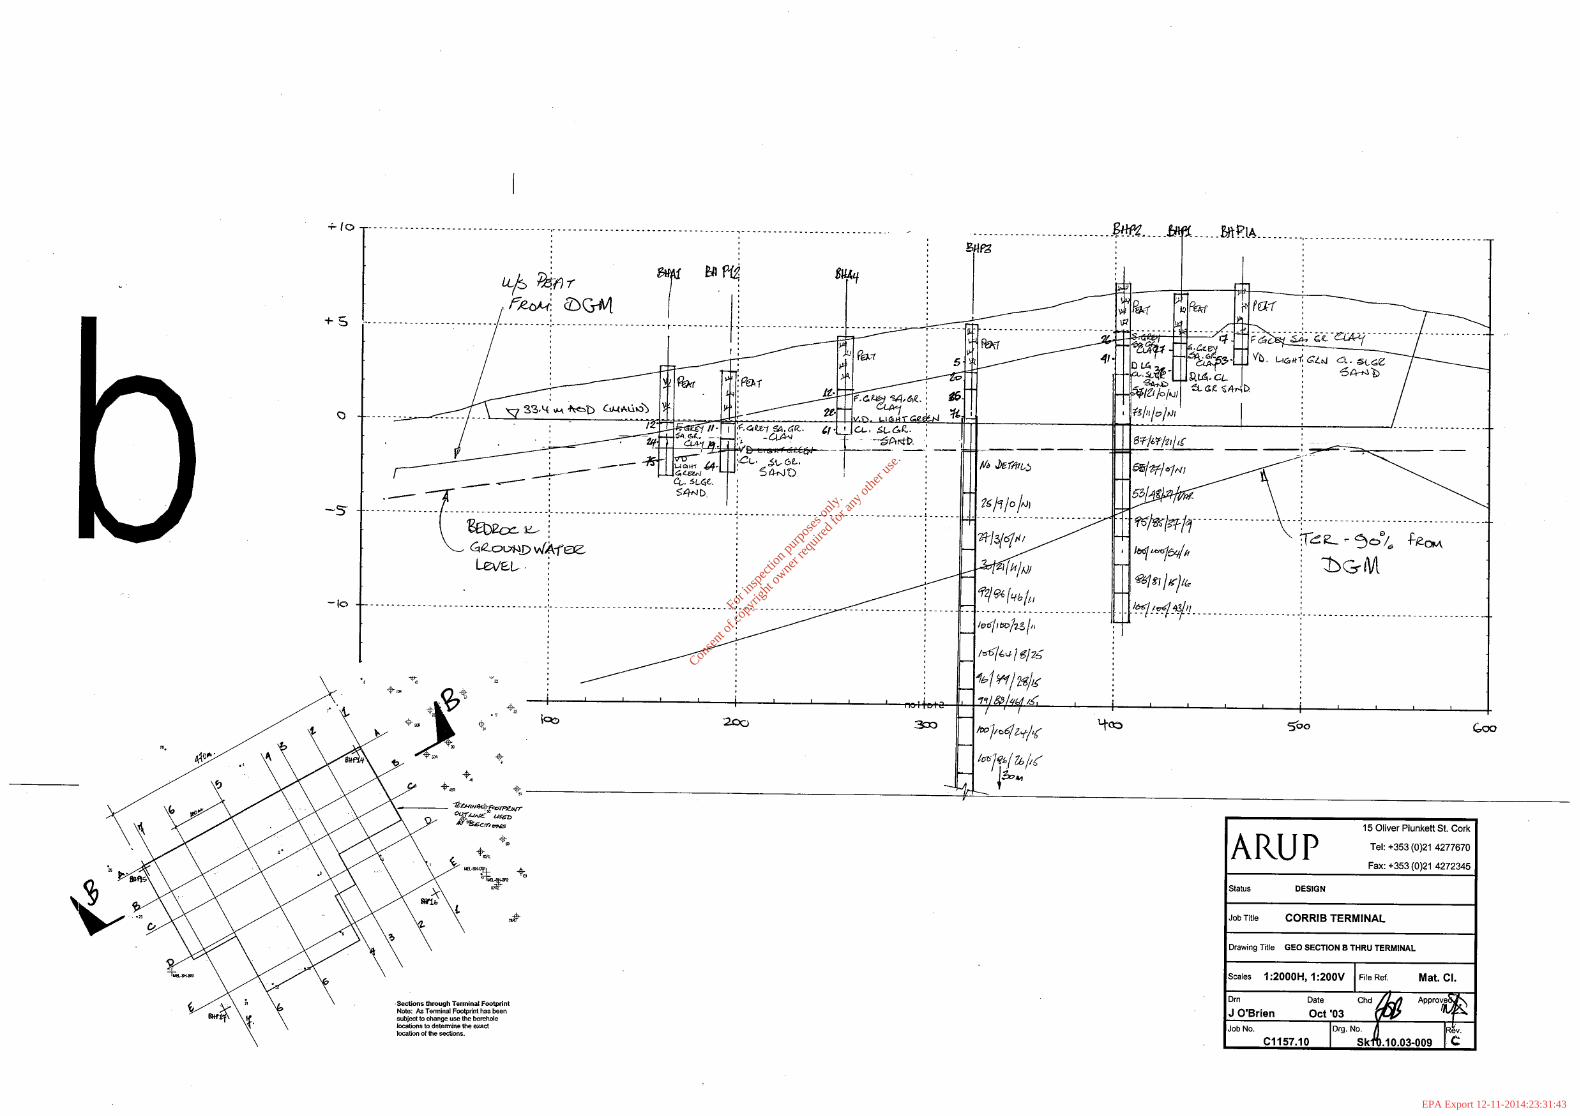
For
insp
ectio
n pur
pose
s only
.
Conse
nt of
copy
right
owne
r req
uired
for a
ny ot
her u
se.
EPA Export 12-11-2014:23:31:43
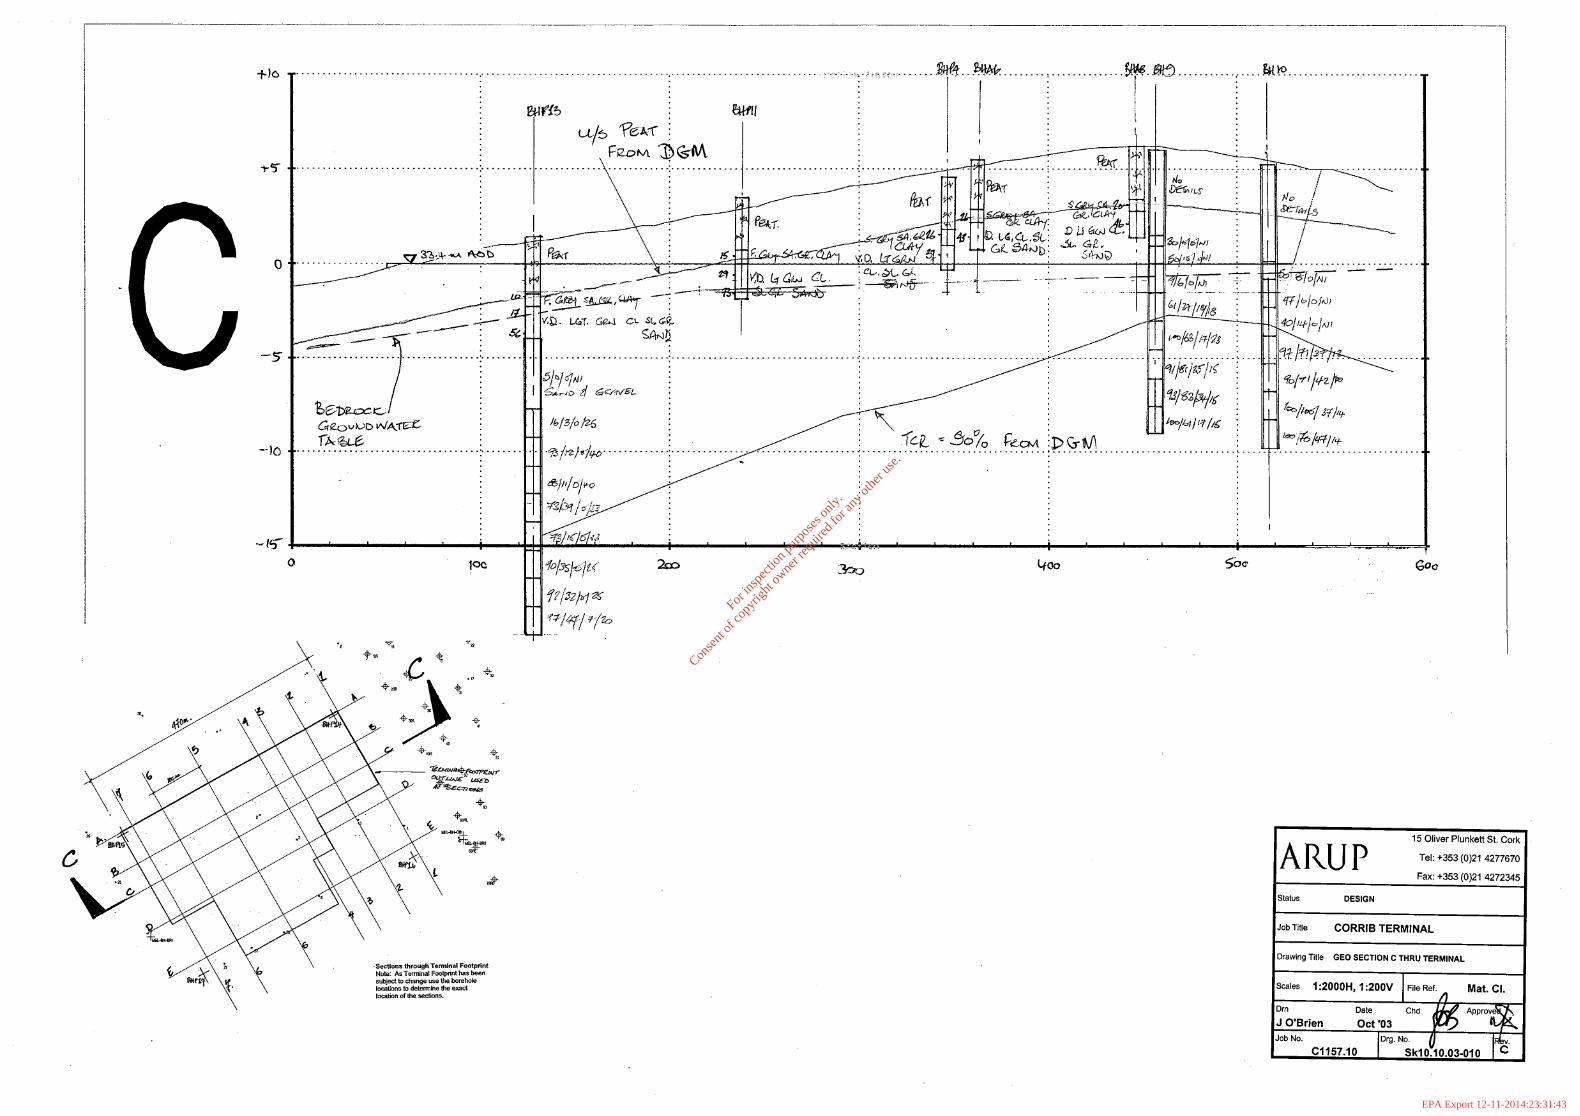
For
insp
ectio
n pur
pose
s only
.
Conse
nt of
copy
right
owne
r req
uired
for a
ny ot
her u
se.
EPA Export 12-11-2014:23:31:43

For
insp
ectio
n pur
pose
s only
.
Conse
nt of
copy
right
owne
r req
uired
for a
ny ot
her u
se.
EPA Export 12-11-2014:23:31:43

For
insp
ectio
n pur
pose
s only
.
Conse
nt of
copy
right
owne
r req
uired
for a
ny ot
her u
se.
EPA Export 12-11-2014:23:31:43

APPENDIX C von Post Humification Index
For
insp
ectio
n pur
pose
s only
.
Conse
nt of
copy
right
owne
r req
uired
for a
ny ot
her u
se.
EPA Export 12-11-2014:23:31:43

For
insp
ectio
n pur
pose
s only
.
Conse
nt of
copy
right
owne
r req
uired
for a
ny ot
her u
se.
EPA Export 12-11-2014:23:31:43

APPENDIX D Selected Photographs (see Figure 22 for locations)
For
insp
ectio
n pur
pose
s only
.
Conse
nt of
copy
right
owne
r req
uired
for a
ny ot
her u
se.
EPA Export 12-11-2014:23:31:43

Plate 1. Quarry to east of terminal site, showing peat overlying head. Note light grey leachedzone (A horizon) with thin iron pan layer (arrowed) developed at interface with underlyinglight brown head.
Plate 2. Quarry to east of terminal site, showing Benmore Formation bedrock. Note beddingand dip of this quartzite formation, and platy shape of the rock fragments. Note also how thebedding is turned over towards the top of the bedrock at the interface with the overlying head.
For
insp
ectio
n pur
pose
s only
.
Conse
nt of
copy
right
owne
r req
uired
for a
ny ot
her u
se.
EPA Export 12-11-2014:23:31:44

Plate 3. Looking south-west along the forestry track that runs along the crest of the terminalsite ridge. Portacabins in the distance mark the north-east corner of the terminal footprintarea. Note the high ground of Bellanaboy ridge in the background.
Plate 4. Terminal footprint area approximately mid-way down the slope looking east. Noteground slope (left to right) is barely perceptible.
For
insp
ectio
n pur
pose
s only
.
Conse
nt of
copy
right
owne
r req
uired
for a
ny ot
her u
se.
EPA Export 12-11-2014:23:31:44
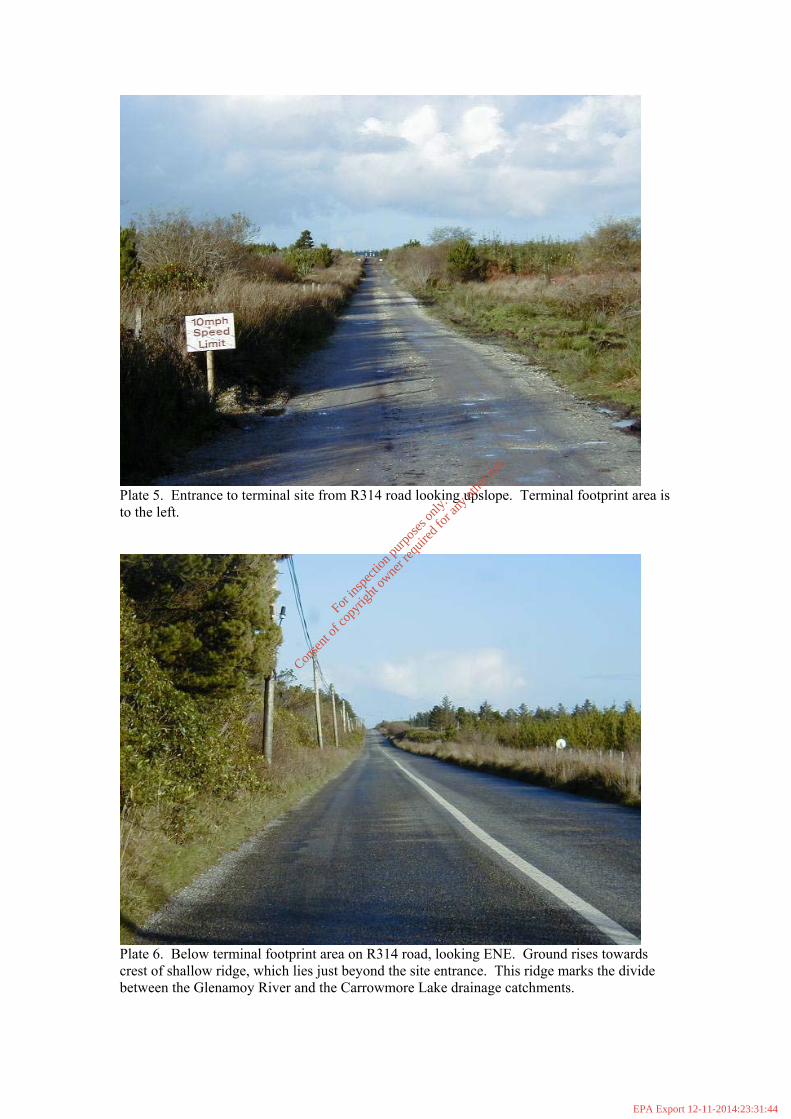
Plate 5. Entrance to terminal site from R314 road looking upslope. Terminal footprint area isto the left.
Plate 6. Below terminal footprint area on R314 road, looking ENE. Ground rises towardscrest of shallow ridge, which lies just beyond the site entrance. This ridge marks the dividebetween the Glenamoy River and the Carrowmore Lake drainage catchments.
For
insp
ectio
n pur
pose
s only
.
Conse
nt of
copy
right
owne
r req
uired
for a
ny ot
her u
se.
EPA Export 12-11-2014:23:31:44
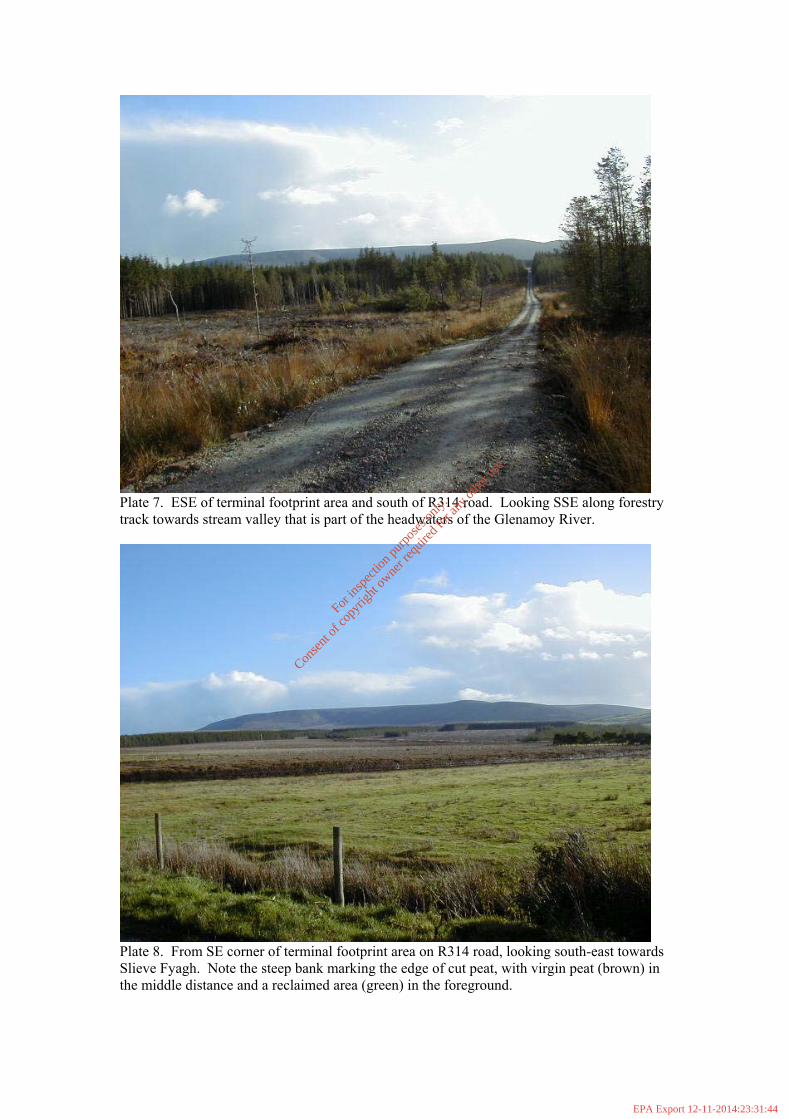
Plate 7. ESE of terminal footprint area and south of R314 road. Looking SSE along forestrytrack towards stream valley that is part of the headwaters of the Glenamoy River.
Plate 8. From SE corner of terminal footprint area on R314 road, looking south-east towardsSlieve Fyagh. Note the steep bank marking the edge of cut peat, with virgin peat (brown) inthe middle distance and a reclaimed area (green) in the foreground.
For
insp
ectio
n pur
pose
s only
.
Conse
nt of
copy
right
owne
r req
uired
for a
ny ot
her u
se.
EPA Export 12-11-2014:23:31:44

APPENDIX E Derivation of Equation for Factor of Safety against Sliding
For
insp
ectio
n pur
pose
s only
.
Conse
nt of
copy
right
owne
r req
uired
for a
ny ot
her u
se.
EPA Export 12-11-2014:23:31:44

For
insp
ectio
n pur
pose
s only
.
Conse
nt of
copy
right
owne
r req
uired
for a
ny ot
her u
se.
EPA Export 12-11-2014:23:31:44
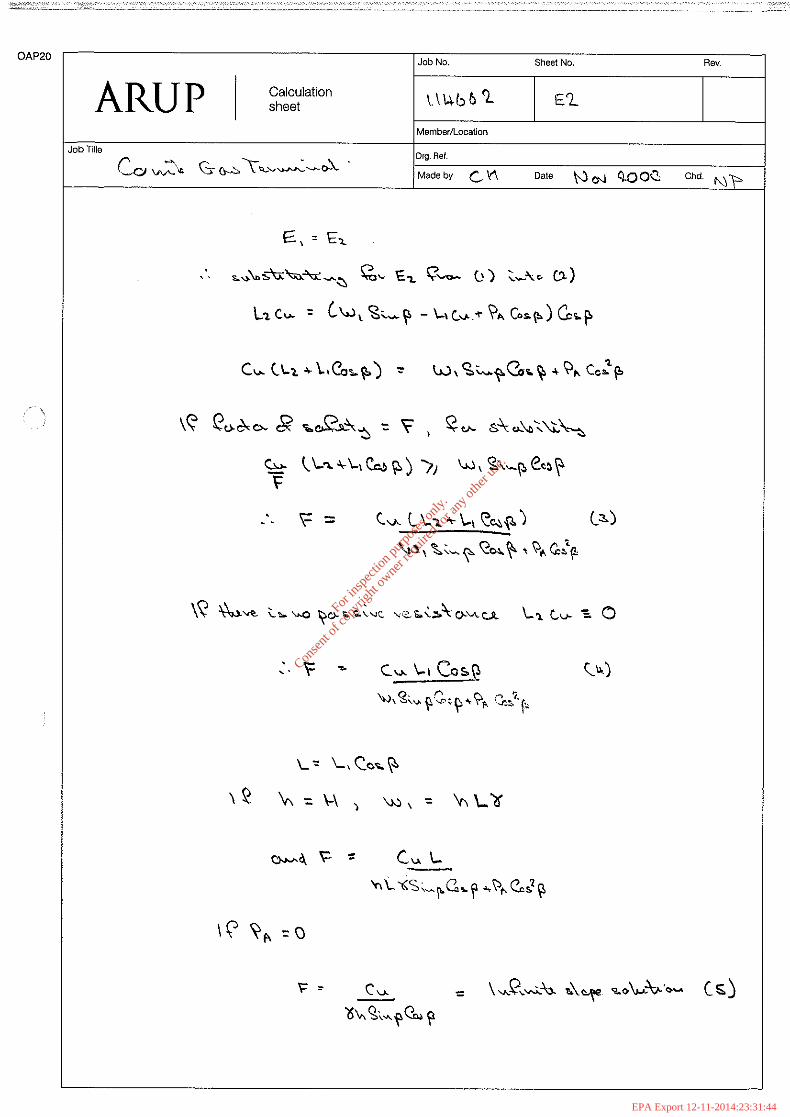
For
insp
ectio
n pur
pose
s only
.
Conse
nt of
copy
right
owne
r req
uired
for a
ny ot
her u
se.
EPA Export 12-11-2014:23:31:44

For
insp
ectio
n pur
pose
s only
.
Conse
nt of
copy
right
owne
r req
uired
for a
ny ot
her u
se.
EPA Export 12-11-2014:23:31:44

For
insp
ectio
n pur
pose
s only
.
Conse
nt of
copy
right
owne
r req
uired
for a
ny ot
her u
se.
EPA Export 12-11-2014:23:31:44

APPENDIX F Calibration Calculations of Wedge Analysis Method
For
insp
ectio
n pur
pose
s only
.
Conse
nt of
copy
right
owne
r req
uired
for a
ny ot
her u
se.
EPA Export 12-11-2014:23:31:44
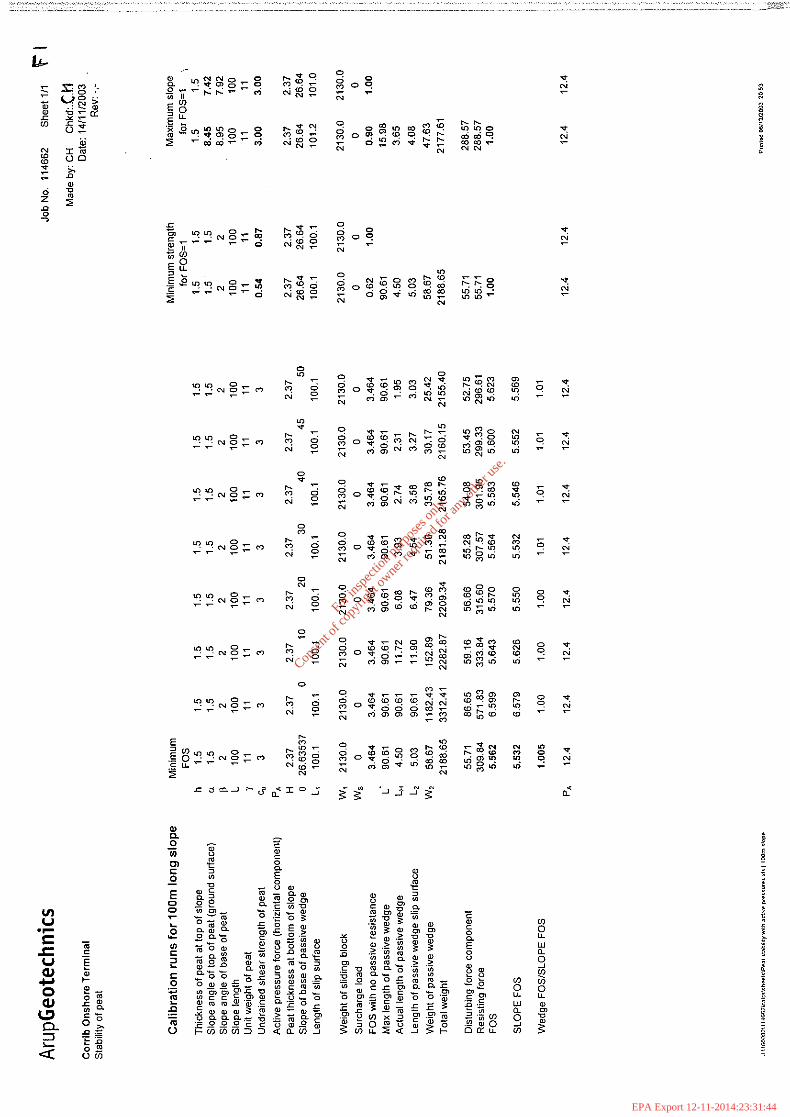
For
insp
ectio
n pur
pose
s only
.
Conse
nt of
copy
right
owne
r req
uired
for a
ny ot
her u
se.
EPA Export 12-11-2014:23:31:44

For
insp
ectio
n pur
pose
s only
.
Conse
nt of
copy
right
owne
r req
uired
for a
ny ot
her u
se.
EPA Export 12-11-2014:23:31:44

For
insp
ectio
n pur
pose
s only
.
Conse
nt of
copy
right
owne
r req
uired
for a
ny ot
her u
se.
EPA Export 12-11-2014:23:31:44

For
insp
ectio
n pur
pose
s only
.
Conse
nt of
copy
right
owne
r req
uired
for a
ny ot
her u
se.
EPA Export 12-11-2014:23:31:44

For
insp
ectio
n pur
pose
s only
.
Conse
nt of
copy
right
owne
r req
uired
for a
ny ot
her u
se.
EPA Export 12-11-2014:23:31:44

For
insp
ectio
n pur
pose
s only
.
Conse
nt of
copy
right
owne
r req
uired
for a
ny ot
her u
se.
EPA Export 12-11-2014:23:31:44

For
insp
ectio
n pur
pose
s only
.
Conse
nt of
copy
right
owne
r req
uired
for a
ny ot
her u
se.
EPA Export 12-11-2014:23:31:44

For
insp
ectio
n pur
pose
s only
.
Conse
nt of
copy
right
owne
r req
uired
for a
ny ot
her u
se.
EPA Export 12-11-2014:23:31:44

For
insp
ectio
n pur
pose
s only
.
Conse
nt of
copy
right
owne
r req
uired
for a
ny ot
her u
se.
EPA Export 12-11-2014:23:31:44

For
insp
ectio
n pur
pose
s only
.
Conse
nt of
copy
right
owne
r req
uired
for a
ny ot
her u
se.
EPA Export 12-11-2014:23:31:44

For
insp
ectio
n pur
pose
s only
.
Conse
nt of
copy
right
owne
r req
uired
for a
ny ot
her u
se.
EPA Export 12-11-2014:23:31:44

For
insp
ectio
n pur
pose
s only
.
Conse
nt of
copy
right
owne
r req
uired
for a
ny ot
her u
se.
EPA Export 12-11-2014:23:31:44

For
insp
ectio
n pur
pose
s only
.
Conse
nt of
copy
right
owne
r req
uired
for a
ny ot
her u
se.
EPA Export 12-11-2014:23:31:44

For
insp
ectio
n pur
pose
s only
.
Conse
nt of
copy
right
owne
r req
uired
for a
ny ot
her u
se.
EPA Export 12-11-2014:23:31:44

For
insp
ectio
n pur
pose
s only
.
Conse
nt of
copy
right
owne
r req
uired
for a
ny ot
her u
se.
EPA Export 12-11-2014:23:31:44
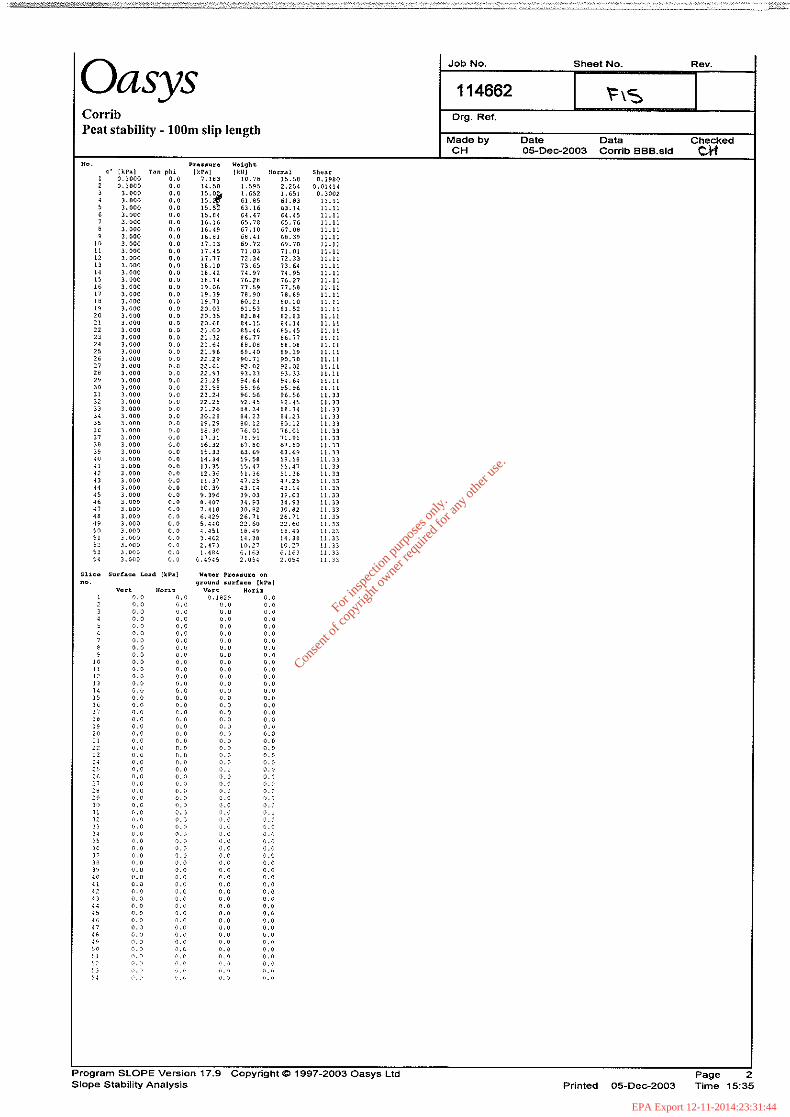
For
insp
ectio
n pur
pose
s only
.
Conse
nt of
copy
right
owne
r req
uired
for a
ny ot
her u
se.
EPA Export 12-11-2014:23:31:44

For
insp
ectio
n pur
pose
s only
.
Conse
nt of
copy
right
owne
r req
uired
for a
ny ot
her u
se.
EPA Export 12-11-2014:23:31:44

For
insp
ectio
n pur
pose
s only
.
Conse
nt of
copy
right
owne
r req
uired
for a
ny ot
her u
se.
EPA Export 12-11-2014:23:31:44

For
insp
ectio
n pur
pose
s only
.
Conse
nt of
copy
right
owne
r req
uired
for a
ny ot
her u
se.
EPA Export 12-11-2014:23:31:44

For
insp
ectio
n pur
pose
s only
.
Conse
nt of
copy
right
owne
r req
uired
for a
ny ot
her u
se.
EPA Export 12-11-2014:23:31:44

For
insp
ectio
n pur
pose
s only
.
Conse
nt of
copy
right
owne
r req
uired
for a
ny ot
her u
se.
EPA Export 12-11-2014:23:31:44

For
insp
ectio
n pur
pose
s only
.
Conse
nt of
copy
right
owne
r req
uired
for a
ny ot
her u
se.
EPA Export 12-11-2014:23:31:44

For
insp
ectio
n pur
pose
s only
.
Conse
nt of
copy
right
owne
r req
uired
for a
ny ot
her u
se.
EPA Export 12-11-2014:23:31:44
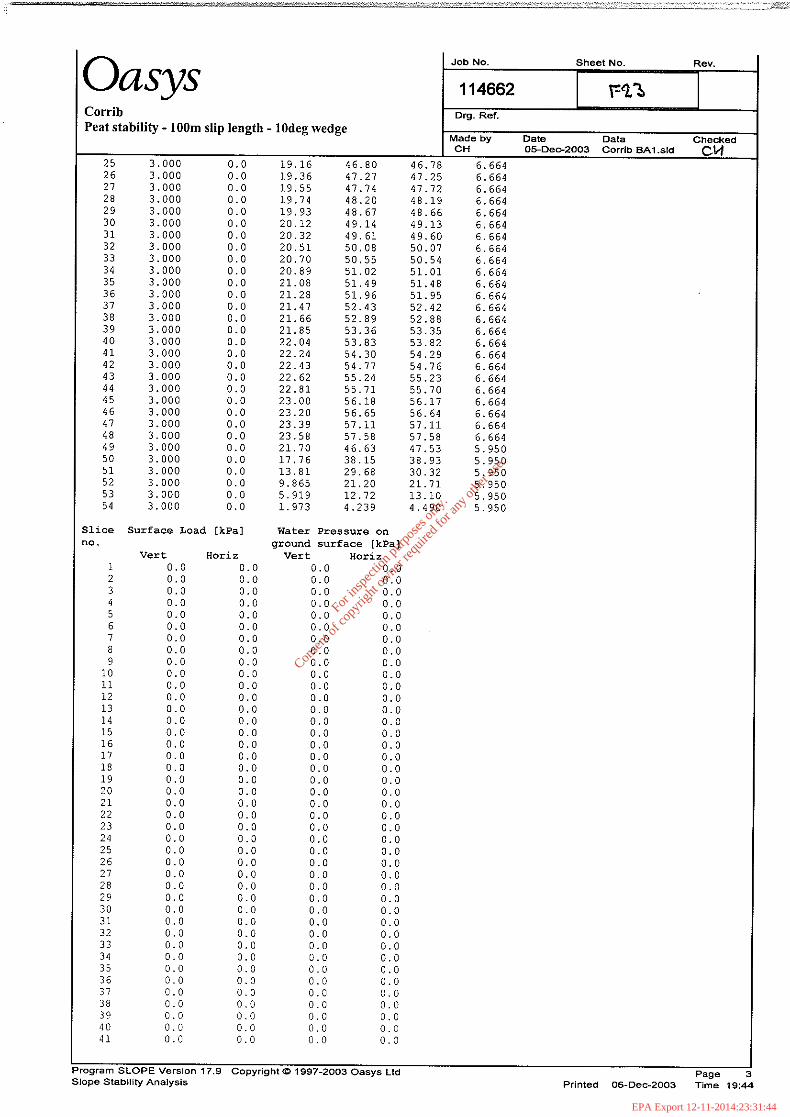
For
insp
ectio
n pur
pose
s only
.
Conse
nt of
copy
right
owne
r req
uired
for a
ny ot
her u
se.
EPA Export 12-11-2014:23:31:44

For
insp
ectio
n pur
pose
s only
.
Conse
nt of
copy
right
owne
r req
uired
for a
ny ot
her u
se.
EPA Export 12-11-2014:23:31:44
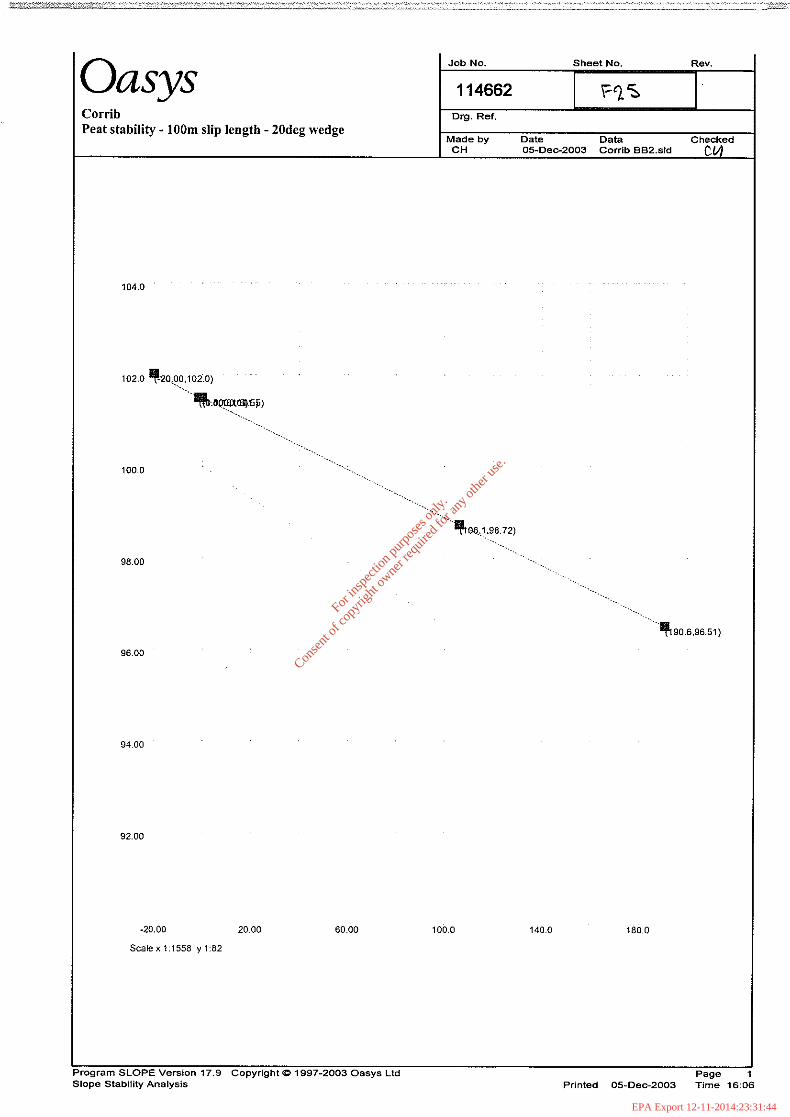
For
insp
ectio
n pur
pose
s only
.
Conse
nt of
copy
right
owne
r req
uired
for a
ny ot
her u
se.
EPA Export 12-11-2014:23:31:44

For
insp
ectio
n pur
pose
s only
.
Conse
nt of
copy
right
owne
r req
uired
for a
ny ot
her u
se.
EPA Export 12-11-2014:23:31:44

For
insp
ectio
n pur
pose
s only
.
Conse
nt of
copy
right
owne
r req
uired
for a
ny ot
her u
se.
EPA Export 12-11-2014:23:31:44

For
insp
ectio
n pur
pose
s only
.
Conse
nt of
copy
right
owne
r req
uired
for a
ny ot
her u
se.
EPA Export 12-11-2014:23:31:44

For
insp
ectio
n pur
pose
s only
.
Conse
nt of
copy
right
owne
r req
uired
for a
ny ot
her u
se.
EPA Export 12-11-2014:23:31:44

For
insp
ectio
n pur
pose
s only
.
Conse
nt of
copy
right
owne
r req
uired
for a
ny ot
her u
se.
EPA Export 12-11-2014:23:31:44

For
insp
ectio
n pur
pose
s only
.
Conse
nt of
copy
right
owne
r req
uired
for a
ny ot
her u
se.
EPA Export 12-11-2014:23:31:44
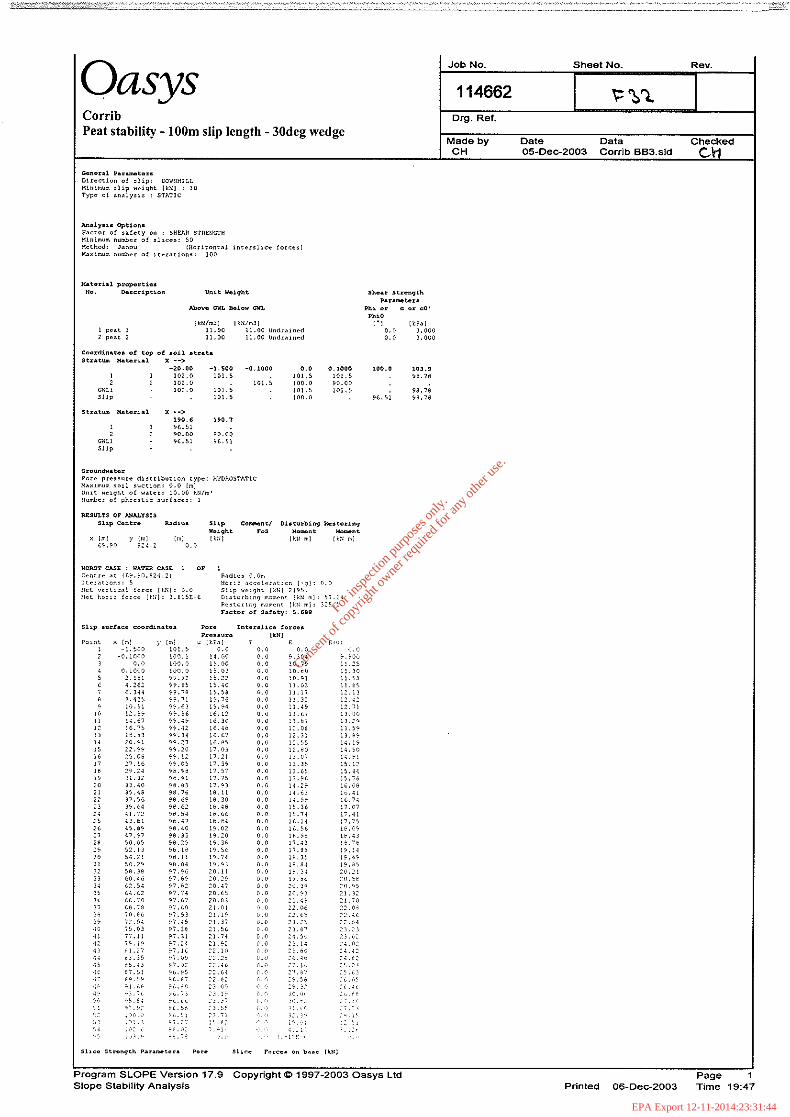
For
insp
ectio
n pur
pose
s only
.
Conse
nt of
copy
right
owne
r req
uired
for a
ny ot
her u
se.
EPA Export 12-11-2014:23:31:44
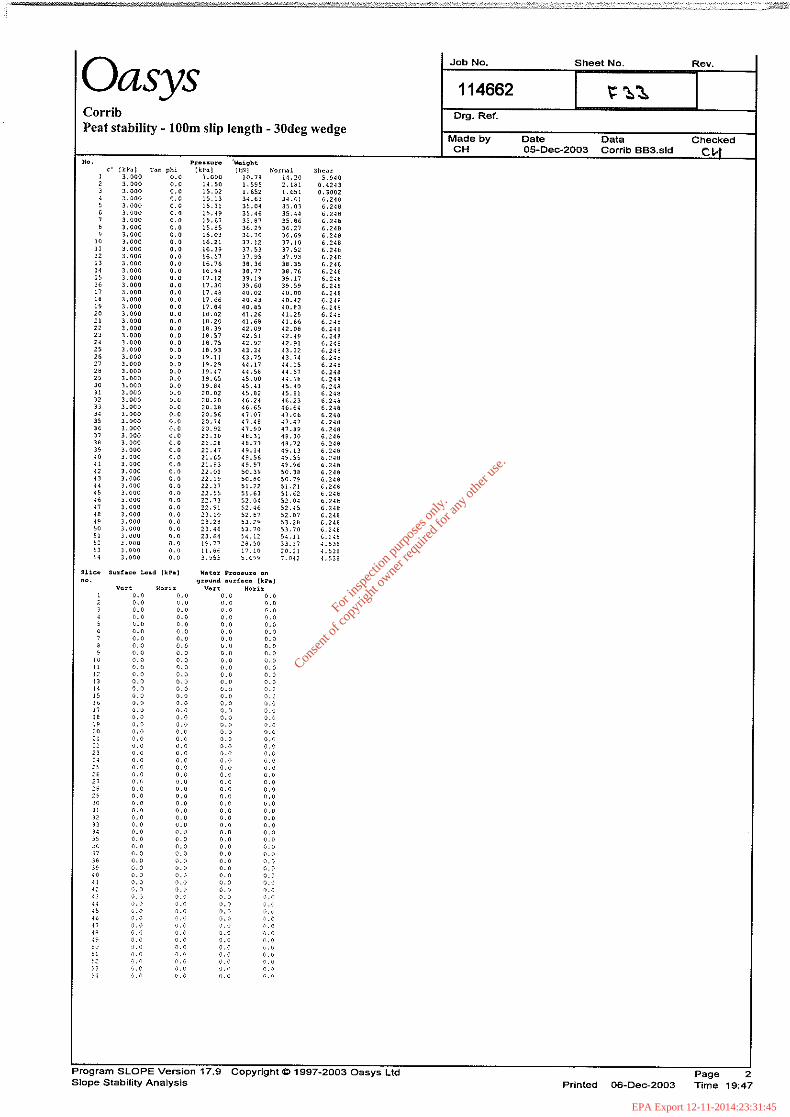
For
insp
ectio
n pur
pose
s only
.
Conse
nt of
copy
right
owne
r req
uired
for a
ny ot
her u
se.
EPA Export 12-11-2014:23:31:45
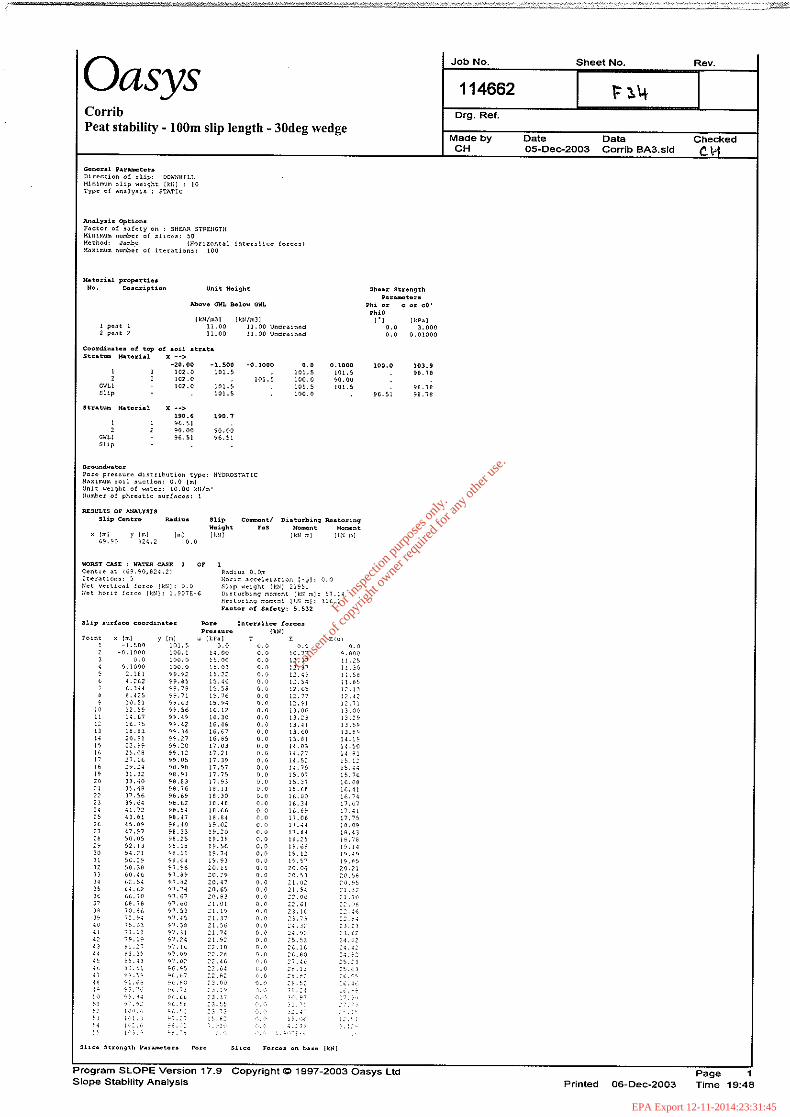
For
insp
ectio
n pur
pose
s only
.
Conse
nt of
copy
right
owne
r req
uired
for a
ny ot
her u
se.
EPA Export 12-11-2014:23:31:45

For
insp
ectio
n pur
pose
s only
.
Conse
nt of
copy
right
owne
r req
uired
for a
ny ot
her u
se.
EPA Export 12-11-2014:23:31:45
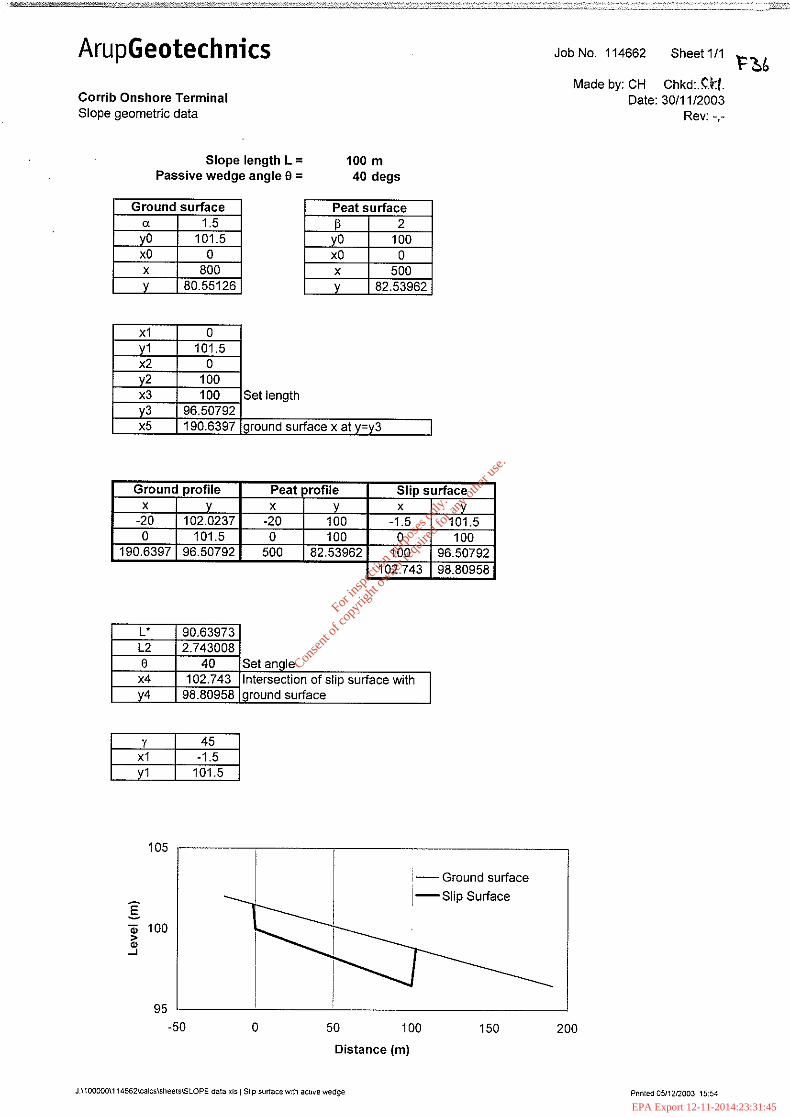
For
insp
ectio
n pur
pose
s only
.
Conse
nt of
copy
right
owne
r req
uired
for a
ny ot
her u
se.
EPA Export 12-11-2014:23:31:45

For
insp
ectio
n pur
pose
s only
.
Conse
nt of
copy
right
owne
r req
uired
for a
ny ot
her u
se.
EPA Export 12-11-2014:23:31:45

For
insp
ectio
n pur
pose
s only
.
Conse
nt of
copy
right
owne
r req
uired
for a
ny ot
her u
se.
EPA Export 12-11-2014:23:31:45
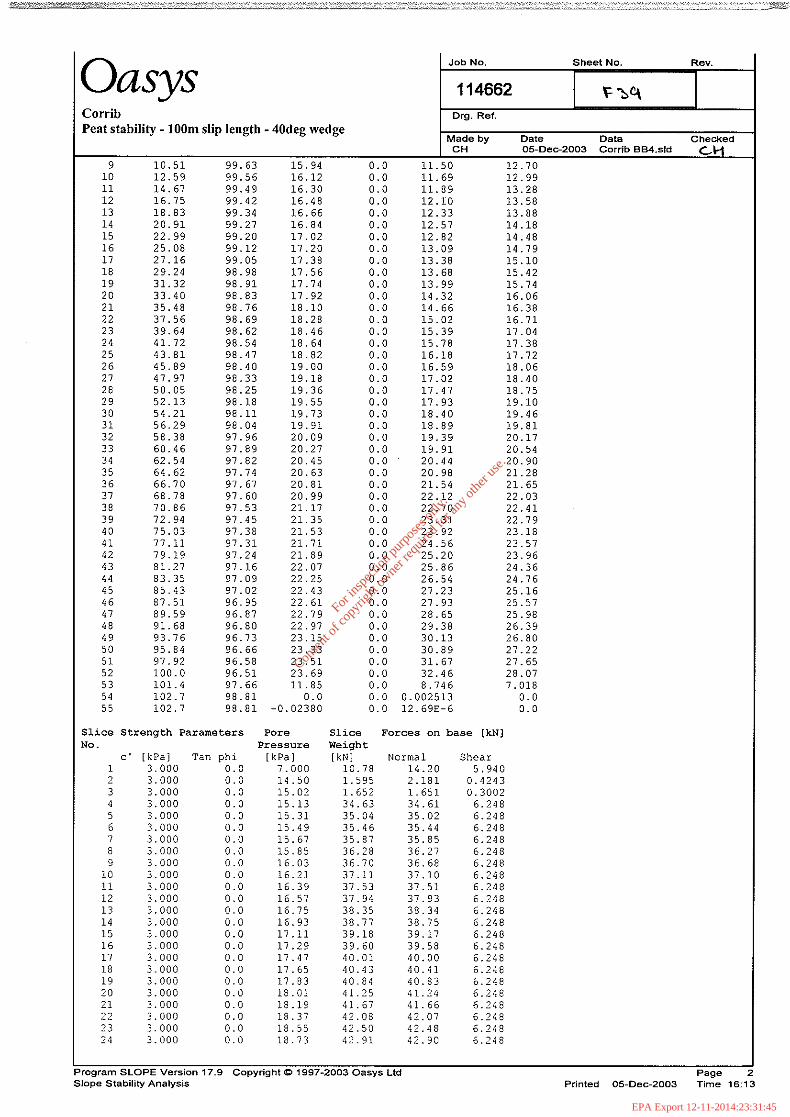
For
insp
ectio
n pur
pose
s only
.
Conse
nt of
copy
right
owne
r req
uired
for a
ny ot
her u
se.
EPA Export 12-11-2014:23:31:45

For
insp
ectio
n pur
pose
s only
.
Conse
nt of
copy
right
owne
r req
uired
for a
ny ot
her u
se.
EPA Export 12-11-2014:23:31:45

For
insp
ectio
n pur
pose
s only
.
Conse
nt of
copy
right
owne
r req
uired
for a
ny ot
her u
se.
EPA Export 12-11-2014:23:31:45

For
insp
ectio
n pur
pose
s only
.
Conse
nt of
copy
right
owne
r req
uired
for a
ny ot
her u
se.
EPA Export 12-11-2014:23:31:45

For
insp
ectio
n pur
pose
s only
.
Conse
nt of
copy
right
owne
r req
uired
for a
ny ot
her u
se.
EPA Export 12-11-2014:23:31:45
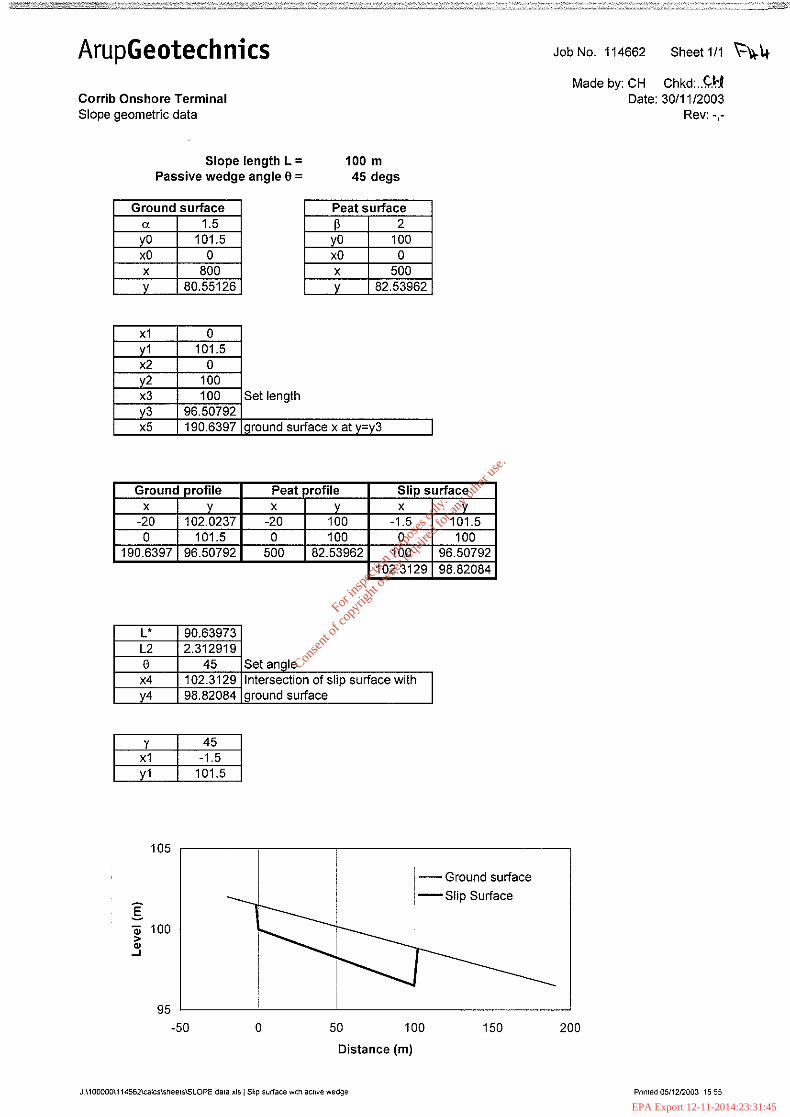
For
insp
ectio
n pur
pose
s only
.
Conse
nt of
copy
right
owne
r req
uired
for a
ny ot
her u
se.
EPA Export 12-11-2014:23:31:45

For
insp
ectio
n pur
pose
s only
.
Conse
nt of
copy
right
owne
r req
uired
for a
ny ot
her u
se.
EPA Export 12-11-2014:23:31:45

For
insp
ectio
n pur
pose
s only
.
Conse
nt of
copy
right
owne
r req
uired
for a
ny ot
her u
se.
EPA Export 12-11-2014:23:31:45

For
insp
ectio
n pur
pose
s only
.
Conse
nt of
copy
right
owne
r req
uired
for a
ny ot
her u
se.
EPA Export 12-11-2014:23:31:45

For
insp
ectio
n pur
pose
s only
.
Conse
nt of
copy
right
owne
r req
uired
for a
ny ot
her u
se.
EPA Export 12-11-2014:23:31:45
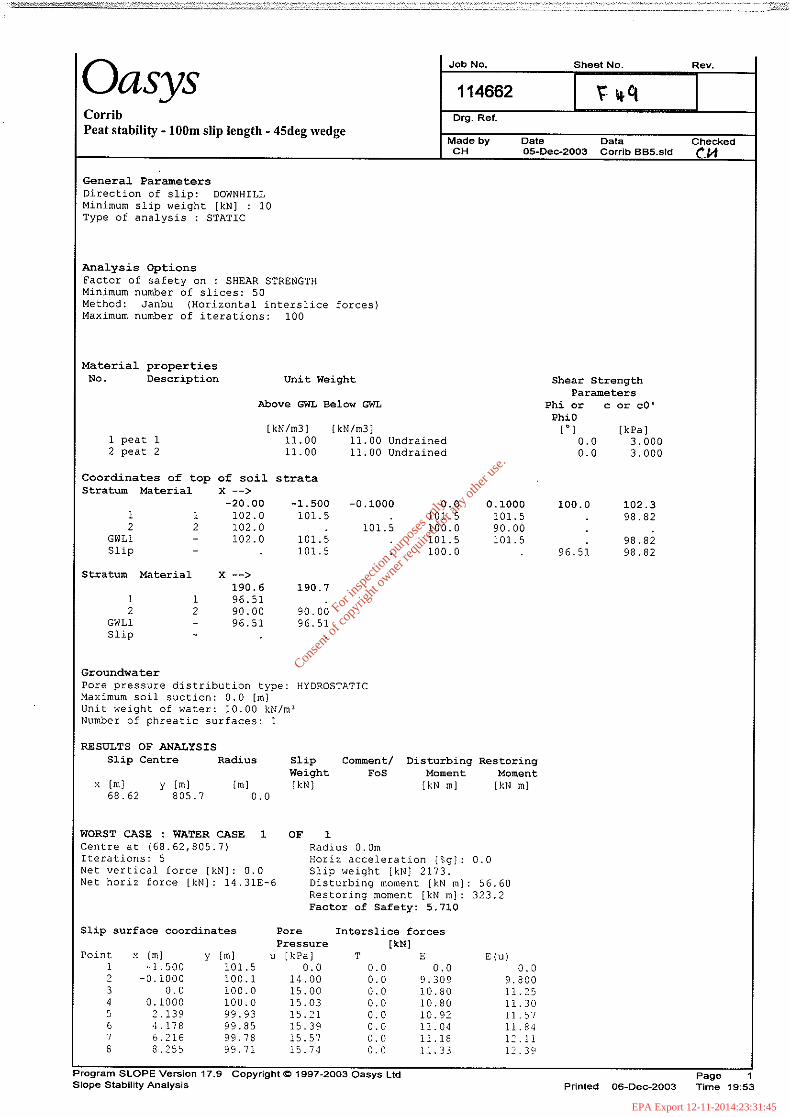
For
insp
ectio
n pur
pose
s only
.
Conse
nt of
copy
right
owne
r req
uired
for a
ny ot
her u
se.
EPA Export 12-11-2014:23:31:45
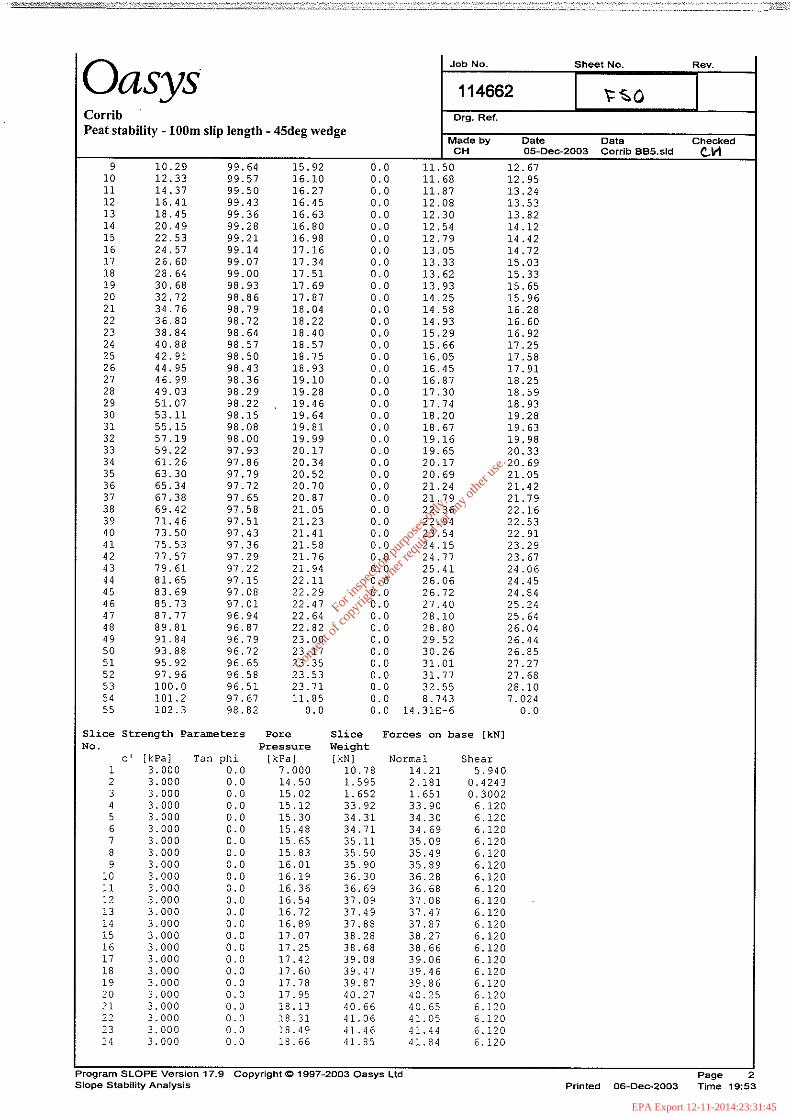
For
insp
ectio
n pur
pose
s only
.
Conse
nt of
copy
right
owne
r req
uired
for a
ny ot
her u
se.
EPA Export 12-11-2014:23:31:45

For
insp
ectio
n pur
pose
s only
.
Conse
nt of
copy
right
owne
r req
uired
for a
ny ot
her u
se.
EPA Export 12-11-2014:23:31:45
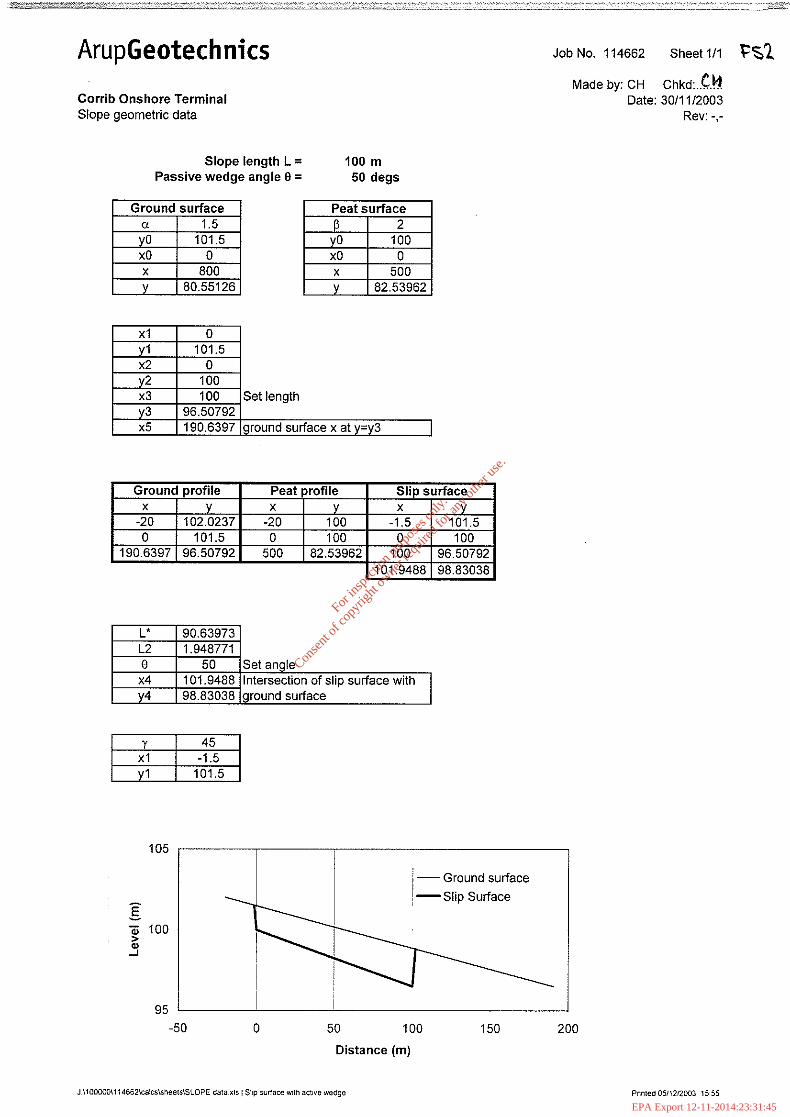
For
insp
ectio
n pur
pose
s only
.
Conse
nt of
copy
right
owne
r req
uired
for a
ny ot
her u
se.
EPA Export 12-11-2014:23:31:45
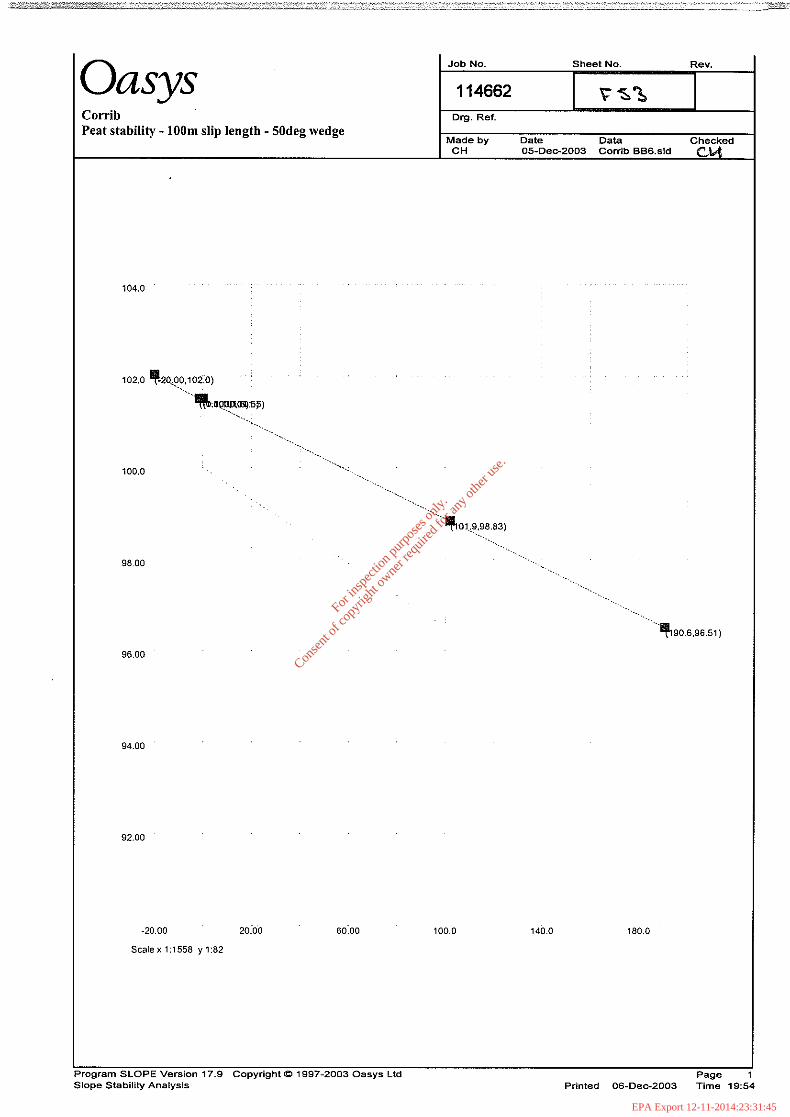
For
insp
ectio
n pur
pose
s only
.
Conse
nt of
copy
right
owne
r req
uired
for a
ny ot
her u
se.
EPA Export 12-11-2014:23:31:45

For
insp
ectio
n pur
pose
s only
.
Conse
nt of
copy
right
owne
r req
uired
for a
ny ot
her u
se.
EPA Export 12-11-2014:23:31:45
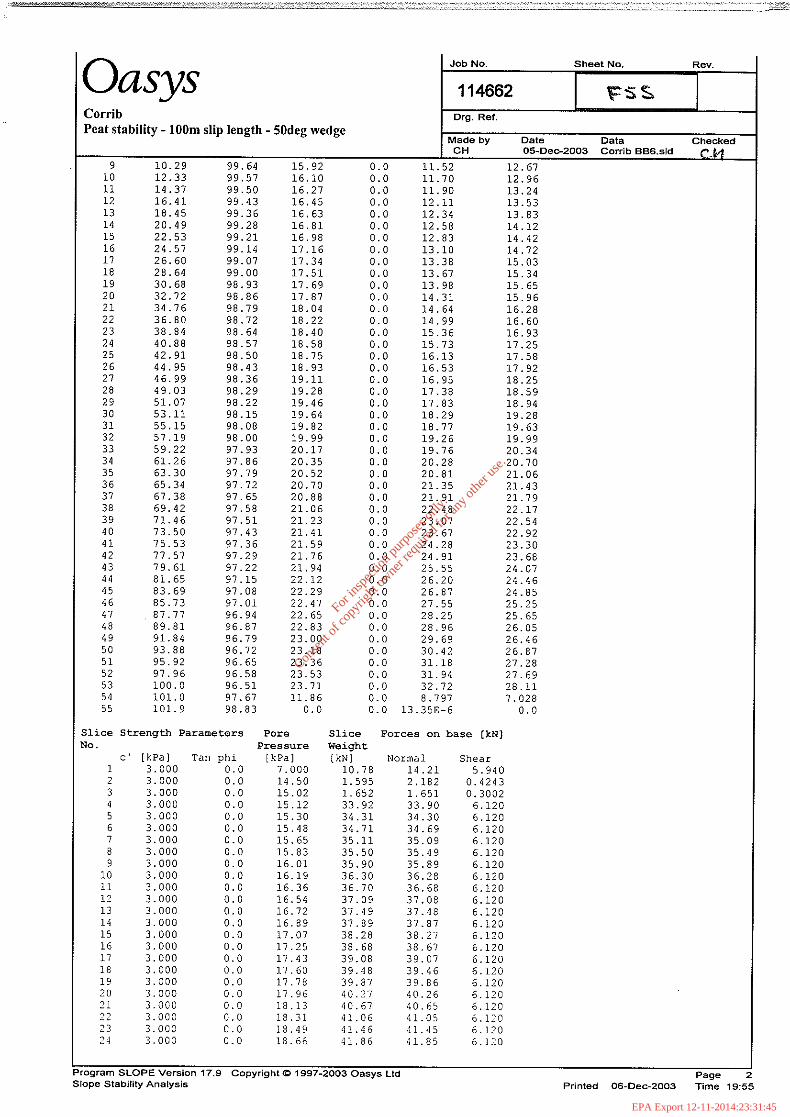
For
insp
ectio
n pur
pose
s only
.
Conse
nt of
copy
right
owne
r req
uired
for a
ny ot
her u
se.
EPA Export 12-11-2014:23:31:45
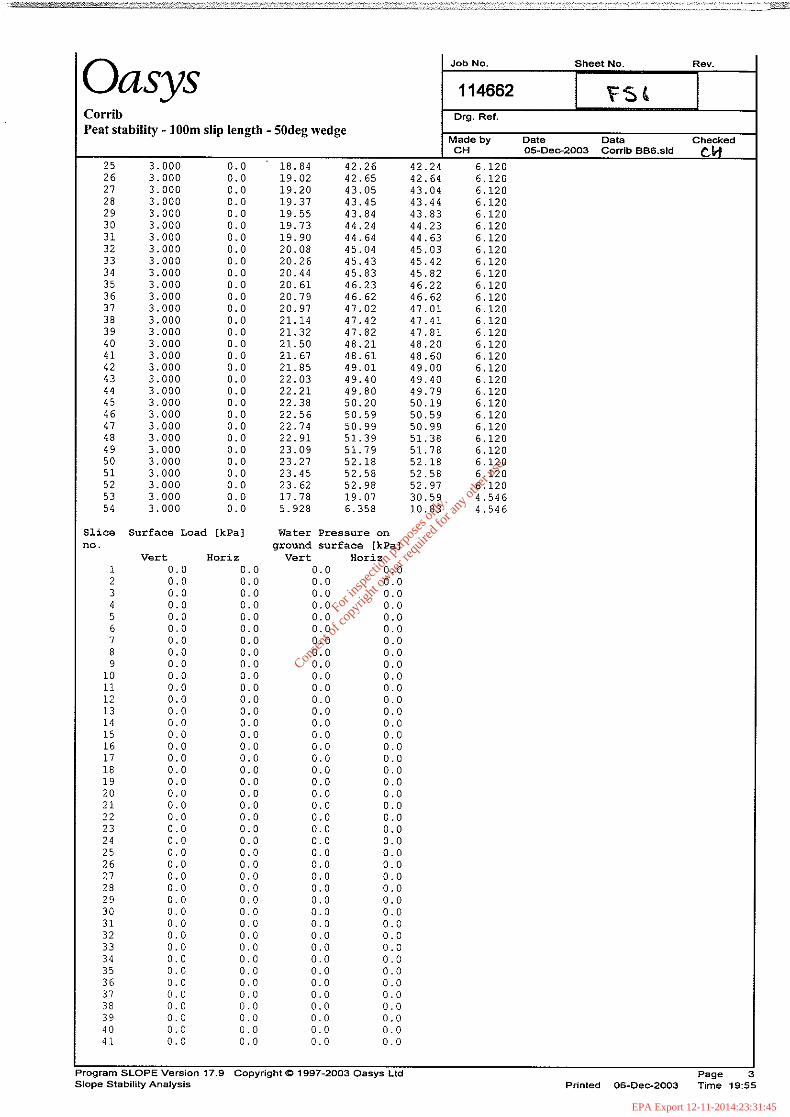
For
insp
ectio
n pur
pose
s only
.
Conse
nt of
copy
right
owne
r req
uired
for a
ny ot
her u
se.
EPA Export 12-11-2014:23:31:45
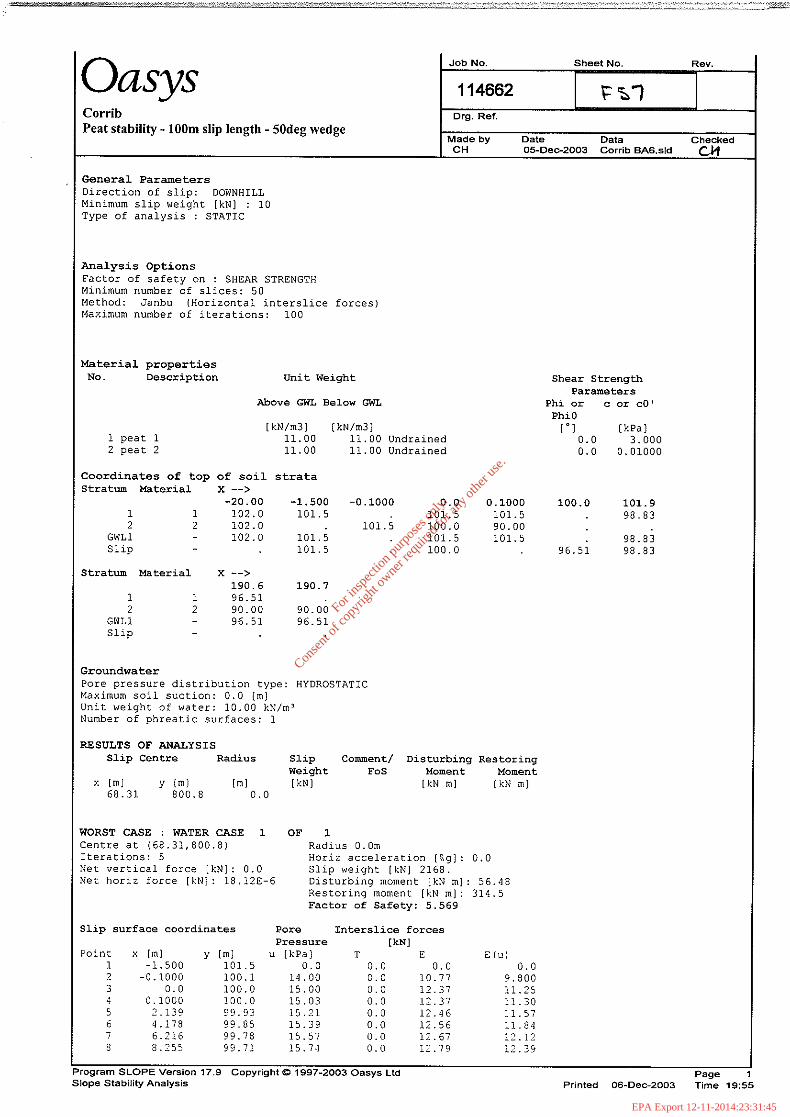
For
insp
ectio
n pur
pose
s only
.
Conse
nt of
copy
right
owne
r req
uired
for a
ny ot
her u
se.
EPA Export 12-11-2014:23:31:45
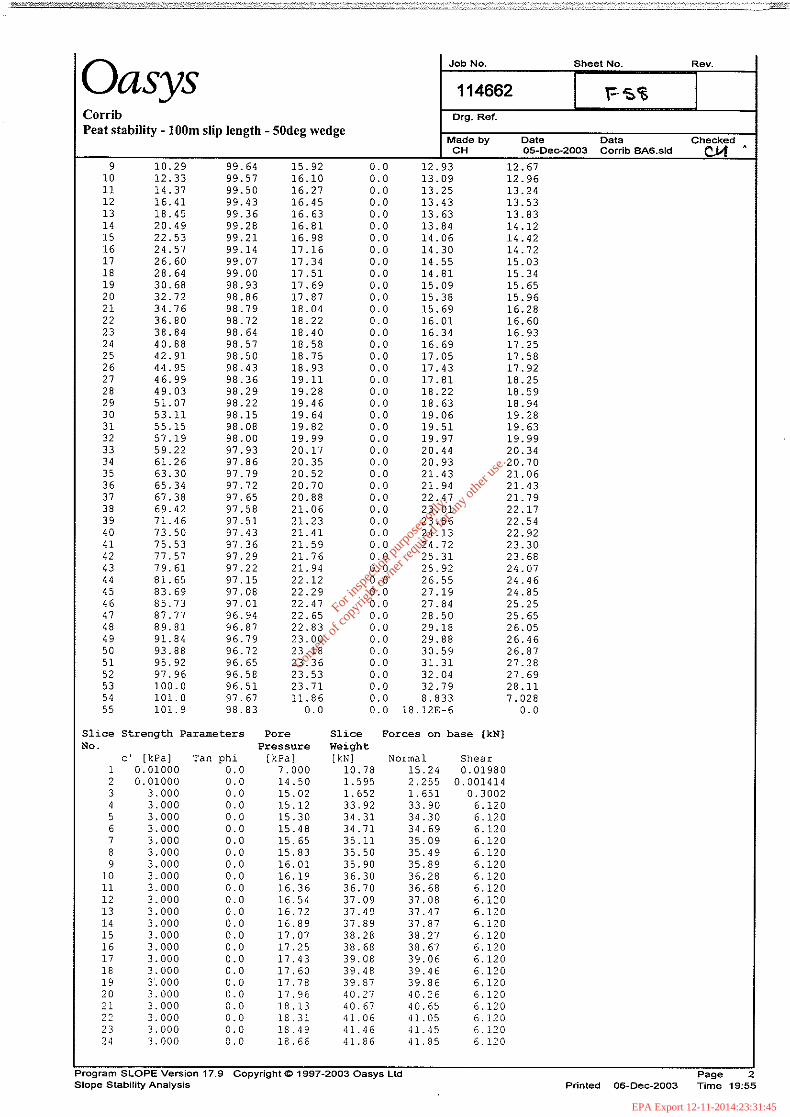
For
insp
ectio
n pur
pose
s only
.
Conse
nt of
copy
right
owne
r req
uired
for a
ny ot
her u
se.
EPA Export 12-11-2014:23:31:45

For
insp
ectio
n pur
pose
s only
.
Conse
nt of
copy
right
owne
r req
uired
for a
ny ot
her u
se.
EPA Export 12-11-2014:23:31:45

For
insp
ectio
n pur
pose
s only
.
Conse
nt of
copy
right
owne
r req
uired
for a
ny ot
her u
se.
EPA Export 12-11-2014:23:31:45

For
insp
ectio
n pur
pose
s only
.
Conse
nt of
copy
right
owne
r req
uired
for a
ny ot
her u
se.
EPA Export 12-11-2014:23:31:45
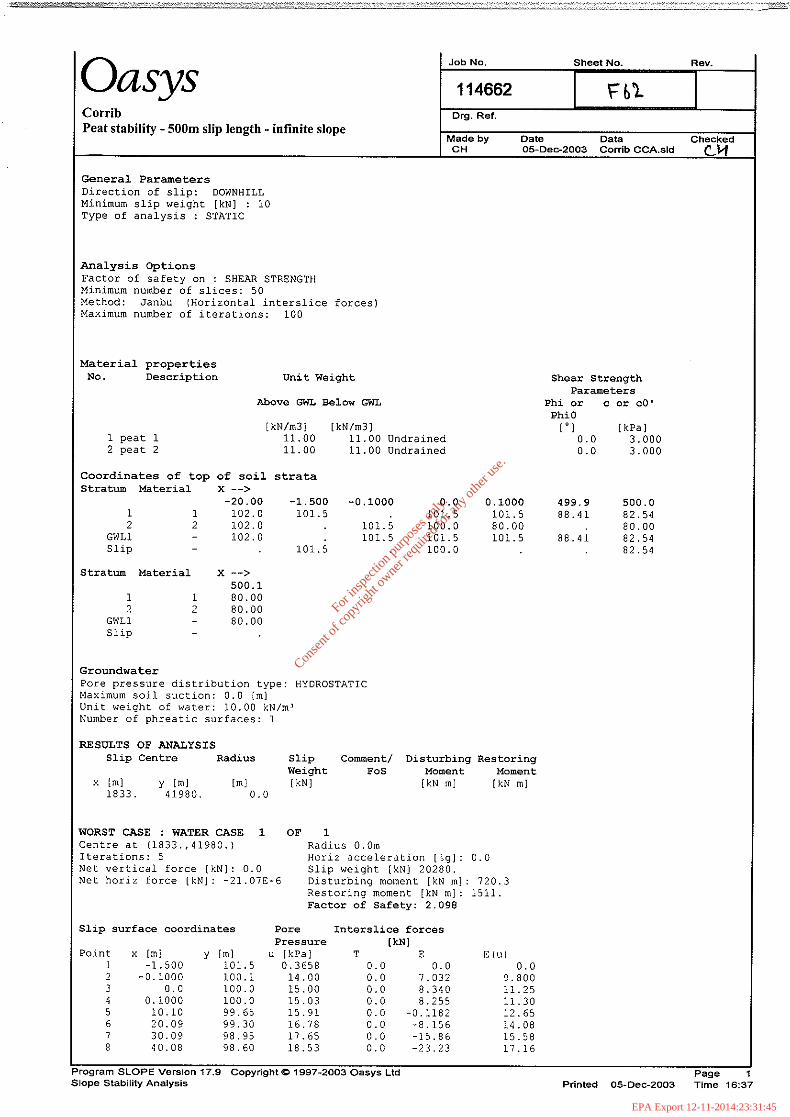
For
insp
ectio
n pur
pose
s only
.
Conse
nt of
copy
right
owne
r req
uired
for a
ny ot
her u
se.
EPA Export 12-11-2014:23:31:45

For
insp
ectio
n pur
pose
s only
.
Conse
nt of
copy
right
owne
r req
uired
for a
ny ot
her u
se.
EPA Export 12-11-2014:23:31:45
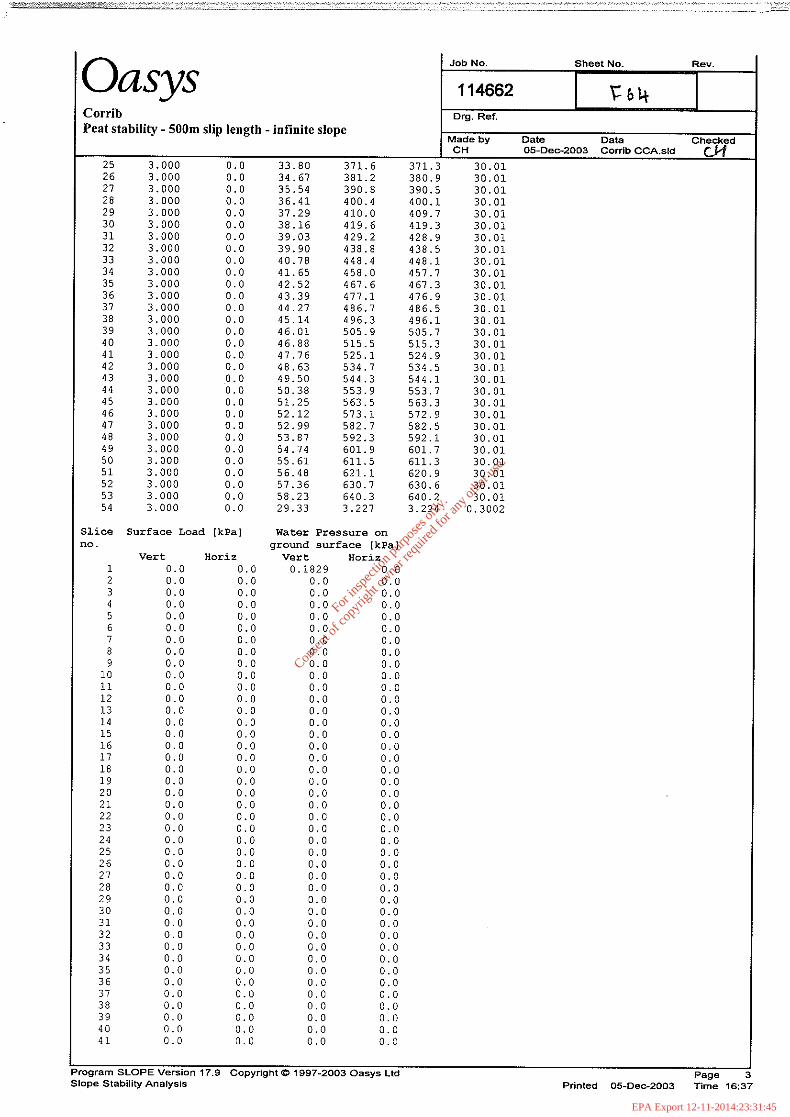
For
insp
ectio
n pur
pose
s only
.
Conse
nt of
copy
right
owne
r req
uired
for a
ny ot
her u
se.
EPA Export 12-11-2014:23:31:45

For
insp
ectio
n pur
pose
s only
.
Conse
nt of
copy
right
owne
r req
uired
for a
ny ot
her u
se.
EPA Export 12-11-2014:23:31:45

For
insp
ectio
n pur
pose
s only
.
Conse
nt of
copy
right
owne
r req
uired
for a
ny ot
her u
se.
EPA Export 12-11-2014:23:31:45

For
insp
ectio
n pur
pose
s only
.
Conse
nt of
copy
right
owne
r req
uired
for a
ny ot
her u
se.
EPA Export 12-11-2014:23:31:45

For
insp
ectio
n pur
pose
s only
.
Conse
nt of
copy
right
owne
r req
uired
for a
ny ot
her u
se.
EPA Export 12-11-2014:23:31:45

For
insp
ectio
n pur
pose
s only
.
Conse
nt of
copy
right
owne
r req
uired
for a
ny ot
her u
se.
EPA Export 12-11-2014:23:31:45

For
insp
ectio
n pur
pose
s only
.
Conse
nt of
copy
right
owne
r req
uired
for a
ny ot
her u
se.
EPA Export 12-11-2014:23:31:45

For
insp
ectio
n pur
pose
s only
.
Conse
nt of
copy
right
owne
r req
uired
for a
ny ot
her u
se.
EPA Export 12-11-2014:23:31:45
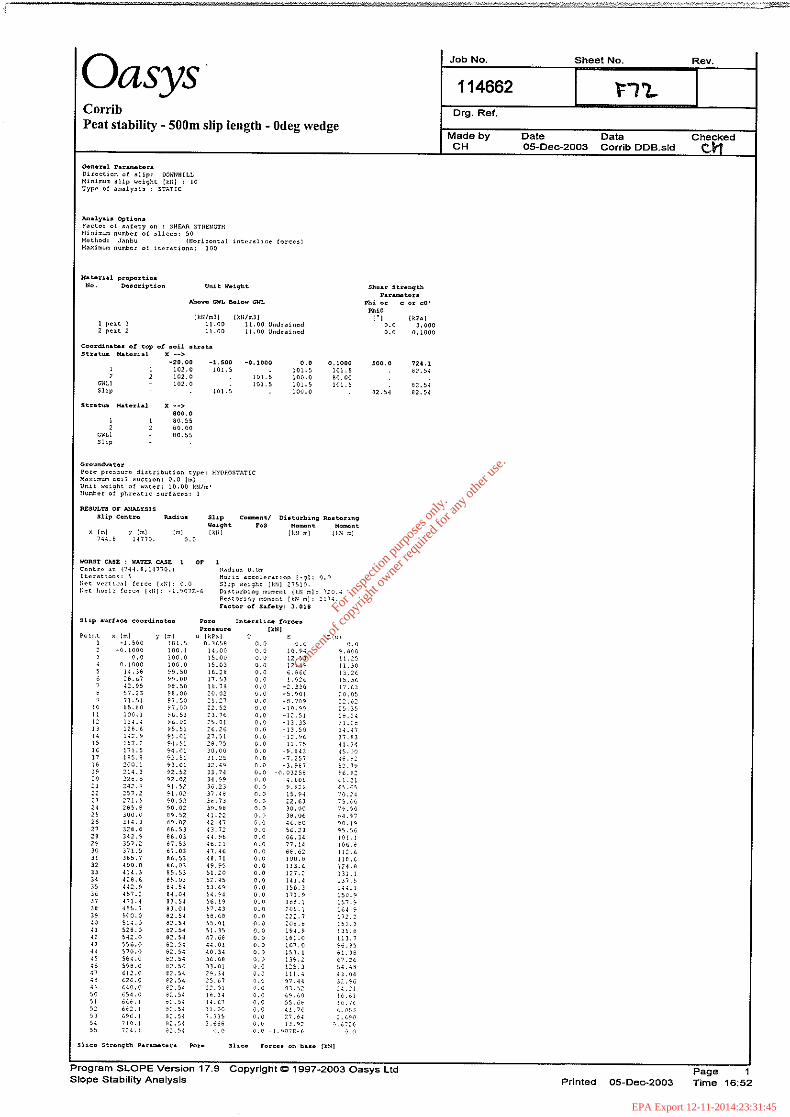
For
insp
ectio
n pur
pose
s only
.
Conse
nt of
copy
right
owne
r req
uired
for a
ny ot
her u
se.
EPA Export 12-11-2014:23:31:45

For
insp
ectio
n pur
pose
s only
.
Conse
nt of
copy
right
owne
r req
uired
for a
ny ot
her u
se.
EPA Export 12-11-2014:23:31:45

For
insp
ectio
n pur
pose
s only
.
Conse
nt of
copy
right
owne
r req
uired
for a
ny ot
her u
se.
EPA Export 12-11-2014:23:31:45
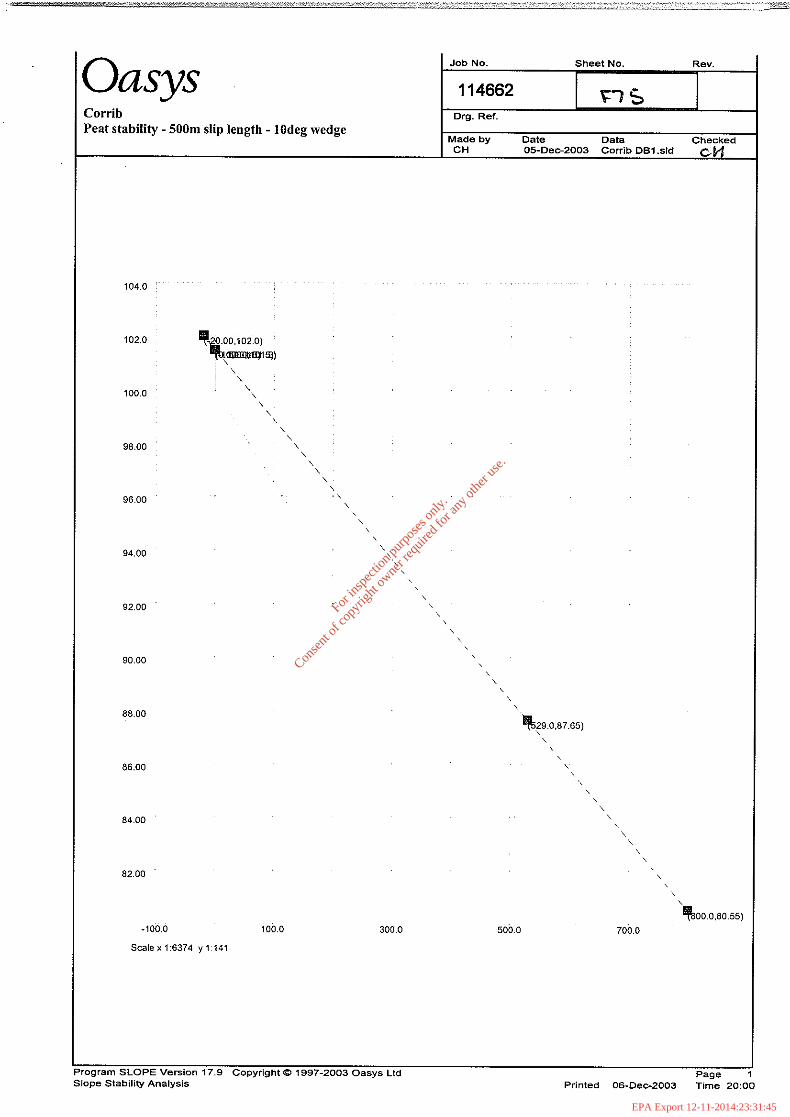
For
insp
ectio
n pur
pose
s only
.
Conse
nt of
copy
right
owne
r req
uired
for a
ny ot
her u
se.
EPA Export 12-11-2014:23:31:45
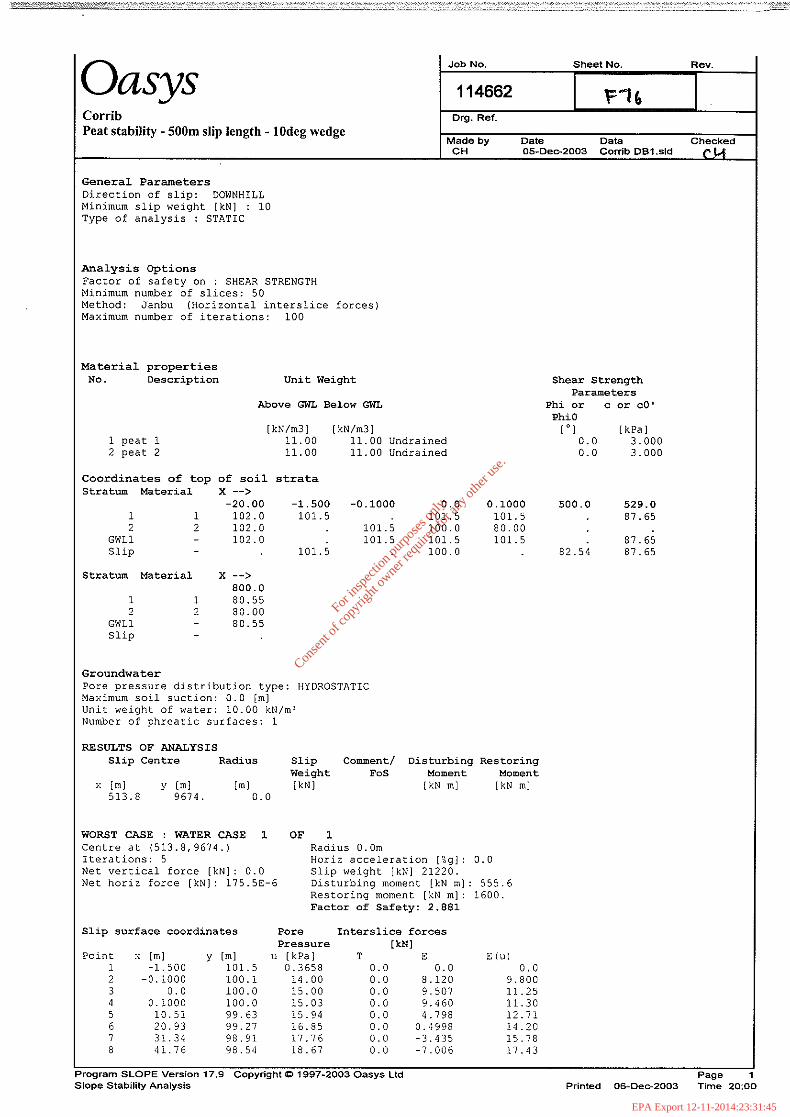
For
insp
ectio
n pur
pose
s only
.
Conse
nt of
copy
right
owne
r req
uired
for a
ny ot
her u
se.
EPA Export 12-11-2014:23:31:45

For
insp
ectio
n pur
pose
s only
.
Conse
nt of
copy
right
owne
r req
uired
for a
ny ot
her u
se.
EPA Export 12-11-2014:23:31:45

For
insp
ectio
n pur
pose
s only
.
Conse
nt of
copy
right
owne
r req
uired
for a
ny ot
her u
se.
EPA Export 12-11-2014:23:31:45

For
insp
ectio
n pur
pose
s only
.
Conse
nt of
copy
right
owne
r req
uired
for a
ny ot
her u
se.
EPA Export 12-11-2014:23:31:45

For
insp
ectio
n pur
pose
s only
.
Conse
nt of
copy
right
owne
r req
uired
for a
ny ot
her u
se.
EPA Export 12-11-2014:23:31:45
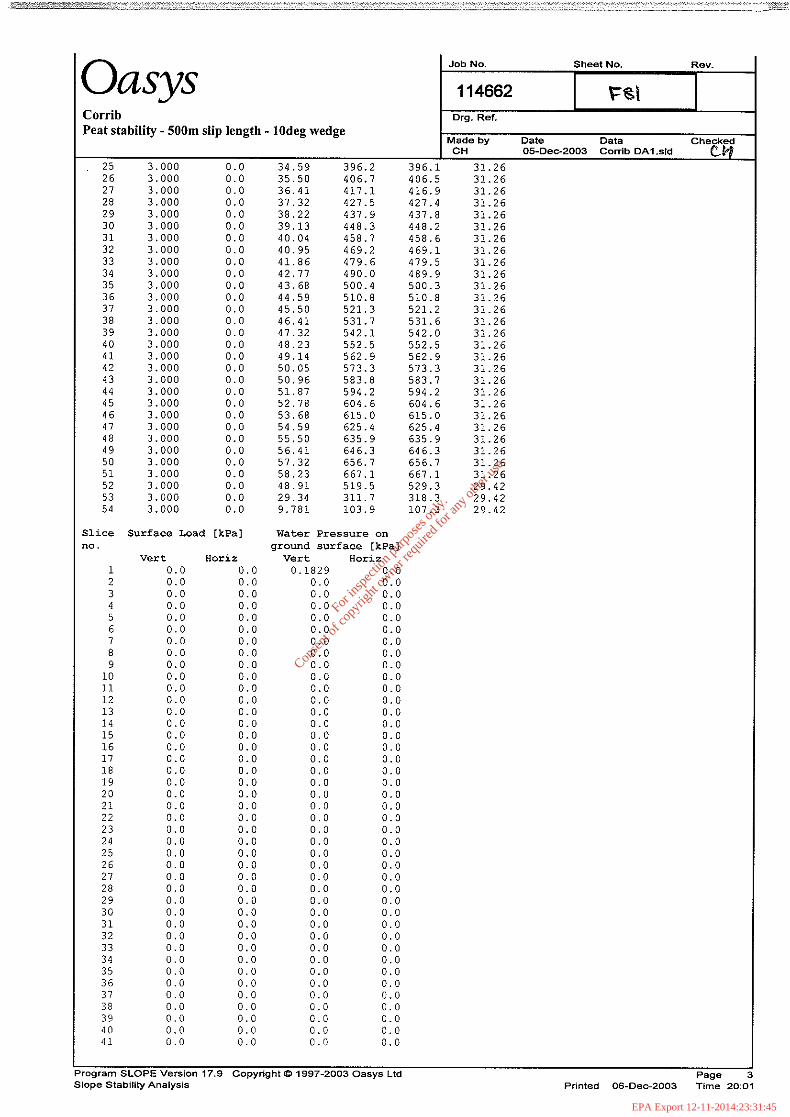
For
insp
ectio
n pur
pose
s only
.
Conse
nt of
copy
right
owne
r req
uired
for a
ny ot
her u
se.
EPA Export 12-11-2014:23:31:45

For
insp
ectio
n pur
pose
s only
.
Conse
nt of
copy
right
owne
r req
uired
for a
ny ot
her u
se.
EPA Export 12-11-2014:23:31:45

For
insp
ectio
n pur
pose
s only
.
Conse
nt of
copy
right
owne
r req
uired
for a
ny ot
her u
se.
EPA Export 12-11-2014:23:31:45

For
insp
ectio
n pur
pose
s only
.
Conse
nt of
copy
right
owne
r req
uired
for a
ny ot
her u
se.
EPA Export 12-11-2014:23:31:45

For
insp
ectio
n pur
pose
s only
.
Conse
nt of
copy
right
owne
r req
uired
for a
ny ot
her u
se.
EPA Export 12-11-2014:23:31:45
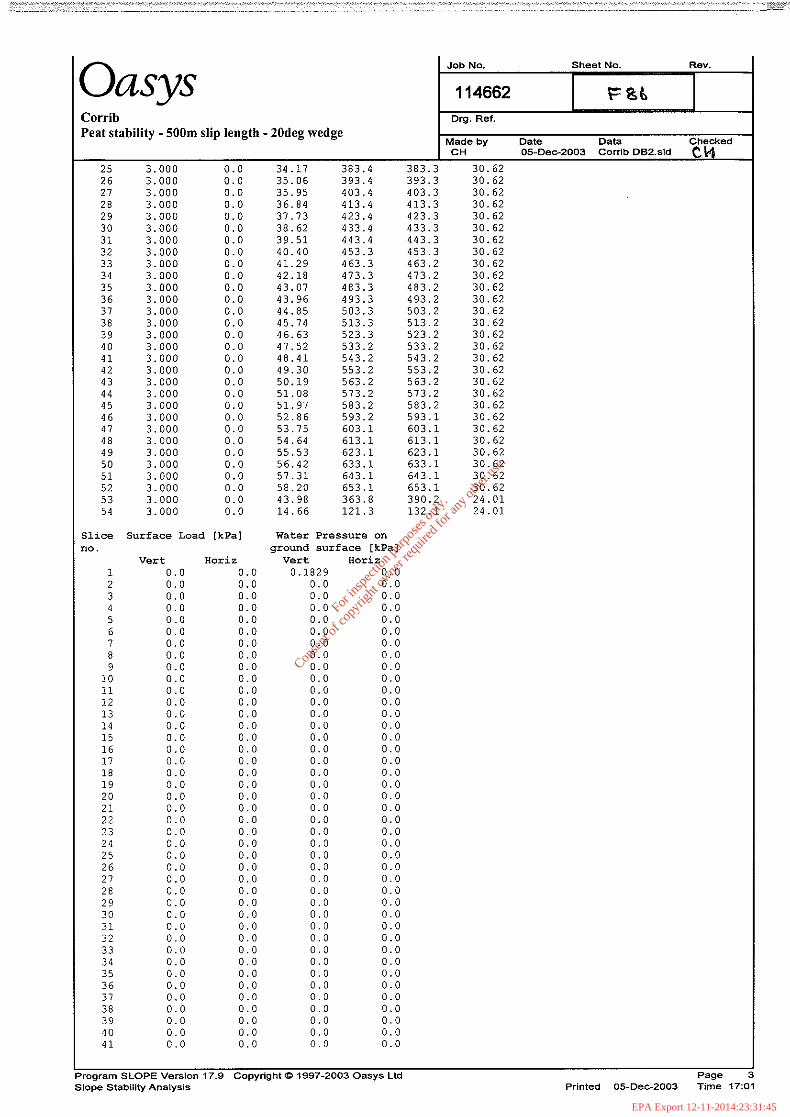
For
insp
ectio
n pur
pose
s only
.
Conse
nt of
copy
right
owne
r req
uired
for a
ny ot
her u
se.
EPA Export 12-11-2014:23:31:45
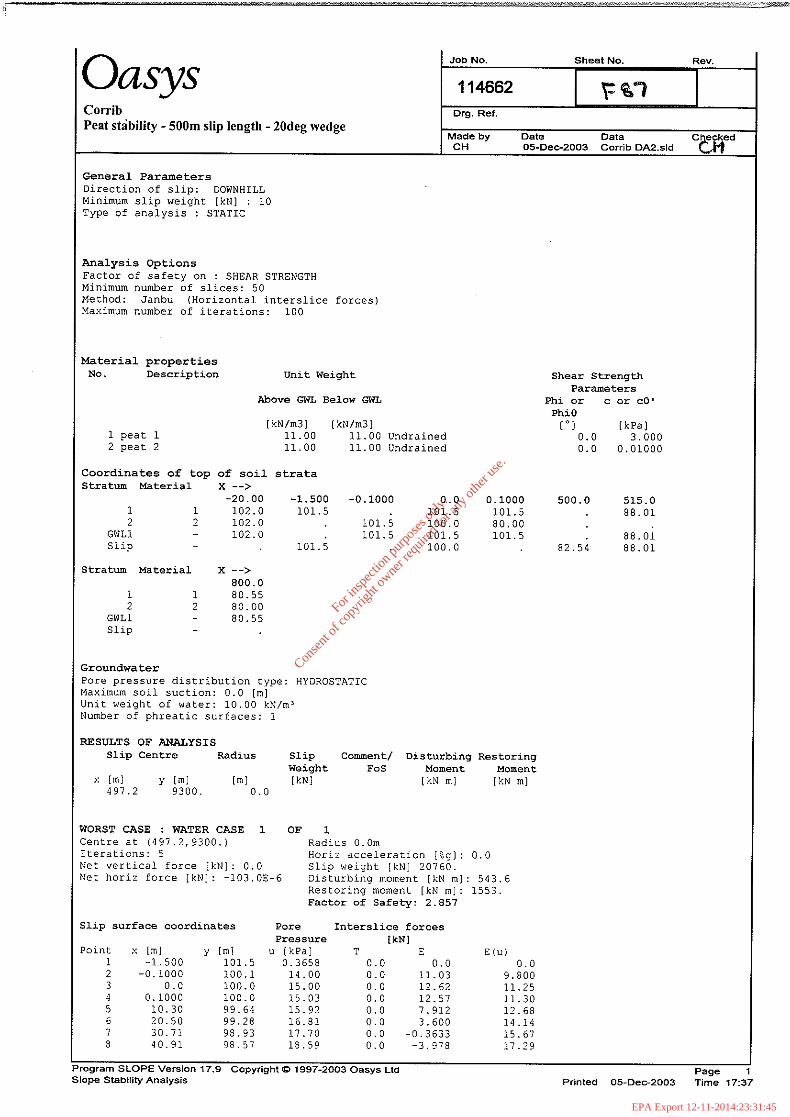
For
insp
ectio
n pur
pose
s only
.
Conse
nt of
copy
right
owne
r req
uired
for a
ny ot
her u
se.
EPA Export 12-11-2014:23:31:45

For
insp
ectio
n pur
pose
s only
.
Conse
nt of
copy
right
owne
r req
uired
for a
ny ot
her u
se.
EPA Export 12-11-2014:23:31:46

For
insp
ectio
n pur
pose
s only
.
Conse
nt of
copy
right
owne
r req
uired
for a
ny ot
her u
se.
EPA Export 12-11-2014:23:31:46

For
insp
ectio
n pur
pose
s only
.
Conse
nt of
copy
right
owne
r req
uired
for a
ny ot
her u
se.
EPA Export 12-11-2014:23:31:46

For
insp
ectio
n pur
pose
s only
.
Conse
nt of
copy
right
owne
r req
uired
for a
ny ot
her u
se.
EPA Export 12-11-2014:23:31:46
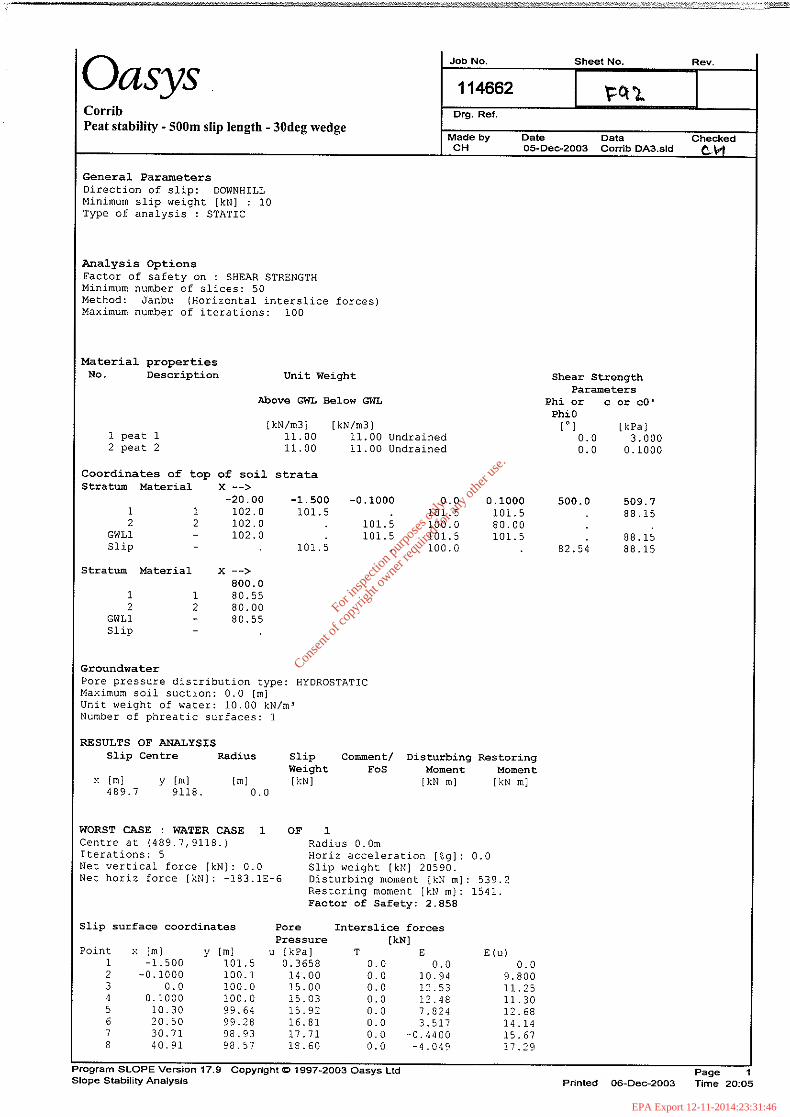
For
insp
ectio
n pur
pose
s only
.
Conse
nt of
copy
right
owne
r req
uired
for a
ny ot
her u
se.
EPA Export 12-11-2014:23:31:46
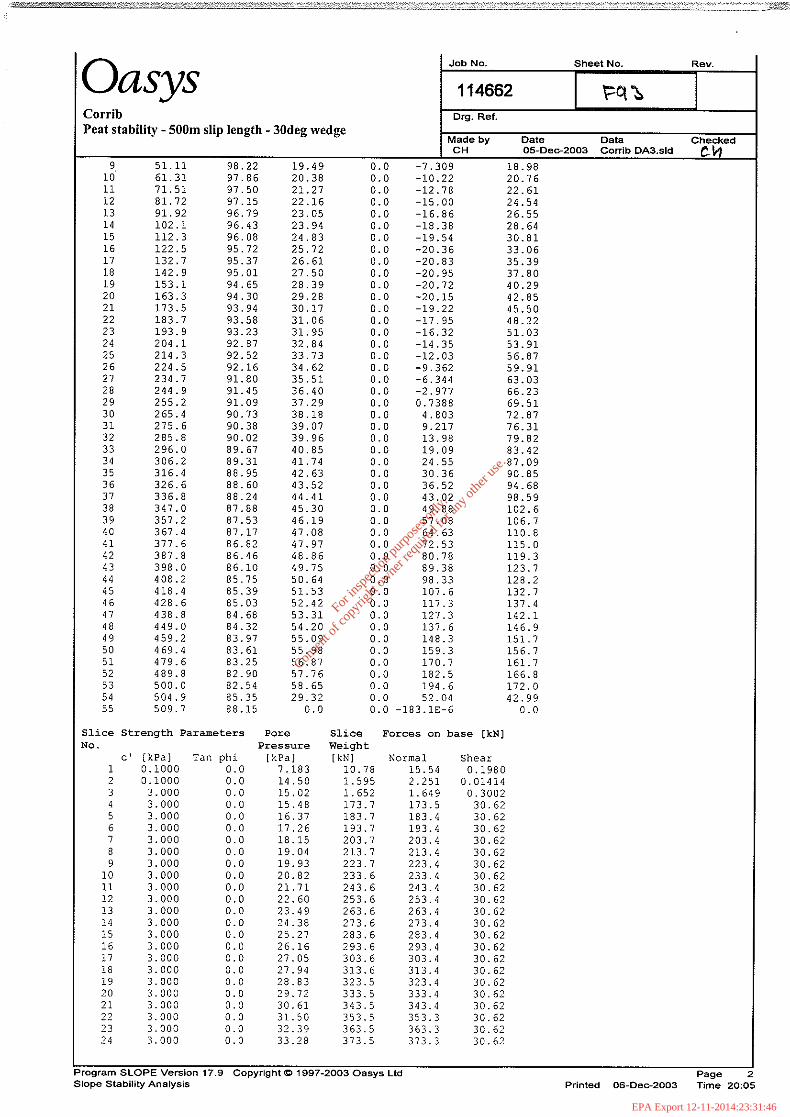
For
insp
ectio
n pur
pose
s only
.
Conse
nt of
copy
right
owne
r req
uired
for a
ny ot
her u
se.
EPA Export 12-11-2014:23:31:46

For
insp
ectio
n pur
pose
s only
.
Conse
nt of
copy
right
owne
r req
uired
for a
ny ot
her u
se.
EPA Export 12-11-2014:23:31:46
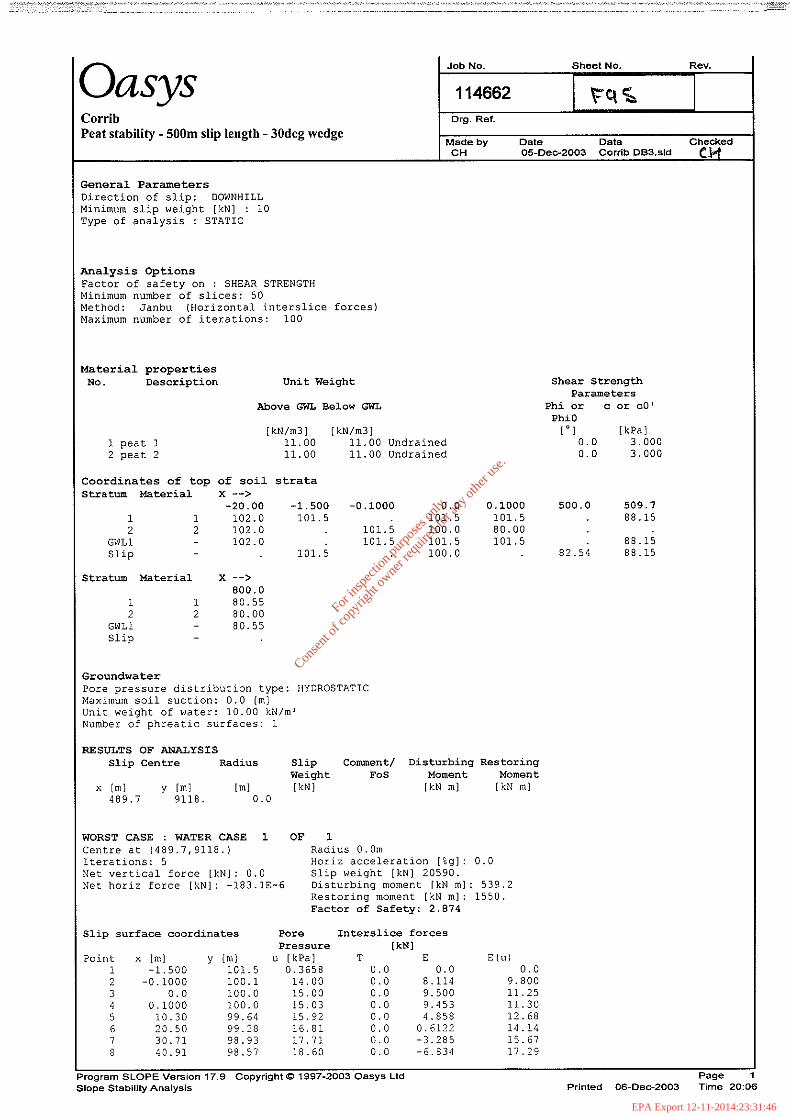
For
insp
ectio
n pur
pose
s only
.
Conse
nt of
copy
right
owne
r req
uired
for a
ny ot
her u
se.
EPA Export 12-11-2014:23:31:46

For
insp
ectio
n pur
pose
s only
.
Conse
nt of
copy
right
owne
r req
uired
for a
ny ot
her u
se.
EPA Export 12-11-2014:23:31:46

For
insp
ectio
n pur
pose
s only
.
Conse
nt of
copy
right
owne
r req
uired
for a
ny ot
her u
se.
EPA Export 12-11-2014:23:31:46
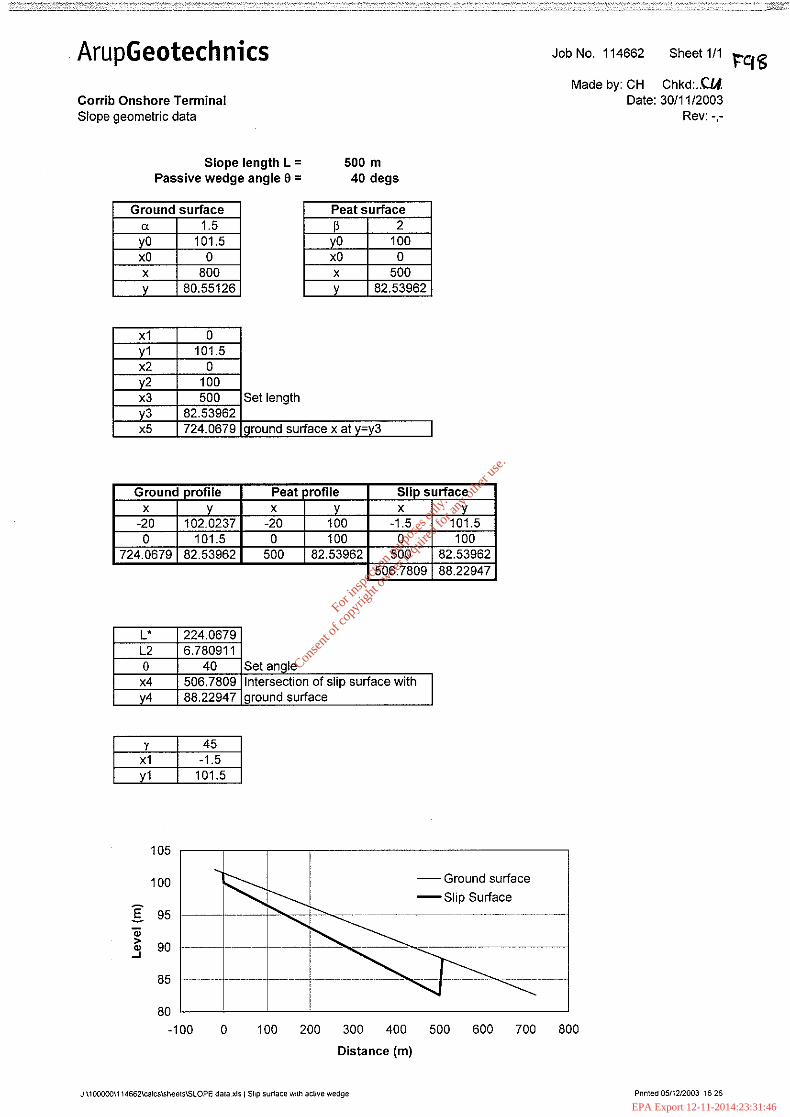
For
insp
ectio
n pur
pose
s only
.
Conse
nt of
copy
right
owne
r req
uired
for a
ny ot
her u
se.
EPA Export 12-11-2014:23:31:46

For
insp
ectio
n pur
pose
s only
.
Conse
nt of
copy
right
owne
r req
uired
for a
ny ot
her u
se.
EPA Export 12-11-2014:23:31:46
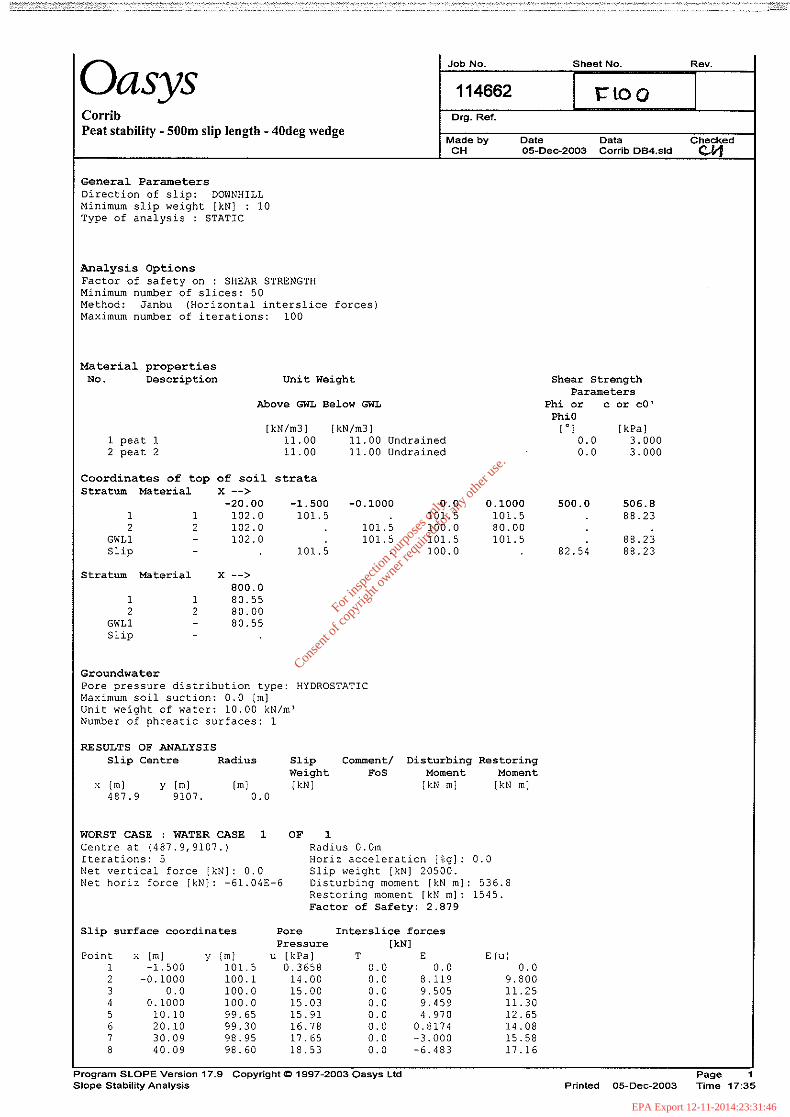
For
insp
ectio
n pur
pose
s only
.
Conse
nt of
copy
right
owne
r req
uired
for a
ny ot
her u
se.
EPA Export 12-11-2014:23:31:46

For
insp
ectio
n pur
pose
s only
.
Conse
nt of
copy
right
owne
r req
uired
for a
ny ot
her u
se.
EPA Export 12-11-2014:23:31:46

For
insp
ectio
n pur
pose
s only
.
Conse
nt of
copy
right
owne
r req
uired
for a
ny ot
her u
se.
EPA Export 12-11-2014:23:31:46

For
insp
ectio
n pur
pose
s only
.
Conse
nt of
copy
right
owne
r req
uired
for a
ny ot
her u
se.
EPA Export 12-11-2014:23:31:46

For
insp
ectio
n pur
pose
s only
.
Conse
nt of
copy
right
owne
r req
uired
for a
ny ot
her u
se.
EPA Export 12-11-2014:23:31:46

For
insp
ectio
n pur
pose
s only
.
Conse
nt of
copy
right
owne
r req
uired
for a
ny ot
her u
se.
EPA Export 12-11-2014:23:31:46

For
insp
ectio
n pur
pose
s only
.
Conse
nt of
copy
right
owne
r req
uired
for a
ny ot
her u
se.
EPA Export 12-11-2014:23:31:46

For
insp
ectio
n pur
pose
s only
.
Conse
nt of
copy
right
owne
r req
uired
for a
ny ot
her u
se.
EPA Export 12-11-2014:23:31:46
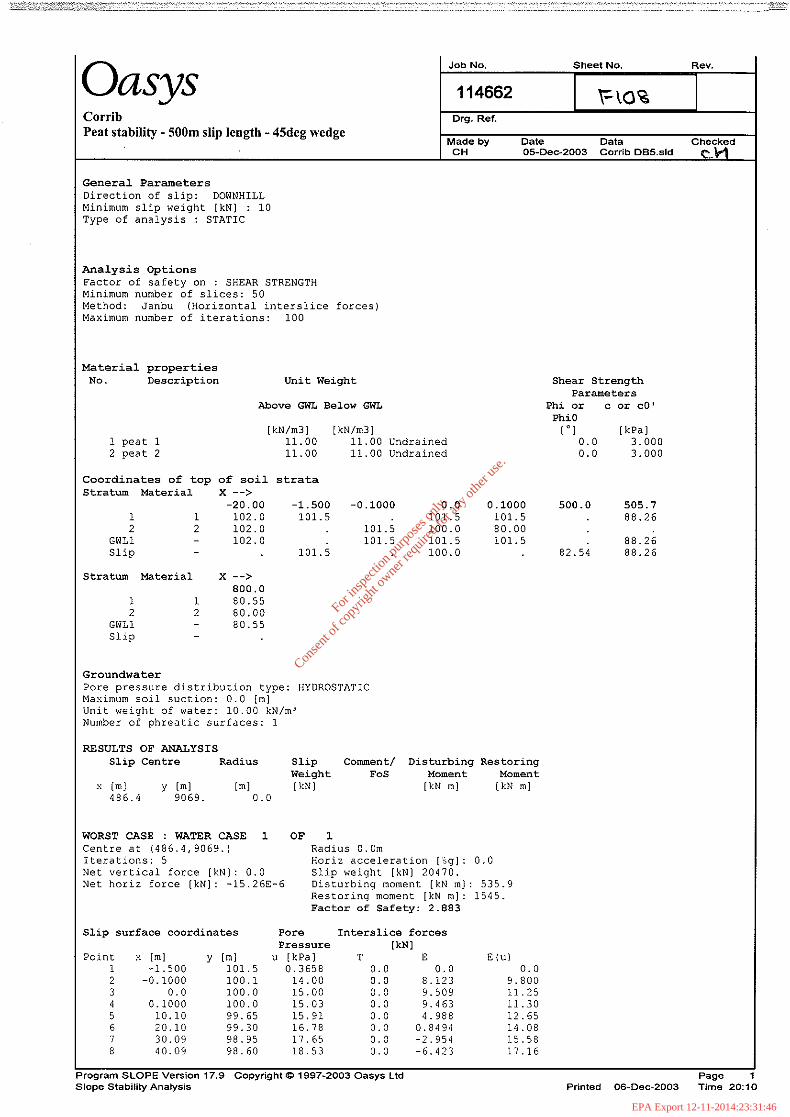
For
insp
ectio
n pur
pose
s only
.
Conse
nt of
copy
right
owne
r req
uired
for a
ny ot
her u
se.
EPA Export 12-11-2014:23:31:46
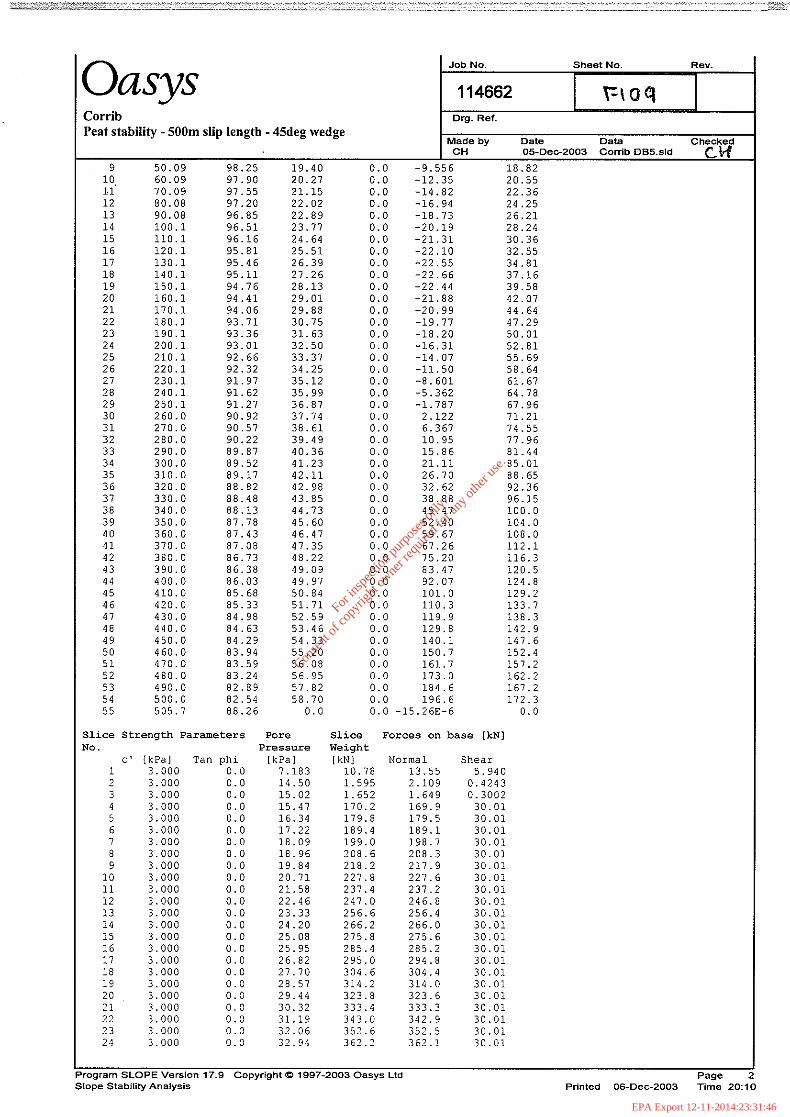
For
insp
ectio
n pur
pose
s only
.
Conse
nt of
copy
right
owne
r req
uired
for a
ny ot
her u
se.
EPA Export 12-11-2014:23:31:46
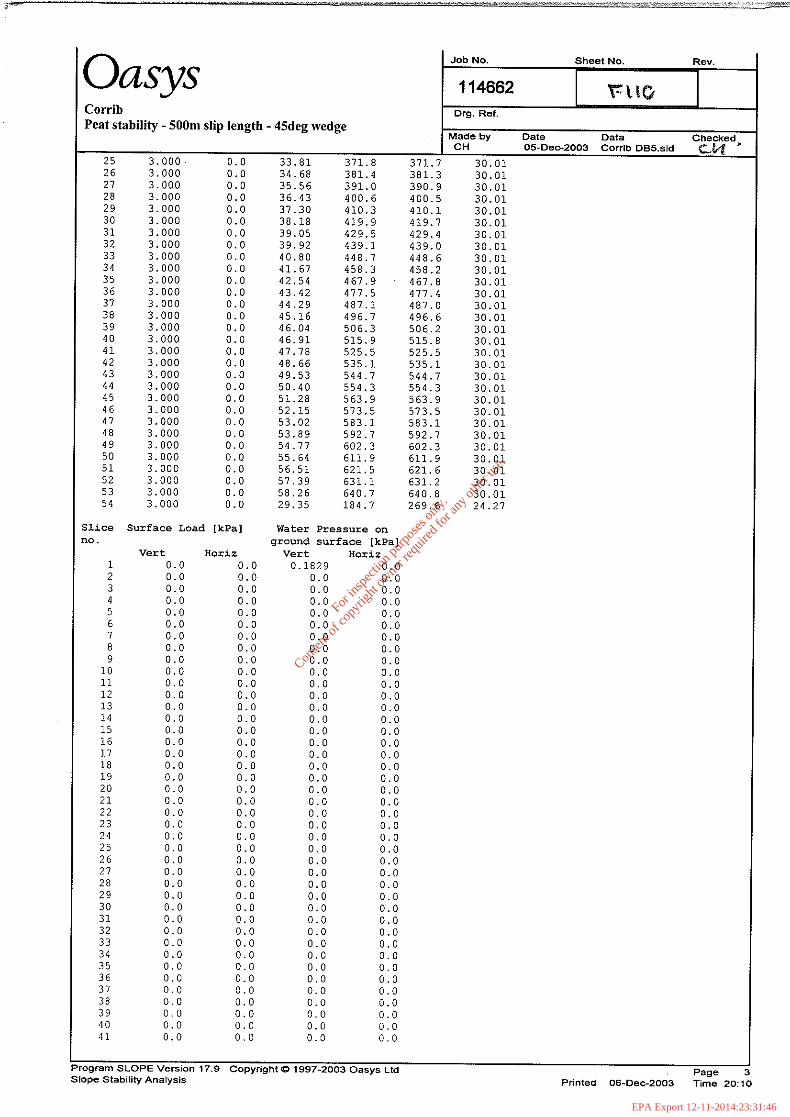
For
insp
ectio
n pur
pose
s only
.
Conse
nt of
copy
right
owne
r req
uired
for a
ny ot
her u
se.
EPA Export 12-11-2014:23:31:46

For
insp
ectio
n pur
pose
s only
.
Conse
nt of
copy
right
owne
r req
uired
for a
ny ot
her u
se.
EPA Export 12-11-2014:23:31:46

For
insp
ectio
n pur
pose
s only
.
Conse
nt of
copy
right
owne
r req
uired
for a
ny ot
her u
se.
EPA Export 12-11-2014:23:31:46

For
insp
ectio
n pur
pose
s only
.
Conse
nt of
copy
right
owne
r req
uired
for a
ny ot
her u
se.
EPA Export 12-11-2014:23:31:46

For
insp
ectio
n pur
pose
s only
.
Conse
nt of
copy
right
owne
r req
uired
for a
ny ot
her u
se.
EPA Export 12-11-2014:23:31:46

For
insp
ectio
n pur
pose
s only
.
Conse
nt of
copy
right
owne
r req
uired
for a
ny ot
her u
se.
EPA Export 12-11-2014:23:31:46

For
insp
ectio
n pur
pose
s only
.
Conse
nt of
copy
right
owne
r req
uired
for a
ny ot
her u
se.
EPA Export 12-11-2014:23:31:46

For
insp
ectio
n pur
pose
s only
.
Conse
nt of
copy
right
owne
r req
uired
for a
ny ot
her u
se.
EPA Export 12-11-2014:23:31:46

For
insp
ectio
n pur
pose
s only
.
Conse
nt of
copy
right
owne
r req
uired
for a
ny ot
her u
se.
EPA Export 12-11-2014:23:31:46

For
insp
ectio
n pur
pose
s only
.
Conse
nt of
copy
right
owne
r req
uired
for a
ny ot
her u
se.
EPA Export 12-11-2014:23:31:46

For
insp
ectio
n pur
pose
s only
.
Conse
nt of
copy
right
owne
r req
uired
for a
ny ot
her u
se.
EPA Export 12-11-2014:23:31:46
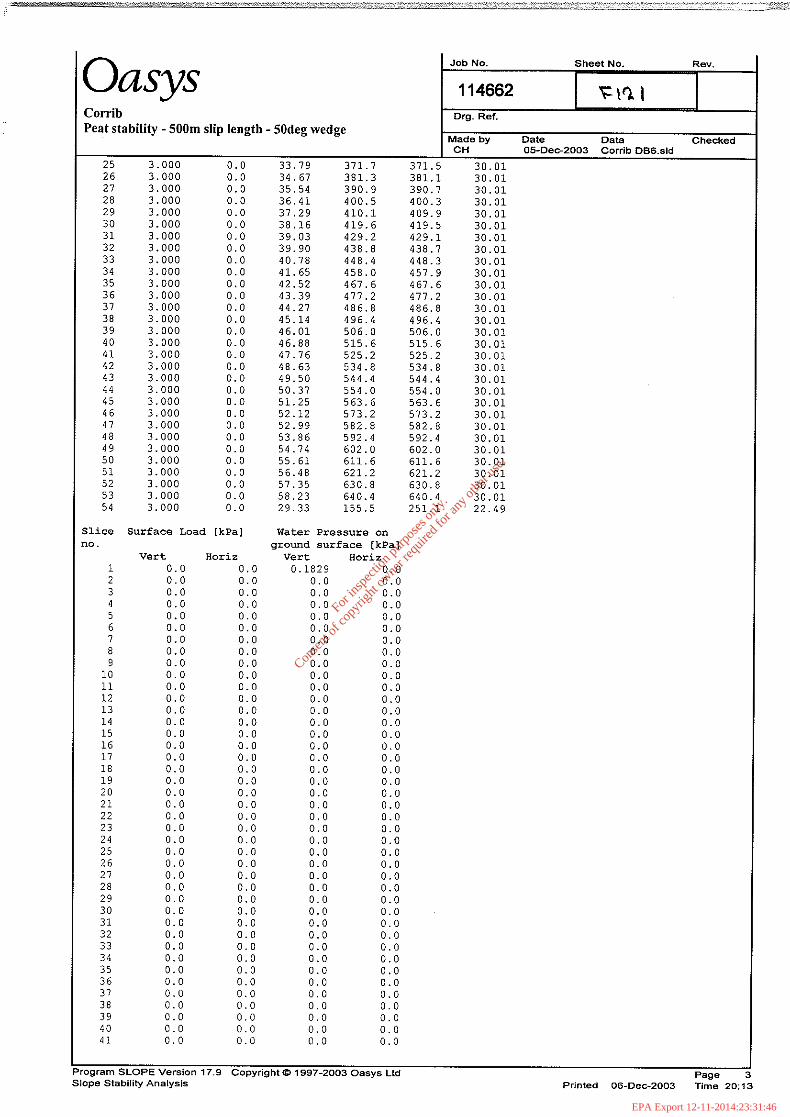
For
insp
ectio
n pur
pose
s only
.
Conse
nt of
copy
right
owne
r req
uired
for a
ny ot
her u
se.
EPA Export 12-11-2014:23:31:46

APPENDIX G Stability Calculations for Existing Slopes
For
insp
ectio
n pur
pose
s only
.
Conse
nt of
copy
right
owne
r req
uired
for a
ny ot
her u
se.
EPA Export 12-11-2014:23:31:46

For
insp
ectio
n pur
pose
s only
.
Conse
nt of
copy
right
owne
r req
uired
for a
ny ot
her u
se.
EPA Export 12-11-2014:23:31:46

For
insp
ectio
n pur
pose
s only
.
Conse
nt of
copy
right
owne
r req
uired
for a
ny ot
her u
se.
EPA Export 12-11-2014:23:31:46

For
insp
ectio
n pur
pose
s only
.
Conse
nt of
copy
right
owne
r req
uired
for a
ny ot
her u
se.
EPA Export 12-11-2014:23:31:46

For
insp
ectio
n pur
pose
s only
.
Conse
nt of
copy
right
owne
r req
uired
for a
ny ot
her u
se.
EPA Export 12-11-2014:23:31:46

For
insp
ectio
n pur
pose
s only
.
Conse
nt of
copy
right
owne
r req
uired
for a
ny ot
her u
se.
EPA Export 12-11-2014:23:31:46

For
insp
ectio
n pur
pose
s only
.
Conse
nt of
copy
right
owne
r req
uired
for a
ny ot
her u
se.
EPA Export 12-11-2014:23:31:46

For
insp
ectio
n pur
pose
s only
.
Conse
nt of
copy
right
owne
r req
uired
for a
ny ot
her u
se.
EPA Export 12-11-2014:23:31:46

APPENDIX H Stability Calculations for Slopes below Sheet Pile Walls
For
insp
ectio
n pur
pose
s only
.
Conse
nt of
copy
right
owne
r req
uired
for a
ny ot
her u
se.
EPA Export 12-11-2014:23:31:46

For
insp
ectio
n pur
pose
s only
.
Conse
nt of
copy
right
owne
r req
uired
for a
ny ot
her u
se.
EPA Export 12-11-2014:23:31:46

For
insp
ectio
n pur
pose
s only
.
Conse
nt of
copy
right
owne
r req
uired
for a
ny ot
her u
se.
EPA Export 12-11-2014:23:31:46

For
insp
ectio
n pur
pose
s only
.
Conse
nt of
copy
right
owne
r req
uired
for a
ny ot
her u
se.
EPA Export 12-11-2014:23:31:46

For
insp
ectio
n pur
pose
s only
.
Conse
nt of
copy
right
owne
r req
uired
for a
ny ot
her u
se.
EPA Export 12-11-2014:23:31:46