Embed Size (px)
Citation preview

Needs For and Alternatives To Chapter 5 –The Manitoba Hydro System, Interconnections and Export Markets
August 2013 Chapter 5 Page i
Table of Contents
5 The Manitoba Hydro System, Interconnections and Export Markets .................................... 1
5.0 Chapter Overview ........................................................................................................... 1
5.1 Manitoba Hydro’s Supply Resources .............................................................................. 1
5.1.1 Hydro Generation ....................................................................................................... 4
5.1.2 Thermal Generation .................................................................................................... 5
5.1.3 Wind Generation ......................................................................................................... 6
5.1.4 Imports ........................................................................................................................ 6
5.2 Manitoba Hydro’s Transmission System and Interconnections ..................................... 7
5.2.1 Transmission System Overview .................................................................................. 7
5.2.2 Manitoba Hydro’s Transmission Interconnections Overview .................................. 10
5.2.2.1 Transmission Interconnections with Saskatchewan ....................................... 12
5.2.2.2 Transmission Interconnections with Ontario .................................................. 13
5.2.2.3 Transmission Interconnections with the U.S. .................................................. 13
5.2.2.4 Current Interconnection Transfer Capability .................................................. 16
5.2.3 Reliability Benefits of Interconnections .................................................................... 17
5.2.4 Economic Benefits of Interconnections .................................................................... 19
5.2.5 Drivers of Development of Transmission Interconnections ..................................... 21
5.2.6 Committed Major Transmission Development at Manitoba Hydro ......................... 23
5.2.6.1 Riel Station Reliability Project ......................................................................... 24
5.2.6.2 Bipole III Reliability Project .............................................................................. 25
5.3 Properties of Manitoba Hydro’s Generating System .................................................... 28
5.3.1 Surplus Energy by Design .......................................................................................... 31

Needs For and Alternatives To Chapter 5 –The Manitoba Hydro System, Interconnections and Export Markets
August 2013 Chapter 5 Page ii
5.3.2 Resource Diversity .................................................................................................... 32
5.4 Interconnected Power Markets .................................................................................... 34
5.4.1 Electricity Market Structure ...................................................................................... 34
5.4.2 Midwest Power Markets ........................................................................................... 37
5.4.2.1 MISO Organizational Overview ....................................................................... 38
5.4.2.2 MISO Market Overview ................................................................................... 39
5.4.2.3 Manitoba Hydro’s Relationship with MISO as a Coordinating Member ......... 41
5.4.2.4 MISO Market.................................................................................................... 42
5.4.2.5 Long-Term Resource-Planning Decisions vs. Energy Market Prices ................ 47
5.4.3 Canadian Export Markets.......................................................................................... 49
5.4.3.1 Ontario Market ................................................................................................ 49
5.4.3.2 Saskatchewan Bilateral Market ....................................................................... 51
5.4.3.3 Alberta Market ................................................................................................ 52
5.5 Renewable Energy Credits ............................................................................................ 53
5.6 MISO Market Outlook ................................................................................................... 55
5.6.1 Need for New Generation Capacity .......................................................................... 55
5.6.1.1 MISO’s Independent Analysis .......................................................................... 55
5.6.1.2 Gradual Demand Growth ................................................................................ 56
5.6.1.3 Pending Generation Retirements .................................................................... 57
5.6.2 Long-Term Nuclear Uncertainty ............................................................................... 60

Needs For and Alternatives To Chapter 5 –The Manitoba Hydro System, Interconnections and Export Markets
August 2013 Chapter 5 Page 1 of 61
5 The Manitoba Hydro System, Interconnections and Export Markets 1
2
5.0 Chapter Overview 3
Chapter 5 – The Manitoba Hydro System, Interconnections and Export Markets begins with a 4
more detailed overview of Manitoba Hydro’s existing supply resources, building on the 5
resource descriptions previously outlined in Chapter 4 – The Need for New Resources. A 6
description of the existing transmission system including interconnections is provided, including 7
an explanation of the significant reliability and economic benefits of transmission 8
interconnections. The unique properties of Manitoba Hydro’s predominantly hydro system are 9
also outlined, including the nature of typically having surplus energy available to sell into 10
adjacent markets. The structure of interconnected markets is described, with particular 11
emphasis on Manitoba Hydro’s primary export market— Midcontinent Independent System 12
Operator, Inc. (MISO). A high-level longer-term outlook of the MISO market is provided, 13
describing some factors which are expected to put upward pressure on MISO capacity and 14
energy market prices over the long-term. 15
16
5.1 Manitoba Hydro’s Supply Resources 17
Manitoba Hydro’s existing supply resources can be divided into four resource types: hydro-18
electric generation, thermal generation, wind generation and imports. Table 5.1 provides a 19
summary of the available energy and capacity from existing system supply resources. Winter 20
peak capacity is the maximum rate of power output, measured in megawatts (MW) that the 21
generator can be relied upon to produce at the time Manitoba load is at its winter maximum. 22
Energy produced is the expected energy generated measured in gigawatt hours (GWh; 1 GWh = 23
1,000 MWh = 1,000,000 kWh). Energy generated by the resources on Manitoba Hydro’s system 24
will depend on water conditions. Table 5.1 provides the energy produced for three flow 25
conditions: 26

Needs For and Alternatives To Chapter 5 –The Manitoba Hydro System, Interconnections and Export Markets
August 2013 Chapter 5 Page 2 of 61
dependable energy is that energy expected to be produced by each resource under the 1
lowest water flow conditions on hydraulic record (e.g. severe drought) – also referred to 2
as dependable generation 3
average energy is the average of energy produced across the range of historic water 4
flow conditions 5
maximum energy is energy produced as a result of flood-like conditions across the 6
system. 7

Needs For and Alternatives To Chapter 5 –The Manitoba Hydro System, Interconnections and Export Markets
August 2013 Chapter 5 Page 3 of 61
Table 5.1 EXISTING SYSTEM RESOURCES 1 1
Facility Winter Peak
Capacity (MW)
Energy Produced Under Flow Condition (GWh)
Dependable Average Maximum
Manitoba Hydro Operated Resources
Pointe du Bois 64 320 550 582
Slave Falls 61 260 520 575
Seven Sisters 156 625 1,015 1,215
McArthur 57 230 390 470
Great Falls 127 545 915 1,010
Pine Falls 88 345 640 720
Grand Rapids 480 1,320 1,555 1,790
Jenpeg 135 695 925 1,150
Kelsey 285 1,760 2,180 2,120
Kettle 1,220 5,180 7,130 8,770
Long Spruce 1,007 4,240 6,080 7,665
Limestone 1,335 5,610 7,630 9,695
Laurie River (I&II) 10 40 60 80
Wuskwatim 200 1,250 1,520 1,650
AGC Reserve -50
Hydro Generation Total 5,175 22,420 31,110 37,492
Brandon Unit 5 105 811 125 125
Brandon Unit 6&7 280 2,354 23 23
Selkirk 132 953 18 18
Thermal Generation Total 517 4,118 166 166
Manitoba Hydro Operated Resources Total 5,692 26,538 31,276 37,658
Wind and Imports
St. Leon Wind Energy 356 419 419
St. Joseph Wind Farm Inc. 421 495 495
Wind Generation Total 777 914 914
Contracted Imports Total 550 2705 Varies Minimal
Market Purchases 363 Varies Minimal
Purchased Resources Total 550 3,845 914 914
Total Existing Resource 6,242 30,383 32,190 38,572
1 Note toTable 5.1
Dependable energy in the Manitoba Hydro Supply and Demand tables provided in Appendix 4.2 will be less than shown in Table 5.1 as the Suppy and Demand tables reflect water withdrawals over time.

Needs For and Alternatives To Chapter 5 –The Manitoba Hydro System, Interconnections and Export Markets
August 2013 Chapter 5 Page 4 of 61
5.1.1 Hydro Generation 1
Hydro-electric power is by far the most significant resource in the Manitoba Hydro generating 2
system, providing almost 90% of the generating capacity that Manitoba Hydro owns and 3
typically about 98% of electric energy. Generating stations (G.S.) located along the lower and 4
upper Nelson River contributes approximately 75% of Manitoba Hydro's current hydro-electric 5
capacity. Several major drainage basins, covering a large area of 1.4 million square kms, 6
ultimately drain through the Nelson River. 7
8
Manitoba Hydro has 15 hydro generating stations on five river systems. Six of Manitoba Hydro’s 9
oldest hydro-generating stations—Pointe du Bois, Great Falls, Slave Falls, Seven Sisters, Pine 10
Falls and McArthur—were built on the Winnipeg River between 1909 and 1955. The combined 11
Winnipeg River generation capacity of 553 MW was sufficient to meet all of the electricity 12
needs of southern Manitoba until the mid 1950’s—by which time the Winnipeg River in 13
Manitoba had been fully developed. 14
15
Initial hydro development in northern Manitoba was driven by mining projects. Laurie River I 16
and II, totaling 10 MW, were developed in the 1950’s by Sherritt Gordon Mines as an isolated 17
system to serve a mining load at Lynn Lake. Manitoba Hydro took over the operation of the 18
Laurie River G.S. in 1970, when the Town of Lynn Lake was interconnected to the Manitoba 19
transmission system. The Kelsey G.S. was developed between 1960 and 1972 by Manitoba 20
Hydro specifically for INCO’s nickel mine in Thompson. Kelsey G.S. operated as an isolated 21
system serving Thompson until it was connected to the southern Manitoba system in 1967. 22
23
The 480 MW Grand Rapids G.S. on the Saskatchewan River was developed between 1965 and 24
1969, completing the development of significant hydro resources in southern Manitoba. 25
Decisions were made in the 1960’s to pursue major hydro development on the lower Nelson 26
River in northern Manitoba. On February 18, 1963, an agreement was completed between the 27
Government of Canada and the Province of Manitoba for joint planning studies that led to the 28

Needs For and Alternatives To Chapter 5 –The Manitoba Hydro System, Interconnections and Export Markets
August 2013 Chapter 5 Page 5 of 61
development of Kettle G.S., Lake Winnipeg Regulation, Churchill River Diversion and the High 1
Voltage Direct Current (HVDC) transmission system. 2
3
The 1,220 MW Kettle G.S. on the lower Nelson River was completed between 1970 and 1974. 4
Kettle G.S. was followed by the 1,007 MW Long Spruce G.S. (complete 1977-79) and then the 5
1,335 MW Limestone G.S. (completed 1990-1992). Also completed in the 1970’s were the Lake 6
Winnipeg Regulation/Jenpeg G.S. (135 MW), and the Churchill River Diversion projects. The 7
most recent hydro station is the 200 MW Wuskwatim G.S. on the Burntwood River, completed 8
in 2012. 9
10
5.1.2 Thermal Generation 11
Manitoba Hydro has two thermal generating stations located in Brandon and Selkirk, Manitoba. 12
The two-unit 132 MW Selkirk G.S. has natural gas boilers coupled with steam turbine-13
generators. Selkirk G.S. was completed in 1960 as a coal-fired station, and the boilers were 14
converted to natural gas in 2002. The three-unit Brandon G.S. has one 105 MW coal-fired boiler 15
coupled with a steam turbine generator completed in 1969, and two natural gas-fired 16
combustion turbines, with a combined capacity of 280 MW, that were completed in 2002. 17
Effective January 2010, The Manitoba Climate Change and Emissions Reduction Act restricted 18
the operation of the Brandon coal unit to the support of emergency operations. 19
20
Thermal resources offer important support in Manitoba Hydro’s system. Thermal resources can 21
be used for capacity purposes to help meet peak loads during winter or when there are hydro-22
generation outages. In a drought, thermal resources would be expected to produce energy. 23
Thermal resources can also be used as a source of supply during major transmission or other 24
outages and for local area electrical requirements. 25

Needs For and Alternatives To Chapter 5 –The Manitoba Hydro System, Interconnections and Export Markets
August 2013 Chapter 5 Page 6 of 61
5.1.3 Wind Generation 1
Manitoba Hydro has purchased the entire output of the St. Leon and St. Joseph wind-2
generation farms in Manitoba—the combined maximum hourly generation capability of the 3
two wind farms is 258 MW. Wind generation is an intermittent resource, in that hourly wind 4
generation can only be relied upon when wind resources are available and are a function of the 5
current wind speed, as opposed to hydro-electric generation which can be called upon 6
immediately to meet current system generation requirements. Wind generation is assumed to 7
have a zero winter peak capacity due to the intermittent nature of the resource and the fact 8
that wind generators cannot operate reliably at temperatures below -30°C, the kind of 9
temperatures which produce Manitoba peak winter load. Wind generation is not dependant on 10
water flow conditions. Annual energy projections are estimated through statistical wind 11
resource assessments and operating history. For planning purposes, 85% of the expected 12
average annual energy from wind generation is assumed to be dependable energy. 13
14
5.1.4 Imports 15
Manitoba Hydro has four import contracts currently in effect as outlined in Table 5.2. The three 16
Seasonal Diversity Agreements provide for the export of capacity for the six-month summer 17
season (May 1-Oct 31) and for the import of capacity for the six-month winter season (Nov 1- 18
April 30). The 500 MW Energy Services Agreement with Northern States Power provides firm 19
import transmission, enabling Manitoba Hydro to make purchases from the MISO market. 20
Imports of energy from a large power market such as MISO, whose resources are 21
predominately thermal, pose very little delivery risk due to lack of energy supply, provided that 22
the deliveries are scheduled on firm transmission service in a period which does not coincide 23
with the peak load in the power market. 24

Needs For and Alternatives To Chapter 5 –The Manitoba Hydro System, Interconnections and Export Markets
August 2013 Chapter 5 Page 7 of 61
Table 5.2 CURRENT IMPORT CONTRACTS 1
Supplier Contract
Name
Capacity
(MW) Type Term
Northern
States Power
NSP 150 SD 150 Seasonal Diversity May 1, 1995 to
April 30, 2015
NSP 200 SD 200 Seasonal Diversity Nov 1, 1996 to
April 30, 2015
NSP 500 ESA 0 500 MW Energy
Services Agreement
May 1, 2009 to
April 30, 2019
Great River
Energy GRE 150 SD 150 Seasonal Diversity
May 1, 1995 to
April 30, 2015
Note: Referenced to Manitoba Border 2
3
5.2 Manitoba Hydro’s Transmission System and Interconnections 4
5
5.2.1 Transmission System Overview 6
Electricity is delivered from Manitoba Hydro’s G.S. to Manitoba customers over a network of 7
transmission lines as shown in Figure 5.1. 8

Needs For and Alternatives To Chapter 5 –The Manitoba Hydro System, Interconnections and Export Markets
August 2013 Chapter 5 Page 8 of 61
Figure 5.1 OVERVIEW OF MANITOBA HYDRO TRANSMISSION SYSTEM1
2 3

Needs For and Alternatives To Chapter 5 –The Manitoba Hydro System, Interconnections and Export Markets
August 2013 Chapter 5 Page 9 of 61
The transmission system has two major components – the Alternating Current (AC) 1
transmission system and the HVDC. The respective lengths of transmission lines connected to 2
Manitoba Hydro’s transmission network are summarized in Table 5.3. 3
Table 5.3 MANITOBA HYDRO SYSTEM- KM OF TRANSMISSION LINES 4
Transmission Line Voltage
500kV 230 kV 138 kV 115 kV 66-69 kV
HVDC System 1,800 km
AC System 200 km 5,000 km 1,400 km 2,900 km 7,200 km
5
As approximately 70% of the existing hydro-generation capacity in Manitoba is located on the 6
lower Nelson River near Gillam, some 800 km north of the major population/load centre in 7
Winnipeg, Manitoba Hydro’s transmission system features a major north-south transmission 8
element: the HVDC system. The existing HVDC system was designed to bring the combined 9
output of the Kettle, Long Spruce and Limestone G.S. in the Gillam area south to the Dorsey 10
Converter Station north-west of Winnipeg near Rosser, Manitoba. 11
12
The existing HVDC system consists of Bipole I and Bipole II and connects to the Northern 13
Collector System. Bipole I consists of the northern Radisson AC-DC Converter Station, a 500 kV 14
(kilovolt) DC (direct current) transmission line from Radisson to Dorsey, and a DC-AC converter 15
station at Dorsey. Bipole I has a capacity rating of ± 463.5 kV and 1,854 MW. Similarly, Bipole II 16
consists of the northern Henday AC-DC Converter Station, a 500 kV DC transmission line from 17
Henday to Dorsey, and a DC-AC Converter Station at Dorsey. Bipole II has a capacity rating of ± 18
500 kV and 2,000 MW. The two HVDC transmission lines which connect the Radisson and 19
Henday Converter Stations to Dorsey are 900 km in length and run on a single right of way. The 20
construction of existing HVDC began in 1968 and the first phase of the system became 21
operational in 1971 with the completion of Bipole I. 22

Needs For and Alternatives To Chapter 5 –The Manitoba Hydro System, Interconnections and Export Markets
August 2013 Chapter 5 Page 10 of 61
The Northern Collector System consists of a number of relatively short 138 and 230 kV AC 1
transmission lines in the Gillam area which deliver power from the Kettle, Long Spruce and 2
Limestone G.S. to the Radisson and Henday Converter Stations. The Northern Collector System 3
is not connected to the AC transmission system and therefore operates in isolation 4
(asynchronously). To provide operating flexibility for the management of transmission outages, 5
it is possible to isolate two units (approximately 200 MW) at the Kettle G.S. from the HVDC 6
system and instead direct their output on the AC transmission system. 7
8
The AC transmission system forms the bulk of the length of transmission lines in Manitoba. The 9
system delivers power from Manitoba generating stations (other than Kettle, Long Spruce and 10
Limestone, which are connected to the HVDC system), and power supplied from the HVDC 11
system at the Dorsey Converter Station, to dozens of electrical stations around the province 12
and to the export market. From these stations, the power is generally delivered to end-use 13
customers through the distribution system; although there are a few large industrial customers 14
who take delivery at high voltage directly from the transmission system. 15
16
5.2.2 Manitoba Hydro’s Transmission Interconnections Overview 17
Manitoba Hydro’s transmission interconnections with adjacent provinces and states are a very 18
important part of Manitoba Hydro’s transmission system. This section describes how the 19
transmission interconnections were developed and the significant reliability and economic 20
benefits they provide to Manitoba. These benefits can be summarized as: 21
improving reliability by enabling imports during drought conditions and under supply 22
contingencies (e.g. temporary loss of supply due to equipment outages) 23
increasing revenues by enabling the export of surplus hydro power and import of 24
market energy at costs lower than the cost of thermal resources available within 25
Manitoba. 26

Needs For and Alternatives To Chapter 5 –The Manitoba Hydro System, Interconnections and Export Markets
August 2013 Chapter 5 Page 11 of 61
Manitoba Hydro’s existing transmission interconnections with Saskatchewan, Ontario and the 1
U.S. are shown in Figure 5.2. 2
3
Figure 5.2 MANITOBA’S TRANSMISSION INTERCONNECTIONS 4

Needs For and Alternatives To Chapter 5 –The Manitoba Hydro System, Interconnections and Export Markets
August 2013 Chapter 5 Page 12 of 61
5.2.2.1 Transmission Interconnections with Saskatchewan 1
Manitoba Hydro currently has five cross-border interconnections with Saskatchewan. Circuits 2
I1F and I2F were constructed around 1929 by a subsidiary of the Hudson Bay Mining and 3
Smelting Company as an isolated system delivering power 96 kms from the Island Falls G.S. in 4
Saskatchewan to a new mine located in Flin Flon, Manitoba. Circuit R7B was constructed in 5
1960 from the Brandon G.S. to Reston, Manitoba and then to the Boundary Dam G.S. in 6
Saskatchewan to provide an alternative source of supply to the electrically remote Brandon 7
area. 8
9
Circuit R25Y, routed between Dauphin/Roblin Manitoba and Yorkton, Saskatchewan was 10
completed in 1972 and was driven in part by a 100 MW sale of surplus power from Kettle G.S. 11
to Saskatchewan from 1972-3. Circuit P52E from The Pas, Manitoba to the E.B. Campbell G.S. in 12
Saskatchewan was placed in service in 1979, improving the stability of the provincial power 13
systems and also increasing the power exchange capability. Existing interconnections with 14
Saskatchewan are summarized in Table 5.4. 15
Table 5.4 INTERCONNECTIONS WITH SASKATCHEWAN 16
Circuit Name Voltage Location Year Completed
I1F/ I2F 115 kV Island Falls, Saskatchewan to Flin Flon,
Manitoba
1929
R7B 230 kV Reston, Manitoba to Boundary Dam
G.S., Saskatchewan
1960
R25Y 230 kV Roblin, Manitoba to Yorkton,
Saskatchewan
1972
P52E 230 kV E.B. Campbell G.S. Saskatchewan to
The Pas, Manitoba
1979

Needs For and Alternatives To Chapter 5 –The Manitoba Hydro System, Interconnections and Export Markets
August 2013 Chapter 5 Page 13 of 61
5.2.2.2 Transmission Interconnections with Ontario 1
Manitoba Hydro has three interconnections with Ontario. Circuit SK1 was constructed in 1956 2
from the Seven Sisters G.S. to Kenora, Ontario to facilitate sales to Ontario under the 1958 Lake 3
St Joseph Agreement, and to provide a diversity of supply for Manitoba and the then-isolated 4
northwestern Ontario power system. Circuits K21W and K22W were placed into service with 5
Ontario in 1972 and 1973 to facilitate a firm power sale with Ontario for 50-200 MW in the 6
1972 to 1976 period using surplus power from Kettle G.S. The existing interconnections with 7
Ontario are summarized in Table 5.5. 8
9
Table 5.5 INTERCONNECTIONS WITH ONTARIO 10
Circuit Name Voltage Location Year Completed
SK1 115 kV Seven Sisters, Manitoba to Kenora,
Ontario
1956
K21W 230 kV Whiteshell Station (Seven Sisters,
Manitoba) to Kenora, Ontario
1972
K22W 230 kV Whiteshell Station (Seven Sisters,
Manitoba) to Kenora, Ontario
1973
11
5.2.2.3 Transmission Interconnections with the U.S. 12
In 1964, representatives of the Mid-Continent Area Power Planners (MAPP) commissioned a 13
report to study immediate and long-range power requirements of the five study sponsors and 14
to develop coordinated plans for new generation and associated transmission facilities with a 15
particular emphasis on U.S.-Canada power interchange. The five utilities sponsoring the study 16
were the Minnesota Power and Light Company, Minnkota Power Cooperative, Northern States 17
Power Company, Otter Tail Power Company, and Manitoba Hydro. Key findings of the 1964 18
MAPP study were as follows: 19
Needs For and Alternatives To Chapter 5 –The Manitoba Hydro System, Interconnections and Export Markets
August 2013 Chapter 5 Page 14 of 61
“For maximum economic benefits, the participating members must operate their 1
individual systems as a single system for the purposes of pooling reserves, 2
exchanging energy, and coordinating the installation of new generating 3
facilities.” 4
5
“The cost of firm power supplied by Manitoba Hydro from their Nelson River 6
development to the principal load centers of the Northern States Power 7
Company in Minneapolis and to North Dakota in the Fargo area is less than firm 8
power from any other source of generation. This reduction in the cost of energy 9
amounting to about 10% is an economic benefit which may be shared by the 10
participants.” 11
12
“The overall cost of energy from the Manitoba Development will be further 13
reduced if maximum utilization is made of energy available from the use of 14
unregulated water flow [e.g. opportunity hydro energy].” 15
16
The MAPP report and subsequent work led to the construction of Manitoba Hydro’s first 17
interconnection with the U.S.: the 230 kV Circuit L20D from Laverendrye near Winnipeg to 18
Drayton and Grand Forks, North Dakota completed in July 1970. The U.S. interconnection was 19
first used by Manitoba Hydro for import purposes during the winter of 1970/71, a time of tight 20
supply just prior to the Kettle G.S. coming into service, 90 MW of capacity had been purchased 21
from the three U.S. owners of the transmission line: Otter Tail Power, Northern States Power 22
(NSP) and Minnkota Power. The export capability of this line was 375 MW. 23
24
The U.S. interconnection supplied interruptible (“opportunity”) hydro power, providing U.S. 25
utilities with a low-cost energy source and providing Manitoba Hydro with export revenue. 26
Success helped drive construction of the second U.S. interconnection: a 230 kV circuit Ridgeway 27
to Moranville (enroute to Duluth) owned in the U.S. by Minnesota Power and connecting 28

Needs For and Alternatives To Chapter 5 –The Manitoba Hydro System, Interconnections and Export Markets
August 2013 Chapter 5 Page 15 of 61
Ridgeway Station, located just east of Winnipeg, with Duluth, Minnesota. The line was 1
approved in 1976, increasing the Manitoba-U.S. transfer capability by 250 MW. 2
3
As construction of the Kettle G.S. neared completion in 1974, construction began on the Long 4
Spruce G.S. Manitoba Hydro was again expecting significant surplus energy once Long Spruce 5
G.S. was completed in 1977-79. Two export sales agreements were signed with NSP in 1976: a 6
200 MW summer peaking capacity sale beginning in 1980, and 300 MW of Seasonal Diversity 7
Sales also beginning in 1980. To facilitate these two sales, a third U.S. interconnection was 8
constructed. The 860 km 500 kV circuit D602F between Dorsey Station and Forbes Station near 9
Minneapolis went into service in 1980. While this line was justified primarily on the basis of the 10
power sales, the line also provided an alternative source of supply to Manitoba in case of major 11
outages on the HVDC network between the Nelson River and Winnipeg. The addition of this 12
500 kV line initially increased export transfer capability to 1,250 MW and ultimately increased 13
transfer capability to the U.S. to 1,500 MW by 1985. 14
15
The addition of Limestone G.S. in 1990-92 and a 500 MW firm power sale agreement with NSP 16
beginning in 1993 triggered a project to further improve the transfer capability to the U.S. The 17
Manitoba-Minnesota Transmission Upgrade (MMTU) project added a number of electrical 18
devices, including series capacitors, to the 500 kV line circuit, D602F; static var compensation at 19
the Forbes station; and several other capacitor bank additions in Minnesota, increasing 20
Manitoba Hydro’s southern transfer capability by almost 30% to 1,900 MW. 21
22
The fourth interconnection with the U.S. was placed in service in 2002. The Glenboro, Manitoba 23
to Rugby, North Dakota 230 kV circuit, G82R, was necessary to maintain import capability into 24
Manitoba as required under the diversity sales agreements with NSP. The project increased 25
long-term import capability to 700 MW, and increased the export capability to the U.S. 26
interface system operating limit of 2,175 MW, which is still in effect. It should be noted that 225 27
MW of the system operating limit is utilized for delivery of operating reserves and transmission 28

Needs For and Alternatives To Chapter 5 –The Manitoba Hydro System, Interconnections and Export Markets
August 2013 Chapter 5 Page 16 of 61
reliability requirements and is not available for export purposes. The existing interconnections 1
with the U.S. are summarized in Table 5.6. 2
Table 5.6 INTERCONNECTIONS TO THE U.S. 3
Circuit Name Voltage Location Year Completed
L20D 230 kV Letellier, Manitoba to Drayton / Grand
Forks, North Dakota
1970
R50M 230 kV Winnipeg, Manitoba to Duluth,
Minnesota
1976
D602F 500 kV Winnipeg, Manitoba to Minneapolis,
Minnesota
1980
G82R 230 kV Glenboro, Manitoba to Rugby, North
Dakota
2002
4
5.2.2.4 Current Interconnection Transfer Capability 5
The current export and import transfer limits on Manitoba Hydro’s interconnections during 6
system-intact conditions are shown in Tables 5.7 and 5.8. 7
Table 5.7 EXPORT TRANSFER LIMITS 8
Interconnection Firm Export Schedule Limit
U.S. 1,950 MW
Ontario 200 MW
Saskatchewan 150 MW
Table 5.8 IMPORT TRANSFER LIMITS 9
Interconnection Firm Transfer Capability for the
Planning Horizon
U.S. 700 MW
Ontario 0 MW
Saskatchewan 0 MW

Needs For and Alternatives To Chapter 5 –The Manitoba Hydro System, Interconnections and Export Markets
August 2013 Chapter 5 Page 17 of 61
The MW limits apply to both the on-peak and off-peak periods. Note that transmission transfer 1
capability is affected by many factors and hence limit values can change. Transfer capabilities 2
can change over the long-term as the transmission system evolves and in the short-term due to 3
issues such as outages of individual lines. A portion of the maximum capability is reserved for 4
transmission reliability purposes, which includes the delivery of operating reserves. Also of note 5
is that the export limits are not additive: due to reliability considerations—and assuming supply 6
were available—exports could not be simultaneously maximized in all three directions. The 7
import capabilities from the interfaces are independent at the present time since no long-term 8
import capability is available from Ontario or Saskatchewan. Import limits from Saskatchewan 9
are dependent upon system conditions within Saskatchewan and vary on a month-by-month 10
basis. 11
12
5.2.3 Reliability Benefits of Interconnections 13
Manitoba Hydro’s interconnections provide significant reliability benefits in several ways: 14
sharing of generation contingency reserves 15
sharing of capacity resources due to load diversity 16
importation of energy during drought conditions or extreme supply loss in Manitoba 17
ability to supply cross-border load when this load is isolated from its system. 18
19
Sharing of Generation Contingency Reserves 20
A reality of power system operation is that individual generators or transmission components 21
will have failures from time to time. To allow for such sudden generation or transmission 22
outages, power system operators must have available spare generation that is ready to 23
operate—units that are called operating or contingency reserves. If operated in isolation, each 24
individual power system must carry sufficient contingency reserves to at least cover the largest 25
single loss-of-supply event or contingency in their power system. For an interconnected power 26
system, power system operators can pool their contingency reserves such that a single pool of 27
contingency generators is available to cover loss-of-supply events over the entire 28

Needs For and Alternatives To Chapter 5 –The Manitoba Hydro System, Interconnections and Export Markets
August 2013 Chapter 5 Page 18 of 61
interconnected system—resulting in a significantly lower level of contingency reserves being 1
carried overall and considerable cost savings. Manitoba Hydro currently has such a 2
contingency-reserve sharing agreement with MISO, which requires Manitoba Hydro to supply 3
150 MW of contingency reserve, with 60 MW of that quantity spinning (or immediately 4
available) and the other 90 MW available within 15 minutes. Firm transmission is reserved on 5
the Manitoba to U.S. interconnection to supply these reserves. 6
7
Sharing of Capacity Resources due to Load Diversity 8
Loads in different power systems will tend to peak at slightly different times on a daily or 9
seasonal basis. Daily diversity means that power demand peaks at different times of the day: 10
peak times tend to vary slightly from system to system depending on factors as time zone, local 11
economy, work hours, holidays, and local weather conditions. Seasonal diversity means that 12
power demand peaks in different seasons: e.g., cold weather drives peak winter (heating) loads 13
in the north, while hot weather drives peak summer (air conditioning) loads in the south. Such 14
load diversities permit the sharing of capacity resources to meet overall peak system loads—15
and cost savings through the reduction in total resources needed to meet system demand. 16
17
Importation of Energy during Drought or Extreme Supply Loss 18
Manitoba Hydro’s predominately hydro system is energy limited, and, therefore, can be short 19
of water/energy in an extreme drought. Transmission interconnections provide an important 20
source of supply during off-peak hours when there is ample excess capacity in the adjacent 21
predominantly thermal system to provide off-peak energy to the hydro system. Such off-peak 22
purchases allow water/energy to be conserved in Manitoba to meet peak loads. Imports may 23
also be required for reliability purposes during major supply loss events such as the loss of the 24
entire Interlake HVDC transmission corridor. 25

Needs For and Alternatives To Chapter 5 –The Manitoba Hydro System, Interconnections and Export Markets
August 2013 Chapter 5 Page 19 of 61
Ability to Supply Cross-Border Loads 1
Load that is located around the periphery of a power system may only have a single source of 2
supply. If this load is located along a transmission interconnection, the load can then be 3
supplied from the host power system, or in the event of a transmission outage, back-fed from 4
the neighboring system. Such arrangements can reduce the overall level of transmission 5
investment in both systems. 6
7
5.2.4 Economic Benefits of Interconnections 8
In addition to reliability and diversity, Manitoba Hydro’s interconnections provide economic 9
benefits as follows: 10
exportation of surplus hydro power 11
provision of a source of economic supply 12
sale of ancillary services. 13
14
Exportation of Surplus Hydro Power 15
The most obvious benefit of interconnections to a predominately hydro system is that 16
interconnections provide a means to export surplus hydro generation. In an isolated system 17
with limited storage capability, such surplus energy cannot be utilized; instead, the water would 18
be spilled and the value lost. In an interconnected system, surplus power can be exported at 19
the value obtained by negotiated contract prices or at the current market value. A history of 20
Manitoba Hydro’s considerable export revenues, totaling over $9.5 billion over the last 35 21
years, is provided in Figure 5.3. 22

Needs For and Alternatives To Chapter 5 –The Manitoba Hydro System, Interconnections and Export Markets
August 2013 Chapter 5 Page 20 of 61
Figure 5.3 EXPORT SALES HISTORY 1
2
Source of Economic Supply 3
There are times during the peak winter demand period when it is economically beneficial to 4
import lower-cost resources from outside of Manitoba rather than use Manitoba Hydro’s own 5
thermal resources. The fleet of wind, nuclear and thermal generation units outside of Manitoba 6
is many times larger than that within Manitoba. Thus, for most hours there would be a more 7
efficient and underutilized unit available to generate power than can be supplied from within 8
Manitoba. Further, thermal units outside of Manitoba may already be operating at part load — 9
resulting in lower startup costs and quicker availability. 10
11
As well, due to Manitoba Hydro’s ability to store power by maintaining and increasing forebay 12
levels at various generating stations, it is able to meet a portion of its off-peak domestic load 13
0
100
200
300
400
500
600
700
800
0
2,000
4,000
6,000
8,000
10,000
12,000
14,000
16,000
19
67
19
69
19
71
19
73
19
75
19
77
19
79
19
81
19
83
19
85
19
87
19
89
19
91
19
93
19
95
19
97
19
99
20
01
20
03
20
05
20
07
20
09
20
11
20
13
Mill
ion
$
GW
h
Fiscal Year Ending Revenue Energy Volume

Needs For and Alternatives To Chapter 5 –The Manitoba Hydro System, Interconnections and Export Markets
August 2013 Chapter 5 Page 21 of 61
requirements by importing power—through interconnections with external markets—during 1
those less expensive hours, with power returned to the external markets during the more 2
profitable on-peak hours the next day. The ability of Manitoba Hydro’s generation facilities to 3
act as a storage battery is particularly significant in light of the substantial wind development 4
occurring in MISO and across the U.S., and the fact that a significant proportion of energy 5
generated by those wind resources occurs during off-peak hours when there is low demand in 6
MISO and can be exported inexpensively to entities like Manitoba Hydro. 7
8
Sale of Ancillary Services 9
Manitoba Hydro has the capability to supply ancillary services into the MISO market. Ancillary 10
services include spinning, supplemental and regulation-reserve services which are required by 11
the system operator for the secure stable operation of the electrical system. Manitoba Hydro 12
can offer up to 375 MW of ancillary services as an External Asynchronous Resource into the 13
MISO market, supporting reliable market operations and providing another revenue stream as a 14
result of the transmission interconnections. 15
16
5.2.5 Drivers of Development of Transmission Interconnections 17
As Manitoba Hydro’s generation system has developed over the last 50 years to supply growing 18
Manitoba load, Manitoba Hydro’s transmission interconnections have similarly developed. 19
Growth of the transmission interconnections has been carefully planned, and was anticipated 20
even before construction started on the Kettle G.S. On February 18, 1963 an agreement was 21
completed between the Government of Canada and the Province of Manitoba for joint-22
planning studies that led to the development of Kettle G.S. and the HVDC transmission system. 23
The first paragraph of this landmark agreement states: 24
25
“WHEREAS Manitoba has represented to Canada that the Nelson River has a 26
power potential of the order of 4 million kilowatts of firm power, approximately 27
2 million kilowatts of which would be surplus to Manitoba’s requirements for a 28
Needs For and Alternatives To Chapter 5 –The Manitoba Hydro System, Interconnections and Export Markets
August 2013 Chapter 5 Page 22 of 61
considerable period and that, if any part of this potential is to be made available 1
at economics rates in the near future, it must be developed for large markets 2
outside of Manitoba to take advantage of economies of scale in which long 3
distance transmission of electric energy would play a vital role.” 4
5
Thus, over 50 years ago it was recognized that the economic development of large hydro 6
resources in Manitoba required large markets outside of Manitoba in order to take advantage 7
of the economies of scale. Transmission interconnections, it was understood, represent the 8
means to achieve such economies of scale. 9
10
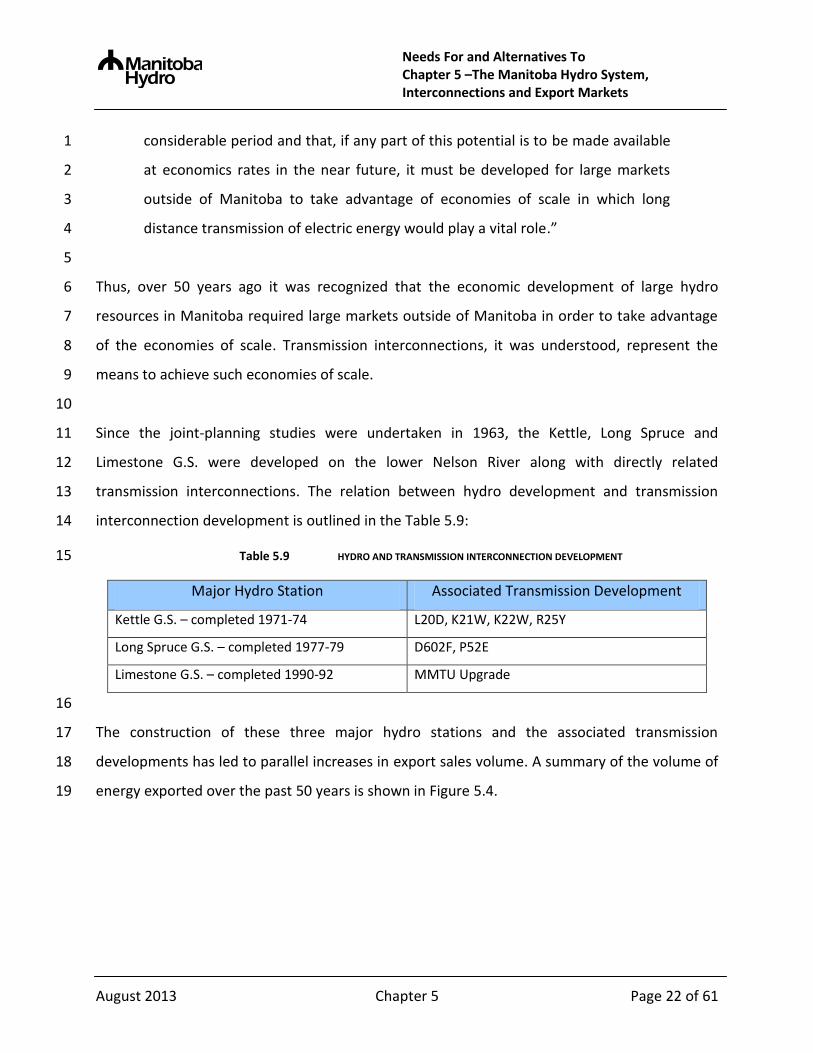
Since the joint-planning studies were undertaken in 1963, the Kettle, Long Spruce and 11
Limestone G.S. were developed on the lower Nelson River along with directly related 12
transmission interconnections. The relation between hydro development and transmission 13
interconnection development is outlined in the Table 5.9: 14
Table 5.9 HYDRO AND TRANSMISSION INTERCONNECTION DEVELOPMENT 15
Major Hydro Station Associated Transmission Development
Kettle G.S. – completed 1971-74 L20D, K21W, K22W, R25Y
Long Spruce G.S. – completed 1977-79 D602F, P52E
Limestone G.S. – completed 1990-92 MMTU Upgrade
16
The construction of these three major hydro stations and the associated transmission 17
developments has led to parallel increases in export sales volume. A summary of the volume of 18
energy exported over the past 50 years is shown in Figure 5.4. 19

Needs For and Alternatives To Chapter 5 –The Manitoba Hydro System, Interconnections and Export Markets
August 2013 Chapter 5 Page 23 of 61
Figure 5.4 HISTORY OF EXPORT SALES 1
2
5.2.6 Committed Major Transmission Development at Manitoba Hydro 3
Manitoba Hydro plans additions and enhancements to its transmission and sub-transmission 4
systems to ensure that the systems will continue to operate reliably in the future as 5
requirements change. Manitoba Hydro plans its transmission system to meet performance 6
requirements set out in the North American Electric Reliability Corporation (NERC) Reliability 7
Standards, Midwest Reliability Organization Standards, and Manitoba Hydro's own 8
Transmission System Interconnection Requirements, which define standards for system 9
adequacy, reliability, and security. The main drivers behind the need for new transmission 10
facilities include the following: to improve safety, serve local load growth, maintain and 11
improve reliability, provide transmission service, connect new generation, increase efficiency, 12
and address aging infrastructure. 13

Needs For and Alternatives To Chapter 5 –The Manitoba Hydro System, Interconnections and Export Markets
August 2013 Chapter 5 Page 24 of 61
The ongoing transmission additions and enhancements help to ensure that the transmission 1
system continues to meet Manitoba Hydro's mandate of serving the province with a reliable 2
supply of electricity as well as meeting the performance requirements of Manitoba Hydro and 3
its neighbouring utilities in Canada and the U.S. 4
5
Currently, Manitoba Hydro is developing the following two major projects for reliability 6
purposes: 7
Riel Station Reliability Project 8
Bipole III Reliability Project. 9
10
5.2.6.1 Riel Station Reliability Project 11
Maintaining a reliable supply of electricity under all conditions is a key tenet of Manitoba 12
Hydro’s planning and operational strategies. That includes ensuring that the utility has the 13
ability to import power reliably during times of low water flows or during emergencies. The Riel 14
Station Reliability Project will improve system reliability by adding an alternate terminal point 15
for the existing 500 kV transmission line to the U.S., thereby preserving Manitoba Hydro’s 16
system import capability if there is a major outage at Dorsey. 17
18
The new Riel Station—as shown in Figure 5.5—will be located on the east Winnipeg periphery 19
adjacent to major 230 kV and 500 kV transmission corridors. The location minimizes the need 20
for new transmission corridors into and out of Riel and reduces the amount of new west-to-east 21
transmission across Winnipeg by providing an alternate supply point to Dorsey, located on the 22
northwest periphery of Winnipeg. 23
24
The project includes establishing the Riel Station site, installing 230 kV and 500 kV switch yards, 25
installing a 230 kV to 500 kV transformer bank, sectionalizing the existing Dorsey- Forbes 500 kV 26
AC MH-U.S. interconnection, and sectionalizing two existing 230 kV lines (Ridgeway-St. Vital 27
lines R32V and R33V). The scheduled in-service date of the project is 2014. 28

Needs For and Alternatives To Chapter 5 –The Manitoba Hydro System, Interconnections and Export Markets
August 2013 Chapter 5 Page 25 of 61
Figure 5.5 CONCEPTUAL OVERVIEW OF RIEL STATION RELIABILITY PROJECT 1
2
5.2.6.2 Bipole III Reliability Project 3
Subject to environmental regulatory approval, Manitoba Hydro is also developing the Bipole III 4
Transmission Project to enhance system reliability. The Bipole III Reliability Project will reduce 5
the severity of the consequences of major HVDC system outages. 6
7
Approximately 70% of Manitoba's hydro-electric generating capacity is delivered to southern 8
Manitoba via the Bipole I and Bipole II HVDC transmission lines. Bipoles I and II share the same 9
transmission corridor through the Interlake region over much of their length from northern 10
Manitoba to a common terminus at the Dorsey Converter Station. The existing transmission 11
system is therefore vulnerable to the risk of catastrophic outages of either (or both) Bipoles I 12
and II in the Interlake corridor and/or at Dorsey due to unpredictable events, particularly severe 13
weather. This vulnerability, combined with the significant consequences of prolonged major 14

Needs For and Alternatives To Chapter 5 –The Manitoba Hydro System, Interconnections and Export Markets
August 2013 Chapter 5 Page 26 of 61
outages, caused Manitoba Hydro to pursue a major initiative to reduce dependence on the 1
Dorsey Converter Station and the existing HVDC Interlake transmission corridor. 2
The conceptual schematic of Bipole III project is shown in Figure 5.6 below and includes: 3
a new converter station, Keewatinoow, to be located near the site of the proposed 4
future Conawapa G.S. on the Nelson River northwest of Gillam, Manitoba 5
new 230 kV transmission lines connecting the Keewatinoow Converter Station to the 6
northern AC collector system at the existing 230 kV switchyards at the Henday 7
Converter Station and Long Spruce Switching Station 8
modifications to the Henday Converter Station and the Long Spruce Switching Station to 9
accommodate the new collector lines 10
the development of a new +/-500 kV HVDC transmission line, 1,384 km in length and 11
centered on a 66-meter-wide right-of-way, that will originate at the Keewatinoow 12
Converter Station, follow a westerly route to southern Manitoba and terminate at a new 13
converter station, Riel, immediately east of Winnipeg 14
a new southern converter station at Riel Station. 15

Needs For and Alternatives To Chapter 5 –The Manitoba Hydro System, Interconnections and Export Markets
August 2013 Chapter 5 Page 27 of 61
Figure 5.6 CONCEPTUAL SCHEMATIC OF BIPOLE III PROJECT 1

Needs For and Alternatives To Chapter 5 –The Manitoba Hydro System, Interconnections and Export Markets
August 2013 Chapter 5 Page 28 of 61
As a major reliability initiative, Bipole III is being developed with or without new hydro 1
generation. However, Bipole III will also provide a transmission outlet for a large portion of 2
power from the Keeyask and Conawapa G.S. should they be developed. 3
4
Upon receipt of the necessary Environment Act licence, construction is planned to commence in 5
2013 with a projected in-service date of October 2017. 6
7
5.3 Properties of Manitoba Hydro’s Generating System 8
Manitoba Hydro’s existing generation system is predominantly hydro-electric—with 9
approximately 98% of the total electric energy supply from hydro resources in a typical year. 10
The water supply for the Manitoba Hydro system is provided from a vast watershed. As shown 11
in Figure 5.7, the watershed—with a footprint of 1,400,000 km2—encompasses parts of four 12
provinces and four states, stretching from the Rocky Mountains in Alberta to Lake Superior in 13
Ontario and south into the U.S. reaching South Dakota. Drainage basins from five rivers are 14
encompassed: the Saskatchewan, Upper Churchill, Nelson, Winnipeg and Red Rivers. Figure 5.7 15
illustrates the average contribution of energy from each of the major river systems to the total 16
energy output from the system. Lake Winnipeg acts as Manitoba Hydro’s main reservoir and 17
provides seasonal storage of energy. 18

Needs For and Alternatives To Chapter 5 –The Manitoba Hydro System, Interconnections and Export Markets
August 2013 Chapter 5 Page 29 of 61
Figure 5.7 MANITOBA HYDRO WATERSHED 1
2
3
Manitoba Hydro’s generation is greatly affected by variability in water supply. As an illustration 4
of this variability, Figure 5.8 shows historic water supply as a percentage of long-term average 5
for each year. It also demonstrates that there is over a 350% difference between the lowest and 6
highest recorded water supply conditions on record. 7

Needs For and Alternatives To Chapter 5 –The Manitoba Hydro System, Interconnections and Export Markets
August 2013 Chapter 5 Page 30 of 61
Figure 5.8 HISTORICAL WATER SUPPLY VARIABILITY 1
2
Table 5.10 below provides the variation in hydro-plant generation under a range of flow 3
conditions. Based on the historic record and the current Manitoba Hydro system, hydro 4
generation ranges from 22,420 GWh under dependable in-flow conditions, including available 5
storage, to 37,492 GWh under high flow conditions. 6
Table 5.10 ENERGY PRODUCED UNDER FLOW CONDITION 7
Flow Condition Energy (GWh)
Dependable 22,420
Average 31,110
Maximum 37,492
Needs For and Alternatives To Chapter 5 –The Manitoba Hydro System, Interconnections and Export Markets
August 2013 Chapter 5 Page 31 of 61
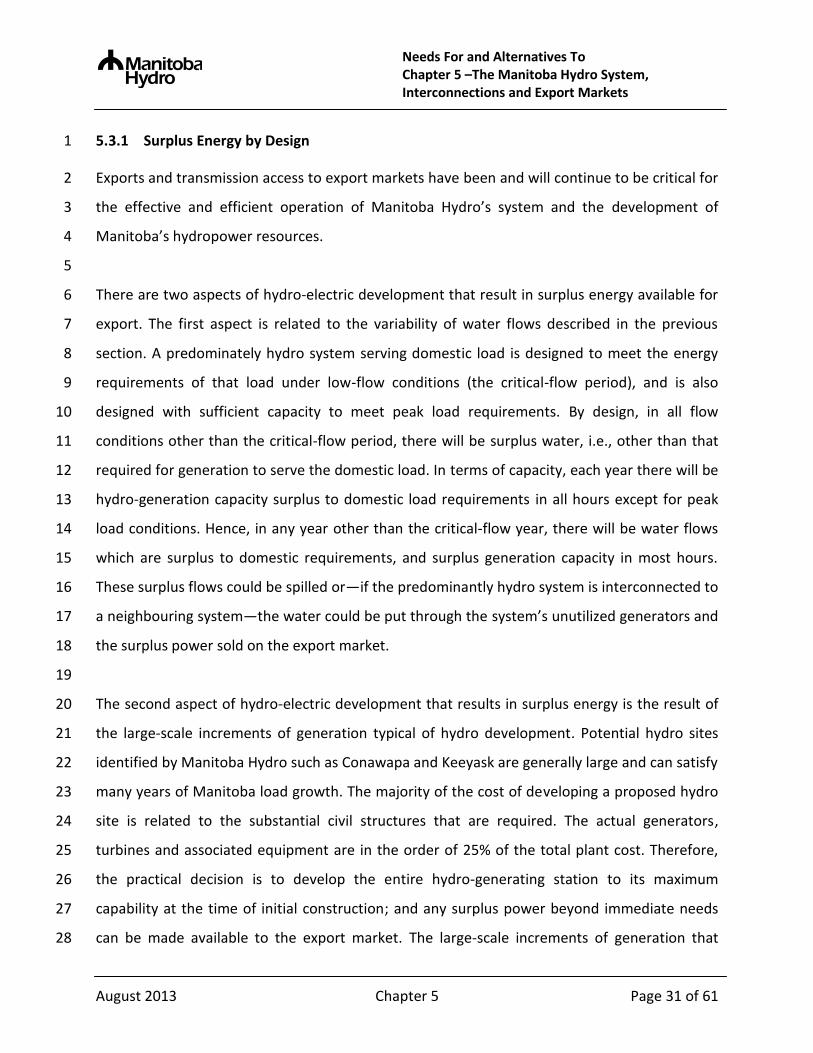
5.3.1 Surplus Energy by Design 1
Exports and transmission access to export markets have been and will continue to be critical for 2
the effective and efficient operation of Manitoba Hydro’s system and the development of 3
Manitoba’s hydropower resources. 4
5
There are two aspects of hydro-electric development that result in surplus energy available for 6
export. The first aspect is related to the variability of water flows described in the previous 7
section. A predominately hydro system serving domestic load is designed to meet the energy 8
requirements of that load under low-flow conditions (the critical-flow period), and is also 9
designed with sufficient capacity to meet peak load requirements. By design, in all flow 10
conditions other than the critical-flow period, there will be surplus water, i.e., other than that 11
required for generation to serve the domestic load. In terms of capacity, each year there will be 12
hydro-generation capacity surplus to domestic load requirements in all hours except for peak 13
load conditions. Hence, in any year other than the critical-flow year, there will be water flows 14
which are surplus to domestic requirements, and surplus generation capacity in most hours. 15
These surplus flows could be spilled or—if the predominantly hydro system is interconnected to 16
a neighbouring system—the water could be put through the system’s unutilized generators and 17
the surplus power sold on the export market. 18
19
The second aspect of hydro-electric development that results in surplus energy is the result of 20
the large-scale increments of generation typical of hydro development. Potential hydro sites 21
identified by Manitoba Hydro such as Conawapa and Keeyask are generally large and can satisfy 22
many years of Manitoba load growth. The majority of the cost of developing a proposed hydro 23
site is related to the substantial civil structures that are required. The actual generators, 24
turbines and associated equipment are in the order of 25% of the total plant cost. Therefore, 25
the practical decision is to develop the entire hydro-generating station to its maximum 26
capability at the time of initial construction; and any surplus power beyond immediate needs 27
can be made available to the export market. The large-scale increments of generation that 28

Needs For and Alternatives To Chapter 5 –The Manitoba Hydro System, Interconnections and Export Markets
August 2013 Chapter 5 Page 32 of 61
come with each new hydro project typically mean there are interim surpluses of both capacity 1
and dependable energy above the amount required to meet Manitoba domestic load. 2
3
Therefore, as the system is expanded, the amount of both dependable and surplus energy is 4
increased as illustrated in Figure 5.9. 5
Figure 5.9 RANGE OF SURPLUS ENERGY WHEN NEW HYDRO IS BUILT 6
7
5.3.2 Resource Diversity 8
Due to variability in water supply, diversity in resource mix is essential to a predominantly 9
hydro-electric generating system from both an economic and supply dependability perspective. 10
Because the Manitoba Hydro system has strong interconnections to adjacent markets, there is 11
access to ample sources of predominantly thermal-based supply to provide resource diversity 12
as a supplement to thermal resources built in Manitoba. The specific quantity of imports that 13
can be relied upon is specified in Appendix 4.1 Manitoba Hydro Generation Planning Criteria. 14
Manitoba Hydro has maintained a reasonable level of diversity in resource mix. For example, in 15
2014/15 under dependable flow conditions, Manitoba Hydro would be able to rely on thermal 16
and import resources representing 25% of total supply. 17

Needs For and Alternatives To Chapter 5 –The Manitoba Hydro System, Interconnections and Export Markets
August 2013 Chapter 5 Page 33 of 61
Figure 5.10 illustrates the various resources that are able to meet Manitoba domestic load and 1
firm export commitments across the historic range of water supply conditions. Noted on Figure 2
5.10 is the Manitoba domestic load for the year 2014/15 (black line) as well as total 3
commitments including firm export commitments (red line). The range of historic water supply 4
depicts the lowest-flow conditions (e.g., dependable conditions) as 0% and the highest-flow 5
conditions as 100%. The mix of resources used to supply the 2014/15 total commitments range 6
from the mix shown under dependable conditions to the mix shown under the highest-flow 7
conditions. For example, under the lowest-water flow conditions on record (0%) Manitoba 8
Hydro would rely on wind, hydro, thermal and imports to meet load requirements. As the 9
capability of thermal plants is not affected by system water flow conditions, the thermal 10
resources in Manitoba are most heavily utilized under dependable water flow conditions when 11
hydro-electric energy supply is low. Under water flows below the tenth percentile, Manitoba 12
Hydro can be expected to require the use of thermal or import energy to meet its Manitoba 13
domestic load commitments. The reliance on thermal or import energy decreases at the time 14
new hydro-generation is added and gradually increases over time thereafter; such an effect 15
would occur under the Preferred Development Plan. 16

Needs For and Alternatives To Chapter 5 –The Manitoba Hydro System, Interconnections and Export Markets
August 2013 Chapter 5 Page 34 of 61
Figure 5.10 GENERATION SUPPLY SOURCES OVER A RANGE OF WATER CONDITIONS IN 1 2014/15 2
3
5.4 Interconnected Power Markets 4
5
5.4.1 Electricity Market Structure 6
The Canadian and U.S. power systems are operated as a collection of coordinated regional 7
power systems. In many areas of the U.S. regional power system operators are also responsible 8
for operating a state or regional power market. In Canada, two provinces—Ontario and 9
Alberta—operate provincial power markets. Other Canadian provinces and U.S. states that do 10
not have a regional power market generally provide open access to their transmission systems 11
and engage in bilateral energy sales with counterparties in their region. 12

Needs For and Alternatives To Chapter 5 –The Manitoba Hydro System, Interconnections and Export Markets
August 2013 Chapter 5 Page 35 of 61
Most wholesale electricity markets in the U.S. operate under the regulatory requirements of 1
the Federal Energy Regulatory Commission (FERC), a federal U.S. agency with jurisdiction over a 2
number of energy matters including the transmission of electricity in interstate commerce and 3
wholesale electricity rates. FERC must approve the electricity market rules for jurisdictional 4
wholesale power markets. The U.S. federal Department of Energy (DOE) has jurisdiction over 5
international electricity exports and the construction and operation of international 6
transmission lines. Individual states have jurisdiction over determination of the need for new 7
generation capacity and the siting of new power plants and transmission lines. In Canada, 8
jurisdiction over intra-provincial electricity supply and regulation lies with the provinces. The 9
jurisdiction of the National Energy Board (NEB) for electricity matters includes the construction 10
and operation of international transmission lines, designated inter-provincial transmission lines 11
and U.S. electricity export authorizations. 12
13
Regional power markets in the U.S. are operated by either a Regional Transmission 14
Organization (RTO) or an Independent System Operator (ISO). These two structures perform 15
similar reliability functions and must provide non-discriminatory access to the transmission 16
network. RTOs generally have a broader multistate market region, while ISOs generally have a 17
single state / provincial market region. Both RTOs and ISOs are FERC-approved entities and 18
function as reliability coordinators, power grid operators and regional market administrators. 19
An RTO has authority over a wider region and also acts as a market operator in wholesale 20
power. 21
22
As shown in Figure 5.11, there are currently four RTOs and five ISOs in North America. The RTOs 23
are PJM (Pennsylvania, New Jersey and Maryland), MISO, SPP (Southwest Power Pool) and ISO-24
NE (Independent System Operator New England). The five ISOs are CAISO (California 25
Independent System Operator), NYISO (New York Independent System Operator), ERCOT 26
(Electric Reliability Council of Texas), AESO (Alberta Electric System Operator), and the IESO 27
(Ontario Independent System Operator). On Figure 5.11, areas not shown as being within an 28

Needs For and Alternatives To Chapter 5 –The Manitoba Hydro System, Interconnections and Export Markets
August 2013 Chapter 5 Page 36 of 61
RTO or ISO would have a central reliability coordinator and would utilize a bilateral market 1
rather than a centrally operated power market. 2
3
Figure 5.11 NORTH AMERICAN MARKETS 4
5
Each market has its own unique characteristics, influenced by regional factors including 6
available local energy sources, population density, regional geography and seasonal load 7
patterns. The source of primary energy used to generate electricity varies widely from region to 8
region, as outlined in Table 5.11. 9

Needs For and Alternatives To Chapter 5 –The Manitoba Hydro System, Interconnections and Export Markets
August 2013 Chapter 5 Page 37 of 61
Table 5.11 2011 SHARE OF ENERGY GENERATED BY FUEL TYPE FOR SELECTED ISOS 1
Fuel Type NE-ISO MISO CAISO PJM NY-ISO ONTARIO
U.S.
(Total)
Coal 6% 75% 1% 47% 7% 3% 42%
Natural Gas/Oil 52% 5% 46% 15% 37% 15% 26%
Hydro 8% 1% 21% 2% 20% 22% 8%
Nuclear 28% 13% 18% 34% 31% 57% 19%
Solar 0% 0% 0% 0% 0% 0% 0%
Wind 1% 5% 4% 2% 2% 3% 3%
Geothermal 0% 0% 6% 0% 0% 0% 0%
Other 5% 0% 3% 1% 3% 1% 2%
Source NE-ISO
Market Data
MISO Market
Assessment
Reports
U.S. DOE EIA
data for
California Cleantechnia
U.S. DOE EIA
data for
New York Ontario IESO
U.S. DOE EIA
data for U.S.
2
As indicated by Table 5.11, the MISO region is coal dominated, generating 75% of its electrical 3
energy from coal in 2011 in comparison with 42% for the U.S. as a whole. Renewables (hydro, 4
wind and solar) provided 11% of U.S. electricity overall in 2011. Thermal generation (coal, 5
natural gas/ oil and nuclear) supplied 87% of the overall U.S. electricity in 2011. As discussed in 6
Chapter 3 – Trends and Factors Influencing North American Electricity Supply, the share of 7
energy generated using coal in the U.S. is on the decline. Between 2001 and 2008, the annual 8
share of coal-generated energy declined from 51% to 48%. Coal-fired generation last provided a 9
50% share in 2005 and is expected to be 40% in 2013 according to the U.S. DOE EIA. 10
11
5.4.2 Midwest Power Markets 12
Manitoba Hydro’s largest transmission interconnection by far is to the south with the U.S. The 13
U.S. interconnection has evolved to become substantially larger than either the Saskatchewan 14
or Ontario interconnections for two reasons. First, the Minneapolis–Saint Paul metropolitan 15
area, which has a population of over 3.3 million people (according to the 2010 U.S. census), 16

Needs For and Alternatives To Chapter 5 –The Manitoba Hydro System, Interconnections and Export Markets
August 2013 Chapter 5 Page 38 of 61
represents the closest population centre/electricity market to southern Manitoba that has a 1
population larger than Winnipeg. Second, the state of Minnesota has few primary energy 2
sources with which to generate electricity, having no oil, coal or natural gas according to the 3
U.S. EIA. As a result, Minnesota is a significant net importer of electricity or the fuel to generate 4
electricity, providing a good market for Manitoba Hydro’s surplus power. 5
6
Manitoba Hydro’s four U.S. transmission interconnections are generally owned in the U.S. by 7
utilities who are members of MISO. As a result of the large U.S. interconnection and size of the 8
Midwestern U.S. market, over 85% of Manitoba Hydro’s exports have been sold into the MISO 9
market in recent years. The relative importance of the MISO energy market to Manitoba Hydro 10
is not expected to change quickly given the geographic proximity of Manitoba to the relatively 11
large population/demand centers in Minnesota and Wisconsin. 12
13
5.4.2.1 MISO Organizational Overview 14
As of July 2012, MISO was the reliability coordinator for over 49,000 miles of transmission 15
located in 11 states in the U.S. Midwest and the province of Manitoba (Figure 5.12). MISO was 16
the first regional entity to be granted RTO status by FERC in 2001. In 2002, FERC accepted 17
MISO’s Open Access Transmission Tariff, allowing MISO to provide regional transmission 18
services and requiring it to conduct transmission planning and expansion activities in the 19
region. In 2005 MISO launched its wholesale energy market, one of the world’s largest real-time 20
energy markets, and began centrally dispatching generating units based on bids and offers 21
cleared in the market. MISO began administration of its Ancillary Services Markets (ASM) in 22
January, 2009—ancillary services include spinning, supplemental and regulation services 23
required to secure stable operations of the electrical system. Transmission service, market and 24
ASM rules are all contained under MISO’s Open Access Transmission, Energy and Operating 25
Reserve Markets Tariff (TEMT). 26

Needs For and Alternatives To Chapter 5 –The Manitoba Hydro System, Interconnections and Export Markets
August 2013 Chapter 5 Page 39 of 61
Figure 5.12 MISO 2012 RELIABILITY COORDINATION AREA 1 2
3
More information on the MISO market is contained in Appendix 5.1 – MISO Corporate Fact 4
Sheet July 2012. The data sheet does not reflect the pending MISO South (Entergy) integration, 5
which will add 25,000 kms of transmission lines and 23,000 MW of generating capacity. Entergy 6
is a large utility, to the south of the July 2012 MISO reliability coordination area, which is in the 7
process of joining MISO. As the Entergy service territory is quite far from Minnesota and 8
Wisconsin, Entergy integration is expected to have a minimal but positive impact on MISO and 9
on Manitoba Hydro’s market region. 10
5.4.2.2 MISO Market Overview 11
In addition to being a transmission system operator and reliability coordinator, MISO also 12
operates power markets in that portion of its region known as the MISO market footprint, as 13
shown in Figure 5.13. 14

Needs For and Alternatives To Chapter 5 –The Manitoba Hydro System, Interconnections and Export Markets
August 2013 Chapter 5 Page 40 of 61
Figure 5.13 MISO 2012 MARKET FOOTPRINT 1
2
The MISO market footprint is slightly smaller than the MISO reliability coordination area: some 3
loads that are not under the jurisdiction of the U.S. FERC—such as Manitoba Hydro and U.S. 4
power cooperatives—are part of the reliability coordination footprint but not the MISO market 5
footprint. The MISO market footprint extends only to the Canada-U.S. border and Manitoba 6
Hydro’s sales and purchases with U.S. counterparties or with the MISO market occur at the 7
international border. 8
9
MISO’s July 2012 historic peak load for the market footprint was 98,576 MW; registered 10
generation capacity in July 2012 was 131,581 MW. About 63,000 MW or 48% of the registered 11
generation capacity is coal-fired generation. Manitoba Hydro’s maximum potential supply into 12
the MISO market is currently limited by the firm export schedule limit of 1,950 MW; therefore, 13
based on the existing firm export schedule limit and current MISO market footprint, the 14
Manitoba Hydro system would currently be able to supply up to 2% of the peak demand in 15
MISO. 16
Needs For and Alternatives To Chapter 5 –The Manitoba Hydro System, Interconnections and Export Markets
August 2013 Chapter 5 Page 41 of 61
5.4.2.3 Manitoba Hydro’s Relationship with MISO as a Coordinating Member 1
Manitoba Hydro’s relationship with MISO is different than that of other U.S. utilities whose load 2
and generation is located within the MISO market footprint. Manitoba Hydro’s load is not 3
served under the MISO TEMT, and Manitoba Hydro’s generation is not directly dispatched 4
based on instructions from MISO. Manitoba Hydro’s governing legislation does not authorize 5
the delegation of authority over its assets or operations to any third party except, in limited 6
circumstances, subject to the approval of the Lieutenant-Governor in Council. Accordingly, 7
Manitoba Hydro participates in the MISO market as a coordinating member via three 8
agreements. The first two agreements, the Coordination Agreement and the Seams Operating 9
Agreement, pertain to the coordination of transmission operations. The third agreement, the 10
MISO Market Participation Agreement, binds Manitoba Hydro to the MISO market rules and a 11
common agreement that all MISO market participants must sign. 12
13
Coordination Agreement 14
Under the Coordination Agreement, Manitoba Hydro and MISO coordinate on tariff 15
administration services, transmission planning activities and contingency reserve sharing. In 16
particular, Manitoba Hydro is responsible for serving its own load and MISO is responsible for 17
certain tariff administration services, transmission settlements, administration of the 18
contingency reserve sharing agreement and reliability coordination. The parties are jointly 19
required to meet reliability standards established by NERC. 20
Seams Agreement 21
The Seams Agreement contains certain standard requirements including data sharing, close 22
coordination of operations and congestion management procedures to be followed in cases 23
where power flows on transmission lines result in congestion on the electrical grid. 24

Needs For and Alternatives To Chapter 5 –The Manitoba Hydro System, Interconnections and Export Markets
August 2013 Chapter 5 Page 42 of 61
Market Participation Agreement 1
The Market Participation Agreement provides that Manitoba Hydro shall take and pay for 2
services in accordance with the TEMT and that MISO shall provide those services as requested. 3
4
5.4.2.4 MISO Market 5
At the consumer level, electricity appears to be a simple, convenient, homogeneous product; 6
however, at the wholesale level, it is much more complex. This complexity is related to the 7
inherent nature of electricity: it currently cannot be readily stored in large quantities and 8
requires the continuous and instantaneous balancing of supply and demand. This balance 9
requires a detailed understanding of many factors, including generator and transmission 10
capability and availability, market rules, the impact of ambient conditions and time of year. 11
Appendix 5.2 - MISO Market Products, Operation and Locational Marginal Pricing provides 12
additional information on the MISO market. 13
14
There are three discrete categories of physical power products that are purchased and sold in 15
the MISO market: energy, generation capacity and ancillary services. Specific market rules 16
pertain to each product. 17
18
MISO operates two energy markets for energy and ancillary services, and facilitates a market 19
for generation capacity in the footprint. The two MISO-operated energy and ancillary product 20
markets are the Day-Ahead Energy and Ancillary Services Market (DA) and the Real-Time 21
Energy and Ancillary Services (RT) Market. MISO facilitates the market for generation capacity—22
the MISO Resource Adequacy Construct—through its resource adequacy requirements for load, 23
the tracking of bilateral capacity transactions, and through the MISO Planning Resource Auction 24
for generation capacity. 25

Needs For and Alternatives To Chapter 5 –The Manitoba Hydro System, Interconnections and Export Markets
August 2013 Chapter 5 Page 43 of 61
MISO Market Pricing 1
To operate the power system and to determine energy prices, MISO utilizes a complex system 2
called “security constrained economic dispatch” to determine which generators are required to 3
operate and to calculate market prices each hour in the day-ahead and real-time energy 4
markets. “Security constrained” means that MISO must observe system limits such as 5
transmission-line capacities and ancillary service requirements when selecting which units to 6
operate. MISO accepts offers to generate power from each generator available within the 7
market footprint, and from adjacent external market participants including Manitoba Hydro. As 8
of July 2012, there were roughly 6000 generators within the MISO market footprint eligible to 9
offer power into MISO energy markets, with a total generation capacity of over 131,000 MW. 10
MISO determines energy prices for each of thousands of locations on the power grid, a type of 11
pricing is known as “locational marginal pricing” (LMP), explained in more detail in Appendix 12
5.2 - MISO Market Products, Operation and Locational Marginal Pricing. 13
14
The LMP at each location includes a system-wide energy price component, a line-loss 15
component, and a congestion component, in which transmission lines play a key role. When 16
there is insufficient transmission to deliver all of the lowest-cost power to the load, the 17
transmission line is said to be congested. The market operator will then dispatch an alternate 18
and more expensive generator located where it will not cause transmission lines to overload. 19
The costs of re-dispatching higher-cost generation to address transmission congestion will 20
cause the LMP to be higher at those re-dispatched locations. The divergence in prices across a 21
market region directly reflect the cost of congestion (e.g. the incremental cost of the higher-22
priced generator that has to be dispatched due to the line limitation) as well as physical energy 23
losses on the transmission line between the two pricing nodes. 24
MISO has a comprehensive framework in place to annually assess potential regional 25
transmission upgrades through the MISO Transmission Expansion Planning (MTEP) process. The 26
primary goal of the MTEP process is to develop a comprehensive plan that meets the reliability, 27
policy and economic needs of the region, making the benefits of an economically efficient 28

Needs For and Alternatives To Chapter 5 –The Manitoba Hydro System, Interconnections and Export Markets
August 2013 Chapter 5 Page 44 of 61
energy market available to all MISO stakeholders. Projects that show they will cost-effectively 1
reduce local congestion and thereby improve market efficiency are identified and their costs 2
are allocated across all regional stakeholders. A centralized approach to transmission planning 3
helps ensure that cost-effective measures to reduce congestion costs are pursued, mitigating 4
the risk of structural, significant and prolonged price divergences emerging within a region. 5
6
MISO Market Marginal Generation 7
In an energy market, generation resources are offered into the market based on the units’ 8
variable operation cost. For any given time period, these offers are then stacked based on price 9
and the last, or most expensive, unit that is cleared or needed to meet load is called the 10
marginal unit. All dispatched units receive the market clearing price. 11
12
The largest component in a generator’s variable cost is fuel prices; therefore fuel costs have a 13
direct and notable effect on marginal prices. Because renewable resources (biomass excepted) 14
have no fuel costs their variable costs are very low. For this reason, renewable resources are at 15
the bottom of this dispatch “stack”, with fossil fuels being ordered above (i.e. dispatched after) 16
renewables. In a region such as MISO where fossil fuels dominate installed capacity (the top 17
80% of the generation “stack”), it can be expected that fossil fuels would almost always be 18
setting the marginal clearing price. 19
20
MISO publishes limited high-level aggregated data regarding marginal generation by fuel type 21
that can provide indicative data to understand what is occurring in MISO. In interpreting the 22
data, one must be aware that more than one type of unit can be the marginal or pricing setting 23
unit at any one time. Coal can frequently be the marginal fuel for a large portion of the market 24
footprint, but due to localized transmission limitations (congestion), natural gas or even wind 25
can be the marginal fuel for a portion of the market—creating two or more marginal generators 26
at one time. MISO has recently created the Dispatchable Intermittent Resource (DIR) category 27

Needs For and Alternatives To Chapter 5 –The Manitoba Hydro System, Interconnections and Export Markets
August 2013 Chapter 5 Page 45 of 61
for wind resources, which allows them to be partially dispatched (e.g. decrease in output only) 1
and thereby participate in setting locational prices. 2
3
Table 5.12 from the MISO Independent Market Monitor’s 2011 State of the Market report 4
provides recent complete historical data regarding the percentage of total hours each of the 5
various fuels are setting prices in MISO. 6
Table 5.12 MISO – HOURS VARIOUS FUELS ARE PRICE SETTING 7
8
The following are selected observations provided by the Independent Market Monitor on the 9
above results: 10
coal-fired resources set the energy price in 93% of (hourly) intervals, including virtually 11
all of the off-peak intervals. Frequently congestion causes both natural gas and coal to 12
be on the margin in the same interval in different areas 13
the correlation between natural gas and energy prices is not stronger because natural 14
gas-fired resources only set prices in 23% of the intervals; although, these periods tend 15
to be the highest load intervals. 16

Needs For and Alternatives To Chapter 5 –The Manitoba Hydro System, Interconnections and Export Markets
August 2013 Chapter 5 Page 46 of 61
At first glance, wind appears to have a significant and growing role in setting marginal prices. 1
However, as noted previously, this is a result of having multiple price setting generators at one 2
time and the wind generators setting the price only in small transmission-constrained areas of 3
the power grid. 4
5
Taking into account the limitations of the available data, the following conclusions can be made 6
regarding marginal generation in MISO: 7
due to the dominance of low cost coal resources in MISO, coal is on the margin many 8
hours of the year 9
natural gas does play an important role, primarily during peak load hours 10
looking out into the future, lower natural gas prices, the development of more natural 11
gas capacity and impending coal retirements would all have the effect of placing natural 12
gas on the margin increasingly over time. 13
14
MISO Resource and Emission Displacement 15
Manitoba Hydro’s exports and imports have implications on the dispatch of resources in the 16
MISO region. Generally, every additional MWh offered by Manitoba Hydro will result in the 17
displacement of a MWh of some type of fossil-fuel generation. Based on MISO Independent 18
Market Monitor’s 2011 annual report, coal was on the margin 93% of all hours in the year. 19
Natural gas was the only other significant marginal fuel, on the margin 23% of the time. As 20
previously noted, due to transmission constraints it is possible for more than one fuel to be on 21
the margin in any particular hour. 22
Coal generation typically emits on the order of 0.9 to 1.1 tonne of CO2/MWh, while natural gas 23
can range from about 0.3 to 0.8 tonnes of CO2/MWh depending on the technology and its 24
efficiency. Manitoba Hydro currently assumes that its exports displace (and its imports result in) 25
0.75 tonnes of CO2/MWh. This reflects a marginal generation mix of various fossil-fuels and 26
technologies. 27

Needs For and Alternatives To Chapter 5 –The Manitoba Hydro System, Interconnections and Export Markets
August 2013 Chapter 5 Page 47 of 61
Given that the marginal generation remains primarily coal (at an emission rate of about 1 tonne 1
of CO2/MWh), the 0.75 tonnes of CO2/MWh factor used by Manitoba Hydro is considered 2
conservative with respect to estimating the emissions displaced by exports. However, the 0.75 3
emission factor may underestimate the emissions associated with imports. While Manitoba 4
Hydro does not forecast the annual marginal export displacements, it expects that as coal units 5
retire and more natural gas generation is built, the marginal emission factor should decrease 6
over time. 7
8
5.4.2.5 Long-Term Resource-Planning Decisions vs. Energy Market Prices 9
Two time horizons are employed for energy resource decisions – the current or operating 10
horizon, and the long-term planning horizon. As indicated in Table 5.13, in the operating 11
horizon, capital costs are considered sunk costs and are not considered when generators 12
prepare their power market supply offers. Hence, when DA and RT prices are determined they 13
are driven by the variable operating cost of the thermal generators – and there is no certainty 14
of recovery of capital costs. This issue has lead to the formation of generation capacity markets 15
to provide an additional source of revenue by which generators can recover their capital or 16
fixed costs. In the MISO market, the full recovery of the costs of generation capacity are not 17
included within the energy market price, and are typically recovered from end-use customers 18
via other rate-base mechanisms in addition to MISO energy market charges. On the planning 19
horizon, beyond at least two years from the current operating horizon, future capital costs are 20
relevant as they have not yet been incurred. 21

Needs For and Alternatives To Chapter 5 –The Manitoba Hydro System, Interconnections and Export Markets
August 2013 Chapter 5 Page 48 of 61
Table 5.13 DECISION HORIZON COMPARISON 1
Operating Horizon Long Term Planning Horizon
Very short-term Beyond two years or more
Operation of plant will be determined by current system requirements
Expected capacity factor of plant is considered: Low capacity-factor requirements: often a gas
peaker (SCGT) with high operating but low capital costs is selected.
High capacity-factor requirements: now CCCTs considered (moderate capital and operating costs); previously base load coal plant (before CO2 consideration);
Capacity (also called fixed or capital) costs are sunk and are not considered. Embedded capital costs not in energy price and recovered via other rate-base mechanisms
Capacity costs are not yet incurred and are considered along with variable production costs
Thermal generators offer into market at variable cost of production. Decision is whether operation is required to meet load or not
Decision is what type of plant to build to meet projected future operating requirements
2
On the long-term planning horizon, capital or capacity costs have not yet been incurred or 3
committed so they cannot be considered a sunk cost. A customer considering the long-term 4
purchase of new supply from Manitoba Hydro as an alternative to a thermal resource will 5
consider both the variable operating costs (the energy market price), and the capital costs (the 6
value of capacity) of the thermal resource. Hence, Manitoba Hydro is able to price its long-term 7
sales of capacity and dependable energy to include both energy revenue based on future 8
expectations of energy prices, and additional capacity revenue based on the annual fixed costs 9
of the alternative thermal resource. 10

Needs For and Alternatives To Chapter 5 –The Manitoba Hydro System, Interconnections and Export Markets
August 2013 Chapter 5 Page 49 of 61
5.4.3 Canadian Export Markets 1
2
5.4.3.1 Ontario Market 3
IESO commenced operations in 2002 and is responsible for the safety and reliability of the 4
transmission grid as well as the operation of the wholesale electricity market in Ontario. 5
Manitoba Hydro has been an active participant in the IESO since its inception, and has 6
transacted with the former Ontario Hydro as far back as 1956. The IESO operates a real-time 7
market for energy and operating reserves, which is similar in design to the MISO real-time 8
market, although it uses uniform prices across the province of Ontario rather than locational 9
marginal prices. Ontario does not have a day-ahead market or a capacity market, although, 10
since 2005 the Ontario Power Authority (OPA) has acted as a central purchaser of generation 11
capacity under long-term contracts to meet Ontario’s needs. 12
13
The Ontario energy market is approximately one-quarter the size of the MISO market. The OPA 14
notes that the Ontario energy demand has been declining since 2005 and is not expected to 15
grow until at least 20202. The annual Ontario peak demand peaked at 26,000 MW in 2005 and 16
has since declined to 24,000 MW. Similarly, annual Ontario energy consumption peaked at 17
155,000 GWh/year in 2005 and has since declined to 145,000 GWh. Declines in the Ontario load 18
have been primarily driven by weaker economic conditions and higher electricity prices3. 19
20
When the IESO commenced market operations in 2002, the electricity supply situation in 21
Ontario was so tight that the market operator had to issue public appeals for load reductions on 22
hot summer days. In 2005, the Ontario government formed the OPA to prepare an integrated 23
system plan for conservation, generation and transmission, and to procure new supply, 24
transmission and DSM either by competition or by contract. 25
2 Forecast of Ontario Electricity Demand- Status and outlook of Ontario demand & next steps, Ontario Power
Authority, January 2013. 3 Ontario Electricity Demand- 2012 Annual Long-Term Outlook, Ontario Power Authority, Summer 2012.

Needs For and Alternatives To Chapter 5 –The Manitoba Hydro System, Interconnections and Export Markets
August 2013 Chapter 5 Page 50 of 61
Since 2005, OPA, acting under specific government supply-mix directives, has contracted for 1
5,100 MW of natural gas-fired generation and 2,900 MW of non-hydro renewable generation 2
(primarily wind power), brought 2,000 MW of existing nuclear power plants back into service, 3
and closed 4,300 MW of coal generation.4 4
5
By November 2014, the total wind and solar generation connected both to the transmission 6
and distribution networks in Ontario is expected to exceed 6,800 MW and provide 14,900 GWh 7
of annual energy5. Generation reserve margins in Ontario are currently in excess of 30%, much 8
higher than required for system reliability. By 2008, Ontario had become a significant net 9
exporter of electricity. However, government-mandated coal closures in Ontario and a return to 10
slow load growth has meant that Ontario’s production capability is expected to exceed demand 11
in 2020. 12
13
Manitoba Hydro currently has an effective export capability into Ontario of 200 MW. There are 14
two major barriers to a major long-term Manitoba Hydro power sale to Ontario: distance and 15
Ontario government policy. The Ontario interconnection is with Northwestern Ontario (that 16
portion of Ontario west of Wawa, Ontario), a large, sparsely populated area with a 17
proportionally small peak load of 750 MW. 18
19
Northwestern Ontario itself is interconnected to southern Ontario through two 230 kV 20
transmission lines (the East-West Tie) with a transfer capability of about 325 MW and running 21
north of Lake Superior from Thunder Bay to Wawa, Ontario. There is already ample generation 22
and a relatively small load within Northwestern Ontario and the Ontario interconnection/east-23
west tie-lines are insufficient for a major new sale into southern Ontario. 24
4 Outlook for Electricity Demand and Supply in Ontario, Ontario Power Authority, November 6, 2012.
5 18-Month Outlook Update From June 2013 to November 2014, Ontario IESO.
Needs For and Alternatives To Chapter 5 –The Manitoba Hydro System, Interconnections and Export Markets
August 2013 Chapter 5 Page 51 of 61
Therefore, a major power sale to Ontario would require a major new transmission line from 1
Manitoba to southern Ontario terminating near Toronto. The length of such a new transmission 2
line to southern Ontario would be about three times the distance to Minneapolis, adding to the 3
complexity of building transmission to the major population centre in southern Ontario. 4
5
In addition to the long distance to the southern Ontario load centre, recent Ontario 6
government policy has strongly favoured in-province generation. The Ontario Green Energy Act 7
of 2009 created strong incentives for renewable generation located within Ontario, including 8
guaranteed payment (a feed-in-tariff) of $115/MWh for wind power and from $347-$549/ 9
MWh for solar power6. 10
11
The contracts OPA has entered into for nuclear power, gas-fired generation, and renewables 12
under the Act have resulted in an energy surcharge, called the “Global Adjustment”, on top of 13
the Ontario electricity market price, which is actually greater than the cost of market energy 14
itself7. Manitoba Hydro is not eligible for revenue from the global adjustment since its 15
generation sources are located outside of Ontario; therefore, Manitoba Hydro is at a significant 16
competitive disadvantage in selling into Ontario. 17
18
5.4.3.2 Saskatchewan Bilateral Market 19
Saskatchewan, like Manitoba, does not operate an energy market within the province. 20
SaskPower is the principal electricity provider in Saskatchewan and has the exclusive right and 21
obligation to supply electricity to the province, except the cities of Swift Current and most of 22
the city of Saskatoon. SaskPower is owned by the government of Saskatchewan through its 23
holding company, the Crown Investments Corporation. Through its wholly-owned subsidiary, 24
6 Ontario FIT/mFIT PRICE SCHEDULE dated April 5, 2012.
7 Ontario Power Authority, Outlook for Electricity Demand and Supply in Ontario, November 6, 2012

Needs For and Alternatives To Chapter 5 –The Manitoba Hydro System, Interconnections and Export Markets
August 2013 Chapter 5 Page 52 of 61
NorthPoint Energy Solutions Inc. (NorthPoint), SaskPower engages in the purchase and sale of 1
energy in the North American wholesale market. 2
3
SaskPower’s peak load in January 2012 was 3,265 MW; at the end of 2011, SaskPower’s total 4
available generation capacity was 4,094 MW. SaskPower expects load growth over the next 5
decade of 2.9% per year in system energy and 2.5% per year in system peak, an increase from 6
the 2000-2010 period when system energy requirements increased 1.4% per year and system 7
peak load increased 1.1% per year8. 8
9
Over the last decade SaskPower has built or purchased the output of over 800 MW of natural 10
gas-fired generation and 200 MW of wind generation. Saskatchewan is Canada’s third-largest 11
producer of natural gas—producing 220 billion cubic feet of natural gas worth almost $500 12
million9 in 2011—and possesses a good wind resource. Manitoba Hydro and SaskPower are in 13
continuous contact to consider short- and long-term opportunities that could provide mutual 14
benefits. In 2011 the provinces signed a Memorandum of Understanding (MOU) which included 15
the intention to cooperate in areas of mutual benefit. In July 2013, SaskPower and Manitoba 16
Hydro developed a MOU to explore specific initiatives. Under the MOU the utilities are to 17
engage in sale discussions for existing and new hydro exports to both northern and southern 18
Saskatchewan—across all time-frames—for volumes ranging from 25 MW to 500 MW; 19
discussions are also to include the possibility of new transmission interconnections. 20
21
5.4.3.3 Alberta Market 22
The Alberta Electric System Operator (AESO) is the independent system operator in Alberta and 23
has overall responsibility for planning the transmission system. The AESO operates an energy-24
only real-time market as well as an ancillary services market comprised of regulating, spinning 25
8 SaskPower 2013 General Rate Application, dated June 2012.
9 Saskatchewan Resources Oil and Gas Fact Sheet, updated May 2012.

Needs For and Alternatives To Chapter 5 –The Manitoba Hydro System, Interconnections and Export Markets
August 2013 Chapter 5 Page 53 of 61
and supplemental reserves procured by the AESO and cleared through an on-line exchange. The 1
overall AESO market design is similar to the MISO real time market design; however, Alberta 2
lacks the day-ahead and capacity markets found in more advanced markets. The peak load in 3
Alberta is around 10,000 MW, making the Alberta market one-tenth the size of the MISO 4
market. 5
6
The Alberta market is not easily accessible to Manitoba Hydro—Alberta is not part of the 7
Eastern Interconnection and the existing transmission interconnection between Saskatchewan 8
and Alberta is only rated at 150 MW. Moreover, the existing transmission system through 9
Saskatchewan itself is not designed for large east-west flows and there is no long-term surplus 10
transmission within Saskatchewan available. Therefore, significant new sales into Alberta would 11
require a major new transmission line from Manitoba to Alberta. 12
13
As Calgary is almost 50% further from Winnipeg than Minneapolis, and the MISO market overall 14
is about 10 times the size of the Alberta market, from the Manitoba perspective transmission 15
investment is better directed towards Minnesota and Wisconsin rather than Alberta. Since 16
Alberta has substantial local reserves of natural gas and coal from which to provide its own 17
fossil fuel, thermal generators in Alberta should have a lower cost of supply than other regions 18
which may have to import thermal fuels. 19
20
5.5 Renewable Energy Credits 21
This section describes how additional value may be obtained from the positive environmental 22
attributes associated with renewable energy. As previously noted in Chapter 3 – Trends and 23
Factors Influencing North American Electricity Supply, many U.S. states have enacted 24
Renewable Portfolio Standards (RPS). The objectives vary from state to state and typically 25
extend beyond simply increasing renewable energy to also include implicit, and sometimes 26
explicit, objectives such as: promoting in-state jobs, providing rural economic development, 27
enhancing energy security, promoting emerging technologies, and reducing GHG and other air 28
Needs For and Alternatives To Chapter 5 –The Manitoba Hydro System, Interconnections and Export Markets
August 2013 Chapter 5 Page 54 of 61
emissions and environmental effects. As such, the list of eligible technologies also varies from 1
state to state and in many instances hydropower has been excluded. However, in recent years 2
there has been a trend towards a much more inclusive treatment of hydropower. Minnesota’s 3
RPS includes hydropower from stations that have a rated capacity less than 100 MW. Starting in 4
2016, Wisconsin’s RPS will include all hydropower facilities built after 2010. 5
6
A Renewable Energy Certificate (REC) can be issued for each MWh of renewable energy 7
produced. Renewable tracking systems are in place to track RECs from the generator to load to 8
demonstrate compliance with an RPS and to facilitate trading of renewable energy. A 9
renewable generator can sell RECs along with the energy as a bundled product, or sell the 10
energy and RECs separately as an unbundled product. The purchasers of the RECs can then use 11
their ownership of the certificates to demonstrate compliance with the state RPS. 12
13
In addition to meeting state RPS requirements, there are parallel voluntary markets for RECs. 14
Entities which place a high value on social responsibility and/or wish to demonstrate an 15
environmentally positive brand image can participate in voluntary REC markets. The voluntary 16
market for RECs is dominated by commercial and industrial customers. Residential customers 17
may also participate indirectly in the REC market through local-utility green-pricing programs. A 18
key requirement for REC sales in the voluntary market is that of third-party renewable energy 19
verification provided by Ecologo (Canadian transactions) and Green-e (U.S. transactions). 20
Ecologo and Green-e have specific criteria that a renewable generator must meet in order to 21
qualify for certification or certifiable status; Manitoba’s St. Leon and St. Joseph wind generators 22
are Ecologo certified and Green-e certifiable. At the present time, Manitoba Hydro is selling 23
RECs from the wind generation that it purchases, as well as some RECs from small hydro 24
resources that meet Minnesota’s 100 MW threshold. To date, the sale of unbundled RECs by 25
Manitoba Hydro has been an additional source of revenue well worth pursuing, but is not 26
expected to become a major source of revenue in the future. 27

Needs For and Alternatives To Chapter 5 –The Manitoba Hydro System, Interconnections and Export Markets
August 2013 Chapter 5 Page 55 of 61
RECs represent additional value above the market price of energy. As such Manitoba Hydro’s 1
long-term export price forecast does include the value of RECs. To the extent that RPS 2
requirements include Canadian hydropower as an eligible resource, they could provide an 3
additional incentive to buy electricity from Manitoba Hydro. The bundled RECs associated with 4
hydropower are a key component of several of the newer long-term firm export sales. The 5
value that Manitoba Hydro’s export customers may derive from these RECs is embedded in the 6
overall sale. While some of these bundled hydro RECs have value associated with RPS systems 7
our customers have other needs for these RECs, such as to disclose what sources are serving 8
their customers. 9
5.6 MISO Market Outlook 10
11
5.6.1 Need for New Generation Capacity 12
13
5.6.1.1 MISO’s Independent Analysis 14
MISO annually prepares a regional transmission expansion plan, called the MTEP. MISO is not 15
responsible for regional generation planning, (which is the responsibility of the individual 16
utilities with oversight by the state regulatory bodies), and MISO does not prepare long-term 17
electricity price forecasts. However, the transmission expansion plan must be consistent with 18
individual-utility resource plans and MISO makes an extensive effort to produce a plan that is 19
robust. The MTEP includes a regional load forecast and an indication of what new resources 20
may be required. While MTEP 2012 is focused on justifying specific transmission projects within 21
the MISO market footprint, it does provide some independent insights into future supply and 22
demand in the MISO market. 23
24
The value of generation capacity can represent up to 30% of the total value of a long-term sale 25
of capacity and dependable energy. At the present time, there is a surplus of generation 26

Needs For and Alternatives To Chapter 5 –The Manitoba Hydro System, Interconnections and Export Markets
August 2013 Chapter 5 Page 56 of 61
capacity in the MISO market footprint beyond that required to meet reliability/resource 1
adequacy requirements; therefore, capacity prices are depressed. This surplus results from the 2
rapid construction of natural gas resources during the mid-2000s coupled with the temporary 3
halt in growth of demand following the 2008 economic downturn. 4
5
MTEP 2012 states that “the MISO region needs to add between 4,484 and 11,290 MW of new 6
capacity, or 3,865 and 9,733 MW of demand reduction to meet minimum Planning Reserve 7
Margins in 202210”. This need for new capacity is driven by two primary factors: gradual 8
demand growth in the MISO market footprint, and pending generation retirements. New 9
capacity is expected to be required to meet the forecast MISO demand between 2015 and 10
2019, depending upon MISO’s planning assumptions11. 11
12
5.6.1.2 Gradual Demand Growth 13
As part of the MTEP planning process, MISO prepared a regional demand forecast for the 2013 14
to 2022 period based on an aggregation of load-serving entity/utility peak demand forecasts. 15
MTEP 2012 was initially based on a 2012 demand forecast of 97,408 MW with a compound 16
annual growth rate of 0.91%—subsequent work modified the forecast slightly to a compound 17
annual growth rate of 0.95%. MTEP 2012 also studied the effects of a high-demand growth rate 18
future using a compound annual growth rate of 1.62%12. 19
20
MISO’s base-case demand-growth assumption in the range of 0.91-0.95% is consistent with the 21
U.S. DOE’s EIA 2013 Annual Energy Outlook (AEO 2013). AEO 2013 notes that growth in 22
electricity use has slowed but is still expected to increase by 28% or 0.9% per year from 2011 to 23
204013. The gradual load-growth finding is also consistent with the Brattle independent market 24
10
MISO MTEP 2012, page 8. 11
MISO MTEP 2012, Table 6.2-1: 2013-2022 Forecasted Reserve Scenarios, page 70. 12
MISO MTEP 2012, page 72. 13
U.S. DOE EIA AEO 2013, page 71. http://www.eia.gov/forecasts/aeo/pdf/0383(2013).pdf

Needs For and Alternatives To Chapter 5 –The Manitoba Hydro System, Interconnections and Export Markets
August 2013 Chapter 5 Page 57 of 61
expert report— attached in Appendix 5.3 - Electricity Market Overview for Manitoba Hydro’s 1
Export Market in MISO. 2
3
Gradual load growth in the MISO market footprint is expected to create a demand for new 4
capacity resources. 5
6
5.6.1.3 Pending Generation Retirements 7
The vast majority of the 66,000 MW of coal-fired generation in the MISO market footprint is 8
produced by generators over 25 years old as shown in Figure 5.14. 9
Figure 5.14 AGE OF MISO GENERATION FLEET IN 2010 10
11
About 20% of the MISO coal-generation fleet is over 45 years old. Older coal units tend to be 12
smaller, less efficient and may have fewer existing emissions controls; these units are at risk of 13
having to be retired due to a combination of factors: 14

Needs For and Alternatives To Chapter 5 –The Manitoba Hydro System, Interconnections and Export Markets
August 2013 Chapter 5 Page 58 of 61
portion of key components including boiler, turbines and generators may require 1
extensive refurbishment or replacement due to the number of operating hours 2
U.S. EPA regulations may require significant upgrades of emissions controls. In particular 3
the Mercury & Air Toxics Standard (MATS), designed to reduce the mercury emissions 4
from coal-fired generating facilities by up to 90%, requires extensive new emissions-5
control equipment to be installed by 2015 or 2016; otherwise, the plant must be shut 6
down 7
the smaller size and lower efficiency of the units typically mean they are more expensive 8
to operate—refurbishment and implementation of emission controls generally cost 9
more per MW of capacity than for larger units. 10
11
As a result, a number of coal-generating plants are expected to close, particularly older and 12
smaller units. On a regional level, MISO has undertaken substantial analysis to estimate the 13
magnitude and impact of coal retirements within its territory, including a quarterly survey 14
which details how coal-generation unit operators expect to respond to EPA regulations. Figure 15
5.15 from the March 2013 MISO survey update, breaks down the projected impacts to the 16
MISO coal fleet.14 Based on the data, only 27% (18 GW) of MISO’s coal fleet does not require 17
any compliance measures to meet pending regulations. The majority of the fleet (36 GW) does 18
require some new environmental controls and would be expected to implement and continue 19
to operate these controls past 2016. Consequently, MISO estimates 6-12 GW of coal capacity 20
will retire by 2020. 21
22
The survey supports the expectation that the coal units likely to retire are older, smaller units 23
that currently have a low annual capacity factor, e.g. the most expensive and least-efficient coal 24
units in the fleet. According to MISO, the average size of a coal unit that is expected to continue 25
14
https://www.midwestiso.org/Library/Repository/Communication%20Material/Power%20Up/EPA%20Compliance%20Update.pdf
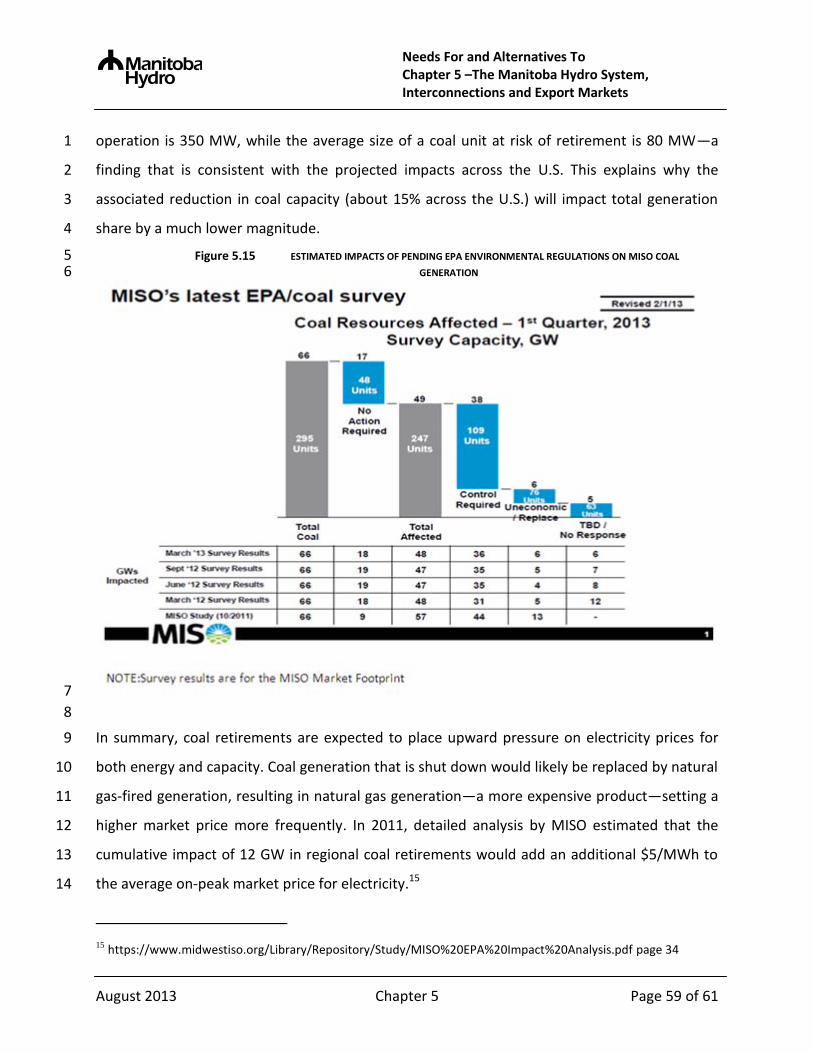
Needs For and Alternatives To Chapter 5 –The Manitoba Hydro System, Interconnections and Export Markets
August 2013 Chapter 5 Page 59 of 61
operation is 350 MW, while the average size of a coal unit at risk of retirement is 80 MW—a 1
finding that is consistent with the projected impacts across the U.S. This explains why the 2
associated reduction in coal capacity (about 15% across the U.S.) will impact total generation 3
share by a much lower magnitude. 4
Figure 5.15 ESTIMATED IMPACTS OF PENDING EPA ENVIRONMENTAL REGULATIONS ON MISO COAL 5 GENERATION 6
7
8
In summary, coal retirements are expected to place upward pressure on electricity prices for 9
both energy and capacity. Coal generation that is shut down would likely be replaced by natural 10
gas-fired generation, resulting in natural gas generation—a more expensive product—setting a 11
higher market price more frequently. In 2011, detailed analysis by MISO estimated that the 12
cumulative impact of 12 GW in regional coal retirements would add an additional $5/MWh to 13
the average on-peak market price for electricity.15 14
15 https://www.midwestiso.org/Library/Repository/Study/MISO%20EPA%20Impact%20Analysis.pdf page 34

Needs For and Alternatives To Chapter 5 –The Manitoba Hydro System, Interconnections and Export Markets
August 2013 Chapter 5 Page 60 of 61
Coal generation closures will also advance the need for new generation capacity. Retired coal 1
capacity will have to be replaced with other generation capacity to the extent necessary to 2
maintain generation reserve margins, requiring new capital investment. 3
4
5.6.2 Long-Term Nuclear Uncertainty 5
As discussed in Chapter 3 – Trends and Factors Influencing North American Electricity Supply 6
Section 3.5, the nuclear fleet in North America is aging, and existing nuclear plants may be 7
expected to retire after about 60 years of service (after 40 years of operation under initial 8
licence plus 20 years of licence extension). As shown in Table 5.14, the existing nuclear units 9
within the MISO market footprint were placed into service between 1970 and 1985, and will 10
reach 60 years of operation between 2030 and 2045. Some of these units may retire prior to 60 11
years of service particularly if major capital costs for refurbishment are required earlier. During 12
2013 four nuclear units across the U.S. with less than 40 years of service were permanently 13
shutdown. This included the Kewaunee Power Station in Carlton, Wisconsin. 14
15
New supply will likely be required to replace these units, which operate at very high capacity 16
factors, and are low carbon-emitting sources of supply. Such retirements of nuclear generation 17
are likely to benefit Manitoba Hydro exports in the long term. 18

Needs For and Alternatives To Chapter 5 –The Manitoba Hydro System, Interconnections and Export Markets
August 2013 Chapter 5 Page 61 of 61
Table 5.14 NUCLEAR POWER PLANTS IN THE MISO MARKET FOOTPRINT 1
Unit Name Capacity State In-Service
Year
Initial License Renewal Date
End of Extended License
Monticello 579 MW MN 1970 2010 2030
Prairie Island 1 551 MW MN 1974 2014 2034
Prairie Island 2 545 MW MN 1974 2014 2034
Kewaunee 556 MW WI 1973 2013 Closed
Point Beach 1 512 MW WI 1970 2010 2030
Point Beach 2 514 MW WI 1973 2013 2033
Clinton 1,065 MW IL 1984 2024 2044
Quad Cities 1 867 MW IL 1972 2012 2032
Quad Cities 2 869 MW IL 1972 2012 2032
Palisides 778 MW MI 1971 2011 2031
Duane Arnold 640 MW IA 1974 2014 2034
Fermi 1,122 MW OH 1985 2025 2045
Callaway 1,236 MW MO 1984 2024 2044
Cooper 830 MW NE 1974 2014 2034