Embed Size (px)
Citation preview

Table of Contents
2011 Commission Summary
2011 Opinions of the Property Tax Administrator
Residential Reports
Residential Assessment Actions
Residential Assessment Survey
R&O Statistics
Residential Correlation
Residential Real Property
I. Correlation
II. Analysis of Sales Verification
III. Measure of Central Tendency
IV. Analysis of Quality of Assessment
Commercial Reports Commercial Assessment Actions
Commercial Assessment Survey
R&O Statistics
Commercial Correlation
Commercial Real Property
I. Correlation
II. Analysis of Sales Verification
III. Measure of Central Tendency
IV. Analysis of Quality of Assessment
Agricultural or Special Valuation Reports Agricultural Assessment Actions
Agricultural Assessment Survey
Agricultural Base Analysis Statistics
Agricultural Random Inclusion Analysis Statistics
Agricultural Random Exclusion Analysis Statistics
Special Valuation Statistics
Special Valuation Methodology
Special Valuation Base Analysis Statistics
Special Valuation Random Inclusion Analysis Statistics
Special Valuation Random Exclusion Analysis Statistics
Agricultural or Special Valuation Correlation
Agricultural or Special Valuation Land
I. Correlation
II. Analysis of Sales Verification
III. Measure of Central Tendency
County 20 - Page 1

IV. Analysis of Quality of Assessment
County Reports
2011 County Abstract of Assessment for Real Property, Form 45
2011 County Agricultural Land Detail
2011 County Abstract of Assessment for Real Property Compared with the 2009
Certificate of Taxes Levied (CTL)
County Assessor’s Three Year Plan of Assessment
Assessment Survey – General Information
Certification
Maps
Market Areas
Registered Wells > 500 GPM
Geo Codes
Soil Classes
Valuation History Charts
County 20 - Page 2

Su
mm
ary
County 20 - Page 3

2011 Commission Summary
for Cuming County
Residential Real Property - Current
Number of Sales
Total Sales Price
Total Adj. Sales Price
Total Assessed Value
Avg. Adj. Sales Price Avg. Assessed Value
Median
Wgt. Mean
Mean
95% Median C.I
95% Wgt. Mean C.I
95% Mean C.I
92.86 to 96.63
92.63 to 96.41
95.88 to 102.72
% of Value of the Class of all Real Property Value in the County
% of Records Sold in the Study Period
% of Value Sold in the Study Period
Average Assessed Value of the Base
15.48
4.84
5.15
$66,391
Residential Real Property - History
Year
2008
2007
2009
Number of Sales LOV
199
197
Confidenence Interval - Current
94
95
Median
168 97 97
95
94
2010 149 97 97
149
99.30
94.65
94.52
$11,131,706
$11,134,506
$10,524,105
$74,728 $70,632
County 20 - Page 4
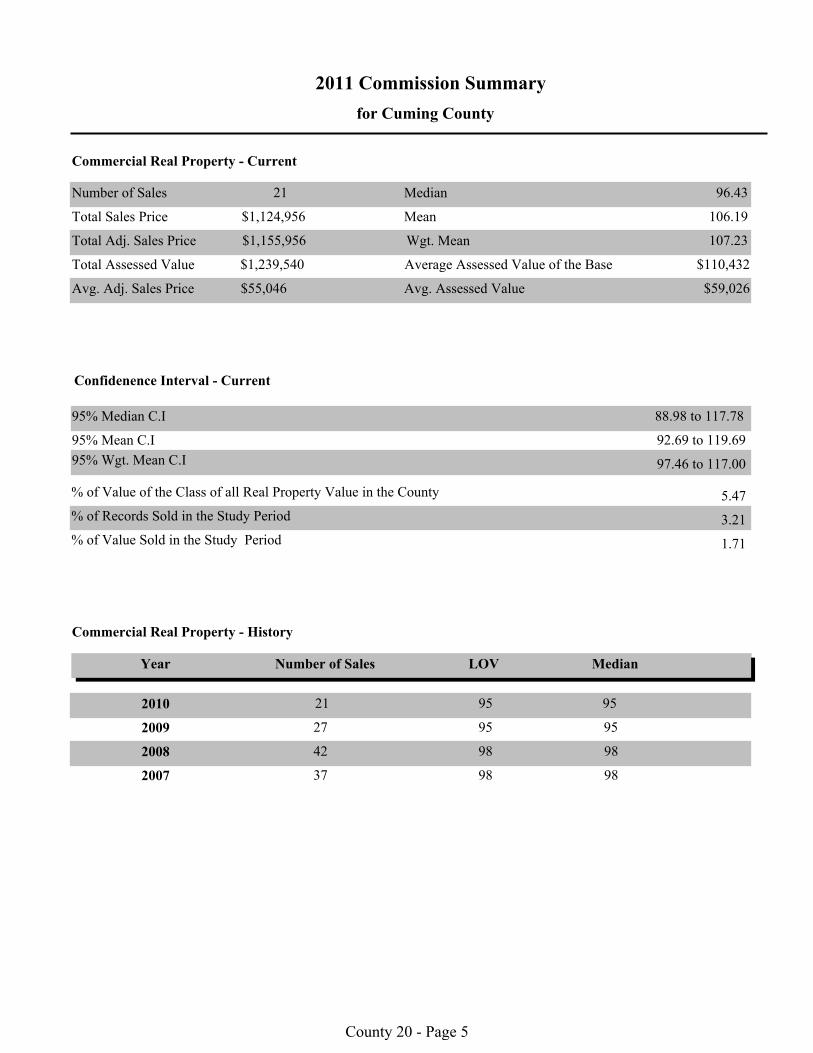
2011 Commission Summary
for Cuming County
Commercial Real Property - Current
Number of Sales
Total Sales Price
Total Adj. Sales Price
Total Assessed Value
Avg. Adj. Sales Price Avg. Assessed Value
Median
Wgt. Mean
Mean
95% Median C.I
95% Wgt. Mean C.I
95% Mean C.I
% of Value of the Class of all Real Property Value in the County
% of Records Sold in the Study Period
% of Value Sold in the Study Period
Average Assessed Value of the Base
Commercial Real Property - History
Year
2008
2007
Number of Sales LOV
21
88.98 to 117.78
97.46 to 117.00
92.69 to 119.69
5.47
3.21
1.71
$110,432
37
42
Confidenence Interval - Current
Median
98
98
2009 27 95 95
98
98
2010 95 95 21
$1,124,956
$1,155,956
$1,239,540
$55,046 $59,026
106.19
96.43
107.23
County 20 - Page 5

Op
inio
ns
County 20 - Page 6

2011 Opinions of the Property Tax Administrator
for Cuming County
My opinions and recommendations are stated as a conclusion based on all of the factors known to me
regarding the assessment practices and statistical analysis for this county. See, Neb. Rev. Stat. §77-5027
(R. S. Supp., 2005). While the median assessment sales ratio from the Qualified Statistical Reports for
each class of real property is considered, my opinion of the level of value for a class of real property may
be determined from other evidence contained within this Reports and Opinions of the Property Tax
Administrator. My opinion of quality of assessment for a class of real property may be influenced by the
assessment practices of the county assessor.
Residential Real
Property
Commercial Real
Property
Agricultural Land
Class Level of Value Quality of Assessment
96
72
95
The qualitative measures calculated in the base stat
sample best reflect the dispersion of the assessed values
within the population. The quality of assessment meets
generally accepted mass appraisal practices.
Meets generally accepted mass appraisal practices.
Meets generally accepted mass appraisal practices.
No recommendation.
No recommendation.
No recommendation.
Non-binding
recommendation
The qualitative measures calculated in the base stat
sample best reflect the dispersion of the assessed values
within the population. The quality of assessment meets
generally accepted mass appraisal practices.
72 No recommendation.Special Valuation of
Agricultural Land
**A level of value displayed as NEI, not enough information, represents a class of property with insufficient
information to determine a level of value.
Dated this 11th day of April, 2011.
Ruth A. Sorensen
Property Tax Administrator
County 20 - Page 7

Resid
entia
l Rep
orts
County 20 - Page 8

2011 Residential Assessment Actions for Cuming County
Bancroft:
In order to reach an appropriate level of value indicated by the median we had to
adjust the functional depreciation from 15% to 20% for older non remodeled homes and
adjusted the economic depreciation from 48% to 44%.
Developed new property records
Beemer:
Adjusted the functional depreciation from 15% to 20% for older non remodeled
homes
Developed new property records
Wisner:
Adjusted the functional depreciation form 15% to 20% for older non remodeled
homes
Developed new property records
West Point:
In order to reach an appropriate level of value indicated by the median we had to
adjust the economic depreciation from 30% to 28%.
Rural:
In order to reach an appropriate level of value indicated by the median we had to
adjust the site value from $3500 to $4,000, we adjusted the recreational ground, and kept
the WRP at $600 per acre. We are also still in the process of doing the property review
for the homes and buildings.
Increase Intensive use area and Lagoon value from $3,000 to $3500
Creek value decrease from $400 to $100
County 20 - Page 9
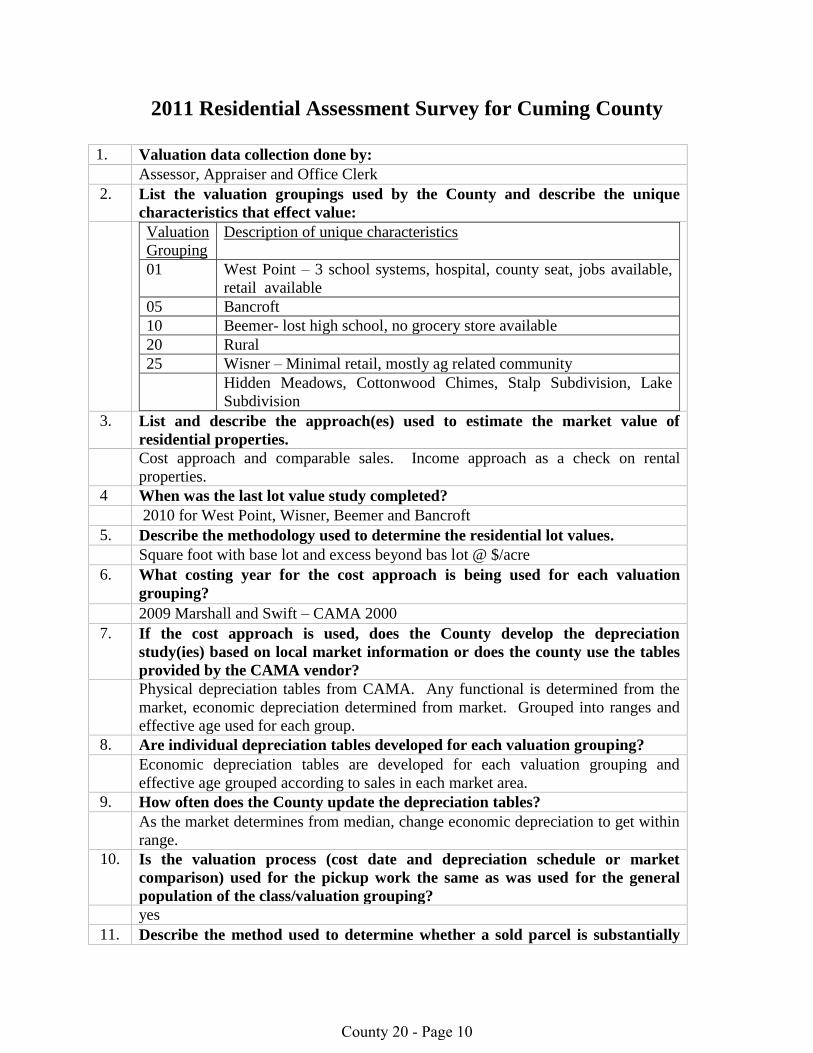
2011 Residential Assessment Survey for Cuming County
1. Valuation data collection done by:
Assessor, Appraiser and Office Clerk
2. List the valuation groupings used by the County and describe the unique
characteristics that effect value:
Valuation
Grouping
Description of unique characteristics
01 West Point – 3 school systems, hospital, county seat, jobs available,
retail available
05 Bancroft
10 Beemer- lost high school, no grocery store available
20 Rural
25 Wisner – Minimal retail, mostly ag related community
Hidden Meadows, Cottonwood Chimes, Stalp Subdivision, Lake
Subdivision
3. List and describe the approach(es) used to estimate the market value of
residential properties.
Cost approach and comparable sales. Income approach as a check on rental
properties.
4 When was the last lot value study completed?
2010 for West Point, Wisner, Beemer and Bancroft
5. Describe the methodology used to determine the residential lot values.
Square foot with base lot and excess beyond bas lot @ $/acre
6. What costing year for the cost approach is being used for each valuation
grouping?
2009 Marshall and Swift – CAMA 2000
7. If the cost approach is used, does the County develop the depreciation
study(ies) based on local market information or does the county use the tables
provided by the CAMA vendor?
Physical depreciation tables from CAMA. Any functional is determined from the
market, economic depreciation determined from market. Grouped into ranges and
effective age used for each group.
8. Are individual depreciation tables developed for each valuation grouping?
Economic depreciation tables are developed for each valuation grouping and
effective age grouped according to sales in each market area.
9. How often does the County update the depreciation tables?
As the market determines from median, change economic depreciation to get within
range.
10. Is the valuation process (cost date and depreciation schedule or market
comparison) used for the pickup work the same as was used for the general
population of the class/valuation grouping?
yes
11. Describe the method used to determine whether a sold parcel is substantially
County 20 - Page 10

changed.
Sales review, permits, pickup work and inspections
12. Please provide any documents related to the policies or procedures used for the
residential class of property.
The county has a notebook full of information concerning the policies and
procedures used to value the residential class of property.
County 20 - Page 11

Number of Sales :
Total Sales Price :
Total Adj. Sales Price :
Total Assessed Value :
Avg. Adj. Sales Price :
Avg. Assessed Value :
MEDIAN :
WGT. MEAN :
MEAN :
COD :
PRD :
COV :
STD :
Avg. Abs. Dev :
MAX Sales Ratio :
MIN Sales Ratio :
95% Median C.I. :
95% Wgt. Mean C.I. :
95% Mean C.I. :
149
11,131,706
11,134,506
10,524,105
74,728
70,632
14.18
105.06
21.48
21.33
13.42
222.25
43.98
92.86 to 96.63
92.63 to 96.41
95.88 to 102.72
Printed:3/28/2011 5:35:57PM
Qualified
PAD 2011 R&O Statistics (Using 2011 Values)Cuming20
Date Range: 7/1/2008 To 6/30/2010 Posted on: 2/17/2011
95
95
99
RESIDENTIAL
Page 1 of 2
Avg. Adj.
RANGE Assd. ValSale Price95%_Median_C.I.MAXMINPRDCODWGT.MEANMEANMEDIANCOUNT
Avg.DATE OF SALE *
_____Qrtrs_____
01-JUL-08 To 30-SEP-08 23 98.11 100.25 97.77 13.88 102.54 61.98 145.34 90.45 to 109.28 57,867 56,575
01-OCT-08 To 31-DEC-08 14 92.88 93.89 94.43 07.30 99.43 78.82 113.31 87.10 to 103.63 63,446 59,911
01-JAN-09 To 31-MAR-09 9 93.60 98.14 96.21 23.27 102.01 61.77 142.75 65.05 to 127.37 56,472 54,333
01-APR-09 To 30-JUN-09 18 93.99 108.98 95.61 20.87 113.98 83.00 222.25 90.67 to 119.57 92,458 88,403
01-JUL-09 To 30-SEP-09 20 93.20 96.85 93.06 13.18 104.07 73.58 129.96 86.18 to 106.46 72,308 67,288
01-OCT-09 To 31-DEC-09 18 96.75 100.07 97.17 08.01 102.98 86.28 139.71 92.85 to 101.83 79,031 76,791
01-JAN-10 To 31-MAR-10 17 90.86 91.67 92.15 13.30 99.48 43.98 142.06 82.62 to 102.18 78,706 72,530
01-APR-10 To 30-JUN-10 30 94.53 101.15 92.38 14.97 109.49 78.78 183.21 90.11 to 97.78 84,537 78,095
_____Study Yrs_____
01-JUL-08 To 30-JUN-09 64 94.42 101.02 96.10 16.12 105.12 61.77 222.25 92.03 to 102.73 68,620 65,941
01-JUL-09 To 30-JUN-10 85 94.65 98.01 93.49 12.74 104.83 43.98 183.21 91.23 to 96.87 79,327 74,163
_____Calendar Yrs_____
01-JAN-09 To 31-DEC-09 65 94.95 101.28 95.38 15.24 106.19 61.77 222.25 91.96 to 100.33 77,557 73,973
_____ALL_____ 149 94.65 99.30 94.52 14.18 105.06 43.98 222.25 92.86 to 96.63 74,728 70,632
Avg. Adj.
RANGE Assd. ValSale Price95%_Median_C.I.MAXMINPRDCODWGT.MEANMEANMEDIANCOUNT
Avg.VALUATION GROUPING
01 67 93.42 95.34 93.42 08.57 102.06 78.53 129.96 90.82 to 96.61 92,206 86,142
05 17 94.95 109.79 94.78 25.40 115.84 61.98 222.25 88.81 to 127.37 59,615 56,505
10 12 95.80 105.19 96.96 22.17 108.49 78.78 183.21 80.13 to 112.41 46,917 45,489
20 11 93.97 87.51 90.48 11.59 96.72 43.98 104.13 61.77 to 98.05 94,391 85,401
25 42 99.57 102.79 98.49 15.56 104.37 65.05 145.34 92.03 to 104.20 55,762 54,921
_____ALL_____ 149 94.65 99.30 94.52 14.18 105.06 43.98 222.25 92.86 to 96.63 74,728 70,632
Avg. Adj.
RANGE Assd. ValSale Price95%_Median_C.I.MAXMINPRDCODWGT.MEANMEANMEDIANCOUNT
Avg.PROPERTY TYPE *
01 144 94.33 98.88 94.36 13.87 104.79 43.98 222.25 92.18 to 96.61 76,483 72,172
06 0 00.00 00.00 00.00 00.00 00.00 00.00 00.00 N/A 0 0
07 5 104.00 111.47 108.52 17.70 102.72 78.82 142.75 N/A 24,200 26,262
_____ALL_____ 149 94.65 99.30 94.52 14.18 105.06 43.98 222.25 92.86 to 96.63 74,728 70,632
County 20 - Page 12

Number of Sales :
Total Sales Price :
Total Adj. Sales Price :
Total Assessed Value :
Avg. Adj. Sales Price :
Avg. Assessed Value :
MEDIAN :
WGT. MEAN :
MEAN :
COD :
PRD :
COV :
STD :
Avg. Abs. Dev :
MAX Sales Ratio :
MIN Sales Ratio :
95% Median C.I. :
95% Wgt. Mean C.I. :
95% Mean C.I. :
149
11,131,706
11,134,506
10,524,105
74,728
70,632
14.18
105.06
21.48
21.33
13.42
222.25
43.98
92.86 to 96.63
92.63 to 96.41
95.88 to 102.72
Printed:3/28/2011 5:35:57PM
Qualified
PAD 2011 R&O Statistics (Using 2011 Values)Cuming20
Date Range: 7/1/2008 To 6/30/2010 Posted on: 2/17/2011
95
95
99
RESIDENTIAL
Page 2 of 2
Avg. Adj.
RANGE Assd. ValSale Price95%_Median_C.I.MAXMINPRDCODWGT.MEANMEANMEDIANCOUNT
Avg.SALE PRICE *
______Low $______
1 TO 4999 1 222.25 222.25 222.25 00.00 100.00 222.25 222.25 N/A 4,000 8,890
5000 TO 9999 1 97.38 97.38 97.38 00.00 100.00 97.38 97.38 N/A 6,300 6,135
_____Total $_____
1 TO 9999 2 159.82 159.82 145.87 39.07 109.56 97.38 222.25 N/A 5,150 7,513
10000 TO 29999 28 109.46 113.46 110.79 23.22 102.41 43.98 183.21 94.99 to 129.96 19,283 21,363
30000 TO 59999 28 97.50 100.53 100.67 10.86 99.86 80.13 139.71 94.76 to 102.11 42,188 42,471
60000 TO 99999 57 93.42 93.95 93.71 10.54 100.26 61.77 122.98 90.11 to 98.05 76,722 71,895
100000 TO 149999 20 92.52 94.10 93.81 05.63 100.31 84.36 119.57 90.45 to 94.58 117,225 109,971
150000 TO 249999 9 86.70 88.24 88.26 04.16 99.98 82.27 96.87 83.00 to 91.23 180,375 159,202
250000 TO 499999 4 93.97 93.70 93.67 02.19 100.03 89.33 97.54 N/A 260,000 243,536
500000 + 0 00.00 00.00 00.00 00.00 00.00 00.00 00.00 N/A 0 0
_____ALL_____ 149 94.65 99.30 94.52 14.18 105.06 43.98 222.25 92.86 to 96.63 74,728 70,632
County 20 - Page 13

Resid
entia
l Co
rrelatio
n
County 20 - Page 14

2011 Correlation Section
for Cuming County
The residential statistical sample for Cuming County includes 149 qualified sales. The sample
is considered reliable for the measurement of the county. The relationship between the
median, weighted mean and mean are all within the acceptable level of 92-100 percent. The
coefficient of dispersion and the price related differential are also within the acceptable
ranges.
Cuming County has a sale verification questionnaire that is done by phone, mail or if possible
in person when verifying the sale. They visit with the seller, buyer or any other person
informed of the sale such as a broker or lawyer. The county compares the current information
on the property record card to insure that the parcel is correct and represented properly in the
sales file.
Cuming County has analyzed the residential class of property and made adjustments to
properties in the towns of Bancroft, Beemer, Wisner, West Point and the Rural. Specific
information of those adjustments can be found on the counties reported assessment actions.
Based on the consideration of all the available information, the level of value is determined to
be 95% of market value for the residential class of real property, and all subclasses are
determined to be valued within the acceptable range.
A. Residential Real Property
County 20 - Page 15
2011 Correlation Section
for Cuming County
B. Analysis of Sales Verification
Neb. Rev. Stat. 77-1327(2) provides that all sales are deemed to be arms length transactions
unless determined to be otherwise under professionally accepted mass appraisal techniques .
The county assessor is responsible for the qualification of the sales included in the state sales
file.
The Standard on Ratio Studies, International Association of Assessing Officials (2007),
indicates that excessive trimming (the arbitrary exclusion or adjustment of arms length
transactions) may indicate an attempt to inappropriately exclude arms length transactions to
create the appearance of a higher level of value and quality of assessment. The sales file, in a
case of excess trimming, will fail to properly represent the level of value and quality of
assessment of the population of real property.
The Division frequently reviews the procedures used by the county assessor to qualify sales to
ensure bias does not exist in judgments made. Arms length transactions should only be
excluded when they compromise the reliability of the resulting statistics. In cases where a
county assessor has disqualified sales without substantiation, the Division may include such
sales in the ratio study.
County 20 - Page 16

2011 Correlation Section
for Cuming County
C. Measures of Central Tendency
There are three measures of central tendency calculated by the Division: median ratio,
weighted mean ratio, and mean ratio. Since each measure of central tendency has strengths
and weaknesses, the use of any statistic for equalization should be reconciled with the other
two, as in an appraisal, based on the appropriateness in the use of the statistic for a defined
purpose, the quantity of the information from which it was drawn, and the reliability of the
data that was used in its calculation. An examination of the three measures can serve to
illustrate important trends in the data if the measures do not closely correlate to each other.
The IAAO considers the median ratio the most appropriate statistical measure for use in
determining level of value for direct equalization; the process of adjusting the values of
classes or subclasses of property in response to the determination of level of value at a point
above or below a particular range. Since the median ratio is considered neutral in relationship
to either assessed value or selling price, its use in adjusting the class or subclass of properties
will not change the relationships between assessed value and level of value already present
within the class or subclass of properties, thus rendering an adjustment neutral in its impact on
the relative tax burden to an individual property. Additionally, the median ratio is less
influenced by the presence of extreme ratios, commonly called outliers. One outlier in a small
sample size of sales can have controlling influence over the other measures of central
tendency. The median ratio limits the distortion potential of an outlier.
The weighted mean ratio is viewed by the IAAO as the most appropriate statistical measure
for indirect equalization. The weighted mean, because it is a value weighted ratio, best reflects
a comparison of the assessed and market value of property in the political subdivision. If the
distribution of aid to political subdivisions must relate to the market value available for
assessment in the political subdivision, the measurement of central tendency used to analyze
level of value should reflect the dollars of value available to be assessed. The weighted mean
ratio does that more than either of the other measures of central tendency.
If the weighted mean ratio, because of its dollar-weighting feature, is significantly different
from the median ratio, it may be an indication of other problems with assessment
proportionality. When this occurs, an evaluation of the county's assessment practices and
procedures is appropriate to discover remedies to the situation.
The mean ratio is used as a basis for other statistical calculations, such as the price related
differential and coefficient of variation. However, the mean ratio has limited application in
the analysis of level of value because it assumes a normal distribution of the data set around
the mean ratio with each ratio having the same impact on the calculation regardless of the
assessed value or the selling price.
County 20 - Page 17

2011 Correlation Section
for Cuming County
D. Analysis of Quality of Assessment
In analyzing the statistical data of assessment quality, there are two measures upon which
assessment officials will primarily rely: the Coefficient of Dispersion (COD), and the Price
Related Differential (PRD). Whether such statistics can be relied upon as meaningful for the
population depends on whether the sample is representative.
The COD is commonly referred to as the index of assessment inequality. It is used to measure
how closely the individual ratios are clustered around the median ratio and suggests the degree
of uniformity or inaccuracy resulting in the assessments. The COD is computed by dividing
the average deviation by the median ratio. For example, a COD of 20 means half of the ratios
are 20 percent above or below the median. The closer the ratios are grouped around the
median, the more equitable the assessment of property tends to be. Conversely, if the
dispersion is quite large, there is a large spread in the ratios typically indicating a large spread
around the median in the assessment of property, which results in an inequity in assessment
and taxes. There is no range of acceptability stated in the Nebraska statutes for the COD
measure. The International Association of Assessing Officers recommended ratio study
performance standards are as follows:
Single-family residences: a COD of 15 percent or less.
For newer and fairly homogeneous areas: a COD of 10 or less.
Income-producing property: a COD of 20 or less, or in larger urban jurisdictions, 15 or less.
Vacant land and other unimproved property, such as agricultural land: a COD of 20 or less.
Rural residential and seasonal properties: a COD of 20 or less.
Mass Appraisal of Real Property, International Association of Assessing Officers, (1999), p.
246.
In unusually homogeneous types of property low CODs can be anticipated; however, in all
other cases CODs less than 5 percent may be indicative of non-representative samples or the
selective reappraisal of sold parcels.
The PRD, also known as the index of regression, is a measurement of the relationship between
the ratios of high-value and low-value properties to determine if the value of property has any
influence on the assessment ratio. It is calculated by dividing the arithmetic mean ratio by the
weighted mean ratio. The PRD provides an indicator of the degree to which high-value
properties are over-assessed or under-assessed in relation to low-value properties. A PRD of
100 indicates there is no bias in the assessment of high-value properties in comparison to
low-value properties. A PRD greater than 100 indicates the assessments are regressive, which
means low-value properties tend to have a higher assessment ratio than high-value properties.
The result is the owner of a low-value property pays a greater amount of tax in relation to
value than the owner of a high-value property. Conversely, a PRD less than 100 indicates that
high-value properties are over assessed in relation to low-value properties.
There is no range of acceptability stated in the Nebraska statutes for the PRD measure. The
Standard of Ratio Studies, adopted by the International Association of Assessing Officers,
County 20 - Page 18

2011 Correlation Section
for Cuming County
July, 2007, recommends that the PRD should lie between 98 and 103. This range is centered
slightly above 100 to allow for a slightly upward measurement bias inherent in the PRD.
The PRD is calculated based on the selling price/assessed value in the sales file. This measure
can be misleading if the dollar value of the records in the sales file is not proportionate to the
dollar value of records in the population.
Mass Appraisal of Real Property, International Association of Assessing Officers, (1999), p.
247.
County 20 - Page 19

Co
mm
ercial R
epo
rts
County 20 - Page 20

2011 Commercial Assessment Actions for Cuming County
Bancroft:
New pricing and new comparable
Used 40 economic depreciation
Main street lot values adjusted to square foot pricing
Pickup work
New property record cards
Beemer:
New pricing and new comparable
Used 40 economic depreciation
Main street lot values adjusted to square foot pricing.
Pickup work
New property record cards
West Point:
Pickup work
Wisner:
Pickup work
Rural:
Pick up work
Commercial excess acres adjusted from $3,000 to $4,000
County 20 - Page 21

2011 Commercial Assessment Survey for Cuming County
1. Valuation data collection done by:
Assessor and Appraiser
2. List the valuation groupings used by the County and describe the unique
characteristics that effect value:
Valuation
Grouping
Description of unique characteristics
01 West Point
05 Bancroft
10 Beemer
20 Rural
25 Wisner
3. List and describe the approach(es) used to estimate the market value of
commercial properties.
Cost, income and comparable sales
4. When was the last lot value study completed?
2009 – 2010 West Point and Wisner, 2010-2011 Beemer and Bancroft
5. Describe the methodology used to determine the commercial lot values.
Square foot and acres, depending on what is the norm for that area.
6.
What costing year for the cost approach is being used for each valuation
grouping?
January 2008
7. If the cost approach is used, does the County develop the depreciation
study(ies) based on local market information or does the county use the tables
provided by the CAMA vendor?
Economic depreciation determined from market, depreciation determined from
market information, 60 years and 55 year life.
8. Are individual depreciation tables developed for each valuation grouping?
No, effective age and comparable sales and reconciliation for each property.
9. How often does the County update the depreciation tables?
Based on sales history and 6 year cycle.
10. Is the valuation process (cost date and depreciation schedule or market
comparison) used for the pickup work the same as was used for the general
population of the class/valuation grouping?
Yes
11. Describe the method used to determine whether a sold parcel is substantially
changed.
Sales review, permits, pick up work and inspections.
12. Please provide any documents related to the policies or procedures used for the
commercial class of property.
The county has a notebook full of information concerning the policies and
procedures used to value the residential class of property.
County 20 - Page 22

Number of Sales :
Total Sales Price :
Total Adj. Sales Price :
Total Assessed Value :
Avg. Adj. Sales Price :
Avg. Assessed Value :
MEDIAN :
WGT. MEAN :
MEAN :
COD :
PRD :
COV :
STD :
Avg. Abs. Dev :
MAX Sales Ratio :
MIN Sales Ratio :
95% Median C.I. :
95% Wgt. Mean C.I. :
95% Mean C.I. :
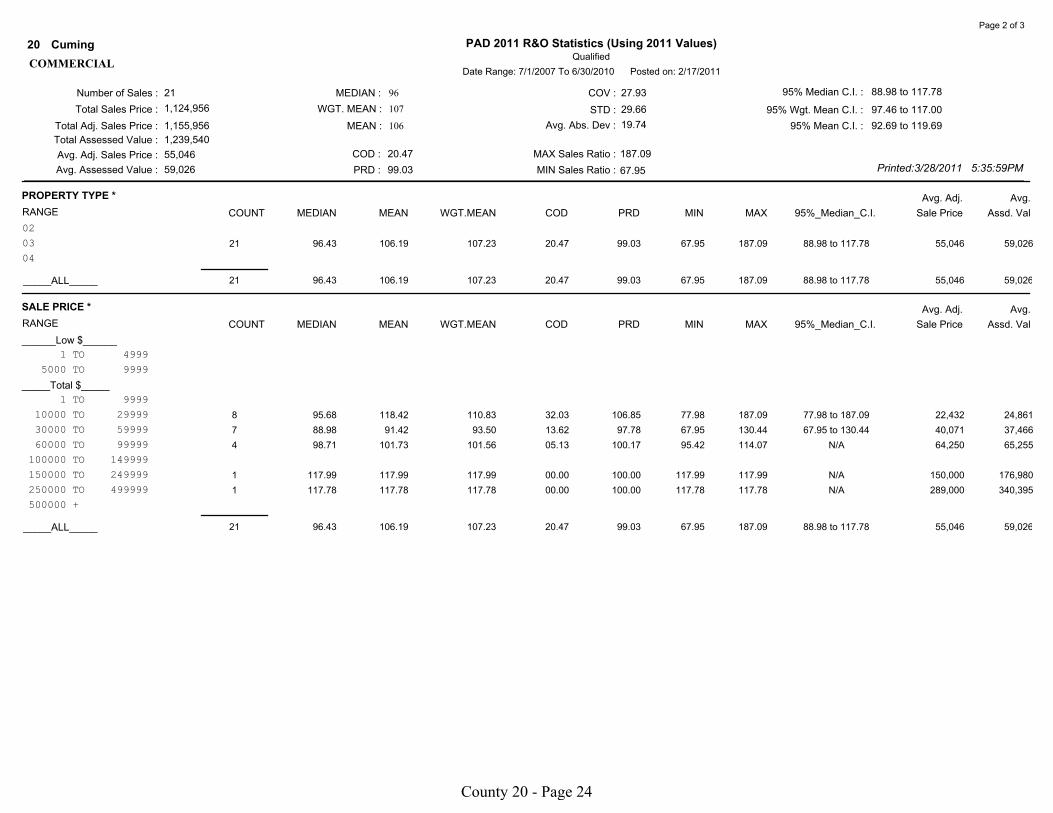
21
1,124,956
1,155,956
1,239,540
55,046
59,026
20.47
99.03
27.93
29.66
19.74
187.09
67.95
88.98 to 117.78
97.46 to 117.00
92.69 to 119.69
Printed:3/28/2011 5:35:59PM
Qualified
PAD 2011 R&O Statistics (Using 2011 Values)Cuming20
Date Range: 7/1/2007 To 6/30/2010 Posted on: 2/17/2011
96
107
106
COMMERCIAL
Page 1 of 3
Avg. Adj.
RANGE Assd. ValSale Price95%_Median_C.I.MAXMINPRDCODWGT.MEANMEANMEDIANCOUNT
Avg.DATE OF SALE *
_____Qrtrs_____
01-JUL-07 To 30-SEP-07 3 97.92 116.41 109.43 19.89 106.38 96.43 154.88 N/A 32,333 35,383
01-OCT-07 To 31-DEC-07 1 96.45 96.45 96.45 00.00 100.00 96.45 96.45 N/A 30,000 28,935
01-JAN-08 To 31-MAR-08 2 89.93 89.93 92.94 06.12 96.76 84.43 95.42 N/A 38,750 36,013
01-APR-08 To 30-JUN-08 1 81.34 81.34 81.34 00.00 100.00 81.34 81.34 N/A 46,000 37,415
01-JUL-08 To 30-SEP-08 1 91.00 91.00 91.00 00.00 100.00 91.00 91.00 N/A 30,000 27,300
01-OCT-08 To 31-DEC-08 1 117.99 117.99 117.99 00.00 100.00 117.99 117.99 N/A 150,000 176,980
01-JAN-09 To 31-MAR-09 2 137.84 137.84 119.13 14.55 115.71 117.78 157.90 N/A 149,500 178,093
01-APR-09 To 30-JUN-09 2 91.01 91.01 94.56 25.34 96.25 67.95 114.07 N/A 52,000 49,170
01-JUL-09 To 30-SEP-09 1 93.75 93.75 93.75 00.00 100.00 93.75 93.75 N/A 20,000 18,750
01-OCT-09 To 31-DEC-09 3 88.98 101.07 106.29 17.48 95.09 83.78 130.44 N/A 43,500 46,237
01-JAN-10 To 31-MAR-10 2 97.21 97.21 98.40 02.36 98.79 94.92 99.49 N/A 49,228 48,443
01-APR-10 To 30-JUN-10 2 132.54 132.54 111.38 41.16 119.00 77.98 187.09 N/A 36,750 40,933
_____Study Yrs_____
01-JUL-07 To 30-JUN-08 7 96.43 100.98 97.61 13.05 103.45 81.34 154.88 81.34 to 154.88 35,786 34,932
01-JUL-08 To 30-JUN-09 6 115.93 111.12 113.00 17.35 98.34 67.95 157.90 67.95 to 157.90 97,167 109,801
01-JUL-09 To 30-JUN-10 8 94.34 107.05 104.27 22.19 102.67 77.98 187.09 77.98 to 187.09 40,307 42,026
_____Calendar Yrs_____
01-JAN-08 To 31-DEC-08 5 91.00 94.04 103.37 10.47 90.97 81.34 117.99 N/A 60,700 62,744
01-JAN-09 To 31-DEC-09 8 103.91 106.83 110.57 22.35 96.62 67.95 157.90 67.95 to 157.90 69,188 76,498
_____ALL_____ 21 96.43 106.19 107.23 20.47 99.03 67.95 187.09 88.98 to 117.78 55,046 59,026
Avg. Adj.
RANGE Assd. ValSale Price95%_Median_C.I.MAXMINPRDCODWGT.MEANMEANMEDIANCOUNT
Avg.VALUATION GROUPING
01 12 95.94 109.05 111.21 26.12 98.06 67.95 187.09 83.78 to 130.44 66,625 74,095
05 4 104.50 115.16 110.39 19.93 104.32 93.75 157.90 N/A 28,364 31,311
10 1 99.49 99.49 99.49 00.00 100.00 99.49 99.49 N/A 75,000 74,620
20 1 88.98 88.98 88.98 00.00 100.00 88.98 88.98 N/A 40,000 35,590
25 3 96.43 90.78 89.80 06.90 101.09 77.98 97.92 N/A 42,667 38,315
_____ALL_____ 21 96.43 106.19 107.23 20.47 99.03 67.95 187.09 88.98 to 117.78 55,046 59,026
County 20 - Page 23
Number of Sales :
Total Sales Price :
Total Adj. Sales Price :
Total Assessed Value :
Avg. Adj. Sales Price :
Avg. Assessed Value :
MEDIAN :
WGT. MEAN :
MEAN :
COD :
PRD :
COV :
STD :
Avg. Abs. Dev :
MAX Sales Ratio :
MIN Sales Ratio :
95% Median C.I. :
95% Wgt. Mean C.I. :
95% Mean C.I. :
21
1,124,956
1,155,956
1,239,540
55,046
59,026
20.47
99.03
27.93
29.66
19.74
187.09
67.95
88.98 to 117.78
97.46 to 117.00
92.69 to 119.69
Printed:3/28/2011 5:35:59PM
Qualified
PAD 2011 R&O Statistics (Using 2011 Values)Cuming20
Date Range: 7/1/2007 To 6/30/2010 Posted on: 2/17/2011
96
107
106
COMMERCIAL
Page 2 of 3
Avg. Adj.
RANGE Assd. ValSale Price95%_Median_C.I.MAXMINPRDCODWGT.MEANMEANMEDIANCOUNT
Avg.PROPERTY TYPE *
02 0 00.00 00.00 00.00 00.00 00.00 00.00 00.00 N/A 0 0
03 21 96.43 106.19 107.23 20.47 99.03 67.95 187.09 88.98 to 117.78 55,046 59,026
04 0 00.00 00.00 00.00 00.00 00.00 00.00 00.00 N/A 0 0
_____ALL_____ 21 96.43 106.19 107.23 20.47 99.03 67.95 187.09 88.98 to 117.78 55,046 59,026
Avg. Adj.
RANGE Assd. ValSale Price95%_Median_C.I.MAXMINPRDCODWGT.MEANMEANMEDIANCOUNT
Avg.SALE PRICE *
______Low $______
1 TO 4999 0 00.00 00.00 00.00 00.00 00.00 00.00 00.00 N/A 0 0
5000 TO 9999 0 00.00 00.00 00.00 00.00 00.00 00.00 00.00 N/A 0 0
_____Total $_____
1 TO 9999 0 00.00 00.00 00.00 00.00 00.00 00.00 00.00 N/A 0 0
10000 TO 29999 8 95.68 118.42 110.83 32.03 106.85 77.98 187.09 77.98 to 187.09 22,432 24,861
30000 TO 59999 7 88.98 91.42 93.50 13.62 97.78 67.95 130.44 67.95 to 130.44 40,071 37,466
60000 TO 99999 4 98.71 101.73 101.56 05.13 100.17 95.42 114.07 N/A 64,250 65,255
100000 TO 149999 0 00.00 00.00 00.00 00.00 00.00 00.00 00.00 N/A 0 0
150000 TO 249999 1 117.99 117.99 117.99 00.00 100.00 117.99 117.99 N/A 150,000 176,980
250000 TO 499999 1 117.78 117.78 117.78 00.00 100.00 117.78 117.78 N/A 289,000 340,395
500000 + 0 00.00 00.00 00.00 00.00 00.00 00.00 00.00 N/A 0 0
_____ALL_____ 21 96.43 106.19 107.23 20.47 99.03 67.95 187.09 88.98 to 117.78 55,046 59,026
County 20 - Page 24
Number of Sales :
Total Sales Price :
Total Adj. Sales Price :
Total Assessed Value :
Avg. Adj. Sales Price :
Avg. Assessed Value :
MEDIAN :
WGT. MEAN :
MEAN :
COD :
PRD :
COV :
STD :
Avg. Abs. Dev :
MAX Sales Ratio :
MIN Sales Ratio :
95% Median C.I. :
95% Wgt. Mean C.I. :
95% Mean C.I. :
21
1,124,956
1,155,956
1,239,540
55,046
59,026
20.47
99.03
27.93
29.66
19.74
187.09
67.95
88.98 to 117.78
97.46 to 117.00
92.69 to 119.69
Printed:3/28/2011 5:35:59PM
Qualified
PAD 2011 R&O Statistics (Using 2011 Values)Cuming20
Date Range: 7/1/2007 To 6/30/2010 Posted on: 2/17/2011
96
107
106
COMMERCIAL
Page 3 of 3
Avg. Adj.
RANGE Assd. ValSale Price95%_Median_C.I.MAXMINPRDCODWGT.MEANMEANMEDIANCOUNT
Avg.OCCUPANCY CODE
Blank 4 119.33 123.43 109.52 39.86 112.70 67.95 187.09 N/A 29,625 32,445
300 2 98.71 98.71 98.78 00.80 99.93 97.92 99.49 N/A 68,500 67,665
303 1 117.78 117.78 117.78 00.00 100.00 117.78 117.78 N/A 289,000 340,395
326 1 84.43 84.43 84.43 00.00 100.00 84.43 84.43 N/A 17,500 14,775
344 2 95.68 95.68 95.51 00.79 100.18 94.92 96.43 N/A 19,228 18,365
350 1 117.99 117.99 117.99 00.00 100.00 117.99 117.99 N/A 150,000 176,980
353 2 95.10 95.10 95.37 01.42 99.72 93.75 96.45 N/A 25,000 23,843
386 1 157.90 157.90 157.90 00.00 100.00 157.90 157.90 N/A 10,000 15,790
407 1 130.44 130.44 130.44 00.00 100.00 130.44 130.44 N/A 58,500 76,310
471 2 92.20 92.20 92.84 03.49 99.31 88.98 95.42 N/A 50,000 46,420
528 2 97.71 97.71 99.86 16.75 97.85 81.34 114.07 N/A 53,000 52,928
529 1 77.98 77.98 77.98 00.00 100.00 77.98 77.98 N/A 51,000 39,770
555 1 91.00 91.00 91.00 00.00 100.00 91.00 91.00 N/A 30,000 27,300
_____ALL_____ 21 96.43 106.19 107.23 20.47 99.03 67.95 187.09 88.98 to 117.78 55,046 59,026
County 20 - Page 25

Co
mm
ercial C
orrela
tion
County 20 - Page 26
2011 Correlation Section
for Cuming County
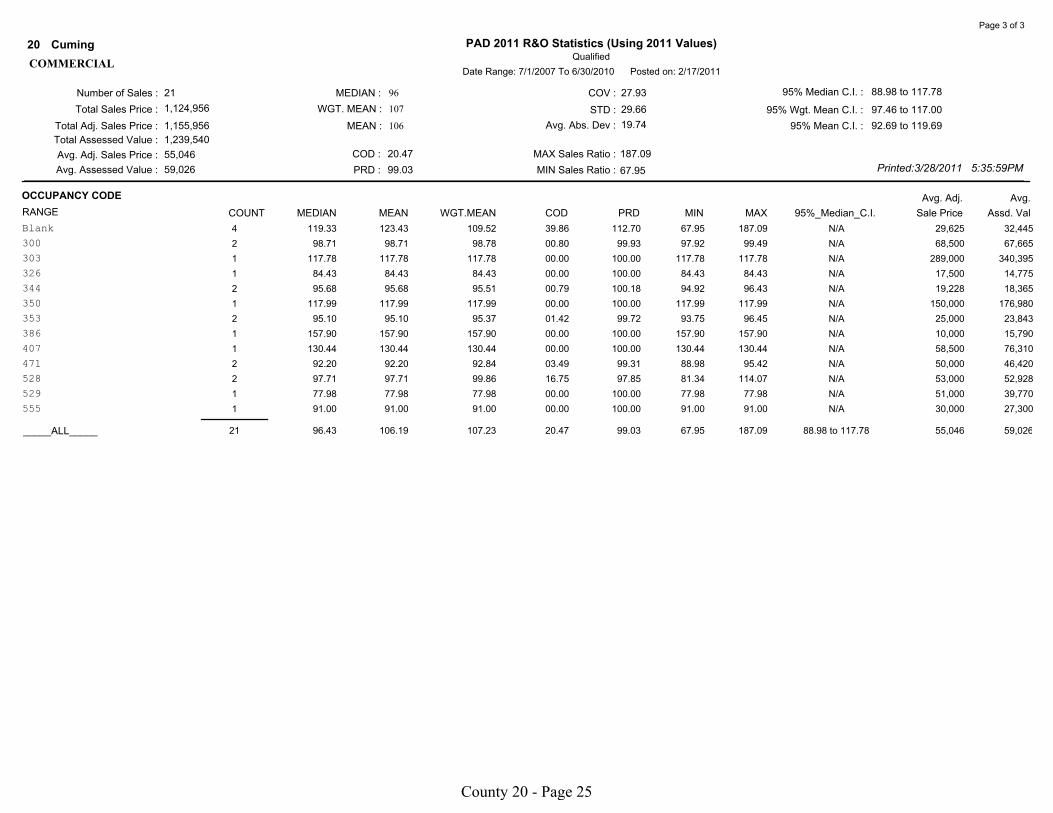
The commercial statistical sample for Cuming County includes 21 qualified sales. Of this
sample the median measure is the only measure within the acceptable range. The coefficient
of dispersion and the price related differential are within the acceptable ranges. The towns of
Bancroft and Beemer have been updated. 12 of the sales are in the city of West Point
The sales verification is primarily handled by the personal knowledge of the assessor and staff .
If there is a concern in the validity of a sale, the county will contact persons involved in the
transaction including the realtor, buyer or seller.
The county reported that the commercial class was updated with new costing in the towns of
Bancroft and Beemer. The pickup work was added in the remainder of the county.
Based on the consideration of all the available information, the level of value is determined to
be 96% of market value for the commercial class of real property.
A. Commerical Real Property
County 20 - Page 27

2011 Correlation Section
for Cuming County
B. Analysis of Sales Verification
Neb. Rev. Stat. 77-1327(2) provides that all sales are deemed to be arms length transactions
unless determined to be otherwise under professionally accepted mass appraisal techniques .
The county assessor is responsible for the qualification of the sales included in the state sales
file.
The Standard on Ratio Studies, International Association of Assessing Officials (2007),
indicates that excessive trimming (the arbitrary exclusion or adjustment of arms length
transactions) may indicate an attempt to inappropriately exclude arms length transactions to
create the appearance of a higher level of value and quality of assessment. The sales file, in a
case of excess trimming, will fail to properly represent the level of value and quality of
assessment of the population of real property.
The Division frequently reviews the procedures used by the county assessor to qualify sales to
ensure bias does not exist in judgments made. Arms length transactions should only be
excluded when they compromise the reliability of the resulting statistics. In cases where a
county assessor has disqualified sales without substantiation, the Division may include such
sales in the ratio study.
County 20 - Page 28
2011 Correlation Section
for Cuming County
C. Measures of Central Tendency
There are three measures of central tendency calculated by the Division: median ratio,
weighted mean ratio, and mean ratio. Since each measure of central tendency has strengths
and weaknesses, the use of any statistic for equalization should be reconciled with the other
two, as in an appraisal, based on the appropriateness in the use of the statistic for a defined
purpose, the quantity of the information from which it was drawn, and the reliability of the
data that was used in its calculation. An examination of the three measures can serve to
illustrate important trends in the data if the measures do not closely correlate to each other.
The IAAO considers the median ratio the most appropriate statistical measure for use in
determining level of value for direct equalization; the process of adjusting the values of
classes or subclasses of property in response to the determination of level of value at a point
above or below a particular range. Since the median ratio is considered neutral in relationship
to either assessed value or selling price, its use in adjusting the class or subclass of properties
will not change the relationships between assessed value and level of value already present
within the class or subclass of properties, thus rendering an adjustment neutral in its impact on
the relative tax burden to an individual property. Additionally, the median ratio is less
influenced by the presence of extreme ratios, commonly called outliers. One outlier in a small
sample size of sales can have controlling influence over the other measures of central
tendency. The median ratio limits the distortion potential of an outlier.
The weighted mean ratio is viewed by the IAAO as the most appropriate statistical measure
for indirect equalization. The weighted mean, because it is a value weighted ratio, best reflects
a comparison of the assessed and market value of property in the political subdivision. If the
distribution of aid to political subdivisions must relate to the market value available for
assessment in the political subdivision, the measurement of central tendency used to analyze
level of value should reflect the dollars of value available to be assessed. The weighted mean
ratio does that more than either of the other measures of central tendency.
If the weighted mean ratio, because of its dollar-weighting feature, is significantly different
from the median ratio, it may be an indication of other problems with assessment
proportionality. When this occurs, an evaluation of the county's assessment practices and
procedures is appropriate to discover remedies to the situation.
The mean ratio is used as a basis for other statistical calculations, such as the price related
differential and coefficient of variation. However, the mean ratio has limited application in
the analysis of level of value because it assumes a normal distribution of the data set around
the mean ratio with each ratio having the same impact on the calculation regardless of the
assessed value or the selling price.
County 20 - Page 29

2011 Correlation Section
for Cuming County
D. Analysis of Quality of Assessment
In analyzing the statistical data of assessment quality, there are two measures upon which
assessment officials will primarily rely: the Coefficient of Dispersion (COD), and the Price
Related Differential (PRD). Whether such statistics can be relied upon as meaningful for the
population depends on whether the sample is representative.
The COD is commonly referred to as the index of assessment inequality. It is used to measure
how closely the individual ratios are clustered around the median ratio and suggests the degree
of uniformity or inaccuracy resulting in the assessments. The COD is computed by dividing
the average deviation by the median ratio. For example, a COD of 20 means half of the ratios
are 20 percent above or below the median. The closer the ratios are grouped around the
median, the more equitable the assessment of property tends to be. Conversely, if the
dispersion is quite large, there is a large spread in the ratios typically indicating a large spread
around the median in the assessment of property, which results in an inequity in assessment
and taxes. There is no range of acceptability stated in the Nebraska statutes for the COD
measure. The International Association of Assessing Officers recommended ratio study
performance standards are as follows:
Single-family residences: a COD of 15 percent or less.
For newer and fairly homogeneous areas: a COD of 10 or less.
Income-producing property: a COD of 20 or less, or in larger urban jurisdictions, 15 or less.
Vacant land and other unimproved property, such as agricultural land: a COD of 20 or less.
Rural residential and seasonal properties: a COD of 20 or less.
Mass Appraisal of Real Property, International Association of Assessing Officers, (1999), p.
246.
In unusually homogeneous types of property low CODs can be anticipated; however, in all
other cases CODs less than 5 percent may be indicative of non-representative samples or the
selective reappraisal of sold parcels.
The PRD, also known as the index of regression, is a measurement of the relationship between
the ratios of high-value and low-value properties to determine if the value of property has any
influence on the assessment ratio. It is calculated by dividing the arithmetic mean ratio by the
weighted mean ratio. The PRD provides an indicator of the degree to which high-value
properties are over-assessed or under-assessed in relation to low-value properties. A PRD of
100 indicates there is no bias in the assessment of high-value properties in comparison to
low-value properties. A PRD greater than 100 indicates the assessments are regressive, which
means low-value properties tend to have a higher assessment ratio than high-value properties.
The result is the owner of a low-value property pays a greater amount of tax in relation to
value than the owner of a high-value property. Conversely, a PRD less than 100 indicates that
high-value properties are over assessed in relation to low-value properties.
There is no range of acceptability stated in the Nebraska statutes for the PRD measure. The
Standard of Ratio Studies, adopted by the International Association of Assessing Officers,
County 20 - Page 30

2011 Correlation Section
for Cuming County
July, 2007, recommends that the PRD should lie between 98 and 103. This range is centered
slightly above 100 to allow for a slightly upward measurement bias inherent in the PRD.
The PRD is calculated based on the selling price/assessed value in the sales file. This measure
can be misleading if the dollar value of the records in the sales file is not proportionate to the
dollar value of records in the population.
Mass Appraisal of Real Property, International Association of Assessing Officers, (1999), p.
247.
County 20 - Page 31

Ag
ricultu
ral R
eports
County 20 - Page 32
2011 Agricultural Assessment Actions for Cuming County
The state had asked us to try and develop market areas that would not fluctuate so much, we
reviewed many factors including but not limited to, school districts, rainfall patterns, river
influences, and previous sales ratios to determine a long term plan of attack on how to divide our
county into market areas. We still have several townships that are transition areas between
communities. The biggest transition area is showing up in the North part of Bismark Township,
West part of Elkhorn Township and either side of the river in Beemer Township. We feel this
transition area is due to community association.
The results are:
Bismark from area 1 to 2
St. Charles from 1 to 2
Monterey from 1 to 2
Sherman South from 2 to 4
Logan from 2 to 4 (this is the only one we would have adjusted –the other adjustments were made
to develop a long term market area)
Implemented a class for wet crop ground – per sales review (29% adj) this is only used in special
cases where warranted.
Reviewed soil types=adjusted some sandy soil values (all inavale soils)
Reviewing the Elkhorn River: Developed a flood code for area damaged by the flood, for crop,
irrigated crop, grass, tree cover
Defining waste area as River, Creek/Pond, Lake, in the past Cuming County also had tree cover
coded under waste. We are in the process of defining tree cover as tree cover 1 and tree cover 2
GIS land use implemented in Logan, Grant, Cleveland and Blaine Townships.
Increased value on Intensive use and Lagoons from $3000 to $3500
Creek value reduced from $400 to $100
County 20 - Page 33
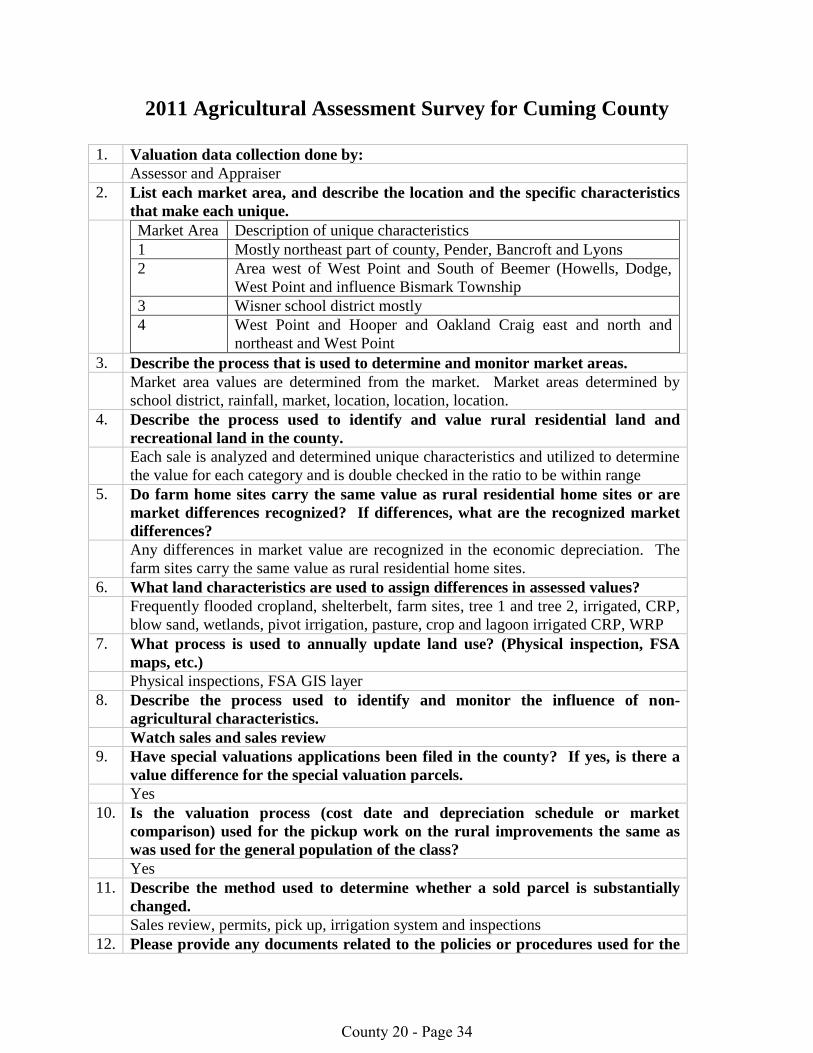
2011 Agricultural Assessment Survey for Cuming County
1. Valuation data collection done by:
Assessor and Appraiser
2. List each market area, and describe the location and the specific characteristics
that make each unique.
Market Area Description of unique characteristics
1 Mostly northeast part of county, Pender, Bancroft and Lyons
2 Area west of West Point and South of Beemer (Howells, Dodge,
West Point and influence Bismark Township
3 Wisner school district mostly
4 West Point and Hooper and Oakland Craig east and north and
northeast and West Point
3. Describe the process that is used to determine and monitor market areas.
Market area values are determined from the market. Market areas determined by
school district, rainfall, market, location, location, location.
4. Describe the process used to identify and value rural residential land and
recreational land in the county.
Each sale is analyzed and determined unique characteristics and utilized to determine
the value for each category and is double checked in the ratio to be within range
5. Do farm home sites carry the same value as rural residential home sites or are
market differences recognized? If differences, what are the recognized market
differences?
Any differences in market value are recognized in the economic depreciation. The
farm sites carry the same value as rural residential home sites.
6. What land characteristics are used to assign differences in assessed values?
Frequently flooded cropland, shelterbelt, farm sites, tree 1 and tree 2, irrigated, CRP,
blow sand, wetlands, pivot irrigation, pasture, crop and lagoon irrigated CRP, WRP
7. What process is used to annually update land use? (Physical inspection, FSA
maps, etc.)
Physical inspections, FSA GIS layer
8. Describe the process used to identify and monitor the influence of non-
agricultural characteristics.
Watch sales and sales review
9. Have special valuations applications been filed in the county? If yes, is there a
value difference for the special valuation parcels.
Yes
10. Is the valuation process (cost date and depreciation schedule or market
comparison) used for the pickup work on the rural improvements the same as
was used for the general population of the class?
Yes
11. Describe the method used to determine whether a sold parcel is substantially
changed.
Sales review, permits, pick up, irrigation system and inspections
12. Please provide any documents related to the policies or procedures used for the
County 20 - Page 34
agricultural class of property.
The county has a notebook full of information concerning the policies and procedures
used to value the residential class of property.
County 20 - Page 35

Number of Sales :
Total Sales Price :
Total Adj. Sales Price :
Total Assessed Value :
Avg. Adj. Sales Price :
Avg. Assessed Value :
MEDIAN :
WGT. MEAN :
MEAN :
COD :
PRD :
COV :
STD :
Avg. Abs. Dev :
MAX Sales Ratio :
MIN Sales Ratio :
95% Median C.I. :
95% Wgt. Mean C.I. :
95% Mean C.I. :
103
31,247,736
31,217,736
23,070,455
303,085
223,985
10.25
98.74
15.02
10.96
07.39
105.23
26.22
70.30 to 73.40
70.54 to 77.26
70.85 to 75.09
Printed:3/28/2011 5:36:02PM
Qualified
PAD 2011 R&O Statistics (Using 2011 Values)Cuming20
Date Range: 7/1/2007 To 6/30/2010 Posted on: 2/17/2011
72
74
73
AGRICULTURAL - BASE STAT
Page 1 of 2
Avg. Adj.
RANGE Assd. ValSale Price95%_Median_C.I.MAXMINPRDCODWGT.MEANMEANMEDIANCOUNT
Avg.DATE OF SALE *
_____Qrtrs_____
01-JUL-07 To 30-SEP-07 0 00.00 00.00 00.00 00.00 00.00 00.00 00.00 N/A 0 0
01-OCT-07 To 31-DEC-07 12 72.33 73.21 72.29 10.26 101.27 52.59 91.93 66.34 to 77.41 286,869 207,373
01-JAN-08 To 31-MAR-08 22 72.88 73.73 73.89 09.11 99.78 60.20 98.47 67.67 to 78.87 284,927 210,526
01-APR-08 To 30-JUN-08 3 71.83 68.97 69.08 05.46 99.84 61.66 73.42 N/A 237,410 163,997
01-JUL-08 To 30-SEP-08 7 66.52 74.27 73.86 21.74 100.56 47.33 104.73 47.33 to 104.73 283,571 209,442
01-OCT-08 To 31-DEC-08 10 72.21 74.08 72.56 07.17 102.09 64.77 84.83 66.44 to 83.54 219,495 159,265
01-JAN-09 To 31-MAR-09 15 71.64 74.03 74.13 05.57 99.87 67.97 85.37 70.19 to 75.46 257,232 190,678
01-APR-09 To 30-JUN-09 8 79.52 82.62 83.30 11.72 99.18 68.46 105.23 68.46 to 105.23 242,744 202,214
01-JUL-09 To 30-SEP-09 3 59.31 52.71 54.37 26.07 96.95 26.22 72.59 N/A 146,902 79,872
01-OCT-09 To 31-DEC-09 15 69.74 70.70 69.46 07.11 101.79 57.11 83.94 66.99 to 72.68 368,134 255,709
01-JAN-10 To 31-MAR-10 6 68.33 69.78 79.99 11.47 87.24 53.28 89.35 53.28 to 89.35 743,376 594,619
01-APR-10 To 30-JUN-10 2 69.66 69.66 71.25 05.30 97.77 65.97 73.35 N/A 195,667 139,408
_____Study Yrs_____
01-JUL-07 To 30-JUN-08 37 72.34 73.18 73.03 09.23 100.21 52.59 98.47 70.30 to 75.42 281,704 205,731
01-JUL-08 To 30-JUN-09 40 73.12 75.80 75.51 10.54 100.38 47.33 105.23 71.32 to 77.61 249,509 188,416
01-JUL-09 To 30-JUN-10 26 68.96 68.33 73.25 10.35 93.28 26.22 89.35 65.97 to 72.60 415,935 304,684
_____Calendar Yrs_____
01-JAN-08 To 31-DEC-08 42 72.21 73.56 73.31 10.46 100.34 47.33 104.73 69.87 to 75.42 265,728 194,817
01-JAN-09 To 31-DEC-09 41 71.64 72.93 72.71 10.05 100.30 26.22 105.23 69.74 to 74.60 286,906 208,613
_____ALL_____ 103 72.08 72.97 73.90 10.25 98.74 26.22 105.23 70.30 to 73.40 303,085 223,985
Avg. Adj.
RANGE Assd. ValSale Price95%_Median_C.I.MAXMINPRDCODWGT.MEANMEANMEDIANCOUNT
Avg.AREA (MARKET)
1 30 71.85 72.51 73.22 09.16 99.03 47.33 98.47 68.46 to 74.33 251,982 184,513
2 27 72.38 70.91 70.20 08.61 101.01 53.28 83.94 65.65 to 75.42 298,387 209,471
3 30 72.85 75.15 77.49 12.61 96.98 26.22 105.23 70.00 to 75.89 398,368 308,685
4 16 70.71 73.25 71.73 10.38 102.12 57.11 91.93 66.61 to 84.83 228,173 163,676
_____ALL_____ 103 72.08 72.97 73.90 10.25 98.74 26.22 105.23 70.30 to 73.40 303,085 223,985
County 20 - Page 36

Number of Sales :
Total Sales Price :
Total Adj. Sales Price :
Total Assessed Value :
Avg. Adj. Sales Price :
Avg. Assessed Value :
MEDIAN :
WGT. MEAN :
MEAN :
COD :
PRD :
COV :
STD :
Avg. Abs. Dev :
MAX Sales Ratio :
MIN Sales Ratio :
95% Median C.I. :
95% Wgt. Mean C.I. :
95% Mean C.I. :
103
31,247,736
31,217,736
23,070,455
303,085
223,985
10.25
98.74
15.02
10.96
07.39
105.23
26.22
70.30 to 73.40
70.54 to 77.26
70.85 to 75.09
Printed:3/28/2011 5:36:02PM
Qualified
PAD 2011 R&O Statistics (Using 2011 Values)Cuming20
Date Range: 7/1/2007 To 6/30/2010 Posted on: 2/17/2011
72
74
73
AGRICULTURAL - BASE STAT
Page 2 of 2
Avg. Adj.
RANGE Assd. ValSale Price95%_Median_C.I.MAXMINPRDCODWGT.MEANMEANMEDIANCOUNT
Avg.95%MLU By Market Area
_____Dry_____
County 70 72.60 73.46 72.60 07.66 101.18 57.11 98.00 71.47 to 74.33 265,414 192,682
1 22 71.98 73.42 72.82 06.29 100.82 66.11 98.00 68.46 to 75.46 237,988 173,299
2 18 73.44 73.01 72.15 06.86 101.19 60.20 83.81 70.16 to 77.61 311,607 224,816
3 18 72.85 74.21 73.34 07.49 101.19 61.99 91.63 69.87 to 75.89 292,002 214,144
4 12 69.02 73.08 71.58 11.16 102.10 57.11 91.93 66.61 to 84.83 206,522 147,820
_____ALL_____ 103 72.08 72.97 73.90 10.25 98.74 26.22 105.23 70.30 to 73.40 303,085 223,985
Avg. Adj.
RANGE Assd. ValSale Price95%_Median_C.I.MAXMINPRDCODWGT.MEANMEANMEDIANCOUNT
Avg.80%MLU By Market Area
_____Irrigated_____
County 9 70.80 77.06 77.59 12.67 99.32 62.64 105.23 68.09 to 94.84 317,104 246,049
1 1 72.34 72.34 72.34 00.00 100.00 72.34 72.34 N/A 323,800 234,230
2 2 66.72 66.72 66.67 06.12 100.07 62.64 70.80 N/A 178,000 118,678
3 6 74.82 81.30 80.16 15.82 101.42 68.09 105.23 68.09 to 105.23 362,357 290,477
_____Dry_____
County 83 72.34 73.17 72.14 08.27 101.43 53.28 104.73 70.47 to 73.42 266,806 192,480
1 25 71.62 72.74 72.13 06.27 100.85 64.77 98.00 68.46 to 74.33 242,067 174,592
2 22 72.71 71.35 70.64 07.98 101.01 53.28 83.81 65.65 to 77.41 300,845 212,519
3 21 73.42 75.45 74.08 08.74 101.85 61.99 104.73 69.87 to 75.89 281,995 208,893
4 15 70.04 73.37 71.74 11.05 102.27 57.11 91.93 66.61 to 84.83 236,852 169,925
_____Grass_____
County 2 49.96 49.96 49.82 05.26 100.28 47.33 52.59 N/A 190,000 94,655
1 2 49.96 49.96 49.82 05.26 100.28 47.33 52.59 N/A 190,000 94,655
_____ALL_____ 103 72.08 72.97 73.90 10.25 98.74 26.22 105.23 70.30 to 73.40 303,085 223,985
County 20 - Page 37

Number of Sales :
Total Sales Price :
Total Adj. Sales Price :
Total Assessed Value :
Avg. Adj. Sales Price :
Avg. Assessed Value :
MEDIAN :
WGT. MEAN :
MEAN :
COD :
PRD :
COV :
STD :
Avg. Abs. Dev :
MAX Sales Ratio :
MIN Sales Ratio :
95% Median C.I. :
95% Wgt. Mean C.I. :
95% Mean C.I. :
132
41,136,806
41,106,806
30,771,090
311,415
233,114
11.49
99.87
15.73
11.76
08.34
108.48
26.22
71.62 to 74.33
71.97 to 77.74
72.75 to 76.77
Printed:3/28/2011 5:36:05PM
Qualified
PAD 2011 R&O Statistics (Using 2011 Values)Cuming20
Date Range: 7/1/2007 To 6/30/2010 Posted on: 2/17/2011
73
75
75
AGRICULTURAL - RANDOM INCLUDE
Page 1 of 2
Avg. Adj.
RANGE Assd. ValSale Price95%_Median_C.I.MAXMINPRDCODWGT.MEANMEANMEDIANCOUNT
Avg.DATE OF SALE *
_____Qrtrs_____
01-JUL-07 To 30-SEP-07 0 00.00 00.00 00.00 00.00 00.00 00.00 00.00 N/A 0 0
01-OCT-07 To 31-DEC-07 13 72.38 74.46 74.31 11.27 100.20 52.59 91.93 66.34 to 89.48 300,065 222,974
01-JAN-08 To 31-MAR-08 27 74.49 76.90 77.36 11.67 99.41 60.20 108.48 70.30 to 80.07 311,367 240,874
01-APR-08 To 30-JUN-08 3 71.83 68.97 69.08 05.46 99.84 61.66 73.42 N/A 237,410 163,997
01-JUL-08 To 30-SEP-08 7 66.52 74.27 73.86 21.74 100.56 47.33 104.73 47.33 to 104.73 283,571 209,442
01-OCT-08 To 31-DEC-08 12 72.35 73.81 72.54 06.00 101.75 64.77 84.83 69.87 to 81.45 241,162 174,942
01-JAN-09 To 31-MAR-09 16 72.52 75.28 74.54 07.09 100.99 67.97 94.07 70.19 to 80.37 246,306 183,607
01-APR-09 To 30-JUN-09 9 81.43 83.74 84.10 11.70 99.57 68.46 105.23 72.83 to 98.00 235,772 198,283
01-JUL-09 To 30-SEP-09 5 72.59 70.36 76.26 29.80 92.26 26.22 99.76 N/A 184,141 140,420
01-OCT-09 To 31-DEC-09 24 71.38 73.91 72.09 09.53 102.52 57.11 85.65 68.17 to 81.81 343,976 247,975
01-JAN-10 To 31-MAR-10 11 70.14 72.72 79.01 10.42 92.04 53.28 89.35 65.92 to 86.14 544,035 429,835
01-APR-10 To 30-JUN-10 5 65.97 65.61 60.85 09.56 107.82 57.27 73.48 N/A 396,902 241,502
_____Study Yrs_____
01-JUL-07 To 30-JUN-08 43 73.41 75.61 75.99 11.29 99.50 52.59 108.48 71.38 to 75.89 302,790 230,099
01-JUL-08 To 30-JUN-09 44 73.12 76.45 75.74 10.89 100.94 47.33 105.23 71.62 to 77.70 248,677 188,356
01-JUL-09 To 30-JUN-10 45 70.16 72.30 73.43 12.36 98.46 26.22 99.76 68.24 to 73.77 381,001 279,760
_____Calendar Yrs_____
01-JAN-08 To 31-DEC-08 49 72.35 75.28 75.45 11.57 99.77 47.33 108.48 71.38 to 75.75 285,675 215,530
01-JAN-09 To 31-DEC-09 54 73.12 75.63 74.65 11.69 101.31 26.22 105.23 70.47 to 79.33 282,203 210,662
_____ALL_____ 132 72.60 74.76 74.86 11.49 99.87 26.22 108.48 71.62 to 74.33 311,415 233,114
Avg. Adj.
RANGE Assd. ValSale Price95%_Median_C.I.MAXMINPRDCODWGT.MEANMEANMEDIANCOUNT
Avg.AREA (MARKET)
1 41 72.68 76.16 77.25 11.72 98.59 47.33 108.48 71.62 to 80.85 277,054 214,030
2 33 72.38 71.57 70.02 09.20 102.21 53.28 92.68 68.24 to 74.60 317,196 222,087
3 40 73.45 75.31 76.38 12.08 98.60 26.22 105.23 70.14 to 75.89 380,437 290,581
4 18 72.37 76.19 74.92 13.38 101.70 57.11 105.45 66.63 to 84.94 225,703 169,098
_____ALL_____ 132 72.60 74.76 74.86 11.49 99.87 26.22 108.48 71.62 to 74.33 311,415 233,114
County 20 - Page 38

Number of Sales :
Total Sales Price :
Total Adj. Sales Price :
Total Assessed Value :
Avg. Adj. Sales Price :
Avg. Assessed Value :
MEDIAN :
WGT. MEAN :
MEAN :
COD :
PRD :
COV :
STD :
Avg. Abs. Dev :
MAX Sales Ratio :
MIN Sales Ratio :
95% Median C.I. :
95% Wgt. Mean C.I. :
95% Mean C.I. :
132
41,136,806
41,106,806
30,771,090
311,415
233,114
11.49
99.87
15.73
11.76
08.34
108.48
26.22
71.62 to 74.33
71.97 to 77.74
72.75 to 76.77
Printed:3/28/2011 5:36:05PM
Qualified
PAD 2011 R&O Statistics (Using 2011 Values)Cuming20
Date Range: 7/1/2007 To 6/30/2010 Posted on: 2/17/2011
73
75
75
AGRICULTURAL - RANDOM INCLUDE
Page 2 of 2
Avg. Adj.
RANGE Assd. ValSale Price95%_Median_C.I.MAXMINPRDCODWGT.MEANMEANMEDIANCOUNT
Avg.95%MLU By Market Area
_____Dry_____
County 88 73.42 75.26 74.88 08.98 100.51 57.11 108.48 72.10 to 75.42 277,998 208,154
1 31 74.33 77.29 77.82 09.83 99.32 66.11 108.48 71.62 to 81.43 280,656 218,402
2 18 73.44 73.01 72.15 06.86 101.19 60.20 83.81 70.16 to 77.61 311,607 224,816
3 27 73.48 75.40 74.60 08.18 101.07 61.99 99.76 70.14 to 77.65 284,308 212,096
4 12 69.02 73.08 71.58 11.16 102.10 57.11 91.93 66.61 to 84.83 206,522 147,820
_____ALL_____ 132 72.60 74.76 74.86 11.49 99.87 26.22 108.48 71.62 to 74.33 311,415 233,114
Avg. Adj.
RANGE Assd. ValSale Price95%_Median_C.I.MAXMINPRDCODWGT.MEANMEANMEDIANCOUNT
Avg.80%MLU By Market Area
_____Irrigated_____
County 11 70.80 78.84 78.36 15.14 100.61 62.64 105.45 68.09 to 105.23 349,764 274,085
1 1 72.34 72.34 72.34 00.00 100.00 72.34 72.34 N/A 323,800 234,230
2 3 68.24 67.23 67.69 03.99 99.32 62.64 70.80 N/A 340,000 230,150
3 6 74.82 81.30 80.16 15.82 101.42 68.09 105.23 68.09 to 105.23 362,357 290,477
4 1 105.45 105.45 105.45 00.00 100.00 105.45 105.45 N/A 329,460 347,400
_____Dry_____
County 104 72.76 74.77 73.93 09.61 101.14 53.28 108.48 71.64 to 74.49 280,133 207,095
1 34 72.64 76.45 76.95 09.84 99.35 64.77 108.48 71.47 to 80.37 279,890 215,373
2 25 72.59 71.68 70.02 09.00 102.37 53.28 92.68 69.23 to 75.42 308,904 216,305
3 30 73.63 76.15 75.03 08.99 101.49 61.99 104.73 70.47 to 75.89 278,072 208,626
4 15 70.04 73.37 71.74 11.05 102.27 57.11 91.93 66.61 to 84.83 236,852 169,925
_____Grass_____
County 2 49.96 49.96 49.82 05.26 100.28 47.33 52.59 N/A 190,000 94,655
1 2 49.96 49.96 49.82 05.26 100.28 47.33 52.59 N/A 190,000 94,655
_____ALL_____ 132 72.60 74.76 74.86 11.49 99.87 26.22 108.48 71.62 to 74.33 311,415 233,114
County 20 - Page 39

Number of Sales :
Total Sales Price :
Total Adj. Sales Price :
Total Assessed Value :
Avg. Adj. Sales Price :
Avg. Assessed Value :
MEDIAN :
WGT. MEAN :
MEAN :
COD :
PRD :
COV :
STD :
Avg. Abs. Dev :
MAX Sales Ratio :
MIN Sales Ratio :
95% Median C.I. :
95% Wgt. Mean C.I. :
95% Mean C.I. :
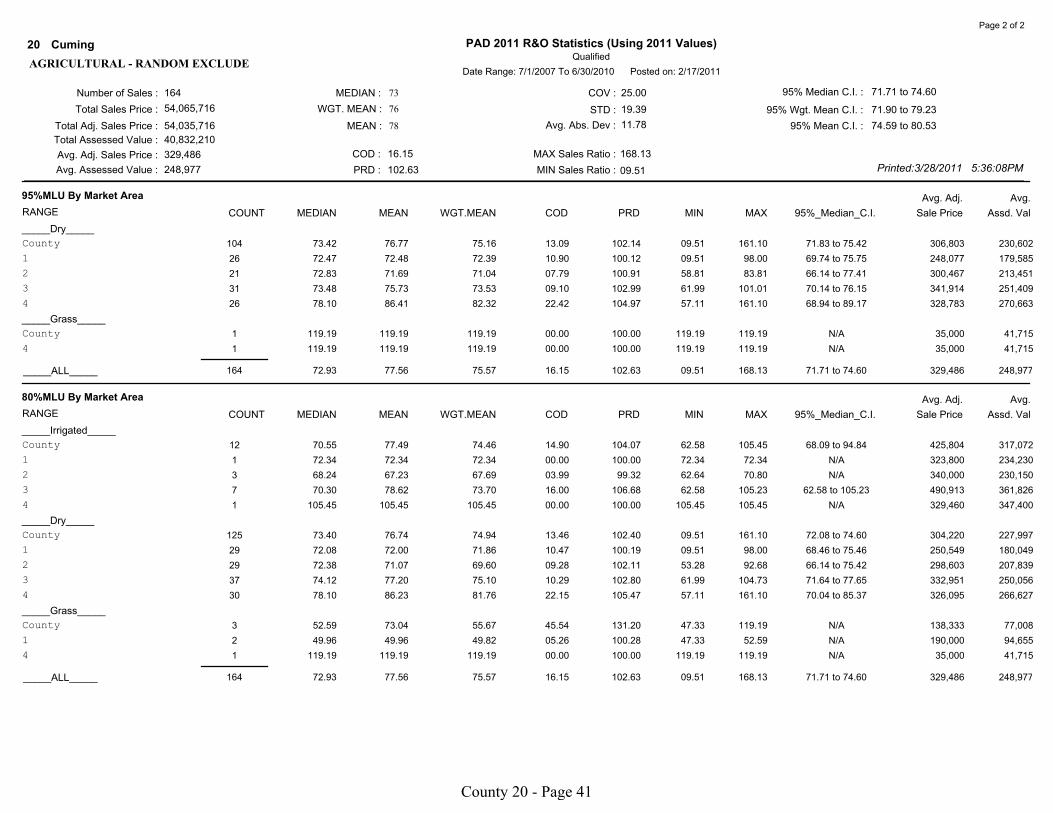
164
54,065,716
54,035,716
40,832,210
329,486
248,977
16.15
102.63
25.00
19.39
11.78
168.13
09.51
71.71 to 74.60
71.90 to 79.23
74.59 to 80.53
Printed:3/28/2011 5:36:08PM
Qualified
PAD 2011 R&O Statistics (Using 2011 Values)Cuming20
Date Range: 7/1/2007 To 6/30/2010 Posted on: 2/17/2011
73
76
78
AGRICULTURAL - RANDOM EXCLUDE
Page 1 of 2
Avg. Adj.
RANGE Assd. ValSale Price95%_Median_C.I.MAXMINPRDCODWGT.MEANMEANMEDIANCOUNT
Avg.DATE OF SALE *
_____Qrtrs_____
01-JUL-07 To 30-SEP-07 3 80.41 91.46 67.24 28.53 136.02 62.58 131.40 N/A 524,450 352,658
01-OCT-07 To 31-DEC-07 17 74.50 85.16 79.31 24.60 107.38 52.59 161.10 66.34 to 97.50 351,355 278,670
01-JAN-08 To 31-MAR-08 32 75.82 81.71 78.26 16.74 104.41 60.20 168.13 71.38 to 79.97 323,365 253,077
01-APR-08 To 30-JUN-08 4 72.63 81.53 71.42 20.35 114.16 61.66 119.19 N/A 186,808 133,426
01-JUL-08 To 30-SEP-08 11 77.70 80.04 78.77 20.22 101.61 47.33 106.55 62.64 to 104.73 343,618 270,681
01-OCT-08 To 31-DEC-08 18 72.35 77.06 76.73 11.03 100.43 64.77 116.59 69.77 to 83.54 219,225 168,220
01-JAN-09 To 31-MAR-09 21 73.40 76.83 75.69 11.70 101.51 48.99 117.85 70.19 to 80.37 289,724 219,298
01-APR-09 To 30-JUN-09 15 77.61 81.74 79.56 13.19 102.74 58.81 111.39 73.03 to 92.68 353,334 281,095
01-JUL-09 To 30-SEP-09 4 65.95 63.01 69.74 30.71 90.35 26.22 93.92 N/A 180,176 125,646
01-OCT-09 To 31-DEC-09 22 69.87 72.36 70.57 08.07 102.54 57.11 84.16 67.99 to 79.33 333,864 235,624
01-JAN-10 To 31-MAR-10 12 69.42 64.91 75.13 14.17 86.40 09.51 89.35 65.92 to 73.48 519,513 390,309
01-APR-10 To 30-JUN-10 5 65.97 65.61 60.85 09.56 107.82 57.27 73.48 N/A 396,902 241,502
_____Study Yrs_____
01-JUL-07 To 30-JUN-08 56 75.59 83.26 77.40 20.23 107.57 52.59 168.13 72.27 to 79.50 332,880 257,634
01-JUL-08 To 30-JUN-09 65 74.12 78.57 77.59 13.90 101.26 47.33 117.85 72.34 to 78.45 294,001 228,110
01-JUL-09 To 30-JUN-10 43 69.74 68.63 71.10 11.96 96.53 09.51 93.92 67.38 to 72.60 378,706 269,245
_____Calendar Yrs_____
01-JAN-08 To 31-DEC-08 65 74.12 80.12 77.77 16.61 103.02 47.33 168.13 72.08 to 78.87 289,550 225,194
01-JAN-09 To 31-DEC-09 62 72.93 75.54 74.59 12.57 101.27 26.22 117.85 70.19 to 77.61 313,708 234,000
_____ALL_____ 164 72.93 77.56 75.57 16.15 102.63 09.51 168.13 71.71 to 74.60 329,486 248,977
Avg. Adj.
RANGE Assd. ValSale Price95%_Median_C.I.MAXMINPRDCODWGT.MEANMEANMEDIANCOUNT
Avg.AREA (MARKET)
1 36 72.21 72.14 72.94 12.02 98.90 09.51 98.47 69.74 to 75.46 253,024 184,555
2 37 72.35 71.11 69.70 09.38 102.02 53.28 92.68 68.17 to 73.48 308,226 214,827
3 49 73.48 75.43 74.62 13.20 101.09 26.22 105.23 70.14 to 76.15 428,817 319,970
4 42 79.70 90.39 84.42 25.29 107.07 57.11 168.13 73.03 to 91.93 297,868 251,455
_____ALL_____ 164 72.93 77.56 75.57 16.15 102.63 09.51 168.13 71.71 to 74.60 329,486 248,977
County 20 - Page 40
Number of Sales :
Total Sales Price :
Total Adj. Sales Price :
Total Assessed Value :
Avg. Adj. Sales Price :
Avg. Assessed Value :
MEDIAN :
WGT. MEAN :
MEAN :
COD :
PRD :
COV :
STD :
Avg. Abs. Dev :
MAX Sales Ratio :
MIN Sales Ratio :
95% Median C.I. :
95% Wgt. Mean C.I. :
95% Mean C.I. :
164
54,065,716
54,035,716
40,832,210
329,486
248,977
16.15
102.63
25.00
19.39
11.78
168.13
09.51
71.71 to 74.60
71.90 to 79.23
74.59 to 80.53
Printed:3/28/2011 5:36:08PM
Qualified
PAD 2011 R&O Statistics (Using 2011 Values)Cuming20
Date Range: 7/1/2007 To 6/30/2010 Posted on: 2/17/2011
73
76
78
AGRICULTURAL - RANDOM EXCLUDE
Page 2 of 2
Avg. Adj.
RANGE Assd. ValSale Price95%_Median_C.I.MAXMINPRDCODWGT.MEANMEANMEDIANCOUNT
Avg.95%MLU By Market Area
_____Dry_____
County 104 73.42 76.77 75.16 13.09 102.14 09.51 161.10 71.83 to 75.42 306,803 230,602
1 26 72.47 72.48 72.39 10.90 100.12 09.51 98.00 69.74 to 75.75 248,077 179,585
2 21 72.83 71.69 71.04 07.79 100.91 58.81 83.81 66.14 to 77.41 300,467 213,451
3 31 73.48 75.73 73.53 09.10 102.99 61.99 101.01 70.14 to 76.15 341,914 251,409
4 26 78.10 86.41 82.32 22.42 104.97 57.11 161.10 68.94 to 89.17 328,783 270,663
_____Grass_____
County 1 119.19 119.19 119.19 00.00 100.00 119.19 119.19 N/A 35,000 41,715
4 1 119.19 119.19 119.19 00.00 100.00 119.19 119.19 N/A 35,000 41,715
_____ALL_____ 164 72.93 77.56 75.57 16.15 102.63 09.51 168.13 71.71 to 74.60 329,486 248,977
Avg. Adj.
RANGE Assd. ValSale Price95%_Median_C.I.MAXMINPRDCODWGT.MEANMEANMEDIANCOUNT
Avg.80%MLU By Market Area
_____Irrigated_____
County 12 70.55 77.49 74.46 14.90 104.07 62.58 105.45 68.09 to 94.84 425,804 317,072
1 1 72.34 72.34 72.34 00.00 100.00 72.34 72.34 N/A 323,800 234,230
2 3 68.24 67.23 67.69 03.99 99.32 62.64 70.80 N/A 340,000 230,150
3 7 70.30 78.62 73.70 16.00 106.68 62.58 105.23 62.58 to 105.23 490,913 361,826
4 1 105.45 105.45 105.45 00.00 100.00 105.45 105.45 N/A 329,460 347,400
_____Dry_____
County 125 73.40 76.74 74.94 13.46 102.40 09.51 161.10 72.08 to 74.60 304,220 227,997
1 29 72.08 72.00 71.86 10.47 100.19 09.51 98.00 68.46 to 75.46 250,549 180,049
2 29 72.38 71.07 69.60 09.28 102.11 53.28 92.68 66.14 to 75.42 298,603 207,839
3 37 74.12 77.20 75.10 10.29 102.80 61.99 104.73 71.64 to 77.65 332,951 250,056
4 30 78.10 86.23 81.76 22.15 105.47 57.11 161.10 70.04 to 85.37 326,095 266,627
_____Grass_____
County 3 52.59 73.04 55.67 45.54 131.20 47.33 119.19 N/A 138,333 77,008
1 2 49.96 49.96 49.82 05.26 100.28 47.33 52.59 N/A 190,000 94,655
4 1 119.19 119.19 119.19 00.00 100.00 119.19 119.19 N/A 35,000 41,715
_____ALL_____ 164 72.93 77.56 75.57 16.15 102.63 09.51 168.13 71.71 to 74.60 329,486 248,977
County 20 - Page 41
Sp
ecial V
alu
atio
n
Rep
orts
County 20 - Page 42

CUMING COUNTY ASSESSOR’S OFFICE Cherie Kreikemeier, Assessor 200 S. Lincoln Street, Room 101
West Point, Ne 68788
(402) 372-6000 Fax (402) 372-6013
February 28, 2011
Nebraska Department of Revenue
Property Assessment Division
301 Centennial Mall South
P.O. Box 98919
Lincoln, NE 68508
Our method of determining Greenbelt values for Cuming County, Nebraska is as follows:
The Greenbelt area in Cuming County is located adjacent to West Point City to the
eastern city limits and is monitored by the City of West Point.
The uninfluenced values are derived from the sales file and equalized with the
surrounding lands, using 69-75% of the indicated market values. This is done on a yearly
basis, just as is the valuing of agricultural land.
The values are derived from the sales file and equalized to the surrounding market values
of land. This is also done on a yearly basis at the time the agricultural land is valued.
Cherie J. Kreikemeier
Cuming County Assessor
County 20 - Page 43

20 - Cuming COUNTY PAD 2011 Special Value Statistics Base Stat Page: 1
AGRICULTURAL - BASE STAT Type : Qualified
Date Range : 07/01/2007 to 06/30/2010 Posted Before : 02/17/2011
Number of Sales : 103 Median : 72 COV : 15.02 95% Median C.I. : 70.30 to 73.40
Total Sales Price : 31,247,736 Wgt. Mean : 74 STD : 10.96 95% Wgt. Mean C.I. : 70.54 to 77.26
Total Adj. Sales Price : 31,217,736 Mean : 73 Avg.Abs.Dev : 07.39 95% Mean C.I. : 70.85 to 75.09
Total Assessed Value : 23,070,455
Avg. Adj. Sales Price : 303,085 COD : 10.25 MAX Sales Ratio : 105.23
Avg. Assessed Value : 223,985 PRD : 98.74 MIN Sales Ratio : 26.22 Printed : 03/29/2011
DATE OF SALE *
RANGE COUNT MEDIAN MEAN WGT.MEAN COD PRD MIN MAX 95% Median C.I. Avg.Adj.SalePrice Avg.AssdValue
_____Qrtrs_____
07/01/2007 To 09/30/2007
10/01/2007 To 12/31/2007 12 72.33 73.21 72.29 10.26 101.27 52.59 91.93 66.34 to 77.41 286,869 207,373
01/01/2008 To 03/31/2008 22 72.88 73.73 73.89 09.11 99.78 60.20 98.47 67.67 to 78.87 284,927 210,526
04/01/2008 To 06/30/2008 3 71.83 68.97 69.08 05.46 99.84 61.66 73.42 N/A 237,410 163,997
07/01/2008 To 09/30/2008 7 66.52 74.27 73.86 21.74 100.56 47.33 104.73 47.33 to 104.73 283,571 209,442
10/01/2008 To 12/31/2008 10 72.21 74.08 72.56 07.17 102.09 64.77 84.83 66.44 to 83.54 219,495 159,265
01/01/2009 To 03/31/2009 15 71.64 74.03 74.13 05.57 99.87 67.97 85.37 70.19 to 75.46 257,232 190,678
04/01/2009 To 06/30/2009 8 79.52 82.62 83.30 11.72 99.18 68.46 105.23 68.46 to 105.23 242,744 202,214
07/01/2009 To 09/30/2009 3 59.31 52.71 54.37 26.07 96.95 26.22 72.59 N/A 146,902 79,872
10/01/2009 To 12/31/2009 15 69.74 70.70 69.46 07.11 101.79 57.11 83.94 66.99 to 72.68 368,134 255,709
01/01/2010 To 03/31/2010 6 68.33 69.78 79.99 11.47 87.24 53.28 89.35 53.28 to 89.35 743,376 594,619
04/01/2010 To 06/30/2010 2 69.66 69.66 71.25 05.30 97.77 65.97 73.35 N/A 195,667 139,408
_____Study Yrs_____
07/01/2007 To 06/30/2008 37 72.34 73.18 73.03 09.23 100.21 52.59 98.47 70.30 to 75.42 281,704 205,731
07/01/2008 To 06/30/2009 40 73.12 75.80 75.51 10.54 100.38 47.33 105.23 71.32 to 77.61 249,509 188,416
07/01/2009 To 06/30/2010 26 68.96 68.33 73.25 10.35 93.28 26.22 89.35 65.97 to 72.60 415,935 304,684
_____Calendar Yrs_____
01/01/2008 To 12/31/2008 42 72.21 73.56 73.31 10.46 100.34 47.33 104.73 69.87 to 75.42 265,728 194,817
01/01/2009 To 12/31/2009 41 71.64 72.93 72.71 10.05 100.30 26.22 105.23 69.74 to 74.60 286,906 208,613
_______ALL_______
07/01/2007 To 06/30/2010 103 72.08 72.97 73.90 10.25 98.74 26.22 105.23 70.30 to 73.40 303,085 223,985
County 20 - Page 44

20 - Cuming COUNTY PAD 2011 Special Value Statistics Base Stat Page: 2
AGRICULTURAL - BASE STAT Type : Qualified
Date Range : 07/01/2007 to 06/30/2010 Posted Before : 02/17/2011
Number of Sales : 103 Median : 72 COV : 15.02 95% Median C.I. : 70.30 to 73.40
Total Sales Price : 31,247,736 Wgt. Mean : 74 STD : 10.96 95% Wgt. Mean C.I. : 70.54 to 77.26
Total Adj. Sales Price : 31,217,736 Mean : 73 Avg.Abs.Dev : 07.39 95% Mean C.I. : 70.85 to 75.09
Total Assessed Value : 23,070,455
Avg. Adj. Sales Price : 303,085 COD : 10.25 MAX Sales Ratio : 105.23
Avg. Assessed Value : 223,985 PRD : 98.74 MIN Sales Ratio : 26.22 Printed : 03/29/2011
AREA (MARKET)
RANGE COUNT MEDIAN MEAN WGT.MEAN COD PRD MIN MAX 95% Median C.I. Avg.Adj.SalePrice Avg.AssdValue
1 30 71.85 72.51 73.22 09.16 99.03 47.33 98.47 68.46 to 74.33 251,982 184,513
2 27 72.38 70.91 70.20 08.61 101.01 53.28 83.94 65.65 to 75.42 298,387 209,471
3 30 72.85 75.15 77.49 12.61 96.98 26.22 105.23 70.00 to 75.89 398,368 308,685
4 16 70.71 73.25 71.73 10.38 102.12 57.11 91.93 66.61 to 84.83 228,173 163,676
_______ALL_______
07/01/2007 To 06/30/2010 103 72.08 72.97 73.90 10.25 98.74 26.22 105.23 70.30 to 73.40 303,085 223,985
95%MLU By Market Area
RANGE COUNT MEDIAN MEAN WGT.MEAN COD PRD MIN MAX 95% Median C.I. Avg.Adj.SalePrice Avg.AssdValue
_____Dry_____
County 70 72.60 73.46 72.60 07.66 101.18 57.11 98.00 71.47 to 74.33 265,414 192,682
1 22 71.98 73.42 72.82 06.29 100.82 66.11 98.00 68.46 to 75.46 237,988 173,299
2 18 73.44 73.01 72.15 06.86 101.19 60.20 83.81 70.16 to 77.61 311,607 224,816
3 18 72.85 74.21 73.34 07.49 101.19 61.99 91.63 69.87 to 75.89 292,002 214,144
4 12 69.02 73.08 71.58 11.16 102.10 57.11 91.93 66.61 to 84.83 206,522 147,820
_______ALL_______
07/01/2007 To 06/30/2010 103 72.08 72.97 73.90 10.25 98.74 26.22 105.23 70.30 to 73.40 303,085 223,985
County 20 - Page 45

20 - Cuming COUNTY PAD 2011 Special Value Statistics Base Stat Page: 3
AGRICULTURAL - BASE STAT Type : Qualified
Date Range : 07/01/2007 to 06/30/2010 Posted Before : 02/17/2011
Number of Sales : 103 Median : 72 COV : 15.02 95% Median C.I. : 70.30 to 73.40
Total Sales Price : 31,247,736 Wgt. Mean : 74 STD : 10.96 95% Wgt. Mean C.I. : 70.54 to 77.26
Total Adj. Sales Price : 31,217,736 Mean : 73 Avg.Abs.Dev : 07.39 95% Mean C.I. : 70.85 to 75.09
Total Assessed Value : 23,070,455
Avg. Adj. Sales Price : 303,085 COD : 10.25 MAX Sales Ratio : 105.23
Avg. Assessed Value : 223,985 PRD : 98.74 MIN Sales Ratio : 26.22 Printed : 03/29/2011
80%MLU By Market Area
RANGE COUNT MEDIAN MEAN WGT.MEAN COD PRD MIN MAX 95% Median C.I. Avg.Adj.SalePrice Avg.AssdValue
_____Irrigated_____
County 9 70.80 77.06 77.59 12.67 99.32 62.64 105.23 68.09 to 94.84 317,104 246,049
1 1 72.34 72.34 72.34 100.00 72.34 72.34 N/A 323,800 234,230
2 2 66.72 66.72 66.67 06.12 100.07 62.64 70.80 N/A 178,000 118,678
3 6 74.82 81.30 80.16 15.82 101.42 68.09 105.23 68.09 to 105.23 362,357 290,477
_____Dry_____
County 83 72.34 73.17 72.14 08.27 101.43 53.28 104.73 70.47 to 73.42 266,806 192,480
1 25 71.62 72.74 72.13 06.27 100.85 64.77 98.00 68.46 to 74.33 242,067 174,592
2 22 72.71 71.35 70.64 07.98 101.01 53.28 83.81 65.65 to 77.41 300,845 212,519
3 21 73.42 75.45 74.08 08.74 101.85 61.99 104.73 69.87 to 75.89 281,995 208,893
4 15 70.04 73.37 71.74 11.05 102.27 57.11 91.93 66.61 to 84.83 236,852 169,925
_____Grass_____
County 2 49.96 49.96 49.82 05.26 100.28 47.33 52.59 N/A 190,000 94,655
1 2 49.96 49.96 49.82 05.26 100.28 47.33 52.59 N/A 190,000 94,655
_______ALL_______
07/01/2007 To 06/30/2010 103 72.08 72.97 73.90 10.25 98.74 26.22 105.23 70.30 to 73.40 303,085 223,985
County 20 - Page 46

20 - Cuming COUNTY PAD 2011 Special Value Statistics Page: 1
AGRICULTURAL-RANDOM INCLUDE Type : Qualified
Number of Sales : 132 Median : 73 COV : 15.73 95% Median C.I. : 71.62 to 74.33
Total Sales Price : 41,136,806 Wgt. Mean : 75 STD : 11.76 95% Wgt. Mean C.I. : 71.97 to 77.74
Total Adj. Sales Price : 41,106,806 Mean : 75 Avg.Abs.Dev : 08.34 95% Mean C.I. : 72.75 to 76.77
Total Assessed Value : 30,771,090
Avg. Adj. Sales Price : 311,415 COD : 11.49 MAX Sales Ratio : 108.48
Avg. Assessed Value : 233,114 PRD : 99.87 MIN Sales Ratio : 26.22
DATE OF SALE *
RANGE COUNT MEDIAN MEAN WGT.MEAN COD PRD MIN MAX 95% Median C.I. Avg.Adj.SalePrice Avg.AssdValue
_____Qrtrs_____
07/01/2007 To 09/30/2007
10/01/2007 To 12/31/2007 13 72.38 74.46 74.31 11.27 100.20 52.59 91.93 66.34 to 89.48 300,065 222,974
01/01/2008 To 03/31/2008 27 74.49 76.90 77.36 11.67 99.41 60.20 108.48 70.30 to 80.07 311,367 240,874
04/01/2008 To 06/30/2008 3 71.83 68.97 69.08 05.46 99.84 61.66 73.42 N/A 237,410 163,997
07/01/2008 To 09/30/2008 7 66.52 74.27 73.86 21.74 100.56 47.33 104.73 47.33 to 104.73 283,571 209,442
10/01/2008 To 12/31/2008 12 72.35 73.81 72.54 06.00 101.75 64.77 84.83 69.87 to 81.45 241,162 174,942
01/01/2009 To 03/31/2009 16 72.52 75.28 74.54 07.09 100.99 67.97 94.07 70.19 to 80.37 246,306 183,607
04/01/2009 To 06/30/2009 9 81.43 83.74 84.10 11.70 99.57 68.46 105.23 72.83 to 98.00 235,772 198,283
07/01/2009 To 09/30/2009 5 72.59 70.36 76.26 29.80 92.26 26.22 99.76 N/A 184,141 140,420
10/01/2009 To 12/31/2009 24 71.38 73.91 72.09 09.53 102.52 57.11 85.65 68.17 to 81.81 343,976 247,975
01/01/2010 To 03/31/2010 11 70.14 72.72 79.01 10.42 92.04 53.28 89.35 65.92 to 86.14 544,035 429,835
04/01/2010 To 06/30/2010 5 65.97 65.61 60.85 09.56 107.82 57.27 73.48 N/A 396,902 241,502
_____Study Yrs_____
07/01/2007 To 06/30/2008 43 73.41 75.61 75.99 11.29 99.50 52.59 108.48 71.38 to 75.89 302,790 230,099
07/01/2008 To 06/30/2009 44 73.12 76.45 75.74 10.89 100.94 47.33 105.23 71.62 to 77.70 248,677 188,356
07/01/2009 To 06/30/2010 45 70.16 72.30 73.43 12.36 98.46 26.22 99.76 68.24 to 73.77 381,001 279,760
_____Calendar Yrs_____
01/01/2008 To 12/31/2008 49 72.35 75.28 75.45 11.57 99.77 47.33 108.48 71.38 to 75.75 285,675 215,530
01/01/2009 To 12/31/2009 54 73.12 75.63 74.65 11.69 101.31 26.22 105.23 70.47 to 79.33 282,203 210,662
County 20 - Page 47

20 - Cuming COUNTY PAD 2011 Special Value Statistics Page: 2
AGRICULTURAL-RANDOM INCLUDE Type : Qualified
Number of Sales : 132 Median : 73 COV : 15.73 95% Median C.I. : 71.62 to 74.33
Total Sales Price : 41,136,806 Wgt. Mean : 75 STD : 11.76 95% Wgt. Mean C.I. : 71.97 to 77.74
Total Adj. Sales Price : 41,106,806 Mean : 75 Avg.Abs.Dev : 08.34 95% Mean C.I. : 72.75 to 76.77
Total Assessed Value : 30,771,090
Avg. Adj. Sales Price : 311,415 COD : 11.49 MAX Sales Ratio : 108.48
Avg. Assessed Value : 233,114 PRD : 99.87 MIN Sales Ratio : 26.22
AREA (MARKET)
RANGE COUNT MEDIAN MEAN WGT.MEAN COD PRD MIN MAX 95% Median C.I. Avg.Adj.SalePrice Avg.AssdValue
1 41 72.68 76.16 77.25 11.72 98.59 47.33 108.48 71.62 to 80.85 277,054 214,030
2 33 72.38 71.57 70.02 09.20 102.21 53.28 92.68 68.24 to 74.60 317,196 222,087
3 40 73.45 75.31 76.38 12.08 98.60 26.22 105.23 70.14 to 75.89 380,437 290,581
4 18 72.37 76.19 74.92 13.38 101.70 57.11 105.45 66.63 to 84.94 225,703 169,098
95%MLU By Market Area
RANGE COUNT MEDIAN MEAN WGT.MEAN COD PRD MIN MAX 95% Median C.I. Avg.Adj.SalePrice Avg.AssdValue
_____Dry_____
County 88 73.42 75.26 74.88 08.98 100.51 57.11 108.48 72.10 to 75.42 277,998 208,154
1 31 74.33 77.29 77.82 09.83 99.32 66.11 108.48 71.62 to 81.43 280,656 218,402
2 18 73.44 73.01 72.15 06.86 101.19 60.20 83.81 70.16 to 77.61 311,607 224,816
3 27 73.48 75.40 74.60 08.18 101.07 61.99 99.76 70.14 to 77.65 284,308 212,096
4 12 69.02 73.08 71.58 11.16 102.10 57.11 91.93 66.61 to 84.83 206,522 147,820
_______ALL_______
07/01/2007 To 06/30/2010 132 72.60 74.76 74.86 11.49 99.87 26.22 108.48 71.62 to 74.33 311,415 233,114
County 20 - Page 48

20 - Cuming COUNTY PAD 2011 Special Value Statistics Page: 3
AGRICULTURAL-RANDOM INCLUDE Type : Qualified
Number of Sales : 132 Median : 73 COV : 15.73 95% Median C.I. : 71.62 to 74.33
Total Sales Price : 41,136,806 Wgt. Mean : 75 STD : 11.76 95% Wgt. Mean C.I. : 71.97 to 77.74
Total Adj. Sales Price : 41,106,806 Mean : 75 Avg.Abs.Dev : 08.34 95% Mean C.I. : 72.75 to 76.77
Total Assessed Value : 30,771,090
Avg. Adj. Sales Price : 311,415 COD : 11.49 MAX Sales Ratio : 108.48
Avg. Assessed Value : 233,114 PRD : 99.87 MIN Sales Ratio : 26.22
80%MLU By Market Area
RANGE COUNT MEDIAN MEAN WGT.MEAN COD PRD MIN MAX 95% Median C.I. Avg.Adj.SalePrice Avg.AssdValue
_____Irrigated_____
County 11 70.80 78.84 78.36 15.14 100.61 62.64 105.45 68.09 to 105.23 349,764 274,085
1 1 72.34 72.34 72.34 100.00 72.34 72.34 N/A 323,800 234,230
2 3 68.24 67.23 67.69 03.99 99.32 62.64 70.80 N/A 340,000 230,150
3 6 74.82 81.30 80.16 15.82 101.42 68.09 105.23 68.09 to 105.23 362,357 290,477
4 1 105.45 105.45 105.45 100.00 105.45 105.45 N/A 329,460 347,400
_____Dry_____
County 104 72.76 74.77 73.93 09.61 101.14 53.28 108.48 71.64 to 74.49 280,133 207,095
1 34 72.64 76.45 76.95 09.84 99.35 64.77 108.48 71.47 to 80.37 279,890 215,373
2 25 72.59 71.68 70.02 09.00 102.37 53.28 92.68 69.23 to 75.42 308,904 216,305
3 30 73.63 76.15 75.03 08.99 101.49 61.99 104.73 70.47 to 75.89 278,072 208,626
4 15 70.04 73.37 71.74 11.05 102.27 57.11 91.93 66.61 to 84.83 236,852 169,925
_____Grass_____
County 2 49.96 49.96 49.82 05.26 100.28 47.33 52.59 N/A 190,000 94,655
1 2 49.96 49.96 49.82 05.26 100.28 47.33 52.59 N/A 190,000 94,655
_______ALL_______
07/01/2007 To 06/30/2010 132 72.60 74.76 74.86 11.49 99.87 26.22 108.48 71.62 to 74.33 311,415 233,114
County 20 - Page 49
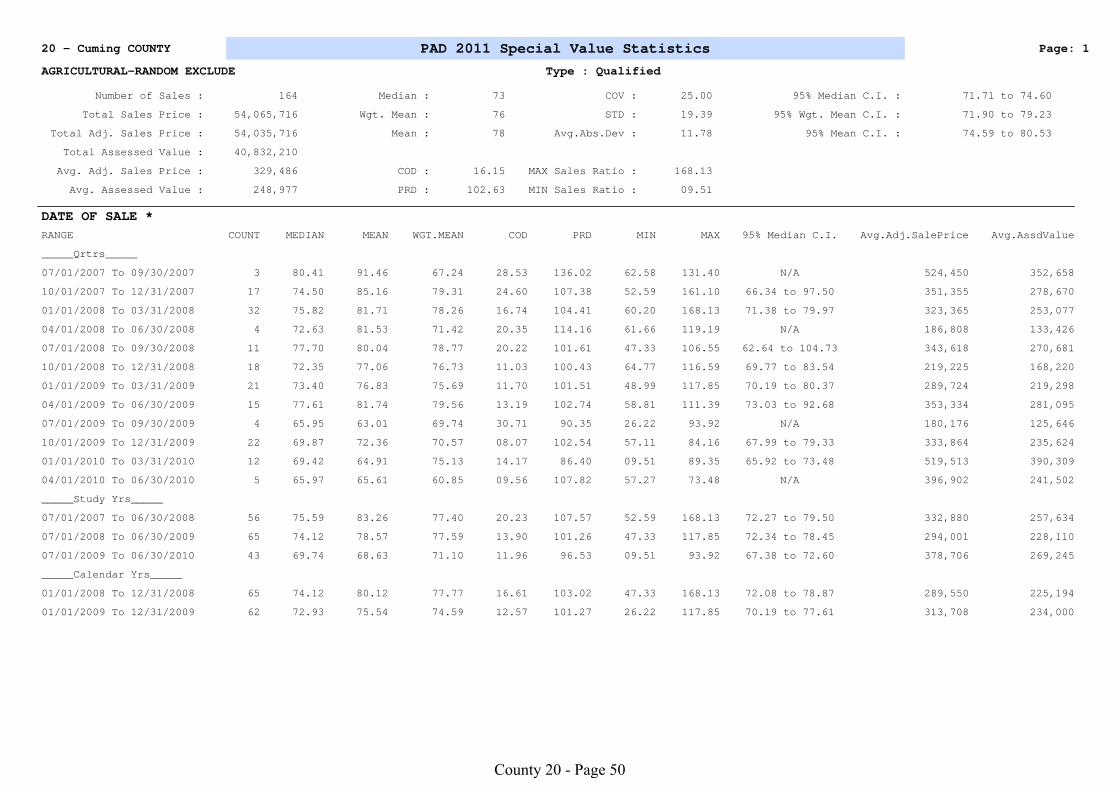
20 - Cuming COUNTY PAD 2011 Special Value Statistics Page: 1
AGRICULTURAL-RANDOM EXCLUDE Type : Qualified
Number of Sales : 164 Median : 73 COV : 25.00 95% Median C.I. : 71.71 to 74.60
Total Sales Price : 54,065,716 Wgt. Mean : 76 STD : 19.39 95% Wgt. Mean C.I. : 71.90 to 79.23
Total Adj. Sales Price : 54,035,716 Mean : 78 Avg.Abs.Dev : 11.78 95% Mean C.I. : 74.59 to 80.53
Total Assessed Value : 40,832,210
Avg. Adj. Sales Price : 329,486 COD : 16.15 MAX Sales Ratio : 168.13
Avg. Assessed Value : 248,977 PRD : 102.63 MIN Sales Ratio : 09.51
DATE OF SALE *
RANGE COUNT MEDIAN MEAN WGT.MEAN COD PRD MIN MAX 95% Median C.I. Avg.Adj.SalePrice Avg.AssdValue
_____Qrtrs_____
07/01/2007 To 09/30/2007 3 80.41 91.46 67.24 28.53 136.02 62.58 131.40 N/A 524,450 352,658
10/01/2007 To 12/31/2007 17 74.50 85.16 79.31 24.60 107.38 52.59 161.10 66.34 to 97.50 351,355 278,670
01/01/2008 To 03/31/2008 32 75.82 81.71 78.26 16.74 104.41 60.20 168.13 71.38 to 79.97 323,365 253,077
04/01/2008 To 06/30/2008 4 72.63 81.53 71.42 20.35 114.16 61.66 119.19 N/A 186,808 133,426
07/01/2008 To 09/30/2008 11 77.70 80.04 78.77 20.22 101.61 47.33 106.55 62.64 to 104.73 343,618 270,681
10/01/2008 To 12/31/2008 18 72.35 77.06 76.73 11.03 100.43 64.77 116.59 69.77 to 83.54 219,225 168,220
01/01/2009 To 03/31/2009 21 73.40 76.83 75.69 11.70 101.51 48.99 117.85 70.19 to 80.37 289,724 219,298
04/01/2009 To 06/30/2009 15 77.61 81.74 79.56 13.19 102.74 58.81 111.39 73.03 to 92.68 353,334 281,095
07/01/2009 To 09/30/2009 4 65.95 63.01 69.74 30.71 90.35 26.22 93.92 N/A 180,176 125,646
10/01/2009 To 12/31/2009 22 69.87 72.36 70.57 08.07 102.54 57.11 84.16 67.99 to 79.33 333,864 235,624
01/01/2010 To 03/31/2010 12 69.42 64.91 75.13 14.17 86.40 09.51 89.35 65.92 to 73.48 519,513 390,309
04/01/2010 To 06/30/2010 5 65.97 65.61 60.85 09.56 107.82 57.27 73.48 N/A 396,902 241,502
_____Study Yrs_____
07/01/2007 To 06/30/2008 56 75.59 83.26 77.40 20.23 107.57 52.59 168.13 72.27 to 79.50 332,880 257,634
07/01/2008 To 06/30/2009 65 74.12 78.57 77.59 13.90 101.26 47.33 117.85 72.34 to 78.45 294,001 228,110
07/01/2009 To 06/30/2010 43 69.74 68.63 71.10 11.96 96.53 09.51 93.92 67.38 to 72.60 378,706 269,245
_____Calendar Yrs_____
01/01/2008 To 12/31/2008 65 74.12 80.12 77.77 16.61 103.02 47.33 168.13 72.08 to 78.87 289,550 225,194
01/01/2009 To 12/31/2009 62 72.93 75.54 74.59 12.57 101.27 26.22 117.85 70.19 to 77.61 313,708 234,000
County 20 - Page 50

20 - Cuming COUNTY PAD 2011 Special Value Statistics Page: 2
AGRICULTURAL-RANDOM EXCLUDE Type : Qualified
Number of Sales : 164 Median : 73 COV : 25.00 95% Median C.I. : 71.71 to 74.60
Total Sales Price : 54,065,716 Wgt. Mean : 76 STD : 19.39 95% Wgt. Mean C.I. : 71.90 to 79.23
Total Adj. Sales Price : 54,035,716 Mean : 78 Avg.Abs.Dev : 11.78 95% Mean C.I. : 74.59 to 80.53
Total Assessed Value : 40,832,210
Avg. Adj. Sales Price : 329,486 COD : 16.15 MAX Sales Ratio : 168.13
Avg. Assessed Value : 248,977 PRD : 102.63 MIN Sales Ratio : 09.51
AREA (MARKET)
RANGE COUNT MEDIAN MEAN WGT.MEAN COD PRD MIN MAX 95% Median C.I. Avg.Adj.SalePrice Avg.AssdValue
1 36 72.21 72.14 72.94 12.02 98.90 09.51 98.47 69.74 to 75.46 253,024 184,555
2 37 72.35 71.11 69.70 09.38 102.02 53.28 92.68 68.17 to 73.48 308,226 214,827
3 49 73.48 75.43 74.62 13.20 101.09 26.22 105.23 70.14 to 76.15 428,817 319,970
4 42 79.70 90.39 84.42 25.29 107.07 57.11 168.13 73.03 to 91.93 297,868 251,455
95%MLU By Market Area
RANGE COUNT MEDIAN MEAN WGT.MEAN COD PRD MIN MAX 95% Median C.I. Avg.Adj.SalePrice Avg.AssdValue
_____Dry_____
County 104 73.42 76.77 75.16 13.09 102.14 09.51 161.10 71.83 to 75.42 306,803 230,602
1 26 72.47 72.48 72.39 10.90 100.12 09.51 98.00 69.74 to 75.75 248,077 179,585
2 21 72.83 71.69 71.04 07.79 100.91 58.81 83.81 66.14 to 77.41 300,467 213,451
3 31 73.48 75.73 73.53 09.10 102.99 61.99 101.01 70.14 to 76.15 341,914 251,409
4 26 78.10 86.41 82.32 22.42 104.97 57.11 161.10 68.94 to 89.17 328,783 270,663
_____Grass_____
County 1 119.19 119.19 119.19 100.00 119.19 119.19 N/A 35,000 41,715
4 1 119.19 119.19 119.19 100.00 119.19 119.19 N/A 35,000 41,715
_______ALL_______
07/01/2007 To 06/30/2010 164 72.93 77.56 75.57 16.15 102.63 09.51 168.13 71.71 to 74.60 329,486 248,977
County 20 - Page 51
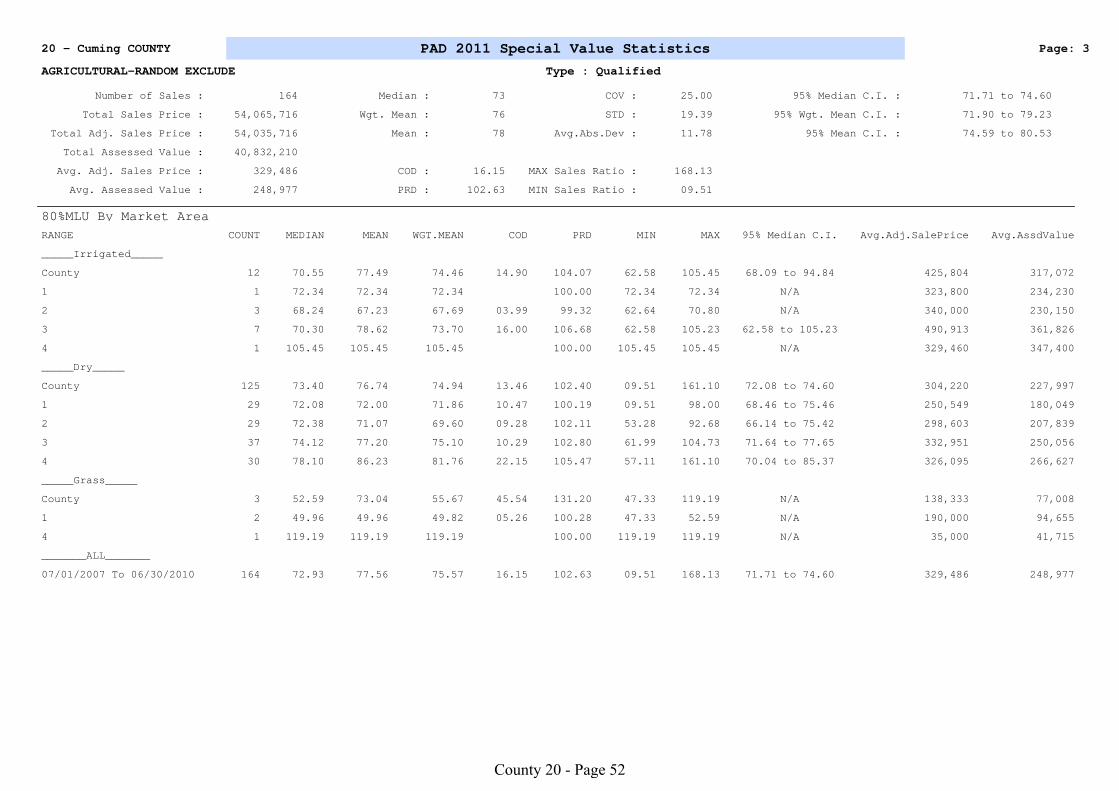
20 - Cuming COUNTY PAD 2011 Special Value Statistics Page: 3
AGRICULTURAL-RANDOM EXCLUDE Type : Qualified
Number of Sales : 164 Median : 73 COV : 25.00 95% Median C.I. : 71.71 to 74.60
Total Sales Price : 54,065,716 Wgt. Mean : 76 STD : 19.39 95% Wgt. Mean C.I. : 71.90 to 79.23
Total Adj. Sales Price : 54,035,716 Mean : 78 Avg.Abs.Dev : 11.78 95% Mean C.I. : 74.59 to 80.53
Total Assessed Value : 40,832,210
Avg. Adj. Sales Price : 329,486 COD : 16.15 MAX Sales Ratio : 168.13
Avg. Assessed Value : 248,977 PRD : 102.63 MIN Sales Ratio : 09.51
80%MLU By Market Area
RANGE COUNT MEDIAN MEAN WGT.MEAN COD PRD MIN MAX 95% Median C.I. Avg.Adj.SalePrice Avg.AssdValue
_____Irrigated_____
County 12 70.55 77.49 74.46 14.90 104.07 62.58 105.45 68.09 to 94.84 425,804 317,072
1 1 72.34 72.34 72.34 100.00 72.34 72.34 N/A 323,800 234,230
2 3 68.24 67.23 67.69 03.99 99.32 62.64 70.80 N/A 340,000 230,150
3 7 70.30 78.62 73.70 16.00 106.68 62.58 105.23 62.58 to 105.23 490,913 361,826
4 1 105.45 105.45 105.45 100.00 105.45 105.45 N/A 329,460 347,400
_____Dry_____
County 125 73.40 76.74 74.94 13.46 102.40 09.51 161.10 72.08 to 74.60 304,220 227,997
1 29 72.08 72.00 71.86 10.47 100.19 09.51 98.00 68.46 to 75.46 250,549 180,049
2 29 72.38 71.07 69.60 09.28 102.11 53.28 92.68 66.14 to 75.42 298,603 207,839
3 37 74.12 77.20 75.10 10.29 102.80 61.99 104.73 71.64 to 77.65 332,951 250,056
4 30 78.10 86.23 81.76 22.15 105.47 57.11 161.10 70.04 to 85.37 326,095 266,627
_____Grass_____
County 3 52.59 73.04 55.67 45.54 131.20 47.33 119.19 N/A 138,333 77,008
1 2 49.96 49.96 49.82 05.26 100.28 47.33 52.59 N/A 190,000 94,655
4 1 119.19 119.19 119.19 100.00 119.19 119.19 N/A 35,000 41,715
_______ALL_______
07/01/2007 To 06/30/2010 164 72.93 77.56 75.57 16.15 102.63 09.51 168.13 71.71 to 74.60 329,486 248,977
County 20 - Page 52
Agricu
ltura
l or S
pecia
l
Valu
atio
n C
orrela
tion
County 20 - Page 53
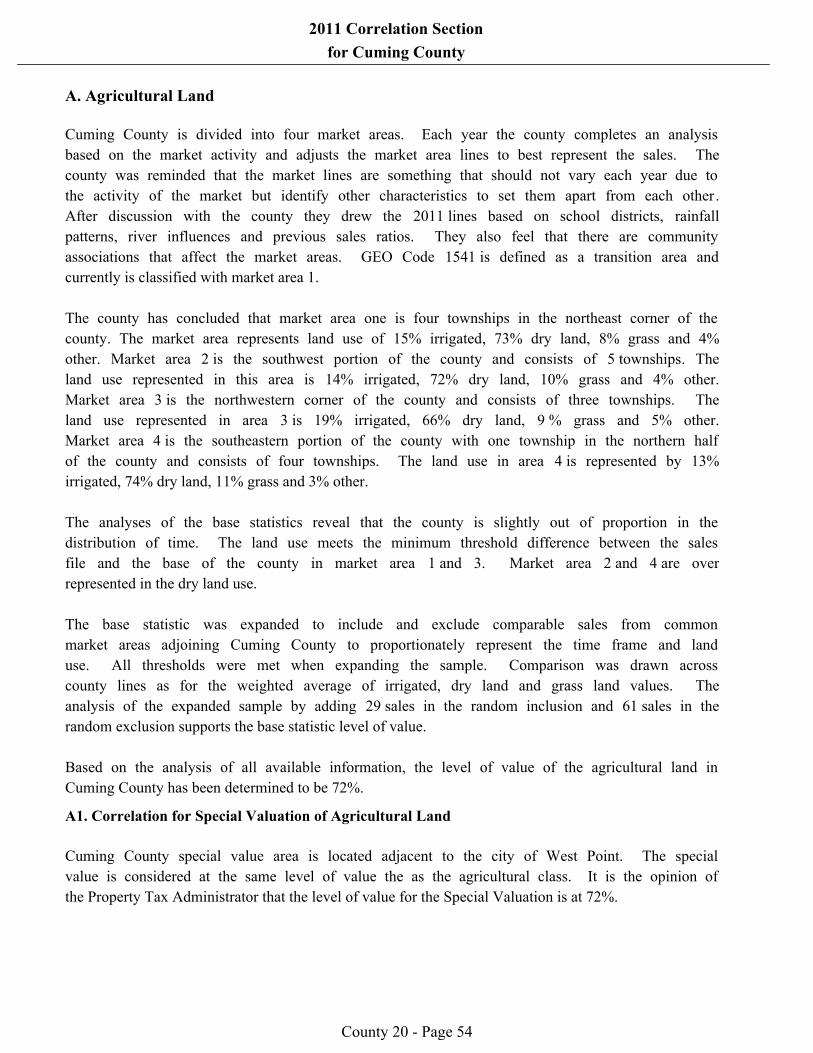
2011 Correlation Section
for Cuming County
Cuming County is divided into four market areas. Each year the county completes an analysis
based on the market activity and adjusts the market area lines to best represent the sales. The
county was reminded that the market lines are something that should not vary each year due to
the activity of the market but identify other characteristics to set them apart from each other.
After discussion with the county they drew the 2011 lines based on school districts, rainfall
patterns, river influences and previous sales ratios. They also feel that there are community
associations that affect the market areas. GEO Code 1541 is defined as a transition area and
currently is classified with market area 1.
The county has concluded that market area one is four townships in the northeast corner of the
county. The market area represents land use of 15% irrigated, 73% dry land, 8% grass and 4%
other. Market area 2 is the southwest portion of the county and consists of 5 townships. The
land use represented in this area is 14% irrigated, 72% dry land, 10% grass and 4% other.
Market area 3 is the northwestern corner of the county and consists of three townships. The
land use represented in area 3 is 19% irrigated, 66% dry land, 9 % grass and 5% other.
Market area 4 is the southeastern portion of the county with one township in the northern half
of the county and consists of four townships. The land use in area 4 is represented by 13%
irrigated, 74% dry land, 11% grass and 3% other.
The analyses of the base statistics reveal that the county is slightly out of proportion in the
distribution of time. The land use meets the minimum threshold difference between the sales
file and the base of the county in market area 1 and 3. Market area 2 and 4 are over
represented in the dry land use.
The base statistic was expanded to include and exclude comparable sales from common
market areas adjoining Cuming County to proportionately represent the time frame and land
use. All thresholds were met when expanding the sample. Comparison was drawn across
county lines as for the weighted average of irrigated, dry land and grass land values. The
analysis of the expanded sample by adding 29 sales in the random inclusion and 61 sales in the
random exclusion supports the base statistic level of value.
Based on the analysis of all available information, the level of value of the agricultural land in
Cuming County has been determined to be 72%.
A. Agricultural Land
Cuming County special value area is located adjacent to the city of West Point. The special
value is considered at the same level of value the as the agricultural class. It is the opinion of
the Property Tax Administrator that the level of value for the Special Valuation is at 72%.
A1. Correlation for Special Valuation of Agricultural Land
County 20 - Page 54

2011 Correlation Section
for Cuming County
B. Analysis of Sales Verification
Neb. Rev. Stat. 77-1327(2) provides that all sales are deemed to be arms length transactions
unless determined to be otherwise under professionally accepted mass appraisal techniques .
The county assessor is responsible for the qualification of the sales included in the state sales
file.
The Standard on Ratio Studies, International Association of Assessing Officials (2007),
indicates that excessive trimming (the arbitrary exclusion or adjustment of arms length
transactions) may indicate an attempt to inappropriately exclude arms length transactions to
create the appearance of a higher level of value and quality of assessment. The sales file, in a
case of excess trimming, will fail to properly represent the level of value and quality of
assessment of the population of real property.
The Division frequently reviews the procedures used by the county assessor to qualify sales to
ensure bias does not exist in judgments made. Arms length transactions should only be
excluded when they compromise the reliability of the resulting statistics. In cases where a
county assessor has disqualified sales without substantiation, the Division may include such
sales in the ratio study.
County 20 - Page 55

2011 Correlation Section
for Cuming County
C. Measures of Central Tendency
There are three measures of central tendency calculated by the Division: median ratio,
weighted mean ratio, and mean ratio. Since each measure of central tendency has strengths
and weaknesses, the use of any statistic for equalization should be reconciled with the other
two, as in an appraisal, based on the appropriateness in the use of the statistic for a defined
purpose, the quantity of the information from which it was drawn, and the reliability of the
data that was used in its calculation. An examination of the three measures can serve to
illustrate important trends in the data if the measures do not closely correlate to each other.
The IAAO considers the median ratio the most appropriate statistical measure for use in
determining level of value for direct equalization; the process of adjusting the values of
classes or subclasses of property in response to the determination of level of value at a point
above or below a particular range. Since the median ratio is considered neutral in relationship
to either assessed value or selling price, its use in adjusting the class or subclass of properties
will not change the relationships between assessed value and level of value already present
within the class or subclass of properties, thus rendering an adjustment neutral in its impact on
the relative tax burden to an individual property. Additionally, the median ratio is less
influenced by the presence of extreme ratios, commonly called outliers. One outlier in a small
sample size of sales can have controlling influence over the other measures of central
tendency. The median ratio limits the distortion potential of an outlier.
The weighted mean ratio is viewed by the IAAO as the most appropriate statistical measure
for indirect equalization. The weighted mean, because it is a value weighted ratio, best reflects
a comparison of the assessed and market value of property in the political subdivision. If the
distribution of aid to political subdivisions must relate to the market value available for
assessment in the political subdivision, the measurement of central tendency used to analyze
level of value should reflect the dollars of value available to be assessed. The weighted mean
ratio does that more than either of the other measures of central tendency.
If the weighted mean ratio, because of its dollar-weighting feature, is significantly different
from the median ratio, it may be an indication of other problems with assessment
proportionality. When this occurs, an evaluation of the county's assessment practices and
procedures is appropriate to discover remedies to the situation.
The mean ratio is used as a basis for other statistical calculations, such as the price related
differential and coefficient of variation. However, the mean ratio has limited application in
the analysis of level of value because it assumes a normal distribution of the data set around
the mean ratio with each ratio having the same impact on the calculation regardless of the
assessed value or the selling price.
County 20 - Page 56

2011 Correlation Section
for Cuming County
D. Analysis of Quality of Assessment
In analyzing the statistical data of assessment quality, there are two measures upon which
assessment officials will primarily rely: the Coefficient of Dispersion (COD), and the Price
Related Differential (PRD). Whether such statistics can be relied upon as meaningful for the
population depends on whether the sample is representative.
The COD is commonly referred to as the index of assessment inequality. It is used to measure
how closely the individual ratios are clustered around the median ratio and suggests the degree
of uniformity or inaccuracy resulting in the assessments. The COD is computed by dividing
the average deviation by the median ratio. For example, a COD of 20 means half of the ratios
are 20 percent above or below the median. The closer the ratios are grouped around the
median, the more equitable the assessment of property tends to be. Conversely, if the
dispersion is quite large, there is a large spread in the ratios typically indicating a large spread
around the median in the assessment of property, which results in an inequity in assessment
and taxes. There is no range of acceptability stated in the Nebraska statutes for the COD
measure. The International Association of Assessing Officers recommended ratio study
performance standards are as follows:
Single-family residences: a COD of 15 percent or less.
For newer and fairly homogeneous areas: a COD of 10 or less.
Income-producing property: a COD of 20 or less, or in larger urban jurisdictions, 15 or less.
Vacant land and other unimproved property, such as agricultural land: a COD of 20 or less.
Rural residential and seasonal properties: a COD of 20 or less.
Mass Appraisal of Real Property, International Association of Assessing Officers, (1999), p.
246.
In unusually homogeneous types of property low CODs can be anticipated; however, in all
other cases CODs less than 5 percent may be indicative of non-representative samples or the
selective reappraisal of sold parcels.
The PRD, also known as the index of regression, is a measurement of the relationship between
the ratios of high-value and low-value properties to determine if the value of property has any
influence on the assessment ratio. It is calculated by dividing the arithmetic mean ratio by the
weighted mean ratio. The PRD provides an indicator of the degree to which high-value
properties are over-assessed or under-assessed in relation to low-value properties. A PRD of
100 indicates there is no bias in the assessment of high-value properties in comparison to
low-value properties. A PRD greater than 100 indicates the assessments are regressive, which
means low-value properties tend to have a higher assessment ratio than high-value properties.
The result is the owner of a low-value property pays a greater amount of tax in relation to
value than the owner of a high-value property. Conversely, a PRD less than 100 indicates that
high-value properties are over assessed in relation to low-value properties.
There is no range of acceptability stated in the Nebraska statutes for the PRD measure. The
Standard of Ratio Studies, adopted by the International Association of Assessing Officers,
County 20 - Page 57

2011 Correlation Section
for Cuming County
July, 2007, recommends that the PRD should lie between 98 and 103. This range is centered
slightly above 100 to allow for a slightly upward measurement bias inherent in the PRD.
The PRD is calculated based on the selling price/assessed value in the sales file. This measure
can be misleading if the dollar value of the records in the sales file is not proportionate to the
dollar value of records in the population.
Mass Appraisal of Real Property, International Association of Assessing Officers, (1999), p.
247.
County 20 - Page 58

Co
un
ty R
eports
County 20 - Page 59
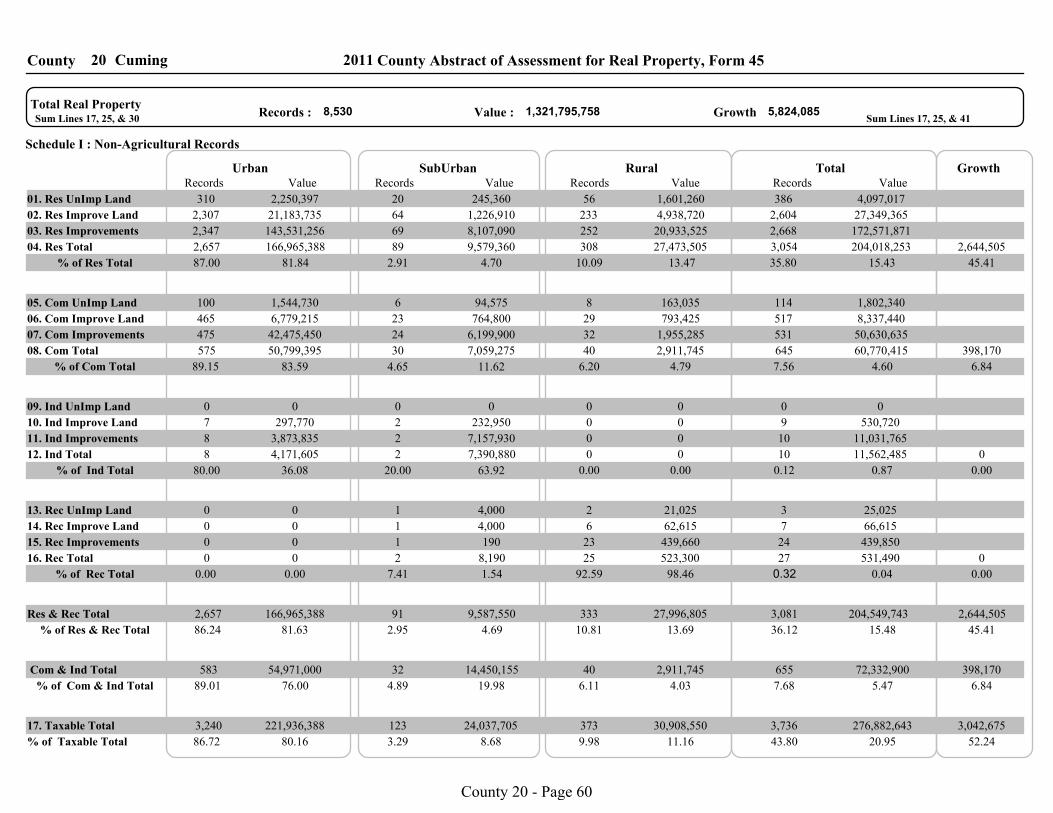
CumingCounty 20 2011 County Abstract of Assessment for Real Property, Form 45
01. Res UnImp Land
02. Res Improve Land
310 2,250,397 20 245,360 56 1,601,260 386 4,097,017
2,307 21,183,735 64 1,226,910 233 4,938,720 2,604 27,349,365
2,347 143,531,256 69 8,107,090 252 20,933,525 2,668 172,571,871
3,054 204,018,253 2,644,505
1,802,340 114 163,035 8 94,575 6 1,544,730 100
465 6,779,215 23 764,800 29 793,425 517 8,337,440
50,630,635 531 1,955,285 32 6,199,900 24 42,475,450 475
645 60,770,415 398,170
03. Res Improvements
04. Res Total
05. Com UnImp Land
06. Com Improve Land
07. Com Improvements
08. Com Total
8,530 1,321,795,758 5,824,085 Total Real Property
Growth Value : Records : Sum Lines 17, 25, & 30 Sum Lines 17, 25, & 41
09. Ind UnImp Land
10. Ind Improve Land
11. Ind Improvements
12. Ind Total
13. Rec UnImp Land
14. Rec Improve Land
15. Rec Improvements
16. Rec Total
17. Taxable Total
0 0 0 0 0 0 0 0
7 297,770 2 232,950 0 0 9 530,720
8 3,873,835 2 7,157,930 0 0 10 11,031,765
10 11,562,485 0
0 0 1 4,000 2 21,025 3 25,025
0 0 1 4,000 6 62,615 7 66,615
0 0 1 190 23 439,660 24 439,850
27 531,490 0
3,736 276,882,643 3,042,675
Urban SubUrban Rural Total GrowthRecords Value Records Value Records Value Records Value
Schedule I : Non-Agricultural Records
% of Res Total
% of Com Total
% of Ind Total
% of Rec Total
% of Taxable Total
% of Res & Rec Total
Res & Rec Total
% of Com & Ind Total
Com & Ind Total
87.00 81.84 2.91 4.70 10.09 13.47 35.80 15.43
9.98 11.16 43.80 20.95
583 54,971,000 32 14,450,155 40 2,911,745 655 72,332,900
3,081 204,549,743 2,657 166,965,388 333 27,996,805 91 9,587,550
81.63 86.24 15.48 36.12 4.69 2.95 13.69 10.81
0.00 0.00 0.04 0.32 1.54 7.41 98.46 92.59
76.00 89.01 5.47 7.68 19.98 4.89 4.03 6.11
0.00 0.00 0.12 0.87 63.92 20.00 36.08 80.00
83.59 89.15 4.60 7.56 11.62 4.65 4.79 6.20
8.68 3.29 80.16 86.72
308 27,473,505 89 9,579,360 2,657 166,965,388
40 2,911,745 30 7,059,275 575 50,799,395
0 0 2 7,390,880 8 4,171,605
25 523,300 2 8,190 0 0
3,240 221,936,388 123 24,037,705 373 30,908,550
6.84
0.00
0.00
45.41
52.24
6.84
45.41
398,170
2,644,505
County 20 - Page 60
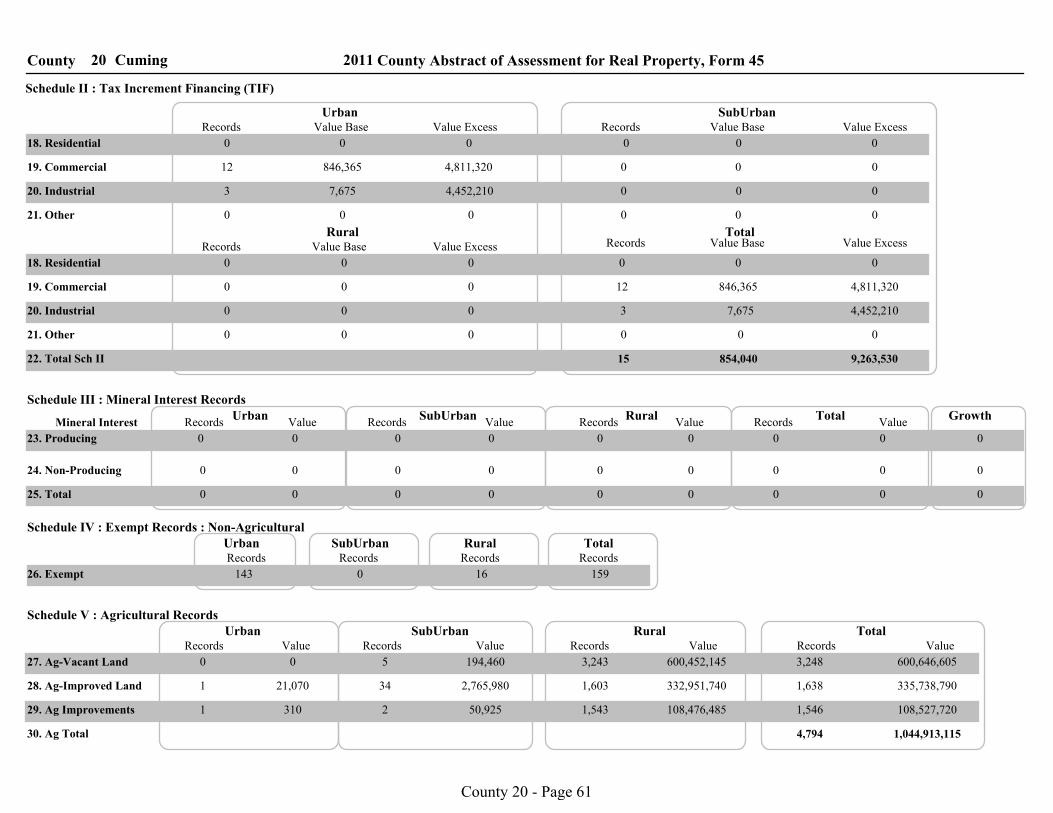
CumingCounty 20 2011 County Abstract of Assessment for Real Property, Form 45
18. Residential
Records
TotalRural
SubUrban Urban
Schedule II : Tax Increment Financing (TIF)
Value Base Value Excess Value ExcessValue BaseRecords
0 0 0 0 0 0
19. Commercial
20. Industrial
21. Other
22. Total Sch II
12 846,365 4,811,320
3 7,675 4,452,210
0 0 0 0 0 0
0 0 0
0 0 0
Value ExcessValue BaseRecordsValue ExcessValue BaseRecords
21. Other
20. Industrial
19. Commercial
18. Residential 0 0 0 0 0 0
0 0 0 12 846,365 4,811,320
0 0 0 3 7,675 4,452,210
0 0 0 0 0 0
15 854,040 9,263,530
23. Producing
GrowthValueRecords
TotalValueRecords
RuralValueRecords
SubUrbanValueRecords
UrbanSchedule III : Mineral Interest Records
0 0 0 0 0 0 0 0 0
0 0 0 0 0 0 0 0 0
0 0 0 0 0 0 0 0 0
Mineral Interest
24. Non-Producing
25. Total
Schedule IV : Exempt Records : Non-Agricultural
Schedule V : Agricultural Records
Records Records Records RecordsTotalRural SubUrban Urban
26. Exempt 143 0 16 159
30. Ag Total
29. Ag Improvements
28. Ag-Improved Land
ValueRecordsTotal
ValueRecordsRural
Records Value SubUrban
ValueRecords
27. Ag-Vacant Land
Urban
0 0 5 194,460 3,243 600,452,145 3,248 600,646,605
1 21,070 34 2,765,980 1,603 332,951,740 1,638 335,738,790
1 310 2 50,925 1,543 108,476,485 1,546 108,527,720
4,794 1,044,913,115
County 20 - Page 61
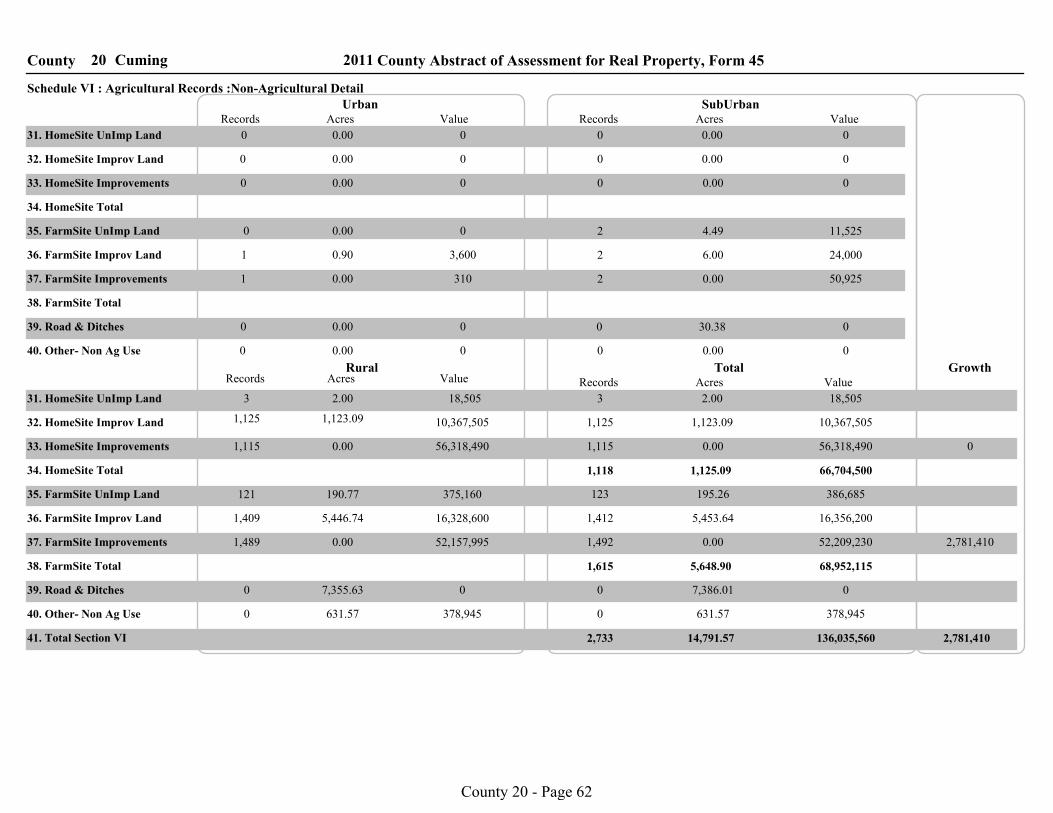
CumingCounty 20 2011 County Abstract of Assessment for Real Property, Form 45
31. HomeSite UnImp Land
Records
TotalRural
SubUrban UrbanSchedule VI : Agricultural Records :Non-Agricultural Detail
Acres Value ValueAcresRecords
32. HomeSite Improv Land
33. HomeSite Improvements
34. HomeSite Total
ValueAcresRecordsValueAcres
34. HomeSite Total
33. HomeSite Improvements
32. HomeSite Improv Land
31. HomeSite UnImp Land
35. FarmSite UnImp Land
36. FarmSite Improv Land
37. FarmSite Improvements
38. FarmSite Total
37. FarmSite Improvements
36. FarmSite Improv Land
35. FarmSite UnImp Land
39. Road & Ditches
38. FarmSite Total
39. Road & Ditches
Records
40. Other- Non Ag Use
40. Other- Non Ag Use
41. Total Section VI
0 0.00 0 0 0.00 0
0 0.00 0
0 0.00 0 0
0 0.00 0 2
1 0.90 3,600 2
1 0.00 310 2
0 0.00 0 0
0 0.00 0 0 0.00 0
0 30.38
50,925 0.00
24,000 6.00
4.49 11,525
0 0.00
0 0.00 0
3 18,505 2.00 3 2.00 18,505
1,125 1,123.09 10,367,505 1,125 1,123.09 10,367,505
1,115 0.00 56,318,490 1,115 0.00 56,318,490
1,118 1,125.09 66,704,500
190.77 121 375,160 123 195.26 386,685
1,409 5,446.74 16,328,600 1,412 5,453.64 16,356,200
1,489 0.00 52,157,995 1,492 0.00 52,209,230
1,615 5,648.90 68,952,115
0 7,355.63 0 0 7,386.01 0
0 631.57 378,945 0 631.57 378,945
2,733 14,791.57 136,035,560
Growth
2,781,410
0
2,781,410
County 20 - Page 62

CumingCounty 20 2011 County Abstract of Assessment for Real Property, Form 45
42. Game & Parks
ValueAcresRecords
SubUrban
ValueAcresRecords
Urban
0 0.00 0 0 0.00 0
42. Game & Parks
ValueAcresRecordsTotal
ValueAcresRecordsRural
Schedule VII : Agricultural Records :Ag Land Detail - Game & Parks
1 121.69 109,115 1 121.69 109,115
Schedule VIII : Agricultural Records : Special Value
43. Special Value
ValueAcresRecords SubUrban
ValueAcresRecords Urban
43. Special Value
ValueAcresRecordsTotal
ValueAcresRecordsRural
44. Recapture Value N/A
44. Market Value
0 0.00 0 0 0.00 0
0 0.00 0 0 0.00 0
0 0.00 0 0 0.00 0
* LB 968 (2006) for tax year 2009 and forward there will be no Recapture value.
0 0 0 0 0 0
County 20 - Page 63

1Market AreaSchedule IX : Agricultural Records : Ag Land Market Area Detail
2011 County Abstract of Assessment for Real Property, Form 45Cuming20County
45. 1A1
ValueAcres
46. 1A
47. 2A1
48. 2A
49. 3A1
50. 3A
51. 4A1
52. 4A
53. Total
54. 1D1
55. 1D
56. 2D1
57. 2D
58. 3D1
59. 3D
60. 4D1
61. 4D
62. Total
63. 1G1
64. 1G
65. 2G1
66. 2G
67. 3G1
68. 3G
69. 4G1
70. 4G
71. Total
Waste
Other
Exempt
Irrigated
Dry
Grass
Market Area Total 228,399,995 86,168.23
0 0.46
4,046,105 1,156.03
479,260 1,494.67
7,454,620 6,366.55
330,875 511.40
478,435 420.56
892,865 835.34
439,500 412.90
2,885,515 2,405.28
274,140 223.73
1,573,170 1,158.29
580,120 399.05
175,189,205 63,497.60
327,295 196.63
5,273.61 11,046,715
41,980,965 16,473.84
19,900,255 7,813.61
20,062,360 7,040.58
2,766,915 970.83
56,629,670 18,416.00
22,475,030 7,312.50
41,230,805 13,653.38
53,545 26.36
1,570,230 683.62
5,119,960 1,863.38
3,300,670 1,205.42
13,072,060 4,314.71
518,065 170.58
9,110,920 2,787.95
8,485,355 2,601.36
% of Acres* % of Value*
19.05%
20.42%
29.00%
11.52%
6.27%
18.19%
31.60%
1.25%
11.09%
1.53%
37.78%
3.51%
8.83%
13.65%
25.94%
12.31%
6.49%
13.12%
0.19%
5.01%
8.31%
0.31%
8.03%
6.61%
100.00%
100.00%
100.00%
Grass Total
Dry Total
Irrigated Total 13,653.38
63,497.60
6,366.55
41,230,805
175,189,205
7,454,620
15.85%
73.69%
7.39%
1.73%
0.00%
1.34%
100.00%
Average Assessed Value*
22.10%
20.58%
31.70%
1.26%
8.01%
12.42%
3.81%
0.13%
100.00%
12.83%
32.32%
21.10%
7.78%
1.58%
11.45%
3.68%
38.71%
11.36%
23.96%
5.90%
11.98%
6.31%
0.19%
6.42%
4.44%
100.00%
100.00%
3,261.89
3,267.96
3,075.03
3,073.51
1,453.75
1,358.18
3,029.65
3,037.08
2,850.05
2,849.53
1,199.66
1,225.32
2,738.19
2,747.67
2,546.87
2,548.34
1,064.42
1,068.86
2,296.93
2,031.30
2,094.72
1,664.52
647.00
1,137.61
3,019.82
2,758.99
1,170.90
0.00% 0.00
1.77% 3,500.00
100.00% 2,650.63
2,758.99 76.70%
1,170.90 3.26%
3,019.82 18.05%
320.65 0.21%72.
73.
74.
75.
County 20 - Page 64

2Market AreaSchedule IX : Agricultural Records : Ag Land Market Area Detail
2011 County Abstract of Assessment for Real Property, Form 45Cuming20County
45. 1A1
ValueAcres
46. 1A
47. 2A1
48. 2A
49. 3A1
50. 3A
51. 4A1
52. 4A
53. Total
54. 1D1
55. 1D
56. 2D1
57. 2D
58. 3D1
59. 3D
60. 4D1
61. 4D
62. Total
63. 1G1
64. 1G
65. 2G1
66. 2G
67. 3G1
68. 3G
69. 4G1
70. 4G
71. Total
Waste
Other
Exempt
Irrigated
Dry
Grass
Market Area Total 275,711,150 106,453.31
0 1.00
4,698,070 1,368.34
1,395,325 2,909.45
12,256,755 10,432.93
598,235 1,022.27
999,210 987.49
1,445,505 1,294.49
808,240 660.26
3,568,830 3,051.42
714,900 583.92
3,017,015 2,132.96
1,104,820 700.12
218,623,865 78,832.11
254,400 134.31
9,646.02 20,498,290
50,242,290 19,512.71
23,482,065 9,119.08
11,309,075 3,933.96
3,446,750 1,198.82
81,857,315 26,405.42
27,533,680 8,881.79
38,737,135 12,910.48
70,110 42.09
3,222,925 1,391.82
7,480,975 2,709.04
3,108,720 1,125.64
2,441,545 802.03
851,900 278.05
15,054,675 4,580.11
6,506,285 1,981.70
% of Acres* % of Value*
15.35%
35.48%
33.50%
11.27%
6.71%
20.44%
6.21%
2.15%
4.99%
1.52%
29.25%
5.60%
8.72%
20.98%
24.75%
11.57%
6.33%
12.41%
0.33%
10.78%
12.24%
0.17%
9.80%
9.47%
100.00%
100.00%
100.00%
Grass Total
Dry Total
Irrigated Total 12,910.48
78,832.11
10,432.93
38,737,135
218,623,865
12,256,755
12.13%
74.05%
9.80%
2.73%
0.00%
1.29%
100.00%
Average Assessed Value*
38.86%
16.80%
6.30%
2.20%
8.03%
19.31%
8.32%
0.18%
100.00%
12.59%
37.44%
24.62%
9.01%
1.58%
5.17%
5.83%
29.12%
10.74%
22.98%
6.59%
11.79%
9.38%
0.12%
8.15%
4.88%
100.00%
100.00%
3,283.18
3,286.97
3,100.02
3,100.01
1,578.04
1,414.47
3,044.21
3,063.84
2,875.12
2,874.73
1,169.56
1,224.31
2,761.74
2,761.49
2,575.05
2,574.85
1,224.12
1,116.66
2,315.62
1,665.72
2,125.05
1,894.13
585.20
1,011.87
3,000.44
2,773.28
1,174.81
0.00% 0.00
1.70% 3,433.41
100.00% 2,589.97
2,773.28 79.29%
1,174.81 4.45%
3,000.44 14.05%
479.58 0.51%72.
73.
74.
75.
County 20 - Page 65

3Market AreaSchedule IX : Agricultural Records : Ag Land Market Area Detail
2011 County Abstract of Assessment for Real Property, Form 45Cuming20County
45. 1A1
ValueAcres
46. 1A
47. 2A1
48. 2A
49. 3A1
50. 3A
51. 4A1
52. 4A
53. Total
54. 1D1
55. 1D
56. 2D1
57. 2D
58. 3D1
59. 3D
60. 4D1
61. 4D
62. Total
63. 1G1
64. 1G
65. 2G1
66. 2G
67. 3G1
68. 3G
69. 4G1
70. 4G
71. Total
Waste
Other
Exempt
Irrigated
Dry
Grass
Market Area Total 162,050,930 64,714.40
0 7.75
6,370,665 1,820.19
437,300 1,092.67
7,382,310 6,650.12
424,195 693.95
704,720 724.55
1,908,195 1,813.70
532,785 459.35
1,956,460 1,586.38
698,280 570.58
1,124,635 770.69
33,040 30.92
113,338,345 43,057.56
364,715 231.88
2,143.75 4,189,745
35,703,620 14,900.51
11,450,305 4,683.32
18,375,140 6,621.63
2,153,885 776.17
31,962,665 10,654.21
9,138,270 3,046.09
34,522,310 12,093.86
15,280 6.87
1,272,455 573.13
10,425,520 3,915.96
3,270,045 1,231.16
9,654,135 3,253.88
306,485 103.06
6,870,905 2,159.03
2,707,485 850.77
% of Acres* % of Value*
7.03%
17.85%
24.74%
7.07%
0.46%
11.59%
26.91%
0.85%
15.38%
1.80%
23.85%
8.58%
10.18%
32.38%
34.61%
10.88%
6.91%
27.27%
0.06%
4.74%
4.98%
0.54%
10.44%
10.90%
100.00%
100.00%
100.00%
Grass Total
Dry Total
Irrigated Total 12,093.86
43,057.56
6,650.12
34,522,310
113,338,345
7,382,310
18.69%
66.53%
10.28%
1.69%
0.01%
2.81%
100.00%
Average Assessed Value*
19.90%
7.84%
27.96%
0.89%
9.47%
30.20%
3.69%
0.04%
100.00%
8.06%
28.20%
15.23%
0.45%
1.90%
16.21%
9.46%
26.50%
10.10%
31.50%
7.22%
25.85%
3.70%
0.32%
9.55%
5.75%
100.00%
100.00%
3,182.39
3,182.40
3,000.00
3,000.00
1,068.56
1,459.26
2,966.96
2,973.85
2,775.02
2,775.02
1,233.29
1,223.81
2,656.07
2,662.32
2,444.91
2,396.13
1,159.87
1,052.10
2,220.19
2,224.16
1,954.40
1,572.86
611.28
972.63
2,854.53
2,632.25
1,110.10
0.00% 0.00
3.93% 3,500.00
100.00% 2,504.09
2,632.25 69.94%
1,110.10 4.56%
2,854.53 21.30%
400.21 0.27%72.
73.
74.
75.
County 20 - Page 66

4Market AreaSchedule IX : Agricultural Records : Ag Land Market Area Detail
2011 County Abstract of Assessment for Real Property, Form 45Cuming20County
45. 1A1
ValueAcres
46. 1A
47. 2A1
48. 2A
49. 3A1
50. 3A
51. 4A1
52. 4A
53. Total
54. 1D1
55. 1D
56. 2D1
57. 2D
58. 3D1
59. 3D
60. 4D1
61. 4D
62. Total
63. 1G1
64. 1G
65. 2G1
66. 2G
67. 3G1
68. 3G
69. 4G1
70. 4G
71. Total
Waste
Other
Exempt
Irrigated
Dry
Grass
Market Area Total 242,715,480 87,921.03
0 84.17
3,299,505 942.45
572,135 1,653.12
12,301,265 10,761.13
649,415 996.59
1,240,020 1,360.15
2,089,780 1,974.49
627,315 566.62
5,190,940 4,149.92
137,420 107.22
2,016,850 1,386.48
349,525 219.66
177,646,075 59,385.72
279,140 189.11
1,548.02 3,333,700
44,684,530 16,801.39
19,048,835 6,889.41
22,915,840 7,452.19
1,158,675 376.80
63,330,420 19,190.98
22,894,935 6,937.82
48,896,500 15,178.61
25,495 11.47
990,150 392.96
12,555,140 4,232.61
4,065,505 1,369.88
10,194,550 3,125.00
623,145 190.51
14,475,950 4,144.05
5,966,565 1,712.13
% of Acres* % of Value*
11.28%
27.30%
32.32%
11.68%
2.04%
12.88%
20.59%
1.26%
12.55%
0.63%
38.56%
1.00%
9.03%
27.89%
28.29%
11.60%
5.27%
18.35%
0.08%
2.59%
2.61%
0.32%
9.26%
12.64%
100.00%
100.00%
100.00%
Grass Total
Dry Total
Irrigated Total 15,178.61
59,385.72
10,761.13
48,896,500
177,646,075
12,301,265
17.26%
67.54%
12.24%
1.88%
0.10%
1.07%
100.00%
Average Assessed Value*
29.61%
12.20%
20.85%
1.27%
8.31%
25.68%
2.02%
0.05%
100.00%
12.89%
35.65%
16.40%
2.84%
0.65%
12.90%
1.12%
42.20%
10.72%
25.15%
5.10%
16.99%
1.88%
0.16%
10.08%
5.28%
100.00%
100.00%
3,484.88
3,493.19
3,300.01
3,300.02
1,591.21
1,454.65
3,262.26
3,270.93
3,075.04
3,075.05
1,250.85
1,281.66
2,967.78
2,966.29
2,764.94
2,659.57
1,107.12
1,058.39
2,519.72
2,222.76
2,153.53
1,476.07
651.64
911.68
3,221.41
2,991.39
1,143.12
0.00% 0.00
1.36% 3,500.99
100.00% 2,760.61
2,991.39 73.19%
1,143.12 5.07%
3,221.41 20.15%
346.09 0.24%72.
73.
74.
75.
County 20 - Page 67
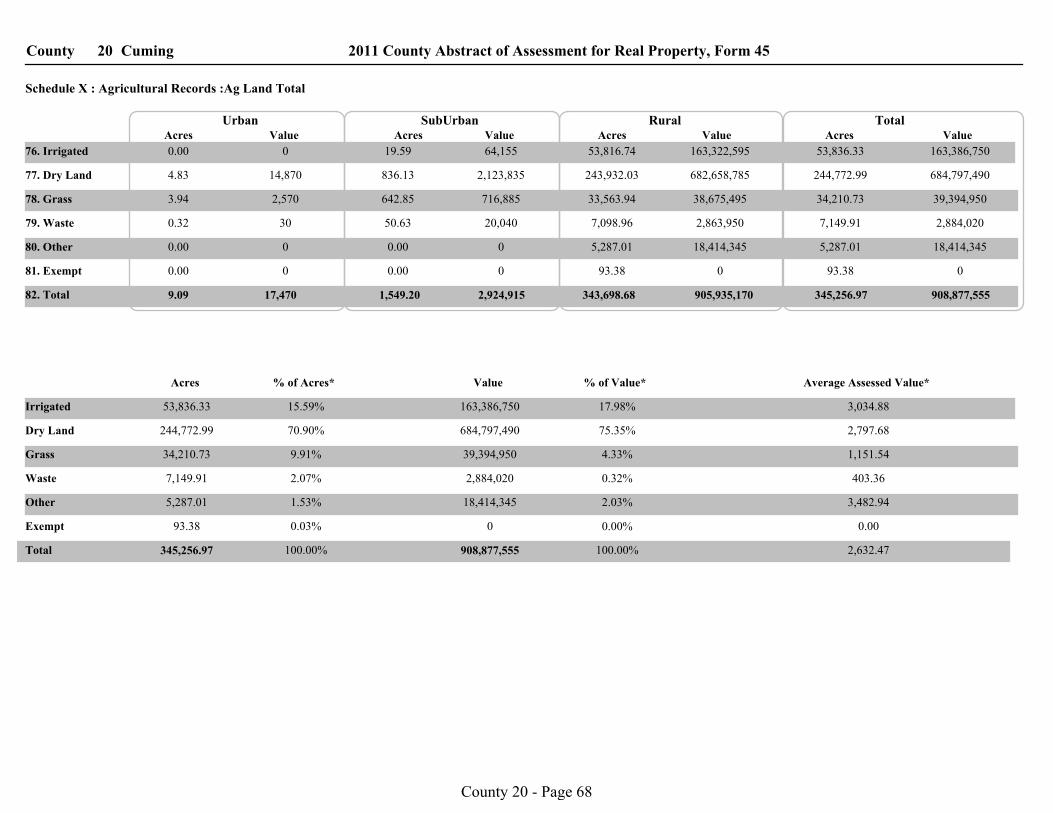
County 2011 County Abstract of Assessment for Real Property, Form 45Cuming20
Schedule X : Agricultural Records :Ag Land Total
76. Irrigated
TotalValueAcresAcres Value
RuralAcres Value ValueAcres
SubUrban Urban
77. Dry Land
78. Grass
79. Waste
80. Other
81. Exempt
82. Total
0.00 0 19.59 64,155 53,816.74 163,322,595 53,836.33 163,386,750
4.83 14,870 836.13 2,123,835 243,932.03 682,658,785 244,772.99 684,797,490
3.94 2,570 642.85 716,885 33,563.94 38,675,495 34,210.73 39,394,950
0.32 30 50.63 20,040 7,098.96 2,863,950 7,149.91 2,884,020
0.00 0 0.00 0 5,287.01 18,414,345 5,287.01 18,414,345
0.00 0
9.09 17,470 1,549.20 2,924,915
0.00 0 93.38 0 93.38 0
343,698.68 905,935,170 345,256.97 908,877,555
Irrigated
Dry Land
Grass
Waste
Other
Exempt
Total 908,877,555 345,256.97
0 93.38
18,414,345 5,287.01
2,884,020 7,149.91
39,394,950 34,210.73
684,797,490 244,772.99
163,386,750 53,836.33
% of Acres*Acres Value % of Value* Average Assessed Value*
2,797.68 70.90% 75.35%
0.00 0.03% 0.00%
1,151.54 9.91% 4.33%
3,034.88 15.59% 17.98%
3,482.94 1.53% 2.03%
2,632.47 100.00% 100.00%
403.36 2.07% 0.32%
County 20 - Page 68

2011 County Abstract of Assessment for Real Property, Form 45 Compared with the 2010 Certificate
of Taxes Levied (CTL)20 Cuming
2010 CTL
County Total
2011 Form 45
County Total
Value Difference Percent
Change
2011 Growth Percent Change
excl. Growth
196,869,940
371,835
01. Residential
02. Recreational
03. Ag-Homesite Land, Ag-Res Dwelling
04. Total Residential (sum lines 1-3)
05. Commercial
06. Industrial
07. Ag-Farmsite Land, Outbuildings
08. Minerals
09. Total Commercial (sum lines 5-8)
10. Total Non-Agland Real Property
11. Irrigated
12. Dryland
13. Grassland
14. Wasteland
15. Other Agland
16. Total Agricultural Land
17. Total Value of all Real Property
(Locally Assessed)
(2011 form 45 - 2010 CTL) (New Construction Value)
66,148,705
263,390,480
57,340,475
13,798,600
65,205,935
0
136,345,010
399,735,490
159,257,145
655,422,125
37,074,455
3,788,625
15,875,685
871,418,035
1,271,153,525
204,018,253
531,490
66,704,500
271,254,243
60,770,415
11,562,485
68,952,115
0
141,285,015
412,918,203
163,386,750
684,797,490
39,394,950
2,884,020
18,414,345
908,877,555
1,321,795,758
7,148,313
159,655
555,795
7,863,763
3,429,940
-2,236,115
3,746,180
0
4,940,005
13,182,713
4,129,605
29,375,365
2,320,495
-904,605
2,538,660
37,459,520
50,642,233
3.63%
42.94%
0.84%
2.99%
5.98%
-16.21%
5.75%
3.62%
3.30%
2.59%
4.48%
6.26%
-23.88%
15.99%
4.30%
3.98%
2,644,505
0
2,644,505
398,170
0
2,781,410
0
3,179,580
5,824,085
5,824,085
42.94%
2.29%
0.84%
1.98%
5.29%
-16.21%
1.48%
1.29%
1.84%
3.53%
0
County 20 - Page 69

CUMING COUNTY ASSESSOR’S OFFICE Cherie Kreikemeier, Assessor
200 S. Lincoln Street, Room 101
West Point, NE 68788
(402) 372-6000 Fax (402) 372-6013
www.co.cuming.ne.us
Introduction This Plan of Assessment is required by Law – Section 77-1311, as amended by 2001 Neb.
Laws LB 170, Section 5, as amended by Neb. Laws 2005, LB 263, Section 9. Purpose: Submit plan to
the County Board of Equalization on or before July 31 each year and the Department of Property
Assessment & Taxation on or before October 31 each year. This is to be a 3-year plan.
General Description of Cuming County Cuming County has a total population of 10,117 (2000 Census Bureau). We are listing 3,058
parcels of Residential property, 23 parcels of Recreational property, 637 parcels as Commercial
property, 11 parcels as Industrial property, and 4,794 parcels as Agricultural property. Cuming County
also has 114 exempt parcels, 13 TIF parcels, and 1 Nebraska Games & Parks parcel.
Cuming County has approximately 1400 Personal Property Schedules filed each year. We also
have approximately 550 Homestead Exemption applications filed each year.
The Assessor’s Office has 5 employees, in addition to the Assessor: 1 full-time appraiser, who
is 95% in charge of the appraisal process; and 3 full time clerks and 1 part time clerk who are the all-
around helpers. We all share in the responsibilities of collecting information for the real estate,
personal property, homestead exemptions, etc.
Education The Assessor and Appraiser will continue to attend mandated continuing education classes each
year. The office employees attend classes and/or seminars as needed. These classes might include:
GIS training, appraisal training, assessor’s workshops, etc. Our office has also started taking NIRMA
classes offered on the internet.
Procedures Manual Cuming County has a Policies and Procedures Manual which is updated on a continual basis. A
copy for review is available in the Assessor’s Office at all times.
Responsibilities Record Maintenance
The Assessor’s Office maintains a Cadastral Map in our office. It is kept up-to-date by the
Assessor. The background flight is a 1975 aerial photo, which is used, primarily, for ownership
records. The actual acre determination is done using the current aerial imagery layer on the GIS maps.
Currently we are assessing the number of acres by previous records and/or survey records. There is a
difference between deeded acres and GIS acres. We are currently using the deeded acres for
assessment purposes. The Assessor’s Office also updates and maintains the Irregular Tract Book for
parcel splits. In September 2005, our office started with the GIS Workshop on updating our Cadastral
County 20 - Page 70

Maps with the GIS system. We have all the parcels labeled, and have started to label the land use layer.
We are using the GIS for split, transfer, etc. and have been updating the GIS Records as the legal
descriptions change. We are currently working on the land use layer in the GIS and have completed the
soil conversion in 2010. This is taking a while as we are also trying to verify our information with the
property owner as we go through each township. We only have one license for the GIS and one clerk
working on it. She also has other duties to complete as well, which causes her to be away from the GIS
weeks at a time.
Property Record Cards The Rural Property Record Cards were replaced in 1998 and the City Property Record Cards
were replaced in 1990 and are in average condition listing 5 or more years of valuation information. In
2010-2011 we will start replacing the current property record cards for the Towns of Bancroft and
Beemer, Wisner and in 2012 the City of West Point. In order to make enough room for the transition of
new city property record cards, we invested in storage boxes and placed the 1980 –through 1997 rural
property cards and the city cards up to 1989 in the downstairs vault. We are also in the process of
scanning our assessor sheets of the rural parcels to make more room for the more current years sheets.
In the summer of 2010 we are scanning assessor sheets from 2000 to 2004, in 2011 we will scan the
2005 rural sheets, in 2012 we will scan the 2006 rural sheets, and in 2013 we plan on scanning the
1987-2007 rural house and outbuilding sheets. We will also replace the rural property record cards at
this time.
Report Generation
The Assessor timely files all reports due to the proper Government Entities:
Abstract – Due March 19 –Personal Property Abstract – Due June 15
Certification of Values – Due to subdivision August 20
School District Taxable Value report – Due August 25
3-Year Plan of Assessments –Due July 31 to County Board, October 31 to PAD
Certificate of Taxes Levied – Due December 1
Generate Tax Roll and Tax Statements – Deliver to Treasurer by November 22
Homestead Exemption Tax Loss Report – November 22
Tax List Corrections – On an as needed basis
Filing Homestead Exemption Applications
Accept Homestead Applications – after Feb 1 and on\before June 30
Send approved Homestead Exemption Applications to Tax Commissioner-Due August 1
Filling Personal Property
Accept Personal Property Schedules on or before May 1
Apply 10% penalty if filed after May 1 and by July 31
Apply 25% penalty if filed on or after August 1
Personal Property Abstract filed by June 15
Centrally Assessed Value
Review valuations certified by PAD for railroads and public service entities, establish
assessment records and tax billing for tax list in an excel program.
Tax Increment Financing
Management of record/valuation information for properties in community redevelopment
projects for proper reporting on administrative reports and allocation of ad valorem tax.
Tax Districts and Tax Rates
Management of school district and other tax entity boundary changes necessary for correct
assessment and tax information; input/review of tax rates used for tax billing process, we work
with the Clerk’s office.
County 20 - Page 71

Real Property
The assessor’s office utilizes the CAMA 2000 computer program. CAMA 2000 implements
the Marshall& Swift pricing system. We are currently using the 2009 pricing version. We use this
program to develop the cost approach and sales comparison approach for all residential properties.
Digital photos are taken during inspections, reviews, and pickup. These photos are then labeled by
parcel and stored in CAMA. The linking of these digital photos allows us to print digital photos on our
sales files and with the property record card.
All commercial buildings, agricultural buildings, and anything not priced in CAMA 2000 are
manually priced using the 2009 Marshall& Swift pricing manual. Data is entered into excel
spreadsheets to create information/pricing sheets for the properties. We develop the cost, sales
comparison, and income approach for commercial properties. Depreciation tables are developed based
upon sales for the agricultural properties.
Our review process consists of physical inspections, aerial flights and interior inspections (if
possible). Any improvements, changes, or discrepancies are corrected by measuring/remeasuring,
collecting data; taking digital photos, comparing the data and entering that data into our computer
database/updating our property record card files with updated information. If the property owner is not
present, we leave a questionnaire for the property owner to fill out and return to our office or they may
call our office with the information. If there continues to be questions, we will set up an appointment
to review the property again. We also get information from newspaper listings, sales reviews, broker
information, personal knowledge, etc., before placing a value on a parcel.
Our pick-up work is started in late fall and continues until the March deadline for the abstract
filing. We use building permits, property owner information sheets, and in-field sightings for adding
properties to the property valuation rolls. Our inspections are similar to the reviews, except we provide
the property owner (who has reported their improvements) with a written notice that we will be
inspecting properties in their township, village, or town. We ask those property owners to call us to set
up an appointment. This allows us to schedule our inspections in an orderly fashion and allows the
property owner to schedule the appointments around their schedules. The properties, where the owner
doesn’t schedule an appointment, are inspected as we are in the neighborhood or the area. We also
obtain limited information from our Zoning Administrator and Personal Property Schedules.
Sales Review
The Assessor’s Office does an in-house sales review. This process includes comparing our
property record card file, with any information we obtain during our sales review, and the Property Tax
Sales File for any discrepancies. These discrepancies might affect the sale and ultimately the value
placed on that property and similar properties.
We use a verification questionnaire which is done by phone, mail or if possible, in person. We
visit with either the seller, the buyer or even the broker or lawyer for information pertaining to that
particular sale.
County Board of Equalization
The Assessor and Appraiser attend county board of equalization meetings for valuation protest,
We review the properties in question a second time and spend lots of valuable time on these
extra issues.
County 20 - Page 72
TERC
The Assessor and Appraiser spend lots of valuable time in preparing information for TERC
hearings, plus there is lots of extra expense in defending our values. TERC hearings take lots of
valuable time away from the office. The Assessor prepares for the TERC Statewide Equalization
hearings if applicable to the county to defend values and/or implement orders of the TERC
CUMING COUNTY’S 3-YEAR ASSESSMENT PLAN
2011-2013
Rural Residential In 2010 we completed the process of implementing the 2009 Marshall& Swift pricing and
reappraising all rural residences and rural buildings using the aerial imagery photos. We have also sent
out verification sheets to the property owners in 8 townships. We will continue to send out verification
sheets to the remaining townships. The verification sheets for the rural residential include, but are not
limited to: review of home, review of buildings information, and a GIS photo and corresponding land
use sheet. The resulting data collected will be inputted and corrected in CAMA, the sketches will be
checked, and the photos will be printed and attached in the CAMA 2000 system. We have completed
the revaluation of the rural buildings using an Excel spreadsheet that we have developed with the
Marshall& Swift 2009 pricing. The Excel program allows us to enter data and reprice every building
on every rural property. The values are entered in GIS and a Cost approach and Comparable sales
approach is developed for every rural residential property. We took aerial imagery photos (oblique
photos) in the year 2006 and plan to have them retaken in 2012. After we receive the 2012 aerial
imagery, we will start our rural reappraisal by reviewing photos & match buildings in the photos. In
2011 we plan to continue to monitor market values and add any new improvements or remodeling. The
summer of 2010 Jenny will take digital pictures of Cottonwood Chimes, Wisner Yacht Club, & Par
Acres subdivisions. We will then attach them to their corresponding record in the CAMA 2000
program.
Residential We updated the Marshall& Swift pricing on all residential properties for 2010 assessment year
(using the 2009 Marshall& Swift pricing). The Wisner properties were reappraised (including
converting residential lot pricing to square foot instead of front foot) for the 2009 assessment year.
Beemer’s inspection, pictures and reappraisal are planned for the summer of 2011 (last
inspected 2006), Wisner in 2012 (last inspected 2006), West Point in 2013 (last inspected 2007), and
Bancroft in 2014 (last inspected 2007). Bancroft is planned for 2014 to get into a routine of reviewing
1 town per year, and getting into a rotation.
In 2011 we will run new comparables for Bancroft. West Point’s and Wisner’s excess lots and
their values will be reviewed. The residential properties values and ratios are monitored on a yearly
basis and may need to be revalued to stay within required ratios.
Commercial Property In 2010 we completed the West Point commercial property appraisal. In 2011 we will do the
reappraisal of Bancroft and Beemer. We will also complete the Apex sketches for Beemer.
Commercial digital pictures will be updated when we update the residential digital pictures. In 2011,
we are rearranging our Excel commercial sheets to improve their readability. This will be a time
consuming project. The commercial properties are reappraised using cost, comparable sales (if
County 20 - Page 73
available), and income approach (if applicable and if we receive adequate income and expense
information).
Agricultural Property
The Cuming County Assessor's Office is currently negotiating with GIS Workshop to retake
aerial imagery (photos of rural improvements and home sites) for the fall of 2011. It will be 6 years
since the last aerial imagery was taken. The proposed cost is $23,000. This cost is to be divided into
two equal payments. We feel this is an important tool for equalization of properties (adding buildings
that may not be reported) and eliminating disagreements with property owners.
The office is in the process of updating the cadastral maps to a Geographic Information System
(GIS). For the 2010 assessment year we implemented the GIS land use in 6 townships and for the 2011
assessment year we plan to implement the remaining 10 townships. After reviewing the properties
with the GIS, a copy of the results are mailed to the property owner for review (at the same time we
mail out property/building review sheets). GIS was used to determine intensive use areas
(feedlots/lagoon areas) during their revaluation. We have found the GIS to be especially helpful in
parcel splits (especially metes & bounds), new subdivisions, replats, etc. for correctly valuing
properties. Our dependence on the program has grown to the point that we are having difficulty getting
the remaining mapping done on the 10 townships. Recreational land/river properties will be the most
difficult area to calculate. We will need to take extra caution along the Elkhorn River due to the
flooding of 2010. It will require extra detail and consideration. We are hoping to receive a 2010
imagery layer from the FSA that might show the flood damage, which might delay our ability to
complete the properties along the river.
We hope to have it complete for the 2011 or 2012 assessment year (based upon staffing ability
and time permitting). The GIS has several steps to complete before we will be able to use it to it’s full
potential, but we believe it will be very beneficial for not only our office, but other county offices as
well (i.e. zoning, roads dept, E911, civil defense, and the sheriff’s dept). We are very appreciative for
the funding of this project. The GIS information is available on a 2nd
computer for public use,
courthouse use, or other employees in the office. The 2nd
computer is used for viewing and printing
pictures only. It can’t be used to edit the information.
Our agricultural land values are monitored on a yearly basis, using our sales file. We also
monitor the land use (i.e. irrigated, dryland, pasture, etc) using FSA aerial photography layer,
inspections, and property owner provided information. We have developed sales files on agricultural
land, feedlots, confinement hog buildings, and recreation land. This data often provides significant
insight into these properties, and provide us with abstracted data, which is quite useful in our continued
monitoring of the valuations. One example of this insight is depreciation tables being developed for
the rural buildings. We have completed a reappraisal of all farm buildings. We are currently in the
process of reviewing all buildings on every property through mail in review sheets (6 of 16 townships
completed).
In 2010 we implemented the new Soil Conversion and symbols. With the high land values and
the new soil codes, we believe it is more important than ever to be very detail oriented with our sales
file. (We are currently developing new ways to breakdown our agricultural sales.) The unique property
characteristics that we are monitoring include: sand spots, alkali spots, wetlands, areas prone to
flooding, river/recreational properties, Wetlands Reserve Program, and properties with inaccessible
areas. These characteristics are being monitored to determine if any market adjustment is necessary.
This will slow up the valuation process of agricultural land, but we want to be as fair and equitable as
possible.
County 20 - Page 74
Each year we have a significant amount of pickup work (nearly 600 parcels / year). As we
inspect a property for new improvements or removal of any improvements, we make a complete
inspection of the entire property for any changes. We would rather revalue the property at the same
time, rather than returning to the property and irritating the property owner again. (We have enough
problems with that, as it is). This does slow up the pickup process significantly, but we feel this is
necessary to maintain accurate records.
Cuming County is a very progressive and prosperous agricultural county. We are seeing a
significant amount of improvements each year within the county. Along with those improvements, we
have seen the sale of properties, within the county, continue to be very strong and agricultural values
have increased significantly over the past few years. This indicates a continual need to monitor the
assessed values on an annual basis, as they will also be increasing dramatically. There is also, a
significant increase in the number of irrigated acres added each year. In addition, our office has
identified numerous cattle yard improvements, such as yards, bunks, lagoons, etc. (most of this is due
to DEQ requirements).
Overview
All of the plans listed above for our 3-year assessment process are goals that have been
established by the Assessor and her appraisal staff. They are all still contingent on time, state
mandates, help and monies budgeted for these years. We would like to also stress that this is a plan
and may need to be changed at any time to address priority issues.
Our County Board has continued to be very cooperative in allowing the Assessor’s Office the
equipment and monies needed to keep current in our assessment process. We are quite appreciative of
their support and hope to live up to their expectations and ours. Our office realizes how important our
job is to correctly value properties for both the property owners and the taxing entities. We work very
hard to implement any process that might improve our ability to value all properties fairly and
equitably.
Valuing properties is a very important, difficult, and time consuming task, for these reasons it
is important to retain good quality employees. Employees of the Assessor’s office often need to be
knowledgeable about many topics that may impact the assessment process. Since there is not a lot of
time to spare it is important to avoid employee turnover and retain knowledgeable employees.
Because of the importance of the employees to the assessment process, employee salaries account for a
majority of the Assessor’s budget.
We are currently cross training employees to be able to complete co-workers duties in case of
emergencies. The staff is doing a very good job and we feel we are moving forward in every aspect of
the office. We hope someday to be caught up, but with the requirements of the office, the technology
changes, and the real estate market continually changing, we know that this is nearly impossible. In
order to get some of these projects completed and stay current, we will continue to have some part time
help during the year.
Respectfully submitted,
Cherie Kreikemeier Date: July 27, 2010
Cuming County Assessor's Office Updated :
County 20 - Page 75
2011 Assessment Survey for Cuming County
A. Staffing and Funding Information
1. Deputy(ies) on staff:
0
2. Appraiser(s) on staff:
1
3. Other full-time employees:
3
4. Other part-time employees:
5. Number of shared employees:
1
6. Assessor’s requested budget for current fiscal year:
$203,223
7. Adopted budget, or granted budget if different from above:
8. Amount of the total budget set aside for appraisal work:
$90,670
9. Appraisal/Reappraisal budget, if not part of the total budget:
10. Part of the budget that is dedicated to the computer system:
$11,000
11. Amount of the total budget set aside for education/workshops:
$1,000
12. Other miscellaneous funds:
13. Amount of last year’s budget not used:
$3,482
B. Computer, Automation Information and GIS
1. Administrative software:
MIPS
2. CAMA software:
MIPS
3. Are cadastral maps currently being used?
Yes
4. If so, who maintains the Cadastral Maps?
Assessor
5. Does the county have GIS software?
Yes
County 20 - Page 76
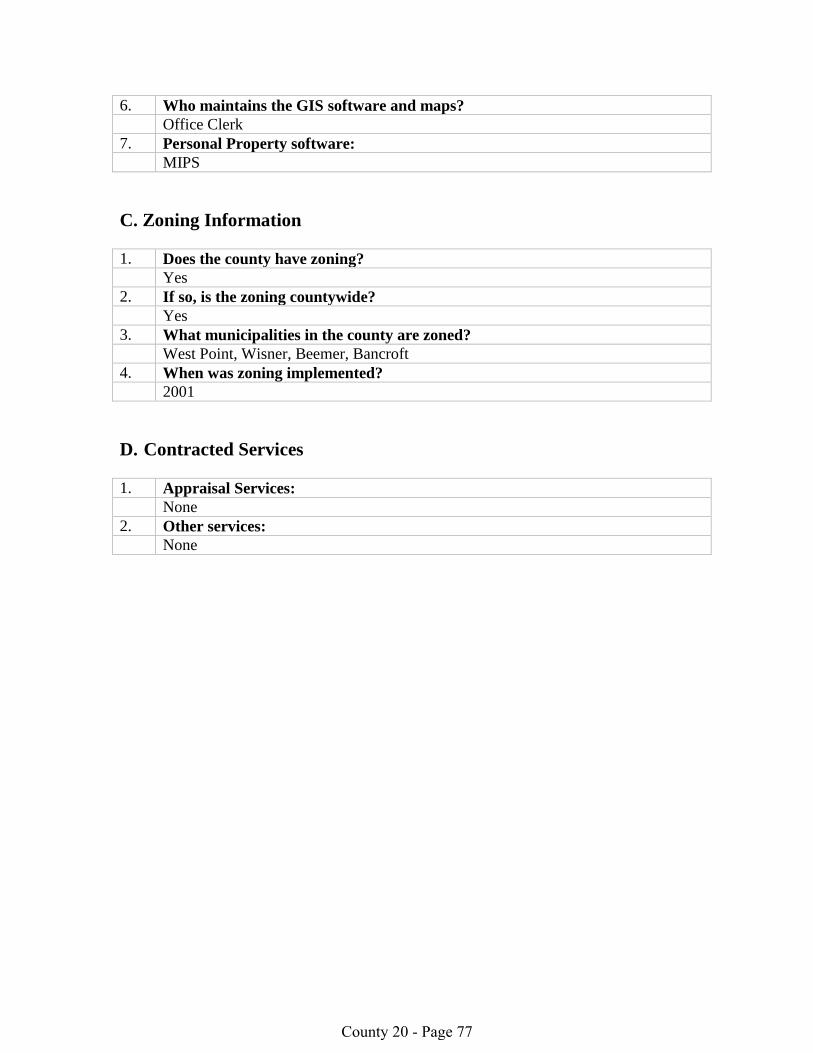
6. Who maintains the GIS software and maps?
Office Clerk
7. Personal Property software:
MIPS
C. Zoning Information
1. Does the county have zoning?
Yes
2. If so, is the zoning countywide?
Yes
3. What municipalities in the county are zoned?
West Point, Wisner, Beemer, Bancroft
4. When was zoning implemented?
2001
D. Contracted Services
1. Appraisal Services:
None
2. Other services:
None
County 20 - Page 77

Certifica
tion
County 20 - Page 78
2011 Certification for Cuming County
This is to certify that the 2011 Reports and Opinions of the Property Tax Administrator
have been sent to the following:
One copy by electronic transmission to the Tax Equalization and Review Commission.
One copy by electronic transmission to the Cuming County Assessor.
Dated this 11th day of April, 2011.
Ruth A. SorensenProperty Tax Administrator
County 20 - Page 79

Ma
p S
ection
County 20 - Page 80

Valu
atio
n H
istory
County 20 - Page 81