Embed Size (px)
Citation preview


i
TABLE OF CONTENTS
1 SOCIO-ECONOMIC PROFILE .........................................................................1 1.1 Overview of the Northern Cape Province..........................................................1 1.1.1 Demographics ...................................................................................................1 1.1.2 Health and health care ......................................................................................2 1.1.3 Stakeholders .....................................................................................................2 1.1.4 Social problems.................................................................................................2 1.1.5 Economic activities............................................................................................3 1.1.6 Road network in the Northern Cape..................................................................3 1.1.7 Road traffic crashes in the Northern Cape ........................................................3 1.1.8 Traffic offences in the Northern Cape ...............................................................4 1.1.9 Traffic safety initiatives ......................................................................................4 1.1.10 Departmental programmes................................................................................5 1.1.11 Vehicle registration and licensing......................................................................5 1.1.12 Mode of transport to services ............................................................................5 1.2 Siyanda District Municipality..............................................................................5 1.2.1 District demographics........................................................................................6 1.2.2 Siyanda local municipalities profile....................................................................8 1.2.3 Demographics of communities next to the N14.................................................9 1.2.4 !Kheis Local Municipality (NC 084) .................................................................10 1.2.5 Demographics of communities next to the N10...............................................11 1.2.6 Schools and learners along the N10 and N14.................................................12 1.3 Community traffic safety survey ......................................................................13 1.3.1 Focus groups...................................................................................................13 1.3.2 Summary of focus group responses................................................................13 1.3.3 Analysis of accidents.......................................................................................15 1.3.4 Analysis of learner questionnaires ..................................................................16 1.4 RECOMMENDATIONS ...................................................................................24
LIST OF TABLES
Table 1: Summary of focus group responses ....................................................................... 13
Table 2: Summary of problems and recommendations ........................................................ 24

ii
ASSOCIATED DOCUMENTS
ORANGE RIVER COMMUNITY IMPACT ASSESSMENT REPORT:
SECTION A: SOCIO-ECONOMIC PROFILE
SECTION B: COMMUNITY TRAFFIC SAFETY SURVEY

1
EXECUTIVE SUMMARY COLESBERG COMMUNITY EMPOWERMENT IMPACT ASSESSMENT
1 SOCIO-ECONOMIC PROFILE
1.1 Overview of the Northern Cape Province
1.1.1 Demographics
Northern Cape is the province with the largest land area (372 889 square kilometers or
30.5% of the country) and the smallest population in South Africa (822 727 people in
2001) and the only province with a declining population growth. The Northern Cape has
5 District Municipalities, 215 communities and 26 local authorities. District
Municipalities are:
• Kgalagadi District Municipality (D45) • Frances Baard District Municipality (DC9) • Namakwa District Municipality (DC6) • Pixley Ka Seme (DC7) • Siyanda District Municipality (DC 8)
This report focuses on the Siyanda District Municipality
Other demographics include:
• Gender: 50% of the population is male and 50% is female. • Language distribution: Afrikaans (70%), Tswana (20%) and Xhosa (6.5%) • In 2000 the Northern Cape had 6556 educators and 200871 school learners • Life expectancy is 57.5 in 2006 and expected to decline to 55.1 in 2015, due to
AIDS • It is estimated that there is currently almost 10 000 AIDS orphans in the
Northern Cape • According to the Medical Research Council, HIV Aids, Tuberculosis, violence
and diarrhoeal diseases were the 4 leading causes of death in the province for both males and females
• Literacy levels in the Northern Cape Province are estimated to be around 80%

2
1.1.2 Health and health care
Overall, HIV AIDS is the biggest single cause of death in the Northern Cape. HIV AIDS
(in 2000) constituted approximately 13.9% of all deaths in the Province – with women
about 9% higher than men.
There are 95 clinics in the Northern Cape and the services rendered at Northern Cape
primary health care clinics do not compare well with the rest of SA. In contrast to that,
the emergency services compared better. NC showed an improvement from 71% to
92% (compared to SA from 55% to 57 %) response time less than an hour. Even so, in
some areas there is still a problem with waiting times of 3 hours.
Emergencies that arrive at district clinics are usually referred to the nearest hospital.
Kimberley, Upington, Springbok and Bloemfontein have referral hospitals which often
are hundreds of kilometers away from clinics.
1.1.3 Stakeholders
Some of the stakeholders in the province are:
• Provincial government departments • SAPS • Traffic Authorities (provincial and local) • District municipalities • BHP Billiton Development Trust (BBDT) • Other mining companies and mining related companies (De Beers, Anglo
American, Samancor and Assmang, Mittal Steel, Samancor, Gold Fields, PPC Lime, Alpha)
• Agricultural institutions and farms • Youth against crime • OFM radio station • Hantam Education Trust • Love Life Youth Centre
1.1.4 Social problems
1.1.4.1 Alcohol abuse
The Northern Cape has the highest alcohol dependency figure in the country for both
men and women (18.5% for women and 38.6% for men). The national comparative
figures are 9.9% for women and 27.6% for men.
3
1.1.4.2 Crime
Northern Cape had the highest ratio of violent crimes per 100 000 population (3433
cases compared to 3250 in the Western Cape, 3037 in Gauteng and 2136 in the Free
State) in 2002/03. In 2003/04, Northern Cape had the 2nd highest ratio of drug related
crime per population (after Western Cape). There are 83 police stations in the
Northern Cape and 4497 sworn officers.
1.1.4.3 Poverty
The unemployment rate has risen from 29% to 33% (2001) and 42,8% of the people
have an income below the poverty breadline of R800.
Umsobomvu local municipality has the highest rate of unemployment, which is
attributed to the decline in the railway industry in the area.
The Human Development Index (HDI) is 0.58, which is lower than the national HDI of
0.72.
1.1.5 Economic activities
Mining and agriculture are most important industries to Northern Cape's economy. The
trade sector as well as transport and finance industries also contribute to the provincial
economy while the tourism, fishing and mari-culture seem to be promising future
industries for the province. Mining has been a mainstream and export-oriented industry
for a century. Many mining giants like De Beers, Anglo American, Samancor and
Assmang operate in the Northern Cape.
The wine industry is expanding fast and the province is now one of the key wine-
producing areas of South Africa. Other agricultural activities include sheep farming and
fruit.
1.1.6 Road network in the Northern Cape
The Northern Cape has a total road network of 64 816km of which 5 633 km is paved,
22 183 km unpaved and 37 000 km minor roads.
1.1.7 Road traffic crashes in the Northern Cape
Road traffic crashes were the 7th leading cause of death for both males and females in
the Northern Cape.

4
For males and females age 5-14 years road traffic accidents were a major leading
cause of death in the Northern Cape. Boys (32.2 %) were more vulnerable than girls
(16.5 %)
Road traffic crashes were the 4th leading cause of death among adults age 16-44
years.
On average there are 240 fatal crashes in per year in the NC (2002 to 2006), in which
305 people lose their lives. In the last 5 years, on average, passengers comprised
40% of fatalities, followed by 34% drivers and 26% pedestrians.
26.7% of road users died on a Saturday, reflecting the national pattern, but
proportionately the highest percentage of all provinces.
Single vehicle overturn accidents were 40% of all fatal accidents, compared to 21% at
national level (the next highest province is Limpopo with 27%).
1.1.8 Traffic offences in the Northern Cape
The major and most critical traffic offences leading to fatal crashes and injuries in the
Northern Cape are:
• Speed too high for a particular circumstance • Driving under the influence of alcohol and fatigue • Vehicle unfitness/ un-roadworthiness • Failure to wear seatbelts
Of the total number of unlicensed vehicles (397 993) in South Africa, 2% were in the
Northern Cape. Of the total number of un-roadworthy vehicles in South Africa (219533),
1% was found in the Northern Cape.
Problems such as the level of fraud and corruption pertaining to licenses and permits
persist. The Province conducted investigations into 21 complaints received in respect
of disciplinary and criminal charges of driving license fraud/corruption during 2004.
1.1.9 Traffic safety initiatives
Traffic management within the province currently falls under the Department of
Transport, Roads and Public Works. The main aim of the traffic management function
is to promote and facilitate effective, efficient and safe mobility on the roads in the
province. Traffic law enforcement, traffic law administration and road safety fall under
this function.
Junior Traffic Safety Centres were established since 2004.

5
The Department and the OFM radio station have entered into a partnership to promote
road safety by erecting 9mx3m billboards at 4 sites in the Province:
• Kimberley N12 South • Between Keimoes and Kakamas on the N14 • Between Upington and Olifantshoek on the N14. Colesberg N1 • Hopetown N12 North
Four Arrive Alive patrol cars were allocated to the province in March 2004 and are
utilized on the N12 between Kimberley and Warrenton, the R31 between Kimberley
and Barkley West, the N14 between Upington and Kakamas, the N7 between Calvinia
& Springbok and the N1 between Colesberg and Three Sisters.
According to the NDOT National Household Travel Survey (2003), approximately 21%
of the Northern Cape population has a driver’s license.
1.1.10 Departmental programmes
The Department of Transport, Roads and Public Works allocates bursaries to
personnel as well as individuals outside of the Department who are studying in fields
relevant to the Department's core functions, like Engineering, Quantity Surveying,
Transport Management and Architecture.
The Department uses the Tswelelopele Training Centre to train road workers and
foremen in functional and managing skills. All road workers receive training in Social
Programmes as well as HIV/Aids awareness.
1.1.11 Vehicle registration and licensing
According to the Department of Transport (2002) the Northern Cape had a total number
of 23 vehicle-testing stations.
1.1.12 Mode of transport to services
The National Household Travel Survey (NDOT: 2003) found that members of most
households in the Northern Cape have to walk (53%) to get to medical facilities. 79%
walk to educational facilities and walk 42% to work.
1.2 Siyanda District Municipality
Previously known as the Lower-Orange River region, Siyanda District municipality
consists of 6 local authorities.
• Mier Municipality (NC 081)
• Kai! Garib Municipality (NC 082)

6
• ////KHARA HAIS Municipality (NC 083
• ! Kheis Municipality (NC 084)
• Tsantsebane Municipality (NC 085)
• Kgatelopele Municipality (MDB: 2005)
The District Management Area (DMA) of Siyanda District Municipality exists mainly of
areas in the Kalahari, private farmlands in the Kenhardt and surrounding areas as well
as the Community of Riemvasmaak.
1.2.1 District demographics
1.2.1.1 District population
According to the Municipal Demarcation Board (2006), the population of Siyanda are
estimated at between 191 891 to 202 096 people (based on census 2001 data). DWAF
(2006) estimated the current annual household growth in Siyanda at 0.9% per year.
Household density is in the region of 2.71 people per household. The population is
distributed in the in local municipalities as follows: Mier Municipality (3%) ;Kai! Garib
Municipality (28%) ; ////KHARA HAIS Municipality (39%) ;! Kheis Municipality (9%) ;
Tsantsebane Municipality (13%) ; Kgatelopele Municipality (8%).
1.2.1.2 Gender
Consistent with the provincial gender profile Siyanda consists of 51% females and 49%
males.
1.2.1.3 Age distribution in the district
40% of the population is below the age of 19 years, while 15% of the population is older
than 50 years.
1.2.1.4 Education profile
24% of the Siyanda District population has had some primary schooling and 16% had
no schooling at all, with 9% completing primary school. 30% had some secondary
schooling, 16% completed grade 12 and only 5% went on to receive higher education
and training.
1.2.1.5 Household income
The last socioeconomic survey in 2000 indicated that approximately 60% of the
population of Siyanda had a monthly household income of between R0-R800.

7
1.2.1.6 Occupations
48% of people that are employed in the district have elementary occupations (48%).
Agriculture (skilled) work contributes to 10% of the occupation.
87% of people earn R800 per month or less.
24% of households consist of one person only, 17% of two people, 14% of three and
15% of four and 10% of five people per household. 4% consists of ten or more people.
1.2.1.7 District economic activities
• Agriculture and farming
There is extensive livestock farming, with some game farming and irrigation farming.
The wine and grape industry contributes a great deal to the local economy.
• Tourism
There are various National Parks and Reserves in this region: Kgalagadi Transfrontier
Park, Spitskop Nature Reserve, Augrabies National Park, Eco-adventures and Safaris:
Possible future products are, according to the IDP (2004):
The development of the San and Nama cultures as a tourist attraction in areas adjacent
to the Kgalagadi National Park.
• District wide mining and minerals
Minerals are only found on a small scale in this region
Salt: Salt is being mined at two large pans but a total of 110 Saltpans in the interior (69
coastal saltpans, as well as sea salt plants where salt is produced), the importance of
the two pans north of Upington is clear.
1.2.1.8 Illiteracy, poverty and health
Social problems experienced in Siyanda district include illiteracy and poverty. As a
result of the above-mentioned factors there is a close correlation between poverty and
health. Generally speaking the poorer people are the worse is their health. This includes
malnutrition of children as a result of a lack of money to buy enough and/or nutritious
food. The person receiving it must understand the health message, which is received.
This is directly affected by literacy and education. The IDP states that malnutrition is the
result of illiterate mothers. The education of people is according to the Department of
Health one of the single most important factors in the health of individuals. Adult literacy
is also below standard. Tuberculosis and HIV/AIDS are some of the infectious diseases,
8
which are receiving priority attention. Shortcomings: Due to staff shortages certain
specific expert health services cannot be optimally delivered.
1.2.1.9 District service delivery
• Piped water
Only 48% of households have access to piped water (41% within their own houses or
yard). 31% get water from a school and 15% get water from river or from a dam.
• Refuse removal
59% of households have a weekly refuse removal service (31% have their own refuse
dump)
• District sanitation
68% of people has a flush toilet
1.2.1.10 District mode of transport
61% of people walk to their destinations, followed by 18% using a car (as passenger or
drivers and 13% used a bus or taxi.
1.2.2 Siyanda local municipalities profile
The following local municipalities were selected for by the National Roads Agency to
form part of their community empowerment assessment programme:
• NC 082: Kai! Garib Municipality
• NC 083: //Khara Hais Municipality
• NC 084: !Kheis Municipality
1.2.2.1 !Kai! Garib Local Municipality (NC082)
The municipality has a geographical area of 7445.759 square kilometres. This local
municipality consists of 8 wards. The municipality is situated on the banks of the
Orange River and is life vein of the area. The following communities next to the N14
were studied: Ward 2 (Cillie); Ward 5 (Loxtonvale and Fierdale); and Ward 8 (Soverby,
Curriescamp and Mctaggertskamp).
9
1.2.3 Demographics of communities next to the N14
1.2.3.1 Gender
Gender in the two municipalities differ in the sense that //Khara Hais has 58% male
residents where !Kai Garib only has 42%. Households in !Kai Garib are mostly headed
by males (62%).
1.2.3.2 Education status along the n14
//Khara-Hais educational services (library) provide satellite library services to people in
remote areas. These services are available in the remote areas of: Karos, Leerkrans,
Louisvaleweg Straussburg, Kalksloot, Raaswater. The IDP (2005) states that there are
311 libraries across the municipality.
According to the !Kai Garib IDP (2005), 10% of the municipal population is illiterate.
Most completed either Grade 7 or Grade 9, which implies that a large part of the
community is able to do unskilled or semi-skilled work.
1.2.3.3 Employment along the N14
Currieskamp, McTaggertskamp and to lesser extent Cillie, had higher proportions of
the population that were employed than those of the other communities.
Frierdale and Loxtonvale (ward 5) have the highest number (41%) of “not economically
active” individuals. They also have the highest unemployment number of the three
communities. This indicates that more people are either unemployed or not
economically active in the ward than those who are employed (29%).
1.2.3.4 Municipal service delivery along the N14
Ward 8 mostly got their water from a stream, while Cillie (Ward 2) had access to piped
water within a 200m radius and the communities of Ward 5 had access to water within
the yard.
!Kai Garib received their water from the Orange River. The IDP (2005) states that the
quality of the water is deteriorating due to an increase in agriculture activities, and
industrial activities upstream from Keimoes.
Many households from Cillie , Curriescamp and McTaggerskamp had their own refuse
dumps and refuse removal were infrequent. Most of Lutzville households had their
refuse removed once weekly. Most households from Karos and Lambrechtsdrift had
refuse removed weekly, but a large percentage had their own refuse dumps.

10
1.2.3.5 Mode of transport along the N14
Most of the people in the communities along the N14 walked to their destinations, but
many people from Karos and Lambrechtsdrift also made use of the bus.
Public transport
The IDP review (2005) states that //Khara Heis has an existing public transport system
provided through taxi services. The municipality no longer offers a bus service after it
was liquidated. Commuters from Louisvale, Sesbrugge and others. are now dependent
on the taxi service.
Taxi organizations
There are approximately 135 taxis in the region, belonging mostly to private owners.
There are two taxi organizations namely Siyanda Local and Long Distance Taxi
Association and the Gordonia Goodhope Local and Long Distance Taxi Association.
Co-operation between these two organisations is poor as they are in competition with
each other.
1.2.4 !Kheis Local Municipality (NC 084)
The geographical area of the municipality is 6435.858 square kilometres. Local
Municipality (NC 084) consists of 4 wards. There are approximately 116 117 people
living in !Kheis Local municipality and an estimated 3990 households. Gender
distribution in the local municipality is equal for males and females. Kheis municipality is
the former Groblershoop municipality (!Kheis IDP: 2006) which includes the following
settlements:
• Boegoeberg
• Gariep
• Grootdrink (+-75km from Upington)
• Kleinbegin
• Opwag
• Topline (+-95km from Upington)
• Groblershoop (+-105 km from Upington)
These settlements were previously part of the Siyanda District with the exception of
Boegoeberg, which previously fell under Karoo District. !Kheis municipality has been
responsible for service delivery in these communities since 1 December 2001.
Groblershoop is the main town in the area and the settlements Topline, Grootdrink,
Boegoeberg and Wegdraai developed around it. Proper town planning should still be
11
done for these areas. Opwag, a formal township establishment is still in its planning
stages.
Agriculture and tourism are the main economic sectors in the region.
Communities studied were: Grootdrink and Gariep (Ward 1) and Topline and Wegdraai
(Ward 5)
1.2.5 Demographics of communities next to the N10
1.2.5.1 Gender distribution in communities along the N10
Whereas Gariep and Grootdrink had slightly more males than females, the
communities of Topline and Wegdraai had more females than males. The differences
are slight.
1.2.5.2 Age distribution in communities along the N10
Topline and Wegdraai communities had proportionately more children and young
people (ages 10 to 19) than the Gariep and Grootdrink communities.
1.2.5.3 Education profile of communities along the n10
The communities of Topline and Wegdraai had a somewhat higher educational level
compared to the Gariep and Grootdrink communities – proportionately more of these
communities had some secondary school or higher education.
1.2.5.4 Income distribution in communities living along the N10
Topline and Wegdraai communities had somewhat higher household income than
Gariep and Grootdrink communities.
1.2.5.5 Service delivery in communities next to the N10
The biggest proportion of households had access to piped water, in the house, yard or
some distance away from the house, but many still had to use rivers or streams, or get
water from the school.
In the Gariep and Grootdrink communities, more households had refused removed
once a week (although many had their own refuse dump), while in Topline and
Wegdraai, most households had their own refuse dumps.
In general, sanitation in the communities are not ideal, with many households having
no facilities – the situation is worse in the Gariep, Grootdrink communities.

12
Most people walked to their destinations, with some using the bus or private cars. Very
few mentioned using taxis.
1.2.6 Schools and learners along the N10 and N14
1.2.6.1 N14-Keimoes n14 to Kakamas
There are 7369 learners making use of the N14 from Keimoes-Kakamas
1.2.6.2 N14-Upington-Keimoes
2376 learners make use of this road
55 educators make use of this road
1.2.6.3 N10-Upington to Groblershoop
7385 learners and 133 educators make use of the N10 to get to school

13
1.3 Community traffic safety survey
1.3.1 Focus groups
5 focus group meetings were held in 4 communities.
In Wegdraai, 28 people participated in a focus group (10 men, 18 women). In
Grootdrink, 15 people (8 men, 7 women) took part in a focus group. In Curriescamp 2
focus groups were conducted. The first consisted of 16 people (1 man, 15 women) and
the second group consisted of 10 people (3 men, 7 women). In the community of Cillié,
24 people (8 men, 16 women) participated in a focus group
1.3.2 Summary of focus group responses
Table 1: Summary of focus group responses
Theme Responses
Knowledge of SANRAL
1 of 4 communities knew of SANRAL
Traffic safety situation
Peoples behaviour during Christmas and holidays
Harvest time on N14, trucks are a problem
Road signs on N10
Fencing on N10
Police travel at high speed in residential area (N10)
No suitable road for vehicles to communities
Children taught the parents about road safety
Street lighting
Pedestrians Drunk pedestrians No place to walk Attitude of pedestrians Old people have problems - cannot walk fast, long distances Children play in the road Dust affects visibility
Knowledge Many people cannot read There is not enough information about road safety
Health and safety
Dust causes health problems - affect especially old people and people who are already sick
Alcohol and drugs are a problem in all communities

14
Dirt and rubbish causes health problems, including toilet facilities
Pure water is a problem. In Curriescamp people drink water from the river
Medical services
Not enough clinic days
No mobile clinic visits Curriescamp
Too few doctors and nurses
Clinics not even always stocked with medicine
Ambulance services very poor - cannot reach the community and has to
come from far Health and safety
Officials Police take very long to respond to calls from community
Traffic officers work only on the main road (N10)
Community never sees a traffic official (N14)
Municipality just makes promises
Behaviour Drinking and driving
Tuck shops (but can be positive since people do not have to cross the road)
Driving without legal licenses
Many place where beer is sold
Public transport Taxi service inefficient - only service commuters in morning and afternoon
No bus service
People walk far to the main road
When they get there they have to wait long for whatever comes round
Some people (N14) walk to town - 7km
Influence of industry and business
“If you want to get people to come to an event there has to be food and beer”Public transport
Taxi service inefficient - only service commuters in morning and afternoon
Solutions People should have work to keep them from drinking
Fencing
Road signs
Proper paved streets so that services can reach community
Rubbish and dirt should be removed
Children's playground
Road safety road shows
Fewer places selling liquour and these should not be open on Sundays
More clinic days - every day

15
Better access to medical personnel
More street lighting
1.4 Analysis of accidents
Accident statistics were collected from Upington and Keimoes police stations.
Accident statistics collected covered the period March 2004 to September 2006. For the
purposes of the following analysis, March 2004 numbers were omitted, in order to
represent the statistics in 3-monthly periods. During this period, there were 79 accidents
on the relevant N14 section (on average 2.6 accidents per month) and 42 accidents on
the relevant N10 section (on average 1.4 accidents per month).
It seems as if the accident pattern on the N10 is relatively stable, whereas the accidents
on the N14 might be more linked to seasonal factors.
On both the road sections, most accidents occurred on Fridays and Saturdays.
From the data it was not always possible to derive the type of accident. Where it was
clear that more than one vehicle was involved, the accident was classified as “multiple
vehicle accident”. In some instances, only one vehicle is listed, but no further
clarification is given, apart from categorizing the accident as a collision.
From the available data, there is an indication that single vehicle accidents, specifically
pedestrian accidents, are a bigger problem on the N14 section, while many multiple
vehicle accidents occurred on the N10 section.
The accidents on the N14 were more severe compared to the N10 section (26.2% of
accidents involved injuries on the N10 section, compared to 16.2% on the N10 section).
On the N10 sections, most accidents occurred between 12:00 and 18:00, compared to
the N14 section, where most accidents occurred between 15:00 and 21:00.
16
1.5 Analysis of learner questionnaires
A survey was conducted at schools in Upington along the N10 and N14. The schools
were:
Along the N10: Grootdrink, Karos, Topline and JG Jansen
Along the N14: Cillié, Soverby, Curriescamp and Mc Taggertskamp
The objectives of the survey were to assess the road safety context and awareness of
the children along the two routes.
1.5.1 Demographics
The total sample consisted of 665 learners of which 436 (66%) were interviewed on the
N10 and 228 (34%) on the N14. The gender distribution was about equal (50.3% boys
and 49.7 % girls).
The survey included children from grades 5 to 9. Most of the children were in Grade 7
(39%) followed by 20.6% in Grade 8 and 20.2 % in Grade 8, 10.4% in Grade 5 and
9.8% in Grade 9.
The average age by grade is consistent with expectations: 11.4 years in Grade 4, 12.5
years for Grade 6, 13.5 years for Grade 7, 14.5 years for Grade 8 and 15.5 years for
Grade 9. Children interviewed on the N10 had a somewhat older age distribution
(average 14.4 years) compared to children interviewed on the N14 (12.2 years). This
seems to be as a result of the school grades offered at different schools along the route:
Children interviewed at schools on the N10 were in grades 7 to 9, while children
interviewed on the N14 were in grades 5 to 7.
Children interviewed on the N10 came from Grootdrink School (45.6%), JG Jansen
(28.5%), Karos (17.9%) and Topline (7.9%). Children interviewed on the N14 came
from Cillié (49.1%), Soverby (18.4%), McTaggartskamp (17.1%) and Curriescamp
(15.4%).
90% of the children came from the following neighbourhoods: Grootdrink, Wegdraai,
Cillié, Karos, Topline, Soverby, Curriescamp, Gariep, and Lambrechtdrift.
The largest group of children came from the Grootdrink neighbourhood (119 children)
going to Grootdrink School, followed by 111 children from Wegdraai going to JG Jansen
School and 102 children from Cillié going to the Cillié School. Other large groups were
from Topline (69 children) going to Topline and JG Jansen, Soverby (42 children) going
to Soverby school, Curriescamp (35 children) going to Curriescamp school, Gariep (28
children) going to Grootdrink school, and Lambrechtdrift (25 children) going to

17
Grootdrink school. Some children also came from Sesbrugge, Mc Taggartskamp,
Klippunt, Salskop, Koppie Eiland, Swartkop, Wolwehoek and others.
1.5.2 Transport mode
Overall, 68% of the children walked to school, 27% used a school bus, 4% rode a
bicycle, and 1% either used public or private transport.
There is a clear difference in transport use between the schools along the two different
routes: 85% of children in schools along the N14 walked, compared to 59% of children
attending schools along the N10; 40% of children attending schools along the N10
made use of a school bus and 11% rode a bicycle; the comparative figures for the N14
were 2.6% and 0%.
On both routes, girls walked about 6% more often than boys with boys on the N10
making use of the school bus more often. On the N14 girls made use of the school bus
more often than the boys, of whom 15% rode bicycles to school (compared to the girls
on the same route of whom 7% rode bicycles).
When comparing the different schools as to transport mode the exceptions were Karos
(N10) where almost all the children made use of a school bus, and Topline, where
almost all the children walked to school. On the N14, all the children from Soverby
walked, almost all the children from Cillié walked and more than half of the children from
McTaggartskamp rode a bicycle. The only other children riding bicycles were from
Curriescamp.
Along both the routes, children from lower grades walked more often than children from
higher grades: On the N10 64% of Grade 7’s walked, 55% of the Grade 8’s and 58% of
the Grade 9’s; on the N14 91% of Grade 5’s walked, 85% of Grade 6’s and 81% of
Grade 9’s.
1.5.3 Duration of school journey
For most learners, the school journey did not take more than 15 minutes (63% on the
N10 and 65% on the N14). For a further 26% of children on the N10 and 22% of
children on the N14 the journey did not exceed 30 minutes. For 7% of children on both
routes the journey took about 45 minutes, leaving 4 % of children on the N10 and N14
with journeys longer than 45 minutes.
The midpoints of the time categories were calculated to estimate average traveling
times: The highest average traveling time (32 minutes) were for children going to
McTaggartskamp, followed by 24 minutes for Karos, 20 minutes for Grootdrink and 19

18
minutes for Soverby. Journeys to all other schools were on average 11 minutes or
shorter.
1.5.4 Road safety at night and visibility
Going out in the evening
More boys than girls went out at night on both routes. 22.4 % of boys on the N10 said
that they went out at night compared to 15.3 % of girls. On the N10 76.1% of girls went
out sometimes. Comparing this to 69.6 % of boys who said that they went out
sometimes, the two groups had an equal percentage who said that they did not go out
at all (7.9 % of boys and 8.6 % of girls).
On the N14 12.5 % of boys said that they did go out at night and 75% said that they
sometimes go out, leaving 12.5 % who did not go out at all. The comparative figures for
girls were 4.6% going out at night, 64.8% who went out sometimes and 30.6 % who did
not go out at all.
On the N10, Grade 7’s went out less than higher grades (17.5 % did not go out at all
compared to only 2.9% and 3% of Grades and 8 and 9). On the N14 it was the lower
graders (Grade 5) who went out most: only 10.1 % of them said that they never go out,
compared to 29.2% of Grade 6’s and 23.4% of Grade 7’s.
Children going to Soverby, Curriescamp, JG Jansen, Topline, and Grootdrink went out
more at night (less than 10% said that they never went out). 33.9% of children from
Cillié and 20.5% of children from Mc Taggartskamp said that they never went out at
night.
Crossing and walking along the main road
Children were asked whether they crossed or walked along the main road when they
went out at night. On the N10 11.7% of children who went out at night crossed or
walked along the main road, compared to 5.7% on the N14 of children walking or
crossing the main road. On both routes, the Grade 7 learners had the highest risk of this
behaviour, when compared to the older groups (N10) and younger groups (N14).
Children from Topline School had the highest positive response to this question
(16.1%), when compared to all other schools.
Visibility at night
There was no marked difference between the genders in regard to this question, but a
difference was reflected between the two different routes. It was suspected that age

19
could influence the answers to this question, but the data are not consistent in this
regard. 77.8% of children on the N10 route thought that they were visible at night,
compared to 63.2% of children on the N14.
There is also a bigger difference between the age groups on the N10 than on the N14
as to their responses on this question. On the N10 69.9 % of 14 year olds thought that
they were visible at night, compared to 92.3 % of 17 year olds who thought that they
were visible. On the N14, responses ranged from 58.5% (11 year olds) to 67.7% (14
year olds). The two 14 year old groups had comparative responses.
The learners from the different schools had different responses to these questions. All
the children from Soverby thought that they were not visible to traffic at night, indicating
either education about this subject, or possible interference in the answering of the
questions. 55.7% of children from Karos thought that they were not visible to traffic at
night. Other responses ranged from 70% to 91% (91.4% of children going to
Curriescamp thought that they were visible to traffic at night).
25% of boys and 17.6% of girls on the N10 said that they did not use anything to make
them more visible at night. Bright clothes were the most popular response (71.4% of
boys compared to 78.8 % of girls).
On the N14, 42.5% of boys and 41.1 % of girls said that they did not do anything to
make them more visible to traffic. The most popular answer was also the wearing of
bright clothing (50% of boys compared to 57.9% of girls). The group with the highest
response of doing nothing to make them visible were the Grade 6’s on the N14 (52.3%)
and the group with the lowest response of doing nothing was the Grade 9 group on the
N10 (16.4%).
Daytime visibility
Almost all learners gave a positive response to this question (96.8% of children on the
N10 and 98.7% of children on the N14).
1.5.5 Alcohol and drugs
Alcohol and drug use
Gender responses did not differ much on the N10 route, but boys and girls gave
different answers at schools along the N14 route. At schools along the N10, 26.2% of
boys and 22.1 % of girls said that learners used neither alcohol nor drugs, while at
schools along the N14, 71.7% of boys gave this answer, compared to 49.5% of the
girls. Answers given by school grade were comparatively similar on both the routes, but

20
there was a marked difference between the different schools. Learners at Soverby and
Curriescamp did not think that any learners used any alcohol or drugs, while 84.6% of
learners from McTaggertskamp and 83.9% of learners from Topline gave a negative
answer.
At all other schools, the negative answers were comparatively small indicating to a
serious alcohol and drug problem in these schools.
On the N10: At Grootdrink School, 53.9% of learners thought that learners used alcohol
(either alcohol only or alcohol and drugs), compared to 51.1% who thought that learners
used drugs (either drugs only or alcohol and drugs). Comparative figures for Karos were
54.3% for alcohol compared to 35.7% for drugs ; for Topline 16.1% for alcohol and no
learners thought that alcohol and drugs were used; for JG Jansen 84.2% (alcohol) and
78.5% (drugs); the average for schools along the N10 were 62.2% for alcohol and
54.9% for drugs.
On the N14: At Cillié 25.9% (alcohol) compared to 64.3% (drugs) and at
McTaggartskamp 2.6% (alcohol) compared to 1.8% (drugs) (an average of 13.2% for
alcohol compared to 33.9% for drugs for the N14).
The neighbourhood of Wegdraai seems to have the biggest alcohol and drug problem,
with only 5.4% of learners indicating that no alcohol or drugs were used. This was
followed by Lambrechtsdrift, Grootdrink and Cillié where 20%, 21.8% and 24.5% of
learners said that no alcohol or drugs were used by learners.
Drinking and walking/driving
Almost all the learners thought that it was not safe to drive or walk after using alcohol or
drugs, responses ranging from 92.9% for Karos to 100.0% at Topline, Soverby and
Curriescamp.
1.5.6 Road safety education
Road safety lessons
Overall, 36.9% of learners said that they did receive road safety education at school
(39.1% at schools along the N10 and 32.9 % at school along the N14). There was a
marked difference between different Grades.
At schools along the N10, 47% of Grade 7’s gave a positive response, compared to
46.3% of Grade 8’s, and 21.6% of Grade 9’s. 57.3% of learners from Grootdrink, 32.9%
from Karos, 80.6% from Topline and 12.7% from JG Jansen gave a positive response
to this question.
21
At schools along the N14, 7.2% of Grade 5’s gave a positive answer, compared to
58.5% of Grade 6’s and 34 % of Grade 7’s. 46.4% of learners from Cillié and 59% of
learners from Mc Taggartskamp gave a positive response. All learners from Soverby
and Curriescamp gave negative responses to this question.
Frequency of road safety lessons
On average, 40.2 % of learners responding positively to the previous question said that
they received 1 to 5 lessons per year, while 29.2% thought that they received more than
15 lessons per year, 23.2% thought that they received 6 to 10 lessons per year and
7.5% thought that they received 11 to 15 lessons per year.
The midpoint of each category was calculated to compare the average number of
lessons per grade and school. Apart from Grade 5, the average number of traffic safety
lessons decreased with each higher year grade, starting at 8.8 lessons per year in
Grade 6, 7.2 lessons per year in Grade 7, 6.9 lessons per year in Grade 8 and 4.2
lessons per Grade in Grade 9.
McTaggartskamp had the highest average traffic safety lessons per year (9.3), followed
by Topline (8.4), Cillié (7.4), Grootdrink (7.1), JG Jansen (4.2) and Karos 4. No traffic
safety lessons were offered at Soverby or Curriescamp.
Road safety as separate subject
Overall, 7.5% of children said that road safety was offered as a separate subject at
school. Grade 5’s (N14) and Grade 8’s (N10) gave a higher response to this question
(17.6% and 14.3% respectively).
None of the children from Karos, Topline, Cillié, Soverby or McTaggartskamp thought
that road safety was offered as a separate subject, compared to 35.3% of children at
Curriescamp, 20.7% and Grootdrink and 1.3% at JG Jansen.
1.5.7 Involvement of learners in traffic accidents
Involvement of learners in traffic accidents
At schools along the N10, 83.3% of children knew of at least one learner that was
involved in a traffic accident, compared to 64.2% of children at schools along the N14.
There was little difference between the responses of boys and girls at schools along the
N10, but a marked difference between the responses of boys and girls at schools along
the N14 (71.4% of boys responded positively, compared to 56.1% of girls).

22
On the N10, 72.9 % of Grade 7’s gave a positive response, compared to 89.1% of
Grade 8’s and 89.6% of Grade 9’s. At Grootdrink School, there was a 68.5% positive
response, compared to 94.3% at Karos, 71% at Topline and 96.8% at JG Jansen.
At schools along the N14, 80.9% of learners in Grade 5 responded positively, compared
to 52.3% of learners in Grade 6 and 60.2% of learners in Grade 7. All the children from
Soverby knew of at least one learner who were involved in a traffic accident, compared
to 67% at Cillié 58.8% from Curriescamp and 21.1 % at McTaggartskamp.
Number of learners involved in traffic accidents
The most frequent answer from learners at schools along the N10 was “one person”
(36.8% of responses) compared to 45.3% of learners at schools along the N14 who
said that they knew of more than 5 persons involved.
At schools along the N10 42.3% of Grade 9 learners said that they knew of at least 3
learners involved in a traffic accident, compared to 29.8% of Grade 7 learners who
knew of one learner and 44.9% of Grade 8 learners who knew of one learner involved in
an accident. Learners from Grootdrink mostly knew of one person (76.6%), while
learners from Karos had a distribution of responses on all the categories, learners from
Topline knew of no accident involvement and 56.1 % of learners from JG Jansen knew
of at least 3 learners involved in accidents.
At schools along the N14, 73.2% of Grade 5 learners said that they knew about more
than 5 learners involved in traffic accidents. The responses of Grades 6 and 7 were
distributed through all the categories, with most of Grade 6 learners indicating
involvement of three learners (38.2%) and most Grade 7 learners indicating
involvement of three learners (36.2%). 58.4% of learners from Cillié thought that more
than 5 learners were involved compared to 100% of learners from Curriescamp who
gave the same answer. 50% of learners from McTaggartskamp thought that there were
two learners involved in accidents.
The average number of learners involved was calculated by multiplying the number of
responses with the number learners in the category and then dividing by the total
responses.
The highest average was at Curriescamp (N14) with and average of more than 5
learners involved in traffic accidents, followed by 3.7 average at Cillié (N14), 3.3 at JG
Jansen (N10), 3 at Karos (N10) and Soverby (N14), 2 at McTaggartskamp (N14), and
1.7 at Grootdrink (N10).

23
Road user type involved in traffic accidents
Learners from schools along the N10 said mostly that learners involved in accidents
were involved as pedestrians (40.4%) followed by motor car passengers (26.9%) and
donkeycart passengers (23.7%). There were some differences between different
grades, but remaining in the above categories. There were clear differences between
the different schools. At Grootdrink 76.1% of learners responded that the most likely
victims were pedestrians, compared to Karos where learners concurred with this
answer, but with a lower percentage (48.5%). 45.5% of Topline learners thought that
accident victims were mostly passengers in motorcars and 40.9% learners from the
same school thought that learners were involved in accidents as pedestrians. At JG
Jansen school, 57.4% of learners responded that the victims were transported on
donkey carts.
Learners from schools along the N14 said mostly that road accident victims were
involved as passengers in motor cars (56.5%) and pedestrians (36.7). There were
differences between the grades: Grade 5 learners mostly indicated involvement as
passengers in motor cars (71.4%) while Grade 6 learners thought mostly that
involvement occurred as a result of pedestrian accidents. Grade 7 learners concurred
with Grade 5 learners in regard to passengers in motorcars being the most frequent
victims (53.4%). 76.3% of learners from Cillié said that victims were involved as
passengers in motor cars and this was concurred by learners from Taggartskamp
(100%). All the learners from Soverby thought that victims were involved as pedestrians
while McTaggartskamp learners thought that victims were distributed equally between
pedestrians and passengers in motorcars.

24
1.6 RECOMMENDATIONS
Table 2: Summary of problems and recommendations
PROBLEM DESCRIPTION RECOMMENDATIONS Socio-economic issues The use of alcohol and drugs has been identified as a
problem in the province. This is supported by findings from learner surveys: at some schools (primary schools) the reported use of alcohol and drugs was found to be very high. Schools along the N10 had a bigger problem than schools along the N14. Schools with the biggest problems were: JG Jansen, Grootdrink, Karos (N10) and Cillie (N14). Drugs is almost as big a problem as alcohol and in Cillie a much larger problem than alcohol. Unemployment levels are high Some communities struggle with access to basic services, such as water, sanitation and rubbish removal Education levels are generally very low, with more than 50% of the population of the studied communities having only primary school or no education. Income levels are generally very low (lowest incomes were in Soverby, McTaggertskamp and Curriescamp) Although most of the communities are Afrikaans, some spoke Tswana or Sesotho (32% of people in Soverby, McTaggertskamp and Curriescamp)
The use of alcohol and drugs are such deep-rooted problems in the community that it could not be addressed only through a road safety awareness project. It is very important that there should be some intervention in these communities. Communities generally struggle in almost all aspects of life, through unemployment, low or no income, alcohol abuse, absence of basic services, that road safety should be integrated into a development project that enhances the lives of community members. It should not be taken for granted that the language spoken is Afrikaans. 32% of 3 of the communities spoke Tswana or Sesotho.
Learners road safety knowledge
Not all learners understood that they were not visible at night and almost none were aware of the fact that visibility is even
Teachers should be supported through appropriate road safety programmes, to give more road safety

25
a problem during the daytime. Most learners knew that walking or driving after having used alcohol or drugs was dangerous. Learners did report that they received road safety lessons at school, which gives an indication that most teachers are willing to engage in road safety education.
lessons.
Crashes and learner perception of crashes. Crash statistics.
From the available data, there is an indication that single vehicle accidents, specifically pedestrian accidents, are a bigger problem on the N14 section, while many multiple vehicle accidents occurred on the N10 section. A large proportion of fatal crashes occurred during week-ends. Children were aware of crashes in which learners were injured. There is an indication that they perceived crashes on the N10 involved more pedestrians, cyclists, donkey carts when compared to the N14 where passengers in motor cars were more at risk, The pedestrian issue was still high on the N14 as well.
The availability and quality of crash statistics are very low, especially report of the location of the crash. The support of SAPS should be negotiated to keep quality statistics for the duration of the project, and on an ongoing basis. Both roads had a variety of accident types, indicating towards a complex traffic environment where an assessment should be made of the safety of access roads, speed management and the visibility of pedestrians and other non-motorised transport
Learner transport modes Most of the learners walked to school, with some communities using the bus. A significant number of children from McTaggertskamp rode bicycles
Due to the fact that most communities have a mobility problem, cycling could be promoted, if safe infrastructure and channelling could be provided. More boys than girls used cycles and the issue of gender and mobility could be investigated.
Traffic volumes Traffic volumes were not identified as an issue during the period of study, but could be a problem during the harvest season.
Further observations during the harvest season will be necessary
Speed Inappropriate speed within the community was identified as a problem. The upgrading of the road within the community could intensify this problem.
The design of the access road must not encourage speeding The design of the road should make provision for the separation of motorised and non-motorised transport (pedestrian walkways, cycle paths)
Pedestrian crossings Pedestrians cross the N10 and N14 either to wait for transport, to disembark, to buy amenities, or to walk to their
The provision of pedestrian walkways and crossings

26
place of work. at the identified access roads should be investigated
Investigate the provision of pedestrian walkways and
crossings within the community
Traffic law enforcement Hardly any traffic law enforcement takes place on the
national roads and no enforcement takes place within the community
Improve visible traffic policing Increased traffic policing of drinking and driving, especially during the holiday seasons
Road signs There are insufficient road signs warning about pedestrians. Add additional appropriate road signs where
necessary
Traffic safety awareness Intoxicated pedestrians and drivers is a huge problem, especially during the holiday season. The regular road users and community members residing along these routes are in need of road safety education and a comprehensive awareness programme.
Develop and implement road safety communication and awareness programmes targeting all community members, taking into consideration factors such as literacy. Liquor outlets should be included
Road infrastructure and public transport facilities
The present condition of the access roads to the communities deters private and public transport from entering the communities freely. This forces community members to walk long distances to the main road. The upgrading of the access road up to the point of the first houses, will be insufficient. The upgrading of access roads and the extension thereof into the communities will create road safety problems, especially for pedestrians and users of non-motorised transport. The unpaved roads create unpleasant and unhealthy conditions, mostly through excessive dust. There are no public transport facilities along the main roads or within the communities.
Upgrading of access routes to surfaced roads will solve the inaccessibility of the community to public transport and services as well as the unhealthy situation of excessive dust The upgraded access roads should be extended to beyond the first dwellings, and the possibility to create a circular route through the community should be investigated. The road design should take into consideration the needs of non-motorised transport Provide public transport facilities within the communities (lay-bys and shelters)
Capacity building and skills development for
Incorrect and incomplete traffic accident data is a serious problem.
SAPS officials should receive training to capture accident data correctly, with special reference to the
27
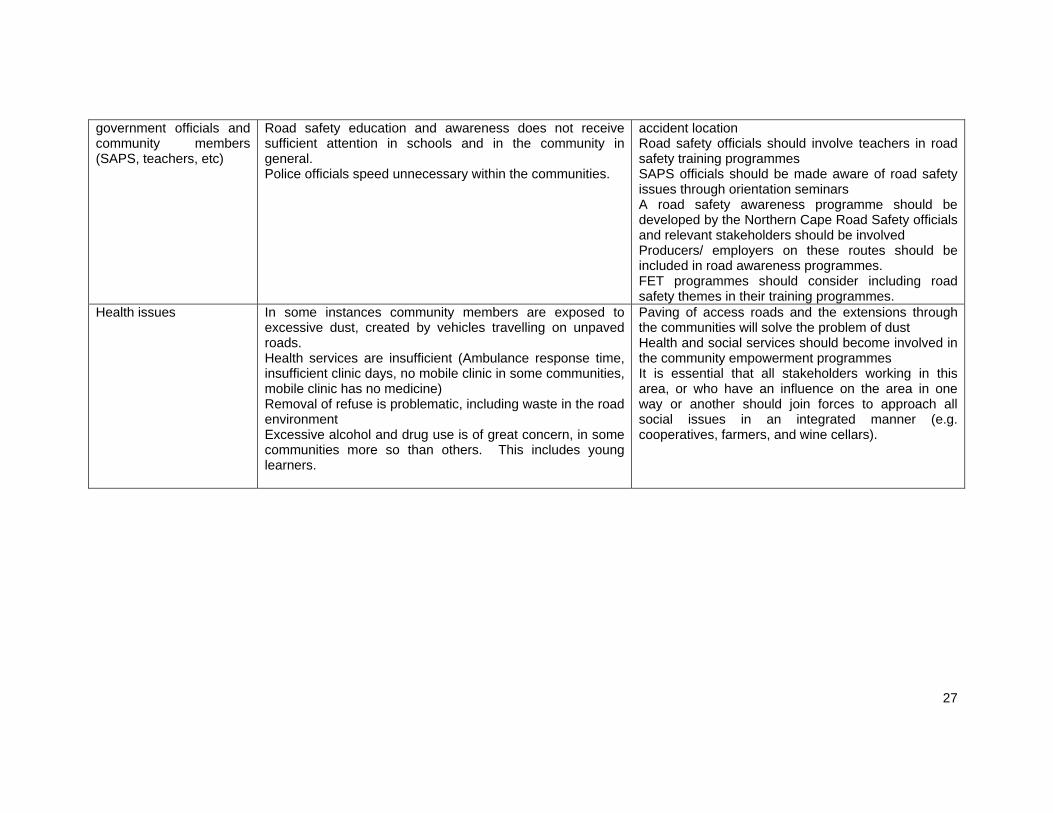
government officials and community members (SAPS, teachers, etc)
Road safety education and awareness does not receive sufficient attention in schools and in the community in general. Police officials speed unnecessary within the communities.
accident location Road safety officials should involve teachers in road safety training programmes SAPS officials should be made aware of road safety issues through orientation seminars A road safety awareness programme should be developed by the Northern Cape Road Safety officials and relevant stakeholders should be involved Producers/ employers on these routes should be included in road awareness programmes. FET programmes should consider including road safety themes in their training programmes.
Health issues In some instances community members are exposed to excessive dust, created by vehicles travelling on unpaved roads. Health services are insufficient (Ambulance response time, insufficient clinic days, no mobile clinic in some communities, mobile clinic has no medicine) Removal of refuse is problematic, including waste in the road environment Excessive alcohol and drug use is of great concern, in some communities more so than others. This includes young learners.
Paving of access roads and the extensions through the communities will solve the problem of dust Health and social services should become involved in the community empowerment programmes It is essential that all stakeholders working in this area, or who have an influence on the area in one way or another should join forces to approach all social issues in an integrated manner (e.g. cooperatives, farmers, and wine cellars).