Embed Size (px)
Citation preview
1
Supporting Information for “Site-directed spin labelling of proteins by Suzuki-
Miyaura coupling via a genetically encoded aryliodide amino acid”
Anandi Kugele, Theresa Sophie Braun, Pia Widder, Lara Williams, Moritz Johannes Schmidt, Daniel Summerer*
and Malte Drescher*
Table of Contents
Experimental Procedures ........................................................................................................................ 2
Synthesis and analysis of NOBA ......................................................................................................... 2
Transformation of E. coli .................................................................................................................... 2
Expression and purification of TRX mutants ..................................................................................... 2
Expression of ASYN-S9→pIPhe .......................................................................................................... 3
Purification of ASYN-S9→pIPhe ......................................................................................................... 3
Spin labelling of ASYN ......................................................................................................................... 4
Spin labelling of TRX ........................................................................................................................... 4
Mass spectrometry of proteins .......................................................................................................... 4
Cw EPR measurements, evaluation and spectral simulations .......................................................... 4
DEER measurement ............................................................................................................................ 5
Observation of ASYN-vesicle interaction ........................................................................................... 5
Measurement of circular dichroism (CD) spectra .............................................................................. 5
Supplementary Figures ............................................................................................................................ 7
Figure S1 .............................................................................................................................................. 7
Figure S2 .............................................................................................................................................. 8
Figure S3 .............................................................................................................................................. 9
Figure S4 ............................................................................................................................................ 10
Figure S5 ............................................................................................................................................ 11
Figure S6 ............................................................................................................................................ 12
Figure S7 ............................................................................................................................................ 14
Figure S8 ............................................................................................................................................ 15
Figure S9 ............................................................................................................................................ 16
Figure S10 .......................................................................................................................................... 17
Figure S11 .......................................................................................................................................... 18
Figure S12 .......................................................................................................................................... 19
Figure S13 .......................................................................................................................................... 20
Supplementary References ................................................................................................................... 21
Electronic Supplementary Material (ESI) for ChemComm.This journal is © The Royal Society of Chemistry 2019
2
Experimental Procedures
Synthesis and analysis of NOBA
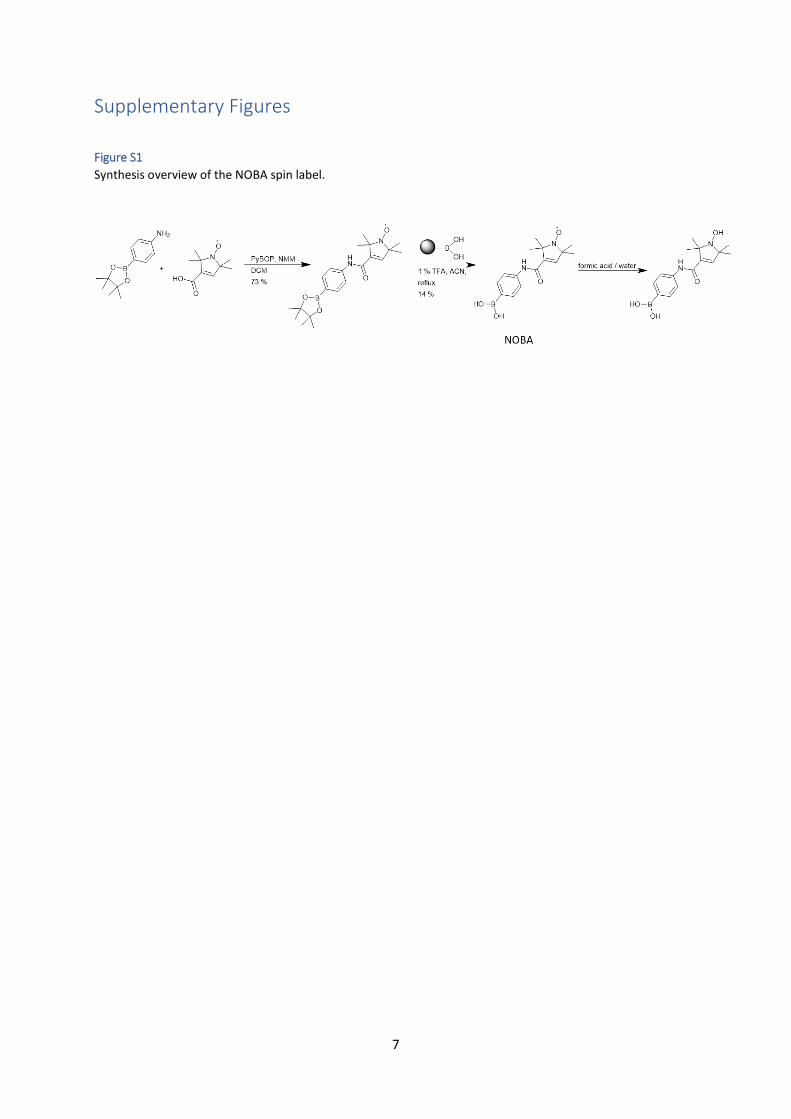
Nitroxide carboxylic acid (500 mg, 2.7 mmol) and 4-aminophenylboronic acid pinacol ester (595 mg, 2.7 mmol) were placed in a 100 mL one-necked flask and dried in vacuo, prior to being dissolved in anhydrous dichloromethane (DCM; 30 mL) in argon atmosphere (for the reaction scheme see Figure S1). The solution was cooled to 0 °C and N-Methylmorpholine (NMM; 657 µL, 5.97 mmol) and PyBOP (1554 mg, 2.99 mmol) were added. The reaction mixture was stirred for 20 h at room temperature. The solution was washed with 10 mL saturated NaHCO3 solution, and the phases were separated and dried with MgSO4. The solvent was removed under reduced pressure and the slightly purple oil was purified using flash column chromatography (PE/EE = 3/1). 759 mg of the intermediate were obtained (73 % yield). 124 mg of this intermediate were dissolved in 5 mL acetonitrile and 100 µL trifluoroacetic acid. 1 g of polymer-bound boronic acid (MERCK) was added. Under reflux, the mixture was stirred for 4 h at 92 °C, before acetonitrile was evaporated. The product (14 mg, 14 %) was obtained as a yellow solid. The identity of NOBA was shown by high resolution mass spectrometry on a Thermo Scientific ESI mass spectrometer with an LTQ Orbitrap Velos detector without previous separation. Purity of 4-(1-oxyl-2,2,5,5-tetramethyl-2,5-dihydro-1H-pyrrole-3-carboxamido)phenylboronic acid (NOBA) was
shown by 13C- and 1H-NMR of the reduced nitroxide analogue. For the reduction of the nitroxide (Figure S1)
NOBA (10 mg) was shaken at room temperature for 3 h in a mixture of 75 µL formic acid (Riedel-de Haën) and
75 µL water, before the solvent was removed by lyophilisation.1 The resulting sample was dissolved in
deuterated DMSO (SIGMA-ALDRICH). NMR spectra were acquired at ambient temperature on a Bruker
Avance III 400 MHz spectrometer. Chemical shifts are reported in δ/ppm relative to solvent signals (DMSO-d6:
δH = 2.5 ppm, δC = 39.52 ppm). Acquired data were processed and analyzed using MestReNova software.
HR-ESI MS (m/z): [M] calculated for NOBA: 303.1516, found: 303.1516.
1H-NMR (400 MHz, DMSO-d6): δ: 7.74 – 6.92 (m, 4H, 4x Ar-H), 6.55 (s, 1H, H-C=C), 3.36 (s, 2H, B-(OH)2), 1.38 –
1.17 (m, 12H, 4x CH3).
13C-NMR (101 MHz, DMSO-d6): δ: 163.32 (HN-C=O), 128.61 (Ar-C), 119,84 (Ar-C), 24.79 (CH3).
Transformation of E. coli
The plasmids pEVOL-pI-Phe and pBAD_TRX_His6_R74TAG2 or pBAD_TRX_His6_D14R74TAG, respectively, were
used for the expression of E. coli thioredoxin (TRX-R74→pIPhe or TRX-D14R74→pIPhe). For expression of TRX wildtype only the pBAD_TRX_His6 plasmid was transformed into E. coli. The plasmids pEVOL-pI-Phe and pT7-
asyn_S9TAG were used for the expression of the human -synuclein (ASYN) mutant, which contains the noncanonical amino acid 4-Iodo-L-phenylalanine (pIPhe; BACHEM) at amino acid residue 9 instead of serine
(ASYN-S9→pIPhe). The plasmids were co-transformed into chemically competent BL21-gold (DE3) E. coli as follows. The reaction tube containing E. coli and an appropriate amount of the particular plasmids was mixed by flicking and incubated 30 min on ice. The cells were then heat shocked at 42 °C for 30 sec and incubated for another 2 min on ice, before being added to 1 mL pre-warmed (37 °C) Super Optimal Broth with catabolite repression (SOC-medium). The cells were then incubated for 1 h at 37 °C and 1400 rpm, before grown on an LB-Agar plate (Lennox; ROTH) containing 34 μg/mL chloramphenicol (ROTH) and 50 μg/mL carbenicillin (ROTH) overnight.
Expression and purification of TRX mutants
For all steps performed in medium, transformed E. coli strains were grown in LB-medium (Lennox; ROTH), containing 34 μg/mL chloramphenicol and 50 μg/mL carbenicillin (or only carbenicillin for expression of TRX wildtype). Cells were shaken at 37 °C and 180 rpm.
3
TRX-R74→pIPhe, TRX-D14R74→pIPhe or TRX wildtype were expressed in E. coli co-transformed with the respective plasmid(s) (see above) as follows. For overnight cultures, 10 mL LB-medium were inoculated with one colony of the particular E. coli from the agar plate. The next day, the overnight culture was diluted 1/100 (typically to a final volume of 1 L), and incubated until an OD600 of 0.5 - 0.7 was reached. Protein expression was induced for 5 - 6 h with 0.2 % L-arabinose (ROTH) from a 20 % w/v stock solution in presence of 3 mM pIPhe (BACHEM). For TRX wildtype, only L-arabinose but no pIPhe was used for the expression. Expression was stopped and cells were harvested by centrifugation (4 °C, 4000 rpm, 10 min). The supernatant was discarded, and the pellet was stored at -20 °C, until TRX was isolated and purified. TRX was purified using HisPur Ni-NTA resin (Thermo Fisher Scientific) as described elsewhere3, before being dialyzed against PBS (MERCK) buffer, pH 8 at 4 °C. TRX concentration was determined photometrically with the use of an Eppendorf BioPhotometer D30 via absorption at 280 nm (with a Factor FP = 1/A0.1% = 0.651 g/L, where A0.1% = εP/MMP is the absorbance of the protein at 0.1 %, εP is the molar extinction coefficient of the protein, and MMP is the relative molar mass of the protein). Integration of pIPhe and purity were confirmed by SDS-PAGE (Figure S5). Briefly, samples for SDS-PAGE analysis and 5 µL of a BIO-RAD Precision Plus ProteinTM Dual Color Standard were applied to a 15 % SDS-gel and run at 90 V in a BIO-RAD Mini-PROTEAN Tetra System. After Coomassie Blue staining (Brillant Blau R 250, ROTH), gels were imaged using a BIO-RAD ChemiDocTM Imaging System. For additional proof for expression of the correct product and for assessing fidelity of the aminoacyl-tRNA-synthetase, full-length ESI-MS spectra were recorded (Figure S6).
Expression of ASYN-S9→pIPhe
Transformed E. coli strains were grown in LB-medium containing 34 μg/mL chloramphenicol and 50 μg/mL carbenicillin by shaking at 37 °C and 180 rpm. For overnight culture, typically 10 mL LB-medium were inoculated with one colony of E. coli from the agar plate. The next day, the overnight culture was diluted 1/100 (typically to a final volume of 1 L), and incubated, until an OD600 of 0.5 - 0.7 was reached. Protein expression was induced for 5 - 6 h with 0.2 % L-arabinose from a 20 % w/v stock solution, and with 1 mM IPTG, in presence of 3 mM pIPhe. Expression was stopped and cells were harvested by centrifugation (4 °C, 4000 rpm, 10 min). The supernatant was discarded, and the pellet was stored at -20 °C, until ASYN was isolated and purified.
Purification of ASYN-S9→pIPhe ASYN was released by lysis with an adequate amount of B-PER Reagent (Thermo Fisher Scientific) containing 1 mM PMSF. After 10 min of incubation on ice including regular vortexing, unsoluble components were removed by centrifugation (4 °C, 15.000 rpm, 2 min) in an Eppendorf Centrifuge 5424 R. The ASYN-containing supernatant was transferred to a fresh tube. An appropriate volume of C-tag beads (e.g. 4 mL bead suspension for a 1 L preparation; CaptureSelectTM C-tag Affinity Matrix, Thermo Fisher Scientific), which bind to the naturally occurring EPEA-sequence of ASYN, were added to an appropriate number of spin columns (MobiSpin Column “F” with 10 μM filter, Mo Bi Tec). Storage solution was removed by centrifugation in a table centrifuge (Benchmark myFUGETM Mini, Benchmark Scientific). The beads were washed with 500 μL of 10 mM TRIS (Trizma base, SIGMA-ALDRICH), pH 7.4, by vortexing and subsequent centrifugation. Then, the beads were agitated with the cleared cell lysate at 4 °C for 10 - 30 min. After re-transfer to spin columns, unbound proteins and reagents were removed by centrifugation, before the beads were washed 7 times with each 500 μL of above mentioned wash solution. For elution, the beads were incubated with an appropriate volume (e.g. 300 μL per spin column) of TRIS 10 mM, pH 7.4, containing 2 M MgCl2, for 10 min. The column was transferred to a fresh tube, and the purified ASYN was obtained by centrifugation. ASYN concentration was determined photometrically with the use of an Eppendorf BioPhotometer D30 via absorption at 280 nm (with a Factor FP = 1/A0.1% = 2.58571 g/L, where A0.1% = εP/MMP is the absorbance of the protein at 0.1 %, εP is the molar extinction coefficient of the protein, and MMP is the relative molar mass of the protein). Prior to in vitro labelling, the elution buffer containing ASYN was replaced by the labelling buffer PBS, pH 8, by spin filters (Amicon Ultra-0.5 Centrifugal Filter Devices with 3K MWCO, Millipore; 6 times washing with approx. 450 µL PBS, pH 8, each). The ASYN stock solution was stored in Eppendorf Protein LoBind Tubes at -20 °C. Expression in 1 L of cell culture yielded approx. 15 mg ASYN.
4
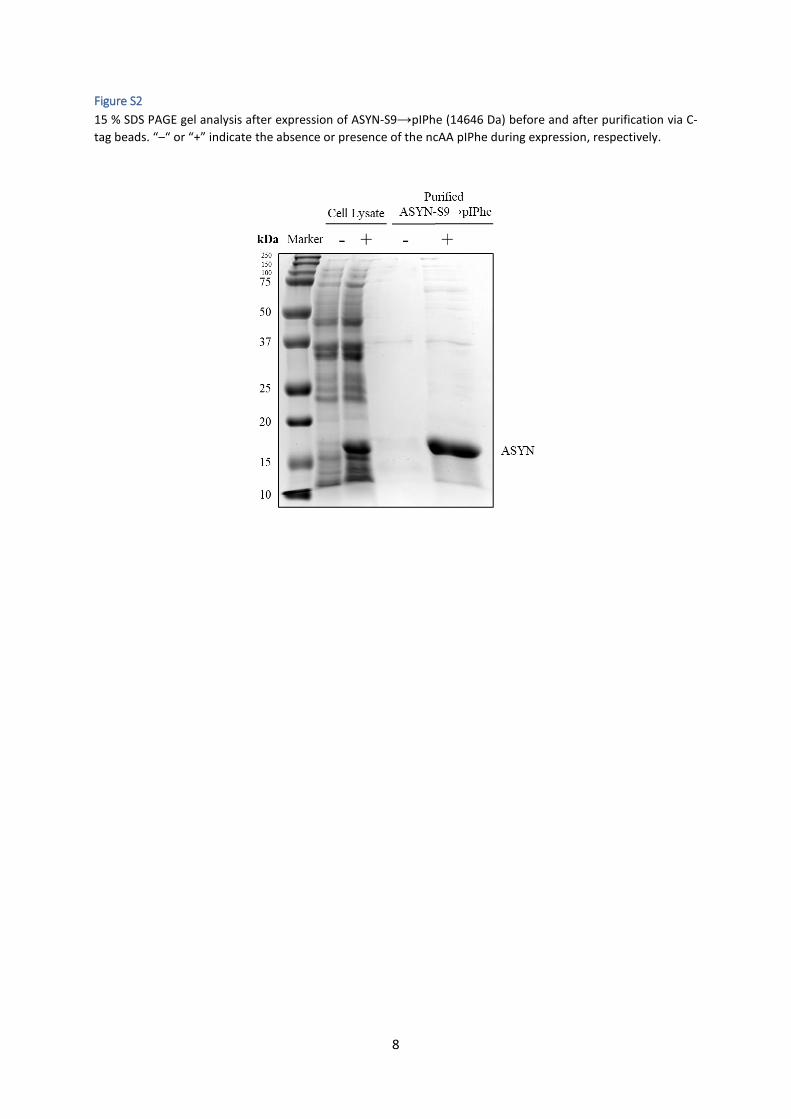
Samples for SDS-PAGE analysis and 5 µL of a BIO-RAD Precision Plus ProteinTM Dual Color Standard were applied to a 15 % SDS-gel and run at 90 V in a BIO-RAD Mini-PROTEAN Tetra System, to verify the purity and effective incorporation of the artificial amino acid. After Coomassie Blue staining (Brillant Blau R 250, ROTH), gels were imaged using a BIO-RAD ChemiDocTM Imaging System (Figure S2). For additional proof for expression of the correct product, full-length ESI-MS were recorded (Figure S3).
Spin labelling of ASYN
The labelling protocol was based on a reaction mixture of 180 μL of 530 μM ASYN-S9→pIPhe (in PBS, pH 8), a 5-fold molar excess of Na2PdCl4 (SIGMA-ALDRICH, from a 50 mM stock solution in DMSO) and a 6-fold molar excess of NOBA (from a 100 mM stock solution in DMSO). The mixture was incubated overnight at 37 °C and 1000 rpm in an Eppendorf ThermoMixer C. 24 μL of 1M 1,4-Dithiothreitol (DTT; SIGMA-ALDRICH) were added and properly resuspended, before the mixture was shaken for another 1 min at 37 °C. The excess reactants were removed with the use of two spin desalting columns (ZebaTM Spin Desalting Columns 7K MWCO, Thermo Scientific; 500 μL column material each) and by 3K spin filters. Full-length ESI-MS of spin labelled ASYN-
S9→NOBA shows approx. 60 % (semi-quantitatively) of conversion to ASYN-S9→NOBA (Figure S4).
Spin labelling of TRX
100 µL of 80 µM TRX-R74→pIPhe or of TRX wildtype (as a negative control) in PBS, pH 8, were mixed with 100 equivalents of NOBA and a 30-fold molar excess of Na2PdCl4. The reaction mixture was incubated at 37 °C and 1400 rpm for 3 h. 13 µL of 1M DTT were added and incubated for 1 min, before excess reagents were removed by washing over two spin desalting columns and over 3K spin filters, until no more unbound NOBA was
removed as confirmed by cw EPR spectroscopy. The TRX-R74→NOBA spectrum (Figure 2G, main text) exhibits a spin concentration of 20 µM at a protein concentration of 110 µM. For ESI-MS see Figure 2D and E (main text) and for detailed analysis Figure S7.
TRX-D14R74→pIPhe for the distance measurement was labelled in full analogy to the above described protocol (for ESI-MS see Figure S8). Before the DEER measurement, the proteins were desalted to be dissolved in MilliQ-water, and with 20 vol.-% deuterated glycerol. For the screening of palladium catalysts (Figure S9 and Figure 2, main text) each 30 µL of 100 µM protein solution were incubated with 67 equivalents of NOBA and 13 equivalents of the respective palladium catalyst (prepared as 10 mM stock solution). The mixture was incubated at 37 °C and 1400 rpm for 30 min. 2 µL of 1 M DTT were added, properly resuspended and incubated for another 5 min, before excess reagents were removed by dialysis (Slide-A-Lyzer, Thermo Fisher Scientific).
Mass spectrometry of proteins
Before being subjected to the Proteomics Facility of the University of Konstanz, the buffer of the protein samples was exchanged with MilliQ-water in 3K spin filters. Protein masses were recorded by FTMS+ESI-MS at the Proteomics Facility of the University of Konstanz on an LTQ Orbitrap Discovery spectrometer.
Cw EPR measurements, evaluation and spectral simulations
EPR spectra were recorded at a BRUKER EMXnano X-band continuous wave EPR spectrometer without temperature regulation at room temperature (approx. 22 °C). A typical sample volume of 30 μL was filled into a glass capillary (HIRSCHMANN® ringcaps®; inner diameter 1.02 mm). Spectra were recorded at a modulation amplitude of 1 G, microwave attenuation 12 dB, and a sweep width of 150 G. Typically, 10 - 60 scans of 60.06 sec scan time each were accumulated to improve the signal-to-noise ratio. Quantitative spin concentrations of samples were obtained with the use of the built-in EMXnano reference-free spin counting module (Xenon software, Bruker). Spectra were plotted with MATLAB R2018a (The MatWorks, Inc. 3 Apple Hill Drive, Natick, MA 01760-2098, USA).
5
ASYN spectra were normalized by dividing the spectra by the area, which is defined by the double integral (Figure 4C, main text). Spectra were simulated using MATLAB R2014a and R2018a and the EasySpin versions 5.1.0 and 5.2.20 with the chili function, respectively.4 For all simulations, a one-component fit and g = [gx gy gz] = [2.00906 2.00687 2.003] were chosen5 (except for the SLK-1-derived spectrum, g given below). For fits of unbound NOBA and of ASYN-
S9→NOBA in solution, A = [Axx Ayy Azz] = [13.017 13.021 109.32] and an intrinsic linewidth of 0.1324 G were
chosen5-7. For ASYN-S9→NOBA bound to vesicles, A = [Axx Ayy Azz] = [13.226 19.183 101.79], and an intrinsic
linewidth of 0.089793 G were determined. For the fit of TRX-R74→NOBA, A = [Axx Ayy Azz] = [17.35 17.35
106.48] and an intrinsic linewidth of 0.1100 G were used. For the fit of TRX-R74→MTSSL A = [Axx Ayy Azz] =
[13.91 13.91 109.43] and an intrinsic linewidth of 0.1100 G were used. For the fit of TRX-R74→PROXYL A = [Axx
Ayy Azz] = [12.42 12.42 110.38] and an intrinsic linewidth of 0.1100 G were used. For TRX-R74→SLK-1 g = [2.00806 2.00806 2.003] like determined by Schmidt et al. was used,1 and in addition A = [Axx Ayy Azz] = [14.74 14.74 107.08] and an intrinsic linewidth of 0.1100 G were chosen for the simulation.
DEER measurement
The distance measurement of TRX-D14R74→NOBA doubly spin labelled with NOBA was performed in Q-band using an Elexsys E580 spectrometer (Bruker Biospin) equipped with a helium gas flow system (CF935, Oxford Instruments). The sample was measured at 50 K. The pump pulse was set to the maximum of the nitroxide spectrum (πpump = 24 ns), and the observer pulse was set 47 MHz lower than the pump pulse (πobserver = 52 ns). 89 scans were accumulated to improve the signal-to-noise ratio. The data were processed using MATLAB R2018a and the DeerAnalysis2018 software.8 The background correction was performed by subtracting singly
labelled TRX-R74→NOBA from the dipolar evolution time trace of the TRX-D14R74→NOBA (Figure S11). The distance distribution (Figure 3B, main text) was obtained with the model-free Tikhonov regularization method.9 The degree of double labelling was determined as described by Jeschke et al.10 We calculated the inversion profiles with EasySpin and received an inversion efficiency of λ = 0.43 = 43 %. Subsequently, for the observed modulation depth of Δ = 0.066 = 6.6 % (see Figure S11) and from the correlation Δ = 0.5*λ*f, we calculated a double labelling degree of f = 0.31 = 31 % (compare labelling degree as detected by mass spectrometry, Figure S8).
Observation of ASYN-vesicle interaction
Anionic POPG (1-palmitoyl-2-oleoyl-sn-glycero-3-phospho-rac-(1’-glycerol); Avanti Polar Lipids) with a molar mass of M = 770,99 g/mol and a concentration of 25 mg/mL in chloroform was used. The chloroform was removed under a nitrogen stream, and the resulting lipid layers were evaporated in vacuum overnight. Then the lipids were rehydrated in 300 μL PBS, pH 8, to a final concentration of 54 mM, and incubated for 20 min at room temperature under occasional vortexing. 100 nm LUVs were prepared by 45 times extrusion through a layer of 100 nm polycarbonate film (Whatman) in a handheld extruder (Avanti, Polar Lipids). Vesicle size was confirmed by Dynamic Light Scattering (DLS) in a Zetasizer nano ZS spectrometer, Malvern Instruments Ltd., at 298 K (Figure S12). Therefore, 2 µL of lipid solution were dispensed in 1 mL PBS, pH 8, and filled into a 1 cm disposable polycarbonate cuvette. LUVs were used the same day for the ASYN binding experiment. For the proof of ASYN-vesicle binding, spin labelled proteins and LUVs were gently mixed in a molar ratio of ASYN/POPG = 1/96 in a final volume of 70 μL (with a final ASYN concentration of 400 μM, whereof approx. 6 % were spin labelled with NOBA). The samples were incubated for 20 min before starting EPR and CD measurements. In addition, a solution of 24 µM NOBA in PBS, pH 8, and a solution of a 400 µM ASYN sample in PBS, pH 8, but without LUVs were measured by cw EPR.
Measurement of circular dichroism (CD) spectra
CD spectra were recorded in a JASCO J-715 Spectropolarimeter. For CD spectra of ASYN, the sample containing
ASYN-S9→NOBA and vesicles (prepared as described above) was diluted in PBS, pH 8, to a final concentration
of 100 μM ASYN. In addition, a CD spectrum of 100 μM ASYN in PBS, pH 8, without LUVs was measured. Spectra
6
were recorded at room temperature, using a 0.5 mm cuvette. Five scans each were accumulated to improve
signal-to-noise levels. 1000 data points were received between 280 and 180 nm. The data were baseline-
corrected, and subsequently background-corrected with a sample containing only buffer (PBS, pH 8). Noisy
data at low wavelength and less relevant parts at higher wavelengths were cut off for the final presentation of
the data (Figure 4B, main text). For the calculation of the molar residue ellipticity out of the given spectrometer
unit (CD-signal in mdeg), the formula MRE = [MRW*CD-signal/1000]/(10*d*c) with M = 14777 g/mol, Naa = 140,
MRW = M/Naa, c (= 100 µM) = 0.0014777 g/mL, and d = 0.05 cm was used.
To test the stability of the secondary structure upon the applied labelling conditions, TRX wildtype without
reactants was compared with samples of TRX wildtype treated with the reactants (Figure S10). A CD sample
contained 20 µM protein each. The sample from which the spectrum “TRX wildtype + Pd” is derived,
additionally contained 44 times molar excess of Na2PdCl4. In another sample TRX wildtype was incubated with
44 times molar excess of Na2PdCl4 and 111 equivalents of NOBA. This sample was then desalted over one spin
desalting column, before DTT was added, and desalted by another column. Then the CD spectrum “TRX
wildtype + Pd + NOBA + DTT” was obtained. The spectra were baseline- and background-corrected as described
above. For TRX the MRE was calculated as follows: MRE = [MRW*CD-signal/1000]/(10*d*c) with
M = 14799 g/mol, Naa = 137, MRW = M/Naa, c (= 20 µM) = 0.00029538 g/mL, and d = 0.05 cm.
7
Supplementary Figures
Figure S1
Synthesis overview of the NOBA spin label.
8
Figure S2
15 % SDS PAGE gel analysis after expression of ASYN-S9→pIPhe (14646 Da) before and after purification via C-
tag beads. “–“ or “+” indicate the absence or presence of the ncAA pIPhe during expression, respectively.
9
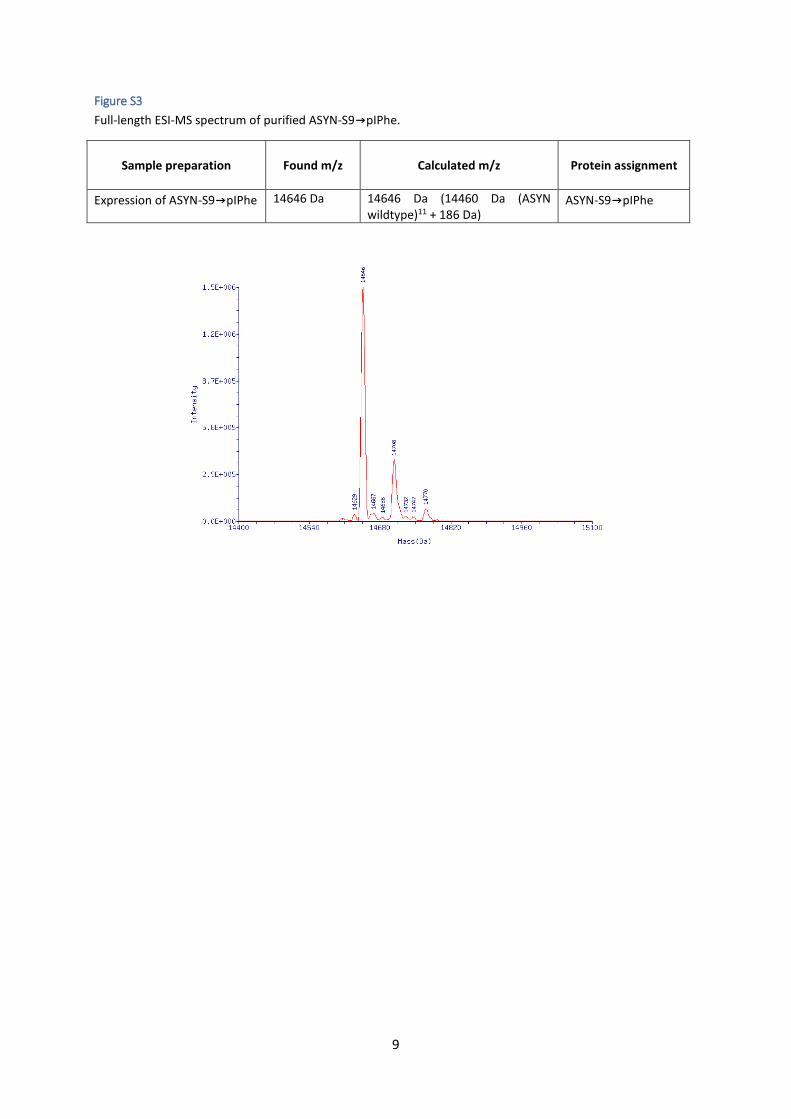
Figure S3
Full-length ESI-MS spectrum of purified ASYN-S9→pIPhe.
Sample preparation
Found m/z
Calculated m/z
Protein assignment
Expression of ASYN-S9→pIPhe 14646 Da 14646 Da (14460 Da (ASYN wildtype)11 + 186 Da)
ASYN-S9→pIPhe
10
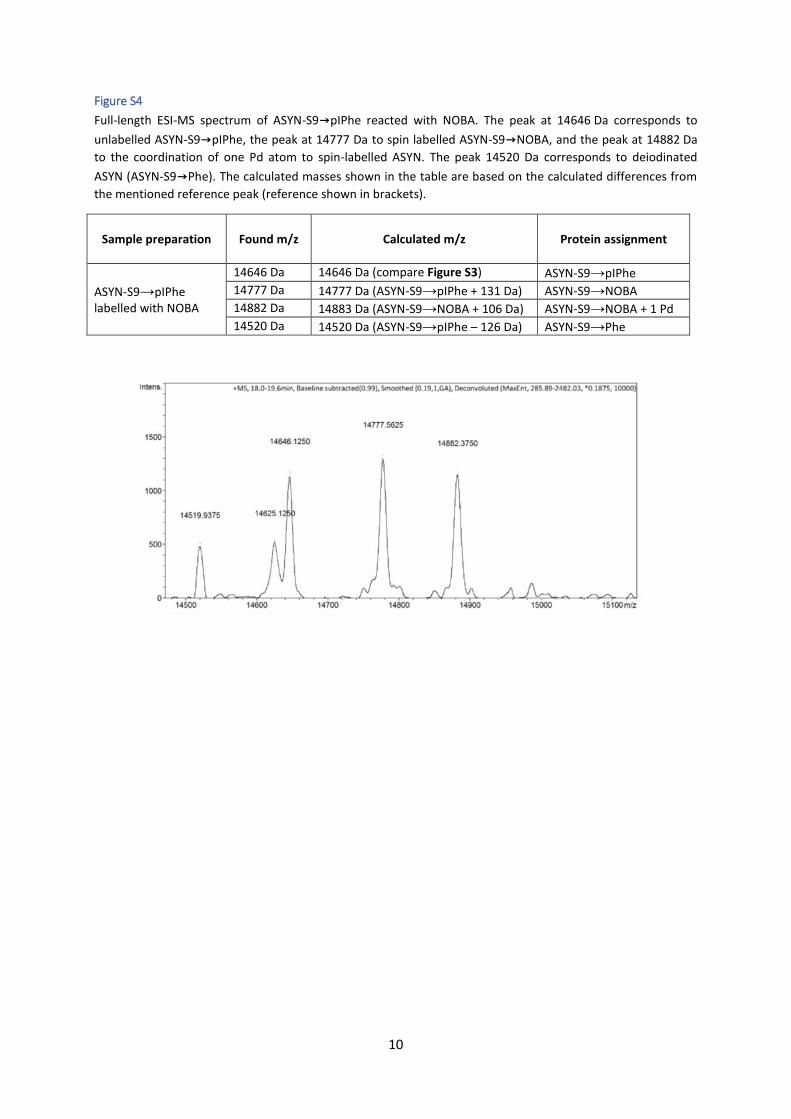
Figure S4
Full-length ESI-MS spectrum of ASYN-S9→pIPhe reacted with NOBA. The peak at 14646 Da corresponds to
unlabelled ASYN-S9→pIPhe, the peak at 14777 Da to spin labelled ASYN-S9→NOBA, and the peak at 14882 Da
to the coordination of one Pd atom to spin-labelled ASYN. The peak 14520 Da corresponds to deiodinated
ASYN (ASYN-S9→Phe). The calculated masses shown in the table are based on the calculated differences from
the mentioned reference peak (reference shown in brackets).
Sample preparation
Found m/z
Calculated m/z
Protein assignment
ASYN-S9→pIPhe labelled with NOBA
14646 Da 14646 Da (compare Figure S3) ASYN-S9→pIPhe
14777 Da 14777 Da (ASYN-S9→pIPhe + 131 Da) ASYN-S9→NOBA
14882 Da 14883 Da (ASYN-S9→NOBA + 106 Da) ASYN-S9→NOBA + 1 Pd
14520 Da 14520 Da (ASYN-S9→pIPhe – 126 Da) ASYN-S9→Phe
11
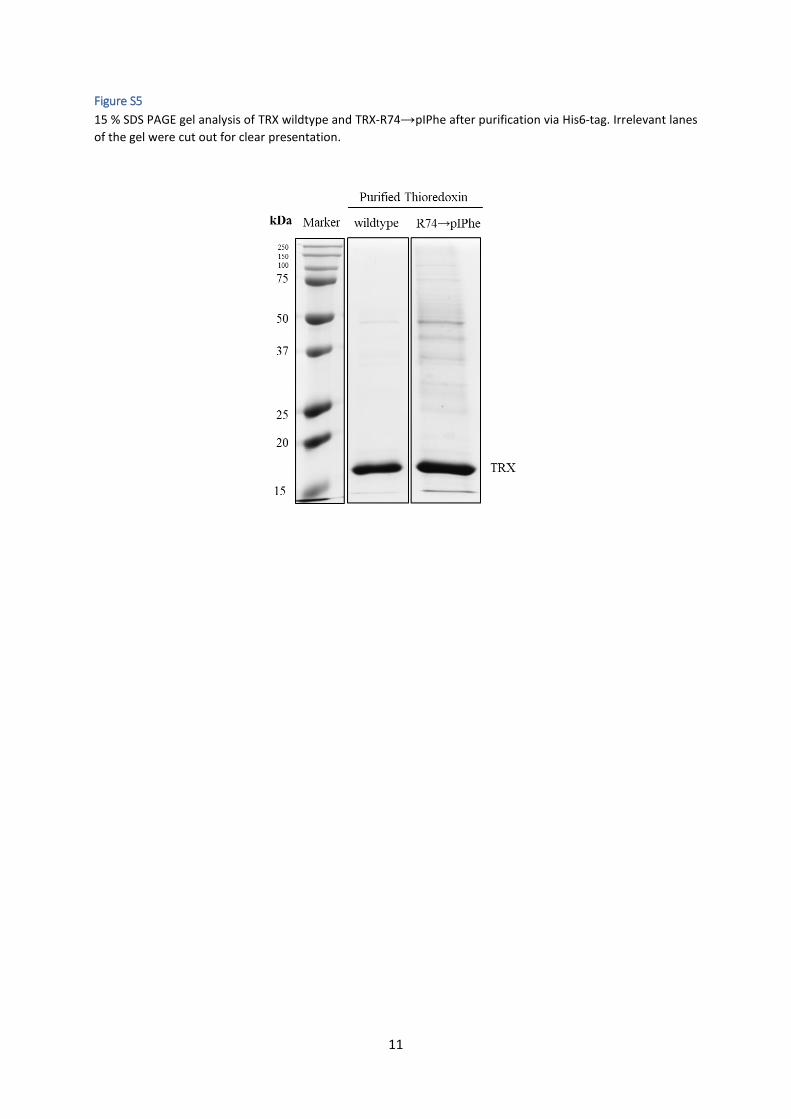
Figure S5
15 % SDS PAGE gel analysis of TRX wildtype and TRX-R74→pIPhe after purification via His6-tag. Irrelevant lanes
of the gel were cut out for clear presentation.
12
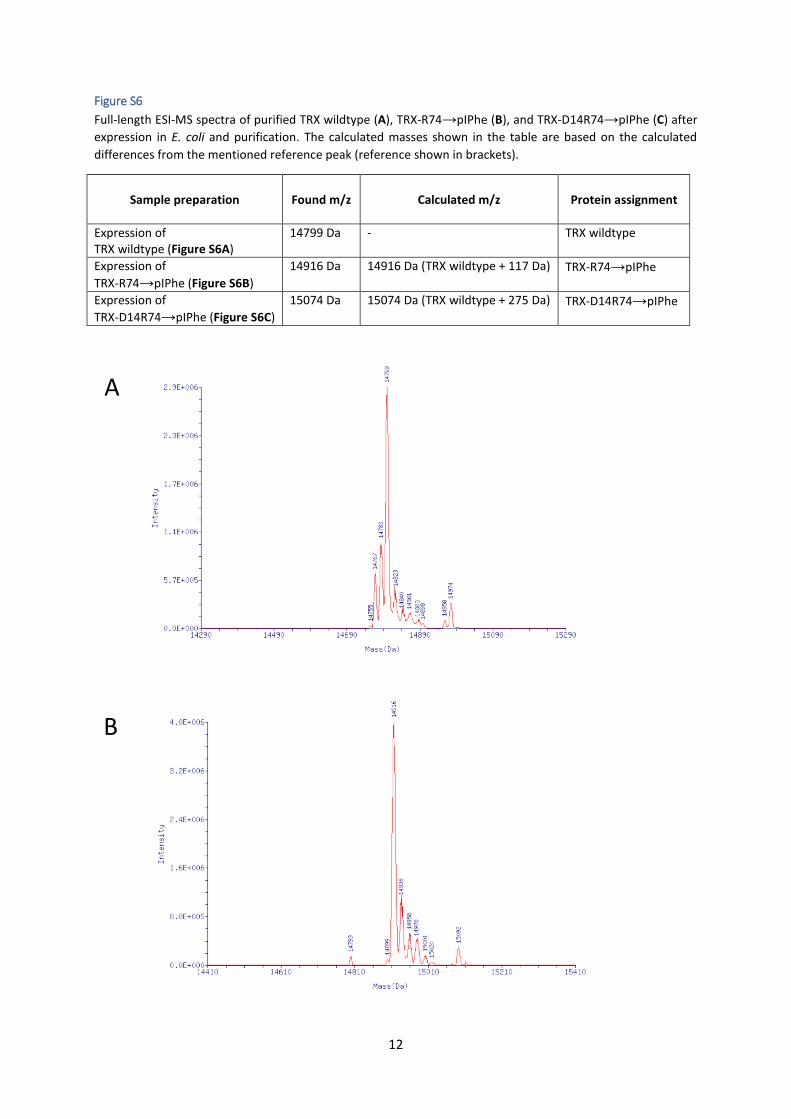
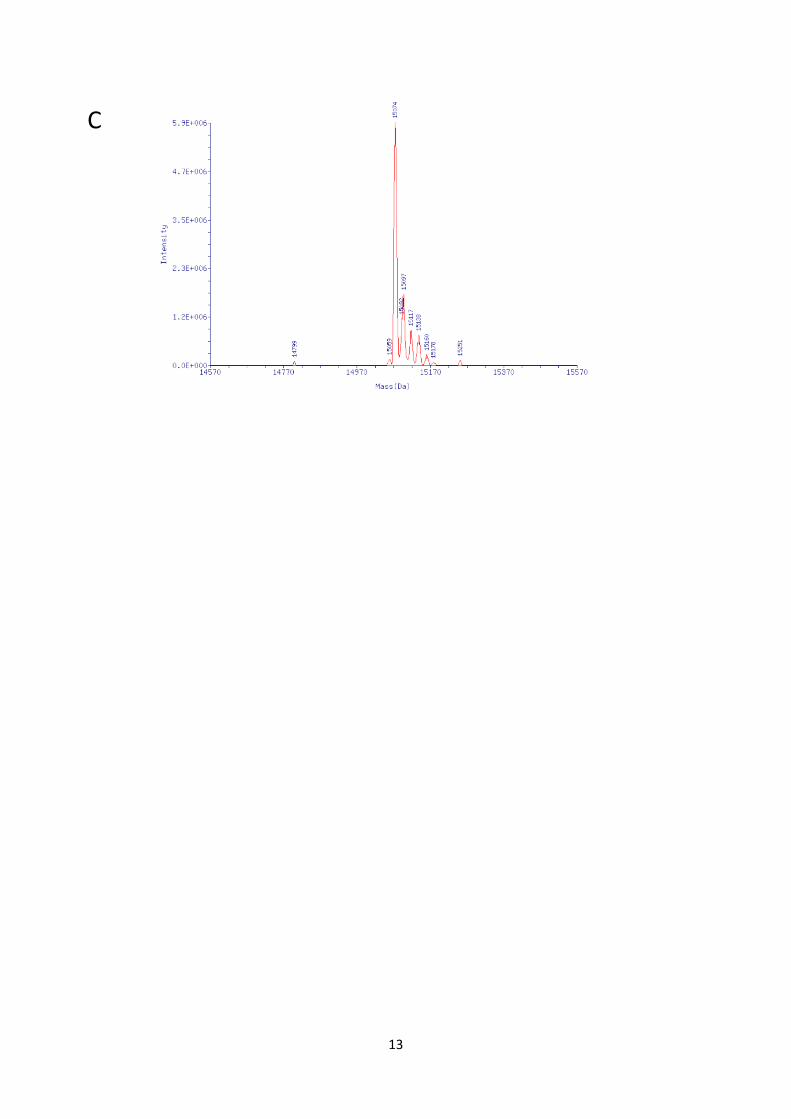
Figure S6
Full-length ESI-MS spectra of purified TRX wildtype (A), TRX-R74→pIPhe (B), and TRX-D14R74→pIPhe (C) after
expression in E. coli and purification. The calculated masses shown in the table are based on the calculated
differences from the mentioned reference peak (reference shown in brackets).
Sample preparation
Found m/z
Calculated m/z
Protein assignment
Expression of TRX wildtype (Figure S6A)
14799 Da - TRX wildtype
Expression of
TRX-R74→pIPhe (Figure S6B)
14916 Da 14916 Da (TRX wildtype + 117 Da) TRX-R74→pIPhe
Expression of
TRX-D14R74→pIPhe (Figure S6C)
15074 Da 15074 Da (TRX wildtype + 275 Da) TRX-D14R74→pIPhe
A
B
13
C
14
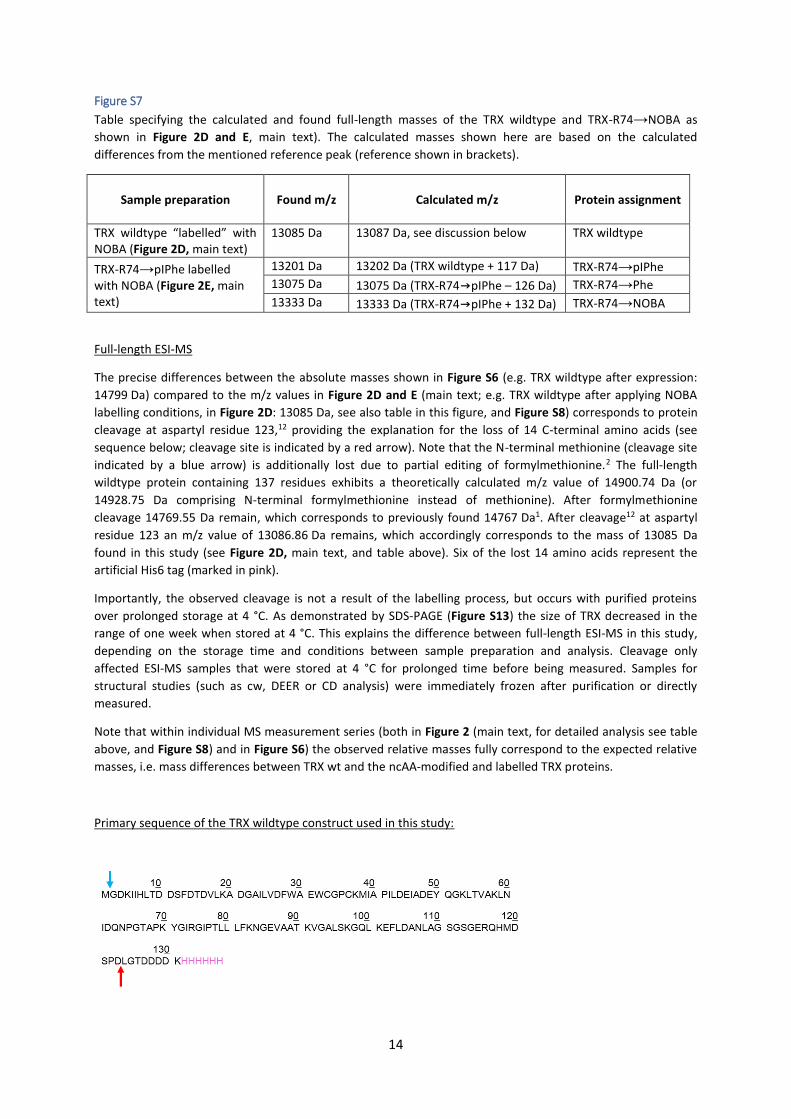
Figure S7
Table specifying the calculated and found full-length masses of the TRX wildtype and TRX-R74→NOBA as
shown in Figure 2D and E, main text). The calculated masses shown here are based on the calculated
differences from the mentioned reference peak (reference shown in brackets).
Sample preparation
Found m/z
Calculated m/z
Protein assignment
TRX wildtype “labelled” with NOBA (Figure 2D, main text)
13085 Da 13087 Da, see discussion below TRX wildtype
TRX-R74→pIPhe labelled with NOBA (Figure 2E, main text)
13201 Da 13202 Da (TRX wildtype + 117 Da) TRX-R74→pIPhe
13075 Da 13075 Da (TRX-R74→pIPhe – 126 Da) TRX-R74→Phe
13333 Da 13333 Da (TRX-R74→pIPhe + 132 Da) TRX-R74→NOBA
Full-length ESI-MS
The precise differences between the absolute masses shown in Figure S6 (e.g. TRX wildtype after expression:
14799 Da) compared to the m/z values in Figure 2D and E (main text; e.g. TRX wildtype after applying NOBA
labelling conditions, in Figure 2D: 13085 Da, see also table in this figure, and Figure S8) corresponds to protein
cleavage at aspartyl residue 123,12 providing the explanation for the loss of 14 C-terminal amino acids (see
sequence below; cleavage site is indicated by a red arrow). Note that the N-terminal methionine (cleavage site
indicated by a blue arrow) is additionally lost due to partial editing of formylmethionine.2 The full-length
wildtype protein containing 137 residues exhibits a theoretically calculated m/z value of 14900.74 Da (or
14928.75 Da comprising N-terminal formylmethionine instead of methionine). After formylmethionine
cleavage 14769.55 Da remain, which corresponds to previously found 14767 Da1. After cleavage12 at aspartyl
residue 123 an m/z value of 13086.86 Da remains, which accordingly corresponds to the mass of 13085 Da
found in this study (see Figure 2D, main text, and table above). Six of the lost 14 amino acids represent the
artificial His6 tag (marked in pink).
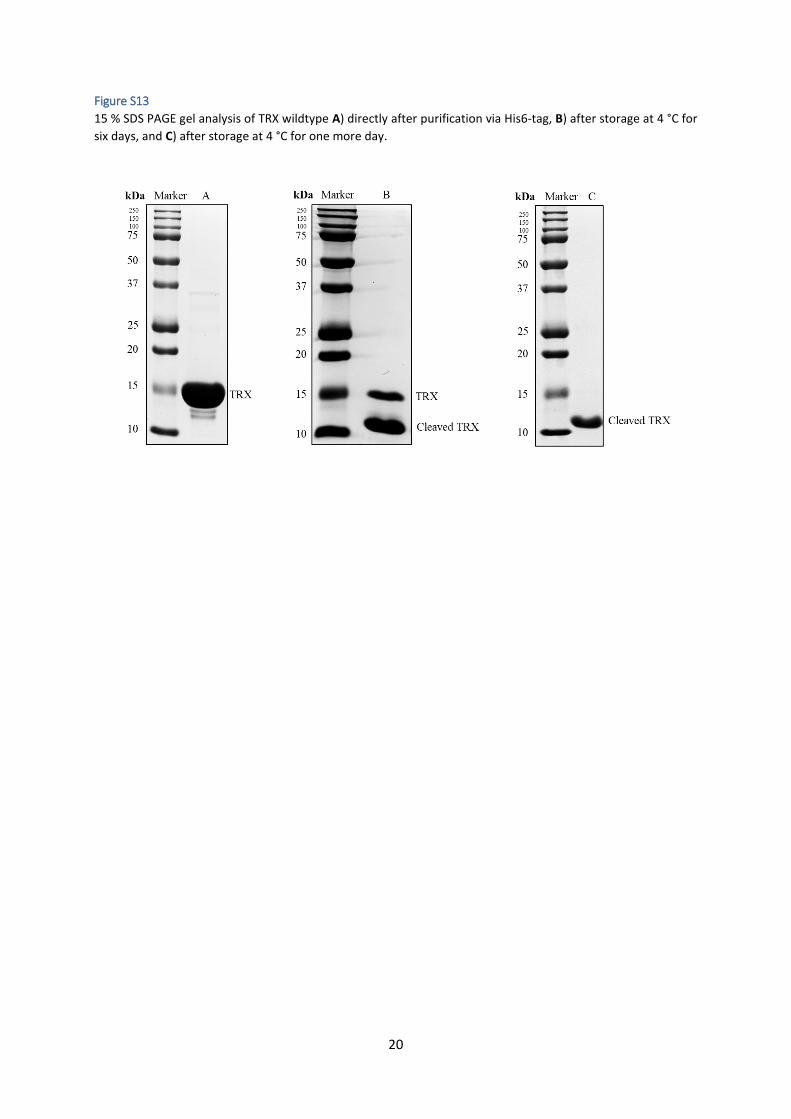
Importantly, the observed cleavage is not a result of the labelling process, but occurs with purified proteins
over prolonged storage at 4 °C. As demonstrated by SDS-PAGE (Figure S13) the size of TRX decreased in the
range of one week when stored at 4 °C. This explains the difference between full-length ESI-MS in this study,
depending on the storage time and conditions between sample preparation and analysis. Cleavage only
affected ESI-MS samples that were stored at 4 °C for prolonged time before being measured. Samples for
structural studies (such as cw, DEER or CD analysis) were immediately frozen after purification or directly
measured.
Note that within individual MS measurement series (both in Figure 2 (main text, for detailed analysis see table
above, and Figure S8) and in Figure S6) the observed relative masses fully correspond to the expected relative
masses, i.e. mass differences between TRX wt and the ncAA-modified and labelled TRX proteins.
Primary sequence of the TRX wildtype construct used in this study:
15
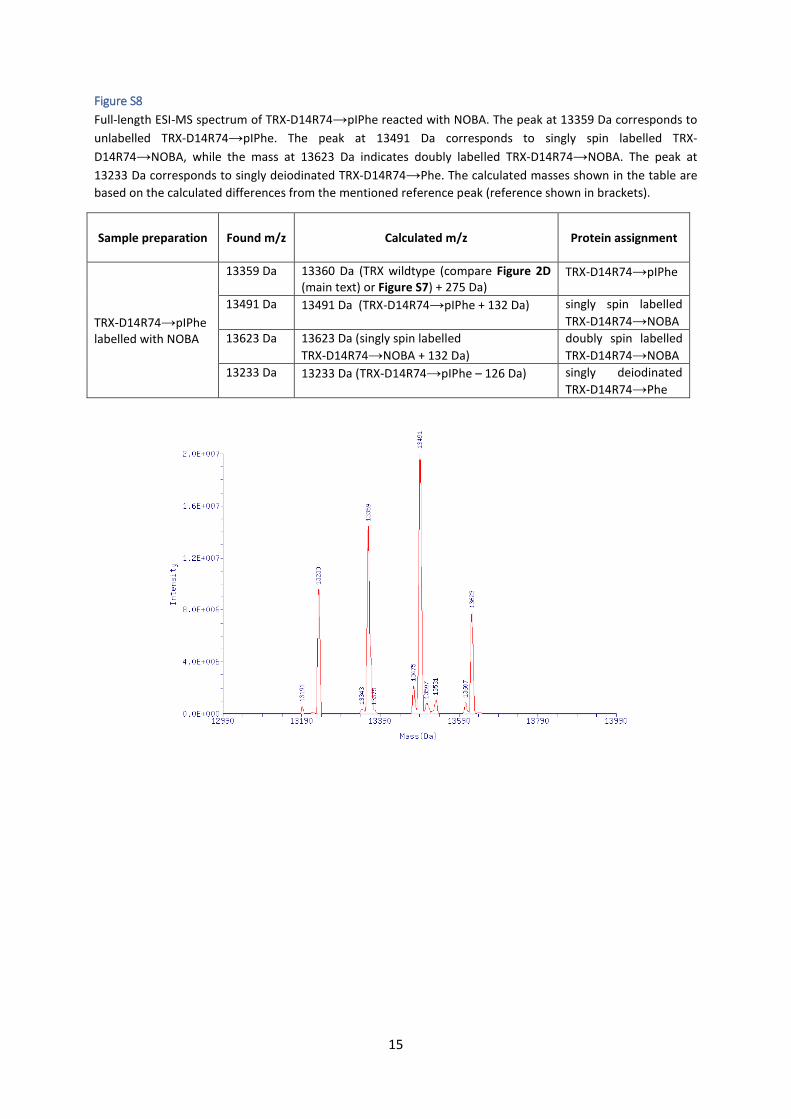
Figure S8
Full-length ESI-MS spectrum of TRX-D14R74→pIPhe reacted with NOBA. The peak at 13359 Da corresponds to
unlabelled TRX-D14R74→pIPhe. The peak at 13491 Da corresponds to singly spin labelled TRX-
D14R74→NOBA, while the mass at 13623 Da indicates doubly labelled TRX-D14R74→NOBA. The peak at
13233 Da corresponds to singly deiodinated TRX-D14R74→Phe. The calculated masses shown in the table are
based on the calculated differences from the mentioned reference peak (reference shown in brackets).
Sample preparation
Found m/z
Calculated m/z
Protein assignment
TRX-D14R74→pIPhe labelled with NOBA
13359 Da 13360 Da (TRX wildtype (compare Figure 2D (main text) or Figure S7) + 275 Da)
TRX-D14R74→pIPhe
13491 Da 13491 Da (TRX-D14R74→pIPhe + 132 Da) singly spin labelled
TRX-D14R74→NOBA
13623 Da 13623 Da (singly spin labelled
TRX-D14R74→NOBA + 132 Da)
doubly spin labelled
TRX-D14R74→NOBA
13233 Da 13233 Da (TRX-D14R74→pIPhe – 126 Da) singly deiodinated
TRX-D14R74→Phe
16
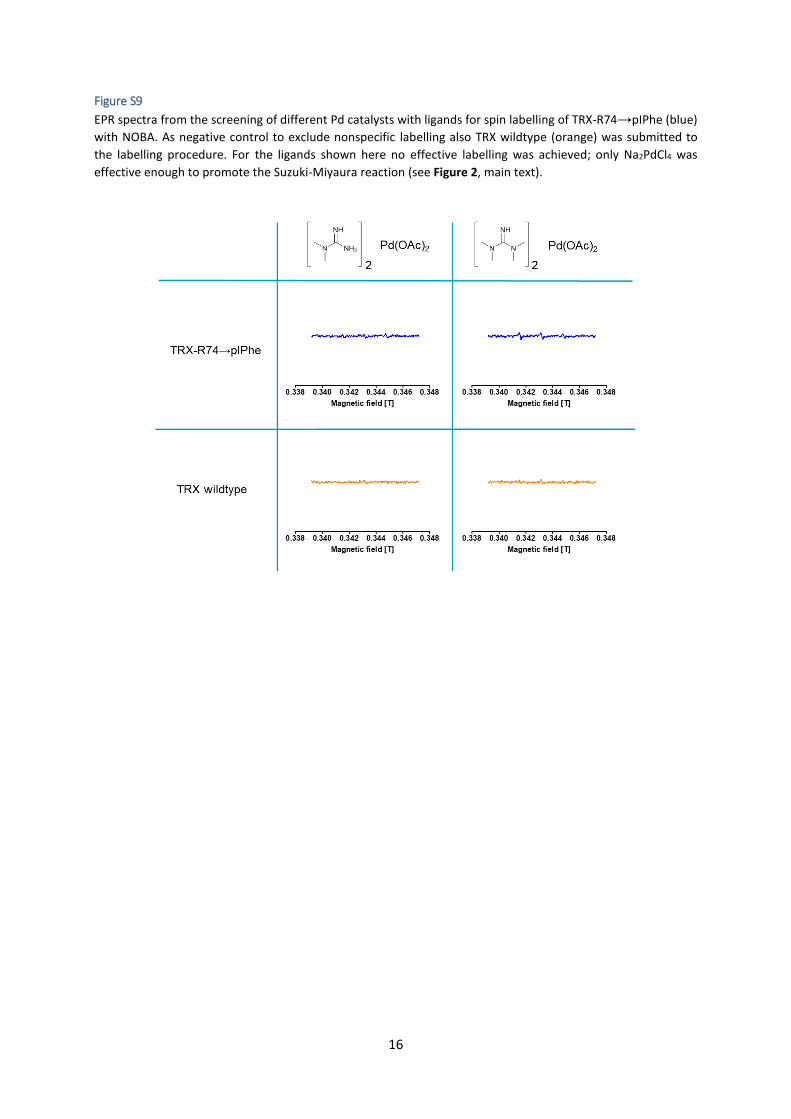
Figure S9
EPR spectra from the screening of different Pd catalysts with ligands for spin labelling of TRX-R74→pIPhe (blue)
with NOBA. As negative control to exclude nonspecific labelling also TRX wildtype (orange) was submitted to
the labelling procedure. For the ligands shown here no effective labelling was achieved; only Na2PdCl4 was
effective enough to promote the Suzuki-Miyaura reaction (see Figure 2, main text).
17
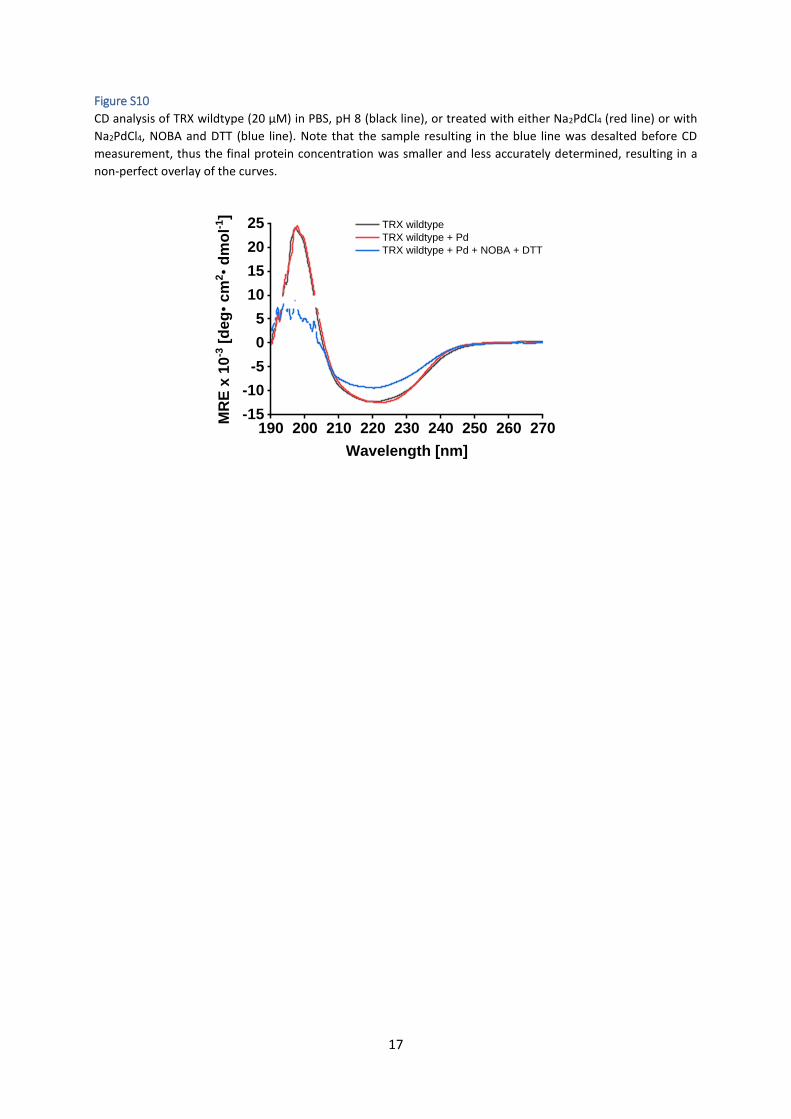
Figure S10
CD analysis of TRX wildtype (20 µM) in PBS, pH 8 (black line), or treated with either Na2PdCl4 (red line) or with
Na2PdCl4, NOBA and DTT (blue line). Note that the sample resulting in the blue line was desalted before CD
measurement, thus the final protein concentration was smaller and less accurately determined, resulting in a
non-perfect overlay of the curves.
190 200 210 220 230 240 250 260 270-15
-10
-5
0
5
10
15
20
25M
RE
x 1
0-3
[d
eg
• c
m2•
dm
ol-1
]
Wavelength [nm]
TRX wildtype
TRX wildtype + Pd
TRX wildtype + Pd + NOBA + DTT
18
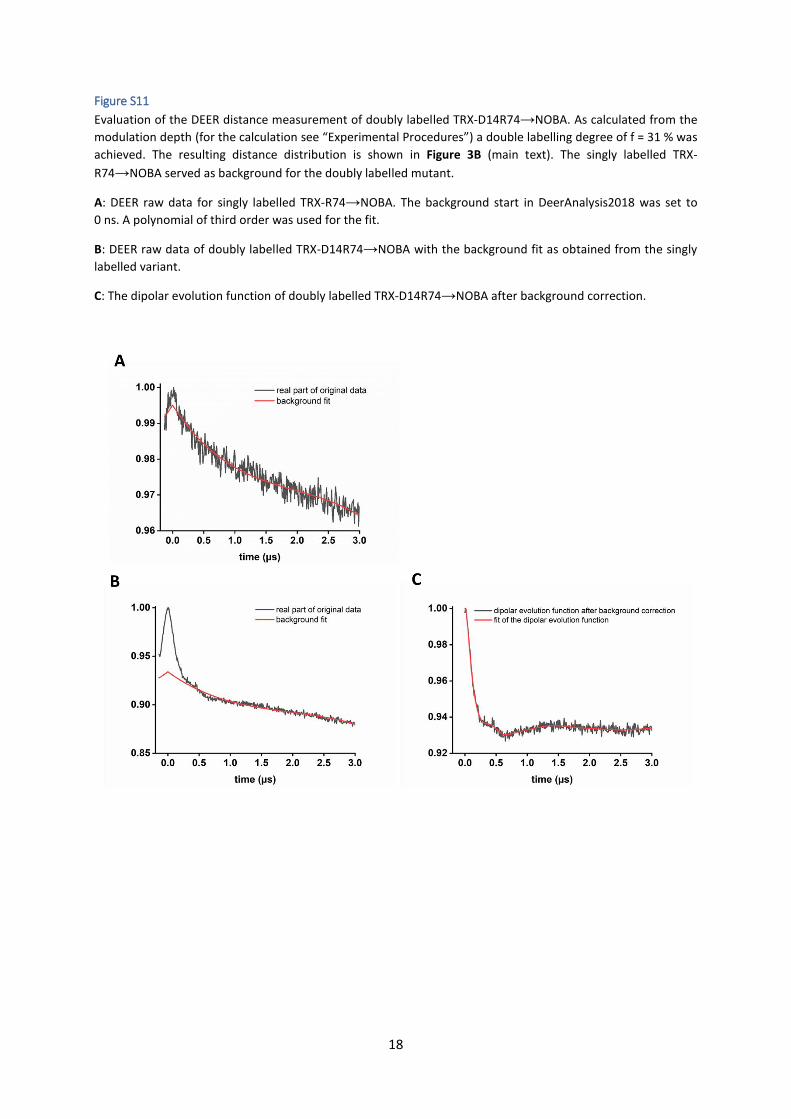
Figure S11
Evaluation of the DEER distance measurement of doubly labelled TRX-D14R74→NOBA. As calculated from the
modulation depth (for the calculation see “Experimental Procedures”) a double labelling degree of f = 31 % was
achieved. The resulting distance distribution is shown in Figure 3B (main text). The singly labelled TRX-
R74→NOBA served as background for the doubly labelled mutant.
A: DEER raw data for singly labelled TRX-R74→NOBA. The background start in DeerAnalysis2018 was set to
0 ns. A polynomial of third order was used for the fit.
B: DEER raw data of doubly labelled TRX-D14R74→NOBA with the background fit as obtained from the singly
labelled variant.
C: The dipolar evolution function of doubly labelled TRX-D14R74→NOBA after background correction.
19
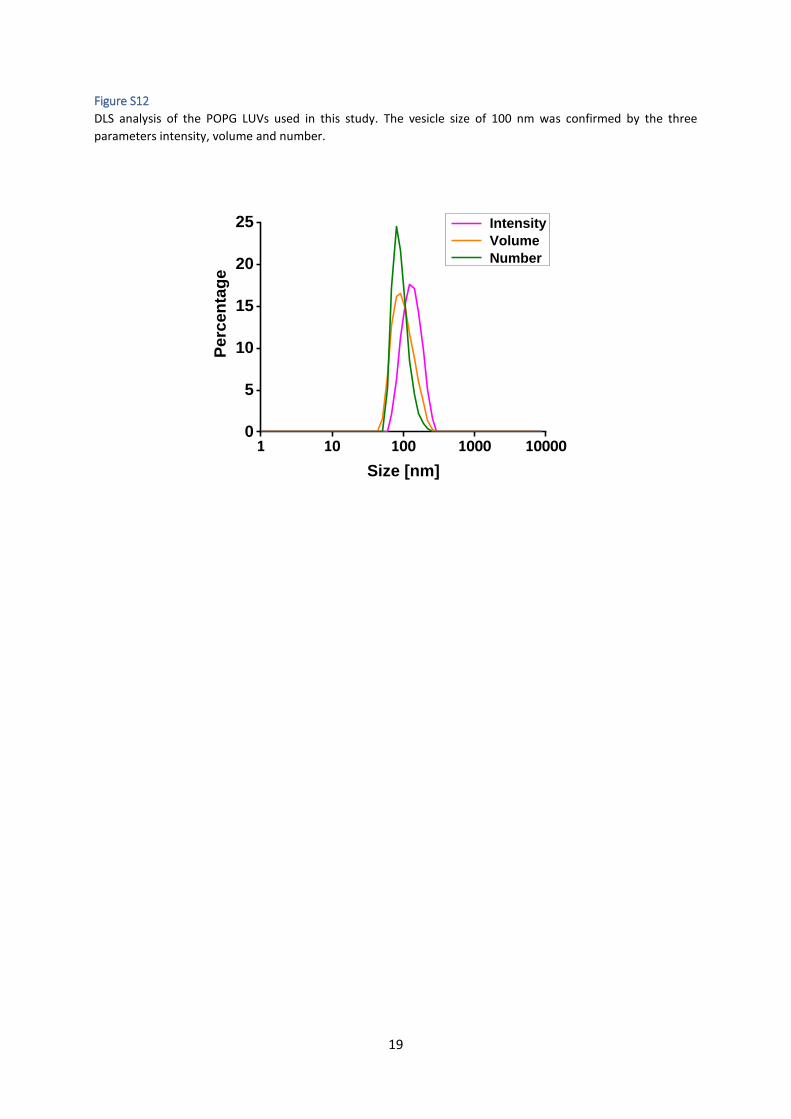
Figure S12
DLS analysis of the POPG LUVs used in this study. The vesicle size of 100 nm was confirmed by the three
parameters intensity, volume and number.
1 10 100 1000 100000
5
10
15
20
25P
erc
en
tag
e
Size [nm]
Intensity
Volume
Number
20
Figure S13
15 % SDS PAGE gel analysis of TRX wildtype A) directly after purification via His6-tag, B) after storage at 4 °C for
six days, and C) after storage at 4 °C for one more day.
21
Supplementary References
1. M. J. Schmidt, J. Borbas, M. Drescher and D. Summerer, J. Am. Chem. Soc., 2014, 136, 1238-1241.
2. M. J. Schmidt and D. Summerer, Angew. Chem., Int. Ed., 2013, 52, 4690-4693. 3. M. J. Schmidt, A. Fedoseev, D. Summerer and M. Drescher, Methods Enzymol., 2015, 563,
483-502. 4. S. Stoll and A. Schweiger, J. Magn. Reson., 2006, 178, 42-55. 5. S. Steigmiller, M. Börsch, P. Gräber and M. Huber, Biochim. Biophys. Acta, Bioenergetics,
2005, 1708, 143-153. 6. M. Robotta, H. R. Gerding, A. Vogel, K. Hauser, S. Schildknecht, C. Karreman, M. Leist, V.
Subramaniam and M. Drescher, ChemBioChem, 2014, 15, 2499-2502. 7. M. Robotta, C. Hintze, S. Schildknecht, N. Zijlstra, C. Jungst, C. Karreman, M. Huber, M. Leist,
V. Subramaniam and M. Drescher, Biochemistry, 2012, 51, 3960-3962. 8. G. Jeschke, V. Chechik, P. Ionita, A. Godt, H. Zimmermann, J. Banham, C. Timmel, D. Hilger
and H. Jung, Appl. Magn. Reson., 2006, 30, 473-498. 9. Y.-W. Chiang, P. P. Borbat and J. H. Freed, J. Magn. Reson., 2005, 172, 279-295. 10. G. Jeschke and Y. Polyhach, Phys. Chem. Chem. Phys., 2007, 9, 1895-1910. 11. J. Burré, S. Vivona, J. Diao, M. Sharma, A. T. Brunger and T. C. Südhof, Nature, 2013, 498, E4. 12. A. Li, R. C. Sowder, L. E. Henderson, S. P. Moore, D. J. Garfinkel and R. J. Fisher, Anal. Chem.,
2001, 73, 5395-5402.