Embed Size (px)
Citation preview

Table of Contents
Page
ST
RI
CT
LY
PR
IV
AT
EA
ND
CO
NF
ID
EN
TI
AL
0
ST
RI
CT
LY
PR
IV
AT
EA
ND
CO
NF
ID
EN
TI
AL
660 Newport Center Drive
Suite 950
Newport Beach, CA 92660
949.415.7321 - Office
949.415.7320 - Fax
WWW.CBCAPITAL.COM
MEMBER FINRA
March 8, 2017
A S S E T M A N A G E M E N T I N V E S T M E N T B A N K I N G R E S E A R C H
Presentation For:

Table of Contents
Page
ST
RI
CT
LY
PR
IV
AT
EA
ND
CO
NF
ID
EN
TI
AL
1
Forecasts
Financial Overview
About CB Capital Partners 2
21
38
The Business Plan Process 12

2
ST
RI
CT
LY
PR
IV
AT
EA
ND
CO
NF
ID
EN
TI
AL
About CB Capital Partners, Inc.
CB Capital Partners differentiates itself by providing customized financial
advisory, investment, and global research services
Conservative, disciplined and efficient approach
Providing innovative, long-term solutions to demanding client needs
Commitment to high quality services to high-growth companies
Senior-level commitment to provide resources for all areas of client
requirements from initial engagement to successful completion

3
ST
RI
CT
LY
PR
IV
AT
EA
ND
CO
NF
ID
EN
TI
AL
About CB Capital Partners, Inc.
Corporate Vision & Mission
To deliver the highest quality financial advisory and investment services to
our clients
To bring innovative and value-added solutions to our clients through a
conservative and disciplined application of our diverse professional banking
talents
To be an ethical service provider for capital and ideas
To give our clients the confidence that they have partnered with a high-
quality advisor with the expertise and insight available to achieve their
performance-based business objectives
4
ST
RI
CT
LY
PR
IV
AT
EA
ND
CO
NF
ID
EN
TI
AL
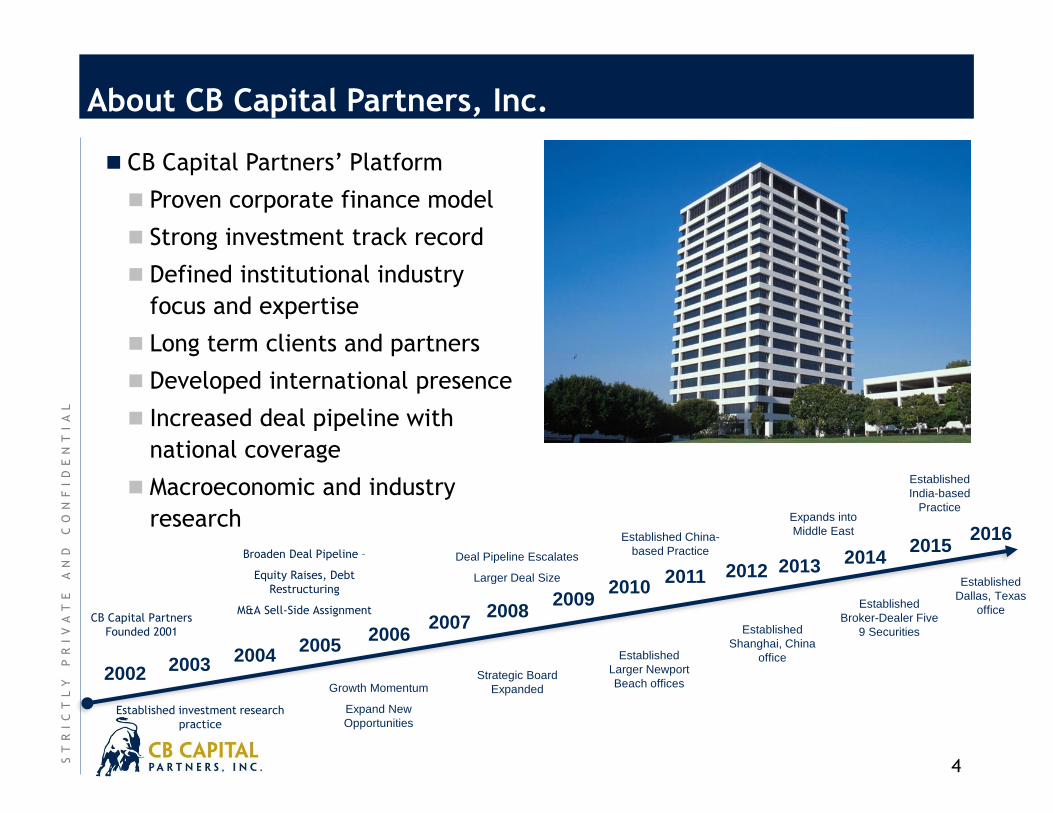
About CB Capital Partners, Inc.
CB Capital Partners’ Platform
Proven corporate finance model
Strong investment track record
Defined institutional industry
focus and expertise
Long term clients and partners
Developed international presence
Increased deal pipeline with
national coverage
Macroeconomic and industry
research
CB Capital Partners
Founded 2001
Broaden Deal Pipeline –
Equity Raises, Debt
Restructuring
M&A Sell-Side Assignment
Deal Pipeline Escalates
Larger Deal Size
2008
Strategic Board
Expanded
Established investment research
practice
20022004
2006
Growth Momentum
Expand New
Opportunities
20032005
2007
2010
Established
Larger Newport
Beach offices
Established
Broker-Dealer Five
9 Securities
2009
2012 2013 20142015
Established China-
based Practice
Expands into
Middle East
Established
India-based
Practice
2016
Established
Dallas, Texas
office
Established
Shanghai, China
office
2011
5
ST
RI
CT
LY
PR
IV
AT
EA
ND
CO
NF
ID
EN
TI
AL
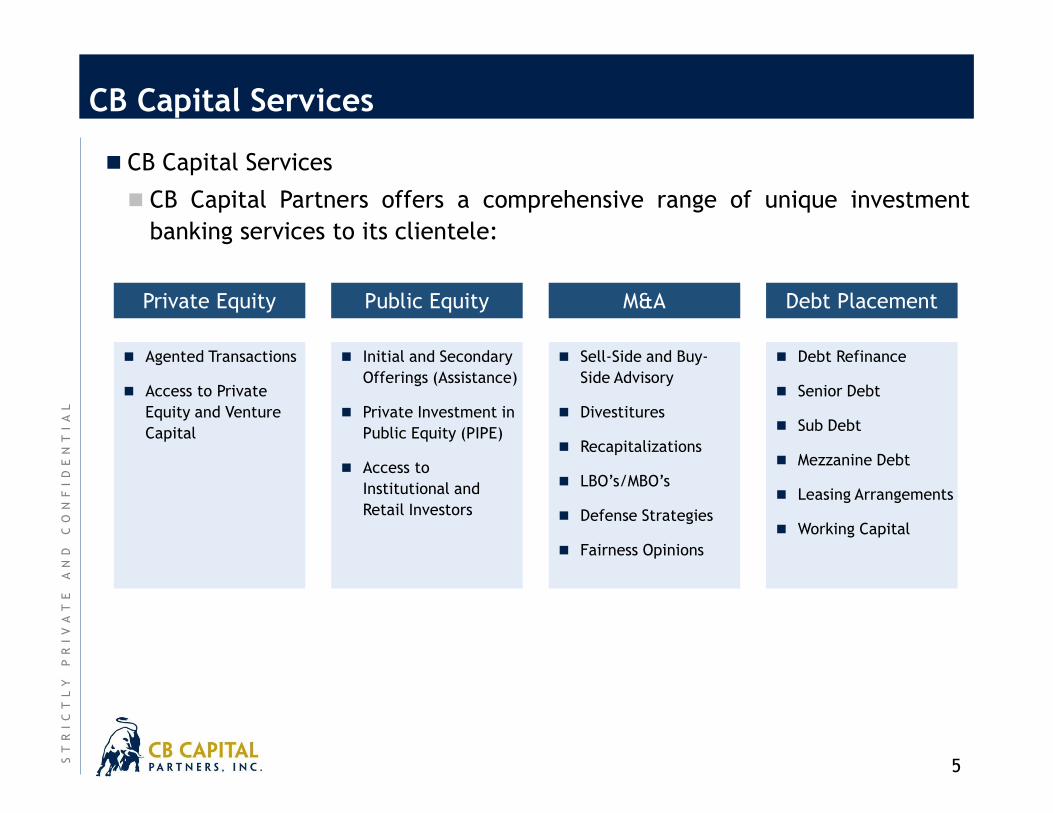
CB Capital Services
CB Capital Services
CB Capital Partners offers a comprehensive range of unique investment
banking services to its clientele:
Public Equity M&APrivate Equity
Agented Transactions
Access to Private
Equity and Venture
Capital
Debt Placement
Initial and Secondary
Offerings (Assistance)
Private Investment in
Public Equity (PIPE)
Access to
Institutional and
Retail Investors
Sell-Side and Buy-
Side Advisory
Divestitures
Recapitalizations
LBO’s/MBO’s
Defense Strategies
Fairness Opinions
Debt Refinance
Senior Debt
Sub Debt
Mezzanine Debt
Leasing Arrangements
Working Capital

6
ST
RI
CT
LY
PR
IV
AT
EA
ND
CO
NF
ID
EN
TI
AL
CB Capital on Cover of Orange County Business Journal
Orange County Business Journal (OCBJ) recently published an extended
article about CB Capital Partners, Inc.'s deals in India extensively featuring
our India head, Mrs. Meghana Gaikwad.

7
ST
RI
CT
LY
PR
IV
AT
EA
ND
CO
NF
ID
EN
TI
AL
CB Capital Research
CB Capital Research
CB Capital Research is headed by Mr. Henry To, CFA, CAIA, FRM. In that
capacity, Mr. To manages the general research process and publication of
CB Capital Partners’ Institutional Macro Research, which includes global
macroeconomics research, industry analyses, and insights on the
investment impact of certain economic themes and public policies. In
addition, Mr. To publishes for numerous financial journals including Forbes,
MarketWatch and Trader Planet.

8
ST
RI
CT
LY
PR
IV
AT
EA
ND
CO
NF
ID
EN
TI
AL
Broad Global Macro Experience and Coverage
Henry To, CFA, CAIA, FRMChief Investment Officer
Our research has been featured in:
Meghana GaikwadDirector
Over 10 investment professionals with over 100 investment transactions completed
Christopher BaclawskiManaging Partner & CEO
Henry To, CFA, CAIA, FRMPartner & CIO
Meghana GaikwadDirector, India
Bernardo OrtizAdvisor, Latin America
http://www.marketwatch.com/story/why
-gold-is-still-a-solid-long-term-investment-
2014-11-21
http://www.traderplanet.com/articles/view
/167267-the-euro-will-reach-parity-with-the-
u-s-dollar-in-2-3-years-stay-short/
http://www.forbes.com/sites/greatspeculat
ions/2015/03/23/investing-in-the-potential-
of-new-asian-infrastructure-investment-
bank/

9
ST
RI
CT
LY
PR
IV
AT
EA
ND
CO
NF
ID
EN
TI
AL
CB Capital Research
Mr. Henry To is a regular contributor on Forbes, MarketWatch.com, and many
other reputed financial publications that provides business news, analysis
and stock market data
In addition, Mr. To is a regular commentator on various media outlets such as
CNBC, CCTV, and others
Source: CNBC 07-8-15
10
ST
RI
CT
LY
PR
IV
AT
EA
ND
CO
NF
ID
EN
TI
AL
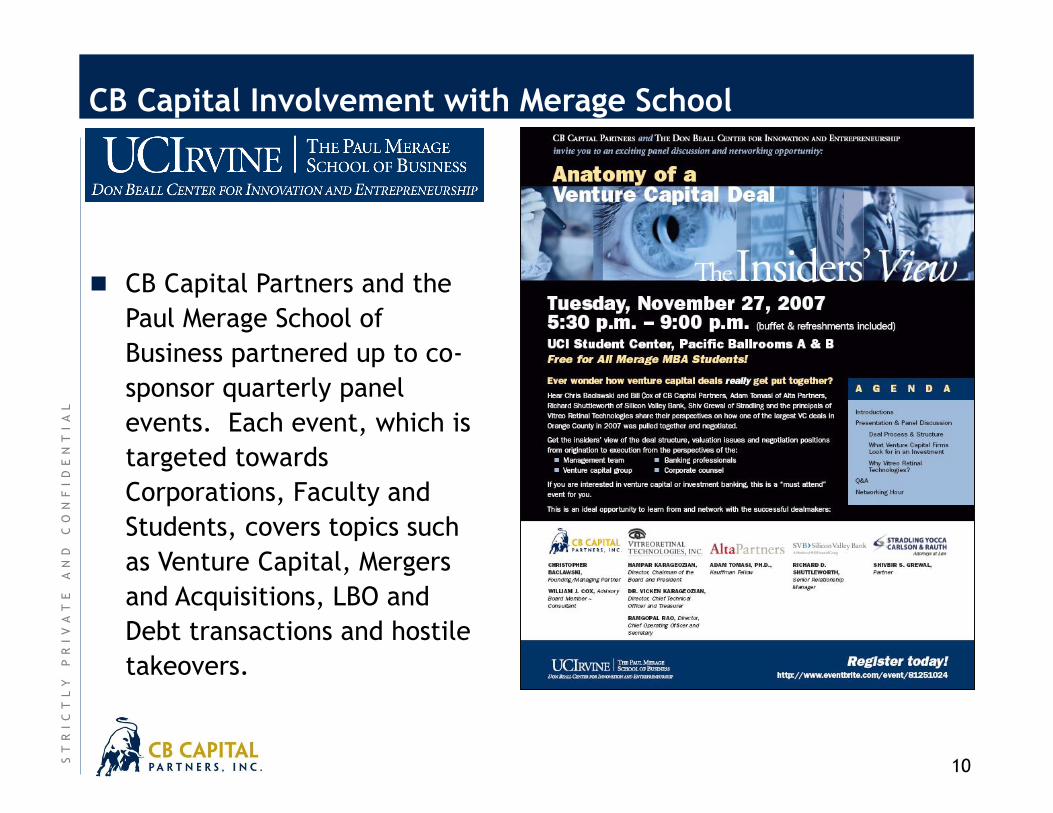
CB Capital Involvement with Merage School
CB Capital Partners and the
Paul Merage School of
Business partnered up to co-
sponsor quarterly panel
events. Each event, which is
targeted towards
Corporations, Faculty and
Students, covers topics such
as Venture Capital, Mergers
and Acquisitions, LBO and
Debt transactions and hostile
takeovers.

Table of Contents
Page
ST
RI
CT
LY
PR
IV
AT
EA
ND
CO
NF
ID
EN
TI
AL
11
Forecasts
Financial Overview
About CB Capital Partners 2
21
38
The Business Plan Process 12

12
ST
RI
CT
LY
PR
IV
AT
EA
ND
CO
NF
ID
EN
TI
AL
Lifecycle of a Company
Venture
Capital
Institutional
Private
Equity
IPO
Secondary
Private Debt
Convertibles
Mergers &
Acquisitions
Product/Concept
Development
Senior
Management
Team
Industry
Market
Opportunity
Competition
Execution
Proven Concept
Sustainable
Competitive
Advantage
Achievable
Distribution
Market Size vs.
Market Niche
Infrastructure
Financing
Continued
Growth
Opportunities
Predictability
Backlog
Valuation
Credit Quality
Cash Flow
Stability
Synergies
Control
Complementary
Management
Consolidating
Industry
Valuation
Company Attributes
Our
Focus
Here

13
ST
RI
CT
LY
PR
IV
AT
EA
ND
CO
NF
ID
EN
TI
AL
The Business Plan
When raising venture capital, thorough planning in the form of a professional
Business Plan will help you obtain sufficient funds to achieve your milestones
at an acceptable valuation, from value-added investors and with minimal
disruption to your company. Today I will offer you some guidelines and
describe the valuation process in detail.

14
ST
RI
CT
LY
PR
IV
AT
EA
ND
CO
NF
ID
EN
TI
AL
The Business Plan
Smart entrepreneurs need to do a lot of homework and planning before
seeking funds from venture capitalists eager to invest in start-up companies.
You can increase your chances of raising capital for the start-up through good
planning and an understanding of how potential investors treat valuation.

15
ST
RI
CT
LY
PR
IV
AT
EA
ND
CO
NF
ID
EN
TI
AL
The Investors
Venture capital firms have money to invest (over $10 billion during the past
four years), and many are interested in technology start-ups because returns
on medical investments have been good.
Targeted Venture Investors focus on specific industries with individual
strategic objectives.
Know your audience.

16
ST
RI
CT
LY
PR
IV
AT
EA
ND
CO
NF
ID
EN
TI
AL
1. To set a direction for the Company.
2. To capture the interest of potential venture capital investors.
3. To project confidence to potential investor and project value.
Business Plan Objectives

17
ST
RI
CT
LY
PR
IV
AT
EA
ND
CO
NF
ID
EN
TI
AL
Business Plan
Good business plans are usually between 20 and 50 pages in length, with
optional supporting data (articles, glossary of terms, endorsement letters)
placed in an appendix or addendum.

18
ST
RI
CT
LY
PR
IV
AT
EA
ND
CO
NF
ID
EN
TI
AL
Fund Raising essentials
Before beginning a search for venture capital, most start-ups will write a
Business Plan describing what they plan to do and how they plan to do it. The
following is a summary of what should be included in each section of the
plan:

19
ST
RI
CT
LY
PR
IV
AT
EA
ND
CO
NF
ID
EN
TI
AL
Business Plan Outline
Executive summary/Company strategy;
Technology/products
Technology description, Development plan, Proprietary protection
Markets/marketing:
Markets, Selling and distribution, Competition, Forecasts
Industrial/Regulatory
Manufacturing and operations:
Facilities, Equipment, Process, Cost of goods sold;
Management team
Financials
Profit and loss, Balance sheet, Cash flow (sources and uses);
Risks
Appendices
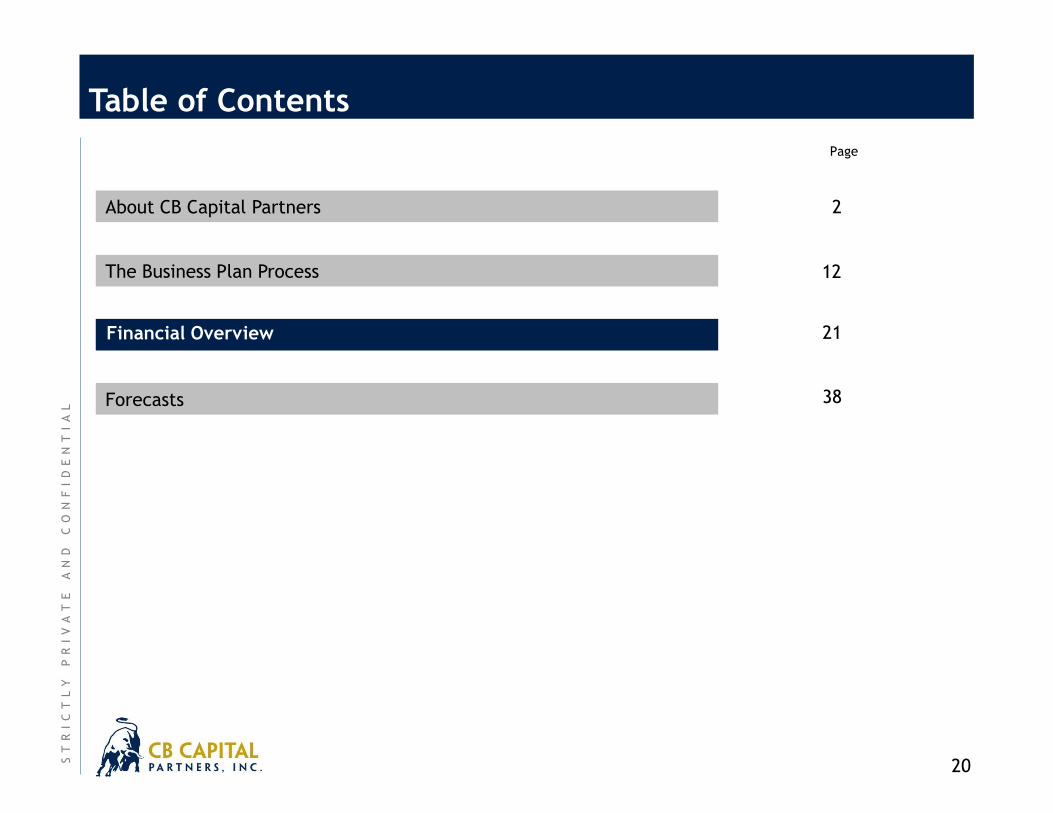
Table of Contents
Page
ST
RI
CT
LY
PR
IV
AT
EA
ND
CO
NF
ID
EN
TI
AL
20
Forecasts
Financial Overview
About CB Capital Partners 2
21
38
The Business Plan Process 12

21
ST
RI
CT
LY
PR
IV
AT
EA
ND
CO
NF
ID
EN
TI
AL
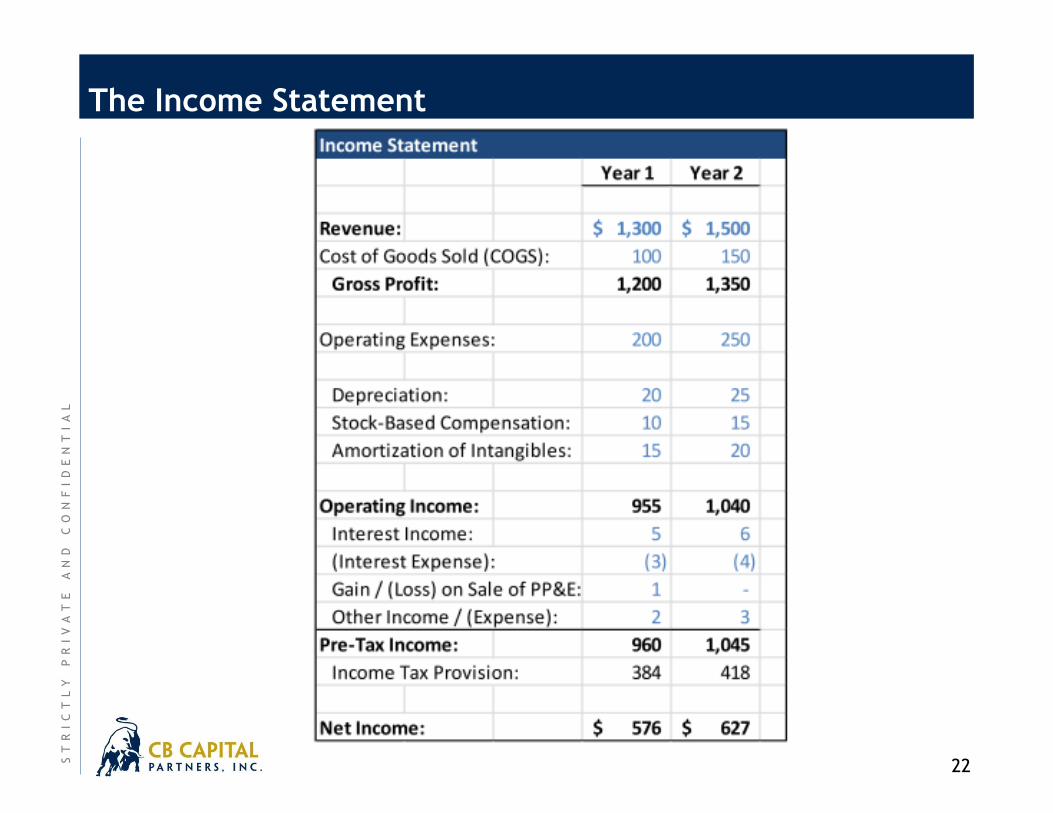
The Income Statement
The Income Statement lists a company’s revenue, expenses, and taxes, with
its after-tax profit at the very bottom, over a period of time (one quarter,
one month, or one year).
To appear on the Income Statement, each item must meet the following
criteria:
It must correspond to the period shown on the Income Statement only – if
you’re paying for an asset that will last for 10-20 years, it would not appear
on a 1-year Income Statement.
It must affect the company’s taxes. For example, interest paid on debt is
tax-deductible so it appears on the Income Statement… but repaying debt
principal is not tax-deductible, so it does not appear on the Income
Statement.
22
ST
RI
CT
LY
PR
IV
AT
EA
ND
CO
NF
ID
EN
TI
AL
The Income Statement

23
ST
RI
CT
LY
PR
IV
AT
EA
ND
CO
NF
ID
EN
TI
AL
The Income Statement
The 4 main sections to be aware of:
Revenue and Cost of Goods Sold (COGS): Revenue is the value of the
products/services that a company sells in the period (Year 1 or Year 2), and
COGS represents the expenses that are linked directly to the sale of those
products/services.
Operating Expenses: Items that are not directly linked to product sales –
employee salaries, rent, marketing, research and development, as well as
non-cash expenses like Depreciation and Amortization.
Other Income and Expenses: This goes between Operating Income and Pre-
Tax Income. Interest shows up here, as well as items such as Gains and
Losses when Assets are sold, Impairment Charges, Write-Downs, and
anything else that is not part of the company’s core business operations.
Taxes and Net Income: Net Income represents the company’s “bottom line”
– how much in after-tax profits it has earned. Net Income = Revenue –
Expenses – Taxes.

24
ST
RI
CT
LY
PR
IV
AT
EA
ND
CO
NF
ID
EN
TI
AL
The Income Statement
A few points on Income Statement revenue, expenses, and taxes:
They do not need to be related to a company’s operational activities –
Gains and Losses on asset sales, Depreciation, and Interest Expense still
appear on the IS but are not related to everyday business.
They do not need to be cash expenses (or cash revenue) – for example,
Depreciation and Amortization are both non-cash expenses. Also, companies
often record revenue and expenses here before they receive or pay them in
cash.
Sometimes, items may be embedded in other items – for example,
sometimes Depreciation is included in COGS or Operating Expenses; other
times it is a separate item.

25
ST
RI
CT
LY
PR
IV
AT
EA
ND
CO
NF
ID
EN
TI
AL
The Income Statement
Here are more rules of thumb about what appears on the Income Statement:
Always Appears: Revenue, COGS, Operating Expenses, Depreciation,
Amortization, Stock-Based Compensation, Interest, Gains / (Losses), Write-
Downs, Other Income / (Expenses)
Never Appears: Capital Expenditures, Purchasing or Selling Investments and
PP&E (Plants, Property & Equipment), Dividends, Issuing or Repaying Debt
Principal, Issuing or Repurchasing Shares, Changes to Balance Sheet Items
such as Cash, Debt, Accounts Receivable, Accounts Payable, and so on
=> The “Always Appears” do affect the company’s taxes (e.g. paying an
employee’s salary reduces the company’s taxable income); and They
correspond to the period shown on the Income Statement (e.g. revenue in
Year 1 refers to all sales to customers in Year 1… not Year 2). The opposite is
true for “Never Appears”

26
ST
RI
CT
LY
PR
IV
AT
EA
ND
CO
NF
ID
EN
TI
AL
The Balance Sheet
The Balance Sheet shows the company’s resources – its Assets – and how it
acquired those resources – its Liabilities & Equity – at a specific point in time.
27
ST
RI
CT
LY
PR
IV
AT
EA
ND
CO
NF
ID
EN
TI
AL
The Balance Sheet
Here are the key Balance Sheet rules:
Assets must always equal Liabilities + Equity – no exceptions.
An Asset is an item that will result in, directly or indirectly, additional cash
in the future.
A Liability is an item that will result in, directly or indirectly, less cash in
the future. Most Liabilities are related to external parties – payments owed
to suppliers, or borrowed money, for example. Liabilities are used to fund a
business.
Equity line items are similar to Liabilities (used to fund a business), but
they refer to the company’s own internal operations rather than external
parties.
28
ST
RI
CT
LY
PR
IV
AT
EA
ND
CO
NF
ID
EN
TI
AL
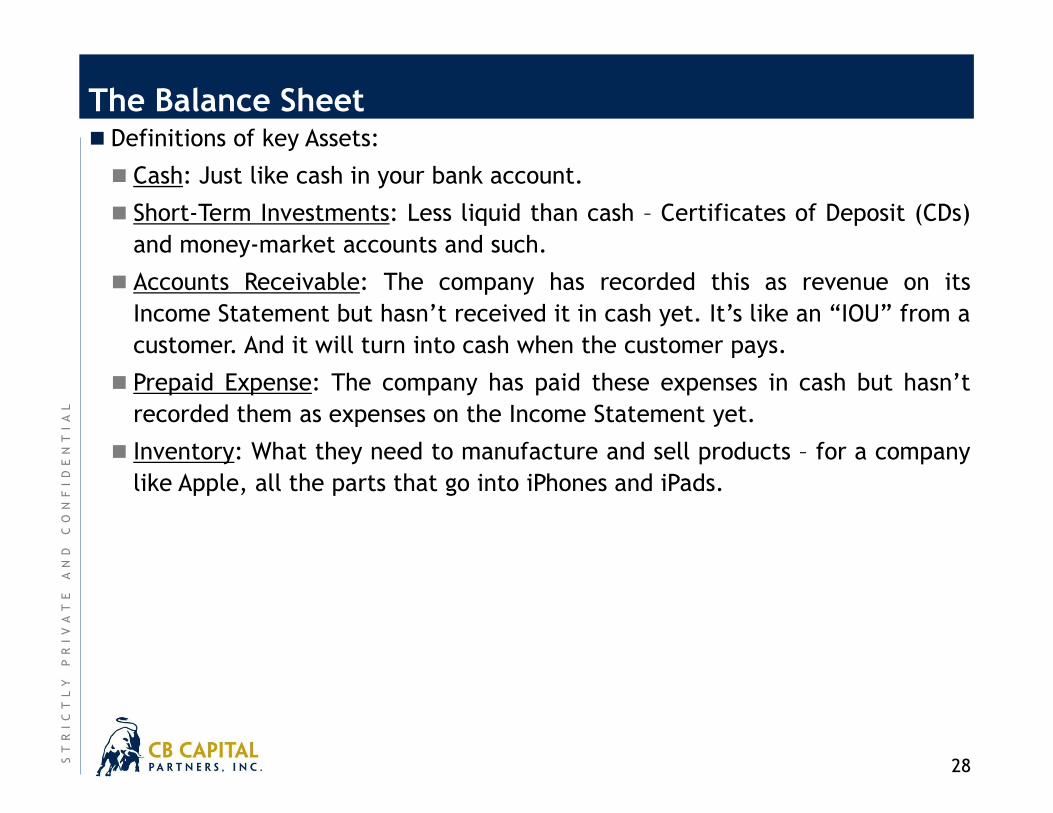
The Balance Sheet Definitions of key Assets:
Cash: Just like cash in your bank account.
Short-Term Investments: Less liquid than cash – Certificates of Deposit (CDs)
and money-market accounts and such.
Accounts Receivable: The company has recorded this as revenue on its
Income Statement but hasn’t received it in cash yet. It’s like an “IOU” from a
customer. And it will turn into cash when the customer pays.
Prepaid Expense: The company has paid these expenses in cash but hasn’t
recorded them as expenses on the Income Statement yet.
Inventory: What they need to manufacture and sell products – for a company
like Apple, all the parts that go into iPhones and iPads.
29
ST
RI
CT
LY
PR
IV
AT
EA
ND
CO
NF
ID
EN
TI
AL
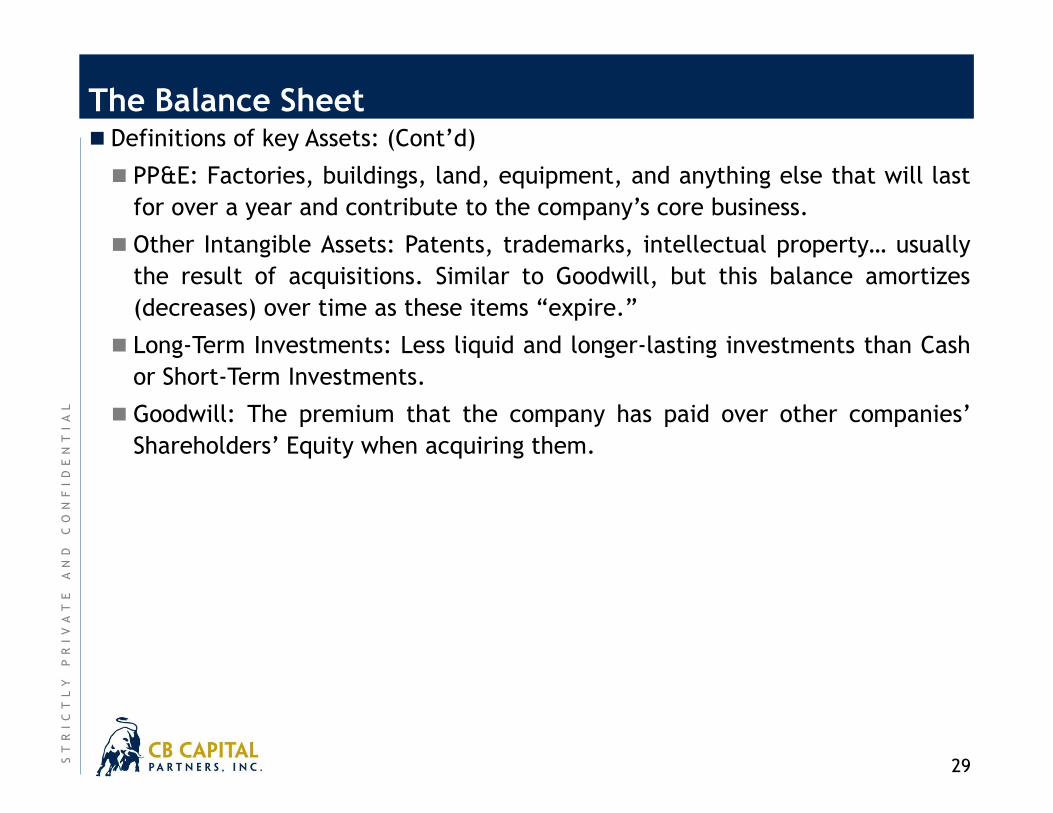
The Balance Sheet Definitions of key Assets: (Cont’d)
PP&E: Factories, buildings, land, equipment, and anything else that will last
for over a year and contribute to the company’s core business.
Other Intangible Assets: Patents, trademarks, intellectual property… usually
the result of acquisitions. Similar to Goodwill, but this balance amortizes
(decreases) over time as these items “expire.”
Long-Term Investments: Less liquid and longer-lasting investments than Cash
or Short-Term Investments.
Goodwill: The premium that the company has paid over other companies’
Shareholders’ Equity when acquiring them.

30
ST
RI
CT
LY
PR
IV
AT
EA
ND
CO
NF
ID
EN
TI
AL
The Balance Sheet Definitions of key Liabilities:
Revolver: Similar to a “credit card” for a company; it borrows money as
needed and must repay it quickly.
Accounts Payable: The company has recorded these as expenses on the
Income Statement, but hasn’t yet paid them out in cash yet – used for one-
time items with specific invoices, such as payment for legal services.
Accrued Expenses: The company has recorded these as expenses on the
Income Statement, but hasn’t yet paid them out in cash yet – used for
recurring monthly items without invoices, such as employee wages,
utilities, and rent.
Deferred Revenue: The company has collected cash in advance from
customers for products/services yet to be delivered, and it will recognize
this as real revenue over time.
Deferred Tax Liability: The company has paid lower taxes than what it
really owes, and needs to make it up by paying additional taxes to the
government in the future.
Long-Term Debt: Similar to a mortgage or a car loan: debt that is due and
must be repaid in over a year’s time.

31
ST
RI
CT
LY
PR
IV
AT
EA
ND
CO
NF
ID
EN
TI
AL
The Balance Sheet Definitions of Equity line items:
Common Stock & Additional Paid-In Capital (APIC): This represents the
market value of shares at the time those shares were issued by the
company. When a company goes public, the total dollar value of shares
issued shows up here. This does not change even if the share price changes
afterward.
Treasury Stock: This represents the cumulative value of shares the company
has repurchased from investors. This does not change even if the share
price changes afterward.
Retained Earnings: This represents the company’s saved up, after-tax
profits (minus any dividends it has issued). This is like the $200K you saved
up, after-taxes, in our “personal Balance Sheet” example above.
Accumulated Other Comprehensive Income (AOCI): This is a section for
“miscellaneous saved-up income” – you see items like the effect of foreign
currency exchange rate changes here, as well as unrealized gains and losses
on certain types of securities (i.e. if their values go up or down but the
company has not yet sold them).

32
ST
RI
CT
LY
PR
IV
AT
EA
ND
CO
NF
ID
EN
TI
AL
The Cash Flow Statement Similar to the Income Statement, the Cash Flow Statement tracks changes
over a period of time (one month, one quarter, or one year). It exists for 2
reasons:
You may have shown non-cash revenue or expenses on the Income
Statement. These need to be adjusted on the Cash Flow Statement to
determine how your cash balance actually changes.
There may be additional cash inflows and outflows that have not appeared
on the Income Statement. For example, Capital Expenditures and Dividends
are both real cash expenses. You need to factor these in to figure out how
your cash balance really changes by.
33
ST
RI
CT
LY
PR
IV
AT
EA
ND
CO
NF
ID
EN
TI
AL
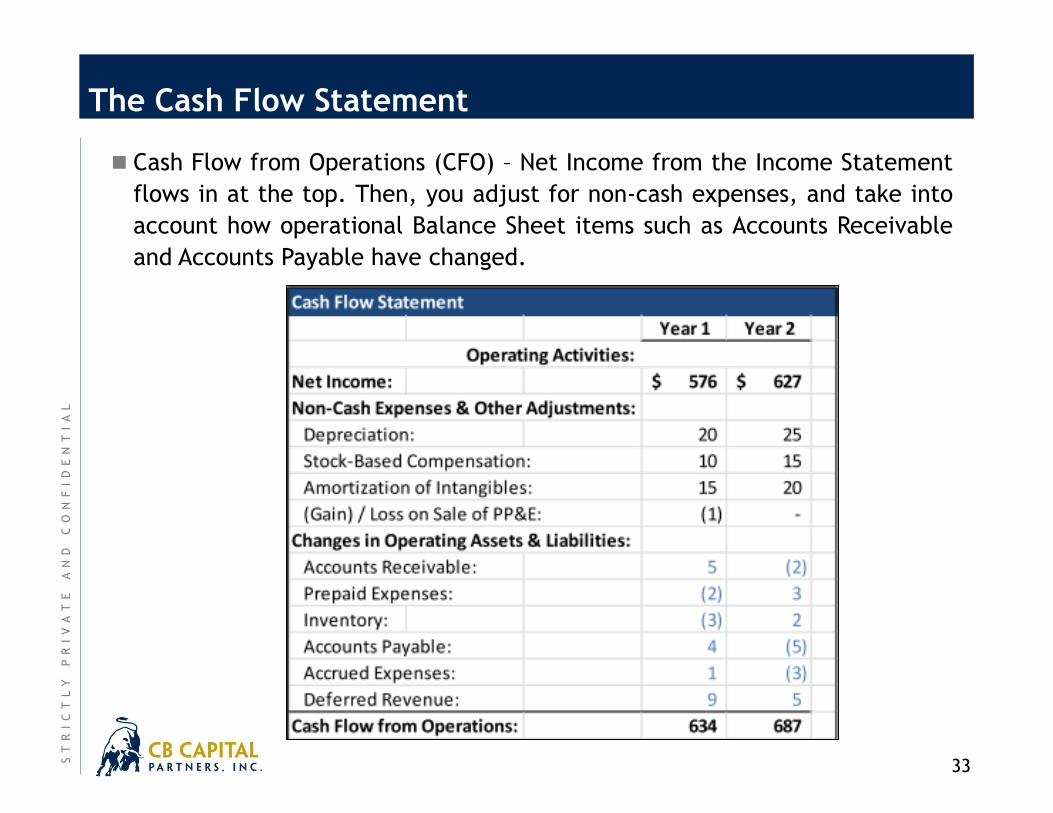
The Cash Flow Statement
Cash Flow from Operations (CFO) – Net Income from the Income Statement
flows in at the top. Then, you adjust for non-cash expenses, and take into
account how operational Balance Sheet items such as Accounts Receivable
and Accounts Payable have changed.

34
ST
RI
CT
LY
PR
IV
AT
EA
ND
CO
NF
ID
EN
TI
AL
The Cash Flow Statement
Cash Flow from Investing (CFI) – Anything related to the company’s
investments, acquisitions, and PP&E shows up here. Purchases are negative
because they use up cash, and sales are positive because they result in
more cash.

35
ST
RI
CT
LY
PR
IV
AT
EA
ND
CO
NF
ID
EN
TI
AL
The Cash Flow Statement
Cash Flow from Financing (CFF) – Items related to debt, dividends, and
issuing or repurchasing shares show up here.

36
ST
RI
CT
LY
PR
IV
AT
EA
ND
CO
NF
ID
EN
TI
AL
How To Link The Three Statements First, Net Income from the bottom of the Income Statement becomes the top
line of the Cash Flow Statement.
Second, you add back non-cash expenses from the Income Statement (and flip
the signs of items such as Gains and Losses).
Third, you reflect changes in operational Balance Sheet line items – if an
Asset goes up, cash flow goes down and vice versa; if a Liability goes up, cash
flow goes up and vice versa.
Fourth, you reflect Purchases and Sales of Investments and PP&E in Cash Flow
from Investing.
Fifth, you reflect Dividends, Debt issued or repurchased, and Shares issued or
repurchased in Cash Flow from Financing.
Sixth, you calculate the net change in cash at the bottom of the CFS, and
then link this into cash at the top of the next period’s Balance Sheet.
Seventh, you update the Balance Sheet to reflect changes in Cash, Debt,
Equity, Investments, PP&E, and anything else that came from the Cash Flow
Statement.

Table of Contents
Page
ST
RI
CT
LY
PR
IV
AT
EA
ND
CO
NF
ID
EN
TI
AL
37
Forecasts
Financial Overview
About CB Capital Partners 2
21
38
The Business Plan Process 12

38
ST
RI
CT
LY
PR
IV
AT
EA
ND
CO
NF
ID
EN
TI
AL
Financial Model Example
XYZ Corp Confidential - Not for Distribution
Series A Model
Table of Contents
Section 1 - Summary Page
1. Summary Income Statement 2
2. Summary Balance Sheet 3
3. Summary Cash Flow Statement 4
4. Headcount and Personnel Expenses 5
Section 2 - Assumptions
5. Revenue Assumptions 6
6. Policies 7
7. Operating Expenses 9
3/8/2017
39
ST
RI
CT
LY
PR
IV
AT
EA
ND
CO
NF
ID
EN
TI
AL
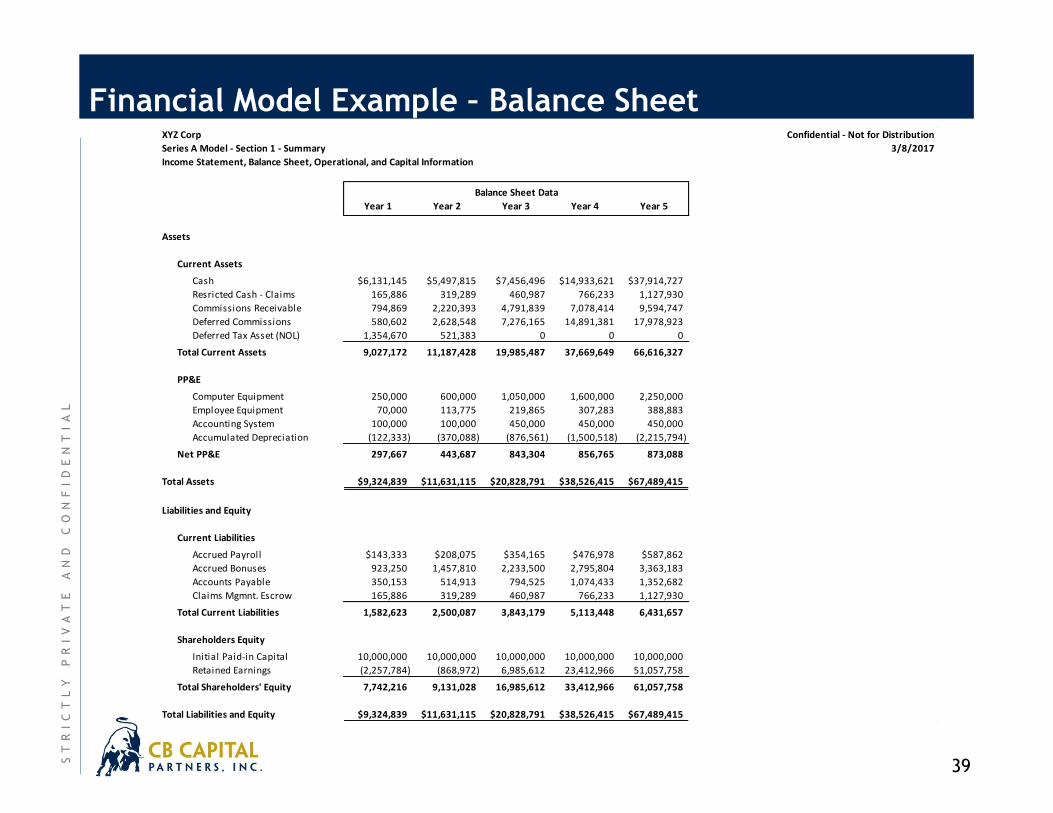
Financial Model Example – Balance Sheet XYZ Corp Confidential - Not for Distribution
Series A Model - Section 1 - Summary
Income Statement, Balance Sheet, Operational, and Capital Information
Balance Sheet Data
Year 1 Year 2 Year 3 Year 4 Year 5
Assets
Current Assets
Cash $6,131,145 $5,497,815 $7,456,496 $14,933,621 $37,914,727
Resricted Cash - Claims 165,886 319,289 460,987 766,233 1,127,930
Commissions Receivable 794,869 2,220,393 4,791,839 7,078,414 9,594,747
Deferred Commissions 580,602 2,628,548 7,276,165 14,891,381 17,978,923
Deferred Tax Asset (NOL) 1,354,670 521,383 0 0 0
Total Current Assets 9,027,172 11,187,428 19,985,487 37,669,649 66,616,327
PP&E
Computer Equipment 250,000 600,000 1,050,000 1,600,000 2,250,000
Employee Equipment 70,000 113,775 219,865 307,283 388,883
Accounting System 100,000 100,000 450,000 450,000 450,000
Accumulated Depreciation (122,333) (370,088) (876,561) (1,500,518) (2,215,794)
Net PP&E 297,667 443,687 843,304 856,765 873,088
Total Assets $9,324,839 $11,631,115 $20,828,791 $38,526,415 $67,489,415
Liabilities and Equity
Current Liabilities
Accrued Payroll $143,333 $208,075 $354,165 $476,978 $587,862
Accrued Bonuses 923,250 1,457,810 2,233,500 2,795,804 3,363,183
Accounts Payable 350,153 514,913 794,525 1,074,433 1,352,682
Claims Mgmnt. Escrow 165,886 319,289 460,987 766,233 1,127,930
Total Current Liabilities 1,582,623 2,500,087 3,843,179 5,113,448 6,431,657
Shareholders Equity
Initial Paid-in Capital 10,000,000 10,000,000 10,000,000 10,000,000 10,000,000
Retained Earnings (2,257,784) (868,972) 6,985,612 23,412,966 51,057,758
Total Shareholders' Equity 7,742,216 9,131,028 16,985,612 33,412,966 61,057,758
Total Liabilities and Equity $9,324,839 $11,631,115 $20,828,791 $38,526,415 $67,489,415
3/8/2017

40
ST
RI
CT
LY
PR
IV
AT
EA
ND
CO
NF
ID
EN
TI
AL
Financial Model Example - Income Statement XYZ Corp Confidential - Not for Distribution
Series A Model - Section 1 - Summary
Income Statement, Balance Sheet, Operational, and Capital Information
Income Statement Data % of Revenue
Year 1 Year 2 Year 3 Year 4 Year 5 Year 1 Year 2 Year 3 Year 4 Year 5
Revenue
Commissions - C&D $0 $439,701 $1,985,006 $4,573,195 $8,254,280 0.0% 3.1% 6.0% 8.4% 10.3%
Commissions - CRE 1,675,885 5,879,426 13,271,185 20,383,383 27,592,878 42.3% 41.5% 40.1% 37.5% 34.6%
Commissions - C&I 2,284,647 7,650,791 16,447,195 23,998,385 30,776,672 57.7% 54.0% 49.7% 44.1% 38.6%
Risk / Profit Sharing 0 188,430 1,413,082 5,468,043 13,155,842 0.0% 1.3% 4.3% 10.0% 16.5%
Total Revenue 3,960,532 14,158,348 33,116,468 54,423,007 79,779,672 100.0% 100.0% 100.0% 100.0% 100.0%
Operating Costs
Underwriting Expenses 1,342,870 2,512,193 5,495,092 8,834,150 11,988,101 33.9% 17.7% 16.6% 16.2% 15.0%
Claims Expenses 165,886 585,127 1,327,891 2,175,776 2,961,059 4.2% 4.1% 4.0% 4.0% 3.7%
Marketing Expenses 1,299,750 1,949,751 2,623,442 3,285,673 4,184,042 32.8% 13.8% 7.9% 6.0% 5.2%
Distribution Expenses 1,046,867 2,218,679 4,273,598 5,522,159 6,851,431 26.4% 15.7% 12.9% 10.1% 8.6%
Finance & Risk Mgmt Expenses 1,260,125 1,349,519 1,635,281 1,686,175 1,738,741 31.8% 9.5% 4.9% 3.1% 2.2%
MIS Expenses 342,600 398,996 581,001 771,621 971,281 8.7% 2.8% 1.8% 1.4% 1.2%
Legal Expenses 300,000 547,973 812,415 829,426 846,997 7.6% 3.9% 2.5% 1.5% 1.1%
HR Expenses 419,400 220,566 588,632 643,597 657,186 10.6% 1.6% 1.8% 1.2% 0.8%
Director and Executive Expenses 1,143,800 1,251,563 1,259,508 1,267,641 1,275,968 28.9% 8.8% 3.8% 2.3% 1.6%
Overhead Expenses 243,816 724,750 1,518,494 2,632,690 3,743,390 6.2% 5.1% 4.6% 4.8% 4.7%
Total Operating Costs 7,565,114 11,759,116 20,115,354 27,648,909 35,218,197 191.0% 83.1% 60.7% 50.8% 44.1%
EBITDA (3,604,581) 2,399,232 13,001,114 26,774,097 44,561,475 NA 16.9% 39.3% 49.2% 55.9%
Depreciation Expense 122,333 247,755 506,473 623,957 715,277 3.1% 1.7% 1.5% 1.1% 0.9%
Operating Income (3,726,915) 2,151,477 12,494,641 26,150,141 43,846,199 NA 15.2% 37.7% 48.0% 55.0%
Other Income (Expenses)
Interest Income (Expenses) 114,461 70,622 72,693 133,626 385,468 2.9% 0.5% 0.2% 0.2% 0.5%
Pre-Tax Income (3,612,454) 2,222,099 12,567,335 26,283,767 44,231,667 NA 15.7% 37.9% 48.3% 55.4%
Income Taxes (1,354,670) 833,287 4,712,750 9,856,413 16,586,875 NA 5.9% 14.2% 18.1% 20.8%
Net Income ($2,257,784) $1,388,812 $7,854,584 $16,427,354 $27,644,792 NA 9.8% 23.7% 30.2% 34.7%
3/8/2017

41
ST
RI
CT
LY
PR
IV
AT
EA
ND
CO
NF
ID
EN
TI
AL
Financial Model Example – Cash Flow
XYZ Corp Confidential - Not for Distribution
Series A Model - Section 1 - Summary
Income Statement, Balance Sheet, Operational, and Capital Information
Cash Flow Data
Year 1 Year 2 Year 3 Year 4 Year 5
Net Income ($2,257,784) $1,388,812 $7,854,584 $16,427,354 $27,644,792
Operating Activities
Depreciation 122,333 247,755 506,473 623,957 715,277
Decrease (Increase) in Res. Cash (165,886) (153,403) (141,698) (305,246) (361,697)
Decrease (Increase) in C/R (794,869) (1,425,524) (2,571,446) (2,286,574) (2,516,333)
Decrease (Increase) in Def. Com. (580,602) (2,047,946) (4,647,617) (7,615,217) (3,087,542)
Decrease (Increase) in NOL (1,354,670) 833,287 521,383 0 0
Increase (Decrease) in C/L 1,582,623 917,464 1,343,092 1,270,270 1,318,209
Cash Flow from Operations (1,191,072) (1,628,366) (4,989,813) (8,312,811) (3,932,087)
Financing Activities
Financing Activities 0 0 0 0 0
Cash Flow from Financing 0 0 0 0 0
Investing Activities
Capital Expenditures (420,000) (393,775) (906,090) (637,418) (731,599)
Cash Flow from Investing (420,000) (393,775) (906,090) (637,418) (731,599)
Change in Cash ($3,868,855) ($633,330) $1,958,681 $7,477,125 $22,981,105
3/8/2017

42
ST
RI
CT
LY
PR
IV
AT
EA
ND
CO
NF
ID
EN
TI
AL
Financial Model Example – Supplemental Information
XYZ Corp Confidential - Not for Distribution
Series A Model - Section 1 - Summary
Income Statement, Balance Sheet, Operational, and Capital Information
Income Statement Data
Year 1 Year 2 Year 3 Year 4 Year 5
Operating Information ($ in millions)
Year End Policies (New) 600 1,625 3,067 4,249 5,119
Year End Policies (Renewal) 0 480 1,684 3,494 5,362
Total 600 2,105 4,751 7,743 10,482
Personal Guarantee Liability $1,200 $4,210 $9,502 $15,486 $20,963
Premium Revenue $16.6 $58.5 $132.8 $217.6 $296.1
Average Premium Rate 1.38% 1.39% 1.40% 1.41% 1.41%
Revenue - Bank Channel $329,742 $1,491,888 $3,666,514 $6,470,292 $9,999,813
Revenue - Direct Marketing $3,630,791 $12,478,030 $28,036,872 $42,484,671 $56,624,018
Revenue - General Marketing $0 $0 $0 $0 $0
Personnel Information (Excludes Sales Personnel Hired Immediately Prior to Year End)
Total Employees 28 45 85 117 146
Additional Profit Share Information (Final Payments Four Years After Year of Operations)
Estimated Future Payments $2,216,495 $9,889,493 $26,433,200 $50,554,120 $77,839,435
Cash Requirement $10,000,000
3/8/2017