Embed Size (px)
Citation preview


TABLE OF CONTENTS
Acronyms and AbbreviationsNavigation Guideline
Foreword
Executive Summary
Section I
Introduction
Section II
Program-Wide Update
Section III
GLICs’ Update
Section IV
GLCs’ Update
Section V
Conclusions
Section VI
Appendices
Page 1
Page 5
Page 11
Page 15
Page 33
Page 37
Glossary of Terms and Definitions
Headline KPIs Announced by G-15 ..
..
..
..
..
..
..
..
..
..
..
..
..
..
..
..
..
..
..
..
..
..
..
..
..
..
..
.
ACRONYMS AND ABBREVIATIONSBoard of DirectorsChief Executive OfficerEarnings Before Interest and TaxationEarnings Before Interest, Taxation, Depreciation and AmortisationEmployees Provident FundEarnings Per ShareEconomic Value AddedGovernment-Linked CompanyGovernment-Linked Investment CompanyJoint Working TeamKhazanah Nasional BerhadKuala Lumpur Composite IndexKey Performance IndicatorKumpulan Wang Amanah PencenLembaga Tabung Angkatan TenteraLembaga Tabung HajiMinority InterestMenteri Kewangan Diperbadankan (Ministry of Finance Incorporated)Ministry of FinanceNet Operating Profit Less Adjusted TaxesNon-Performing FinancingNon-Performing LoanPutrajaya Committee on GLC High PerformancePermodalan Nasional BerhadTransformation Management OfficeTotal Shareholders’ Return Return on Invested CapitalRisk Weighted Capital RatioWeighted Average Cost of Capital
EVA is a registered trademark of Stern Stewart & Co.
BOD
CEO
EBIT
EBITDA
EPF
EPS
EVA
GLC
GLIC
JWT
Khazanah
KLCI
KPI
KWAP
LTAT
LTH
MI
MKD
MOF
NOPLAT
NPF
NPL
PCG
PNB
TMO
TSR
ROIC
RWCR
WACC
..
..
..
..
..
..
..
..
..
..
..
..
..
..
..
..
..
..
..
..
..
..
..
..
..
..
..
..
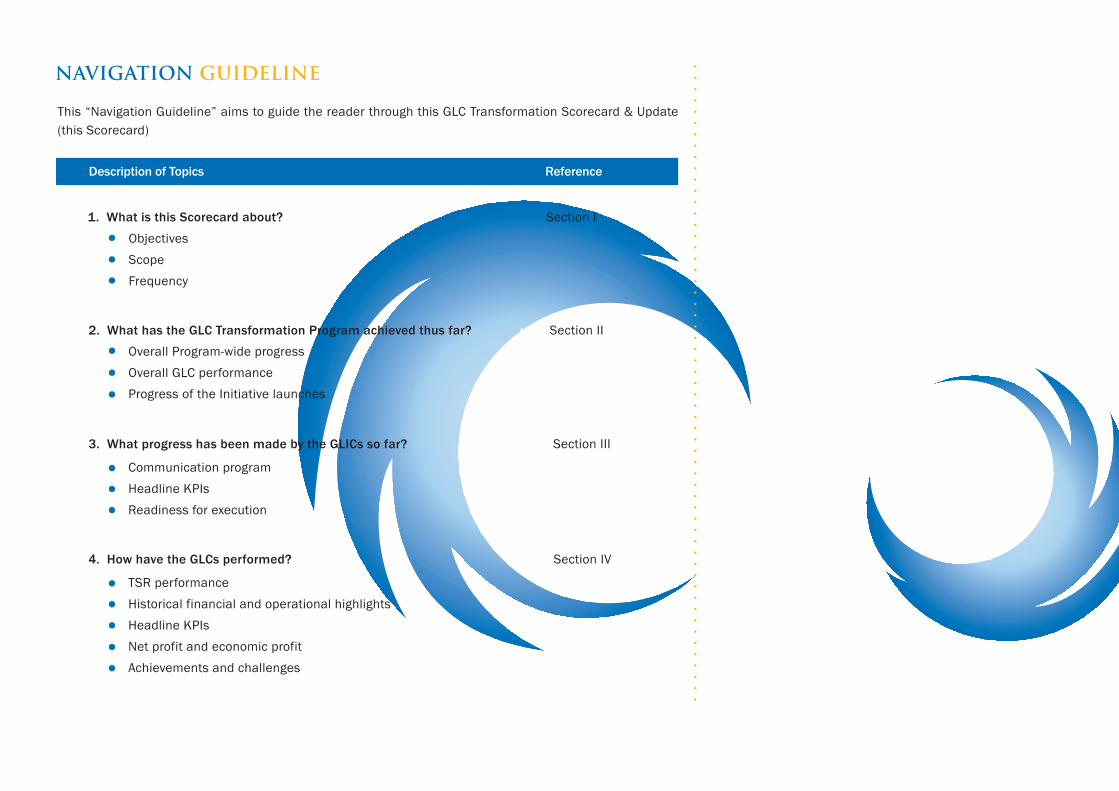
1. What is this Scorecard about?
This “Navigation Guideline” aims to guide the reader through this GLC Transformation Scorecard & Update (this Scorecard)
Objectives Scope Frequency
Section I
2. What has the GLC Transformation Program achieved thus far?
Overall Program-wide progress Overall GLC performance Progress of the Initiative launches
Section II
3. What progress has been made by the GLICs so far?
Communication programHeadline KPIsReadiness for execution
Section III
4. How have the GLCs performed?
TSR performance Historical financial and operational highlightsHeadline KPIsNet profit and economic profitAchievements and challenges
Section IV
Description of Topics Reference
NAVIGATION GUIDELINE
..
..
..
..
..
..
..
..
..
..
..
..
..
..
..
..
..
..
..
..
..
..
..
..
..
..
..
..
.


EXECUTIVE SUMMARY
EXECUTIVE SUMMARY
This Scorecard is published in line with Policy Thrust 5, Implementing the GLC Transformation Program of the Manual, to report on the status of the Program to key stakeholders. This is a half-yearly publication.
This first edition of this Scorecard focuses on 15 significantly large GLCs (G-15) held by the GLIC constituents of the PCG. However, in future editions, the other GLCs will also be covered.
The scope of this Scorecard covers reporting at three different levels - Program-wide, GLIC and GLC. Key highlights at each level are summarised below and in the next page:
At Program level
Overall, the Program is on schedule. Currently, the Program is in Phase 2: Generate Momentum, which is targeted to last until the end of 2006.
G-15’s outperformance against the KLCI dissipated towards the end of 2005 while the broader G-23* grouping maintained its outperformance against the KLCI.
The Transformation Manual was launched in July 2005.
Three GLC Transformation Initiatives (the Initiative) have been launched since July 2005. They include: - Initiative 9, Intensify Performance Management Practices (Blue Book), launched in July 2005; - Initiative 1, Enhancing Board Effectiveness (Green Book), to be launched on 26 April 2006; and - Initiative 6, Review and Revamp Procurement (Red Book), to be launched on 26 April 2006.
On 22 March 2006, the G-15 companies announced their Headline KPIs.
A program management approach to ensure proper implementation and monitoring of the Program at each GLC has been adopted. This effort is supported by the establishment of the TMO in August 2005.
*The G-23 refers to the 23 GLCs among the 100 KLCI constituent stocks..................................................................
At GLIC level
PCG’s role as a policy advisory committee also includes implementing the Program and monitoring its progress, providing guidance to GLICs and Boards of GLCs as well as updating the Policy Guidelines and Initiatives.
Roadshows on the Program to inform and engage GLC Boards and senior management were conducted throughout Q3 and Q4 of 2005.
G-15 is in various stages of establishing their TMOs to ensure traction and accountability. Almost all have appointed TMO Heads, most are developing their terms of reference, KPIs as well as processes for monitoring, escalating issues and reporting.
At GLC level
In this Scorecard, G-15 has provided progress update on the following: - TSR performance - Historical financial and operational highlights - Headline KPIs - Net profit and economic profit - Achievements and challenges
..................................................................

FOREWORD .................................................................
Nine months ago, on 29 July 2005, our YAB Prime Minister launched the GLC Transformation Manual (the Manual). The Manual is the roadmap in getting our GLCs to our final destination of High Performance.
The Manual also stated the target of ten years to 2015 for the nation to reap the full benefits of the GLC Transformation Program (the Program). By then, the GLCs should be performing at least on par with non-GLC peers and competitors in the Malaysian market while several GLCs would have cemented positions as regional champions.
We have witnessed significant progress in the Program since the launch. However, as experienced in other countries that have undergone similar large scale change programs, there are considerable challenges.
Thus, the purpose of this GLC Transformation Scorecard & Update (this Scorecard) is to report on the achievements as well as challenges faced by the various GLCs under this Program.
This Scorecard will also serve as a document to monitor progress and highlight key issues under the Program on a regular basis. We aim to publish a similar Scorecard every six months.
The Government is committed to see through the execution of this Program towards achieving our Nation’s longer term objective of Vision 2020.
TAN SRI NOR MOHAMED YAKCOPSECOND FINANCE MINISTER OF MALAYSIAPutrajaya26 April 2006
“This year until the beginning of 2007 would be a “year of implementation” after the successful financial restructuring and recruitment of staff among the GLCs … The enthusiasm at the top level should trickle down to everyone else in the company and every person should be involved in the transformation process”.


SECTION IINTRODUCTION
2
OBJECTIVES OF THIS SCORECARD
This Scorecard is published in line with Policy Thrust 5, Implementing the GLC Transformation Program, of the Manual to report the status of the Program to key stakeholders.
Specifically, this Scorecard aims to: Highlight progress achieved; and Identify challenges and possible areas of improvement.
SCOPE OF THIS SCORECARD
This Scorecard is intended to cover three levels of reporting:
1. Program level – this will report Program-wide developments that cut across the various GLICs and GLCs; for example, progress in launching the various Initiatives as described in the Manual;
2. GLIC level – this will report progress at the GLIC level in managing and executing the Program; and
3. GLC specific – this will drill down to specific achievements, challenges, economic and financial performances of particular GLCs.
This Scorecard shall be published every six months to report and track progress of the Program.
THIS SCORECARD IS A HALF-YEARLY REPORT CARD ON THE PROGRESSOF THE PROGRAM
..................................................................
“It is envisaged that the PCG will at periodic intervals as necessary, communicate progress of the GLC Transformation Program to shareholders and key stakeholders, including employee groups, suppliers, customers, and members of Parliament”
Policy Thrust 5, GLC Transformation Manual
3
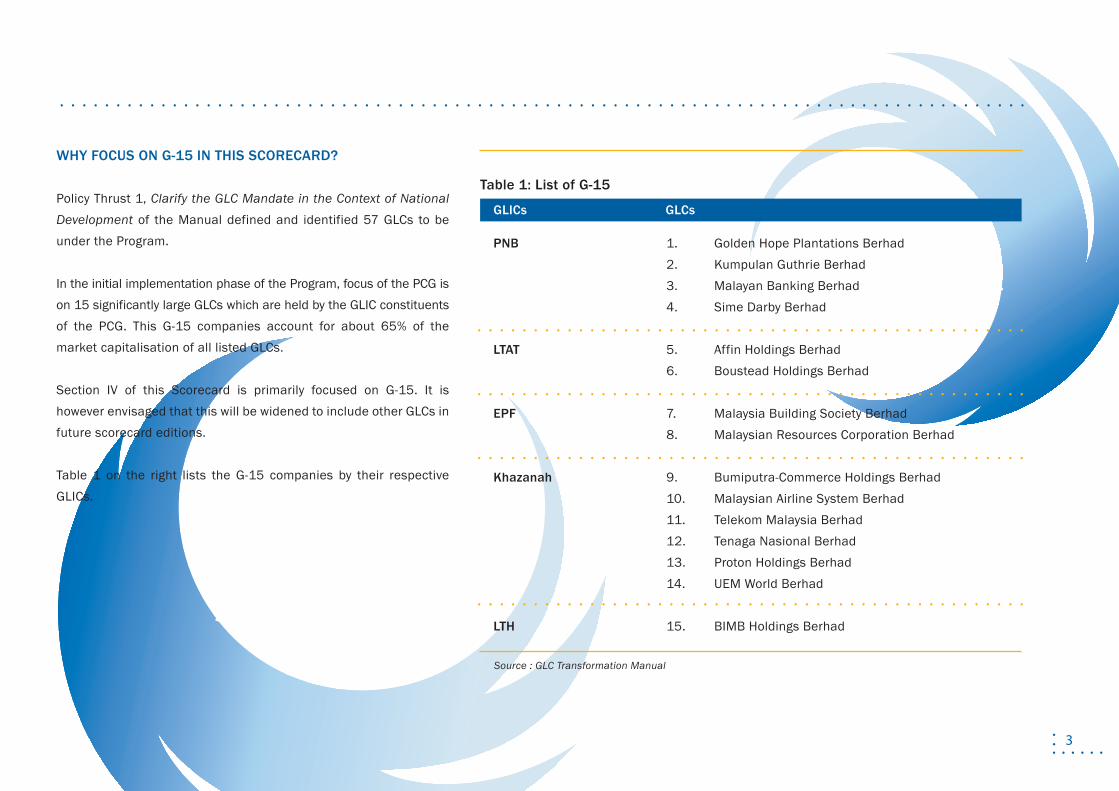
Table 1: List of G-15
PNB
LTAT
EPF
Khazanah
LTH
1. Golden Hope Plantations Berhad2. Kumpulan Guthrie Berhad3. Malayan Banking Berhad4. Sime Darby Berhad
5. Affin Holdings Berhad6. Boustead Holdings Berhad
7. Malaysia Building Society Berhad8. Malaysian Resources Corporation Berhad
9. Bumiputra-Commerce Holdings Berhad10. Malaysian Airline System Berhad11. Telekom Malaysia Berhad12. Tenaga Nasional Berhad13. Proton Holdings Berhad14. UEM World Berhad
15. BIMB Holdings Berhad
GLICs GLCs
.................................................
.................................................
Source : GLC Transformation Manual
WHY FOCUS ON G-15 IN THIS SCORECARD?
Policy Thrust 1, Clarify the GLC Mandate in the Context of National Development of the Manual defined and identified 57 GLCs to be under the Program.
In the initial implementation phase of the Program, focus of the PCG is on 15 significantly large GLCs which are held by the GLIC constituents of the PCG. This G-15 companies account for about 65% of the market capitalisation of all listed GLCs.
Section IV of this Scorecard is primarily focused on G-15. It is however envisaged that this will be widened to include other GLCs in future scorecard editions.
Table 1 on the right lists the G-15 companies by their respective GLICs.
.................................................
.................................................
......................................................................................


SECTION IIPROGRAM-WIDE UPDATE
6
Source: GLC Transformation Manual
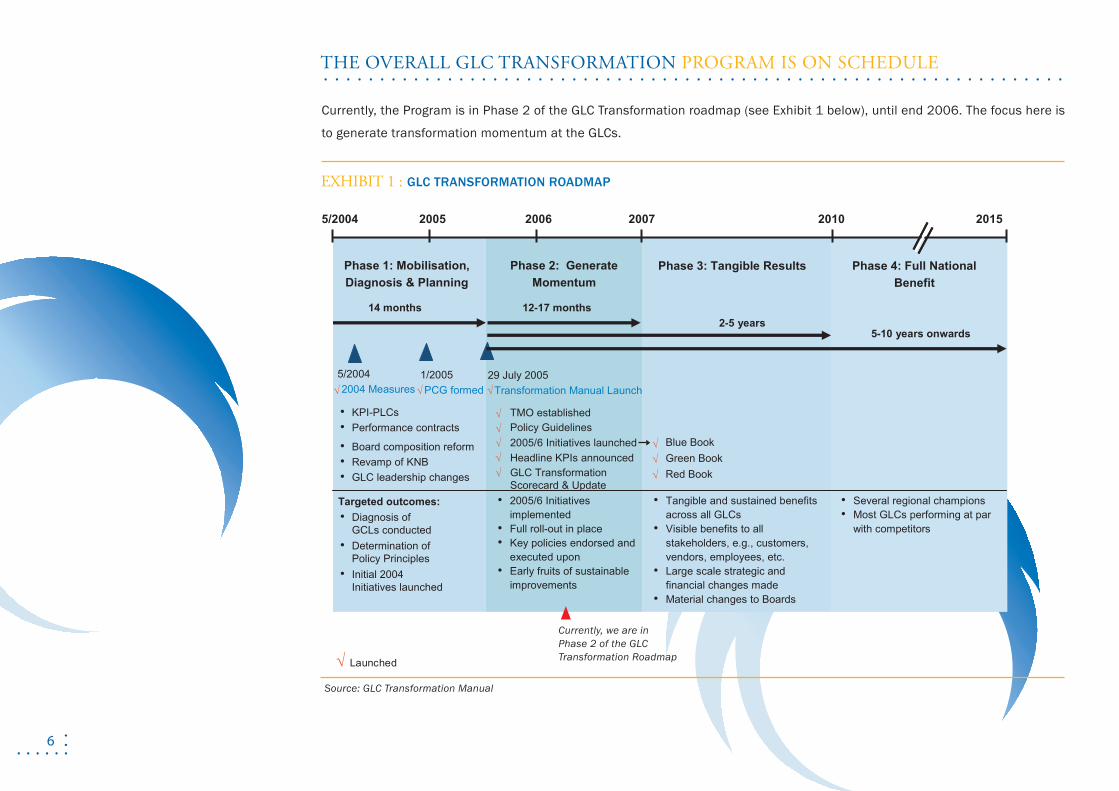
EXHIBIT 1 : GLC TRANSFORMATION ROADMAP
2005 2006 2007 2015
Phase 1: Mobilisation, Diagnosis & Planning
Phase 2: Generate Momentum
Phase 3: Tangible Results Phase 4: Full National Benefit
Targeted outcomes:
5/20042004 Measures
29 July 2005 Transformation Manual Launch
Policy Guidelines 2005/6 Initiatives launched Blue Book
Green BookRed BookGLC Transformation
Scorecard & Update
Headline KPIs announced
14 months 12-17 months2-5 years
5-10 years onwards
• 2005/6 Initiatives implemented
• Full roll-out in place• Key policies endorsed and
executed upon• Early fruits of sustainable
improvements
• Tangible and sustained benefits across all GLCs
• Visible benefits to all stakeholders, e.g., customers, vendors, employees, etc.
• Large scale strategic and financial changes made
• Material changes to Boards
• Several regional champions• Most GLCs performing at par
with competitors
• KPI-PLCs• Performance contracts
• Board composition reform• Revamp of KNB• GLC leadership changes
• Diagnosis of GCLs conducted
• Determination ofPolicy Principles
• Initial 2004Initiatives launched
2010
1/2005 PCG formed
5/2004
Currently, we are in Phase 2 of the GLC Transformation Roadmap
THE OVERALL GLC TRANSFORMATION PROGRAM IS ON SCHEDULE
..................................................................
√ Launched
√√
TMO established√
√√√
√√√
√√
Currently, the Program is in Phase 2 of the GLC Transformation roadmap (see Exhibit 1 below), until end 2006. The focus here is
to generate transformation momentum at the GLCs.
7
1. TSR Performance
The performance of G-15 since the start of the Program approximates the
rest of the KLCI (ex G-15), albeit slightly lower by 3.2% as at 14 April
2006 (see Exhibit 2).
Though G-15 outperformed the KLCI (ex G-15) in the initial months of May
2004 through May 2005, that performance dissipated towards the end of
2005.
The performance of the broader G-23 meanwhile remained strong,
maintaining its outperformance which began in early 2005, against the
KLCI.
Overall, the TSR performance of the GLCs remained mixed.
2. Economic Profit
The same trend was also observed from the analysis of Economic Profit
between 2004 and 2005, whereby four of the G-15 companies showed year-on-
year improvements (see Exhibit 3).
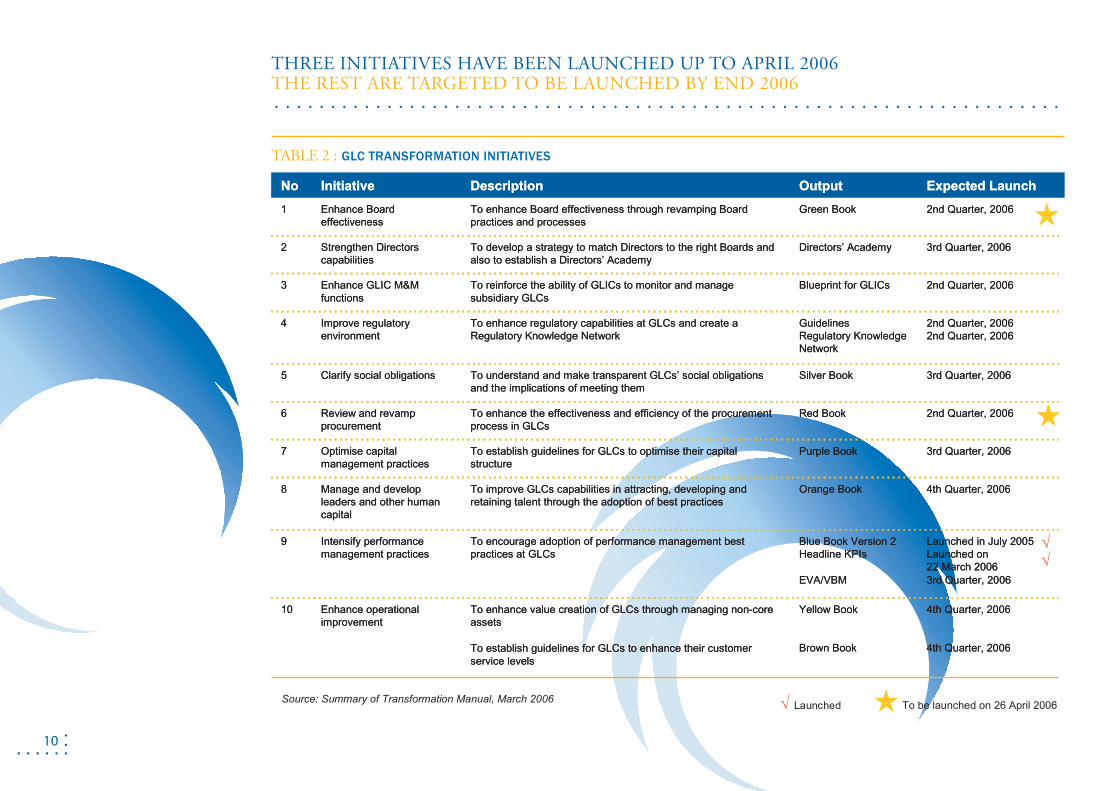
3. Launch of GLC Transformation Initiatives
There are ten overarching Initiatives, announced in the Manual, which should
be undertaken by GLC Boards and GLCs to achieve a higher standard of
performance.
Initiative 9, Intensify Performance Management Practices (Blue Book) has
already been launched.
On 26 April 2006, two key Initiatives will be launched by our YAB Prime
Minister. They are potentially very significant value creation levers for the
GLCs. Specifically they are:
- Initiative 1, Enhancing Board Effectiveness (Green Book); and
- Initiative 6, Review and Revamp Procurement (Red Book).
The remaining Initiatives are targeted for roll-out by the end of 2006 (see
Table 2).
THE OVERALL GLC TRANSFORMATION PROGRAM IS ON SCHEDULE
..................................................................
8
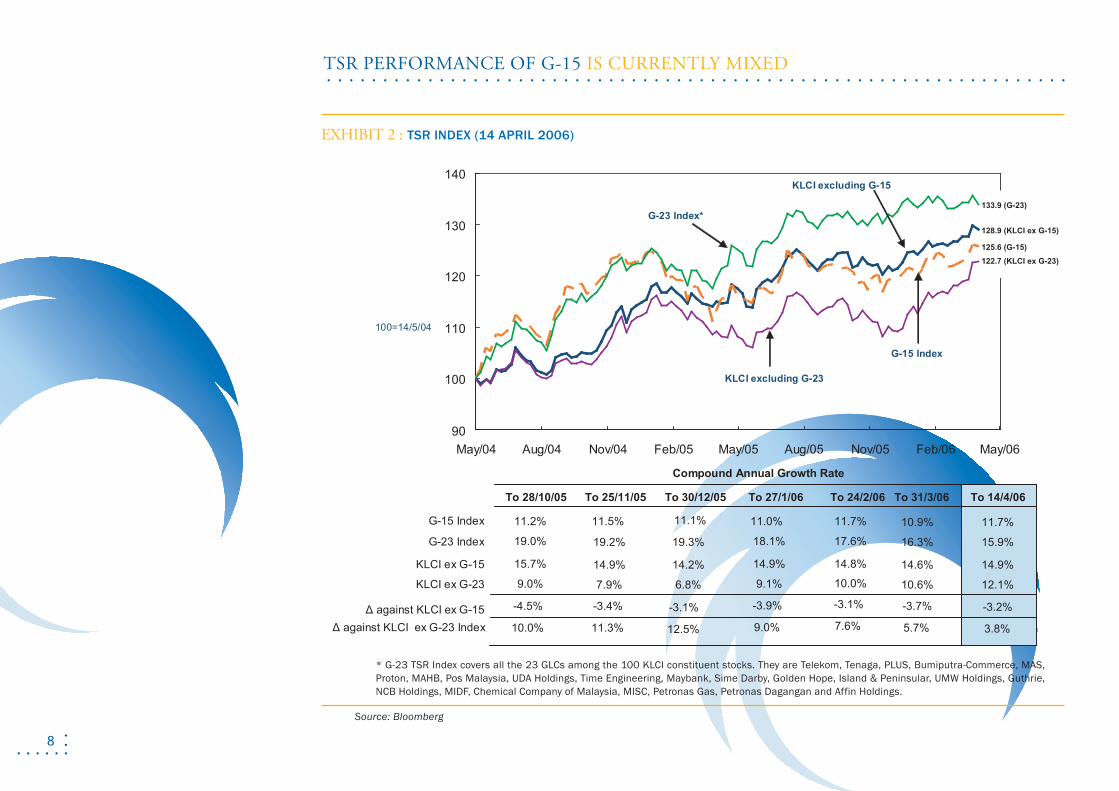
EXHIBIT 2 : TSR INDEX (14 APRIL 2006)
Source: Bloomberg
TSR PERFORMANCE OF G-15 IS CURRENTLY MIXED
..................................................................
14.9%
90
100
110
120
130
140
May/04 Aug/04 Nov/04 Feb/05 May/05 Aug/05 Nov/05 Feb/06 May/06
G-15 Index
KLCI excluding G-15
To 28/10/05 To 25/11/05
Compound Annual Growth Rate
G-15 Index 11.2%
KLCI ex G-15 15.7%
Δ against KLCI ex G-23 Index
To 27/1/06 To 24/2/06
11.0%
14.9%
To 31/3/06
11.7%
14.8%
11.1%
14.2%
To 30/12/05
11.5%
14.9%
To 14/4/06
10.9%
14.6%
11.7%
100=14/5/04
G-23 Index*
G-23 Index 19.0% 18.1% 17.6%19.3%19.2% 16.3% 15.9%
KLCI excluding G-23
10.0% 12.5% 9.0% 7.6%11.3% 5.7% 3.8%
KLCI ex G-23 9.0% 9.1% 10.0%6.8%7.9% 10.6% 12.1%
-4.5% -3.1% -3.9% -3.1%-3.4% -3.7% -3.2%Δ against KLCI ex G-15
* G-23 TSR Index covers all the 23 GLCs among the 100 KLCI constituent stocks. They are Telekom, Tenaga, PLUS, Bumiputra-Commerce, MAS, Proton, MAHB, Pos Malaysia, UDA Holdings, Time Engineering, Maybank, Sime Darby, Golden Hope, Island & Peninsular, UMW Holdings, Guthrie, NCB Holdings, MIDF, Chemical Company of Malaysia, MISC, Petronas Gas, Petronas Dagangan and Affin Holdings.
133.9 (G-23)
128.9 (KLCI ex G-15)
125.6 (G-15)
122.7 (KLCI ex G-23)
9
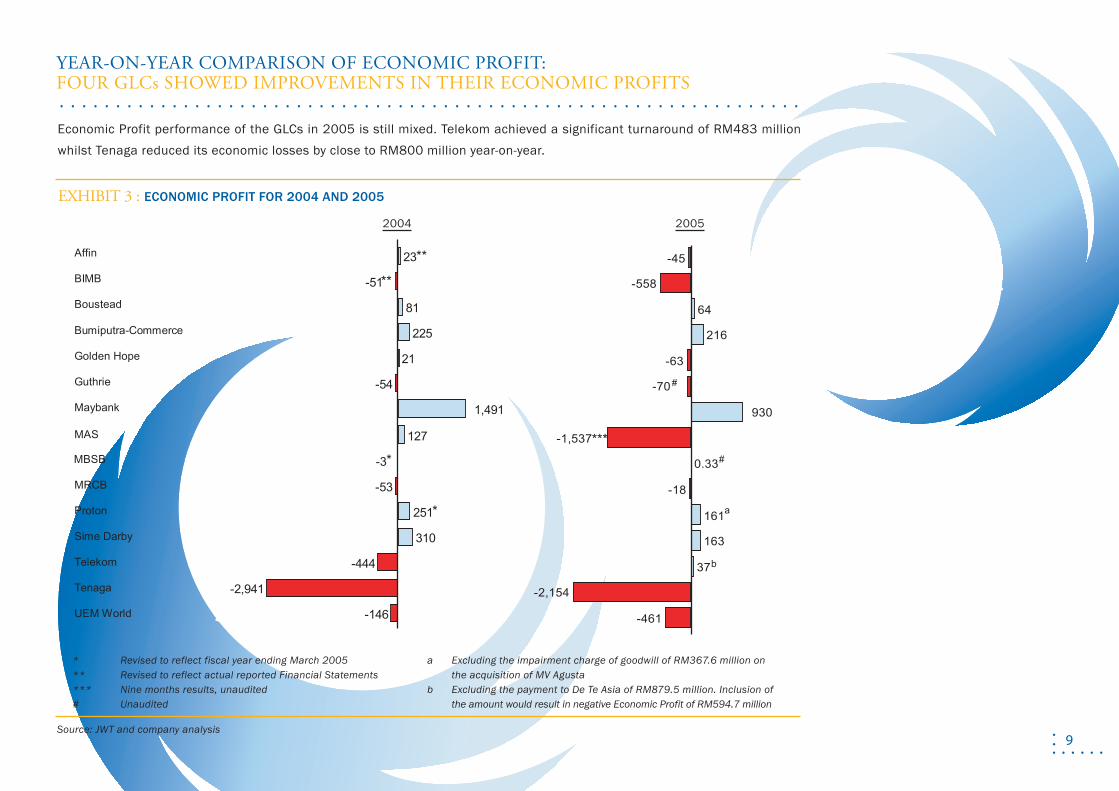
Excluding the impairment charge of goodwill of RM367.6 million on the acquisition of MV Agusta Excluding the payment to De Te Asia of RM879.5 million. Inclusion of the amount would result in negative Economic Profit of RM594.7 million
a
b
* Revised to reflect fiscal year ending March 2005** Revised to reflect actual reported Financial Statements*** Nine months results, unaudited# Unaudited
Source: JWT and company analysis
EXHIBIT 3 : ECONOMIC PROFIT FOR 2004 AND 2005
Economic Profit performance of the GLCs in 2005 is still mixed. Telekom achieved a significant turnaround of RM483 million whilst Tenaga reduced its economic losses by close to RM800 million year-on-year.
2004 2005
YEAR-ON-YEAR COMPARISON OF ECONOMIC PROFIT: FOUR GLCs SHOWED IMPROVEMENTS IN THEIR ECONOMIC PROFITS
..................................................................
Telekom
Sime Darby
Proton
Bumiputra-Commerce
MAS
Guthrie
Golden Hope
Tenaga
MBSB
UEM World
Boustead
BIMB
Affin
MRCB
Maybank
-146
-2,941
-444
310
251
-53
-3
127
-54
21
225
81
23
1,491
-51
*
**
*
**
-461
-2,154
37
163
161
-18
0.33
-63
216
64
-558
-45
-70
-1,537
930
b
a
#
#
***
10
COMPANY
NET PROFIT (2005) ECONOMIC PROFIT (2005)TABLE 2 : GLC TRANSFORMATION INITIATIVES
Source: Summary of Transformation Manual, March 2006
4th Quarter, 2006
4th Quarter, 20064th Quarter, 2006
Yellow Book
Brown BookBrown Book
To enhance value creation of GLCs through managing non-core assets
To establish guidelines for GLCs to enhance their customer service levels
Enhance operational improvement
10
Launched in July 2005Launched on 22 March 20063rd Quarter, 2006
Blue Book Version 2Headline KPIs
EVA/VBM
Launched on 22 March 20063rd Quarter, 2006EVA/VBM
To encourage adoption of performance management best practices at GLCs
Intensify performance management practices
9
4th Quarter, 2006Orange BookTo improve GLCs capabilities in attracting, developing and retaining talent through the adoption of best practices
Manage and develop leaders and other human capital
8
3rd Quarter, 2006Purple BookTo establish guidelines for GLCs to optimise their capital structure
Optimise capital management practices
7
2nd Quarter, 2006Red BookTo enhance the effectiveness and efficiency of the procurement process in GLCs
Review and revamp procurement
6
3rd Quarter, 2006Silver BookTo understand and make transparent GLCs’ social obligations and the implications of meeting them
Clarify social obligations5
2nd Quarter, 20062nd Quarter, 2006
GuidelinesRegulatory Knowledge Network
To enhance regulatory capabilities at GLCs and create a Regulatory Knowledge Network
Improve regulatory environment
4
2nd Quarter, 2006Blueprint for GLICsGLICsTo reinforce the ability of GLICs to monitor and manage subsidiary GLCs
Enhance GLIC M&M functions
3
3rd Quarter, 2006Directors’ AcademyTo develop a strategy to match Directors to the right Boards andalso to establish a Directors’ Academy
Strengthen Directors capabilities
2
2nd Quarter, 2006Green BookTo enhance Board effectiveness through revamping Board practices and processes
Enhance Board effectivenesseffectiveness
1
Expected LaunchOutputDescriptionInitiativeNo
4th Quarter, 2006Yellow BookTo enhance value creation of GLCs through managing non-core assets
To establish guidelines for GLCs to enhance their customer service levels
Enhance operational improvement
10
Launched in July 2005Blue Book Version 2Headline KPIs
To encourage adoption of performance management best practices at GLCs
Intensify performance management practices
9
4th Quarter, 2006Orange BookTo improve GLCs capabilities in attracting, developing and retaining talent through the adoption of best practices
Manage and develop leaders and other human capital
8
3rd Quarter, 2006Purple BookTo establish guidelines for GLCs to optimise their capital structure
Optimise capital management practices
7
2nd Quarter, 2006Red BookTo enhance the effectiveness and efficiency of the procurement process in GLCs
Review and revamp procurement
6
3rd Quarter, 2006Silver BookTo understand and make transparent GLCs’ social obligations and the implications of meeting them
Clarify social obligations5
2nd Quarter, 20062nd Quarter, 2006
GuidelinesRegulatory Knowledge Network
To enhance regulatory capabilities at GLCs and create a Regulatory Knowledge Network
Improve regulatory environment
4
2nd Quarter, 2006Blueprint for To reinforce the ability of GLICs to monitor and manage subsidiary GLCs
Enhance GLIC M&M functions
3
3rd Quarter, 2006Directors’ AcademyTo develop a strategy to match Directors to the right Boards andalso to establish a Directors’ Academy
Strengthen Directors capabilities
2
2nd Quarter, 2006Green BookTo enhance Board effectiveness through revamping Board practices and processes
Enhance Board 1
Expected LaunchOutputDescriptionInitiativeNo
To be launched on 26 April 2006√ Launched
√√
THREE INITIATIVES HAVE BEEN LAUNCHED UP TO APRIL 2006 THE REST ARE TARGETED TO BE LAUNCHED BY END 2006
......................................................................

SECTION IIIGLICs’ UPDATE
12
1. PCG’s role as a policy advisory committee includes:
Implementing the Program and monitoring its progress;
Providing guidance to GLICs and Boards of GLCs on rolling-out and implementing the Program Initiatives; and
Reviewing, amending and updating Policy Guidelines and Initiatives whenever required.
Since the launch of the Manual, three PCG meetings, chaired by YB Second Finance Minister, were held in September 2005, December 2005 and March 2006.
2. The contents of the Manual were communicated and disseminated to the Boards and senior management of the G-15 companies, and a selection of the other GLCs through roadshows on the Program in Q3 and Q4 of 2005.
These communication sessions, which were intended to generate momentum at the GLCs, were carried out within the first six months of the launch of the Manual.
They were presented either at the GLCs’ Board meetings or through senior management workshops.
GLICs ARE INSTRUMENTAL IN DRIVING THE ROLL-OUT AND IMPLEMENTATION OF THE PROGRAM INITIATIVES
..................................................................
Membership of the Putrajaya Committee on GLC High Performance
Second Finance Minister - ChairmanTan Sri Nor Mohamed Yakcop
President and Group Chief Executive, Permodalan Nasional BerhadTan Sri Dato’ Hamad Kama Piah Che Othman
Chief Executive Officer,Lembaga Tabung Angkatan TenteraTan Sri Dato’ Haji Lodin Wok Kamaruddin
Chief Executive Officer,Employees Provident FundDatuk Azlan Zainol
Managing Director, Khazanah Nasional BerhadDato’ Azman Mokhtar
Chief Executive Officer, Lembaga Tabung HajiIsmee Ismail
Deputy Secretary General (System and Controls), Ministry of FinanceDato’ Abdul Rahim Mokti
Head of Policy Unit,Prime Minister’s OfficeAhmad Zaki Zahid
13
3. In the spirit of performance, accountability and transparency, G-15 has taken the lead to announce their Headline KPIs on 22 March 2006.
This announcement was in line with the GLC Transformation Initiative 9, Intensify Performance Management Practices (Blue Book). These Headline KPIs, as approved by the Boards of the respective GLCs, are intended to give an insight and alignment of the GLCs’ strategies and aspirations.
Based on a review of the Headline KPIs of G-15 (see Sections IV and VI), several observations can be made: - More than half of G-15 have announced their medium-term (over a two to three year period) Headline KPIs. This defines their medium-term strategy and provides a more measured, less short-termist approach. - Most of the Headline KPIs are financially-focused with some 60% of G-15 having identified Return on Equity as one of their Headline KPIs. - Three GLCs announced customer-related Headline KPIs in line with their customer-driven business priorities.
4. The Manual also specified that a program management approach be adopted to ensure proper implementation and monitoring of the Program at each GLC.
At the Program level, The Transformation Program Office (the TMO) was established at the Secretariat office in August 2005.
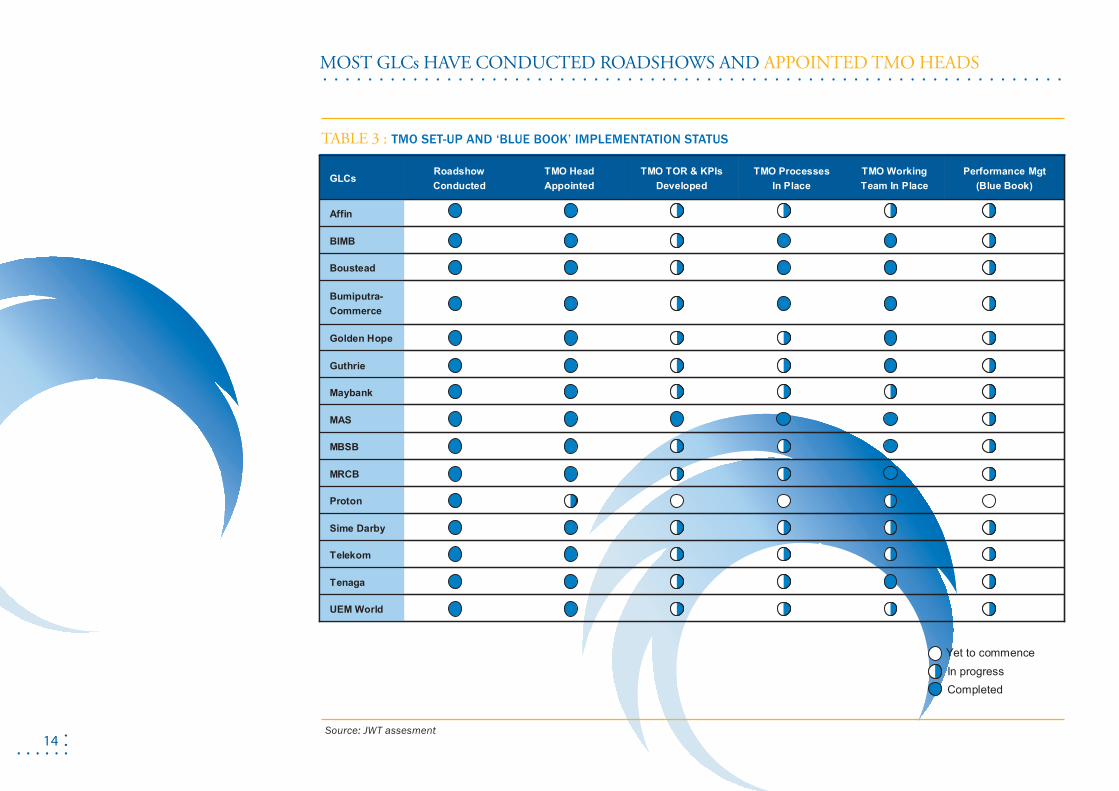
G-15 is in various stages of establishing their TMOs (see Table 3): - A program management approach to ensure proper implementation and monitoring of the Program at each GLC has been adopted; - Almost all G-15 have appointed their TMO Heads, with a working team in place; - These TMO Heads are typically from senior management, with direct reporting to the CEOs of the respective GLCs; and - To ensure traction and accountability, most TMOs are developing their terms of reference, KPIs as well as processes for monitoring, escalating issues and reporting.
HEADLINE KPIs WERE ANNOUNCED AND TMOs WERE SET UP BY G-15
..................................................................
14
MOST GLCs HAVE CONDUCTED ROADSHOWS AND APPOINTED TMO HEADS
..................................................................
UEM World
Tenaga
Telekom
Sime Darby
Proton
MRCB
MBSB
MAS
Maybank
Guthrie
Bumiputra-Commerce
Boustead
BIMB
TMO Head Appointed
Golden Hope
Affin
Performance Mgt (Blue Book)
TMO Working Team In Place
TMO Processes In Place
TMO TOR & KPIsDeveloped
RoadshowConducted
GLCs
UEM World
Tenaga
Telekom
Sime Darby
Proton
MRCB
MBSB
MAS
Maybank
Guthrie
Bumiputra-Commerce
Boustead
BIMB
TMO Head Appointed
Golden Hope
Affin
Performance Mgt (Blue Book)
TMO Working Team In Place
TMO Processes In Place
TMO TOR & KPIsDeveloped
RoadshowConducted
GLCs
Yet to commence
CompletedIn progress
TABLE 3 : TMO SET-UP AND ‘BLUE BOOK’ IMPLEMENTATION STATUS
Source: JWT assesment

SECTION IVGLCs’ UPDATE
16
PROGRESS OF THE PROGRAM AT GLC LEVEL
..................................................................
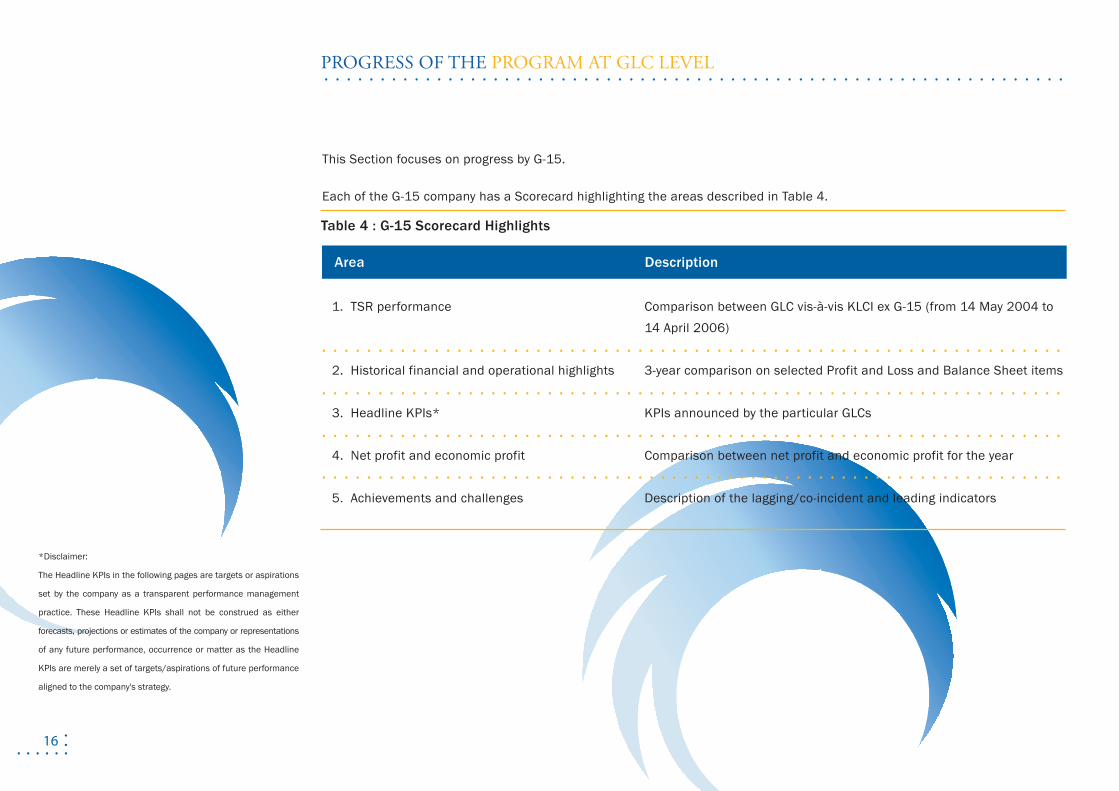
Table 4 : G-15 Scorecard Highlights
1. TSR performance
2. Historical financial and operational highlights
3. Headline KPIs*
4. Net profit and economic profit
5. Achievements and challenges
This Section focuses on progress by G-15.
Each of the G-15 company has a Scorecard highlighting the areas described in Table 4.
Comparison between GLC vis-à-vis KLCI ex G-15 (from 14 May 2004 to 14 April 2006)
3-year comparison on selected Profit and Loss and Balance Sheet items
KPIs announced by the particular GLCs
Comparison between net profit and economic profit for the year
Description of the lagging/co-incident and leading indicators
Area Description
. . . . . . . . . . . . . . . . . . . . . . . . . . . . . . . . . . . . . . . . . . . . . . . . . . . . . . . . . . . . . . . . . .
. . . . . . . . . . . . . . . . . . . . . . . . . . . . . . . . . . . . . . . . . . . . . . . . . . . . . . . . . . . . . . . . . .
. . . . . . . . . . . . . . . . . . . . . . . . . . . . . . . . . . . . . . . . . . . . . . . . . . . . . . . . . . . . . . . . . .
. . . . . . . . . . . . . . . . . . . . . . . . . . . . . . . . . . . . . . . . . . . . . . . . . . . . . . . . . . . . . . . . . .
*Disclaimer:
The Headline KPIs in the following pages are targets or aspirations
set by the company as a transparent performance management
practice. These Headline KPIs shall not be construed as either
forecasts, projections or estimates of the company or representations
of any future performance, occurrence or matter as the Headline
KPIs are merely a set of targets/aspirations of future performance
aligned to the company's strategy.
17
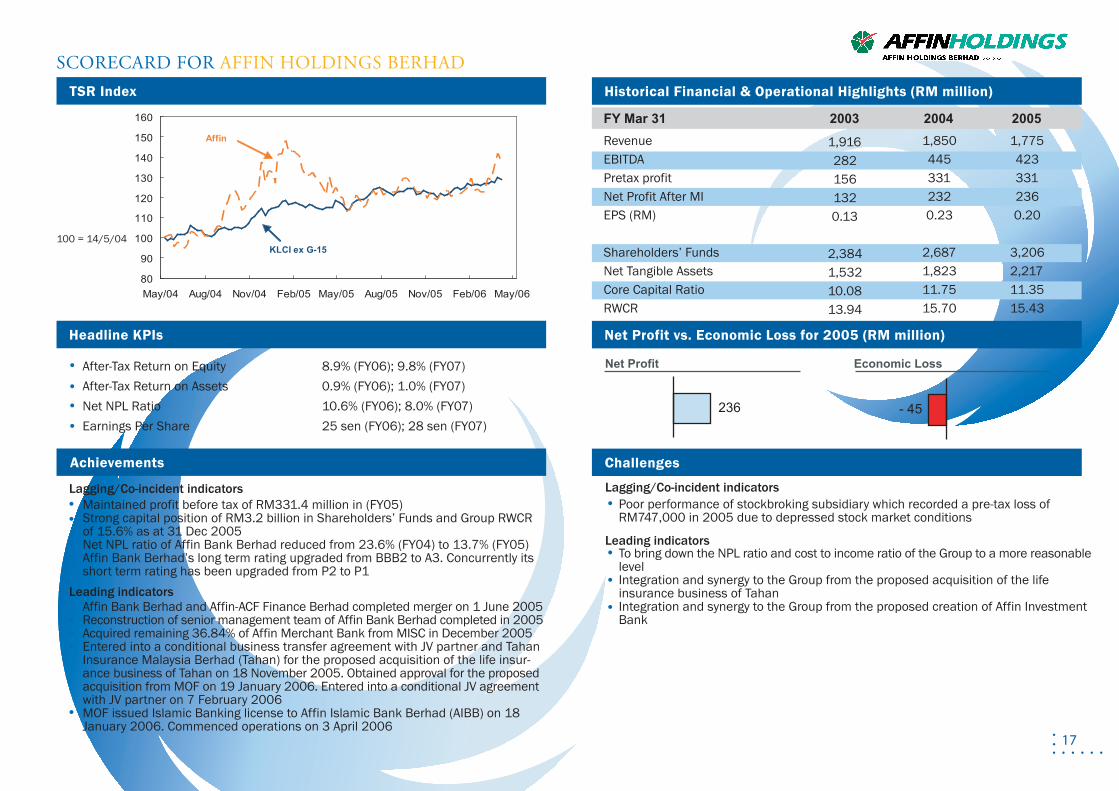
Historical Financial & Operational Highlights (RM million)
Net Profit vs. Economic Loss for 2005 (RM million)
Challenges
Lagging/Co-incident indicatorsMaintained profit before tax of RM331.4 million in (FY05)Strong capital position of RM3.2 billion in Shareholders’ Funds and Group RWCR of 15.6% as at 31 Dec 2005Net NPL ratio of Affin Bank Berhad reduced from 23.6% (FY04) to 13.7% (FY05)Affin Bank Berhad’s long term rating upgraded from BBB2 to A3. Concurrently its short term rating has been upgraded from P2 to P1
Leading indicatorsAffin Bank Berhad and Affin-ACF Finance Berhad completed merger on 1 June 2005Reconstruction of senior management team of Affin Bank Berhad completed in 2005Acquired remaining 36.84% of Affin Merchant Bank from MISC in December 2005Entered into a conditional business transfer agreement with JV partner and Tahan Insurance Malaysia Berhad (Tahan) for the proposed acquisition of the life insur-ance business of Tahan on 18 November 2005. Obtained approval for the proposed acquisition from MOF on 19 January 2006. Entered into a conditional JV agreement with JV partner on 7 February 2006MOF issued Islamic Banking license to Affin Islamic Bank Berhad (AIBB) on 18 January 2006. Commenced operations on 3 April 2006
Lagging/Co-incident indicatorsPoor performance of stockbroking subsidiary which recorded a pre-tax loss of RM747,000 in 2005 due to depressed stock market conditions
Leading indicatorsTo bring down the NPL ratio and cost to income ratio of the Group to a more reasonable levelIntegration and synergy to the Group from the proposed acquisition of the life insurance business of TahanIntegration and synergy to the Group from the proposed creation of Affin Investment Bank
RevenueEBITDA Pretax profitNet Profit After MIEPS (RM)
Shareholders’ FundsNet Tangible AssetsCore Capital RatioRWCR
FY Mar 31 2003 2004 2005
1,9162821561320.13
2,3841,53210.0813.94
1,8504453312320.23
2,6871,82311.7515.70
1,7754233312360.20
3,2062,21711.3515.43
SCORECARD FOR AFFIN HOLDINGS BERHAD
After-Tax Return on Equity 8.9% (FY06); 9.8% (FY07)After-Tax Return on Assets 0.9% (FY06); 1.0% (FY07)Net NPL Ratio 10.6% (FY06); 8.0% (FY07)Earnings Per Share 25 sen (FY06); 28 sen (FY07)
100 = 14/5/04
TSR Index
Headline KPIs
Achievements
80
90
100
110
120
130
140
150
160
May/04 Aug/04 Nov/04 Feb/05 May/05 Aug/05 Nov/05 Feb/06 May/06
Affin
KLCI ex G-15
Net Profit Economic Loss
236 - 45
18
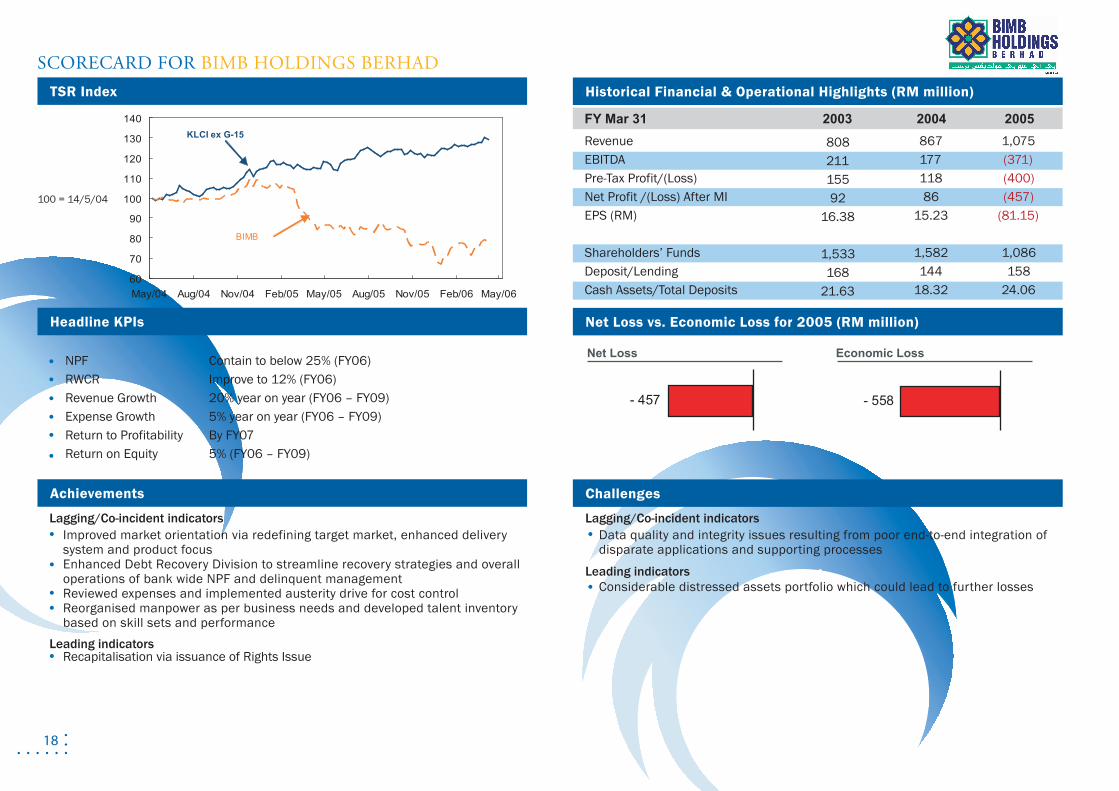
Historical Financial & Operational Highlights (RM million)
Net Loss vs. Economic Loss for 2005 (RM million)
Challenges
Lagging/Co-incident indicatorsImproved market orientation via redefining target market, enhanced delivery system and product focusEnhanced Debt Recovery Division to streamline recovery strategies and overall operations of bank wide NPF and delinquent managementReviewed expenses and implemented austerity drive for cost controlReorganised manpower as per business needs and developed talent inventory based on skill sets and performance
Leading indicatorsRecapitalisation via issuance of Rights Issue
Lagging/Co-incident indicatorsData quality and integrity issues resulting from poor end-to-end integration of disparate applications and supporting processes
Leading indicatorsConsiderable distressed assets portfolio which could lead to further losses
RevenueEBITDA Pre-Tax Profit/(Loss)Net Profit /(Loss) After MIEPS (RM)
Shareholders’ FundsDeposit/Lending Cash Assets/Total Deposits
FY Mar 31 2003 2004 2005
80821115592
16.38
1,533168
21.63
86717711886
15.23
1,582144
18.32
1,075(371)(400)(457)
(81.15)
1,086158
24.06
SCORECARD FOR BIMB HOLDINGS BERHAD
NPF Contain to below 25% (FY06)RWCR Improve to 12% (FY06)Revenue Growth 20% year on year (FY06 – FY09)Expense Growth 5% year on year (FY06 – FY09)Return to Profitability By FY07Return on Equity 5% (FY06 – FY09)
100 = 14/5/04
TSR Index
Headline KPIs
Achievements
- 457 - 558
60
70
80
90
100
110
120
130
140
May/04 Aug/04 Nov/04 Feb/05 May/05 Aug/05 Nov/05 Feb/06 May/06
BIMB
KLCI ex G-15
Net Loss Economic Loss
19
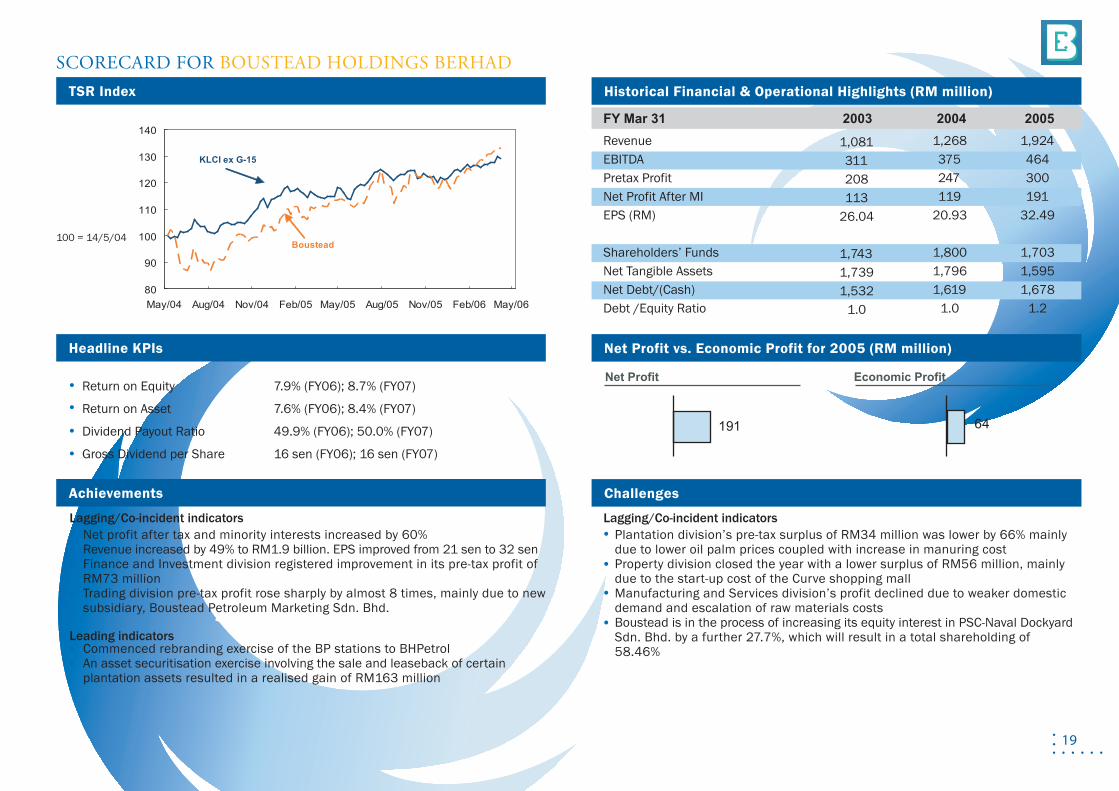
Historical Financial & Operational Highlights (RM million)
Net Profit vs. Economic Profit for 2005 (RM million)
Challenges
Lagging/Co-incident indicatorsNet profit after tax and minority interests increased by 60%Revenue increased by 49% to RM1.9 billion. EPS improved from 21 sen to 32 senFinance and Investment division registered improvement in its pre-tax profit of RM73 millionTrading division pre-tax profit rose sharply by almost 8 times, mainly due to new subsidiary, Boustead Petroleum Marketing Sdn. Bhd.
Leading indicatorsCommenced rebranding exercise of the BP stations to BHPetrolAn asset securitisation exercise involving the sale and leaseback of certain plantation assets resulted in a realised gain of RM163 million
Lagging/Co-incident indicatorsPlantation division’s pre-tax surplus of RM34 million was lower by 66% mainly due to lower oil palm prices coupled with increase in manuring costProperty division closed the year with a lower surplus of RM56 million, mainly due to the start-up cost of the Curve shopping mallManufacturing and Services division’s profit declined due to weaker domestic demand and escalation of raw materials costsBoustead is in the process of increasing its equity interest in PSC-Naval Dockyard Sdn. Bhd. by a further 27.7%, which will result in a total shareholding of 58.46%
Revenue EBITDA Pretax Profit Net Profit After MI EPS (RM)
Shareholders’ FundsNet Tangible AssetsNet Debt/(Cash)Debt /Equity Ratio
FY Mar 31 2003 2004 2005
1,081311208113
26.04
1,7431,7391,532
1.0
1,268375247119
20.93
1,8001,7961,619
1.0
1,924464300191
32.49
1,7031,5951,678
1.2
SCORECARD FOR BOUSTEAD HOLDINGS BERHAD
Return on Equity 7.9% (FY06); 8.7% (FY07)
Return on Asset 7.6% (FY06); 8.4% (FY07)
Dividend Payout Ratio 49.9% (FY06); 50.0% (FY07)
Gross Dividend per Share 16 sen (FY06); 16 sen (FY07)
100 = 14/5/04
TSR Index
Headline KPIs
Achievements
80
90
100
110
120
130
140
May/04 Aug/04 Nov/04 Feb/05 May/05 Aug/05 Nov/05 Feb/06 May/06
Boustead
KLCI ex G-15
191 64
Net Profit Economic Profit
20
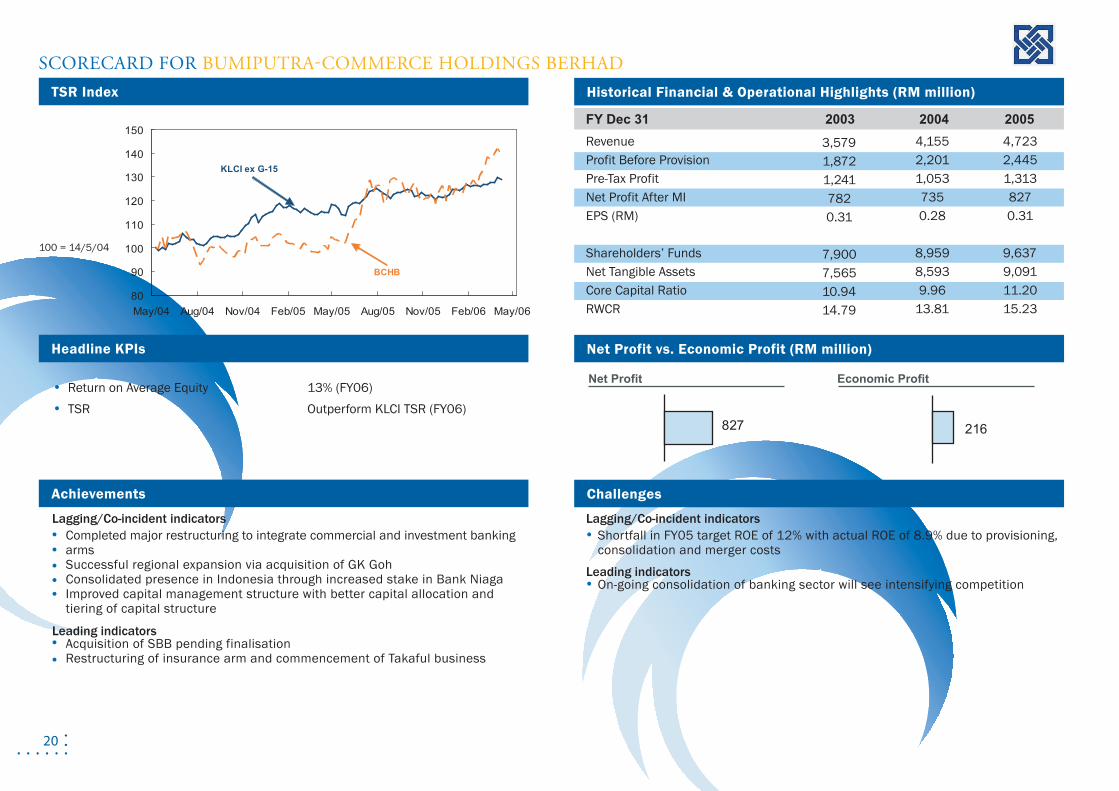
Historical Financial & Operational Highlights (RM million)
Net Profit vs. Economic Profit (RM million)
Challenges
Lagging/Co-incident indicatorsCompleted major restructuring to integrate commercial and investment banking arms Successful regional expansion via acquisition of GK GohConsolidated presence in Indonesia through increased stake in Bank NiagaImproved capital management structure with better capital allocation and tiering of capital structure
Leading indicatorsAcquisition of SBB pending finalisationRestructuring of insurance arm and commencement of Takaful business
Lagging/Co-incident indicatorsShortfall in FY05 target ROE of 12% with actual ROE of 8.9% due to provisioning, consolidation and merger costs
Leading indicatorsOn-going consolidation of banking sector will see intensifying competition
RevenueProfit Before ProvisionPre-Tax ProfitNet Profit After MIEPS (RM)
Shareholders’ FundsNet Tangible AssetsCore Capital RatioRWCR
FY Dec 31 2003 2004 2005
3,5791,872 1,241 782 0.31
7,900 7,565 10.9414.79
4,155 2,201 1,053 735 0.28
8,959 8,593 9.96
13.81
4,723 2,445 1,313 827 0.31
9,6379,091 11.20 15.23
SCORECARD FOR BUMIPUTRA-COMMERCE HOLDINGS BERHAD
Return on Average Equity 13% (FY06)TSR Outperform KLCI TSR (FY06)
100 = 14/5/04
TSR Index
Headline KPIs
Achievements
80
90
100
110
120
130
140
150
May/04 Aug/04 Nov/04 Feb/05 May/05 Aug/05 Nov/05 Feb/06 May/06
BCHB
KLCI ex G-15
827 216
Net Profit Economic Profit
21
Historical Financial & Operational Highlights (RM million)
Net Profit vs. Economic Loss for 2005 (RM million)
Challenges
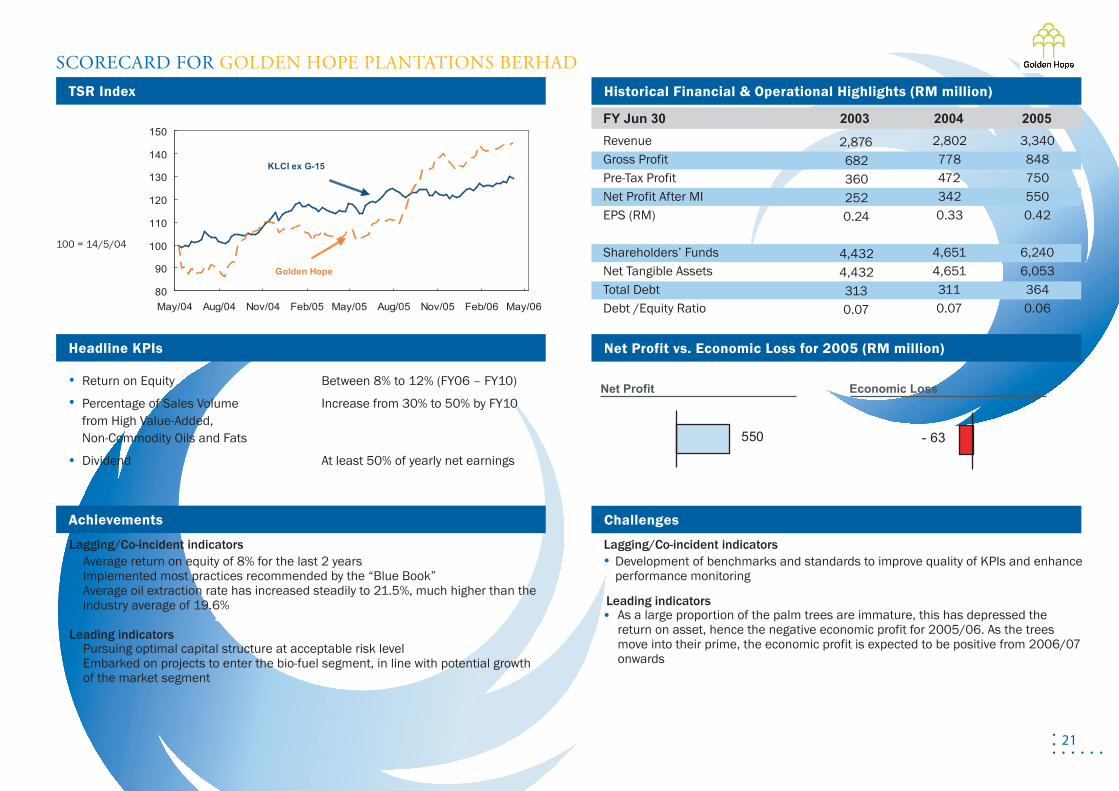
Lagging/Co-incident indicatorsAverage return on equity of 8% for the last 2 yearsImplemented most practices recommended by the “Blue Book”Average oil extraction rate has increased steadily to 21.5%, much higher than the industry average of 19.6%
Leading indicatorsPursuing optimal capital structure at acceptable risk levelEmbarked on projects to enter the bio-fuel segment, in line with potential growth of the market segment
Leading indicatorsAs a large proportion of the palm trees are immature, this has depressed the return on asset, hence the negative economic profit for 2005/06. As the trees move into their prime, the economic profit is expected to be positive from 2006/07 onwards
Lagging/Co-incident indicatorsDevelopment of benchmarks and standards to improve quality of KPIs and enhance performance monitoring
RevenueGross Profit Pre-Tax ProfitNet Profit After MIEPS (RM)
Shareholders’ FundsNet Tangible AssetsTotal DebtDebt /Equity Ratio
FY Jun 30 2003 2004 2005
2,8766823602520.24
4,4324,4323130.07
2,8027784723420.33
4,6514,6513110.07
3,3408487505500.42
6,2406,0533640.06
SCORECARD FOR GOLDEN HOPE PLANTATIONS BERHAD
Return on Equity Between 8% to 12% (FY06 – FY10)
Percentage of Sales Volume Increase from 30% to 50% by FY10from High Value-Added, Non-Commodity Oils and Fats
Dividend At least 50% of yearly net earnings
100 = 14/5/04
TSR Index
Headline KPIs
Achievements
80
90
100
110
120
130
140
150
May/04 Aug/04 Nov/04 Feb/05 May/05 Aug/05 Nov/05 Feb/06 May/06
Golden Hope
KLCI ex G-15
550 - 63
Net Profit Economic Loss
22
Historical Financial & Operational Highlights (RM million)
Net Profit vs. Economic Loss for 2005 (RM million)
Challenges
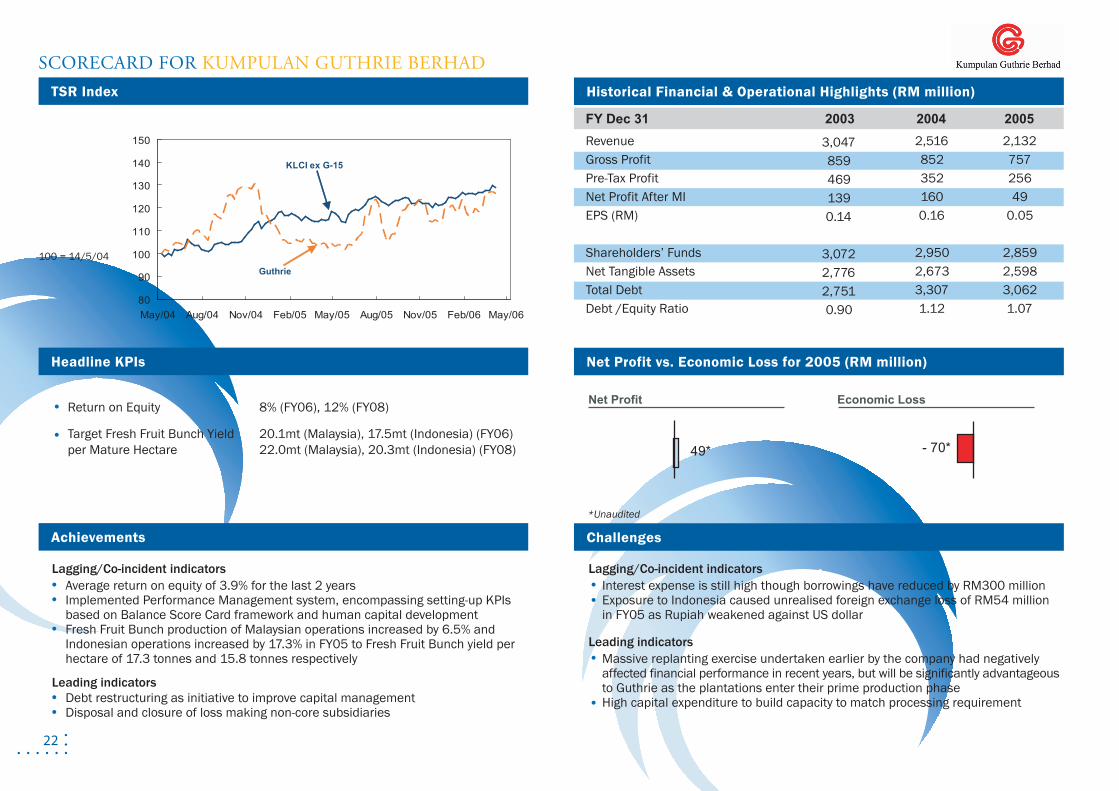
Lagging/Co-incident indicatorsAverage return on equity of 3.9% for the last 2 yearsImplemented Performance Management system, encompassing setting-up KPIs based on Balance Score Card framework and human capital developmentFresh Fruit Bunch production of Malaysian operations increased by 6.5% and Indonesian operations increased by 17.3% in FY05 to Fresh Fruit Bunch yield per hectare of 17.3 tonnes and 15.8 tonnes respectively
Leading indicatorsDebt restructuring as initiative to improve capital managementDisposal and closure of loss making non-core subsidiaries
Lagging/Co-incident indicatorsInterest expense is still high though borrowings have reduced by RM300 millionExposure to Indonesia caused unrealised foreign exchange loss of RM54 million in FY05 as Rupiah weakened against US dollar
Leading indicatorsMassive replanting exercise undertaken earlier by the company had negatively affected financial performance in recent years, but will be significantly advantageous to Guthrie as the plantations enter their prime production phaseHigh capital expenditure to build capacity to match processing requirement
RevenueGross Profit Pre-Tax ProfitNet Profit After MIEPS (RM)
Shareholders’ FundsNet Tangible AssetsTotal DebtDebt /Equity Ratio
FY Dec 31 2003 2004 2005
3,0478594691390.14
3,0722,7762,7510.90
2,5168523521600.16
2,9502,6733,3071.12
2,13275725649
0.05
2,8592,5983,0621.07
SCORECARD FOR KUMPULAN GUTHRIE BERHAD
Return on Equity 8% (FY06), 12% (FY08)
Target Fresh Fruit Bunch Yield 20.1mt (Malaysia), 17.5mt (Indonesia) (FY06)per Mature Hectare 22.0mt (Malaysia), 20.3mt (Indonesia) (FY08)
100 = 14/5/04
TSR Index
Headline KPIs
Achievements
80
90
100
110
120
130
140
150
May/04 Aug/04 Nov/04 Feb/05 May/05 Aug/05 Nov/05 Feb/06 May/06
KLCI ex G-15
Guthrie
49* - 70*
*Unaudited
Net Profit Economic Loss
23
Historical Financial & Operational Highlights (RM million)
Net Profit vs. Economic Profit for 2005 (RM million)
Challenges
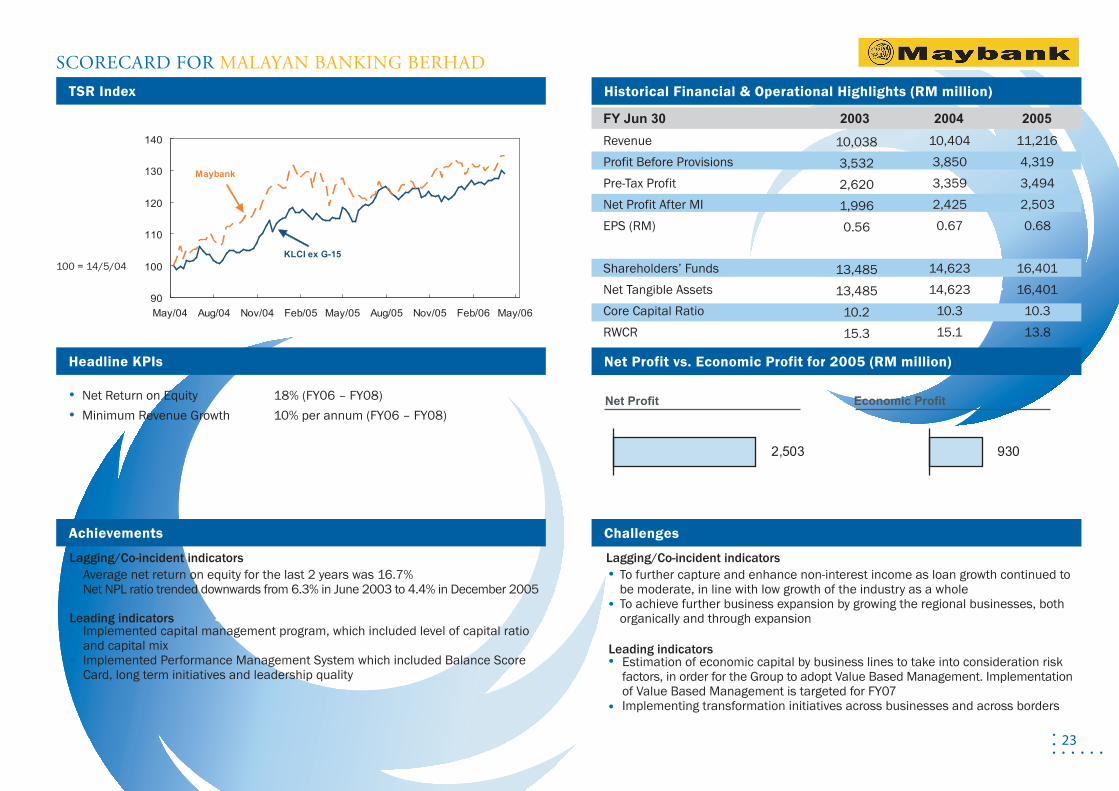
Lagging/Co-incident indicatorsAverage net return on equity for the last 2 years was 16.7%Net NPL ratio trended downwards from 6.3% in June 2003 to 4.4% in December 2005
Leading indicatorsImplemented capital management program, which included level of capital ratio and capital mixImplemented Performance Management System which included Balance Score Card, long term initiatives and leadership quality
Leading indicatorsEstimation of economic capital by business lines to take into consideration risk factors, in order for the Group to adopt Value Based Management. Implementation of Value Based Management is targeted for FY07Implementing transformation initiatives across businesses and across borders
Lagging/Co-incident indicatorsTo further capture and enhance non-interest income as loan growth continued to be moderate, in line with low growth of the industry as a wholeTo achieve further business expansion by growing the regional businesses, both organically and through expansion
Revenue Profit Before ProvisionsPre-Tax ProfitNet Profit After MIEPS (RM)
Shareholders’ FundsNet Tangible AssetsCore Capital RatioRWCR
FY Jun 30 2003 2004 2005
10,0383,5322,6201,9960.56
13,48513,485
10.215.3
10,4043,8503,3592,4250.67
14,62314,623
10.315.1
11,2164,3193,4942,5030.68
16,40116,401
10.313.8
SCORECARD FOR MALAYAN BANKING BERHAD
Net Return on Equity 18% (FY06 – FY08)Minimum Revenue Growth 10% per annum (FY06 – FY08)
100 = 14/5/04
TSR Index
Headline KPIs
Achievements
90
100
110
120
130
140
May/04 Aug/04 Nov/04 Feb/05 May/05 Aug/05 Nov/05 Feb/06 May/06
Maybank
KLCI ex G-15
2,503 930
Net Profit Economic Profit
24
Historical Financial & Operational Highlights (RM million)
Net Loss vs. Economic Loss for 2005 (RM million)
Challenges
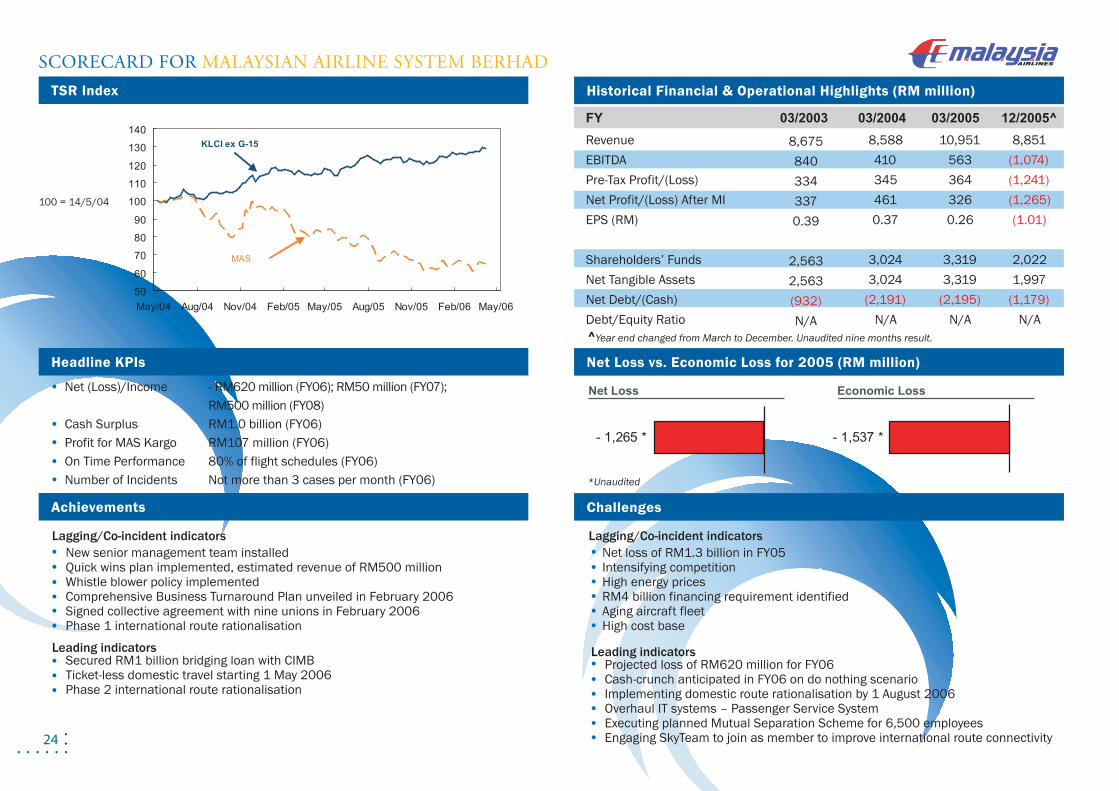
Lagging/Co-incident indicatorsNew senior management team installedQuick wins plan implemented, estimated revenue of RM500 millionWhistle blower policy implementedComprehensive Business Turnaround Plan unveiled in February 2006Signed collective agreement with nine unions in February 2006Phase 1 international route rationalisation
Leading indicatorsSecured RM1 billion bridging loan with CIMBTicket-less domestic travel starting 1 May 2006Phase 2 international route rationalisation
Leading indicatorsProjected loss of RM620 million for FY06 Cash-crunch anticipated in FY06 on do nothing scenarioImplementing domestic route rationalisation by 1 August 2006Overhaul IT systems – Passenger Service SystemExecuting planned Mutual Separation Scheme for 6,500 employeesEngaging SkyTeam to join as member to improve international route connectivity
Lagging/Co-incident indicatorsNet loss of RM1.3 billion in FY05Intensifying competitionHigh energy pricesRM4 billion financing requirement identifiedAging aircraft fleetHigh cost base
RevenueEBITDA Pre-Tax Profit/(Loss)Net Profit/(Loss) After MIEPS (RM)
Shareholders’ FundsNet Tangible AssetsNet Debt/(Cash)Debt/Equity Ratio^Year end changed from March to December. Unaudited nine months result.
*Unaudited
FY 03/2003 03/2004 03/2005 12/2005^
8,675840334337 0.39
2,563 2,563 (932)N/A
8,5884103454610.37
3,0243,024
(2,191)N/A
10,9515633643260.26
3,3193,319
(2,195)N/A
8,851(1,074)(1,241)(1,265)(1.01)
2,0221,997
(1,179)N/A
SCORECARD FOR MALAYSIAN AIRLINE SYSTEM BERHAD
Net (Loss)/Income - RM620 million (FY06); RM50 million (FY07); RM500 million (FY08)Cash Surplus RM1.0 billion (FY06)Profit for MAS Kargo RM107 million (FY06)On Time Performance 80% of flight schedules (FY06)Number of Incidents Not more than 3 cases per month (FY06)
100 = 14/5/04
TSR Index
Headline KPIs
Achievements
50
60
70
80
90
100
110
120
130
140
May/04 Aug/04 Nov/04 Feb/05 May/05 Aug/05 Nov/05 Feb/06 May/06
MAS
KLCI ex G-15
- 1,265 * - 1,537 *
Net Loss Economic Loss
25
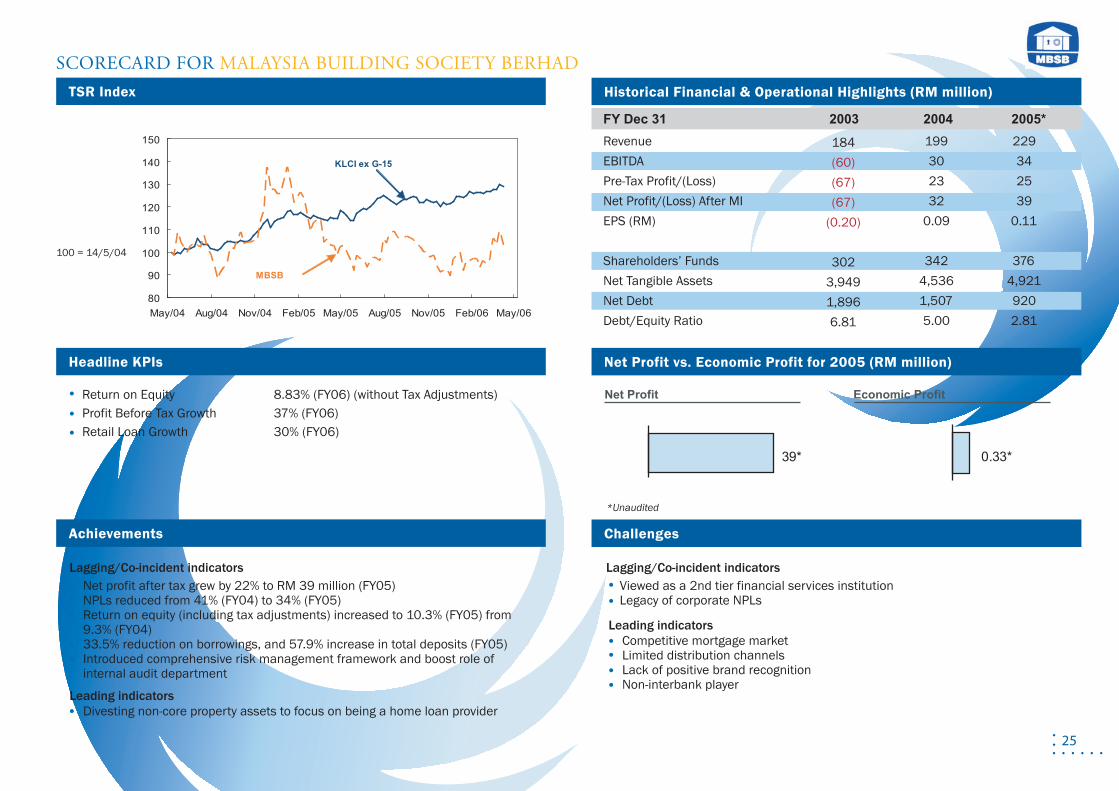
Historical Financial & Operational Highlights (RM million)
Net Profit vs. Economic Profit for 2005 (RM million)
Challenges
Lagging/Co-incident indicatorsNet profit after tax grew by 22% to RM 39 million (FY05)NPLs reduced from 41% (FY04) to 34% (FY05) Return on equity (including tax adjustments) increased to 10.3% (FY05) from 9.3% (FY04)33.5% reduction on borrowings, and 57.9% increase in total deposits (FY05)Introduced comprehensive risk management framework and boost role of internal audit department
Leading indicatorsDivesting non-core property assets to focus on being a home loan provider
Leading indicatorsCompetitive mortgage marketLimited distribution channelsLack of positive brand recognitionNon-interbank player
Lagging/Co-incident indicatorsViewed as a 2nd tier financial services institutionLegacy of corporate NPLs
*Unaudited
RevenueEBITDA Pre-Tax Profit/(Loss)Net Profit/(Loss) After MIEPS (RM)
Shareholders’ FundsNet Tangible AssetsNet DebtDebt/Equity Ratio
FY Dec 31 2003 2004 2005*
184(60)(67)(67)
(0.20)
3023,9491,8966.81
199302332
0.09
3424,5361,5075.00
229342539
0.11
3764,9219202.81
SCORECARD FOR MALAYSIA BUILDING SOCIETY BERHAD
Return on Equity 8.83% (FY06) (without Tax Adjustments) Profit Before Tax Growth 37% (FY06)Retail Loan Growth 30% (FY06)
100 = 14/5/04
TSR Index
Headline KPIs
Achievements
80
90
100
110
120
130
140
150
May/04 Aug/04 Nov/04 Feb/05 May/05 Aug/05 Nov/05 Feb/06 May/06
MBSB
KLCI ex G-15
39* 0.33*
Net Profit Economic Profit
26
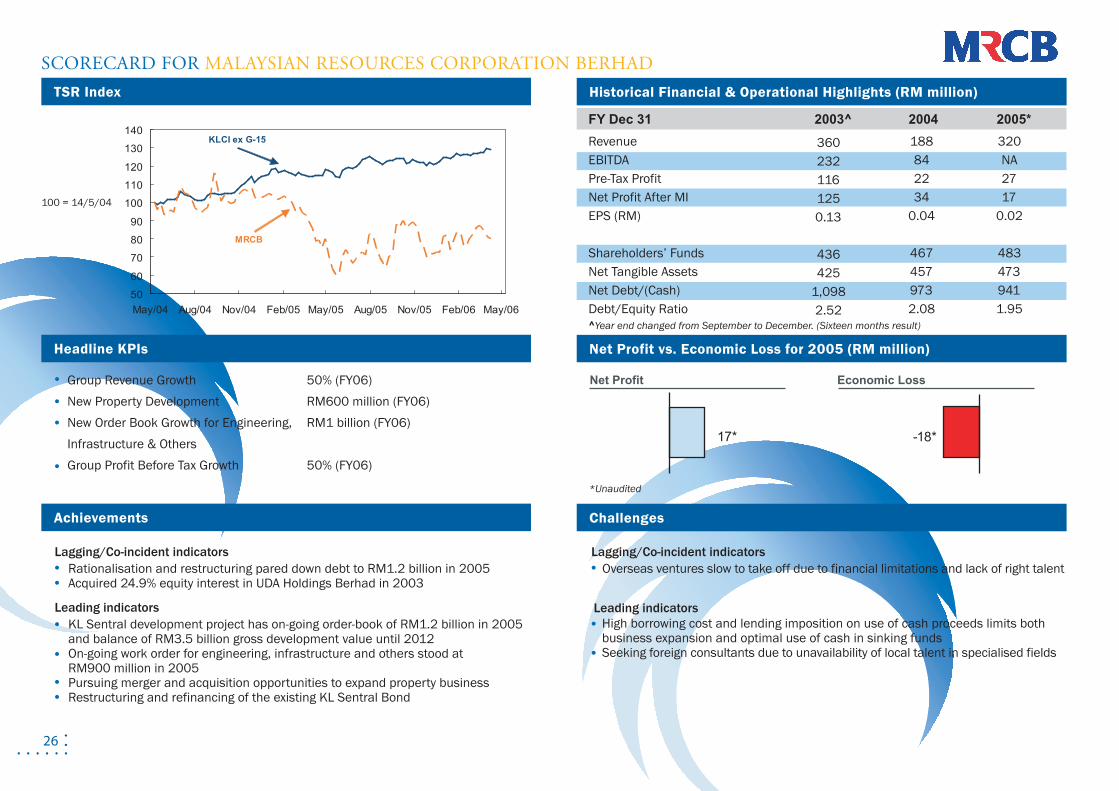
Historical Financial & Operational Highlights (RM million)
Net Profit vs. Economic Loss for 2005 (RM million)
Challenges
Lagging/Co-incident indicatorsRationalisation and restructuring pared down debt to RM1.2 billion in 2005Acquired 24.9% equity interest in UDA Holdings Berhad in 2003
Leading indicatorsKL Sentral development project has on-going order-book of RM1.2 billion in 2005 and balance of RM3.5 billion gross development value until 2012 On-going work order for engineering, infrastructure and others stood at RM900 million in 2005Pursuing merger and acquisition opportunities to expand property businessRestructuring and refinancing of the existing KL Sentral Bond
Leading indicatorsHigh borrowing cost and lending imposition on use of cash proceeds limits both business expansion and optimal use of cash in sinking fundsSeeking foreign consultants due to unavailability of local talent in specialised fields
Lagging/Co-incident indicatorsOverseas ventures slow to take off due to financial limitations and lack of right talent
*Unaudited
^Year end changed from September to December. (Sixteen months result)
RevenueEBITDA Pre-Tax ProfitNet Profit After MIEPS (RM)
Shareholders’ FundsNet Tangible AssetsNet Debt/(Cash)Debt/Equity Ratio
FY Dec 31 2003^ 2004 2005*
3602321161250.13
436425
1,0982.52
188842234
0.04
4674579732.08
320NA2717
0.02
4834739411.95
SCORECARD FOR MALAYSIAN RESOURCES CORPORATION BERHAD
Group Revenue Growth 50% (FY06)New Property Development RM600 million (FY06)New Order Book Growth for Engineering, RM1 billion (FY06)Infrastructure & OthersGroup Profit Before Tax Growth 50% (FY06)
100 = 14/5/04
TSR Index
Headline KPIs
Achievements
50
60
70
80
90
100
110
120
130
140
May/04 Aug/04 Nov/04 Feb/05 May/05 Aug/05 Nov/05 Feb/06 May/06
MRCB
KLCI ex G-15
17* -18*
Net Profit Economic Loss
27
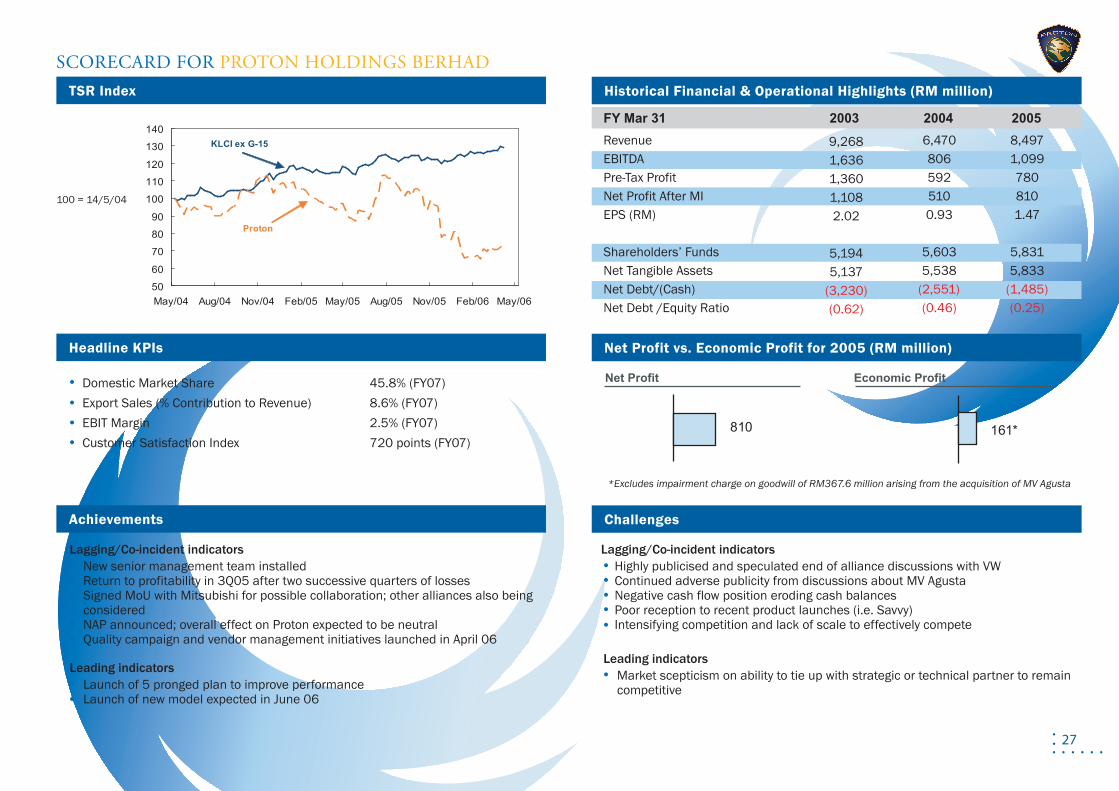
Historical Financial & Operational Highlights (RM million)
Net Profit vs. Economic Profit for 2005 (RM million)
Challenges
Lagging/Co-incident indicatorsNew senior management team installedReturn to profitability in 3Q05 after two successive quarters of lossesSigned MoU with Mitsubishi for possible collaboration; other alliances also being consideredNAP announced; overall effect on Proton expected to be neutralQuality campaign and vendor management initiatives launched in April 06
Leading indicatorsLaunch of 5 pronged plan to improve performance Launch of new model expected in June 06
Leading indicatorsMarket scepticism on ability to tie up with strategic or technical partner to remain competitive
Lagging/Co-incident indicatorsHighly publicised and speculated end of alliance discussions with VWContinued adverse publicity from discussions about MV AgustaNegative cash flow position eroding cash balancesPoor reception to recent product launches (i.e. Savvy)Intensifying competition and lack of scale to effectively compete
RevenueEBITDA Pre-Tax ProfitNet Profit After MIEPS (RM)
Shareholders’ FundsNet Tangible AssetsNet Debt/(Cash)Net Debt /Equity Ratio
FY Mar 31 2003 2004 2005
9,268 1,636 1,360 1,108 2.02
5,194 5,137
(3,230)(0.62)
6,470 806 592 510 0.93
5,603 5,538
(2,551)(0.46)
8,497 1,099 780 810 1.47
5,831 5,833
(1,485)(0.25)
SCORECARD FOR PROTON HOLDINGS BERHAD
Domestic Market Share 45.8% (FY07)Export Sales (% Contribution to Revenue) 8.6% (FY07)EBIT Margin 2.5% (FY07) Customer Satisfaction Index 720 points (FY07)
*Excludes impairment charge on goodwill of RM367.6 million arising from the acquisition of MV Agusta
100 = 14/5/04
TSR Index
Headline KPIs
Achievements
50
60
70
80
90
100
110
120
130
140
May/04 Aug/04 Nov/04 Feb/05 May/05 Aug/05 Nov/05 Feb/06 May/06
Proton
KLCI ex G-15
810 161*
Net Profit Economic Profit
28
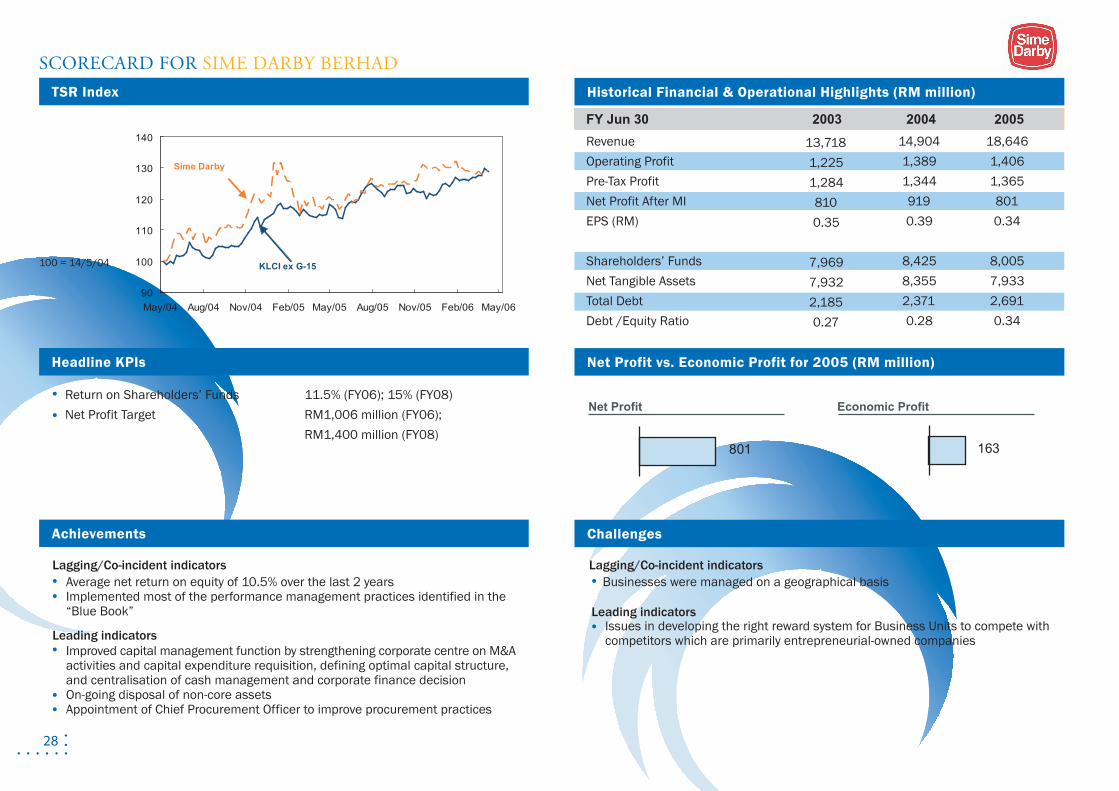
Historical Financial & Operational Highlights (RM million)
Net Profit vs. Economic Profit for 2005 (RM million)
Challenges
Lagging/Co-incident indicatorsAverage net return on equity of 10.5% over the last 2 yearsImplemented most of the performance management practices identified in the “Blue Book”
Leading indicatorsImproved capital management function by strengthening corporate centre on M&A activities and capital expenditure requisition, defining optimal capital structure, and centralisation of cash management and corporate finance decisionOn-going disposal of non-core assetsAppointment of Chief Procurement Officer to improve procurement practices
Leading indicatorsIssues in developing the right reward system for Business Units to compete with competitors which are primarily entrepreneurial-owned companies
Lagging/Co-incident indicatorsBusinesses were managed on a geographical basis
Net Profit Economic Profit
RevenueOperating Profit Pre-Tax ProfitNet Profit After MIEPS (RM)
Shareholders’ FundsNet Tangible AssetsTotal DebtDebt /Equity Ratio
FY Jun 30 2003 2004 2005
13,7181,2251,2848100.35
7,9697,9322,1850.27
14,9041,3891,3449190.39
8,4258,3552,3710.28
18,6461,4061,3658010.34
8,0057,9332,6910.34
SCORECARD FOR SIME DARBY BERHAD
Return on Shareholders’ Funds 11.5% (FY06); 15% (FY08)Net Profit Target RM1,006 million (FY06); RM1,400 million (FY08)
100 = 14/5/04
TSR Index
Headline KPIs
Achievements
90
100
110
120
130
140
May/04 Aug/04 Nov/04 Feb/05 May/05 Aug/05 Nov/05 Feb/06 May/06
Sime Darby
KLCI ex G-15
801 163
29
Historical Financial & Operational Highlights (RM million)
Net Profit vs. Economic Profit for 2005 (RM million)
Challenges
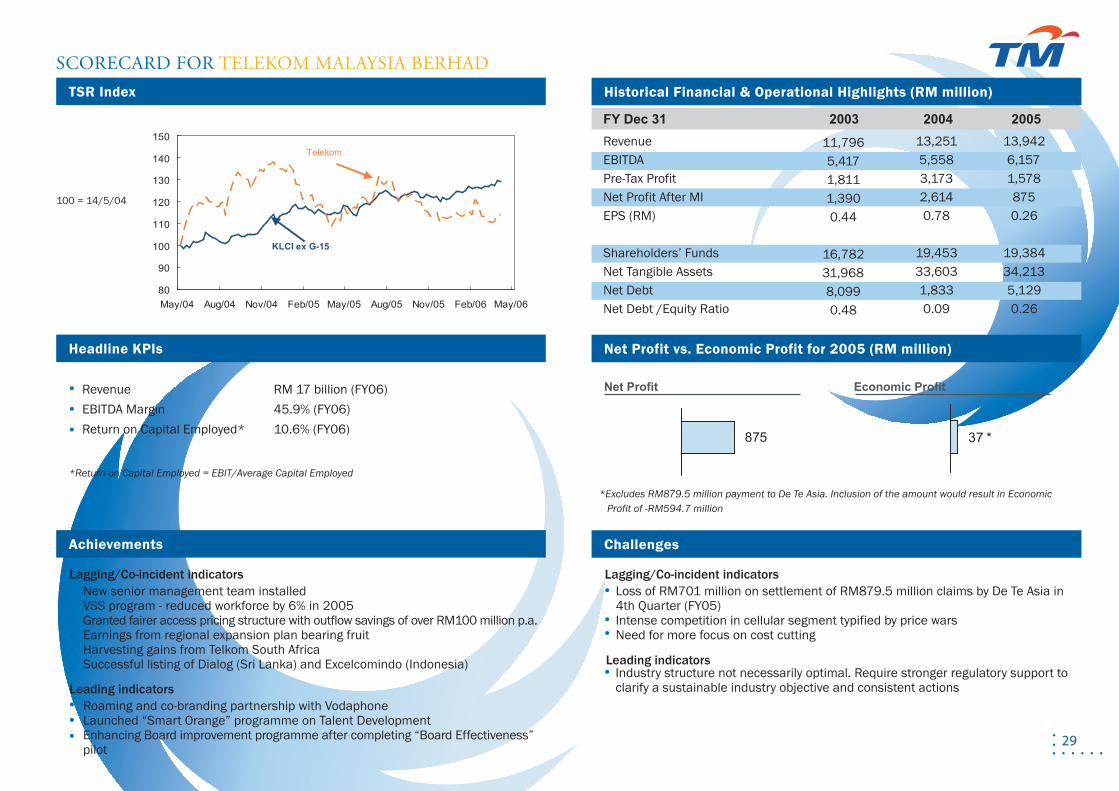
Lagging/Co-incident indicatorsNew senior management team installedVSS program - reduced workforce by 6% in 2005Granted fairer access pricing structure with outflow savings of over RM100 million p.a.Earnings from regional expansion plan bearing fruitHarvesting gains from Telkom South Africa Successful listing of Dialog (Sri Lanka) and Excelcomindo (Indonesia)
Leading indicatorsRoaming and co-branding partnership with VodaphoneLaunched “Smart Orange” programme on Talent DevelopmentEnhancing Board improvement programme after completing “Board Effectiveness” pilot
Leading indicatorsIndustry structure not necessarily optimal. Require stronger regulatory support to clarify a sustainable industry objective and consistent actions
Lagging/Co-incident indicatorsLoss of RM701 million on settlement of RM879.5 million claims by De Te Asia in 4th Quarter (FY05)Intense competition in cellular segment typified by price wars Need for more focus on cost cutting
RevenueEBITDA Pre-Tax ProfitNet Profit After MIEPS (RM)
Shareholders’ FundsNet Tangible AssetsNet DebtNet Debt /Equity Ratio
FY Dec 31 2003 2004 2005
11,796 5,417 1,811 1,390 0.44
16,782 31,9688,099 0.48
13,251 5,558 3,173 2,614 0.78
19,453 33,6031,833 0.09
13,9426,1571,5788750.26
19,384 34,2135,129 0.26
SCORECARD FOR TELEKOM MALAYSIA BERHAD
Revenue RM 17 billion (FY06)EBITDA Margin 45.9% (FY06)Return on Capital Employed* 10.6% (FY06)
*Return on Capital Employed = EBIT/Average Capital Employed
*Excludes RM879.5 million payment to De Te Asia. Inclusion of the amount would result in Economic Profit of -RM594.7 million
100 = 14/5/04
TSR Index
Headline KPIs
Achievements
80
90
100
110
120
130
140
150
May/04 Aug/04 Nov/04 Feb/05 May/05 Aug/05 Nov/05 Feb/06 May/06
Telekom
KLCI ex G-15
875 37 *
Net Profit Economic Profit
30
Historical Financial & Operational Highlights (RM million)
Net Profit vs. Economic Loss for 2005 (RM million)
Challenges
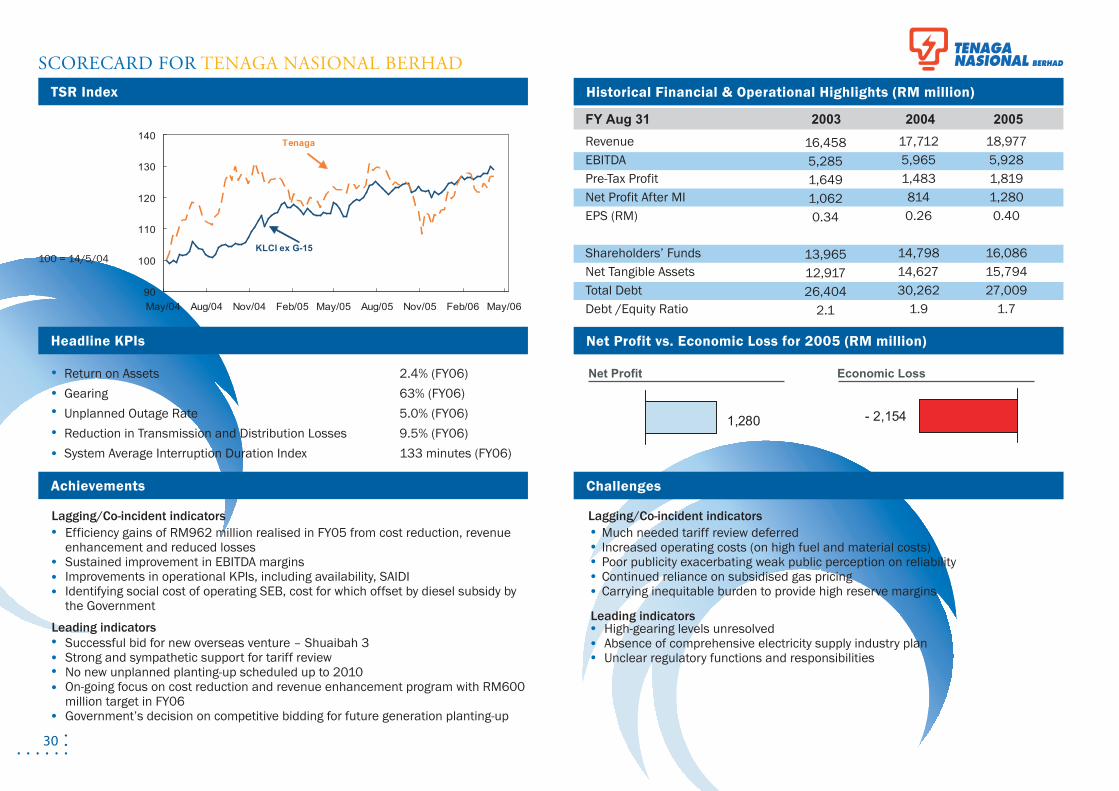
Lagging/Co-incident indicatorsEfficiency gains of RM962 million realised in FY05 from cost reduction, revenue enhancement and reduced lossesSustained improvement in EBITDA marginsImprovements in operational KPIs, including availability, SAIDIIdentifying social cost of operating SEB, cost for which offset by diesel subsidy by the Government
Leading indicatorsSuccessful bid for new overseas venture – Shuaibah 3 Strong and sympathetic support for tariff reviewNo new unplanned planting-up scheduled up to 2010On-going focus on cost reduction and revenue enhancement program with RM600 million target in FY06Government’s decision on competitive bidding for future generation planting-up
Leading indicatorsHigh-gearing levels unresolvedAbsence of comprehensive electricity supply industry planUnclear regulatory functions and responsibilities
Lagging/Co-incident indicatorsMuch needed tariff review deferredIncreased operating costs (on high fuel and material costs)Poor publicity exacerbating weak public perception on reliabilityContinued reliance on subsidised gas pricing Carrying inequitable burden to provide high reserve margins
RevenueEBITDA Pre-Tax ProfitNet Profit After MIEPS (RM)
Shareholders’ FundsNet Tangible AssetsTotal DebtDebt /Equity Ratio
FY Aug 31 2003 2004 2005
16,458 5,285 1,649 1,062 0.34
13,965 12,917 26,404
2.1
17,712 5,965 1,483 814 0.26
14,798 14,62730,262
1.9
18,977 5,9281,819 1,280 0.40
16,086 15,794 27,009
1.7
SCORECARD FOR TENAGA NASIONAL BERHAD
Return on Assets 2.4% (FY06)Gearing 63% (FY06)Unplanned Outage Rate 5.0% (FY06)Reduction in Transmission and Distribution Losses 9.5% (FY06)System Average Interruption Duration Index 133 minutes (FY06)
100 = 14/5/04
TSR Index
Net Profit Economic Loss
Headline KPIs
Achievements
90
100
110
120
130
140
May/04 Aug/04 Nov/04 Feb/05 May/05 Aug/05 Nov/05 Feb/06 May/06
Tenaga
KLCI ex G-15
1,280 - 2,154
31
Historical Financial & Operational Highlights (RM million)
Net Loss vs. Economic Loss for 2005 (RM million)
Challenges
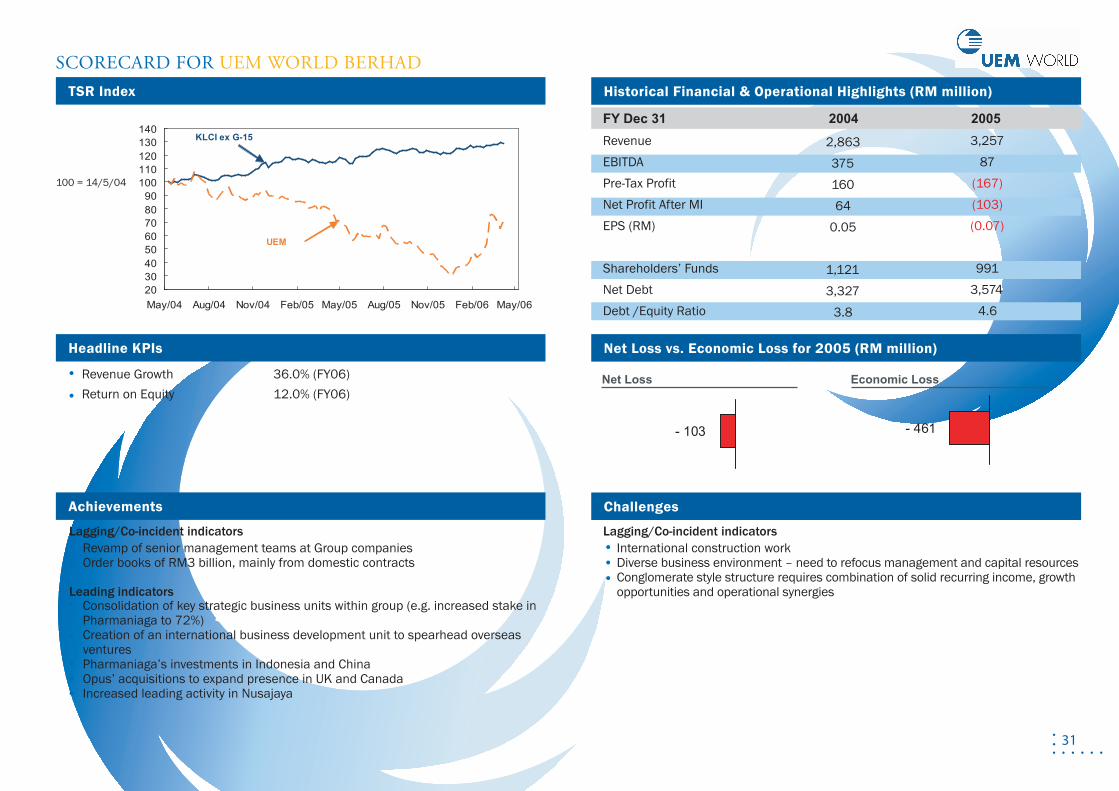
Lagging/Co-incident indicatorsRevamp of senior management teams at Group companiesOrder books of RM3 billion, mainly from domestic contracts
Leading indicatorsConsolidation of key strategic business units within group (e.g. increased stake in Pharmaniaga to 72%)Creation of an international business development unit to spearhead overseas venturesPharmaniaga’s investments in Indonesia and ChinaOpus’ acquisitions to expand presence in UK and CanadaIncreased leading activity in Nusajaya
Lagging/Co-incident indicatorsInternational construction workDiverse business environment – need to refocus management and capital resourcesConglomerate style structure requires combination of solid recurring income, growth opportunities and operational synergies
RevenueEBITDA Pre-Tax ProfitNet Profit After MIEPS (RM)
Shareholders’ FundsNet DebtDebt /Equity Ratio
FY Dec 31 2004 2005
2,86337516064
0.05
1,1213,327
3.8
3,25787
(167)(103)(0.07)
9913,574
4.6
SCORECARD FOR UEM WORLD BERHAD
Revenue Growth 36.0% (FY06)Return on Equity 12.0% (FY06)
100 = 14/5/04
TSR Index
Headline KPIs
Achievements
2030405060708090
100110120130140
May/04 Aug/04 Nov/04 Feb/05 May/05 Aug/05 Nov/05 Feb/06 May/06
UEM
KLCI ex G-15
- 103 - 461
Net Loss Economic Loss


SECTION VCONCLUSIONS
MOMENTUM HAS BEEN GENERATED AND PROGRESS IS ON TRACK, HOWEVER MUCH WORK STILL NEEDS TO BE DONE ..................................................................
The Program is a medium to long-term effort with some early fruits of sustainable improvement coming through in the first three to five years, while full tangible benefits are targeted within ten years to 2015.Steady momentum in executing the Program has been generated.This Scorecard will be published every six months, to primarily track the progress of GLCs in implementing the Program.Close co-operation amongst all stakeholders, including the employees, suppliers, customers, market participants and the Goverment will be vital in ensuring success of the Program.
34
TSR performanceLaunch of InitiativesFeedback on Initiatives launched
Progress of execution across GLICsReadiness for execution
G-15 implementation on InitiativesNon G-15 GLCs achievements and challengesNon G-15 GLCs Headline KPIsProgress against Headlines KPIs achieved
Program-Wide Level
GLIC Level
GLC Level
WHAT CAN BE EXPECTED IN THE NEXT SCORECARD
. . . . . . . . . . . . . . . . . . . . . . . . . . . . . . . . . . . . . . . . . . . . . . . . . . . . . . . . . . . . . . . . . .
. . . . . . . . . . . . . . . . . . . . . . . . . . . . . . . . . . . . . . . . . . . . . . . . . . . . . . . . . . . . . . . . . .
. . . . . . . . . . . . . . . . . . . . . . . . . . . . . . . . . . . . . . . . . . . . . . . . . . . . . . . . . . . . . . . . . .
35
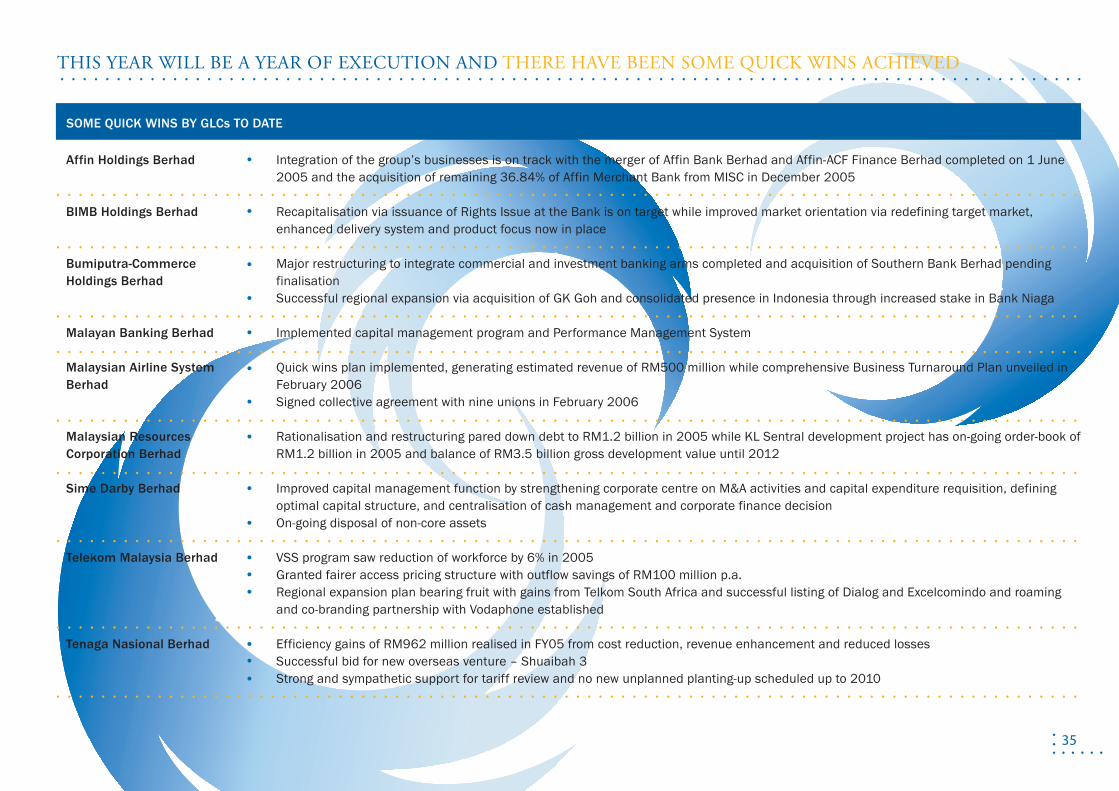
Integration of the group’s businesses is on track with the merger of Affin Bank Berhad and Affin-ACF Finance Berhad completed on 1 June 2005 and the acquisition of remaining 36.84% of Affin Merchant Bank from MISC in December 2005
Recapitalisation via issuance of Rights Issue at the Bank is on target while improved market orientation via redefining target market, enhanced delivery system and product focus now in place
Major restructuring to integrate commercial and investment banking arms completed and acquisition of Southern Bank Berhad pending finalisationSuccessful regional expansion via acquisition of GK Goh and consolidated presence in Indonesia through increased stake in Bank Niaga
Implemented capital management program and Performance Management System
Quick wins plan implemented, generating estimated revenue of RM500 million while comprehensive Business Turnaround Plan unveiled in February 2006Signed collective agreement with nine unions in February 2006
Rationalisation and restructuring pared down debt to RM1.2 billion in 2005 while KL Sentral development project has on-going order-book of RM1.2 billion in 2005 and balance of RM3.5 billion gross development value until 2012
Improved capital management function by strengthening corporate centre on M&A activities and capital expenditure requisition, defining optimal capital structure, and centralisation of cash management and corporate finance decision On-going disposal of non-core assets
VSS program saw reduction of workforce by 6% in 2005Granted fairer access pricing structure with outflow savings of RM100 million p.a.Regional expansion plan bearing fruit with gains from Telkom South Africa and successful listing of Dialog and Excelcomindo and roaming and co-branding partnership with Vodaphone established
Efficiency gains of RM962 million realised in FY05 from cost reduction, revenue enhancement and reduced lossesSuccessful bid for new overseas venture – Shuaibah 3 Strong and sympathetic support for tariff review and no new unplanned planting-up scheduled up to 2010
Affin Holdings Berhad
BIMB Holdings Berhad
Bumiputra-Commerce Holdings Berhad
Malayan Banking Berhad
Malaysian Airline System Berhad
Malaysian Resources Corporation Berhad
Sime Darby Berhad
Telekom Malaysia Berhad
Tenaga Nasional Berhad
SOME QUICK WINS BY GLCs TO DATE
. . . . . . . . . . . . . . . . . . . . . . . . . . . . . . . . . . . . . . . . . . . . . . . . . . . . . . . . . . . . . . . . . . . . . . . . . . . . . . . . . . . . . . . . . . .
. . . . . . . . . . . . . . . . . . . . . . . . . . . . . . . . . . . . . . . . . . . . . . . . . . . . . . . . . . . . . . . . . . . . . . . . . . . . . . . . . . . . . . . . . . .
. . . . . . . . . . . . . . . . . . . . . . . . . . . . . . . . . . . . . . . . . . . . . . . . . . . . . . . . . . . . . . . . . . . . . . . . . . . . . . . . . . . . . . . . . . .
. . . . . . . . . . . . . . . . . . . . . . . . . . . . . . . . . . . . . . . . . . . . . . . . . . . . . . . . . . . . . . . . . . . . . . . . . . . . . . . . . . . . . . . . . . .
. . . . . . . . . . . . . . . . . . . . . . . . . . . . . . . . . . . . . . . . . . . . . . . . . . . . . . . . . . . . . . . . . . . . . . . . . . . . . . . . . . . . . . . . . . .
. . . . . . . . . . . . . . . . . . . . . . . . . . . . . . . . . . . . . . . . . . . . . . . . . . . . . . . . . . . . . . . . . . . . . . . . . . . . . . . . . . . . . . . . . . .
. . . . . . . . . . . . . . . . . . . . . . . . . . . . . . . . . . . . . . . . . . . . . . . . . . . . . . . . . . . . . . . . . . . . . . . . . . . . . . . . . . . . . . . . . . .
. . . . . . . . . . . . . . . . . . . . . . . . . . . . . . . . . . . . . . . . . . . . . . . . . . . . . . . . . . . . . . . . . . . . . . . . . . . . . . . . . . . . . . . . . . .
. . . . . . . . . . . . . . . . . . . . . . . . . . . . . . . . . . . . . . . . . . . . . . . . . . . . . . . . . . . . . . . . . . . . . . . . . . . . . . . . . . . . . . . . . . .
THIS YEAR WILL BE A YEAR OF EXECUTION AND THERE HAVE BEEN SOME QUICK WINS ACHIEVED ...........................................................................................


SECTION VIAPPENDICES
38
GLOSSARY OF TERMS AND DEFINITIONS
GLCs
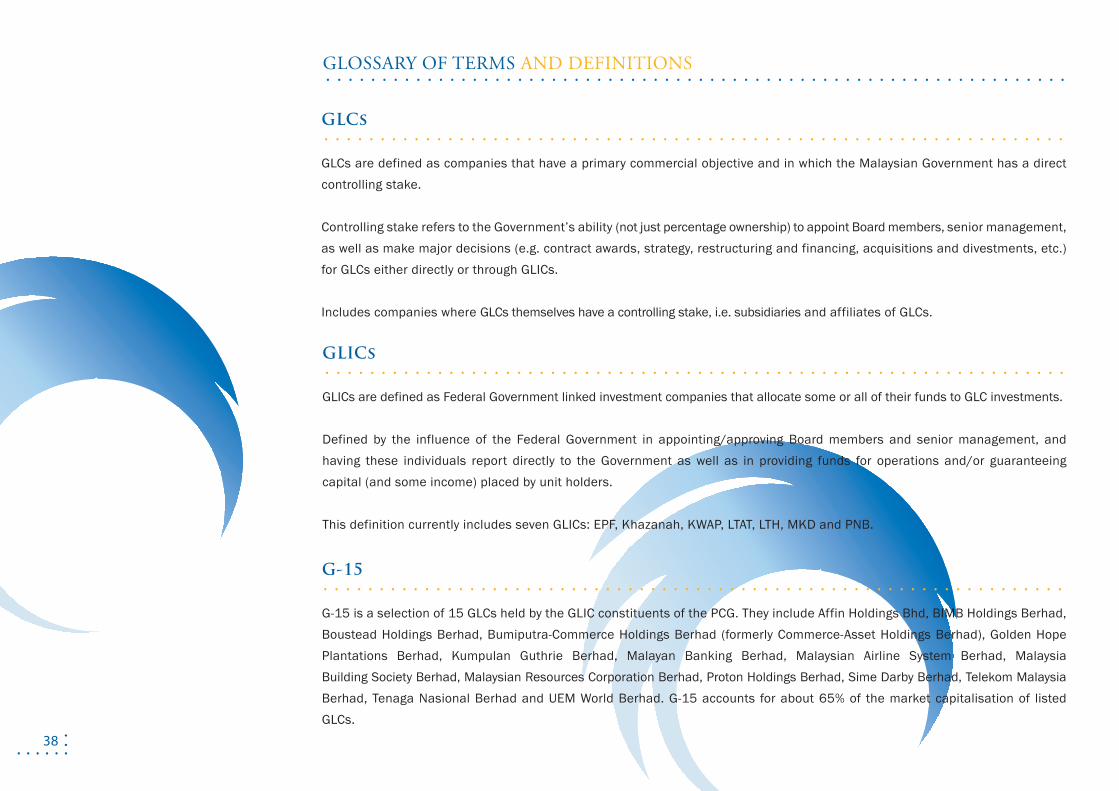
GLCs are defined as companies that have a primary commercial objective and in which the Malaysian Government has a direct controlling stake.
Controlling stake refers to the Government’s ability (not just percentage ownership) to appoint Board members, senior management, as well as make major decisions (e.g. contract awards, strategy, restructuring and financing, acquisitions and divestments, etc.) for GLCs either directly or through GLICs.
Includes companies where GLCs themselves have a controlling stake, i.e. subsidiaries and affiliates of GLCs.
GLICs
GLICs are defined as Federal Government linked investment companies that allocate some or all of their funds to GLC investments.
Defined by the influence of the Federal Government in appointing/approving Board members and senior management, and having these individuals report directly to the Government as well as in providing funds for operations and/or guaranteeing capital (and some income) placed by unit holders.
This definition currently includes seven GLICs: EPF, Khazanah, KWAP, LTAT, LTH, MKD and PNB.
G-15
G-15 is a selection of 15 GLCs held by the GLIC constituents of the PCG. They include Affin Holdings Bhd, BIMB Holdings Berhad, Boustead Holdings Berhad, Bumiputra-Commerce Holdings Berhad (formerly Commerce-Asset Holdings Berhad), Golden Hope Plantations Berhad, Kumpulan Guthrie Berhad, Malayan Banking Berhad, Malaysian Airline System Berhad, Malaysia Building Society Berhad, Malaysian Resources Corporation Berhad, Proton Holdings Berhad, Sime Darby Berhad, Telekom Malaysia Berhad, Tenaga Nasional Berhad and UEM World Berhad. G-15 accounts for about 65% of the market capitalisation of listed GLCs.
..................................................................
..................................................................
..................................................................
..................................................................
39
INDICATORS
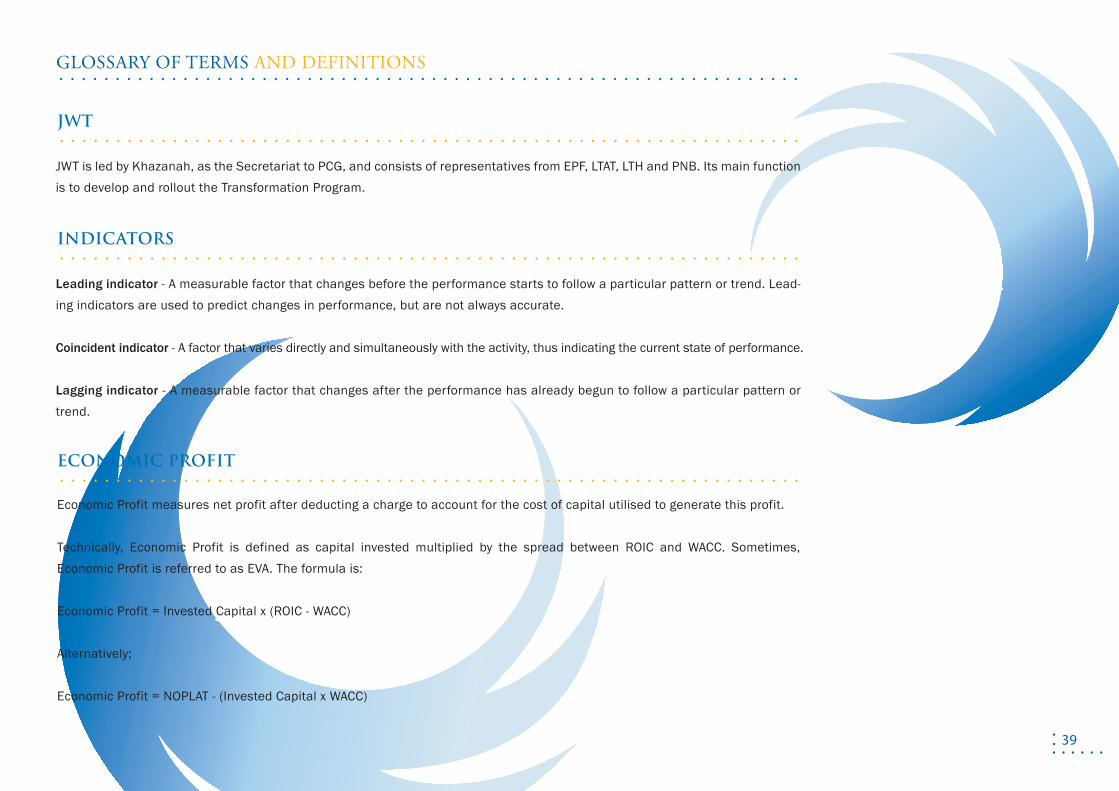
Leading indicator - A measurable factor that changes before the performance starts to follow a particular pattern or trend. Lead-ing indicators are used to predict changes in performance, but are not always accurate.
Coincident indicator - A factor that varies directly and simultaneously with the activity, thus indicating the current state of performance.
Lagging indicator - A measurable factor that changes after the performance has already begun to follow a particular pattern or trend.
..................................................................
JWT
JWT is led by Khazanah, as the Secretariat to PCG, and consists of representatives from EPF, LTAT, LTH and PNB. Its main function is to develop and rollout the Transformation Program.
..................................................................
..................................................................
ECONOMIC PROFIT
Economic Profit measures net profit after deducting a charge to account for the cost of capital utilised to generate this profit.
Technically, Economic Profit is defined as capital invested multiplied by the spread between ROIC and WACC. Sometimes, Economic Profit is referred to as EVA. The formula is:
Economic Profit = Invested Capital x (ROIC - WACC)
Alternatively;
Economic Profit = NOPLAT - (Invested Capital x WACC)
..................................................................
GLOSSARY OF TERMS AND DEFINITIONS
40
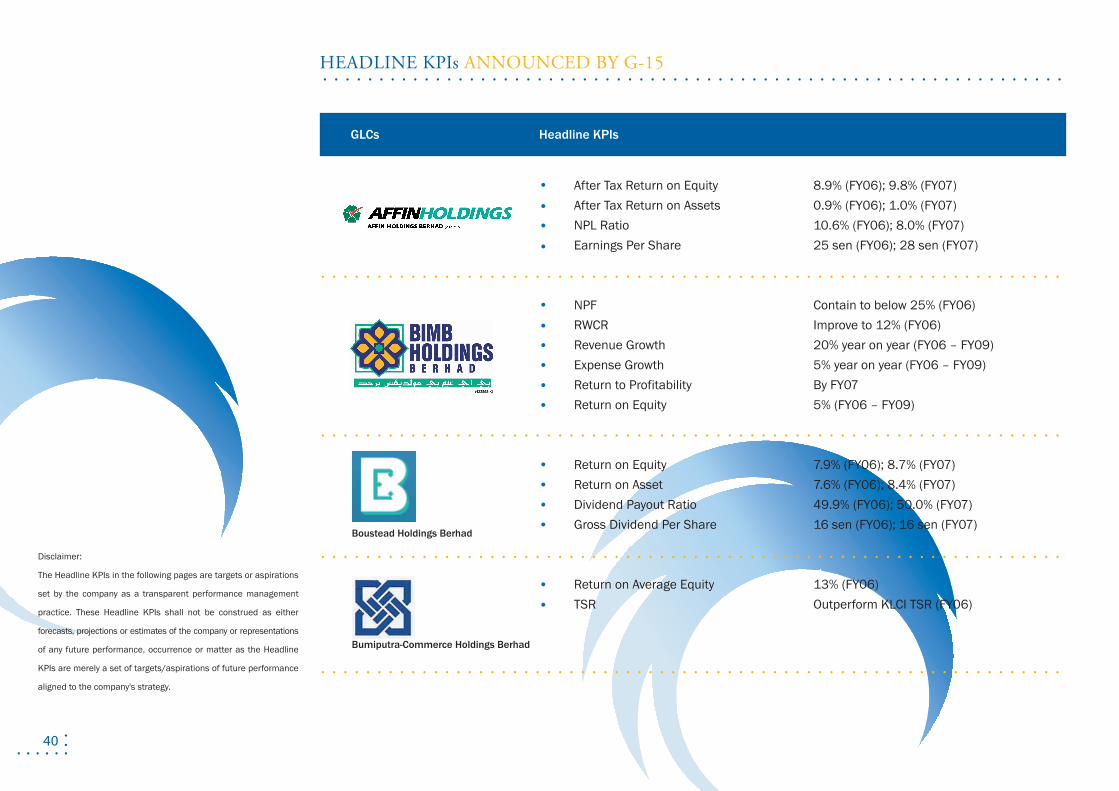
HEADLINE KPIs ANNOUNCED BY G-15
..................................................................
After Tax Return on Equity 8.9% (FY06); 9.8% (FY07) After Tax Return on Assets 0.9% (FY06); 1.0% (FY07) NPL Ratio 10.6% (FY06); 8.0% (FY07) Earnings Per Share 25 sen (FY06); 28 sen (FY07)
NPF Contain to below 25% (FY06) RWCR Improve to 12% (FY06) Revenue Growth 20% year on year (FY06 – FY09) Expense Growth 5% year on year (FY06 – FY09) Return to Profitability By FY07 Return on Equity 5% (FY06 – FY09)
Return on Equity 7.9% (FY06); 8.7% (FY07) Return on Asset 7.6% (FY06); 8.4% (FY07) Dividend Payout Ratio 49.9% (FY06); 50.0% (FY07) Gross Dividend Per Share 16 sen (FY06); 16 sen (FY07)
Return on Average Equity 13% (FY06) TSR Outperform KLCI TSR (FY06)
GLCs Headline KPIs
. . . . . . . . . . . . . . . . . . . . . . . . . . . . . . . . . . . . . . . . . . . . . . . . . . . . . . . . . . . . . . . . . .
. . . . . . . . . . . . . . . . . . . . . . . . . . . . . . . . . . . . . . . . . . . . . . . . . . . . . . . . . . . . . . . . . .
. . . . . . . . . . . . . . . . . . . . . . . . . . . . . . . . . . . . . . . . . . . . . . . . . . . . . . . . . . . . . . . . . .
. . . . . . . . . . . . . . . . . . . . . . . . . . . . . . . . . . . . . . . . . . . . . . . . . . . . . . . . . . . . . . . . . .
Boustead Holdings Berhad
Bumiputra-Commerce Holdings Berhad
Disclaimer:
The Headline KPIs in the following pages are targets or aspirations
set by the company as a transparent performance management
practice. These Headline KPIs shall not be construed as either
forecasts, projections or estimates of the company or representations
of any future performance, occurrence or matter as the Headline
KPIs are merely a set of targets/aspirations of future performance
aligned to the company's strategy.
41
Disclaimer:
The Headline KPIs in the following pages are targets or aspirations
set by the company as a transparent performance management
practice. These Headline KPIs shall not be construed as either
forecasts, projections or estimates of the company or representations
of any future performance, occurrence or matter as the Headline
KPIs are merely a set of targets/aspirations of future performance
aligned to the company's strategy.
..................................................................
GLCs Headline KPIs
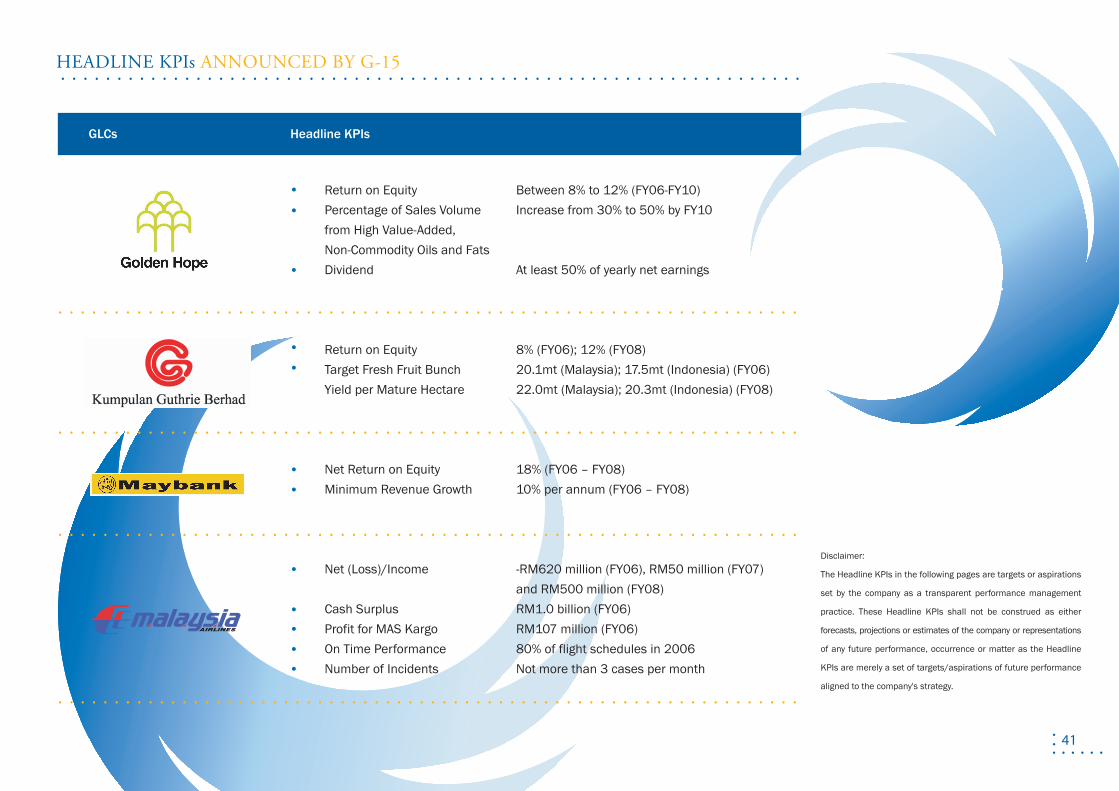
Return on Equity Between 8% to 12% (FY06-FY10) Percentage of Sales Volume Increase from 30% to 50% by FY10 from High Value-Added, Non-Commodity Oils and Fats Dividend At least 50% of yearly net earnings
Return on Equity 8% (FY06); 12% (FY08) Target Fresh Fruit Bunch 20.1mt (Malaysia); 17.5mt (Indonesia) (FY06) Yield per Mature Hectare 22.0mt (Malaysia); 20.3mt (Indonesia) (FY08) Net Return on Equity 18% (FY06 – FY08) Minimum Revenue Growth 10% per annum (FY06 – FY08)
Net (Loss)/Income -RM620 million (FY06), RM50 million (FY07) and RM500 million (FY08) Cash Surplus RM1.0 billion (FY06) Profit for MAS Kargo RM107 million (FY06) On Time Performance 80% of flight schedules in 2006 Number of Incidents Not more than 3 cases per month
. . . . . . . . . . . . . . . . . . . . . . . . . . . . . . . . . . . . . . . . . . . . . . . . . . . . . . . . . . . . . . . . . .
. . . . . . . . . . . . . . . . . . . . . . . . . . . . . . . . . . . . . . . . . . . . . . . . . . . . . . . . . . . . . . . . . .
. . . . . . . . . . . . . . . . . . . . . . . . . . . . . . . . . . . . . . . . . . . . . . . . . . . . . . . . . . . . . . . . . .
. . . . . . . . . . . . . . . . . . . . . . . . . . . . . . . . . . . . . . . . . . . . . . . . . . . . . . . . . . . . . . . . . .
HEADLINE KPIs ANNOUNCED BY G-15
42
HEADLINE KPIs ANNOUNCED BY G-15
..................................................................
GLCs Headline KPIs
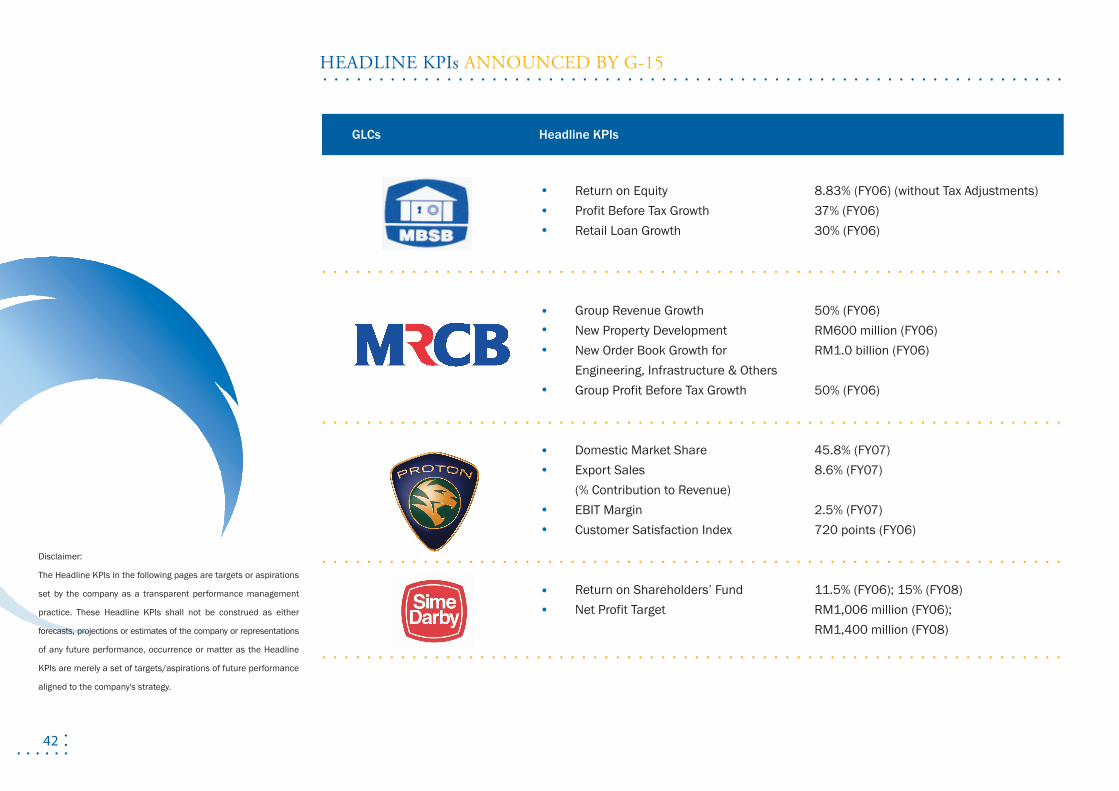
Return on Equity 8.83% (FY06) (without Tax Adjustments) Profit Before Tax Growth 37% (FY06) Retail Loan Growth 30% (FY06)
Group Revenue Growth 50% (FY06) New Property Development RM600 million (FY06) New Order Book Growth for RM1.0 billion (FY06) Engineering, Infrastructure & Others Group Profit Before Tax Growth 50% (FY06)
Domestic Market Share 45.8% (FY07) Export Sales 8.6% (FY07) (% Contribution to Revenue) EBIT Margin 2.5% (FY07) Customer Satisfaction Index 720 points (FY06) Return on Shareholders’ Fund 11.5% (FY06); 15% (FY08) Net Profit Target RM1,006 million (FY06); RM1,400 million (FY08)
. . . . . . . . . . . . . . . . . . . . . . . . . . . . . . . . . . . . . . . . . . . . . . . . . . . . . . . . . . . . . . . . . .
. . . . . . . . . . . . . . . . . . . . . . . . . . . . . . . . . . . . . . . . . . . . . . . . . . . . . . . . . . . . . . . . . .
. . . . . . . . . . . . . . . . . . . . . . . . . . . . . . . . . . . . . . . . . . . . . . . . . . . . . . . . . . . . . . . . . .
. . . . . . . . . . . . . . . . . . . . . . . . . . . . . . . . . . . . . . . . . . . . . . . . . . . . . . . . . . . . . . . . . .
Disclaimer:
The Headline KPIs in the following pages are targets or aspirations
set by the company as a transparent performance management
practice. These Headline KPIs shall not be construed as either
forecasts, projections or estimates of the company or representations
of any future performance, occurrence or matter as the Headline
KPIs are merely a set of targets/aspirations of future performance
aligned to the company's strategy.
43
..................................................................
GLCs Headline KPIs
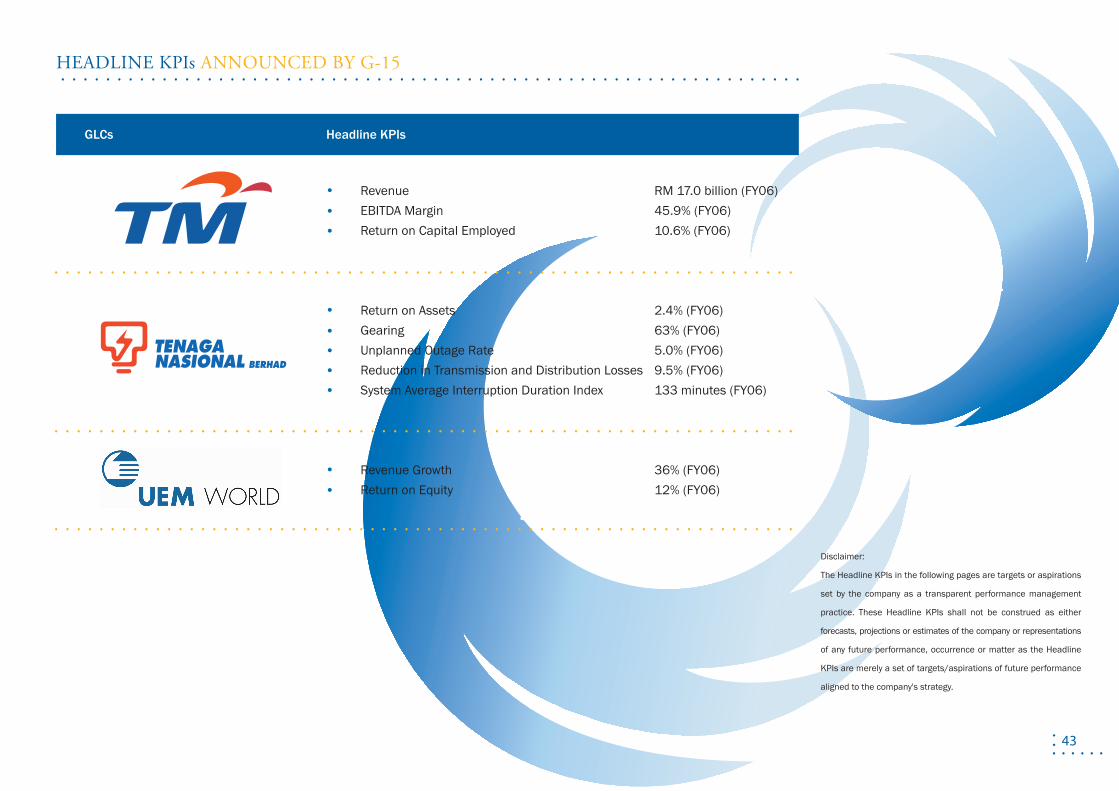
Revenue RM 17.0 billion (FY06) EBITDA Margin 45.9% (FY06) Return on Capital Employed 10.6% (FY06)
Return on Assets 2.4% (FY06) Gearing 63% (FY06) Unplanned Outage Rate 5.0% (FY06) Reduction in Transmission and Distribution Losses 9.5% (FY06) System Average Interruption Duration Index 133 minutes (FY06)
Revenue Growth 36% (FY06) Return on Equity 12% (FY06)
. . . . . . . . . . . . . . . . . . . . . . . . . . . . . . . . . . . . . . . . . . . . . . . . . . . . . . . . . . . . . . . . . .
. . . . . . . . . . . . . . . . . . . . . . . . . . . . . . . . . . . . . . . . . . . . . . . . . . . . . . . . . . . . . . . . . .
. . . . . . . . . . . . . . . . . . . . . . . . . . . . . . . . . . . . . . . . . . . . . . . . . . . . . . . . . . . . . . . . . .
HEADLINE KPIs ANNOUNCED BY G-15
Disclaimer:
The Headline KPIs in the following pages are targets or aspirations
set by the company as a transparent performance management
practice. These Headline KPIs shall not be construed as either
forecasts, projections or estimates of the company or representations
of any future performance, occurrence or matter as the Headline
KPIs are merely a set of targets/aspirations of future performance
aligned to the company's strategy.


Notes

Putrajaya Committee on GLC High Performance (PCG)Transformation Management Office,Level 37, Tower 2, Petronas Twin Towers,Kuala Lumpur City Centre, 50088 Kuala Lumpur, MalaysiaTel: (03) 2034 0000 Fax: (03) 2034 0008Email: [email protected] Website: www.pcg.gov.my