Embed Size (px)
Citation preview
22-1-02953-002-R1_03.05.2013.docx/wp/lkn 22-1-02953-002 i
TABLE OF CONTENTS
Page
1.0 INTRODUCTION ..................................................................................................................1 1.1 Purpose .......................................................................................................................1 1.2 Scope of Work ............................................................................................................1
2.0 PROJECT LOCATION AND DESCRIPTION .....................................................................1
3.0 EXISTING BRIDGE STRUCTURE AND PROPOSED IMPROVEMENTS......................2
4.0 EXPLORATIONS AND LABORATORY TESTING ..........................................................3 4.1 Drilling .......................................................................................................................3 4.2 Laboratory Testing .....................................................................................................4
5.0 GEOLOGY AND SUBSURFACE CONDITIONS ...............................................................5 5.1 Regional and Site Geology .........................................................................................5 5.2 Subsurface Conditions ................................................................................................6 5.3 Groundwater ...............................................................................................................6
6.0 GEOLOGIC HAZARDS ........................................................................................................7 6.1 Scour ...........................................................................................................................7 6.2 Earthquake-Induced Geologic Hazards ......................................................................7
7.0 ENGINEERING CONCLUSIONS ........................................................................................8 7.1 Foundation Alternatives .............................................................................................8 7.2 Driven Pipe Pile Design .............................................................................................9
7.2.1 Geotechnical Pile Compressive Resistance .................................................9 7.2.2 Estimated Settlement .................................................................................10 7.2.3 Lateral Pile Load Capacity.........................................................................10 7.2.4 Pile Installation Construction Considerations ............................................13
7.3 Bridge Abutment and Wingwall Design ..................................................................14 7.3.1 General .......................................................................................................14 7.3.2 Subdrainage................................................................................................14 7.3.3 Backfill Material and Compaction .............................................................14 7.3.4 Lateral Earth Pressures ..............................................................................14 7.3.5 Lateral Resistances.....................................................................................15
7.4 Seismic Design Criteria ............................................................................................15
8.0 CONSTRUCTION CONSIDERATIONS ...........................................................................16 8.1 Construction Practices ..............................................................................................16 8.2 Earthwork .................................................................................................................16 8.3 Excavations/Slopes ...................................................................................................17
TABLE OF CONTENTS (cont.)
Page
22-1-02953-002-R1_03.05.2013.docx/wp/lkn 22-1-02953-002 ii
8.4 Retaining Structures .................................................................................................18 8.5 Wet Weather and Conditions ...................................................................................18 8.6 Excavation Cofferdam and Groundwater Control....................................................19 8.7 Plan Review and Construction Observation .............................................................19
9.0 LIMITATIONS ....................................................................................................................20
10.0 REFERENCES .....................................................................................................................22
TABLES
1 Geotechnical Input Parameters for Lateral Pile Resistance Analysis Using LPILE® ...................................................................................................................10
2 Geotechnical Input Parameters for Lateral Pile Resistance Analysis Using LPILE® ...................................................................................................................11
3 AASHTO Seismic Design Parameters...................................................................20
FIGURES
1 Vicinity Map 2 Site and Exploration Plan 3 Generalized Cross-Section A-A’ 4 Estimated Axial Pile Resistance: Closed-End, Steel PP24 x 0.375 (B-1) 5 Estimated Axial Pile Resistance: Closed-End, Steel PP24 x 0.375 (B-2) 6 Static Lateral Earth Pressure Distribution on Abutment Walls
APPENDICES
A Exploratory Boring Logs B Laboratory Test Results C Important Information About Your Geotechnical Report
22-1-02953-002-R1_03.05.2013.docx/wp/lkn 22-1-02953-002 1
GEOTECHNICAL ENGINEERING STUDY LITTLE NESPELEM RIVER (BUFFALO LAKE ROAD SOUTH)
BRIDGE REPLACEMENT OKANOGAN COUNTY, WASHINGTON
1.0 INTRODUCTION
1.1 Purpose
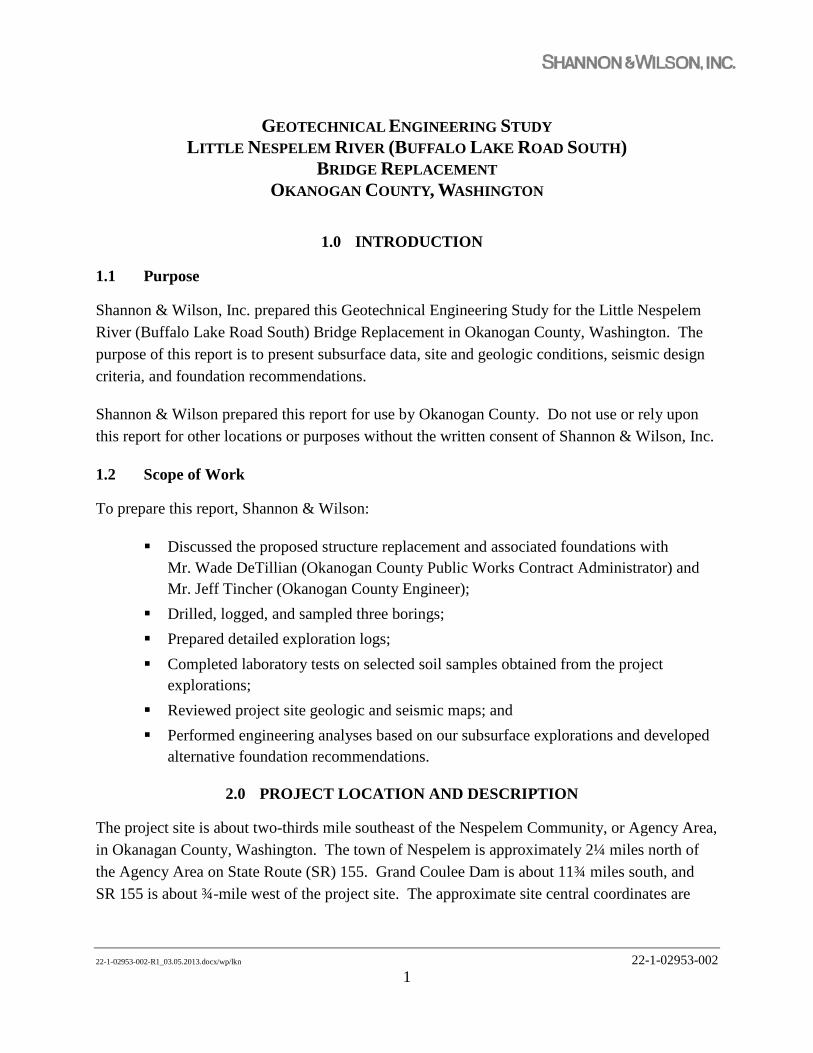
Shannon & Wilson, Inc. prepared this Geotechnical Engineering Study for the Little Nespelem River (Buffalo Lake Road South) Bridge Replacement in Okanogan County, Washington. The purpose of this report is to present subsurface data, site and geologic conditions, seismic design criteria, and foundation recommendations.
Shannon & Wilson prepared this report for use by Okanogan County. Do not use or rely upon this report for other locations or purposes without the written consent of Shannon & Wilson, Inc.
1.2 Scope of Work
To prepare this report, Shannon & Wilson:
Discussed the proposed structure replacement and associated foundations with Mr. Wade DeTillian (Okanogan County Public Works Contract Administrator) and Mr. Jeff Tincher (Okanogan County Engineer);
Drilled, logged, and sampled three borings; Prepared detailed exploration logs; Completed laboratory tests on selected soil samples obtained from the project
explorations; Reviewed project site geologic and seismic maps; and Performed engineering analyses based on our subsurface explorations and developed
alternative foundation recommendations.
2.0 PROJECT LOCATION AND DESCRIPTION
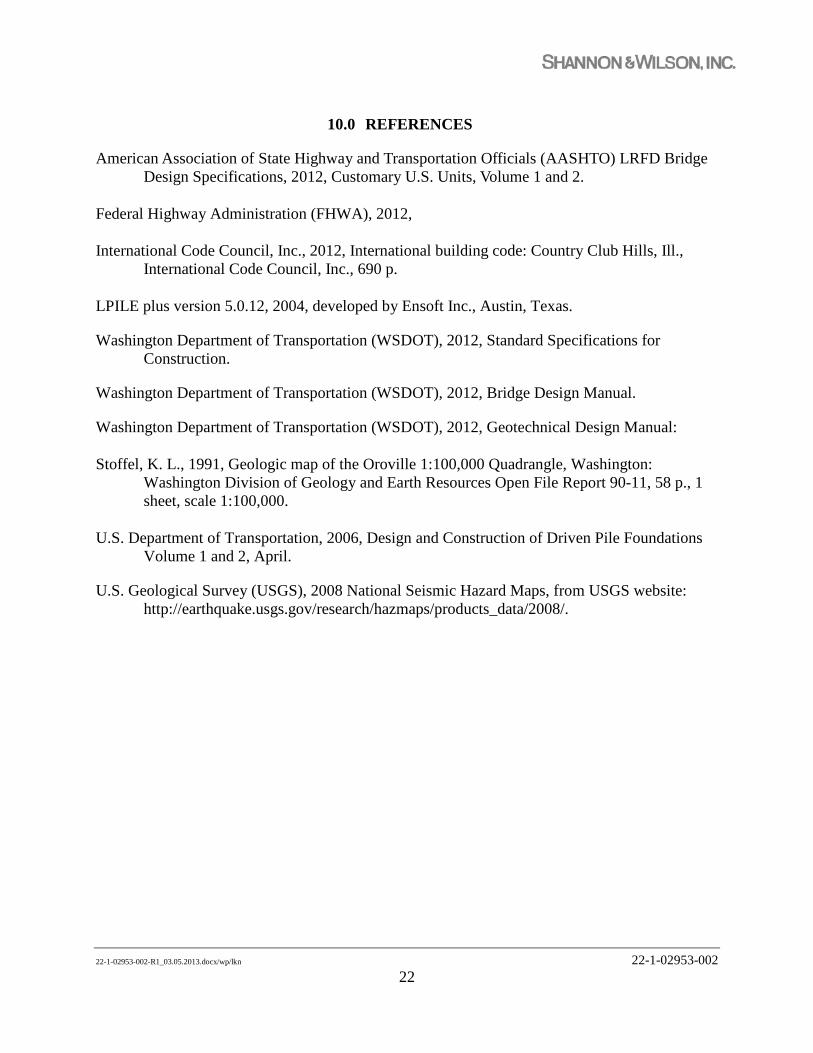
The project site is about two-thirds mile southeast of the Nespelem Community, or Agency Area, in Okanagan County, Washington. The town of Nespelem is approximately 2¼ miles north of the Agency Area on State Route (SR) 155. Grand Coulee Dam is about 11¾ miles south, and SR 155 is about ¾-mile west of the project site. The approximate site central coordinates are
22-1-02953-002-R1_03.05.2013.docx/wp/lkn 22-1-02953-002 2
48.1251 degrees north latitude, 118.9619 degrees west longitude. We show the general site location in Figure 1 (Vicinity Map).
Published quad maps indicate the general project area lies within the (“so called”) Little Nespelem River (LNR) valley. The valley is generally surrounded from the northwest to southeast (clockwise) by peaks and ridges of the Okanogan National Forest. The LNR generally flows northeast to southwest, originating approximately 7⅓ miles northeast of the project site at Owhi Lake.
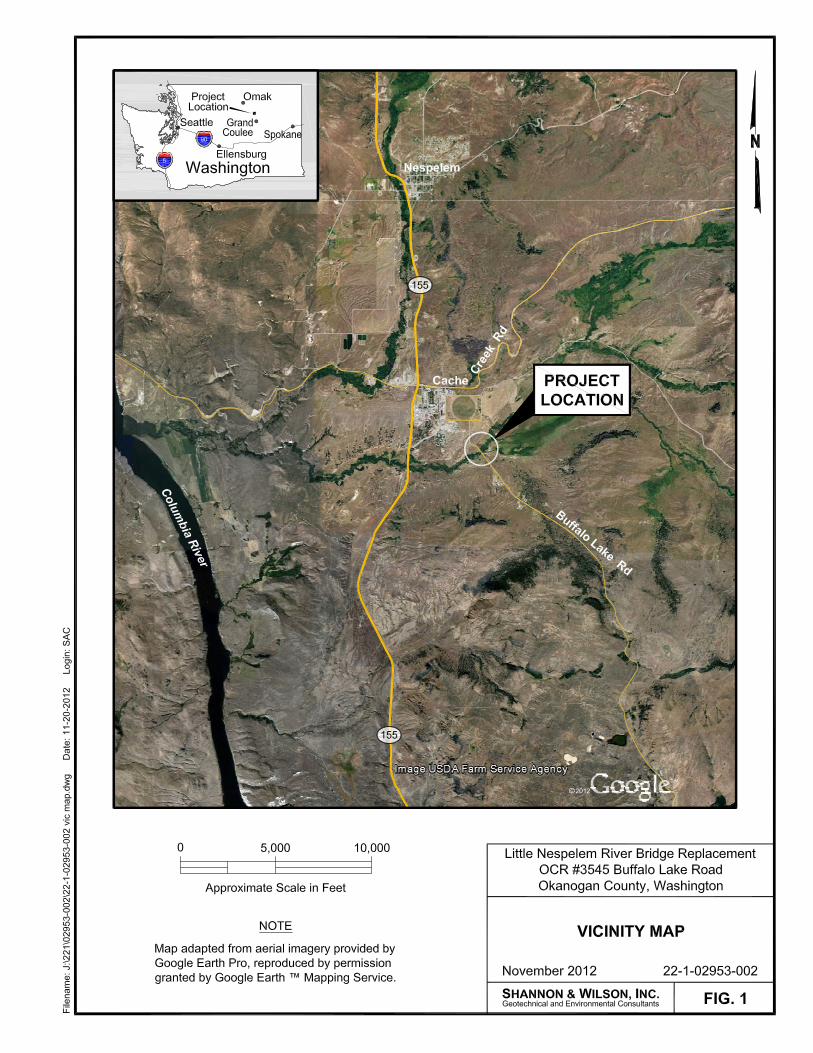
Project site topography provided by the County indicates the LNR banks range from near vertical to about 1 Horizontal to 1 Vertical (1H:1V) to 1½H:1V slopes. The creek bottom is approximately 15 feet, or greater, below roadway grades. The LNR is approximately 15 feet wide at the bridge downstream side, and approximately 28 feet wide at the bridge upstream side at the time of our fieldwork. Medium to large trees, brush, and weeds line the LNR bank slopes and floodplain. We show the site topography in Figure 2 (Site and Exploration Plan).
3.0 EXISTING BRIDGE STRUCTURE AND PROPOSED IMPROVEMENTS
The existing 51-foot bridge carries Buffalo Lake Road South across the Little Nespelem River. The bridge includes a mid-stream wooden cross-beam supported on wooden support pillars. We anticipate the interior bent is supported on wooden piles. Load restrictions were placed on the bridge in 2010 because of its deteriorating condition. The bridge is located in an environmentally and culturally sensitive area.
The bridge replacement consists of constructing an approximately 60-foot single-span bridge, including new abutments and approaches, at or near the existing horizontal alignment. We anticipate the new bridge deck elevation will remain at or near the existing vertical alignment (1753.8 feet above mean sea level [MSL]). Early planning considered supporting the bridge deck on a geosynthetic reinforced soil-integrated bridge system (GRS-IBS) or deep foundations.
Hammond Collier Wade Livingstone (HCWL) prepared the August 4, 2011 Predesign Technical Information Report: Hydraulic Analysis and Design Recommendations to analyze the LNR 100-year flow (cubic feet per second [cfs]) and flood elevation at the project site, and provide preliminary bridge replacement options. HCWL reported the 100-year flow as approximately 1,740 cfs at 7.2-foot depth, and reaching approximate elevation 1747 feet, resulting in an
22-1-02953-002-R1_03.05.2013.docx/wp/lkn 22-1-02953-002 3
approximately 35-foot-wide river channel at the surface water elevation. The report suggested a free-span bridge structure, dual arch-culverts, or box culvert as potential replacement options. The HCWL report did not include a 100-year event scour elevation.
Shannon & Wilson completed a scour analysis for the bridge site as part of this geotechnical engineering study. Our analysis estimates the 100-year event peak flow at 2418 cfs resulting in a water surface elevation of 1748.1 feet.
4.0 EXPLORATIONS AND LABORATORY TESTING
Shannon & Wilson completed the following exploration and laboratory testing tasks.
1. Drilled, logged, and sampled three exploratory borings. 2. Laboratory testing of selected soil samples.
4.1 Drilling
Shannon & Wilson completed drilling at the site from September 27 through October 1, 2012, and October 13 - 14, 2012. We planned our exploration locations based on the proposed improvements. In the field, we located our explorations by measuring from existing site features. We show the approximate exploration locations in Figure 2 (Site and Exploration Plan).
The initial drilling subcontractor (Johnson Exploration Drilling, Inc., Rathdrum, Idaho) drilled boring B-3 with a Mobile B-53 truck-mounted drill rig, using an approximately 4-inch-diameter casing advancer system (TUBEX) with air-rotary drilling techniques. We generally obtained disturbed soil samples at approximately 2½-foot intervals in the upper 35 feet, and 5-foot intervals thereafter using a 2.0-inch outside diameter (O.D.) Standard Penetration Test (SPT) sampler. We conducted SPT testing in general accordance with ASTM International (ASTM) Designation: D 1586, Test Method for Penetration Test and Split-Barrel Sampling of Soil. Drive samples were generally driven 18 inches (three 6-inch increments) below the casing with a rope-and-cathead (manual) operated hammer, weighing 140 pounds and free-falling 30 inches.
The second drilling subcontractor (HazTech Drilling, Inc., Meridian, Idaho) drilled borings B-1 and B-2 with a CME 75 truck-mounted drill rig, using approximately 3¼-inch diameter equipment with open-hole mud-rotary drilling techniques. We generally obtained disturbed soil
22-1-02953-002-R1_03.05.2013.docx/wp/lkn 22-1-02953-002 4
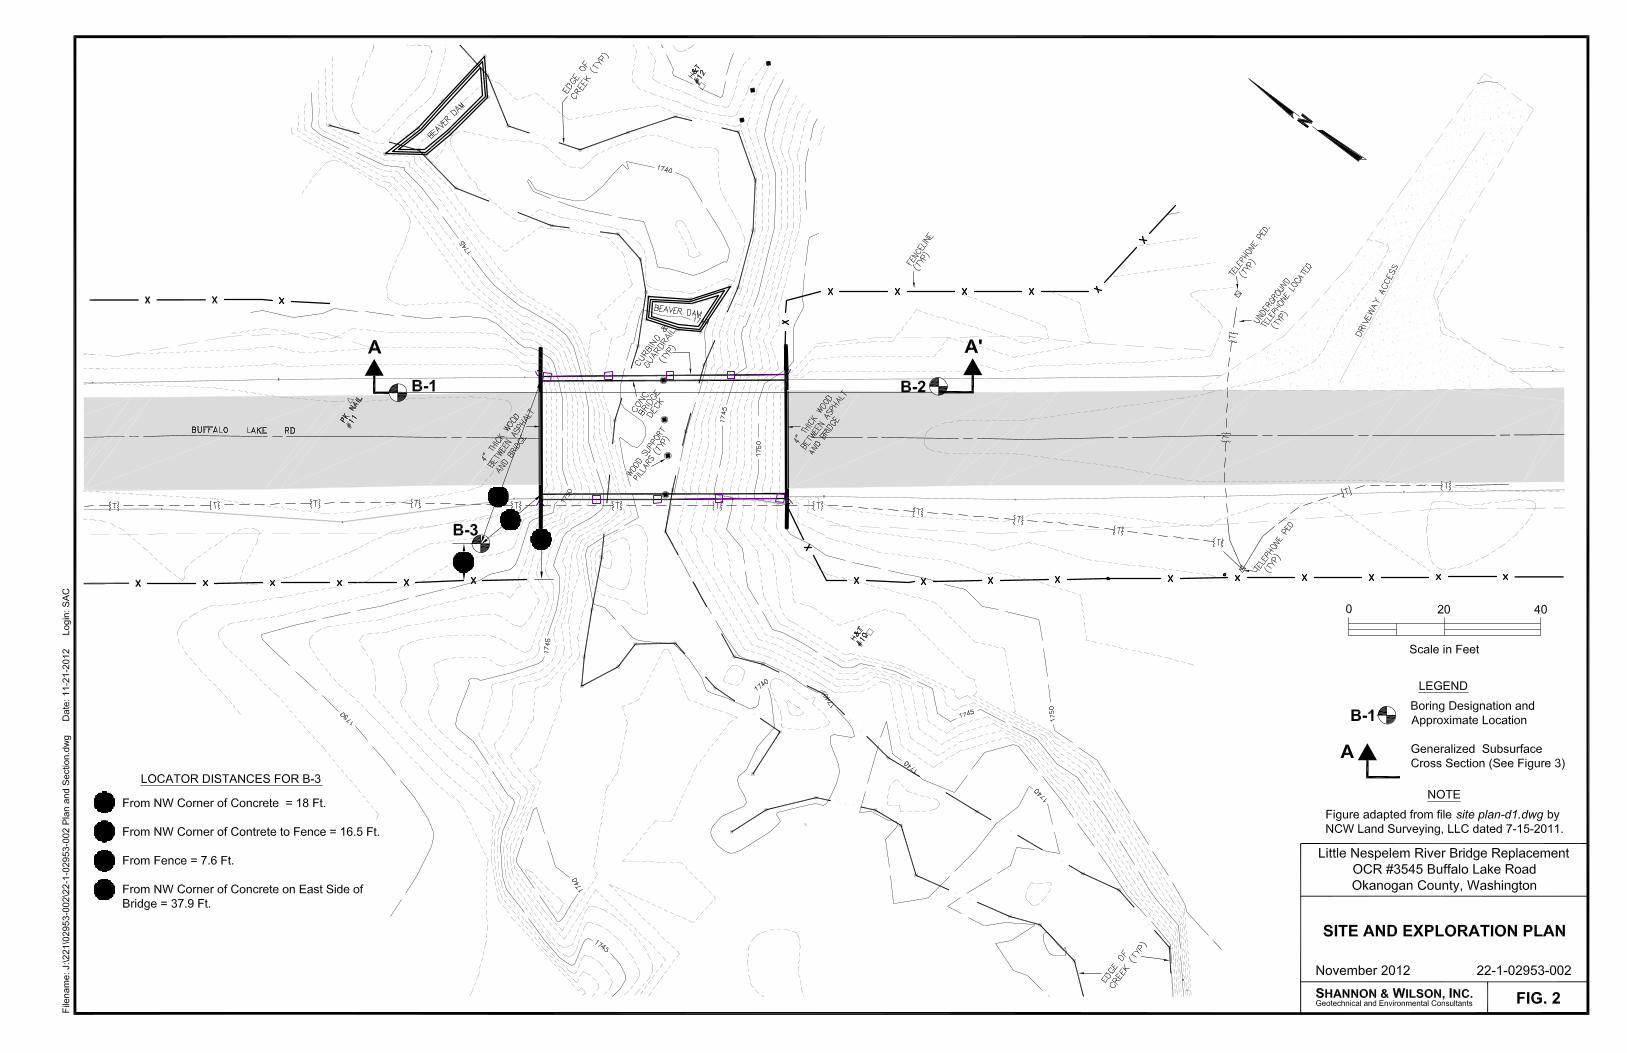
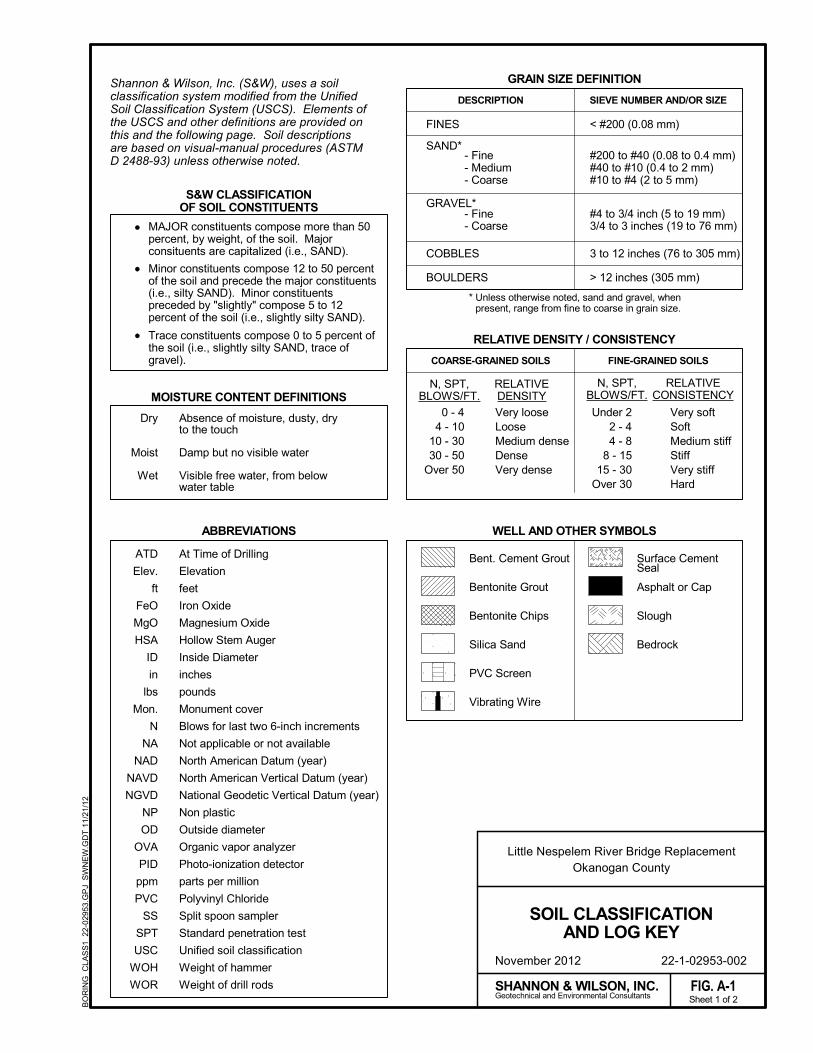
samples at approximately 2½-foot intervals in the upper 40 feet, and 5-foot intervals thereafter using either a 2.0-inch O.D. SPT or approximately 3.0-inch O.D. Shelby tube sampler. We conducted SPT testing in general accordance with ASTM D 1586. Drive samples were generally driven 18 inches (three 6-inch increments) into undisturbed materials with an automatic hammer, weighing 140 pounds and free-falling 30 inches. We present the boring logs in Appendix A. Subsurface soil conditions are described below and illustrated in Figure 3, Generalized Subsurface Profile A-A'.
A Shannon & Wilson engineer observed and logged the explorations, directed the sampling, and obtained samples for manual-visual classification and laboratory testing. Our field representative placed drive samples into sealed and labeled plastic jars and/or ziplock bags. We sealed and wrapped Shelby tube sample ends and transported them in a vertical orientation.
We recorded the number of blows required to advance the split-spoon through each 6-inch increment. The SPT resistance, or N-value, is defined as the number of blows required to drive the sampler from 6 to 18 inches below the drill casing. The N-value is reported as the number of blows per 1 foot of penetration. When 50 blows are required to achieve penetration of 6 inches or less, we halt testing and record the number of blows with the corresponding penetration. The N-value provides an indication of the relative density, or consistency, of the soil and is plotted on the boring logs.
We estimated strata boundaries in the field based on the drill action and disturbed samples (i.e., SPT drive samples, drill cuttings, etc.), as appropriate. The subsurface conditions are known only at exploration locations on the dates explored and should be considered approximate. Actual subsurface conditions may vary between explorations and within the general vicinity of the proposed improvements.
4.2 Laboratory Testing
We completed the following laboratory tests on representative soil samples obtained from the exploratory borings.
Water Content (ASTM D 2216).
Particle Size Analysis (ASTM D 422 and ASTM D 1140).
Atterberg Limits (ASTM D 4318).
22-1-02953-002-R1_03.05.2013.docx/wp/lkn 22-1-02953-002 5
Laboratory test results are presented in Appendix B.
5.0 GEOLOGY AND SUBSURFACE CONDITIONS
5.1 Regional and Site Geology
Based on the Geologic Map of Washington – Northeast Quadrant, (Stoffel, et. al, 1991), the project vicinity geology consists of, from youngest to oldest:
Young Little Nespelem River alluvial deposits of silt, sand and gravel (Qa); Older, glacial drift deposits of silt, sand, gravel and cobbles, with varying amounts of
clay (Qgd); and Grande Ronde Basalt of the Columbia River Basalt Group (Mvg).
Grande Ronde Basalt of the Columbia River Basalt Group (Mv) is mapped along the base of the hills in the vicinity of the bridge site. The Grande Ronde Basalt member was emplaced between about 15 and 17 million years ago during Miocene time from a series of volcanic vents located in southeast Washington and northeast Oregon. Columbia River Basalt was not encountered in the explorations performed for this study; however it is likely to exist below the glacial soils within the Little Nespelem valley.
On top of the basalt basement rock lies an undifferentiated deposit of Pleistocene glacial drift (Qgd) consisting of silt, sand, gravel and cobbles with minor amounts of clay. The glacial deposits were deposited between about 18,000 and 10,000 years ago by the last continental glaciation [time equivalent to the Fraser (western Washington) and late Wisconsin (mid-continent]. Various depositional environments existed at the margin of the retreating ice, including recessional glaciofluvial, glaciolacustrine, and ice-contact environments. Because the soils were deposited during the retreat or wasting of the last ice advance, they were not overridden by continental ice. Consequently the glacial drift deposits encountered at the site are generally very loose to dense or soft to stiff (normally consolidated). The contact between the overlying recent alluvium (Qa, described below) and the recessional glaciofluvial soils is commonly difficult to precisely determine due to their similar lithology and density.
Recent alluvium (Qa) of the Little Nespelem River overlies the glacial drift soils at the site. Alluvial sediments are those deposited by rivers and streams. These deposits generally consist of coarser-grained channel deposits with interbeds of finer-grained over-bank silt. The grain size
22-1-02953-002-R1_03.05.2013.docx/wp/lkn 22-1-02953-002 6
and degree of sorting of these deposits are related to the stream velocity. Organic fragments are generally more common within the recent alluvium than in the glaciofluvial recessional soils.
Unmapped fill, placed during Buffalo Lake Road South embankment and abutment construction, is also present at the site.
5.2 Subsurface Conditions
In general, subsurface soils encountered at the site consist of 16 to 17 feet of recent, loose to medium dense, silty, SAND overlying older glacial recessional soils consisting of very loose to medium dense, slightly silty to silty, slightly gravelly to gravelly SAND.
Fill soils observed in borings B-2 and B-3 consist of approximately 7 feet of loose to medium dense, silty SAND and fine sandy SILT. The fill soils appeared less dense at the south abutment (B-2); and were generally siltier toward the north (B-3).
Approximately 8 to 10 feet of recent alluvial soils were encountered below the fill soils in borings B-2 and B-3. The alluvium consists of very loose to medium dense, slightly gravelly to gravelly, silty SAND. The top of the alluvium is marked by scattered roots and root holes.
Recessional glacial soils were encountered in all 3 borings below the recent alluvium, between 15 and 17 feet in depth. As discussed earlier, the contact between the overlying recent alluvium (Qa, described above) and the recessional glacial soils is commonly difficult to precisely determine due to their similar lithology and density. However, we determined the contact based on the color change, with depth, from brown to gray. The composition and density of the glacial recessional soils varies widely, ranging from loose to dense, slightly silty to silty, slightly gravelly to gravelly SAND to soft, clayey SILT.
5.3 Groundwater
We measured static groundwater at 12.7 feet below the existing ground surface (bgs) in boring B-3 the morning of the second day of drilling. The groundwater appears to be similar to the Little Nespelem River elevation at the bridge site.
We observed evidence of groundwater heave in boring B-3, which was drilled using air rotary methods. Groundwater heave was noted in boring B-3 between 27.5 and 30 feet bgs and below
22-1-02953-002-R1_03.05.2013.docx/wp/lkn 22-1-02953-002 7
55 feet bgs. Mud rotary methods used at borings B-1 and B-2 were specifically intended to mitigate groundwater heave conditions and no heave was noted in the field.
6.0 GEOLOGIC HAZARDS
Based on our literature review and site observations, the primary geologic hazards within the project site area likely include river scour and earthquake-related hazards. These hazards are summarized in the following report subsections.
6.1 Scour
Shannon & Wilson completed a scour study following our initial DRAFT geotechnical report. Our study indicates total (contraction and stream bed) scour may be as much as 12 feet for the 500-year event, or approximate elevation 1736.8 feet msl. River scour may present a long-term stability issue for Little Nespelem River bridge foundations. Scour and scour protection measures should be considered in bridge design. The scour study is presented in a separate project report.
6.2 Earthquake-Induced Geologic Hazards
Earthquake-induced geologic hazards that may affect a given site include seismically-induced landsliding, liquefaction and associated effects (e.g., loss of shear strength, bearing capacity failures, loss of lateral support, ground oscillation, lateral spreading, settlement, etc.), tsunami, seiche, and ground surface fault rupture. Based on our evaluation, fault rupture, seismically-induced land sliding, tsunami, and seiche are unlikely in the immediate vicinity of the Little Nespelem River Bridge site.
Soils susceptible to liquefaction are typically loose to medium dense, saturated, cohesionless deposits. Saturated, cohesionless deposits in the project area consist of Quaternary alluvium and Pleistocene glacial drift. The boring logs indicate that these soils are generally very loose to dense. Our analyses indicate potential liquefaction may occur for the design seismic event (1,000 year recurrence interval) at approximately 20 to 35 feet bgs.
The potential for ground surface rupture at the site is also relatively low, in our opinion. There are no active faults mapped within the project site area. The nearest mapped potentially active faults identified by the U.S. Geological Survey (USGS, 2008) are the east-west-trending
22-1-02953-002-R1_03.05.2013.docx/wp/lkn 22-1-02953-002 8
Frenchman Hills structures located about 80 miles south-southwest of the site (Lidke, 2003a and 2003b; Personius and Lidke, 2003).
7.0 ENGINEERING CONCLUSIONS
7.1 Foundation Alternatives
Bridge structure foundation selection is dependent upon several factors, including but not limited to required resistances due to loading, total and differential settlement tolerances, and construction considerations. Shannon & Wilson, Inc. evaluated shallow and deep foundations, including abutment footings, drilled shafts, drilled-in piles, and driven pipe and H-piles.
Shallow spread footings are not considered a viable foundation alternative due to potential settlement, anticipated scour, and the deep excavation relative to anticipated groundwater and/or LNR elevations. We do not consider drilled shafts or drilled-in piles economically viable alternatives due to the equipment mobilization costs and full-depth casing requirements. Driven H-piles are not the preferred foundation alternative because they will develop relatively minimal axial capacity compared to other pile types.
The County indicates strong consideration shall be given to the GRS-IBS, a mechanically stabilized earth (MSE) wall dually acting to retain the approach fill and support the superstructure. The Federal Highways Administration (FHWA) published the June 2012 revision of the Geosynthetic Reinforced Soil Integrated Bridge System Interim Implementation Guide (FHWA-HRT-11-026) discussing details of the low-volume road alternative. We do not
Based on the anticipated subsurface conditions, scour, moderate axial and lateral loads, we consider driven, closed-end pipe piles the most suitable conventional bridge foundation alternative. Pile driving vibrations and the associated damage risk is not a significant concern due to the rural project location (i.e., lack of nearby structures, facilities, etc.). Driven pile installations are typically performed by impacting or vibrating the pile into the ground to the prescribed bearing stratum. Driven piles develop axial resistance through frictional interaction between the pile surface and the soil profile, and end-bearing resistance at the pile tip. Driven piles are typically less expensive than drilled shafts. We provide driven pipe pile and abutment and wingwall design and construction recommendations in Sections 6.2 and 6.3 below.
consider the GRS-IBS a viable foundation alternative due to the potentially deep scour.
22-1-02953-002-R1_03.05.2013.docx/wp/lkn 22-1-02953-002 9
7.2 Driven Pipe Pile Design
We evaluated closed-end (i.e., full displacement) 18-, 24-, and 36-inch O.D. steel pipe pile sections. The pile wall thickness selection is typically based on a preliminary drivability evaluation performed using GRLWEAP, or other similar programs. Based on the relatively moderate subsurface densities, as inferred from project explorations, we anticipate the piles will largely provide structure support through skin friction with a low end bearing contribution.
We estimate liquefaction and/or seismic settlement could occur within relatively loose fine sands and silts at depth. The liquefaction and/or seismic settlement will likely induce down-drag forces over the pile section.
Pile design and construction should meet the requirements of WSDOT Standard Specifications, Section 6-05. Steel pipe piles shall conform to ASTM A252, Standard Specification for Welded and Seamless Steel Pipe Piles, Grade 2 requirements to withstand anticipated driving stress.
7.2.1 Geotechnical Pile Compressive Resistance
We evaluated the axial resistance of driven 18-, 24-, and 36-inch-diameter, closed-end steel pipe piles. Driven pile axial resistance is a function of pile type, diameter, shape, embedment length, and subsurface conditions. Driven piles develop frictional resistance between the pile surface and the soil profile and end-bearing (base) resistance at the pile tip. The total nominal axial pile resistance is the sum of the frictional and base resistance, with frictional resistance cumulating with embedment depth and base resistance determined considering the subsurface conditions for about two pile diameters below the pile tip.
We performed our pile capacity analyses in accordance with ASSHTO guidelines based on our subsurface explorations and experience. We performed our axial resistance analyses for strength and extreme event limit states for a single pile or pile groups with a minimum 2.5 pile diameter center-to-center spacing. The AASHTO Load Resistance Factor Design (LRFD) Bridge Design Specifications (BDS) recommends pile group efficiency (reduction) factors equal to 1.0 for pile groups with a minimum 2.5 pile diameter center-to-center spacing.
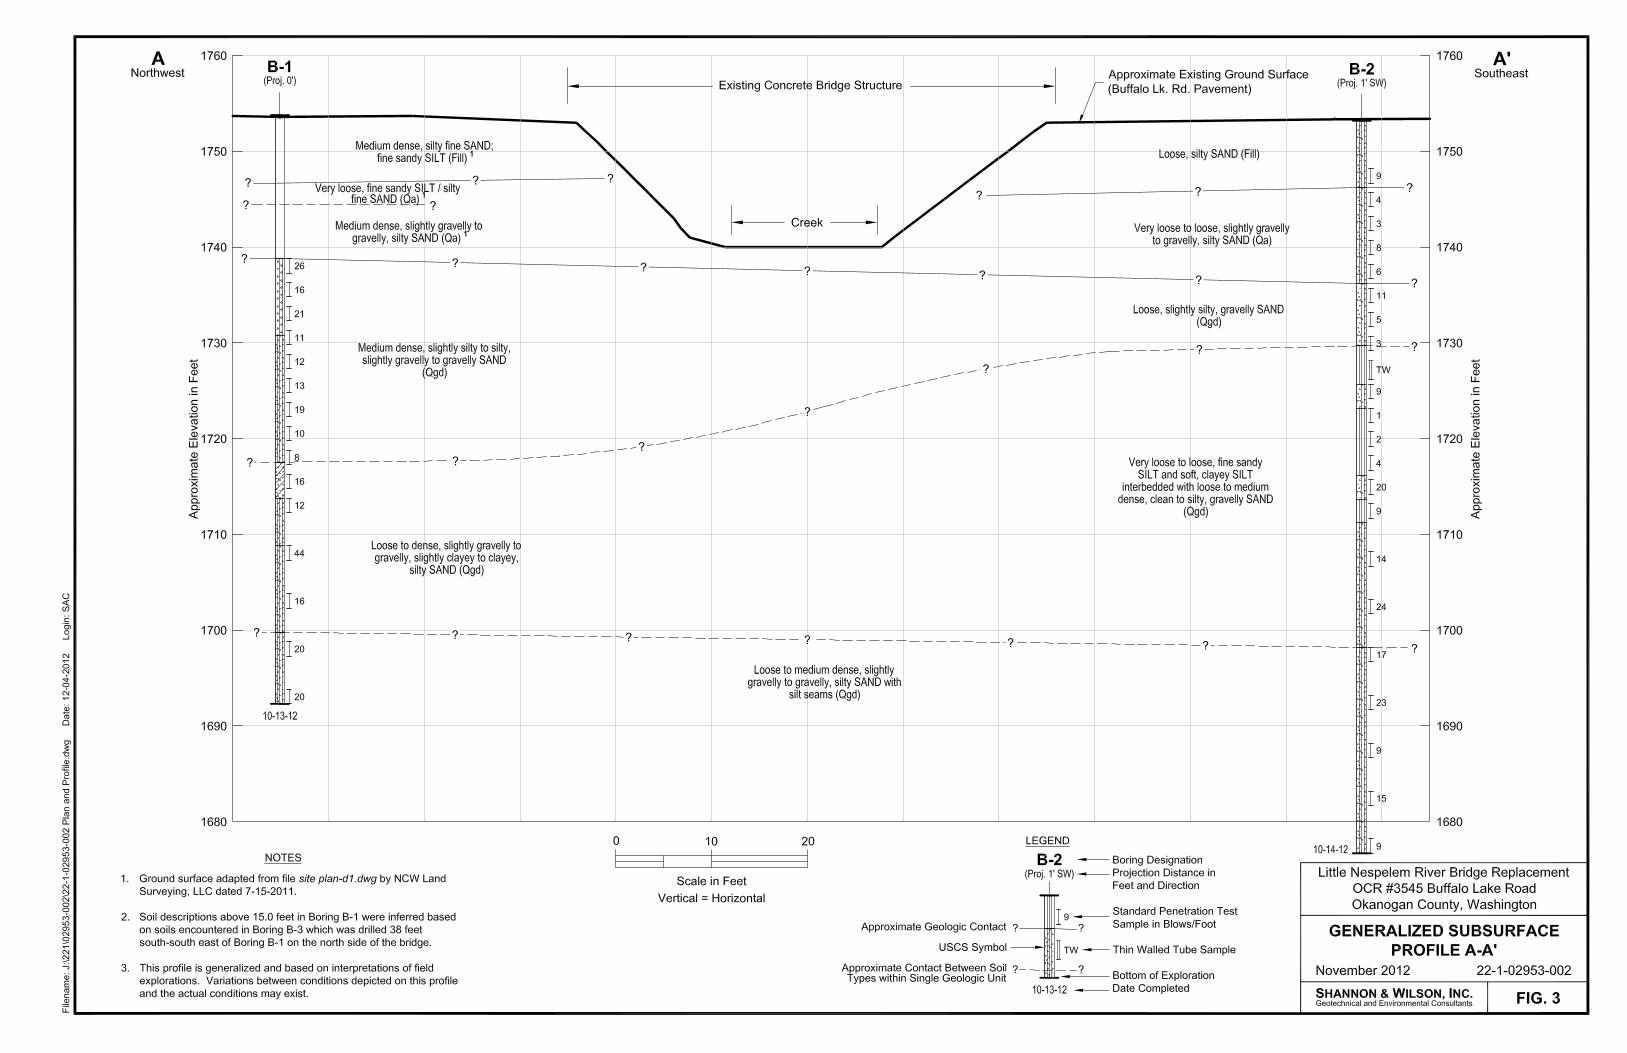
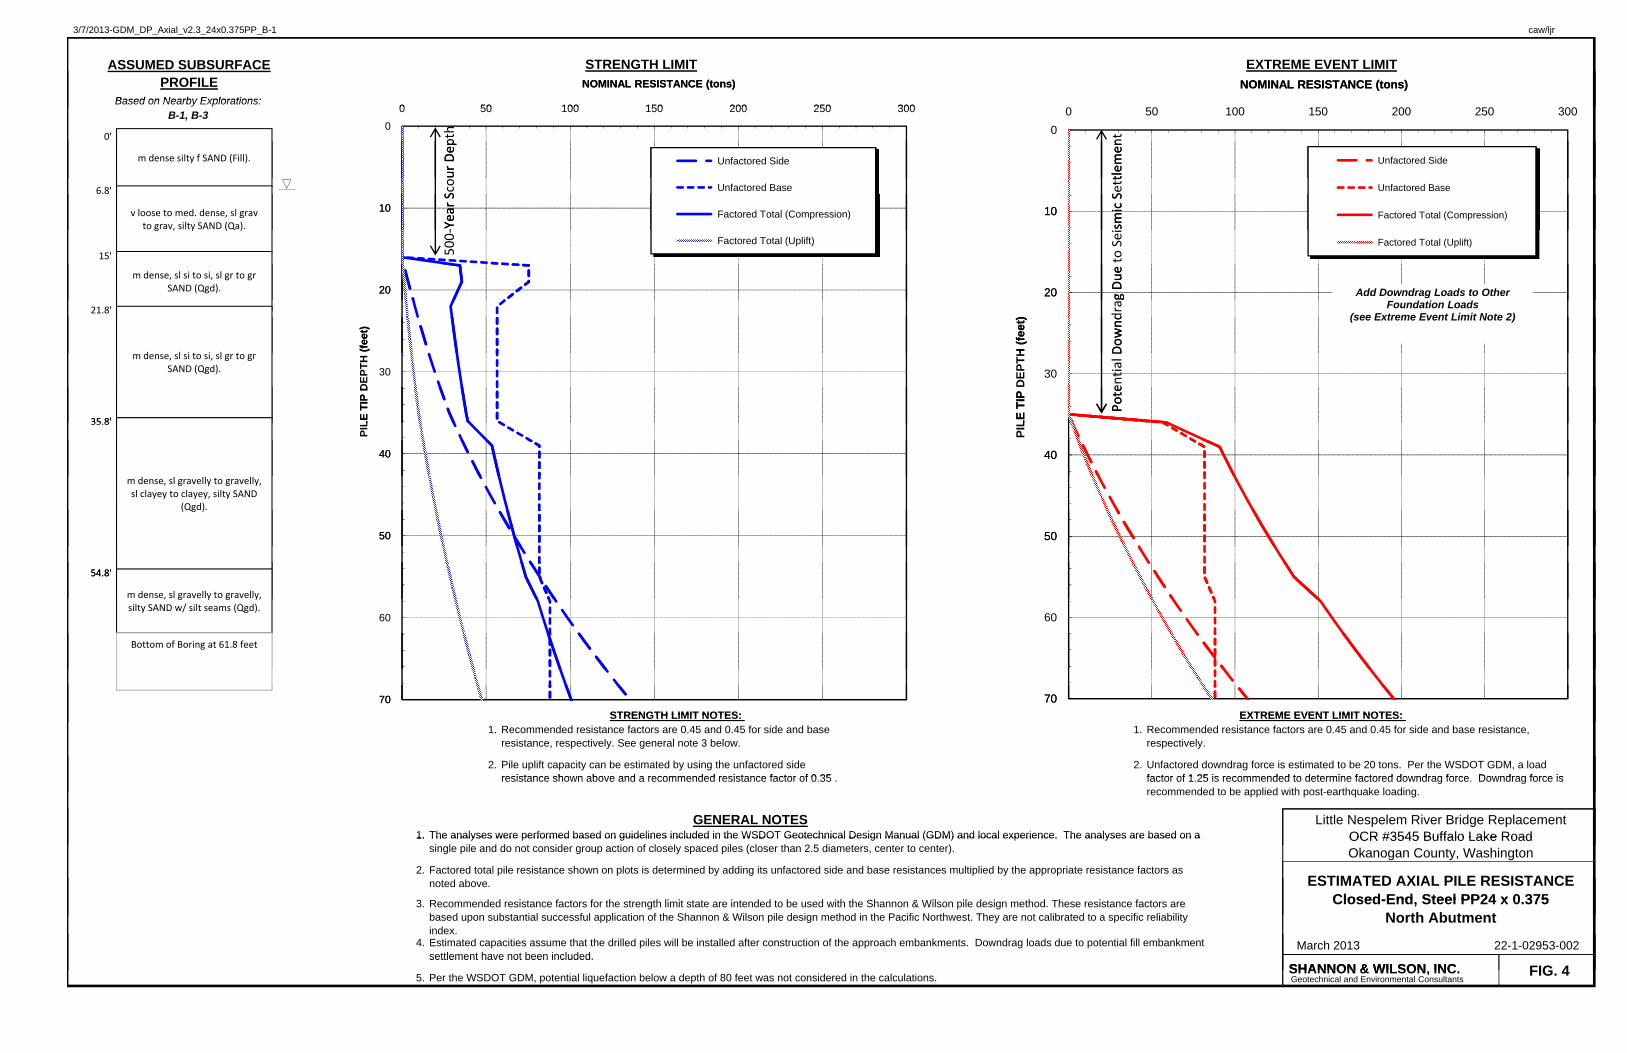
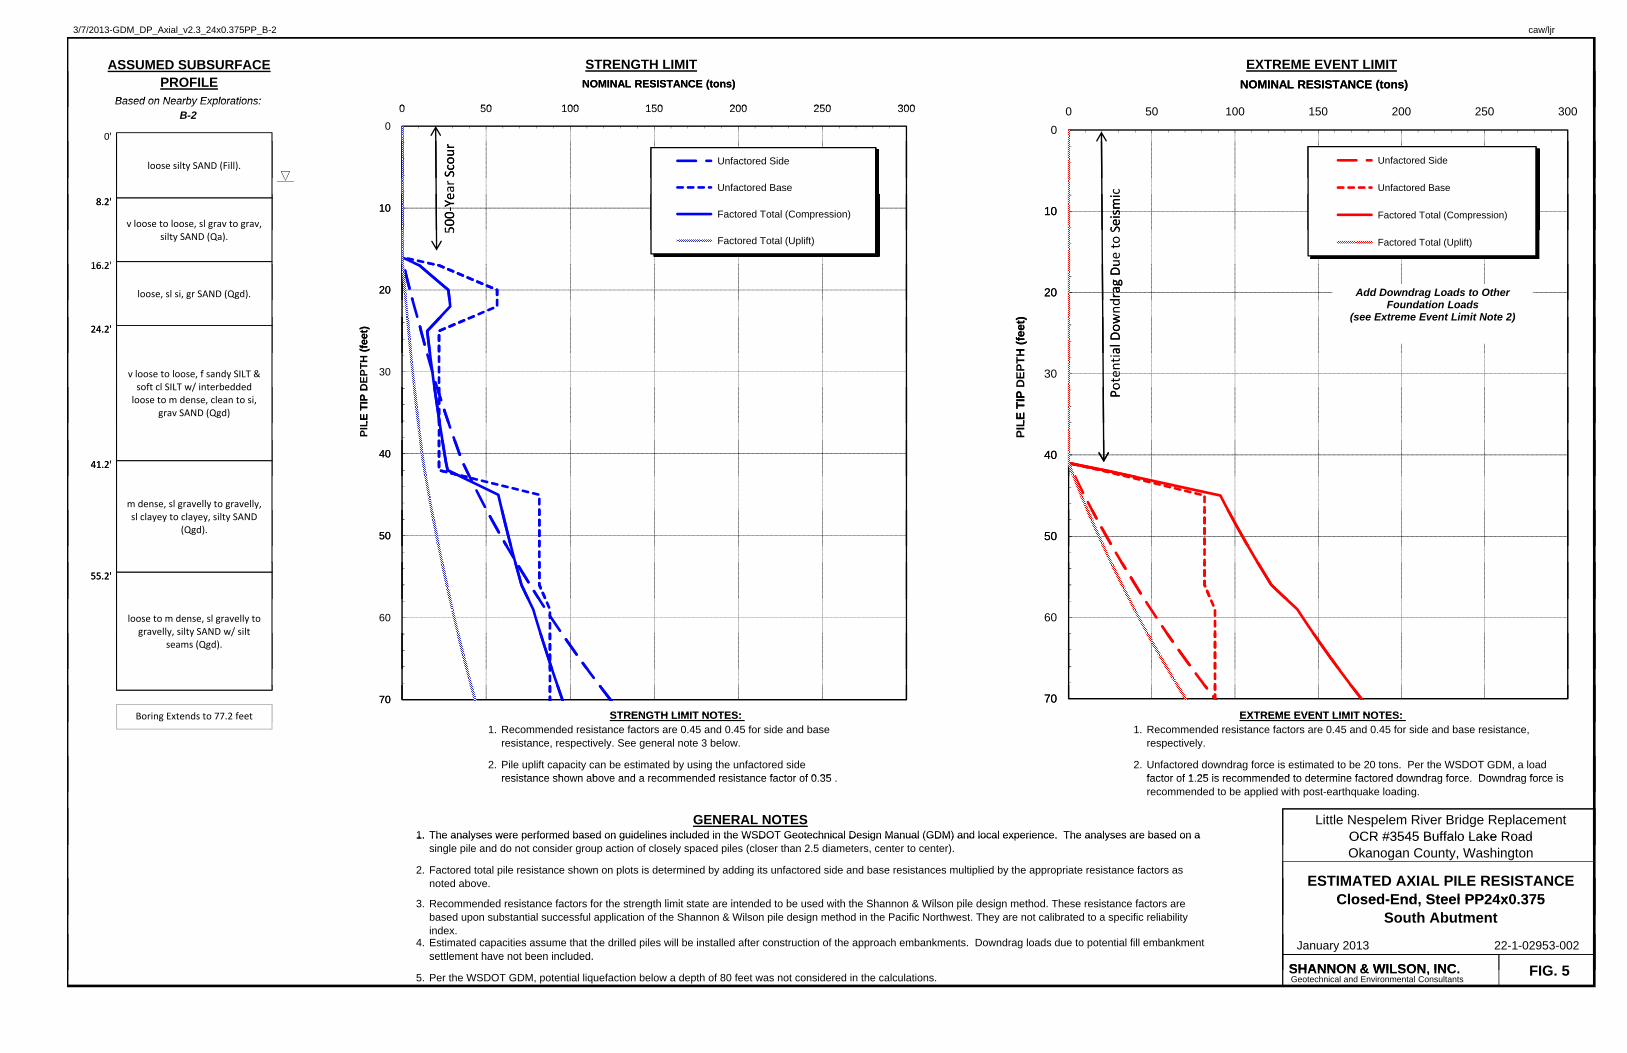
Based on discussions with the structural engineering consultants (Meier Architecture Engineering), we anticipate 24-inch-diameter pipe piles will provide the necessary foundation support. We present driven pipe pile section PP24x0.375 axial resistance against driving depth for the Strength and Extreme Limit States in Figure 4 for the north abutment (based on borings B-1 and B-3), and Figure 5 for south abutment (based on boring B-2). (The pile wall thickness
22-1-02953-002-R1_03.05.2013.docx/wp/lkn 22-1-02953-002 10
selection is typically based on a preliminary drivability evaluation performed using GRLWEAP, or other similar programs.) The plots present unfactored (nominal) side and tip resistance for each limit state. Factored total compressive resistance for the Strength Limit state is shown using typical AASHTO BDS resistance factors, as listed below the plot. The figures include generalized subsurface conditions along the left side, as encountered in the respective boring. Differing subsurface conditions are possible at specific pile locations.
Based on the anticipated driving conditions and scour depth, we recommend a minimum pile length of 55 feet below the pile cap to develop the required capacity. The abutment design calculations are based on 56-foot piles. Because of uncertainties often encountered when driving pile, we recommend including an additional 10 feet per pile in order lengths. The final quantities will not be determined until WEAP analysis and driving are completed.
7.2.2 Estimated Settlement
Assuming pile design and installation in accordance with our recommendations contained herein, we estimate total settlements may be approximately 1-inch, with differential settlement between abutments approximately one-half of estimated total settlement. The foundation soils at the site generally consist of granular, cohesionless (non-plastic) fine sands/silts and fine gravels. In granular soils, we anticipate settlement will consist of “immediate” settlement, or elastic deformations that take place during construction due to pile driving vibration.
At least ½-inch of ground settlement around driven piles is typically required to induce down-drag loading conditions following installation. We expect minimal compression of the foundation soils under static and live loading conditions due to the proposed vertical alignment at or near current elevations.
Down-drag forces may be induced by liquefaction and/or seismic settlement. We account for down-drag forces, including reduced soil strength of layers below the design water level due to cyclic stresses.
7.2.3 Lateral Pile Load Capacity
The lateral load resistance of driven piles is a complex soil-structure interaction problem that takes into account pile stiffness and the substratum’s varying resistance as the pile deflects laterally. Lateral loading caused by wind, seismic forces, unbalanced earth pressures, etc., can be resisted by foundation piles and passive earth pressures acting against embedded portions of the foundations. The lateral resistance developed by the pile foundations depends on pile type,
22-1-02953-002-R1_03.05.2013.docx/wp/lkn 22-1-02953-002 11
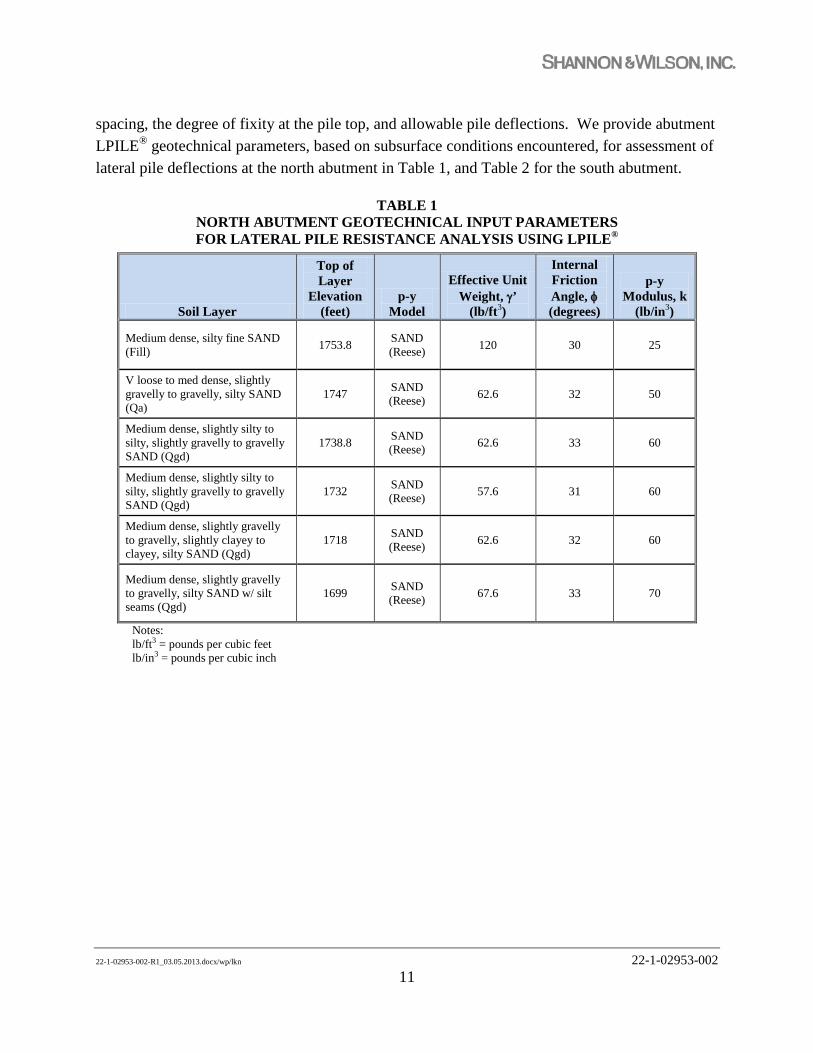
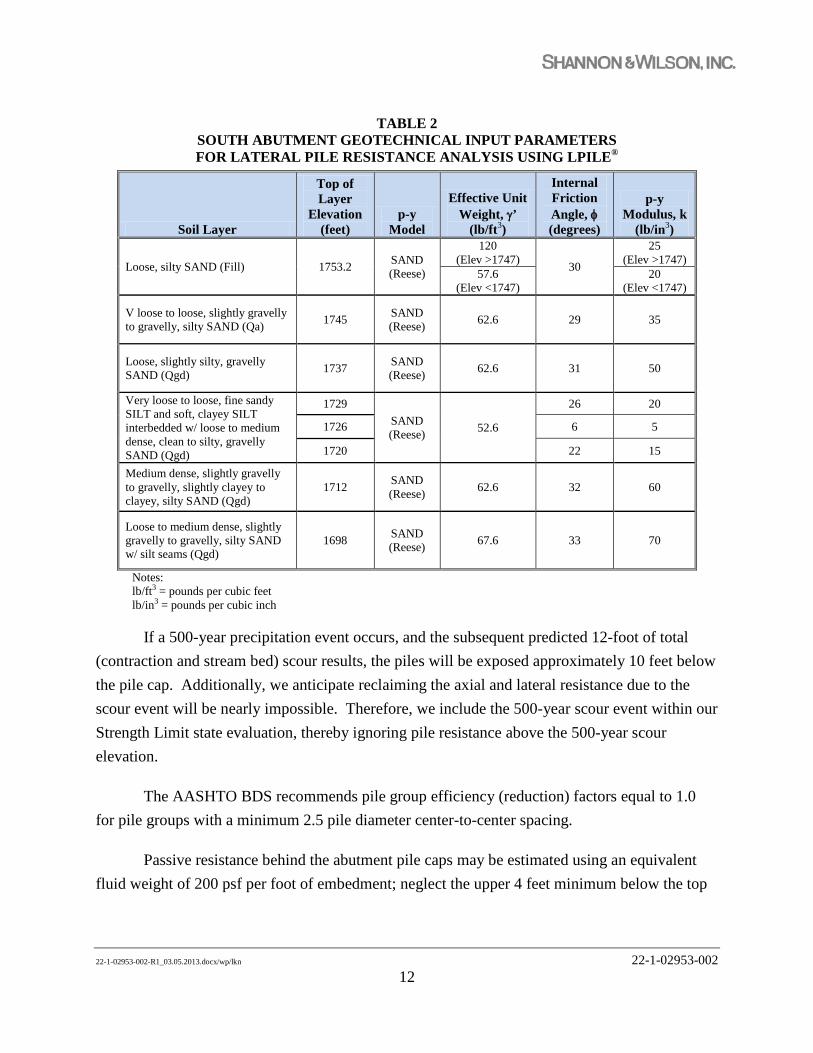
spacing, the degree of fixity at the pile top, and allowable pile deflections. We provide abutment LPILE® geotechnical parameters, based on subsurface conditions encountered, for assessment of lateral pile deflections at the north abutment in Table 1, and Table 2 for the south abutment.
TABLE 1 NORTH ABUTMENT GEOTECHNICAL INPUT PARAMETERS FOR LATERAL PILE RESISTANCE ANALYSIS USING LPILE®
Soil Layer
Top of Layer
Elevation (feet)
p-y Model
Effective Unit Weight, γ’
(lb/ft3)
Internal Friction Angle, φ (degrees)
p-y Modulus, k
(lb/in3)
Medium dense, silty fine SAND (Fill) 1753.8 SAND
(Reese) 120 30 25
V loose to med dense, slightly gravelly to gravelly, silty SAND (Qa)
1747 SAND (Reese) 62.6 32 50
Medium dense, slightly silty to silty, slightly gravelly to gravelly SAND (Qgd)
1738.8 SAND (Reese) 62.6 33 60
Medium dense, slightly silty to silty, slightly gravelly to gravelly SAND (Qgd)
1732 SAND (Reese) 57.6 31 60
Medium dense, slightly gravelly to gravelly, slightly clayey to clayey, silty SAND (Qgd)
1718 SAND (Reese) 62.6 32 60
Medium dense, slightly gravelly to gravelly, silty SAND w/ silt seams (Qgd)
1699 SAND (Reese) 67.6 33 70
Notes: lb/ft3 = pounds per cubic feet lb/in3 = pounds per cubic inch
22-1-02953-002-R1_03.05.2013.docx/wp/lkn 22-1-02953-002 12
TABLE 2 SOUTH ABUTMENT GEOTECHNICAL INPUT PARAMETERS FOR LATERAL PILE RESISTANCE ANALYSIS USING LPILE®
Soil Layer
Top of Layer
Elevation (feet)
p-y Model
Effective Unit Weight, γ’
(lb/ft3)
Internal Friction Angle, φ (degrees)
p-y Modulus, k
(lb/in3)
Loose, silty SAND (Fill) 1753.2 SAND (Reese)
120 (Elev >1747) 30
25 (Elev >1747)
57.6 (Elev <1747)
20 (Elev <1747)
V loose to loose, slightly gravelly to gravelly, silty SAND (Qa) 1745 SAND
(Reese) 62.6 29 35
Loose, slightly silty, gravelly SAND (Qgd) 1737 SAND
(Reese) 62.6 31 50
Very loose to loose, fine sandy SILT and soft, clayey SILT interbedded w/ loose to medium dense, clean to silty, gravelly SAND (Qgd)
1729 SAND (Reese) 52.6
26 20
1726 6 5
1720 22 15
Medium dense, slightly gravelly to gravelly, slightly clayey to clayey, silty SAND (Qgd)
1712 SAND (Reese) 62.6 32 60
Loose to medium dense, slightly gravelly to gravelly, silty SAND w/ silt seams (Qgd)
1698 SAND (Reese) 67.6 33 70
Notes: lb/ft3 = pounds per cubic feet lb/in3 = pounds per cubic inch
If a 500-year precipitation event occurs, and the subsequent predicted 12-foot of total (contraction and stream bed) scour results, the piles will be exposed approximately 10 feet below the pile cap. Additionally, we anticipate reclaiming the axial and lateral resistance due to the scour event will be nearly impossible. Therefore, we include the 500-year scour event within our Strength Limit state evaluation, thereby ignoring pile resistance above the 500-year scour elevation.
The AASHTO BDS recommends pile group efficiency (reduction) factors equal to 1.0 for pile groups with a minimum 2.5 pile diameter center-to-center spacing.
Passive resistance behind the abutment pile caps may be estimated using an equivalent fluid weight of 200 psf per foot of embedment; neglect the upper 4 feet minimum below the top
22-1-02953-002-R1_03.05.2013.docx/wp/lkn 22-1-02953-002 13
of pile cap due to disturbance. In this calculation, we apply a 1.5 safety factor to the calculated passive resistance and assume the pile cap backfill consists of free-draining, granular material. Ignore passive resistance at the pile cap if the soils providing resistance may be removed at any time in the future. In this case, we suggest ignoring the old abutment and fill materials on the stream side of the new abutments; we do not anticipate they will remain intact during the 500-year scour event.
7.2.4 Pile Installation Construction Considerations
Pile driving and installation should follow WSDOT Standard Specification Section 6-05. If possible, we recommend driving the steel pipe piles full length without splicing. If splicing pile lengths in the leads is necessary to install the piles, then splicing locations should be approved by the structural engineer. All pile splices should be made according to WSDOT Standard Specifications and procedures for piling with lateral and tension loading conditions. Also, the piles should be driven no closer together than 2.5 pile diameters, measured from center-to-center and within 6 inches of plan locations. The pile driving alignment tolerance should follow the WSDOT Standard Specification. Piles driven out of tolerance may require a redesigned pile cap.
The piles should be driven with an impact hammer such as a single- or double-acting air, steam, or diesel hammer. Preliminary pile driving hammer selection, to drive the pile to the required nominal resistance, should be determined based on minimum hammer energy of 30,000 ft-lbs.
The piles should be driven to both a minimum “last set” and to a minimum pile length to obtain the required capacity. If the “last set” is reached before the minimum embedment, driving should continue until the minimum embedment is reached. If driving must be terminated before the minimum embedment is reached because driving stresses are greater than 0.9Fy (90 percent of the yield strength of the steel pile), or to prevent other damage to the pile or hammer, the driving records should be reviewed by the geotechnical engineer to evaluate both compressive and lateral pile capacities. Based upon the evaluation, pile location pre-boring or adding piles to the pile group may be required. In cases where additional piles are required, the pile cap may need to be redesigned by the structural engineer.
The actual pile driving criteria including “last set” should be established before production driving by the geotechnical engineer. The Wave Equation Analysis Pile (WEAP) is a commonly accepted method of evaluating the “last set”, nominal pile resistance, and driving
22-1-02953-002-R1_03.05.2013.docx/wp/lkn 22-1-02953-002 14
stresses. A WEAP analysis should be performed for any piles with a nominal bearing resistance greater than 100 tons. The WEAP analysis should include the specific hammer, helmet and cushion characteristics proposed by the contractor for the project.
7.3 Bridge Abutment and Wingwall Design
7.3.1 General
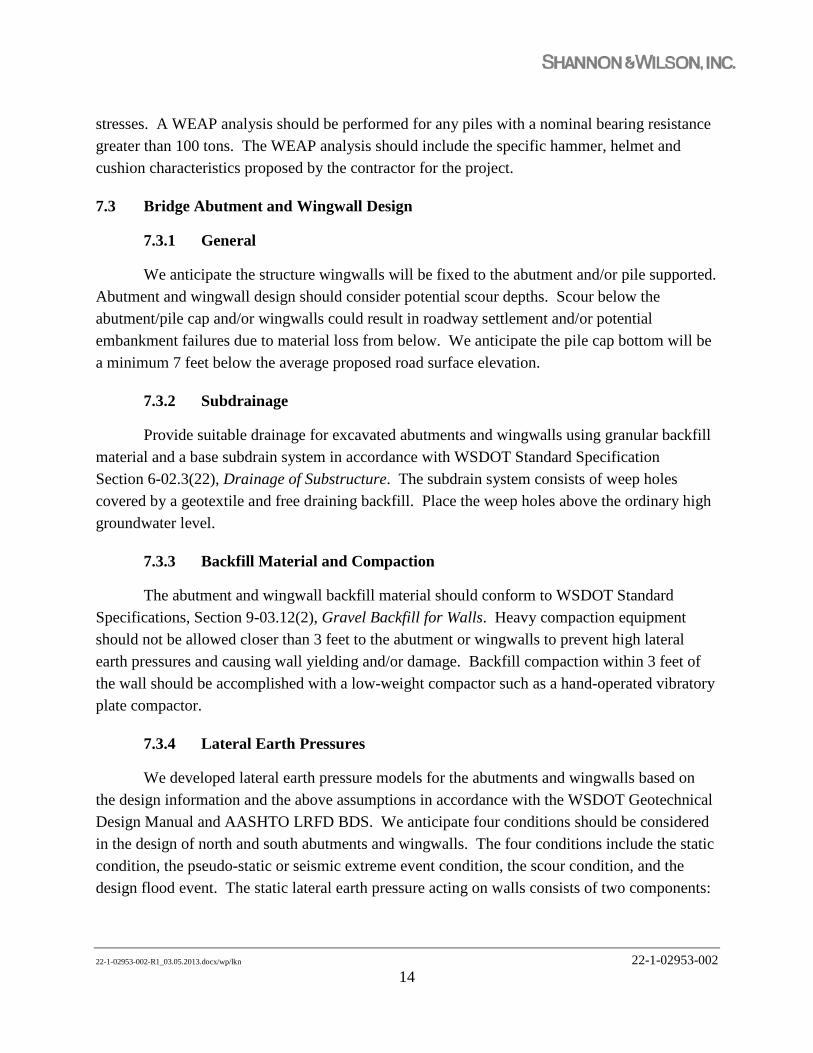
We anticipate the structure wingwalls will be fixed to the abutment and/or pile supported. Abutment and wingwall design should consider potential scour depths. Scour below the abutment/pile cap and/or wingwalls could result in roadway settlement and/or potential embankment failures due to material loss from below. We anticipate the pile cap bottom will be a minimum 7 feet below the average proposed road surface elevation.
7.3.2 Subdrainage
Provide suitable drainage for excavated abutments and wingwalls using granular backfill material and a base subdrain system in accordance with WSDOT Standard Specification Section 6-02.3(22), Drainage of Substructure. The subdrain system consists of weep holes covered by a geotextile and free draining backfill. Place the weep holes above the ordinary high groundwater level.
7.3.3 Backfill Material and Compaction
The abutment and wingwall backfill material should conform to WSDOT Standard Specifications, Section 9-03.12(2), Gravel Backfill for Walls. Heavy compaction equipment should not be allowed closer than 3 feet to the abutment or wingwalls to prevent high lateral earth pressures and causing wall yielding and/or damage. Backfill compaction within 3 feet of the wall should be accomplished with a low-weight compactor such as a hand-operated vibratory plate compactor.
7.3.4 Lateral Earth Pressures
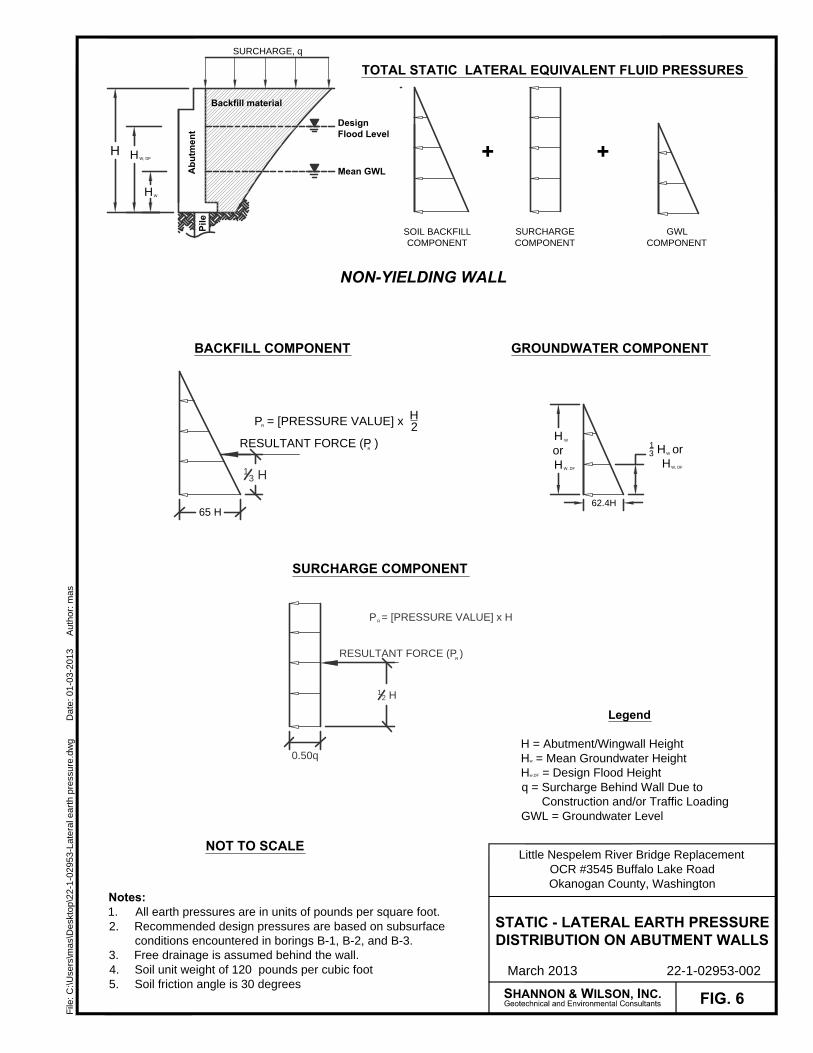
We developed lateral earth pressure models for the abutments and wingwalls based on the design information and the above assumptions in accordance with the WSDOT Geotechnical Design Manual and AASHTO LRFD BDS. We anticipate four conditions should be considered in the design of north and south abutments and wingwalls. The four conditions include the static condition, the pseudo-static or seismic extreme event condition, the scour condition, and the design flood event. The static lateral earth pressure acting on walls consists of two components:
22-1-02953-002-R1_03.05.2013.docx/wp/lkn 22-1-02953-002 15
earth and surcharge pressures. These pressures should be incorporated into the static, scour, and flood event designs. Static and seismic pressures should be used for the pseudo-static condition. We estimate extreme flood event water pressures exceed the seismic pressures. The static and flood-event lateral pressure distributions and resultants are shown in Figure 6.
7.3.5 Lateral Resistances
The abutment and wingwall static and seismic lateral resistance may be provided by the driven piles. Passive soil resistance may be considered at depths greater than two feet below the estimated scour elevation.
7.4 Seismic Design Criteria
In accordance with the 2012 American Association of State Highway and Transportation Officials (AASHTO) Load Resistance Factor Design (LRFD) Bridge Design Specifications (BDS), the U.S. Geological Survey (USGS) indicates the Peak Horizontal Ground Acceleration (PGA) for rock (Site Class B) along the project alignment is 0.109g for an approximately 1,000-year (7 percent probability of exceedance in 75 years) recurrence interval. We estimate short- and long-period spectral response accelerations (Ss and S1) are 0.249 and 0.083g, respectively.
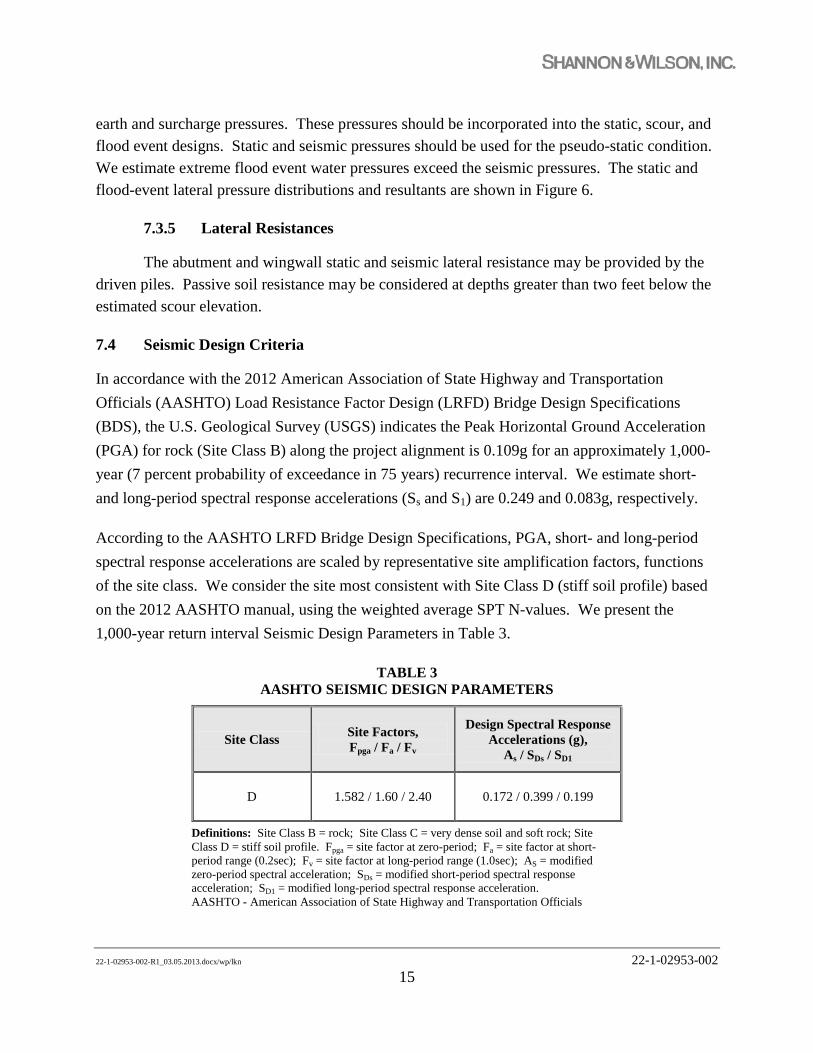
According to the AASHTO LRFD Bridge Design Specifications, PGA, short- and long-period spectral response accelerations are scaled by representative site amplification factors, functions of the site class. We consider the site most consistent with Site Class D (stiff soil profile) based on the 2012 AASHTO manual, using the weighted average SPT N-values. We present the 1,000-year return interval Seismic Design Parameters in Table 3.
TABLE 3 AASHTO SEISMIC DESIGN PARAMETERS
Site Class Site Factors, Fpga / Fa / Fv
Design Spectral Response Accelerations (g),
As / SDs / SD1
D 1.582 / 1.60 / 2.40 0.172 / 0.399 / 0.199
Definitions: Site Class B = rock; Site Class C = very dense soil and soft rock; Site Class D = stiff soil profile. Fpga = site factor at zero-period; Fa = site factor at short-period range (0.2sec); Fv = site factor at long-period range (1.0sec); AS = modified zero-period spectral acceleration; SDs = modified short-period spectral response acceleration; SD1 = modified long-period spectral response acceleration. AASHTO - American Association of State Highway and Transportation Officials
22-1-02953-002-R1_03.05.2013.docx/wp/lkn 22-1-02953-002 16
Based on the 2012 AASHTO LRFD Bridge Design Specifications, bridge design shall be in accordance with the requirements of Seismic Design Category B (0.15g < SD1 ≤ 0.30g).
8.0 CONSTRUCTION CONSIDERATIONS
8.1 Construction Practices
The applicability of our recommendations is contingent upon good construction practices. Poor construction techniques may alter conditions from those on which our recommendations are based and, therefore, result in reduced foundation capacity or additional settlement and movement. The following sections present construction considerations for this project.
8.2 Earthwork
Remove the existing abutments and backfill materials, if necessary, and other deleterious materials. Remove loose soil and debris prior to abutment backfill placement on cut ground surfaces.
Place and compact all earthwork in accordance with Specification Section 2-03.3(14)C, Method C of the Standard Specifications for Road, Bridge, and Municipal Construction (WSDOT, 2010), except that the relative compaction should be as determined by ASTM Designation: D 1557, Laboratory Compaction Characteristics of Soil Using Modified Effort.
Moisture condition the native subgrade upper 12 inches to within 2 percent of optimum, then compact to a minimum in-place dry density of 95 percent of the maximum laboratory dry density of ASTM D 1557.
Mitigate very loose to loose, silty SAND and/or other unsuitable subgrade areas, as identified by Shannon & Wilson. Overexcavate unsuitable subgrade areas and replace with coarse granular structural fill, or quarry spalls (4- to 6-inch maximum dimension), as recommended by the geotechnical engineer. Compact the coarse replacement materials to a firm and nonyielding condition, as observed by the geotechnical engineer.
Fill should be free of debris, organic material, and any other deleterious material. If import material is required, we recommend using a well-graded, 2-inch minus, pit-run sand and gravel with less than 5 percent fines, or crushed rock for structural fill, except where noted. Shannon & Wilson should review and approve material for import prior to transporting to the site. The
22-1-02953-002-R1_03.05.2013.docx/wp/lkn 22-1-02953-002 17
existing silty SAND and/or sandy SILT soils may be used for structural fill or backfill if they meet the appropriate specifications for structural fill and the specific application. Silty soils are typically moisture sensitive and often difficult to compact during wet weather conditions.
Moisture condition fill material to within 2 percent of optimum and place in 6- to 10-inch-thick maximum, horizontal, loose lifts. Final lift thicknesses will be provided within project plans and specifications. Compact the fill to a minimum 95 percent of ASTM D 1557. Only hand-operated compaction equipment should be allowed within 3 feet of below-grade structures.
Lift thicknesses may be altered during construction by Shannon & Wilson subject to the contractor’s construction equipment, means and methods, quality control testing, and compaction performance. Only hand-operated compaction equipment should be allowed within 3 feet of abutment walls and other project structures.
Local quarry sources may contain aggregate greater than approximately 3 to 4 inches, but may be acceptable for structural fill with the proper compaction and testing procedures provided aggregate is well graded. Typical nuclear density testing may not apply to coarse aggregate fill, depending on coarse aggregate quantity and size, gradation, and fines content. In such cases, a performance specification shall be determined in the field by the geotechnical engineer. Generally, we recommend placing gravelly materials in 6- to 8-inch-thick maximum, horizontal, loose lifts, depending on the actual particle sizes. Using heavy kneading and/or vibratory-type equipment, compact each lift with steady, uniform passes until a non-yielding state is achieved. Typically, five or more passes will be required.
8.3 Excavations/Slopes
Based on our explorations, we characterize the site soils as Occupational Safety and Health Administration (OSHA) Type C with maximum temporary slopes of 1½H:1V. These slopes do not include slope surcharging, such as equipment or material stockpiling located at or near the slope. Surcharged slopes should be evaluated by the geotechnical engineer based on the contractor’s proposed construction site layout. The contractor is responsible for the safety of all temporary excavations based on exposed ground conditions.
Construct permanent (unsupported) cut-and-fill slopes at 2H:1V, or less, and protect from both wind and water erosion. Erosion protection may consist of a vegetative cover or a minimum 3-
22-1-02953-002-R1_03.05.2013.docx/wp/lkn 22-1-02953-002 18
inch layer of coarse concrete aggregate conforming to the requirements of WSDOT Standard Specification 9-03.1(4)c, “Concrete Aggregate AASHTO Grading No. 57”.
8.4 Retaining Structures
Traditional pile supported abutment and wingwalls should include adequate back drainage to avoid buildup of hydrostatic pressures as discussed in Section 7.3.2. If short retaining walls are included in the project, drainage should consist of a vertical layer of permeable material, such as a graded sand and gravel, pea gravel, or crushed rock (typically ½- to ¾-inch crushed), at least 12 inches thick, positioned between the retaining wall and the backfill.
We recommend placing a nonwoven filter fabric (e.g., Mirafi 140N or equivalent) between the drainage material and the general backfill to prevent fines from migrating into the drainage material.
8.5 Wet Weather and Conditions
The project site soils are fine-grained and sensitive to moisture during handling and compaction. Proceeding with site earthwork operations using these soils during wet weather could add significant project costs and/or delays. The stability of exposed soils may rapidly deteriorate due to a change in moisture content. Therefore, if at all possible, complete site clearing, preparation, and earthwork during periods of warm, dry weather when soil moisture can be controlled by aeration. During or subsequent to wet weather, drying or compacting the on-site soils will be difficult. It may be necessary to amend the on-site soils or import granular materials for use as structural fill. If earthwork takes place in wet weather or wet conditions, the following recommendations should be followed:
• Fill material should consist of clean, granular soil, and not more than 5 percent fines (by weight) should pass the No. 200 sieve, based on wet-sieving the soil fraction passing the ¾-inch sieve. Fines should be non-plastic. These soils would have to be imported to the site.
• Earthwork should be accomplished in small sections and carried through to completion to reduce exposure to wet weather. Soils that become too wet for compaction should be removed and replaced with clean, granular matieral.
22-1-02953-002-R1_03.05.2013.docx/wp/lkn 22-1-02953-002 19
• The ground surface in the construction area should be sloped and sealed to reduce water infiltration, to promote rapid runoff, and to prevent water ponding.
• To prevent soil disturbance, the size or type of equipment may have to be limited.
• Work areas and stockpiles should be covered with plastic. Straw bales, straw wattles, geotextile silt fences and/or other measures should be used as appropriate to control soil erosion.
• Excavation and fill placement should be observed on a full-time basis by a geotechnical engineer (or engineer’s representative) experienced in wet weather earthwork to determine that unsuitable materials are removed and that suitable compaction and site drainage is achieved.
We recommend including these recommendations in the contract specifications.
8.6 Excavation Groundwater Control
We anticipate minimal earthwork will be performed within the active stream channel. However, we anticipate abutment construction may occur below LNR elevations. Temporary construction dewatering may be required. An engineered sump system may be required.
Groundwater inflow into excavations should be controlled to provide dry conditions for construction activities. The contractor should be responsible for ground and surface water control within permit and contract limits. In this regard, grading, slope protection, ditching, sumps, dewatering, and other measures should be used to direct water away from excavations to prevent ponding near or entering the excavation. Wet weather conditions may require the use of sumps or wells to control the surface and/or groundwater and allow for an accessible excavation. Temporary dewatering should follow applicable WSDOT specifications. Treat and dispose of collected water in accordance with local, state, and federal environmental regulations and requirements.
8.7 Plan Review and Construction Observation
Shannon & Wilson, in conjunction with Meier Architect Engineering, prepared the abutment construction plans and specifications. We recommend that Shannon & Wilson review the
22-1-02953-002-R1_03.05.2013.docx/wp/lkn 22-1-02953-002 20
geotechnical aspects of other project feature plans and specifications for conformance with the intent of our geotechnical recommendations.
Variations in soil conditions are possible at the site and may be encountered during construction. Geotechnical design recommendations are developed from a limited number of explorations and tests. Therefore, recommendations may need to be adjusted in the field. Shannon & Wilson should be retained to provide construction observation services during the project earthwork, excavation, and foundation preparation. Construction observation allows the geotechnical engineer to observe the actual soil conditions exposed during construction, determine if the proposed design is compatible with the design recommendations, and if the conditions encountered at the site are consistent with those observed during the geotechnical study. Construction observation is conducted to reduce the potential for problems arising during and after construction. However, in all cases, the Contractor is responsible for the quality and completeness of their work and for adhering to the plans, specifications, and recommendations on which their work is based.
9.0 LIMITATIONS
This report was prepared for the exclusive use of Okanogan County for specific application to the design and construction of the project at this site as it relates to the geotechnical aspects discussed herein. Its purpose is to provide information on factual data only; it should not be construed as a warranty of subsurface conditions, such as those interpreted from the exploration logs and subsurface conditions discussions in this report.
The analyses, conclusions, and recommendations contained in this report are based upon site conditions as they presently exist. We further assume that the site explorations are representative of the subsurface conditions throughout the site; that is, the subsurface conditions everywhere are not significantly different from those disclosed by the field explorations and observations.
Within the limitations of scope, schedule, and budget, the conclusions and recommendations presented in this report were prepared in accordance with generally accepted professional geotechnical and geological principles and practice in this area at the time this report was prepared. We make no other warranty, either expressed or implied.
22-1-02953-002-R1_03.05.2013.docx/wp/lkn 22-1-02953-002 22
10.0 REFERENCES
American Association of State Highway and Transportation Officials (AASHTO) LRFD Bridge Design Specifications, 2012, Customary U.S. Units, Volume 1 and 2.
Federal Highway Administration (FHWA), 2012,
International Code Council, Inc., 2012, International building code: Country Club Hills, Ill., International Code Council, Inc., 690 p.
LPILE plus version 5.0.12, 2004, developed by Ensoft Inc., Austin, Texas.
Washington Department of Transportation (WSDOT), 2012, Standard Specifications for Construction.
Washington Department of Transportation (WSDOT), 2012, Bridge Design Manual.
Washington Department of Transportation (WSDOT), 2012, Geotechnical Design Manual:
Stoffel, K. L., 1991, Geologic map of the Oroville 1:100,000 Quadrangle, Washington: Washington Division of Geology and Earth Resources Open File Report 90-11, 58 p., 1 sheet, scale 1:100,000.
U.S. Department of Transportation, 2006, Design and Construction of Driven Pile Foundations Volume 1 and 2, April.
U.S. Geological Survey (USGS), 2008 National Seismic Hazard Maps, from USGS website: http://earthquake.usgs.gov/research/hazmaps/products_data/2008/.
3/7/2013-GDM_DP_Axial_v2.3_24x0.375PP_B-1 caw/ljr
EXTREME EVENT LIMITSTRENGTH LIMITASSUMED SUBSURFACEPROFILE
Based on Nearby Explorations:0 50 100 150 200 250 300
NOMINAL RESISTANCE (tons)
0 50 100 150 200 250 300
NOMINAL RESISTANCE (tons)Based on Nearby Explorations:
B-1, B-30
0 50 100 150 200 250 300
NOMINAL RESISTANCE (tons)
Unfactored Side
00 50 100 150 200 250 300
NOMINAL RESISTANCE (tons)
Unfactored Sidem dense silty f SAND (Fill).
0'
ur Dep
th
tlemen
t
10
Unfactored Side
Unfactored Base
Factored Total (Compression)10
Unfactored Side
Unfactored Base
Factored Total (Compression)
m dense silty f SAND (Fill).
v loose to med. dense, sl grav to grav, silty SAND (Qa).
6.8'
‐Year S
cour Dep
smic Settle
men
10
20
Factored Total (Compression)
Factored Total (Uplift)
10
20
Factored Total (Compression)
Factored Total (Uplift)
Add Downdrag Loads to Other F d i L d
v loose to med. dense, sl grav to grav, silty SAND (Qa).
m dense, sl si to si, sl gr to gr SAND (Qgd).
15' 500‐Year S
g Du
eto Seism
ic S
20
H (f
eet)
20
(feet
)
Add Downdrag Loads to Other Foundation Loads
(see Extreme Event Limit Note 2)
m dense, sl si to si, sl gr to gr SAND (Qgd).
d l i t i l t
21.8'
Downd
rag Du
e
30
LE T
IP D
EPTH
(fee
t)
30LE
TIP
DEP
TH (f
eet)
(see Extreme Event Limit Note 2)
m dense, sl si to si, sl gr to gr SAND (Qgd).
35 8'
Potential D
ownd
40
PILE
TIP
40
PILE
TIP
D
35.8'
Pote
40
50
40
50
m dense, sl gravelly to gravelly, sl clayey to clayey, silty SAND
(Qgd).
5050
(Qgd)
m dense, sl gravelly to gravelly,
54.8'
6060
m dense, sl gravelly to gravelly, silty SAND w/ silt seams (Qgd).
54.8'
Bottom of Boring at 61.8 feet
STRENGTH LIMIT NOTES: EXTREME EVENT LIMIT NOTES:7070
Bottom of Boring at 61.8 feet
1. 1.
2. 2.
Recommended resistance factors are 0.45 and 0.45 for side and base resistance, respectively. See general note 3 below.
Recommended resistance factors are 0.45 and 0.45 for side and base resistance, respectively.
STRENGTH LIMIT NOTES: EXTREME EVENT LIMIT NOTES:
Unfactored downdrag force is estimated to be 20 tons. Per the WSDOT GDM, a load factor of 1 25 is recommended to determine factored downdrag force Downdrag force is
Pile uplift capacity can be estimated by using the unfactored side resistance shown above and a recommended resistance factor of 0 35
7070
1.Little Nespelem River Bridge Replacement
OCR #3545 Buffalo Lake RoadGENERAL NOTES
The analyses were performed based on guidelines included in the WSDOT Geotechnical Design Manual (GDM) and local experience. The analyses are based on a
factor of 1.25 is recommended to determine factored downdrag force. Downdrag force is recommended to be applied with post-earthquake loading.
resistance shown above and a recommended resistance factor of 0.35 .
1.
2.
3
ESTIMATED AXIAL PILE RESISTANCEClosed-End Steel PP24 x 0 375
OCR #3545 Buffalo Lake Road Okanogan County, Washington
Factored total pile resistance shown on plots is determined by adding its unfactored side and base resistances multiplied by the appropriate resistance factors as noted above.
R d d i t f t f th t th li it t t i t d d t b d ith th Sh & Wil il d i th d Th i t f t
The analyses were performed based on guidelines included in the WSDOT Geotechnical Design Manual (GDM) and local experience. The analyses are based on a single pile and do not consider group action of closely spaced piles (closer than 2.5 diameters, center to center).
3.
4. 22-1-02953-002
Closed-End, Steel PP24 x 0.375North Abutment
Estimated capacities assume that the drilled piles will be installed after construction of the approach embankments. Downdrag loads due to potential fill embankment settlement have not been included.
Recommended resistance factors for the strength limit state are intended to be used with the Shannon & Wilson pile design method. These resistance factors are based upon substantial successful application of the Shannon & Wilson pile design method in the Pacific Northwest. They are not calibrated to a specific reliability index.
March 2013
SHANNON & WILSON INC5. Per the WSDOT GDM, potential liquefaction below a depth of 80 feet was not considered in the calculations. FIG. 4
settlement have not been included.
Geotechnical and Environmental ConsultantsSHANNON & WILSON, INC.
3/7/2013-GDM_DP_Axial_v2.3_24x0.375PP_B-2 caw/ljr
EXTREME EVENT LIMITSTRENGTH LIMITASSUMED SUBSURFACEPROFILE
Based on Nearby Explorations:0 50 100 150 200 250 300
NOMINAL RESISTANCE (tons)
0 50 100 150 200 250 300
NOMINAL RESISTANCE (tons)Based on Nearby Explorations:
B-20
0 50 100 150 200 250 300
NOMINAL RESISTANCE (tons)
Unfactored Side
00 50 100 150 200 250 300
NOMINAL RESISTANCE (tons)
Unfactored Sideloose silty SAND (Fill).
0'
Scou
r
10
Unfactored Side
Unfactored Base
Factored Total (Compression)10
Unfactored Side
Unfactored Base
Factored Total (Compression)
loose silty SAND (Fill).
v loose to loose, sl grav to grav,
8.2'
500‐Year Scour
Seism
ic
10
20
Factored Total (Compression)
Factored Total (Uplift)
10
20
Factored Total (Compression)
Factored Total (Uplift)
Add Downdrag Loads to Other F d i L d
v loose to loose, sl grav to grav, silty SAND (Qa).
8.2'
loose, sl si, gr SAND (Qgd).
16.2'
500‐Ye
drag Due
to Seism
i
20
H (f
eet)
20
(feet
)
Add Downdrag Loads to Other Foundation Loads
(see Extreme Event Limit Note 2)
loose, sl si, gr SAND (Qgd).
16.2
24.2'
al Dow
ndrag Du
30
LE T
IP D
EPTH
(fee
t)
30LE
TIP
DEP
TH (f
eet)
(see Extreme Event Limit Note 2)
v loose to loose, f sandy SILT & soft cl SILT w/ interbedded loose to m dense, clean to si,
grav SAND (Qgd)
24.2'
Potential D
ow
40
PILE
TIP
40
PILE
TIP
Dsoft cl SILT w/ interbedded loose to m dense, clean to si,
grav SAND (Qgd)
41.2'
Po
40
50
40
50
m dense, sl gravelly to gravelly, sl clayey to clayey, silty SAND
(Qgd).
41.2'
5050
sl clayey to clayey, silty SAND (Qgd).
55.2'
6060loose to m dense, sl gravelly to gravelly, silty SAND w/ silt
seams (Qgd).
55.2'
STRENGTH LIMIT NOTES: EXTREME EVENT LIMIT NOTES:7070
gravelly, silty SAND w/ silt seams (Qgd).
Boring Extends to 77.2 feet1. 1.
2. 2.
Recommended resistance factors are 0.45 and 0.45 for side and base resistance, respectively. See general note 3 below.
Recommended resistance factors are 0.45 and 0.45 for side and base resistance, respectively.
STRENGTH LIMIT NOTES: EXTREME EVENT LIMIT NOTES:
Unfactored downdrag force is estimated to be 20 tons. Per the WSDOT GDM, a load factor of 1 25 is recommended to determine factored downdrag force Downdrag force is
Pile uplift capacity can be estimated by using the unfactored side resistance shown above and a recommended resistance factor of 0 35
7070Boring Extends to 77.2 feet
1.Little Nespelem River Bridge Replacement
OCR #3545 Buffalo Lake RoadGENERAL NOTES
The analyses were performed based on guidelines included in the WSDOT Geotechnical Design Manual (GDM) and local experience. The analyses are based on a
factor of 1.25 is recommended to determine factored downdrag force. Downdrag force is recommended to be applied with post-earthquake loading.
resistance shown above and a recommended resistance factor of 0.35 .
1.
2.
3
ESTIMATED AXIAL PILE RESISTANCEClosed-End Steel PP24x0 375
OCR #3545 Buffalo Lake Road Okanogan County, Washington
Factored total pile resistance shown on plots is determined by adding its unfactored side and base resistances multiplied by the appropriate resistance factors as noted above.
R d d i t f t f th t th li it t t i t d d t b d ith th Sh & Wil il d i th d Th i t f t
The analyses were performed based on guidelines included in the WSDOT Geotechnical Design Manual (GDM) and local experience. The analyses are based on a single pile and do not consider group action of closely spaced piles (closer than 2.5 diameters, center to center).
3.
4. 22-1-02953-002
Closed-End, Steel PP24x0.375South Abutment
Estimated capacities assume that the drilled piles will be installed after construction of the approach embankments. Downdrag loads due to potential fill embankment settlement have not been included.
Recommended resistance factors for the strength limit state are intended to be used with the Shannon & Wilson pile design method. These resistance factors are based upon substantial successful application of the Shannon & Wilson pile design method in the Pacific Northwest. They are not calibrated to a specific reliability index.
January 2013
SHANNON & WILSON INC5. Per the WSDOT GDM, potential liquefaction below a depth of 80 feet was not considered in the calculations. FIG. 5
settlement have not been included.
Geotechnical and Environmental ConsultantsSHANNON & WILSON, INC.
STATIC - LATERAL EARTH PRESSUREDISTRIBUTION ON ABUTMENT WALLS
FIG. 6 SHANNON & WILSON, INC.
22-1-02953-002 March 2013
Little Nespelem River Bridge Replacement
OCR #3545 Buffalo Lake Road
Okanogan County, Washington
BACKFILL COMPONENT
SURCHARGE COMPONENT
TOTAL STATIC LATERAL EQUIVALENT FLUID PRESSURES
Notes:1. All earth pressures are in units of pounds per square foot.
2. Recommended design pressures are based on subsurface
conditions encountered in borings B-1, B-2, and B-3.
3. Free drainage is assumed behind the wall.
4. Soil unit weight of 120 pounds per cubic foot
5. Soil friction angle is 30 degrees
P
= [PRESSURE VALUE] x H
R
NON-YIELDING WALL
SURCHARGE
COMPONENT
SOIL BACKFILL
COMPONENT
+
RESULTANT FORCE (P
1
2
H
0.50q
)
R
File: C
:\U
sers\m
as\D
esktop\22-1-02953-Lateral earth pressure.dw
g D
ate: 01-03-2013 A
uthor: m
as
+
GWL
COMPONENT
65 H
1
3
H
RESULTANT FORCE (P )
R
P
= [PRESSURE VALUE] x
H
2
R
H
or
H
W
W, DF
W
W, DF
1
3
H or
H
62.4H
Backfill material
SURCHARGE, q
H
H
H
W, DF
W
DesignFlood Level
Mean GWLAbu
tmen
tPi
le
GROUNDWATER COMPONENT
Legend
H = Abutment/Wingwall Height
Hw = Mean Groundwater Height
Hw,DF = Design Flood Height
q = Surcharge Behind Wall Due to
Construction and/or Traffic Loading
GWL = Groundwater Level
NOT TO SCALE

22-1-02953-002
APPENDIX A
EXPLORATORY BORING LOGS
November 2012 22-1-02953-002
Little Nespelem River Bridge ReplacementOkanogan County
Very softSoftMedium stiffStiffVery stiffHard
Trace constituents compose 0 to 5 percent ofthe soil (i.e., slightly silty SAND, trace ofgravel).
Sheet 1 of 2
DESCRIPTION SIEVE NUMBER AND/OR SIZE
COARSE-GRAINED SOILS
GRAIN SIZE DEFINITION
0 - 44 - 10
10 - 3030 - 50
Over 50
Under 22 - 44 - 8
8 - 1515 - 30
Over 30
ABBREVIATIONS
Very looseLooseMedium denseDenseVery dense
RELATIVEDENSITY
#4 to 3/4 inch (5 to 19 mm)3/4 to 3 inches (19 to 76 mm)
3 to 12 inches (76 to 305 mm)
> 12 inches (305 mm)
- Fine- Medium- Coarse
Dry
Moist
Wet
Absence of moisture, dusty, dryto the touch
Damp but no visible water
Visible free water, from belowwater table
SHANNON & WILSON, INC.
FINES
Minor constituents compose 12 to 50 percentof the soil and precede the major constituents(i.e., silty SAND). Minor constituentspreceded by "slightly" compose 5 to 12percent of the soil (i.e., slightly silty SAND).
WELL AND OTHER SYMBOLS
#200 to #40 (0.08 to 0.4 mm)#40 to #10 (0.4 to 2 mm)#10 to #4 (2 to 5 mm)
BOULDERS
- Fine- Coarse
FINE-GRAINED SOILS
S&W CLASSIFICATIONOF SOIL CONSTITUENTS
MOISTURE CONTENT DEFINITIONS
GRAVEL*
Bent. Cement Grout
Bentonite Grout
Bentonite Chips
Silica Sand
PVC Screen
Vibrating Wire
Surface Cement
Asphalt or Cap
Slough
Bedrock
Seal
* Unless otherwise noted, sand and gravel, whenpresent, range from fine to coarse in grain size.
COBBLES
Geotechnical and Environmental Consultants
RELATIVECONSISTENCY
N, SPT,BLOWS/FT.
N, SPT,BLOWS/FT.
SOIL CLASSIFICATIONAND LOG KEY
SAND*
RELATIVE DENSITY / CONSISTENCY
MAJOR constituents compose more than 50percent, by weight, of the soil. Majorconsituents are capitalized (i.e., SAND).
< #200 (0.08 mm)
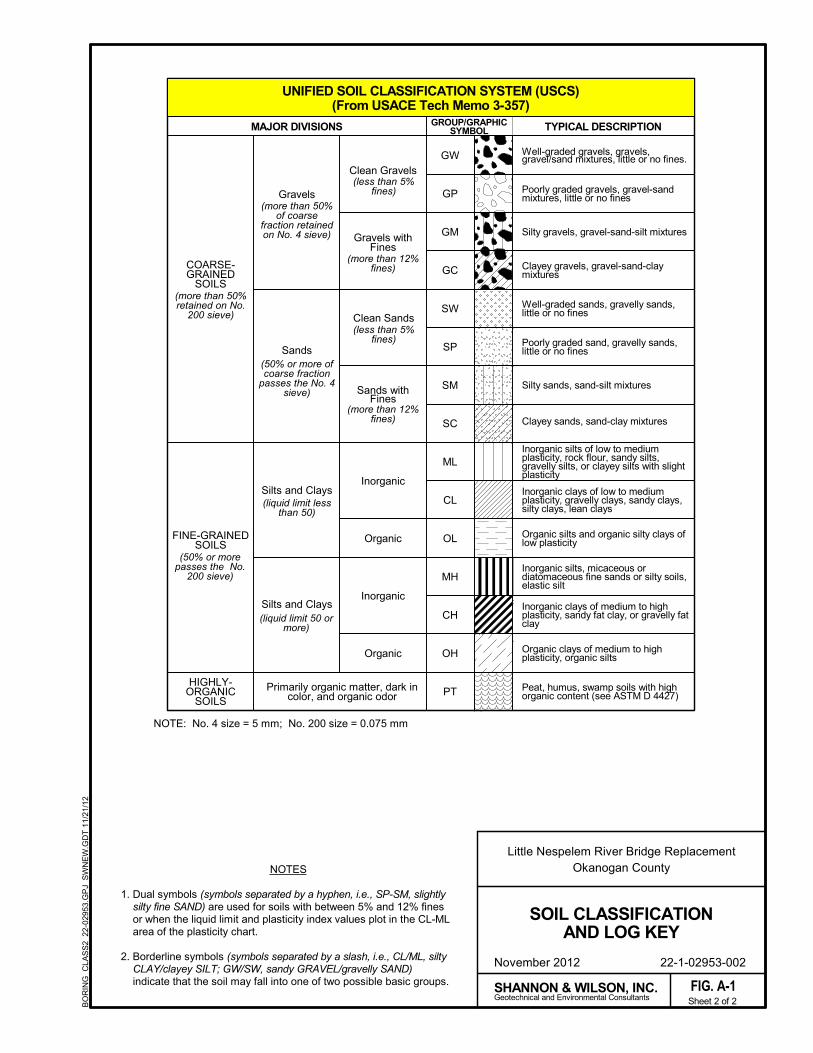
Shannon & Wilson, Inc. (S&W), uses a soilclassification system modified from the UnifiedSoil Classification System (USCS). Elements ofthe USCS and other definitions are provided onthis and the following page. Soil descriptionsare based on visual-manual procedures (ASTMD 2488-93) unless otherwise noted.
FIG. A-1
At Time of Drilling
Elevation
feet
Iron Oxide
Magnesium Oxide
Hollow Stem Auger
Inside Diameter
inches
pounds
Monument cover
Blows for last two 6-inch increments
Not applicable or not available
North American Datum (year)
North American Vertical Datum (year)
National Geodetic Vertical Datum (year)
Non plastic
Outside diameter
Organic vapor analyzer
Photo-ionization detector
parts per million
Polyvinyl Chloride
Split spoon sampler
Standard penetration test
Unified soil classification
Weight of hammer
Weight of drill rods
ATD
Elev.
ft
FeO
MgO
HSA
ID
in
lbs
Mon.
N
NA
NAD
NAVD
NGVD
NP
OD
OVA
PID
ppm
PVC
SS
SPT
USC
WOH
WOR
BO
RIN
G_C
LAS
S1
22-
0295
3.G
PJ
SW
NE
W.G
DT
11
/21/
12
November 2012 22-1-02953-002
Little Nespelem River Bridge ReplacementOkanogan County
GC
Well-graded gravels, gravels,gravel/sand mixtures, little or no fines.
SC
Inorganic
Gravels withFines
Organic
Poorly graded sand, gravelly sands,little or no fines
Silty sands, sand-silt mixtures
(more than 50%of coarse
fraction retainedon No. 4 sieve)
MAJOR DIVISIONS
SOIL CLASSIFICATIONAND LOG KEY
GROUP/GRAPHICSYMBOL TYPICAL DESCRIPTION
CH
OH
NOTES
1. Dual symbols (symbols separated by a hyphen, i.e., SP-SM, slightlysilty fine SAND) are used for soils with between 5% and 12% finesor when the liquid limit and plasticity index values plot in the CL-MLarea of the plasticity chart.
2. Borderline symbols (symbols separated by a slash, i.e., CL/ML, siltyCLAY/clayey SILT; GW/SW, sandy GRAVEL/gravelly SAND)indicate that the soil may fall into one of two possible basic groups.
ML
CL
Gravels
Clean Gravels
Primarily organic matter, dark incolor, and organic odor
SW
Clayey gravels, gravel-sand-claymixtures
Well-graded sands, gravelly sands,little or no fines
(more than 12%fines)
Silts and Clays
Silts and Clays
(more than 50%retained on No.
200 sieve)
(50% or more ofcoarse fraction
passes the No. 4sieve)
(liquid limit lessthan 50)
(liquid limit 50 ormore)
Organic
Inorganic
FINE-GRAINEDSOILS
Organic silts and organic silty clays oflow plasticity
SM
Sands
Clayey sands, sand-clay mixtures
Inorganic silts of low to mediumplasticity, rock flour, sandy silts,gravelly silts, or clayey silts with slightplasticity
Sheet 2 of 2
HIGHLY-ORGANIC
SOILS
COARSE-GRAINED
SOILS
OL
Peat, humus, swamp soils with highorganic content (see ASTM D 4427)
(less than 5%fines)
Poorly graded gravels, gravel-sandmixtures, little or no fines
Silty gravels, gravel-sand-silt mixtures
GW
Geotechnical and Environmental ConsultantsSHANNON & WILSON, INC.
Inorganic clays of low to mediumplasticity, gravelly clays, sandy clays,silty clays, lean clays
Inorganic silts, micaceous ordiatomaceous fine sands or silty soils,elastic silt
(less than 5%fines)
PT
(50% or morepasses the No.
200 sieve)
(more than 12%fines)
Sands withFines
Clean Sands
Organic clays of medium to highplasticity, organic silts
MH
SP
GP
GM
Inorganic clays of medium to highplasticity, sandy fat clay, or gravelly fatclay
FIG. A-1
BO
RIN
G_C
LAS
S2
22-
0295
3.G
PJ
SW
NE
W.G
DT
11
/21/
12
NOTE: No. 4 size = 5 mm; No. 200 size = 0.075 mm
UNIFIED SOIL CLASSIFICATION SYSTEM (USCS)(From USACE Tech Memo 3-357)
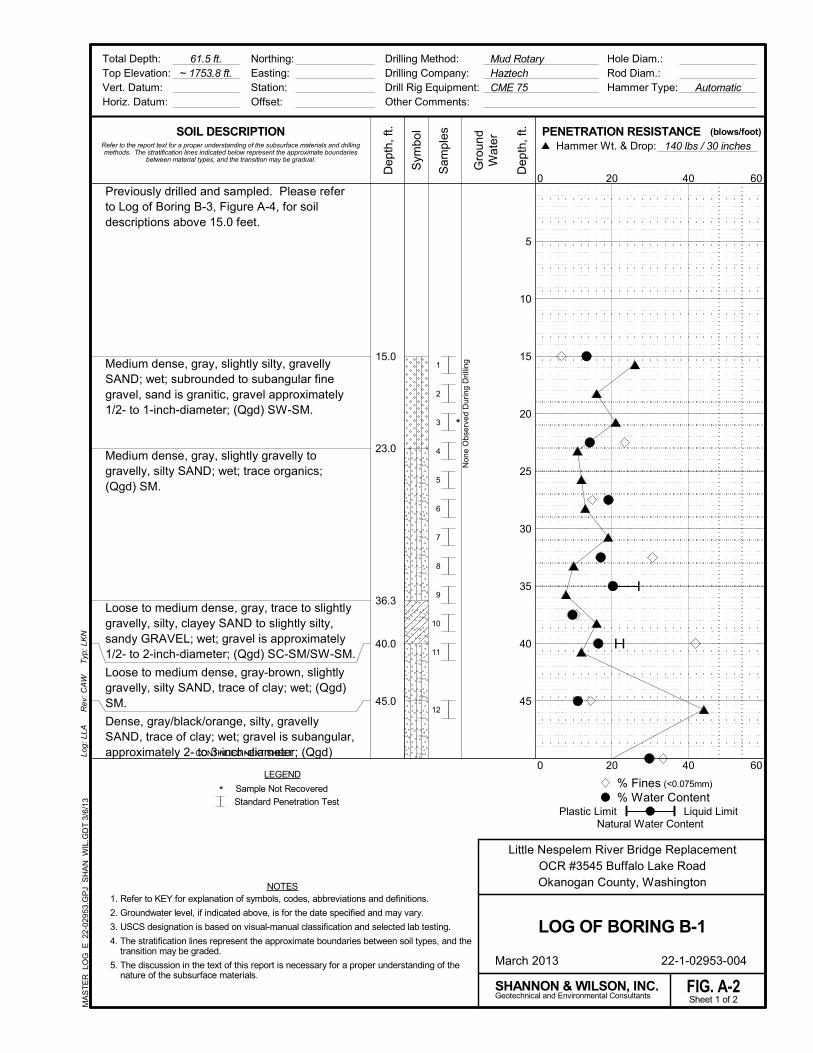
Previously drilled and sampled. Please referto Log of Boring B-3, Figure A-4, for soildescriptions above 15.0 feet.
Medium dense, gray, slightly silty, gravellySAND; wet; subrounded to subangular finegravel, sand is granitic, gravel approximately1/2- to 1-inch-diameter; (Qgd) SW-SM.
Medium dense, gray, slightly gravelly togravelly, silty SAND; wet; trace organics;(Qgd) SM.
Loose to medium dense, gray, trace to slightlygravelly, silty, clayey SAND to slightly silty,sandy GRAVEL; wet; gravel is approximately1/2- to 2-inch-diameter; (Qgd) SC-SM/SW-SM.
Loose to medium dense, gray-brown, slightlygravelly, silty SAND, trace of clay; wet; (Qgd)SM.
Dense, gray/black/orange, silty, gravellySAND, trace of clay; wet; gravel is subangular,approximately 2- to 3-inch-diameter; (Qgd)
1
2
3
4
5
6
7
8
9
10
11
12
Non
e O
bser
ved
Dur
ing
Dril
ling
*
15.0
23.0
36.3
40.0
45.0
Drilling Method:Drilling Company:Drill Rig Equipment:Other Comments:
Log:
LLA
Northing:Easting:Station:Offset:
SHANNON & WILSON, INC.
61.5 ft.~ 1753.8 ft.
Sheet 1 of 2
CONTINUED NEXT SHEET
20 40
Rev
: CA
W
SOIL DESCRIPTION
20 40 60
Sam
ples
Automatic
5
10
15
20
25
30
35
40
45
Standard Penetration Test
FIG. A-2
Hole Diam.:Rod Diam.:Hammer Type:
LEGEND
Sym
bol
NOTES
Mud RotaryHaztechCME 75
Refer to the report text for a proper understanding of the subsurface materials and drillingmethods. The stratification lines indicated below represent the approximate boundaries
between material types, and the transition may be gradual.
*
LOG OF BORING B-1
0 60
0
Total Depth:Top Elevation:Vert. Datum:Horiz. Datum:
March 2013 22-1-02953-004
Typ
: LK
N
Geotechnical and Environmental Consultants
Sample Not Recovered
Gro
und
Wat
er
Dep
th, f
t.
Little Nespelem River Bridge ReplacementOCR #3545 Buffalo Lake RoadOkanogan County, Washington
Dep
th, f
t.
1. Refer to KEY for explanation of symbols, codes, abbreviations and definitions.
2. Groundwater level, if indicated above, is for the date specified and may vary.
3. USCS designation is based on visual-manual classification and selected lab testing.
4. The stratification lines represent the approximate boundaries between soil types, and thetransition may be graded.
5. The discussion in the text of this report is necessary for a proper understanding of thenature of the subsurface materials.
MA
ST
ER
_LO
G_E
22-
029
53.G
PJ
SH
AN
_WIL
.GD
T 3
/6/1
3
PENETRATION RESISTANCE Hammer Wt. & Drop: 140 lbs / 30 inches
(blows/foot)
% Water ContentLiquid LimitPlastic Limit
Natural Water Content
% Fines (<0.075mm)
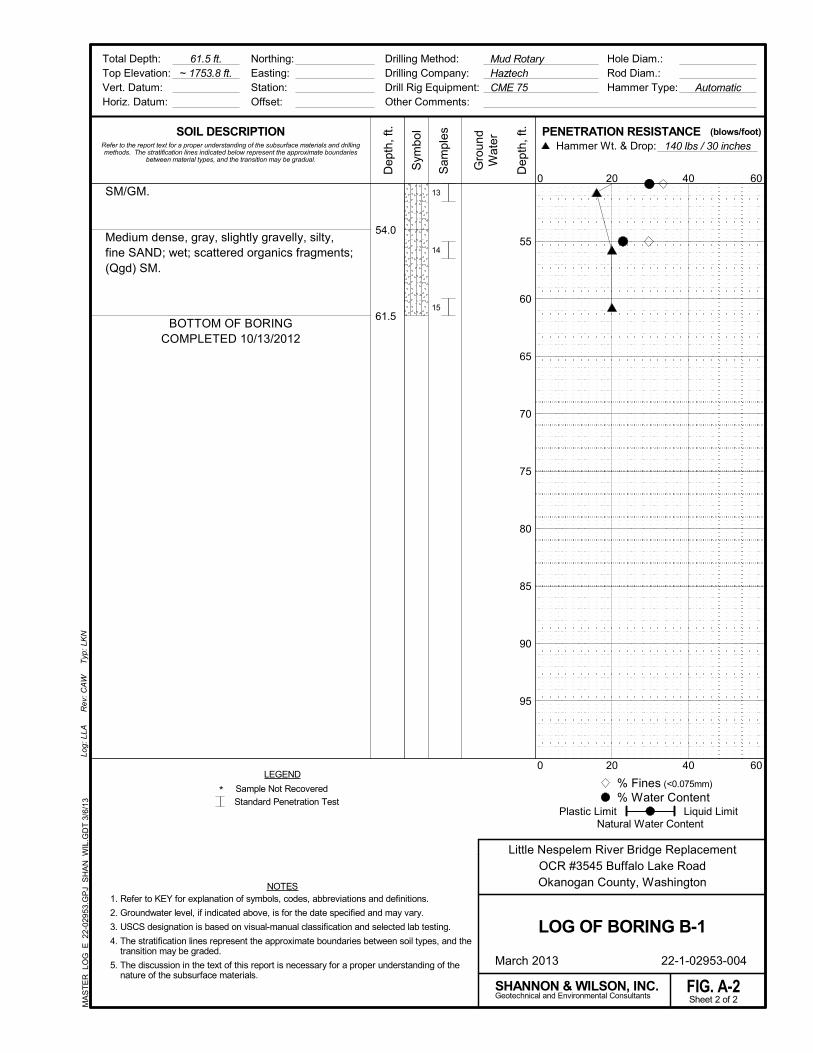
SM/GM.
Medium dense, gray, slightly gravelly, silty,fine SAND; wet; scattered organics fragments;(Qgd) SM.
BOTTOM OF BORINGCOMPLETED 10/13/2012
13
14
15
54.0
61.5
Drilling Method:Drilling Company:Drill Rig Equipment:Other Comments:
Log:
LLA
Northing:Easting:Station:Offset:
SHANNON & WILSON, INC.
61.5 ft.~ 1753.8 ft.
Sheet 2 of 2
20 40
Rev
: CA
W
SOIL DESCRIPTION
20 40 60
Sam
ples
Automatic
55
60
65
70
75
80
85
90
95
Standard Penetration Test
FIG. A-2
Hole Diam.:Rod Diam.:Hammer Type:
LEGEND
Sym
bol
NOTES
Mud RotaryHaztechCME 75
Refer to the report text for a proper understanding of the subsurface materials and drillingmethods. The stratification lines indicated below represent the approximate boundaries
between material types, and the transition may be gradual.
*
LOG OF BORING B-1
0 60
0
Total Depth:Top Elevation:Vert. Datum:Horiz. Datum:
March 2013 22-1-02953-004
Typ
: LK
N
Geotechnical and Environmental Consultants
Sample Not Recovered
Gro
und
Wat
er
Dep
th, f
t.
Little Nespelem River Bridge ReplacementOCR #3545 Buffalo Lake RoadOkanogan County, Washington
Dep
th, f
t.
1. Refer to KEY for explanation of symbols, codes, abbreviations and definitions.
2. Groundwater level, if indicated above, is for the date specified and may vary.
3. USCS designation is based on visual-manual classification and selected lab testing.
4. The stratification lines represent the approximate boundaries between soil types, and thetransition may be graded.
5. The discussion in the text of this report is necessary for a proper understanding of thenature of the subsurface materials.
MA
ST
ER
_LO
G_E
22-
029
53.G
PJ
SH
AN
_WIL
.GD
T 3
/6/1
3
PENETRATION RESISTANCE Hammer Wt. & Drop: 140 lbs / 30 inches
(blows/foot)
% Water ContentLiquid LimitPlastic Limit
Natural Water Content
% Fines (<0.075mm)
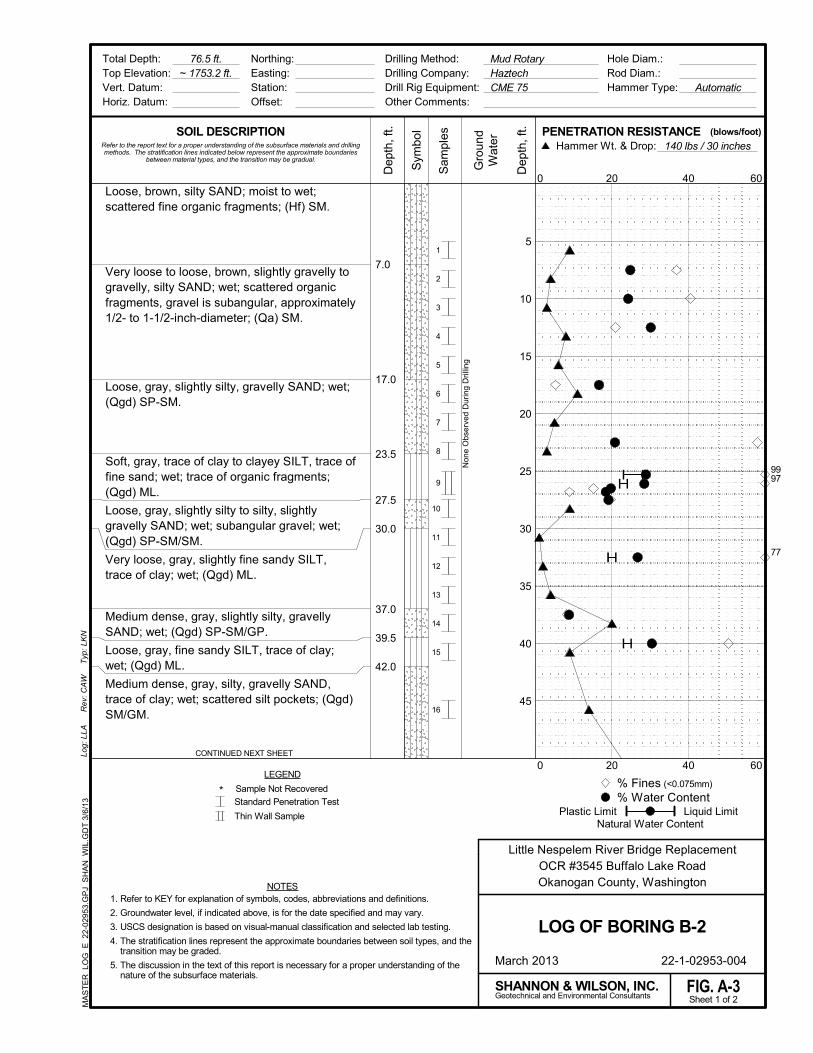
Loose, brown, silty SAND; moist to wet;scattered fine organic fragments; (Hf) SM.
Very loose to loose, brown, slightly gravelly togravelly, silty SAND; wet; scattered organicfragments, gravel is subangular, approximately1/2- to 1-1/2-inch-diameter; (Qa) SM.
Loose, gray, slightly silty, gravelly SAND; wet;(Qgd) SP-SM.
Soft, gray, trace of clay to clayey SILT, trace offine sand; wet; trace of organic fragments;(Qgd) ML.
Loose, gray, slightly silty to silty, slightlygravelly SAND; wet; subangular gravel; wet;(Qgd) SP-SM/SM.
Very loose, gray, slightly fine sandy SILT,trace of clay; wet; (Qgd) ML.
Medium dense, gray, slightly silty, gravellySAND; wet; (Qgd) SP-SM/GP.
Loose, gray, fine sandy SILT, trace of clay;wet; (Qgd) ML.
Medium dense, gray, silty, gravelly SAND,trace of clay; wet; scattered silt pockets; (Qgd)SM/GM.
1
2
3
4
5
6
7
8
9
10
11
12
13
14
15
16
Non
e O
bser
ved
Dur
ing
Dril
ling
7.0
17.0
23.5
27.5
30.0
37.0
39.5
42.0
Drilling Method:Drilling Company:Drill Rig Equipment:Other Comments:
Log:
LLA
Northing:Easting:Station:Offset:
SHANNON & WILSON, INC.
76.5 ft.~ 1753.2 ft.
Sheet 1 of 2
CONTINUED NEXT SHEET
20 40
Rev
: CA
W
SOIL DESCRIPTION
20 40 60
Sam
ples
Automatic
5
10
15
20
25
30
35
40
45
Standard Penetration Test
Thin Wall Sample
FIG. A-3
Hole Diam.:Rod Diam.:Hammer Type:
LEGEND
Sym
bol
NOTES
Mud RotaryHaztechCME 75
Refer to the report text for a proper understanding of the subsurface materials and drillingmethods. The stratification lines indicated below represent the approximate boundaries
between material types, and the transition may be gradual.
*
LOG OF BORING B-2
0 60
0
Total Depth:Top Elevation:Vert. Datum:Horiz. Datum:
March 2013 22-1-02953-004
Typ
: LK
N
Geotechnical and Environmental Consultants
Sample Not Recovered
Gro
und
Wat
er
Dep
th, f
t.
Little Nespelem River Bridge ReplacementOCR #3545 Buffalo Lake RoadOkanogan County, Washington
Dep
th, f
t.
1. Refer to KEY for explanation of symbols, codes, abbreviations and definitions.
2. Groundwater level, if indicated above, is for the date specified and may vary.
3. USCS designation is based on visual-manual classification and selected lab testing.
4. The stratification lines represent the approximate boundaries between soil types, and thetransition may be graded.
5. The discussion in the text of this report is necessary for a proper understanding of thenature of the subsurface materials.
MA
ST
ER
_LO
G_E
22-
029
53.G
PJ
SH
AN
_WIL
.GD
T 3
/6/1
3
PENETRATION RESISTANCE Hammer Wt. & Drop: 140 lbs / 30 inches
(blows/foot)
% Water ContentLiquid LimitPlastic Limit
Natural Water Content
% Fines (<0.075mm)
9997
77
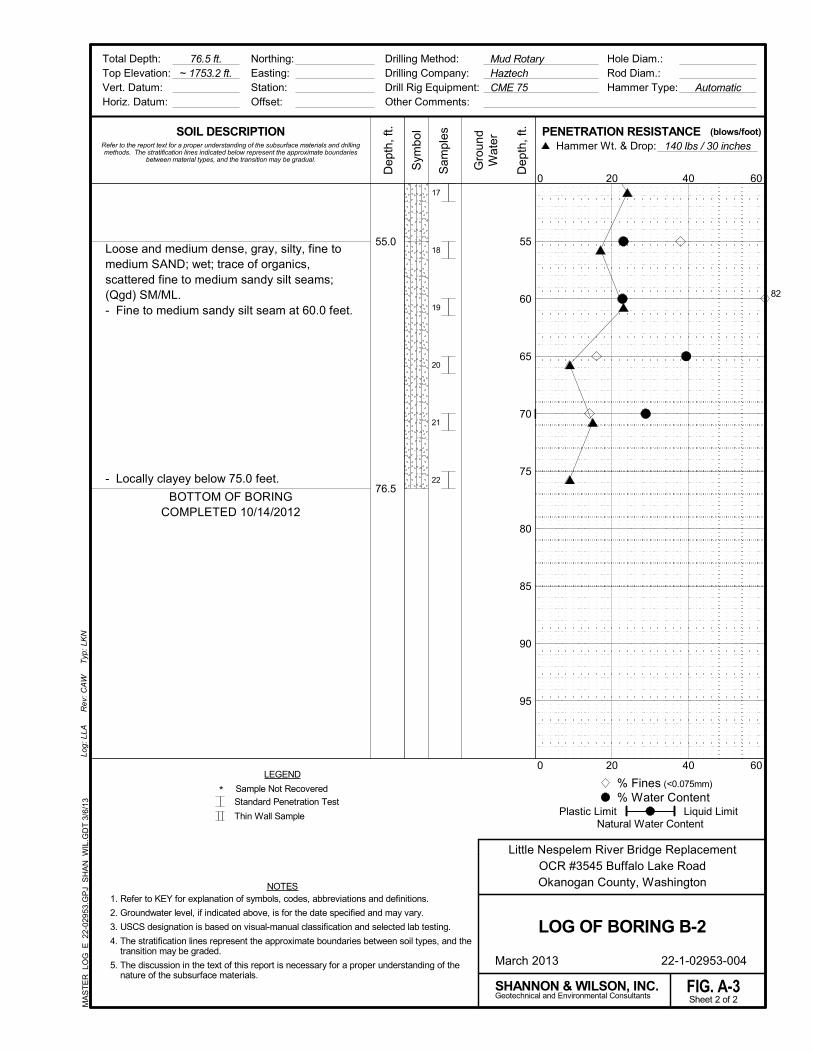
Loose and medium dense, gray, silty, fine tomedium SAND; wet; trace of organics,scattered fine to medium sandy silt seams;(Qgd) SM/ML.- Fine to medium sandy silt seam at 60.0 feet.
- Locally clayey below 75.0 feet.
BOTTOM OF BORINGCOMPLETED 10/14/2012
17
18
19
20
21
22
55.0
76.5
Drilling Method:Drilling Company:Drill Rig Equipment:Other Comments:
Log:
LLA
Northing:Easting:Station:Offset:
SHANNON & WILSON, INC.
76.5 ft.~ 1753.2 ft.
Sheet 2 of 2
20 40
Rev
: CA
W
SOIL DESCRIPTION
20 40 60
Sam
ples
Automatic
55
60
65
70
75
80
85
90
95
Standard Penetration Test
Thin Wall Sample
FIG. A-3
Hole Diam.:Rod Diam.:Hammer Type:
LEGEND
Sym
bol
NOTES
Mud RotaryHaztechCME 75
Refer to the report text for a proper understanding of the subsurface materials and drillingmethods. The stratification lines indicated below represent the approximate boundaries
between material types, and the transition may be gradual.
*
LOG OF BORING B-2
0 60
0
Total Depth:Top Elevation:Vert. Datum:Horiz. Datum:
March 2013 22-1-02953-004
Typ
: LK
N
Geotechnical and Environmental Consultants
Sample Not Recovered
Gro
und
Wat
er
Dep
th, f
t.
Little Nespelem River Bridge ReplacementOCR #3545 Buffalo Lake RoadOkanogan County, Washington
Dep
th, f
t.
1. Refer to KEY for explanation of symbols, codes, abbreviations and definitions.
2. Groundwater level, if indicated above, is for the date specified and may vary.
3. USCS designation is based on visual-manual classification and selected lab testing.
4. The stratification lines represent the approximate boundaries between soil types, and thetransition may be graded.
5. The discussion in the text of this report is necessary for a proper understanding of thenature of the subsurface materials.
MA
ST
ER
_LO
G_E
22-
029
53.G
PJ
SH
AN
_WIL
.GD
T 3
/6/1
3
PENETRATION RESISTANCE Hammer Wt. & Drop: 140 lbs / 30 inches
(blows/foot)
% Water ContentLiquid LimitPlastic Limit
Natural Water Content
% Fines (<0.075mm)
82
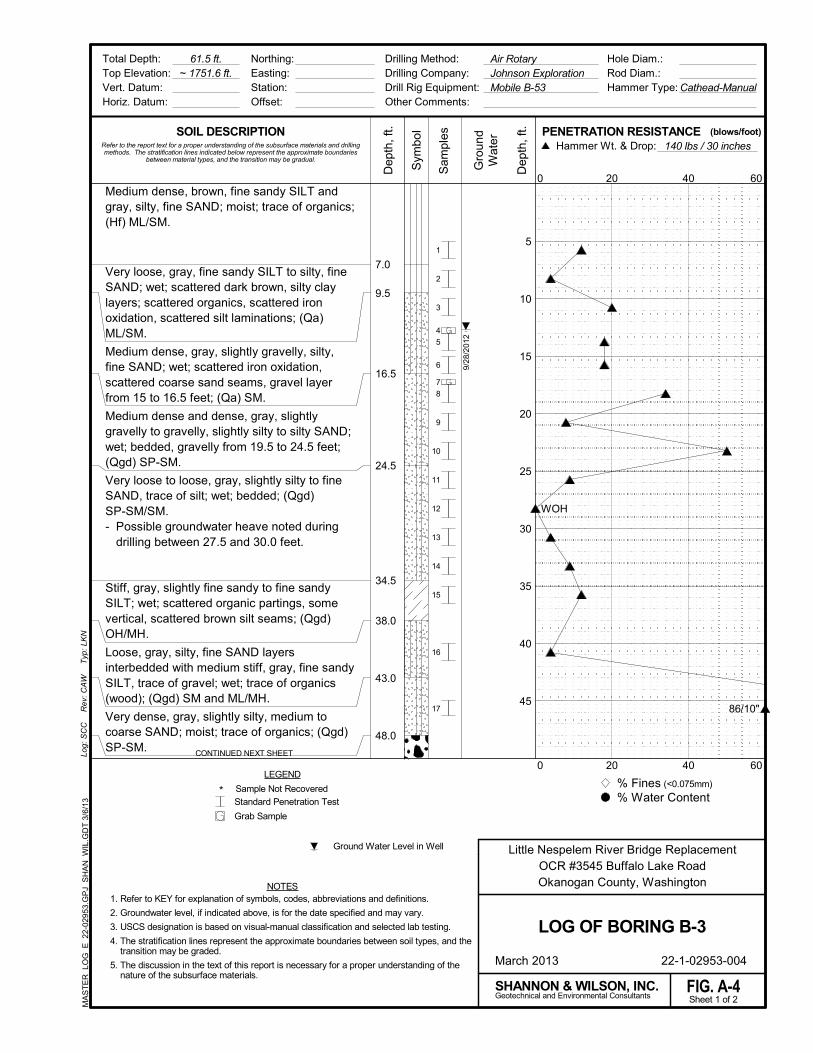
Medium dense, brown, fine sandy SILT andgray, silty, fine SAND; moist; trace of organics;(Hf) ML/SM.
Very loose, gray, fine sandy SILT to silty, fineSAND; wet; scattered dark brown, silty claylayers; scattered organics, scattered ironoxidation, scattered silt laminations; (Qa)ML/SM.
Medium dense, gray, slightly gravelly, silty,fine SAND; wet; scattered iron oxidation,scattered coarse sand seams, gravel layerfrom 15 to 16.5 feet; (Qa) SM.
Medium dense and dense, gray, slightlygravelly to gravelly, slightly silty to silty SAND;wet; bedded, gravelly from 19.5 to 24.5 feet;(Qgd) SP-SM.
Very loose to loose, gray, slightly silty to fineSAND, trace of silt; wet; bedded; (Qgd)SP-SM/SM.- Possible groundwater heave noted during
drilling between 27.5 and 30.0 feet.
Stiff, gray, slightly fine sandy to fine sandySILT; wet; scattered organic partings, somevertical, scattered brown silt seams; (Qgd)OH/MH.
Loose, gray, silty, fine SAND layersinterbedded with medium stiff, gray, fine sandySILT, trace of gravel; wet; trace of organics(wood); (Qgd) SM and ML/MH.
Very dense, gray, slightly silty, medium tocoarse SAND; moist; trace of organics; (Qgd)SP-SM.
9/28
/201
2
1
2
3
4
5
6
7
8
9
10
11
12
13
14
15
16
17
7.0
9.5
16.5
24.5
34.5
38.0
43.0
48.0
Drilling Method:Drilling Company:Drill Rig Equipment:Other Comments:
Log:
SC
C
Northing:Easting:Station:Offset:
SHANNON & WILSON, INC.
61.5 ft.~ 1751.6 ft.
Sheet 1 of 2
CONTINUED NEXT SHEET
20 40
Rev
: CA
W
SOIL DESCRIPTION
20 40 60
Sam
ples
Cathead-Manual
5
10
15
20
25
30
35
40
45
Standard Penetration Test
Grab Sample
FIG. A-4
Hole Diam.:Rod Diam.:Hammer Type:
LEGEND
Sym
bol
Ground Water Level in Well
NOTES
Air RotaryJohnson ExplorationMobile B-53
Refer to the report text for a proper understanding of the subsurface materials and drillingmethods. The stratification lines indicated below represent the approximate boundaries
between material types, and the transition may be gradual.
*
LOG OF BORING B-3
0 60
0
Total Depth:Top Elevation:Vert. Datum:Horiz. Datum:
March 2013 22-1-02953-004
Typ
: LK
N
Geotechnical and Environmental Consultants
Sample Not Recovered
Gro
und
Wat
er
Dep
th, f
t.
Little Nespelem River Bridge ReplacementOCR #3545 Buffalo Lake RoadOkanogan County, Washington
Dep
th, f
t.
1. Refer to KEY for explanation of symbols, codes, abbreviations and definitions.
2. Groundwater level, if indicated above, is for the date specified and may vary.
3. USCS designation is based on visual-manual classification and selected lab testing.
4. The stratification lines represent the approximate boundaries between soil types, and thetransition may be graded.
5. The discussion in the text of this report is necessary for a proper understanding of thenature of the subsurface materials.
MA
ST
ER
_LO
G_E
22-
029
53.G
PJ
SH
AN
_WIL
.GD
T 3
/6/1
3
PENETRATION RESISTANCE Hammer Wt. & Drop: 140 lbs / 30 inches
(blows/foot)
% Water Content % Fines (<0.075mm)
WOH
86/10"
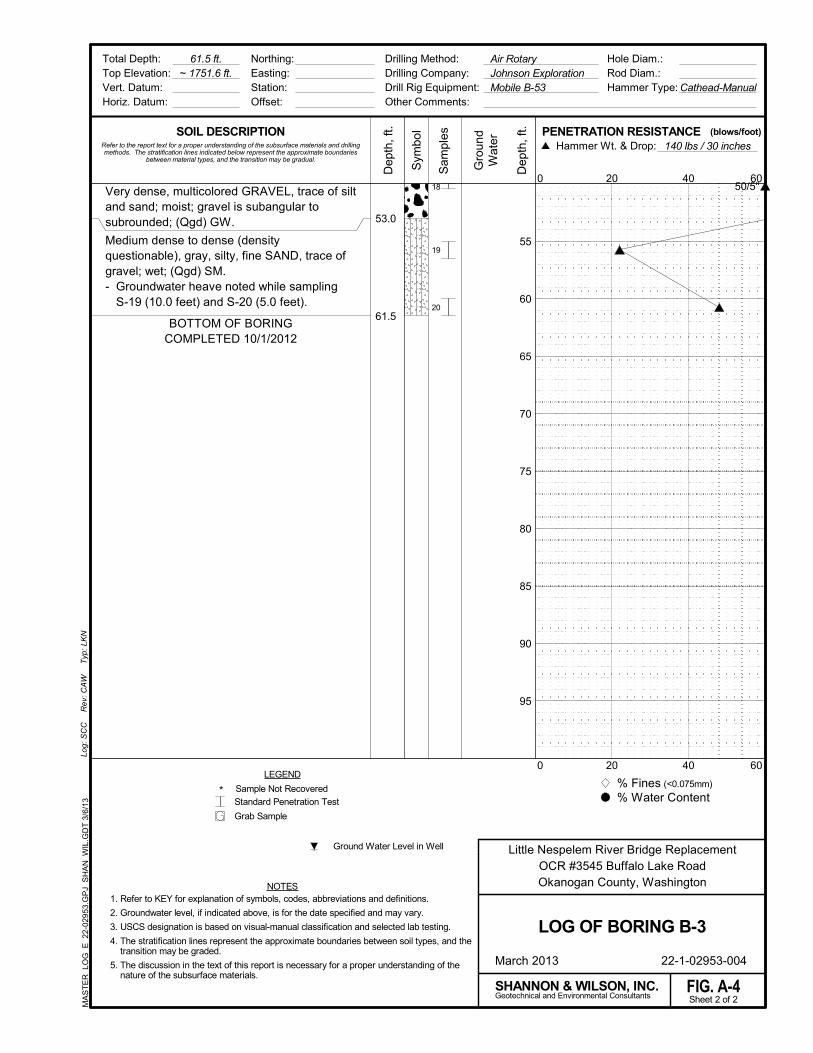
Very dense, multicolored GRAVEL, trace of siltand sand; moist; gravel is subangular tosubrounded; (Qgd) GW.
Medium dense to dense (densityquestionable), gray, silty, fine SAND, trace ofgravel; wet; (Qgd) SM.- Groundwater heave noted while sampling
S-19 (10.0 feet) and S-20 (5.0 feet).
BOTTOM OF BORINGCOMPLETED 10/1/2012
18
19
20
53.0
61.5
Drilling Method:Drilling Company:Drill Rig Equipment:Other Comments:
Log:
SC
C
Northing:Easting:Station:Offset:
SHANNON & WILSON, INC.
61.5 ft.~ 1751.6 ft.
Sheet 2 of 2
20 40
Rev
: CA
W
SOIL DESCRIPTION
20 40 60
Sam
ples
Cathead-Manual
55
60
65
70
75
80
85
90
95
Standard Penetration Test
Grab Sample
FIG. A-4
Hole Diam.:Rod Diam.:Hammer Type:
LEGEND
Sym
bol
Ground Water Level in Well
NOTES
Air RotaryJohnson ExplorationMobile B-53
Refer to the report text for a proper understanding of the subsurface materials and drillingmethods. The stratification lines indicated below represent the approximate boundaries
between material types, and the transition may be gradual.
*
LOG OF BORING B-3
0 60
0
Total Depth:Top Elevation:Vert. Datum:Horiz. Datum:
March 2013 22-1-02953-004
Typ
: LK
N
Geotechnical and Environmental Consultants
Sample Not Recovered
Gro
und
Wat
er
Dep
th, f
t.
Little Nespelem River Bridge ReplacementOCR #3545 Buffalo Lake RoadOkanogan County, Washington
Dep
th, f
t.
1. Refer to KEY for explanation of symbols, codes, abbreviations and definitions.
2. Groundwater level, if indicated above, is for the date specified and may vary.
3. USCS designation is based on visual-manual classification and selected lab testing.
4. The stratification lines represent the approximate boundaries between soil types, and thetransition may be graded.
5. The discussion in the text of this report is necessary for a proper understanding of thenature of the subsurface materials.
MA
ST
ER
_LO
G_E
22-
029
53.G
PJ
SH
AN
_WIL
.GD
T 3
/6/1
3
PENETRATION RESISTANCE Hammer Wt. & Drop: 140 lbs / 30 inches
(blows/foot)
% Water Content % Fines (<0.075mm)
50/5"

22-1-02953-002
APPENDIX B
LABORATORY TEST RESULTS
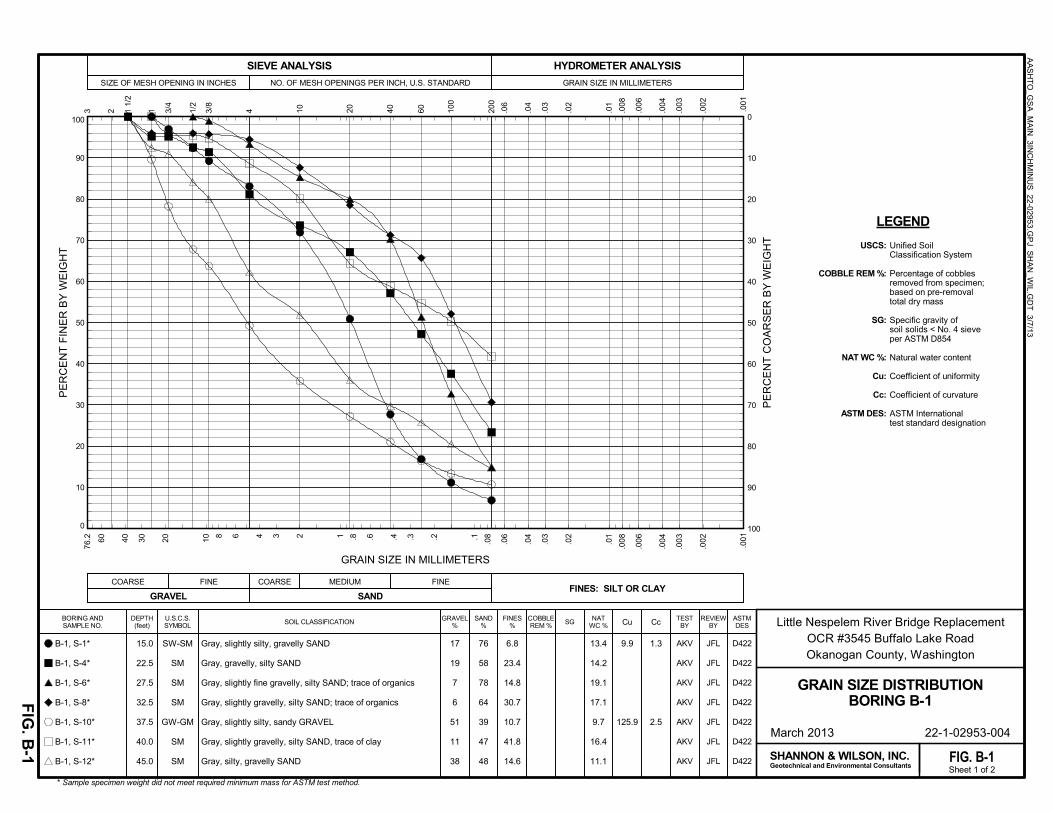
0
10
20
30
40
50
60
70
80
90
100
1/2
40
4 3 .6
.04
2 3/8
4 10 20 .04
.03
.008
76.2 2 .4
.08
.003
100
90
80
70
60
50
40
30
20
10
0
HYDROMETER ANALYSIS
GRAIN SIZE IN MILLIMETERS
1 1/
2
PE
RC
EN
T C
OA
RS
ER
BY
WE
IGH
T
SAND%
FINES%
COBBLEREM %
NATWC %
FINES: SILT OR CLAY
March 2013 22-1-02953-004
AA
SH
TO
_GS
A_M
AIN
_3INC
HM
INU
S 22-029
53.GP
J SH
AN
_WIL.G
DT
3/7/13
FIG
. B-1
Little Nespelem River Bridge ReplacementOCR #3545 Buffalo Lake RoadOkanogan County, Washington
BORING ANDSAMPLE NO.
GRAVEL%
LEGEND
200
.06
.02
.006
.004
.003
30
6 .3 .2
100
.01
.002
GRAVEL
FINE COARSECOARSE
USCS:
COBBLE REM %:
SG:
NAT WC %:
Cu:
Cc:
ASTM DES:
Unified SoilClassification System
Percentage of cobblesremoved from specimen;based on pre-removaltotal dry mass
Specific gravity ofsoil solids < No. 4 sieveper ASTM D854
Natural water content
Coefficient of uniformity
Coefficient of curvature
ASTM Internationaltest standard designation
6.8
23.4
14.8
30.7
10.7
41.8
14.6
9.9
125.9
1.3
2.5
* Sample specimen weight did not meet required minimum mass for ASTM test method.
17
19
7
6
51
11
38
60 40 20 10
8 1 .8 .1
.01
SIEVE ANALYSIS
NO. OF MESH OPENINGS PER INCH, U.S. STANDARDSIZE OF MESH OPENING IN INCHES
.06
.03
.02
.008
.006
PE
RC
EN
T F
INE
R B
Y W
EIG
HT
Gray, slightly silty, gravelly SAND
Gray, gravelly, silty SAND
Gray, slightly fine gravelly, silty SAND; trace of organics
Gray, slightly gravelly, silty SAND; trace of organics
Gray, slightly silty, sandy GRAVEL
Gray, slightly gravelly, silty SAND, trace of clay
Gray, silty, gravelly SAND
GRAIN SIZE IN MILLIMETERS
SHANNON & WILSON, INC.Geotechnical and Environmental Consultants Sheet 1 of 2
U.S.C.S.SYMBOL
DEPTH(feet)
ASTMDES
REVIEWBY
TESTBY
FIG. B-1
JFL
JFL
JFL
JFL
JFL
JFL
JFL
D422
D422
D422
D422
D422
D422
D422
SW-SM
SM
SM
SM
GW-GM
SM
SM
15.0
22.5
27.5
32.5
37.5
40.0
45.0
.004
.001
3
.002
.001
3/4
Cu CcSOIL CLASSIFICATION
13.4
14.2
19.1
17.1
9.7
16.4
11.1
AKV
AKV
AKV
AKV
AKV
AKV
AKV
SG
1 60
FINE
SAND
MEDIUM
76
58
78
64
39
47
48
B-1, S-1*
B-1, S-4*
B-1, S-6*
B-1, S-8*
B-1, S-10*
B-1, S-11*
B-1, S-12*
GRAIN SIZE DISTRIBUTIONBORING B-1
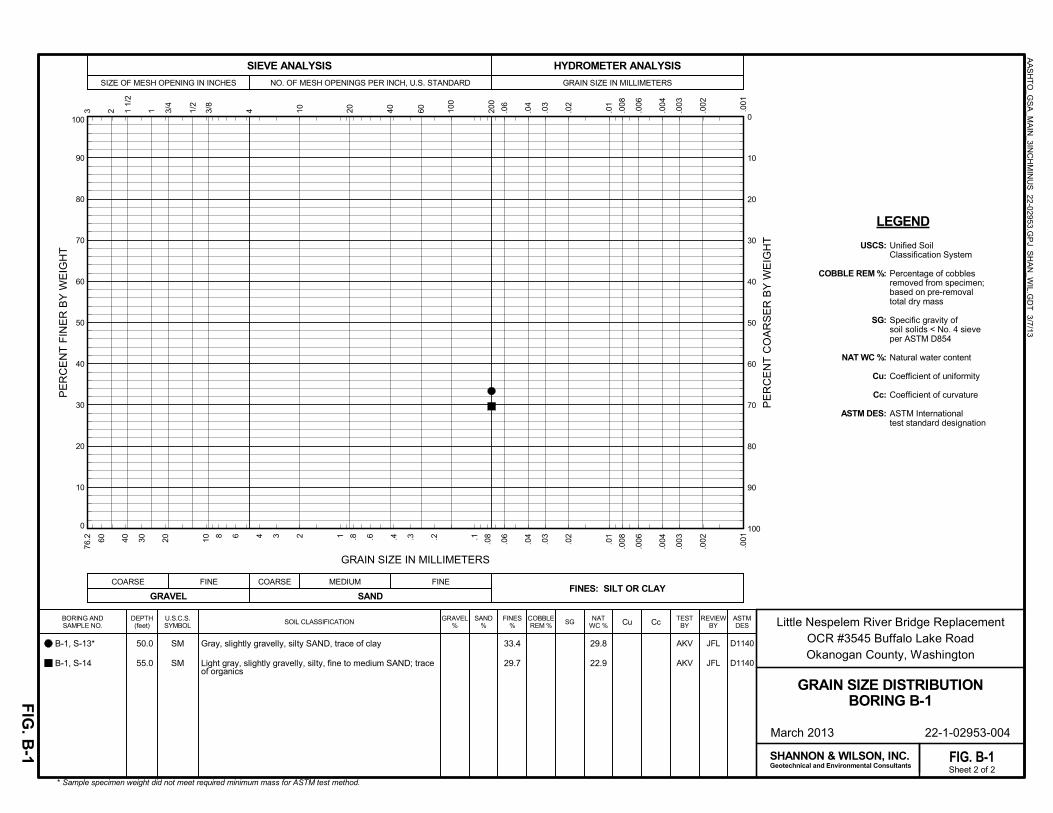
0
10
20
30
40
50
60
70
80
90
100
1/2
40
4 3 .6
.04
2 3/8
4 10 20 .04
.03
.008
76.2 2 .4
.08
.003
100
90
80
70
60
50
40
30
20
10
0
HYDROMETER ANALYSIS
GRAIN SIZE IN MILLIMETERS
1 1/
2
PE
RC
EN
T C
OA
RS
ER
BY
WE
IGH
T
SAND%
FINES%
COBBLEREM %
NATWC %
FINES: SILT OR CLAY
March 2013 22-1-02953-004
AA
SH
TO
_GS
A_M
AIN
_3INC
HM
INU
S 22-029
53.GP
J SH
AN
_WIL.G
DT
3/7/13
FIG
. B-1
Little Nespelem River Bridge ReplacementOCR #3545 Buffalo Lake RoadOkanogan County, Washington
BORING ANDSAMPLE NO.
GRAVEL%
LEGEND
200
.06
.02
.006
.004
.003
30
6 .3 .2
100
.01
.002
GRAVEL
FINE COARSECOARSE
USCS:
COBBLE REM %:
SG:
NAT WC %:
Cu:
Cc:
ASTM DES:
Unified SoilClassification System
Percentage of cobblesremoved from specimen;based on pre-removaltotal dry mass
Specific gravity ofsoil solids < No. 4 sieveper ASTM D854
Natural water content
Coefficient of uniformity
Coefficient of curvature
ASTM Internationaltest standard designation
33.4
29.7
* Sample specimen weight did not meet required minimum mass for ASTM test method.
60 40 20 10
8 1 .8 .1
.01
SIEVE ANALYSIS
NO. OF MESH OPENINGS PER INCH, U.S. STANDARDSIZE OF MESH OPENING IN INCHES
.06
.03
.02
.008
.006
PE
RC
EN
T F
INE
R B
Y W
EIG
HT
Gray, slightly gravelly, silty SAND, trace of clay
Light gray, slightly gravelly, silty, fine to medium SAND; traceof organics
GRAIN SIZE IN MILLIMETERS
SHANNON & WILSON, INC.Geotechnical and Environmental Consultants Sheet 2 of 2
U.S.C.S.SYMBOL
DEPTH(feet)
ASTMDES
REVIEWBY
TESTBY
FIG. B-1
JFL
JFL
D1140
D1140
SM
SM
50.0
55.0.0
04
.001
3
.002
.001
3/4
Cu CcSOIL CLASSIFICATION
29.8
22.9
AKV
AKV
SG
1 60
FINE
SAND
MEDIUM
B-1, S-13*
B-1, S-14
GRAIN SIZE DISTRIBUTIONBORING B-1
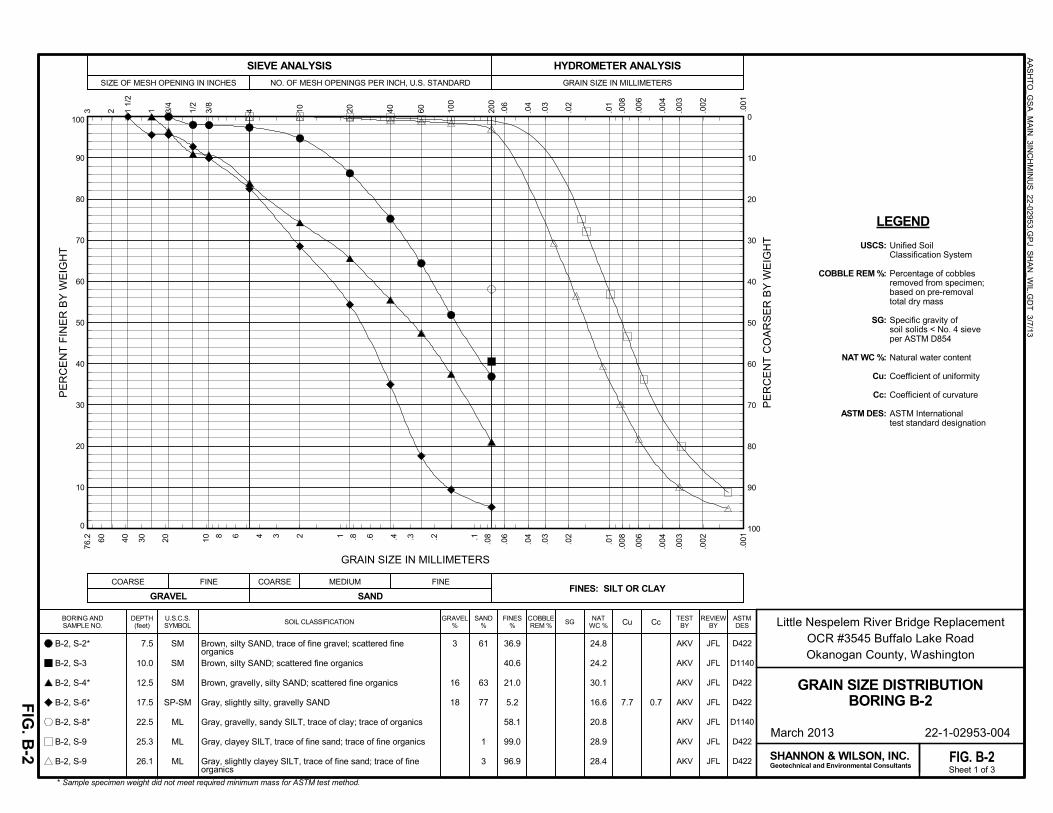
0
10
20
30
40
50
60
70
80
90
100
1/2
40
4 3 .6
.04
2 3/8
4 10 20 .04
.03
.008
76.2 2 .4
.08
.003
100
90
80
70
60
50
40
30
20
10
0
HYDROMETER ANALYSIS
GRAIN SIZE IN MILLIMETERS
1 1/
2
PE
RC
EN
T C
OA
RS
ER
BY
WE
IGH
T
SAND%
FINES%
COBBLEREM %
NATWC %
FINES: SILT OR CLAY
March 2013 22-1-02953-004
AA
SH
TO
_GS
A_M
AIN
_3INC
HM
INU
S 22-029
53.GP
J SH
AN
_WIL.G
DT
3/7/13
FIG
. B-2
Little Nespelem River Bridge ReplacementOCR #3545 Buffalo Lake RoadOkanogan County, Washington
BORING ANDSAMPLE NO.
GRAVEL%
LEGEND
200
.06
.02
.006
.004
.003
30
6 .3 .2
100
.01
.002
GRAVEL
FINE COARSECOARSE
USCS:
COBBLE REM %:
SG:
NAT WC %:
Cu:
Cc:
ASTM DES:
Unified SoilClassification System
Percentage of cobblesremoved from specimen;based on pre-removaltotal dry mass
Specific gravity ofsoil solids < No. 4 sieveper ASTM D854
Natural water content
Coefficient of uniformity
Coefficient of curvature
ASTM Internationaltest standard designation
36.9
40.6
21.0
5.2
58.1
99.0
96.9
7.7 0.7
* Sample specimen weight did not meet required minimum mass for ASTM test method.
3
16
18
60 40 20 10
8 1 .8 .1
.01
SIEVE ANALYSIS
NO. OF MESH OPENINGS PER INCH, U.S. STANDARDSIZE OF MESH OPENING IN INCHES
.06
.03
.02
.008
.006
PE
RC
EN
T F
INE
R B
Y W
EIG
HT
Brown, silty SAND, trace of fine gravel; scattered fineorganicsBrown, silty SAND; scattered fine organics
Brown, gravelly, silty SAND; scattered fine organics
Gray, slightly silty, gravelly SAND
Gray, gravelly, sandy SILT, trace of clay; trace of organics
Gray, clayey SILT, trace of fine sand; trace of fine organics
Gray, slightly clayey SILT, trace of fine sand; trace of fineorganics
GRAIN SIZE IN MILLIMETERS
SHANNON & WILSON, INC.Geotechnical and Environmental Consultants Sheet 1 of 3
U.S.C.S.SYMBOL
DEPTH(feet)
ASTMDES
REVIEWBY
TESTBY
FIG. B-2
JFL
JFL
JFL
JFL
JFL
JFL
JFL
D422
D1140
D422
D422
D1140
D422
D422
SM
SM
SM
SP-SM
ML
ML
ML
7.5
10.0
12.5
17.5
22.5
25.3
26.1
.004
.001
3
.002
.001
3/4
Cu CcSOIL CLASSIFICATION
24.8
24.2
30.1
16.6
20.8
28.9
28.4
AKV
AKV
AKV
AKV
AKV
AKV
AKV
SG
1 60
FINE
SAND
MEDIUM
61
63
77
1
3
B-2, S-2*
B-2, S-3
B-2, S-4*
B-2, S-6*
B-2, S-8*
B-2, S-9
B-2, S-9
GRAIN SIZE DISTRIBUTIONBORING B-2
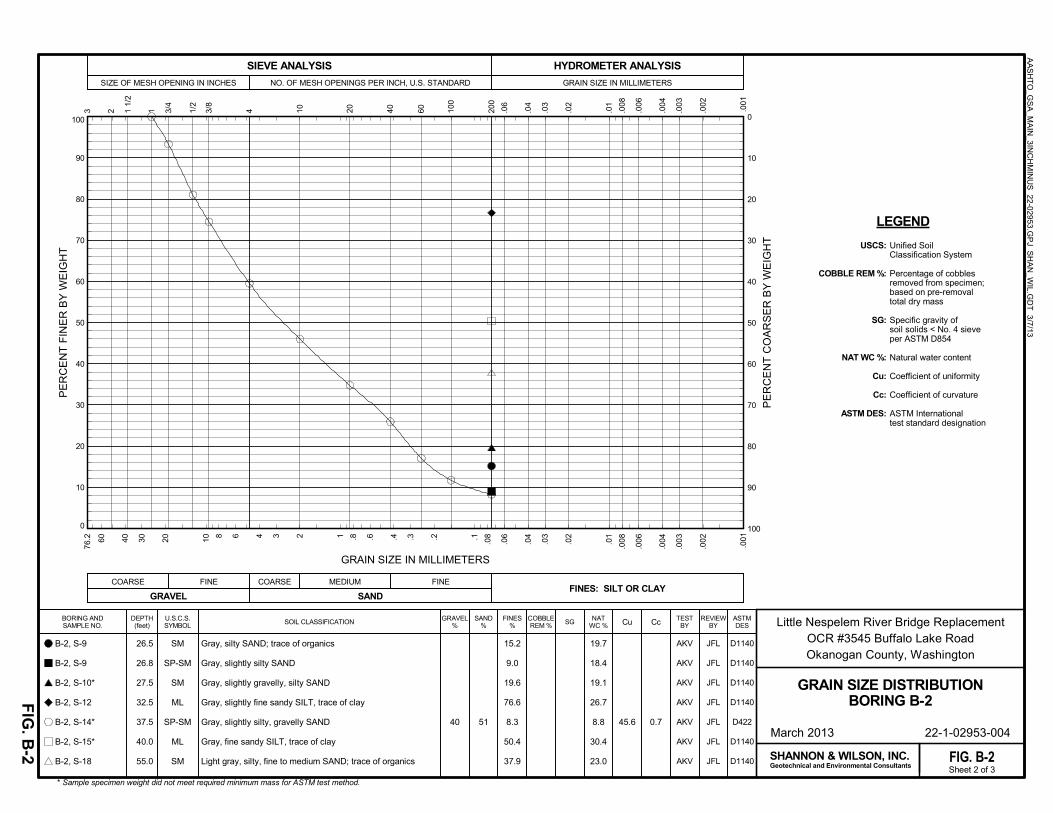
0
10
20
30
40
50
60
70
80
90
100
1/2
40
4 3 .6
.04
2 3/8
4 10 20 .04
.03
.008
76.2 2 .4
.08
.003
100
90
80
70
60
50
40
30
20
10
0
HYDROMETER ANALYSIS
GRAIN SIZE IN MILLIMETERS
1 1/
2
PE
RC
EN
T C
OA
RS
ER
BY
WE
IGH
T
SAND%
FINES%
COBBLEREM %
NATWC %
FINES: SILT OR CLAY
March 2013 22-1-02953-004
AA
SH
TO
_GS
A_M
AIN
_3INC
HM
INU
S 22-029
53.GP
J SH
AN
_WIL.G
DT
3/7/13
FIG
. B-2
Little Nespelem River Bridge ReplacementOCR #3545 Buffalo Lake RoadOkanogan County, Washington
BORING ANDSAMPLE NO.
GRAVEL%
LEGEND
200
.06
.02
.006
.004
.003
30
6 .3 .2
100
.01
.002
GRAVEL
FINE COARSECOARSE
USCS:
COBBLE REM %:
SG:
NAT WC %:
Cu:
Cc:
ASTM DES:
Unified SoilClassification System
Percentage of cobblesremoved from specimen;based on pre-removaltotal dry mass
Specific gravity ofsoil solids < No. 4 sieveper ASTM D854
Natural water content
Coefficient of uniformity
Coefficient of curvature
ASTM Internationaltest standard designation
15.2
9.0
19.6
76.6
8.3
50.4
37.9
45.6 0.7
* Sample specimen weight did not meet required minimum mass for ASTM test method.
40
60 40 20 10
8 1 .8 .1
.01
SIEVE ANALYSIS
NO. OF MESH OPENINGS PER INCH, U.S. STANDARDSIZE OF MESH OPENING IN INCHES
.06
.03
.02
.008
.006
PE
RC
EN
T F
INE
R B
Y W
EIG
HT
Gray, silty SAND; trace of organics
Gray, slightly silty SAND
Gray, slightly gravelly, silty SAND
Gray, slightly fine sandy SILT, trace of clay
Gray, slightly silty, gravelly SAND
Gray, fine sandy SILT, trace of clay
Light gray, silty, fine to medium SAND; trace of organics
GRAIN SIZE IN MILLIMETERS
SHANNON & WILSON, INC.Geotechnical and Environmental Consultants Sheet 2 of 3
U.S.C.S.SYMBOL
DEPTH(feet)
ASTMDES
REVIEWBY
TESTBY
FIG. B-2
JFL
JFL
JFL
JFL
JFL
JFL
JFL
D1140
D1140
D1140
D1140
D422
D1140
D1140
SM
SP-SM
SM
ML
SP-SM
ML
SM
26.5
26.8
27.5
32.5
37.5
40.0
55.0
.004
.001
3
.002
.001
3/4
Cu CcSOIL CLASSIFICATION
19.7
18.4
19.1
26.7
8.8
30.4
23.0
AKV
AKV
AKV
AKV
AKV
AKV
AKV
SG
1 60
FINE
SAND
MEDIUM
51
B-2, S-9
B-2, S-9
B-2, S-10*
B-2, S-12
B-2, S-14*
B-2, S-15*
B-2, S-18
GRAIN SIZE DISTRIBUTIONBORING B-2
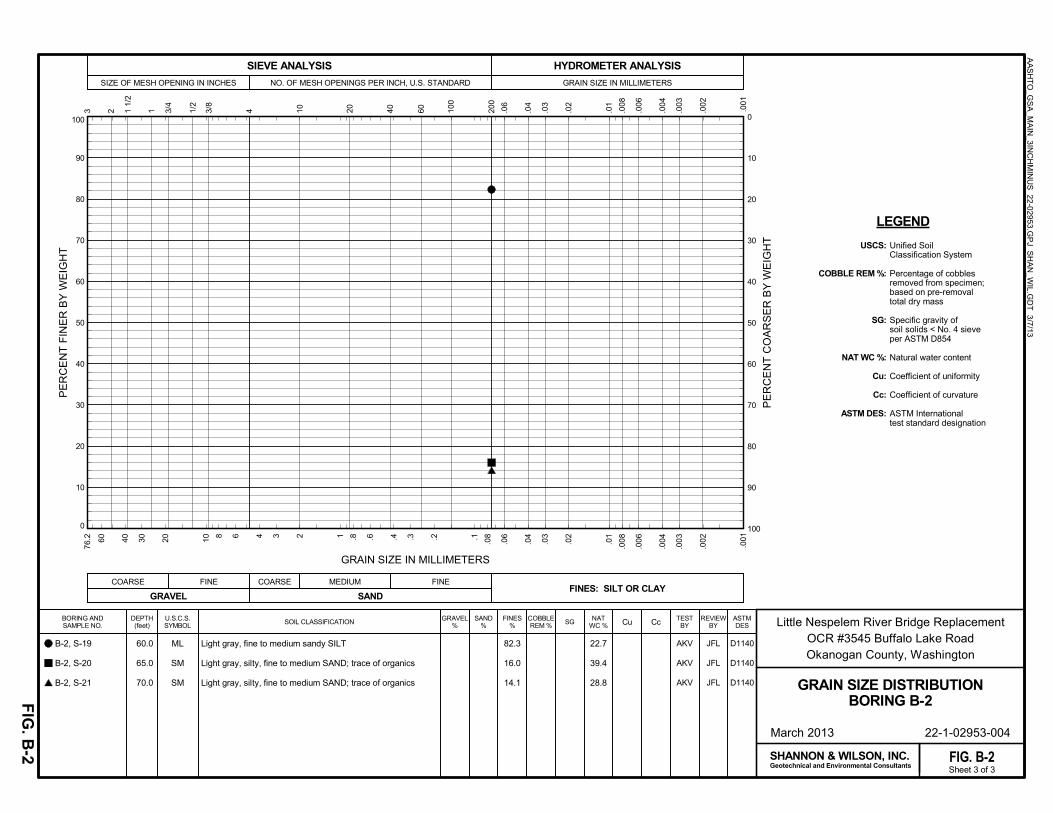
0
10
20
30
40
50
60
70
80
90
100
1/2
40
4 3 .6
.04
2 3/8
4 10 20 .04
.03
.008
76.2 2 .4
.08
.003
100
90
80
70
60
50
40
30
20
10
0
HYDROMETER ANALYSIS
GRAIN SIZE IN MILLIMETERS
1 1/
2
PE
RC
EN
T C
OA
RS
ER
BY
WE
IGH
T
SAND%
FINES%
COBBLEREM %
NATWC %
FINES: SILT OR CLAY
March 2013 22-1-02953-004
AA
SH
TO
_GS
A_M
AIN
_3INC
HM
INU
S 22-029
53.GP
J SH
AN
_WIL.G
DT
3/7/13
FIG
. B-2
Little Nespelem River Bridge ReplacementOCR #3545 Buffalo Lake RoadOkanogan County, Washington
BORING ANDSAMPLE NO.
GRAVEL%
LEGEND
200
.06
.02
.006
.004
.003
30
6 .3 .2
100
.01
.002
GRAVEL
FINE COARSECOARSE
USCS:
COBBLE REM %:
SG:
NAT WC %:
Cu:
Cc:
ASTM DES:
Unified SoilClassification System
Percentage of cobblesremoved from specimen;based on pre-removaltotal dry mass
Specific gravity ofsoil solids < No. 4 sieveper ASTM D854
Natural water content
Coefficient of uniformity
Coefficient of curvature
ASTM Internationaltest standard designation
82.3
16.0
14.1
60 40 20 10
8 1 .8 .1
.01
SIEVE ANALYSIS
NO. OF MESH OPENINGS PER INCH, U.S. STANDARDSIZE OF MESH OPENING IN INCHES
.06
.03
.02
.008
.006
PE
RC
EN
T F
INE
R B
Y W
EIG
HT
Light gray, fine to medium sandy SILT
Light gray, silty, fine to medium SAND; trace of organics
Light gray, silty, fine to medium SAND; trace of organics
GRAIN SIZE IN MILLIMETERS
SHANNON & WILSON, INC.Geotechnical and Environmental Consultants Sheet 3 of 3
U.S.C.S.SYMBOL
DEPTH(feet)
ASTMDES
REVIEWBY
TESTBY
FIG. B-2
JFL
JFL
JFL
D1140
D1140
D1140
ML
SM
SM
60.0
65.0
70.0
.004
.001
3
.002
.001
3/4
Cu CcSOIL CLASSIFICATION
22.7
39.4
28.8
AKV
AKV
AKV
SG
1 60
FINE
SAND
MEDIUM
B-2, S-19
B-2, S-20
B-2, S-21 GRAIN SIZE DISTRIBUTIONBORING B-2
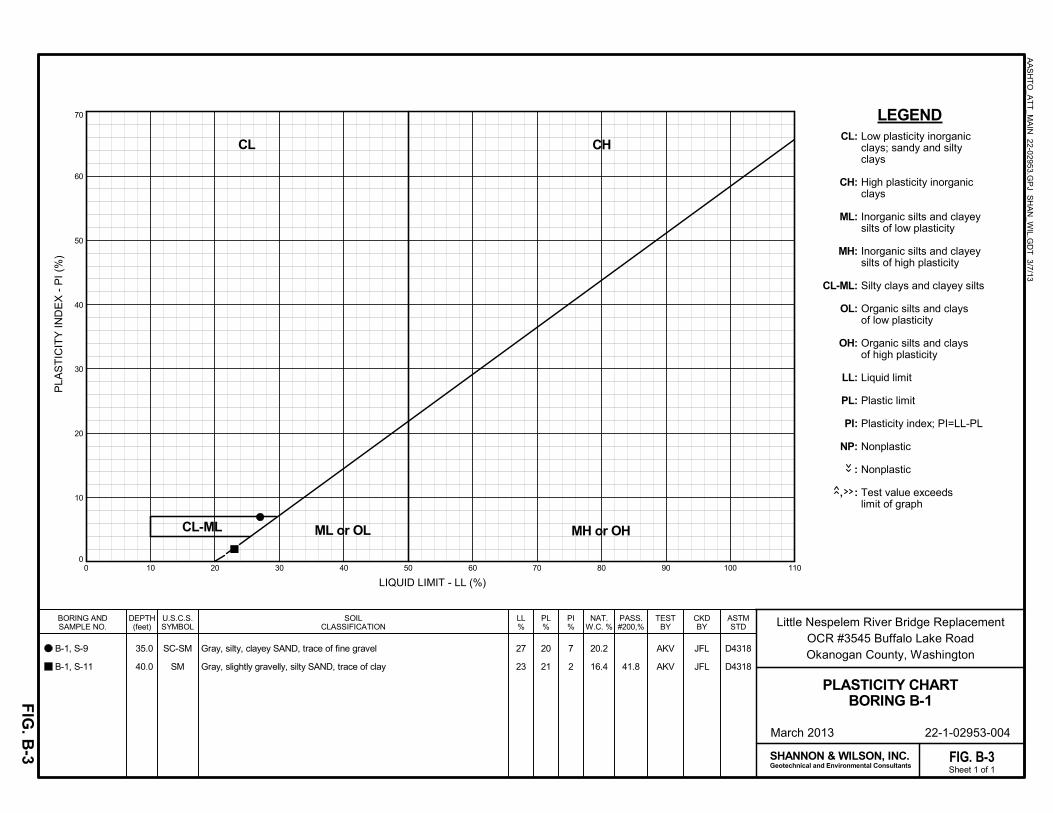
0
10
20
30
40
50
60
70
0 10 20 30 40 50 60 70 80 90 100 110
March 2013 22-1-02953-004
SHANNON & WILSON, INC.Geotechnical and Environmental Consultants
FIG. B-3Sheet 1 of 1
D4318
D4318
JFL
JFL
AKV
AKV
NAT.W.C. %
SOILCLASSIFICATION
PASS.#200,%
B-1, S-9
B-1, S-11
Gray, silty, clayey SAND, trace of fine gravel
Gray, slightly gravelly, silty SAND, trace of clay
CL:
CH:
ML:
MH:
CL-ML:
OL:
OH:
LL:
PL:
PI:
NP:
:
, :
LIQUID LIMIT - LL (%)
PLA
ST
ICIT
Y I
ND
EX
- P
I (%
)
CHCL
DEPTH(feet)
LEGEND
ML or OLCL-ML MH or OH
27
23
20
21
BORING ANDSAMPLE NO. Little Nespelem River Bridge Replacement
OCR #3545 Buffalo Lake RoadOkanogan County, Washington
ASTMSTD
CKDBY
41.8
35.0
40.0
Low plasticity inorganicclays; sandy and siltyclays
High plasticity inorganicclays
Inorganic silts and clayeysilts of low plasticity
Inorganic silts and clayeysilts of high plasticity
Silty clays and clayey silts
Organic silts and claysof low plasticity
Organic silts and claysof high plasticity
Liquid limit
Plastic limit
Plasticity index; PI=LL-PL
Nonplastic
Nonplastic
Test value exceedslimit of graph
SC-SM
SM
U.S.C.S.SYMBOL
LL%
7
2
TESTBY
PL%
PI%
20.2
16.4
FIG
. B-3
AA
SH
TO
_AT
T_M
AIN
22-02953.G
PJ S
HA
N_W
IL.GD
T 3/7/13
PLASTICITY CHARTBORING B-1
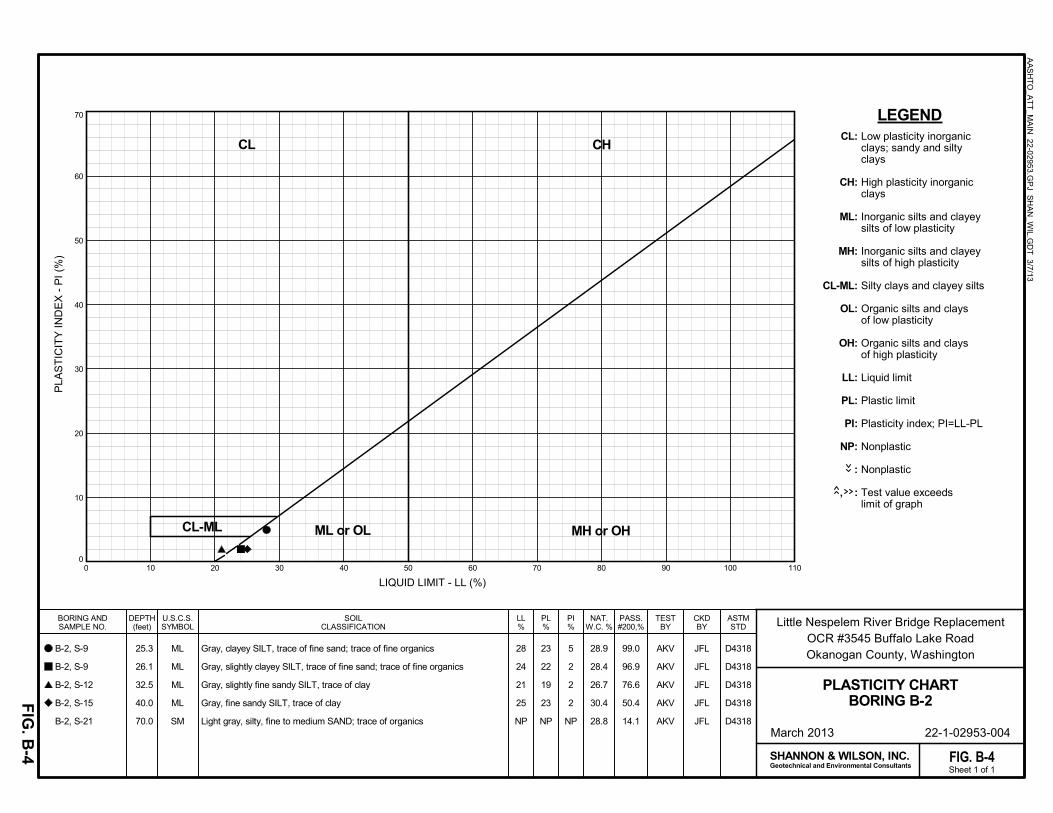
0
10
20
30
40
50
60
70
0 10 20 30 40 50 60 70 80 90 100 110
March 2013 22-1-02953-004
SHANNON & WILSON, INC.Geotechnical and Environmental Consultants
FIG. B-4Sheet 1 of 1
D4318
D4318
D4318
D4318
D4318
JFL
JFL
JFL
JFL
JFL
AKV
AKV
AKV
AKV
AKV
NAT.W.C. %
SOILCLASSIFICATION
PASS.#200,%
B-2, S-9
B-2, S-9
B-2, S-12
B-2, S-15
B-2, S-21
Gray, clayey SILT, trace of fine sand; trace of fine organics
Gray, slightly clayey SILT, trace of fine sand; trace of fine organics
Gray, slightly fine sandy SILT, trace of clay
Gray, fine sandy SILT, trace of clay
Light gray, silty, fine to medium SAND; trace of organics
CL:
CH:
ML:
MH:
CL-ML:
OL:
OH:
LL:
PL:
PI:
NP:
:
, :
LIQUID LIMIT - LL (%)
PLA
ST
ICIT
Y I
ND
EX
- P
I (%
)
CHCL
DEPTH(feet)
LEGEND
ML or OLCL-ML MH or OH
28
24
21
25
NP
23
22
19
23
NP
BORING ANDSAMPLE NO. Little Nespelem River Bridge Replacement
OCR #3545 Buffalo Lake RoadOkanogan County, Washington
ASTMSTD
CKDBY
99.0
96.9
76.6
50.4
14.1
25.3
26.1
32.5
40.0
70.0
Low plasticity inorganicclays; sandy and siltyclays
High plasticity inorganicclays
Inorganic silts and clayeysilts of low plasticity
Inorganic silts and clayeysilts of high plasticity
Silty clays and clayey silts
Organic silts and claysof low plasticity
Organic silts and claysof high plasticity
Liquid limit
Plastic limit
Plasticity index; PI=LL-PL
Nonplastic
Nonplastic
Test value exceedslimit of graph
ML
ML
ML
ML
SM
U.S.C.S.SYMBOL
LL%
5
2
2
2
NP
TESTBY
PL%
PI%
28.9
28.4
26.7
30.4
28.8
FIG
. B-4
AA
SH
TO
_AT
T_M
AIN
22-02953.G
PJ S
HA
N_W
IL.GD
T 3/7/13
PLASTICITY CHARTBORING B-2

22-1-02953-002
APPENDIX C
IMPORTANT INFORMATION ABOUT YOUR GEOTECHNICAL REPORT
Page 1 of 2 1/2012
SHANNON & WILSON, INC. Geotechnical and Environmental Consultants
Attachment to and part of Report 22-1-02953-002 Date: March 6, 2013 To: Mr. Wade DeTillian - Okanogan County Little Nespelem River Bridge Replacement
IMPORTANT INFORMATION ABOUT YOUR GEOTECHNICAL REPORT CONSULTING SERVICES ARE PERFORMED FOR SPECIFIC PURPOSES AND FOR SPECIFIC CLIENTS.
Consultants prepare reports to meet the specific needs of specific individuals. A report prepared for a civil engineer may not be adequate for a construction contractor or even another civil engineer. Unless indicated otherwise, your consultant prepared your report expressly for you and expressly for the purposes you indicated. No one other than you should apply this report for its intended purpose without first conferring with the consultant. No party should apply this report for any purpose other than that originally contemplated without first conferring with the consultant.
THE CONSULTANT'S REPORT IS BASED ON PROJECT-SPECIFIC FACTORS.
A geotechnical/environmental report is based on a subsurface exploration plan designed to consider a unique set of project-specific factors. Depending on the project, these may include: the general nature of the structure and property involved; its size and configuration; its historical use and practice; the location of the structure on the site and its orientation; other improvements such as access roads, parking lots, and underground utilities; and the additional risk created by scope-of-service limitations imposed by the client. To help avoid costly problems, ask the consultant to evaluate how any factors that change subsequent to the date of the report may affect the recommendations. Unless your consultant indicates otherwise, your report should not be used: (1) when the nature of the proposed project is changed (for example, if an office building will be erected instead of a parking garage, or if a refrigerated warehouse will be built instead of an unrefrigerated one, or chemicals are discovered on or near the site); (2) when the size, elevation, or configuration of the proposed project is altered; (3) when the location or orientation of the proposed project is modified; (4) when there is a change of ownership; or (5) for application to an adjacent site. Consultants cannot accept responsibility for problems that may occur if they are not consulted after factors which were considered in the development of the report have changed.
SUBSURFACE CONDITIONS CAN CHANGE.
Subsurface conditions may be affected as a result of natural processes or human activity. Because a geotechnical/environmental report is based on conditions that existed at the time of subsurface exploration, construction decisions should not be based on a report whose adequacy may have been affected by time. Ask the consultant to advise if additional tests are desirable before construction starts; for example, groundwater conditions commonly vary seasonally. Construction operations at or adjacent to the site and natural events such as floods, earthquakes, or groundwater fluctuations may also affect subsurface conditions and, thus, the continuing adequacy of a geotechnical/environmental report. The consultant should be kept apprised of any such events, and should be consulted to determine if additional tests are necessary.
MOST RECOMMENDATIONS ARE PROFESSIONAL JUDGMENTS.
Site exploration and testing identifies actual surface and subsurface conditions only at those points where samples are taken. The data were extrapolated by your consultant, who then applied judgment to render an opinion about overall subsurface conditions. The actual interface between materials may be far more gradual or abrupt than your report indicates. Actual conditions in areas not sampled may differ from those predicted in your report. While nothing can be done to prevent such situations, you and your consultant can work together to help reduce their impacts. Retaining your consultant to observe subsurface construction operations can be particularly beneficial in this respect.
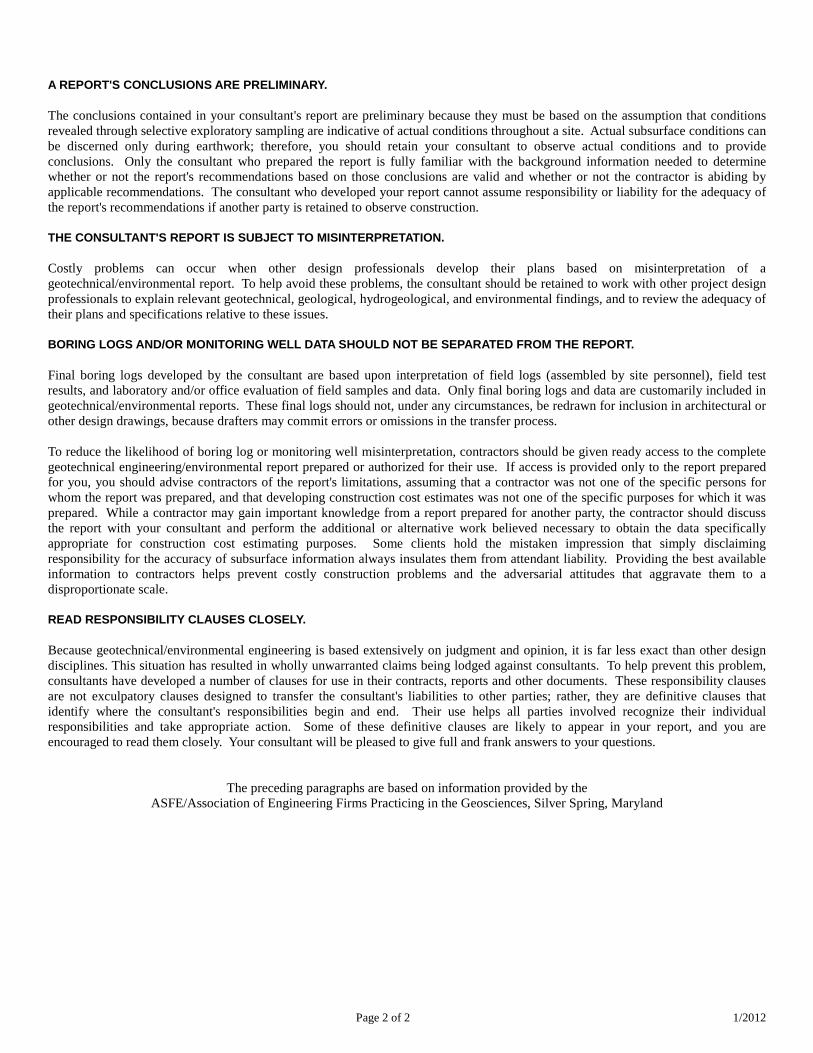
Page 2 of 2 1/2012
A REPORT'S CONCLUSIONS ARE PRELIMINARY.
The conclusions contained in your consultant's report are preliminary because they must be based on the assumption that conditions revealed through selective exploratory sampling are indicative of actual conditions throughout a site. Actual subsurface conditions can be discerned only during earthwork; therefore, you should retain your consultant to observe actual conditions and to provide conclusions. Only the consultant who prepared the report is fully familiar with the background information needed to determine whether or not the report's recommendations based on those conclusions are valid and whether or not the contractor is abiding by applicable recommendations. The consultant who developed your report cannot assume responsibility or liability for the adequacy of the report's recommendations if another party is retained to observe construction.
THE CONSULTANT'S REPORT IS SUBJECT TO MISINTERPRETATION.
Costly problems can occur when other design professionals develop their plans based on misinterpretation of a geotechnical/environmental report. To help avoid these problems, the consultant should be retained to work with other project design professionals to explain relevant geotechnical, geological, hydrogeological, and environmental findings, and to review the adequacy of their plans and specifications relative to these issues.
BORING LOGS AND/OR MONITORING WELL DATA SHOULD NOT BE SEPARATED FROM THE REPORT.
Final boring logs developed by the consultant are based upon interpretation of field logs (assembled by site personnel), field test results, and laboratory and/or office evaluation of field samples and data. Only final boring logs and data are customarily included in geotechnical/environmental reports. These final logs should not, under any circumstances, be redrawn for inclusion in architectural or other design drawings, because drafters may commit errors or omissions in the transfer process. To reduce the likelihood of boring log or monitoring well misinterpretation, contractors should be given ready access to the complete geotechnical engineering/environmental report prepared or authorized for their use. If access is provided only to the report prepared for you, you should advise contractors of the report's limitations, assuming that a contractor was not one of the specific persons for whom the report was prepared, and that developing construction cost estimates was not one of the specific purposes for which it was prepared. While a contractor may gain important knowledge from a report prepared for another party, the contractor should discuss the report with your consultant and perform the additional or alternative work believed necessary to obtain the data specifically appropriate for construction cost estimating purposes. Some clients hold the mistaken impression that simply disclaiming responsibility for the accuracy of subsurface information always insulates them from attendant liability. Providing the best available information to contractors helps prevent costly construction problems and the adversarial attitudes that aggravate them to a disproportionate scale.
READ RESPONSIBILITY CLAUSES CLOSELY.
Because geotechnical/environmental engineering is based extensively on judgment and opinion, it is far less exact than other design disciplines. This situation has resulted in wholly unwarranted claims being lodged against consultants. To help prevent this problem, consultants have developed a number of clauses for use in their contracts, reports and other documents. These responsibility clauses are not exculpatory clauses designed to transfer the consultant's liabilities to other parties; rather, they are definitive clauses that identify where the consultant's responsibilities begin and end. Their use helps all parties involved recognize their individual responsibilities and take appropriate action. Some of these definitive clauses are likely to appear in your report, and you are encouraged to read them closely. Your consultant will be pleased to give full and frank answers to your questions. The preceding paragraphs are based on information provided by the ASFE/Association of Engineering Firms Practicing in the Geosciences, Silver Spring, Maryland