Embed Size (px)
Citation preview
TABLE OF CONTENTS
1. Where the money comes from and where it goes .......................................................... 1
2. Western Australia’s GST share ..................................................................................... 5
3. Key agencies’ recurrent appropriation and expense movements ................................... 8
4. Asset Investment Program .......................................................................................... 10
5. Household fees and charges .......................................................................................15
6. Funding future infrastructure .......................................................................................17
7. Wages policy ...............................................................................................................18
8. Agency Expenditure Reviews ......................................................................................20
9. Perth Freight Link ........................................................................................................24
10. Western Australian economy .......................................................................................25
11. Expansion of motor injury insurance ............................................................................27
12. Broadening the State’s economy through tourism .......................................................29
13. Perth Stadium Financial Impact ...................................................................................31
WHERE THE MONEY COMES FROM AND WHERE IT GOES
The general government sector net operating balance is Western Australia’s headline budget measure and is an indicator of the State’s ability to provide recurrent services, such as health, education, and law and order, from the revenue it collects, such as taxation and royalties. The net operating balance is forecast to be in deficit in 2016-17, reflecting a projected shortfall between revenue (of $25.7 billion) and recurrent spending (or expenses, of $29.6 billion).
General government revenue is expected to decline for the third year in a row in 2016-17, which is unprecedented. Despite the Government’s success in reining in expense growth, the broader economic and revenue environment means that operating deficits are unavoidable in the near term.
Revenue
Total general government revenue is expected to decline by 3.1% or $810 million in 2016-17, to $25.7 billion.
Taxation revenue, which is the largest component of total revenue (see Chart 1), is forecast to decline by 1.3% in 2016-17, largely reflecting lower transfer duty revenue (from commercial property transactions, as well as a soft residential property market), lower land tax (as a result of lower land values) and growth in payroll tax of 0.2% (due to soft labour market conditions).
Commonwealth grants (including GST) comprise around one third of the State’s total revenue, and are forecast to grow by just 1.5% in 2016-17. Western Australia’s share of national GST collections is just 30.3% of its population share in 2016-17 – a GST subsidy to the rest of the nation of $4.7 billion (see separate Fact Sheet).
Royalty income, which is the third largest source of the State’s revenue after taxation and Commonwealth grants, is forecast to decline by 8% in 2016-17, due largely to a lower iron ore price and a higher exchange rate in 2016-17 compared to 2015-16.
1
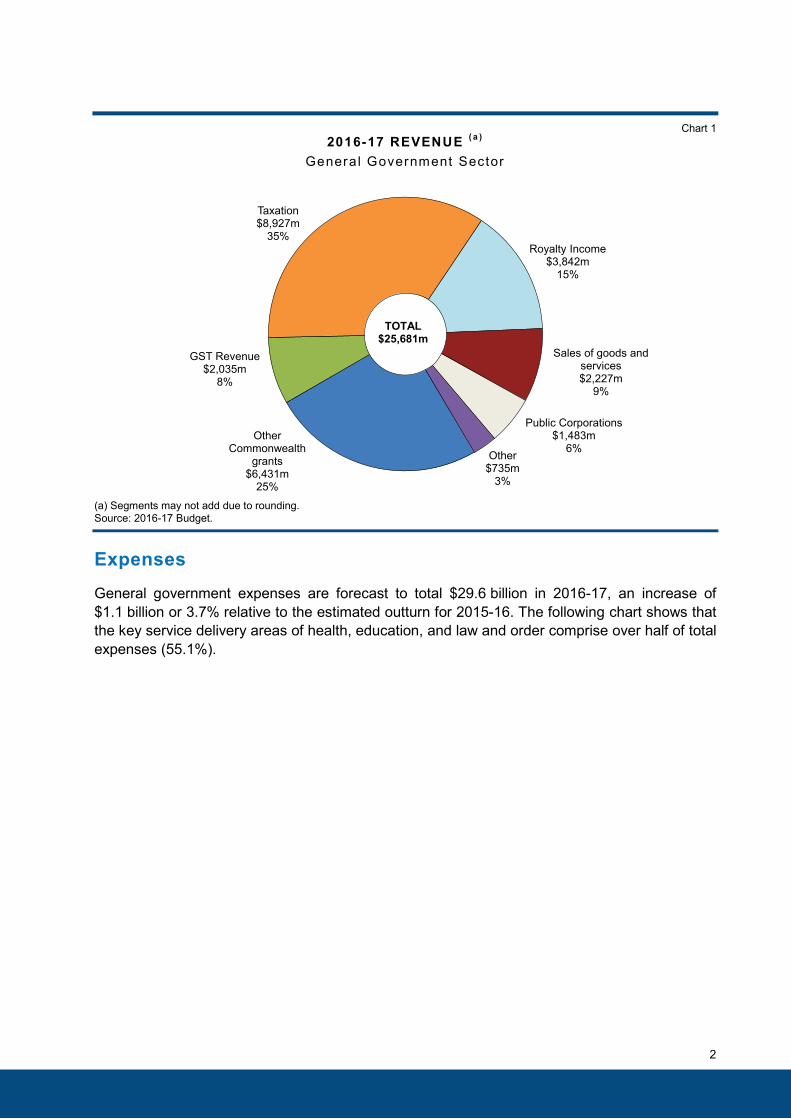
Chart 1 2016-17 REVENUE ( a )
General Government Sector
(a) Segments may not add due to rounding. Source: 2016-17 Budget.
Expenses
General government expenses are forecast to total $29.6 billion in 2016-17, an increase of $1.1 billion or 3.7% relative to the estimated outturn for 2015-16. The following chart shows that the key service delivery areas of health, education, and law and order comprise over half of total expenses (55.1%).
GST Revenue$2,035m
8%
Taxation$8,927m
35%Royalty Income
$3,842m15%
Sales of goods and services$2,227m
9%
Public Corporations$1,483m
6%Other
Commonwealth grants
$6,431m25%
Other$735m
3%
TOTAL$25,681m
2
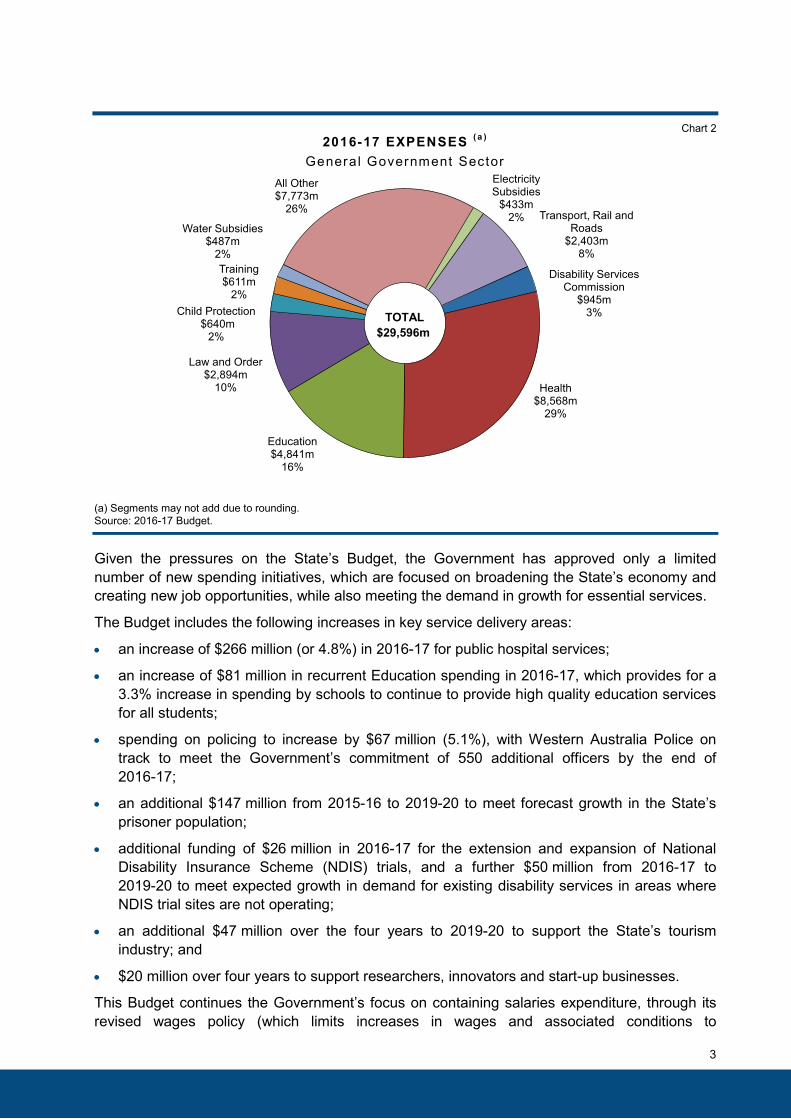
Chart 2 2016-17 EXPENSES ( a )
General Government Sector
(a) Segments may not add due to rounding. Source: 2016-17 Budget.
Given the pressures on the State’s Budget, the Government has approved only a limited number of new spending initiatives, which are focused on broadening the State’s economy and creating new job opportunities, while also meeting the demand in growth for essential services.
The Budget includes the following increases in key service delivery areas:
• an increase of $266 million (or 4.8%) in 2016-17 for public hospital services;
• an increase of $81 million in recurrent Education spending in 2016-17, which provides for a3.3% increase in spending by schools to continue to provide high quality education servicesfor all students;
• spending on policing to increase by $67 million (5.1%), with Western Australia Police ontrack to meet the Government’s commitment of 550 additional officers by the end of2016-17;
• an additional $147 million from 2015-16 to 2019-20 to meet forecast growth in the State’sprisoner population;
• additional funding of $26 million in 2016-17 for the extension and expansion of NationalDisability Insurance Scheme (NDIS) trials, and a further $50 million from 2016-17 to2019-20 to meet expected growth in demand for existing disability services in areas whereNDIS trial sites are not operating;
• an additional $47 million over the four years to 2019-20 to support the State’s tourismindustry; and
• $20 million over four years to support researchers, innovators and start-up businesses.
This Budget continues the Government’s focus on containing salaries expenditure, through its revised wages policy (which limits increases in wages and associated conditions to
Child Protection$640m
2%
Health $8,568m
29%
Disability Services Commission
$945m3%
Education$4,841m
16%
Training $611m
2%
Electricity Subsidies
$433m2%
All Other$7,773m
26%
Water Subsidies$487m
2%
Transport, Rail and Roads
$2,403m8%
Law and Order$2,894m
10%
TOTAL$29,596m
3
1.5% per annum), and driving further cost efficiencies across the public sector (through the roll out of Agency Expenditure Reviews to a further 54 agencies). Expense growth is forecast to average 2.4% across the forward estimates period, compared to average growth over the past decade of 7.7%.
4
WESTERN AUSTRALIA’S GST SHARE Western Australia’s share of the GST will rise marginally from 30.0% of our population share in 2015-16 to 30.3% in 2016-17 (i.e. our ‘GST relativity’ will increase to 30.3%). Western Australia’s GST revenue is estimated to be $2,035 million in 2016-17, an increase of $150 million from the previous year. Only $20 million of that growth is due to the slight rise in our GST relativity, the remainder being due to higher GST collections nationally and a slight increase in Western Australia’s population share.
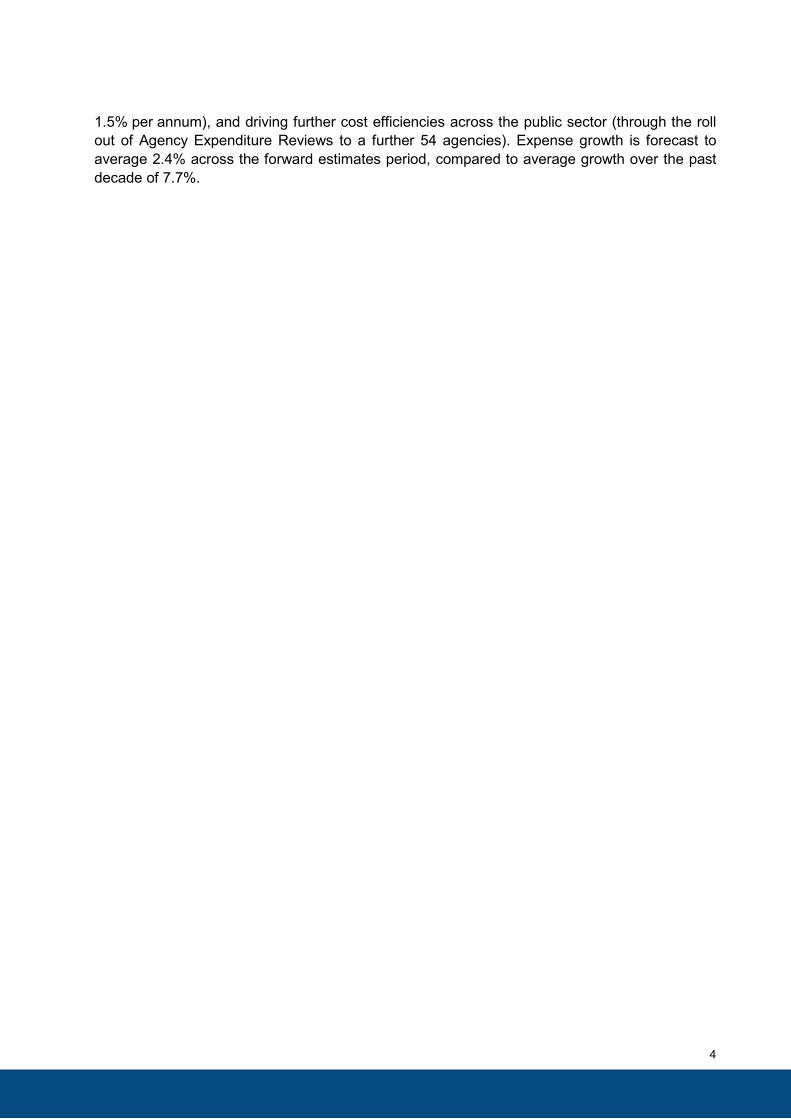
If Western Australia received its population share of GST revenue (i.e. a GST relativity of 100%), it would receive an additional $4.7 billion in 2016-17 alone. As shown in Figure 1, the total GST subsidy paid by Western Australia to other States over the period 2015-16 to 2019-20 is estimated at $17.8 billion.
Figure 1 LOSS IN WESTERN AUSTRALIA’S GST GRANTS
COMPARED TO POPULATION SHARE
1.9 2.0
2.9
4.7
6.0
6.3 6.7
7.1 7.4
7.9
0
1
2
3
4
5
6
7
8
9
2015-16 2016-17 2017-18 2018-19 2019-20
Estimated GST grantsEqual per capita GST grants
(Five year loss = $17.8 billion)
$ Billion
$4.7 billion
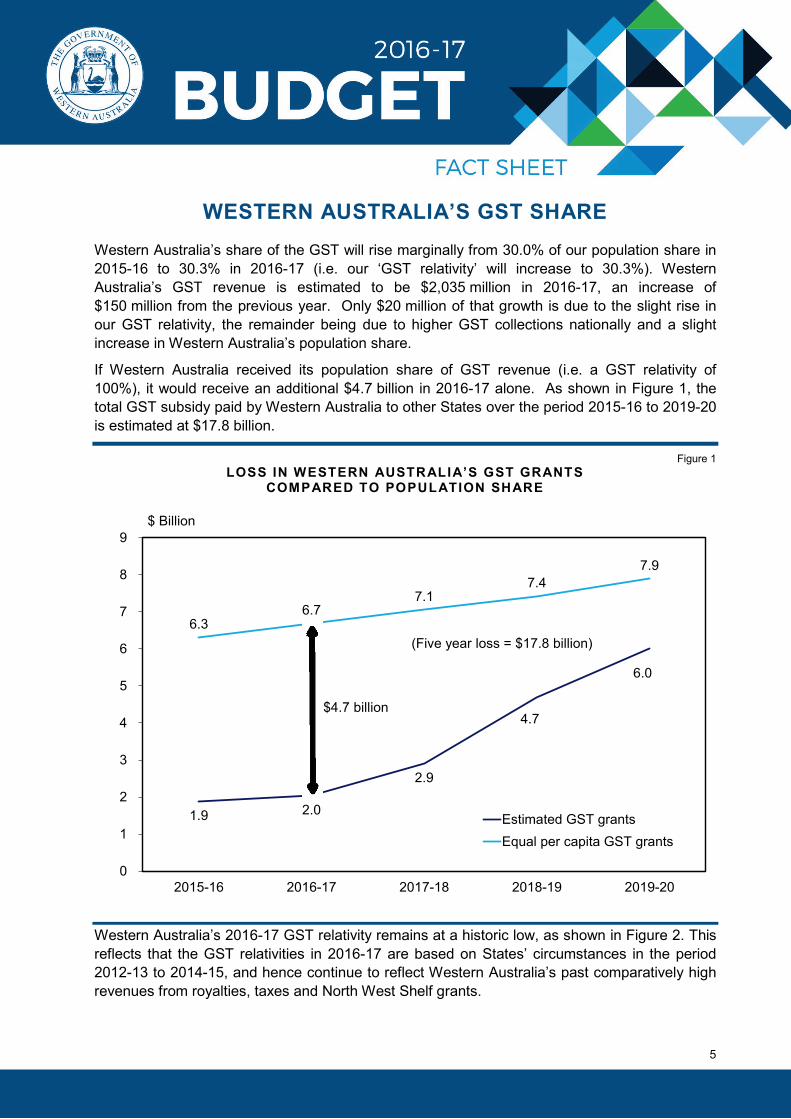
Western Australia’s 2016-17 GST relativity remains at a historic low, as shown in Figure 2. This reflects that the GST relativities in 2016-17 are based on States’ circumstances in the period 2012-13 to 2014-15, and hence continue to reflect Western Australia’s past comparatively high revenues from royalties, taxes and North West Shelf grants.
5
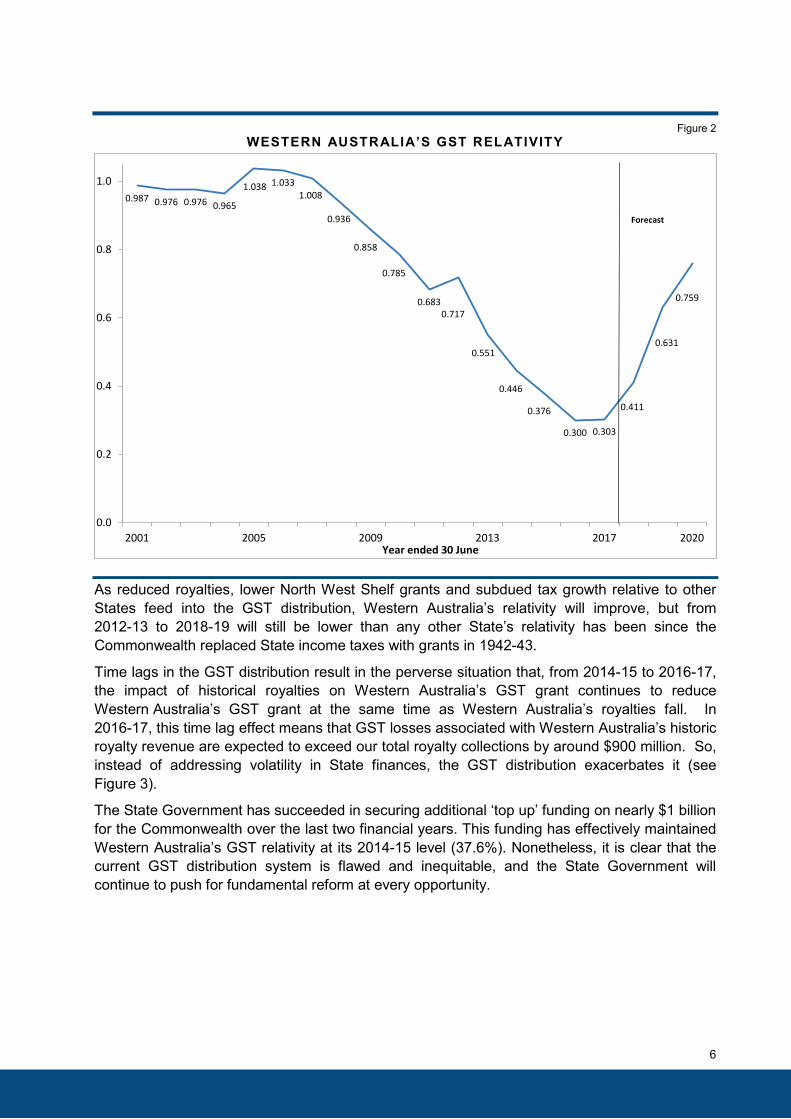
Figure 2 WESTERN AUSTRALIA’S GST RELATIVITY
0.987 0.976 0.976 0.965
1.038 1.0331.008
0.936
0.858
0.785
0.6830.717
0.551
0.446
0.376
0.300 0.303
0.411
0.631
0.759
0.0
0.2
0.4
0.6
0.8
1.0
2001 2005 2009 2013 2017 2020
Forecast
Year ended 30 June
As reduced royalties, lower North West Shelf grants and subdued tax growth relative to other States feed into the GST distribution, Western Australia’s relativity will improve, but from 2012-13 to 2018-19 will still be lower than any other State’s relativity has been since the Commonwealth replaced State income taxes with grants in 1942-43.
Time lags in the GST distribution result in the perverse situation that, from 2014-15 to 2016-17, the impact of historical royalties on Western Australia’s GST grant continues to reduce Western Australia’s GST grant at the same time as Western Australia’s royalties fall. In 2016-17, this time lag effect means that GST losses associated with Western Australia’s historic royalty revenue are expected to exceed our total royalty collections by around $900 million. So, instead of addressing volatility in State finances, the GST distribution exacerbates it (see Figure 3).
The State Government has succeeded in securing additional ‘top up’ funding on nearly $1 billion for the Commonwealth over the last two financial years. This funding has effectively maintained Western Australia’s GST relativity at its 2014-15 level (37.6%). Nonetheless, it is clear that the current GST distribution system is flawed and inequitable, and the State Government will continue to push for fundamental reform at every opportunity.
6
Figure 3 WESTERN AUSTRALIA’S RETENTION OF ROYALTIES
AFTER ASSOCIATED GST LOSSES
-2
-1
0
1
2
3
4
5
6
7
2008-09 2012-13 2016-17 2019-20
Total royalties collected
Royalties retained afterassociated GST losses
$ Billion
Forecast
7
KEY AGENCIES’ RECURRENT APPROPRIATION AND EXPENSE MOVEMENTS
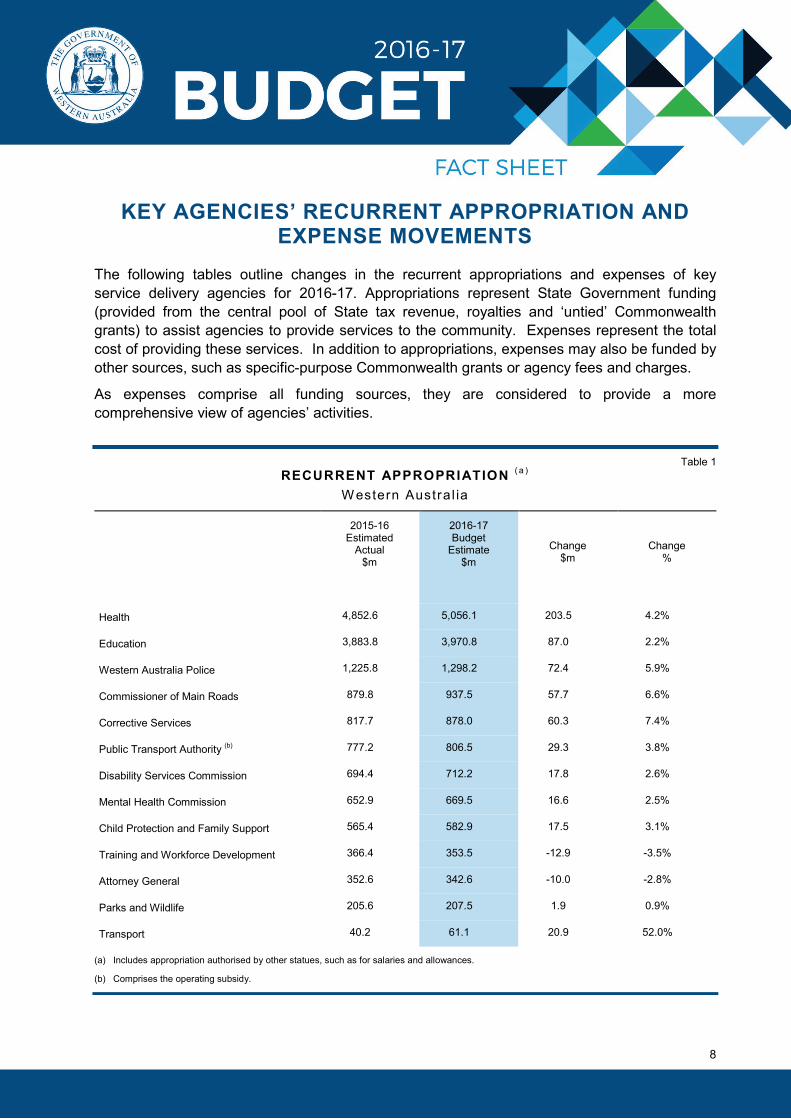
The following tables outline changes in the recurrent appropriations and expenses of key service delivery agencies for 2016-17. Appropriations represent State Government funding (provided from the central pool of State tax revenue, royalties and ‘untied’ Commonwealth grants) to assist agencies to provide services to the community. Expenses represent the total cost of providing these services. In addition to appropriations, expenses may also be funded by other sources, such as specific-purpose Commonwealth grants or agency fees and charges.
As expenses comprise all funding sources, they are considered to provide a more comprehensive view of agencies’ activities.
Table 1 RECURRENT APPROPRIATION ( a )
W estern Austra l ia
2015-16 Estimated
Actual $m
2016-17 Budget
Estimate $m
Change $m
Change %
Health 4,852.6 5,056.1 203.5 4.2%
Education 3,883.8 3,970.8 87.0 2.2%
Western Australia Police 1,225.8 1,298.2 72.4 5.9%
Commissioner of Main Roads 879.8 937.5 57.7 6.6%
Corrective Services 817.7 878.0 60.3 7.4%
Public Transport Authority (b) 777.2 806.5 29.3 3.8%
Disability Services Commission 694.4 712.2 17.8 2.6%
Mental Health Commission 652.9 669.5 16.6 2.5%
Child Protection and Family Support 565.4 582.9 17.5 3.1%
Training and Workforce Development 366.4 353.5 -12.9 -3.5%
Attorney General 352.6 342.6 -10.0 -2.8%
Parks and Wildlife 205.6 207.5 1.9 0.9%
Transport 40.2 61.1 20.9 52.0%
(a) Includes appropriation authorised by other statues, such as for salaries and allowances.
(b) Comprises the operating subsidy.
8
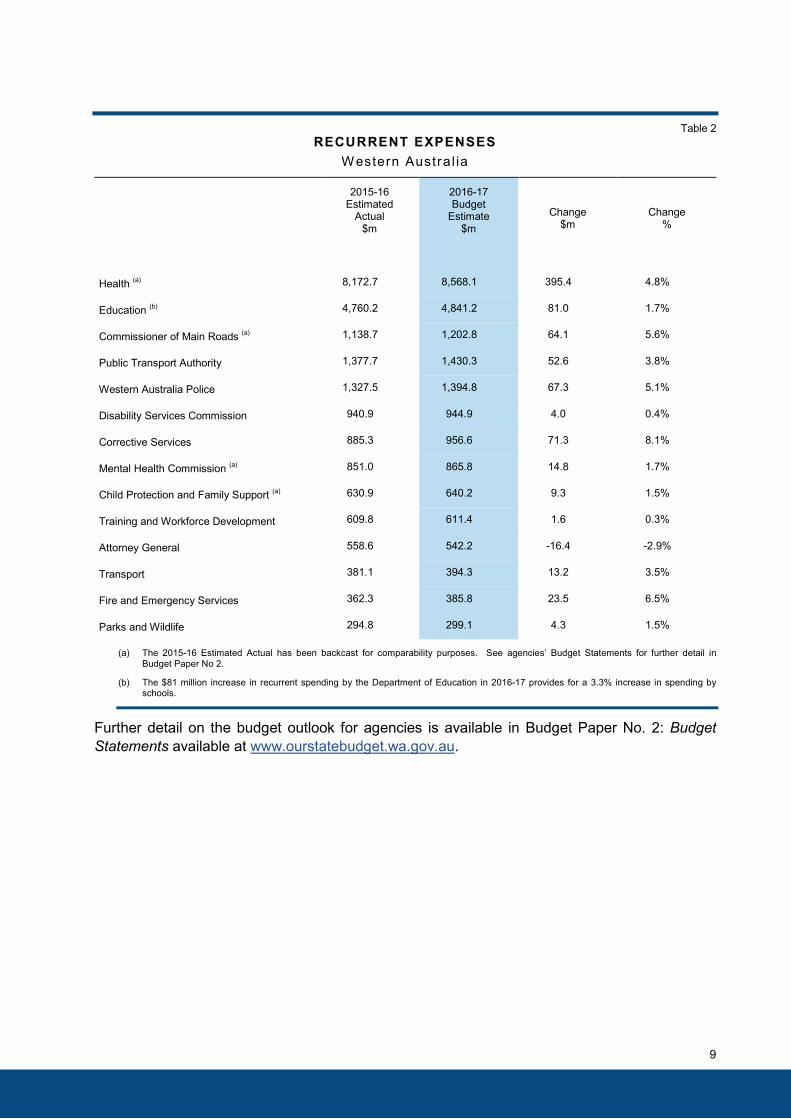
Table 2 RECURRENT EXPENSES
W estern Austra l ia
2015-16 Estimated
Actual $m
2016-17 Budget
Estimate $m
Change $m
Change %
Health (a) 8,172.7 8,568.1 395.4 4.8%
Education (b) 4,760.2 4,841.2 81.0 1.7%
Commissioner of Main Roads (a) 1,138.7 1,202.8 64.1 5.6%
Public Transport Authority 1,377.7 1,430.3 52.6 3.8%
Western Australia Police 1,327.5 1,394.8 67.3 5.1%
Disability Services Commission 940.9 944.9 4.0 0.4%
Corrective Services 885.3 956.6 71.3 8.1%
Mental Health Commission (a) 851.0 865.8 14.8 1.7%
Child Protection and Family Support (a) 630.9 640.2 9.3 1.5%
Training and Workforce Development 609.8 611.4 1.6 0.3%
Attorney General 558.6 542.2 -16.4 -2.9%
Transport 381.1 394.3 13.2 3.5%
Fire and Emergency Services 362.3 385.8 23.5 6.5%
Parks and Wildlife 294.8 299.1 4.3 1.5%
(a) The 2015-16 Estimated Actual has been backcast for comparability purposes. See agencies’ Budget Statements for further detail in Budget Paper No 2.
(b) The $81 million increase in recurrent spending by the Department of Education in 2016-17 provides for a 3.3% increase in spending by schools.
Further detail on the budget outlook for agencies is available in Budget Paper No. 2: Budget Statements available at www.ourstatebudget.wa.gov.au.
9
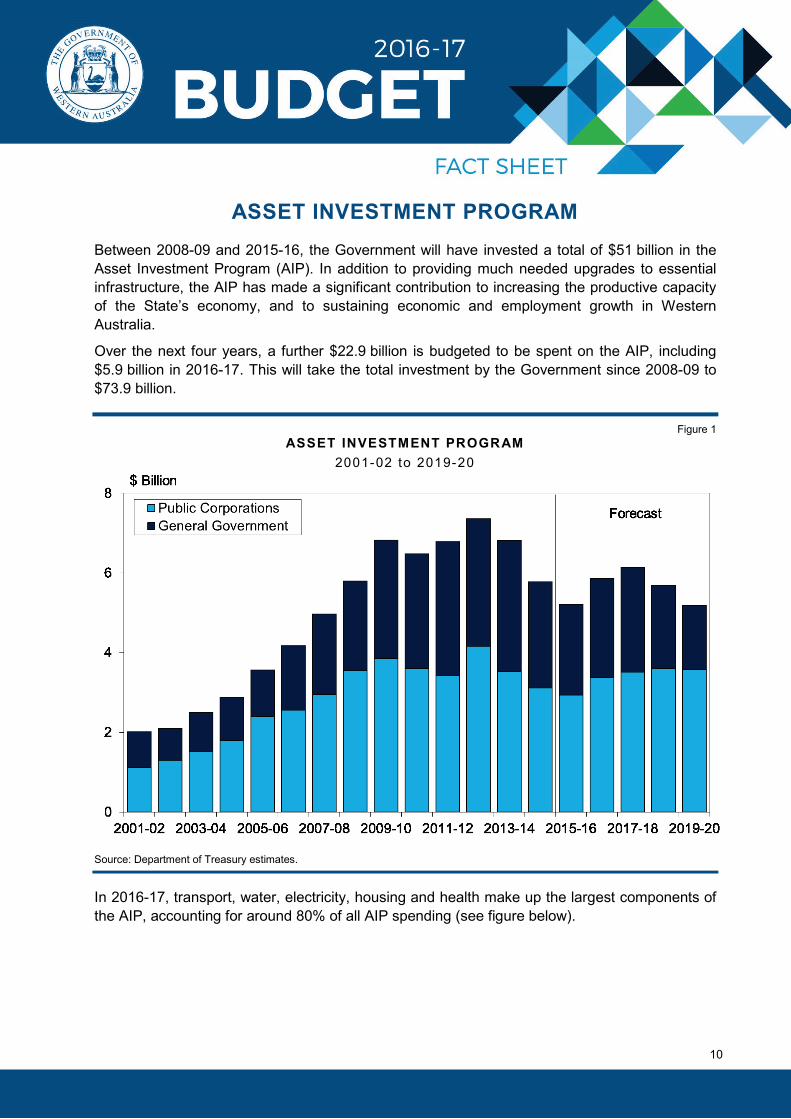
ASSET INVESTMENT PROGRAM Between 2008-09 and 2015-16, the Government will have invested a total of $51 billion in the Asset Investment Program (AIP). In addition to providing much needed upgrades to essential infrastructure, the AIP has made a significant contribution to increasing the productive capacity of the State’s economy, and to sustaining economic and employment growth in Western Australia.
Over the next four years, a further $22.9 billion is budgeted to be spent on the AIP, including $5.9 billion in 2016-17. This will take the total investment by the Government since 2008-09 to $73.9 billion.
Figure 1 ASSET INVESTMENT PROGRAM
2001-02 to 2019-20
Source: Department of Treasury estimates.
In 2016-17, transport, water, electricity, housing and health make up the largest components of the AIP, accounting for around 80% of all AIP spending (see figure below).
10
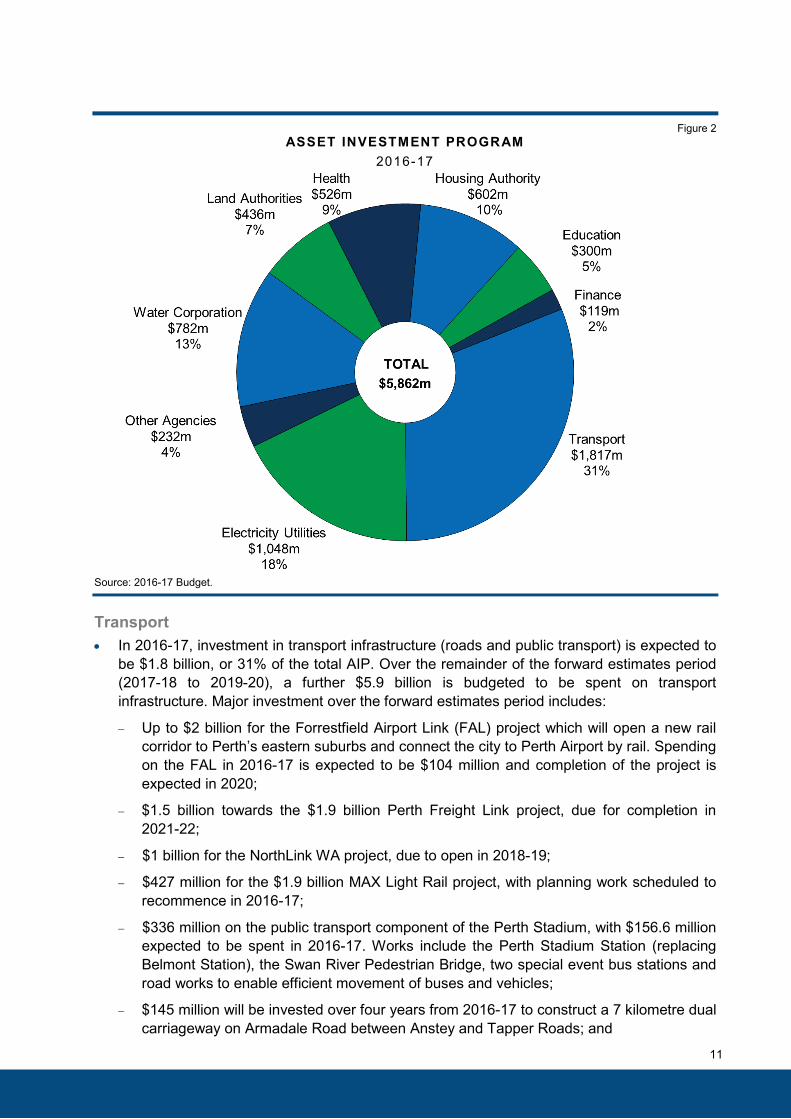
Figure 2 ASSET INVESTMENT PROGRAM
2016-17
Source: 2016-17 Budget.
Transport • In 2016-17, investment in transport infrastructure (roads and public transport) is expected to
be $1.8 billion, or 31% of the total AIP. Over the remainder of the forward estimates period(2017-18 to 2019-20), a further $5.9 billion is budgeted to be spent on transportinfrastructure. Major investment over the forward estimates period includes:
− Up to $2 billion for the Forrestfield Airport Link (FAL) project which will open a new railcorridor to Perth’s eastern suburbs and connect the city to Perth Airport by rail. Spending on the FAL in 2016-17 is expected to be $104 million and completion of the project is expected in 2020;
− $1.5 billion towards the $1.9 billion Perth Freight Link project, due for completion in 2021-22;
− $1 billion for the NorthLink WA project, due to open in 2018-19;
− $427 million for the $1.9 billion MAX Light Rail project, with planning work scheduled to recommence in 2016-17;
− $336 million on the public transport component of the Perth Stadium, with $156.6 million expected to be spent in 2016-17. Works include the Perth Stadium Station (replacing Belmont Station), the Swan River Pedestrian Bridge, two special event bus stations and road works to enable efficient movement of buses and vehicles;
− $145 million will be invested over four years from 2016-17 to construct a 7 kilometre dual carriageway on Armadale Road between Anstey and Tapper Roads; and
11
− a total of $49 million will be invested in 2016-17 and 2017-18 to construct a 9 kilometre dedicated bus route from Ellenbrook to Marshall Road near Reid Highway. The route will reduce congestion on Lord Street and improve amenity for public transport passengers.
Power • A total of $1 billion is expected to be invested in power infrastructure in 2016-17, including:
− $304.3 million to continue a number of important safety programs by Western Power,including replacement and reinforcement of wood poles, conductor management and bushfire mitigation projects;
− $65 million for asset replacement for transmission and distribution assets such as transformers, circuit breakers and surge arrestors;
− $57.2 million will be spent on Synergy’s generation portfolio which utilises coal, gas, liquid fuel and renewable energy sources; and
− $22.6 million for the State Underground Power Program.
Water • In 2016-17, a total of $782 million has been committed to ensure the continued provision of
high quality and reliable water and wastewater services across the State, including;
− $315.7 million on the Integrated Water Supply Scheme (IWSS) and country watersources and distribution;
− $233.2 million on improvements to, and the maintenance of, wastewater treatment plants across the State;
− $15.5 million allocated to the Infill Sewerage Program which provides social and environmental benefits to communities by reducing the reliance on septic tanks, including $20k for scoping for Kenwick infill sewerage; and
− $7 million to complete the commissioning of the Groundwater Replenishment Scheme. Construction of the 14 billion litre capacity scheme began in 2014, with completion expected by late 2016, at an estimated total cost of $130 million.
Health • Investment in 2016-17 totals $526.3 million and includes:
− $150.6 million for the ongoing redevelopment and expansion of regional hospitals andmedical facilities (as part of the $326.2 million Southern Inland Health Initiative);
− $91.8 million to finalise construction of the $1.2 billion Perth Children’s Hospital at the Queen Elizabeth II Medical Centre (QEIIMC) site;
− $76.6 million to continue construction of the $206.9 million Karratha Health Campus;
− $18.9 million to commence construction of the $41.8 million Onslow Hospital;
− $21.5 million to continue delivering Renal Dialysis and Support Services in regional Western Australia; and
− $16.7 million to commence the replacement of the medical imaging system across public hospitals in Western Australia.
12
Education • Investment in education infrastructure is another major focus of the 2016-17 Budget, with
$300 million budgeted to be spent in 2016-17. New investment over the next four yearsapproved as part of this Budget includes:
− $67.4 million on the acquisition of land and the construction of North Butler Senior HighSchool Stage 1;
− $49.5 million on the construction of facilities to expand the permanent accommodation for students at Shenton College;
− $32.1 million, including $6 million funded by Royalties for Regions, on the construction of facilities to expand the permanent accommodation for students at Cape Naturaliste College;
− $17.9 million, including $11.9 million funded by Royalties for Regions, to continue the redevelopment of Carnarvon Community College;
− $13.5 million for security fencing, power related works, and improvements to facilities; and
− $10.5 million to expand the permanent accommodation for students attending Inglewood, Wembley and West Leederville Primary Schools.
Housing • The Government will invest $1.5 billion over the forward estimates period, including
$602 million in 2016-17, for the provision of affordable housing and land in WesternAustralia. Key investments include:
− $298.1 million in 2016-17 to continue the implementation of the Social HousingInvestment Package announced in last year’s Budget. This $564 million initiative will deliver 1,000 additional social housing dwellings and halve the number of seniors and families with children who are on the priority waitlist for social housing by 30 June 2017; and
− $175 million in 2016-17 for the development of up to 1,901 housing lots, which will support affordable, public and community housing throughout metropolitan and regional areas.
Other Projects • Investment in other major AIP projects includes:
− $378.5 million over the budget period towards the construction of the $428.3 million NewMuseum, which will incorporate the four existing heritage buildings into a new facility. The New Museum project will also provide a connection between the revitalised Perth Cultural Centre to Perth City Link and to Elizabeth Quay, with these key developments working together to deliver a better connected city;
− $27.2 million in 2016-17 on the Waterbank precinct, including site works at the Western Australia Police site in Hay Street;
− $18.2 million in 2016-17 on the $20 million Kalbarri Skywalk and National Park tourist infrastructure, providing new sealed roads to the Loop and Z Bend tourist sites and the development of new facilities at several sites including two new lookout structures overlooking the Murchison River gorge;
13
− an additional $18 million in 2016-17 for the redevelopment of the Scarborough foreshore, bringing total investment in the project to $48 million; and
− $8.1 million in 2016-17 to complete construction of the new Cockburn Central police station.
14
HOUSEHOLD FEES AND CHARGES The 2016-17 Budget includes the following increases in household fees and charges, which take effect from 1 July 2016:
• a 3% increase in residential electricity tariffs;
• a 4.5% increase in the Water Corporation’s total water charges (water, wastewater anddrainage);
• a 2.5% increase in public transport standard fares (rounded to the nearest ten cents), withthe 60 cent student fare remaining unchanged;
• no change in drivers’ licence fees;
• a 2.5% increase in motor vehicle licence fees;
• a 2.5% increase in compulsory third party (CTP) insurance premiums;
• the introduction of the Catastrophic Injuries Support Scheme (CISS), which will result invehicle owners paying an additional $99 for the average family car; and
• a 4.2% increase in the Emergency Services Levy.
Total expenditure by the ‘representative household’ on this basket of Government goods and services in 2016-17 is $5,659.92. This is an increase of $257 or 4.76% on 2015-16 levels (or a $158 or 2.92% increase if the previously announced CISS is excluded).
Even after the increases outlined above and prior to other States announcing their 2016-17 Budgets, the representative household in Western Australia has amongst the lowest expenditure on State Government goods and services when compared to other States (see Figure 1). For example:
• Western Australia’s 2016-17 utility charges (i.e. water and electricity) are in line with thenational average;
• public transport fares remain the lowest in the nation and will remain significantly lower thanthose of New South Wales, Victoria, Queensland and South Australia; and
• motor vehicle charges are amongst the lowest in Australia.
Despite the increases, the Government will spend $1.8 billion in 2016-17 on operating subsidies, rebates and concessions for electricity, water and public transport.
Assistance to Households
The Government recognises that some individuals and families need assistance to pay utility bills. The Government funds the Hardship Utilities Grants Scheme (HUGS) to help people in financial difficulty pay water, gas and electricity bills so that supply is not suspended. To apply for HUGS, customers can contact their electricity, gas or water supplier.
15
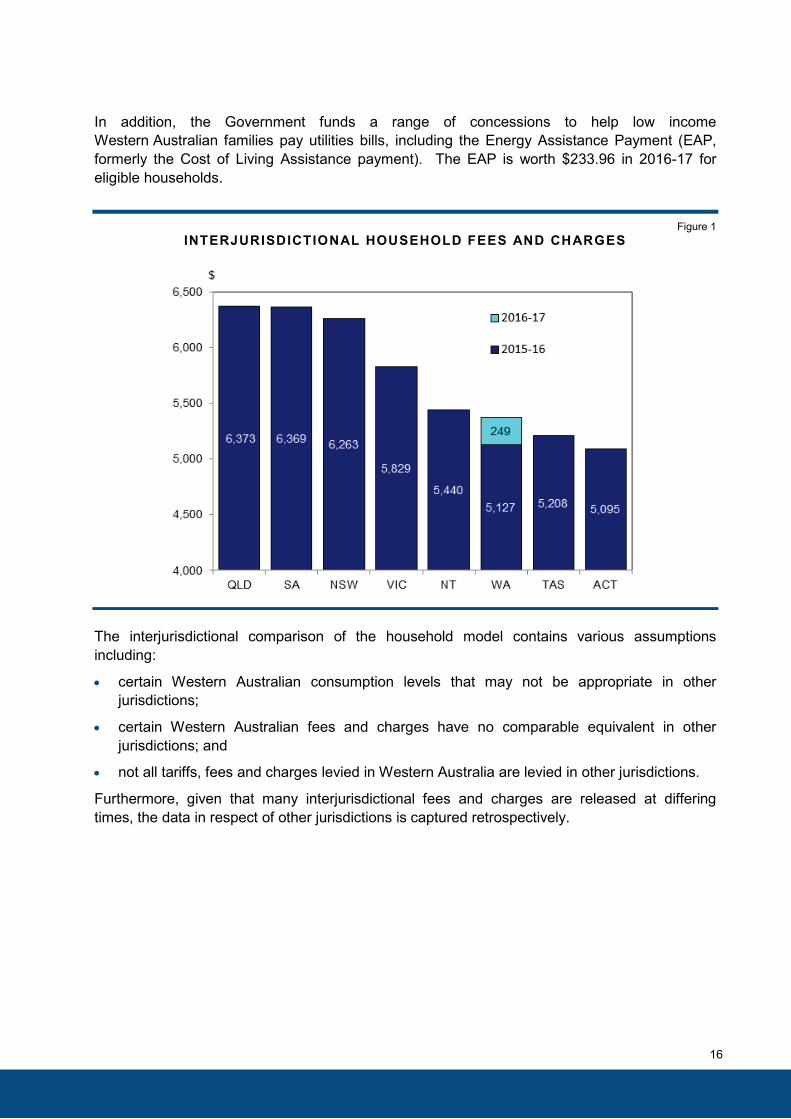
In addition, the Government funds a range of concessions to help low income Western Australian families pay utilities bills, including the Energy Assistance Payment (EAP, formerly the Cost of Living Assistance payment). The EAP is worth $233.96 in 2016-17 for eligible households.
Figure 1 INTERJURISDICTIONAL HOUSEHOLD FEES AND CHARGES
The interjurisdictional comparison of the household model contains various assumptions including:
• certain Western Australian consumption levels that may not be appropriate in otherjurisdictions;
• certain Western Australian fees and charges have no comparable equivalent in otherjurisdictions; and
• not all tariffs, fees and charges levied in Western Australia are levied in other jurisdictions.
Furthermore, given that many interjurisdictional fees and charges are released at differing times, the data in respect of other jurisdictions is captured retrospectively.
16
FUNDING FUTURE INFRASTRUCTURE The State Government has completed the sale of Perth Market City and is progressing the divestment, via long-term lease, of the Utah Point bulk handling facility at Port Hedland and the Fremantle Port. The Government is also continuing to actively engage with the racing industry on the future sale of the TAB.
Proposed Asset Divestments
The Government proposes the sale of:
• Western Power; and
• Horizon Power’s transmission and distribution assets in the Pilbara.
A final decision to sell these assets will not be made until after the election. A decision to sell the assets will only be made following confirmation that divestment of these assets is in the best interests of both taxpayers and electricity consumers.
The decision will also be dependent on an effective regulatory regime, which ensures electricity consumers are no worse off.
Proceeds from these divestments, when combined with the Government’s existing asset sales program, are expected to total around $16 billion.
Proposed Use of Proceeds from Divestments
The Government will use the proceeds to:
• retire around $11 billion of public debt (some of which is currently held by Western Power);and
• create a $5 billion Infrastructure Fund, to provide the State with the capacity to finance keyinfrastructure projects that meet the needs of Western Australia into the next decade. Suchprojects may include public transport, roads, schools and other economic and socialinfrastructure to support the continued growth of Western Australia.
Financial Impact The proposed divestment of these assets would mean that the general government sector would no longer receive yearly dividend and tax equivalent payments of around $300 million. However, this is more than offset by the interest savings on the associated debt. In this regard, the repayment of $11 billion in debt represents around a 30% reduction in the forecast level of net debt by the end of the forward estimates and caps debt at around 2015-16 levels. It is estimated that public sector interest costs would be around $570 million lower per year from 2019-20.
While the Government will continue to drive spending efficiencies across the public sector, which will help contain the growth in debt levels going forward, divesting assets that do not need to be owned and operated by the State Government is the only practical option for significantly reducing the current stock of debt.
17
WAGES POLICY
Revised Public Sector Wages Policy
On 26 February 2016, the Government announced amendments to the public sector wages policy to limit increases in wages and associated conditions to 1.5% per annum. The revised policy applies to all agreements as they expire from 1 June 2016, with the Prison Officers’ Enterprise Agreement being the first agreement to be covered by the new policy.
Salary costs remain the largest expense across the public sector, accounting for about 40% of total recurrent spending in 2015-16. The revised policy aims to ensure that public sector pay rises are both reasonable and sustainable in the current economic and fiscal environment.
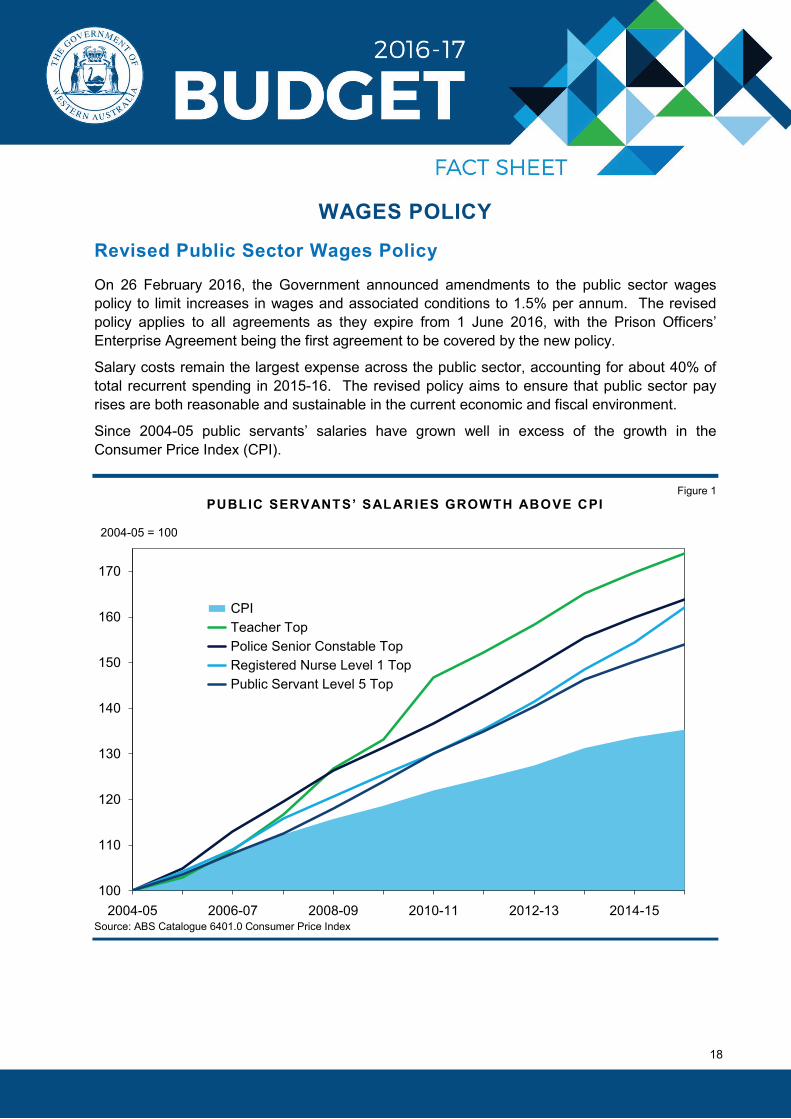
Since 2004-05 public servants’ salaries have grown well in excess of the growth in the Consumer Price Index (CPI).
Figure 1 PUBLIC SERVANTS’ SALARIES GROWTH ABOVE CPI
Source: ABS Catalogue 6401.0 Consumer Price Index
100
110
120
130
140
150
160
170
2004-05 2006-07 2008-09 2010-11 2012-13 2014-15
CPI Teacher Top Police Senior Constable Top Registered Nurse Level 1 Top Public Servant Level 5 Top
2004-05 = 100
18
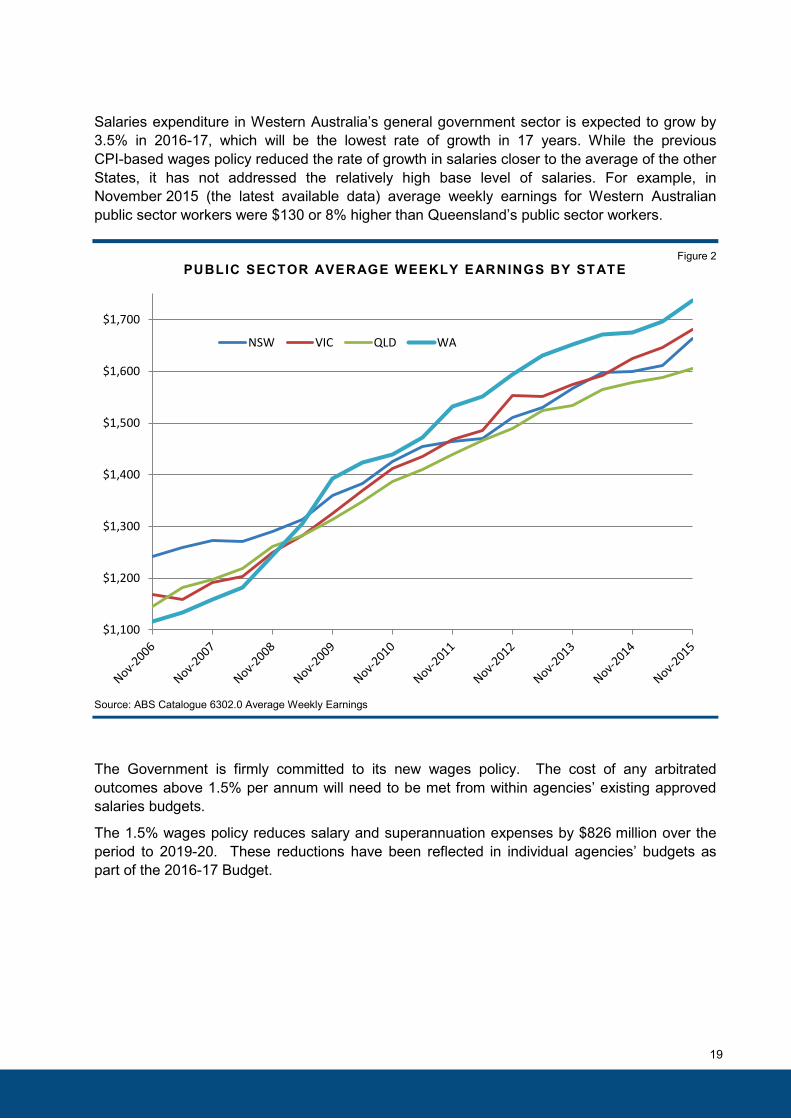
Salaries expenditure in Western Australia’s general government sector is expected to grow by 3.5% in 2016-17, which will be the lowest rate of growth in 17 years. While the previous CPI-based wages policy reduced the rate of growth in salaries closer to the average of the other States, it has not addressed the relatively high base level of salaries. For example, in November 2015 (the latest available data) average weekly earnings for Western Australian public sector workers were $130 or 8% higher than Queensland’s public sector workers.
Figure 2 PUBLIC SECTOR AVERAGE WEEKLY EARNINGS BY STATE
Source: ABS Catalogue 6302.0 Average Weekly Earnings
The Government is firmly committed to its new wages policy. The cost of any arbitrated outcomes above 1.5% per annum will need to be met from within agencies’ existing approved salaries budgets.
The 1.5% wages policy reduces salary and superannuation expenses by $826 million over the period to 2019-20. These reductions have been reflected in individual agencies’ budgets as part of the 2016-17 Budget.
$1,100
$1,200
$1,300
$1,400
$1,500
$1,600
$1,700
NSW VIC QLD WA
19
AGENCY EXPENDITURE REVIEWS In response to the continuing weakness in the revenue outlook, the Government has implemented a number of new savings initiatives in recent times to further limit the growth in spending, including the Agency Expenditure Review (AER) program of agency examination.
The objective of AERs is to ensure that as circumstances change over time, the programs delivered by agencies remain a Government priority and continue to be delivered in an efficient and effective manner. The AER program achieves this through a two stage process of review overseen by the Department of Treasury.
The AER model of review drives a critical examination and re-definition of the entirety of an agency’s programs. It seeks to reform program delivery by agencies rather than being a blunt ‘efficiency dividend’.
Generally, AER savings measures can be expected to apply to programs that:
• are no longer a priority and can be ceased;
• can be materially altered in delivery (e.g. delivered more efficiently through technologicalimprovements, outsourcing to alternative providers, etc.);
• are duplicated with other State government agencies, other levels of government ornon-government organisations; or
• can be scaled back as current demand conditions do not warrant the same level of servicedelivery or funding.
Tranche Three Arrangements
As part of the 2016-17 Budget, the Government has announced a third tranche of AERs, which:
• will apply to 54 agencies;
• is forecast to achieve $313 million in net savings commencing in 2017-18;
• will reprioritise a further $148 million in funding to hospital services; and
• will deliver total savings of $461 million over the period 2017-18 to 2019-20.
Following the completion of this third tranche, AERs will have been applied to almost all general government agencies, delivering net savings of $728 million and an additional $148 million in reprioritised funding to WA Health’s hospital services, for total savings of $877 million.
Tranche three will apply to general government agencies that were not subject to previous AERs, excluding Western Australia Police, the Department for Child Protection and Family Support, and those agencies with annual savings of less than $50,000, which are fully exempt.
20
As such, 54 agencies are subject to tranche three and will be required to identify program specific savings measures that achieve a 3.5% reduction in cash appropriation funding, with the following exceptions (see Table 1 for impacted agencies and savings amounts):
• WA Health’s savings are based upon recurrent funding provided for ‘non-hospitals’expenditure only (e.g. corporate and support services), and will be retained and reinvestedby WA Health in hospitals expenditure;
• the Department of Education's savings are based on 3.5% of central and regional officecosts only (funding for schools is exempt);
• not-for-profit funding is excluded from the calculation of the Disability ServicesCommission’s savings target; and
• funding for electoral offices and native title and science grants is excluded from thecalculation of the Department of the Premier and Cabinet's savings target.
Savings allocations are to be held at a global level until allocated to agencies as part of the 2016-17 Mid-year Review, with specific savings measures to be announced as part of the 2017-18 Budget.
21
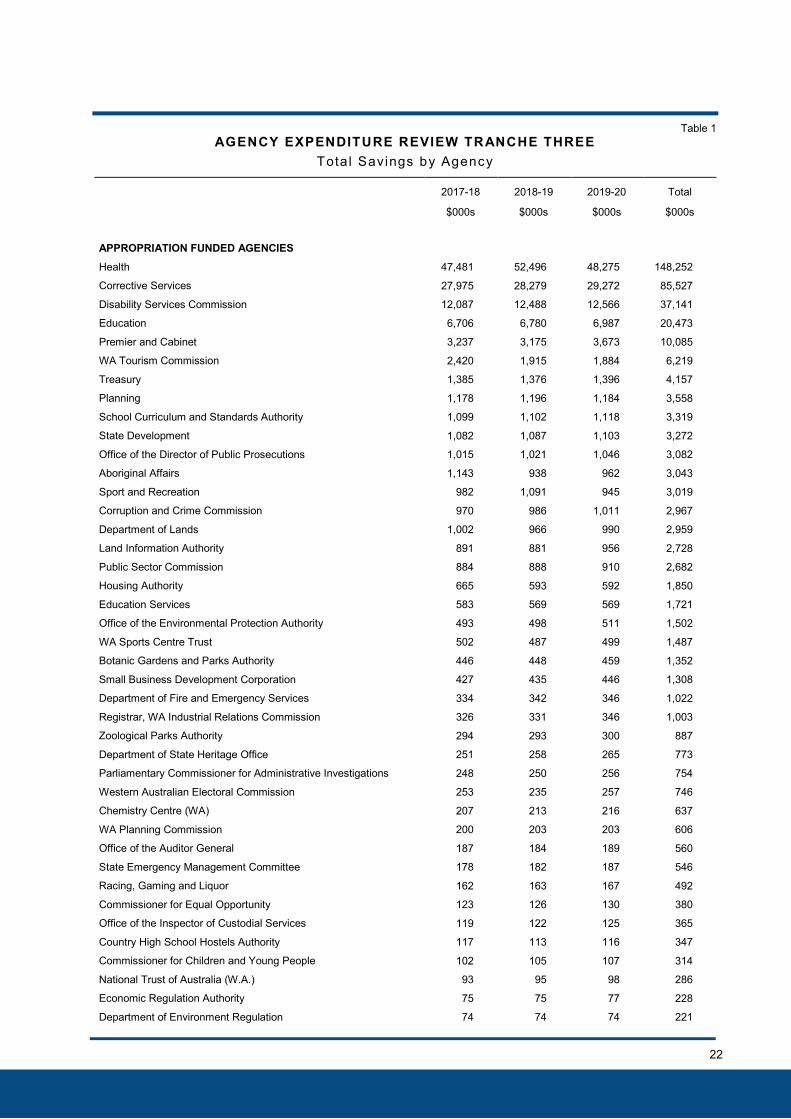
Table 1 AGENCY EXPENDITURE REVIEW TRANCHE THREE
Total Savings by Agency
2017-18
$000s
2018-19
$000s
2019-20
$000s
Total
$000s
APPROPRIATION FUNDED AGENCIES
Health 47,481 52,496 48,275 148,252
Corrective Services 27,975 28,279 29,272 85,527
Disability Services Commission 12,087 12,488 12,566 37,141
Education 6,706 6,780 6,987 20,473
Premier and Cabinet 3,237 3,175 3,673 10,085
WA Tourism Commission 2,420 1,915 1,884 6,219
Treasury 1,385 1,376 1,396 4,157
Planning 1,178 1,196 1,184 3,558
School Curriculum and Standards Authority 1,099 1,102 1,118 3,319
State Development 1,082 1,087 1,103 3,272
Office of the Director of Public Prosecutions 1,015 1,021 1,046 3,082
Aboriginal Affairs 1,143 938 962 3,043
Sport and Recreation 982 1,091 945 3,019
Corruption and Crime Commission 970 986 1,011 2,967
Department of Lands 1,002 966 990 2,959
Land Information Authority 891 881 956 2,728
Public Sector Commission 884 888 910 2,682
Housing Authority 665 593 592 1,850
Education Services 583 569 569 1,721
Office of the Environmental Protection Authority 493 498 511 1,502
WA Sports Centre Trust 502 487 499 1,487
Botanic Gardens and Parks Authority 446 448 459 1,352
Small Business Development Corporation 427 435 446 1,308
Department of Fire and Emergency Services 334 342 346 1,022
Registrar, WA Industrial Relations Commission 326 331 346 1,003
Zoological Parks Authority 294 293 300 887
Department of State Heritage Office 251 258 265 773
Parliamentary Commissioner for Administrative Investigations 248 250 256 754
Western Australian Electoral Commission 253 235 257 746
Chemistry Centre (WA) 207 213 216 637
WA Planning Commission 200 203 203 606
Office of the Auditor General 187 184 189 560
State Emergency Management Committee 178 182 187 546
Racing, Gaming and Liquor 162 163 167 492
Commissioner for Equal Opportunity 123 126 130 380
Office of the Inspector of Custodial Services 119 122 125 365
Country High School Hostels Authority 117 113 116 347
Commissioner for Children and Young People 102 105 107 314
National Trust of Australia (W.A.) 93 95 98 286
Economic Regulation Authority 75 75 77 228
Department of Environment Regulation 74 74 74 221
22
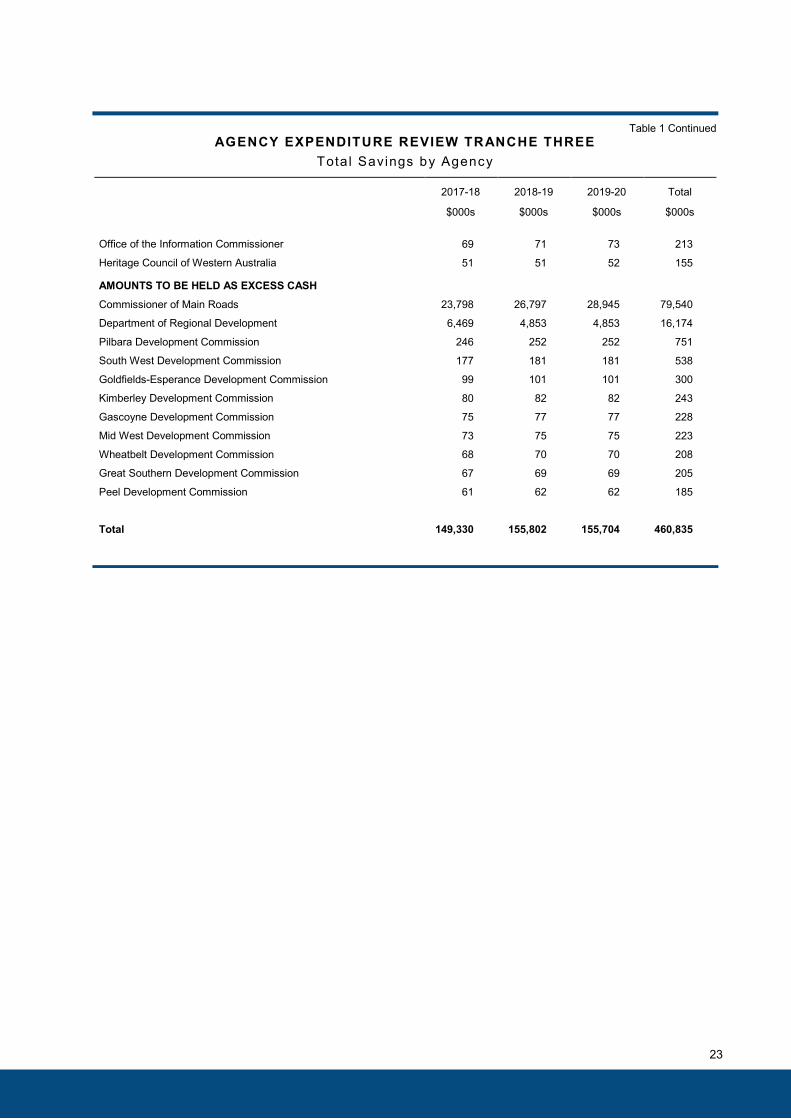
Table 1 Continued AGENCY EXPENDITURE REVIEW TRANCHE THREE
Total Savings by Agency
2017-18
$000s
2018-19
$000s
2019-20
$000s
Total
$000s
Office of the Information Commissioner 69 71 73 213
Heritage Council of Western Australia 51 51 52 155
AMOUNTS TO BE HELD AS EXCESS CASH
Commissioner of Main Roads 23,798 26,797 28,945 79,540
Department of Regional Development 6,469 4,853 4,853 16,174
Pilbara Development Commission 246 252 252 751
South West Development Commission 177 181 181 538
Goldfields-Esperance Development Commission 99 101 101 300
Kimberley Development Commission 80 82 82 243
Gascoyne Development Commission 75 77 77 228
Mid West Development Commission 73 75 75 223
Wheatbelt Development Commission 68 70 70 208
Great Southern Development Commission 67 69 69 205
Peel Development Commission 61 62 62 185
Total 149,330 155,802 155,704 460,835
23
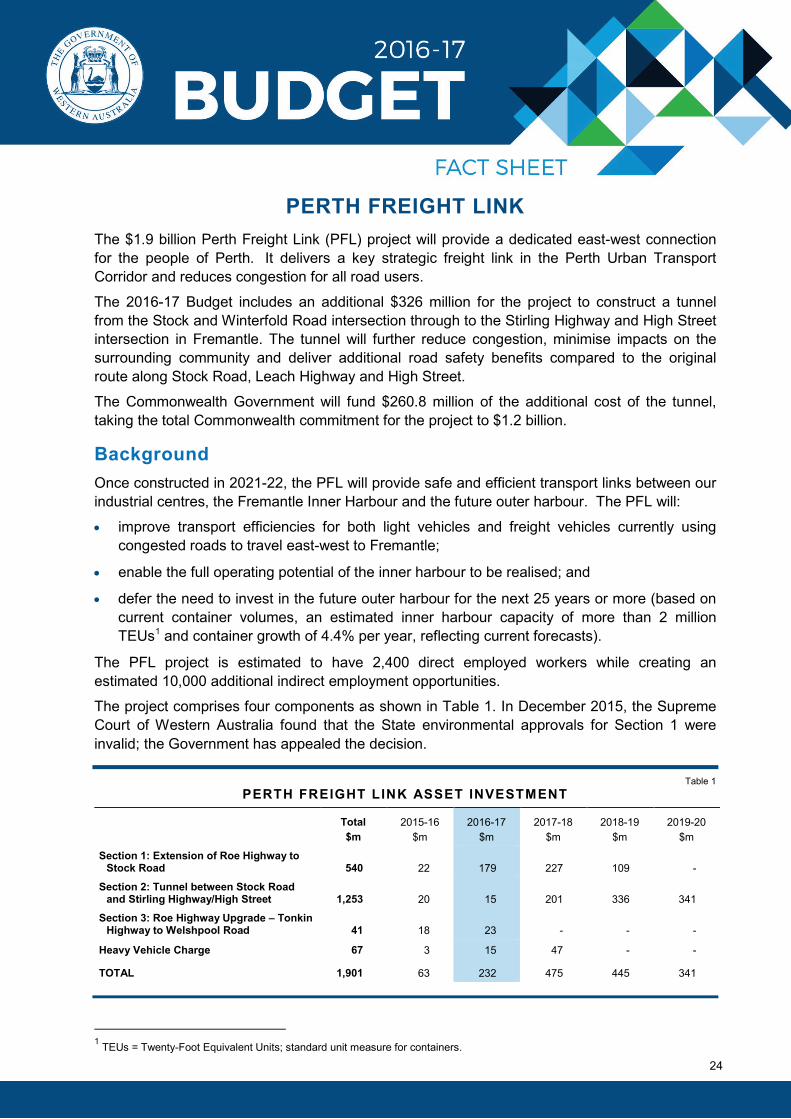
PERTH FREIGHT LINK The $1.9 billion Perth Freight Link (PFL) project will provide a dedicated east-west connection for the people of Perth. It delivers a key strategic freight link in the Perth Urban Transport Corridor and reduces congestion for all road users.
The 2016-17 Budget includes an additional $326 million for the project to construct a tunnel from the Stock and Winterfold Road intersection through to the Stirling Highway and High Street intersection in Fremantle. The tunnel will further reduce congestion, minimise impacts on the surrounding community and deliver additional road safety benefits compared to the original route along Stock Road, Leach Highway and High Street.
The Commonwealth Government will fund $260.8 million of the additional cost of the tunnel, taking the total Commonwealth commitment for the project to $1.2 billion.
Background Once constructed in 2021-22, the PFL will provide safe and efficient transport links between our industrial centres, the Fremantle Inner Harbour and the future outer harbour. The PFL will:
• improve transport efficiencies for both light vehicles and freight vehicles currently usingcongested roads to travel east-west to Fremantle;
• enable the full operating potential of the inner harbour to be realised; and
• defer the need to invest in the future outer harbour for the next 25 years or more (based oncurrent container volumes, an estimated inner harbour capacity of more than 2 millionTEUs1 and container growth of 4.4% per year, reflecting current forecasts).
The PFL project is estimated to have 2,400 direct employed workers while creating an estimated 10,000 additional indirect employment opportunities.
The project comprises four components as shown in Table 1. In December 2015, the Supreme Court of Western Australia found that the State environmental approvals for Section 1 were invalid; the Government has appealed the decision.
Table 1 PERTH FREIGHT LINK ASSET INVESTMENT
Total $m
2015-16 $m
2016-17 $m
2017-18 $m
2018-19 $m
2019-20 $m
Section 1: Extension of Roe Highway to Stock Road 540 22 179 227 109 -
Section 2: Tunnel between Stock Road and Stirling Highway/High Street 1,253 20 15 201 336 341
Section 3: Roe Highway Upgrade – Tonkin Highway to Welshpool Road 41 18 23 - - -
Heavy Vehicle Charge 67 3 15 47 - -
TOTAL 1,901 63 232 475 445 341
1 TEUs = Twenty-Foot Equivalent Units; standard unit measure for containers.
24
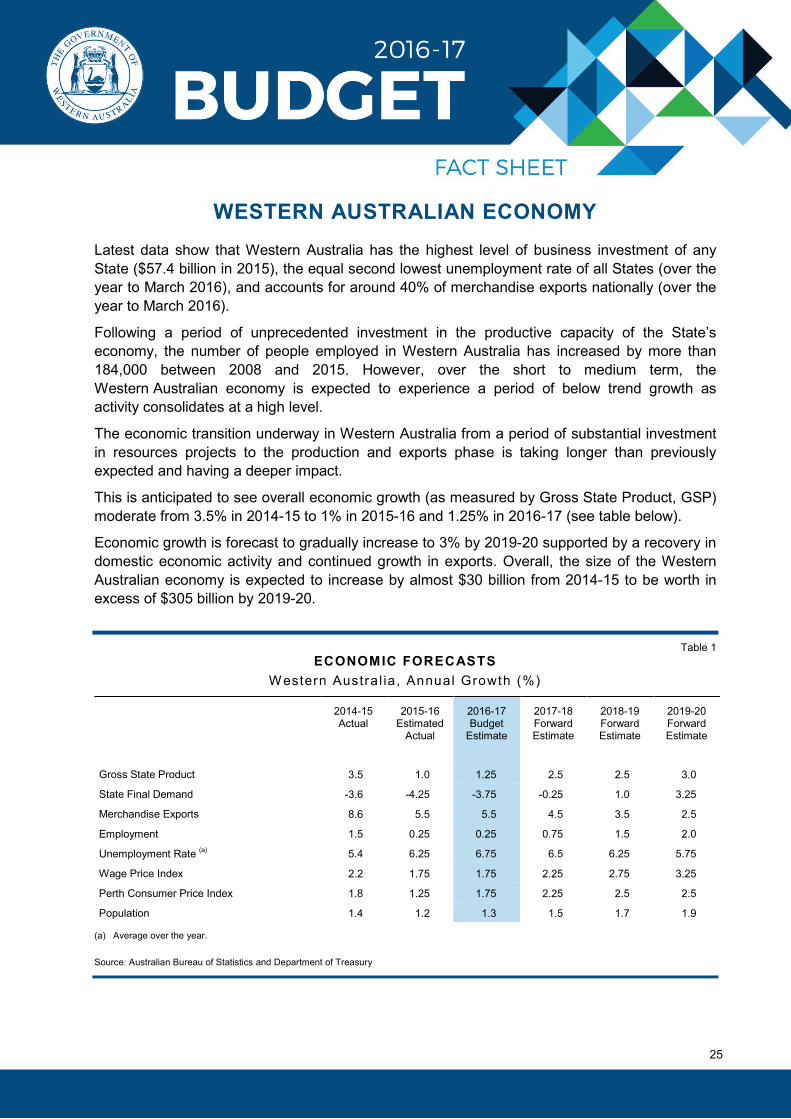
WESTERN AUSTRALIAN ECONOMY Latest data show that Western Australia has the highest level of business investment of any State ($57.4 billion in 2015), the equal second lowest unemployment rate of all States (over the year to March 2016), and accounts for around 40% of merchandise exports nationally (over the year to March 2016).
Following a period of unprecedented investment in the productive capacity of the State’s economy, the number of people employed in Western Australia has increased by more than 184,000 between 2008 and 2015. However, over the short to medium term, the Western Australian economy is expected to experience a period of below trend growth as activity consolidates at a high level.
The economic transition underway in Western Australia from a period of substantial investment in resources projects to the production and exports phase is taking longer than previously expected and having a deeper impact.
This is anticipated to see overall economic growth (as measured by Gross State Product, GSP) moderate from 3.5% in 2014-15 to 1% in 2015-16 and 1.25% in 2016-17 (see table below).
Economic growth is forecast to gradually increase to 3% by 2019-20 supported by a recovery in domestic economic activity and continued growth in exports. Overall, the size of the Western Australian economy is expected to increase by almost $30 billion from 2014-15 to be worth in excess of $305 billion by 2019-20.
Table 1 ECONOMIC FORECASTS
W estern Austra l ia , Annual Growth (%)
2014-15 Actual
2015-16 Estimated
Actual
2016-17 Budget
Estimate
2017-18 Forward Estimate
2018-19 Forward Estimate
2019-20 Forward Estimate
Gross State Product 3.5 1.0 1.25 2.5 2.5 3.0
State Final Demand -3.6 -4.25 -3.75 -0.25 1.0 3.25
Merchandise Exports 8.6 5.5 5.5 4.5 3.5 2.5
Employment 1.5 0.25 0.25 0.75 1.5 2.0
Unemployment Rate (a) 5.4 6.25 6.75 6.5 6.25 5.75
Wage Price Index 2.2 1.75 1.75 2.25 2.75 3.25
Perth Consumer Price Index 1.8 1.25 1.75 2.25 2.5 2.5
Population 1.4 1.2 1.3 1.5 1.7 1.9
(a) Average over the year.
Source: Australian Bureau of Statistics and Department of Treasury
25
The domestic economy, as measured by State Final Demand (SFD), is contracting as business investment declines from a peak in 2012-13 to more normal levels by the end of the forecast period. As a result, SFD is expected to contract for a fourth consecutive year in 2016-17.
Business investment is expected to decline in each year of the forecast period to 2018-19, as major LNG projects continue to wind down their capital expenditure and move into production. Beyond 2018-19, investment is projected to increase modestly, supported by a rise in sustaining capital expenditure for the large resource projects built in recent years, as well as the potential for some strategic investment in anticipation of a re-balancing of the iron ore market.
As a share of the total economy, investment is expected to fall from a peak of over 31% in 2012-13 to around 12% by the end of the forecast period, which is much closer to the average share of around 11% prior to the last decade where iron ore and LNG investment has been unusually large.
Exports are expected to continue to be a key driver of the States’ economic growth across the Budget period, primarily due to the ramp up in production from large resource projects.
For example, from 2015-16 to 2019-20, LNG exports are projected to more than double (from around 20 to almost 50 million tonnes) and as a result, by 2020, Western Australia is expected to have the third largest installed LNG production capacity in the world after Qatar and the US.
Weakness in the domestic economy is translating into soft labour market conditions. Employment is expected to increase by 0.25% per annum in 2015-16 and 2016-17 and grow more strongly in 2017-18 and beyond. The unemployment rate is expected to rise and peak at 6.75% in 2016-17, before steadily declining to 5.75% in 2019-20.
Increasing space capacity in the labour market is expected to contain wage pressure, with the Wage Price Index (CPI) projected to increase by only 1.75% per annum over the two years to 2016-17.
Inflation pressures are also expected to remain subdued in the near term. Perth’s Consumer Price Index is forecast to increase by only 1.25% in 2015-16 and 1.75% in 2016-17 reflecting the combined impact of low fuel prices, falling residential rents, incentives by builders for purchasers building a new home, and historically low wages growth.
Estimates of CPI in the March 2016 quarter, released after the cut-off date for Budget (19 April) shows the largest quarterly decline in the Perth CPI since the March 1991 quarter. This was primarily the result of lower project home costs, rents and automotive fuel prices. Fuel prices are no longer acting to moderate CPI growth. However, softer house construction and rental markets represent a downside to the 2016-17 Budget forecasts.
Population growth in Western Australia is anticipated to remain modest over the short-term as softer economic conditions continue to translate into lower levels of overseas migration to the State. Population growth is forecast at 1.3% in 2016-17, and is projected to increase gradually to 1.9% by 2019-20.
26
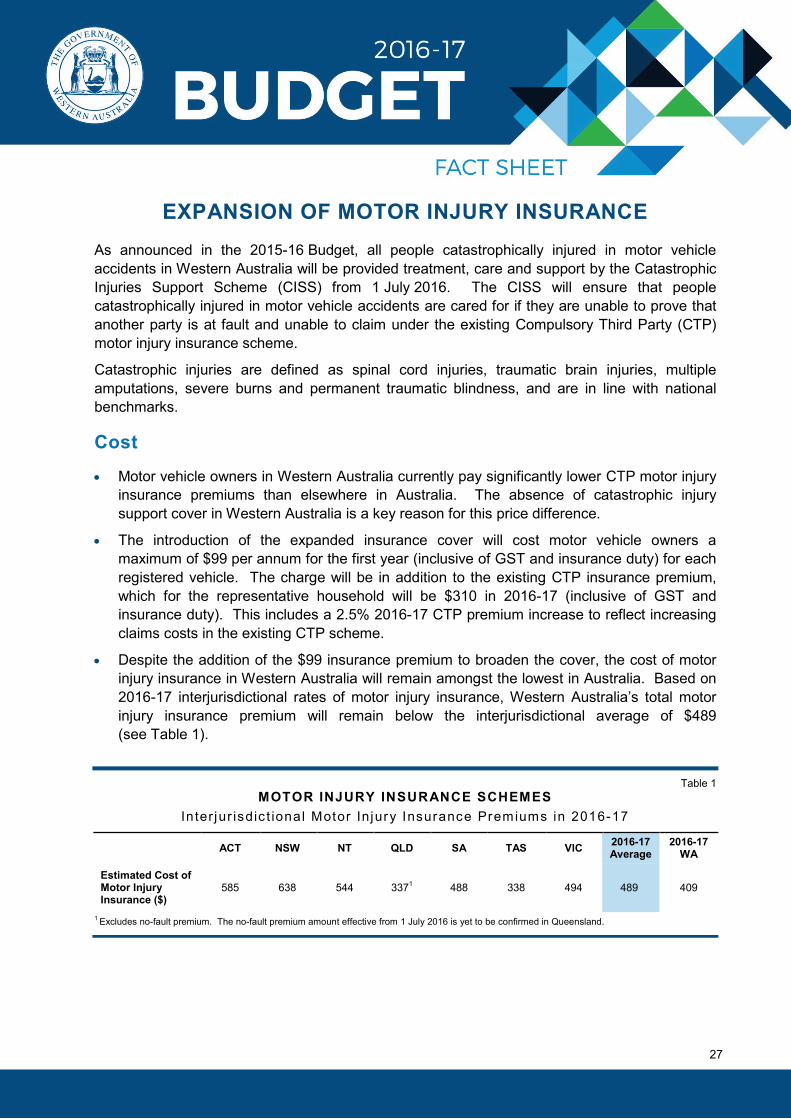
EXPANSION OF MOTOR INJURY INSURANCE As announced in the 2015-16 Budget, all people catastrophically injured in motor vehicle accidents in Western Australia will be provided treatment, care and support by the Catastrophic Injuries Support Scheme (CISS) from 1 July 2016. The CISS will ensure that people catastrophically injured in motor vehicle accidents are cared for if they are unable to prove that another party is at fault and unable to claim under the existing Compulsory Third Party (CTP) motor injury insurance scheme.
Catastrophic injuries are defined as spinal cord injuries, traumatic brain injuries, multiple amputations, severe burns and permanent traumatic blindness, and are in line with national benchmarks.
Cost
• Motor vehicle owners in Western Australia currently pay significantly lower CTP motor injuryinsurance premiums than elsewhere in Australia. The absence of catastrophic injurysupport cover in Western Australia is a key reason for this price difference.
• The introduction of the expanded insurance cover will cost motor vehicle owners amaximum of $99 per annum for the first year (inclusive of GST and insurance duty) for eachregistered vehicle. The charge will be in addition to the existing CTP insurance premium,which for the representative household will be $310 in 2016-17 (inclusive of GST andinsurance duty). This includes a 2.5% 2016-17 CTP premium increase to reflect increasingclaims costs in the existing CTP scheme.
• Despite the addition of the $99 insurance premium to broaden the cover, the cost of motorinjury insurance in Western Australia will remain amongst the lowest in Australia. Based on2016-17 interjurisdictional rates of motor injury insurance, Western Australia’s total motorinjury insurance premium will remain below the interjurisdictional average of $489(see Table 1).
Table 1 MOTOR INJURY INSURANCE SCHEMES
In ter jur isdic t ional Motor Injury Insurance Premiums in 2016-17
ACT NSW NT QLD SA TAS VIC 2016-17 Average
2016-17 WA
Estimated Cost of Motor Injury Insurance ($)
585 638 544 3371 488 338 494 489 409
1 Excludes no-fault premium. The no-fault premium amount effective from 1 July 2016 is yet to be confirmed in Queensland.
27
• The following additional premium rates will be charged for the expanded cover availablefrom 1 July 2016:
− $99 for family cars and motorcycles above 75cc;
− $30 for farm fire-fighting vehicles, mopeds and vintage cars;
− $25 for most tractors; and
− no additional premium will apply to caravans and trailers.
• The insurance premiums applied to the various vehicle classes reflect the different riskprofiles in the existing CTP scheme and the estimated crash experience.
• No vehicle class will pay more than $99 in the first year for expanded catastrophic injurycover.
• The premium rate will be reviewed as part of each year’s Budget process following anindependent actuarial assessment of the claims experience.
Benefits
• Over 1.8 million motorists in 2.8 million registered vehicles in Western Australia will havetheir injury insurance cover expanded to ensure they are covered if they are catastrophicallyinjured in a crash after 1 July 2016.
• It is estimated that each year in Western Australia 92 people suffer a catastrophic injury in amotor vehicle accident, 48 of whom are able to claim compensation under the existing CTPscheme. The remaining 44 people rely on support available through Government fundedservices, personal accident, superannuation or income protection insurance, and/or thesupport of family and friends. The introduction of expanded motor injury insurance willensure all people catastrophically injured in motor vehicle accidents will be cared for.
• People catastrophically injured will be entitled to the following services: rehabilitation;attendant and nursing care; domestic assistance; respite care; dental treatment; ambulancetransportation; aids and appliances; home and transport modifications; prosthetics; medicaltreatment; and educational and vocational training.
• People who are catastrophically injured in a motor accident and can prove fault of anotherparty will retain their legal right to compensation via a lump-sum payment following injurystabilisation if their injuries are caused by the actions of another party. Alternatively, theycan continue to receive their entitlements paid on a periodic payment basis.
28
BROADENING THE STATE’S ECONOMY THROUGH TOURISM
Recognising the potential of tourism as a future growth sector for Western Australia, the Government launched the State Government Strategy for Tourism in Western Australia 2020 (2020 Strategy) in December 2012, which outlines the goal of increasing the value of tourism to $12 billion by 2020.
In 2015, tourism contributed over $9 billion in visitor spending and generated more than 94,000 jobs (representing 7% of the State’s employment).
Tourism Infrastructure
To achieve the 2020 goal, the Government and private sector have invested heavily into tourism infrastructure in recent years. This helps to make Western Australia more attractive as a potential holiday destination among international and domestic travellers. This includes:
• completion of Elizabeth Quay along the Swan River, connecting the river to the city, whichincludes plans for new hotels such as Crown Towers, the Ritz-Carlton and the Westin;
• the new 60,000-seat Perth Stadium, due for completion in late 2017, which will giveWestern Australia the potential to host large-scale international sporting events; and
• the Perth City Link project, which will reconnect the city centre with Northbridge, featureretail and commercial precincts within Yagan Square and Kings Square, and provide visitorswith better access to public transport.
Tourism Events and Marketing
Tourism WA has secured the following events and marketing initiatives to increase brand awareness of Perth’s tourism spots:
• in June 2016, the Government will roll out the first phase of its new campaign to marketPerth and Western Australia. Designed to bring to life the unique, personal experiencesvisitors can have on any given day in Western Australia, the campaign will promote shortstories of people’s travel experiences within the State;
• Western Australia will host the Corroboree Asia 2016 event in September 2016. This eventis a Tourism Australia initiative aimed at attracting 300 travel agents from across Asia toAustralia; and
• in September 2016, the Australian Wallabies Rugby team will play an international testagainst South Africa at Domain Stadium and Perth will host the Australian UniversityGames, the final of the UCI World Cycling Tour and the World Masters AthleticsChampionships.
29
Funding Commitments
As part of the 2016-17 Budget, the Government will provide the following additional funding to assist Tourism WA in delivering the $12 billion goal by 2020:
• $16.9 million over four years to 2019-20 to enable Tourism WA to increase its DestinationMarketing activities;
• a further $19 million to be spent over three years to 2018-19 to allow Tourism WA to securemajor events; and
• $10.7 million for the Perth Convention Bureau to continue securing national andinternational events by marketing Western Australia nationally and internationally as apreferred convention, exhibition and incentive travel destination.
The Royalties for Regions program is funding the following initiatives to improve the visitor experience in regional Western Australia:
• a new lookout and see-through platform has been built at The Gap and Natural Bridge, nearAlbany, as part of a $6.1 million upgrade;
• a $20 million new Kalbarri Skywalk and National Park Tourist Infrastructure projectcommenced in 2015-16, providing new sealed roads to the Loop and Z Bend tourist sitesand the development of new facilities at several sites including two new lookout structuresoverlooking the Murchison River gorge in Kalbarri National Park;
• an additional $22 million will be invested in establishing and managing new Kimberleynational and marine parks, including the Great Kimberley Marine Park which will be thesecond largest coastal marine park in Australia;
• funding of $16 million over four years to establish a Western Australian Regional Film Fund,with the objective to deliver a coordinated regional film industry strategy to attract highquality Australian and international production to film in Western Australia;
• in partnership with the Western Australian Indigenous Tourism Operators Council, theGovernment’s $4.6 million Aboriginal Tourism Development Plan will deliver businessdevelopment training and marketing over three years to 2018, to support a sustainableAboriginal tourism sector; and
• in response to the growing popularity of camping and caravan holidays, the Government hasinvested $40.7 million in the Western Australian Caravan and Camping ActionPlan: 2013-2018 and Parks for People initiative, which will see new and upgraded amenitiesat popular camping grounds along Western Australia’s south coast.
30
PERTH STADIUM FINANCIAL IMPACT The delivery of the Perth Stadium and its subsequent operation involves two major State Government contracts: the Design-Build-Finance-Maintain (DBFM) contract for the design, construction and ongoing maintenance of the facilities; and the Operator Services contract for management of the completed Stadium and Sports Precinct.
The procurement strategy for Perth Stadium was adopted by the State Government following detailed consideration of project attributes, objectives and risks, in order to deliver the best overall outcome for the community.
Operating Costs
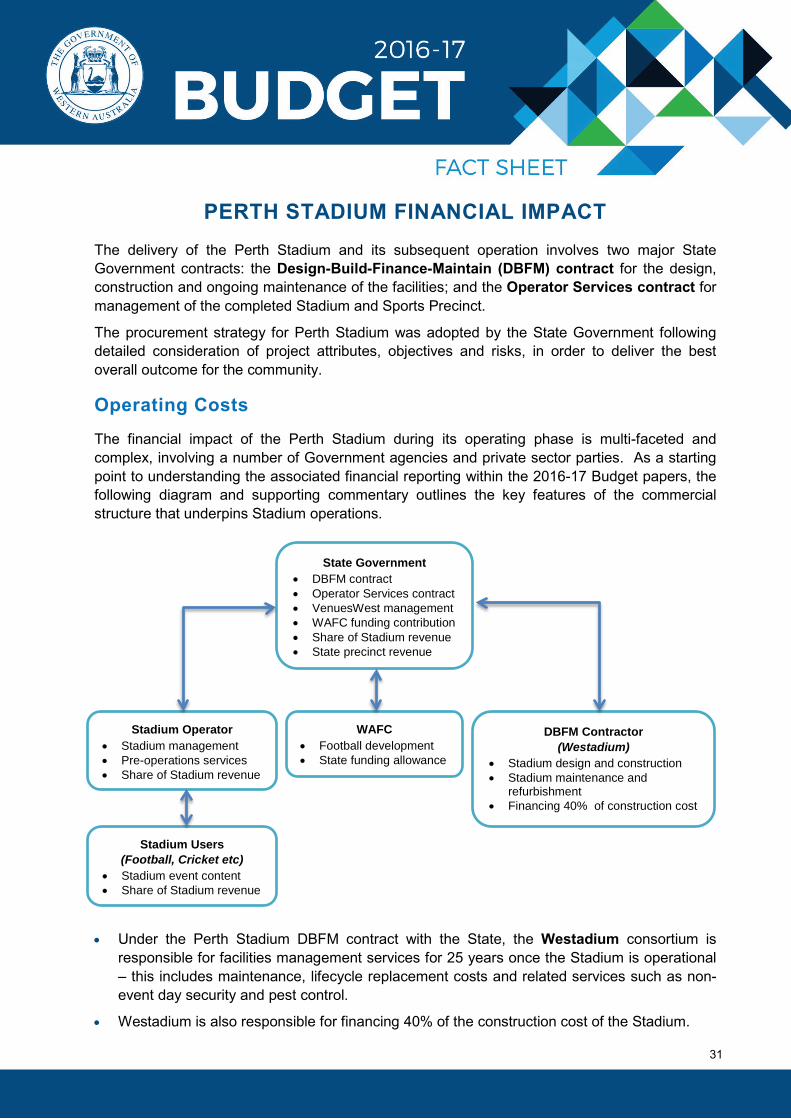
The financial impact of the Perth Stadium during its operating phase is multi-faceted and complex, involving a number of Government agencies and private sector parties. As a starting point to understanding the associated financial reporting within the 2016-17 Budget papers, the following diagram and supporting commentary outlines the key features of the commercial structure that underpins Stadium operations.
• Under the Perth Stadium DBFM contract with the State, the Westadium consortium isresponsible for facilities management services for 25 years once the Stadium is operational– this includes maintenance, lifecycle replacement costs and related services such as non-event day security and pest control.
• Westadium is also responsible for financing 40% of the construction cost of the Stadium.
31
State Government • DBFM contract• Operator Services contract• VenuesWest management• WAFC funding contribution• Share of Stadium revenue• State precinct revenue
Stadium Users (Football, Cricket etc)
• Stadium event content
• Share of Stadium revenue
Stadium Operator • Stadium management• Pre-operations services
• Share of Stadium revenue
DBFM Contractor (Westadium)
• Stadium design and construction• Stadium maintenance and
refurbishment• Financing 40% of construction cost
WAFC • Football development• State funding allowance
• Through VenuesWest (the Western Australian Sports Centre Trust), the State makescontract payments to Westadium for facilities management services and financing costsrelated to Westadium’s 40% financing contribution. These payments will be made over the25 year operational phase of the DBFM contract.
• Under the Operator Services contract with VenuesWest, the Stadium Operator isresponsible for day-to-day management of the Stadium and Sports Precinct, includingcatering, securing event content, event management and ticketing. The Stadium Operatorwill receive a base management fee from VenuesWest, plus an agreed share of the netrevenue generated by the Stadium and Sports Precinct, with VenuesWest also receiving ashare.
• Under User Agreements with the Stadium Operator, the Stadium Users (including AFLFootball and Cricket parties) will commit to providing event content in return for venueaccess and an agreed share of Stadium revenue.
• In order to sustain its ongoing football development role, the State will separately provide afunding contribution to the Western Australian Football Commission (WAFC).
The Government has consistently stated that a key performance objective for the Perth Stadium is that relevant operational costs are met from revenue derived from the Stadium and its surrounding Sports Precinct.
These operational costs comprise:
• the operational component of the payments to be made by VenuesWest under theStadium’s DBFM contract (relating to maintenance, lifecycle replacement and facilitiesmanagement services);
• payments made by VenuesWest under the Stadium’s Operator Services contract;
• VenuesWest’s own governance and management costs; and
• a fixed funding contribution for the WAFC.
The capital component of the DBFM contract payments (relating to Westadium’s financing costs) is funded by the State, under the same principle that would apply if the Perth Stadium was delivered as a conventional, publicly funded project. One-off pre-operational costs incurred by the Stadium Operator and VenuesWest in preparing for the transition to Stadium operations are also separately funded by the State.
Stadium revenue comprises the income that VenuesWest derives under the Operator Services contract and other revenue sources under direct State control. This includes income from Stadium events (Football, Cricket and other events), ‘non-event day’ functions, food and beverage sales, sponsorship and Precinct revenue (managed by VenuesWest outside the Operator Services contract).
VenuesWest’s income is net of the revenue that funds the Stadium Operator’s operating costs and the revenue that flows direct to the Stadium Users under the User Agreements.
The State’s project team has undertaken detailed financial modelling of the Stadium’s forecast operating costs and revenue. To align with the terms of key operational contracts (the Operator Services contract, the Cricket User arrangements and the review period proposed for the Football User arrangements), modelling has focused on the initial 10 years of the operating phase.
The analysis shows that over the initial 10 years of the operating phase, the income derived from Perth Stadium’s operational model is forecast to meet its operational costs.
32
Overall Project Financial Impact Given the complex commercial arrangements detailed above, the total impact of the Perth Stadium is reflected in the financial aggregates and operations of several government agencies, and has been updated over several budget processes. In total, the consolidated budget aggregates reflect:
• an increase in asset value of $1.399 billion relating to the Perth Stadium and Precinct($1.063 billion) and supporting transport infrastructure ($336 million) by 2017-18;
• a finance lease liability of $423 million from 2017-18;
• the impact of the Operator Services contract, with revenue from Stadium activities sufficientto cover relevant operating costs as detailed above; and
• updated finance lease and depreciation costs reflecting the consolidation of the asset inVenuesWest’s Accounts.
Department of Sport and Recreation (DSR) There is no change to the financial impacts for DSR reported in the 2015-16 Budget.
• The DSR is responsible for the State’s 60% capital contribution under the DBFM contract of$489 million. This amount will be progressively paid to Westadium during the DBFMdesign and construction phase. It is reflected in DSR’s Statement of Cashflows as ‘otherpayments’ under ‘Cashflows from Financing Activities’, consistent with the relevantaccounting standards for Public Private Partnerships which require the costs associated withthe DBFM contract to be recognised as a finance lease. The $489 million State capitalcontribution includes $13 million for transport infrastructure delivered under the DBFMcontract and shown as ‘other proceeds’, funded by the Public Transport Authority.
• Following the completion of the design and construction phase of the DBFM contract in2017-18, the Stadium and Sports Precinct asset will be transferred to VenuesWest.
• DSR is also responsible for other non-DBFM project costs including initial site works (underthe completed Pre-construction Site Works contract), providing utility services to the site andthe State’s project management team. These costs are reflected in the DSR’s AssetInvestment Program (AIP) with a total estimated cost of $131 million (noting that additionalplanning costs of $20 million have previously been reported under DSR’s AIP).
VenuesWest The most significant changes in the 2016-17 Budget in relation to the Perth Stadium are reported by VenuesWest, reflecting the progression of the project towards commencement of operations in 2017-18. The financial impacts reported by VenuesWest are outlined below.
• Disclosure of the financial lease liability of $423 million from 2017-18 to reflect the 40% ofthe DBFM construction cost financed by Westadium. This liability amount reduces to$390 million in 2019-20, in line with the capital component of the DBFM finance leasepayments, shown as ‘other payments’ under ‘Cashflows from Financing Activities’.
• Reflecting the competed Perth Stadium and Sports Precinct from 2017-18 as a non-currentasset of $1.063 billion, which includes DBFM costs ($912 million, made up of the Statecapital contribution of $489 million plus the initial finance lease liability of $423 million) andother non-DBFM costs, including planning costs ($151 million).
33
• Depreciation expenses of $21 million per annum. This is a non-cash expense, and reflectsstraight line depreciation of the Stadium and Sports Precinct assets over their lifecycle.
• Pre-operating costs of $12 million in 2016-17 and 2017-18, reflecting the one-off costsincurred by VenuesWest in preparing for the transition to Stadium operations.
• Finance lease charges totalling $80 million to 2019-20, reflecting the capital component ofthe payments to be made by VenuesWest under the Stadium’s DBFM contract, as outlinedabove.
• Lastly, VenuesWest is reflecting operating expenditure (supplies and services costs) ofapproximately $13 million per annum related to the Stadium, covering the operationalcomponent of the DBFM contract payments (as outlined above) plus VenuesWest’s ownmanagement costs. Consistent with commentary above, these costs will be met fromincreased sales of goods and services income representing the impact of Stadiumoperations.
Public Transport Authority • $336 million transport infrastructure package, through the traditional Asset Investment
Program, to service the Stadium and precinct. This is in addition to $22 million in transportrelated infrastructure delivered under the DBFM ($13 million) and Pre-construction SiteWorks ($9 million) contracts and reflected in the DSR and VenuesWest stadium assets.
• An increase to the PTA operating subsidy, reflecting the subsidised amount related toStadium patronage.
WAFC FundingSince early 2014, the State Government has been negotiating with the Joint Football Working Group (JFWG, comprising the Australian Football League (AFL), the WAFC and Western Australian AFL clubs) regarding the JFWG user arrangements at Perth Stadium once it commences operations in 2017-18.
The Stadium Operator will be responsible for finalising the detailed terms of these negotiations; however, a number of elements have been agreed in principle. Key amongst these is ensuring that Australian Rules Football remains strong and well supported in Western Australia. To achieve this, the State Government has agreed that the WAFC’s historical revenue from Subiaco Oval will effectively be funded from Perth Stadium revenue. This will replace football development and competition (Western Australian Football League) funding that the WAFC currently derives from Subiaco Oval. This funding contribution has been included in the Stadium financial model, based on an independently audited review of the WAFC’s historical financial performance.
Whilst the detailed mechanisms by which the WAFC will receive this funding commitment are being finalised, it is likely to be in the form of an ongoing grant from the DSR – similar to other State Government grants previously provided to the WAFC.
A global provision for WAFC funding has been included in the 2016-17 Budget, as an interim measure prior to finalisation of commercial negotiations with the JFWG.
34