Embed Size (px)
Citation preview
IFRS FINANCIAL STATEMENTS 2016
Table of contentsTABLE OF CONTENTS...........................................................................................................................................................2FINANCIAL HIGHLIGHTS.......................................................................................................................................................3GENERAL INFORMATION.....................................................................................................................................................4DIRECTORS’ REPORT............................................................................................................................................................5REPORT OF SHARIA SUPERVISORY BOARD..........................................................................................................................7REPORT OF THE INDEPENDENT AUDITORS..........................................................................................................................8STATEMENT OF COMPREHENSIVE INCOME.........................................................................................................................9STATEMENT OF FINANCIAL POSITION................................................................................................................................10STATEMENT OF CHANGES IN EQUITY.................................................................................................................................11STATEMENT OF CASH FLOWS............................................................................................................................................121. REPORTING ENTITY..............................................................................................................................................132. BASIS OF PREPARATION.......................................................................................................................................143. SIGNIFICANT ACCOUNTING POLICIES...................................................................................................................144. FINANCIAL RISK MANAGEMENT...........................................................................................................................225. INCOME FROM ISLAMIC FINANCE.......................................................................................................................376. RETURN TO CUSTOMERS......................................................................................................................................377. FEE AND COMMISSION INCOME..........................................................................................................................378. FEES AND COMMISSION EXPENSES.....................................................................................................................389. NET TRADING INCOME.........................................................................................................................................3810. OTHER OPERATING INCOME................................................................................................................................3811. PERSONNEL EXPENSES........................................................................................................................................3812. OPERATING LEASE EXPENSE................................................................................................................................3913. ADMINISTRATION AND GENERAL EXPENSES.......................................................................................................3914. INCOME TAX EXPENSE.........................................................................................................................................3915. INCOME TAX LIABILITY.........................................................................................................................................4016. DEFERRED TAX EXPENSE......................................................................................................................................4017. EARNINGS PER SHARE..........................................................................................................................................4118. CASH AND CASH EQUIVALENTS............................................................................................................................4219. ISLAMIC FINANCING AND RELATED ASSETS.........................................................................................................4220. HELD-TO-MATURITY INVESTMENT SECURITIES....................................................................................................4321. INVESTMENTS IN PROPERTIES.............................................................................................................................4322. PROPERTY, PLANT AND EQUIPMENT....................................................................................................................4323. INTANGIBLE ASSETS............................................................................................................................................4424. OTHER ASSETS.....................................................................................................................................................4525. DEPOSITS FROM BANKS......................................................................................................................................4526. DEPOSITS FROM CUSTOMERS.............................................................................................................................4627. OTHER LIABILITIES...............................................................................................................................................4628. STATEMENT OF CHANGES IN EQUITY...................................................................................................................4629. OFF BALANCE SHEET CONTINGENCIES AND COMMITMENTS ........................................................................4730. RELATED PARTIES ................................................................................................................................................4831. SUBSEQUENT EVENTS.........................................................................................................................................4932. NEW STANDARDS, INTERPRETATIONS AND AMENDMENTS TO EXISTING STANDARDS THAT ARE NOT YET EFFECTIVE.............................................................................................................................................49VALUE ADDED STATEMENT................................................................................................................................................51LIST OF TOP 20 SHAREHOLDERS........................................................................................................................................52
1
IFRS FINANCIAL STATEMENTS 2016
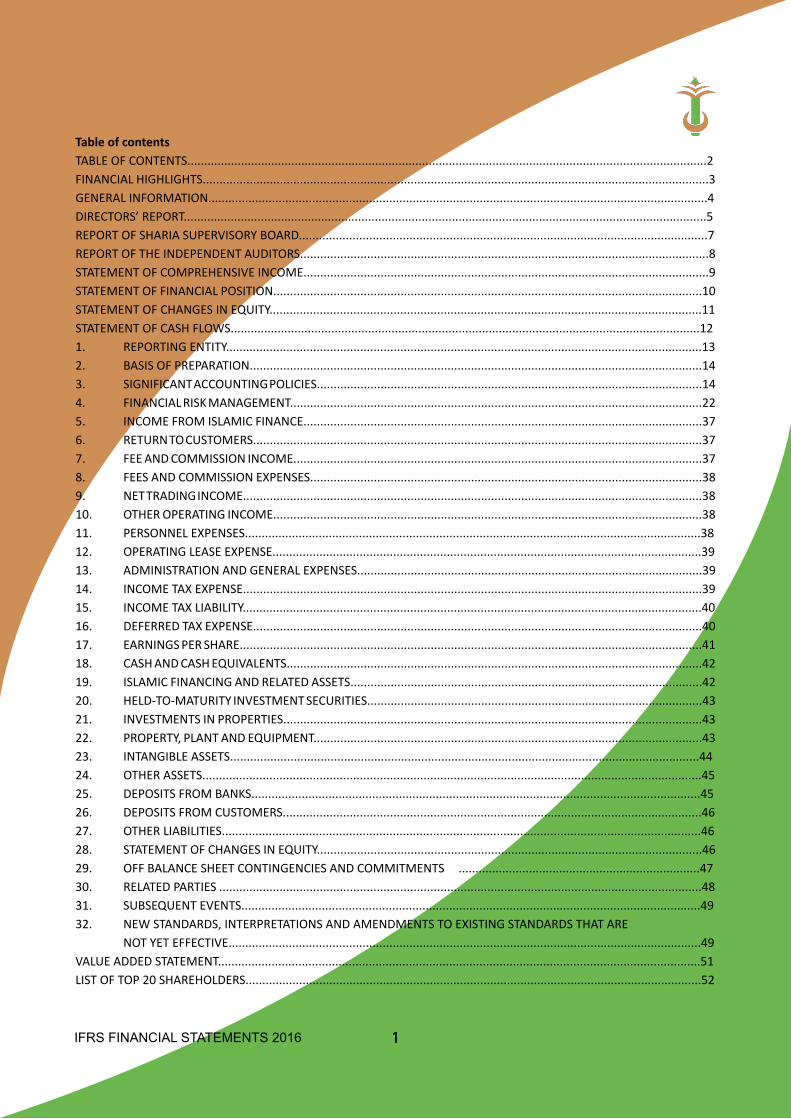
VISION STATEMENT“To be distinctive in all aspects of our business”
MISSION STATEMENT“To provide quality and accessible banking services based on Islamic
financial principles with equitable reward to stakeholders, driven by highly motivated well-trained people
and state-of-the art technology”
PAY OFF…..Working today for your tomorrow
VALUESThe core values of the bank are shared belief that drives behavior in
the company backed by Islamic faith. Some of these values, which are aimed at realizing the bank’s vision,
mission and goals are:
• Honesty• Tolerance• Brotherhood (treat each other as a sister/brother)• Team work
2
IFRS FINANCIAL STATEMENTS 2016
THE BANK PROFILE
AGIB Ltd was incorporated as a private limited liability company in November, 1994 and was granted a banking license by The Central Bank of The Gambia in September 1996. The bank became fully operational in January, 1997. It is worth mentioning here that the Finan-cial Institution Act 1992 was amended to provide for the establishment of an Islamic Bank in The Gambia.
AGIB is the first and the only Islamic Bank in The Gambia and it is legally allowed to own equity in other companies and also operate in commodities and Real Estate markets on its own account.
In September, 2008 AGIB consummated a strategic alliance with First Inland Bank (FINBANK) of Nigeria. In May 2014 FINBANK shares were all bought by Gambian businessman making him the majority shareholder. The Islamic Development Bank in Jeddah also holds significant shares. The bank currently has 103 employees and has 6 branches strategically located in Banjul, New Jeshwang, Tranquil, Bakoteh, Brikama and Basse and 6 ATMs in Banjul, Churchill’s Town, Brikama and Basse branchesand at 2 offsite locations at QCell head office on Kairaba Avenue and at Brusubi roundabout.
AGIB operates on the Islamic Economic Principle of Risk/Reward also known as Profit and Loss Sharing.
Unique characteristics:
• Only Islamic bank in a 90% Muslim dominated country• Offers only Sharia compliant products• Only bank allowed to own and develop real state• Assist disadvantaged people in the community• Legally allowed to own equity in other companies
3
IFRS FINANCIAL STATEMENTS 2016
Murabaha (Cost plus mark-up agreement)Murabaha is a contract in which the customer requests for the Islamic financial institution to purchase a commodity and sell it to him/her at a cost plus mark-up will be on adeferred payment basis. The cost of the commodity is paid to the supplier of the goods delivered directly to the institution or to the customer.
Mudaraba (profit sharing)Mudaraba is a profit sharing contract in which one party offer the funds (investor) and the other (the financial institutions) invest and manage the fund. It’s a mutual agreement between the investor and the specialist with the expertise. The investor (Rabal Mal) is the dormant partner and the bank is the manager of the funds (Mudarib). Profits are shared at a fixed ratio while any loss is borne by the owner of the funds provided that the mudarib is not negligent in the investment of the funds.
Musharaka (Partnership financing)
Musaraka is referred to as joint venture agreement where both the bank and the customer contribute towards the funds required for the venture in the agreed proportion in short it is base on equity participation between the Islamic Financial Institution and a Client.
Istisna’a (contract of manufacture)
This is where the bank agrees to finance the manufacture or production of a product and the payment is made upon completion and delivery of the item in question. Income generated from providing this product is small (less than one percent of total investment income). Is sna’a is currently advanced to staff.
Ijara
This is similar to conventional leasing operating leases where the income generated is in the form of rental income accruing to the bank.
PRODUCTS AND SERVICES
HAJJ SAVINGS SCHEMEIn addition to this saving scheme, products and services to be rendered to pilgrims are straight forward and simple. Already, the Bank has been involved in the provision of Saudi Riyals for exchange though volumes dwindled significantly during the period under review.
BUSINESS ADVISORY SERVICE
In addition to traditional commercial banking, AGIB has been mandated to carry out investment financing by granting medium to long-term finances to customers. The preparation of project documents is also within the purview of the Investment Department. Some customers may have sound investment ideas but may not be able to transform them into reality. Thus, the department offers advice to customers of the Bank on various aspects of their business, ranging from feasibility studies to keeping proper books of account.
ACCOUNTS
AGIB SAVING ACCOUNTThis is designed specifically to meet require-ments of customers who would like the bank to invest their money, they can deposit and withdraw as and when they want and they are paid profits as permitted by the Shariah
AGIB CURRENT ACCOUNT
It is a profit-free account which is designed to meet the requirements of Customers. Account holders can deposit and withdraw money by cheque at any of the bank’s 6 branches. It is available to all categories of customers
4
IFRS FINANCIAL STATEMENTS 2016
PRODUCTS AND SERVICES AGIB INVESTMENT ACCOUNTThis is a high return account that would enable customers to deposit fixed sums of money in the bank through our the year and for a fixed periods ranging from (three months six months and twelve months). The bank invests the money and profit is distributed in accordance with Islamic Sharia law as per the agreement signed between the two parties.
Our Technology
Information technology remains the bedrock of service delivery. The bank continues to exploit and master new technologies to package and deliver innovative products and services. AGIB is a technology and service driven Bank, through enhanced service delivery channels leveraging on cutting edge solutions.
Our People
Our customers are unique and require individual approach. AGIB has competence and expertise in the delivery of customized and unique solutions tailored to address our customers distinctive needs. Our staff are polite, well-trained and experienced in customer service.
IFRS FINANCIAL STATEMENTS 2016 Page | 3
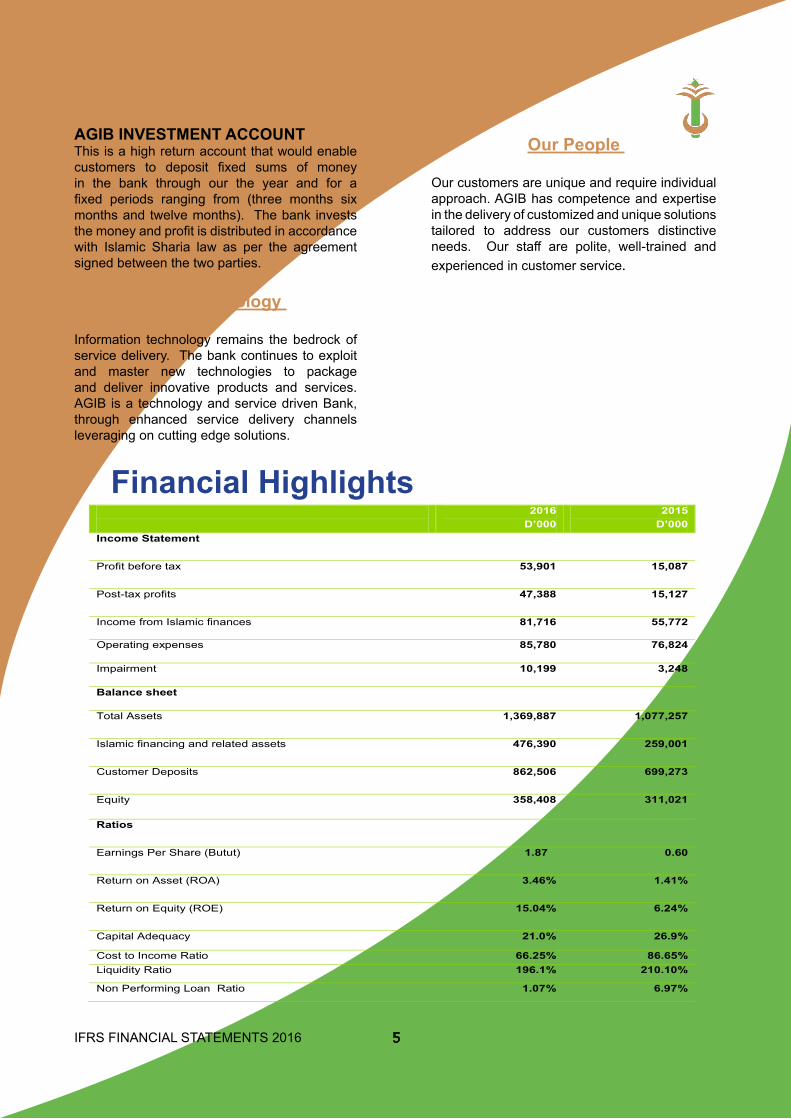
Financial Highlights
2016 D’000
2015 D’000
Income Statement
Profit before tax
53,901 15,087
Post-tax profits
47,388 15,127
Income from Islamic finances 81,716 55,772
Operating expenses 85,780 76,824
Impairment 10,199 3,248
Balance sheet
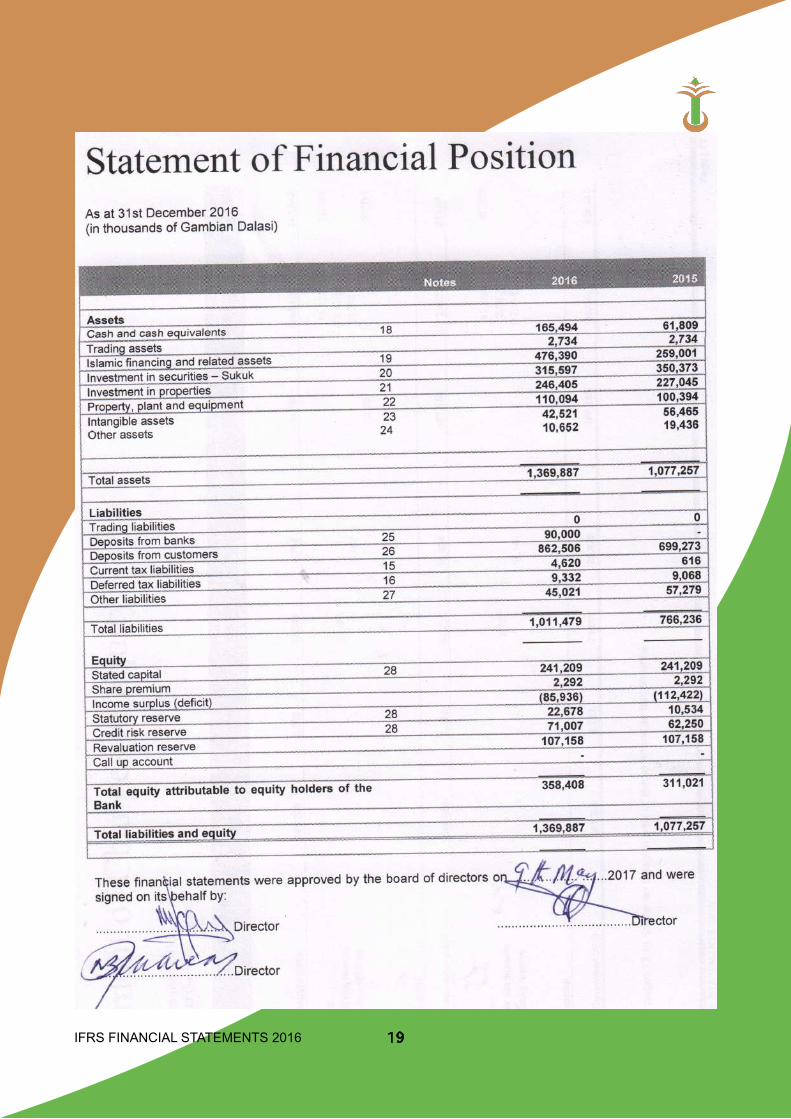
Total Assets
1,369,887 1,077,257
Islamic financing and related assets
476,390 259,001
Customer Deposits
862,506 699,273
Equity 358,408 311,021
Ratios
Earnings Per Share (Butut)
1.87 0.60
Return on Asset (ROA)
3.46% 1.41%
Return on Equity (ROE)
15.04% 6.24%
Capital Adequacy 21.0% 26.9%
Cost to Income Ratio 66.25% 86.65% Liquidity Ratio 196.1% 210.10%
Non Performing Loan Ratio 1.07% 6.97%
Financial Highlights
5
IFRS FINANCIAL STATEMENTS 2016
IFRS FINANCIAL STATEMENTS 2016 Page | 4
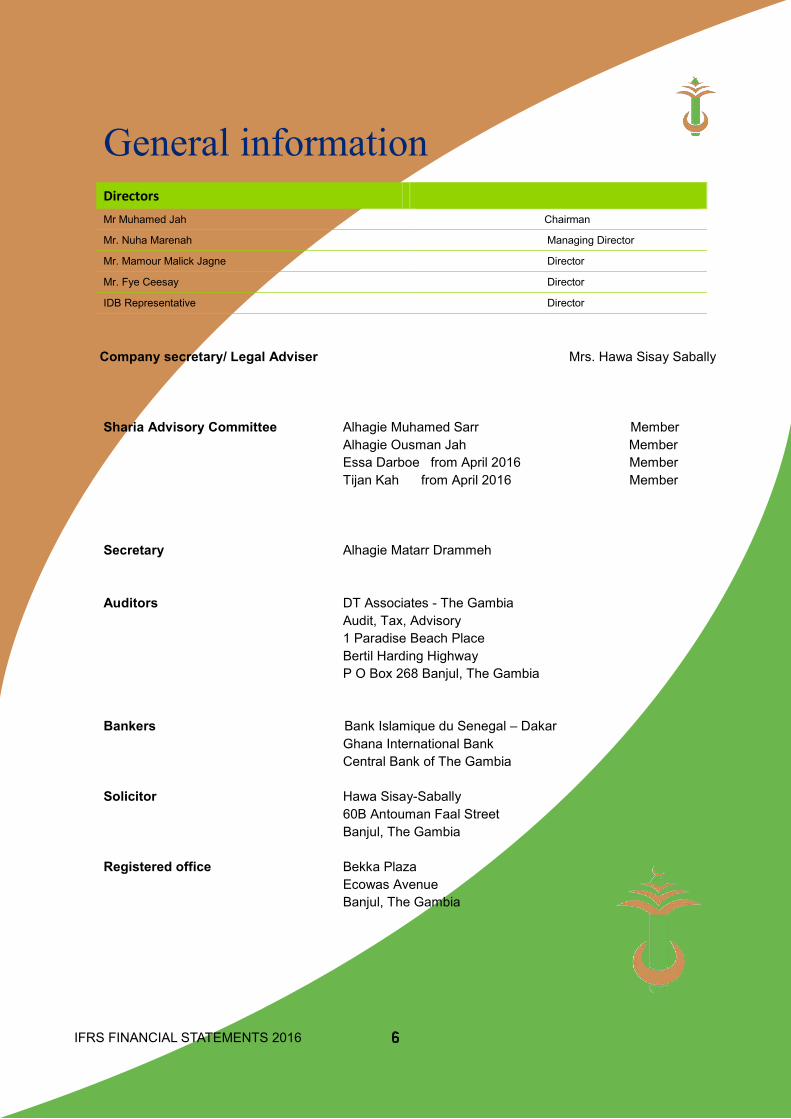
General information
Directors Mr Muhamed Jah Chairman Mr. Nuha Marenah Managing Director
Mr. Mamour Malick Jagne Director
Mr. Fye Ceesay Director
IDB Representative Director
Company secretary/ Legal Adviser Mrs. Hawa Sisay Sabally
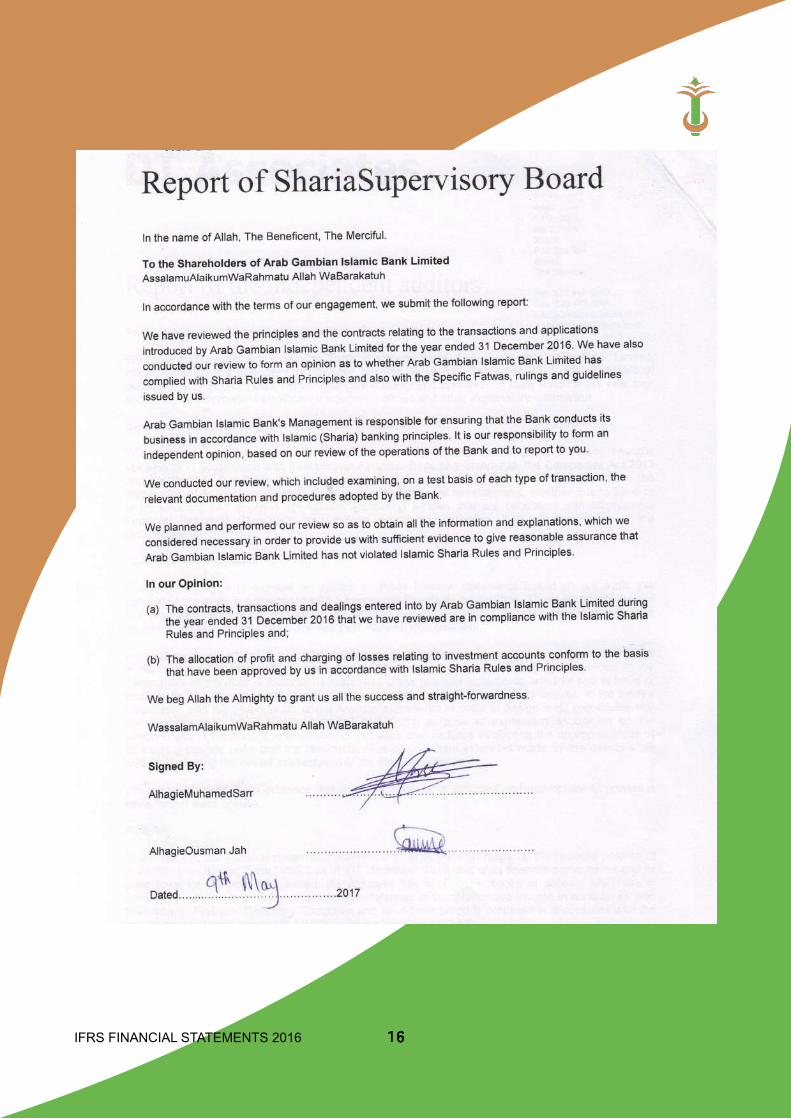
Sharia Advisory Committee Alhagie Muhamed Sarr Member Alhagie Ousman Jah Member Essa Darboe from April 2016 Member Tijan Kah from April 2016 Member Secretary Alhagie Matarr Drammeh Auditors DT Associates - The Gambia Audit, Tax, Advisory 1 Paradise Beach Place Bertil Harding Highway P O Box 268 Banjul, The Gambia Bankers Bank Islamique du Senegal – Dakar Ghana International Bank Central Bank of The Gambia Solicitor Hawa Sisay-Sabally 60B Antouman Faal Street Banjul, The Gambia Registered office Bekka Plaza Ecowas Avenue Banjul, The Gambia
6
IFRS FINANCIAL STATEMENTS 2016
Chairman’s Statement
Assalamualaikum.On behalf of the Board of Directors, I am delighted to welcome you to the Annual General Meeting of your bank Agib Bank Ltd. I have the honour of presenting the highlights
of the bank's operating performance for the year ended December31, 2016, as well as an overview of the major developments that impacted the international and domestic environments in which your bank operated.
International EnvironmentThe year under review was characterized by contrasting fortunes for developed countries and emerging and developing countries. There was strong growth registered by developed economies whereas there was a slowdown in major developing economies mainly in Latin America. Overall, the United States recovered strongly in the second half of the year when unemployment was re-duced to its lowest level over a number of years after a lackluster first half. Europe did not enjoy same level of success though domestic demand in Spain and in the United Kingdom exceeded forecasts despite the Brexit vote in the UK.
The economies of emerging markets and developing countries (EMDEs) was a lot more diverse. The growth rate in China was stronger than expected while performance was sluggish in some key Latin American countries such as Argentina and Brazil which went into recession. Turkey was bewildered by political turmoil while Russia did slightly better than expected as a result of improved oil prices after Opec’s decision to reduce output to push prices up.
The IMF reported that headline inflation rates recovered in advanced economies with the bottoming out of commodity prices. Core inflation rates have remained broadly unchanged and generally below inflation targets during 2016. In developing countries, inflation trends have been heterogeneous, reflecting differing exchange rate movements in particular and producer prices.
Distinguished Shareholders, Ladies and Gentlemen,
In Financial market developments. long-term nominal and real interest rates have risen substantially since August, particularly in the United Kingdom and in the United States (since the November election). Trump government was expected to pursue an expansionary fiscal policy which fuel inflation.
The U.S. dollar appreciated against most major currencies during the year particularly against the Great Britain Pound and the Japanese Yen. However, the currencies of some commodity ex-porting countries like Russia strengthened as a result of overall increases in commodity prices.
The Domestic Economy
The Gambian economy is heavily dependent on the agricultural sector both in terms of its contribution to GDP and in terms of the huge number of people engaged in the sector for their livelihood. The sector contributes 25% of GDP and employs about 75% of the work force.
The Gambia has sparse natural resource deposits. Households rely heavily on remittances from workers overseas and tourist receipts. Remittance inflows to The Gambia amount to approximately 20% of the country’s GDP
Small-scale manufacturing activity features the processing of peanuts, fish, and hides. Re-ex-port trade accounts for almost 80% of goods ex-ports with China as the largest trading partner for both exports and imports.
7
IFRS FINANCIAL STATEMENTS 2016
The Gambia's natural beauty and proximity to Europe has made it a preferred tourist destination in West Africa, boosted by government and private sector investments in eco-tourism and upscale facilities. Tourism contributes about 20% of GDP. The sector is yet to recover from hit in 2014 which was occasioned by fears of Ebola virus in neighboring West African countries. The run up to the elections of 2016 ushered in uncertainty and fears of violence resulting in cancellations of tourists’ bookings and an unprecedented drop in tourist arrivals with its attendant effects on the economy (drop in employment, low contribution to GDP, reduced government earnings etc). Overall, Q4 of 2016 was arguably the most unproductive quarter for the tourism industry in the history of independent Gambia mainly due to political uncertainly which culminated in the impasse of December 2016 and January 2017. Unemployment peaked and incomes plummeted.
DOMESTIC BANKING SECTOR
The banking sector remains strong and safe as indicated by the financial soundness indicators. The capital adequacy ratio for the industry averaged 38.5% up from 37.9% at the corresponding period last year.
Total assets of the sector increased by 0.7% to D29.6 billion (69.8% of GDP) Gross loans and advances declined by 15.7% com-pared to the same period last year. Gross loans and advances constitute 14.4% of the industry’s total assets.
Non-performing loans ratio dropped from 11.6% same period last year to 7.6%. This signifies a marked improvement in the quality of banks’ assets
Deposit liabilities, which constitute 54% of the industry’s total liabilities, declined by 2.9% to D16.1 million. Liquidity ratio averaged 88.7% well above the required
The last few months of 2016 were however punctuated by a high-impact political impasse which literally crippled the economy. Businesses closed down temporarily while their proprietors sought refuge out of the country or in the countryside. This went into the new year. Agib Bank Ltd, like other commercial banks and the Central Bank of The Gambia, closed its head office in Banjul for a few days and operated from our the Disaster Recovery (DR) site in Bakote. I am glad to say that our operations from DR site was seamless with no adverse impact on services. Infact Agib Bank’s customers did not notice that we were operating from the DR site.
Chairman’s Statement
8
IFRS FINANCIAL STATEMENTS 2016
FINANCIAL PERFORMANCE OF AGIB BANK LTD
In the last AGM in June 2016, the Board of Directors’ recommendation to change the bank’s name from Arab Gambian Islamic Bank (AGIB) Ltd to Agib Bank Ltd was approved. Following the approval, authorization was sought from the Central Bank of The Gambia to effect the name changand it was granted. All necessary procedures and requirements have been complied with and the name change has been finalized and published in the papers for public notification.
Chairman’s Statement
9
Profit after tax increased from D15.1 million in 2015 to D47.4 million in 2016 i.e. a growth of 213.27%
Return on Assets (ROA) grew from 1.41% to 3.46%; an increase of 145.39%
Return on Equity (ROE) grew from 6.24% to 15.04% in 2016; a growth of 141.03%
Earnings per share improved from 0.6% in 2015 to 1.87% in 2016; an increase of 211.67%
Deposits grew from D699.27 million in 2015 to D952.51 in 2016; a growth of 36.21%
Non-performing loan ratio improved from 6.97% to 1.07%; an improvement of 84.65%
SIGNIFICANT EVENTS DURING THE YEAR 2016
I am pleased to inform you that your bank made a strategic decision to buy a piece of land on Kairaba Avenue in heart of the business district for the purpose of constructing its head office. As you are all aware, the bank is currently housed in a rented shopping complex in Banjul which is obviously not ideal. Architectural and structural drawings/designs have been completed and the construction will be tendered shortly.
It is refreshing to report that the IDB is now committed to attend all our Board meetings and are in the process of identifying a permanent representative. A representative attended the last meeting with a Power of Attorney from IDB.
IFRS FINANCIAL STATEMENTS 2016
OUTLOOK FOR 2017
Results of 1st December 2016 elections were challenged by the defeated sitting government resulting in the infamous political impasse and economic devastation as discussed earlier. 2017 started under very stressful, volatile and unprecedented conditions. This was swiftly addressed by the intervention of sub-regional forces which saw the former President seek exile in Equitorial Guinea. His departure was a necessary but not a sufficient condition for immediate positive changes in the political, social and economic conditions of the majority of Gambians.
Given the lack of any meaningful quantity of natural resources and the depleted government coffers, progress depends on sustained bilateral and multilateral aid, onresponsible government economic management, and on continued technical assistance from multilateral and bilateral donors. The good news is that International donors and lenders are enthused by the return of democracy to the country and a number of them have pledged funds for budgetary support and for financing much-needed infrastructural and capacity building projects. Your bank is well poised to take advantage of the opportunities that present themselves.
CONCLUSION
On behalf of the Board of Directors and Management, I want to thank our customers for their trust and patronage, our shareholders for their support and confidence in us and our staff for their commitment towards sustaining and actualizing the ideals and the corporate objectives of your noble institution. I would also like to thank the CentraI Bank for their effective oversight and guidance. I pray that Almighty Allah SAW would continue to guide and direct your bank and every one of us.
Finally, may I take this opportunity to seek you approval for the payment of dividend at 98 bututs per share.
Chairman’s Statement
10
IFRS FINANCIAL STATEMENTS 2016
Managing Director’s Statement
It is indeed a great privilege to brief you on the activities of your bank for the period January to December 2016
THE GLOBAL ECONOMYThe year 2016 was a mixed bag of fortunes for the world economy. The first half of the year saw relative stability while there was far less certainty in global markets in the second half of the year due primarily to the BREXIT vote in the United Kingdom and the election of Donald P Trump as the President of the United States. The unprecedented upsurge in terrorist activity in both Germany and France, the two economic and political powerhouses in the European Union caused nervousness in stock markets in the Euro Zone. The IMF and other major multilateral financial institutions had no alternative but to reduce their global growth forecasts for 2016 to 1.8% in 2016 lower than the 1.9% in 2015 mainly influenced by weak consumer appending, lower oil and gas prices in the first half of the year. The strengthening of the US Dollar against all other major currencies like GBP and the Japanese Yen did not help consumer spending either. Against the backdrop of low oil prices and dampening consumer demand in most major economies, inflation pressures remain generallylow.
Growth in emerging markets and developing countries remained strong at 4.1% for 2016 driven by a 6.7% growth forecast for China. For Sub-Saharan Africa, growth forecast in the region has been revised down to 1.6% which is much lower than the 3.3% growth in 2015. This is mainly due to difficulties in South Africa and Nigeria where the local currency, the Naira had to be devalued. Prices of both oil and non-oil commodities remain well below historical averages.
Assalamu Alaykum Warahmatullah tala wabarakatuhu
Distinguished Ladies and Gentlemen
In The Gambia, domestic debt is estimated at 67.9 percent of GDP in 2016 up from 53.9 percent in 2015 reflecting high domestic debt accumulation. The ratio of external debt to GDP ratios in 2016 stood at 50.9 percent compared with the established threshold of 30 percent. Overall, national debt exceeded GDP
The FX market remained unpredictable throughout 2016 with significant volatilities especially after the lifting of the executive order that pegged the USD to D40/$. USD sky-rocketed from D40/$ to 54.50/$ immediately after the lifting of the Executive Order due to the growing importance of the parallel market. On 1st November 2016, the CBG issued a directive after intensive consultation with players in the market that restricted commercial banks’ spread to D1.00 per Dollar. It also required commercial banks to sell at least 15% of their total FX purchases to the Central purchases to build up depleted national FX reserves. Obviously these interventions affected revenues negatively. Revenues from FX Trading normally constitute a significant portion of the bank’s revenue but that was not the case in 2017 due to the negative impact of the bad executive order and the burgeoning parallel market.
Banking Sector highlightsThe banking sector remains strong and safe as indicated by the financial soundness indicators. The capital adequacy ratio for the industry averaged 38.5% up from 37.9% corresponding period last year.
Total assets of the sector increased by 0.7% to D29.6 billion (69.8% of GDP)
Gross loans and advances declined by 15.7% compared to the same period last year. They constitute 14.4% of the industry’s total assets
Non-performing loans ratio dropped from 11.6% same period last year to 7.6%. This signifies a marked improvement in the quality of banks’ assets
Deposit liabilities declined by 2.9% to D16.1 million. Deposit liabilities constitute 54% of the industry’s total liabilities. Liquidity ratio averaged 88.7% well above the required minimum of 30%.
11
IFRS FINANCIAL STATEMENTS 2016
Yields on the 91 day and 182-day treasury bills declined to 17.15% and 17.83 percent in June 2016 from 17.28% and 18.44% in June 2015. In contrast, yields on the 364 day bills, on the other hand, rose to 21.85% from 21.45% a year ago. Yields on the 91 day and 182 day SAS declined to 17.5% and 17.9% in June 2016 compared to 17.6% and 18.4% respectively in June 2015. Yields on 364 day SAS, on the other hand, rose to 21.90 percent from 20.54 percent in June 2015.
Preliminary balance of payments estimates for the first half of 2016 indicate a deficit of US$24.7 million from a surplus of US$21.8 million in the same period last year. The current account defi-cit narrated to US$58.1 million in June 2016 compared to US$69.7 million a year ago, mainly on account of improved trade balance.
These indicators were contained in the Central Bank of The Gambia’s Monetary Policy Committee’s Press release of September 2016 and are the latest available official numbers as at the time of writing this report.
The last few months of 2016 were however punctuated by a high-impact political impasse which literally crippled the economy. Businesses closed down temporarily while their proprietors sought refuge out of the country or in the coun-tryside. This went into the new year.
OVERVIEW OF THE BANKIt was in the forgoing environment that your bank operated in 2016. Additionally, I would like to highlight some key performance indicators as at 31st December 2016
Financial Performance Indicators
• Customer deposits increased from D699m in 2015 to D953m in 2016 I.e. an increase of 36%
• Bank registered a pre-tax profit of D54m (fifty four million Dalasi only) as at 31st December 2016 from D15m in 2015 i.e. 260% increase
• Operating expenses increased from D73.6m in 2015 to D75.6m in 2016 i.e. 3% increase
• Income from Treasury Operations increased from D7.9m 2015 to D8.4m in 2016 i.e 6% increase
Managing Director’s Statement
• Income from banking service increased from D16.6M to in 2015 to D19.5 in 2016 i.e 18% increase
• Income from Islamic finance increased from D55.8m in 2015 to D81.7m in 2016 i.e.47% increase
• Non-performing loans ratio declined from 6.9% in 2015 to 1.07% in 2016 i.e. a decline of 84%
• Cost/income ratio reduced from 86.65% in 2015 to 66.25% in 2016 i.e. a decline of 24%
Human Resources
Training continues to be the priority. During the year, in-house training sessions were conducted for all staff in Operational Risk Management, AML and Terrorist Financing. In addition to the in-house training, our staff attended all relevant training programs organised by the Gambia Bankers’ association. At the Annual Dinner of the Association, the Gambia Bankers’ Association recognised your banks performance in the training space by awarding us a certificate for being one of the most active banks in capacity building. We believe human resources to be the most important component of any business so we consider training to be a worthwhile investment.
Every staff took their full annual leave entitlement during the year
In June 2016, a minimum increase of 10% of staff salary was implemented across board as approved by you in the AGM of 3rd June 2016. Staff morale is currently at an all-time high as a result of which we have been able to attract some good resources from competitor banks
An in-house provident fund was set up to promote a savings culture amongst staff with a view to enhance their incomes at retirement. Contributions to the fund are voluntary and are deducted from their salaries at source.
12
IFRS FINANCIAL STATEMENTS 2016
Managing Director’s StatementTECHNOLOGYThe IT team had intensive training in ORACLE, the platform on which the bank’s core banking software, iMAL sits to reduce dependence in order to enhance the team's knowledge in report generation and better understanding of the software itself. The training was facilitated by a certified oracle IT specialist.
Your bank implemented internet banking in May 2016 to provide our customers with modern banking our customers can now do their banking in the confort of their homes.
We achieved a remarkable level of uptime of over 95% on all our major technology platforms (like iMAL core banking, ATMs and iBanking).
During the impasse, we had to close our head office and our data centre in Banjul for a few days and resorted to operating from our Disaster Recovery site in Bakote. We were able to operate seamlessly with no impact on service. This confirmed the robustness the bank’s technology platforms and the efficiency of your technology team.
I am pleased to inform you that all our processes are now fully automated.
Outlook for 2017The main challenges for 2017 will be the diminishing revenue from fixed income investments. Sukuk Al Salam floats are reducing at an alarming rate and the trend is most likely not going to be reversed given the budgetary support that international donor community is providing for the New Gambia. It is not only the quantum of the float that is going down but the rates as well. The budget rate for 364-day bills was 22% but as of today, the actual rate is 12% which is a significant reduction in the revenues.
Trade Services is an integral part of our operations and as such we are embarking on developing in-house capability to handle the transactions/volumes we anticipate in the commodities market.
In 2016 we requested for a murabaha financing credit line in the sum of $5million (five million United States Dollars only) from IDB. A due diligence team from IDB visited the bank and their findings were very positive.The request has since been approved and the legal documentation is near finalization prior to disbursement.
Our outlook for the 2017 is bright and very promising. The on boarding of NFSC into the bank’s books will undoubtedly be an immense opportunity to increase the bank’s performance both in terms of business volumes and income. Coupled with this is the increasing support coming from IDB. It must be noted that Sukuk yields are not expected to go up for the foreseeable future. However, this will be mitigated by working on increasing the bank’s portfolio size using the excesses of the funds strategically.
Head Office buildingThe architect has submitted the final plans and are being reviewed. We have issue notice of termination of the tenancy contract to our cur-rent landlord for 30th November 2017 but that is being reviewed for extension as construction work is not likely to be completed before 30th November when the current tenancy will expire.
Agency BankingFollowing Central Bank of The Gambia’s ap-proval for commercial banks to roll out agency banking in areas where we do not have a foot print, we are piloting in two towns, Numuyel and Garawole, in the URR. Staff have been trained as Tellers and CSOs for the two sites in Basse Branch in December 2016. The Agencies are expected to commence operations soon.
CONCLUSION AND ACKNOWLEDGEMENTSIn conclusion, I would like to assure you the shareholders that your bank is on the right trajectory and Management and staff of the bank are enthused by the confidence and trust that you, the shareholders and the Board of Directors have placed in us. We will continue to exploit the prospects and opportunities that present themselves with a view to move your bank to the next level. We thank you for your invaluable trust and support throughout the year.I would also like to express our sincere gratitude to the Central Bank of The Gambia for their invaluable support and guidance.
It is evident that without our esteemed customers, we would not have achieved all what we are celebrating today. We thank them for their custom and for their partnership.
Finally, on behalf of the Chairman, Board of Directors and Management of the bank, I would like to thank the staff of your bank for their honesty, commitment, dedication and genuine desire to achieve the goals of the bank while maintaining full compliance with Shariah, the rockbed of Islamic banking and with regulatory guidelines. May Allah SWT The Almighty continue to bless, protect and guide us all. Amen.
THANK YOU13
IFRS FINANCIAL STATEMENTS 2016
IFRS FINANCIAL STATEMENTS 2016 Page | 5
Directors’ report
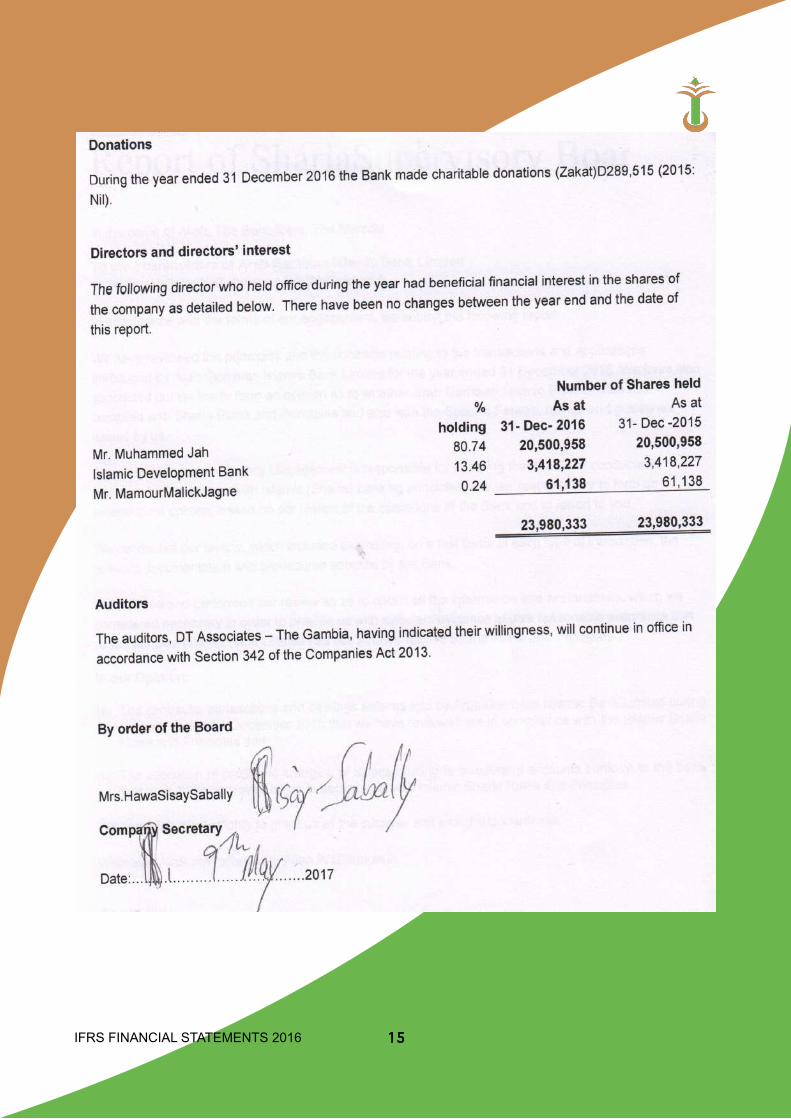
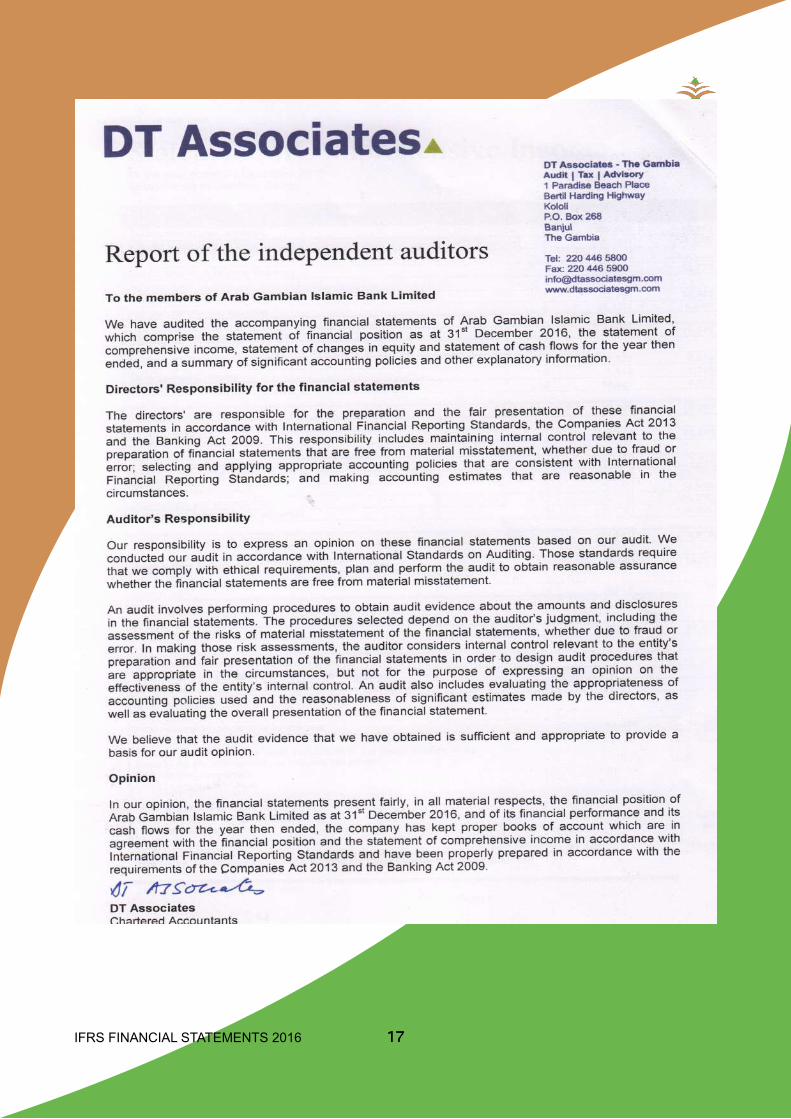
The Directors present their report and audited financial statements of Arab Gambian Islamic Bank Limited for the year ended 31 December 2016.
Statement of directors’ responsibilities The Companies Act 2013 requires the directors to prepare the financial statements for each financial year which give a true and fair view of the state of affairs of the company and of its profit or loss for that period. In preparing the financial statements, the directors are required to:
select suitable accounting policies and then apply them consistently;
make judgments and estimates that are reasonable and prudent;
state whether applicable accounting standards have been followed, subject to any material departures disclosed and explained in the financial statements;
prepare the financial statements on the going concern basis unless it is inappropriate to presume that the company will continue in business.
The directors are responsible for keeping proper accounting records which disclose with reasonable accuracy at any time the financial position of the company and to enable them ensure that the financial statements comply with the Banking Act 2009 and the Companies Act 2013. They are responsible for safeguarding the assets of the company and hence for taking reasonable steps for the prevention and detection of fraud and other irregularities. Principal business activity The company provides banking services in all its departments and branches in accordance with Islamic (Sharia) banking principles, regulations of the Central Bank of The Gambia and the Banking Act 2009, with a view to making profit for its shareholders and depositors and to contribute to the socioeconomic development of The Gambia. Apart from accepting deposits from customers and providing services traditionally rendered by conventional banks, the bank also grants financing facilities for short, medium and long term economically and financial viable undertakings. Results and dividends The results of the company are as detailed in the accompanying financial statements. The directors are proposing to pay dividend of D0.40 bututs per share.
Property, plant and equipment The property, plant and equipment of the company are as detailed in note 22 of the financial statements. There has not been any permanent diminution in the value of the property, plant and equipment and as a result a provision has not been deemed necessary.
14
IFRS FINANCIAL STATEMENTS 2016 15
IFRS FINANCIAL STATEMENTS 2016 16
IFRS FINANCIAL STATEMENTS 2016 17
IFRS FINANCIAL STATEMENTS 2016
IFRS FINANCIAL STATEMENTS 2016 Page | 9
Statement of Comprehensive Income for the year ended 31 December 2016 (in thousands of Gambian Dalasi) Notes 2016
2015
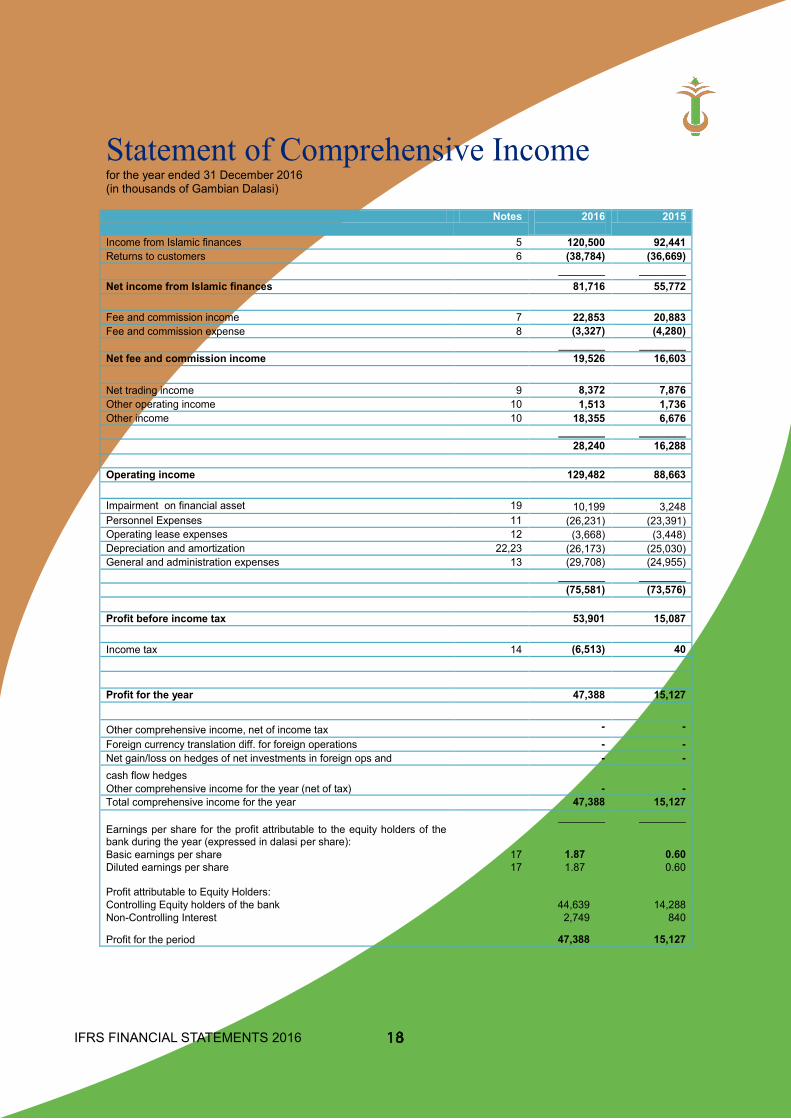
Income from Islamic finances 5 120,500 92,441 Returns to customers 6 (38,784) (36,669) ________ ________ Net income from Islamic finances 81,716 55,772 Fee and commission income 7 22,853 20,883 Fee and commission expense 8 (3,327) (4,280) ________ ________ Net fee and commission income 19,526 16,603 Net trading income 9 8,372 7,876 Other operating income 10 1,513 1,736 Other income 10 18,355 6,676 ________ ________ 28,240 16,288 Operating income 129,482 88,663 Impairment on financial asset 19 10,199 3,248 Personnel Expenses 11 (26,231) (23,391) Operating lease expenses 12 (3,668) (3,448) Depreciation and amortization 22,23 (26,173) (25,030) General and administration expenses 13 (29,708) (24,955) ________ ________ (75,581) (73,576) Profit before income tax 53,901 15,087 Income tax 14 (6,513) 40 Profit for the year 47,388 15,127 Other comprehensive income, net of income tax - - Foreign currency translation diff. for foreign operations - - Net gain/loss on hedges of net investments in foreign ops and - - cash flow hedges Other comprehensive income for the year (net of tax) - - Total comprehensive income for the year 47,388 15,127 Earnings per share for the profit attributable to the equity holders of the bank during the year (expressed in dalasi per share):
________ ________
Basic earnings per share 17 1.87 0.60 Diluted earnings per share Profit attributable to Equity Holders:
17 1.87 0.60
Controlling Equity holders of the bank 44,639 14,288 Non-Controlling Interest 2,749 840
Profit for the period 47,388 15,127 The notes on pages 13 to 49 are an integral part of these financial statement
18
IFRS FINANCIAL STATEMENTS 2016 19
IFRS FINANCIAL STATEMENTS 2016
IFRS
FIN
ANCI
AL S
TATE
MEN
TS 2
016
Page
| 11
Stat
emen
t of C
hang
es in
Equ
ity
As a
t 31s
t Dec
embe
r 201
6
(in
thou
sand
s of
Gam
bian
Dal
asi)
Sh
are
Shar
e
Cred
it ris
k
Stat
utor
y
Prop
ertie
s Re
valu
atio
n
Inco
me
To
tal
C
apita
l Pr
emiu
m
rese
rve
rese
rve
rese
rve
surp
lus
eq
uity
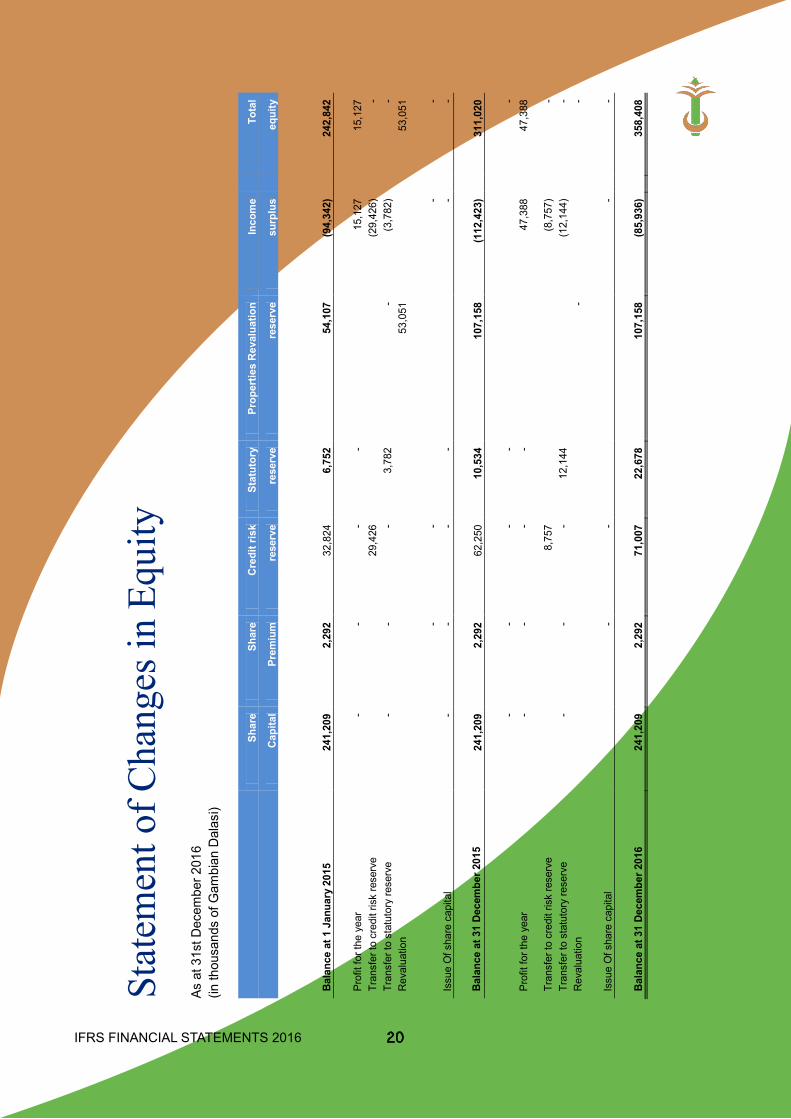
Ba
lanc
e at
1 J
anua
ry 2
015
241,
209
2,29
2 32
,824
6,
752
54,1
07
(94,
342)
242,
842
Pr
ofit
for t
he y
ear
-
-
-
-
15,1
27
15
,127
Tr
ansf
er to
cre
dit r
isk
rese
rve
29,4
26
(29,
426)
-
Tr
ansf
er to
sta
tuto
ry re
serv
e
-
-
-
3,
782
-
(3
,782
)
-
R
eval
uatio
n
53
,051
53
,051
-
-
-
-
Issu
e O
f sha
re c
apita
l -
-
-
-
-
-
Ba
lanc
e at
31
Dece
mbe
r 201
5 24
1,20
9 2,
292
62,2
50
10,5
34
107,
158
(112
,423
)
311,
020
-
-
-
-
-
Pr
ofit
for t
he y
ear
-
-
-
-
47,3
88
47
,388
Tran
sfer
to c
redi
t ris
k re
serv
e
8,
757
(8,7
57)
-
Tran
sfer
to s
tatu
tory
rese
rve
-
-
-
12,1
44
(1
2,14
4)
-
Rev
alua
tion
-
-
Is
sue
Of s
hare
cap
ital
-
-
-
-
Bala
nce
at 3
1 De
cem
ber 2
016
241,
209
2,29
2 71
,007
22
,678
10
7,15
8 (8
5,93
6)
35
8,40
8
The
note
s on
pag
es13
to 4
9 ar
e an
inte
gral
par
t of t
hese
fina
ncia
l sta
tem
ents
.
20
IFRS FINANCIAL STATEMENTS 2016 21
ANNUAL REPORT AND FINANCIAL STATEMENTS 2016 Page | 12
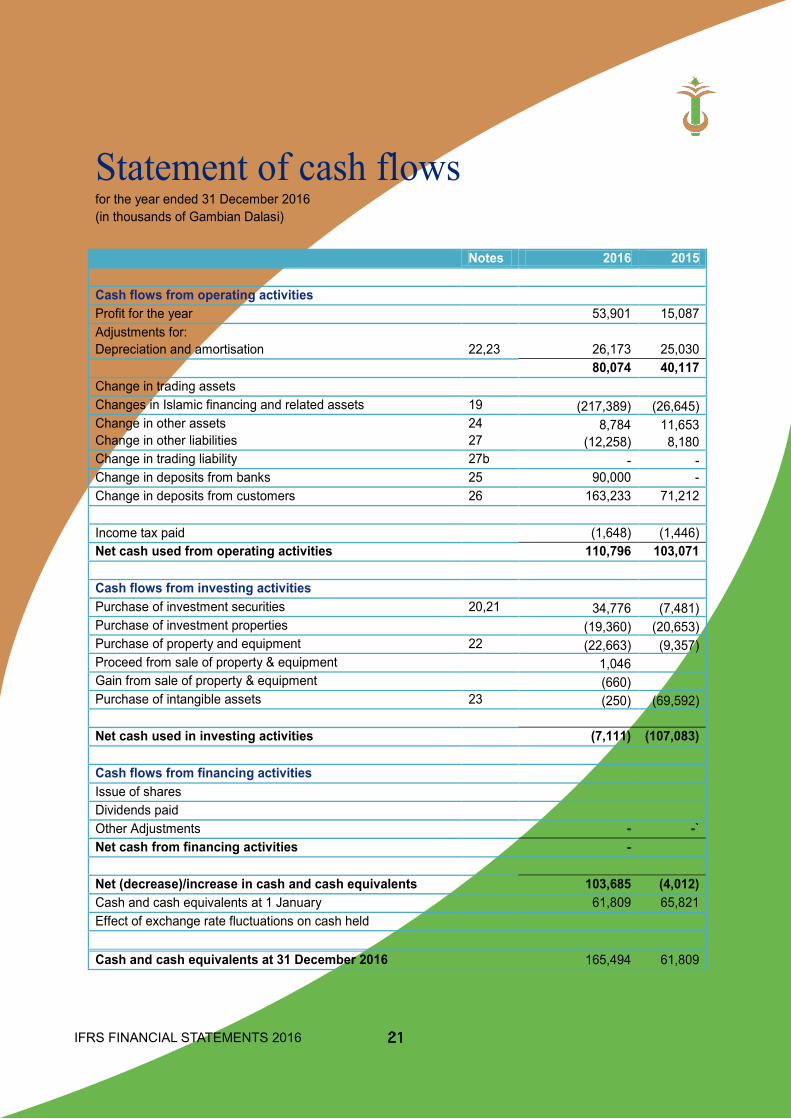
Statement of cash flows for the year ended 31 December 2016 (in thousands of Gambian Dalasi) Notes 2016 2015 Cash flows from operating activities Profit for the year 53,901 15,087 Adjustments for: Depreciation and amortisation 22,23 26,173 25,030 80,074 40,117 Change in trading assets Changes in Islamic financing and related assets 19 (217,389) (26,645) Change in other assets 24 8,784 11,653 Change in other liabilities 27 (12,258) 8,180 Change in trading liability 27b - - Change in deposits from banks 25 90,000 - Change in deposits from customers 26 163,233 71,212 Income tax paid (1,648) (1,446) Net cash used from operating activities 110,796 103,071 Cash flows from investing activities Purchase of investment securities 20,21 34,776 (7,481) Purchase of investment properties (19,360) (20,653) Purchase of property and equipment 22 (22,663) (9,357) Proceed from sale of property & equipment 1,046 Gain from sale of property & equipment (660) Purchase of intangible assets 23 (250) (69,592) Net cash used in investing activities (7,111) (107,083) Cash flows from financing activities Issue of shares Dividends paid Other Adjustments - -` Net cash from financing activities -
Net (decrease)/increase in cash and cash equivalents 103,685 (4,012) Cash and cash equivalents at 1 January 61,809 65,821 Effect of exchange rate fluctuations on cash held Cash and cash equivalents at 31 December 2016 165,494 61,809 The notes on pages 13 to 49 are an integral part of these financial statements.
IFRS FINANCIAL STATEMENTS 2016
The accompanying notes are an integral part of the financial statements. 13
Notes to the financial statements (forming an integral part of the financial statements)
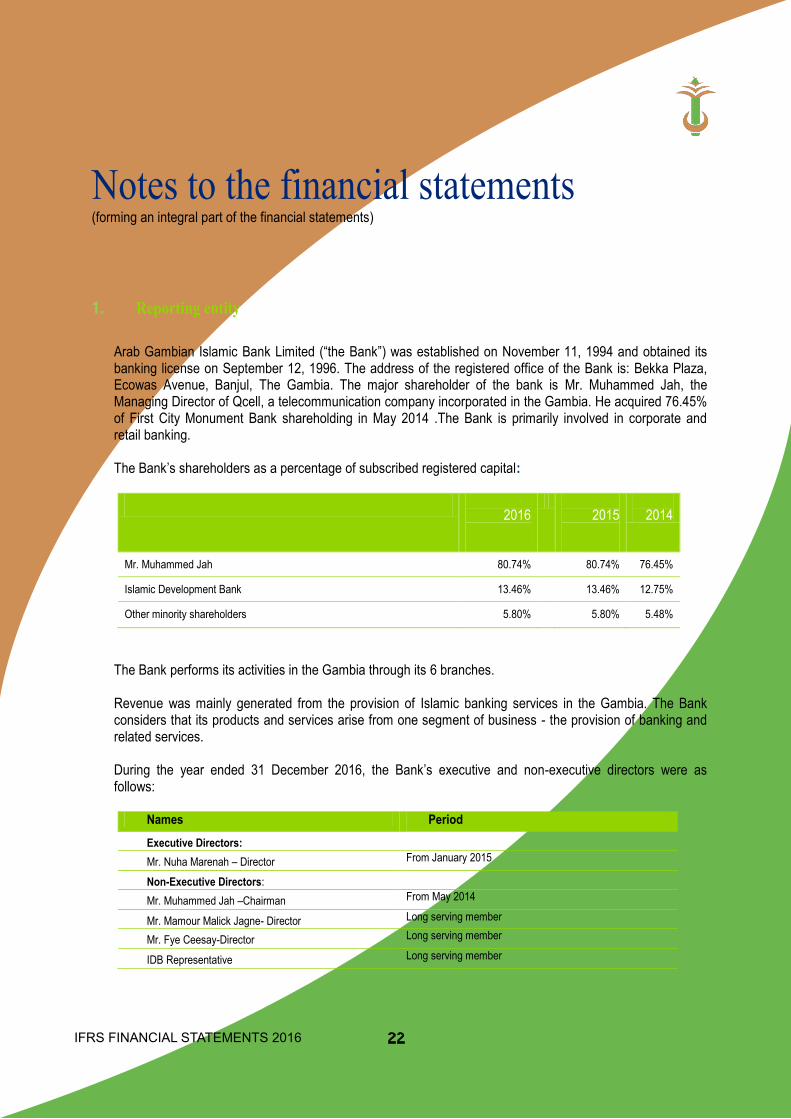
1. Reporting entity Arab Gambian Islamic Bank Limited (“the Bank”) was established on November 11, 1994 and obtained its banking license on September 12, 1996. The address of the registered office of the Bank is: Bekka Plaza, Ecowas Avenue, Banjul, The Gambia. The major shareholder of the bank is Mr. Muhammed Jah, the Managing Director of Qcell, a telecommunication company incorporated in the Gambia. He acquired 76.45% of First City Monument Bank shareholding in May 2014 .The Bank is primarily involved in corporate and retail banking.
The Bank’s shareholders as a percentage of subscribed registered capital:
2016
2015
2014
Mr. Muhammed Jah 80.74% 80.74% 76.45%
Islamic Development Bank 13.46% 13.46% 12.75%
Other minority shareholders 5.80% 5.80% 5.48%
The Bank performs its activities in the Gambia through its 6 branches. Revenue was mainly generated from the provision of Islamic banking services in the Gambia. The Bank considers that its products and services arise from one segment of business - the provision of banking and related services. During the year ended 31 December 2016, the Bank’s executive and non-executive directors were as follows:
Names Period Executive Directors:
Mr. Nuha Marenah – Director From January 2015
Non-Executive Directors:
Mr. Muhammed Jah –Chairman From May 2014
Mr. Mamour Malick Jagne- Director Long serving member
Mr. Fye Ceesay-Director Long serving member
IDB Representative Long serving member
22
IFRS FINANCIAL STATEMENTS 2016 23
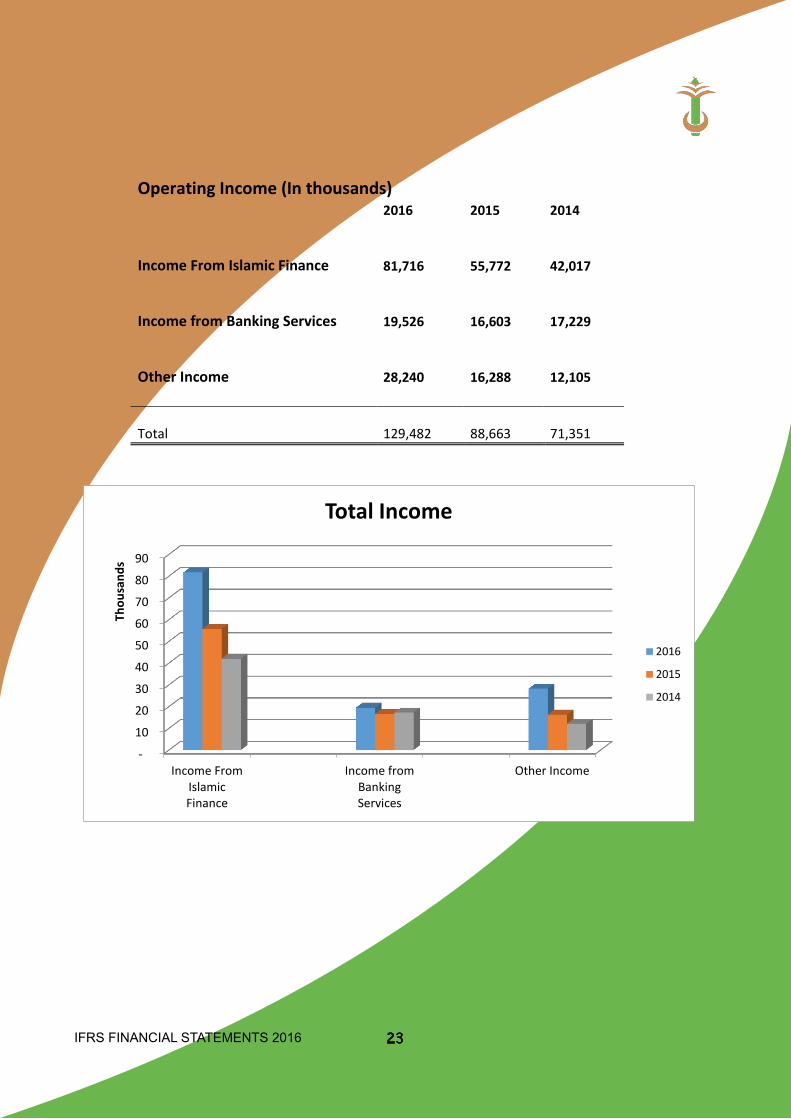
Operating Income (In thousands)
2016 2015 2014
Income From Islamic Finance
81,716
55,772
42,017
Income from Banking Services
19,526
16,603
17,229
Other Income
28,240
16,288
12,105
Total
129,482
88,663
71,351
-
10
20
30
40
50
60
70
80
90
Income FromIslamicFinance
Income fromBankingServices
Other Income
Thou
sand
s
Total Income
2016
2015
2014
IFRS FINANCIAL STATEMENTS 2016
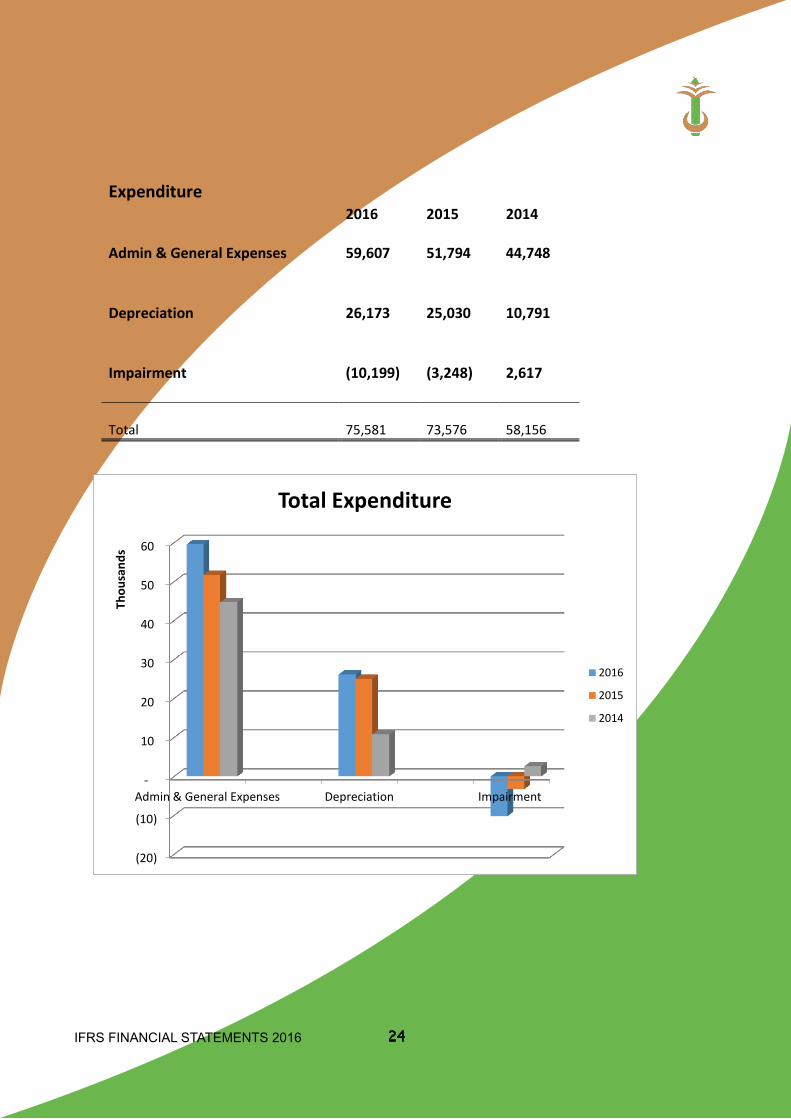
Expenditure
2016 2015 2014
Admin & General Expenses 59,607
51,794
44,748
Depreciation 26,173
25,030
10,791
Impairment (10,199)
(3,248)
2,617
Total
75,581
73,576
58,156
(20)
(10)
-
10
20
30
40
50
60
Admin & General Expenses Depreciation Impairment
Thou
sand
s
Total Expenditure
2016
2015
2014
24
IFRS FINANCIAL STATEMENTS 2016 25
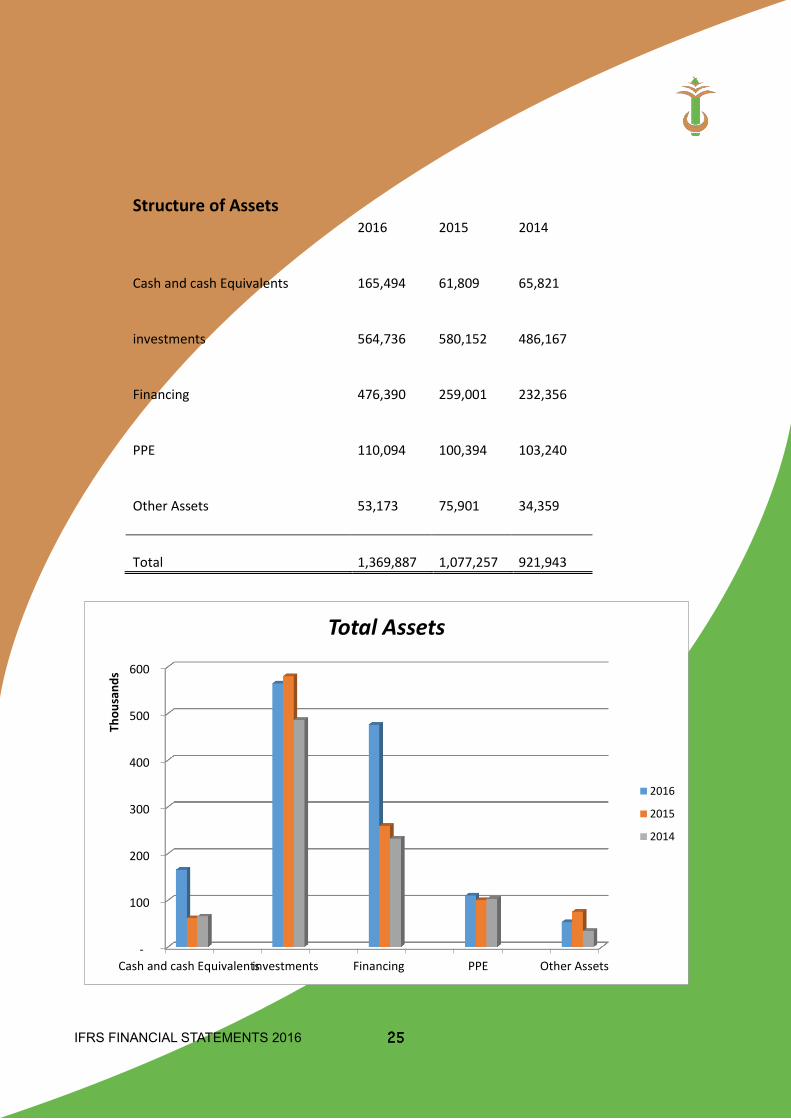
Structure of Assets
2016 2015 2014
Cash and cash Equivalents
165,494
61,809
65,821
investments
564,736
580,152
486,167
Financing
476,390
259,001
232,356
PPE 110,094
100,394
103,240
Other Assets
53,173
75,901
34,359
Total
1,369,887
1,077,257
921,943
-
100
200
300
400
500
600
Cash and cash Equivalentsinvestments Financing PPE Other Assets
Thou
sand
s
Total Assets
2016
2015
2014
IFRS FINANCIAL STATEMENTS 2016
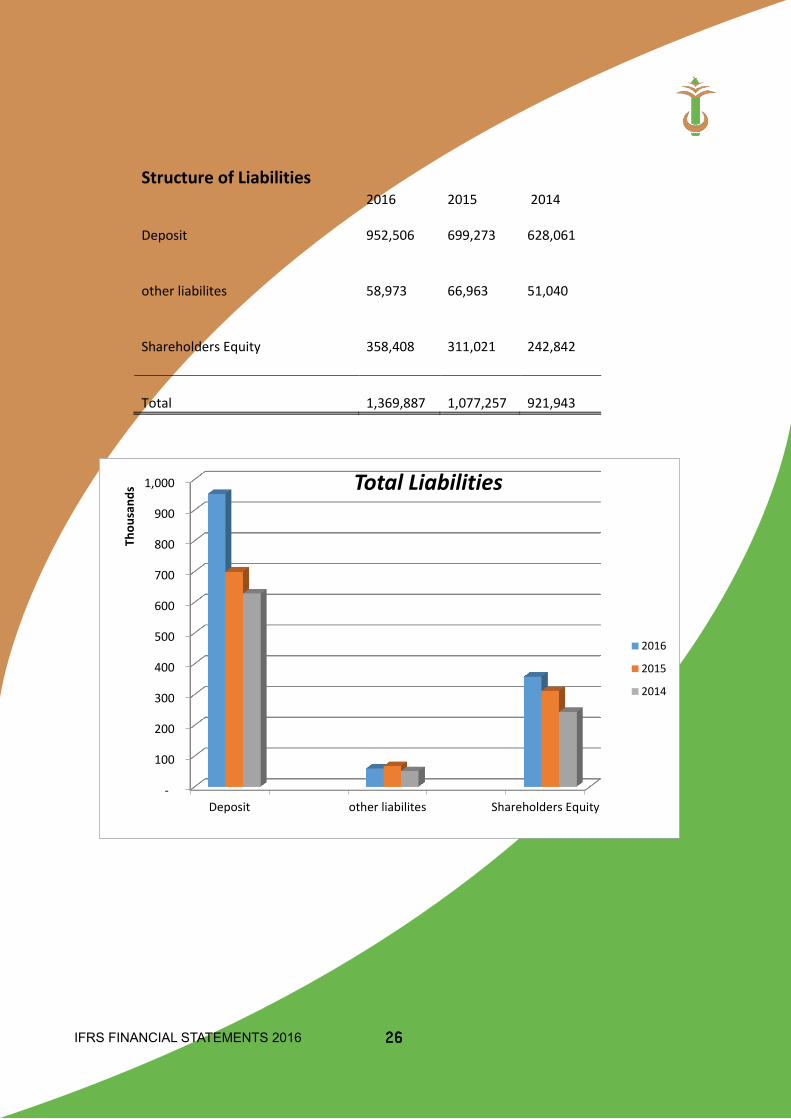
Structure of Liabilities
2016 2015 2014
Deposit 952,506
699,273
628,061
other liabilites
58,973
66,963
51,040
Shareholders Equity
358,408
311,021
242,842
Total
1,369,887
1,077,257
921,943
-
100
200
300
400
500
600
700
800
900
1,000
Deposit other liabilites Shareholders Equity
Thou
sand
s Total Liabilities
2016
2015
2014
26
IFRS FINANCIAL STATEMENTS 2016 27
2. Basis of preparation
2.1 Statement of compliance These financial statements have been prepared in accordance with International Financial Reporting Standards (“IFRS”) and current interpretations issued by the International Financial Reporting Interpretations Committee (“IFRIC”) and with the relevant provisions of the Banking Act 2009 and The Companies Act 2013.. The financial statements were approved by the Board of Directors on …………………..9th May .........2017.
2.2 Basis of measurement These financial statements are prepared under the historical cost basis.
2.3 Functional and presentation currency The financial statements are presented in The Gambian dalasis (D), which represents the functional and presentation currency of the Bank, being the currency of the economic environment in which the Bank operates. The financial statements have been prepared under the assumption that the Bank will continue as a going concern.
2.4 Use of estimates and judgments The presentation of financial statements in conformity with IFRS requires the preparation of estimates and assumptions that affect the reported amounts of assets and liabilities and disclosure of contingent assets and liabilities as of the date of the financial statements and their reported amounts of revenues and expenses during the reporting period. Actual results could differ from those estimates and future changes in the economic conditions, business strategies, regulatory requirements, accounting rules or/and other factors could subse-quently result in a change in estimates that could have a material impact on the reported financial position and results of operations. The estimates and underlying assumptions are reviewed on an ongoing basis. Revisions to accounting estimates are recognised in the period in which the estimate is revised if the revision affects only that period or in the period of the revision and future periods if the revision affects both current and future periods.
The following are the critical judgements that the directors have made in the process of applying the Bank’s accounting policies and that have the most significant effect on the amounts recognised in financial statements.
Provisioning for incurred credit losses and identified contingencies involve many uncertainties about the outcome of those risks and require the management of the Bank to make many subjective judgements in estimating the loss amounts.
The income taxes rules and regulations have recently experienced significant changes; there is no major historical precedent and/or interpretation judgement with respect to the extensive and complex issue affecting the banking sector.
3. Significant Accounting Policies The accounting policies set out below have been applied consistently to all periods presented in these financial statements
IFRS FINANCIAL STATEMENTS 2016
3.1 Foreign currency activities
Transactions in currencies other than Dalasi are recorded at the rates of exchange prevailing on the dates of the transactions. At each balance sheet date, monetary assets and liabilities that are denominated in foreign currencies are retranslated at the rates prevailing on the balance sheet date. Non-monetary assets and liabilities carried at fair value that are denominated in foreign currencies are translated at the rates prevailing at the date when the fair value was determined. Gains and losses arising on retranslation are included in net profit or loss for the period, except for exchange differences arising on non-monetary assets and liabilities where the changes in fair value are recognized directly in equity.
3.2 Revenue from investmentsRevenue is generally recognised when future economic benefits of the underlying assets will flow to the Bank and it can be reliably measured. It is income derived from use of an entity’s assets and hence the revenue is mostly dependent on the underlying agreement. Investment income and expense is accrued on a time basis, by reference to the principal outstanding and the effective interest rate applicable. The effective interest rate is the rate that exactly discounts the estimated future cash payments and receipts through the expected life of the financial asset or liability (or, where appropriate, a shorter period) to the carrying amount of the financial asset or liability.
The calculation of the effective interest rate includes all fees paid or received transaction costs, and discounts or premiums that are an integral part of the effective interest rate. Transaction costs are incremental costs that are directly attributable to the acquisition, issue or disposal of a financial asset or liability. Investment income and expense presented in the income statement include:
Profit (markup) on financial assets and liabilities at amortised cost on an effective interest rate basis.
Profit (markup) on Held to maturity investments (Sukuk al Salam) on an effective interest basis.
Investment income and expense on all trading assets and liabilities are considered to be incidental to the bank’s trading operations and are presented together with all other changes in the fair value of trading assets and liabilities in net trading income.
3.3 Fees and commissionFees and commission income and expenses that are integral to the effective interest rate on a financial asset or liability are included in the measurement of the effective interest rate.
Fees and commissions that do not form part of the effective interest rate are recognised as expense and income in the income statement on an accrual basis.
Other fees and commission expense relates mainly to transaction and service fees, which are expensed as the services are received.
3.4 Net trading incomeNet trading income comprises gains less losses related to trading assets and liabilities, and includes all realised and unrealised fair value changes, interest, dividends and foreign exchange differences.
3.5 Lease payments madePayments made under operating leases (Ijaara financing) are recognised in profit or loss on a straight-line basis over the term of the lease.
28
IFRS FINANCIAL STATEMENTS 2016 29
3.6 Income tax expenseIncome tax expense comprises current and deferred tax. Income tax expense is recognised in the income statement except to the extent that it relates to items recognised directly in equity, in which case it is recognised in equity.
Current tax is the expected tax payable on the taxable income for the year, using tax rates enacted or substantively enacted at the balance sheet date, and any adjustment to tax payable in respect of previous years.
Deferred tax is provided using the balance sheet method, providing for temporary differences between the carrying amounts of assets and liabilities for financial reporting purposes and the amounts used for taxation purposes. Deferred tax is measured at the tax rates that are expected to be applied to the temporary differences when they reverse, based on the laws that have been enacted or substantively enacted by the reporting date.
A deferred tax asset is recognised only to the extent that it is probable that future taxable profits will be available against which the asset can be utilised. Deferred tax assets are reviewed at each reporting date and are reduced to the extent that it is no longer probable that the related tax benefit will be realised.
3.7 Financial assets and liabilitiesMurabaha is an Islamic financing transaction, which represents an agreement whereby the bank buys a commodity and sells it to a counterparty based on a promise received from that counterparty to buy the commodity according to specific terms and conditions. The selling price comprises of the cost of the commodity and a pre-agreed profit margin.
(i) RecognitionThe Bank initially recognises account receivables issued on the date that they are originated. All other financial assets and liabilities (including assets and liabilities designated at fair value through profit or loss) are initially recognised on the trade date at which the Bank becomes a party to the contractual provisions of the instrument.
Murabaha receivables are recognised upon the sale of the commodity to the counterparty. Income on Murabaha receivables is recognised on an effective yield basis. The effective yield rate is the rate that exactly discounts the estimated future cash payments and receipts through the agreed payment term of the contract to the carrying amount of the receivable. The effective yield is established on initial recognition of the asset and is not revised subsequently. The calculation of the effective yield rate includes all fees paid or received, transaction costs, and discounts or premiums that are an integral part of the effective yield rate.
Transaction costs are incremental costs that are directly attributable to the acquisition, issue or disposal of a financial asset or liability. Commodity Murabaha receivables are initially recorded at fair value and are subsequently measured at amortised cost using the effective yield method, less impairment losses. The accrued income receivable is classified under other assets. Other advances to banks are stated at cost and are non-return bearing.
3.8 Deposits from customersProfit sharing accounts are based on the principle of Mudaraba whereby the Company and the customer share an agreed percentage of any profit earned on the customer’s deposit. The customer’s share of profit is paid in accordance with the terms and conditions of the account. The profit calculation is undertaken at the end of each calendar month.
IFRS FINANCIAL STATEMENTS 2016
Customer Murabaha deposits consist of an Islamic financing transaction involving the Company arranging the purchase of an asset on behalf of the customer and the purchase thereof from the same customer by the Company at cost plus an agreed profit (mark-up) with settlement on a deferred payment basis. Customer Murabaha deposit balances are included in the statement of financial position under deposits from customers and the accrued returns payable to the customer are classified under other liabilities. Returns payable on customer Murabaha deposits are recognised on an effective yield basis over the period of the contract.
3.9 Profit stabilisation reserveThe profit stabilisation reserve is used to maintain returns payable to customers on Mudaraba based savings accounts. Returns payable on these profit sharing accounts are credited to customers in accordance with the terms and conditions of the account. Any surplus returns arising from the investment of funds are then credited to this reserve. In the case of inadequate returns generated by these funds, the Company will maintain the return to depositors by utilising this reserve.
(ii) De-recognitionThe Bank derecognises a financial asset when the contractual rights to the cash flows from the asset expire, or it transfers the rights to receive the contractual cash flows on the financial asset in a transaction in which substantially all the risks and rewards of ownership of the financial asset are transferred.
The Bank derecognises a financial liability when its contractual obligations are discharged or cancelled or expire.
The Bank enters into transactions whereby it transfers assets recognised on its balance sheet, but retains either all risks and rewards of the transferred assets or a portion of them. If all or substantially all risks and rewards are retained, then the transferred assets are not derecognised from the balance sheet.
(iii) OffsettingFinancial assets and liabilities are set off and the net amount presented in the balance sheet when, and only when, the Bank has a legal right to set off the amounts and intends either to settle on a net basis or to realise the asset and settle the liability simultaneously.
Income and expenses are presented on a net basis only when permitted by the accounting standards, or for gains and losses arising from a group of similar transactions such as in trading activity.
(iv) Amortised cost measurementThe amortised cost of a financial asset or liability is the amount at which the financial asset or liability is measured at initial recognition, minus principal repayments, plus or minus the cumulative amortisation using the effective interest method of any difference between the initial amount recognised and the maturity amount, minus any reduction for impairment.
(v) Fair value measurementThe determination of fair values of financial assets and financial liabilities is based on quoted market prices or dealer price quotations for financial instruments traded in active markets. For all other financial instruments fair value is determined by using valuation techniques. Valuation techniques include net present value techniques, the discounted cash flow method, comparison to similar instruments for which market observable prices exist, and valuation models.
30
IFRS FINANCIAL STATEMENTS 2016 31
(i) dentification and measurement of impairmentAt each reporting date the Bank assesses whether there is objective evidence that financial assets not carried at fair value through profit or loss are impaired. Financial assets are impaired when objective evidence demonstrates that a loss event has occurred after the initial
recognition of the asset, and that the loss event has an impact on the future cash flows on the asset that can be estimated reliably.
The bank considers evidence of impairment at both an individual and collective level. All individually significant financial assets are assessed for specific impairment. All significant assets found not to be specifically impaired are then collectively assessed for any impairment that has been incurred but not yet identified. Assets that are not individually significant are then collectively assessed for impairment by grouping together financial assets (carried at amortised cost) with similar risk characteristics.
Objective evidence that financial assets (including equity securities) are impaired can include default or delinquency by a borrower, restructuring of a loan or advance by the Bank on terms that the Bank would not otherwise consider, indications that a borrower or issuer will enter bankruptcy, the disappearance of an active market for a security, or other observable data relating to a group of assets such as adverse changes in the payment status of borrowers or issuers or economic conditions that correlate with defaults. In assessing collective impairment the Bank uses statistical modelling of historical trends of the probability of default, timing of recoveries and the amount of loss incurred, adjusted for management’s judgement as to whether current economic and credit conditions are such that the actual losses are likely to be greater or less than suggested by historical modelling. Default rates, loss rates and the expected timing of future recoveries are regularly benchmarked against actual outcomes to ensure that they remain appropriate.
Impairment losses on assets carried at amortised cost are measured as the difference between the carrying amount of the financial assets and the present value of estimated cash flows discounted at the assets’ original effective interest rate. Losses are recognised in profit or loss and reflected in an allowance account against loans and advances. When a subsequent event causes the amount of impairment loss to decrease, the impairment loss is reversed through profit or loss.
Impairment losses on available-for-sale investment securities are recognised by transferring the difference between the amortised acquisition cost and current fair value out of equity to profit or loss. When a subsequent event that can be related to the event causes the amount of impairment loss on an available-for-sale debt security to decrease, the impairment loss is reversed through profit or loss.
However, any subsequent recovery in the fair value of an impaired available-for-sale equity security is recognised directly in equity. Changes in impairment provisions attributable to time value are reflected as a component of interest income.
IFRS FINANCIAL STATEMENTS 2016
3.10 Cash and cash equivalentsCash and cash equivalents include notes and coins on hand, unrestricted balances held with central banks and highly liquid financial assets with original maturities of less than three months, which are subject to insignificant risk of changes in their fair value, and are used by the Bank in the management of its short-term commitments.
3.11 Account receivablesAccount receivables are non-derivative financial assets with fixed or determinable payments that are not quoted in an active market and that the Bank does not intend to sell immediately or in the near term.
Account receivables are initially measured at amortised cost plus incremental direct transaction costs, and subsequently measured at their amortised cost using the effective interest method less any impairment losses.
3.12 Sukuk Al SalamSukuk al Salam are initially measured at fair value plus incremental direct transaction costs and subsequent-ly accounted for depending on their classification as either held-to-maturity.
(i) Held-to-maturityHeld-to-maturity investments are non-derivative assets with fixed or determinable payments and fixed maturity that the Bank has the positive intent and ability to hold to maturity, and which are not designated at fair value through profit or loss or available-for-sale. Held-to-maturity investments are carried at amortised cost using the effective interest method. Any sale or reclassification of a significant amount of held-to-maturity investments not close to their maturity would result in the reclassification of all held-to-maturity investments as available-for-sale, and prevent the Bank from classifying investment securities as held-to-maturity for the current and the following two financial years. It must be noted that IFRS 9 only considers fair value and amortised cost based on the business models for managing the financial asset and the contractual cash flow characteristics of the financial asset. Thus all HTM assets are classified as amortised cost. (ii) Fair value through profit or loss
The Bank carries no investment securities at fair value, with fair value changes recognised immedi ately in profit or loss.
(iii) Available-for-sale
Available-for-sale investments are non-derivative investments that are not designated as another category of financial assets. Unquoted equity securities whose fair value cannot be reliably measured are carried at cost. All other available-for-sale investments are carried at fair value.Interest income is recognised in profit or loss using the effective interest method. Dividend income is recognised in profit or loss when the Bank becomes entitled to the dividend. Foreign exchange gains or losses on available-for-sale debt security investments are recognised in profit or loss. Other fair value changes are recognised directly in equity until the investment is sold or impaired and the balance in equity is transferred to profit or loss.
3.13 Property, plant and equipment(i) Recognition and measurementItems of property and equipment are measured at cost less accumulated depreciation and impairment loss-es.
32
IFRS FINANCIAL STATEMENTS 2016 33
(ii) DepreciationDepreciation is recognised in profit or loss on a straight-line basis over the estimated useful lives of each item of property, plant and equipment. Leased assets are depreciated over the shorter of the lease term and their useful lives. Land is not depreciated.
The estimated useful lives for the current and comparative periods are as follows:
• Buildings 10%• Furniture and equipment 20%• Motor Vehicle 25%
Depreciation methods, useful lives and residual values are reassessed at each reporting date. 3.14 Intangible assets
An Intangible asset is generally considered as an identifiable non-monetary asset without physical substance. It is distinguished from goodwill based on the identifiability concept. It is recognised when future economic benefits will flow to the Bank and it can be reliably measured. The useful life may be finite or indefinite depending on the nature and legal framework underpinning the transaction. Impairment assessment is made of all indefinite intangibles at each reporting date and the appropriate adjustments made.
(i) SoftwareSoftware acquired by the Bank is stated at cost less accumulated amortisation and accumulated impairment losses.
Subsequent expenditure on software assets is capitalised only when it increases the future economic benefits embodied in the specific asset to which it relates. All other expenditure is expensed as incurred.
Amortisation is recognised in profit or loss on a straight-line basis over the estimated useful life of the software, from the date that it is available for use. The estimated useful life of software is three to five years. 3.15 Leased assets – lessee (Ijaara financing)
Other leases are operating leases and, except for investment property, the leased assets are not recognised on the bank’s statement of financial position. Investment property held under an operating lease is recognised on the Bank’s financial position at its fair value.
3.16 Impairment of non-financial assetsThe carrying amounts of the Bank’s non-financial assets, other than investment property and deferred tax assets are reviewed at each reporting date to determine whether there is any indication of impairment. If any such indication exists then the asset’s recoverable amount is estimated. The recoverable amount of goodwill is estimated at each reporting date.
An impairment loss is recognised if the carrying amount of an asset or its cash-generating unit exceeds its recoverable amount. A cash-generating unit is the smallest identifiable asset group that generates cash flows that largely are independent from other assets and groups. Impairment losses are recognised in profit or loss. Impairment losses recognised in respect of cash-generating units are allocated first to reduce the carrying amount of any goodwill allocated to the units and then to reduce the carrying amount of the other assets in the unit (group of units) on a pro rata basis.
IFRS FINANCIAL STATEMENTS 2016
The recoverable amount of an asset or cash-generating unit is the greater of its value in use and its fair value less costs to sell. In assessing value in use, the estimated future cash flows are discounted to their present value using a pre-tax discount rate that reflects current market assessments of the time value of money and the risks specific to the asset.
3.17 ProvisionsA provision is recognised if, as a result of a past event, the Bank has a present legal or constructive obligation that can be estimated reliably, and it is probable that an outflow of economic benefits will be required to settle the obligation. Provisions are determined by discounting the expected future cash flows at a pre-tax rate that reflects current market assessments of the time value of money and, where appropriate, the risks specific to the liability.
A provision for restructuring is recognised when the Bank has approved a detailed and formal restructuring plan, and the restructuring either has commenced or has been announced publicly. Future operating costs are not provided for.
3.18 Personnel Expenses
(i) Defined contribution plansThe Bank operates a defined contribution plan for all employees. Under the plan, fixed contributions are paid into a separate entity and the Bank will have no legal or constructive obligation to pay further amounts. Obligations for contributions to defined contribution pension plans are recognised as an employee benefit ex-pense in profit or loss in the periods during which services are rendered by employees. Prepaid contributions are recognised as an asset to the extent that a cash refund or a reduction in future payments is available.
(ii) Short-term benefitsShort-term employee benefit obligations are measured on an undiscounted basis and are expensed as the related service is provided.
A provision is recognised for the amount expected to be paid under short-term cash bonus or profit-sharing plans if the Bank has a present legal or constructive obligation to pay this amount as a result of past service provided by the employee and the obligation can be estimated reliably. 3.19 Share capital and reserves The Bank classifies capital instruments as financial liabilities or equity instruments in accordance with the substance of the contractual terms of the instrument.
Share issue costsIncremental costs directly attributable to the issue of an equity instrument are deducted from the initial mea-surement of the equity instruments.
34
IFRS FINANCIAL STATEMENTS 2016 35
3.20 Earnings per share
The bank presents basic and diluted earnings per share (EPS) data for its ordinary shares. Basic EPS is calculated by dividing the profit or loss attributable to ordinary shareholders of the bank by the weighted average number of ordinary shares outstanding during the period. Diluted EPS is determined by adjusting the profit or loss attributable to ordinary shareholders and the weighted average number of ordinary shares outstanding for the effects of all dilutive potential ordinary shares.
3.21 DividendsDividends are recognised as a liability in the period in which they are declared.
3.22 Sukuk Al SalamSecurities purchased from the Central Bank of The Gambia under agreement to resell (reverse Repos), are disclosed as Sukuk al Salam as they are held to maturity after which they are repurchased and are not nego-tiable or discounted during the tenure.
3.23 Acceptances and letters of credit
Acceptances and Letters of credits are considered contingent liabilities and are disclosed unless the possibil-ity of an outflow of resources involving economic benefits is remote.
3.24 Borrowings (liabilities to banks and customers)
Borrowings are recognised initially at fair value, net of transaction costs incurred. Borrowings are subse-quently stated at amortised cost using the effective interest method, any differences between proceeds (net of transaction costs) and the redemption value is recognised in the income statement over the period of the borrowings. Borrowings and other forms of financial liabilities shall be de-recognised from the books only when they are extinguished, ie when the obligation specified in the contract is discharged or cancelled or expires.
4. Financial risk management
Introduction and overviewThe Bank has exposure to the following risks arising from the use of financial instruments. Typical of such risks are as follows:
• credit risk• liquidity risk• market risk• operational risk.
These are principal risks of the Bank. This note presents information about the Bank exposure to these risks, including the objectives, policies and processes for measuring and managing the risks as well as their impact on earnings and capital.
IFRS FINANCIAL STATEMENTS 2016
Risk management frameworkThis depends mainly on the Risk Management framework set out by the Central Bank. Bank specific frame-work based on the overall structure of the Bank ensures that the Board of Directors has overall responsibility for the establishment and oversight of the Bank’s risk management framework. The Board has established the Asset and Liability (ALCO), Credit and Operational Risk committees, which are responsible for develop-ing and monitoring risk management policies in their specified areas. All Board committees have both execu-tive and non-executive members and report regularly to the Board of Directors on their activities.
The Bank’s risk management policies are established to identify and analyse the risks faced by the Bank, to set appropriate risk limits and controls, and to monitor risks and adherence to limits. Risk man-agement policies and systems are reviewed regularly to reflect changes in market conditions, products and services offered. The bank, through its training and management standards and procedures, aims to develop a disciplined and constructive control environment, in which all employees understand their roles and obliga-tions.
The Bank’s Audit Committee is responsible for monitoring compliance with the Bank’s risk manage-ment policies and procedures, and for reviewing the adequacy of the risk management framework in relation to the risks faced by the Bank. The Bank’s Audit Committee is assisted in these functions by Internal Audit. Internal Audit undertakes both regular and ad-hoc reviews of risk management controls and procedures, the results of which are reported to the Audit Committee.
(i) Credit risk Credit risk is the risk of financial loss to the bank if a customer or counterparty to a financial instru-ment fails to meet its contractual obligations, and arises principally from the Bank’s account receivables to customers. For risk management reporting purposes, the Bank considers and consolidates all elements of credit risk exposure. Management of credit risk
The Management Credit Committee has delegated responsibility for the management of credit risk in the bank. The committee comprise of the Senior Management of the bank. The Management Credit Committee is responsible for,
• Reviewing and approving all credits that are above the level of theI Managing Director i.e. the com mittee shall review and approve extensions of credit, including one-obligor.• Establishing the Bank’s Prime Lending Rate (PLR)• Approving changes in PLR in line with Government regulations.• Establishing guidelines for pricing credit facilities.• Approving all the credits, which are within its approval limit.• Reviewing credit related systems and operational issues and their implementation.• Approving Target Market Definitions and Risk Acceptance Criteria for lending units.• Approving new financial products and credit product initiatives.• Approving the risk ratings for credits and the credit process.
36
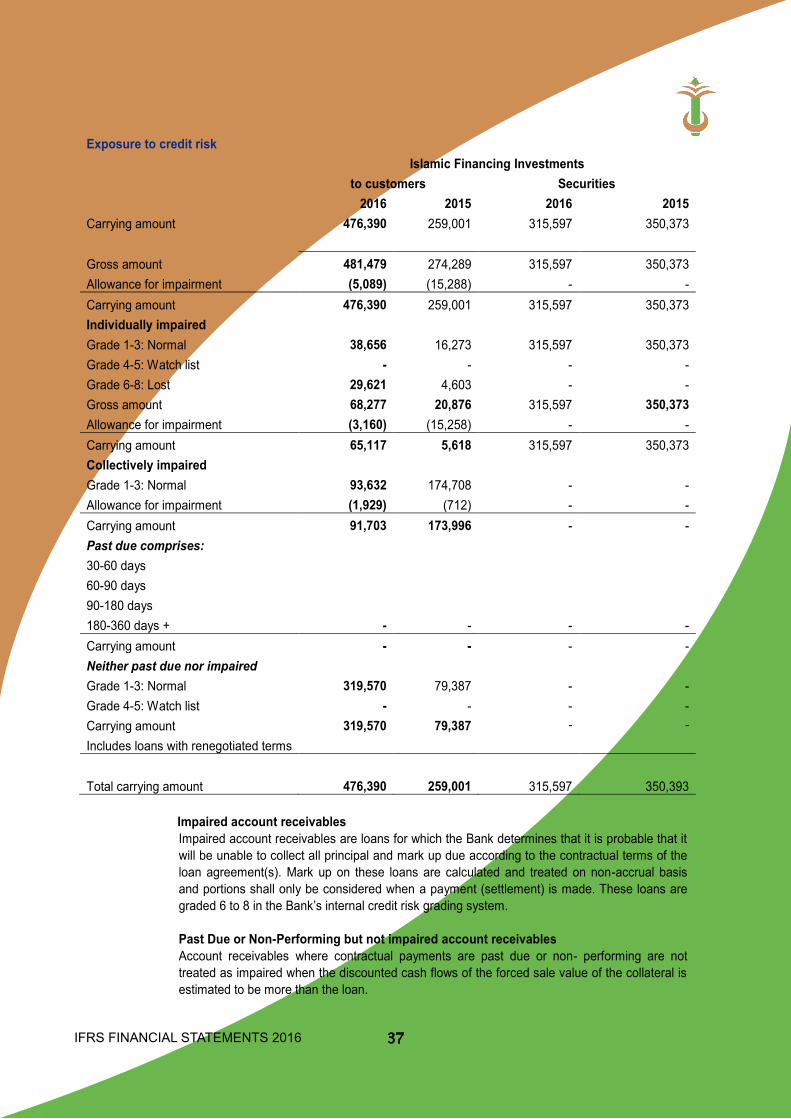
IFRS FINANCIAL STATEMENTS 2016 37
The accompanying notes are an integral part of the financial statements. 24
Exposure to credit risk
Islamic Financing Investments
to customers Securities
2016 2015 2016 2015
Carrying amount 476,390 259,001 315,597 350,373
Gross amount 481,479 274,289 315,597 350,373 Allowance for impairment (5,089) (15,288) - - Carrying amount 476,390 259,001 315,597 350,373 Individually impaired
Grade 1-3: Normal 38,656 16,273 315,597 350,373 Grade 4-5: Watch list - - - - Grade 6-8: Lost 29,621 4,603 - - Gross amount 68,277 20,876 315,597 350,373 Allowance for impairment (3,160) (15,258) - - Carrying amount 65,117 5,618 315,597 350,373 Collectively impaired
Grade 1-3: Normal 93,632 174,708 - - Allowance for impairment (1,929) (712) - - Carrying amount 91,703 173,996 - - Past due comprises:
30-60 days 60-90 days 90-180 days 180-360 days + - - - -
Carrying amount - - - - Neither past due nor impaired
Grade 1-3: Normal 319,570 79,387 - - Grade 4-5: Watch list - - - - Carrying amount 319,570 79,387 - - Includes loans with renegotiated terms
Total carrying amount 476,390 259,001 315,597 350,393 Impaired account receivables
Impaired account receivables are loans for which the Bank determines that it is probable that it will be unable to collect all principal and mark up due according to the contractual terms of the loan agreement(s). Mark up on these loans are calculated and treated on non-accrual basis and portions shall only be considered when a payment (settlement) is made. These loans are graded 6 to 8 in the Bank’s internal credit risk grading system.
Past Due or Non-Performing but not impaired account receivables Account receivables where contractual payments are past due or non- performing are not
treated as impaired when the discounted cash flows of the forced sale value of the collateral is estimated to be more than the loan.
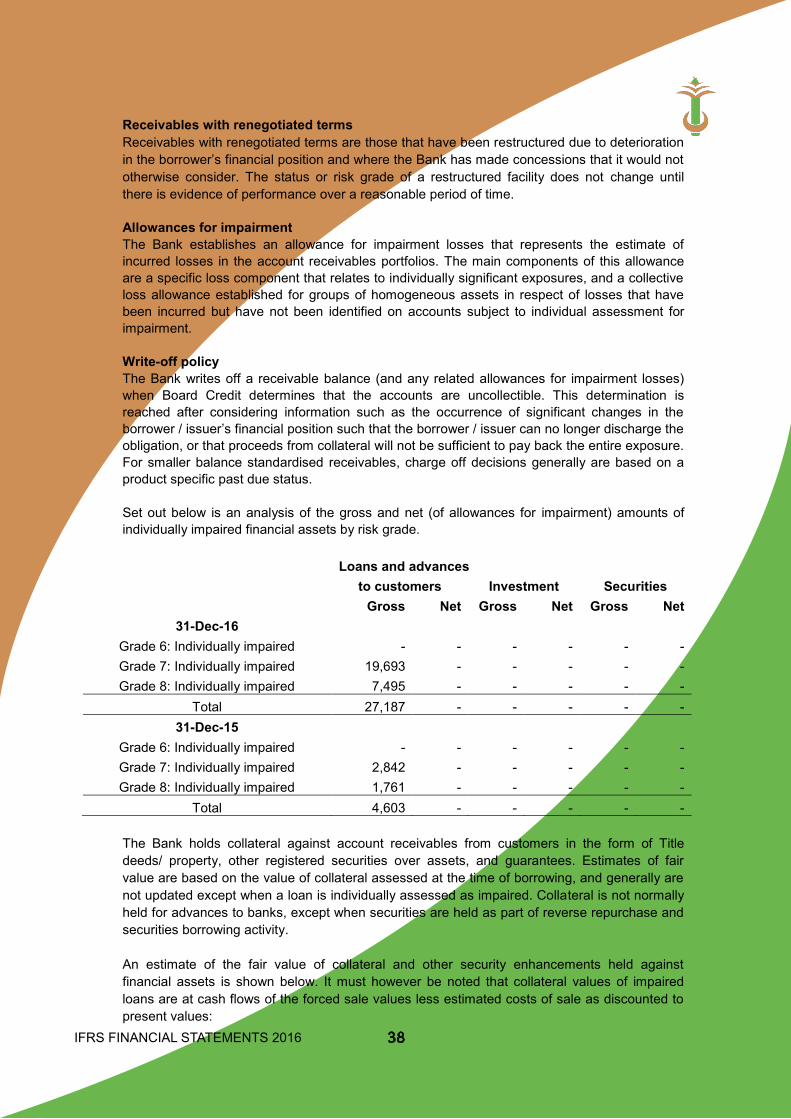
IFRS FINANCIAL STATEMENTS 2016
The accompanying notes are an integral part of the financial statements. 25
Receivables with renegotiated terms Receivables with renegotiated terms are those that have been restructured due to deterioration
in the borrower’s financial position and where the Bank has made concessions that it would not otherwise consider. The status or risk grade of a restructured facility does not change until there is evidence of performance over a reasonable period of time.
Allowances for impairment The Bank establishes an allowance for impairment losses that represents the estimate of
incurred losses in the account receivables portfolios. The main components of this allowance are a specific loss component that relates to individually significant exposures, and a collective loss allowance established for groups of homogeneous assets in respect of losses that have been incurred but have not been identified on accounts subject to individual assessment for impairment.
Write-off policy The Bank writes off a receivable balance (and any related allowances for impairment losses)
when Board Credit determines that the accounts are uncollectible. This determination is reached after considering information such as the occurrence of significant changes in the borrower / issuer’s financial position such that the borrower / issuer can no longer discharge the obligation, or that proceeds from collateral will not be sufficient to pay back the entire exposure. For smaller balance standardised receivables, charge off decisions generally are based on a product specific past due status.
Set out below is an analysis of the gross and net (of allowances for impairment) amounts of
individually impaired financial assets by risk grade.
Loans and advances
to customers Investment Securities
Gross Net Gross Net Gross Net
31-Dec-16 Grade 6: Individually impaired - - - - - -
Grade 7: Individually impaired 19,693 - - - - - Grade 8: Individually impaired 7,495 - - - - - Total 27,187 - - - - - 31-Dec-15
Grade 6: Individually impaired - - - - - - Grade 7: Individually impaired 2,842 - - - - - Grade 8: Individually impaired 1,761 - - - - - Total 4,603 - - - - -
The Bank holds collateral against account receivables from customers in the form of Title
deeds/ property, other registered securities over assets, and guarantees. Estimates of fair value are based on the value of collateral assessed at the time of borrowing, and generally are not updated except when a loan is individually assessed as impaired. Collateral is not normally held for advances to banks, except when securities are held as part of reverse repurchase and securities borrowing activity.
An estimate of the fair value of collateral and other security enhancements held against
financial assets is shown below. It must however be noted that collateral values of impaired loans are at cash flows of the forced sale values less estimated costs of sale as discounted to present values:
38
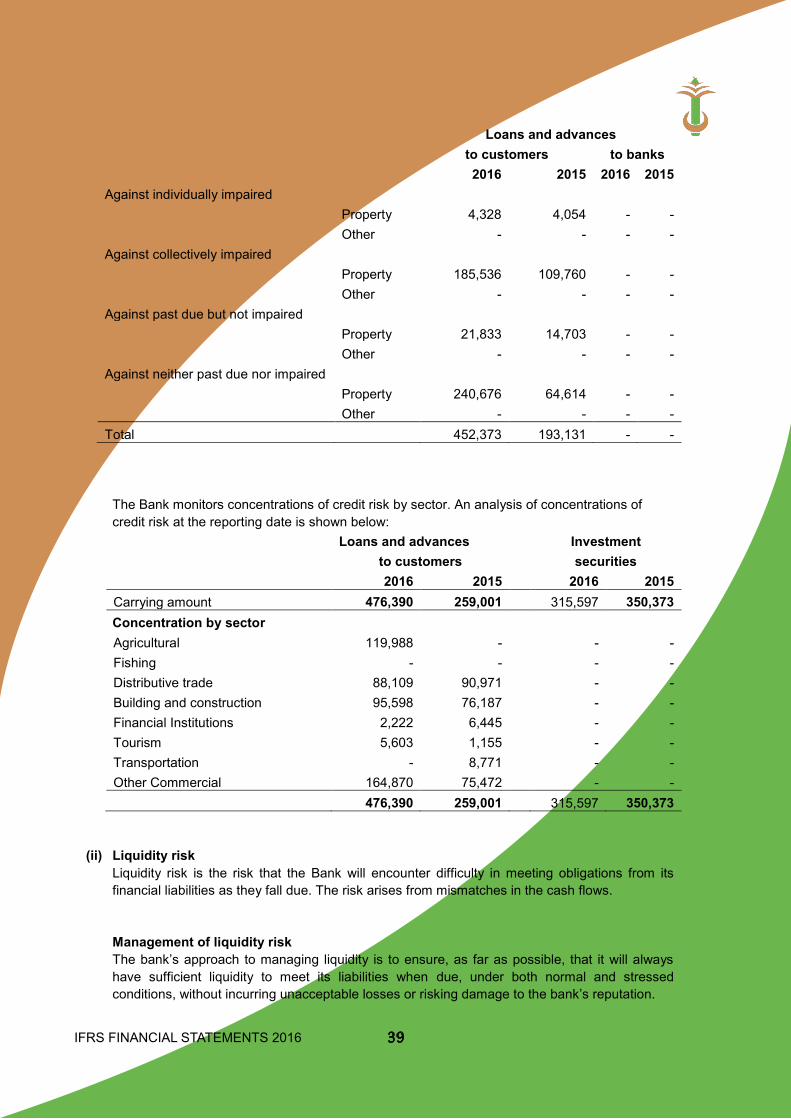
IFRS FINANCIAL STATEMENTS 2016 39
The accompanying notes are an integral part of the financial statements. 26
Loans and advances
to customers to banks
2016 2015 2016 2015
Against individually impaired Property 4,328 4,054 - -
Other - - - - Against collectively impaired
Property 185,536 109,760 - -
Other - - - -
Against past due but not impaired
Property 21,833 14,703 - -
Other - - - - Against neither past due nor impaired
Property 240,676 64,614 - -
Other - - - -
Total 452,373 193,131 - - The Bank monitors concentrations of credit risk by sector. An analysis of concentrations of
credit risk at the reporting date is shown below:
Loans and advances Investment
to customers
securities
2016 2015 2016 2015
Carrying amount 476,390 259,001 315,597 350,373 Concentration by sector
Agricultural 119,988 -
- -
Fishing - -
- -
Distributive trade 88,109 90,971
- -
Building and construction 95,598 76,187
- -
Financial Institutions 2,222 6,445
- -
Tourism 5,603 1,155
- -
- Transportation - 8,771
- -
Other Commercial 164,870 75,472
- -
476,390 259,001 315,597 350,373
(ii) Liquidity risk Liquidity risk is the risk that the Bank will encounter difficulty in meeting obligations from its
financial liabilities as they fall due. The risk arises from mismatches in the cash flows. Management of liquidity risk The bank’s approach to managing liquidity is to ensure, as far as possible, that it will always
have sufficient liquidity to meet its liabilities when due, under both normal and stressed conditions, without incurring unacceptable losses or risking damage to the bank’s reputation.
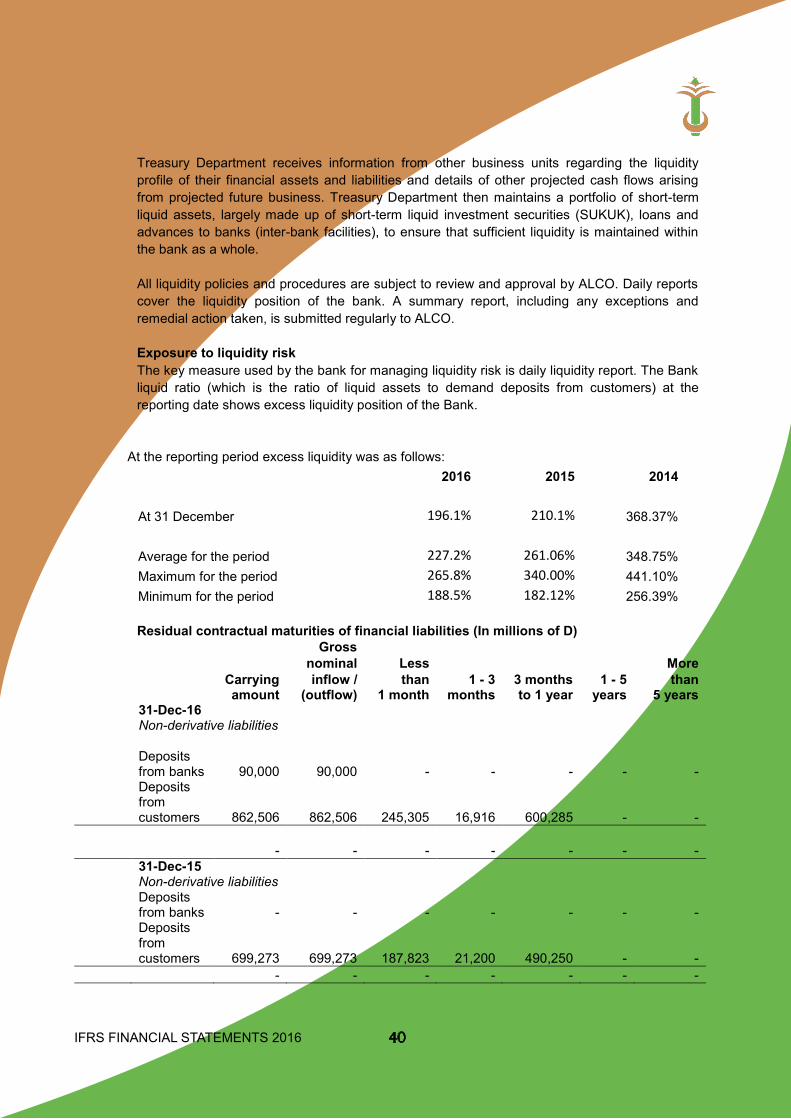
IFRS FINANCIAL STATEMENTS 2016
The accompanying notes are an integral part of the financial statements. 27
Treasury Department receives information from other business units regarding the liquidity profile of their financial assets and liabilities and details of other projected cash flows arising from projected future business. Treasury Department then maintains a portfolio of short-term liquid assets, largely made up of short-term liquid investment securities (SUKUK), loans and advances to banks (inter-bank facilities), to ensure that sufficient liquidity is maintained within the bank as a whole.
All liquidity policies and procedures are subject to review and approval by ALCO. Daily reports
cover the liquidity position of the bank. A summary report, including any exceptions and remedial action taken, is submitted regularly to ALCO.
Exposure to liquidity risk The key measure used by the bank for managing liquidity risk is daily liquidity report. The Bank
liquid ratio (which is the ratio of liquid assets to demand deposits from customers) at the reporting date shows excess liquidity position of the Bank.
At the reporting period excess liquidity was as follows:
2016 2015 2014
At 31 December 196.1% 210.1% 368.37%
Average for the period 227.2% 261.06% 348.75%
Maximum for the period 265.8% 340.00% 441.10% Minimum for the period 188.5% 182.12% 256.39%
Residual contractual maturities of financial liabilities (In millions of D)
Gross
nominal Less
More
Carrying inflow / than 1 - 3 3 months 1 - 5 than
amount (outflow) 1 month months to 1 year years 5 years 31-Dec-16
Non-derivative liabilities
Deposits from banks 90,000 90,000 - - - - -
Deposits from customers
862,506 862,506 245,305
16,916 600,285 - -
- - - - - - -
31-Dec-15 Non-derivative liabilities
Deposits from banks - - - - - - -
Deposits from customers
699,273 699,273 187,823
21,200 490,250 - -
- - - - - - -
40
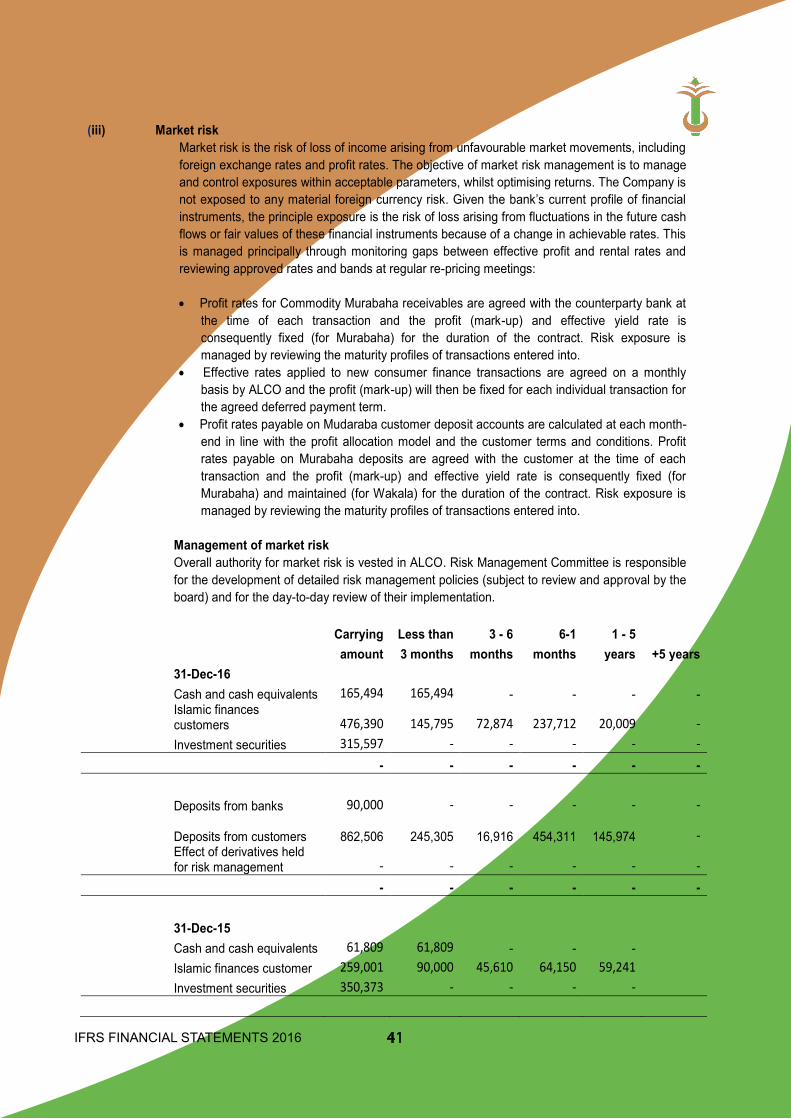
IFRS FINANCIAL STATEMENTS 2016 41
The accompanying notes are an integral part of the financial statements. 28
(iii) Market risk Market risk is the risk of loss of income arising from unfavourable market movements, including
foreign exchange rates and profit rates. The objective of market risk management is to manage and control exposures within acceptable parameters, whilst optimising returns. The Company is not exposed to any material foreign currency risk. Given the bank’s current profile of financial instruments, the principle exposure is the risk of loss arising from fluctuations in the future cash flows or fair values of these financial instruments because of a change in achievable rates. This is managed principally through monitoring gaps between effective profit and rental rates and reviewing approved rates and bands at regular re-pricing meetings:
Profit rates for Commodity Murabaha receivables are agreed with the counterparty bank at
the time of each transaction and the profit (mark-up) and effective yield rate is consequently fixed (for Murabaha) for the duration of the contract. Risk exposure is managed by reviewing the maturity profiles of transactions entered into.
Effective rates applied to new consumer finance transactions are agreed on a monthly basis by ALCO and the profit (mark-up) will then be fixed for each individual transaction for the agreed deferred payment term.
Profit rates payable on Mudaraba customer deposit accounts are calculated at each month-end in line with the profit allocation model and the customer terms and conditions. Profit rates payable on Murabaha deposits are agreed with the customer at the time of each transaction and the profit (mark-up) and effective yield rate is consequently fixed (for Murabaha) and maintained (for Wakala) for the duration of the contract. Risk exposure is managed by reviewing the maturity profiles of transactions entered into.
Management of market risk
Overall authority for market risk is vested in ALCO. Risk Management Committee is responsible for the development of detailed risk management policies (subject to review and approval by the board) and for the day-to-day review of their implementation.
Carrying Less than 3 - 6 6-1 1 - 5
amount 3 months months months years +5 years 31-Dec-16
Cash and cash equivalents 165,494 165,494 - - - - Islamic finances customers 476,390 145,795 72,874 237,712 20,009 - Investment securities 315,597 - - - - -
- - - - - -
Deposits from banks 90,000 - - - - -
Deposits from customers
862,506 245,305
16,916 454,311 145,974 - Effect of derivatives held for risk management - - - - - -
- - - - - -
31-Dec-15 Cash and cash equivalents 61,809 61,809 - - -
Islamic finances customer 259,001 90,000 45,610 64,150 59,241 Investment securities 350,373 - - - -
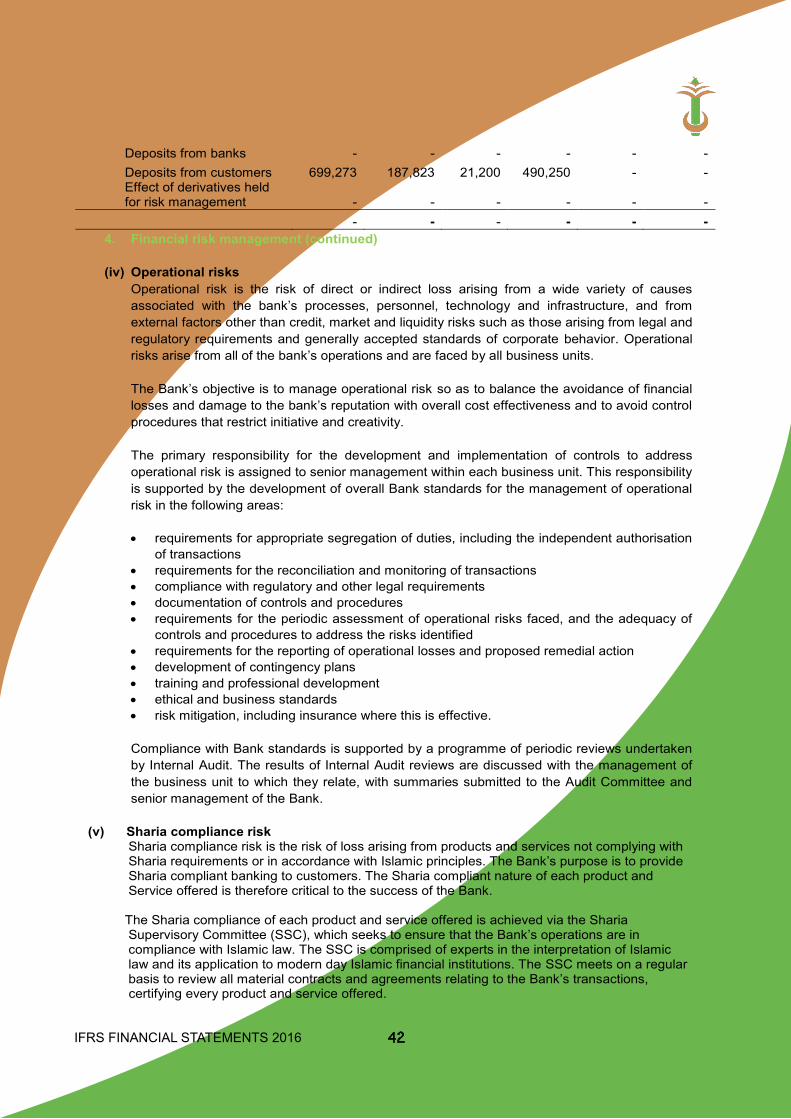
IFRS FINANCIAL STATEMENTS 2016
The accompanying notes are an integral part of the financial statements. 29
Deposits from banks - - - - - - Deposits from customers 699,273 187,823 21,200 490,250 - - Effect of derivatives held for risk management - - - - - -
- - - - - - 4. Financial risk management (continued) (iv) Operational risks Operational risk is the risk of direct or indirect loss arising from a wide variety of causes
associated with the bank’s processes, personnel, technology and infrastructure, and from external factors other than credit, market and liquidity risks such as those arising from legal and regulatory requirements and generally accepted standards of corporate behavior. Operational risks arise from all of the bank’s operations and are faced by all business units.
The Bank’s objective is to manage operational risk so as to balance the avoidance of financial
losses and damage to the bank’s reputation with overall cost effectiveness and to avoid control procedures that restrict initiative and creativity.
The primary responsibility for the development and implementation of controls to address
operational risk is assigned to senior management within each business unit. This responsibility is supported by the development of overall Bank standards for the management of operational risk in the following areas:
requirements for appropriate segregation of duties, including the independent authorisation
of transactions requirements for the reconciliation and monitoring of transactions compliance with regulatory and other legal requirements documentation of controls and procedures requirements for the periodic assessment of operational risks faced, and the adequacy of
controls and procedures to address the risks identified requirements for the reporting of operational losses and proposed remedial action development of contingency plans training and professional development ethical and business standards risk mitigation, including insurance where this is effective.
Compliance with Bank standards is supported by a programme of periodic reviews undertaken
by Internal Audit. The results of Internal Audit reviews are discussed with the management of the business unit to which they relate, with summaries submitted to the Audit Committee and senior management of the Bank.
(v) Sharia compliance risk
Sharia compliance risk is the risk of loss arising from products and services not complying with Sharia requirements or in accordance with Islamic principles. The Bank’s purpose is to provide Sharia compliant banking to customers. The Sharia compliant nature of each product and Service offered is therefore critical to the success of the Bank. The Sharia compliance of each product and service offered is achieved via the Sharia Supervisory Committee (SSC), which seeks to ensure that the Bank’s operations are in compliance with Islamic law. The SSC is comprised of experts in the interpretation of Islamic law and its application to modern day Islamic financial institutions. The SSC meets on a regular basis to review all material contracts and agreements relating to the Bank’s transactions,
certifying every product and service offered.
42
IFRS FINANCIAL STATEMENTS 2016 43
The accompanying notes are an integral part of the financial statements. 30
The bank is currently holding 558,000 shares in Trust Bank (G) Limited valued at D2.734million.
These shares were given to the bank by the courts as part settlement of an overdue debt. Annual dividend received does not form part of the bank’s annual revenue but is rather given out as Zakat as recommended by the Sharia Board. Dividend of D0.57miillion was received in 2016 and D0.29million was given as Zakat and the balance of D0.28million remains in the accrued zakat account. We are negotiating with potential buyers to sell it off. (vi) Capital management Regulatory capital The Central Bank of The Gambia sets and monitors capital requirements for the Bank as a
whole. The parent company and individual banking operations are directly supervised by their local regulators.
In implementing current capital requirements The Central Bank of The Gambia requires the
bank to maintain a prescribed ratio of total capital to total risk-weighted assets. The bank is also required to maintain a credible capital plan to ensure that capital level of the Bank is maintained in consonance with the Bank’s risk appetite.
The Bank’s regulatory capital is analysed into two tiers:
Tier 1 capital, which includes ordinary share capital, share premium, perpetual bonds
(which are classified as innovative Tier 1 securities), retained earnings, translation reserve and other regulatory adjustments relating to items that are included in equity but are treated differently for capital adequacy purposes.
Tier 2 capital, which includes qualifying subordinated liabilities, and the element of the fair value reserve relating to unrealised gains on equity instruments classified as available-for-sale.
Various limits are applied to elements of the capital base; qualifying tier 2 capital cannot exceed tier 1 capital; and qualifying term subordinated loan capital may not exceed 50 percent of tier 1 capital. Other deductions from capital include the carrying amounts of investments in subsidiaries that are not included in the regulatory consolidation, investments in the capital of banks and certain other regulatory items.
Banking operations are categorised as either trading book or banking book, and risk-weighted
assets are determined according to specified requirements that seek to reflect the varying levels of risk attached to assets and off-balance sheet exposures.
The bank’s policy is to maintain a strong capital base so as to maintain investor, creditor and
market confidence and to sustain future development of the business. The impact of the level of capital on shareholders’ return is also recognised and the Bank recognises the need to maintain a balance between the higher returns that might be possible with greater gearing and the advantages and security afforded by a sound capital position.
The bank and its individually regulated operations have complied with all externally imposed
capital requirements throughout the period. There have been no material changes in the bank’s management of capital during the period.
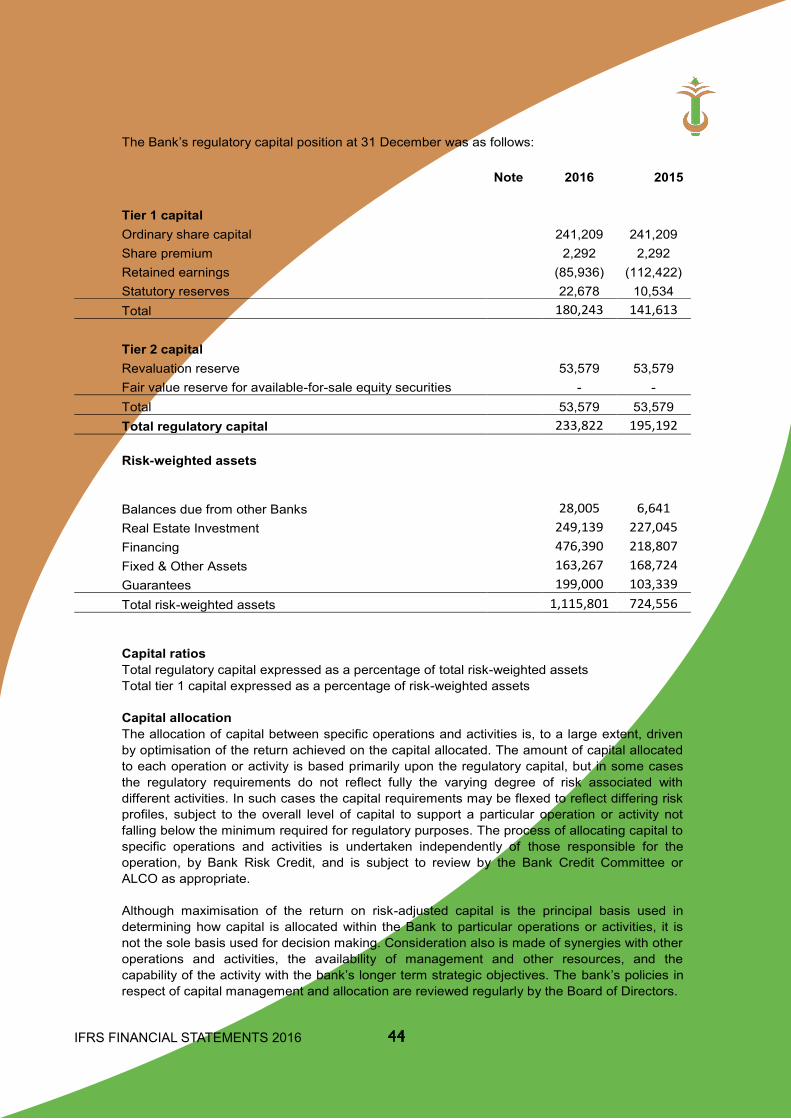
IFRS FINANCIAL STATEMENTS 2016
The accompanying notes are an integral part of the financial statements. 31
The Bank’s regulatory capital position at 31 December was as follows:
Note 2016 2015
Tier 1 capital Ordinary share capital
241,209 241,209 Share premium
2,292 2,292
Retained earnings
(85,936) (112,422) Statutory reserves
22,678 10,534
Total 180,243 141,613
Tier 2 capital Revaluation reserve
53,579 53,579 Fair value reserve for available-for-sale equity securities
- -
Total 53,579 53,579 Total regulatory capital 233,822 195,192
Risk-weighted assets
Balances due from other Banks
28,005 6,641
Real Estate Investment
249,139 227,045 Financing 476,390 218,807 Fixed & Other Assets 163,267 168,724 Guarantees 199,000 103,339 Total risk-weighted assets 1,115,801 724,556
Capital ratios Total regulatory capital expressed as a percentage of total risk-weighted assets Total tier 1 capital expressed as a percentage of risk-weighted assets Capital allocation The allocation of capital between specific operations and activities is, to a large extent, driven
by optimisation of the return achieved on the capital allocated. The amount of capital allocated to each operation or activity is based primarily upon the regulatory capital, but in some cases the regulatory requirements do not reflect fully the varying degree of risk associated with different activities. In such cases the capital requirements may be flexed to reflect differing risk profiles, subject to the overall level of capital to support a particular operation or activity not falling below the minimum required for regulatory purposes. The process of allocating capital to specific operations and activities is undertaken independently of those responsible for the operation, by Bank Risk Credit, and is subject to review by the Bank Credit Committee or ALCO as appropriate.
Although maximisation of the return on risk-adjusted capital is the principal basis used in
determining how capital is allocated within the Bank to particular operations or activities, it is not the sole basis used for decision making. Consideration also is made of synergies with other operations and activities, the availability of management and other resources, and the capability of the activity with the bank’s longer term strategic objectives. The bank’s policies in respect of capital management and allocation are reviewed regularly by the Board of Directors.
44
IFRS FINANCIAL STATEMENTS 2016 45
Use of estimates and judgements Management discussed with the Audit Committee the development, selection and disclosure of the Bank critical accounting policies and estimates, and the application of these policies and estimates.
These disclosures supplement the commentary on financial risk management.
Key sources of estimation uncertainty Allowances for credit losses Assets accounted for at amortised cost are evaluated for impairment on a basis described in accounting policy 3.
The individual counterparty component of the total allowances for impairment applies to claims evaluated individually for impairment and is based on management’s best estimate of the present value of the cash flows that are expected to be received. In estimating these cash flows, management makes judgements about counterparty’s financial situation and the net realisable value of any underlying collateral. Each impaired asset is assessed on its merits, and the workout strategy and estimate of cash flows considered recoverable are independently approved by the Credit Risk function.
Collectively assessed impairment allowances cover credit losses inherent in portfolios of claims with similar credit characteristics when there is objective evidence to suggest that they contain impaired claims, but the individual impaired items cannot yet be identified. In assessing the need for collective loan loss allowances, management considers factors such as credit quality, portfolio size, concentrations, and economic factors. In order to estimate the required allowance, assumptions are made to define the way inherent losses are modeled and to determine the required input parameters, based on historical experience and current economic conditions. The accuracy of the allowances depends on how well these estimated future cash flows for specific counterparty allowances and the moel assumptions and parameters are used in determining collective allowances.
Critical accounting judgements in applying the bank’s accounting policies Critical accounting judgements made in applying the Bank’s accounting policies include:
Financial asset and liability classification The bank’s accounting policies provide scope for assets and liabilities to be designated on inception into different accounting categories in certain circumstances:
• In classifying financial assets as held-to-maturity, the Bank has determined that it has both the positive intention and ability to hold the assets until their maturity date as required by accounting policy 3.
Details of the bank’s classification of financial assets and liabilities are given in note 1.4.2.
1.4.1 Operating segments Segment information is presented in respect of the AGIB’s business segments. The primary format, business segments, is based on the bank’s management and internal reporting structure.
IFRS FINANCIAL STATEMENTS 2016 46
The accompanying notes are an integral part of the financial statements. 33
Business segments The Bank comprises the following main business segments: Investment Banking Includes the bank’s trading and corporate finance activities Corporate Banking Includes loans, deposits and other transactions and balances
with corporate customers Retail Banking Includes loans, deposits and other transactions and balances
with retail customers Treasury Undertakes the bank’s funding and centralised risk management
activities through borrowings, issues of debt securities and investing in liquid assets such as short-term placements and corporate and government debt securities.
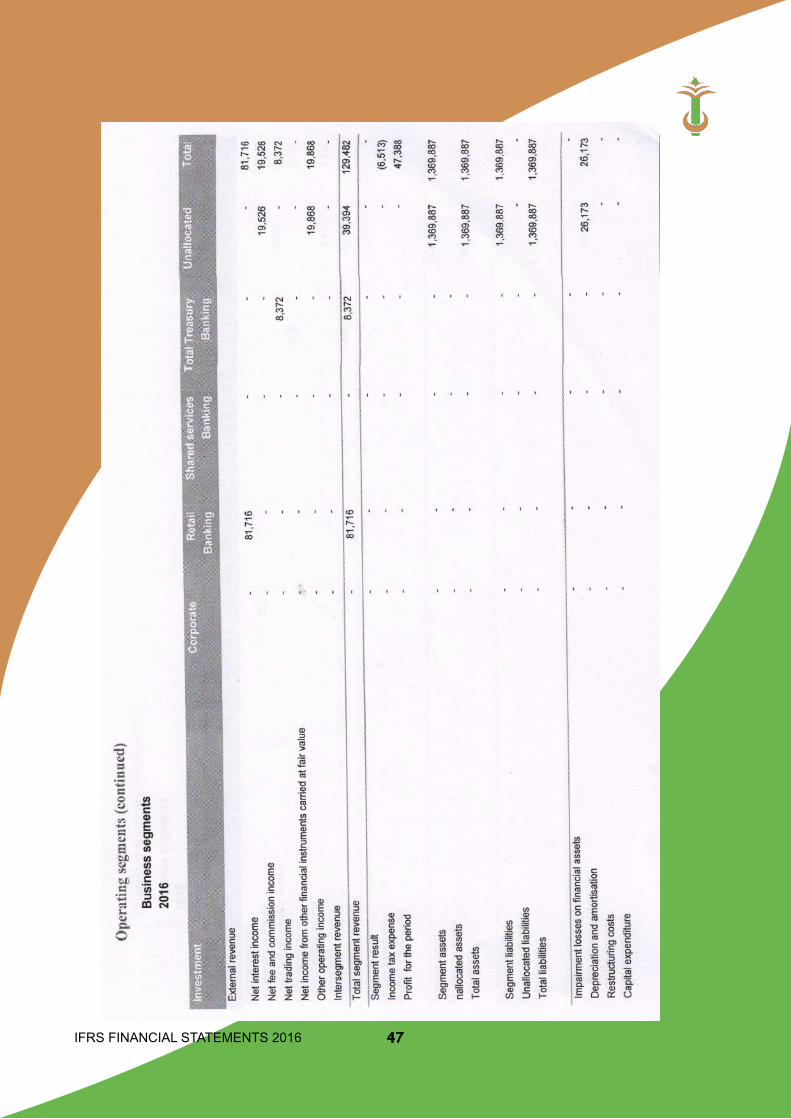
IFRS FINANCIAL STATEMENTS 2016 47
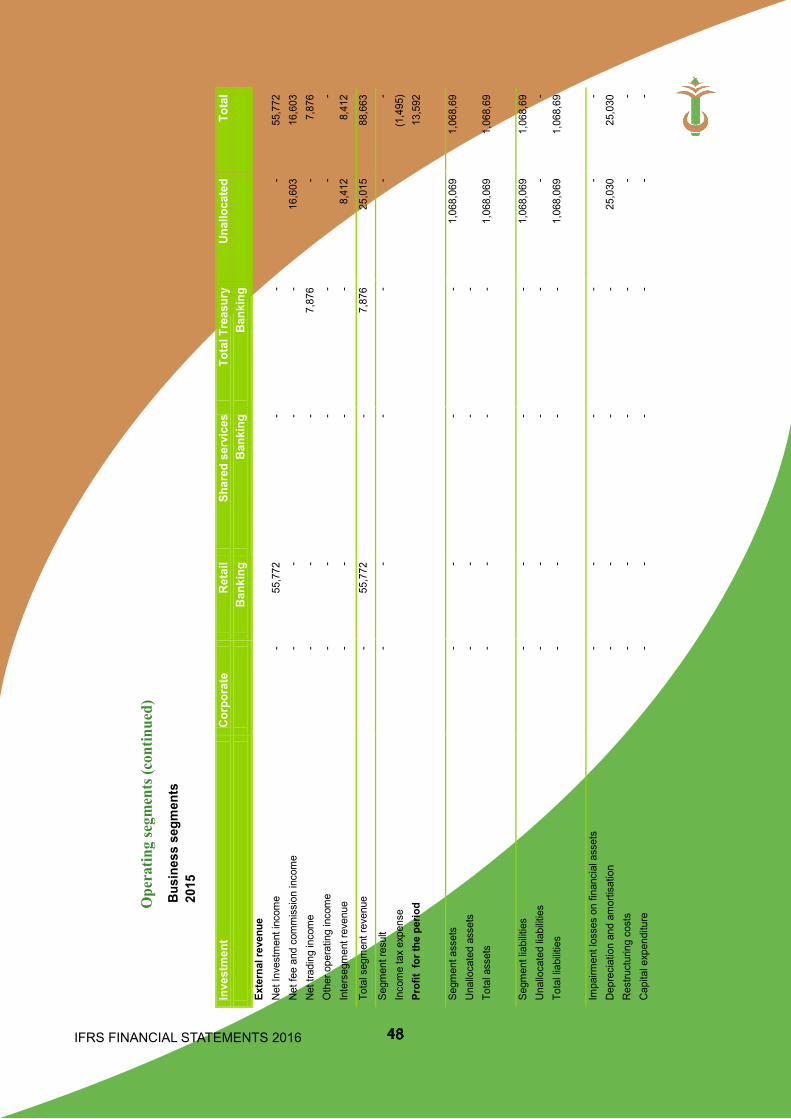
IFRS FINANCIAL STATEMENTS 2016 48
Th
e ac
com
pany
ing
note
s ar
e an
inte
gral
par
t of t
he fi
nanc
ial s
tate
men
ts.
35
O
pera
ting
segm
ents
(con
tinue
d)
Bu
sine
ss s
egm
ents
2015
In
vest
men
t Co
rpor
ate
Reta
il Sh
ared
ser
vice
s To
tal T
reas
ury
Unal
loca
ted
Tota
l
Ba
nkin
g Ba
nkin
g Ba
nkin
g
Ex
tern
al re
venu
e
N
et In
vest
men
t inc
ome
-
55
,772
-
-
-
55,
772
N
et fe
e an
d co
mm
issio
n in
com
e
-
-
-
-
16
,603
1
6,60
3
Net
trad
ing
inco
me
-
-
-
7,8
76
-
7,
876
O
ther
ope
ratin
g in
com
e
-
-
-
-
-
-
In
ters
egm
ent r
even
ue
-
-
-
-
8,4
12
8,
412
Tota
l seg
men
t rev
enue
-
55
,772
-
7
,876
25,0
15
88,
663
Segm
ent r
esul
t
-
- -
-
-
-
Inco
me
tax
expe
nse
(1,
495)
Pr
ofit
for t
he p
erio
d
1
3,59
2
Segm
ent a
sset
s
-
-
-
-
1
,068
,069
1,
068,
69
Una
lloca
ted
asse
ts
-
-
-
-
Tota
l ass
ets
-
-
-
-
1,0
68,0
69
1,06
8,69
Segm
ent l
iabi
litie
s
-
-
-
-
1,0
68,0
69
1,06
8,69
U
nallo
cate
d lia
bilit
ies
-
-
-
-
-
-
Tota
l lia
bilit
ies
-
-
-
-
1,0
68,0
69
1,06
8,69
Impa
irmen
t los
ses
on fi
nanc
ial a
sset
s
-
-
-
-
-
-
Dep
reci
atio
n an
d am
ortis
atio
n
-
-
-
-
25
,030
2
5,03
0
Res
truct
urin
g co
sts
-
-
-
-
-
-
C
apita
l exp
endi
ture
-
-
-
-
-
-
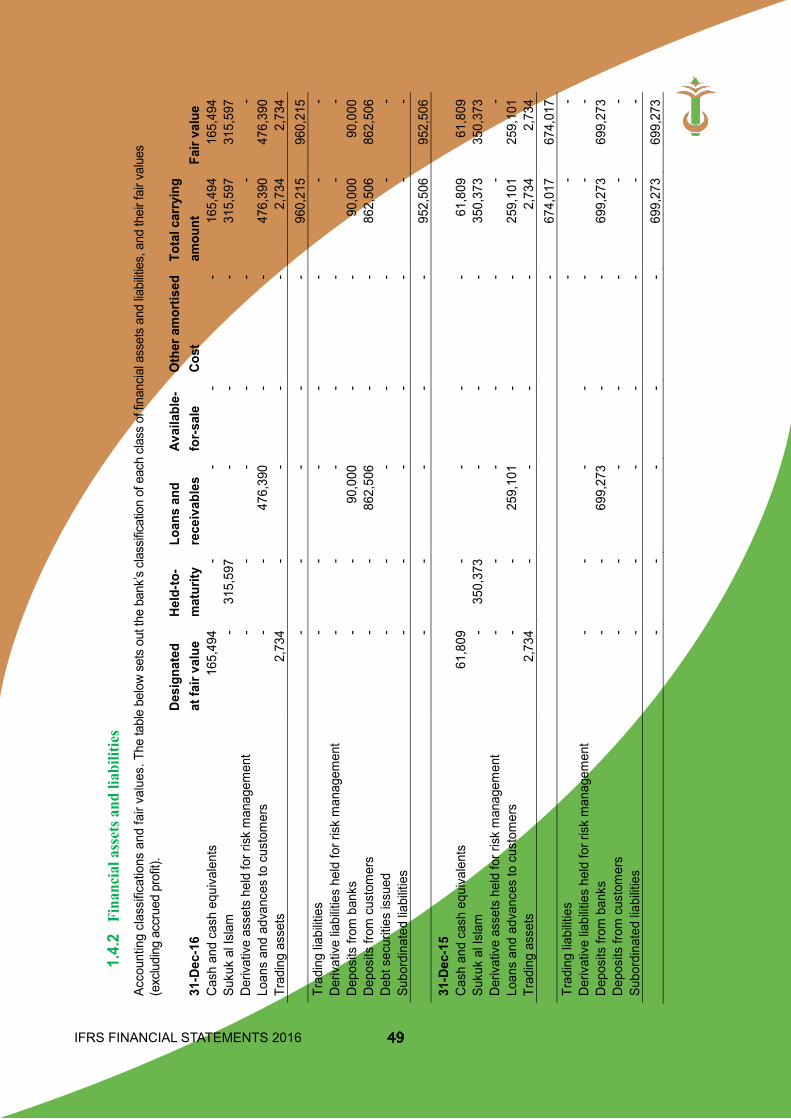
IFRS FINANCIAL STATEMENTS 2016 49
Th
e ac
com
pany
ing
note
s ar
e an
inte
gral
par
t of t
he fi
nanc
ial s
tate
men
ts.
36
1.4.
2 Fi
nanc
ial a
sset
s and
liab
ilitie
s Ac
coun
ting
clas
sific
atio
ns a
nd fa
ir va
lues
. The
tabl
e be
low
sets
out
the
bank
’s cla
ssific
atio
n of
eac
h cla
ss o
f fin
ancia
l ass
ets
and
liabi
lities
, and
thei
r fai
r val
ues
(exc
ludi
ng a
ccru
ed p
rofit
).
De
sign
ated
He
ld-to
- Lo
ans
and
Av
aila
ble-
O
ther
am
ortis
ed
Tota
l car
ryin
g
31
-Dec
-16
at fa
ir va
lue
mat
urity
re
ceiv
able
s fo
r-sal
e Co
st
amou
nt
Fair
valu
e C
ash
and
cash
equ
ival
ents
16
5,49
4
- -
- -
165,
494
16
5,49
4
Suku
k al
Isla
m
-
315,
597
-
-
-
31
5,59
7
315,
597
D
eriv
ativ
e as
sets
hel
d fo
r ris
k m
anag
emen
t -
-
-
-
-
-
-
Lo
ans
and
adva
nces
to c
usto
mer
s -
-
47
6,39
0
-
-
476,
390
47
6,39
0
Trad
ing
asse
ts
2,73
4
-
-
-
-
2,73
4
2,73
4
-
- -
- -
960,
215
960,
215
Trad
ing
liabi
litie
s -
- -
- -
- -
Der
ivat
ive
liabi
litie
s he
ld fo
r ris
k m
anag
emen
t -
- -
- -
- -
Dep
osits
from
ban
ks
- -
90,0
00
- -
90,0
00
90,0
00
Dep
osits
from
cus
tom
ers
- -
862,
506
-
- 86
2,50
6
862,
506
D
ebt s
ecur
ities
issu
ed
- -
- -
- -
- Su
bord
inat
ed lia
bilit
ies
- -
- -
- -
-
- -
- -
- 95
2,50
6 95
2,50
6 31
-Dec
-15
C
ash
and
cash
equ
ival
ents
61
,809
-
- -
- 61
,809
61
,809
Su
kuk
al Is
lam
-
35
0,37
3
-
-
-
350,
373
35
0,37
3
Der
ivat
ive
asse
ts h
eld
for r
isk
man
agem
ent
-
-
-
-
-
-
-
Loan
s an
d ad
vanc
es to
cus
tom
ers
-
-
259,
101
-
-
25
9,10
1
259,
101
Tr
adin
g as
sets
2,
734
-
-
-
-
2,
734
2,
734
- 67
4,01
7 67
4,01
7 Tr
adin
g lia
bilit
ies
- -
- D
eriv
ativ
e lia
bilit
ies
held
for r
isk
man
agem
ent
- -
- -
- -
- D
epos
its fr
om b
anks
-
- 69
9,27
3 -
- 69
9,27
3
699,
273
D
epos
its fr
om c
usto
mer
s -
- -
- -
- -
Subo
rdin
ated
liabi
litie
s -
- -
- -
- -
-
- -
- -
699,
273
699,
273
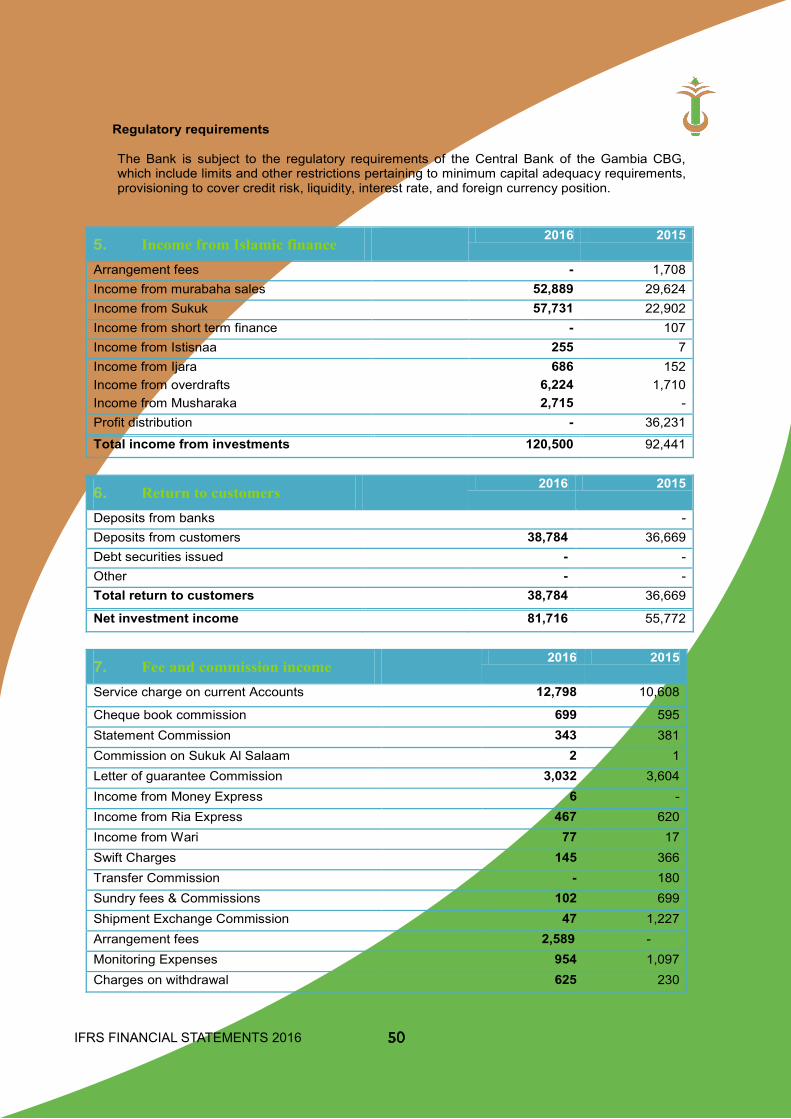
IFRS FINANCIAL STATEMENTS 2016 50
These notes are an integral part of the financial statements. 37
Regulatory requirements
The Bank is subject to the regulatory requirements of the Central Bank of the Gambia CBG, which include limits and other restrictions pertaining to minimum capital adequacy requirements, provisioning to cover credit risk, liquidity, interest rate, and foreign currency position.
5. Income from Islamic finance 2016 2015
Arrangement fees - 1,708 Income from murabaha sales 52,889 29,624 Income from Sukuk 57,731 22,902 Income from short term finance - 107 Income from Istisnaa 255 7 Income from Ijara 686 152 Income from overdrafts 6,224 1,710 Income from Musharaka 2,715 - Profit distribution - 36,231
Total income from investments 120,500 92,441
6. Return to customers 2016 2015
Deposits from banks - Deposits from customers 38,784 36,669 Debt securities issued - - Other - - Total return to customers 38,784 36,669
Net investment income 81,716 55,772
7. Fee and commission income 2016 2015
Service charge on current Accounts 12,798 10,608
Cheque book commission 699 595 Statement Commission 343 381 Commission on Sukuk Al Salaam 2 1 Letter of guarantee Commission 3,032 3,604 Income from Money Express 6 - Income from Ria Express 467 620 Income from Wari 77 17 Swift Charges 145 366 Transfer Commission - 180 Sundry fees & Commissions 102 699 Shipment Exchange Commission 47 1,227 Arrangement fees 2,589 - Monitoring Expenses 954 1,097 Charges on withdrawal 625 230
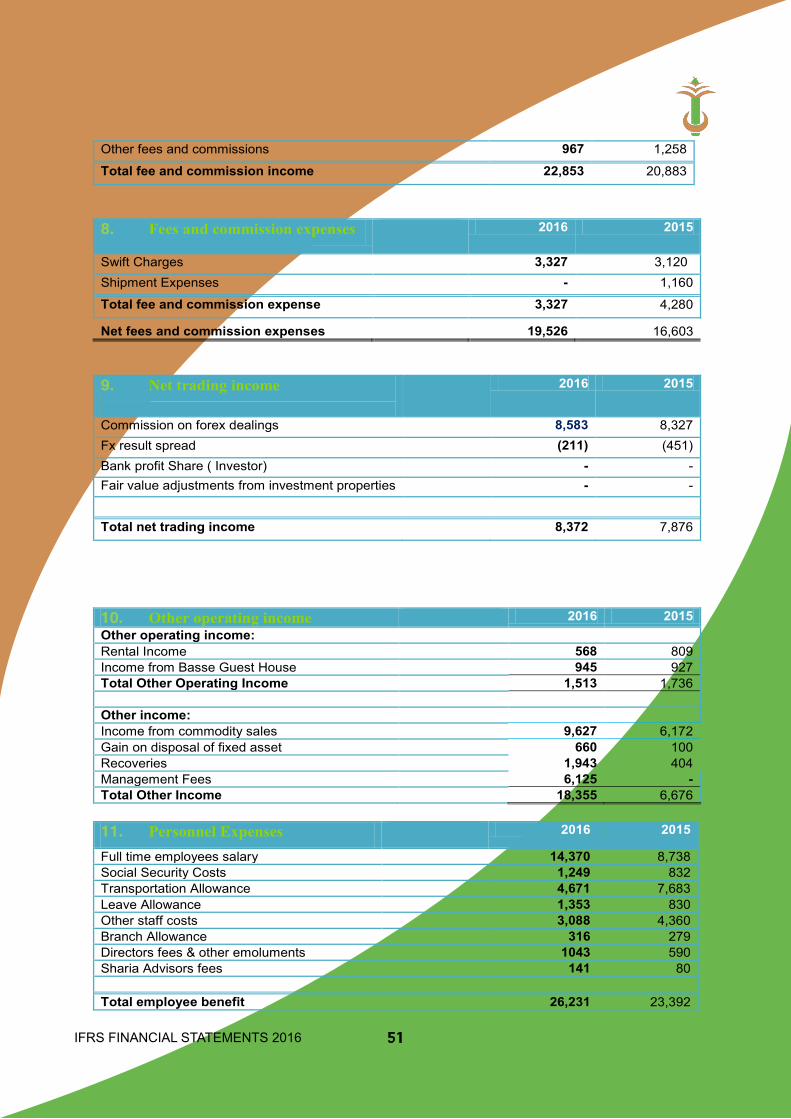
IFRS FINANCIAL STATEMENTS 2016 51
These notes are an integral part of the financial statements. 38
Other fees and commissions 967 1,258
Total fee and commission income 22,853 20,883
8. Fees and commission expenses 2016 2015
Swift Charges 3,327 3,120 Shipment Expenses - 1,160
Total fee and commission expense 3,327 4,280
Net fees and commission expenses 19,526 16,603 9. Net trading income
2016 2015
Commission on forex dealings 8,583 8,327 Fx result spread (211) (451) Bank profit Share ( Investor) - - Fair value adjustments from investment properties - -
Total net trading income 8,372 7,876
10. Other operating income 2016 2015 Other operating income: Rental Income 568 809 Income from Basse Guest House 945 927 Total Other Operating Income 1,513 1,736 Other income: Income from commodity sales 9,627 6,172 Gain on disposal of fixed asset 660 100 Recoveries 1,943 404 Management Fees 6,125 - Total Other Income 18,355 6,676 11. Personnel Expenses 2016 2015
Full time employees salary 14,370 8,738 Social Security Costs 1,249 832 Transportation Allowance 4,671 7,683 Leave Allowance 1,353 830 Other staff costs 3,088 4,360 Branch Allowance 316 279 Directors fees & other emoluments 1043 590 Sharia Advisors fees 141 80 Total employee benefit 26,231 23,392
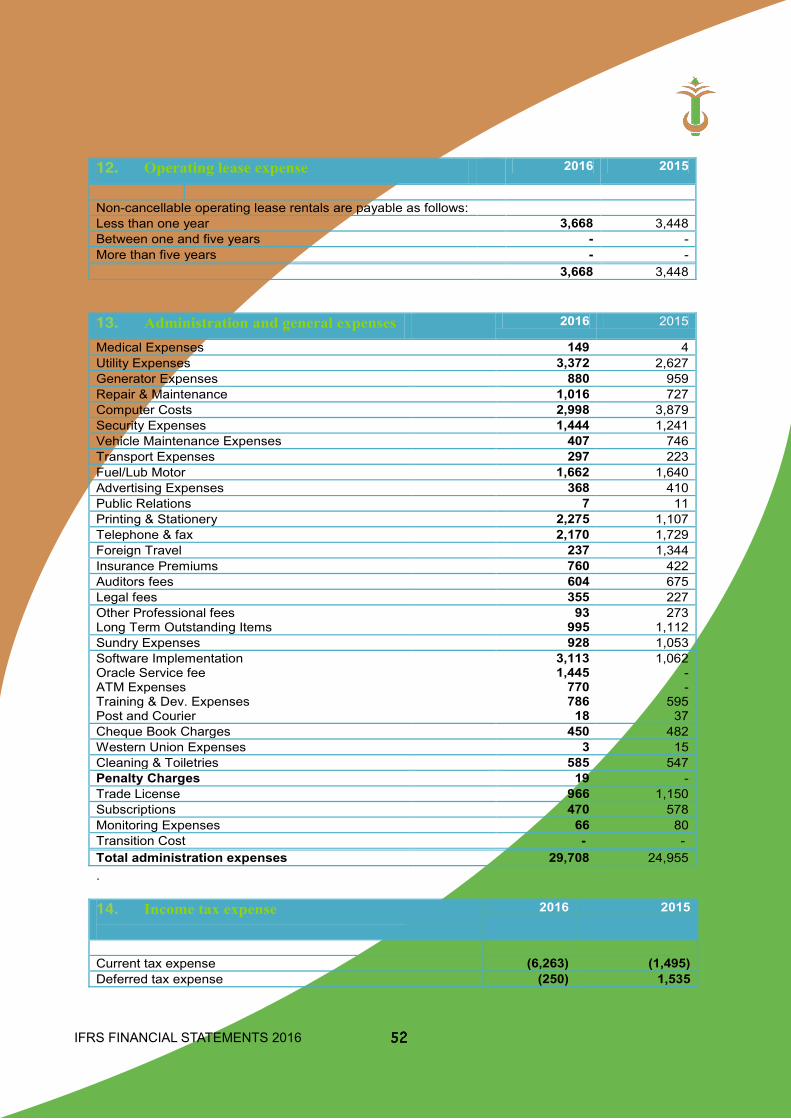
IFRS FINANCIAL STATEMENTS 2016 52
These notes are an integral part of the financial statements. 39
12. Operating lease expense 2016 2015
Non-cancellable operating lease rentals are payable as follows: Less than one year 3,668 3,448 Between one and five years - - More than five years - - 3,668 3,448 13. Administration and general expenses 2016 2015
Medical Expenses 149 4 Utility Expenses 3,372 2,627 Generator Expenses 880 959 Repair & Maintenance 1,016 727 Computer Costs 2,998 3,879 Security Expenses 1,444 1,241 Vehicle Maintenance Expenses 407 746 Transport Expenses 297 223 Fuel/Lub Motor 1,662 1,640 Advertising Expenses 368 410 Public Relations 7 11 Printing & Stationery 2,275 1,107 Telephone & fax 2,170 1,729 Foreign Travel 237 1,344 Insurance Premiums 760 422 Auditors fees 604 675 Legal fees 355 227 Other Professional fees 93 273 Long Term Outstanding Items 995 1,112 Sundry Expenses 928 1,053 Software Implementation 3,113 1,062 Oracle Service fee 1,445 - ATM Expenses 770 - Training & Dev. Expenses 786 595 Post and Courier 18 37 Cheque Book Charges 450 482 Western Union Expenses 3 15 Cleaning & Toiletries 585 547 Penalty Charges 19 - Trade License 966 1,150 Subscriptions 470 578 Monitoring Expenses 66 80 Transition Cost - - Total administration expenses 29,708 24,955 . 14. Income tax expense
2016 2015
Current tax expense (6,263) (1,495) Deferred tax expense (250) 1,535
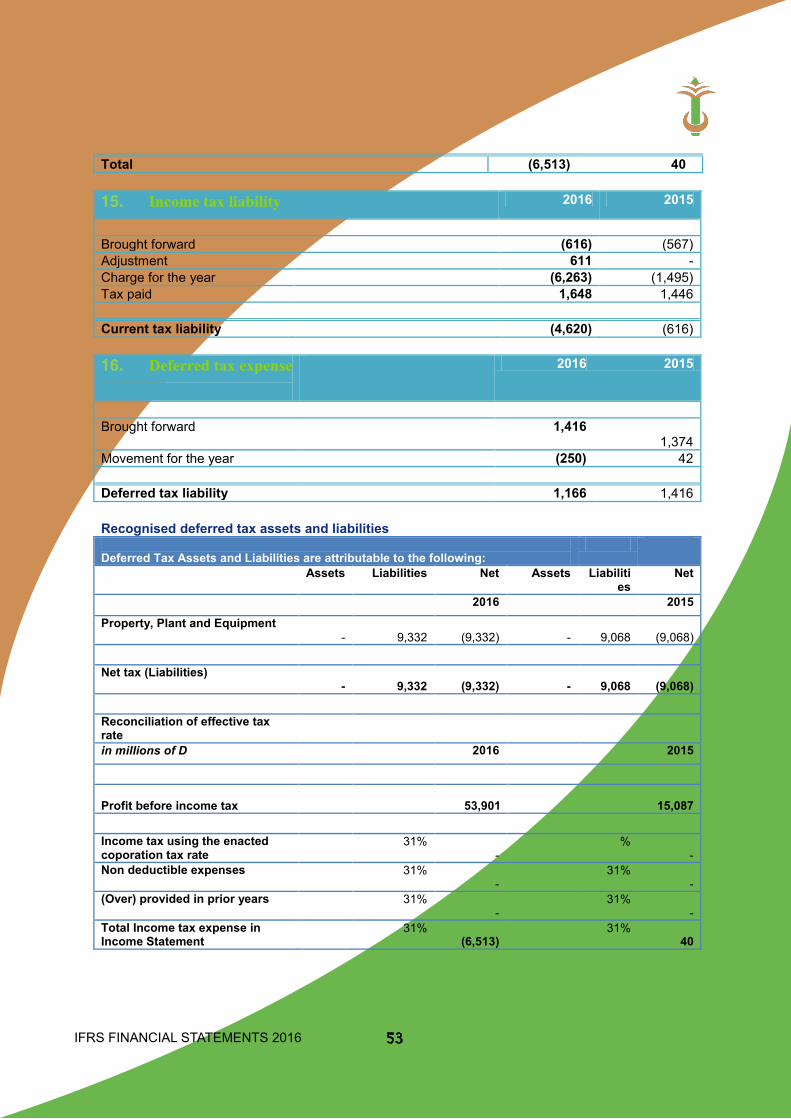
IFRS FINANCIAL STATEMENTS 2016 53
These notes are an integral part of the financial statements. 40
Total (6,513) 40 15. Income tax liability 2016 2015
Brought forward (616) (567) Adjustment 611 - Charge for the year (6,263) (1,495) Tax paid 1,648 1,446 Current tax liability (4,620) (616) 16. Deferred tax expense
2016 2015
Brought forward 1,416
1,374 Movement for the year (250) 42 Deferred tax liability 1,166 1,416 Recognised deferred tax assets and liabilities Deferred Tax Assets and Liabilities are attributable to the following:
Assets Liabilities Net Assets Liabilities
Net
2016 2015 Property, Plant and Equipment
-
9,332
(9,332)
-
9,068
(9,068) Net tax (Liabilities)
-
9,332
(9,332)
-
9,068
(9,068) Reconciliation of effective tax rate
in millions of D 2016 2015 Profit before income tax
53,901
15,087
Income tax using the enacted coporation tax rate
31% -
% -
Non deductible expenses 31% -
31% -
(Over) provided in prior years 31% -
31% -
Total Income tax expense in Income Statement
31% (6,513)
31% 40
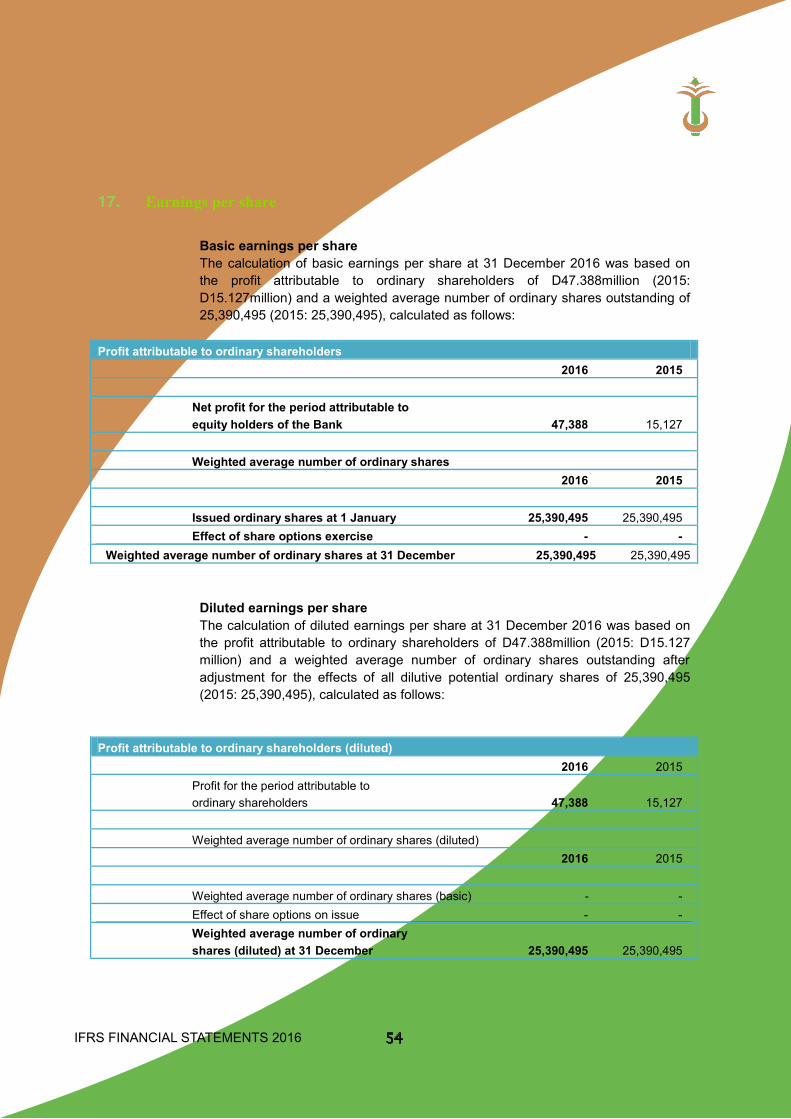
IFRS FINANCIAL STATEMENTS 2016 54
These notes are an integral part of the financial statements. 41
17. Earnings per share
Basic earnings per share The calculation of basic earnings per share at 31 December 2016 was based on
the profit attributable to ordinary shareholders of D47.388million (2015: D15.127million) and a weighted average number of ordinary shares outstanding of 25,390,495 (2015: 25,390,495), calculated as follows:
Profit attributable to ordinary shareholders 2016 2015 Net profit for the period attributable to equity holders of the Bank 47,388 15,127 Weighted average number of ordinary shares 2016 2015 Issued ordinary shares at 1 January 25,390,495 25,390,495 Effect of share options exercise - -
Weighted average number of ordinary shares at 31 December 25,390,495 25,390,495
Diluted earnings per share The calculation of diluted earnings per share at 31 December 2016 was based on
the profit attributable to ordinary shareholders of D47.388million (2015: D15.127 million) and a weighted average number of ordinary shares outstanding after adjustment for the effects of all dilutive potential ordinary shares of 25,390,495 (2015: 25,390,495), calculated as follows:
Profit attributable to ordinary shareholders (diluted) 2016 2015 Profit for the period attributable to ordinary shareholders 47,388 15,127 Weighted average number of ordinary shares (diluted)
2016 2015 Weighted average number of ordinary shares (basic) - - Effect of share options on issue - - Weighted average number of ordinary shares (diluted) at 31 December 25,390,495 25,390,495
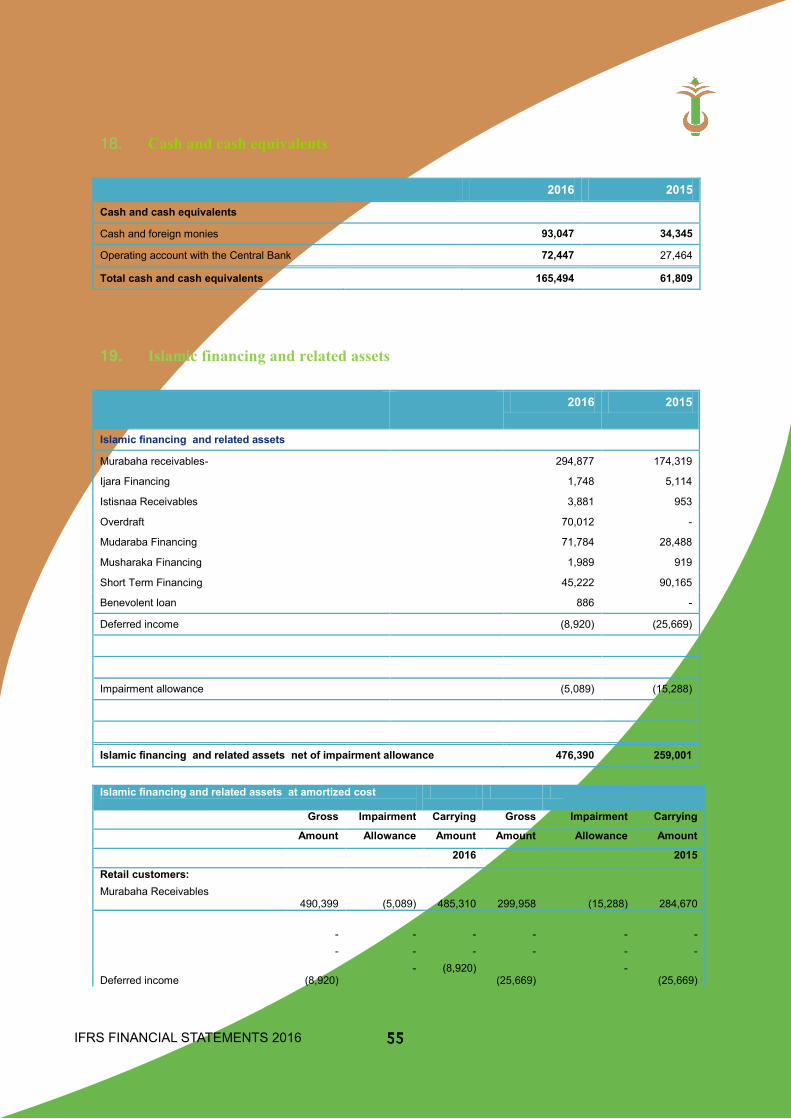
IFRS FINANCIAL STATEMENTS 2016 55
These notes are an integral part of the financial statements. 42
18. Cash and cash equivalents 2016 2015
Cash and cash equivalents
Cash and foreign monies 93,047 34,345
Operating account with the Central Bank 72,447 27,464
Total cash and cash equivalents 165,494 61,809
19. Islamic financing and related assets
2016 2015
Islamic financing and related assets
Murabaha receivables- 294,877 174,319
Ijara Financing 1,748 5,114
Istisnaa Receivables 3,881 953
Overdraft 70,012 -
Mudaraba Financing 71,784 28,488
Musharaka Financing 1,989 919
Short Term Financing 45,222 90,165
Benevolent loan 886 -
Deferred income (8,920) (25,669)
Impairment allowance (5,089) (15,288)
Islamic financing and related assets net of impairment allowance 476,390 259,001
Islamic financing and related assets at amortized cost
Gross Impairment Carrying Gross Impairment Carrying
Amount Allowance Amount Amount Allowance Amount
2016 2015
Retail customers: Murabaha Receivables
490,399 (5,089)
485,310
299,958 (15,288) 284,670 - - - - - - - - - - - - Deferred income
(8,920)
- (8,920) (25,669)
- (25,669)
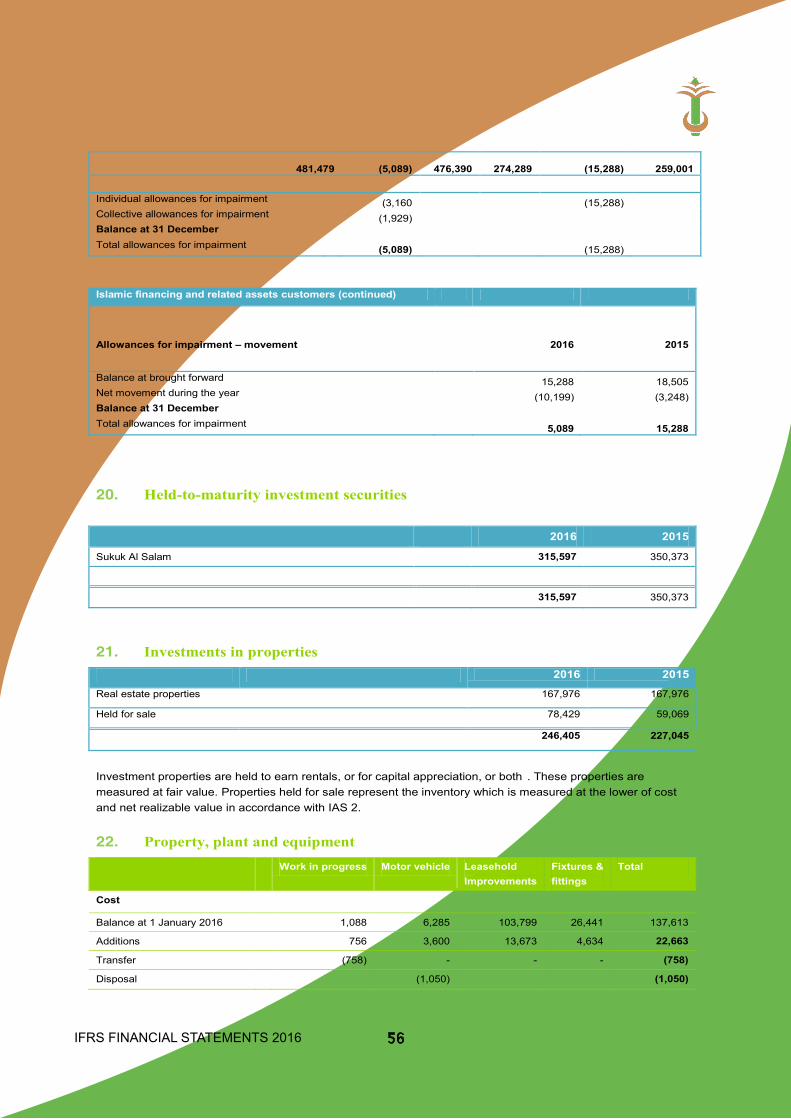
IFRS FINANCIAL STATEMENTS 2016 56
These notes are an integral part of the financial statements. 43
481,479 (5,089) 476,390
274,289 (15,288) 259,001
Individual allowances for impairment (3,160 (15,288) Collective allowances for impairment (1,929)
Balance at 31 December
Total allowances for impairment (5,089) (15,288)
Islamic financing and related assets customers (continued)
Allowances for impairment – movement 2016 2015
Balance at brought forward 15,288 18,505 Net movement during the year (10,199) (3,248) Balance at 31 December
Total allowances for impairment 5,089 15,288
20. Held-to-maturity investment securities 2016 2015
Sukuk Al Salam 315,597 350,373
315,597 350,373
21. Investments in properties 2016 2015 Real estate properties 167,976 167,976
Held for sale 78,429 59,069
246,405 227,045
Investment properties are held to earn rentals, or for capital appreciation, or both . These properties are measured at fair value. Properties held for sale represent the inventory which is measured at the lower of cost and net realizable value in accordance with IAS 2.
22. Property, plant and equipment Work in progress Motor vehicle Leasehold
Improvements Fixtures & fittings
Total
Cost
Balance at 1 January 2016 1,088 6,285 103,799 26,441 137,613
Additions 756 3,600 13,673 4,634 22,663
Transfer (758) - - - (758)
Disposal (1,050) (1,050)
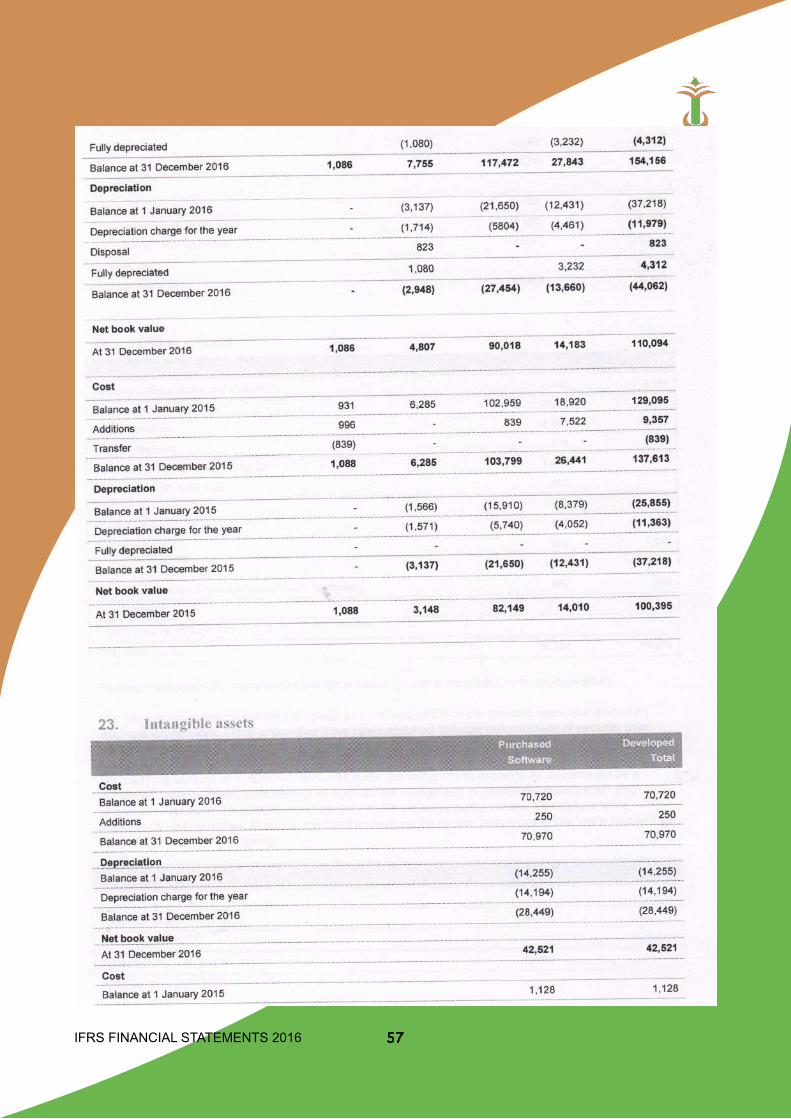
IFRS FINANCIAL STATEMENTS 2016
42
57
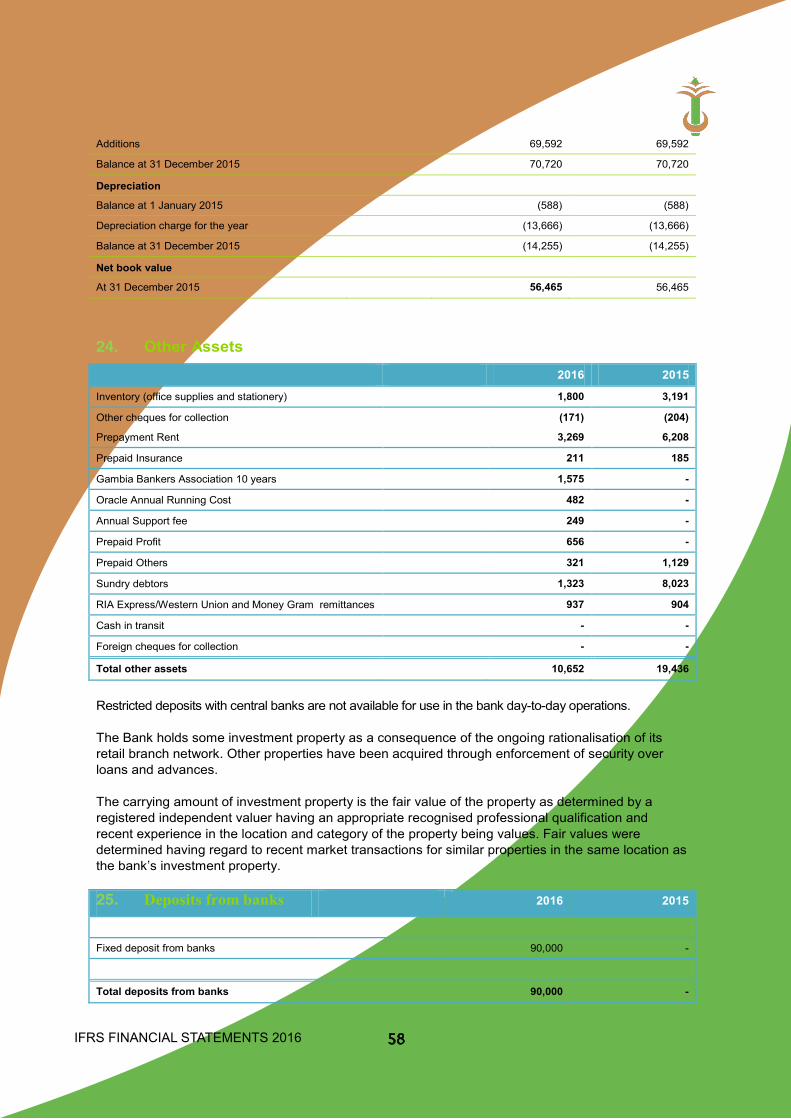
IFRS FINANCIAL STATEMENTS 2016
These notes are an integral part of the financial statements. 45
Additions 69,592 69,592
Balance at 31 December 2015 70,720 70,720
Depreciation
Balance at 1 January 2015 (588) (588)
Depreciation charge for the year (13,666) (13,666)
Balance at 31 December 2015 (14,255) (14,255)
Net book value
At 31 December 2015 56,465 56,465
24. Other Assets 2016 2015
Inventory (office supplies and stationery) 1,800 3,191
Other cheques for collection (171) (204)
Prepayment Rent 3,269 6,208
Prepaid Insurance 211 185
Gambia Bankers Association 10 years 1,575 -
Oracle Annual Running Cost 482 -
Annual Support fee 249 -
Prepaid Profit 656 -
Prepaid Others 321 1,129
Sundry debtors 1,323 8,023
RIA Express/Western Union and Money Gram remittances 937 904
Cash in transit - -
Foreign cheques for collection - -
Total other assets 10,652 19,436
Restricted deposits with central banks are not available for use in the bank day-to-day operations. The Bank holds some investment property as a consequence of the ongoing rationalisation of its retail branch network. Other properties have been acquired through enforcement of security over loans and advances. The carrying amount of investment property is the fair value of the property as determined by a registered independent valuer having an appropriate recognised professional qualification and recent experience in the location and category of the property being values. Fair values were determined having regard to recent market transactions for similar properties in the same location as the bank’s investment property. 25. Deposits from banks 2016 2015
Fixed deposit from banks 90,000 -
Total deposits from banks 90,000 -
58
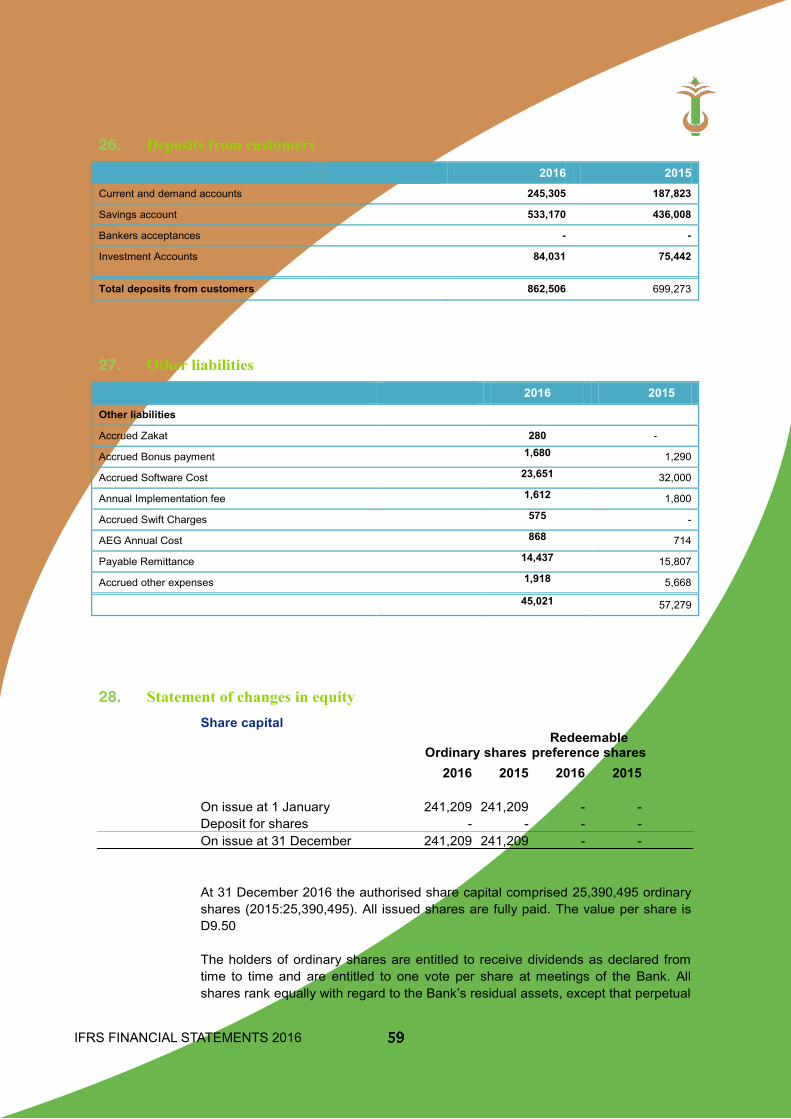
IFRS FINANCIAL STATEMENTS 2016 59
These notes are an integral part of the financial statements. 46
26. Deposits from customers
2016 2015 Current and demand accounts 245,305 187,823
Savings account 533,170 436,008
Bankers acceptances - -
Investment Accounts 84,031 75,442
Total deposits from customers 862,506 699,273
27. Other liabilities 2016 2015
Other liabilities
Accrued Zakat 280 -
Accrued Bonus payment 1,680 1,290
Accrued Software Cost 23,651 32,000
Annual Implementation fee 1,612 1,800
Accrued Swift Charges 575 -
AEG Annual Cost 868 714
Payable Remittance 14,437 15,807
Accrued other expenses 1,918 5,668
45,021 57,279
28. Statement of changes in equity Share capital Redeemable Ordinary shares preference shares 2016 2015 2016 2015 On issue at 1 January 241,209 241,209 - - Deposit for shares - - - - On issue at 31 December 241,209 241,209 - - At 31 December 2016 the authorised share capital comprised 25,390,495 ordinary
shares (2015:25,390,495). All issued shares are fully paid. The value per share is D9.50
The holders of ordinary shares are entitled to receive dividends as declared from
time to time and are entitled to one vote per share at meetings of the Bank. All shares rank equally with regard to the Bank’s residual assets, except that perpetual
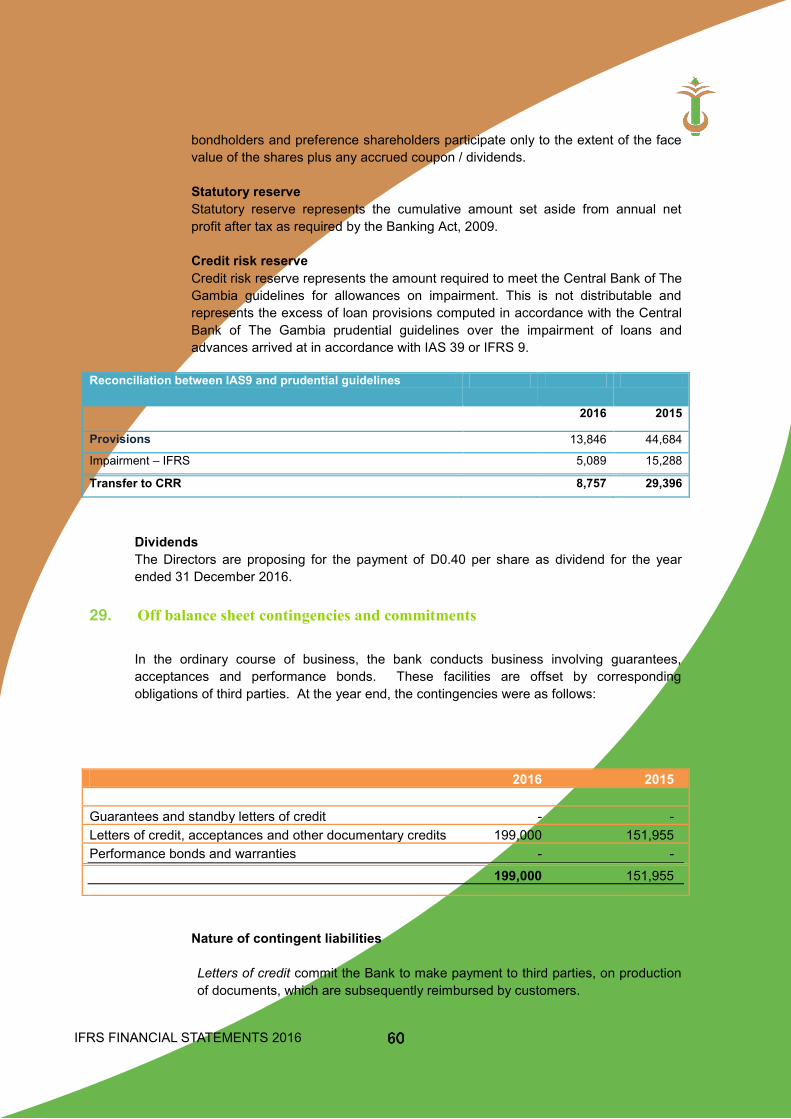
IFRS FINANCIAL STATEMENTS 2016 60
These notes are an integral part of the financial statements. 47
bondholders and preference shareholders participate only to the extent of the face value of the shares plus any accrued coupon / dividends.
Statutory reserve Statutory reserve represents the cumulative amount set aside from annual net
profit after tax as required by the Banking Act, 2009. Credit risk reserve Credit risk reserve represents the amount required to meet the Central Bank of The
Gambia guidelines for allowances on impairment. This is not distributable and represents the excess of loan provisions computed in accordance with the Central Bank of The Gambia prudential guidelines over the impairment of loans and advances arrived at in accordance with IAS 39 or IFRS 9.
Reconciliation between IAS9 and prudential guidelines
2016 2015
Provisions 13,846 44,684
Impairment – IFRS 5,089 15,288
Transfer to CRR 8,757 29,396
Dividends The Directors are proposing for the payment of D0.40 per share as dividend for the year
ended 31 December 2016.
29. Off balance sheet contingencies and commitments
In the ordinary course of business, the bank conducts business involving guarantees,
acceptances and performance bonds. These facilities are offset by corresponding obligations of third parties. At the year end, the contingencies were as follows:
2016 2015 Guarantees and standby letters of credit - - Letters of credit, acceptances and other documentary credits 199,000 151,955 Performance bonds and warranties - - 199,000 151,955
Nature of contingent liabilities
Letters of credit commit the Bank to make payment to third parties, on production of documents, which are subsequently reimbursed by customers.
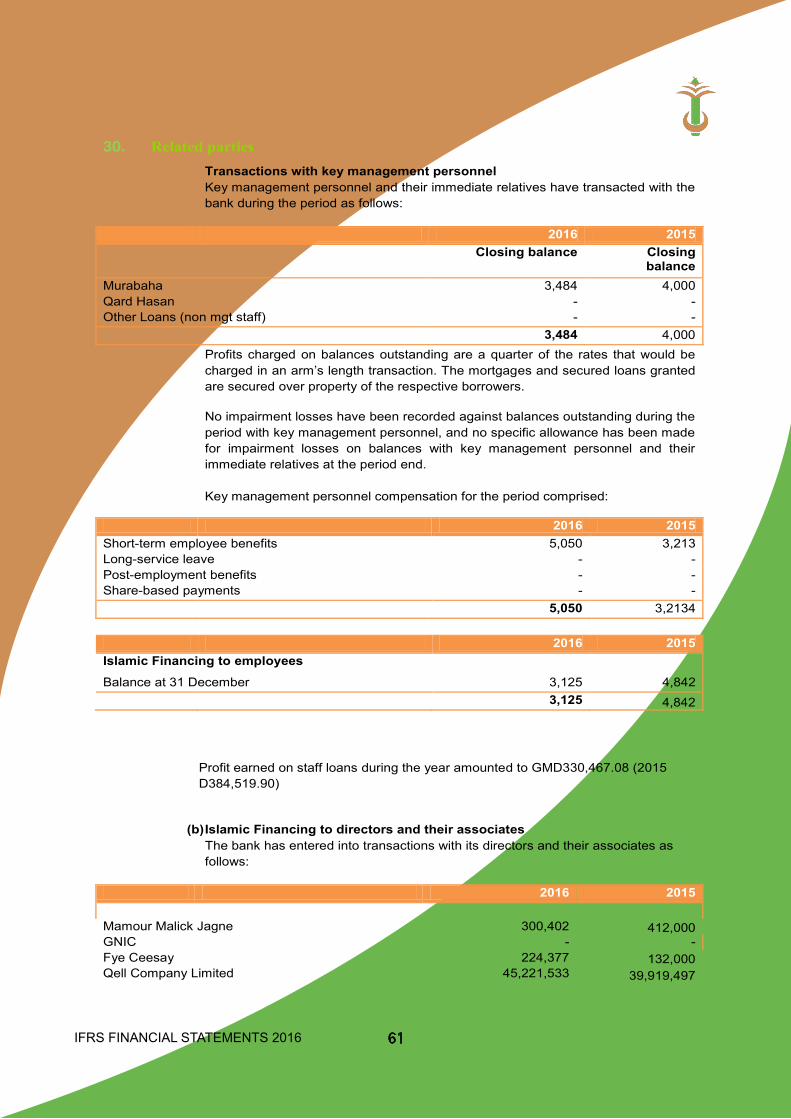
IFRS FINANCIAL STATEMENTS 2016 61
These notes are an integral part of the financial statements. 48
30. Related parties
Transactions with key management personnel Key management personnel and their immediate relatives have transacted with the
bank during the period as follows: 2016 2015 Closing balance Closing
balance Murabaha 3,484 4,000 Qard Hasan - - Other Loans (non mgt staff) - - 3,484 4,000 Profits charged on balances outstanding are a quarter of the rates that would be
charged in an arm’s length transaction. The mortgages and secured loans granted are secured over property of the respective borrowers.
No impairment losses have been recorded against balances outstanding during the
period with key management personnel, and no specific allowance has been made for impairment losses on balances with key management personnel and their immediate relatives at the period end.
Key management personnel compensation for the period comprised:
2016 2015 Short-term employee benefits 5,050 3,213 Long-service leave - - Post-employment benefits - - Share-based payments - - 5,050 3,2134 2016 2015 Islamic Financing to employees Balance at 31 December 3,125 4,842 3,125 4,842
Profit earned on staff loans during the year amounted to GMD330,467.08 (2015 D384,519.90)
(b) Islamic Financing to directors and their associates The bank has entered into transactions with its directors and their associates as follows:
2016 2015
Mamour Malick Jagne 300,402 412,000 GNIC - - Fye Ceesay 224,377 132,000 Qell Company Limited 45,221,533 39,919,497
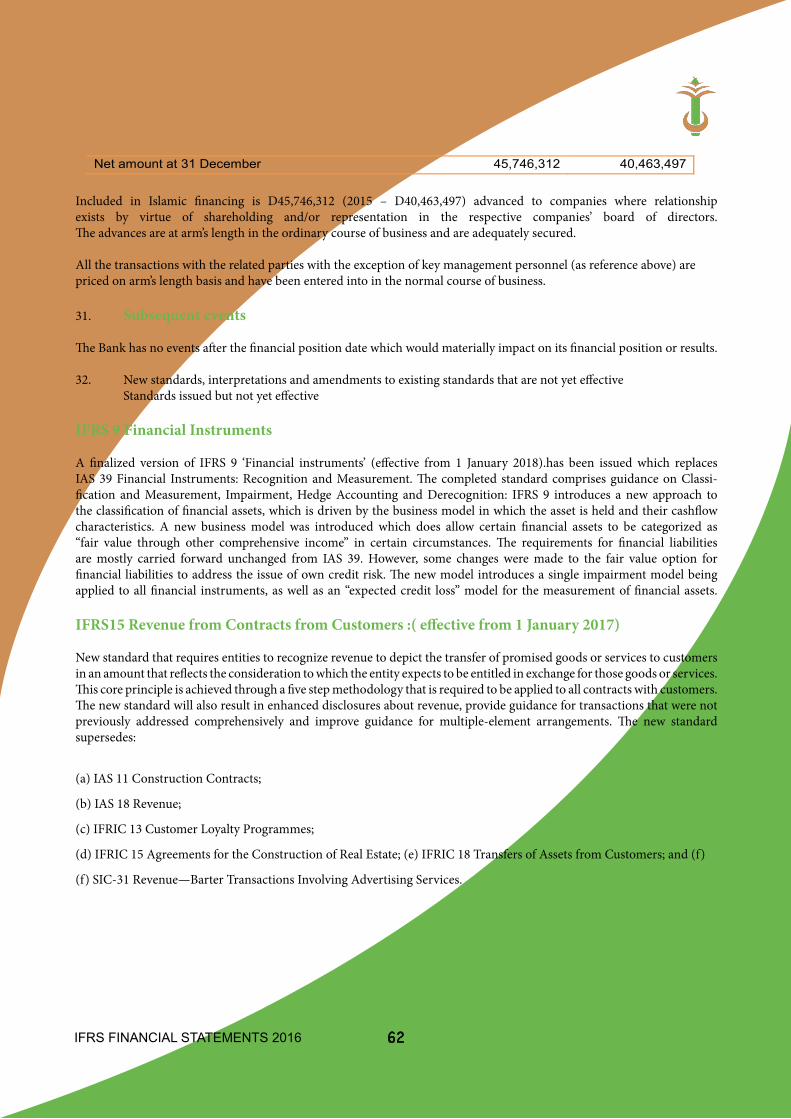
IFRS FINANCIAL STATEMENTS 2016 62
These notes are an integral part of the financial statements. 49
Net amount at 31 December 45,746,312 40,463,497
Included in Islamic financing is D45,746,312 (2015 – D40,463,497) advanced to companies where relationship exists by virtue of shareholding and/or representation in the respective companies‟ board of directors. The advances are at arm‟s length in the ordinary course of business and are adequately secured.
All the transactions with the related parties with the exception of key management personnel (as reference above) are priced on arm‟s length basis and have been entered into in the normal course of business.
31. Subsequent events
The Bank has no events after the financial position date which would materially impact on its financial position or results.
32. New standards, interpretations and amendments to existing standards that are not yet effective
Standards issued but not yet effective
IFRS 9 Financial Instruments A finalized version of IFRS 9 „Financial instruments‟ (effective from 1 January 2018).has been issued which replaces IAS 39 Financial Instruments: Recognition and Measurement. The completed standard comprises guidance on Classification and Measurement, Impairment, Hedge Accounting and Derecognition: IFRS 9 introduces a new approach to the classification of financial assets, which is driven by the business model in which the asset is held and their cashflow characteristics. A new business model was introduced which does allow certain financial assets to be categorized as “fair value through other comprehensive income” in certain circumstances. The requirements for financial liabilities are mostly carried forward unchanged from IAS 39. However, some changes were made to the fair value option for financial liabilities to address the issue of own credit risk. The new model introduces a single impairment model being applied to all financial instruments, as well as an “expected credit loss” model for the measurement of financial assets. IFRS15 Revenue from Contracts from Customers :( effective from 1 January
2017) New standard that requires entities to recognize revenue to depict the transfer of promised goods or services to customers in an amount that reflects the consideration to which the entity expects to be entitled in exchange for those goods or services. This core principle is achieved through a five step methodology that is required to be applied to all contracts with customers. The new standard will also result in enhanced disclosures about revenue, provide guidance for transactions that were not previously addressed comprehensively and improve guidance for multiple-element arrangements. The new standard supersedes: (a) IAS 11 Construction Contracts; (b) IAS 18 Revenue; (c) IFRIC 13 Customer Loyalty Programmes;
Included in Islamic financing is D45,746,312 (2015 – D40,463,497) advanced to companies where relationship exists by virtue of shareholding and/or representation in the respective companies’ board of directors. The advances are at arm’s length in the ordinary course of business and are adequately secured.
All the transactions with the related parties with the exception of key management personnel (as reference above) are priced on arm’s length basis and have been entered into in the normal course of business.
31. Subsequent events
The Bank has no events after the financial position date which would materially impact on its financial position or results.
32. New standards, interpretations and amendments to existing standards that are not yet effective Standards issued but not yet effective
IFRS 9 Financial Instruments
A finalized version of IFRS 9 ‘Financial instruments’ (effective from 1 January 2018).has been issued which replaces IAS 39 Financial Instruments: Recognition and Measurement. The completed standard comprises guidance on Classi-fication and Measurement, Impairment, Hedge Accounting and Derecognition: IFRS 9 introduces a new approach to the classification of financial assets, which is driven by the business model in which the asset is held and their cashflow characteristics. A new business model was introduced which does allow certain financial assets to be categorized as “fair value through other comprehensive income” in certain circumstances. The requirements for financial liabilities are mostly carried forward unchanged from IAS 39. However, some changes were made to the fair value option for financial liabilities to address the issue of own credit risk. The new model introduces a single impairment model being applied to all financial instruments, as well as an “expected credit loss” model for the measurement of financial assets.
IFRS15 Revenue from Contracts from Customers :( effective from 1 January 2017)
New standard that requires entities to recognize revenue to depict the transfer of promised goods or services to customers in an amount that reflects the consideration to which the entity expects to be entitled in exchange for those goods or services. This core principle is achieved through a five step methodology that is required to be applied to all contracts with customers. The new standard will also result in enhanced disclosures about revenue, provide guidance for transactions that were not previously addressed comprehensively and improve guidance for multiple-element arrangements. The new standard supersedes:
(a) IAS 11 Construction Contracts;
(b) IAS 18 Revenue;
(c) IFRIC 13 Customer Loyalty Programmes;
(d) IFRIC 15 Agreements for the Construction of Real Estate; (e) IFRIC 18 Transfers of Assets from Customers; and (f)
(f) SIC-31 Revenue—Barter Transactions Involving Advertising Services.
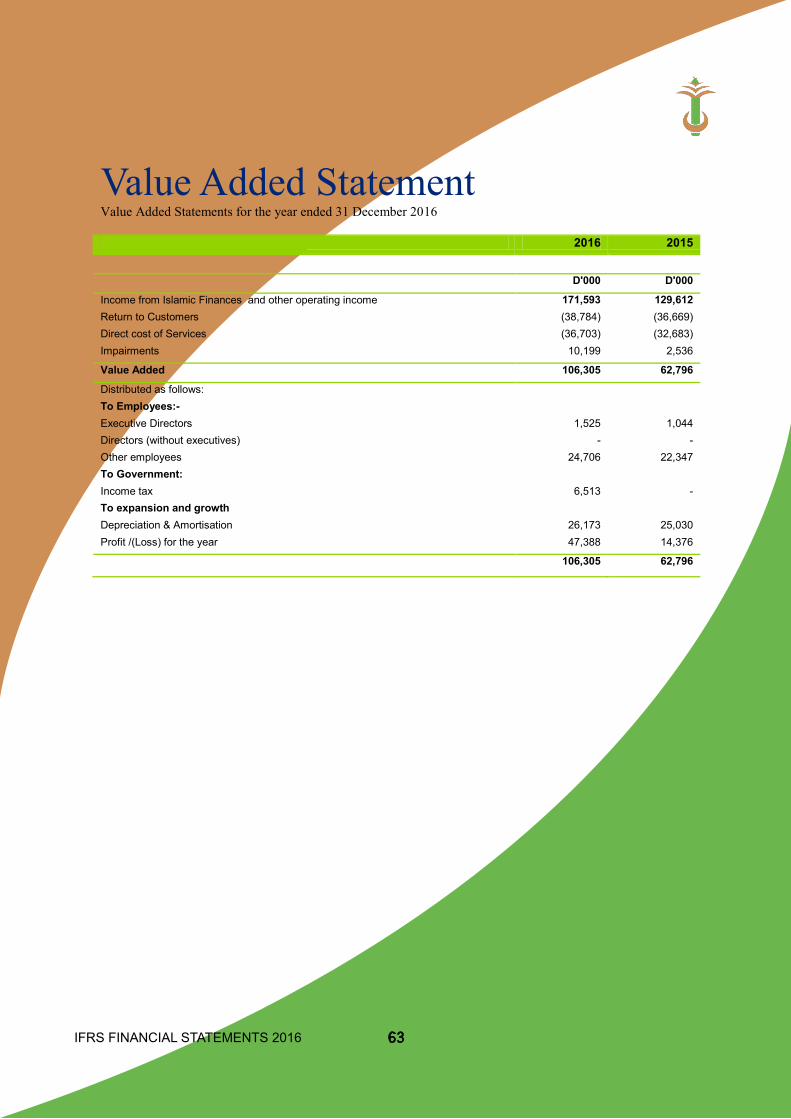
IFRS FINANCIAL STATEMENTS 2016 63
These notes are an integral part of the financial statements. 51
Value Added Statement Value Added Statements for the year ended 31 December 2016 2016 2015
D'000 D'000
Income from Islamic Finances and other operating income 171,593 129,612 Return to Customers (38,784) (36,669) Direct cost of Services (36,703) (32,683) Impairments 10,199 2,536
Value Added 106,305 62,796
Distributed as follows: To Employees:- Executive Directors 1,525 1,044 Directors (without executives) - - Other employees 24,706 22,347 To Government: Income tax 6,513 - To expansion and growth Depreciation & Amortisation 26,173 25,030 Profit /(Loss) for the year 47,388 14,376
106,305 62,796
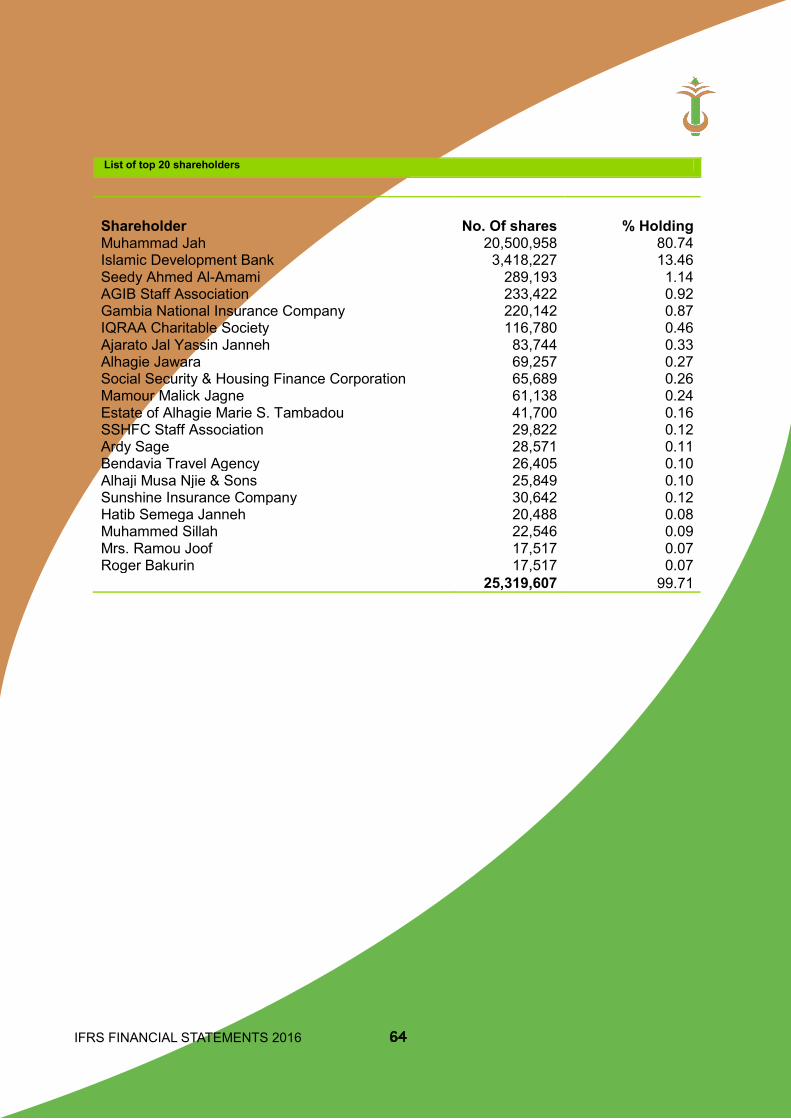
IFRS FINANCIAL STATEMENTS 2016 64
These notes are an integral part of the financial statements. 52
List of top 20 shareholders
Shareholder No. Of shares % Holding Muhammad Jah 20,500,958 80.74 Islamic Development Bank 3,418,227 13.46 Seedy Ahmed Al-Amami 289,193 1.14 AGIB Staff Association 233,422 0.92 Gambia National Insurance Company 220,142 0.87 IQRAA Charitable Society 116,780 0.46 Ajarato Jal Yassin Janneh 83,744 0.33 Alhagie Jawara 69,257 0.27 Social Security & Housing Finance Corporation 65,689 0.26 Mamour Malick Jagne 61,138 0.24 Estate of Alhagie Marie S. Tambadou 41,700 0.16 SSHFC Staff Association 29,822 0.12 Ardy Sage 28,571 0.11 Bendavia Travel Agency 26,405 0.10 Alhaji Musa Njie & Sons 25,849 0.10 Sunshine Insurance Company 30,642 0.12 Hatib Semega Janneh 20,488 0.08 Muhammed Sillah 22,546 0.09 Mrs. Ramou Joof 17,517 0.07 Roger Bakurin 17,517 0.07
25,319,607 99.71