Embed Size (px)
Citation preview
i
Table of Contents
Introduction Distinguished Budget Presentation Award ............................................... 1 Reader’s Guide ........................................................................................ 2 Community Profile ................................................................................... 3 List of Officials ......................................................................................... 7 Organizational Chart ................................................................................ 8
Budget Summary Budget Overview ..................................................................................... 9 Goals & Priorities ................................................................................... 13 Challenges & Opportunities ................................................................... 15 Revenue Assessment ............................................................................ 16 Expenditure Assessment ....................................................................... 21 Other Sources/Uses .............................................................................. 24 Fund Balance Analysis .......................................................................... 25 City-Wide Summary ............................................................................... 28 City-Wide Revenue Detail ...................................................................... 30 City-Wide Expenditure Detail ................................................................. 33
Fund Summaries General Fund ......................................................................................... 36
Conservation Trust Fund ....................................................................... 38 CDBG Fund ........................................................................................... 40
Capital Projects Fund ............................................................................ 42 Water & Wastewater Fund ..................................................................... 48 Stormwater Fund ................................................................................... 54 Sanitation Fund ..................................................................................... 56
Department Summaries Department Funding Matrix ................................................................... 59 Legislative ............................................................................................. 60 City Manager ......................................................................................... 68 City Clerk ............................................................................................... 76 Management Services ........................................................................... 82 Technology ............................................................................................ 94 Finance ................................................................................................ 102 Planning & Development ..................................................................... 112 Parks, Recreation, & Culture ............................................................... 120 Police................................................................................................... 132 Public Works ........................................................................................ 140 Capital Improvement Program Program Overview ............................................................................... 175 Conservation Trust Fund ..................................................................... 177 CDBG Fund ......................................................................................... 184 Capital Projects Fund .......................................................................... 186 Water & Wastewater Fund ................................................................... 206 Stormwater Fund ................................................................................. 224

ii
Appendix Financial Policies ................................................................................. 227 Personnel Summary ............................................................................ 233 Glossary of Terms ............................................................................... 238 Resolution No. 17-109 ......................................................................... 246 Resolution No. 17-110 ......................................................................... 247
The Government Finance Officers Association of the United States and Canada (GFOA) presented a Distinguished Budget Presentation Award to the City of Northglenn for its annual budget for the fiscal year beginning January 1, 2017. In order to receive this award, a governmental unit must publish a budget document that meets program criteria as a policy document, as an operations guide, as a financial plan, and as a communications device. The award is valid for a period of one year only. The City of Northglenn believes the 2018 budget document continues to conform to the provisions set forth by the program and will be submitting it to GFOA for determination.
1

Reader’s Guide This budget document is prepared in a format that strives to reduce the level of difficulty for readers not familiar with public budgeting systems, yet still provide comprehensive information useful in communicating the overall financial direction and policy of the City. Each section of the budget document and its contents are described below: Introduction – Provides a profile and brief history of the City including information regarding the local population, climate, and economy. In addition, this section describes the operating structure of the local government, identifies key municipal facilities, and provides a list of current City Officials, as well as a city-wide organizational chart. Budget Summary – Describes the budget process, fund structure, and basis of accounting used in the budget document. It also provides information regarding the goals and challenges facing the organization, an assessment of the major revenues and expenditures, and various city-wide budgetary statements. Fund Summaries – The City operates a number of individual funds, each with its own appropriated budget. This section provides a budgetary statement for each of the City’s funds and when applicable provides summary statements of the restricted funding elements within those funds. Department Summaries – The City is organized by department, and as such each department has an authorized expenditure budget, which it must follow. A department funding matrix as well as detail regarding each department including departmental statements, descriptive narratives, goals, activity measures, and Full Time Equivalency (FTE) levels are presented in this section. Capital Improvements – This section provides a detailed account of each capital improvement project including a program summary, descriptions, estimated costs, and information regarding the impacts of the projects on future operations and maintenance. Appendix – This section contains miscellaneous information that may be of interest to readers and includes financial policies, personnel summaries, the City’s adopted pay plan, and a glossary of terms. The resolution adopting/appropriating the budget and certifying the mill levy are included at the end of this section.
2
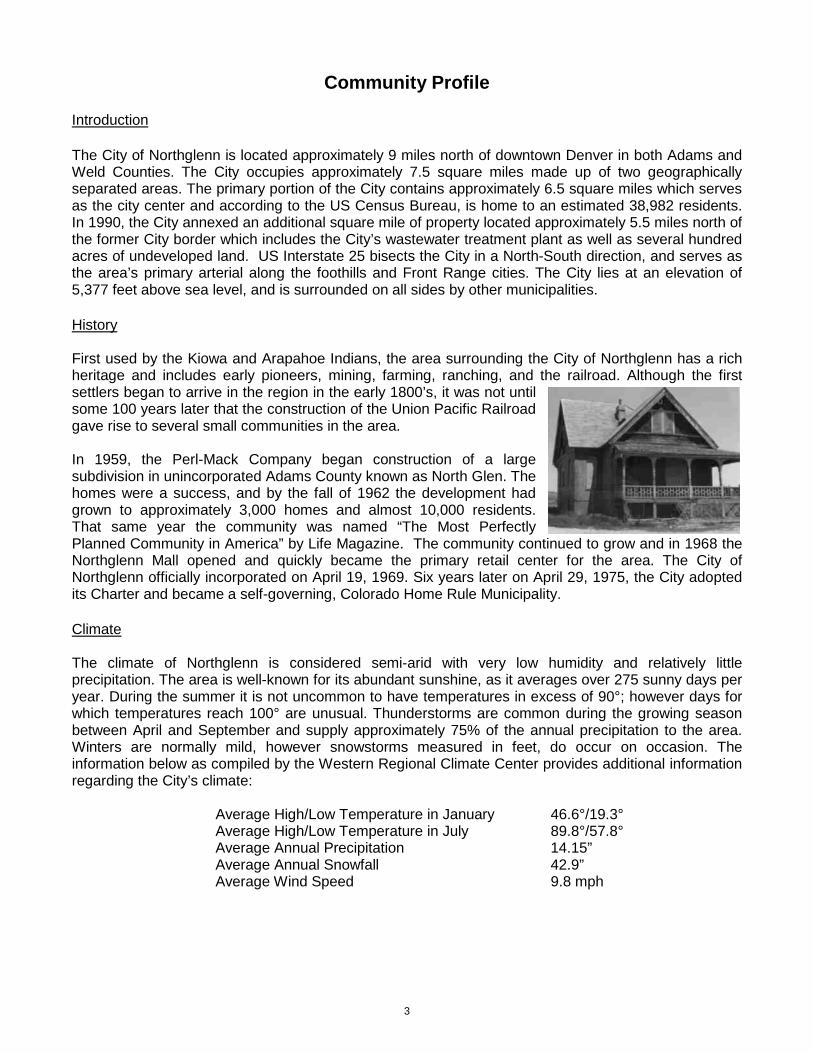
Community Profile Introduction The City of Northglenn is located approximately 9 miles north of downtown Denver in both Adams and Weld Counties. The City occupies approximately 7.5 square miles made up of two geographically separated areas. The primary portion of the City contains approximately 6.5 square miles which serves as the city center and according to the US Census Bureau, is home to an estimated 38,982 residents. In 1990, the City annexed an additional square mile of property located approximately 5.5 miles north of the former City border which includes the City’s wastewater treatment plant as well as several hundred acres of undeveloped land. US Interstate 25 bisects the City in a North-South direction, and serves as the area’s primary arterial along the foothills and Front Range cities. The City lies at an elevation of 5,377 feet above sea level, and is surrounded on all sides by other municipalities. History First used by the Kiowa and Arapahoe Indians, the area surrounding the City of Northglenn has a rich heritage and includes early pioneers, mining, farming, ranching, and the railroad. Although the first settlers began to arrive in the region in the early 1800’s, it was not until some 100 years later that the construction of the Union Pacific Railroad gave rise to several small communities in the area. In 1959, the Perl-Mack Company began construction of a large subdivision in unincorporated Adams County known as North Glen. The homes were a success, and by the fall of 1962 the development had grown to approximately 3,000 homes and almost 10,000 residents. That same year the community was named “The Most Perfectly Planned Community in America” by Life Magazine. The community continued to grow and in 1968 the Northglenn Mall opened and quickly became the primary retail center for the area. The City of Northglenn officially incorporated on April 19, 1969. Six years later on April 29, 1975, the City adopted its Charter and became a self-governing, Colorado Home Rule Municipality. Climate The climate of Northglenn is considered semi-arid with very low humidity and relatively little precipitation. The area is well-known for its abundant sunshine, as it averages over 275 sunny days per year. During the summer it is not uncommon to have temperatures in excess of 90°; however days for which temperatures reach 100° are unusual. Thunderstorms are common during the growing season between April and September and supply approximately 75% of the annual precipitation to the area. Winters are normally mild, however snowstorms measured in feet, do occur on occasion. The information below as compiled by the Western Regional Climate Center provides additional information regarding the City’s climate:
Average High/Low Temperature in January 46.6°/19.3° Average High/Low Temperature in July 89.8°/57.8° Average Annual Precipitation 14.15” Average Annual Snowfall 42.9” Average Wind Speed 9.8 mph
3

Population & Demographics According to the US Census Bureau, the estimated population of the City of Northglenn is 38,982. In addition, there were an estimated 14,482 housing units within the City and an average household size of 2.68 individuals. Approximately 95.9% of the housing units in Northglenn are occupied, and of those, 40.9% are categorized as renter-occupied. Additional information regarding the demographics of the City compared to that of Adams County and the State is provided in the following table: Northglenn Adams County Colorado
Male 49.8% 50.3% 50.1% Female 50.2% 49.7% 49.9% Median Age 33.1 32.4 36.1 Under 18 Years 25.5% 28.6% 24.4% Between 18-64 Years 63.2% 63.1% 64.7% Over 65 Years 11.3% 8.3% 10.9% High School Graduate or higher 84.5% 79.7% 89.7% Bachelor’s degree or higher 17.1% 20.6% 36.3% Graduate degree 4.4% 6.0% 13.0%
Labor & Employment According to the U.S. Census Bureau, Northglenn’s workforce accounts for 72.5% of its total population. Occupations in sales and service make up the largest category, followed by professional positions, production, transportation, and construction. The City’s median household income is estimated at $55,831. Approximately 690 store-front businesses operate in the City offering a wide variety of goods and services. A 125-acre industrial park located on the east side of the City and comprised of 140 businesses involved in manufacturing, transportation, warehousing, automotive, and other services provides many of the primary jobs within the community. The City is also home to a number of “big box” commercial retail establishments including Lowes, Best Buy, and Bed, Bath & Beyond. The Northglenn Marketplace located at I-25 and 104th Avenue is the primary retail center within the City and is made up of approximately 142 establishments. The chart below provides additional information regarding local employment by industry:
Construction 16%
Manufacturing/ Warehouse 18%
Retail 20%
Real Estate/Leasing 3%
Professional/ Scientific 7%
Education 9%
Health Care 11%
Accommodation/ Food Service 8%
Other 4%
Public Administration 4%
4
Growth & Development The City of Northglenn is a mature community, bordered on all sides by other municipalities with limited land available for new development. As such, redevelopment plays an important role in the local economy. In 1990, the Northglenn Urban Renewal Authority (NURA) was created to actively eliminate blight, assist with private redevelopment projects, as well as plan and develop public-related improvements in an effort to develop and maintain a sustainable economy. While limited, opportunities for infill development within the City do exist. Two future mass-transit light rail stations are planned in or near Northglenn as part of the Regional Transportation District’s (RTD) FasTrack program. The first station is planned to be built on vacant property between Irma and York Street on 112th Avenue, while the other is planned to go in just north of the city limits, at 124th Avenue and Claude Court. The City is also focused on several redevelopment projects throughout the City, including at the Marketplace. Government The City of Northglenn is a home rule community consisting of a council-manager form of government with power vested in an elected, nine-member City Council. Policy-making and legislative authority remains the responsibility of the City Council. The Council adopts the budget, appoints the boards and commissions, and hires the City Manager, City Attorney, City Clerk, and Municipal Judge. The City Manager is responsible for carrying out the policies and ordinances approved by Council, for overseeing the day-to-day operations of the City, and for appointing the heads of various departments. Elected by ward on a non-partisan basis, Council Members serve four-year staggered terms. The Mayor is elected at-large every four years. The Council may take action through ordinances, resolutions, and motions. The Home Rule Charter establishes procedures to promote the expeditious and efficient handling of City matters. The City provides a full range of services including police protection, municipal court services, street and road maintenance, parks and recreation, sanitation services, water treatment, sewer and stormwater services, as well as planning and general administration. City Facilities City Hall & Police Department 11701 Community Center Drive Northglenn, Colorado 80233 303.451.8326
Water Treatment Facility 2350 West 112th Avenue Northglenn, Colorado 80234 303.450.4061
Recreation Center 11801 Community Center Drive Northglenn, Colorado 80233 303.450.8800
Wastewater Treatment Facility 5445 Weld County Road 2 Brighton, Colorado 80603 303.457.0931
Maintenance & Operations Facility 12301 Claude Court Northglenn, Colorado 80241 303.450.4004
5
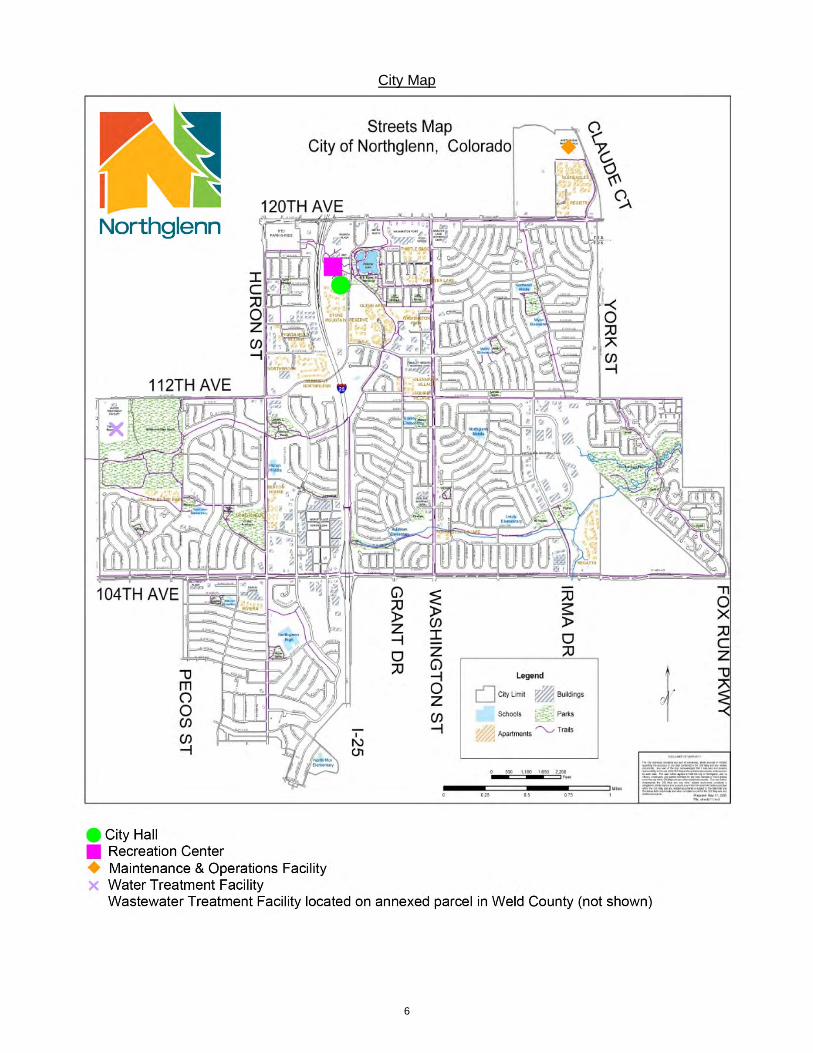
City Map
6

List of Officials
City Council
Mayor Carol A. Dodge
Mayor Pro Tem, Ward IV Antonio Esquibel
Ward I Jordan Sauers
Ward I Meredith Leighty
Ward II Becky Brown
Ward II Joyce Downing
Ward III Marci Whitman
Ward III Julie Duran Mullica
Ward IV Jenny Willford
Administration
City Manager James A. Hayes
City Attorney Corey Hoffmann
City Clerk Johanna Small
Director of Management Services Paula Jensen
Director of Technology Bob Lehr
Director of Finance Jason Loveland
Chief of Police James May, Jr.
Director of Parks, Recreation, & Culture Amanda Peterson
Director of Planning & Development Brook Svoboda
Director of Public Works David Willett
Boards & Commissions
Board of Adjustments Northglenn Urban Renewal Authority (NURA)
Citizens’ Affairs Board Parks & Recreation Advisory Board
Charter Review Committee Planning Commission
Election Commission Victim Assistance & Law Enforcement Board (VALE)
Historic Preservation Commission Youth Commission
Liquor Licensing Authority
7
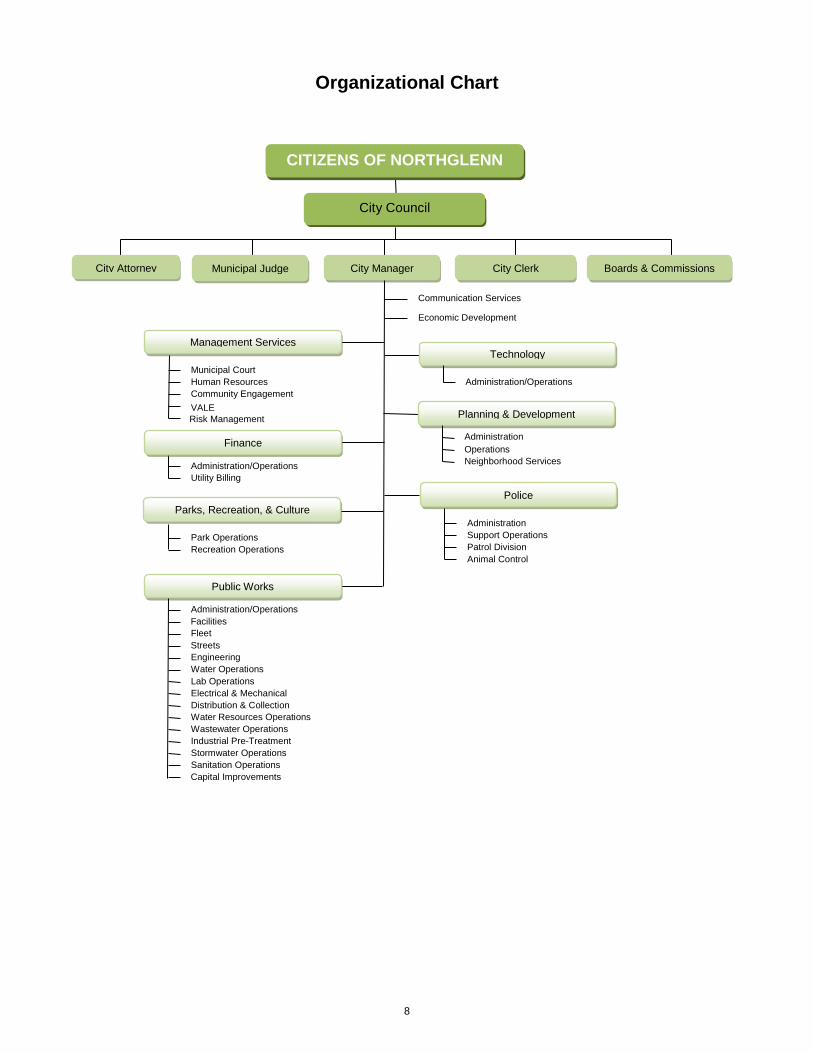
Organizational Chart
City Attorney Municipal Judge City Manager City Clerk Boards & Commissions
Management Services Technology
Planning & Development
Communication Services
Municipal Court Human Resources Community Engagement
Administration/Operations
Administration/Operations Utility Billing
Administration Operations Neighborhood Services
Parks, Recreation, & Culture
Park Operations Recreation Operations
Police
Administration Support Operations Patrol Division Animal Control
Administration/Operations Facilities Fleet Streets Engineering Water Operations Lab Operations Electrical & Mechanical Distribution & Collection Water Resources Operations Wastewater Operations Industrial Pre-Treatment Stormwater Operations Sanitation Operations Capital Improvements
Economic Development
Risk Management
Finance
VALE
City Council
CITIZENS OF NORTHGLENN
Public Works
8

Budget Overview
Pursuant to Article VIII of the City Charter, I am pleased to present the 2018 Annual Operating Budget & 2018-2022 Capital Improvement Plan for the City of Northglenn. The budget identifies the allocation of available resources and acts as an operations guide in an effort to meet the service needs of the community.
Budget Process The City’s fiscal year begins on January 1st and ends on December 31st of each year. Although the City legally appropriates its budget on an annual basis, the budgeting process includes discussions regarding multi-year financial planning, specifically as it relates to the City’s five-year Capital Improvement Program. The individual departments prepare budgets using a line-item method, providing detailed documentation for revenues and expenditures. Service levels, as approved by the City Council during the annual budget review, assist the departments in determining projected expenditures. In order to present a balanced budget, the City Manager works closely with departments to coordinate funding levels. Article VIII, Section 4e of the City Charter defines a balanced budget as, “The total of proposed expenditures shall not exceed the total of estimated revenues.” Per the City’s Municipal Code, the proposed budget must be presented to City Council at a study session on or before September 20th, followed by a public hearing which must be held on or before November 30th. During the public hearing, City Council may adopt the budget with or without amendment. If City Council fails to adopt the budget by December 31st, the amounts appropriated for the current operation for the current fiscal year shall be deemed adopted for the ensuing fiscal year on a month-to-month basis. Adoption of the budget by City Council shall constitute appropriations of the amounts specified at the fund and department level. The City encourages citizen participation by publishing notices of the hearing in the local newspaper, the City’s website, and posted at official City posting places. Copies of the budget document are also available for citizen review.
Budget Flowchart
REVENUE FORECASTS
May
EXPENDITURE FORECASTS
May
ADOPTED BUDGET
DOCUMENT AVAILABLE TO
PUBLIC December
BUDGET STUDY SESSIONS
September
BUDGET PRESENTATION
August
BUDGET PUBLIC HEARING
October
Major Elements
ADOPTION OF THE ANNUAL
BUDGET October
9

Budget Calendar
Date Activity January 30, 2017 File the Adopted Budget with the Colorado Division of Local Governments
Due By: January 30th (C.R.S. 29-1-113(1)) February 11 Development/Communication of 2018 Organizational Goals & Priorities March 14 Executive Team Budget Meeting & Debriefing on Goals & Priorities April 17 Present 2018 Budget Calendar to City Council May 15 – 19 Develop Preliminary Projections, and Budget Worksheets May 22 Distribute Projections, Preparation Manual, and Worksheets to Departments May 22 – June 9 Departments Complete Budget Worksheets/Package Requests/CIP June 12 – 16 Develop Preliminary Budget Reports June 19 – 23 Distribute Preliminary Budget to City Manager/Staff Budget Retreat/CIP June 26 – 30 Executive Level Review of the Preliminary Budget July 3 – 7 Develop & Compile Proposed Budget Document July 10 – 14 City Manager Review of the Proposed Budget July 17 – 23 Proposed Budget Development & Analysis July 24 Submit Proposed Budget to City Council (Work Session scheduled for 8/7) August 7 Formal Presentation of Proposed Budget Document to City Council August 21 All Departments Budget Presentation To Council
August 25 Receive Preliminary Abstract of Assessments from County Assessor Due By: August 25th (C.R.S. 39-5-121(2)(b))
August 26 Calculate Preliminary Mill Levy Rate September 11 Submit Recommended Budget to City Council September 25 Public Hearing on the Proposed Budget and Capital Improvement Program October 2 Legislative Level Review & Instruction October 23 Adoption of the Annual Operating & Capital Improvement Budget/Mill Levy November 1 – 30 Develop & Compile Recommended Budget Document November 7 Election Day
December 10 Receive Certified Final Assessed Valuation from County Assessor Due By: December 10th (C.R.S. 39-1-111(5))
December 15 Certification of the Annual Mill Levy Due By: December 15th (C.R.S. 39-5-128(1))
December 15 – 31 Compile and Format Adopted Budget, CIP, and Budget-In-Brief Documents for Print and Distribution
Budgetary Control Once adopted, it becomes the responsibility of the Finance Department to monitor and report on the financial activity of the organization and condition of the annual budget. The City incorporates the use of financial software, policies, and procedures to provide an adequate level of control over expenditures. Each department is responsible for controlling expenditures within budgetary allowances; however, ultimate budgetary responsibility is retained at the legislative level. As allowed by the City’s Charter, requests for amended, supplemental, or reduction appropriations to the budget will be issued in a public notice and subject to the approval of City Council by ordinance.
10
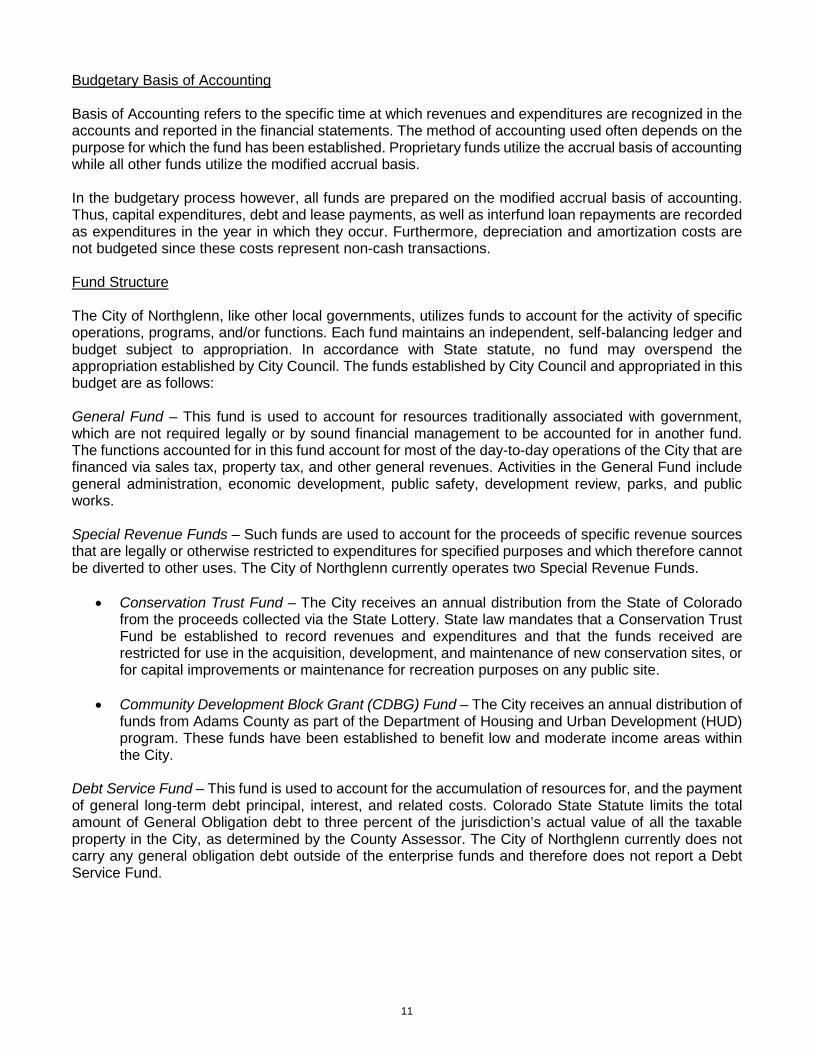
Budgetary Basis of Accounting Basis of Accounting refers to the specific time at which revenues and expenditures are recognized in the accounts and reported in the financial statements. The method of accounting used often depends on the purpose for which the fund has been established. Proprietary funds utilize the accrual basis of accounting while all other funds utilize the modified accrual basis. In the budgetary process however, all funds are prepared on the modified accrual basis of accounting. Thus, capital expenditures, debt and lease payments, as well as interfund loan repayments are recorded as expenditures in the year in which they occur. Furthermore, depreciation and amortization costs are not budgeted since these costs represent non-cash transactions. Fund Structure The City of Northglenn, like other local governments, utilizes funds to account for the activity of specific operations, programs, and/or functions. Each fund maintains an independent, self-balancing ledger and budget subject to appropriation. In accordance with State statute, no fund may overspend the appropriation established by City Council. The funds established by City Council and appropriated in this budget are as follows: General Fund – This fund is used to account for resources traditionally associated with government, which are not required legally or by sound financial management to be accounted for in another fund. The functions accounted for in this fund account for most of the day-to-day operations of the City that are financed via sales tax, property tax, and other general revenues. Activities in the General Fund include general administration, economic development, public safety, development review, parks, and public works. Special Revenue Funds – Such funds are used to account for the proceeds of specific revenue sources that are legally or otherwise restricted to expenditures for specified purposes and which therefore cannot be diverted to other uses. The City of Northglenn currently operates two Special Revenue Funds.
• Conservation Trust Fund – The City receives an annual distribution from the State of Colorado from the proceeds collected via the State Lottery. State law mandates that a Conservation Trust Fund be established to record revenues and expenditures and that the funds received are restricted for use in the acquisition, development, and maintenance of new conservation sites, or for capital improvements or maintenance for recreation purposes on any public site.
• Community Development Block Grant (CDBG) Fund – The City receives an annual distribution of
funds from Adams County as part of the Department of Housing and Urban Development (HUD) program. These funds have been established to benefit low and moderate income areas within the City.
Debt Service Fund – This fund is used to account for the accumulation of resources for, and the payment of general long-term debt principal, interest, and related costs. Colorado State Statute limits the total amount of General Obligation debt to three percent of the jurisdiction’s actual value of all the taxable property in the City, as determined by the County Assessor. The City of Northglenn currently does not carry any general obligation debt outside of the enterprise funds and therefore does not report a Debt Service Fund.
11
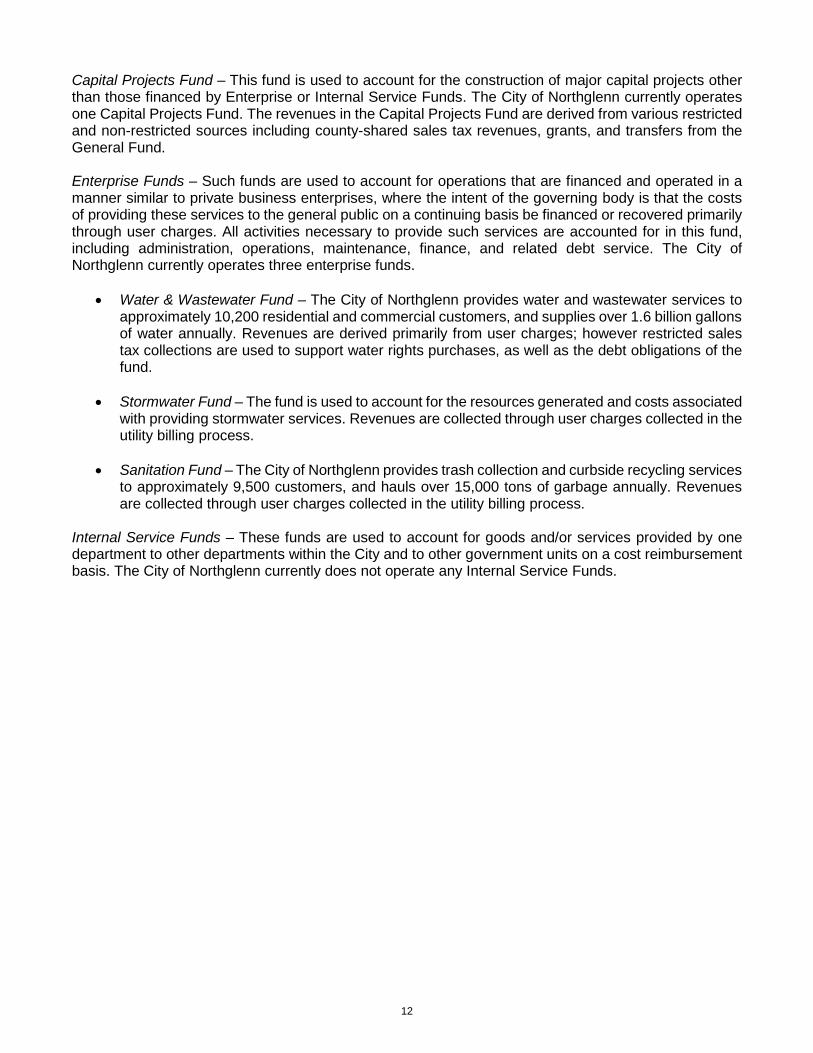
Capital Projects Fund – This fund is used to account for the construction of major capital projects other than those financed by Enterprise or Internal Service Funds. The City of Northglenn currently operates one Capital Projects Fund. The revenues in the Capital Projects Fund are derived from various restricted and non-restricted sources including county-shared sales tax revenues, grants, and transfers from the General Fund. Enterprise Funds – Such funds are used to account for operations that are financed and operated in a manner similar to private business enterprises, where the intent of the governing body is that the costs of providing these services to the general public on a continuing basis be financed or recovered primarily through user charges. All activities necessary to provide such services are accounted for in this fund, including administration, operations, maintenance, finance, and related debt service. The City of Northglenn currently operates three enterprise funds.
• Water & Wastewater Fund – The City of Northglenn provides water and wastewater services to approximately 10,200 residential and commercial customers, and supplies over 1.6 billion gallons of water annually. Revenues are derived primarily from user charges; however restricted sales tax collections are used to support water rights purchases, as well as the debt obligations of the fund.
• Stormwater Fund – The fund is used to account for the resources generated and costs associated
with providing stormwater services. Revenues are collected through user charges collected in the utility billing process.
• Sanitation Fund – The City of Northglenn provides trash collection and curbside recycling services
to approximately 9,500 customers, and hauls over 15,000 tons of garbage annually. Revenues are collected through user charges collected in the utility billing process.
Internal Service Funds – These funds are used to account for goods and/or services provided by one department to other departments within the City and to other government units on a cost reimbursement basis. The City of Northglenn currently does not operate any Internal Service Funds.
12
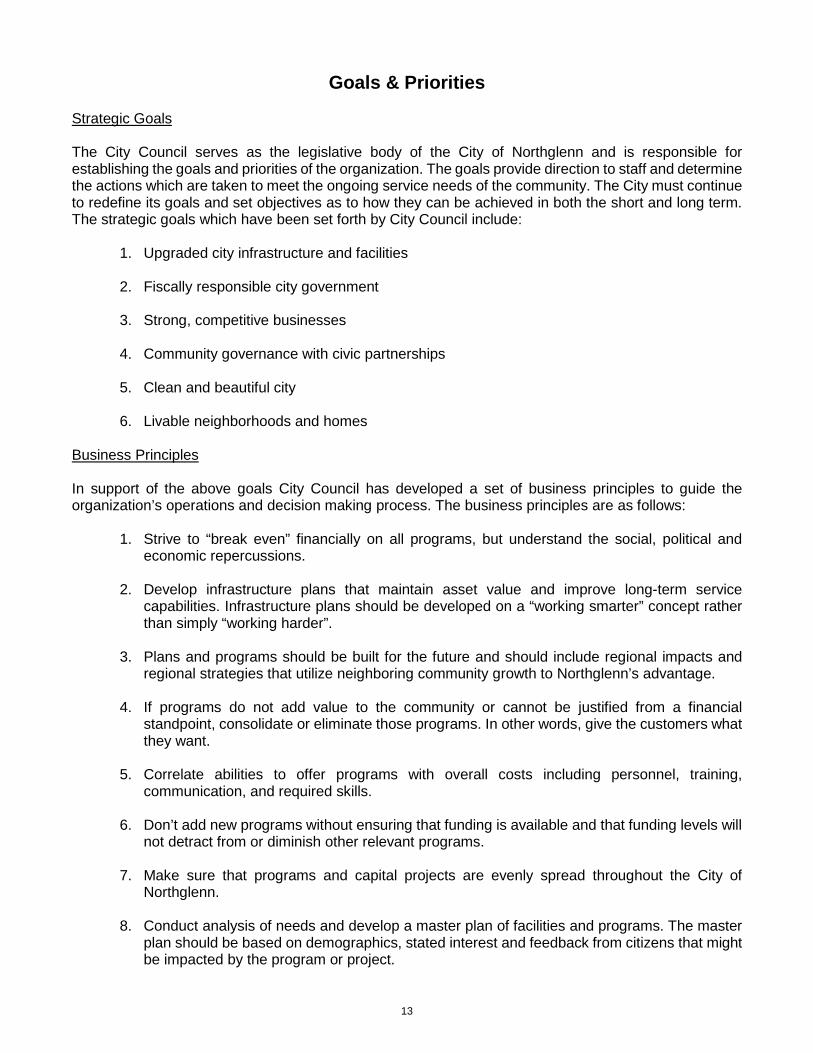
Goals & Priorities Strategic Goals The City Council serves as the legislative body of the City of Northglenn and is responsible for establishing the goals and priorities of the organization. The goals provide direction to staff and determine the actions which are taken to meet the ongoing service needs of the community. The City must continue to redefine its goals and set objectives as to how they can be achieved in both the short and long term. The strategic goals which have been set forth by City Council include:
1. Upgraded city infrastructure and facilities 2. Fiscally responsible city government
3. Strong, competitive businesses
4. Community governance with civic partnerships
5. Clean and beautiful city 6. Livable neighborhoods and homes
Business Principles In support of the above goals City Council has developed a set of business principles to guide the organization’s operations and decision making process. The business principles are as follows:
1. Strive to “break even” financially on all programs, but understand the social, political and economic repercussions.
2. Develop infrastructure plans that maintain asset value and improve long-term service
capabilities. Infrastructure plans should be developed on a “working smarter” concept rather than simply “working harder”.
3. Plans and programs should be built for the future and should include regional impacts and
regional strategies that utilize neighboring community growth to Northglenn’s advantage.
4. If programs do not add value to the community or cannot be justified from a financial standpoint, consolidate or eliminate those programs. In other words, give the customers what they want.
5. Correlate abilities to offer programs with overall costs including personnel, training,
communication, and required skills.
6. Don’t add new programs without ensuring that funding is available and that funding levels will not detract from or diminish other relevant programs.
7. Make sure that programs and capital projects are evenly spread throughout the City of
Northglenn.
8. Conduct analysis of needs and develop a master plan of facilities and programs. The master plan should be based on demographics, stated interest and feedback from citizens that might be impacted by the program or project.
13

Other Planning Processes In developing the annual budget, the City utilizes other planning processes including the City’s Capital Improvement Plan, the Comprehensive Plan, the Economic Development Strategic Plan, the Parks & Recreation Master Plan, the Water Treatment Plant Master Plan, the Wastewater Utility Plan, the Water Conservation Plan, the Integrated Resources Plan, and the Water & Wastewater Rate Study. Such plans have either been developed, or are in the process of being developed to assess the City of Northglenn’s short and long-term infrastructure needs and strategic priorities. Where appropriate, the recommendations and initiatives provided in these plans have been incorporated into the planning and development of the annual budget. Capital expenditures for the upcoming year are directly linked to the City’s Capital Improvement Plan. Priorities The City of Northglenn is committed to providing its residents, businesses, and visitors with dependable municipal services while ensuring the financial health of the community. The organization is focuses on the long-term direction and development of the community while remaining attentive to changes in the local economy. The City held a strategic planning session with staff and elected officials in January 2014. From that session, several key initiatives were identified as priorities for 2014-2018. The overriding objective for the City is to create vitalization throughout the City. This initiative is meant to lay the foundation for future planning, development, and redevelopment. Staff is taking on a rebranding and marketing of the City, updating the zoning code, and evaluating the sustainability of providing services given the current land-use and fiscal policies. While an emphasis has been placed on planning for the future, the City has also committed to delivering services at current levels and to find ways to continuously improve the delivery of those services. Many of the aforementioned initiatives are continuing in 2018. During the strategic budget meeting staff and city council set forth the completion and evaluation of the civic campus. The campus currently is home to city hall and a recreation center/theatre complex. In 2018 the masterplan of the campus is to be completed and a direction from council will be set regarding the campus after receiving extensive community feedback. The 2018 budget continues to control operating expenditures, while making significant commitments in the community’s assets and infrastructure. City-wide, the 2018 revenue forecasts represent an increase of 2.6% over the 2017 year-end estimates. Projects such as the construction of a new Justice Center, rehabilitation of residential streets, and improvements to the water and wastewater systems in the City are major capital improvement projects planned for in 2018. Services for residents have been maintained at current levels and the City has been moving forward on many strategic fronts in economic development and infrastructure improvements. Investments and grants from the City and its Urban Renewal Authority are key in maintaining and expanding the tax base. The City is preparing for rail transit services to the community starting in 2019. Master planning efforts will be implemented in 2018 to the station area. To control operating expenditures to the greatest extent possible, the City has placed significant emphasis on improved efficiencies and value-based operations. Formal requests to increase operating budgets over the prior year are required. An emphasis in the budget for 2018 has been placed on police operations and staff retention, strategic evaluations of the City’s planning documents, including the Zoning Code and a Sustainability Assessment that will factor in land use and its revenue impact. The 2018 budget includes up to a 2% market adjustment for all positions surveyed below current industry levels, as well as step increases for all sworn police personnel.
14

Challenges & Opportunities
An ongoing challenge the City faces now as well as into the foreseeable future is its dependence on sales and use tax revenues. Historically, approximately 50% of the City’s total revenues are derived through sales and use taxes, making it especially reliant upon, and vulnerable to, patterns in consumer and business spending. Of all the major revenue sources municipal government collects, sales tax is the most sensitive to the economic climate. In 2017, the City has seen sales and use tax growth of over 2.5%. Recently sales tax growth of over 10% was seen due to the establishment of the recreational marijuana industry in the City as well as the Webster Lake Promenade. The City’s major shopping center has seen three large tenants leave. In the near-term, inflationary growth in revenue is expected with an opportunity to create new business within the largest shopping center. The City continues to support ongoing operating costs without the use of fund balance. By implementing cost containment efforts, the City has been able to implement numerous efficiencies, thereby cutting expenditures without reductions in service levels. As is the case with many local government organizations, there are limited opportunities to increase revenues, therefore, in an effort to maintain the City’s financial viability it will be imperative that the organization continue efforts which maximize service delivery in the most efficient and effective manner possible. The City of Northglenn is a mature community with limited land available for new development. The City is also bordered on all sides by other municipalities and therefore cannot annex new land. As such, redevelopment plays an important role in the local economy. In 1990, the Northglenn Urban Renewal Authority (NURA) was created to actively eliminate blight, assist with private redevelopment projects, as well as plan and develop public-related improvements. In 2017, NURA executed an incentive to redevelop a midsized shopping center and office space. Future efforts for redevelopment and infill projects will be key for the future sustainability of the City. In order to be considered sustainable, the City must maintain a level of reinvestment within the community. Deferred maintenance to the City’s equipment, facilities, and infrastructure are a priority. In response, the City continues to focus on its planned, non-grant funded capital spending in 2018. In 2013, voters approved the extension of an expiring ½% sale and use tax. This ½% tax on non-food items are used to meet the water resource needs of the community and thus recorded in the Water and Wastewater Fund. The tax expires in 2025. In 2015, voters approved the extension of a ½% sales and use tax on non-food items are used to meet the capital improvement needs of the community. The sales and use tax is anticipated to generate an additional $2.7 million in 2018. As the City plans to improve facilities and infrastructure it was paramount the tax be extended without an expiration in order to provide a more secure revenue stream for potential debt service activities. This tax revenue source will fund the Justice Center project of approximately $23 million. There is not a sunset provision on this tax. In 2017, voters approved the extension of a 4.000 mill property tax for the purposes of reconstruction and rehabilitation of City streets. This revenue is tracked in the Capital Projects Fund. This tax extension does not include a sunset provision and provides a long-term source of funds to address transportation improvements. In an effort to provide the best services possible to its citizens, the City actively seeks out additional funding opportunities. Grants have been awarded for various capital projects related to the City’s Parks and Recreation activities. The details of the grant projects can be found in the Capital Improvement Projects section of the budget.
15

Revenue Assessment City-Wide Revenues In an effort to simplify financial reporting, the City of Northglenn has organized its revenues into six categories: Taxes, Intergovernmental, Licenses & Permits, User Charges & Fees, Fines & Forfeits, and Other Revenue. The following table and chart illustrate the City’s total revenue (all funds, not including Other Sources or use of fund balance).
Revenue Category
2016 Audited
Amounts
2017 Year-End Forecast
2018 Adopted Budget
Taxes $ 27,801,495 $ 27,114,234 $ 28,508,242 Intergovernmental 4,207,082 4,771,050 3,743,201 Licenses & Permits 697,955 703,320 692,272 User Charges & Fees 15,723,537 16,407,472 16,999,704 Fines & Forfeitures 980,680 814,975 1,201,901 Other Revenue 504,190 402,218 395,718 Total $ 49,914,939 $ 50,213,269 $ 51,541,038
As shown in the above table, city-wide 2018 budgeted revenue is estimated at $51,541,038 compared to estimated collections of $50,213,269 in 2017. The increase in user charges and fees is due to an increase to water and sewer fees of 6.7%. City Council approved a 5-year plan to increase these utility charges in order to pay for infrastructure projects planned over the next decade. Overall, much of the revenue is estimated to remain flat in 2018 over 2017 year-end estimates. There were no tax increases, new industries, or developments expected to occur in 2018. Additional detail regarding the forecasting methods for several of the major revenue sources of the City, as well as the associated impacts of the current economic environment is presented in the following sections.
Taxes55%
Intergovernmental8%
Licenses & Permits1%
User Charges & Fees33%
Fines & Forfeitures2%
Other Revenue1%
Operating Revenue Budget By Category
16

Tax Revenue Category Taxes represent by far the largest revenue category of the 2018 budgeted revenues, accounting for approximately 55% of the City’s total revenue. Property, specific ownership, sales, use, accommodation, and occupational taxes comprise this category. Due to the material nature of the property, sales, and use tax collections, each revenue source is discussed in more detail below. Property Tax – Property taxes are generated through an 11.597 mill levy on the assessed real and personal property valuation of $355,856,840. In 2018, the City has estimated property tax collections of $4,011,063, which makes up 8% of the City’s total revenue. The mill levy is made up of perpetual 7.597 mills used to support general operating activities and is recorded in the General Fund, while a voter-approved 4.000 mills, is restricted for purposes of major road and street reconstruction projects and accounted for in the Capital Projects Fund. While property tax remains one of the most dependable revenue streams for the City, it also remains one of the most regulated under State law. The residential assessment rate, which determines the amount of residential assessed value the mill levy was decreased by the State for 2018. The assessment rate is based on a statewide calculation, which keeps the total value of residential properties at 45% of the total assessed valuation. The assessment rate for nonresidential properties is fixed at 29% of market value, while residential rates remain variable. Pursuant to the requirements of the Gallagher Amendment to the State Constitution, the State of Colorado established the residential assessment rate at 7.20%. The table below shows the assessed valuation of the City and percent changes from year to year.
Year Assessed Valuation % Change
2008 250,837,050 -1.0% 2009 239,829,910 -4.4%
2010 240,509,600 0.3% 2011 238,969,630 -0.6% 2012 241,951,680 1.2% 2013 242,042,167 0.0% 2014 237,061,750 -2.0% 2015 270,286,440 14.0% 2016 267,718,930 -1.0% 2017 345,870,790 29.2%
17
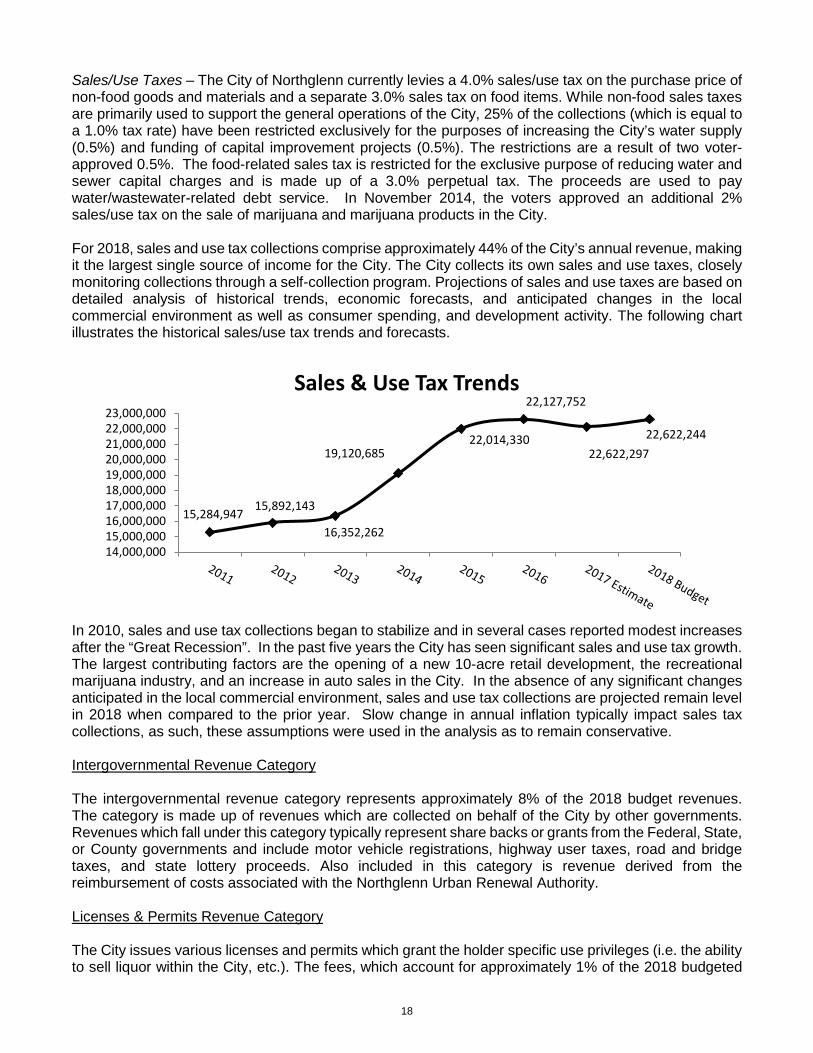
Sales/Use Taxes – The City of Northglenn currently levies a 4.0% sales/use tax on the purchase price of non-food goods and materials and a separate 3.0% sales tax on food items. While non-food sales taxes are primarily used to support the general operations of the City, 25% of the collections (which is equal to a 1.0% tax rate) have been restricted exclusively for the purposes of increasing the City’s water supply (0.5%) and funding of capital improvement projects (0.5%). The restrictions are a result of two voter-approved 0.5%. The food-related sales tax is restricted for the exclusive purpose of reducing water and sewer capital charges and is made up of a 3.0% perpetual tax. The proceeds are used to pay water/wastewater-related debt service. In November 2014, the voters approved an additional 2% sales/use tax on the sale of marijuana and marijuana products in the City. For 2018, sales and use tax collections comprise approximately 44% of the City’s annual revenue, making it the largest single source of income for the City. The City collects its own sales and use taxes, closely monitoring collections through a self-collection program. Projections of sales and use taxes are based on detailed analysis of historical trends, economic forecasts, and anticipated changes in the local commercial environment as well as consumer spending, and development activity. The following chart illustrates the historical sales/use tax trends and forecasts.
In 2010, sales and use tax collections began to stabilize and in several cases reported modest increases after the “Great Recession”. In the past five years the City has seen significant sales and use tax growth. The largest contributing factors are the opening of a new 10-acre retail development, the recreational marijuana industry, and an increase in auto sales in the City. In the absence of any significant changes anticipated in the local commercial environment, sales and use tax collections are projected remain level in 2018 when compared to the prior year. Slow change in annual inflation typically impact sales tax collections, as such, these assumptions were used in the analysis as to remain conservative. Intergovernmental Revenue Category The intergovernmental revenue category represents approximately 8% of the 2018 budget revenues. The category is made up of revenues which are collected on behalf of the City by other governments. Revenues which fall under this category typically represent share backs or grants from the Federal, State, or County governments and include motor vehicle registrations, highway user taxes, road and bridge taxes, and state lottery proceeds. Also included in this category is revenue derived from the reimbursement of costs associated with the Northglenn Urban Renewal Authority.
Licenses & Permits Revenue Category The City issues various licenses and permits which grant the holder specific use privileges (i.e. the ability to sell liquor within the City, etc.). The fees, which account for approximately 1% of the 2018 budgeted
15,284,947 15,892,143
16,352,262
19,120,685 22,014,330
22,622,297
22,127,752
22,622,244
14,000,00015,000,00016,000,00017,000,00018,000,00019,000,00020,000,00021,000,00022,000,00023,000,000
Sales & Use Tax Trends
18
revenues, are intended to offset some of the administration, recording, and regulation costs associated with those activities. Currently the City issues and collects fees for business and liquor licenses, as well as building, electrical, sign, special use, and park use permits. User Charges & Fees Revenue Category User charges and fees are intended to offset some or all of the costs associated with specific services provided to identifiable recipients. This revenue category represents approximately 33% of the 2018 organization-wide revenue, making it the second largest revenue category for the City. Approximately 81% of the dollars collected through user charges are associated with water, wastewater, and sanitation services. Due to the material nature of these revenue sources additional information has been provided below. Water Usage Charges – Charges for water services are based on a tiered rate structure and offset the operating costs associated with providing clean and safe drinking water to the City’s inhabitants. In 2018, the estimated collections associated with such services account for approximately 15% of the City’s total annual revenue. In 2009, City Council approved a rate increase as well as modified the tier structure of the water rates schedule. A rate increase of approximately 4.5% was approved for 2018. Subsequent increases, 3%-4.5% for 2019-2022, were also set by Ordinance by Council. Revenue forecasts are based on customer trends, changes to the rate structure, and estimates regarding annual precipitation. Sewer Usage Charges – The City currently provides wastewater utility services to its residents. Charges for wastewater services are based on scheduled rate structures and offset the operating costs associated with providing the services. In 2018, the estimated collections associated with these services comprise approximately 8% of the City’s total annual revenue. In 2017, City Council approved a rate increase and slight modification of the wastewater rate schedule of 9.75%, to begin in 2018. Just as with the water rates, sewer rates were also increased in 2018 to meet ongoing funding needs. Revenue forecasts closely match those of the water usage charges and are based on historical trends. Rate increases ranging from 8%-9.75% from 2019-2022 have been approved by Ordinance by the Council. Trash Collection Charges – The City provides sanitation utility services for its residents through garbage collection and recycling programs. Charges for trash collection services are based on a set rate structure intended to offset the operating costs associated with providing the service. In 2018, the forecasted trash collection charge represents almost 4% of the City’s annual revenue. Due to the nature of the service, revenue collections are relatively immune from external variables such as the local economy or weather. Customer trends and anticipated changes to the rate structure are used when forecasting future collections. In 2016, City Council approved a rate increase for trash collection.
19

The following chart illustrates and compares the historical water, wastewater, and sanitation collection trends and forecasts.
Fines & Forfeits Revenue Category Fines and forfeits include court costs, violation fines, and police surcharges and comprise approximately 2% of the City’s total 2018 anticipated revenue. The funds received are intended as a financial punishment for the commission of minor crimes, code violations, or the settlement of a claim. Monies are used to help offset the day-to-day operations of various patrolling, enforcement, and municipal court activities. Other Revenue Revenue sources categorized as other revenue include the investment earnings, miscellaneous reimbursements, and grants/contributions from local sources and account for less than 1% of the City’s total revenue.
2012 2013 2014 2015 2016 2017Estimate
2018Budget
Water Usage $6,774,645 5,707,221 5,890,045 6,575,064 $7,206,564 $7,579,378 $7,920,450Sewer Usage $3,231,099 3,223,103 3,333,269 3,630,574 $3,682,568 $3,624,785 $3,978,202Sanitation Collection $1,376,251 1,376,349 1,380,690 1,384,295 $1,384,953 $1,830,491 $1,830,491
0
750,000
1,500,000
2,250,000
3,000,000
3,750,000
4,500,000
5,250,000
6,000,000
6,750,000
7,500,000
8,250,000
9,000,000
Utility User Charges Trends
20

Expenditure Assessment City-Wide Expenditures In an effort to simplify financial reporting, the City of Northglenn has organized its expenditures into six categories: Personnel, Purchased Services, Supplies/Non-Capital Equipment, Capital Outlay, Miscellaneous, and Contingencies. The following table and chart illustrate the City’s total expenditures (all funds, not including Other Uses or internal fund transfers).
Expenditure Category
2016 Audited
Amounts
2017 Year-End Forecast
2018 Adopted Budget
Personnel $ 20,190,737 $ 21,229,940 $ 22,942,032 Purchased Services 6,460,796 5,880,908 6,055,830 Supplies/Non-Capital Equipment 4,205,813 4,282,562 4,385,750 Capital Outlay 12,020,104 25,002,053 26,240,308 Miscellaneous 252,731 312,816 229,174 Contingency - - 100,000
Total $ 43,130,181 $ 56,708,279 $ 59,953,094
The City controls operating costs while continuing to deliver services at their expected levels while focusing on increasing reinvestment within the community via capital improvement projects. The expenditure categories, as well as some of the more significant changes in spending authorization are discussed in more detail below. Personnel Category Salaries, wages, and benefits represent approximately 38% of the 2018 city-wide budgeted expenditures. The category includes all costs associated with personnel including regular and seasonal staff, payroll taxes, and all clothing, tool, or vehicle allowances. Significant changes for 2018 include:
Personnel38%
Purchased Services11%
Supplies/Non-Capital Equipment
8%
Capital Outlay43%Miscellaneous
<1%
Contingency<1%
Operating Expenditure Budget By Category
21
• The 2018 budget includes market adjustments for all positions which are considered below
current industry levels of 2%, as well as step increases for all sworn police personnel. The market, merit and step adjustments account for a city-wide increase of approximately $500,000.
• Medical benefit costs were increased nearly $207,445 to reflect a premium increase of 8.5%
associated with health insurance during the mid-year renewal process.
• Workers’ Compensation Insurance premiums increased 4%, or $15,000.
• 3.15 full-time equivalents (FTE) were added to the budget: 2 Utility Plant Operators; 1 Sanitation Worker; .15 various recreation staffing adjustments.
Purchased Services Category The purchased services category represents approximately 11% of the 2018 budgeted expenditures. This category is made up of expenditures which by their nature are performed by persons or firms external to the organization. While a product may or may not result from the transaction, the primary reason for the purchase is the service provided. Expenditures which fall under this category include administrative services, technical services, travel, training, repairs/maintenance, rentals/leases, and non-personnel related insurance premiums. Significant changes for 2018 include:
• The City’s 2014 Strategic Plan identified several key areas to study, evaluate, and update to assist in vitalizing the City. The Planning Department will undertake one-time projects of updating the zoning code, master planning a transit-oriented development area, and evaluating pedestrian mobility throughout the City. The total cost for these projects is estimated at $200,000.
Supplies/Non-Capital Equipment Category The supplies and non-capital equipment category accounts for about 8% of the 2018 budgeted expenditures. Expenditures in this category are for items that are consumed, worn out, or deteriorated through use, and do not meet the requirements of the City’s definition of capital assets. Supplies, natural gas, electricity, fuel, as well as non-capital equipment such as file cabinets, desks, and personal computers are included in this category. The category increased 2.4% from 2017 forecasted spending but is less than the 2017 Budget. Changes in 2018 include:
• 10% estimated decrease to gas and electric services. This decrease was based on historical averages and efficiencies from upgraded HVAC systems.
• 40% reduction of motor vehicle fuels budget due to historical analysis and future forecasts of fuel costs by the U.S. Energy Information Administration.
22

Capital Outlay Category The capital outlay category makes up close to 43% of the 2018 budgeted expenditures. This category includes capital assets and capital improvement projects such as the acquisition of land, water rights acquisitions, buildings construction/maintenance and other capital spending. Expenditures in this category tend to vary from year to year based on the needs of the organization and community. A listing of the planned capital asset purchases for 2018 is shown below:
Capital Equipment Item List
Item Description
2018 Adopted Budget
General Fund Server Replacement $ 15,000 Theater Clear Com System 12,000 Vehicle Replacement Unit #205-09 60,000 Vehicle Replacement Unit #211-10 75,000 Vehicle Replacement Unit #280-10 75,000 Vehicle Replacement Unit #291 35,000 City Hall Lighting 7,000 SQL Server 40,000 Street Sign Equipment 58,000 Streets Patch Truck 210,000
Subtotal 587,000 Water & Wastewater Fund Server Replacement 31,000 Dump Truck 275,000 Water Treatment Capital Equipment Program 200,000 Grinder Pump 25,000 Sewer Capital Equipment Program 200,000 Locate Truck w/ Valve Turner 65,000 Subtotal 796,000 Sanitation Fund High Pressure Washer 9,000 Vehicle Replacement 300,000
Loader attachment 16,000
Subtotal 325,000
City-Wide Total $ 1,708,000
At over $26 million, capital projects, including improvements, replacement, and construction of new assets have a significant one-time impact on the budget in 2018. The construction of a new Justice Center, design and architecture work on a new recreation facility, and park facility upgrades headline the capital spending. The Justice Center is financed through Certificates of Participation – paid for from a restricted revenue source of a ½% sales tax.
23

Additional detail regarding the capital improvement projects can be found in the “Capital Improvements” section of the budget document. On the project pages, there is information regarding on-going or one-time costs for the projects as well as information on the operational impact of the project. The categories are Positive or Negative. Positive means the project will improve or reduce future operational costs. Negative means the project will lead to future operational expenditures. Several projects are one-time expenditures and do not have an identifiable operational impact and are marked N/A. Miscellaneous Category The other expenditures category accounts for less than 1% of the 2018 budgeted expenditures. Expenditures in this category include dues and fees to professional organizations, as well as the community grants and contributions program. The grants and contributions program makes up a significant portion of this category and includes incentive programs such as those associated with the water conservation and education program, as well as a contribution to the Northglenn Historical Preservation Commission. This category changes each year based on the needs of the community and financial ability of the organization. Contingency Category The contingency category accounts for less than 1% of the 2018 expenditure budget. This category is provided for budget purposes only as actual expenditures are to be charged to the appropriate program and object classification. The allocation provides for unforeseen expenditures or overruns in other categories throughout the year.
Other Sources/Uses Interfund Transfers In order to accommodate the changing needs of the community, the City is often required to transfer non-restricted revenues from one fund to another. In 2018, the General Fund will transfer $1,700,000 to the Capital Projects Fund to ensure fund availability for the construction of the recreation center. Debt Proceeds & Payments Colorado State Statute limits the total amount of General Obligation debt to three percent of the actual value of the taxable property within the City, as determined by the County Assessor. The City’s current legal debt limit and debt margin are as follows:
Calculation of Legal Debt Limit & Debt Margin
2017 Actual Value $ 3,797,292,948
Debt Limit – 3% of Net Assessed Value 113,918,788
Outstanding Debt Applicable to Debt Limit -
Debt Margin $ 113,918,788
24

While the City currently does not carry any debt which is applicable to the debt limit, other obligations do exist. The following tables highlight the City’s current debt obligations as identified in the 2018 budget:
As of December 31, 2017 2018 Activity
Outstanding
Interest Principal Balance
Interest Payment
Principal Payments
Ending Balance
Maturity Date
2013 Standley Reservoir Certificates of Participation $ 286,590 $ 4,600,000 $ 94,300 $ 885,000 $ 3,907,290 12/01/22 2017 Justice Center Certificates of Participation $ 8,893,444 $ 18,930,000 $ 828,919 $ 635,000 $ 27,823,444 12/01/36 Total $ 9,180,034 $ 23,530,000 $ 923,219 $ 1,520,000 $ 31,730,734
Given the fund balance and debt positions of the City, long-term financial planning discussions have remained project specific. There are significant capital expenditures in the 2018 budget for roads projects that will be cash funded. COPs were issued to finance approximately $20 million of the Justice Center project in the spring of 2017. Long-term financing of wastewater projects is planned beginning in 2019. The rate increase to utility fees in 2018 is the first step in the financing process. A debt issuance for the recreation center project is scheduled for 2019. This financing will require the on-going transfer from the General Fund of $1.7 million. Economic Incentives Economic development is imperative to establishing and maintaining a sustainable local economy. As such, the City of Northglenn provides economic incentives (often in the form of sales tax rebates) to attract development and/or redevelopment by private enterprise with the intent to provide beneficial impacts on the local economy and enhance the services and products available to citizens. Awards & Claims The City currently operates under a $25,000 and a $100,000 per incident deductible for property and liability insurance respectively. Based on historical trending, an estimate of $125,000 has been included in the budget document.
Fund Balance Analysis
Changes in Fund Balance Following sound financial management, the City confines the use of fund balance to items which are commonly regarded as one-time or limited-duration expenditures. By maintaining appropriate fund balances in each of its funds, the City is able to adapt to changing market conditions, take advantage of unforeseen opportunities, and maintain adequate cash balances given the cyclical nature of the local retail economy. In addition, several of the City’s funds are designed to accumulate fund balances in order to finance future projects and/or purchases. In 2018, the city-wide fund balance is anticipated to decrease approximately 17% or $11,415,275. A listing of changes in fund balances for fiscal year 2018 is presented below:
25

2018 Beginning Fund Balance
2018 Revenues &
Other Sources
2018 Expenditures & Other Uses
2018 Surplus/ (Deficit)
2018 Projected Ending Fund
Balance General Fund $ 22,091,342 $ 26,844,346 $ 26,460,491 $ 383,855 $ 22,475,197 Conservation Trust Fund 1,283,245 440,060 1,546,000 (1,105,940) 177,305 CDBG Fund - - - - - Capital Projects Fund 30,573,042 7,653,162 19,652,004 (11,998,842) 18,574,200 Water & Wastewater Fund 12,708,813 15,914,519 15,060,493 854,026 13,562,839 Stormwater Fund 48,921 465,685 365,443 100,242 149,163 Sanitation Fund 1,485,303 1,923,266 1,571,882 351,384 1,836,687 Total $ 68,190,666 $ 53,241,038 $ 64,656,313 $ (11,415,275) $ 56,775,391
General Fund – Fund balance is anticipated to increase by 2%. The General Fund is responsible for supporting the majority of the ongoing operating costs of the government. Conservation Trust Fund – Fund balance is expected to decrease by approximately 86%. CDBG Fund – As a reimbursable grant fund, the CDBG fund’s fund balance is expected to remain unchanged. This is due to the nature of the fund which is intended to receive reimbursement for all qualified expenditures made throughout the course of the year. Capital Projects Fund – Fund balance is forecasted to decrease by 39%. The fund accounts for revenue sources restricted for capital improvement such as sales tax shared by Adams County for open space and transportation projects. Fund balances are often accumulated over a period of time and spent on planned future projects. Water & Wastewater Fund – Fund balance is anticipated to increase approximately 7%. The decrease in fund balance is due the building of a new Headworks and Clarifier and budgeted reserve expenditures for water right acquisition. Stormwater Fund – Fund balance is expected to increase by 200%. Sanitation Fund – Fund balance is anticipated to increase 24%. Fund Balance Restrictions, Commitments, & Assignments Due to limitations placed on the purposes for which all or portions of the City’s financial resources may be used, it is necessary to classify various components of fund balance. The components are developed in such a manner as to identify the extent to which the City is bound to the constraints and specific purposes for which amounts in the fund can be spent. Restricted Fund Balance – Describes the portion of fund balance which reflects resources that are subject to externally enforceable legal restrictions. Such restrictions are typically imposed by parties outside of the City. Examples include the 3% emergency reserve established by the Taxpayers’ Bill of Rights (TABOR). Committed Fund Balance – Describes the portion of fund balance which represents resources that are constrained by self-imposed limitations. Commitments of this type are made at the highest level of decision-making (normally the governing body) and can only be removed in the same manner. Examples include the 25% minimum operating reserve in the General Fund. Assigned Fund Balance – Describes the portion of fund balance which reflects the governments intended use of resources. Assignments are often made by the governing body, committee, or executive of the organization.
26

Unassigned Fund Balance – If funds are not restricted, committed, or assigned, they could not properly be reported in a fund other that the General Fund. Therefore, only the General Fund can technically report a positive amount of unassigned fund balance. However, to simplify the decision-making process and fund summary statements within the budget document, each fund reports an unassigned fund balance. It is important to note that resources deemed “unassigned” in the statements other than those reported in the General Fund are in fact assigned in conjunction with the overall, non-specific purposes of the funds themselves.
2018 Beginning Fund Balance
2018 Revenues &
Other Sources
2018 Expenditures & Other Uses
2012 Restrictions,
Commitments, & Assignments
2018 Unassigned Fund Balance
General Fund $ 22,091,342 $ 26,844,346 $ 26,460,491 $ 6,615,123 $ 15,860,074
Conservation Trust Fund 1,283,245 440,060 1,546,000 - 177,305
CDBG Fund - - - - -
Capital Projects Fund 30,573,042 7,653,162 19,652,004 9,989,800 8,584,400
Water & Wastewater Fund 12,708,813 15,914,519 15,060,493 10,383,433 3,179,406
Stormwater Fund 48,921 465,685 365,443 - 149,163
Sanitation Fund 1,485,303 1,923,266 1,571,882 - 1,836,687
Total $ 68,190,666 $ 53,241,038 $ 64,656,313 $ 26,988,356 $ 29,787,035 I would like to recognize and thank City staff for their work and commitment to the 2018 budget. I also want to express my appreciation to the City Council for their vision and leadership throughout the budget process. Respectfully Submitted,
James A. Hayes, AICP City Manager
27
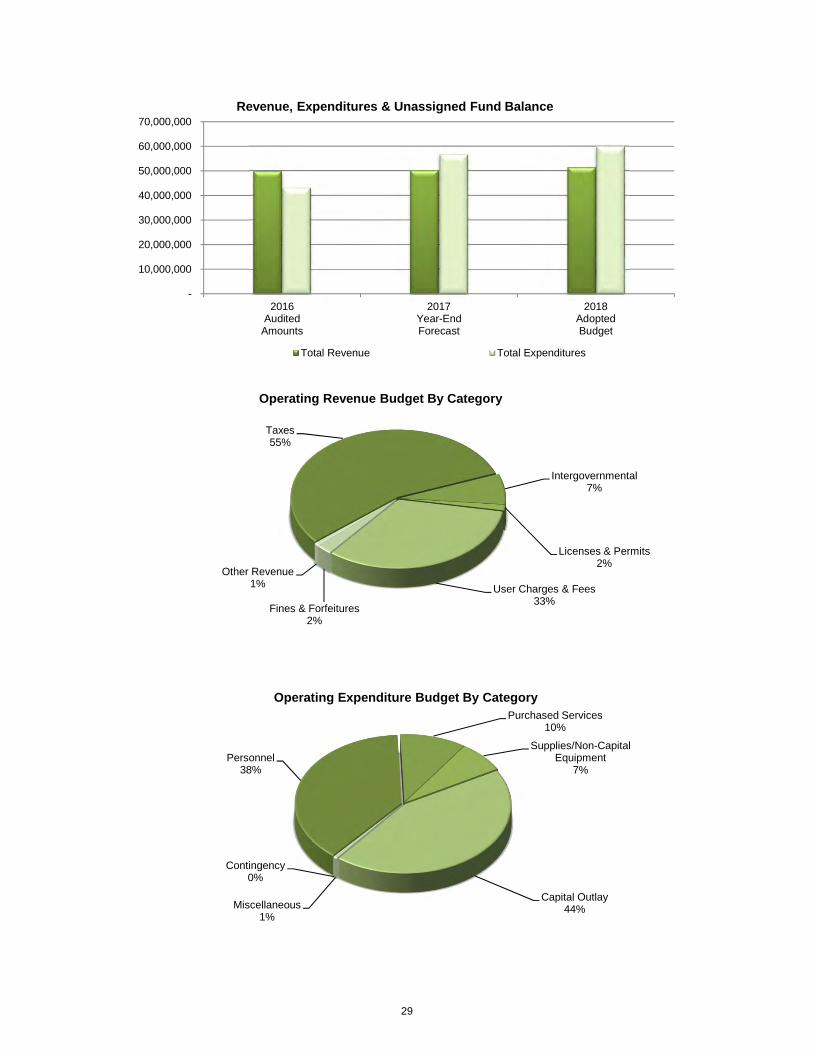
2016Audited
Amounts
2017AdoptedBudget
2017Year-EndForecast
2018AdoptedBudget
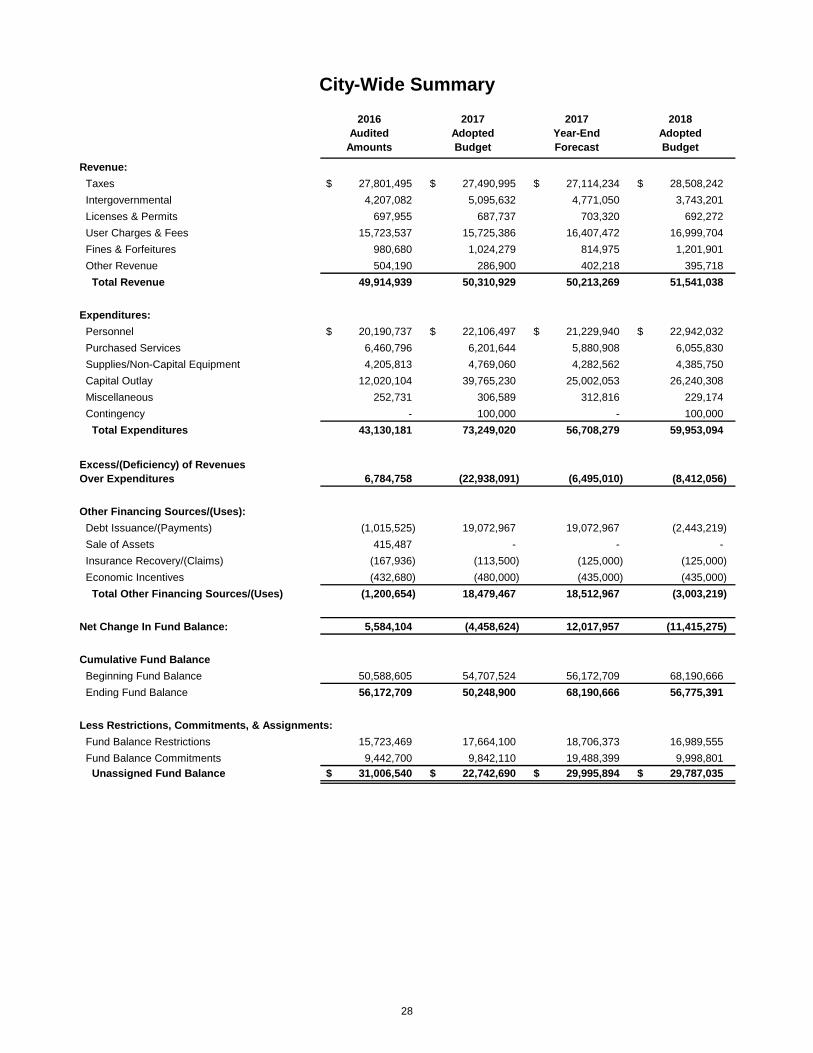
Revenue:Taxes 27,801,495$ 27,490,995$ 27,114,234$ 28,508,242$ Intergovernmental 4,207,082 5,095,632 4,771,050 3,743,201 Licenses & Permits 697,955 687,737 703,320 692,272 User Charges & Fees 15,723,537 15,725,386 16,407,472 16,999,704 Fines & Forfeitures 980,680 1,024,279 814,975 1,201,901 Other Revenue 504,190 286,900 402,218 395,718
Total Revenue 49,914,939 50,310,929 50,213,269 51,541,038
Expenditures:Personnel 20,190,737$ 22,106,497$ 21,229,940$ 22,942,032$ Purchased Services 6,460,796 6,201,644 5,880,908 6,055,830 Supplies/Non-Capital Equipment 4,205,813 4,769,060 4,282,562 4,385,750 Capital Outlay 12,020,104 39,765,230 25,002,053 26,240,308 Miscellaneous 252,731 306,589 312,816 229,174 Contingency - 100,000 - 100,000
Total Expenditures 43,130,181 73,249,020 56,708,279 59,953,094
6,784,758 (22,938,091) (6,495,010) (8,412,056)
Other Financing Sources/(Uses):Debt Issuance/(Payments) (1,015,525) 19,072,967 19,072,967 (2,443,219) Sale of Assets 415,487 - - - Insurance Recovery/(Claims) (167,936) (113,500) (125,000) (125,000) Economic Incentives (432,680) (480,000) (435,000) (435,000)
Total Other Financing Sources/(Uses) (1,200,654) 18,479,467 18,512,967 (3,003,219)
Net Change In Fund Balance: 5,584,104 (4,458,624) 12,017,957 (11,415,275)
Cumulative Fund BalanceBeginning Fund Balance 50,588,605 54,707,524 56,172,709 68,190,666 Ending Fund Balance 56,172,709 50,248,900 68,190,666 56,775,391
Less Restrictions, Commitments, & Assignments:Fund Balance Restrictions 15,723,469 17,664,100 18,706,373 16,989,555 Fund Balance Commitments 9,442,700 9,842,110 19,488,399 9,998,801
Unassigned Fund Balance 31,006,540$ 22,742,690$ 29,995,894$ 29,787,035$
City-Wide Summary
Excess/(Deficiency) of RevenuesOver Expenditures
28
-
10,000,000
20,000,000
30,000,000
40,000,000
50,000,000
60,000,000
70,000,000
2016Audited
Amounts
2017Year-EndForecast
2018AdoptedBudget
Revenue, Expenditures & Unassigned Fund Balance
Total Revenue Total Expenditures
Taxes55%
Intergovernmental7%
Licenses & Permits2%
User Charges & Fees33%
Fines & Forfeitures2%
Other Revenue1%
Operating Revenue Budget By Category
Personnel38%
Purchased Services10%
Supplies/Non-Capital Equipment
7%
Capital Outlay44%Miscellaneous
1%
Contingency0%
Operating Expenditure Budget By Category
29

2016Audited
Amounts
2017AdoptedBudget
2017Year-EndForecast
2018AdoptedBudget
TaxesProperty Tax 3,121,745 3,103,366 3,134,512 4,011,063 Penalties & Interest 3,861 4,000 4,107 4,000 Specific Ownership Tax 275,735 284,199 300,401 304,907 Sales Tax 18,168,402 17,884,533 17,969,532 18,418,771 Marijuana Sales Tax 536,778 589,015 549,567 563,306 Food Sales Tax 1,503,266 1,654,314 991,804 1,001,722 Penalties & Interest 47,243 50,000 53,000 53,000 Use Tax 2,943,429 3,083,450 3,166,416 3,201,751 Building Materials Use Tax 665,931 525,414 568,267 570,027 Audit Transactions 246,023 45,000 110,000 110,000 Accommodations Tax 225,242 205,544 204,468 207,535 Occupational Tax 63,840 62,160 62,160 62,160
Total Taxes 27,801,495 27,490,995 27,114,234 28,508,242
IntergovernmentalNURA IGA 250,000 250,000 250,000 250,000 School Resource Officers 112,236 109,246 112,236 115,603 North Metro Task Force - 6,000 3,000 3,000 Traffic Light IGA 2,433 2,000 2,000 2,000 Berthoud Pass IGA - 3,500 2,500 3,500 Open Space Tax 323,614 380,265 333,600 333,600 DUI Proceeds 37,322 36,090 36,000 36,090 Uninsured Motorist Revenue 2,331 2,005 2,000 2,005 Seat Belt Violations 520 501 500 501 Drug Surcharge 732 982 1,717 1,721 Transportation Tax 880,640 1,070,086 935,100 935,100 Road & Bridge Tax 174,884 177,649 181,382 181,835 Motor Vehicle Registration 125,091 127,081 125,931 126,246 Tobacco Tax 79,292 83,117 68,571 68,742 Severance Tax 32,299 70,175 32,299 32,380 Mineral Lease Proceeds 39,453 50,125 38,453 39,552 Lottery Proceeds 430,861 368,000 425,912 436,560 Highway Users Tax 1,022,117 1,066,921 1,052,158 1,104,766 County Grants 396,586 60,000 60,000 - State Grants 173,029 728,000 758,000 - Federal Grants 123,642 503,889 349,691 70,000
Total Intergovernmental 4,207,082 5,095,632 4,771,050 3,743,201
Licenses & PermitsSales/Use Tax Licenses 40,715 39,000 40,000 40,000 Contractor Licenses 43,274 43,469 40,605 40,605 Liquor/Marijuana Licenses 33,996 40,000 36,000 36,000 Pawn Shop Licenses 13,000 31,000 15,000 15,000 Amusement Licenses 10,500 11,000 11,000 11,000 Peddlers Licenses 750 200 750 750 Building Permits 283,510 261,000 288,000 273,600 Electrical Permits 44,774 38,068 43,000 43,000 ROW Construction Permits 96,977 110,000 107,816 105,660 Sign Permits 10,890 11,000 11,000 11,000 Park Use Permits 119,569 103,000 110,149 115,657
Total Licenses & Permits 697,955 687,737 703,320 692,272
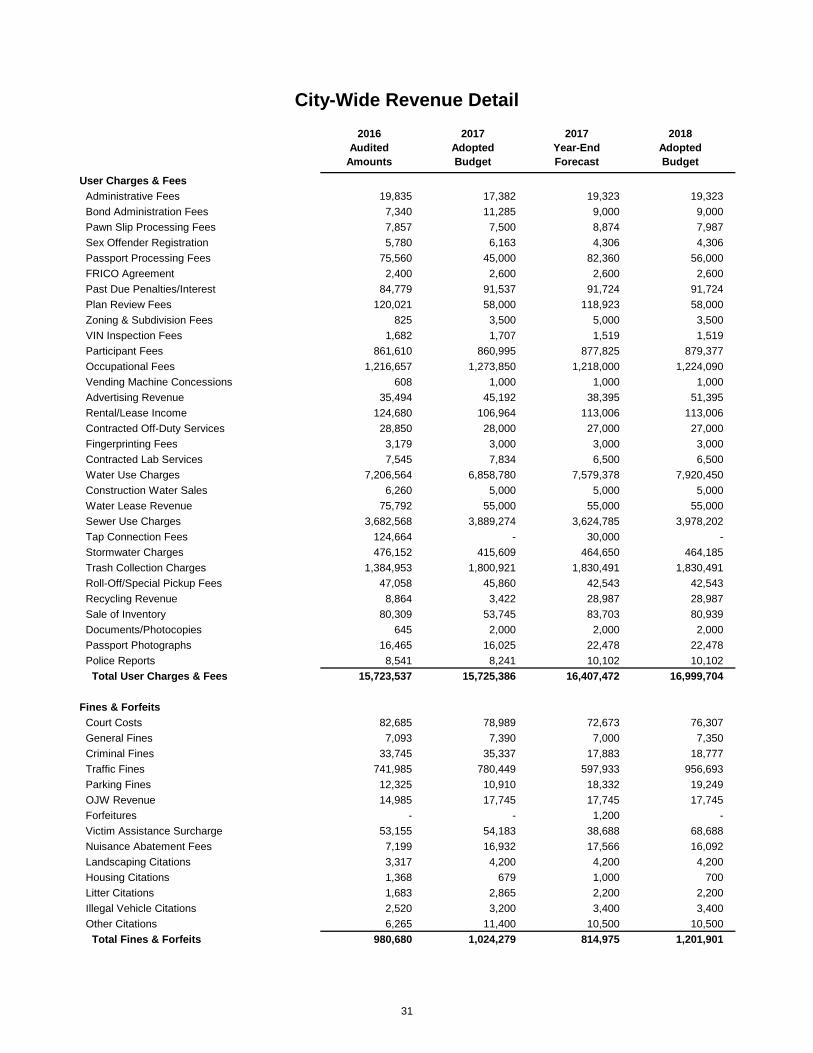
City-Wide Revenue Detail
30
2016Audited
Amounts
2017AdoptedBudget
2017Year-EndForecast
2018AdoptedBudget
User Charges & FeesAdministrative Fees 19,835 17,382 19,323 19,323Bond Administration Fees 7,340 11,285 9,000 9,000Pawn Slip Processing Fees 7,857 7,500 8,874 7,987Sex Offender Registration 5,780 6,163 4,306 4,306Passport Processing Fees 75,560 45,000 82,360 56,000FRICO Agreement 2,400 2,600 2,600 2,600Past Due Penalties/Interest 84,779 91,537 91,724 91,724Plan Review Fees 120,021 58,000 118,923 58,000Zoning & Subdivision Fees 825 3,500 5,000 3,500VIN Inspection Fees 1,682 1,707 1,519 1,519Participant Fees 861,610 860,995 877,825 879,377Occupational Fees 1,216,657 1,273,850 1,218,000 1,224,090 Vending Machine Concessions 608 1,000 1,000 1,000Advertising Revenue 35,494 45,192 38,395 51,395Rental/Lease Income 124,680 106,964 113,006 113,006Contracted Off-Duty Services 28,850 28,000 27,000 27,000Fingerprinting Fees 3,179 3,000 3,000 3,000Contracted Lab Services 7,545 7,834 6,500 6,500Water Use Charges 7,206,564 6,858,780 7,579,378 7,920,450 Construction Water Sales 6,260 5,000 5,000 5,000Water Lease Revenue 75,792 55,000 55,000 55,000Sewer Use Charges 3,682,568 3,889,274 3,624,785 3,978,202 Tap Connection Fees 124,664 - 30,000 - Stormwater Charges 476,152 415,609 464,650 464,185Trash Collection Charges 1,384,953 1,800,921 1,830,491 1,830,491 Roll-Off/Special Pickup Fees 47,058 45,860 42,543 42,543Recycling Revenue 8,864 3,422 28,987 28,987Sale of Inventory 80,309 53,745 83,703 80,939Documents/Photocopies 645 2,000 2,000 2,000Passport Photographs 16,465 16,025 22,478 22,478Police Reports 8,541 8,241 10,102 10,102
Total User Charges & Fees 15,723,537 15,725,386 16,407,472 16,999,704
Fines & ForfeitsCourt Costs 82,685 78,989 72,673 76,307General Fines 7,093 7,390 7,000 7,350Criminal Fines 33,745 35,337 17,883 18,777Traffic Fines 741,985 780,449 597,933 956,693Parking Fines 12,325 10,910 18,332 19,249OJW Revenue 14,985 17,745 17,745 17,745Forfeitures - - 1,200 - Victim Assistance Surcharge 53,155 54,183 38,688 68,688Nuisance Abatement Fees 7,199 16,932 17,566 16,092Landscaping Citations 3,317 4,200 4,200 4,200Housing Citations 1,368 679 1,000 700Litter Citations 1,683 2,865 2,200 2,200Illegal Vehicle Citations 2,520 3,200 3,400 3,400Other Citations 6,265 11,400 10,500 10,500
Total Fines & Forfeits 980,680 1,024,279 814,975 1,201,901
City-Wide Revenue Detail
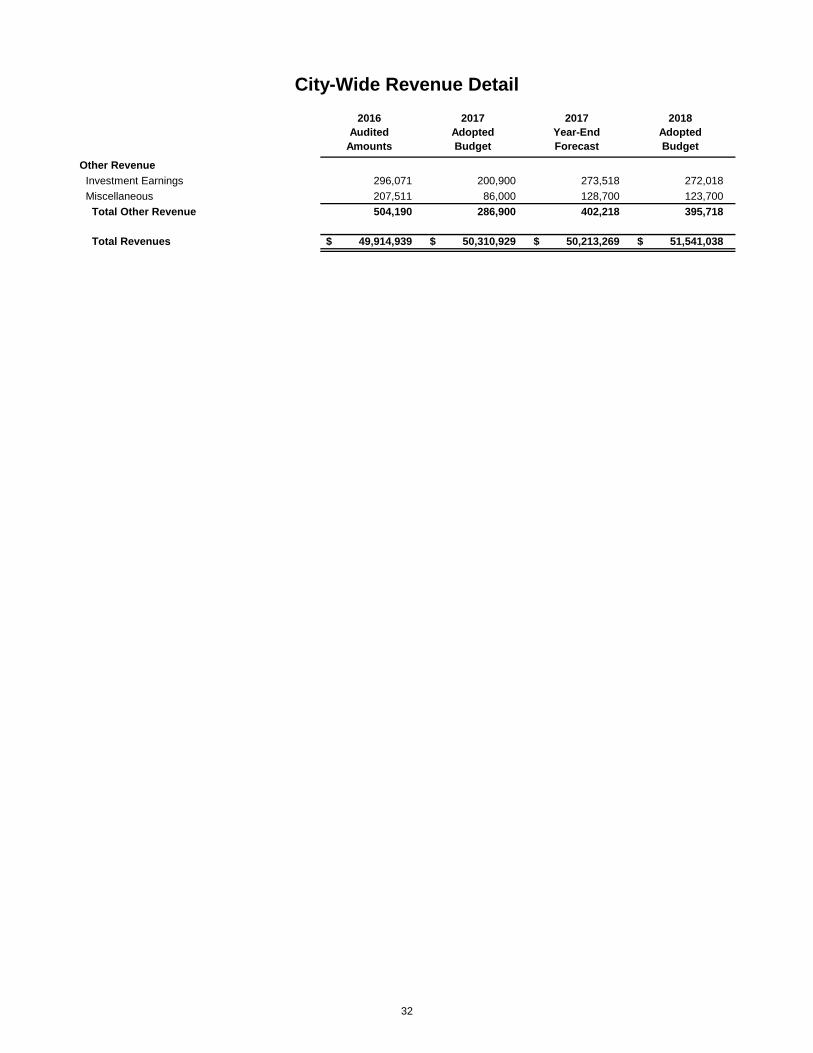
31
2016Audited
Amounts
2017AdoptedBudget
2017Year-EndForecast
2018AdoptedBudget
Other RevenueInvestment Earnings 296,071 200,900 273,518 272,018Miscellaneous 207,511 86,000 128,700 123,700
Total Other Revenue 504,190 286,900 402,218 395,718
Total Revenues 49,914,939$ 50,310,929$ 50,213,269$ 51,541,038$
City-Wide Revenue Detail
32

2016Audited
Amounts
2017AdoptedBudget
2017Year-EndForecast
2018AdoptedBudget
PersonnelRegular Wages 15,138,771 16,472,395 15,616,403 16,960,842 Seasonal/Temporary Wages 235,137 238,459 238,700 244,671 Overtime 505,542 378,755 498,261 436,400 Allowances 128,972 127,964 133,473 130,056 Medicare 210,563 242,168 213,387 248,809 Unemployment Insurance 34,832 30,000 - 25,000 Workers Compensation 302,212 371,875 328,887 383,703 Retirement Contributions 1,330,570 1,480,130 1,376,489 1,531,173 Medical Benefits 2,101,417 2,509,033 2,598,466 2,716,587 Life/Disability Benefits 171,915 227,718 194,231 236,791 Post-Employment Benefits 30,806 28,000 31,643 28,000
Total Personnel 20,190,737 22,106,497 21,229,940 22,942,032
Purchased ServicesProfessional Services 1,791,611 1,799,037 1,526,046 1,345,930 Technical Services 760,543 524,561 478,243 712,561 General Services 415,512 422,569 451,594 442,629 Property Services 1,824,807 1,546,667 1,543,199 1,670,942 Repair/Maintenance Services (105) 32,500 - - Communication Services 1,117,299 1,144,012 1,145,291 1,147,552 Internet Services 8,497 9,600 9,200 9,200 Training/Registration 133,322 280,364 287,869 269,664 Mileage/Travel 31,397 19,935 17,985 18,835 Rentals/Leases 88,901 100,290 100,537 106,745 Insurance Premiums 289,012 322,109 320,944 331,772
Total Purchased Services 6,460,796 6,201,644 5,880,908 6,055,830
Supplies/Non-Capital EquipmentOffice Supplies 61,012 57,713 59,013 58,613 Technology Supplies 69,987 119,300 117,540 88,400 Operating Supplies 1,587,520 1,609,836 1,609,327 1,633,436 Chemicals/Compounds 497,633 350,000 354,333 350,000 Maintenance Supplies 7,579 - - - Inventory Supplies 44,346 87,500 87,500 87,500 Uniforms/Clothing 19,568 19,100 19,100 19,100 Non-Capital Equipment 254,299 272,700 276,728 275,200 Gas/Electricity 1,477,272 1,858,211 1,535,956 1,634,820 Motor Vehicle Fuels 186,597 394,700 223,065 238,681
Total Supplies/Non-Capital Equipment 4,205,813 4,769,060 4,282,562 4,385,750
Capital OutlayProperty/Rights - 2,250,000 1,000,000 1,000,000 Capital Equipment 1,950,759 923,000 1,020,000 1,701,000 Capital Improvement Projects 10,069,345 36,592,230 22,982,053 23,539,308
Total Capital Outlay 12,020,104 39,765,230 25,002,053 26,240,308
City-Wide Expenditure Detail
33

2016Audited
Amounts
2017AdoptedBudget
2017Year-EndForecast
2018AdoptedBudget
MiscellaneousDues/Fees 102,963 110,864 107,203 103,674 Grants/Donations 126,774 170,000 180,000 95,000 Community Incentive 21,886 25,000 25,113 30,000 Bad Debt Expense 1,108 725 500 500
Total Other Expenditures 252,731 306,589 312,816 229,174
ContingencyContingency - 100,000 - 100,000
Total Contingency - 100,000 - 100,000
Total Expenditures 43,130,181$ 73,249,020$ 56,708,279$ 59,953,094$
City-Wide Expenditure Detail
34

35

2016Audited
Amounts
2017AdoptedBudget
2017Year-EndForecast
2018AdoptedBudget
Revenue:Taxes 18,767,774$ 19,345,470$ 19,188,125$ 20,132,560$ Intergovernmental 2,162,132 2,280,434 2,080,591 2,034,441 Licenses & Permits 697,955 672,737 703,320 692,272 User Charges & Fees 2,580,488 2,517,741 2,613,552 2,543,454 Fines & Forfeitures 980,680 1,024,279 814,975 1,201,901 Other Revenue 257,741 139,400 239,718 239,718
Total Revenue 25,446,770 25,980,061 25,640,281 26,844,346
Expenditures:Personnel 15,119,477$ 16,699,323$ 16,026,015$ 17,223,915$ Purchased Services 3,506,205 3,910,442 3,769,750 3,768,879 Supplies/Non-Capital Equipment 2,134,548 2,501,665 2,281,905 2,335,873 Capital Outlay 831,543 172,000 169,000 580,000 Miscellaneous 223,330 274,739 280,736 191,824 Contingency - 100,000 - 100,000
Total Expenditures 21,815,103 23,658,169 22,527,406 24,200,491
3,631,667 2,321,892 3,112,875 2,643,855
Other Financing Sources/(Uses):Transfers In/(Out) (1,700,000) (1,700,000) (1,700,000) (1,700,000) Sale of Assets 327,554 - - - Insurance Recovery/(Claims) (167,778) (100,000) (125,000) (125,000) Economic Incentives (432,680) (480,000) (435,000) (435,000)
Total Other Financing Sources/(Uses) (1,972,904) (2,280,000) (2,260,000) (2,260,000)
Net Change In Fund Balance: 1,658,763 41,892 852,875 383,855
Cumulative Fund BalanceBeginning Fund Balance 19,579,704 18,282,321 21,238,467 22,091,342 Ending Fund Balance 21,238,467 18,324,213 22,091,342 22,475,197
Less Restrictions, Commitments, & Assignments:3% TABOR Reserve Restriction 712,403 778,145 743,622 793,815 Operating Reserve Commitment 5,234,599 5,706,397 5,453,230 5,821,308
Unassigned Fund Balance 15,291,465$ 11,839,671$ 15,894,490$ 15,860,074$
General Fund Summary
Excess/(Deficiency) of RevenuesOver Expenditures
36

-
5,000,000
10,000,000
15,000,000
20,000,000
25,000,000
30,000,000
2016Audited
Amounts
2017Year-EndForecast
2018AdoptedBudget
Revenue, Expenditures & Unassigned Fund Balance
Total Revenue Total Expenditures Unassigned Fund Balance
Taxes75%
Intergovernmental8%
Licenses & Permits3%
User Charges & Fees9%
Fines & Forfeitures4%Other Revenue
<1%
Operating Revenue Budget By Category
Personnel71%
Purchased Services16%
Supplies/Non-Capital Equipment
10%
Capital Outlay2%
Miscellaneous1%Contingency
<1%
Operating Expenditure Budget By Category
37
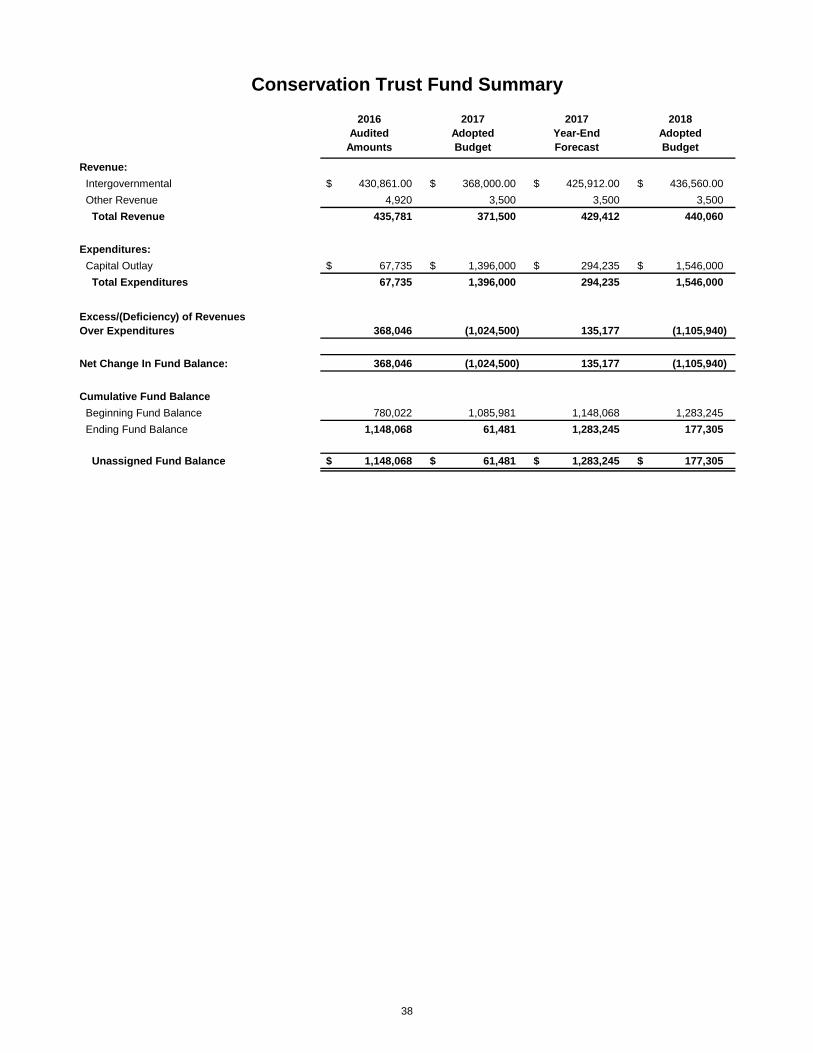
2016Audited
Amounts
2017AdoptedBudget
2017Year-EndForecast
2018AdoptedBudget
Revenue:Intergovernmental 430,861.00$ 368,000.00$ 425,912.00$ 436,560.00$ Other Revenue 4,920 3,500 3,500 3,500
Total Revenue 435,781 371,500 429,412 440,060
Expenditures:Capital Outlay 67,735$ 1,396,000$ 294,235$ 1,546,000$
Total Expenditures 67,735 1,396,000 294,235 1,546,000
368,046 (1,024,500) 135,177 (1,105,940)
Net Change In Fund Balance: 368,046 (1,024,500) 135,177 (1,105,940)
Cumulative Fund BalanceBeginning Fund Balance 780,022 1,085,981 1,148,068 1,283,245 Ending Fund Balance 1,148,068 61,481 1,283,245 177,305
Unassigned Fund Balance 1,148,068$ 61,481$ 1,283,245$ 177,305$
Conservation Trust Fund Summary
Excess/(Deficiency) of RevenuesOver Expenditures
38
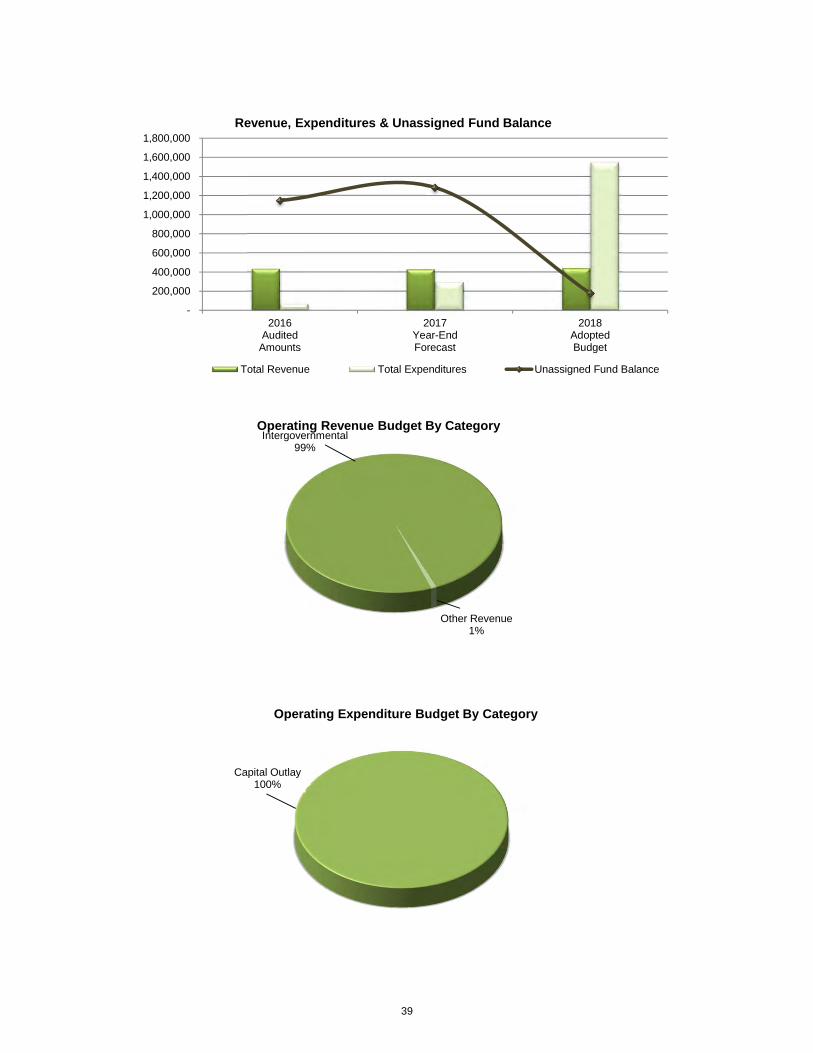
-
200,000
400,000
600,000
800,000
1,000,000
1,200,000
1,400,000
1,600,000
1,800,000
2016Audited
Amounts
2017Year-EndForecast
2018AdoptedBudget
Revenue, Expenditures & Unassigned Fund Balance
Total Revenue Total Expenditures Unassigned Fund Balance
Intergovernmental99%
Other Revenue1%
Operating Revenue Budget By Category
Capital Outlay100%
Operating Expenditure Budget By Category
39

2016Audited
Amounts
2017AdoptedBudget
2017Year-EndForecast
2018AdoptedBudget
Revenue:Intergovernmental 13,249$ 205,347$ 205,347$ -$
Total Revenue 13,249 205,347 205,347 -
Expenditures:Capital Outlay 13,249$ 205,347$ 205,347$ -$
Total Expenditures 13,249 205,347 205,347 -
- - - -
Net Change In Fund Balance: - - - -
Cumulative Fund BalanceBeginning Fund Balance - - - - Ending Fund Balance - - - -
Unassigned Fund Balance -$ -$ -$ -$
CDBG Fund Summary
Excess/(Deficiency) of RevenuesOver Expenditures
40

-
50,000
100,000
150,000
200,000
250,000
2016Audited
Amounts
2017Year-EndForecast
2018AdoptedBudget
Revenue, Expenditures & Unassigned Fund Balance
Total Revenue Total Expenditures Unassigned Fund Balance
41

2016Audited
Amounts
2017AdoptedBudget
2017Year-EndForecast
2018AdoptedBudget
Revenue:Taxes 4,303,745$ 4,363,311$ 4,227,423$ 4,604,462$ Intergovernmental 1,600,840 2,238,351 2,056,700 1,268,700 Other Revenue 117,083 60,000 80,000 80,000
Total Revenue 6,021,668 6,661,662 6,364,123 5,953,162
Expenditures:Supplies/Non-Capital Equipment 9,257$ -$ -$ -$ Capital Outlay 2,955,963 26,937,321 14,635,348 18,188,085
Total Expenditures 2,965,220 26,937,321 14,635,348 18,188,085
3,056,448 (20,275,659) (8,271,225) (12,234,923)
Other Financing Sources/(Uses):Transfers In/(Out) 1,700,000 1,700,000 1,700,000 1,700,000 Debt Issuance/(Payments) - 20,050,000 20,050,000 (1,463,919)
Total Other Financing Sources/(Uses) 1,700,000 21,750,000 21,750,000 236,081
Net Change In Fund Balance: 4,756,448 1,474,341 13,478,775 (11,998,842)
Cumulative Fund BalanceBeginning Fund Balance 12,337,819 16,127,031 17,094,267 30,573,042 Ending Fund Balance 17,094,267 17,601,372 30,573,042 18,574,200
Less Restrictions, Commitments, & Assignments:4.000 Mill Restricted Fund Balance (1,384,156) (1,028,995) (463,010) 920,473 1/2% Sales/Use Tax Restricted Balance 12,134,376 11,667,667 12,304,004 7,947,758 Marijuana Sales Tax Restricted Balance 1,021,382 1,648,268 1,570,949 2,134,255 ADCOO Restricted Fund Balance 575,020 98,215 448,995 32,595 ADCOT Restricted Fund Balance 989,167 1,238,860 1,346,789 1,088,974 Debt Restricted Fund Balance - - 10,020,445 -
Unassigned Fund Balance 3,758,478$ 3,977,357$ 5,344,870$ 6,450,145$
Capital Projects Fund Summary
Excess/(Deficiency) of RevenuesOver Expenditures
42
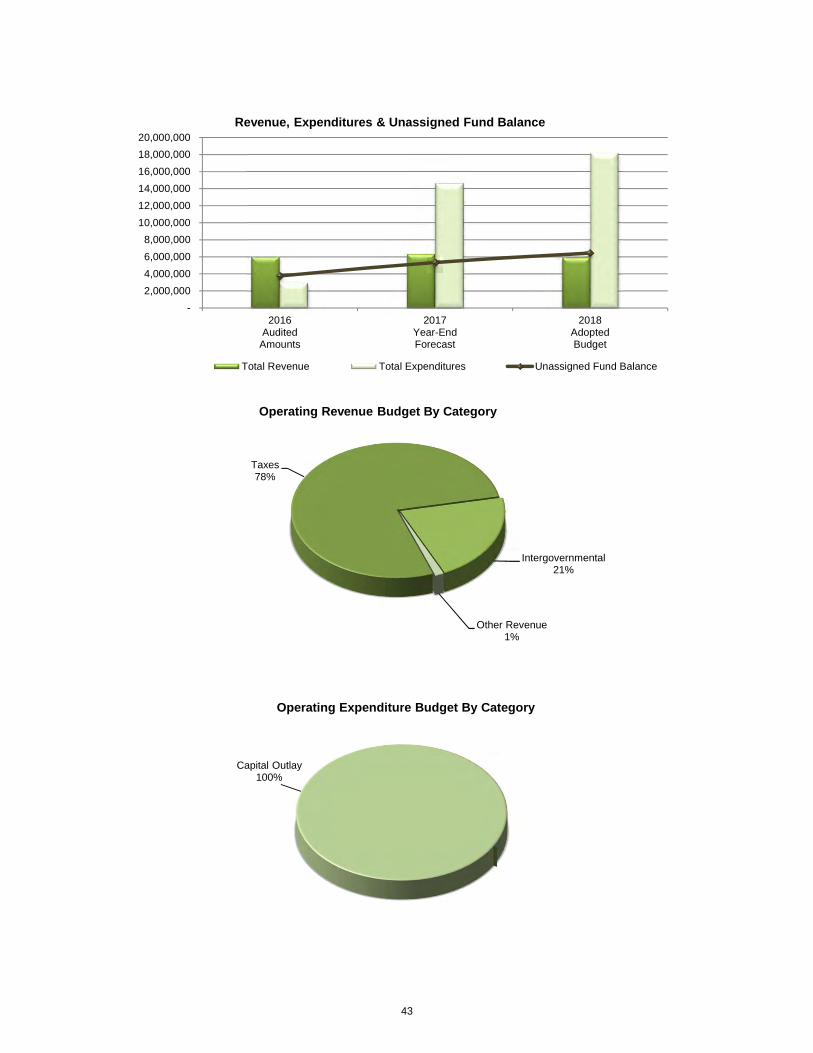
- 2,000,000 4,000,000 6,000,000 8,000,000
10,000,000 12,000,000 14,000,000 16,000,000 18,000,000 20,000,000
2016AuditedAmounts
2017Year-EndForecast
2018AdoptedBudget
Revenue, Expenditures & Unassigned Fund Balance
Total Revenue Total Expenditures Unassigned Fund Balance
Taxes78%
Intergovernmental21%
Other Revenue1%
Operating Revenue Budget By Category
Capital Outlay100%
Operating Expenditure Budget By Category
43

2016Audited
Amounts
2017AdoptedBudget
2017Year-EndForecast
2018AdoptedBudget
Revenue:4.000 Mill Property Tax 1,077,002$ 1,050,000$ 1,081,146$ 1,383,483$
Total Revenue 1,077,002 1,050,000 1,081,146 1,383,483
Expenditures:Road Reconstruction Improvements 625,518$ 125,000$ 160,000$ -$
Total Expenditures 625,518 125,000 160,000 -
451,484 925,000 921,146 1,383,483
Net Change In Fund Balance: 451,484 925,000 921,146 1,383,483
Cumulative Fund BalanceBeginning Fund Balance (1,835,640) (1,953,995) (1,384,156) (463,010) Ending Fund Balance (1,384,156)$ (1,028,995)$ (463,010)$ 920,473$
4.000 Mill Property Tax Restricted Revenue
Excess/(Deficiency) of RevenuesOver Expenditures
44
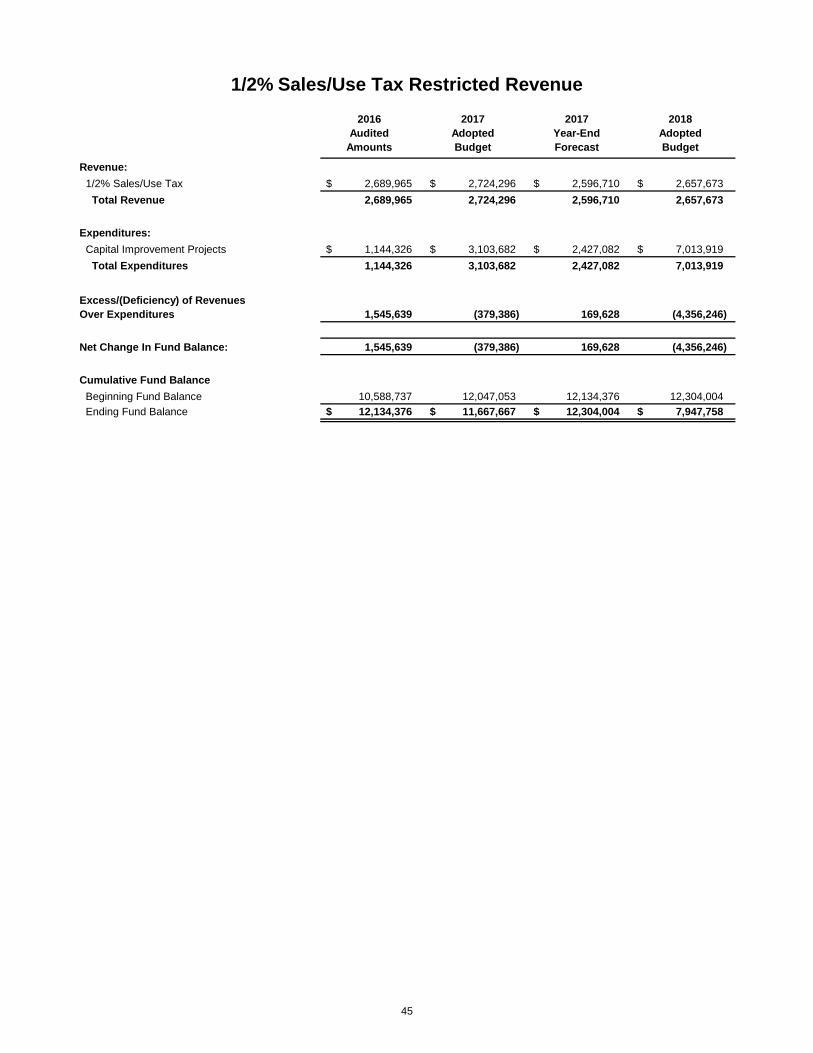
2016Audited
Amounts
2017AdoptedBudget
2017Year-EndForecast
2018AdoptedBudget
Revenue:1/2% Sales/Use Tax 2,689,965$ 2,724,296$ 2,596,710$ 2,657,673$
Total Revenue 2,689,965 2,724,296 2,596,710 2,657,673
Expenditures:Capital Improvement Projects 1,144,326$ 3,103,682$ 2,427,082$ 7,013,919$
Total Expenditures 1,144,326 3,103,682 2,427,082 7,013,919
1,545,639 (379,386) 169,628 (4,356,246)
Net Change In Fund Balance: 1,545,639 (379,386) 169,628 (4,356,246)
Cumulative Fund BalanceBeginning Fund Balance 10,588,737 12,047,053 12,134,376 12,304,004 Ending Fund Balance 12,134,376$ 11,667,667$ 12,304,004$ 7,947,758$
1/2% Sales/Use Tax Restricted Revenue
Excess/(Deficiency) of RevenuesOver Expenditures
45

2016Audited
Amounts
2017AdoptedBudget
2017Year-EndForecast
2018AdoptedBudget
Revenue:Marijuana Sales Tax 536,778$ 589,015$ 549,567$ 563,306$
Total Revenue 536,778 589,015 549,567 563,306
Expenditures:Capital Improvement Projects -$ -$ -$ -$
Total Expenditures - - - -
536,778 589,015 549,567 563,306
Net Change In Fund Balance: 536,778 589,015 549,567 563,306
Cumulative Fund BalanceBeginning Fund Balance 484,604 1,059,253 1,021,382 1,570,949 Ending Fund Balance 1,021,382$ 1,648,268$ 1,570,949$ 2,134,255$
2% Marijuana Sales Tax Restricted Revenue
Excess/(Deficiency) of RevenuesOver Expenditures
46

47

2016Audited
Amounts
2017AdoptedBudget
2017Year-EndForecast
2018AdoptedBudget
Revenue:Taxes 3,656,420$ 3,782,214$ 3,698,686$ 3,771,220$ Intergovernmental - 3,500 2,500 3,500User Charges & Fees 11,206,334 10,925,664 11,410,310 12,074,799 Other Revenue 111,462 73,000 70,000 65,000
Total Revenue 14,974,216 14,784,378 15,181,496 15,914,519
Expenditures:Personnel 4,277,301$ 4,614,845$ 4,415,472$ 4,828,008$ Purchased Services 2,591,036 1,860,912 1,793,935 1,983,375 Supplies/Non-Capital Equipment 1,938,272 2,036,494 1,818,657 1,862,487 Capital Outlay 7,505,816 9,076,733 7,615,123 5,371,223 Miscellaneous 25,795 30,600 30,830 36,100
Total Expenditures 16,338,220 17,619,584 15,674,017 14,081,193
(1,364,004) (2,835,206) (492,521) 1,833,326
Other Financing Sources/(Uses):Debt Issuance/(Payments) (1,015,525) (977,033) (977,033) (979,300)Insurance Recovery/(Claims) (158) (3,500) - -
Total Other Financing Sources/(Uses) (1,015,683) (980,533) (977,033) (979,300)
Net Change In Fund Balance: (2,379,687) (3,815,739) (1,469,554) 854,026
Cumulative Fund BalanceBeginning Fund Balance 16,558,054 16,874,230 14,178,367 12,708,813 Ending Fund Balance 14,178,367 13,058,491 12,708,813 13,562,839
Less Restrictions, Commitments, & Assignments:3% TABOR Reserve Restriction 318,645 221,152 226,306 314,353Debt Service Reserve Restriction 50,377 247,538 65,148 87,570Water Right Purchase Restriction 2,327,637 4,441,518 4,034,519 5,804,017 Capital/Infrastructure Commitment 2,000,000 2,000,000 2,000,000 2,000,000 Operating Reserve Commitment 2,208,101 2,135,713 2,014,724 2,177,493
Unassigned Fund Balance 7,273,607$ 4,012,570$ 4,368,116$ 3,179,406$
Water & Wastewater Fund Summary
Excess/(Deficiency) of RevenuesOver Expenditures
48

-
2,000,000
4,000,000
6,000,000
8,000,000
10,000,000
12,000,000
14,000,000
16,000,000
18,000,000
2016Audited
Amounts
2017Year-EndForecast
2018AdoptedBudget
Revenue, Expenditures & Unassigned Fund Balance
Total Revenue Total Expenditures Unassigned Fund Balance
TaxesTaxes24%
Intergovernmental<1%
User Charges & Fees76%
Other Revenue<1%
Operating Revenue Budget By Category
Personnel35%
Purchased Services14%
Supplies/Non-Capital Equipment
13%Capital Outlay
38%
Miscellaneous<1%
Operating Expenditure Budget By Category
49
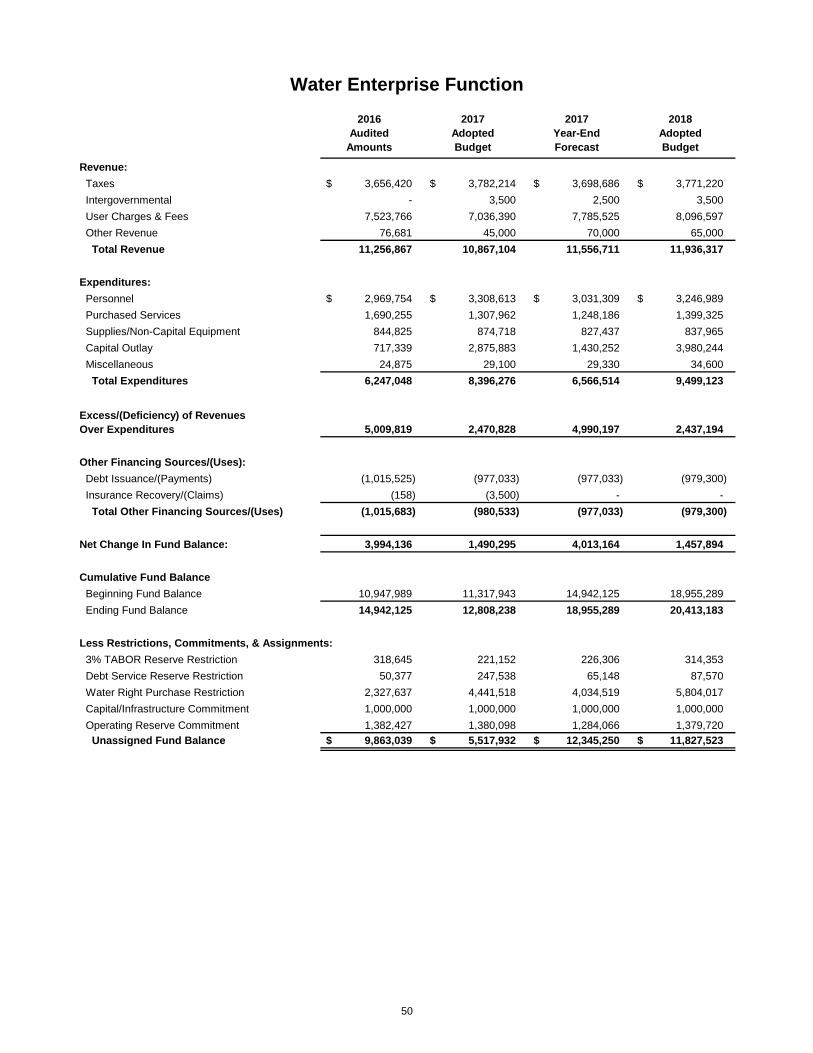
2016Audited
Amounts
2017AdoptedBudget
2017Year-EndForecast
2018AdoptedBudget
Revenue:Taxes 3,656,420$ 3,782,214$ 3,698,686$ 3,771,220$ Intergovernmental - 3,500 2,500 3,500 User Charges & Fees 7,523,766 7,036,390 7,785,525 8,096,597 Other Revenue 76,681 45,000 70,000 65,000
Total Revenue 11,256,867 10,867,104 11,556,711 11,936,317
Expenditures:Personnel 2,969,754$ 3,308,613$ 3,031,309$ 3,246,989$ Purchased Services 1,690,255 1,307,962 1,248,186 1,399,325 Supplies/Non-Capital Equipment 844,825 874,718 827,437 837,965 Capital Outlay 717,339 2,875,883 1,430,252 3,980,244 Miscellaneous 24,875 29,100 29,330 34,600
Total Expenditures 6,247,048 8,396,276 6,566,514 9,499,123
5,009,819 2,470,828 4,990,197 2,437,194
Other Financing Sources/(Uses):Debt Issuance/(Payments) (1,015,525) (977,033) (977,033) (979,300) Insurance Recovery/(Claims) (158) (3,500) - -
Total Other Financing Sources/(Uses) (1,015,683) (980,533) (977,033) (979,300)
Net Change In Fund Balance: 3,994,136 1,490,295 4,013,164 1,457,894
Cumulative Fund BalanceBeginning Fund Balance 10,947,989 11,317,943 14,942,125 18,955,289 Ending Fund Balance 14,942,125 12,808,238 18,955,289 20,413,183
Less Restrictions, Commitments, & Assignments:3% TABOR Reserve Restriction 318,645 221,152 226,306 314,353 Debt Service Reserve Restriction 50,377 247,538 65,148 87,570 Water Right Purchase Restriction 2,327,637 4,441,518 4,034,519 5,804,017 Capital/Infrastructure Commitment 1,000,000 1,000,000 1,000,000 1,000,000 Operating Reserve Commitment 1,382,427 1,380,098 1,284,066 1,379,720
Unassigned Fund Balance 9,863,039$ 5,517,932$ 12,345,250$ 11,827,523$
Water Enterprise Function
Excess/(Deficiency) of RevenuesOver Expenditures
50
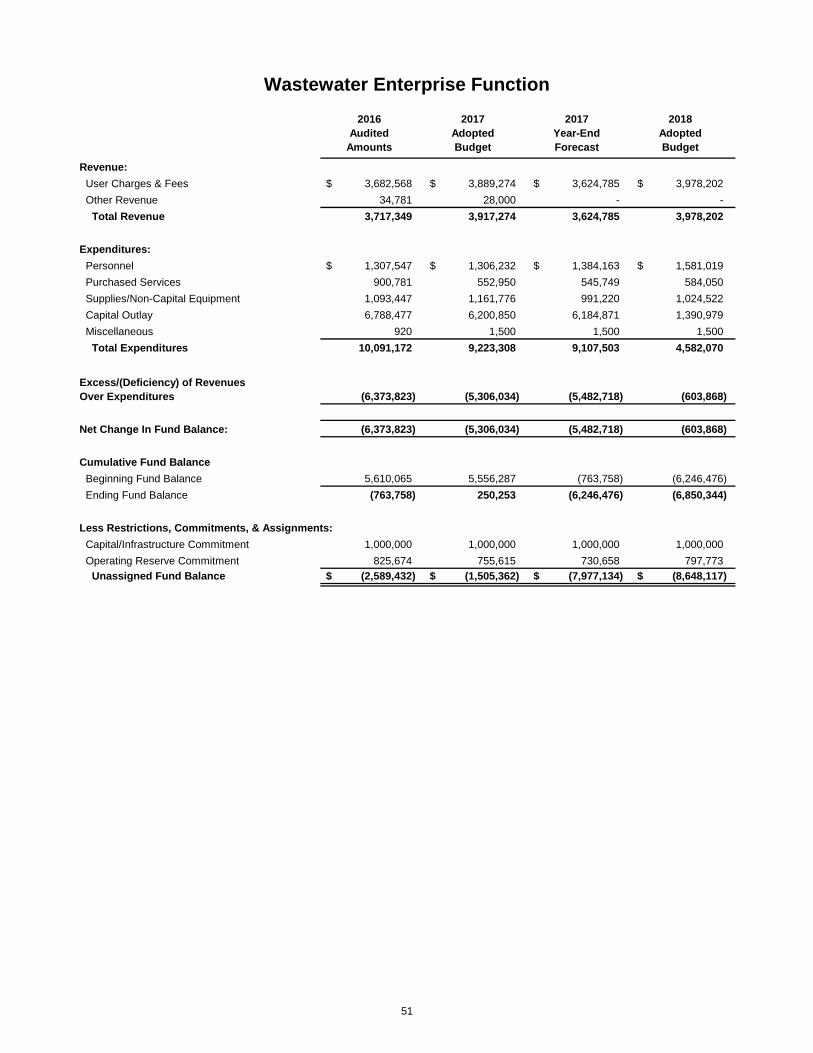
2016Audited
Amounts
2017AdoptedBudget
2017Year-EndForecast
2018AdoptedBudget
Revenue:User Charges & Fees 3,682,568$ 3,889,274$ 3,624,785$ 3,978,202$ Other Revenue 34,781 28,000 - -
Total Revenue 3,717,349 3,917,274 3,624,785 3,978,202
Expenditures:Personnel 1,307,547$ 1,306,232$ 1,384,163$ 1,581,019$ Purchased Services 900,781 552,950 545,749 584,050 Supplies/Non-Capital Equipment 1,093,447 1,161,776 991,220 1,024,522 Capital Outlay 6,788,477 6,200,850 6,184,871 1,390,979 Miscellaneous 920 1,500 1,500 1,500
Total Expenditures 10,091,172 9,223,308 9,107,503 4,582,070
(6,373,823) (5,306,034) (5,482,718) (603,868)
Net Change In Fund Balance: (6,373,823) (5,306,034) (5,482,718) (603,868)
Cumulative Fund BalanceBeginning Fund Balance 5,610,065 5,556,287 (763,758) (6,246,476) Ending Fund Balance (763,758) 250,253 (6,246,476) (6,850,344)
Less Restrictions, Commitments, & Assignments:Capital/Infrastructure Commitment 1,000,000 1,000,000 1,000,000 1,000,000 Operating Reserve Commitment 825,674 755,615 730,658 797,773
Unassigned Fund Balance (2,589,432)$ (1,505,362)$ (7,977,134)$ (8,648,117)$
Wastewater Enterprise Function
Excess/(Deficiency) of RevenuesOver Expenditures
51

2016Audited
Amounts
2017AdoptedBudget
2017Year-EndForecast
2018AdoptedBudget
Revenue:Food Related Sales Tax 966,488$ 1,065,299$ 991,804$ 1,001,722$
Total Revenue 966,488 1,065,299 991,804 1,001,722
Expenditures:Agent Fees -$ -$ -$ -$
Total Expenditures - - - -
966,488 1,065,299 991,804 1,001,722
Other Financing Sources/(Uses):Series 2002A - Certificates of Participation - - - -
2013 Lease Purchase Agreement (1,015,525) (977,033) (977,033) (979,300) Total Other Financing Sources/(Uses) (1,015,525) (977,033) (977,033) (979,300)
Net Change In Fund Balance: (49,037) 88,266 14,771 22,422
Cumulative Fund BalanceBeginning Fund Balance 99,414 159,272 50,377 65,148 Ending Fund Balance 50,377$ 247,538$ 65,148$ 87,570$
Debt Service Function
Excess/(Deficiency) of RevenuesOver Expenditures
52
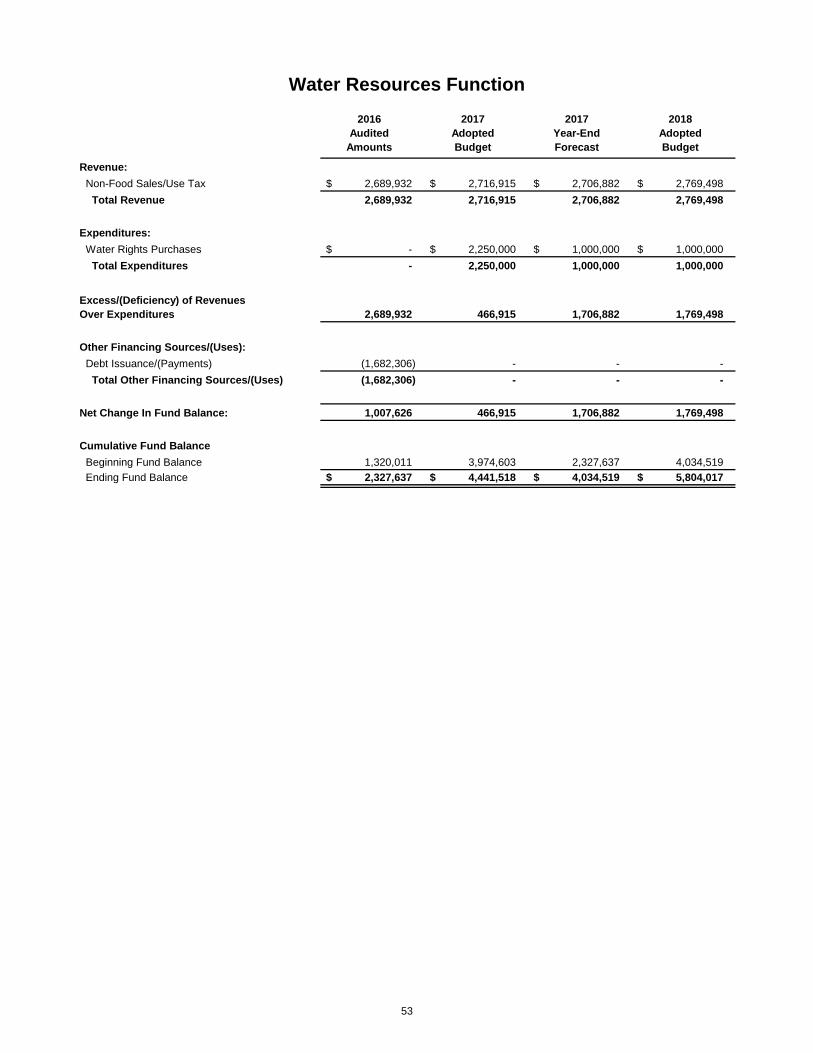
2016Audited
Amounts
2017AdoptedBudget
2017Year-EndForecast
2018AdoptedBudget
Revenue:Non-Food Sales/Use Tax 2,689,932$ 2,716,915$ 2,706,882$ 2,769,498$
Total Revenue 2,689,932 2,716,915 2,706,882 2,769,498
Expenditures:Water Rights Purchases -$ 2,250,000$ 1,000,000$ 1,000,000$
Total Expenditures - 2,250,000 1,000,000 1,000,000
2,689,932 466,915 1,706,882 1,769,498
Other Financing Sources/(Uses):Debt Issuance/(Payments) (1,682,306) - - -
Total Other Financing Sources/(Uses) (1,682,306) - - -
Net Change In Fund Balance: 1,007,626 466,915 1,706,882 1,769,498
Cumulative Fund BalanceBeginning Fund Balance 1,320,011 3,974,603 2,327,637 4,034,519 Ending Fund Balance 2,327,637$ 4,441,518$ 4,034,519$ 5,804,017$
Water Resources Function
Excess/(Deficiency) of RevenuesOver Expenditures
53

2016Audited
Amounts
2017AdoptedBudget
2017Year-EndForecast
2018AdoptedBudget
Revenue:User Charges & Fees 476,152$ 415,609$ 464,650$ 464,185$ Other Revenue 5,611 3,500 3,000 1,500
Total Revenue 481,763 419,109 467,650 465,685
Expenditures:Personnel 77,016$ 80,209$ 78,685$ 82,143$ Purchased Services 18,400 32,550 51,558 32,550 Supplies/Non-Capital Equipment 15,459 20,000 20,000 20,000 Capital Outlay 45,171 1,454,829 1,560,000 230,000 Miscellaneous 3,085 750 750 750
Total Expenditures 159,131 1,588,338 1,710,993 365,443
322,632 (1,169,229) (1,243,343) 100,242
Net Change In Fund Balance: 322,632 (1,169,229) (1,243,343) 100,242
Cumulative Fund BalanceBeginning Fund Balance 969,632 1,253,622 1,292,264 48,921 Ending Fund Balance 1,292,264 84,393 48,921 149,163
Unassigned Fund Balance 1,292,264$ 84,393$ 48,921$ 149,163$
Stormwater Fund Summary
Excess/(Deficiency) of RevenuesOver Expenditures
54
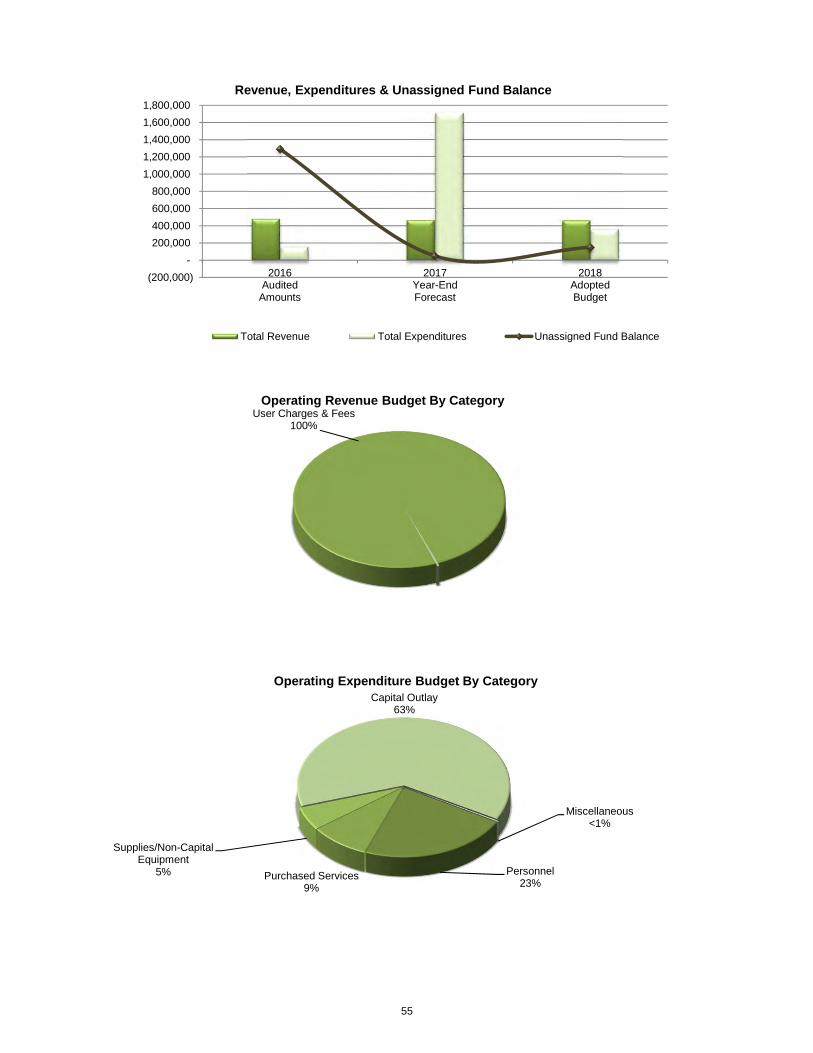
(200,000) -
200,000 400,000 600,000 800,000
1,000,000 1,200,000 1,400,000 1,600,000 1,800,000
2016Audited
Amounts
2017Year-EndForecast
2018AdoptedBudget
Revenue, Expenditures & Unassigned Fund Balance
Total Revenue Total Expenditures Unassigned Fund Balance
User Charges & Fees100%
Operating Revenue Budget By Category
Personnel23%
Purchased Services9%
Supplies/Non-Capital Equipment
5%
Capital Outlay63%
Miscellaneous<1%
Operating Expenditure Budget By Category
55

2016Audited
Amounts
2017AdoptedBudget
2017Year-EndForecast
2018AdoptedBudget
Revenue:User Charges & Fees 1,460,563$ 1,866,372$ 1,918,960$ 1,917,266$ Other Revenue 7,373 7,500 6,000 6,000
Total Revenue 1,467,936 1,873,872 1,924,960 1,923,266
Expenditures:Personnel 716,943$ 712,120$ 709,768$ 807,966$ Purchased Services 345,155 397,740 265,665 271,026 Supplies/Non-Capital Equipment 108,277 210,901 162,000 167,390 Capital Outlay 600,627 523,000 523,000 325,000 Miscellaneous 521 500 500 500
Total Expenditures 1,771,523 1,844,261 1,660,933 1,571,882
(303,587) 29,611 264,027 351,384
Other Financing Sources/(Uses):Sale of Assets 87,933 - - - Insurance Recovery/(Claims) - (10,000) - -
Total Other Financing Sources/(Uses) 87,933 (10,000) - -
Net Change In Fund Balance: (215,654) 19,611 264,027 351,384
Cumulative Fund BalanceBeginning Fund Balance 1,436,930 1,084,339 1,221,276 1,485,303 Ending Fund Balance 1,221,276 1,103,950 1,485,303 1,836,687
Less Restrictions, Commitments, & Assignments:Assigned Fund Balance - - - -
Unassigned Fund Balance 1,221,276$ 1,103,950$ 1,485,303$ 1,836,687$
Sanitation Fund Summary
Excess/(Deficiency) of RevenuesOver Expenditures
56
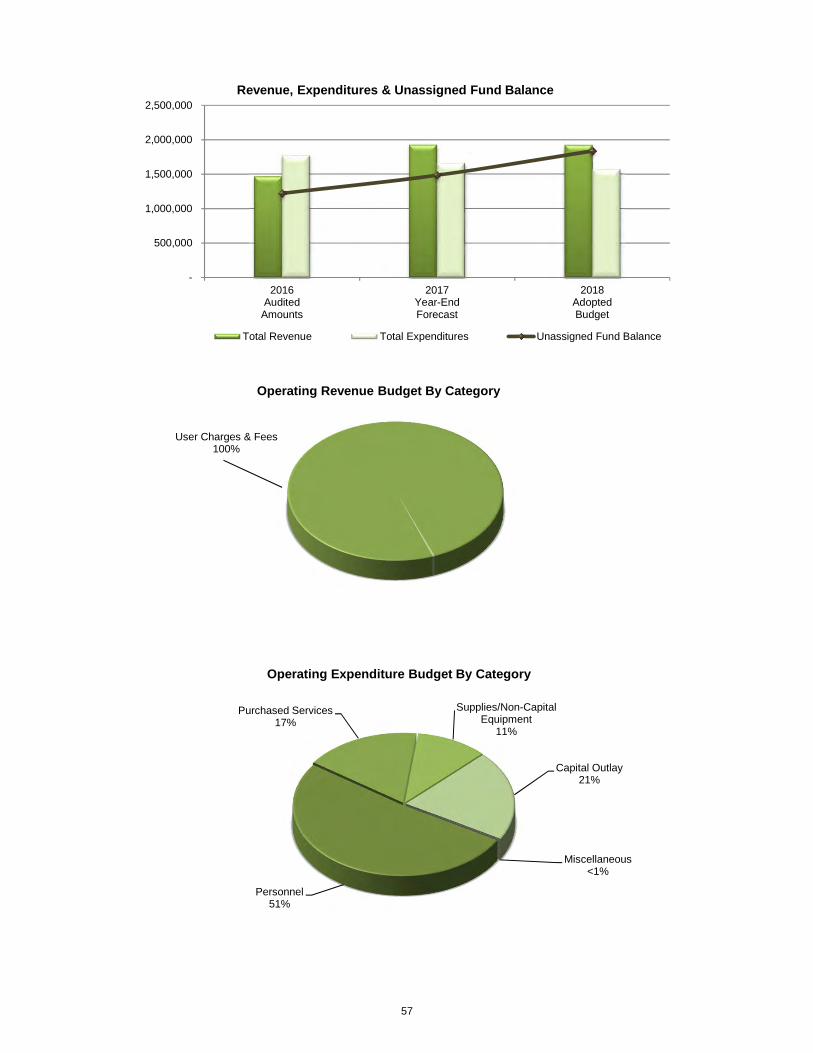
-
500,000
1,000,000
1,500,000
2,000,000
2,500,000
2016Audited
Amounts
2017Year-EndForecast
2018AdoptedBudget
Revenue, Expenditures & Unassigned Fund Balance
Total Revenue Total Expenditures Unassigned Fund Balance
User Charges & Fees100%
Operating Revenue Budget By Category
Personnel51%
Purchased Services17%
Supplies/Non-Capital Equipment
11%
Capital Outlay21%
Miscellaneous<1%
Operating Expenditure Budget By Category
57

58

General FundConservation Trust
Fund CDBG FundCapital Projects
FundWater &
Wastewater Fund Stormwater Fund Sanitation Fund Total
Departments:Legislative 732,974$ -$ -$ -$ 60,000$ -$ -$ 792,974$ City Manager 1,075,950 - - - - - - 1,075,950 City Clerk 369,440 - - - - - - 369,440 Management Services 1,800,309 - - - 286,607 - 9,826 2,096,742 Technology 920,372 - - - 240,586 - - 1,160,958 Finance 488,920 - - - 814,068 - 2,000 1,304,988 Planning & Development 1,463,232 - - - - - - 1,463,232 Parks, Recreation, & Culture 4,109,136 1,546,000 - 1,425,000 - - - 7,080,136 Police 10,232,954 - - - - - - 10,232,954 Public Works 3,007,204 - - 16,763,085 12,679,932 365,443 1,560,056 34,375,720
Total Expenditures 24,200,491$ 1,546,000$ -$ 18,188,085$ 14,081,193$ 365,443$ 1,571,882$ 59,953,094$
Department Funding Matrix
Legislative1%
City Manager2%
City Clerk1%
Management Services4%
Technology2%
Finance2%
Planning & Development
4%
Parks, Recreation, & Culture
11%
Police17%
Public Works57%
City-Wide Expenditures By Department
General Fund40%
Conservation Trust Fund3%
CDBG Fund<1%
Capital Projects Fund30%
Water & Wastewater Fund23%
Stormwater Fund1%
Sanitation Fund3%
City-Wide Expenditures By Fund
59

The Legislative Department includes three divisions: City Council, City Attorney, and Boards and Commissions.
The City Council is comprised of the Mayor and two council members elected from each of the City's four wards. The CityCouncil serves as the legislative and governing body of the City of Northglenn and is responsible for establishing City policiesand goals.
The City Attorney serves as legal counsel for the City and represents the City in litigation in state and federal courts and beforelocal administrative agencies. The City Attorney advises Council, City Manager, administrative staff, and board members on legal matters, drafts ordinances, resolutions, and contracts for the City. The City Attorney is also responsible for the prosecution of all cases in Municipal Court.
The City of Northglenn has 10 boards and commissions, which provide various opportunities for citizens to become involved inthe City. The boards are created by the City Charter, by Ordinance, or by Resolution and include the following: Board of Adjustments, Citizens' Affairs Board, Elections Commission, Historic Preservation Commission, Liquor Licensing Authority,Parks and Recreation Advisory Board, Planning Commission, Victim Assistance and Law Enforcement Board, and YouthCommission.
Upgraded city infrastructure and facilities
Fiscally responsible city government
Strong, competitive businesses
Community governance with civic partnerships
Clean and beautiful city
Livable Neighborhoods & Homes
LegislativeJoyce Downing, Mayor
Department Description
Goals & Objectives
1.
2.
3.
4.
5.
6.
60

Fund(s) Budget FTEGeneral Fund 732,974$ - Conservation Trust Fund - - CDBG Fund - - Capital Projects Fund - - Water & Wastewater Fund 60,000 - Stormwater Fund - - Sanitation Fund - - Total 792,974 -
Division/Program(s) Budget FTECity Council 787,887$ - City Attorney - - Boards & Authorities 5,087 -
Total 792,974 -
2016Audited
Amounts
2017AdoptedBudget
2017Year-EndForecast
2018AdoptedBudget
Staff - Full Time Equivalency (FTE)* - - - -
Expenditures:Personnel 135,204$ 138,087$ 135,137$ 138,087$ Purchased Services 475,468 379,017 434,032 404,017 Supplies/Non-Capital Equipment 13,973 13,870 13,870 13,870 Miscellaneous 102,289 122,000 132,000 137,000 Contingency - 100,000 - 100,000
Total Expenditures 726,934$ 752,974$ 715,039$ 792,974$
Amount
25,000 Sponsorships - OAF 5,000
30,000$
1.2.
Professional Services - Legal, Lobbyist
2018 BUDGET PACKAGES
Legislative
EXPENDITURE SUMMARY
2018 BUDGET SUMMARY BY DIVISION
2018 BUDGET SUMMARY BY FUND
$660,000
$680,000
$700,000
$720,000
$740,000
$760,000
$780,000
$800,000
2016Audited
Amounts
2017Year-EndForecast
2018AdoptedBudget
Expe
nditu
res
EXPENDITURE
Total Expenditures
61

2016Audited
Amounts
2017AdoptedBudget
2017Year-EndForecast
2018AdoptedBudget
PersonnelRegular Wages 88,188 87,708 87,926 87,708 Allowances 39,960 39,960 39,960 39,960 Medicare 1,852 1,855 1,895 1,855 Workers Compensation 97 215 110 215 Retirement Contributions 4,806 7,529 4,912 7,529 Life/Disability Benefits 301 820 334 820
Total Personnel 135,204 138,087 135,137 138,087
Purchased ServicesProfessional Services 439,845 316,680 361,680 341,680 Communication Services - 20,162 20,162 20,162 Training/Registration 15,566 42,175 52,190 42,175 Mileage/Travel 20,057 - - -
Total Purchased Services 475,468 379,017 434,032 404,017
Supplies/Non-Capital EquipmentOffice Supplies 129 200 200 200 Operating Supplies 13,844 13,670 13,670 13,670
Total Supplies/Non-Capital Equipment 13,973 13,870 13,870 13,870
MiscellaneousDues/Fees 55,361 62,000 62,000 62,000 Grants/Donations 46,928 60,000 70,000 75,000
Total Other Expenditures 102,289 122,000 132,000 137,000
ContingencyContingency - 100,000 - 100,000
Total Contingency - 100,000 - 100,000
Total Expenditures 726,934$ 752,974$ 715,039$ 792,974$
Expenditure DetailLegislative Department - All Funds
62

2016Audited
Amounts
2017AdoptedBudget
2017Year-EndForecast
2018AdoptedBudget
PersonnelRegular Wages 88,188 87,708 87,926 87,708 Allowances 39,960 39,960 39,960 39,960 Medicare 1,852 1,855 1,895 1,855 Workers Compensation 97 215 110 215 Retirement Contributions 4,806 7,529 4,912 7,529 Life/Disability Benefits 301 820 334 820
Total Personnel 135,204 138,087 135,137 138,087
Purchased ServicesProfessional Services 281,422 256,680 301,680 281,680 Communication Services - 20,162 20,162 20,162 Training/Registration 15,566 42,175 52,190 42,175 Mileage/Travel 20,057 - - -
Total Purchased Services 317,045 319,017 374,032 344,017
Supplies/Non-Capital EquipmentOffice Supplies 129 200 200 200 Operating Supplies 13,844 13,670 13,670 13,670
Total Supplies/Non-Capital Equipment 13,973 13,870 13,870 13,870
MiscellaneousDues/Fees 55,361 62,000 62,000 62,000 Grants/Donations 46,928 60,000 70,000 75,000
Total Other Expenditures 102,289 122,000 132,000 137,000
ContingencyContingency - 100,000 - 100,000
Total Contingency - 100,000 - 100,000
Total Expenditures 568,511$ 692,974$ 655,039$ 732,974$
Expenditure DetailLegislative Department - General Fund
63
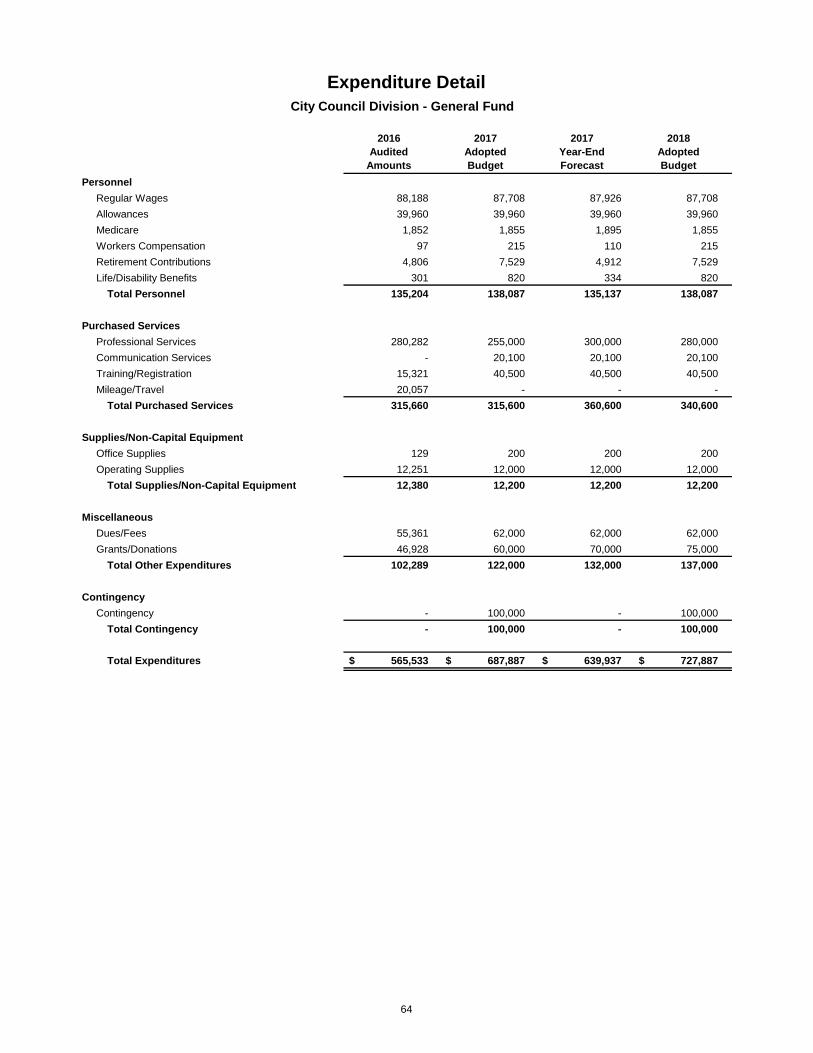
2016Audited
Amounts
2017AdoptedBudget
2017Year-EndForecast
2018AdoptedBudget
PersonnelRegular Wages 88,188 87,708 87,926 87,708 Allowances 39,960 39,960 39,960 39,960 Medicare 1,852 1,855 1,895 1,855 Workers Compensation 97 215 110 215 Retirement Contributions 4,806 7,529 4,912 7,529 Life/Disability Benefits 301 820 334 820
Total Personnel 135,204 138,087 135,137 138,087
Purchased ServicesProfessional Services 280,282 255,000 300,000 280,000 Communication Services - 20,100 20,100 20,100 Training/Registration 15,321 40,500 40,500 40,500 Mileage/Travel 20,057 - - -
Total Purchased Services 315,660 315,600 360,600 340,600
Supplies/Non-Capital EquipmentOffice Supplies 129 200 200 200 Operating Supplies 12,251 12,000 12,000 12,000
Total Supplies/Non-Capital Equipment 12,380 12,200 12,200 12,200
MiscellaneousDues/Fees 55,361 62,000 62,000 62,000 Grants/Donations 46,928 60,000 70,000 75,000
Total Other Expenditures 102,289 122,000 132,000 137,000
ContingencyContingency - 100,000 - 100,000
Total Contingency - 100,000 - 100,000
Total Expenditures 565,533$ 687,887$ 639,937$ 727,887$
Expenditure DetailCity Council Division - General Fund
64
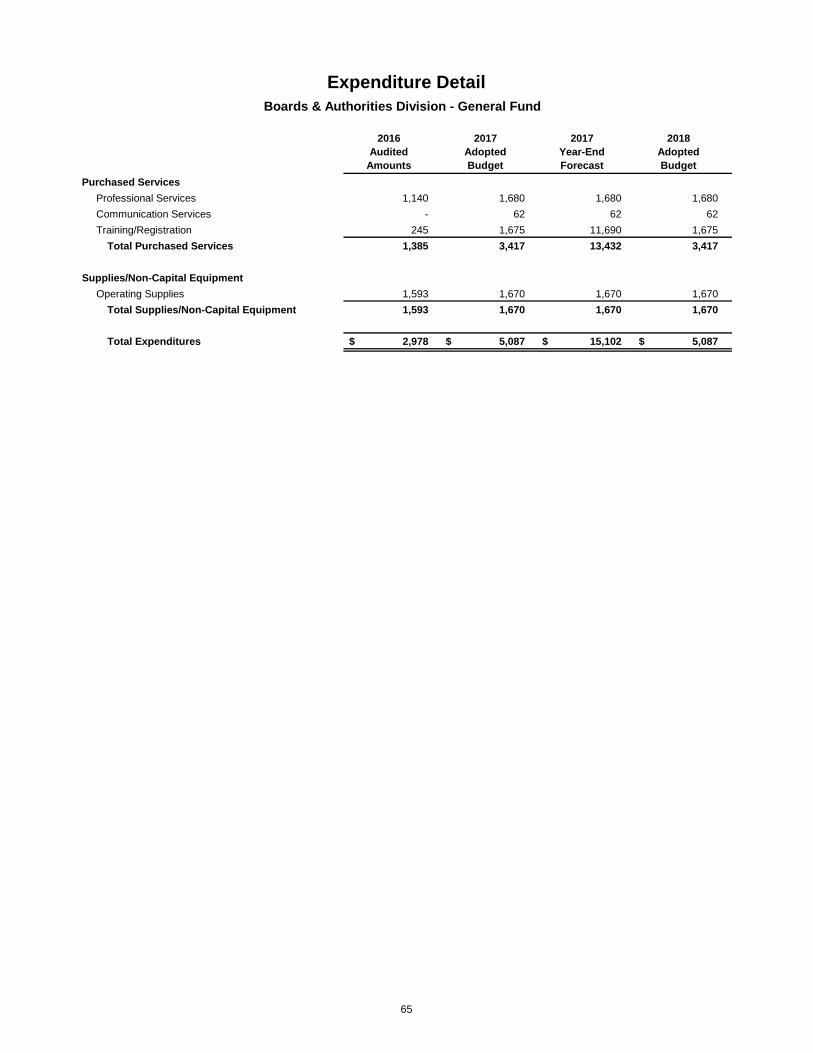
2016Audited
Amounts
2017AdoptedBudget
2017Year-EndForecast
2018AdoptedBudget
Purchased ServicesProfessional Services 1,140 1,680 1,680 1,680 Communication Services - 62 62 62 Training/Registration 245 1,675 11,690 1,675
Total Purchased Services 1,385 3,417 13,432 3,417
Supplies/Non-Capital EquipmentOperating Supplies 1,593 1,670 1,670 1,670
Total Supplies/Non-Capital Equipment 1,593 1,670 1,670 1,670
Total Expenditures 2,978$ 5,087$ 15,102$ 5,087$
Expenditure DetailBoards & Authorities Division - General Fund
65

2016Audited
Amounts
2017AdoptedBudget
2017Year-EndForecast
2018AdoptedBudget
Purchased ServicesProfessional Services 158,423 60,000 60,000 60,000
Total Purchased Services 158,423 60,000 60,000 60,000
Total Expenditures 158,423$ 60,000$ 60,000$ 60,000$
Legislative Department - Water & Wastewater FundExpenditure Detail
66

2016Audited
Amounts
2017AdoptedBudget
2017Year-EndForecast
2018AdoptedBudget
Purchased ServicesProfessional Services 158,423 60,000 60,000 60,000
Total Purchased Services 158,423 60,000 60,000 60,000
Total Expenditures 158,423$ 60,000$ 60,000$ 60,000$
Expenditure DetailCity Council Division - Water & Wastewater Fund
67
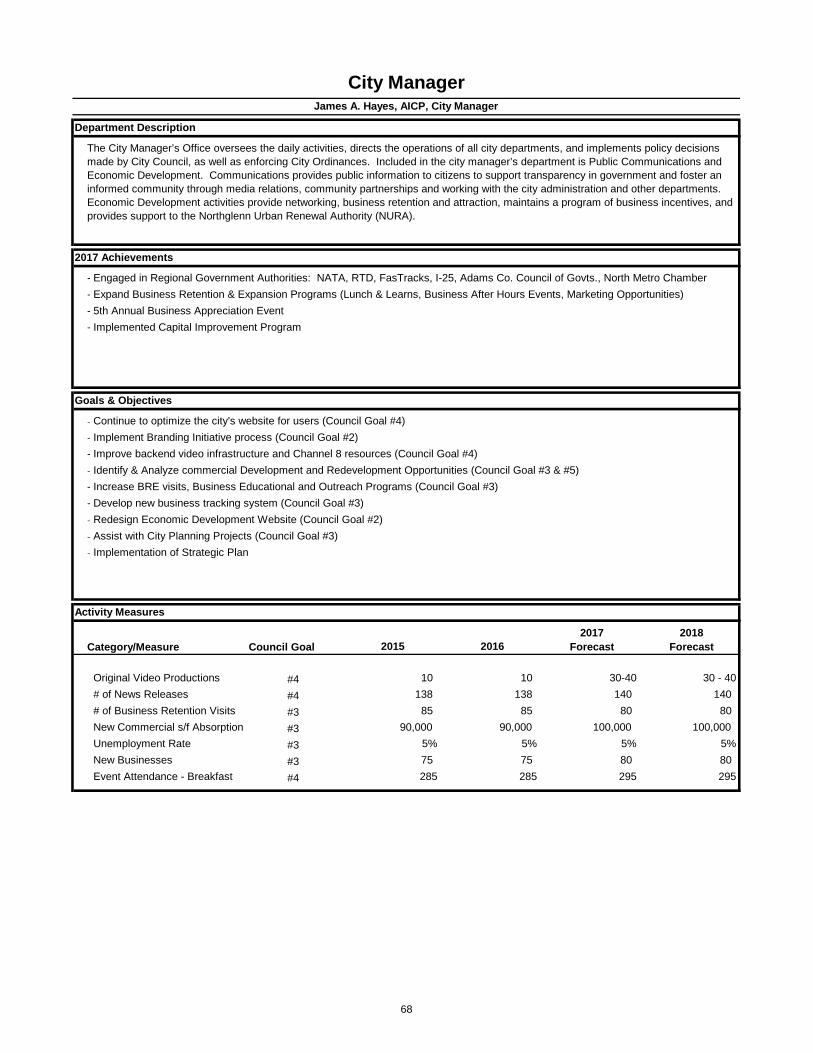
- Engaged in Regional Government Authorities: NATA, RTD, FasTracks, I-25, Adams Co. Council of Govts., North Metro Chamber- Expand Business Retention & Expansion Programs (Lunch & Learns, Business After Hours Events, Marketing Opportunities)--
˗˗- Improve backend video infrastructure and Channel 8 resources (Council Goal #4)˗ Identify & Analyze commercial Development and Redevelopment Opportunities (Council Goal #3 & #5)- Increase BRE visits, Business Educational and Outreach Programs (Council Goal #3)- Develop new business tracking system (Council Goal #3)˗ Redesign Economic Development Website (Council Goal #2)˗ Assist with City Planning Projects (Council Goal #3)˗ Implementation of Strategic Plan
Category/Measure Council Goal 2015 20162017
Forecast2018
Forecast
Original Video Productions #4 10 10 30-40 30 - 40# of News Releases #4 138 138 140 140 # of Business Retention Visits #3 85 85 80 80 New Commercial s/f Absorption #3 90,000 90,000 100,000 100,000 Unemployment Rate #3 5% 5% 5% 5%New Businesses #3 75 75 80 80 Event Attendance - Breakfast #4 285 285 295 295
City ManagerJames A. Hayes, AICP, City Manager
Department Description
2017 Achievements
Goals & Objectives
The City Manager’s Office oversees the daily activities, directs the operations of all city departments, and implements policy decisions made by City Council, as well as enforcing City Ordinances. Included in the city manager’s department is Public Communications and Economic Development. Communications provides public information to citizens to support transparency in government and foster an informed community through media relations, community partnerships and working with the city administration and other departments. Economic Development activities provide networking, business retention and attraction, maintains a program of business incentives, and provides support to the Northglenn Urban Renewal Authority (NURA).
5th Annual Business Appreciation EventImplemented Capital Improvement Program
Activity Measures
Continue to optimize the city's website for users (Council Goal #4)Implement Branding Initiative process (Council Goal #2)
68

Fund(s) Budget FTEGeneral Fund 1,075,950$ 6.00 Conservation Trust Fund - - CDBG Fund - - Capital Projects Fund - - Water & Wastewater Fund - - Stormwater Fund - - Sanitation Fund - - Total 1,075,950 6.00
Division/Program(s) Budget FTEAdministration/Operations 336,539$ 2.00 Public Communications 326,956 2.00 Economic Development 412,455 2.00
Total 1,075,950 6.00
2016Audited
Amounts
2017AdoptedBudget
2017Year-EndForecast
2018AdoptedBudget
Staff - Full Time Equivalency (FTE)* 6.00 6.00 6.00 6.00
Expenditures:Personnel 558,127$ 653,244$ 635,286$ 680,578$ Purchased Services 274,714 581,167 368,322 293,225 Supplies/Non-Capital Equipment 34,968 74,286 74,236 69,247 Capital Outlay - - - - Miscellaneous 18,819 42,900 35,900 32,900
Total Expenditures 886,628$ 1,351,597$ 1,113,744$ 1,075,950$
Amount
6,701$ 7,600 5,000 5,000
13,000 6. 70,000 7. 15,000
122,301$
City Manager
EXPENDITURE SUMMARY
2018 BUDGET SUMMARY BY DIVISION
2018 BUDGET SUMMARY BY FUND
2018 BUDGET PACKAGES
1. Personnel Market Adjustment 2. Technical Services - Live Streaming3. Professional Services - Retreats4. Technical Services - Transmission Equipment5.
Professional Services - Marketing Videos
Supplies - Wayfinding ProgramProfessional Services - EPA Grant Carryover
-
1.00
2.00
3.00
4.00
5.00
6.00
7.00
$-
$200,000
$400,000
$600,000
$800,000
$1,000,000
$1,200,000
2016Audited
Amounts
2017Year-EndForecast
2018AdoptedBudget
FTE
Expe
nditu
res
EXPENDITURE & FULL TIME EQUIVALENCY
Total ExpendituresFull Time Equivilancy (FTE)
69
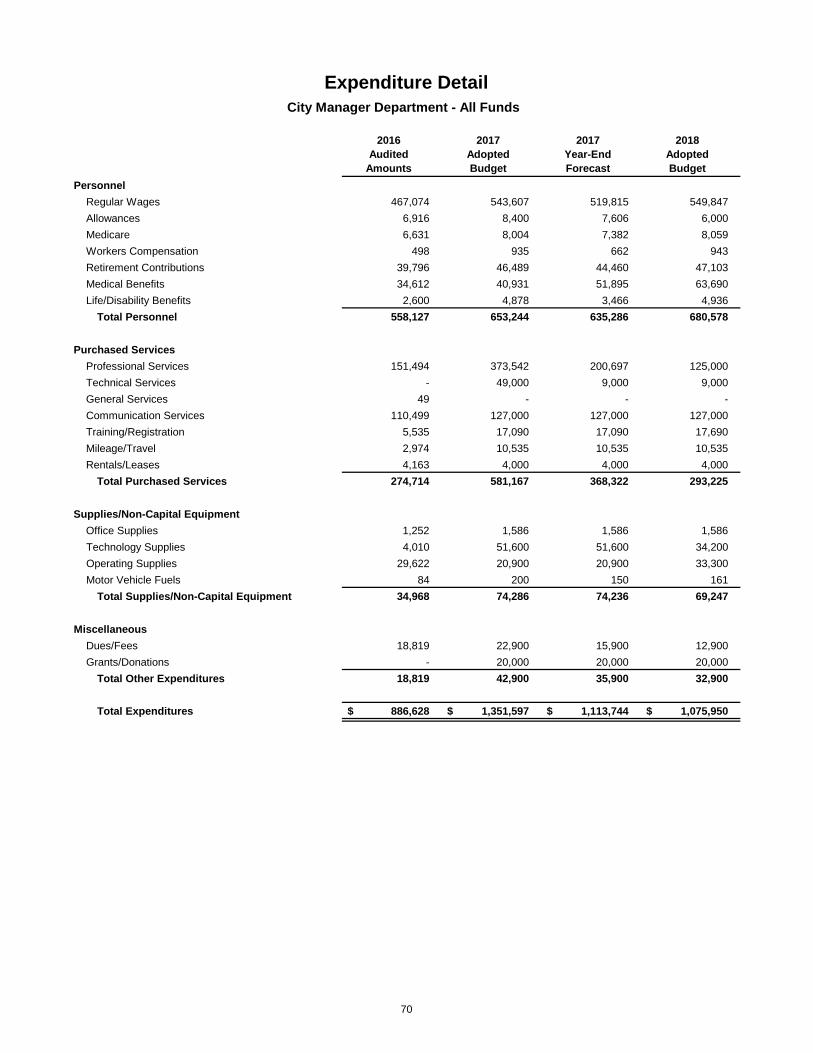
2016Audited
Amounts
2017AdoptedBudget
2017Year-EndForecast
2018AdoptedBudget
PersonnelRegular Wages 467,074 543,607 519,815 549,847 Allowances 6,916 8,400 7,606 6,000 Medicare 6,631 8,004 7,382 8,059 Workers Compensation 498 935 662 943 Retirement Contributions 39,796 46,489 44,460 47,103 Medical Benefits 34,612 40,931 51,895 63,690 Life/Disability Benefits 2,600 4,878 3,466 4,936
Total Personnel 558,127 653,244 635,286 680,578
Purchased ServicesProfessional Services 151,494 373,542 200,697 125,000 Technical Services - 49,000 9,000 9,000 General Services 49 - - - Communication Services 110,499 127,000 127,000 127,000 Training/Registration 5,535 17,090 17,090 17,690 Mileage/Travel 2,974 10,535 10,535 10,535 Rentals/Leases 4,163 4,000 4,000 4,000
Total Purchased Services 274,714 581,167 368,322 293,225
Supplies/Non-Capital EquipmentOffice Supplies 1,252 1,586 1,586 1,586 Technology Supplies 4,010 51,600 51,600 34,200 Operating Supplies 29,622 20,900 20,900 33,300 Motor Vehicle Fuels 84 200 150 161
Total Supplies/Non-Capital Equipment 34,968 74,286 74,236 69,247
MiscellaneousDues/Fees 18,819 22,900 15,900 12,900 Grants/Donations - 20,000 20,000 20,000
Total Other Expenditures 18,819 42,900 35,900 32,900
Total Expenditures 886,628$ 1,351,597$ 1,113,744$ 1,075,950$
Expenditure DetailCity Manager Department - All Funds
70
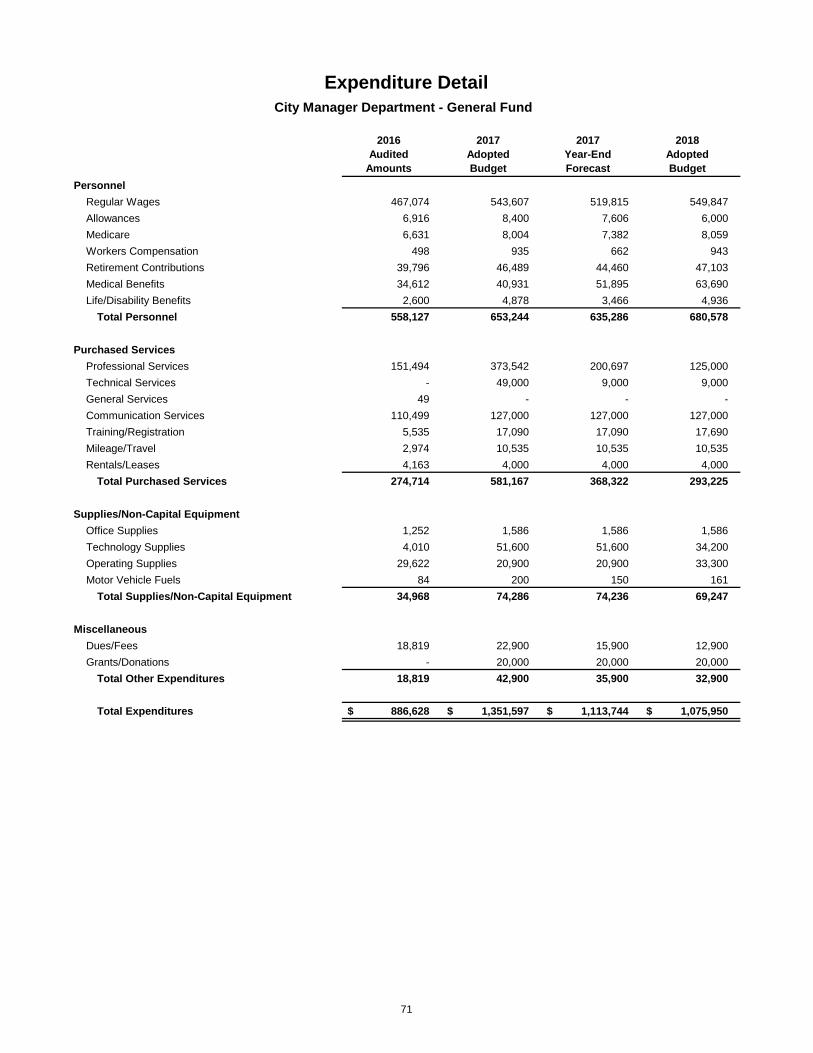
2016Audited
Amounts
2017AdoptedBudget
2017Year-EndForecast
2018AdoptedBudget
PersonnelRegular Wages 467,074 543,607 519,815 549,847 Allowances 6,916 8,400 7,606 6,000 Medicare 6,631 8,004 7,382 8,059 Workers Compensation 498 935 662 943 Retirement Contributions 39,796 46,489 44,460 47,103 Medical Benefits 34,612 40,931 51,895 63,690 Life/Disability Benefits 2,600 4,878 3,466 4,936
Total Personnel 558,127 653,244 635,286 680,578
Purchased ServicesProfessional Services 151,494 373,542 200,697 125,000 Technical Services - 49,000 9,000 9,000 General Services 49 - - - Communication Services 110,499 127,000 127,000 127,000 Training/Registration 5,535 17,090 17,090 17,690 Mileage/Travel 2,974 10,535 10,535 10,535 Rentals/Leases 4,163 4,000 4,000 4,000
Total Purchased Services 274,714 581,167 368,322 293,225
Supplies/Non-Capital EquipmentOffice Supplies 1,252 1,586 1,586 1,586 Technology Supplies 4,010 51,600 51,600 34,200 Operating Supplies 29,622 20,900 20,900 33,300 Motor Vehicle Fuels 84 200 150 161
Total Supplies/Non-Capital Equipment 34,968 74,286 74,236 69,247
MiscellaneousDues/Fees 18,819 22,900 15,900 12,900 Grants/Donations - 20,000 20,000 20,000
Total Other Expenditures 18,819 42,900 35,900 32,900
Total Expenditures 886,628$ 1,351,597$ 1,113,744$ 1,075,950$
City Manager Department - General Fund
Expenditure Detail
71
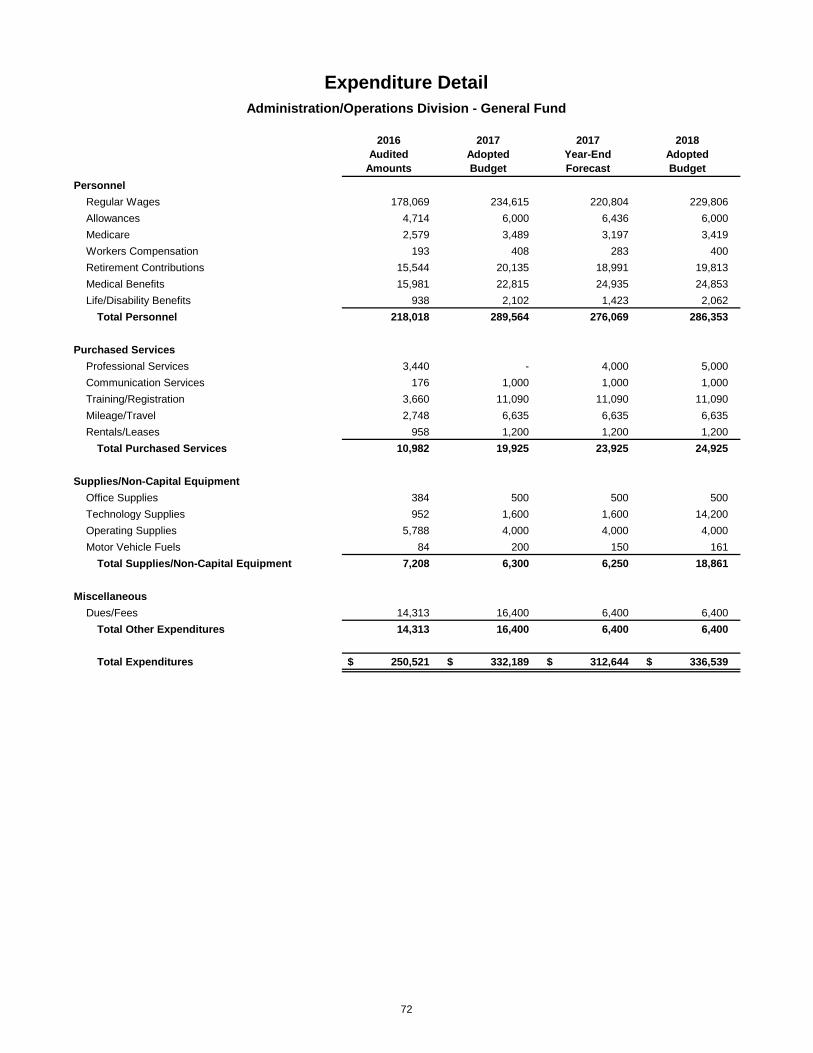
2016Audited
Amounts
2017AdoptedBudget
2017Year-EndForecast
2018AdoptedBudget
PersonnelRegular Wages 178,069 234,615 220,804 229,806 Allowances 4,714 6,000 6,436 6,000 Medicare 2,579 3,489 3,197 3,419 Workers Compensation 193 408 283 400 Retirement Contributions 15,544 20,135 18,991 19,813 Medical Benefits 15,981 22,815 24,935 24,853 Life/Disability Benefits 938 2,102 1,423 2,062
Total Personnel 218,018 289,564 276,069 286,353
Purchased ServicesProfessional Services 3,440 - 4,000 5,000 Communication Services 176 1,000 1,000 1,000 Training/Registration 3,660 11,090 11,090 11,090 Mileage/Travel 2,748 6,635 6,635 6,635 Rentals/Leases 958 1,200 1,200 1,200
Total Purchased Services 10,982 19,925 23,925 24,925
Supplies/Non-Capital EquipmentOffice Supplies 384 500 500 500 Technology Supplies 952 1,600 1,600 14,200 Operating Supplies 5,788 4,000 4,000 4,000 Motor Vehicle Fuels 84 200 150 161
Total Supplies/Non-Capital Equipment 7,208 6,300 6,250 18,861
MiscellaneousDues/Fees 14,313 16,400 6,400 6,400
Total Other Expenditures 14,313 16,400 6,400 6,400
Total Expenditures 250,521$ 332,189$ 312,644$ 336,539$
Administration/Operations Division - General Fund
Expenditure Detail
72

2016Audited
Amounts
2017AdoptedBudget
2017Year-EndForecast
2018AdoptedBudget
PersonnelRegular Wages 133,535 141,360 133,776 143,817 Allowances 1,206 1,200 1,170 - Medicare 1,828 2,067 1,830 2,085 Workers Compensation 146 241 171 244 Retirement Contributions 11,221 11,882 11,235 12,097 Medical Benefits 10,664 11,585 12,678 24,635 Life/Disability Benefits 779 1,271 916 1,292
Total Personnel 159,379 169,606 161,776 184,170
Purchased ServicesProfessional Services 40,887 65,000 65,000 40,000 Technical Services - 40,000 - - General Services - - - - Communication Services 89,983 74,000 74,000 74,000 Training/Registration - - - - Rentals/Leases 748 300 300 300
Total Purchased Services 131,618 179,300 139,300 114,300
Supplies/Non-Capital EquipmentOffice Supplies 34 486 486 486 Technology Supplies 1,529 48,000 48,000 18,000 Operating Supplies 10,037 7,000 7,000 7,000
Total Supplies/Non-Capital Equipment 11,600 55,486 55,486 25,486
MiscellaneousDues/Fees 2,590 3,000 3,000 3,000
Total Other Expenditures 2,590 3,000 3,000 3,000
Total Expenditures 305,187$ 407,392$ 359,562$ 326,956$
Expenditure DetailPublic Communications Division - General Fund
73

2016Audited
Amounts
2017AdoptedBudget
2017Year-EndForecast
2018AdoptedBudget
PersonnelRegular Wages 155,470 167,632 165,235 176,224 Allowances 996 1,200 - - Medicare 2,224 2,448 2,355 2,555 Workers Compensation 159 286 208 299 Retirement Contributions 13,031 14,472 14,234 15,193 Medical Benefits 7,967 6,531 14,282 14,202 Life/Disability Benefits 883 1,505 1,127 1,582
Total Personnel 180,730 194,074 197,441 210,055
Purchased ServicesProfessional Services 107,167 308,542 131,697 80,000 Technical Services - 9,000 9,000 9,000 General Services 49 - - - Communication Services 20,340 52,000 52,000 52,000 Training/Registration 1,875 6,000 6,000 6,600 Mileage/Travel 226 3,900 3,900 3,900 Rentals/Leases 2,457 2,500 2,500 2,500
Total Purchased Services 132,114 381,942 205,097 154,000
Supplies/Non-Capital EquipmentOffice Supplies 834 600 600 600 Technology Supplies 1,529 2,000 2,000 2,000 Operating Supplies 13,797 9,900 9,900 22,300
Total Supplies/Non-Capital Equipment 16,160 12,500 12,500 24,900
MiscellaneousDues/Fees 1,916 3,500 6,500 3,500 Grants/Donations - 20,000 20,000 20,000
Total Other Expenditures 1,916 23,500 26,500 23,500
Total Expenditures 330,920$ 612,016$ 441,538$ 412,455$
Expenditure DetailEconomic Development Division - General Fund
74

75
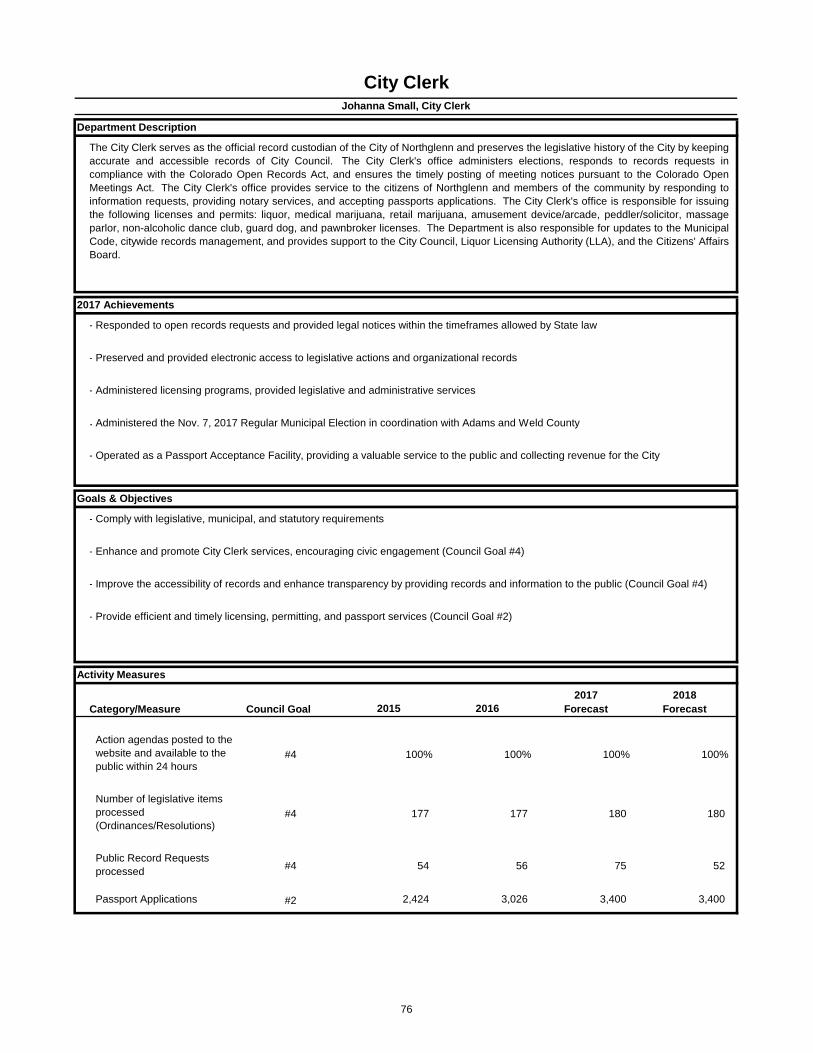
- Responded to open records requests and provided legal notices within the timeframes allowed by State law
- Preserved and provided electronic access to legislative actions and organizational records
- Administered licensing programs, provided legislative and administrative services
-Administered the Nov. 7, 2017 Regular Municipal Election in coordination with Adams and Weld County
- Operated as a Passport Acceptance Facility, providing a valuable service to the public and collecting revenue for the City
- Comply with legislative, municipal, and statutory requirements
- Enhance and promote City Clerk services, encouraging civic engagement (Council Goal #4)
- Improve the accessibility of records and enhance transparency by providing records and information to the public (Council Goal #4)
- Provide efficient and timely licensing, permitting, and passport services (Council Goal #2)
Category/Measure Council Goal 2015 20162017
Forecast2018
Forecast
Action agendas posted to the website and available to the public within 24 hours
#4 100% 100% 100% 100%
Number of legislative items processed (Ordinances/Resolutions)
#4 177 177 180 180
Public Record Requests processed #4 54 56 75 52
Passport Applications #2 2,424 3,026 3,400 3,400
Activity Measures
City ClerkJohanna Small, City Clerk
Department Description
The City Clerk serves as the official record custodian of the City of Northglenn and preserves the legislative history of the City by keepingaccurate and accessible records of City Council. The City Clerk's office administers elections, responds to records requests incompliance with the Colorado Open Records Act, and ensures the timely posting of meeting notices pursuant to the Colorado OpenMeetings Act. The City Clerk's office provides service to the citizens of Northglenn and members of the community by responding toinformation requests, providing notary services, and accepting passports applications. The City Clerk's office is responsible for issuingthe following licenses and permits: liquor, medical marijuana, retail marijuana, amusement device/arcade, peddler/solicitor, massageparlor, non-alcoholic dance club, guard dog, and pawnbroker licenses. The Department is also responsible for updates to the MunicipalCode, citywide records management, and provides support to the City Council, Liquor Licensing Authority (LLA), and the Citizens' AffairsBoard.
2017 Achievements
Goals & Objectives
76
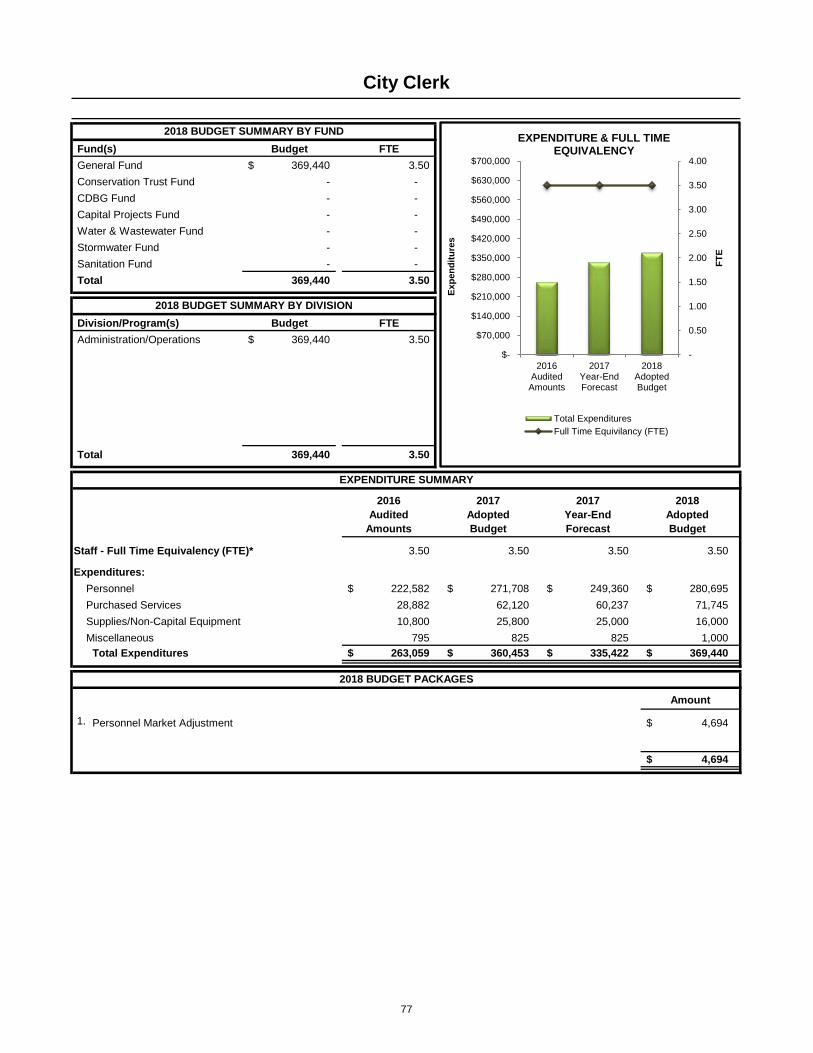
Fund(s) Budget FTEGeneral Fund 369,440$ 3.50 Conservation Trust Fund - - CDBG Fund - - Capital Projects Fund - - Water & Wastewater Fund - - Stormwater Fund - - Sanitation Fund - - Total 369,440 3.50
Division/Program(s) Budget FTEAdministration/Operations 369,440$ 3.50
Total 369,440 3.50
2016Audited
Amounts
2017AdoptedBudget
2017Year-EndForecast
2018AdoptedBudget
Staff - Full Time Equivalency (FTE)* 3.50 3.50 3.50 3.50
Expenditures:Personnel 222,582$ 271,708$ 249,360$ 280,695$ Purchased Services 28,882 62,120 60,237 71,745 Supplies/Non-Capital Equipment 10,800 25,800 25,000 16,000 Miscellaneous 795 825 825 1,000
Total Expenditures 263,059$ 360,453$ 335,422$ 369,440$
Amount
4,694$
4,694$
City Clerk
EXPENDITURE SUMMARY
2018 BUDGET SUMMARY BY DIVISION
2018 BUDGET SUMMARY BY FUND
2018 BUDGET PACKAGES
1. Personnel Market Adjustment
-
0.50
1.00
1.50
2.00
2.50
3.00
3.50
4.00
$-
$70,000
$140,000
$210,000
$280,000
$350,000
$420,000
$490,000
$560,000
$630,000
$700,000
2016Audited
Amounts
2017Year-EndForecast
2018AdoptedBudget
FTE
Expe
nditu
res
EXPENDITURE & FULL TIME EQUIVALENCY
Total ExpendituresFull Time Equivilancy (FTE)
77
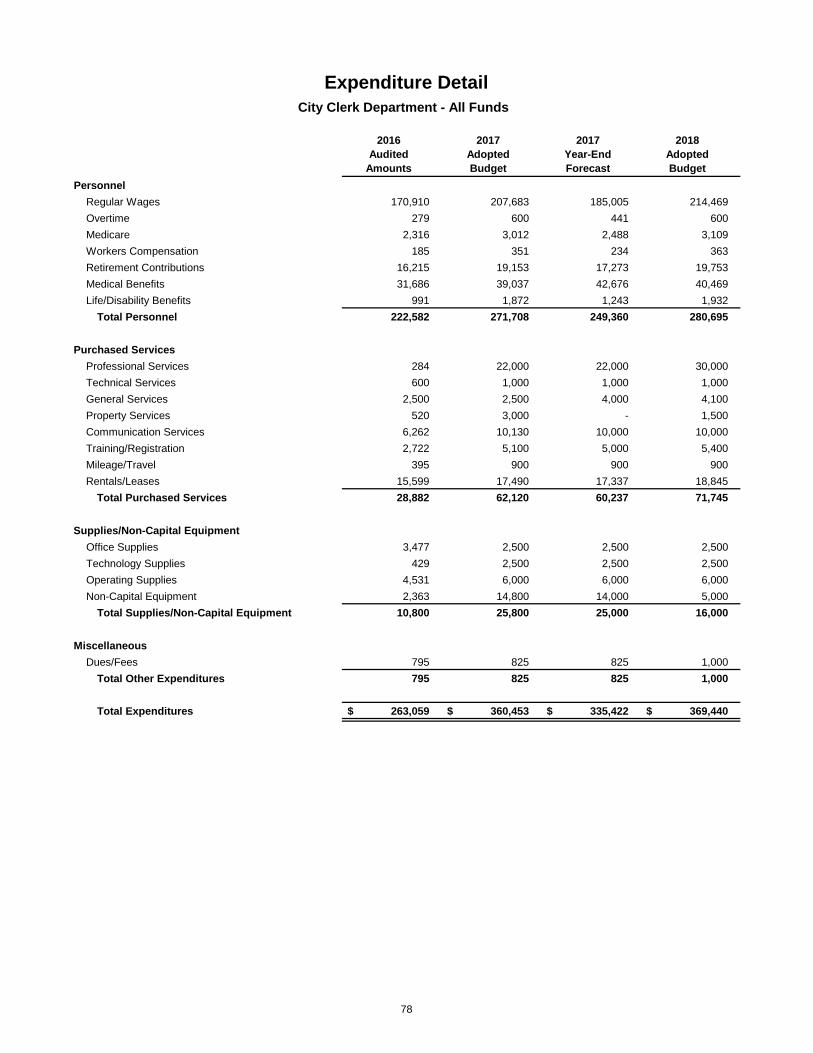
2016Audited
Amounts
2017AdoptedBudget
2017Year-EndForecast
2018AdoptedBudget
PersonnelRegular Wages 170,910 207,683 185,005 214,469 Overtime 279 600 441 600 Medicare 2,316 3,012 2,488 3,109 Workers Compensation 185 351 234 363 Retirement Contributions 16,215 19,153 17,273 19,753 Medical Benefits 31,686 39,037 42,676 40,469 Life/Disability Benefits 991 1,872 1,243 1,932
Total Personnel 222,582 271,708 249,360 280,695
Purchased ServicesProfessional Services 284 22,000 22,000 30,000 Technical Services 600 1,000 1,000 1,000 General Services 2,500 2,500 4,000 4,100 Property Services 520 3,000 - 1,500 Communication Services 6,262 10,130 10,000 10,000 Training/Registration 2,722 5,100 5,000 5,400 Mileage/Travel 395 900 900 900 Rentals/Leases 15,599 17,490 17,337 18,845
Total Purchased Services 28,882 62,120 60,237 71,745
Supplies/Non-Capital EquipmentOffice Supplies 3,477 2,500 2,500 2,500 Technology Supplies 429 2,500 2,500 2,500 Operating Supplies 4,531 6,000 6,000 6,000 Non-Capital Equipment 2,363 14,800 14,000 5,000
Total Supplies/Non-Capital Equipment 10,800 25,800 25,000 16,000
MiscellaneousDues/Fees 795 825 825 1,000
Total Other Expenditures 795 825 825 1,000
Total Expenditures 263,059$ 360,453$ 335,422$ 369,440$
City Clerk Department - All Funds
Expenditure Detail
78

2016Audited
Amounts
2017AdoptedBudget
2017Year-EndForecast
2018AdoptedBudget
PersonnelRegular Wages 170,910 207,683 185,005 214,469 Overtime 279 600 441 600 Medicare 2,316 3,012 2,488 3,109 Workers Compensation 185 351 234 363 Retirement Contributions 16,215 19,153 17,273 19,753 Medical Benefits 31,686 39,037 42,676 40,469 Life/Disability Benefits 991 1,872 1,243 1,932
Total Personnel 222,582 271,708 249,360 280,695
Purchased ServicesProfessional Services 284 22,000 22,000 30,000 Technical Services 600 1,000 1,000 1,000 General Services 2,500 2,500 4,000 4,100 Property Services 520 3,000 - 1,500 Communication Services 6,262 10,130 10,000 10,000 Training/Registration 2,722 5,100 5,000 5,400 Mileage/Travel 395 900 900 900 Rentals/Leases 15,599 17,490 17,337 18,845
Total Purchased Services 28,882 62,120 60,237 71,745
Supplies/Non-Capital EquipmentOffice Supplies 3,477 2,500 2,500 2,500 Technology Supplies 429 2,500 2,500 2,500 Operating Supplies 4,531 6,000 6,000 6,000 Non-Capital Equipment 2,363 14,800 14,000 5,000
Total Supplies/Non-Capital Equipment 10,800 25,800 25,000 16,000
MiscellaneousDues/Fees 795 825 825 1,000
Total Other Expenditures 795 825 825 1,000
Total Expenditures 263,059$ 360,453$ 335,422$ 369,440$
City Clerk Department - General Fund
Expenditure Detail
79
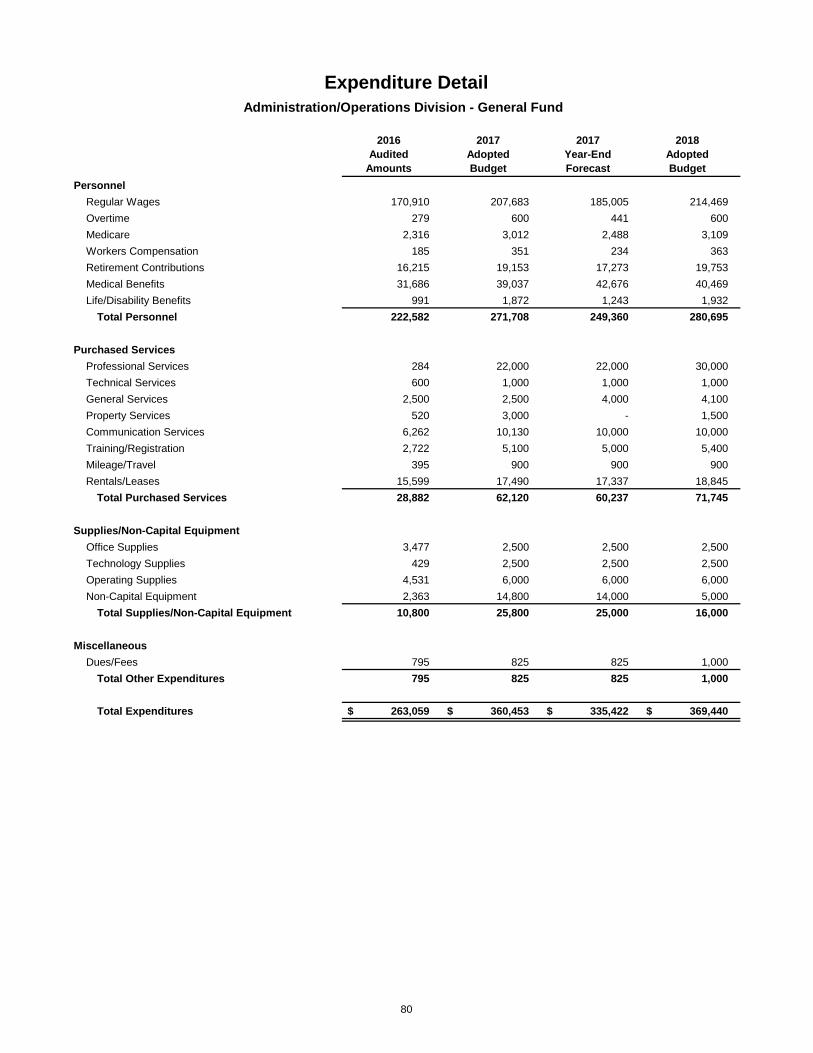
2016Audited
Amounts
2017AdoptedBudget
2017Year-EndForecast
2018AdoptedBudget
PersonnelRegular Wages 170,910 207,683 185,005 214,469 Overtime 279 600 441 600 Medicare 2,316 3,012 2,488 3,109 Workers Compensation 185 351 234 363 Retirement Contributions 16,215 19,153 17,273 19,753 Medical Benefits 31,686 39,037 42,676 40,469 Life/Disability Benefits 991 1,872 1,243 1,932
Total Personnel 222,582 271,708 249,360 280,695
Purchased ServicesProfessional Services 284 22,000 22,000 30,000 Technical Services 600 1,000 1,000 1,000 General Services 2,500 2,500 4,000 4,100 Property Services 520 3,000 - 1,500 Communication Services 6,262 10,130 10,000 10,000 Training/Registration 2,722 5,100 5,000 5,400 Mileage/Travel 395 900 900 900 Rentals/Leases 15,599 17,490 17,337 18,845
Total Purchased Services 28,882 62,120 60,237 71,745
Supplies/Non-Capital EquipmentOffice Supplies 3,477 2,500 2,500 2,500 Technology Supplies 429 2,500 2,500 2,500 Operating Supplies 4,531 6,000 6,000 6,000 Non-Capital Equipment 2,363 14,800 14,000 5,000
Total Supplies/Non-Capital Equipment 10,800 25,800 25,000 16,000
MiscellaneousDues/Fees 795 825 825 1,000
Total Other Expenditures 795 825 825 1,000
Total Expenditures 263,059$ 360,453$ 335,422$ 369,440$
Expenditure DetailAdministration/Operations Division - General Fund
80

81
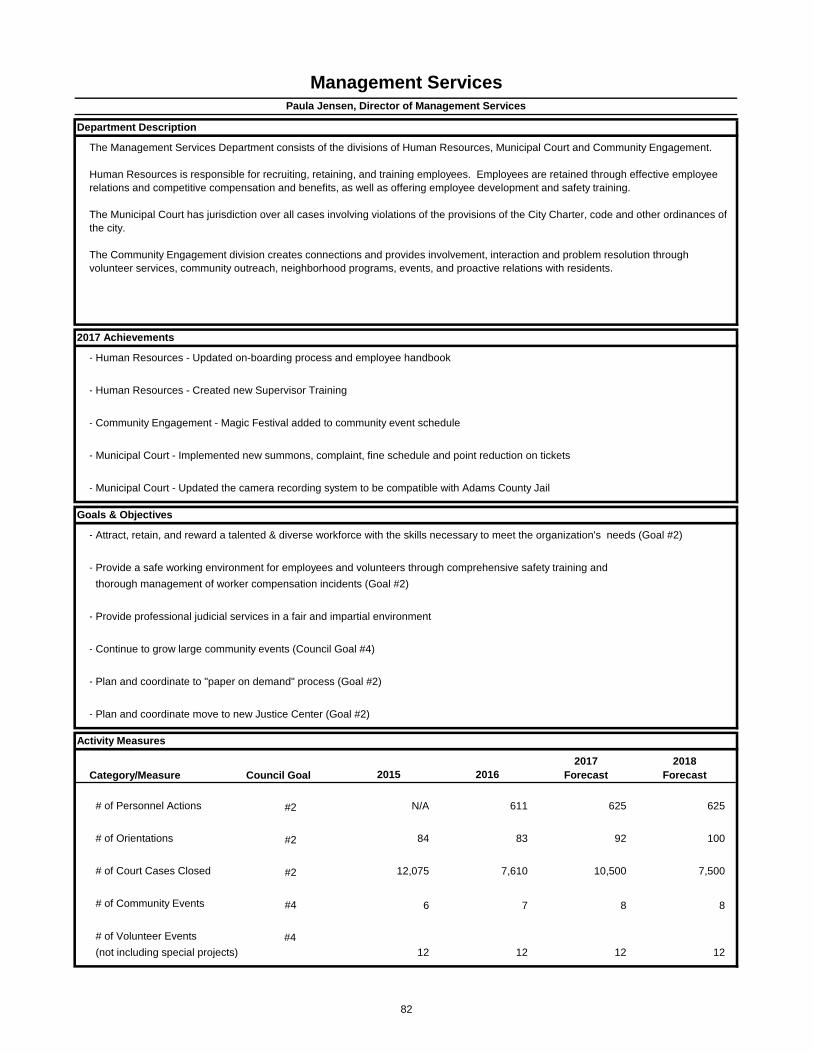
-
-
-
-
- Municipal Court - Updated the camera recording system to be compatible with Adams County Jail
- Attract, retain, and reward a talented & diverse workforce with the skills necessary to meet the organization's needs (Goal #2)
- Provide a safe working environment for employees and volunteers through comprehensive safety training and thorough management of worker compensation incidents (Goal #2)
- Provide professional judicial services in a fair and impartial environment
- Continue to grow large community events (Council Goal #4)
-
-
Category/Measure Council Goal 2015 20162017
Forecast2018
Forecast
# of Personnel Actions #2 N/A 611 625 625
# of Orientations #2 84 83 92 100
# of Court Cases Closed #2 12,075 7,610 10,500 7,500
# of Community Events #4 6 7 8 8
# of Volunteer Events #4(not including special projects) 12 12 12 12
Activity Measures
Management ServicesPaula Jensen, Director of Management Services
Department Description
2017 Achievements
Goals & Objectives
The Management Services Department consists of the divisions of Human Resources, Municipal Court and Community Engagement.
Human Resources is responsible for recruiting, retaining, and training employees. Employees are retained through effective employee relations and competitive compensation and benefits, as well as offering employee development and safety training.
The Municipal Court has jurisdiction over all cases involving violations of the provisions of the City Charter, code and other ordinances of the city.
The Community Engagement division creates connections and provides involvement, interaction and problem resolution through volunteer services, community outreach, neighborhood programs, events, and proactive relations with residents.
Human Resources - Updated on-boarding process and employee handbook
Human Resources - Created new Supervisor Training
Community Engagement - Magic Festival added to community event schedule
Municipal Court - Implemented new summons, complaint, fine schedule and point reduction on tickets
Plan and coordinate to "paper on demand" process (Goal #2)
Plan and coordinate move to new Justice Center (Goal #2)
82
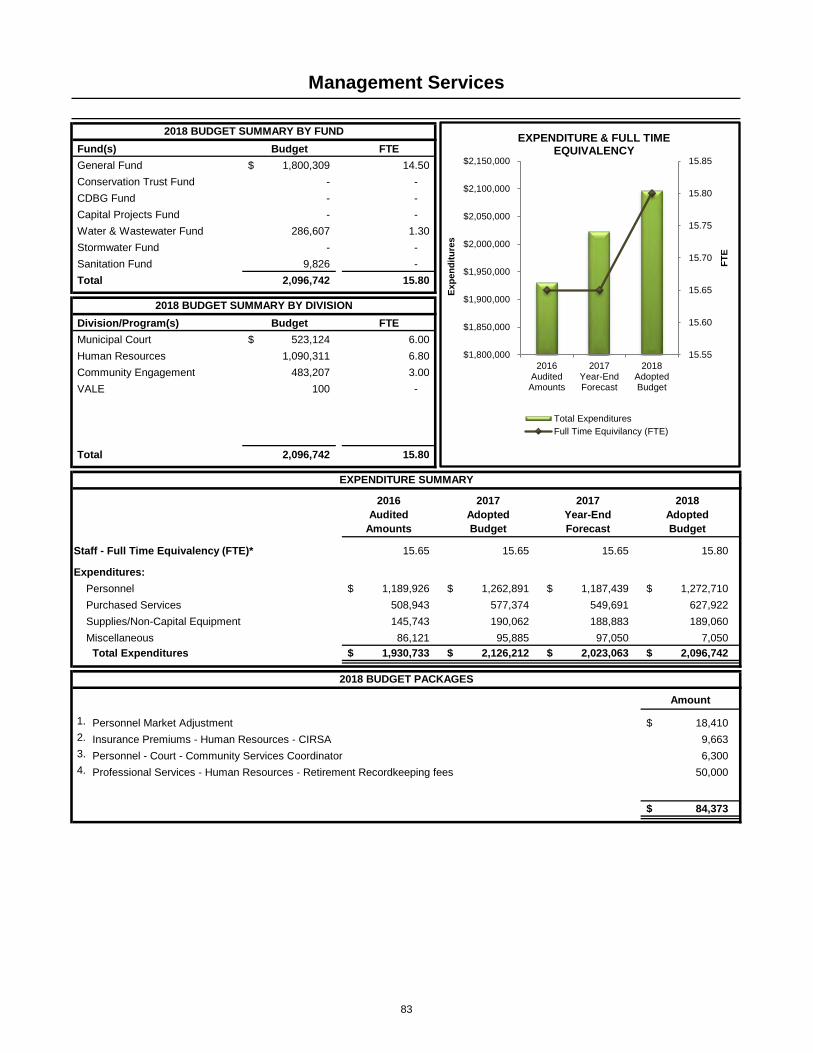
Fund(s) Budget FTEGeneral Fund 1,800,309$ 14.50 Conservation Trust Fund - - CDBG Fund - - Capital Projects Fund - - Water & Wastewater Fund 286,607 1.30 Stormwater Fund - - Sanitation Fund 9,826 - Total 2,096,742 15.80
Division/Program(s) Budget FTEMunicipal Court 523,124$ 6.00 Human Resources 1,090,311 6.80 Community Engagement 483,207 3.00 VALE 100 -
Total 2,096,742 15.80
2016Audited
Amounts
2017AdoptedBudget
2017Year-EndForecast
2018AdoptedBudget
Staff - Full Time Equivalency (FTE)* 15.65 15.65 15.65 15.80
Expenditures:Personnel 1,189,926$ 1,262,891$ 1,187,439$ 1,272,710$ Purchased Services 508,943 577,374 549,691 627,922 Supplies/Non-Capital Equipment 145,743 190,062 188,883 189,060 Miscellaneous 86,121 95,885 97,050 7,050
Total Expenditures 1,930,733$ 2,126,212$ 2,023,063$ 2,096,742$
Amount
18,410$ 9,663 6,300
50,000
84,373$
Management Services
EXPENDITURE SUMMARY
2018 BUDGET SUMMARY BY DIVISION
2018 BUDGET SUMMARY BY FUND
2018 BUDGET PACKAGES
2.
Personnel - Court - Community Services Coordinator4. Professional Services - Human Resources - Retirement Recordkeeping fees
1. Personnel Market Adjustment Insurance Premiums - Human Resources - CIRSA
3.
15.55
15.60
15.65
15.70
15.75
15.80
15.85
$1,800,000
$1,850,000
$1,900,000
$1,950,000
$2,000,000
$2,050,000
$2,100,000
$2,150,000
2016Audited
Amounts
2017Year-EndForecast
2018AdoptedBudget
FTE
Expe
nditu
res
EXPENDITURE & FULL TIME EQUIVALENCY
Total ExpendituresFull Time Equivilancy (FTE)
83
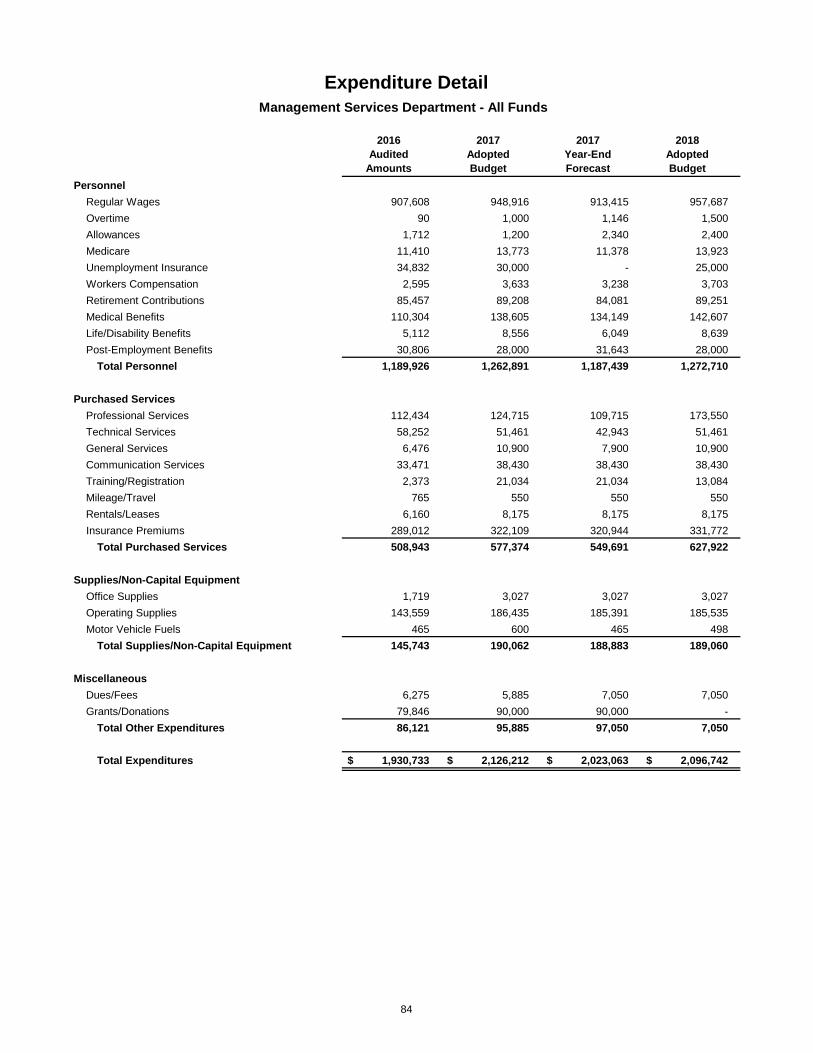
2016Audited
Amounts
2017AdoptedBudget
2017Year-EndForecast
2018AdoptedBudget
PersonnelRegular Wages 907,608 948,916 913,415 957,687 Overtime 90 1,000 1,146 1,500 Allowances 1,712 1,200 2,340 2,400 Medicare 11,410 13,773 11,378 13,923 Unemployment Insurance 34,832 30,000 - 25,000 Workers Compensation 2,595 3,633 3,238 3,703 Retirement Contributions 85,457 89,208 84,081 89,251 Medical Benefits 110,304 138,605 134,149 142,607 Life/Disability Benefits 5,112 8,556 6,049 8,639 Post-Employment Benefits 30,806 28,000 31,643 28,000
Total Personnel 1,189,926 1,262,891 1,187,439 1,272,710
Purchased ServicesProfessional Services 112,434 124,715 109,715 173,550 Technical Services 58,252 51,461 42,943 51,461 General Services 6,476 10,900 7,900 10,900 Communication Services 33,471 38,430 38,430 38,430 Training/Registration 2,373 21,034 21,034 13,084 Mileage/Travel 765 550 550 550 Rentals/Leases 6,160 8,175 8,175 8,175 Insurance Premiums 289,012 322,109 320,944 331,772
Total Purchased Services 508,943 577,374 549,691 627,922
Supplies/Non-Capital EquipmentOffice Supplies 1,719 3,027 3,027 3,027 Operating Supplies 143,559 186,435 185,391 185,535 Motor Vehicle Fuels 465 600 465 498
Total Supplies/Non-Capital Equipment 145,743 190,062 188,883 189,060
MiscellaneousDues/Fees 6,275 5,885 7,050 7,050 Grants/Donations 79,846 90,000 90,000 -
Total Other Expenditures 86,121 95,885 97,050 7,050
Total Expenditures 1,930,733$ 2,126,212$ 2,023,063$ 2,096,742$
Management Services Department - All Funds
Expenditure Detail
84

2016Audited
Amounts
2017AdoptedBudget
2017Year-EndForecast
2018AdoptedBudget
PersonnelRegular Wages 793,823 828,929 810,124 838,625 Overtime 90 1,000 1,146 1,500 Allowances 1,698 1,200 2,340 2,400 Medicare 9,769 12,034 9,917 12,196 Unemployment Insurance 31,520 25,000 - 25,000 Workers Compensation 2,468 3,429 3,106 3,501 Retirement Contributions 74,079 77,821 74,064 77,883 Medical Benefits 103,460 126,060 122,256 128,962 Life/Disability Benefits 4,488 7,475 5,323 7,561 Post-Employment Benefits 27,662 28,000 28,000 28,000
Total Personnel 1,049,057 1,110,948 1,056,276 1,125,628
Purchased ServicesProfessional Services 112,434 124,715 109,715 153,550 Technical Services 58,252 51,461 42,943 51,461 General Services 6,476 10,900 7,900 10,900 Communication Services 33,036 37,810 37,810 37,810 Training/Registration 2,373 21,034 21,034 13,084 Mileage/Travel 765 550 550 550 Rentals/Leases 6,160 8,175 8,175 8,175 Insurance Premiums 171,449 197,127 195,962 203,041
Total Purchased Services 390,945 451,772 424,089 478,571
Supplies/Non-Capital EquipmentOffice Supplies 1,719 3,027 3,027 3,027 Operating Supplies 143,559 186,435 185,391 185,535 Motor Vehicle Fuels 465 600 465 498
Total Supplies/Non-Capital Equipment 145,743 190,062 188,883 189,060
MiscellaneousDues/Fees 6,275 5,885 7,050 7,050 Grants/Donations 79,846 90,000 90,000 -
Total Other Expenditures 86,121 95,885 97,050 7,050
Total Expenditures 1,671,866$ 1,848,667$ 1,766,298$ 1,800,309$
Management Services Department - General Fund
Expenditure Detail
85
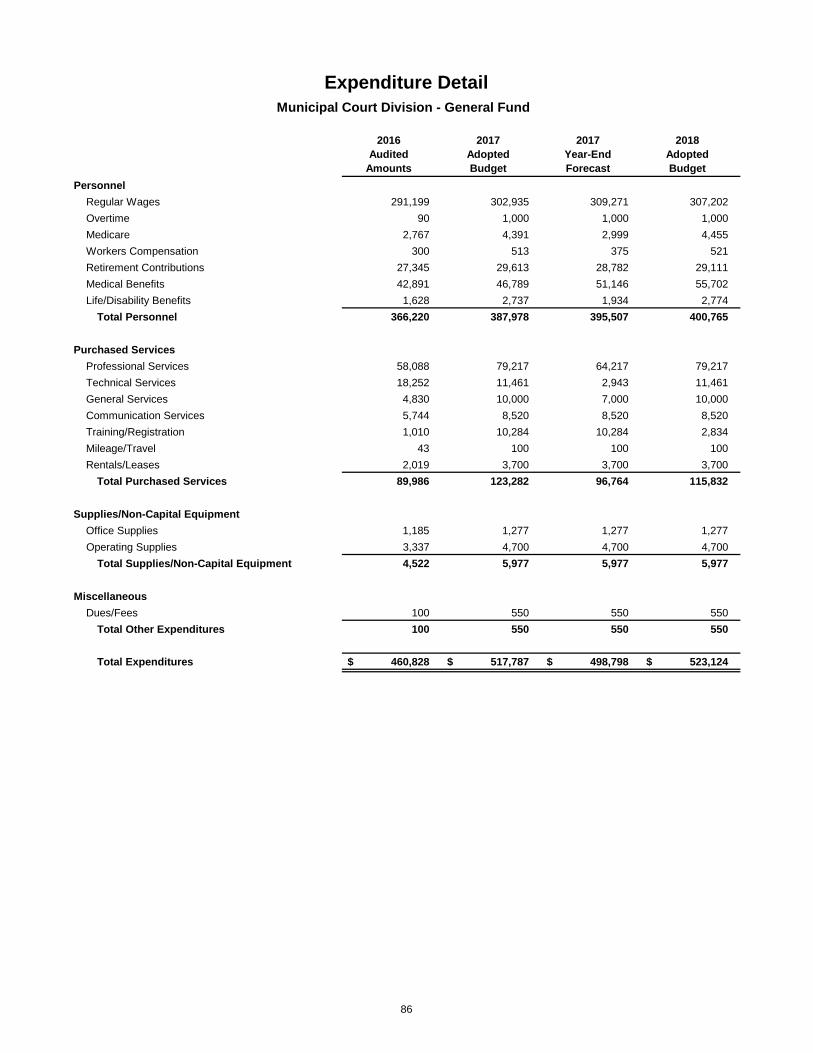
2016Audited
Amounts
2017AdoptedBudget
2017Year-EndForecast
2018AdoptedBudget
PersonnelRegular Wages 291,199 302,935 309,271 307,202 Overtime 90 1,000 1,000 1,000 Medicare 2,767 4,391 2,999 4,455 Workers Compensation 300 513 375 521 Retirement Contributions 27,345 29,613 28,782 29,111 Medical Benefits 42,891 46,789 51,146 55,702 Life/Disability Benefits 1,628 2,737 1,934 2,774
Total Personnel 366,220 387,978 395,507 400,765
Purchased ServicesProfessional Services 58,088 79,217 64,217 79,217 Technical Services 18,252 11,461 2,943 11,461 General Services 4,830 10,000 7,000 10,000 Communication Services 5,744 8,520 8,520 8,520 Training/Registration 1,010 10,284 10,284 2,834 Mileage/Travel 43 100 100 100 Rentals/Leases 2,019 3,700 3,700 3,700
Total Purchased Services 89,986 123,282 96,764 115,832
Supplies/Non-Capital EquipmentOffice Supplies 1,185 1,277 1,277 1,277 Operating Supplies 3,337 4,700 4,700 4,700
Total Supplies/Non-Capital Equipment 4,522 5,977 5,977 5,977
MiscellaneousDues/Fees 100 550 550 550
Total Other Expenditures 100 550 550 550
Total Expenditures 460,828$ 517,787$ 498,798$ 523,124$
Expenditure DetailMunicipal Court Division - General Fund
86
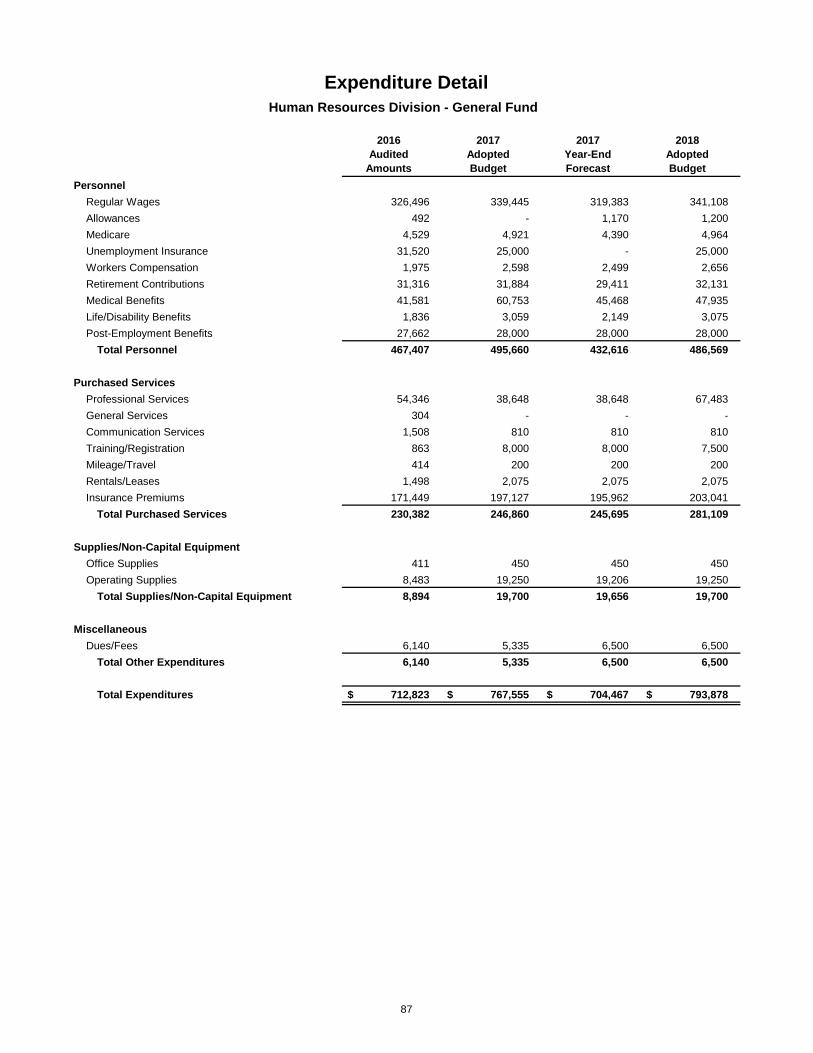
2016Audited
Amounts
2017AdoptedBudget
2017Year-EndForecast
2018AdoptedBudget
PersonnelRegular Wages 326,496 339,445 319,383 341,108 Allowances 492 - 1,170 1,200 Medicare 4,529 4,921 4,390 4,964 Unemployment Insurance 31,520 25,000 - 25,000 Workers Compensation 1,975 2,598 2,499 2,656 Retirement Contributions 31,316 31,884 29,411 32,131 Medical Benefits 41,581 60,753 45,468 47,935 Life/Disability Benefits 1,836 3,059 2,149 3,075 Post-Employment Benefits 27,662 28,000 28,000 28,000
Total Personnel 467,407 495,660 432,616 486,569
Purchased ServicesProfessional Services 54,346 38,648 38,648 67,483 General Services 304 - - - Communication Services 1,508 810 810 810 Training/Registration 863 8,000 8,000 7,500 Mileage/Travel 414 200 200 200 Rentals/Leases 1,498 2,075 2,075 2,075 Insurance Premiums 171,449 197,127 195,962 203,041
Total Purchased Services 230,382 246,860 245,695 281,109
Supplies/Non-Capital EquipmentOffice Supplies 411 450 450 450 Operating Supplies 8,483 19,250 19,206 19,250
Total Supplies/Non-Capital Equipment 8,894 19,700 19,656 19,700
MiscellaneousDues/Fees 6,140 5,335 6,500 6,500
Total Other Expenditures 6,140 5,335 6,500 6,500
Total Expenditures 712,823$ 767,555$ 704,467$ 793,878$
Expenditure DetailHuman Resources Division - General Fund
87
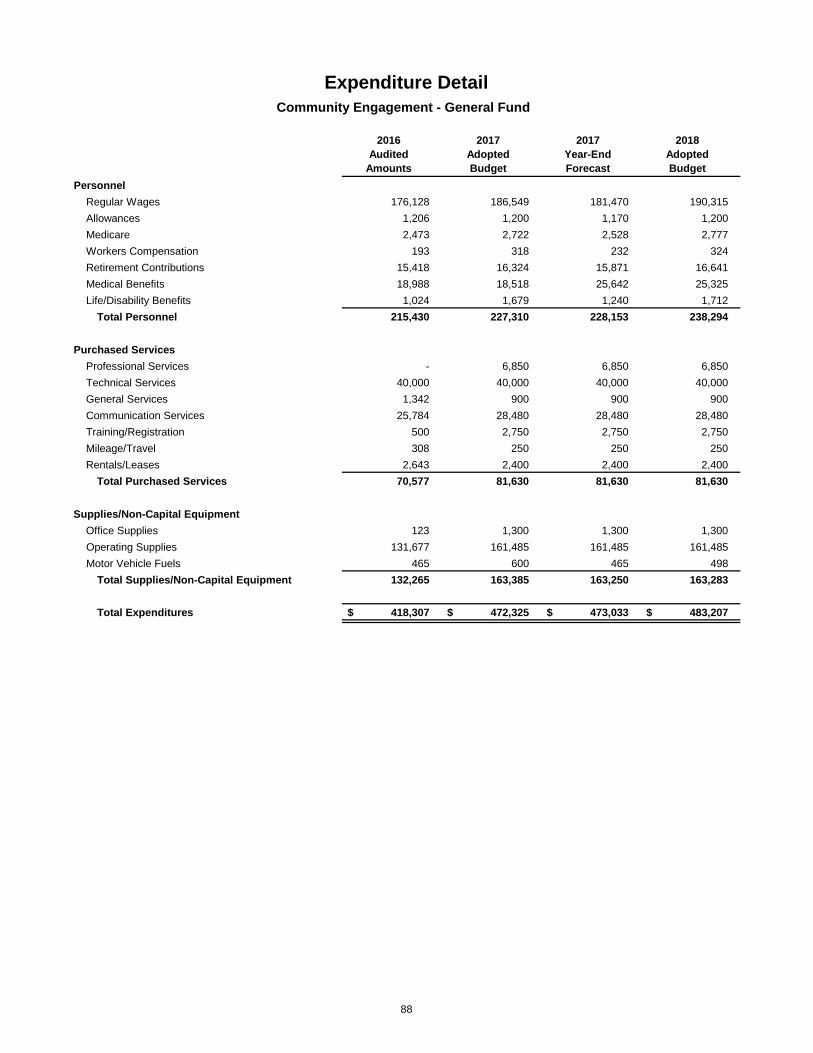
2016Audited
Amounts
2017AdoptedBudget
2017Year-EndForecast
2018AdoptedBudget
PersonnelRegular Wages 176,128 186,549 181,470 190,315 Allowances 1,206 1,200 1,170 1,200 Medicare 2,473 2,722 2,528 2,777 Workers Compensation 193 318 232 324 Retirement Contributions 15,418 16,324 15,871 16,641 Medical Benefits 18,988 18,518 25,642 25,325 Life/Disability Benefits 1,024 1,679 1,240 1,712
Total Personnel 215,430 227,310 228,153 238,294
Purchased ServicesProfessional Services - 6,850 6,850 6,850 Technical Services 40,000 40,000 40,000 40,000 General Services 1,342 900 900 900 Communication Services 25,784 28,480 28,480 28,480 Training/Registration 500 2,750 2,750 2,750 Mileage/Travel 308 250 250 250 Rentals/Leases 2,643 2,400 2,400 2,400
Total Purchased Services 70,577 81,630 81,630 81,630
Supplies/Non-Capital EquipmentOffice Supplies 123 1,300 1,300 1,300 Operating Supplies 131,677 161,485 161,485 161,485 Motor Vehicle Fuels 465 600 465 498
Total Supplies/Non-Capital Equipment 132,265 163,385 163,250 163,283
Total Expenditures 418,307$ 472,325$ 473,033$ 483,207$
Expenditure DetailCommunity Engagement - General Fund
88

2016Audited
Amounts
2017AdoptedBudget
2017Year-EndForecast
2018AdoptedBudget
Supplies/Non-Capital EquipmentOperating Supplies 62 1,000 - 100
Total Supplies/Non-Capital Equipment 62 1,000 - 100
MiscellaneousGrants/Donations 79,846 90,000 90,000 -
Total Other Expenditures 79,846 90,000 90,000 -
Total Expenditures 79,908$ 91,000$ 90,000$ 100$
Expenditure DetailVALE Division - General Fund
89
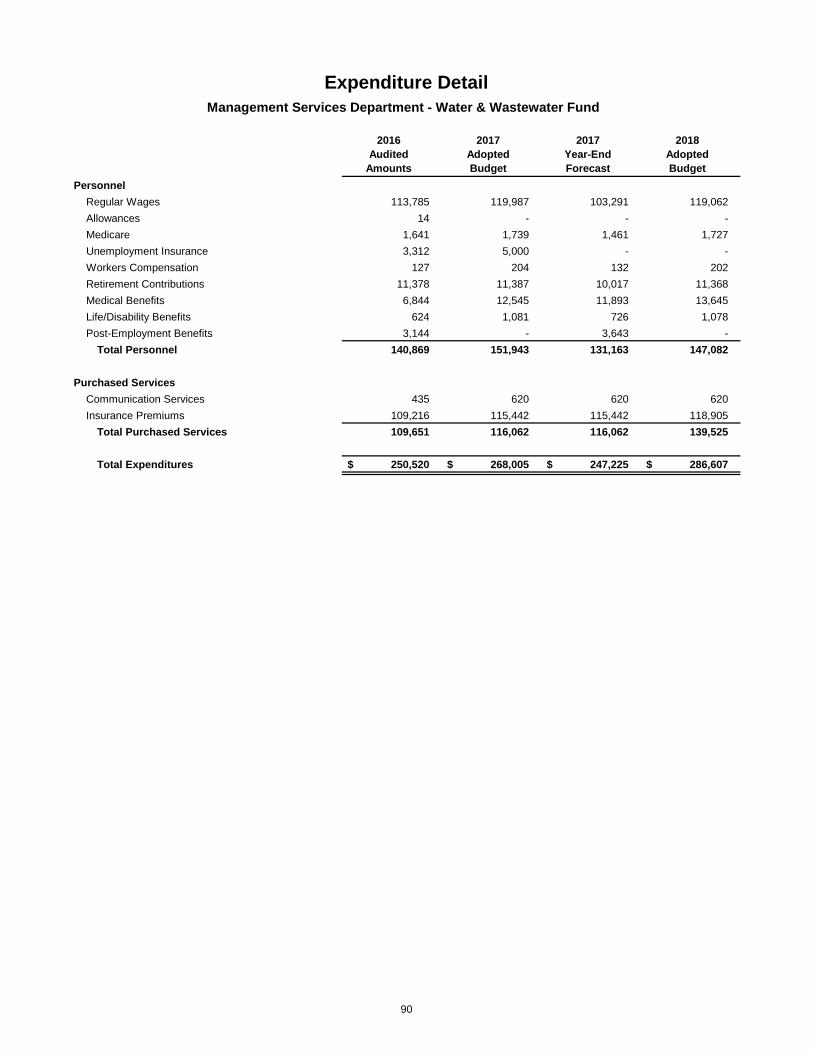
2016Audited
Amounts
2017AdoptedBudget
2017Year-EndForecast
2018AdoptedBudget
PersonnelRegular Wages 113,785 119,987 103,291 119,062 Allowances 14 - - - Medicare 1,641 1,739 1,461 1,727 Unemployment Insurance 3,312 5,000 - - Workers Compensation 127 204 132 202 Retirement Contributions 11,378 11,387 10,017 11,368 Medical Benefits 6,844 12,545 11,893 13,645 Life/Disability Benefits 624 1,081 726 1,078 Post-Employment Benefits 3,144 - 3,643 -
Total Personnel 140,869 151,943 131,163 147,082
Purchased ServicesCommunication Services 435 620 620 620 Insurance Premiums 109,216 115,442 115,442 118,905
Total Purchased Services 109,651 116,062 116,062 139,525
Total Expenditures 250,520$ 268,005$ 247,225$ 286,607$
Management Services Department - Water & Wastewater Fund
Expenditure Detail
90

2016Audited
Amounts
2017AdoptedBudget
2017Year-EndForecast
2018AdoptedBudget
PersonnelRegular Wages 113,785 119,987 103,291 119,062 Allowances 14 - - - Medicare 1,641 1,739 1,461 1,727 Unemployment Insurance 3,312 5,000 - - Workers Compensation 127 204 132 202 Retirement Contributions 11,378 11,387 10,017 11,368 Medical Benefits 6,844 12,545 11,893 13,645 Life/Disability Benefits 624 1,081 726 1,078 Post-Employment Benefits 3,144 - 3,643 -
Total Personnel 140,869 151,943 131,163 147,082
Purchased ServicesCommunication Services 435 620 620 620 Insurance Premiums 109,216 115,442 115,442 118,905
Total Purchased Services 109,651 116,062 116,062 139,525
Total Expenditures 250,520$ 268,005$ 247,225$ 286,607$
Expenditure DetailHuman Resources Division - Water & Wastewater Fund
91

2016Audited
Amounts
2017AdoptedBudget
2017Year-EndForecast
2018AdoptedBudget
Purchased ServicesInsurance Premiums 8,347 9,540 9,540 9,826
Total Purchased Services 8,347 9,540 9,540 9,826
Total Expenditures 8,347$ 9,540$ 9,540$ 9,826$
Management Services Department - Sanitation Fund
Expenditure Detail
92

2016Audited
Amounts
2017AdoptedBudget
2017Year-EndForecast
2018AdoptedBudget
Purchased ServicesInsurance Premiums 8,347 9,540 9,540 9,826
Total Purchased Services 8,347 9,540 9,540 9,826
Total Expenditures 8,347$ 9,540$ 9,540$ 9,826$
Human Resources Division - Sanitation Fund
Expenditure Detail
93
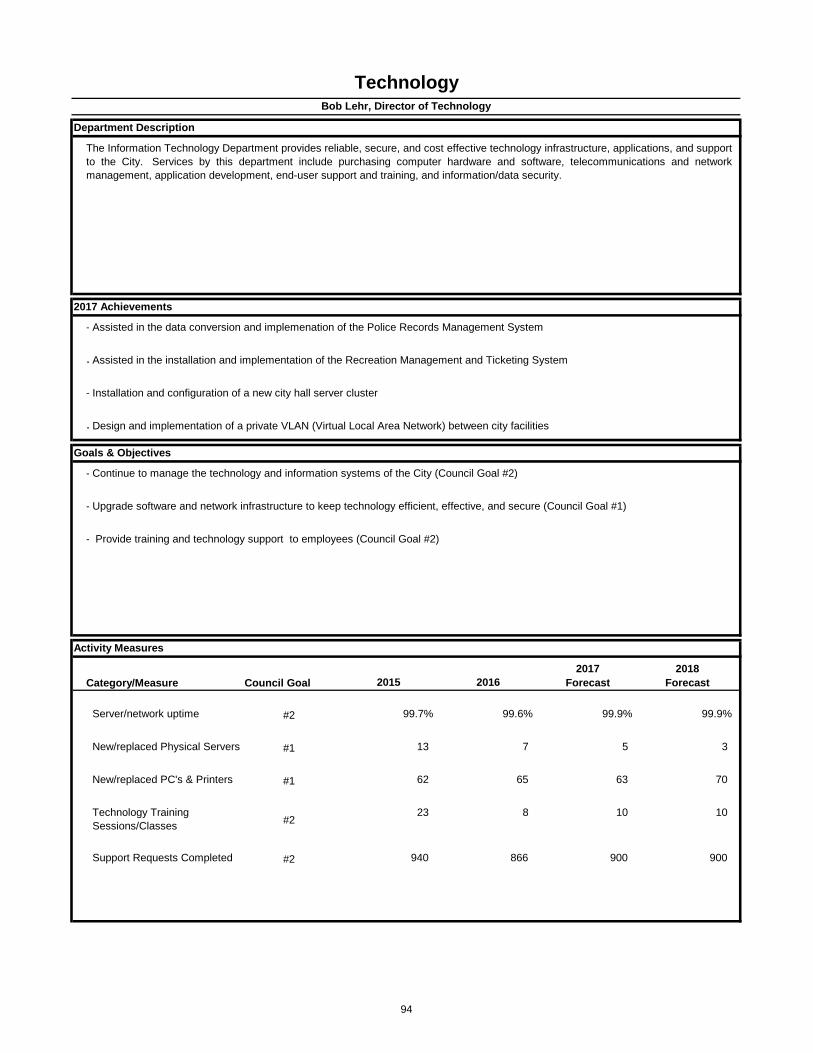
-
-
- Installation and configuration of a new city hall server cluster
-
- Continue to manage the technology and information systems of the City (Council Goal #2)
- Upgrade software and network infrastructure to keep technology efficient, effective, and secure (Council Goal #1)
- Provide training and technology support to employees (Council Goal #2)
Category/Measure Council Goal 2015 20162017
Forecast2018
Forecast
Server/network uptime #2 99.7% 99.6% 99.9% 99.9%
New/replaced Physical Servers #1 13 7 5 3
New/replaced PC's & Printers #1 62 65 63 70
Technology Training Sessions/Classes #2
23 8 10 10
Support Requests Completed #2 940 866 900 900
Activity Measures
TechnologyBob Lehr, Director of Technology
Department Description
The Information Technology Department provides reliable, secure, and cost effective technology infrastructure, applications, and supportto the City. Services by this department include purchasing computer hardware and software, telecommunications and networkmanagement, application development, end-user support and training, and information/data security.
2017 Achievements
Goals & Objectives
Assisted in the data conversion and implemenation of the Police Records Management System
Assisted in the installation and implementation of the Recreation Management and Ticketing System
Design and implementation of a private VLAN (Virtual Local Area Network) between city facilities
94
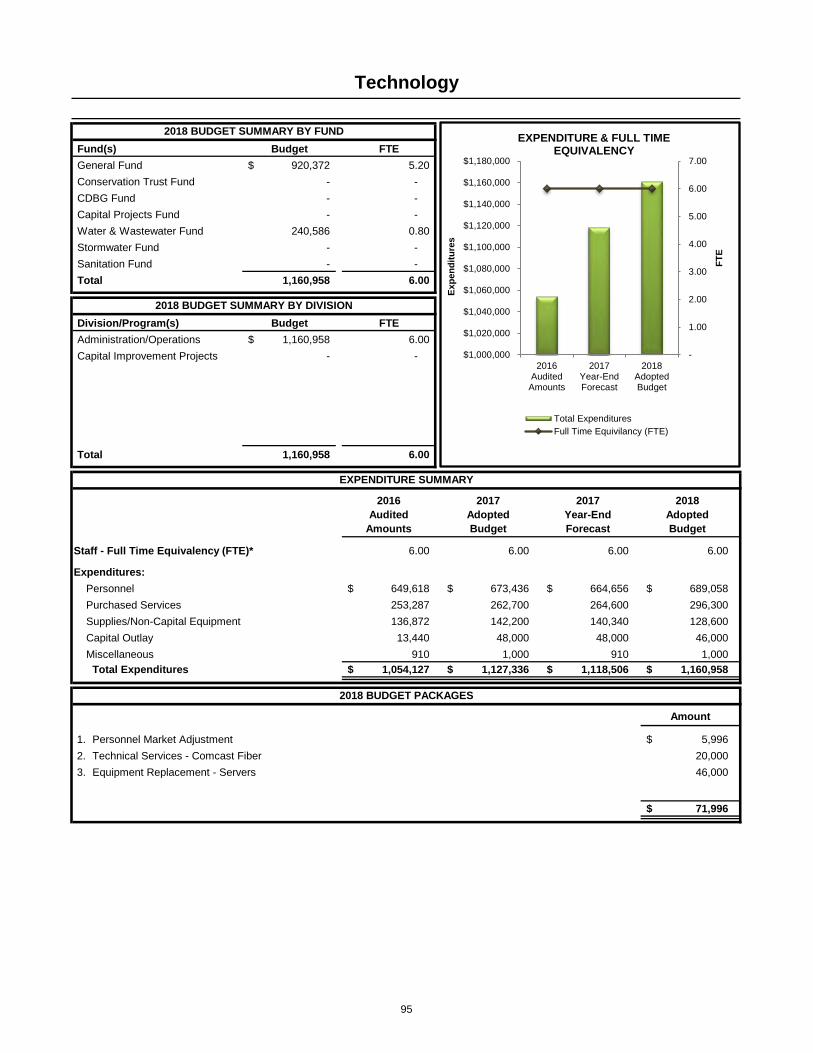
Fund(s) Budget FTEGeneral Fund 920,372$ 5.20 Conservation Trust Fund - - CDBG Fund - - Capital Projects Fund - - Water & Wastewater Fund 240,586 0.80 Stormwater Fund - - Sanitation Fund - - Total 1,160,958 6.00
Division/Program(s) Budget FTEAdministration/Operations 1,160,958$ 6.00 Capital Improvement Projects - -
Total 1,160,958 6.00
2016Audited
Amounts
2017AdoptedBudget
2017Year-EndForecast
2018AdoptedBudget
Staff - Full Time Equivalency (FTE)* 6.00 6.00 6.00 6.00
Expenditures:Personnel 649,618$ 673,436$ 664,656$ 689,058$ Purchased Services 253,287 262,700 264,600 296,300 Supplies/Non-Capital Equipment 136,872 142,200 140,340 128,600 Capital Outlay 13,440 48,000 48,000 46,000 Miscellaneous 910 1,000 910 1,000
Total Expenditures 1,054,127$ 1,127,336$ 1,118,506$ 1,160,958$
Amount
5,996$ 20,000 46,000
71,996$
2.
Technology
EXPENDITURE SUMMARY
2018 BUDGET SUMMARY BY DIVISION
2018 BUDGET SUMMARY BY FUND
2018 BUDGET PACKAGES
1. Personnel Market Adjustment Technical Services - Comcast Fiber
3. Equipment Replacement - Servers
-
1.00
2.00
3.00
4.00
5.00
6.00
7.00
$1,000,000
$1,020,000
$1,040,000
$1,060,000
$1,080,000
$1,100,000
$1,120,000
$1,140,000
$1,160,000
$1,180,000
2016Audited
Amounts
2017Year-EndForecast
2018AdoptedBudget
FTE
Expe
nditu
res
EXPENDITURE & FULL TIME EQUIVALENCY
Total ExpendituresFull Time Equivilancy (FTE)
95

2016Audited
Amounts
2017AdoptedBudget
2017Year-EndForecast
2018AdoptedBudget
PersonnelRegular Wages 520,758 533,116 524,589 545,258 Medicare 7,329 7,731 7,374 7,908 Workers Compensation 577 905 670 924 Retirement Contributions 52,076 53,313 52,460 54,526 Medical Benefits 65,864 73,581 75,986 75,543 Life/Disability Benefits 3,014 4,790 3,577 4,899
Total Personnel 649,618 673,436 664,656 689,058
Purchased ServicesTechnical Services 129,575 128,000 130,200 159,700 Communication Services 110,054 120,000 120,000 122,900 Internet Services 8,497 9,600 9,200 9,200 Training/Registration 4,740 4,700 4,700 4,000 Rentals/Leases 421 400 500 500
Total Purchased Services 253,287 262,700 264,600 296,300
Supplies/Non-Capital EquipmentOffice Supplies 901 800 800 800 Technology Supplies 41,940 32,200 30,440 18,700 Operating Supplies 40 200 100 100 Non-Capital Equipment 93,991 109,000 109,000 109,000
Total Supplies/Non-Capital Equipment 136,872 142,200 140,340 128,600
Capital OutlayCapital Equipment 13,440 48,000 48,000 46,000
Total Capital Outlay 13,440 48,000 48,000 46,000
MiscellaneousDues/Fees 910 1,000 910 1,000
Total Other Expenditures 910 1,000 910 1,000
Total Expenditures 1,054,127$ 1,127,336$ 1,118,506$ 1,160,958$
Expenditure DetailTechnology Department - All Funds
96
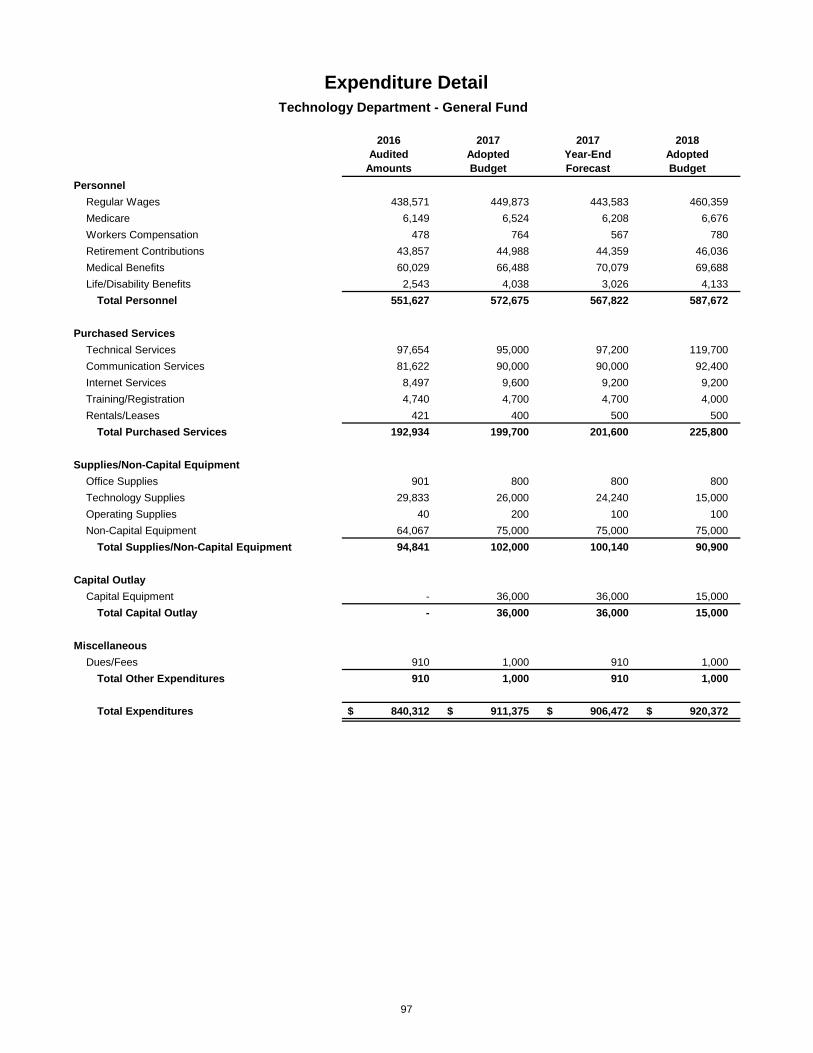
2016Audited
Amounts
2017AdoptedBudget
2017Year-EndForecast
2018AdoptedBudget
PersonnelRegular Wages 438,571 449,873 443,583 460,359 Medicare 6,149 6,524 6,208 6,676 Workers Compensation 478 764 567 780 Retirement Contributions 43,857 44,988 44,359 46,036 Medical Benefits 60,029 66,488 70,079 69,688 Life/Disability Benefits 2,543 4,038 3,026 4,133
Total Personnel 551,627 572,675 567,822 587,672
Purchased ServicesTechnical Services 97,654 95,000 97,200 119,700 Communication Services 81,622 90,000 90,000 92,400 Internet Services 8,497 9,600 9,200 9,200 Training/Registration 4,740 4,700 4,700 4,000 Rentals/Leases 421 400 500 500
Total Purchased Services 192,934 199,700 201,600 225,800
Supplies/Non-Capital EquipmentOffice Supplies 901 800 800 800 Technology Supplies 29,833 26,000 24,240 15,000 Operating Supplies 40 200 100 100 Non-Capital Equipment 64,067 75,000 75,000 75,000
Total Supplies/Non-Capital Equipment 94,841 102,000 100,140 90,900
Capital OutlayCapital Equipment - 36,000 36,000 15,000
Total Capital Outlay - 36,000 36,000 15,000
MiscellaneousDues/Fees 910 1,000 910 1,000
Total Other Expenditures 910 1,000 910 1,000
Total Expenditures 840,312$ 911,375$ 906,472$ 920,372$
Technology Department - General Fund
Expenditure Detail
97
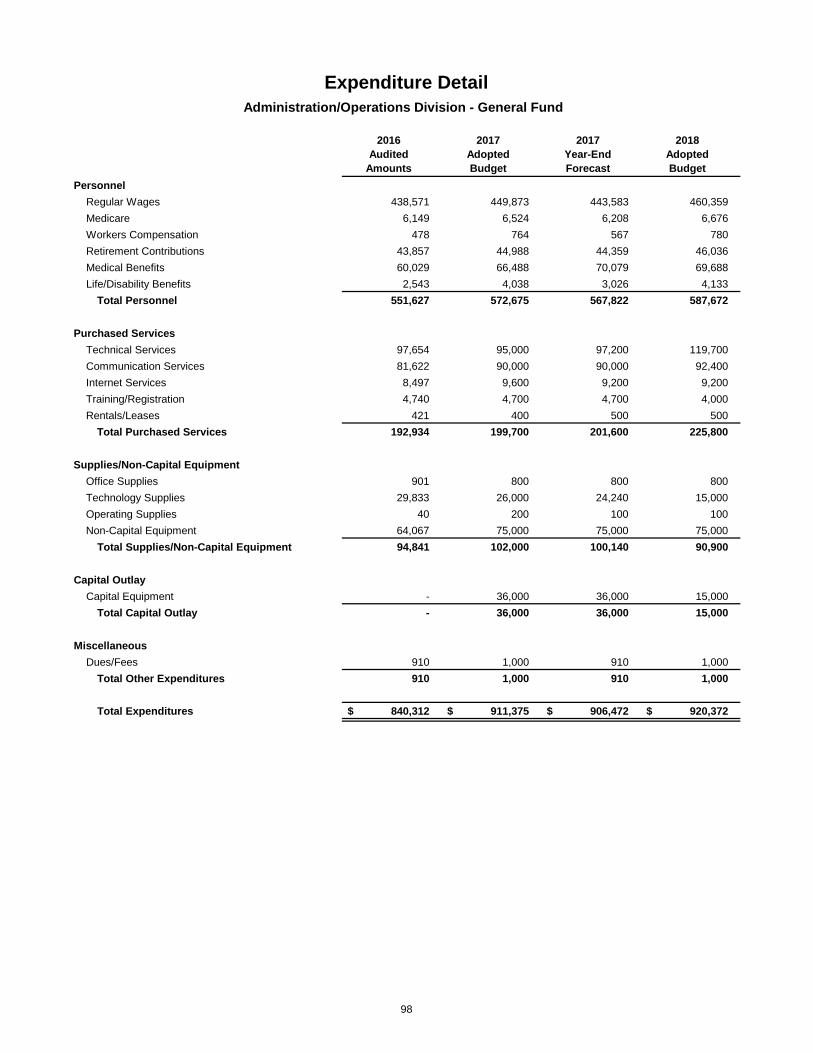
2016Audited
Amounts
2017AdoptedBudget
2017Year-EndForecast
2018AdoptedBudget
PersonnelRegular Wages 438,571 449,873 443,583 460,359 Medicare 6,149 6,524 6,208 6,676 Workers Compensation 478 764 567 780 Retirement Contributions 43,857 44,988 44,359 46,036 Medical Benefits 60,029 66,488 70,079 69,688 Life/Disability Benefits 2,543 4,038 3,026 4,133
Total Personnel 551,627 572,675 567,822 587,672
Purchased ServicesTechnical Services 97,654 95,000 97,200 119,700 Communication Services 81,622 90,000 90,000 92,400 Internet Services 8,497 9,600 9,200 9,200 Training/Registration 4,740 4,700 4,700 4,000 Rentals/Leases 421 400 500 500
Total Purchased Services 192,934 199,700 201,600 225,800
Supplies/Non-Capital EquipmentOffice Supplies 901 800 800 800 Technology Supplies 29,833 26,000 24,240 15,000 Operating Supplies 40 200 100 100 Non-Capital Equipment 64,067 75,000 75,000 75,000
Total Supplies/Non-Capital Equipment 94,841 102,000 100,140 90,900
Capital OutlayCapital Equipment - 36,000 36,000 15,000
Total Capital Outlay - 36,000 36,000 15,000
MiscellaneousDues/Fees 910 1,000 910 1,000
Total Other Expenditures 910 1,000 910 1,000
Total Expenditures 840,312$ 911,375$ 906,472$ 920,372$
Expenditure DetailAdministration/Operations Division - General Fund
98
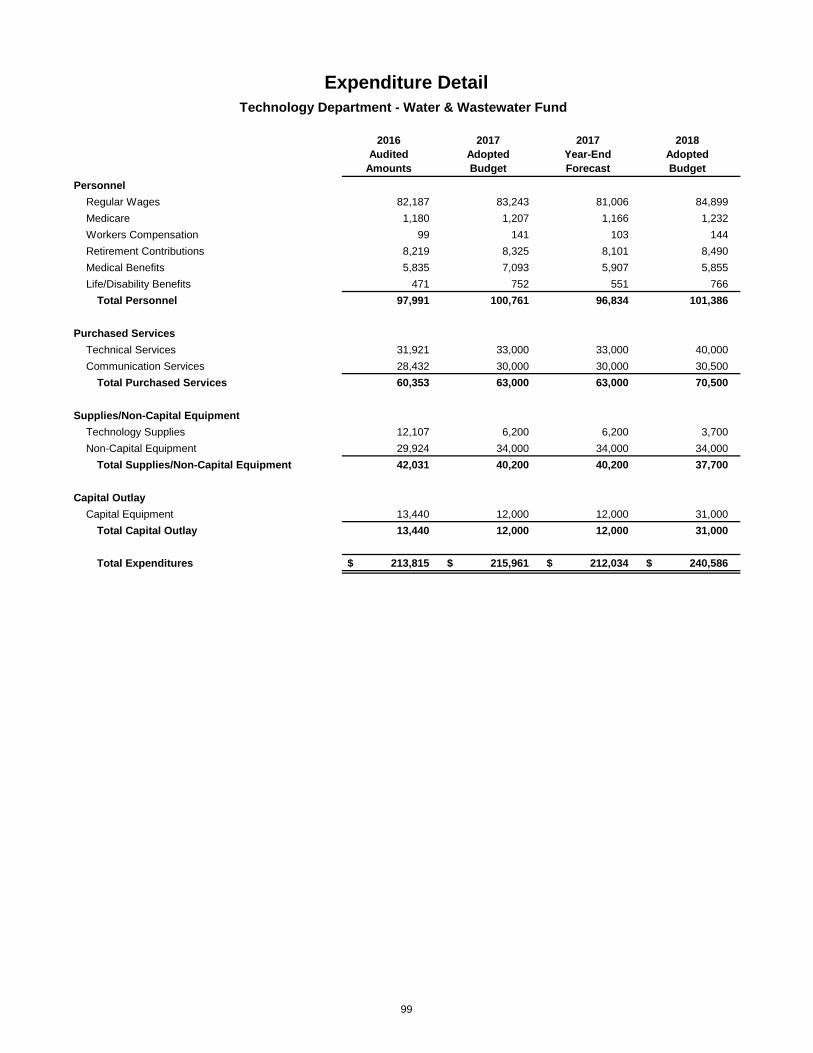
2016Audited
Amounts
2017AdoptedBudget
2017Year-EndForecast
2018AdoptedBudget
PersonnelRegular Wages 82,187 83,243 81,006 84,899 Medicare 1,180 1,207 1,166 1,232 Workers Compensation 99 141 103 144 Retirement Contributions 8,219 8,325 8,101 8,490 Medical Benefits 5,835 7,093 5,907 5,855 Life/Disability Benefits 471 752 551 766
Total Personnel 97,991 100,761 96,834 101,386
Purchased ServicesTechnical Services 31,921 33,000 33,000 40,000 Communication Services 28,432 30,000 30,000 30,500
Total Purchased Services 60,353 63,000 63,000 70,500
Supplies/Non-Capital EquipmentTechnology Supplies 12,107 6,200 6,200 3,700 Non-Capital Equipment 29,924 34,000 34,000 34,000
Total Supplies/Non-Capital Equipment 42,031 40,200 40,200 37,700
Capital OutlayCapital Equipment 13,440 12,000 12,000 31,000
Total Capital Outlay 13,440 12,000 12,000 31,000
Total Expenditures 213,815$ 215,961$ 212,034$ 240,586$
Technology Department - Water & Wastewater Fund
Expenditure Detail
99

2016Audited
Amounts
2017AdoptedBudget
2017Year-EndForecast
2018AdoptedBudget
PersonnelRegular Wages 82,187 83,243 81,006 84,899 Medicare 1,180 1,207 1,166 1,232 Workers Compensation 99 141 103 144 Retirement Contributions 8,219 8,325 8,101 8,490 Medical Benefits 5,835 7,093 5,907 5,855 Life/Disability Benefits 471 752 551 766
Total Personnel 97,991 100,761 96,834 101,386
Purchased ServicesTechnical Services 31,921 33,000 33,000 40,000 Communication Services 28,432 30,000 30,000 30,500
Total Purchased Services 60,353 63,000 63,000 70,500
Supplies/Non-Capital EquipmentTechnology Supplies 12,107 6,200 6,200 3,700 Non-Capital Equipment 29,924 34,000 34,000 34,000
Total Supplies/Non-Capital Equipment 42,031 40,200 40,200 37,700
Capital OutlayCapital Equipment 13,440 12,000 12,000 31,000
Total Capital Outlay 13,440 12,000 12,000 31,000
Total Expenditures 213,815$ 215,961$ 212,034$ 240,586$
Administration/Operations Division - Water & Wastewater Fund
Expenditure Detail
100

101

- Received the Distinguished Budget Presentation Award from the GFOA
- Received the Certificate of Achievement for Excellence in Financial Reporting from the GFOA
- Achieved AA- rating from Standard & Poor's for 2017 Northglenn Justice Center debt issue
- Updated Sales Tax Code as part of the Statewide effort to simplify taxes for Colorado businesses
- Monitor budget forecast accuracy. (Council Goal #2)
- Receive GFOA Distinguished Budget Award. (Council Goal #2)
- Receive GFOA Certificate of Achievement for CAFR. (Council Goal #2)
- Provide monthly financial report in accordance with policy. (Council Goal #2)
Category/Measure Council Goal 2015 20162017
Forecast2018
Forecast
% of General Fund actual expenditures versus original budget +/- 3% #2 2.0% -5.0% -1.0% -1.0%
Consecutive Years GFOA Budget Award Received #2 6 7 8 9
Consecutive Years GFOA CAFR Award Received #2 27 28 29 30
% of time monthly report completed timely #2 100% 100% 100% 100%
Activity Measures
FinanceJason Loveland, Director of Finance
Department Description
The Finance Department is responsible for the administration and recording of all financial activities of the City, including revenuecollection, cash management, accounts payable, payroll, utility billing, sales tax collection, as well as, general accounting and reporting.The Department oversees the procurement function of the City and is responsible for the production of the Annual Operating and CapitalImprovement Budget, and Comprehensive Annual Financial Report.
2017 Achievements
Goals & Objectives
102

Fund(s) Budget FTEGeneral Fund 488,920$ 4.00 Conservation Trust Fund - - CDBG Fund - - Capital Projects Fund - - Water & Wastewater Fund 814,068 7.60 Stormwater Fund - - Sanitation Fund 2,000 - Total 1,304,988 11.60
Division/Program(s) Budget FTEAdministration/Operations 940,817$ 7.00 Utility Billing 364,171 4.60
Total 1,304,988 11.60
2016Audited
Amounts
2017AdoptedBudget
2017Year-EndForecast
2018AdoptedBudget
Staff - Full Time Equivalency (FTE)* 11.60 11.60 11.60 11.60
Expenditures:Personnel 816,166$ 921,832$ 856,457$ 956,888$ Purchased Services 355,233 321,450 325,800 341,250 Supplies/Non-Capital Equipment 5,206 5,250 5,300 5,450 Miscellaneous 1,351 1,400 1,400 1,400
Total Expenditures 1,177,956$ 1,249,932$ 1,188,957$ 1,304,988$
Amount
11,374$ 20,000
31,374$
2. Professional Services - Credit Card processing fees
2018 BUDGET PACKAGES
1. Personnel Market Adjustment
Finance
EXPENDITURE SUMMARY
2018 BUDGET SUMMARY BY DIVISION
2018 BUDGET SUMMARY BY FUND
-
2.00
4.00
6.00
8.00
10.00
12.00
14.00
$1,100,000
$1,150,000
$1,200,000
$1,250,000
$1,300,000
$1,350,000
2016Audited
Amounts
2017Year-EndForecast
2018AdoptedBudget
FTE
Expe
nditu
res
EXPENDITURE & FULL TIME EQUIVALENCY
Total ExpendituresFull Time Equivilancy (FTE)
103
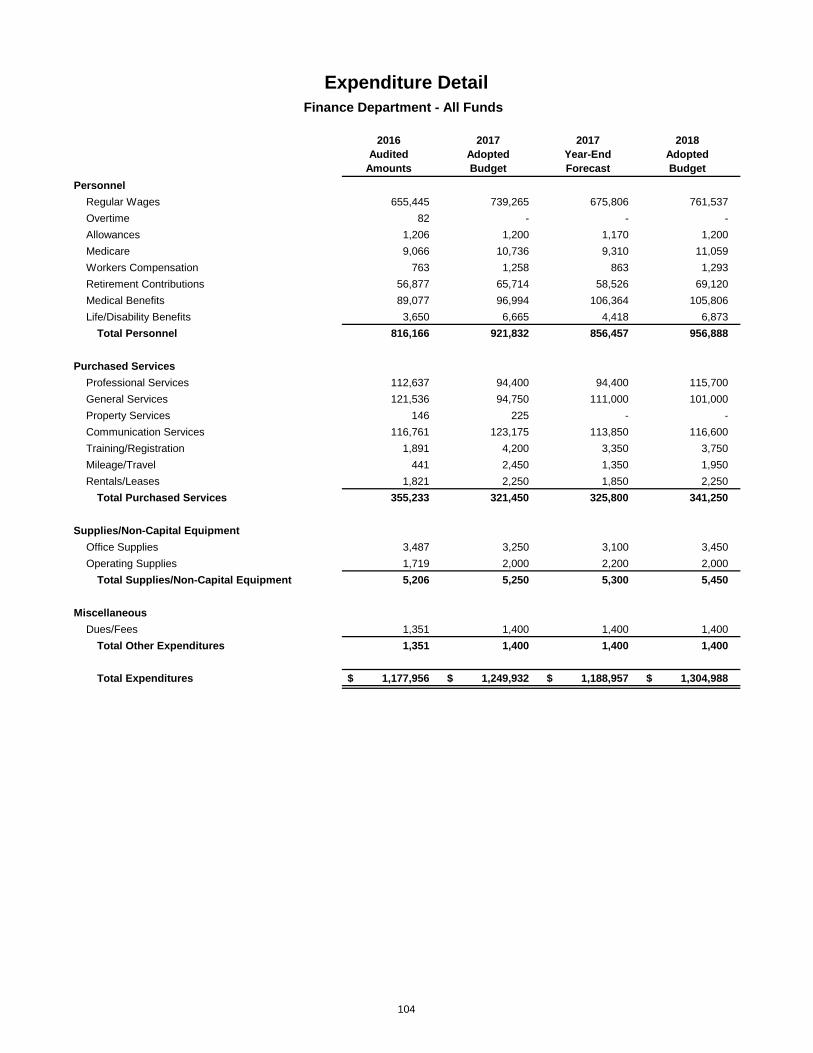
2016Audited
Amounts
2017AdoptedBudget
2017Year-EndForecast
2018AdoptedBudget
PersonnelRegular Wages 655,445 739,265 675,806 761,537 Overtime 82 - - - Allowances 1,206 1,200 1,170 1,200 Medicare 9,066 10,736 9,310 11,059 Workers Compensation 763 1,258 863 1,293 Retirement Contributions 56,877 65,714 58,526 69,120 Medical Benefits 89,077 96,994 106,364 105,806 Life/Disability Benefits 3,650 6,665 4,418 6,873
Total Personnel 816,166 921,832 856,457 956,888
Purchased ServicesProfessional Services 112,637 94,400 94,400 115,700 General Services 121,536 94,750 111,000 101,000 Property Services 146 225 - - Communication Services 116,761 123,175 113,850 116,600 Training/Registration 1,891 4,200 3,350 3,750 Mileage/Travel 441 2,450 1,350 1,950 Rentals/Leases 1,821 2,250 1,850 2,250
Total Purchased Services 355,233 321,450 325,800 341,250
Supplies/Non-Capital EquipmentOffice Supplies 3,487 3,250 3,100 3,450 Operating Supplies 1,719 2,000 2,200 2,000
Total Supplies/Non-Capital Equipment 5,206 5,250 5,300 5,450
MiscellaneousDues/Fees 1,351 1,400 1,400 1,400
Total Other Expenditures 1,351 1,400 1,400 1,400
Total Expenditures 1,177,956$ 1,249,932$ 1,188,957$ 1,304,988$
Expenditure DetailFinance Department - All Funds
104

2016Audited
Amounts
2017AdoptedBudget
2017Year-EndForecast
2018AdoptedBudget
PersonnelRegular Wages 263,432 278,246 270,664 286,859 Allowances 603 600 585 600 Medicare 3,633 4,043 3,728 4,168 Workers Compensation 287 474 346 487 Retirement Contributions 22,707 23,981 23,325 25,176 Medical Benefits 39,352 42,838 46,996 46,741 Life/Disability Benefits 1,524 2,509 1,843 2,589
Total Personnel 331,538 352,691 347,487 366,620
Purchased ServicesProfessional Services 52,929 38,700 38,700 38,700 General Services 31,867 31,000 31,000 31,000 Property Services 146 - - - Communication Services 46,103 43,350 43,350 43,350 Training/Registration 1,223 2,500 2,000 2,500 Mileage/Travel 441 1,200 750 1,200 Rentals/Leases 1,585 2,000 1,600 2,000
Total Purchased Services 134,294 118,750 117,400 118,750
Supplies/Non-Capital EquipmentOffice Supplies 1,834 1,500 1,500 1,500 Operating Supplies 859 1,250 1,250 1,250
Total Supplies/Non-Capital Equipment 2,693 2,750 2,750 2,750
MiscellaneousDues/Fees 753 800 800 800
Total Other Expenditures 753 800 800 800
Total Expenditures 469,278$ 474,991$ 468,437$ 488,920$
Expenditure DetailFinance Department - General Fund
105

2016Audited
Amounts
2017AdoptedBudget
2017Year-EndForecast
2018AdoptedBudget
PersonnelRegular Wages 263,432 278,246 270,664 286,859 Allowances 603 600 585 600 Medicare 3,633 4,043 3,728 4,168 Workers Compensation 287 474 346 487 Retirement Contributions 22,707 23,981 23,325 25,176 Medical Benefits 39,352 42,838 46,996 46,741 Life/Disability Benefits 1,524 2,509 1,843 2,589
Total Personnel 331,538 352,691 347,487 366,620
Purchased ServicesProfessional Services 52,929 38,700 38,700 38,700 General Services 31,867 31,000 31,000 31,000 Property Services 146 - - - Communication Services 46,103 43,350 43,350 43,350 Training/Registration 1,223 2,500 2,000 2,500 Mileage/Travel 441 1,200 750 1,200 Rentals/Leases 1,585 2,000 1,600 2,000
Total Purchased Services 134,294 118,750 117,400 118,750
Supplies/Non-Capital EquipmentOffice Supplies 1,834 1,500 1,500 1,500 Operating Supplies 859 1,250 1,250 1,250
Total Supplies/Non-Capital Equipment 2,693 2,750 2,750 2,750
MiscellaneousDues/Fees 753 800 800 800
Total Other Expenditures 753 800 800 800
Total Expenditures 469,278$ 474,991$ 468,437$ 488,920$
Expenditure DetailAdministration/Operations Division - General Fund
106

2016Audited
Amounts
2017AdoptedBudget
2017Year-EndForecast
2018AdoptedBudget
PersonnelRegular Wages 392,013 461,019 405,142 474,678 Overtime 82 - - - Allowances 603 600 585 600 Medicare 5,433 6,693 5,582 6,891 Workers Compensation 476 784 517 806 Retirement Contributions 34,170 41,733 35,201 43,944 Medical Benefits 49,725 54,156 59,368 59,065 Life/Disability Benefits 2,126 4,156 2,575 4,284
Total Personnel 484,628 569,141 508,970 590,268
Purchased ServicesProfessional Services 57,708 53,700 53,700 75,000 General Services 89,669 63,750 80,000 70,000 Property Services - 225 - - Communication Services 70,658 79,825 70,500 73,250 Training/Registration 668 1,700 1,350 1,250 Mileage/Travel - 1,250 600 750 Rentals/Leases 236 250 250 250
Total Purchased Services 218,939 200,700 206,400 220,500
Supplies/Non-Capital EquipmentOffice Supplies 1,653 1,750 1,600 1,950 Operating Supplies 860 750 950 750
Total Supplies/Non-Capital Equipment 2,513 2,500 2,550 2,700
MiscellaneousDues/Fees 598 600 600 600
Total Other Expenditures 598 600 600 600
Total Expenditures 706,678$ 772,941$ 718,520$ 814,068$
Expenditure DetailFinance Department - Water & Wastewater Fund
107

2016Audited
Amounts
2017AdoptedBudget
2017Year-EndForecast
2018AdoptedBudget
PersonnelRegular Wages 215,901 228,502 221,434 235,782 Allowances 603 600 585 600 Medicare 2,990 3,321 3,062 3,427 Workers Compensation 262 390 283 401 Retirement Contributions 18,710 19,793 19,182 20,881 Medical Benefits 28,715 31,240 34,316 34,123 Life/Disability Benefits 1,249 2,065 1,511 2,133
Total Personnel 268,430 285,911 280,373 297,347
Purchased ServicesProfessional Services 57,708 53,700 53,700 75,000 General Services 89,669 63,750 80,000 70,000 Communication Services 3,546 2,500 2,500 3,600 Training/Registration 668 1,200 1,200 1,000 Mileage/Travel - 1,000 500 500
Total Purchased Services 151,591 122,150 137,900 150,100
Supplies/Non-Capital EquipmentOffice Supplies 1,252 1,000 1,000 1,200 Operating Supplies 405 750 750 750
Total Supplies/Non-Capital Equipment 1,657 1,750 1,750 1,950
MiscellaneousDues/Fees 598 500 500 500
Total Other Expenditures 598 500 500 500
Total Expenditures 422,276$ 410,311$ 420,523$ 449,897$
Expenditure DetailAdministration/Operations Division - Water & Wastewater Fund
108

2016Audited
Amounts
2017AdoptedBudget
2017Year-EndForecast
2018AdoptedBudget
PersonnelRegular Wages 176,112 232,517 183,708 238,896 Overtime 82 - - - Medicare 2,443 3,372 2,520 3,464 Workers Compensation 214 394 234 405 Retirement Contributions 15,460 21,940 16,019 23,063 Medical Benefits 21,010 22,916 25,052 24,942 Life/Disability Benefits 877 2,091 1,064 2,151
Total Personnel 216,198 283,230 228,597 292,921
Purchased ServicesProperty Services - 225 - - Communication Services 67,112 77,325 68,000 69,650 Training/Registration - 500 150 250 Mileage/Travel - 250 100 250 Rentals/Leases 236 250 250 250
Total Purchased Services 67,348 78,550 68,500 70,400
Supplies/Non-Capital EquipmentOffice Supplies 401 750 600 750 Operating Supplies 455 - 200 -
Total Supplies/Non-Capital Equipment 856 750 800 750
MiscellaneousDues/Fees - 100 100 100
Total Other Expenditures - 100 100 100
Total Expenditures 284,402$ 362,630$ 297,997$ 364,171$
Expenditure DetailUtility Billing Division - Water & Wastewater Fund
109
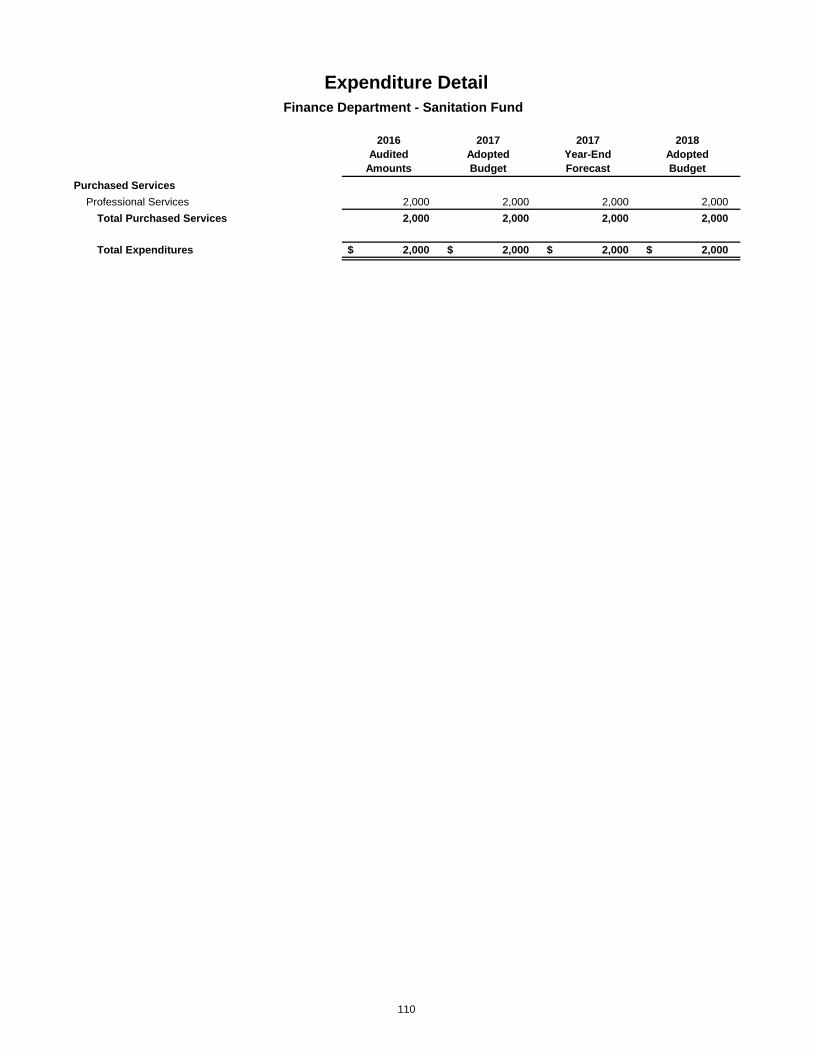
2016Audited
Amounts
2017AdoptedBudget
2017Year-EndForecast
2018AdoptedBudget
Purchased ServicesProfessional Services 2,000 2,000 2,000 2,000
Total Purchased Services 2,000 2,000 2,000 2,000
Total Expenditures 2,000$ 2,000$ 2,000$ 2,000$
Finance Department - Sanitation Fund
Expenditure Detail
110

2016Audited
Amounts
2017AdoptedBudget
2017Year-EndForecast
2018AdoptedBudget
Purchased ServicesProfessional Services 2,000 2,000 2,000 2,000
Total Purchased Services 2,000 2,000 2,000 2,000
Total Expenditures 2,000$ 2,000$ 2,000$ 2,000$
Expenditure DetailAdministration/Operations Division - Sanitation Fund
111

- Completed Sign Code amendment
- Completed and facilitated the adoption of the Civic Center Master Plan as a Comprehensive Plan amendment
- Completed and facilitiated the adoption of the 112th Station Area Master Plan as a Comprehensive Plan amendment
-Developed the HEAL program and achieved Elite Status in the Colorado LiveWell HEAL Cities and Towns Campaign
- Sustainability Program (Council Goal #2)
- Bike Ped Mobility Study (Council Goal #5)
- Neighborhood program (Council Goal #2)
- Zoning Code Rewrite (Council Goal #4)
- Civic Center Master Plan implementation (Council Goal #4)
Category/Measure Council Goal 2015 20162017
Forecast2018
Forecast
# of Permits Issued #5 1,483 1,483 1,682 1,400
Permit Fee Collection #2 236,922$ 236,922$ 250,000$ 215,022$
Permit Valuations #5 13,222,168$ 13,222,168$ 26,000,000$ 12,000,000$
Neighborhood Service Officer Activity (calls) #5
3,500 3,500 6,800 6,800
Activity Measures
Planning & DevelopmentBrook Svoboda, Director of Planning & Development
Department Description
The Planning and Development Department is responsible for the administration of the City's land use and development functionsincluding building, planning, and neighborhood services (code enforcement). The department also guides the City's ongoingdevelopment and redevelopment activities by recruiting new investment and working to integrate new development projects into theexisting fabric of the community. The department is also responsible for the administration and enforcement of the City's building,electrical, plumbing, and mechanical codes, as well as enforcement of the City's zoning ordinance and nuisance abatement program.
2017 Achievements
Goals & Objectives
112

Fund(s) Budget FTEGeneral Fund 1,463,232$ 12.00 Conservation Trust Fund - - CDBG Fund - - Capital Projects Fund - - Water & Wastewater Fund - - Stormwater Fund - - Sanitation Fund - - Total 1,463,232 12.00
Division/Program(s) Budget FTEAdministration 155,604$ 1.00 Operations 776,534 4.00 Neighborhood Services 531,094 7.00
Total 1,463,232 12.00
2016Audited
Amounts
2017AdoptedBudget
2017Year-EndForecast
2018AdoptedBudget
Staff - Full Time Equivalency (FTE)* 12.00 12.00 12.00 12.00
Expenditures:Personnel 799,163$ 995,265$ 921,958$ 973,419$ Purchased Services 558,284 600,700 458,481 466,730 Supplies/Non-Capital Equipment 26,584 20,600 20,640 19,613 Capital Outlay - 35,000 32,000 - Miscellaneous 1,531 2,500 2,950 3,470
Total Expenditures 1,385,562$ 1,654,065$ 1,436,029$ 1,463,232$
Amount
13,256$ 74,000 11,000 5,000
103,256$
Professional Services - Zoning Map
2018 BUDGET PACKAGES
1. Personnel Market Adjustment2. Professional Services - Carry Over Projects3. Professional Services - HEAL & Sustainability programs4.
Planning & Development
EXPENDITURE SUMMARY
2018 BUDGET SUMMARY BY DIVISION
2018 BUDGET SUMMARY BY FUND
-
2.00
4.00
6.00
8.00
10.00
12.00
14.00
$1,340,000
$1,360,000
$1,380,000
$1,400,000
$1,420,000
$1,440,000
$1,460,000
$1,480,000
2016Audited
Amounts
2017Year-EndForecast
2018AdoptedBudget
FTE
Expe
nditu
res
EXPENDITURE & FULL TIME EQUIVALENCY
Total ExpendituresFull Time Equivilancy (FTE)
113

2016Audited
Amounts
2017AdoptedBudget
2017Year-EndForecast
2018AdoptedBudget
PersonnelRegular Wages 634,310 755,912 708,339 754,199 Overtime 3,593 6,000 4,794 5,000 Medicare 8,367 10,959 9,782 10,952 Workers Compensation 2,978 2,966 4,642 4,595 Retirement Contributions 54,268 64,391 61,826 65,312 Medical Benefits 92,240 148,240 126,429 125,382 Life/Disability Benefits 3,407 6,797 4,934 6,779
Total Personnel 799,163 995,265 921,958 973,419
Purchased ServicesProfessional Services 144,618 393,150 240,150 90,150 Technical Services 370,460 165,000 165,000 325,000 General Services 14,994 20,000 20,000 20,000 Communication Services 13,599 1,750 14,281 12,280 Training/Registration 7,421 13,000 12,000 12,000 Mileage/Travel 3,145 4,500 3,750 4,000 Rentals/Leases 3,027 3,300 3,300 3,300
Total Purchased Services 558,284 600,700 458,481 466,730
Supplies/Non-Capital EquipmentOffice Supplies 4,920 3,600 4,300 4,300 Operating Supplies 18,155 8,500 8,800 8,800 Non-Capital Equipment - 2,500 3,790 2,500 Motor Vehicle Fuels 3,509 6,000 3,750 4,013
Total Supplies/Non-Capital Equipment 26,584 20,600 20,640 19,613
Capital OutlayCapital Equipment - 35,000 32,000 -
Total Capital Outlay - 35,000 32,000 -
MiscellaneousDues/Fees 1,531 2,500 2,950 3,470
Total Other Expenditures 1,531 2,500 2,950 3,470
Total Expenditures 1,385,562$ 1,654,065$ 1,436,029$ 1,463,232$
Expenditure DetailPlanning & Development Department - All Funds
114

2016Audited
Amounts
2017AdoptedBudget
2017Year-EndForecast
2018AdoptedBudget
PersonnelRegular Wages 634,310 755,912 708,339 754,199 Overtime 3,593 6,000 4,794 5,000 Medicare 8,367 10,959 9,782 10,952 Workers Compensation 2,978 2,966 4,642 4,595 Retirement Contributions 54,268 64,391 61,826 65,312 Medical Benefits 92,240 148,240 126,429 125,382 Life/Disability Benefits 3,407 6,797 4,934 6,779
Total Personnel 799,163 995,265 921,958 973,419
Purchased ServicesProfessional Services 144,618 393,150 240,150 90,150 Technical Services 370,460 165,000 165,000 325,000 General Services 14,994 20,000 20,000 20,000 Communication Services 13,599 1,750 14,281 12,280 Training/Registration 7,421 13,000 12,000 12,000 Mileage/Travel 3,145 4,500 3,750 4,000 Rentals/Leases 3,027 3,300 3,300 3,300
Total Purchased Services 558,284 600,700 458,481 466,730
Supplies/Non-Capital EquipmentOffice Supplies 4,920 3,600 4,300 4,300 Operating Supplies 18,155 8,500 8,800 8,800 Non-Capital Equipment - 2,500 3,790 2,500 Motor Vehicle Fuels 3,509 6,000 3,750 4,013
Total Supplies/Non-Capital Equipment 26,584 20,600 20,640 19,613
Capital OutlayCapital Equipment - 35,000 32,000 -
Total Capital Outlay - 35,000 32,000 -
MiscellaneousDues/Fees 1,531 2,500 2,950 3,470
Total Other Expenditures 1,531 2,500 2,950 3,470
Total Expenditures 1,385,562$ 1,654,065$ 1,436,029$ 1,463,232$
Planning & Development Department - General Fund
Expenditure Detail
115

2016Audited
Amounts
2017AdoptedBudget
2017Year-EndForecast
2018AdoptedBudget
PersonnelRegular Wages 122,527 124,156 124,174 129,879 Medicare 1,770 1,800 1,793 1,883 Workers Compensation 134 210 159 220 Retirement Contributions 10,022 11,174 11,176 11,689 Medical Benefits 5,993 6,531 7,141 7,101 Life/Disability Benefits 707 1,113 842 1,162
Total Personnel 141,153 144,984 145,285 151,934
Purchased ServicesTraining/Registration 1,105 1,500 500 500 Mileage/Travel 2,392 2,000 1,000 1,000 Rentals/Leases 133 600 600 600
Total Purchased Services 4,530 4,100 2,100 2,100
Supplies/Non-Capital EquipmentOffice Supplies 158 300 300 300 Operating Supplies 41 300 300 300
Total Supplies/Non-Capital Equipment 199 600 600 600
MiscellaneousDues/Fees 525 - 450 970
Total Other Expenditures 525 - 450 970
Total Expenditures 146,407$ 149,684$ 148,435$ 155,604$
Expenditure DetailAdministrative Division - General Fund
116
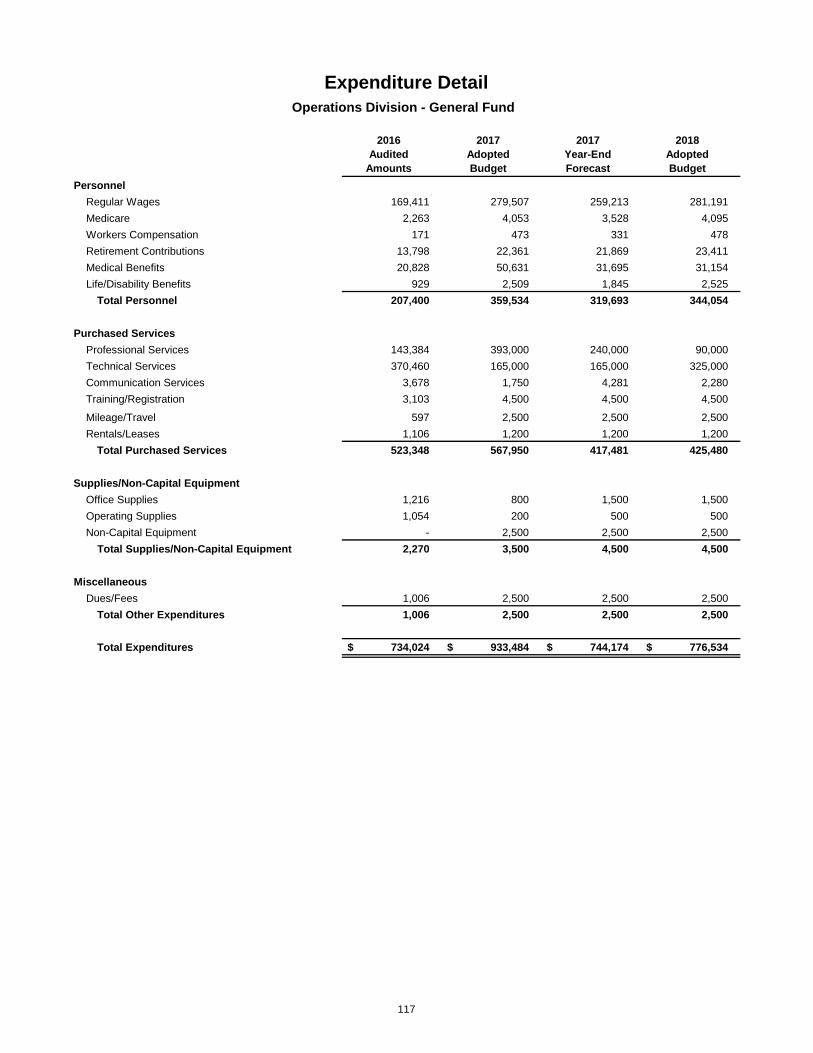
2016Audited
Amounts
2017AdoptedBudget
2017Year-EndForecast
2018AdoptedBudget
PersonnelRegular Wages 169,411 279,507 259,213 281,191 Medicare 2,263 4,053 3,528 4,095 Workers Compensation 171 473 331 478 Retirement Contributions 13,798 22,361 21,869 23,411 Medical Benefits 20,828 50,631 31,695 31,154 Life/Disability Benefits 929 2,509 1,845 2,525
Total Personnel 207,400 359,534 319,693 344,054
Purchased ServicesProfessional Services 143,384 393,000 240,000 90,000 Technical Services 370,460 165,000 165,000 325,000 Communication Services 3,678 1,750 4,281 2,280 Training/Registration 3,103 4,500 4,500 4,500
Mileage/Travel 597 2,500 2,500 2,500 Rentals/Leases 1,106 1,200 1,200 1,200
Total Purchased Services 523,348 567,950 417,481 425,480
Supplies/Non-Capital EquipmentOffice Supplies 1,216 800 1,500 1,500 Operating Supplies 1,054 200 500 500 Non-Capital Equipment - 2,500 2,500 2,500
Total Supplies/Non-Capital Equipment 2,270 3,500 4,500 4,500
MiscellaneousDues/Fees 1,006 2,500 2,500 2,500
Total Other Expenditures 1,006 2,500 2,500 2,500
Total Expenditures 734,024$ 933,484$ 744,174$ 776,534$
Expenditure DetailOperations Division - General Fund
117

2016Audited
Amounts
2017AdoptedBudget
2017Year-EndForecast
2018AdoptedBudget
PersonnelRegular Wages 342,372 352,249 324,952 343,129 Overtime 3,593 6,000 4,794 5,000 Medicare 4,334 5,106 4,461 4,974 Workers Compensation 2,673 2,283 4,152 3,897 Retirement Contributions 30,448 30,856 28,781 30,212 Medical Benefits 65,419 91,078 87,593 87,127 Life/Disability Benefits 1,771 3,175 2,247 3,092
Total Personnel 450,610 490,747 456,980 477,431
Purchased ServicesProfessional Services 334 150 150 150 General Services 14,994 20,000 20,000 20,000 Communication Services 9,921 - 10,000 10,000 Training/Registration 3,213 7,000 7,000 7,000 Rentals/Leases 1,788 1,500 1,500 1,500
Total Purchased Services 30,406 28,650 38,900 39,150
Supplies/Non-Capital EquipmentOffice Supplies 3,546 2,500 2,500 2,500 Operating Supplies 17,060 8,000 8,000 8,000 Non-Capital Equipment - - 1,290 - Motor Vehicle Fuels 3,509 6,000 3,750 4,013
Total Supplies/Non-Capital Equipment 24,115 16,500 15,540 14,513
Capital OutlayCapital Equipment - 35,000 32,000 -
Total Capital Outlay - 35,000 32,000 -
Total Expenditures 505,131$ 570,897$ 543,420$ 531,094$
Expenditure DetailNeighborhood Services Division - General Fund
118

119

- Completed the Fox Run Opens Space improvments
- Secured over $1 million in grant funds from Adams County Open Space and and additional $80,000 from SCFD through NAHF
-
-
- Completed the 2017 Parks & Recreation Master Plan update
-
-
Category/Measure Council Goal 2015 20162017
Forecast2018
Forecast
# of park acres maintained #5 337 337 337 337
# of miles of trails maintained #5 28 28 28 28
Recreation Center attendance #2 242,198 242,198 240,000 240,000
Number of registered program participants #2
10,700 10,700 10,700 10,700
Activity Measures
Parks, Recreation, & CultureAmanda Peterson, Director of Parks, Recreation, & Culture
Department Description
The Department of Parks, Recreation and Cultural Services offers recreational and leisure services, and maintains parks, right-of-waysand open spaces. Divisions within Parks, Recreation and Cultural Services include Parks Maintenance & Operations, Aquatics, Youth &Marketing, Operations, Fitness & Sports, Theatre, Culture and Senior Programs.
2017 Achievements
Goals & Objectives
Designated as a Playful City USA and a Tree City USA
Served on Civic Center Master Plan strategic team
Submit grant requests for applicable projects through Adams County Open Space and other sources as appropriate (Council Goal #2, #4)
Utilize the completed Recreation facility assessment and begin the design and implementation phase of the Civic Center Master Plan
120
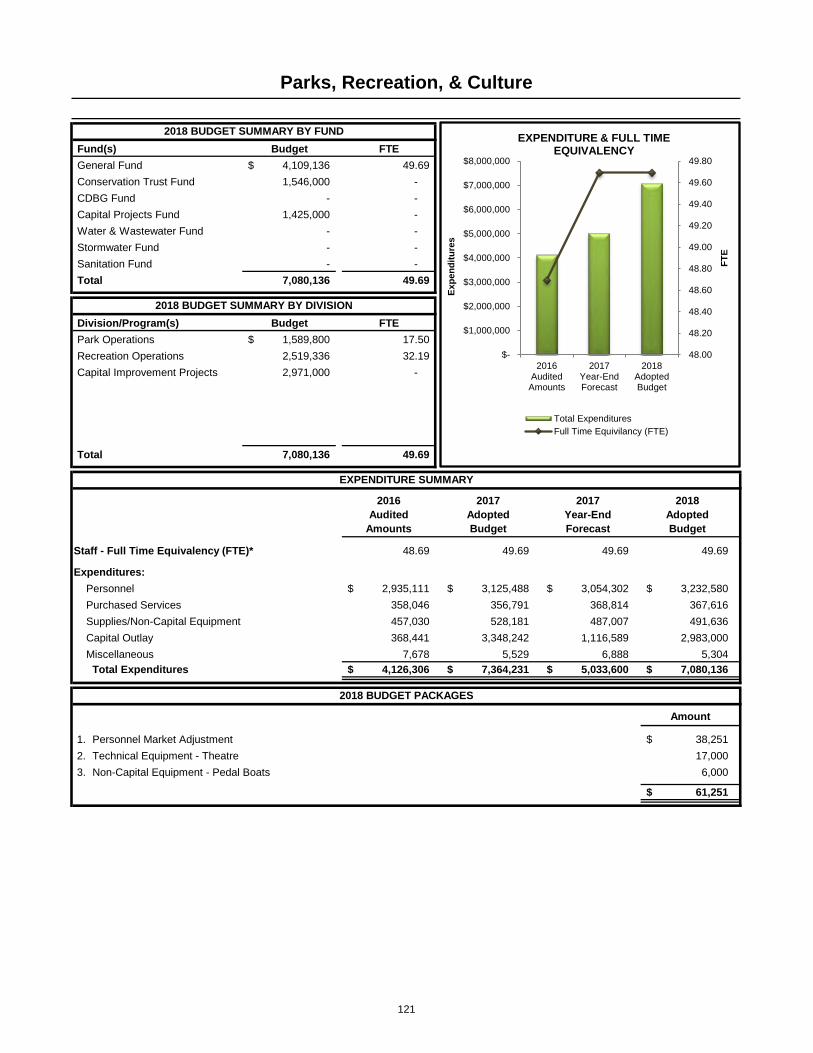
Fund(s) Budget FTEGeneral Fund 4,109,136$ 49.69 Conservation Trust Fund 1,546,000 - CDBG Fund - - Capital Projects Fund 1,425,000 - Water & Wastewater Fund - - Stormwater Fund - - Sanitation Fund - - Total 7,080,136 49.69
Division/Program(s) Budget FTEPark Operations 1,589,800$ 17.50 Recreation Operations 2,519,336 32.19 Capital Improvement Projects 2,971,000 -
Total 7,080,136 49.69
2016Audited
Amounts
2017AdoptedBudget
2017Year-EndForecast
2018AdoptedBudget
Staff - Full Time Equivalency (FTE)* 48.69 49.69 49.69 49.69
Expenditures:Personnel 2,935,111$ 3,125,488$ 3,054,302$ 3,232,580$ Purchased Services 358,046 356,791 368,814 367,616 Supplies/Non-Capital Equipment 457,030 528,181 487,007 491,636 Capital Outlay 368,441 3,348,242 1,116,589 2,983,000 Miscellaneous 7,678 5,529 6,888 5,304
Total Expenditures 4,126,306$ 7,364,231$ 5,033,600$ 7,080,136$
Amount
38,251$ 17,000 6,000
61,251$
2. Technical Equipment - Theatre3. Non-Capital Equipment - Pedal Boats
2018 BUDGET PACKAGES
1. Personnel Market Adjustment
Parks, Recreation, & Culture
EXPENDITURE SUMMARY
2018 BUDGET SUMMARY BY DIVISION
2018 BUDGET SUMMARY BY FUND
48.00
48.20
48.40
48.60
48.80
49.00
49.20
49.40
49.60
49.80
$-
$1,000,000
$2,000,000
$3,000,000
$4,000,000
$5,000,000
$6,000,000
$7,000,000
$8,000,000
2016Audited
Amounts
2017Year-EndForecast
2018AdoptedBudget
FTE
Expe
nditu
res
EXPENDITURE & FULL TIME EQUIVALENCY
Total ExpendituresFull Time Equivilancy (FTE)
121

2016Audited
Amounts
2017AdoptedBudget
2017Year-EndForecast
2018AdoptedBudget
PersonnelRegular Wages 2,060,060 2,177,286 2,125,586 2,240,453 Seasonal/Temporary Wages 235,137 238,459 238,700 244,671 Overtime 49,365 31,600 45,102 41,800 Allowances 5,522 5,136 5,860 5,388 Medicare 31,845 34,753 28,898 35,729 Workers Compensation 61,428 78,453 39,789 80,137 Retirement Contributions 162,504 193,411 166,417 200,468 Medical Benefits 319,869 345,422 392,540 362,411 Life/Disability Benefits 9,381 20,968 11,410 21,523
Total Personnel 2,935,111 3,125,488 3,054,302 3,232,580
Purchased ServicesProfessional Services 5,379 2,200 4,925 4,000 Technical Services 11,131 11,000 11,000 11,000 General Services 189,094 156,019 170,294 168,229 Property Services 80,022 90,542 89,750 90,542 Communication Services 48,067 63,765 59,580 60,580 Training/Registration 8,568 19,565 19,565 19,565 Mileage/Travel 490 200 200 200 Rentals/Leases 15,295 13,500 13,500 13,500
Total Purchased Services 358,046 356,791 368,814 367,616
Supplies/Non-Capital EquipmentOffice Supplies 1,718 2,350 3,100 2,350 Technology Supplies 4,784 6,000 6,000 6,000 Operating Supplies 299,993 307,131 306,351 303,031 Inventory Supplies 10,799 12,500 12,500 12,500 Non-Capital Equipment 8,790 12,700 12,556 11,000 Gas/Electricity 102,037 135,000 114,000 121,980 Motor Vehicle Fuels 28,909 52,500 32,500 34,775
Total Supplies/Non-Capital Equipment 457,030 528,181 487,007 491,636
Capital OutlayCapital Equipment 158,038 - - 12,000 Capital Improvement Projects 210,403 3,348,242 1,116,589 2,971,000
Total Capital Outlay 368,441 3,348,242 1,116,589 2,983,000
MiscellaneousDues/Fees 6,570 4,804 6,388 4,804 Bad Debt Expense 1,108 725 500 500
Total Other Expenditures 7,678 5,529 6,888 5,304
Total Expenditures 4,126,306$ 7,364,231$ 5,033,600$ 7,080,136$
Expenditure DetailParks, Recreation, & Culture Department - All Funds
122

2016Audited
Amounts
2017AdoptedBudget
2017Year-EndForecast
2018AdoptedBudget
PersonnelRegular Wages 2,060,060 2,177,286 2,125,586 2,240,453 Seasonal/Temporary Wages 235,137 238,459 238,700 244,671 Overtime 49,365 31,600 45,102 41,800 Allowances 5,522 5,136 5,860 5,388 Medicare 31,845 34,753 28,898 35,729 Workers Compensation 61,428 78,453 39,789 80,137 Retirement Contributions 162,504 193,411 166,417 200,468 Medical Benefits 319,869 345,422 392,540 362,411 Life/Disability Benefits 9,381 20,968 11,410 21,523
Total Personnel 2,935,111 3,125,488 3,054,302 3,232,580
Purchased ServicesProfessional Services 5,379 2,200 4,925 4,000 Technical Services 11,131 11,000 11,000 11,000 General Services 189,094 156,019 170,294 168,229 Property Services 80,022 90,542 89,750 90,542 Communication Services 48,067 63,765 59,580 60,580 Training/Registration 8,568 19,565 19,565 19,565 Mileage/Travel 490 200 200 200 Rentals/Leases 15,295 13,500 13,500 13,500
Total Purchased Services 358,046 356,791 368,814 367,616
Supplies/Non-Capital EquipmentOffice Supplies 1,718 2,350 3,100 2,350 Technology Supplies 4,784 6,000 6,000 6,000 Operating Supplies 299,993 307,131 306,351 303,031 Inventory Supplies 10,799 12,500 12,500 12,500 Non-Capital Equipment 8,790 12,700 12,556 11,000 Gas/Electricity 102,037 135,000 114,000 121,980 Motor Vehicle Fuels 28,909 52,500 32,500 34,775
Total Supplies/Non-Capital Equipment 457,030 528,181 487,007 491,636
Capital OutlayCapital Equipment 158,038 - - 12,000
Total Capital Outlay 158,038 - - 12,000
MiscellaneousDues/Fees 6,570 4,804 6,388 4,804 Bad Debt Expense 1,108 725 500 500
Total Other Expenditures 7,678 5,529 6,888 5,304
Total Expenditures 3,915,903$ 4,015,989$ 3,917,011$ 4,109,136$
Parks, Recreation, & Culture Department - General Fund
Expenditure Detail
123

2016Audited
Amounts
2017AdoptedBudget
2017Year-EndForecast
2018AdoptedBudget
PersonnelRegular Wages 778,847 874,384 806,600 873,731 Seasonal/Temporary Wages 91,239 108,785 108,000 108,157 Overtime 39,799 27,200 35,241 34,800 Allowances 5,100 5,136 5,792 5,388 Medicare 11,989 13,983 10,672 13,935 Workers Compensation 20,793 28,528 22,681 28,336 Retirement Contributions 68,432 76,107 70,288 77,191 Medical Benefits 128,364 158,036 158,972 155,078 Life/Disability Benefits 4,431 8,303 5,424 8,269
Total Personnel 1,148,994 1,300,462 1,223,670 1,304,885
Purchased ServicesProperty Services 56,217 64,000 64,000 64,000 Communication Services 8,245 9,825 7,900 7,900 Training/Registration 2,625 7,665 7,665 7,665 Rentals/Leases 5,719 4,000 4,000 4,000
Total Purchased Services 73,886 85,490 84,965 84,965
Supplies/Non-Capital EquipmentOffice Supplies 470 750 1,500 750 Operating Supplies 147,871 148,700 148,700 144,700 Non-Capital Equipment 1,138 - - - Gas/Electricity 16,055 25,000 19,000 20,330 Motor Vehicle Fuels 27,793 50,000 31,000 33,170
Total Supplies/Non-Capital Equipment 193,327 224,450 200,200 198,950
Capital OutlayCapital Equipment 83,978 - - -
Total Capital Outlay 83,978 - - -
MiscellaneousDues/Fees 1,169 1,000 1,000 1,000
Total Other Expenditures 1,169 1,000 1,000 1,000
Total Expenditures 1,501,354$ 1,611,402$ 1,509,835$ 1,589,800$
Expenditure DetailPark Operations Division - General Fund
124
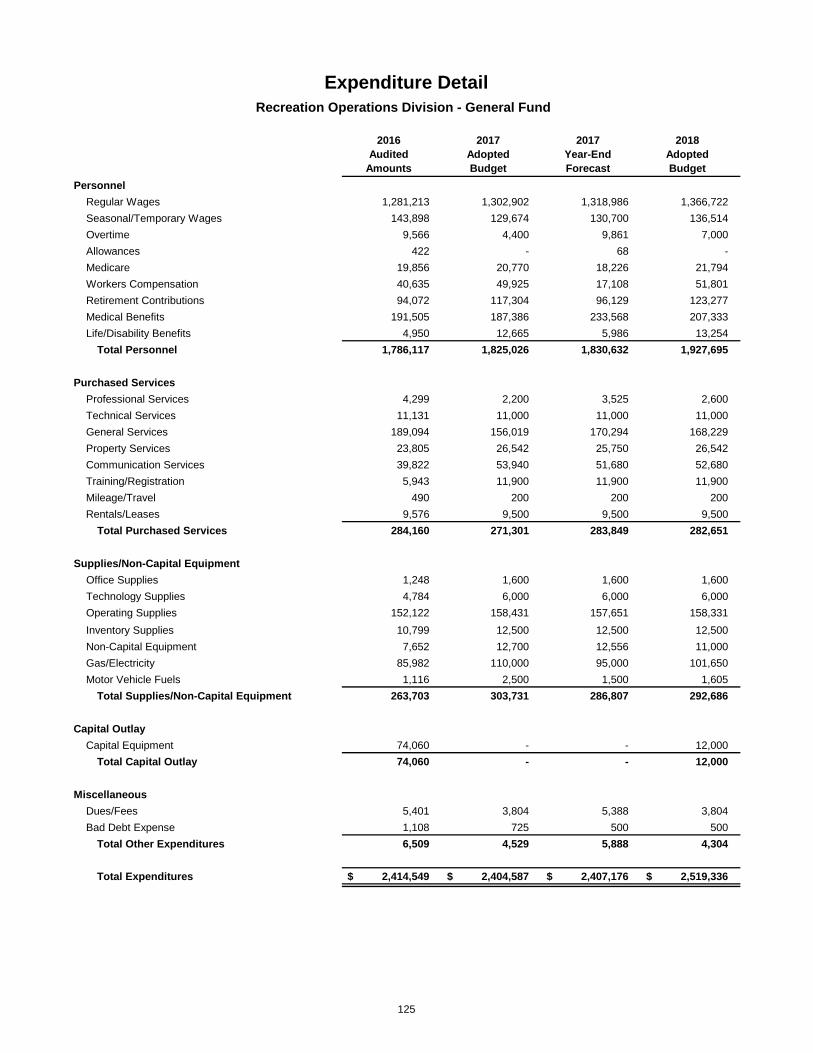
2016Audited
Amounts
2017AdoptedBudget
2017Year-EndForecast
2018AdoptedBudget
PersonnelRegular Wages 1,281,213 1,302,902 1,318,986 1,366,722 Seasonal/Temporary Wages 143,898 129,674 130,700 136,514 Overtime 9,566 4,400 9,861 7,000 Allowances 422 - 68 - Medicare 19,856 20,770 18,226 21,794 Workers Compensation 40,635 49,925 17,108 51,801 Retirement Contributions 94,072 117,304 96,129 123,277 Medical Benefits 191,505 187,386 233,568 207,333 Life/Disability Benefits 4,950 12,665 5,986 13,254
Total Personnel 1,786,117 1,825,026 1,830,632 1,927,695
Purchased ServicesProfessional Services 4,299 2,200 3,525 2,600 Technical Services 11,131 11,000 11,000 11,000 General Services 189,094 156,019 170,294 168,229 Property Services 23,805 26,542 25,750 26,542 Communication Services 39,822 53,940 51,680 52,680 Training/Registration 5,943 11,900 11,900 11,900 Mileage/Travel 490 200 200 200 Rentals/Leases 9,576 9,500 9,500 9,500
Total Purchased Services 284,160 271,301 283,849 282,651
Supplies/Non-Capital EquipmentOffice Supplies 1,248 1,600 1,600 1,600 Technology Supplies 4,784 6,000 6,000 6,000 Operating Supplies 152,122 158,431 157,651 158,331 Inventory Supplies 10,799 12,500 12,500 12,500 Non-Capital Equipment 7,652 12,700 12,556 11,000 Gas/Electricity 85,982 110,000 95,000 101,650 Motor Vehicle Fuels 1,116 2,500 1,500 1,605
Total Supplies/Non-Capital Equipment 263,703 303,731 286,807 292,686
Capital OutlayCapital Equipment 74,060 - - 12,000
Total Capital Outlay 74,060 - - 12,000
MiscellaneousDues/Fees 5,401 3,804 5,388 3,804 Bad Debt Expense 1,108 725 500 500
Total Other Expenditures 6,509 4,529 5,888 4,304
Total Expenditures 2,414,549$ 2,404,587$ 2,407,176$ 2,519,336$
Expenditure DetailRecreation Operations Division - General Fund
125

2016Audited
Amounts
2017AdoptedBudget
2017Year-EndForecast
2018AdoptedBudget
Capital OutlayCapital Improvement Projects 67,735 1,396,000 194,235 1,546,000
Total Capital Outlay 67,735 1,396,000 194,235 1,546,000
Total Expenditures 67,735$ 1,396,000$ 194,235$ 1,546,000$
Parks, Recreation, & Culture Department - Conservation Trust Fund
Expenditure Detail
126

2016Audited
Amounts
2017AdoptedBudget
2017Year-EndForecast
2018AdoptedBudget
Capital OutlayCapital Improvement Projects 67,735 1,396,000 194,235 1,546,000
Total Capital Outlay 67,735 1,396,000 194,235 1,546,000
Total Expenditures 67,735$ 1,396,000$ 194,235$ 1,546,000$
Expenditure DetailCapital Improvement Projects Division - Conservation Trust Fund
127

2016Audited
Amounts
2017AdoptedBudget
2017Year-EndForecast
2018AdoptedBudget
Capital OutlayCapital Improvement Projects 13,249 - - -
Total Capital Outlay 13,249 - - -
Total Expenditures 13,249$ -$ -$ -$
Parks, Recreation, & Culture Department - CDBG Fund
Expenditure Detail
128

2016Audited
Amounts
2017AdoptedBudget
2017Year-EndForecast
2018AdoptedBudget
Capital OutlayCapital Improvement Projects 13,249 - - -
Total Capital Outlay 13,249 - - -
Total Expenditures 13,249$ -$ -$ -$
Capital Improvement Projects Division - CDBG Fund
Expenditure Detail
129

2016Audited
Amounts
2017AdoptedBudget
2017Year-EndForecast
2018AdoptedBudget
Capital OutlayCapital Improvement Projects 129,419 1,952,242 922,354 1,425,000
Total Capital Outlay 129,419 1,952,242 922,354 1,425,000
Total Expenditures 129,419$ 1,952,242$ 922,354$ 1,425,000$
Parks, Recreation, & Culture Department - Capital Projects Fund
Expenditure Detail
130

2016Audited
Amounts
2017AdoptedBudget
2017Year-EndForecast
2018AdoptedBudget
Capital OutlayCapital Improvement Projects 129,419 1,952,242 922,354 1,425,000
Total Capital Outlay 129,419 1,952,242 922,354 1,425,000
Total Expenditures 129,419$ 1,952,242$ 922,354$ 1,425,000$
Expenditure DetailCapital Improvement Projects Division - Capital Projects Fund
131
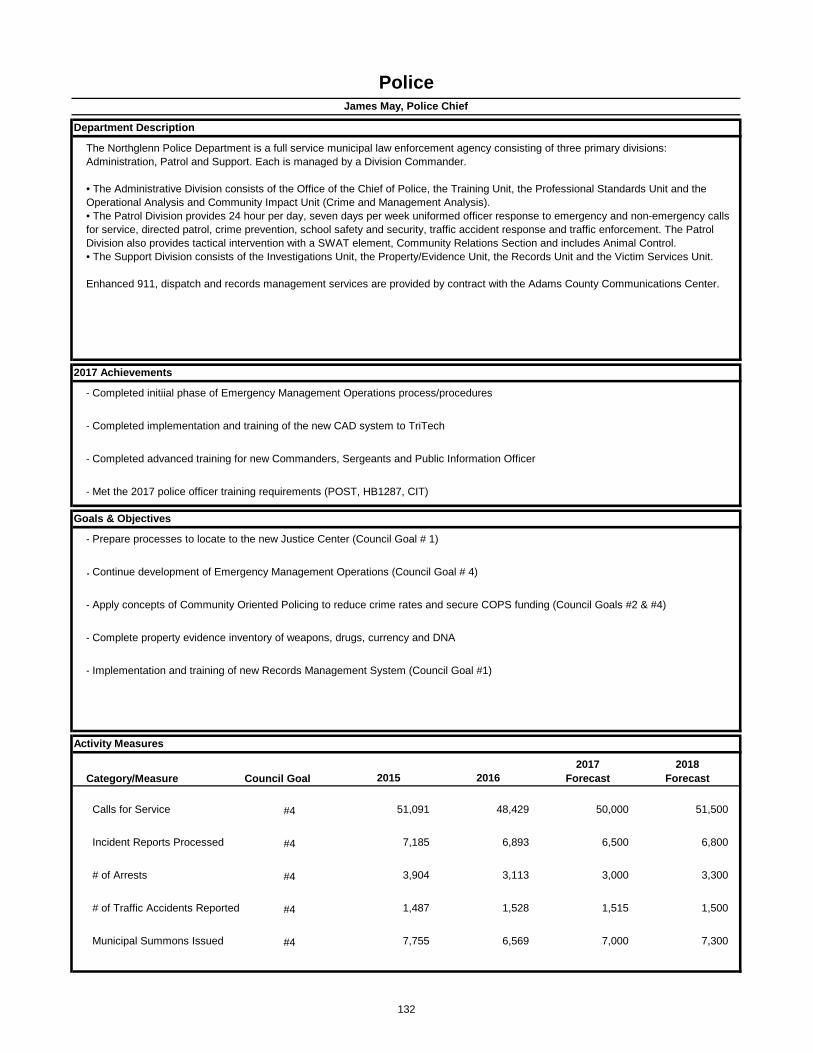
- Completed initiial phase of Emergency Management Operations process/procedures
- Completed implementation and training of the new CAD system to TriTech
- Completed advanced training for new Commanders, Sergeants and Public Information Officer
- Met the 2017 police officer training requirements (POST, HB1287, CIT)
-
-
-
-
-
Category/Measure Council Goal 2015 20162017
Forecast2018
Forecast
Calls for Service #4 51,091 48,429 50,000 51,500
Incident Reports Processed #4 7,185 6,893 6,500 6,800
# of Arrests #4 3,904 3,113 3,000 3,300
# of Traffic Accidents Reported #4 1,487 1,528 1,515 1,500
Municipal Summons Issued #4 7,755 6,569 7,000 7,300
Activity Measures
PoliceJames May, Police Chief
Department Description
2017 Achievements
Goals & Objectives
The Northglenn Police Department is a full service municipal law enforcement agency consisting of three primary divisions: Administration, Patrol and Support. Each is managed by a Division Commander.
• The Administrative Division consists of the Office of the Chief of Police, the Training Unit, the Professional Standards Unit and the Operational Analysis and Community Impact Unit (Crime and Management Analysis). • The Patrol Division provides 24 hour per day, seven days per week uniformed officer response to emergency and non-emergency calls for service, directed patrol, crime prevention, school safety and security, traffic accident response and traffic enforcement. The Patrol Division also provides tactical intervention with a SWAT element, Community Relations Section and includes Animal Control. • The Support Division consists of the Investigations Unit, the Property/Evidence Unit, the Records Unit and the Victim Services Unit.
Enhanced 911, dispatch and records management services are provided by contract with the Adams County Communications Center.
Prepare processes to locate to the new Justice Center (Council Goal # 1)
Continue development of Emergency Management Operations (Council Goal # 4)
Complete property evidence inventory of weapons, drugs, currency and DNA
Implementation and training of new Records Management System (Council Goal #1)
Apply concepts of Community Oriented Policing to reduce crime rates and secure COPS funding (Council Goals #2 & #4)
132
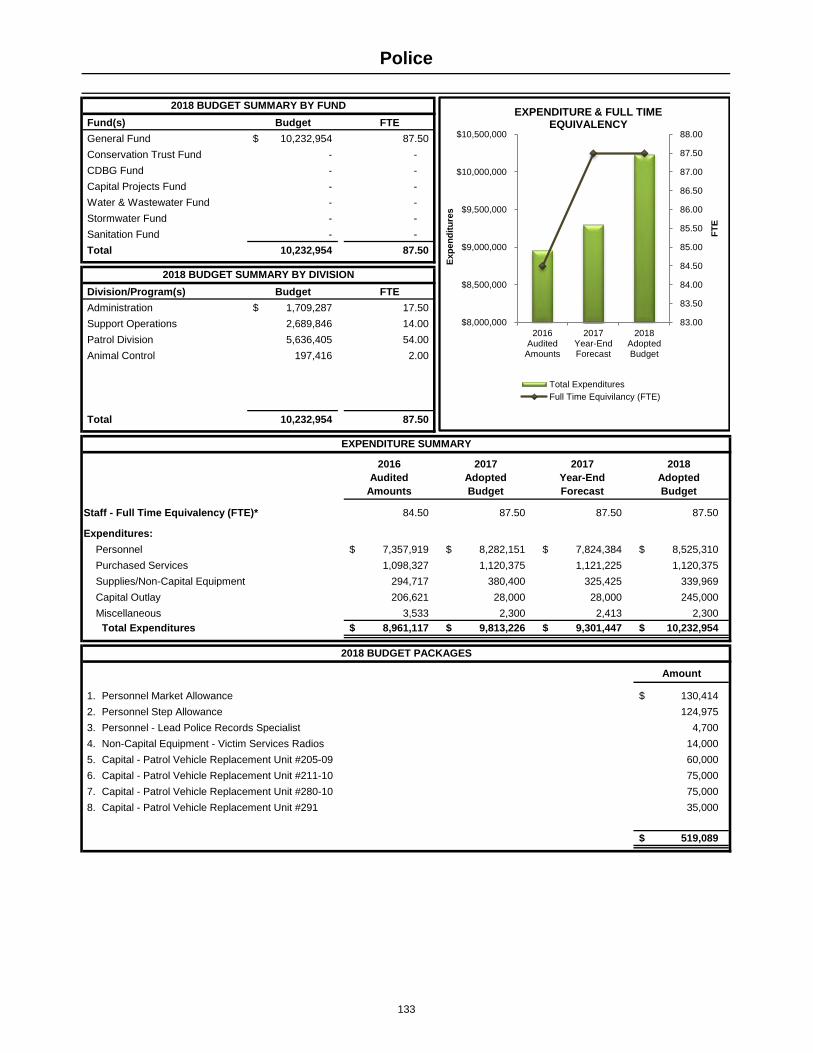
Fund(s) Budget FTEGeneral Fund 10,232,954$ 87.50 Conservation Trust Fund - - CDBG Fund - - Capital Projects Fund - - Water & Wastewater Fund - - Stormwater Fund - - Sanitation Fund - - Total 10,232,954 87.50
Division/Program(s) Budget FTEAdministration 1,709,287$ 17.50 Support Operations 2,689,846 14.00 Patrol Division 5,636,405 54.00 Animal Control 197,416 2.00
Total 10,232,954 87.50
2016Audited
Amounts
2017AdoptedBudget
2017Year-EndForecast
2018AdoptedBudget
Staff - Full Time Equivalency (FTE)* 84.50 87.50 87.50 87.50
Expenditures:Personnel 7,357,919$ 8,282,151$ 7,824,384$ 8,525,310$ Purchased Services 1,098,327 1,120,375 1,121,225 1,120,375 Supplies/Non-Capital Equipment 294,717 380,400 325,425 339,969 Capital Outlay 206,621 28,000 28,000 245,000 Miscellaneous 3,533 2,300 2,413 2,300
Total Expenditures 8,961,117$ 9,813,226$ 9,301,447$ 10,232,954$
Amount
130,414$ 124,975
4,700 14,000 60,000
6. 75,000 75,000 35,000
519,089$
Capital - Patrol Vehicle Replacement Unit #211-10Capital - Patrol Vehicle Replacement Unit #280-10Capital - Patrol Vehicle Replacement Unit #291
7.8.
Police
EXPENDITURE SUMMARY
2018 BUDGET SUMMARY BY DIVISION
2018 BUDGET SUMMARY BY FUND
2018 BUDGET PACKAGES
1. Personnel Market Allowance 2. Personnel Step Allowance 3. Personnel - Lead Police Records Specialist4. Non-Capital Equipment - Victim Services Radios5. Capital - Patrol Vehicle Replacement Unit #205-09
83.00
83.50
84.00
84.50
85.00
85.50
86.00
86.50
87.00
87.50
88.00
$8,000,000
$8,500,000
$9,000,000
$9,500,000
$10,000,000
$10,500,000
2016Audited
Amounts
2017Year-EndForecast
2018AdoptedBudget
FTE
Expe
nditu
res
EXPENDITURE & FULL TIME EQUIVALENCY
Total ExpendituresFull Time Equivilancy (FTE)
133
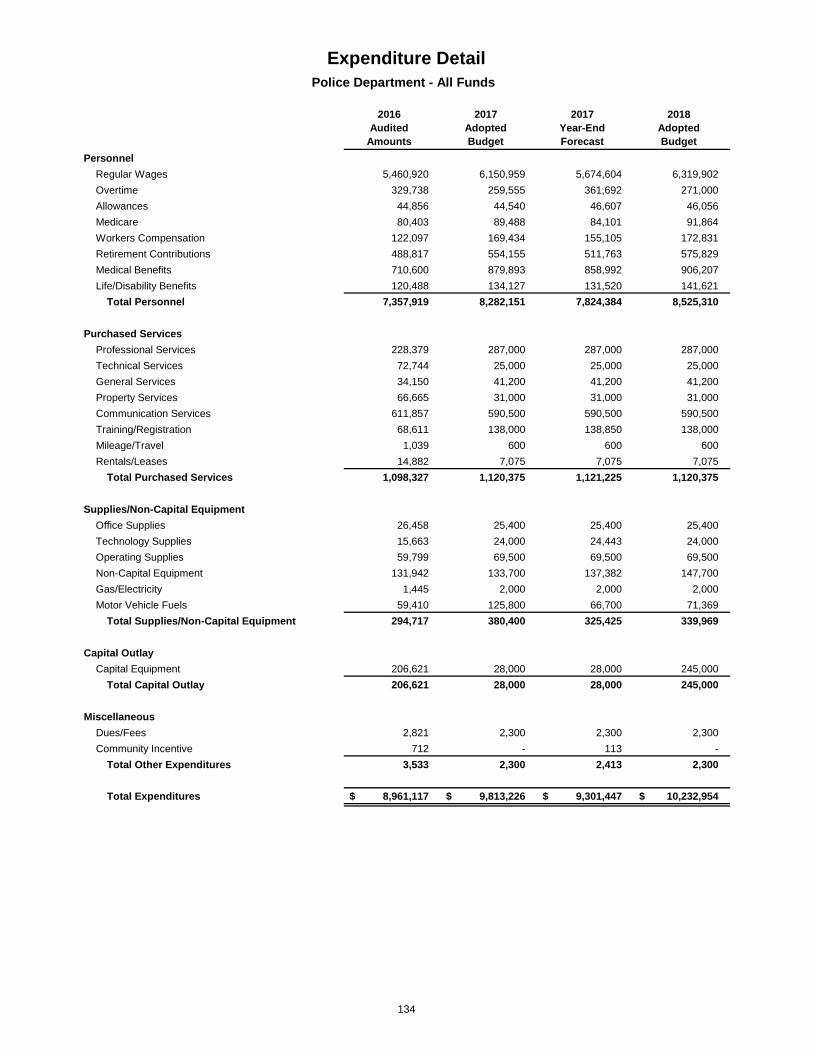
2016Audited
Amounts
2017AdoptedBudget
2017Year-EndForecast
2018AdoptedBudget
PersonnelRegular Wages 5,460,920 6,150,959 5,674,604 6,319,902 Overtime 329,738 259,555 361,692 271,000 Allowances 44,856 44,540 46,607 46,056 Medicare 80,403 89,488 84,101 91,864 Workers Compensation 122,097 169,434 155,105 172,831 Retirement Contributions 488,817 554,155 511,763 575,829 Medical Benefits 710,600 879,893 858,992 906,207 Life/Disability Benefits 120,488 134,127 131,520 141,621
Total Personnel 7,357,919 8,282,151 7,824,384 8,525,310
Purchased ServicesProfessional Services 228,379 287,000 287,000 287,000 Technical Services 72,744 25,000 25,000 25,000 General Services 34,150 41,200 41,200 41,200 Property Services 66,665 31,000 31,000 31,000 Communication Services 611,857 590,500 590,500 590,500 Training/Registration 68,611 138,000 138,850 138,000 Mileage/Travel 1,039 600 600 600 Rentals/Leases 14,882 7,075 7,075 7,075
Total Purchased Services 1,098,327 1,120,375 1,121,225 1,120,375
Supplies/Non-Capital EquipmentOffice Supplies 26,458 25,400 25,400 25,400 Technology Supplies 15,663 24,000 24,443 24,000 Operating Supplies 59,799 69,500 69,500 69,500 Non-Capital Equipment 131,942 133,700 137,382 147,700 Gas/Electricity 1,445 2,000 2,000 2,000 Motor Vehicle Fuels 59,410 125,800 66,700 71,369
Total Supplies/Non-Capital Equipment 294,717 380,400 325,425 339,969
Capital OutlayCapital Equipment 206,621 28,000 28,000 245,000
Total Capital Outlay 206,621 28,000 28,000 245,000
MiscellaneousDues/Fees 2,821 2,300 2,300 2,300 Community Incentive 712 - 113 -
Total Other Expenditures 3,533 2,300 2,413 2,300
Total Expenditures 8,961,117$ 9,813,226$ 9,301,447$ 10,232,954$
Expenditure DetailPolice Department - All Funds
134

2016Audited
Amounts
2017AdoptedBudget
2017Year-EndForecast
2018AdoptedBudget
PersonnelRegular Wages 5,460,920 6,150,959 5,674,604 6,319,902 Overtime 329,738 259,555 361,692 271,000 Allowances 44,856 44,540 46,607 46,056 Medicare 80,403 89,488 84,101 91,864 Workers Compensation 122,097 169,434 155,105 172,831 Retirement Contributions 488,817 554,155 511,763 575,829 Medical Benefits 710,600 879,893 858,992 906,207 Life/Disability Benefits 120,488 134,127 131,520 141,621
Total Personnel 7,357,919 8,282,151 7,824,384 8,525,310
Purchased ServicesProfessional Services 228,379 287,000 287,000 287,000 Technical Services 72,744 25,000 25,000 25,000 General Services 34,150 41,200 41,200 41,200 Property Services 66,665 31,000 31,000 31,000 Communication Services 611,857 590,500 590,500 590,500 Training/Registration 68,611 138,000 138,850 138,000 Mileage/Travel 1,039 600 600 600 Rentals/Leases 14,882 7,075 7,075 7,075
Total Purchased Services 1,098,327 1,120,375 1,121,225 1,120,375
Supplies/Non-Capital EquipmentOffice Supplies 26,458 25,400 25,400 25,400 Technology Supplies 15,663 24,000 24,443 24,000 Operating Supplies 59,799 69,500 69,500 69,500 Non-Capital Equipment 131,942 133,700 137,382 147,700 Gas/Electricity 1,445 2,000 2,000 2,000 Motor Vehicle Fuels 59,410 125,800 66,700 71,369
Total Supplies/Non-Capital Equipment 294,717 380,400 325,425 339,969
Capital OutlayCapital Equipment 206,621 28,000 28,000 245,000
Total Capital Outlay 206,621 28,000 28,000 245,000
MiscellaneousDues/Fees 2,821 2,300 2,300 2,300 Community Incentive 712 - 113 -
Total Other Expenditures 3,533 2,300 2,413 2,300
Total Expenditures 8,961,117$ 9,813,226$ 9,301,447$ 10,232,954$
Police Department - General FundExpenditure Detail
135
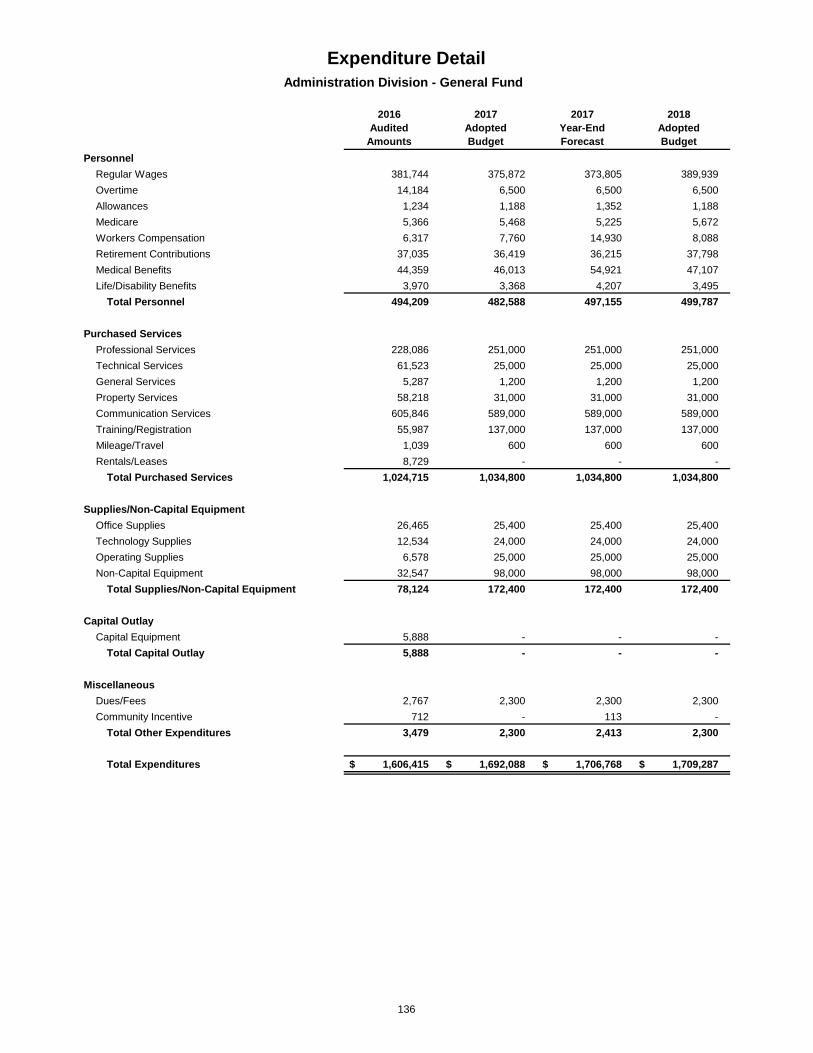
2016Audited
Amounts
2017AdoptedBudget
2017Year-EndForecast
2018AdoptedBudget
PersonnelRegular Wages 381,744 375,872 373,805 389,939 Overtime 14,184 6,500 6,500 6,500 Allowances 1,234 1,188 1,352 1,188 Medicare 5,366 5,468 5,225 5,672 Workers Compensation 6,317 7,760 14,930 8,088 Retirement Contributions 37,035 36,419 36,215 37,798 Medical Benefits 44,359 46,013 54,921 47,107 Life/Disability Benefits 3,970 3,368 4,207 3,495
Total Personnel 494,209 482,588 497,155 499,787
Purchased ServicesProfessional Services 228,086 251,000 251,000 251,000 Technical Services 61,523 25,000 25,000 25,000 General Services 5,287 1,200 1,200 1,200 Property Services 58,218 31,000 31,000 31,000 Communication Services 605,846 589,000 589,000 589,000 Training/Registration 55,987 137,000 137,000 137,000 Mileage/Travel 1,039 600 600 600 Rentals/Leases 8,729 - - -
Total Purchased Services 1,024,715 1,034,800 1,034,800 1,034,800
Supplies/Non-Capital EquipmentOffice Supplies 26,465 25,400 25,400 25,400 Technology Supplies 12,534 24,000 24,000 24,000 Operating Supplies 6,578 25,000 25,000 25,000 Non-Capital Equipment 32,547 98,000 98,000 98,000
Total Supplies/Non-Capital Equipment 78,124 172,400 172,400 172,400
Capital OutlayCapital Equipment 5,888 - - -
Total Capital Outlay 5,888 - - -
MiscellaneousDues/Fees 2,767 2,300 2,300 2,300 Community Incentive 712 - 113 -
Total Other Expenditures 3,479 2,300 2,413 2,300
Total Expenditures 1,606,415$ 1,692,088$ 1,706,768$ 1,709,287$
Expenditure DetailAdministration Division - General Fund
136
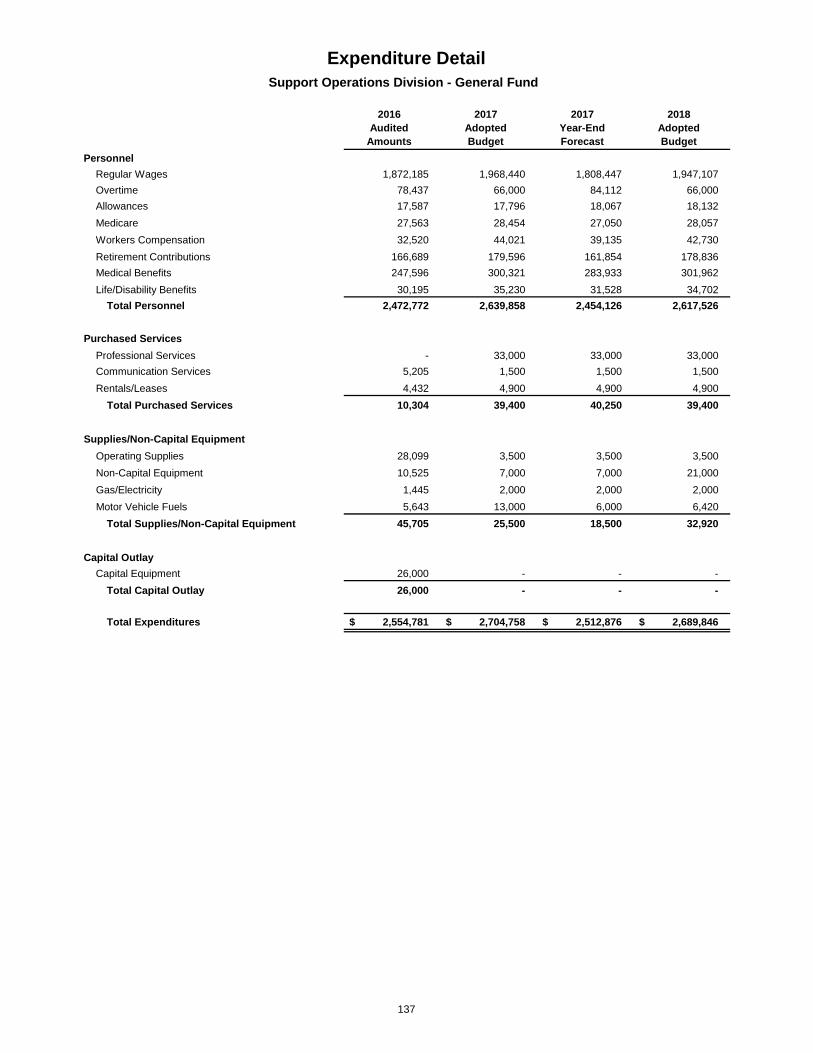
2016Audited
Amounts
2017AdoptedBudget
2017Year-EndForecast
2018AdoptedBudget
PersonnelRegular Wages 1,872,185 1,968,440 1,808,447 1,947,107 Overtime 78,437 66,000 84,112 66,000 Allowances 17,587 17,796 18,067 18,132 Medicare 27,563 28,454 27,050 28,057 Workers Compensation 32,520 44,021 39,135 42,730 Retirement Contributions 166,689 179,596 161,854 178,836 Medical Benefits 247,596 300,321 283,933 301,962 Life/Disability Benefits 30,195 35,230 31,528 34,702
Total Personnel 2,472,772 2,639,858 2,454,126 2,617,526
Purchased ServicesProfessional Services - 33,000 33,000 33,000 Communication Services 5,205 1,500 1,500 1,500 Rentals/Leases 4,432 4,900 4,900 4,900
Total Purchased Services 10,304 39,400 40,250 39,400
Supplies/Non-Capital EquipmentOperating Supplies 28,099 3,500 3,500 3,500 Non-Capital Equipment 10,525 7,000 7,000 21,000 Gas/Electricity 1,445 2,000 2,000 2,000 Motor Vehicle Fuels 5,643 13,000 6,000 6,420
Total Supplies/Non-Capital Equipment 45,705 25,500 18,500 32,920
Capital OutlayCapital Equipment 26,000 - - -
Total Capital Outlay 26,000 - - -
Total Expenditures 2,554,781$ 2,704,758$ 2,512,876$ 2,689,846$
Expenditure DetailSupport Operations Division - General Fund
137

2016Audited
Amounts
2017AdoptedBudget
2017Year-EndForecast
2018AdoptedBudget
PersonnelRegular Wages 3,116,036 3,699,461 3,392,278 3,877,128 Overtime 232,282 185,255 269,280 195,000 Allowances 25,363 24,788 26,314 25,968 Medicare 46,178 54,001 50,439 56,591 Workers Compensation 82,126 115,685 99,503 120,071 Retirement Contributions 276,780 328,492 304,633 349,612 Medical Benefits 400,335 505,144 495,360 532,503 Life/Disability Benefits 85,819 94,564 95,098 102,472
Total Personnel 4,264,919 5,007,390 4,732,905 5,259,345
Purchased ServicesTechnical Services 11,221 - - - Property Services 8,447 - - - Training/Registration 11,457 - - - Rentals/Leases 1,635 2,000 2,000 2,000
Total Purchased Services 32,760 2,000 2,000 2,000
Supplies/Non-Capital EquipmentTechnology Supplies 3,129 - 443 - Operating Supplies 24,871 40,000 40,000 40,000 Non-Capital Equipment 88,144 28,000 31,682 28,000 Motor Vehicle Fuels 51,130 108,000 58,000 62,060
Total Supplies/Non-Capital Equipment 167,274 176,000 130,125 130,060
Capital OutlayCapital Equipment 174,733 28,000 28,000 245,000
Total Capital Outlay 174,733 28,000 28,000 245,000
Total Expenditures 4,639,686$ 5,213,390$ 4,893,030$ 5,636,405$
Expenditure DetailPatrol Division - General Fund
138
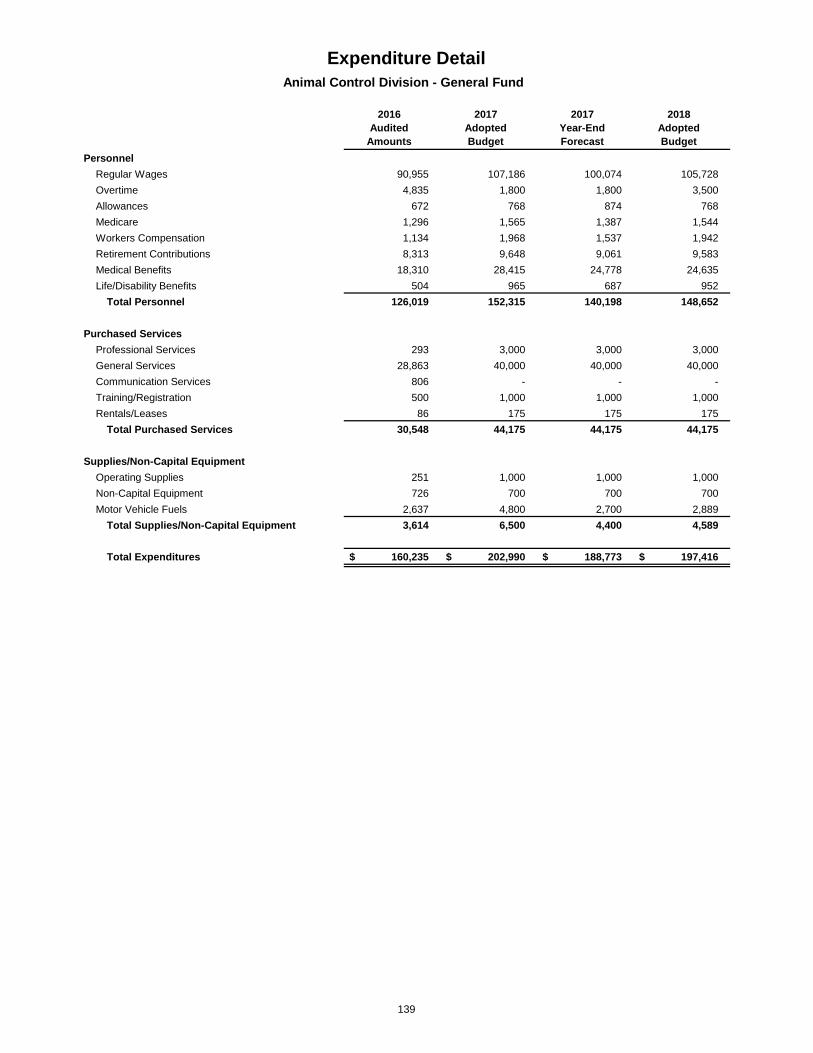
2016Audited
Amounts
2017AdoptedBudget
2017Year-EndForecast
2018AdoptedBudget
PersonnelRegular Wages 90,955 107,186 100,074 105,728 Overtime 4,835 1,800 1,800 3,500 Allowances 672 768 874 768 Medicare 1,296 1,565 1,387 1,544 Workers Compensation 1,134 1,968 1,537 1,942 Retirement Contributions 8,313 9,648 9,061 9,583 Medical Benefits 18,310 28,415 24,778 24,635 Life/Disability Benefits 504 965 687 952
Total Personnel 126,019 152,315 140,198 148,652
Purchased ServicesProfessional Services 293 3,000 3,000 3,000 General Services 28,863 40,000 40,000 40,000 Communication Services 806 - - - Training/Registration 500 1,000 1,000 1,000 Rentals/Leases 86 175 175 175
Total Purchased Services 30,548 44,175 44,175 44,175
Supplies/Non-Capital EquipmentOperating Supplies 251 1,000 1,000 1,000 Non-Capital Equipment 726 700 700 700 Motor Vehicle Fuels 2,637 4,800 2,700 2,889
Total Supplies/Non-Capital Equipment 3,614 6,500 4,400 4,589
Total Expenditures 160,235$ 202,990$ 188,773$ 197,416$
Expenditure DetailAnimal Control Division - General Fund
139
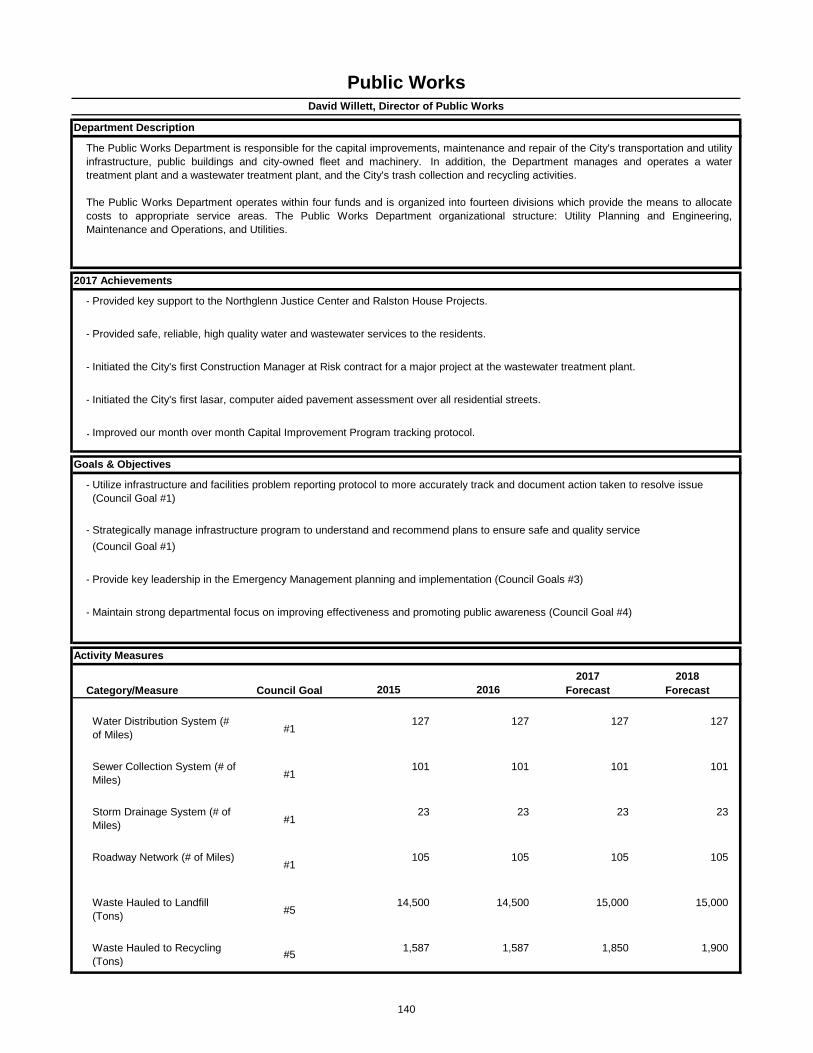
- Provided key support to the Northglenn Justice Center and Ralston House Projects.
- Provided safe, reliable, high quality water and wastewater services to the residents.
- Initiated the City's first Construction Manager at Risk contract for a major project at the wastewater treatment plant.
- Initiated the City's first lasar, computer aided pavement assessment over all residential streets.
-
-
- Strategically manage infrastructure program to understand and recommend plans to ensure safe and quality service (Council Goal #1)
- Provide key leadership in the Emergency Management planning and implementation (Council Goals #3)
- Maintain strong departmental focus on improving effectiveness and promoting public awareness (Council Goal #4)
Category/Measure Council Goal 2015 20162017
Forecast2018
Forecast
Water Distribution System (# of Miles) #1
127 127 127 127
Sewer Collection System (# of Miles) #1
101 101 101 101
Storm Drainage System (# of Miles) #1
23 23 23 23
Roadway Network (# of Miles)#1
105 105 105 105
Waste Hauled to Landfill (Tons) #5
14,500 14,500 15,000 15,000
Waste Hauled to Recycling (Tons) #5 1,587 1,587 1,850 1,900
Activity Measures
Public WorksDavid Willett, Director of Public Works
Department Description
The Public Works Department is responsible for the capital improvements, maintenance and repair of the City's transportation and utilityinfrastructure, public buildings and city-owned fleet and machinery. In addition, the Department manages and operates a watertreatment plant and a wastewater treatment plant, and the City's trash collection and recycling activities. The Public Works Department operates within four funds and is organized into fourteen divisions which provide the means to allocatecosts to appropriate service areas. The Public Works Department organizational structure: Utility Planning and Engineering,Maintenance and Operations, and Utilities.
2017 Achievements
Goals & Objectives
Improved our month over month Capital Improvement Program tracking protocol.
Utilize infrastructure and facilities problem reporting protocol to more accurately track and document action taken to resolve issue (Council Goal #1)
140

Fund(s) Budget FTEGeneral Fund 3,007,204$ 14.40 Conservation Trust Fund - - CDBG Fund - - Capital Projects Fund 16,763,085 - Water & Wastewater Fund 12,679,932 47.40 Stormwater Fund 365,443 1.00 Sanitation Fund 1,560,056 11.20 Total 34,375,720 74.00
Division/Program(s) Budget FTEAdministration/Operations 419,959$ 2.00 Facilities 457,140 3.00 Fleet 478,115 4.00 Streets 1,106,163 8.00 Engineering 1,698,730 5.00 Water Operations 1,328,486 6.50 Lab Operations 567,465 4.00 Electrical & Mechanical 631,338 5.00 Distribution & Collection 1,471,136 9.00 Water Resources Operations 1,798,427 6.00 Wastewater Operations 2,090,878 8.50 Industrial Pre-Treatment 112,725 1.00 Stormwater Operations 120,443 1.00 Sanitation Operations 1,526,407 11.00 Capital Improvement Projects 20,568,308 - Total 34,375,720 74.00
2016Audited
Amounts
2017AdoptedBudget
2017Year-EndForecast
2018AdoptedBudget
Staff - Full Time Equivalency (FTE)* 71.00 71.00 71.00 74.00
Expenditures:Personnel 5,526,921$ 5,782,395$ 5,700,961$ 6,192,707$ Purchased Services 2,549,612 1,939,950 1,929,706 2,066,650 Supplies/Non-Capital Equipment 3,062,707 3,388,411 2,994,348 3,112,305 Capital Outlay 10,942,224 37,440,988 24,007,664 22,966,308 Miscellaneous 29,704 32,250 32,480 37,750
Total Expenditures 22,111,168$ 48,583,994$ 34,665,159$ 34,375,720$
Public Works
EXPENDITURE SUMMARY
2018 BUDGET SUMMARY BY DIVISION
2018 BUDGET SUMMARY BY FUND
69.50
70.00
70.50
71.00
71.50
72.00
72.50
73.00
73.50
74.00
74.50
$-
$5,000,000
$10,000,000
$15,000,000
$20,000,000
$25,000,000
$30,000,000
$35,000,000
$40,000,000
2016Audited
Amounts
2017Year-EndForecast
2018AdoptedBudget
FTE
Expe
nditu
res
EXPENDITURE & FULL TIME EQUIVALENCY
Total Expenditures
Full Time Equivilancy (FTE)
141

Amount
74,222$ 7,000
40,000 Capital - Streets - Sign Equipment 58,000 Operating Supplies - Streets 16,000 Capital - Streets Patch Truck 210,000 Capital - Dump Truck 275,000 Professional Services - Lab Analysis 10,200 Capital - Locate Truck 65,000 Professional Services - On-call Electric 50,000 Professional Services - On-call Engineering 20,000 Operating Supplies - Slow the Flow 5,000 Capital - Water Treatment Plant 200,000 Personnel - Wastewater Treatment Operator 72,588 Personnel - Wastewater Treatment Operator 72,588 Capital - Grinder Pump 25,000 Technical Services - Local Limit Redevelopment 26,100 Professional Services - Generator Services 15,000 Capital - Wastewater Treatment Plant 200,000
20. Capital - Pressure Washer 9,000 Capital - Loader Attachment 16,000
22. Personnel - MSWI - Sanitation 53,551 23. Professional Services - Tree Program rentals 5,000
Capital - Trash Truck 300,000
1,825,249$
24.
Non-Capital Equipment - City Hall Parking Lot LightingCapital - SQL Server
19.18.
21.
2018 BUDGET PACKAGES
1. Personnel Market Adjustment
17.
2.3.4.5.6.7.8.9.10.11.12.13.14.15.16.
142
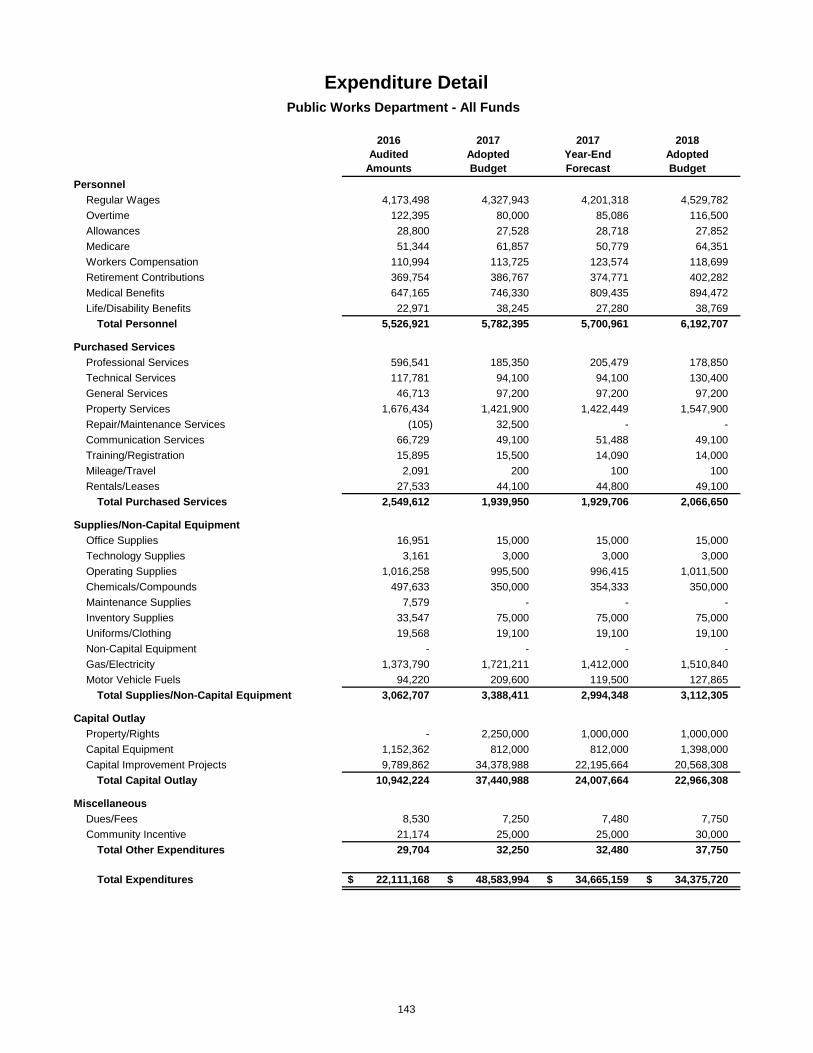
2016Audited
Amounts
2017AdoptedBudget
2017Year-EndForecast
2018AdoptedBudget
PersonnelRegular Wages 4,173,498 4,327,943 4,201,318 4,529,782 Overtime 122,395 80,000 85,086 116,500 Allowances 28,800 27,528 28,718 27,852 Medicare 51,344 61,857 50,779 64,351 Workers Compensation 110,994 113,725 123,574 118,699 Retirement Contributions 369,754 386,767 374,771 402,282 Medical Benefits 647,165 746,330 809,435 894,472 Life/Disability Benefits 22,971 38,245 27,280 38,769
Total Personnel 5,526,921 5,782,395 5,700,961 6,192,707
Purchased ServicesProfessional Services 596,541 185,350 205,479 178,850 Technical Services 117,781 94,100 94,100 130,400 General Services 46,713 97,200 97,200 97,200 Property Services 1,676,434 1,421,900 1,422,449 1,547,900 Repair/Maintenance Services (105) 32,500 - - Communication Services 66,729 49,100 51,488 49,100 Training/Registration 15,895 15,500 14,090 14,000 Mileage/Travel 2,091 200 100 100 Rentals/Leases 27,533 44,100 44,800 49,100
Total Purchased Services 2,549,612 1,939,950 1,929,706 2,066,650
Supplies/Non-Capital EquipmentOffice Supplies 16,951 15,000 15,000 15,000 Technology Supplies 3,161 3,000 3,000 3,000 Operating Supplies 1,016,258 995,500 996,415 1,011,500 Chemicals/Compounds 497,633 350,000 354,333 350,000 Maintenance Supplies 7,579 - - - Inventory Supplies 33,547 75,000 75,000 75,000 Uniforms/Clothing 19,568 19,100 19,100 19,100 Non-Capital Equipment - - - - Gas/Electricity 1,373,790 1,721,211 1,412,000 1,510,840 Motor Vehicle Fuels 94,220 209,600 119,500 127,865
Total Supplies/Non-Capital Equipment 3,062,707 3,388,411 2,994,348 3,112,305
Capital OutlayProperty/Rights - 2,250,000 1,000,000 1,000,000 Capital Equipment 1,152,362 812,000 812,000 1,398,000 Capital Improvement Projects 9,789,862 34,378,988 22,195,664 20,568,308
Total Capital Outlay 10,942,224 37,440,988 24,007,664 22,966,308
MiscellaneousDues/Fees 8,530 7,250 7,480 7,750 Community Incentive 21,174 25,000 25,000 30,000
Total Other Expenditures 29,704 32,250 32,480 37,750
Total Expenditures 22,111,168$ 48,583,994$ 34,665,159$ 34,375,720$
Expenditure DetailPublic Works Department - All Funds
143
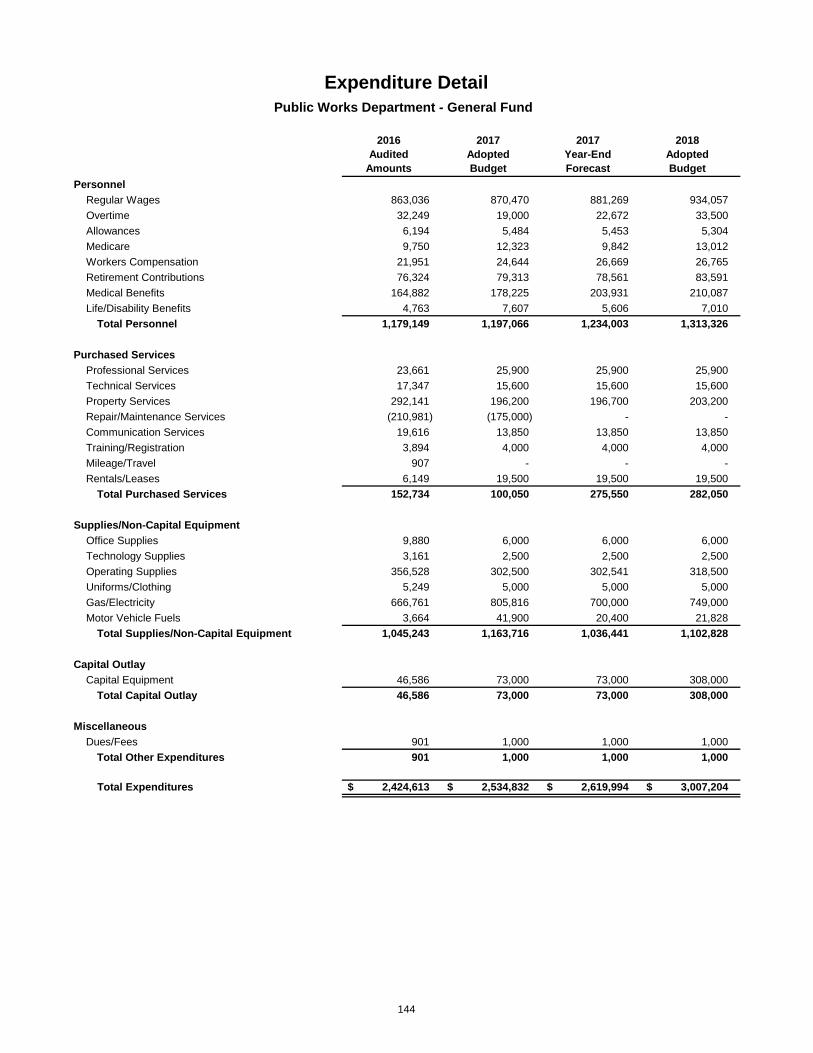
2016Audited
Amounts
2017AdoptedBudget
2017Year-EndForecast
2018AdoptedBudget
PersonnelRegular Wages 863,036 870,470 881,269 934,057 Overtime 32,249 19,000 22,672 33,500 Allowances 6,194 5,484 5,453 5,304 Medicare 9,750 12,323 9,842 13,012 Workers Compensation 21,951 24,644 26,669 26,765 Retirement Contributions 76,324 79,313 78,561 83,591 Medical Benefits 164,882 178,225 203,931 210,087 Life/Disability Benefits 4,763 7,607 5,606 7,010
Total Personnel 1,179,149 1,197,066 1,234,003 1,313,326
Purchased ServicesProfessional Services 23,661 25,900 25,900 25,900 Technical Services 17,347 15,600 15,600 15,600 Property Services 292,141 196,200 196,700 203,200 Repair/Maintenance Services (210,981) (175,000) - - Communication Services 19,616 13,850 13,850 13,850 Training/Registration 3,894 4,000 4,000 4,000 Mileage/Travel 907 - - - Rentals/Leases 6,149 19,500 19,500 19,500
Total Purchased Services 152,734 100,050 275,550 282,050
Supplies/Non-Capital EquipmentOffice Supplies 9,880 6,000 6,000 6,000 Technology Supplies 3,161 2,500 2,500 2,500 Operating Supplies 356,528 302,500 302,541 318,500 Uniforms/Clothing 5,249 5,000 5,000 5,000 Gas/Electricity 666,761 805,816 700,000 749,000 Motor Vehicle Fuels 3,664 41,900 20,400 21,828
Total Supplies/Non-Capital Equipment 1,045,243 1,163,716 1,036,441 1,102,828
Capital OutlayCapital Equipment 46,586 73,000 73,000 308,000
Total Capital Outlay 46,586 73,000 73,000 308,000
MiscellaneousDues/Fees 901 1,000 1,000 1,000
Total Other Expenditures 901 1,000 1,000 1,000
Total Expenditures 2,424,613$ 2,534,832$ 2,619,994$ 3,007,204$
Public Works Department - General Fund
Expenditure Detail
144
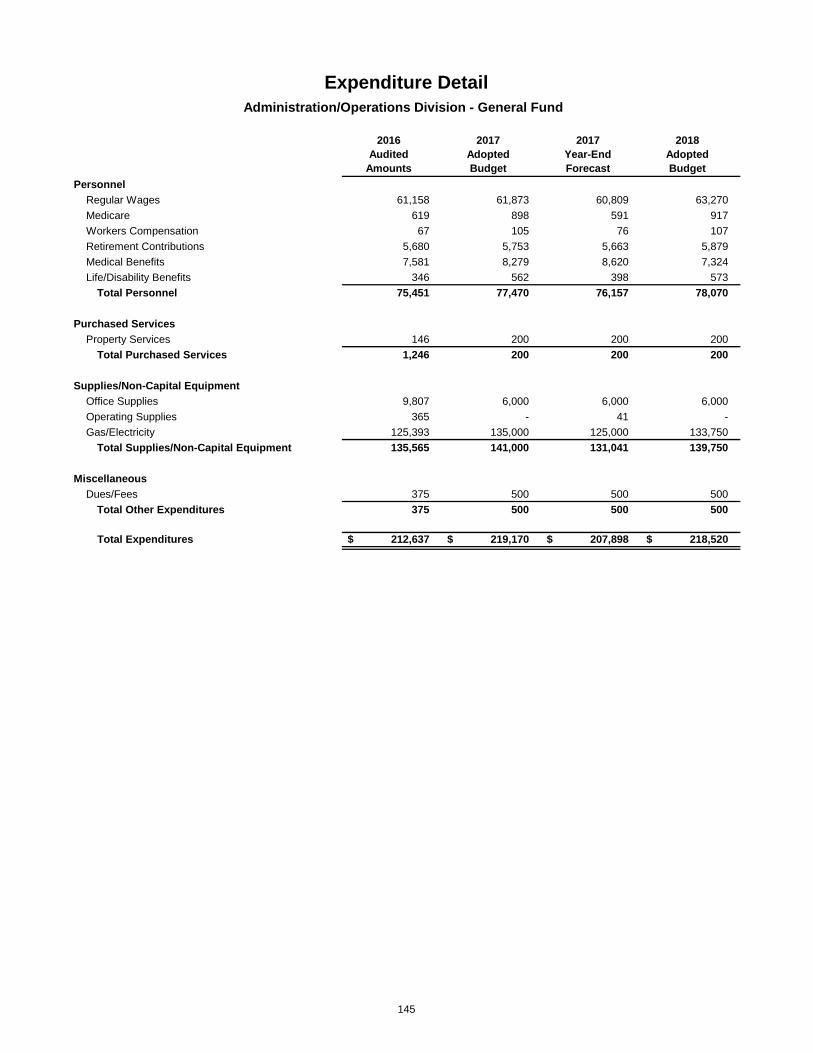
2016Audited
Amounts
2017AdoptedBudget
2017Year-EndForecast
2018AdoptedBudget
PersonnelRegular Wages 61,158 61,873 60,809 63,270 Medicare 619 898 591 917 Workers Compensation 67 105 76 107 Retirement Contributions 5,680 5,753 5,663 5,879 Medical Benefits 7,581 8,279 8,620 7,324 Life/Disability Benefits 346 562 398 573
Total Personnel 75,451 77,470 76,157 78,070
Purchased ServicesProperty Services 146 200 200 200
Total Purchased Services 1,246 200 200 200
Supplies/Non-Capital EquipmentOffice Supplies 9,807 6,000 6,000 6,000 Operating Supplies 365 - 41 - Gas/Electricity 125,393 135,000 125,000 133,750
Total Supplies/Non-Capital Equipment 135,565 141,000 131,041 139,750
MiscellaneousDues/Fees 375 500 500 500
Total Other Expenditures 375 500 500 500
Total Expenditures 212,637$ 219,170$ 207,898$ 218,520$
Expenditure DetailAdministration/Operations Division - General Fund
145
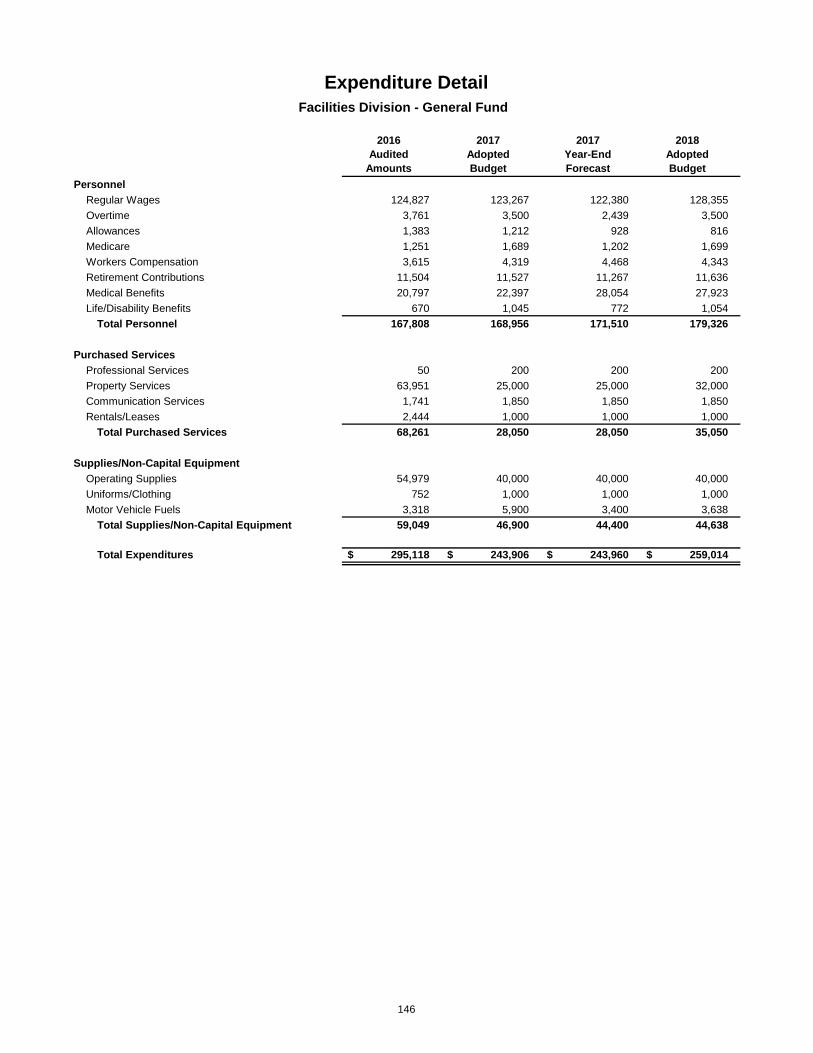
2016Audited
Amounts
2017AdoptedBudget
2017Year-EndForecast
2018AdoptedBudget
PersonnelRegular Wages 124,827 123,267 122,380 128,355 Overtime 3,761 3,500 2,439 3,500 Allowances 1,383 1,212 928 816 Medicare 1,251 1,689 1,202 1,699 Workers Compensation 3,615 4,319 4,468 4,343 Retirement Contributions 11,504 11,527 11,267 11,636 Medical Benefits 20,797 22,397 28,054 27,923 Life/Disability Benefits 670 1,045 772 1,054
Total Personnel 167,808 168,956 171,510 179,326
Purchased ServicesProfessional Services 50 200 200 200 Property Services 63,951 25,000 25,000 32,000 Communication Services 1,741 1,850 1,850 1,850 Rentals/Leases 2,444 1,000 1,000 1,000
Total Purchased Services 68,261 28,050 28,050 35,050
Supplies/Non-Capital EquipmentOperating Supplies 54,979 40,000 40,000 40,000 Uniforms/Clothing 752 1,000 1,000 1,000 Motor Vehicle Fuels 3,318 5,900 3,400 3,638
Total Supplies/Non-Capital Equipment 59,049 46,900 44,400 44,638
Total Expenditures 295,118$ 243,906$ 243,960$ 259,014$
Facilities Division - General Fund
Expenditure Detail
146

2016Audited
Amounts
2017AdoptedBudget
2017Year-EndForecast
2018AdoptedBudget
PersonnelRegular Wages 242,935 242,358 253,154 240,923 Overtime 7,995 3,500 3,509 5,000 Allowances 1,573 816 1,276 1,224 Medicare 2,714 3,352 2,788 3,338 Workers Compensation 3,384 3,565 3,988 3,545 Retirement Contributions 21,909 23,036 22,925 21,945 Medical Benefits 55,691 60,930 62,042 64,879 Life/Disability Benefits 1,323 2,072 1,470 2,061
Total Personnel 337,524 339,629 351,152 342,915
Purchased ServicesProfessional Services 275 200 200 200 Technical Services 11,907 5,000 5,000 5,000 Property Services 92,995 36,000 36,000 36,000 Repair/Maintenance Services (210,981) (175,000) - - Communication Services 1,210 1,500 1,500 1,500 Training/Registration 1,039 1,000 1,000 1,000 Rentals/Leases 658 500 500 500
Total Purchased Services (101,990) (130,800) 44,200 44,200
Supplies/Non-Capital EquipmentOperating Supplies 81,652 90,000 90,000 90,000 Uniforms/Clothing 549 1,000 1,000 1,000 Motor Vehicle Fuels (14,772) - - -
Total Supplies/Non-Capital Equipment 67,502 91,000 91,000 91,000
Total Expenditures 311,225$ 299,829$ 486,352$ 478,115$
Fleet Division - General Fund
Expenditure Detail
147

2016Audited
Amounts
2017AdoptedBudget
2017Year-EndForecast
2018AdoptedBudget
PersonnelRegular Wages 332,687 330,433 336,669 386,820 Overtime 20,493 12,000 16,724 25,000 Allowances 2,856 2,856 3,249 3,264 Medicare 3,716 4,743 3,748 5,395 Workers Compensation 13,793 15,170 16,528 17,264 Retirement Contributions 29,117 29,994 30,045 34,956 Medical Benefits 73,219 79,678 88,964 93,792 Life/Disability Benefits 1,848 2,917 2,230 3,322
Total Personnel 477,729 477,791 498,157 569,813
Purchased ServicesProfessional Services 822 500 500 500 Technical Services 5,225 5,300 5,300 5,300 Property Services 31,987 20,000 20,500 20,000 Communication Services 5,412 3,500 3,500 3,500 Training/Registration 2,034 1,000 1,000 1,000 Rentals/Leases 3,047 18,000 18,000 18,000
Total Purchased Services 48,527 48,300 48,800 48,300
Supplies/Non-Capital EquipmentOperating Supplies 217,035 170,000 170,000 186,000 Uniforms/Clothing 3,948 3,000 3,000 3,000 Motor Vehicle Fuels 13,181 33,000 15,000 16,050
Total Supplies/Non-Capital Equipment 234,164 206,000 188,000 205,050
Capital OutlayCapital Equipment 38,397 73,000 73,000 268,000
Total Capital Outlay 38,397 73,000 73,000 268,000
Total Expenditures 798,817$ 805,091$ 807,957$ 1,091,163$
Expenditure DetailStreets Division - General Fund
148
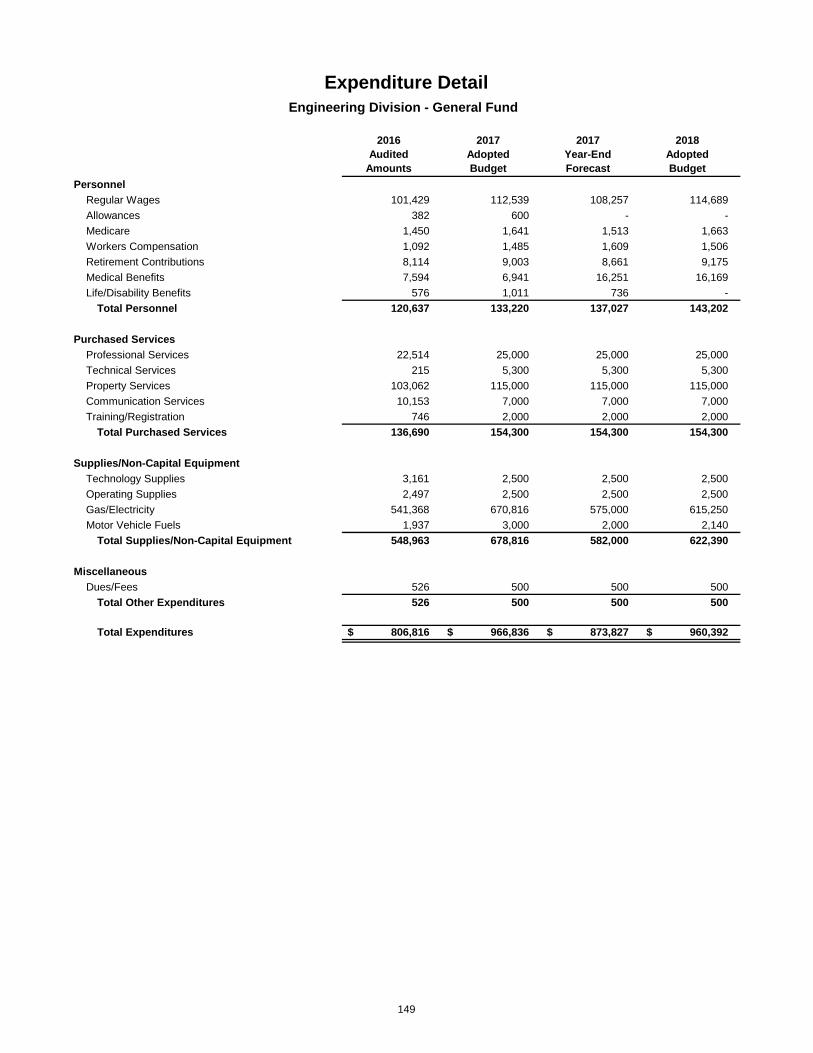
2016Audited
Amounts
2017AdoptedBudget
2017Year-EndForecast
2018AdoptedBudget
PersonnelRegular Wages 101,429 112,539 108,257 114,689 Allowances 382 600 - - Medicare 1,450 1,641 1,513 1,663 Workers Compensation 1,092 1,485 1,609 1,506 Retirement Contributions 8,114 9,003 8,661 9,175 Medical Benefits 7,594 6,941 16,251 16,169 Life/Disability Benefits 576 1,011 736 -
Total Personnel 120,637 133,220 137,027 143,202
Purchased ServicesProfessional Services 22,514 25,000 25,000 25,000 Technical Services 215 5,300 5,300 5,300 Property Services 103,062 115,000 115,000 115,000 Communication Services 10,153 7,000 7,000 7,000 Training/Registration 746 2,000 2,000 2,000
Total Purchased Services 136,690 154,300 154,300 154,300
Supplies/Non-Capital EquipmentTechnology Supplies 3,161 2,500 2,500 2,500 Operating Supplies 2,497 2,500 2,500 2,500 Gas/Electricity 541,368 670,816 575,000 615,250 Motor Vehicle Fuels 1,937 3,000 2,000 2,140
Total Supplies/Non-Capital Equipment 548,963 678,816 582,000 622,390
MiscellaneousDues/Fees 526 500 500 500
Total Other Expenditures 526 500 500 500
Total Expenditures 806,816$ 966,836$ 873,827$ 960,392$
Expenditure DetailEngineering Division - General Fund
149
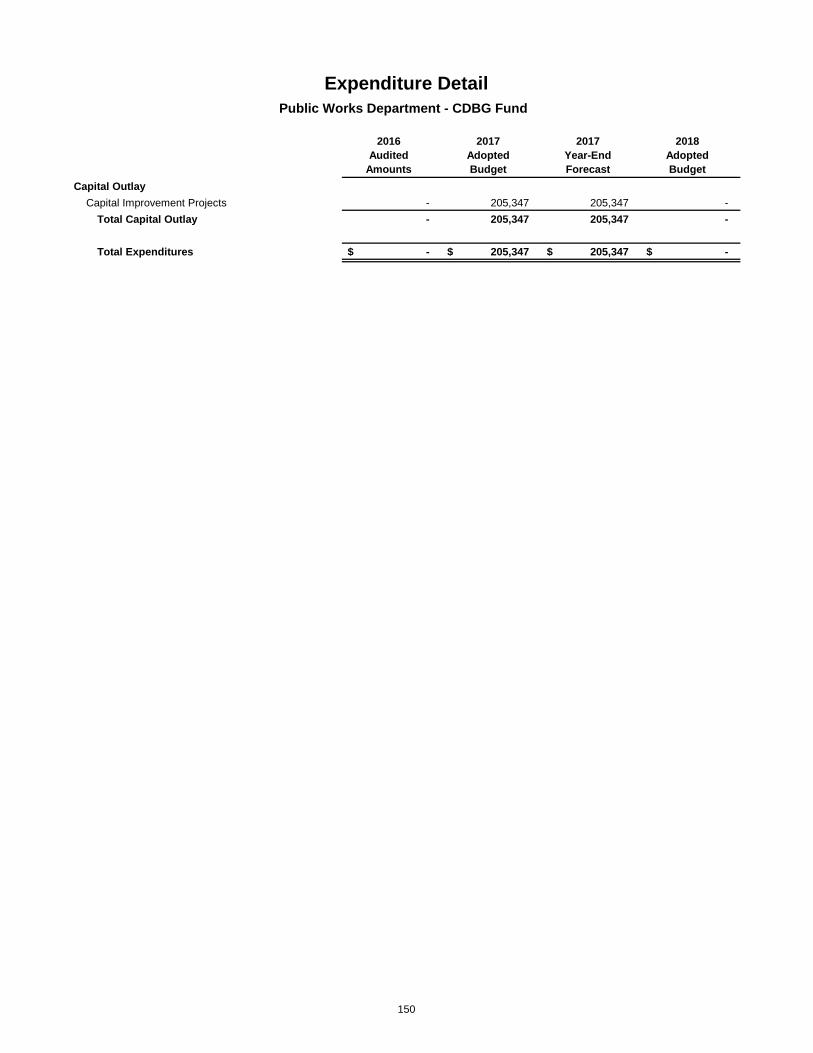
2016Audited
Amounts
2017AdoptedBudget
2017Year-EndForecast
2018AdoptedBudget
Capital OutlayCapital Improvement Projects - 205,347 205,347 -
Total Capital Outlay - 205,347 205,347 -
Total Expenditures -$ 205,347$ 205,347$ -$
Expenditure DetailPublic Works Department - CDBG Fund
150

2016Audited
Amounts
2017AdoptedBudget
2017Year-EndForecast
2018AdoptedBudget
Capital OutlayCapital Improvement Projects - 205,347 205,347 -
Total Capital Outlay - 205,347 205,347 -
Total Expenditures -$ 205,347$ 205,347$ -$
Expenditure DetailCapital Improvement Projects Division - CDBG Fund
151

2016Audited
Amounts
2017AdoptedBudget
2017Year-EndForecast
2018AdoptedBudget
Capital OutlayCapital Improvement Projects 2,757,464 24,860,079 13,552,994 16,763,085
Total Capital Outlay 2,757,464 24,860,079 13,552,994 16,763,085
Total Expenditures 2,757,464$ 24,860,079$ 13,552,994$ 16,763,085$
Public Works Department - Capital Projects Fund
Expenditure Detail
152
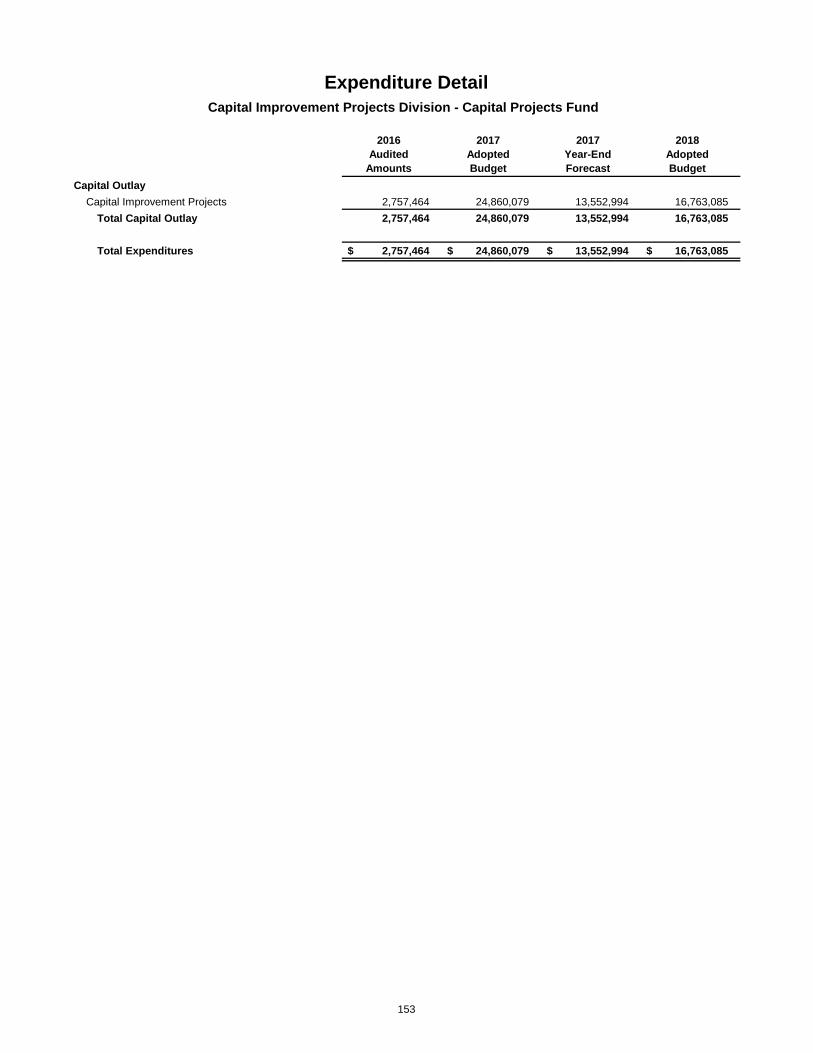
2016Audited
Amounts
2017AdoptedBudget
2017Year-EndForecast
2018AdoptedBudget
Capital OutlayCapital Improvement Projects 2,757,464 24,860,079 13,552,994 16,763,085
Total Capital Outlay 2,757,464 24,860,079 13,552,994 16,763,085
Total Expenditures 2,757,464$ 24,860,079$ 13,552,994$ 16,763,085$
Expenditure DetailCapital Improvement Projects Division - Capital Projects Fund
153
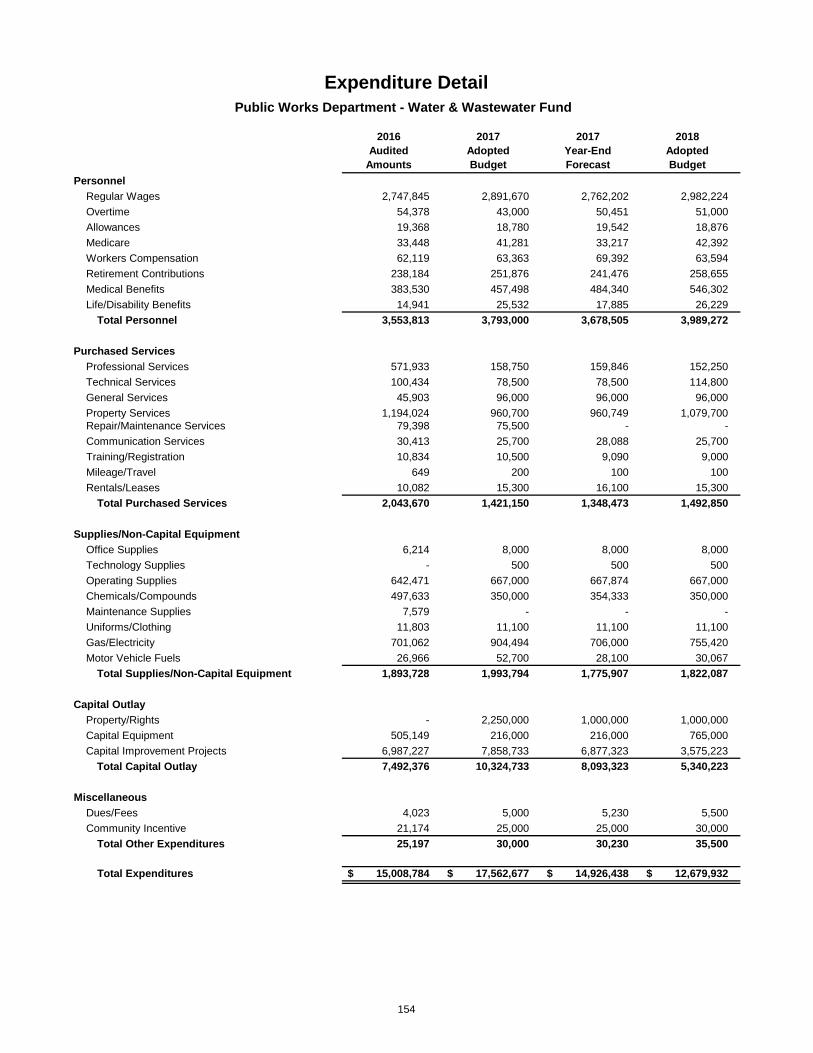
2016Audited
Amounts
2017AdoptedBudget
2017Year-EndForecast
2018AdoptedBudget
PersonnelRegular Wages 2,747,845 2,891,670 2,762,202 2,982,224 Overtime 54,378 43,000 50,451 51,000 Allowances 19,368 18,780 19,542 18,876 Medicare 33,448 41,281 33,217 42,392 Workers Compensation 62,119 63,363 69,392 63,594 Retirement Contributions 238,184 251,876 241,476 258,655 Medical Benefits 383,530 457,498 484,340 546,302 Life/Disability Benefits 14,941 25,532 17,885 26,229
Total Personnel 3,553,813 3,793,000 3,678,505 3,989,272
Purchased ServicesProfessional Services 571,933 158,750 159,846 152,250 Technical Services 100,434 78,500 78,500 114,800 General Services 45,903 96,000 96,000 96,000 Property Services 1,194,024 960,700 960,749 1,079,700 Repair/Maintenance Services 79,398 75,500 - - Communication Services 30,413 25,700 28,088 25,700 Training/Registration 10,834 10,500 9,090 9,000 Mileage/Travel 649 200 100 100 Rentals/Leases 10,082 15,300 16,100 15,300
Total Purchased Services 2,043,670 1,421,150 1,348,473 1,492,850
Supplies/Non-Capital EquipmentOffice Supplies 6,214 8,000 8,000 8,000 Technology Supplies - 500 500 500 Operating Supplies 642,471 667,000 667,874 667,000 Chemicals/Compounds 497,633 350,000 354,333 350,000 Maintenance Supplies 7,579 - - - Uniforms/Clothing 11,803 11,100 11,100 11,100 Gas/Electricity 701,062 904,494 706,000 755,420 Motor Vehicle Fuels 26,966 52,700 28,100 30,067
Total Supplies/Non-Capital Equipment 1,893,728 1,993,794 1,775,907 1,822,087
Capital OutlayProperty/Rights - 2,250,000 1,000,000 1,000,000 Capital Equipment 505,149 216,000 216,000 765,000 Capital Improvement Projects 6,987,227 7,858,733 6,877,323 3,575,223
Total Capital Outlay 7,492,376 10,324,733 8,093,323 5,340,223
MiscellaneousDues/Fees 4,023 5,000 5,230 5,500 Community Incentive 21,174 25,000 25,000 30,000
Total Other Expenditures 25,197 30,000 30,230 35,500
Total Expenditures 15,008,784$ 17,562,677$ 14,926,438$ 12,679,932$
Expenditure DetailPublic Works Department - Water & Wastewater Fund
154
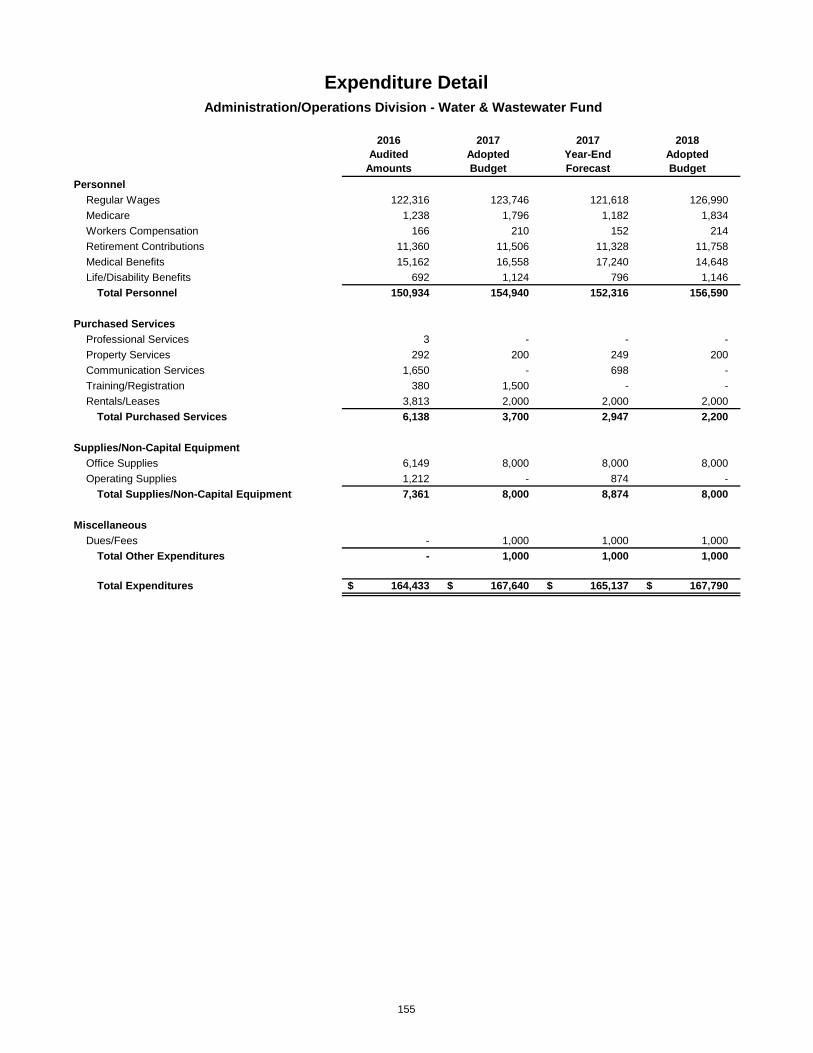
2016Audited
Amounts
2017AdoptedBudget
2017Year-EndForecast
2018AdoptedBudget
PersonnelRegular Wages 122,316 123,746 121,618 126,990 Medicare 1,238 1,796 1,182 1,834 Workers Compensation 166 210 152 214 Retirement Contributions 11,360 11,506 11,328 11,758 Medical Benefits 15,162 16,558 17,240 14,648 Life/Disability Benefits 692 1,124 796 1,146
Total Personnel 150,934 154,940 152,316 156,590
Purchased ServicesProfessional Services 3 - - - Property Services 292 200 249 200 Communication Services 1,650 - 698 - Training/Registration 380 1,500 - - Rentals/Leases 3,813 2,000 2,000 2,000
Total Purchased Services 6,138 3,700 2,947 2,200
Supplies/Non-Capital EquipmentOffice Supplies 6,149 8,000 8,000 8,000 Operating Supplies 1,212 - 874 -
Total Supplies/Non-Capital Equipment 7,361 8,000 8,874 8,000
MiscellaneousDues/Fees - 1,000 1,000 1,000
Total Other Expenditures - 1,000 1,000 1,000
Total Expenditures 164,433$ 167,640$ 165,137$ 167,790$
Expenditure DetailAdministration/Operations Division - Water & Wastewater Fund
155

2016Audited
Amounts
2017AdoptedBudget
2017Year-EndForecast
2018AdoptedBudget
PersonnelRegular Wages 124,826 123,267 122,380 128,355 Overtime 3,761 3,000 2,439 3,000 Allowances 1,383 1,212 928 816 Medicare 1,251 1,689 1,202 1,699 Workers Compensation 4,033 4,319 4,468 4,343 Retirement Contributions 11,504 11,527 11,267 11,636 Medical Benefits 20,797 22,397 28,054 27,923 Life/Disability Benefits 669 1,045 771 1,054
Total Personnel 168,224 168,456 171,509 178,826
Purchased ServicesProperty Services 16,381 12,000 12,000 12,000 Communication Services 3,995 1,800 2,100 1,800 Rentals/Leases - 500 500 500
Total Purchased Services 20,376 14,300 14,600 14,300
Supplies/Non-Capital EquipmentOperating Supplies 3,752 5,000 5,000 5,000
Total Supplies/Non-Capital Equipment 3,767 5,000 5,000 5,000
Capital OutlayCapital Equipment 33,217 - - -
Total Capital Outlay 33,217 - - -
Total Expenditures 225,584$ 187,756$ 191,109$ 198,126$
Expenditure DetailFacilities Division - Water & Wastewater Fund
156
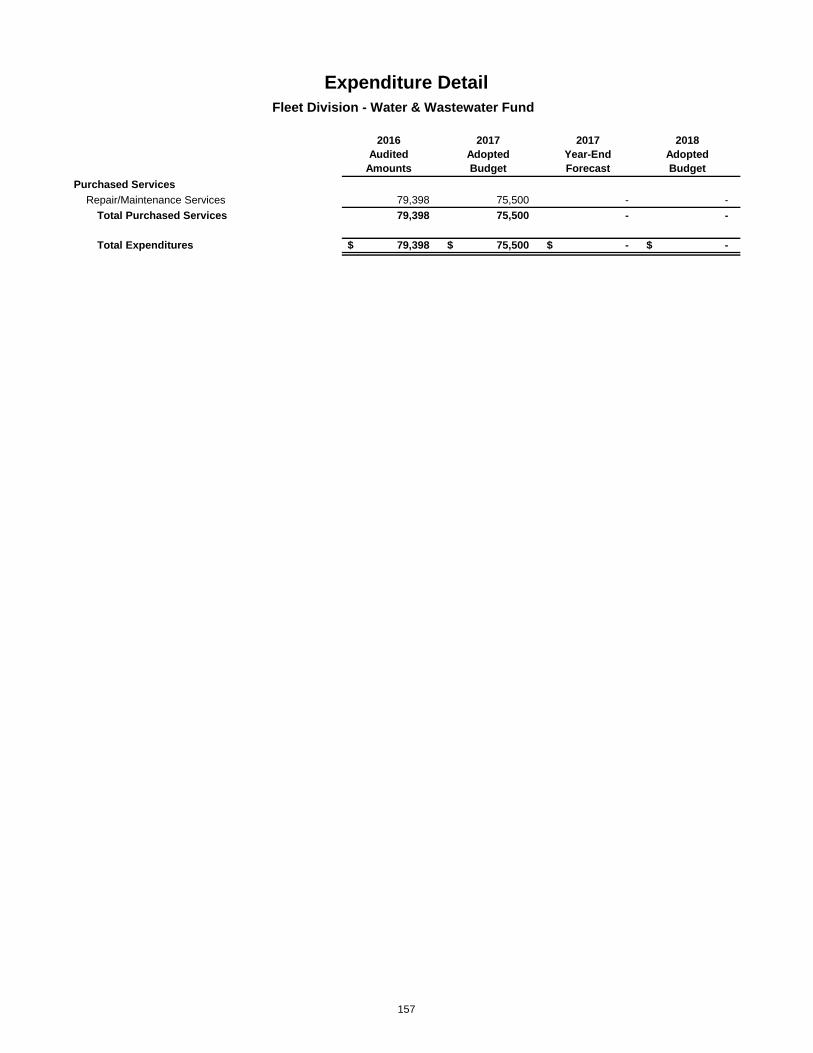
2016Audited
Amounts
2017AdoptedBudget
2017Year-EndForecast
2018AdoptedBudget
Purchased ServicesRepair/Maintenance Services 79,398 75,500 - -
Total Purchased Services 79,398 75,500 - -
Total Expenditures 79,398$ 75,500$ -$ -$
Expenditure DetailFleet Division - Water & Wastewater Fund
157

2016Audited
Amounts
2017AdoptedBudget
2017Year-EndForecast
2018AdoptedBudget
PersonnelRegular Wages 496,475 541,365 500,871 513,038 Overtime 3,148 - 4,556 - Allowances 960 1,416 580 408 Medicare 6,815 7,875 6,801 7,444 Workers Compensation 7,727 8,251 8,362 7,365 Retirement Contributions 41,546 45,733 42,213 43,581 Medical Benefits 85,232 96,524 113,440 111,476 Life/Disability Benefits 2,848 4,891 3,398 4,636
Total Personnel 644,751 706,055 680,221 687,948
Purchased ServicesProfessional Services 11,698 40,000 40,000 40,000 Technical Services - 1,000 1,000 1,000 Communication Services 1,717 1,000 1,000 1,000 Training/Registration - 1,000 1,000 1,000 Rentals/Leases 1,397 2,500 2,500 2,500
Total Purchased Services 14,812 45,500 45,500 45,500
Supplies/Non-Capital EquipmentOperating Supplies 1,041 2,000 2,000 2,000 Motor Vehicle Fuels 2,008 1,500 2,000 2,140
Total Supplies/Non-Capital Equipment 3,049 3,500 4,000 4,140
Capital OutlayCapital Equipment - 35,000 35,000 -
Total Capital Outlay - 35,000 35,000 -
MiscellaneousDues/Fees - 500 500 750
Total Other Expenditures - 500 500 750
Total Expenditures 662,612$ 790,555$ 765,221$ 738,338$
Engineering Division - Water & Wastewater Fund
Expenditure Detail
158

2016Audited
Amounts
2017AdoptedBudget
2017Year-EndForecast
2018AdoptedBudget
PersonnelRegular Wages 464,208 557,152 470,243 495,697 Overtime 8,031 8,000 7,955 8,000 Allowances 5,618 4,464 5,589 5,256 Medicare 5,987 8,101 5,996 7,206 Workers Compensation 10,889 13,195 12,639 11,617 Retirement Contributions 41,363 48,473 42,083 44,146 Medical Benefits 68,446 90,999 86,648 86,247 Life/Disability Benefits 2,674 4,989 3,159 4,422
Total Personnel 607,216 735,373 634,312 662,591
Purchased ServicesProfessional Services 3,747 250 7,335 250 Technical Services 25,401 20,000 20,000 20,000 General Services - 9,000 9,000 9,000 Property Services 12,530 14,000 14,000 34,000 Communication Services 7,275 8,000 8,000 8,000 Training/Registration 2,759 1,500 1,500 1,500 Rentals/Leases 874 1,000 1,000 1,000
Total Purchased Services 52,586 53,750 60,835 73,750
Supplies/Non-Capital EquipmentOperating Supplies 219,631 150,000 150,000 150,000 Maintenance Supplies 7,579 - - - Uniforms/Clothing 2,352 2,000 2,000 2,000 Gas/Electricity 229,500 251,240 223,000 238,610 Motor Vehicle Fuels 458 1,900 500 535
Total Supplies/Non-Capital Equipment 462,491 405,140 379,833 391,145
Capital OutlayCapital Equipment 97,501 80,000 80,000 200,000
Total Capital Outlay 97,501 80,000 80,000 200,000
MiscellaneousDues/Fees 662 1,000 1,000 1,000
Total Other Expenditures 662 1,000 1,000 1,000
Total Expenditures 1,220,456$ 1,275,263$ 1,155,980$ 1,328,486$
Expenditure DetailWater Operations Division - Water & Wastewater Fund
159
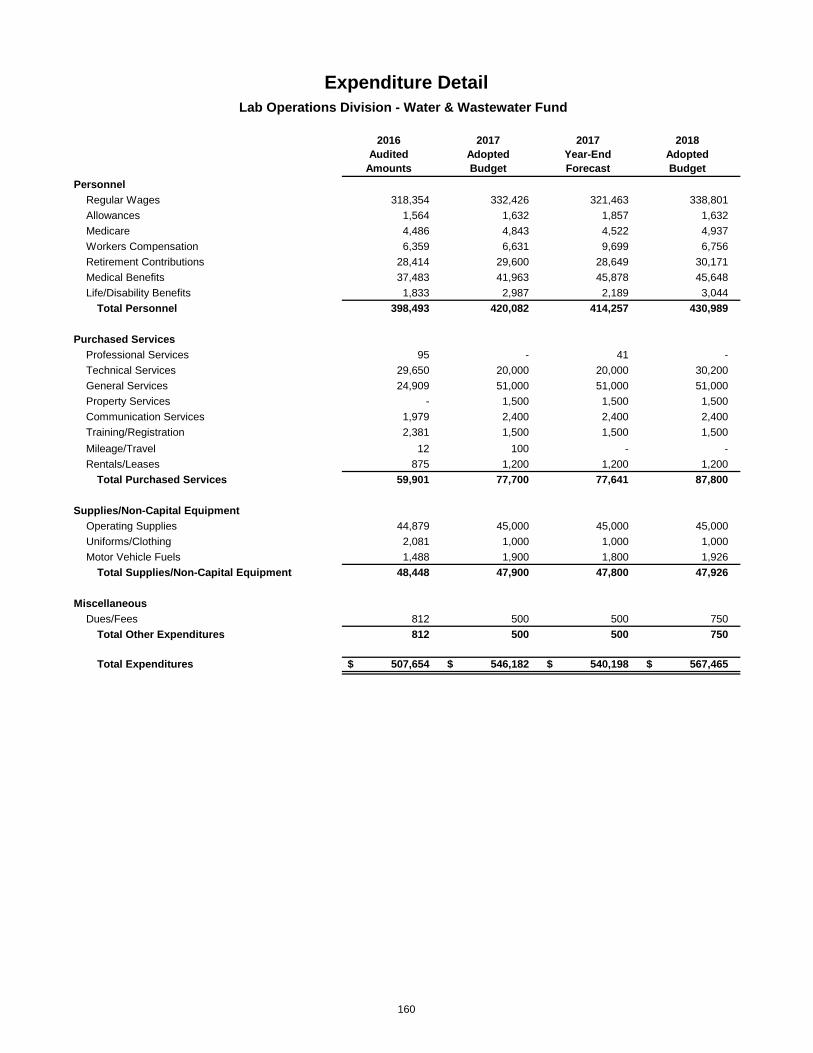
2016Audited
Amounts
2017AdoptedBudget
2017Year-EndForecast
2018AdoptedBudget
PersonnelRegular Wages 318,354 332,426 321,463 338,801 Allowances 1,564 1,632 1,857 1,632 Medicare 4,486 4,843 4,522 4,937 Workers Compensation 6,359 6,631 9,699 6,756 Retirement Contributions 28,414 29,600 28,649 30,171 Medical Benefits 37,483 41,963 45,878 45,648 Life/Disability Benefits 1,833 2,987 2,189 3,044
Total Personnel 398,493 420,082 414,257 430,989
Purchased ServicesProfessional Services 95 - 41 - Technical Services 29,650 20,000 20,000 30,200 General Services 24,909 51,000 51,000 51,000 Property Services - 1,500 1,500 1,500 Communication Services 1,979 2,400 2,400 2,400 Training/Registration 2,381 1,500 1,500 1,500 Mileage/Travel 12 100 - - Rentals/Leases 875 1,200 1,200 1,200
Total Purchased Services 59,901 77,700 77,641 87,800
Supplies/Non-Capital EquipmentOperating Supplies 44,879 45,000 45,000 45,000 Uniforms/Clothing 2,081 1,000 1,000 1,000 Motor Vehicle Fuels 1,488 1,900 1,800 1,926
Total Supplies/Non-Capital Equipment 48,448 47,900 47,800 47,926
MiscellaneousDues/Fees 812 500 500 750
Total Other Expenditures 812 500 500 750
Total Expenditures 507,654$ 546,182$ 540,198$ 567,465$
Expenditure DetailLab Operations Division - Water & Wastewater Fund
160

2016Audited
Amounts
2017AdoptedBudget
2017Year-EndForecast
2018AdoptedBudget
PersonnelRegular Wages 296,723 313,036 259,462 325,984 Overtime 5,912 8,000 5,886 8,000 Allowances 1,468 1,632 1,400 1,632 Medicare 1,898 4,274 1,375 4,418 Workers Compensation 7,660 7,382 6,748 7,632 Retirement Contributions 26,148 28,142 23,035 28,986 Medical Benefits 27,904 34,676 24,768 41,450 Life/Disability Benefits 1,530 2,650 1,554 2,742
Total Personnel 369,243 399,792 324,228 420,844
Purchased ServicesProfessional Services 218 500 1,945 1,500 Technical Services - 2,000 2,000 2,000 Property Services - 55,000 55,000 105,000 Communication Services 2,302 2,500 2,617 2,500 Training/Registration 1,415 500 500 500 Rentals/Leases 123 3,000 3,000 3,000
Total Purchased Services 4,058 63,500 65,062 114,500
Supplies/Non-Capital EquipmentOperating Supplies 93,534 90,000 90,000 90,000 Uniforms/Clothing 1,896 1,500 1,500 1,500 Motor Vehicle Fuels 3,628 8,500 4,200 4,494
Total Supplies/Non-Capital Equipment 99,070 100,000 95,700 95,994
Capital OutlayCapital Equipment - 68,000 68,000 -
Total Capital Outlay - 68,000 68,000 -
Total Expenditures 472,371$ 631,292$ 552,990$ 631,338$
Expenditure DetailElectrical & Mechanical Division - Water & Wastewater Fund
161
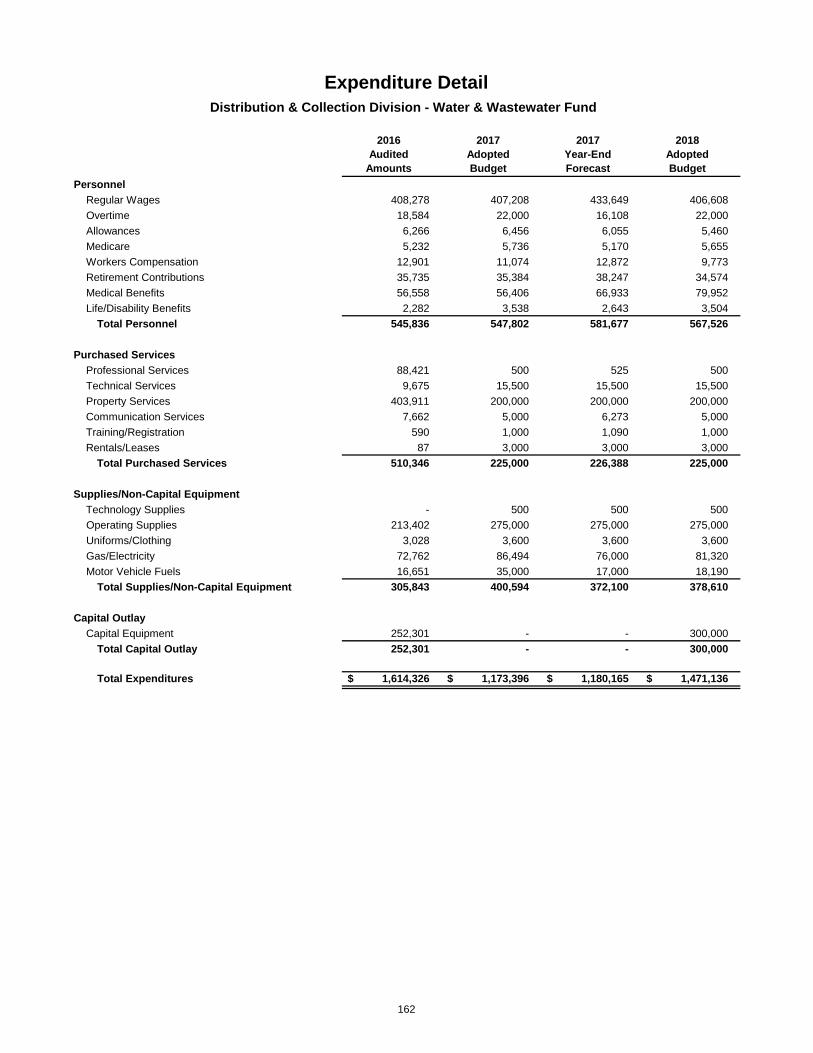
2016Audited
Amounts
2017AdoptedBudget
2017Year-EndForecast
2018AdoptedBudget
PersonnelRegular Wages 408,278 407,208 433,649 406,608 Overtime 18,584 22,000 16,108 22,000 Allowances 6,266 6,456 6,055 5,460 Medicare 5,232 5,736 5,170 5,655 Workers Compensation 12,901 11,074 12,872 9,773 Retirement Contributions 35,735 35,384 38,247 34,574 Medical Benefits 56,558 56,406 66,933 79,952 Life/Disability Benefits 2,282 3,538 2,643 3,504
Total Personnel 545,836 547,802 581,677 567,526
Purchased ServicesProfessional Services 88,421 500 525 500 Technical Services 9,675 15,500 15,500 15,500 Property Services 403,911 200,000 200,000 200,000 Communication Services 7,662 5,000 6,273 5,000 Training/Registration 590 1,000 1,090 1,000 Rentals/Leases 87 3,000 3,000 3,000
Total Purchased Services 510,346 225,000 226,388 225,000
Supplies/Non-Capital EquipmentTechnology Supplies - 500 500 500 Operating Supplies 213,402 275,000 275,000 275,000 Uniforms/Clothing 3,028 3,600 3,600 3,600 Gas/Electricity 72,762 86,494 76,000 81,320 Motor Vehicle Fuels 16,651 35,000 17,000 18,190
Total Supplies/Non-Capital Equipment 305,843 400,594 372,100 378,610
Capital OutlayCapital Equipment 252,301 - - 300,000
Total Capital Outlay 252,301 - - 300,000
Total Expenditures 1,614,326$ 1,173,396$ 1,180,165$ 1,471,136$
Expenditure DetailDistribution & Collection Division - Water & Wastewater Fund
162
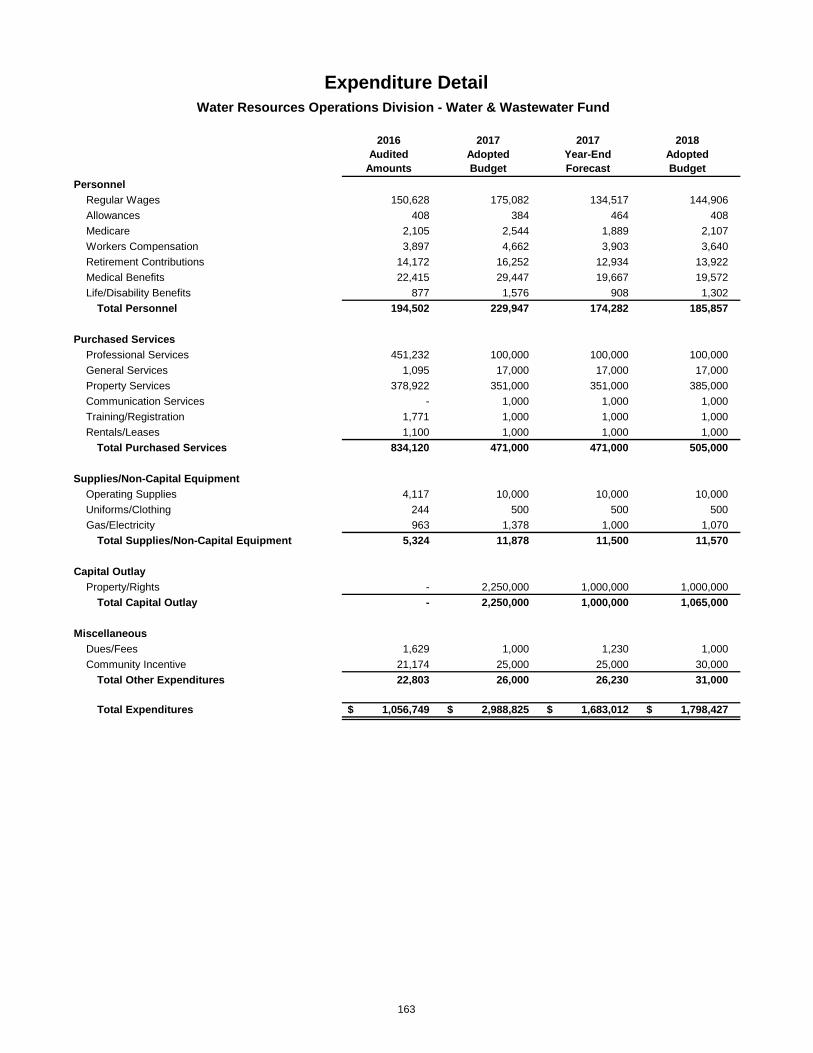
2016Audited
Amounts
2017AdoptedBudget
2017Year-EndForecast
2018AdoptedBudget
PersonnelRegular Wages 150,628 175,082 134,517 144,906 Allowances 408 384 464 408 Medicare 2,105 2,544 1,889 2,107 Workers Compensation 3,897 4,662 3,903 3,640 Retirement Contributions 14,172 16,252 12,934 13,922 Medical Benefits 22,415 29,447 19,667 19,572 Life/Disability Benefits 877 1,576 908 1,302
Total Personnel 194,502 229,947 174,282 185,857
Purchased ServicesProfessional Services 451,232 100,000 100,000 100,000 General Services 1,095 17,000 17,000 17,000 Property Services 378,922 351,000 351,000 385,000 Communication Services - 1,000 1,000 1,000 Training/Registration 1,771 1,000 1,000 1,000 Rentals/Leases 1,100 1,000 1,000 1,000
Total Purchased Services 834,120 471,000 471,000 505,000
Supplies/Non-Capital EquipmentOperating Supplies 4,117 10,000 10,000 10,000 Uniforms/Clothing 244 500 500 500 Gas/Electricity 963 1,378 1,000 1,070
Total Supplies/Non-Capital Equipment 5,324 11,878 11,500 11,570
Capital OutlayProperty/Rights - 2,250,000 1,000,000 1,000,000
Total Capital Outlay - 2,250,000 1,000,000 1,065,000
MiscellaneousDues/Fees 1,629 1,000 1,230 1,000 Community Incentive 21,174 25,000 25,000 30,000
Total Other Expenditures 22,803 26,000 26,230 31,000
Total Expenditures 1,056,749$ 2,988,825$ 1,683,012$ 1,798,427$
Expenditure DetailWater Resources Operations Division - Water & Wastewater Fund
163
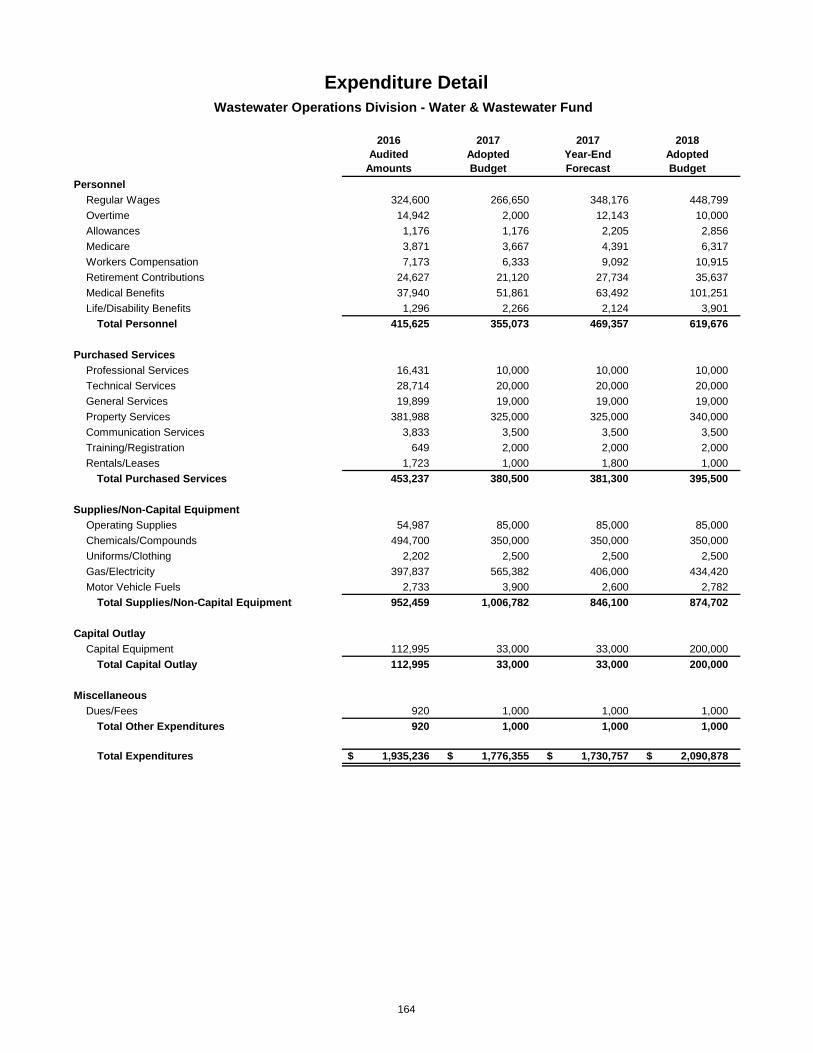
2016Audited
Amounts
2017AdoptedBudget
2017Year-EndForecast
2018AdoptedBudget
PersonnelRegular Wages 324,600 266,650 348,176 448,799 Overtime 14,942 2,000 12,143 10,000 Allowances 1,176 1,176 2,205 2,856 Medicare 3,871 3,667 4,391 6,317 Workers Compensation 7,173 6,333 9,092 10,915 Retirement Contributions 24,627 21,120 27,734 35,637 Medical Benefits 37,940 51,861 63,492 101,251 Life/Disability Benefits 1,296 2,266 2,124 3,901
Total Personnel 415,625 355,073 469,357 619,676
Purchased ServicesProfessional Services 16,431 10,000 10,000 10,000 Technical Services 28,714 20,000 20,000 20,000 General Services 19,899 19,000 19,000 19,000 Property Services 381,988 325,000 325,000 340,000 Communication Services 3,833 3,500 3,500 3,500 Training/Registration 649 2,000 2,000 2,000 Rentals/Leases 1,723 1,000 1,800 1,000
Total Purchased Services 453,237 380,500 381,300 395,500
Supplies/Non-Capital EquipmentOperating Supplies 54,987 85,000 85,000 85,000 Chemicals/Compounds 494,700 350,000 350,000 350,000 Uniforms/Clothing 2,202 2,500 2,500 2,500 Gas/Electricity 397,837 565,382 406,000 434,420 Motor Vehicle Fuels 2,733 3,900 2,600 2,782
Total Supplies/Non-Capital Equipment 952,459 1,006,782 846,100 874,702
Capital OutlayCapital Equipment 112,995 33,000 33,000 200,000
Total Capital Outlay 112,995 33,000 33,000 200,000
MiscellaneousDues/Fees 920 1,000 1,000 1,000
Total Other Expenditures 920 1,000 1,000 1,000
Total Expenditures 1,935,236$ 1,776,355$ 1,730,757$ 2,090,878$
Expenditure DetailWastewater Operations Division - Water & Wastewater Fund
164
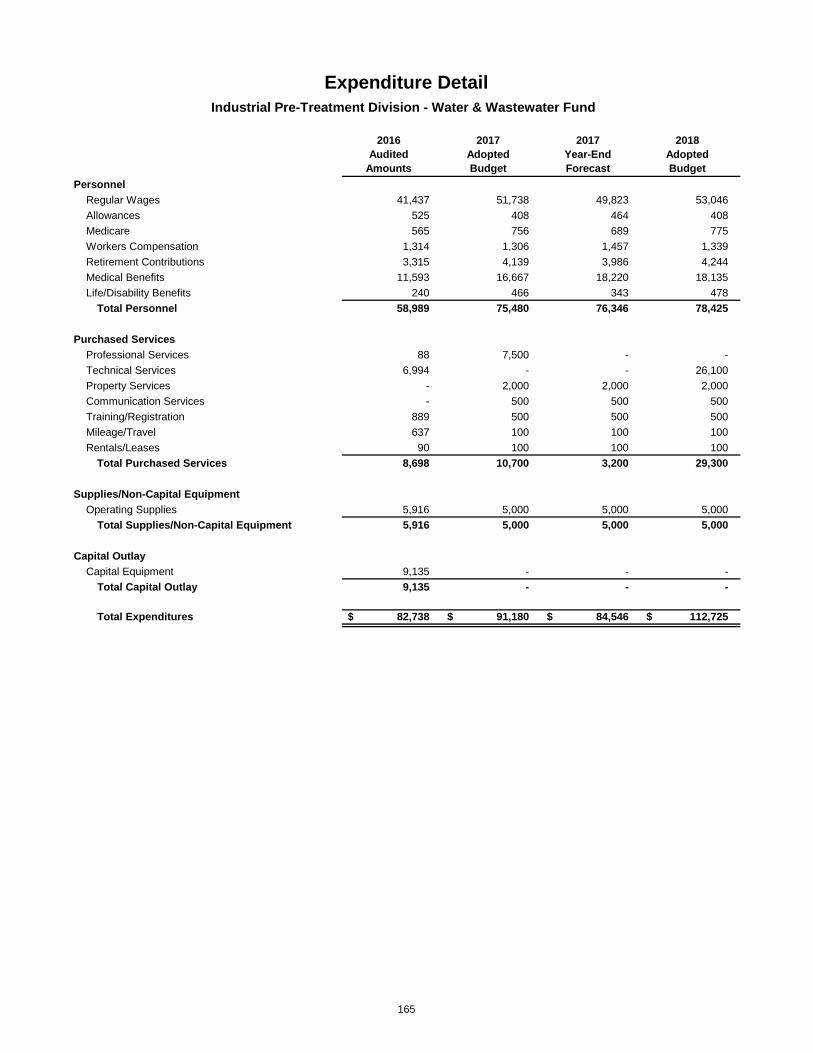
2016Audited
Amounts
2017AdoptedBudget
2017Year-EndForecast
2018AdoptedBudget
PersonnelRegular Wages 41,437 51,738 49,823 53,046 Allowances 525 408 464 408 Medicare 565 756 689 775 Workers Compensation 1,314 1,306 1,457 1,339 Retirement Contributions 3,315 4,139 3,986 4,244 Medical Benefits 11,593 16,667 18,220 18,135 Life/Disability Benefits 240 466 343 478
Total Personnel 58,989 75,480 76,346 78,425
Purchased ServicesProfessional Services 88 7,500 - - Technical Services 6,994 - - 26,100 Property Services - 2,000 2,000 2,000 Communication Services - 500 500 500 Training/Registration 889 500 500 500 Mileage/Travel 637 100 100 100 Rentals/Leases 90 100 100 100
Total Purchased Services 8,698 10,700 3,200 29,300
Supplies/Non-Capital EquipmentOperating Supplies 5,916 5,000 5,000 5,000
Total Supplies/Non-Capital Equipment 5,916 5,000 5,000 5,000
Capital OutlayCapital Equipment 9,135 - - -
Total Capital Outlay 9,135 - - -
Total Expenditures 82,738$ 91,180$ 84,546$ 112,725$
Expenditure DetailIndustrial Pre-Treatment Division - Water & Wastewater Fund
165
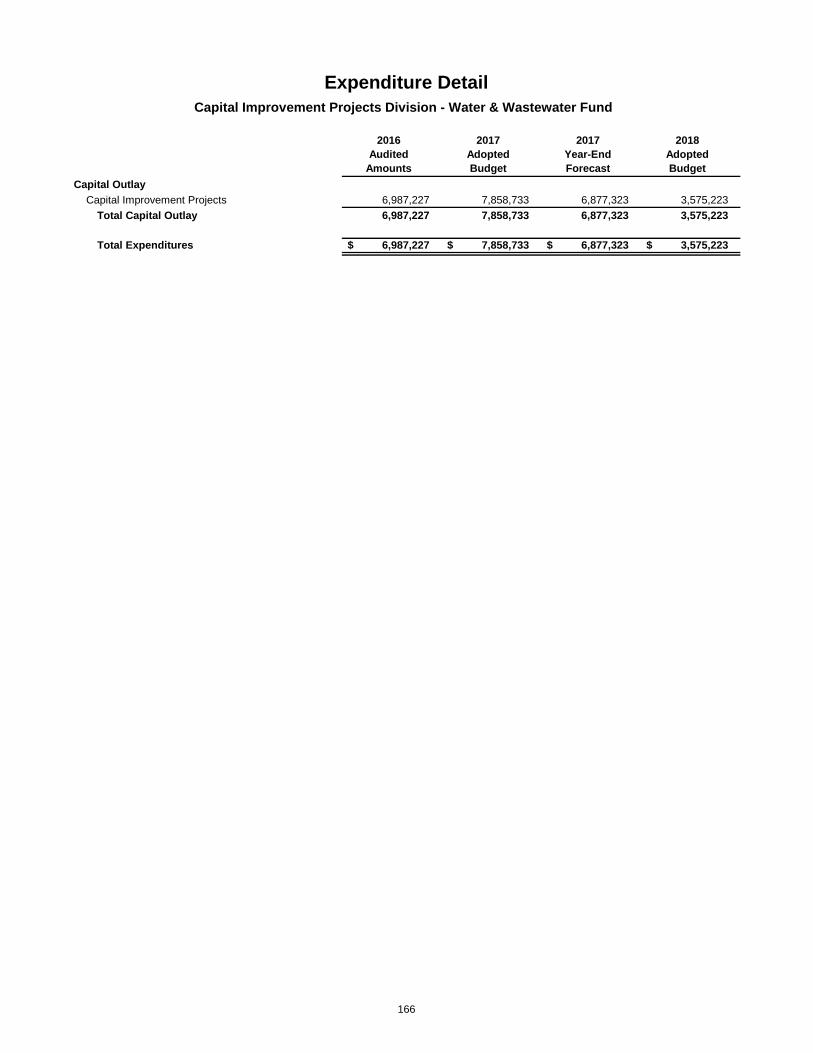
2016Audited
Amounts
2017AdoptedBudget
2017Year-EndForecast
2018AdoptedBudget
Capital OutlayCapital Improvement Projects 6,987,227 7,858,733 6,877,323 3,575,223
Total Capital Outlay 6,987,227 7,858,733 6,877,323 3,575,223
Total Expenditures 6,987,227$ 7,858,733$ 6,877,323$ 3,575,223$
Capital Improvement Projects Division - Water & Wastewater Fund
Expenditure Detail
166
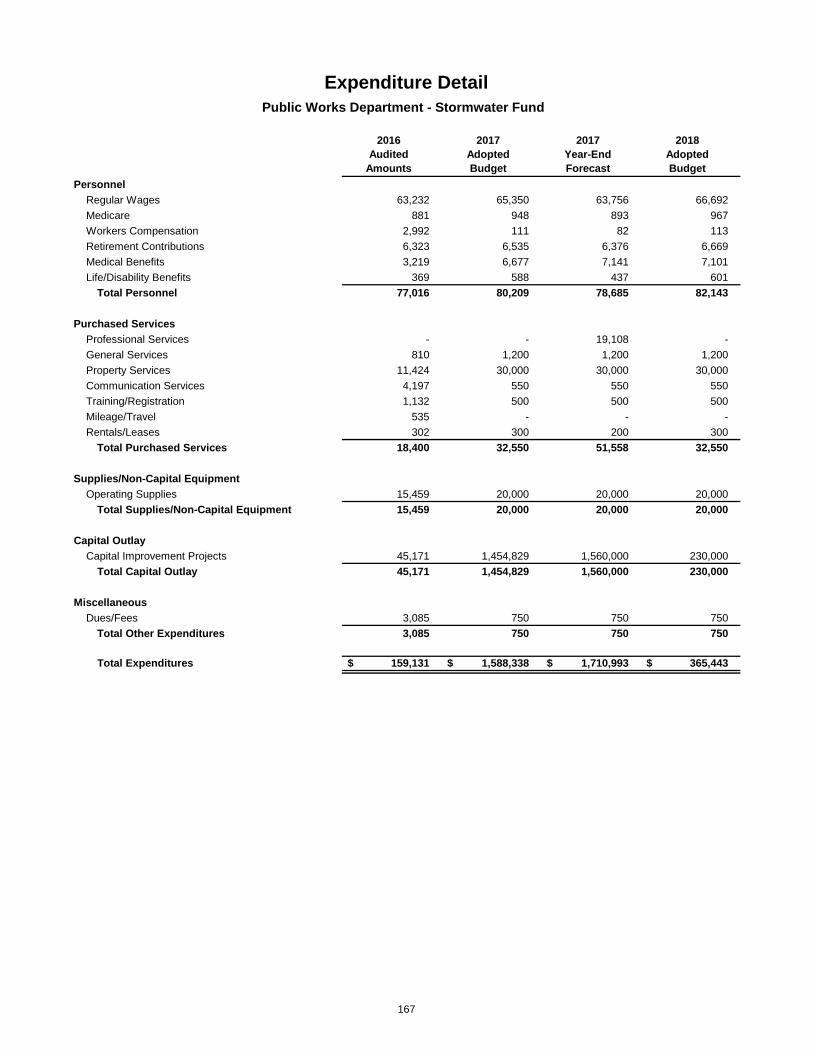
2016Audited
Amounts
2017AdoptedBudget
2017Year-EndForecast
2018AdoptedBudget
PersonnelRegular Wages 63,232 65,350 63,756 66,692 Medicare 881 948 893 967 Workers Compensation 2,992 111 82 113 Retirement Contributions 6,323 6,535 6,376 6,669 Medical Benefits 3,219 6,677 7,141 7,101 Life/Disability Benefits 369 588 437 601
Total Personnel 77,016 80,209 78,685 82,143
Purchased ServicesProfessional Services - - 19,108 - General Services 810 1,200 1,200 1,200 Property Services 11,424 30,000 30,000 30,000 Communication Services 4,197 550 550 550 Training/Registration 1,132 500 500 500 Mileage/Travel 535 - - - Rentals/Leases 302 300 200 300
Total Purchased Services 18,400 32,550 51,558 32,550
Supplies/Non-Capital EquipmentOperating Supplies 15,459 20,000 20,000 20,000
Total Supplies/Non-Capital Equipment 15,459 20,000 20,000 20,000
Capital OutlayCapital Improvement Projects 45,171 1,454,829 1,560,000 230,000
Total Capital Outlay 45,171 1,454,829 1,560,000 230,000
MiscellaneousDues/Fees 3,085 750 750 750
Total Other Expenditures 3,085 750 750 750
Total Expenditures 159,131$ 1,588,338$ 1,710,993$ 365,443$
Expenditure DetailPublic Works Department - Stormwater Fund
167

2016Audited
Amounts
2017AdoptedBudget
2017Year-EndForecast
2018AdoptedBudget
Purchased ServicesCommunication Services 3,608 - - -
Total Purchased Services 3,608 - - -
Supplies/Non-Capital EquipmentOperating Supplies 12,037 15,000 15,000 15,000
Total Supplies/Non-Capital Equipment 12,037 15,000 15,000 15,000
MiscellaneousDues/Fees 2,000 - - -
Total Other Expenditures 2,000 - - -
Total Expenditures 17,645$ 15,000$ 15,000$ 15,000$
Expenditure DetailStreets Division - Stormwater Fund
168

2016Audited
Amounts
2017AdoptedBudget
2017Year-EndForecast
2018AdoptedBudget
PersonnelRegular Wages 63,232 65,350 63,756 66,692 Medicare 881 948 893 967 Workers Compensation 2,992 111 82 113 Retirement Contributions 6,323 6,535 6,376 6,669 Medical Benefits 3,219 6,677 7,141 7,101 Life/Disability Benefits 369 588 437 601
Total Personnel 77,016 80,209 78,685 82,143
Purchased ServicesProfessional Services - - 19,108 - General Services 810 1,200 1,200 1,200 Property Services 11,424 30,000 30,000 30,000 Communication Services 589 550 550 550 Training/Registration 1,132 500 500 500 Mileage/Travel 535 - - - Rentals/Leases 302 300 200 300
Total Purchased Services 14,792 32,550 51,558 32,550
Supplies/Non-Capital EquipmentOperating Supplies 3,422 5,000 5,000 5,000
Total Supplies/Non-Capital Equipment 3,422 5,000 5,000 5,000
MiscellaneousDues/Fees 1,085 750 750 750
Total Other Expenditures 1,085 750 750 750
Total Expenditures 96,315$ 118,509$ 135,993$ 120,443$
Stormwater Operations Division - Stormwater Fund
Expenditure Detail
169

2016Audited
Amounts
2017AdoptedBudget
2017Year-EndForecast
2018AdoptedBudget
Capital OutlayCapital Improvement Projects 45,171 1,454,829 1,560,000 230,000
Total Capital Outlay 45,171 1,454,829 1,560,000 230,000
Total Expenditures 45,171$ 1,454,829$ 1,560,000$ 230,000$
Expenditure DetailCapital Improvement Projects Division - Stormwater Fund
170

2016Audited
Amounts
2017AdoptedBudget
2017Year-EndForecast
2018AdoptedBudget
PersonnelRegular Wages 499,385 500,453 494,091 546,809 Overtime 35,768 18,000 11,963 32,000 Allowances 3,238 3,264 3,723 3,672 Medicare 7,265 7,305 6,827 7,980 Workers Compensation 23,932 25,607 27,431 28,227 Retirement Contributions 48,923 49,043 48,358 53,367 Medical Benefits 95,534 103,930 114,023 130,982 Life/Disability Benefits 2,898 4,518 3,352 4,929
Total Personnel 716,943 712,120 709,768 807,966
Purchased ServicesProfessional Services 947 700 625 700 Property Services 178,845 235,000 235,000 235,000 Repair/Maintenance Services 131,478 132,000 - - Communication Services 12,503 9,000 9,000 9,000 Training/Registration 35 500 500 500 Rentals/Leases 11,000 9,000 9,000 14,000
Total Purchased Services 334,808 386,200 254,125 259,200
Supplies/Non-Capital EquipmentOffice Supplies 857 1,000 1,000 1,000 Operating Supplies 1,800 6,000 6,000 6,000 Inventory Supplies 33,547 75,000 75,000 75,000 Uniforms/Clothing 2,516 3,000 3,000 3,000 Gas/Electricity 5,967 10,901 6,000 6,420 Motor Vehicle Fuels 63,590 115,000 71,000 75,970
Total Supplies/Non-Capital Equipment 108,277 210,901 162,000 167,390
Capital OutlayCapital Equipment 600,627 523,000 523,000 325,000
Total Capital Outlay 600,627 523,000 523,000 325,000
MiscellaneousDues/Fees 521 500 500 500
Total Other Expenditures 521 500 500 500
Total Expenditures 1,761,176$ 1,832,721$ 1,649,393$ 1,560,056$
Public Works Department - Sanitation Fund
Expenditure Detail
171
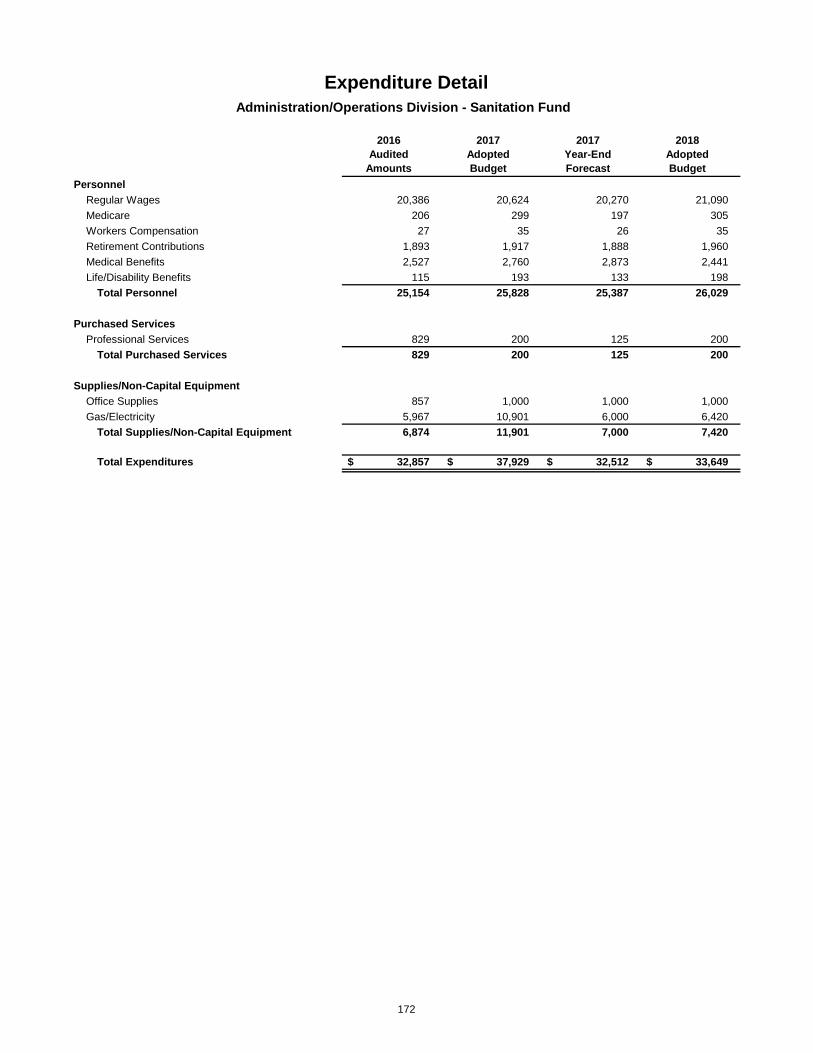
2016Audited
Amounts
2017AdoptedBudget
2017Year-EndForecast
2018AdoptedBudget
PersonnelRegular Wages 20,386 20,624 20,270 21,090 Medicare 206 299 197 305 Workers Compensation 27 35 26 35 Retirement Contributions 1,893 1,917 1,888 1,960 Medical Benefits 2,527 2,760 2,873 2,441 Life/Disability Benefits 115 193 133 198
Total Personnel 25,154 25,828 25,387 26,029
Purchased ServicesProfessional Services 829 200 125 200
Total Purchased Services 829 200 125 200
Supplies/Non-Capital EquipmentOffice Supplies 857 1,000 1,000 1,000 Gas/Electricity 5,967 10,901 6,000 6,420
Total Supplies/Non-Capital Equipment 6,874 11,901 7,000 7,420
Total Expenditures 32,857$ 37,929$ 32,512$ 33,649$
Expenditure DetailAdministration/Operations Division - Sanitation Fund
172

2016Audited
Amounts
2017AdoptedBudget
2017Year-EndForecast
2018AdoptedBudget
Purchased ServicesRepair/Maintenance Services 131,478 132,000 - -
Total Purchased Services 131,478 132,000 - -
Total Expenditures 131,478$ 132,000$ -$ -$
Expenditure DetailFleet Division - Sanitation Fund
173
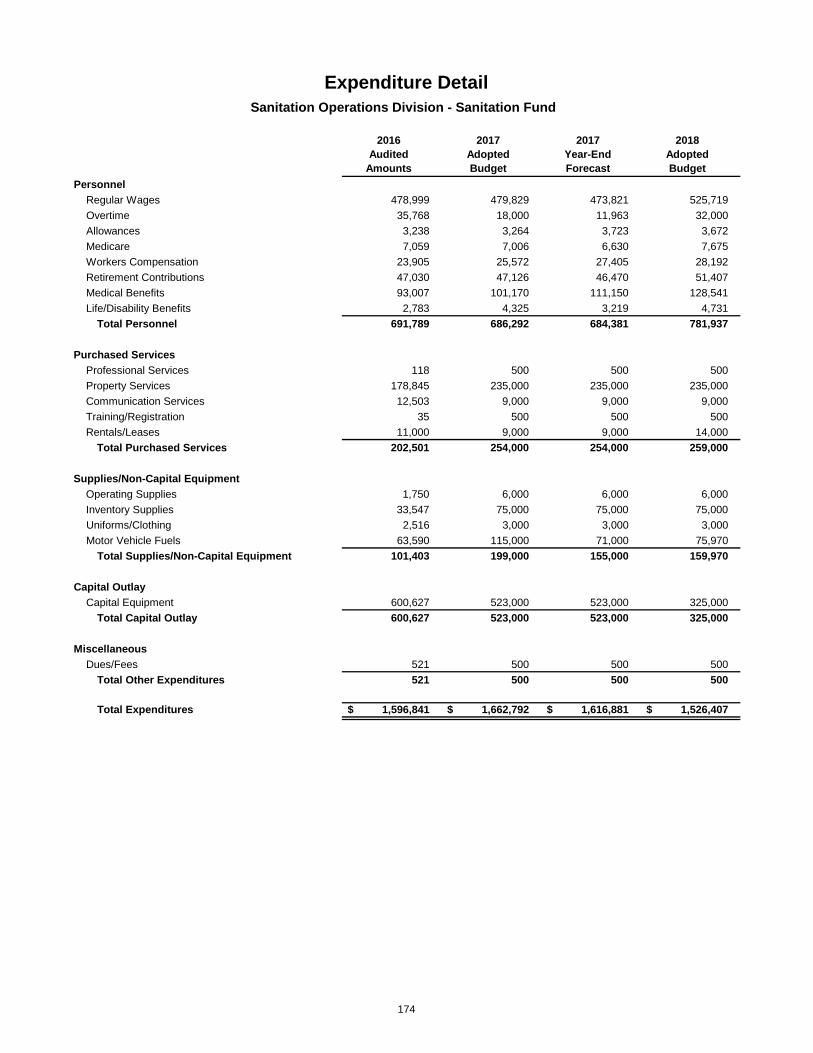
2016Audited
Amounts
2017AdoptedBudget
2017Year-EndForecast
2018AdoptedBudget
PersonnelRegular Wages 478,999 479,829 473,821 525,719 Overtime 35,768 18,000 11,963 32,000 Allowances 3,238 3,264 3,723 3,672 Medicare 7,059 7,006 6,630 7,675 Workers Compensation 23,905 25,572 27,405 28,192 Retirement Contributions 47,030 47,126 46,470 51,407 Medical Benefits 93,007 101,170 111,150 128,541 Life/Disability Benefits 2,783 4,325 3,219 4,731
Total Personnel 691,789 686,292 684,381 781,937
Purchased ServicesProfessional Services 118 500 500 500 Property Services 178,845 235,000 235,000 235,000 Communication Services 12,503 9,000 9,000 9,000 Training/Registration 35 500 500 500 Rentals/Leases 11,000 9,000 9,000 14,000
Total Purchased Services 202,501 254,000 254,000 259,000
Supplies/Non-Capital EquipmentOperating Supplies 1,750 6,000 6,000 6,000 Inventory Supplies 33,547 75,000 75,000 75,000 Uniforms/Clothing 2,516 3,000 3,000 3,000 Motor Vehicle Fuels 63,590 115,000 71,000 75,970
Total Supplies/Non-Capital Equipment 101,403 199,000 155,000 159,970
Capital OutlayCapital Equipment 600,627 523,000 523,000 325,000
Total Capital Outlay 600,627 523,000 523,000 325,000
MiscellaneousDues/Fees 521 500 500 500
Total Other Expenditures 521 500 500 500
Total Expenditures 1,596,841$ 1,662,792$ 1,616,881$ 1,526,407$
Expenditure DetailSanitation Operations Division - Sanitation Fund
174
Program Overview Capital Improvement Program The City of Northglenn’s Capital Improvement Program (CIP) identifies and provides a summary of all planned capital projects and corresponding funding sources for the ensuing five-year period. The 2018 budget includes $23,539,308 in capital improvement projects. In order to be included in the CIP, a project must meet the following requirements:
• Total costs of the project are expected to meet or exceed $5,000. • The resulting project will have a useful life of more than one year. • The project will result in the creation of a new asset or the extension of an
existing asset’s useful life, value, and/or operational capacity During the preparation process, staff focused on setting priorities and identifying which projects or phases of projects could reasonably be accomplished within each year. Contractual obligations as well as funding limitations and needs were also considered in setting the priorities. Capital improvement projects are funded through a variety of sources including the use of reserves, restricted and designated revenues, debt financing, grant awards, and available operating revenues. All available current and estimated future resources were considered when identifying planned capital improvements. The forecasted costs of each capital project meet, but do not exceed, the limitations of the identified funding sources. The following pages provide a summary listing of the planned capital projects by fund. Each fund summary is then followed by individual project worksheets which provide project dates, total estimated costs, a brief description of the project, as well as any ongoing operating costs or savings associated with the project. Corresponding funding sources by project year are also presented. The City uses a system for rating the impact of capital projects on the operating budget once the projects is completed. Costs related to a capital project that might have an impact on current and/or future operating budget include additional staff, maintenance, or contractor operations. The amount of the operational impact is categorized in the following terms:
Positive – The project will either generate some revenue to offset expenses or actually reduce continued operating costs.
Negligible – The impact on operating expenditures is considered immaterial. It will generate less than $5,000 annually in increased operating expenditures. Ongoing operations and maintenance can be managed with existing staff and equipment.
Slight – The impact on operating expenditures will fall between $5,001 and $20,000 annually. Additional overtime, seasonal staff, purchased services, and/or equipment upgrades may be required to operate and maintain the capital once completed.
Moderate – The impact on operating expenditures will fall between $20,001 and $50,000 annually. An additional staff member and/or a piece of equipment may be required to operate and maintain the resulting capital asset.
High – The impact on operating expenditures will exceed $50,000 annually. Multiple additional staff, large equipment, and/or contracted services may be required to operate and maintain the resulting capital asset.
175

176
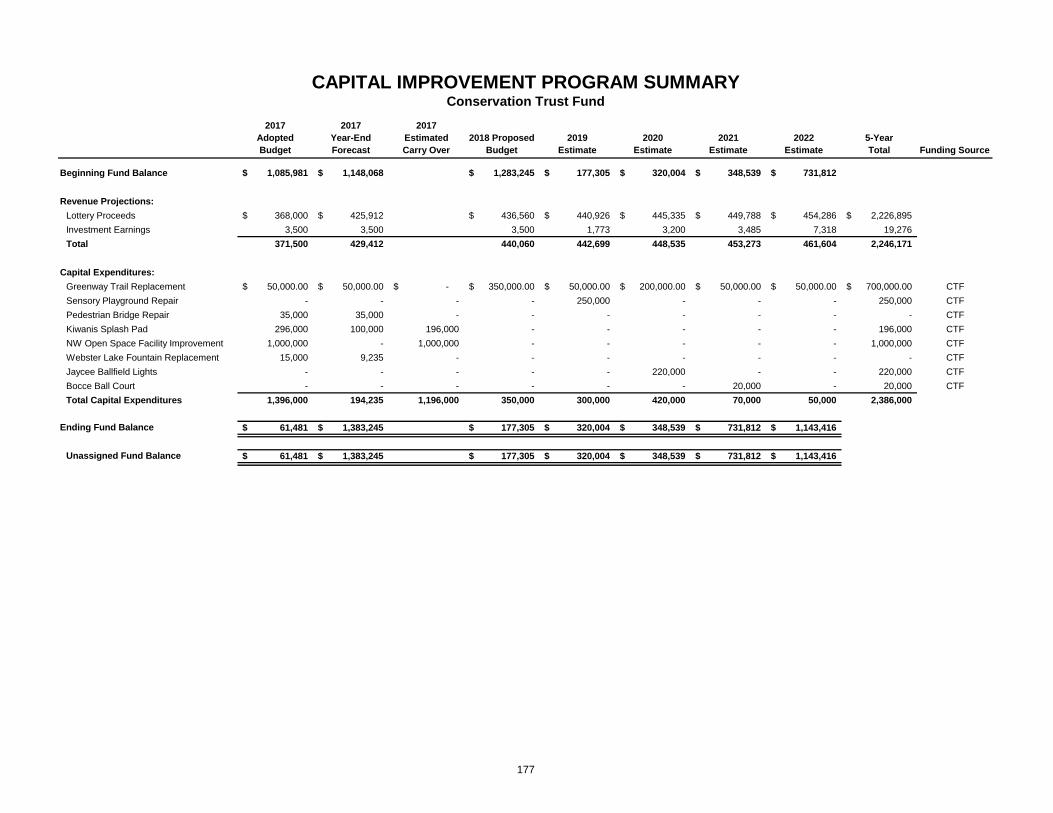
2017AdoptedBudget
2017Year-End Forecast
2017EstimatedCarry Over
2018 Proposed Budget
2019Estimate
2020Estimate
2021Estimate
2022Estimate
5-YearTotal Funding Source
Beginning Fund Balance 1,085,981$ 1,148,068$ 1,283,245$ 177,305$ 320,004$ 348,539$ 731,812$
Revenue Projections:Lottery Proceeds 368,000$ 425,912$ 436,560$ 440,926$ 445,335$ 449,788$ 454,286$ 2,226,895$ Investment Earnings 3,500 3,500 3,500 1,773 3,200 3,485 7,318 19,276 Total 371,500 429,412 440,060 442,699 448,535 453,273 461,604 2,246,171
Capital Expenditures:Greenway Trail Replacement 50,000.00$ 50,000.00$ -$ 350,000.00$ 50,000.00$ 200,000.00$ 50,000.00$ 50,000.00$ 700,000.00$ CTFSensory Playground Repair - - - - 250,000 - - - 250,000 CTFPedestrian Bridge Repair 35,000 35,000 - - - - - - - CTFKiwanis Splash Pad 296,000 100,000 196,000 - - - - - 196,000 CTFNW Open Space Facility Improvement 1,000,000 - 1,000,000 - - - - - 1,000,000 CTFWebster Lake Fountain Replacement 15,000 9,235 - - - - - - - CTFJaycee Ballfield Lights - - - - - 220,000 - - 220,000 CTFBocce Ball Court - - - - - - 20,000 - 20,000 CTFTotal Capital Expenditures 1,396,000 194,235 1,196,000 350,000 300,000 420,000 70,000 50,000 2,386,000
Ending Fund Balance 61,481$ 1,383,245$ 177,305$ 320,004$ 348,539$ 731,812$ 1,143,416$
Unassigned Fund Balance 61,481$ 1,383,245$ 177,305$ 320,004$ 348,539$ 731,812$ 1,143,416$
CAPITAL IMPROVEMENT PROGRAM SUMMARYConservation Trust Fund
177

Begin: Finish:
Future Operational Impact: Yes Operational Impact Category: N/ANo
2018 2019 2020 2021 2022 5 - Year TotalConservation Trust Fund 350,000 50,000 200,000 50,000 50,000 700,000$
- - - -
Total Revenue 350,000$ 50,000$ 200,000$ 50,000$ 50,000$ 700,000$
2018 2019 2020 2021 2022 5 - Year TotalPlans/Studies -$ Design - Construction 350,000 50,000 200,000 50,000 50,000 700,000 Materials - Equipment - Other - - Other - -
Total Expenditures 350,000$ 50,000$ 200,000$ 50,000$ 50,000$ 700,000$
XDescription/Justification:
5-YEAR CAPITAL IMPROVEMENT PROGRAM
Project Name: Greenway Trail Concrete Replacement Program
Project Dates: Ongoing Ongoing
Comprehensive Project Cost: $700,000.00 (5 Year Total)
Project Rationale: Maintenance Program
This is an annual program to maintain the Greenway Trails.
Degraded trail sections are documented by the Parks Department throughout the year. The Greenway Trails Concrete Replacement program replaces thesedegraded sections to maintain a safe, accessible, and aesthetically pleasing trail system.
Source of Funding:
Expenditures:
178
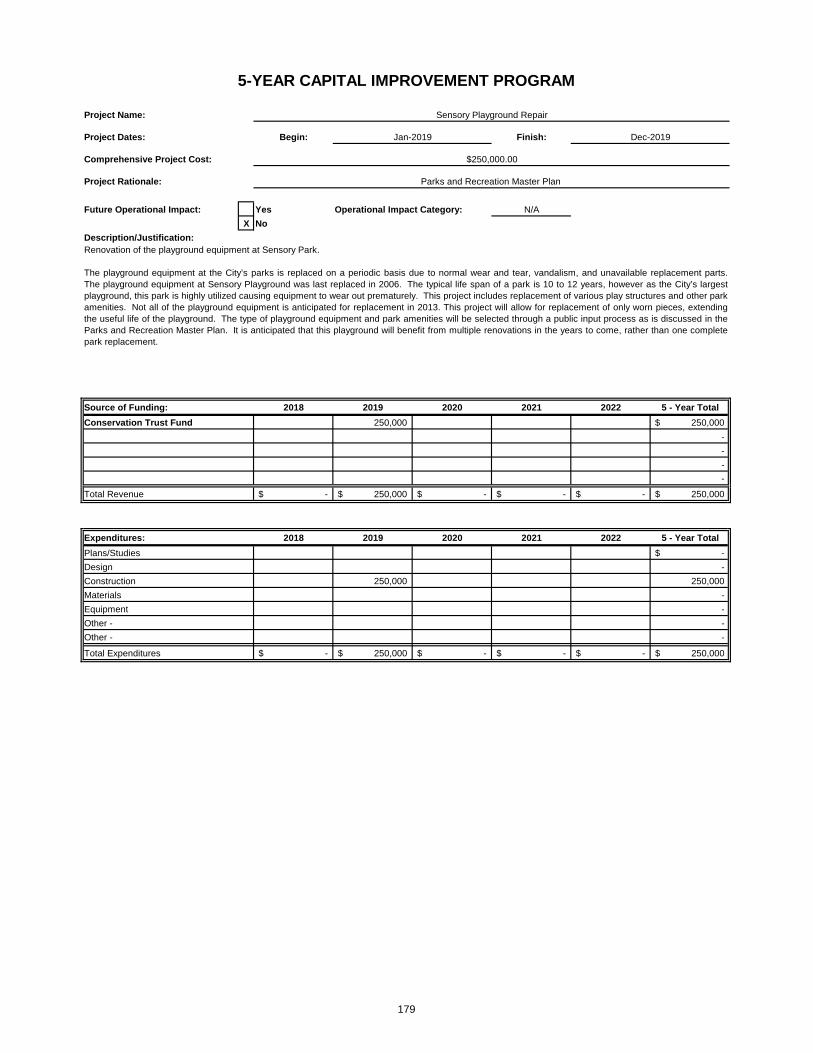
Begin: Finish:
Future Operational Impact: Yes Operational Impact Category: N/ANo
2018 2019 2020 2021 2022 5 - Year TotalConservation Trust Fund 250,000 250,000$
- - - -
Total Revenue -$ 250,000$ -$ -$ -$ 250,000$
2018 2019 2020 2021 2022 5 - Year TotalPlans/Studies -$ Design - Construction 250,000 250,000 Materials - Equipment - Other - - Other - -
Total Expenditures -$ 250,000$ -$ -$ -$ 250,000$
5-YEAR CAPITAL IMPROVEMENT PROGRAM
Project Name: Sensory Playground Repair
Project Dates: Jan-2019 Dec-2019
Expenditures:
Comprehensive Project Cost: $250,000.00
Project Rationale: Parks and Recreation Master Plan
XDescription/Justification:Renovation of the playground equipment at Sensory Park.
The playground equipment at the City’s parks is replaced on a periodic basis due to normal wear and tear, vandalism, and unavailable replacement parts.The playground equipment at Sensory Playground was last replaced in 2006. The typical life span of a park is 10 to 12 years, however as the City’s largestplayground, this park is highly utilized causing equipment to wear out prematurely. This project includes replacement of various play structures and other parkamenities. Not all of the playground equipment is anticipated for replacement in 2013. This project will allow for replacement of only worn pieces, extendingthe useful life of the playground. The type of playground equipment and park amenities will be selected through a public input process as is discussed in theParks and Recreation Master Plan. It is anticipated that this playground will benefit from multiple renovations in the years to come, rather than one completepark replacement.
Source of Funding:
179

Begin: Finish:
Future Operational Impact: Yes Operational Impact Category: NegativeNo
2018 2019 2020 2021 2022 5 - Year TotalConservation Trust Fund 196,000 196,000$
- - - -
Total Revenue 196,000$ -$ -$ -$ -$ 196,000$
2018 2019 2020 2021 2022 5 - Year TotalPlans/Studies -$ Design - Construction 196,000 196,000 Materials - Equipment - Other - - Other - -
Total Expenditures 196,000$ -$ -$ -$ -$ 196,000$
5-YEAR CAPITAL IMPROVEMENT PROGRAM
Project Name: Kiwanis Splash Pad
Project Dates: Jan-2017 Dec-2017
Expenditures:
Comprehensive Project Cost: $600,000.00
Project Rationale: Facility Improvement
X
Description/Justification:Splash pads have become very popular among children in Colorado. They provide a fun outdoor activity that keeps them occupied and engaged. There isplenty of space located outside of the existing fence at the Kiwanis Pool, and it has been identified as a future location for a splash pad.The splash pad wouldprovide an additional interactive feature at the pool, making the area more appealing for drop-in use.
Source of Funding:
180
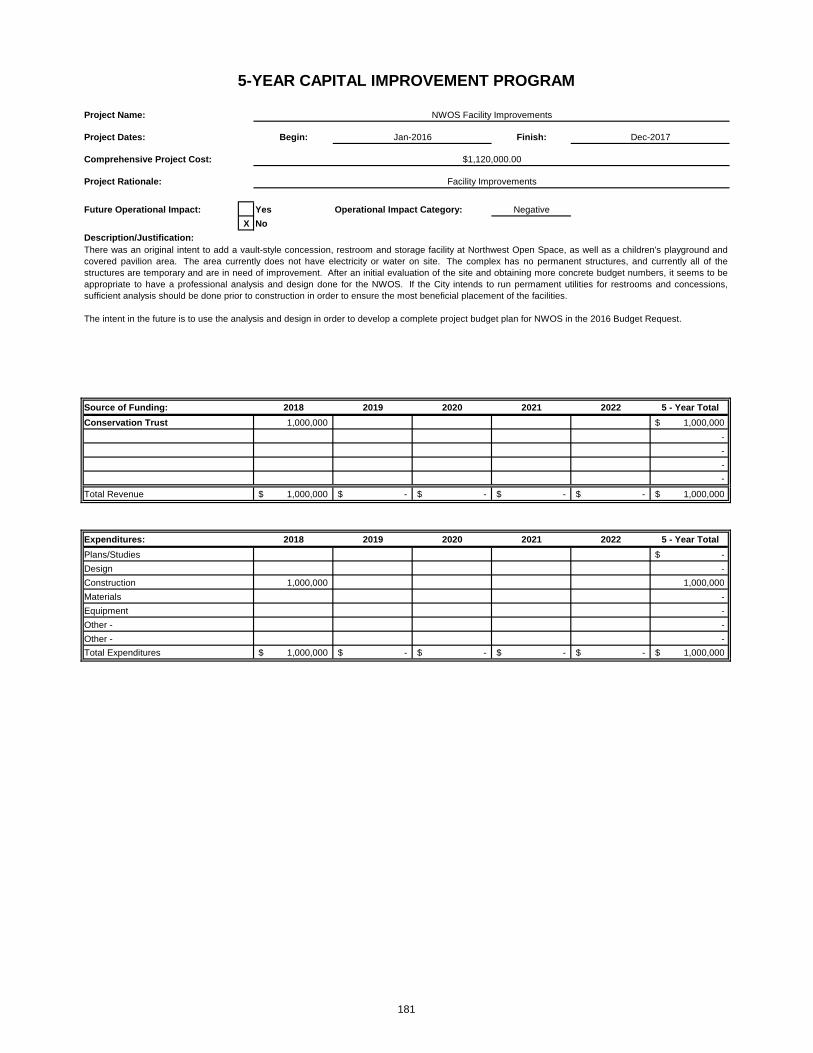
Begin: Finish:
Future Operational Impact: Yes Operational Impact Category: NegativeNo
2018 2019 2020 2021 2022 5 - Year TotalConservation Trust 1,000,000 1,000,000$
- - - -
Total Revenue 1,000,000$ -$ -$ -$ -$ 1,000,000$
2018 2019 2020 2021 2022 5 - Year TotalPlans/Studies -$ Design - Construction 1,000,000 1,000,000 Materials - Equipment - Other - - Other - - Total Expenditures 1,000,000$ -$ -$ -$ -$ 1,000,000$
5-YEAR CAPITAL IMPROVEMENT PROGRAM
Project Name: NWOS Facility Improvements
Project Dates: Jan-2016 Dec-2017
Expenditures:
Comprehensive Project Cost: $1,120,000.00
Project Rationale: Facility Improvements
XDescription/Justification:There was an original intent to add a vault-style concession, restroom and storage facility at Northwest Open Space, as well as a children's playground andcovered pavilion area. The area currently does not have electricity or water on site. The complex has no permanent structures, and currently all of thestructures are temporary and are in need of improvement. After an initial evaluation of the site and obtaining more concrete budget numbers, it seems to beappropriate to have a professional analysis and design done for the NWOS. If the City intends to run permament utilities for restrooms and concessions,sufficient analysis should be done prior to construction in order to ensure the most beneficial placement of the facilities.
The intent in the future is to use the analysis and design in order to develop a complete project budget plan for NWOS in the 2016 Budget Request.
Source of Funding:
181

Begin: Finish:
Future Operational Impact: Yes Operational Impact Category: MaintenanceNo
2018 2019 2020 2021 2022 5 - Year TotalCTF 220,000 220,000$
- - - -
Total Revenue -$ -$ 220,000$ -$ -$ 220,000$
2018 2019 2020 2021 2022 5 - Year TotalPlans/Studies -$ Design - Construction 220,000 220,000 Materials - Equipment - Other - - Other - -
Total Expenditures -$ -$ 220,000$ -$ -$ 220,000$
XDescription/Justification:
5-YEAR CAPITAL IMPROVEMENT PROGRAM
Project Name: Jaycee Ballfield Lights
Project Dates: Jan-2020 Dec-2020
Comprehensive Project Cost: $220,000.00
Project Rationale: Facility Improvement
The lights at the Jaycee Ballfield are old and in need of replacement. The current lights require constant maintenance, as they go out on a regular basis, causingproblems for teams playing games in the evenings.
Source of Funding:
Expenditures:
182
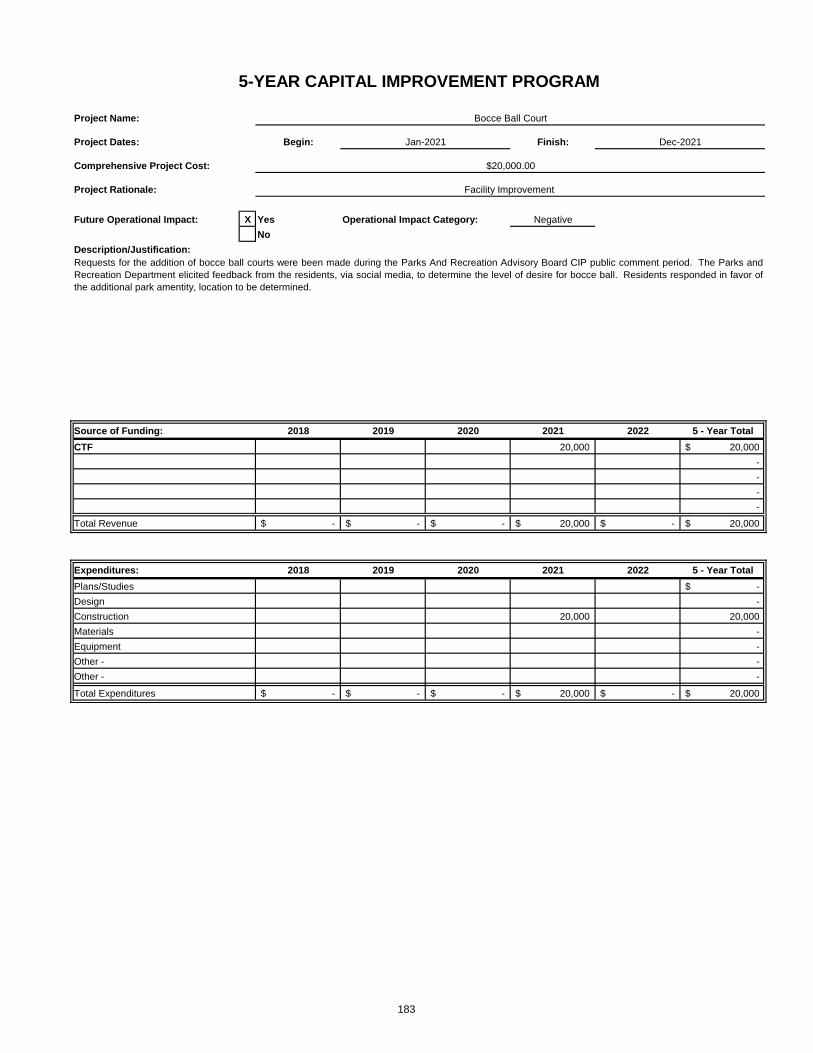
Begin: Finish:
Future Operational Impact: Yes Operational Impact Category: NegativeNo
2018 2019 2020 2021 2022 5 - Year TotalCTF 20,000 20,000$
- - - -
Total Revenue -$ -$ -$ 20,000$ -$ 20,000$
2018 2019 2020 2021 2022 5 - Year TotalPlans/Studies -$ Design - Construction 20,000 20,000 Materials - Equipment - Other - - Other - -
Total Expenditures -$ -$ -$ 20,000$ -$ 20,000$
Description/Justification:
5-YEAR CAPITAL IMPROVEMENT PROGRAM
Project Name: Bocce Ball Court
Project Dates: Jan-2021 Dec-2021
Comprehensive Project Cost: $20,000.00
Project Rationale: Facility Improvement
X
Requests for the addition of bocce ball courts were been made during the Parks And Recreation Advisory Board CIP public comment period. The Parks andRecreation Department elicited feedback from the residents, via social media, to determine the level of desire for bocce ball. Residents responded in favor ofthe additional park amentity, location to be determined.
Source of Funding:
Expenditures:
183
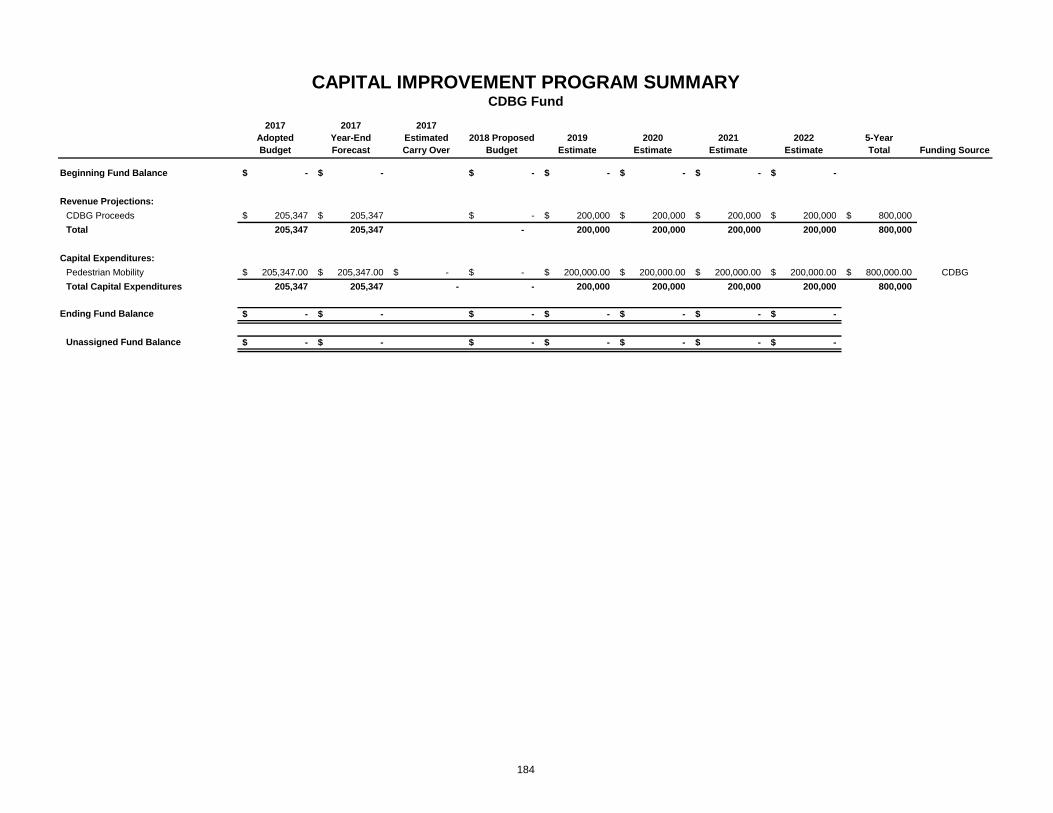
2017AdoptedBudget
2017Year-End Forecast
2017EstimatedCarry Over
2018 Proposed Budget
2019Estimate
2020Estimate
2021Estimate
2022Estimate
5-YearTotal Funding Source
Beginning Fund Balance -$ -$ -$ -$ -$ -$ -$
Revenue Projections:CDBG Proceeds 205,347$ 205,347$ -$ 200,000$ 200,000$ 200,000$ 200,000$ 800,000$ Total 205,347 205,347 - 200,000 200,000 200,000 200,000 800,000
Capital Expenditures:Pedestrian Mobility 205,347.00$ 205,347.00$ -$ -$ 200,000.00$ 200,000.00$ 200,000.00$ 200,000.00$ 800,000.00$ CDBGTotal Capital Expenditures 205,347 205,347 - - 200,000 200,000 200,000 200,000 800,000
Ending Fund Balance -$ -$ -$ -$ -$ -$ -$
Unassigned Fund Balance -$ -$ -$ -$ -$ -$ -$
CAPITAL IMPROVEMENT PROGRAM SUMMARYCDBG Fund
184

Begin: Finish:
Future Operational Impact: Yes Operational Impact Category: N/ANo
2018 2019 2020 2021 2022 5 - Year TotalCDBG Funding 200,000 200,000 200,000 200,000 200,000 1,000,000$
- - - -
Total Revenue 200,000$ 200,000$ 200,000$ 200,000$ 200,000$ 1,000,000$
2018 2019 2020 2021 2022 5 - Year TotalPlans/Studies -$ Design - Construction 200,000 200,000 200,000 200,000 200,000 1,000,000 Materials - Equipment - Other - - Other - -
Total Expenditures 200,000$ 200,000$ 200,000$ 200,000$ 200,000$ 1,000,000$
5-YEAR CAPITAL IMPROVEMENT PROGRAM
Project Name: Pedestrian Mobility Program
Project Dates: Jan-2016 Dec-2016
Expenditures:
Comprehensive Project Cost: $1,000,000.00
Project Rationale: CDBG Concrete Improvements
XDescription/Justification:This maintenance program will replace damaged concrete in CDBG designated areas.
Instead of replacing a few damaged concrete locations annually through the annual streets resurfacing program, this Concrete Program will allow the City tofocus their efforts on a specific area. Centralizing the concrete improvements will save on mobilization costs and will provide a greater visual impact toresidents.
Source of Funding:
185

2017AdoptedBudget
2017Year-End Forecast
2017EstimatedCarry Over
2018 Proposed Budget
2019Estimate
2020Estimate
2021Estimate
2022Estimate
5-YearTotal Funding Source
Beginning Fund Balance 16,127,031$ 17,094,267$ 30,573,042$ 18,574,200$ 14,344,011$ 14,269,274$ 14,639,899$
Revenue:Property Tax (4.000 Mills) 1,050,000$ 1,081,146$ 1,383,483$ 1,397,318$ -$ -$ -$ 2,780,801$ Sales/Use Tax (1/2%) 2,724,296 2,596,710 2,657,673 2,684,250 2,711,093 2,738,204 2,765,586 13,556,806 Marijuana Sales Tax 589,015 549,567 563,306 568,939 574,628 580,374 586,178 2,873,425 Open Space Tax (ADCOO) 380,265 333,600 333,600 336,936 340,305 343,708 347,145 1,701,694 Transportation Tax (ADCOT) 1,070,086 935,100 935,100 944,451 953,896 963,435 973,069 4,769,951 County Grant 60,000 60,000 - - - - - - State Grant 728,000 728,000 - - - - - - Investment Earnings 60,000 80,000 80,000 46,436 35,860 35,673 36,600 234,569 Debt Issuance Proceeds 21,254,736 21,254,736 - 40,000,000 - - - 40,000,000 Transfers From General Fund 1,700,000 1,700,000 1,700,000 1,700,000 1,700,000 1,700,000 1,700,000 8,500,000 Total 29,616,398 29,318,859 7,653,162 47,678,330 6,315,782 6,361,394 6,408,578 74,417,246
Expenditures:4.000 Mill Funded Projects 125,000.00$ 160,000.00$ -$ -$ 600,000.00$ 1,200,000.00$ -$ -$ 1,800,000.00$ 1/2% Sales/Use Tax Funded Projects 2,847,346 2,172,346 675,000 6,338,919 9,963,519 2,465,519 2,465,769 2,464,269 24,372,995 Marijuana Sales Tax - - - - 550,000 550,000 550,000 1,650,000 ADCOO Funded Projects 822,070 424,625 400,000 350,000 295,000 25,000 25,000 25,000 1,120,000 ADCOT Funded Projects 820,393 577,478 242,915 950,000 950,000 950,000 950,000 950,000 4,992,915 Construction Proceeds 21,254,736 11,234,291 10,020,445 - 40,000,000 - - - 50,020,445 General Fund Projects 1,283,157 1,007,434 108,725 566,000 100,000 1,200,000 1,250,000 1,200,000 4,424,725 Grant Funded Projects 919,355 193,910 - - - - - - -
Total Capital Expenditures* 28,142,057 15,840,084 11,447,085 8,204,919 11,908,519 6,390,519 5,990,769 5,189,269 49,131,080
Ending Fund Balance 17,601,372$ 30,573,042$ 18,574,200$ 14,344,011$ 14,269,274$ 14,639,899$ 15,859,208$
Restrictions, Commitments, & Assignments:4.000 Mill Restricted Fund Balance (1,028,995)$ (463,010)$ 920,473$ 1,717,791$ 517,791$ 517,791$ 517,791$ 1/2% Sales/Use Tax Restricted Balance 11,667,667 12,304,004 7,947,758 668,489 914,063 1,186,498 1,487,815 Marijuana Sales Tax 1,648,268 1,570,949 2,134,255 2,703,194 2,727,822 2,758,196 2,794,374 ADCOO Restricted Fund Balance 98,215 448,995 32,595 74,531 389,836 708,544 1,030,689 ADCOT Restricted Fund Balance 1,238,860 1,346,789 1,088,974 1,083,425 1,087,321 1,100,756 1,123,825 Construction Proceeds Restricted Fund Ba - 10,020,445 - - - - - Unassigned Fund Balance 3,977,357$ 5,344,870$ 6,450,145$ 8,096,581$ 8,632,441$ 8,368,114$ 8,904,714$
*See following page for project listing
CAPITAL IMPROVEMENT PROGRAM SUMMARYCapital Projects Fund
186
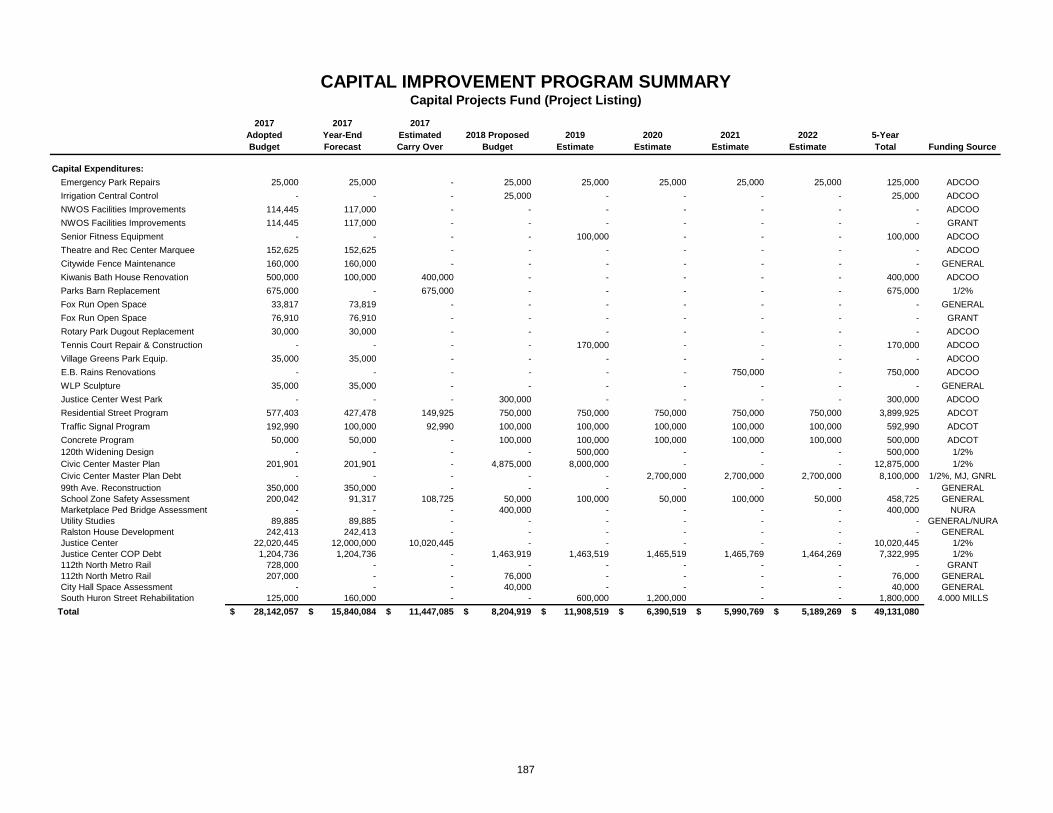
2017AdoptedBudget
2017Year-End Forecast
2017EstimatedCarry Over
2018 Proposed Budget
2019Estimate
2020Estimate
2021Estimate
2022Estimate
5-YearTotal Funding Source
Capital Expenditures:Emergency Park Repairs 25,000 25,000 - 25,000 25,000 25,000 25,000 25,000 125,000 ADCOOIrrigation Central Control - - - 25,000 - - - - 25,000 ADCOONWOS Facilities Improvements 114,445 117,000 - - - - - - - ADCOONWOS Facilities Improvements 114,445 117,000 - - - - - - - GRANTSenior Fitness Equipment - - - - 100,000 - - - 100,000 ADCOOTheatre and Rec Center Marquee 152,625 152,625 - - - - - - - ADCOOCitywide Fence Maintenance 160,000 160,000 - - - - - - - GENERALKiwanis Bath House Renovation 500,000 100,000 400,000 - - - - - 400,000 ADCOOParks Barn Replacement 675,000 - 675,000 - - - - - 675,000 1/2%Fox Run Open Space 33,817 73,819 - - - - - - - GENERALFox Run Open Space 76,910 76,910 - - - - - - - GRANTRotary Park Dugout Replacement 30,000 30,000 - - - - - - - ADCOOTennis Court Repair & Construction - - - - 170,000 - - - 170,000 ADCOOVillage Greens Park Equip. 35,000 35,000 - - - - - - - ADCOOE.B. Rains Renovations - - - - - - 750,000 - 750,000 ADCOOWLP Sculpture 35,000 35,000 - - - - - - - GENERALJustice Center West Park - - - 300,000 - - - - 300,000 ADCOOResidential Street Program 577,403 427,478 149,925 750,000 750,000 750,000 750,000 750,000 3,899,925 ADCOTTraffic Signal Program 192,990 100,000 92,990 100,000 100,000 100,000 100,000 100,000 592,990 ADCOTConcrete Program 50,000 50,000 - 100,000 100,000 100,000 100,000 100,000 500,000 ADCOT120th Widening Design - - - - 500,000 - - - 500,000 1/2%Civic Center Master Plan 201,901 201,901 - 4,875,000 8,000,000 - - - 12,875,000 1/2%Civic Center Master Plan Debt - - - - - 2,700,000 2,700,000 2,700,000 8,100,000 1/2%, MJ, GNRL99th Ave. Reconstruction 350,000 350,000 - - - - - - - GENERALSchool Zone Safety Assessment 200,042 91,317 108,725 50,000 100,000 50,000 100,000 50,000 458,725 GENERALMarketplace Ped Bridge Assessment - - - 400,000 - - - - 400,000 NURAUtility Studies 89,885 89,885 - - - - - - - GENERAL/NURARalston House Development 242,413 242,413 - - - - - - - GENERALJustice Center 22,020,445 12,000,000 10,020,445 - - - - - 10,020,445 1/2%Justice Center COP Debt 1,204,736 1,204,736 - 1,463,919 1,463,519 1,465,519 1,465,769 1,464,269 7,322,995 1/2%112th North Metro Rail 728,000 - - - - - - - - GRANT112th North Metro Rail 207,000 - - 76,000 - - - - 76,000 GENERALCity Hall Space Assessment - - - 40,000 - - - - 40,000 GENERALSouth Huron Street Rehabilitation 125,000 160,000 - - 600,000 1,200,000 - - 1,800,000 4.000 MILLS
Total 28,142,057$ 15,840,084$ 11,447,085$ 8,204,919$ 11,908,519$ 6,390,519$ 5,990,769$ 5,189,269$ 49,131,080$
CAPITAL IMPROVEMENT PROGRAM SUMMARYCapital Projects Fund (Project Listing)
187

Begin: Finish:
Future Operational Impact: Yes Operational Impact Category: N/ANo
2018 2019 2020 2021 2022 5 - Year TotalOpen Space Tax (ADCOO) 25,000 25,000 25,000 25,000 25,000 125,000$
- - - -
Total Revenue 25,000$ 25,000$ 25,000$ 25,000$ 25,000$ 125,000$
2018 2019 2020 2021 2022 5 - Year TotalPlans/Studies -$ Design - Construction 25,000 25,000 25,000 25,000 25,000 125,000 Materials - Equipment - Other - - Other - -
Total Expenditures 25,000$ 25,000$ 25,000$ 25,000$ 25,000$ 125,000$
Comprehensive Project Cost: $125,000.00 (5 year total)
Project Rationale: Emergency Facility Maintenance
XDescription/Justification:Emergency replacement of the playground equipment throughout the City.
The playground equipment at the City’s parks is replaced on a periodic basis due to normal wear and tear, vandalism, and unavailable replacement parts.However, in some instances the damaged equipment presents an unsafe condition and requires immediate removal. In the event a piece of equipment isdamaged, it is more likely that replacement parts will still be available if that component is replaced immediately. A delay of a year or two increases thelikelihood of complete equipment replacement due to unavailable parts and leaves facilities in an undesirable condition for park patrons. Funding for theEmergency Park Repairs will only be expended on an as needed basis. In the event little or no emergency equipment replacements are necessary in aspecific year, the funds would remain in the fund balance.
Source of Funding:
Expenditures:
5-YEAR CAPITAL IMPROVEMENT PROGRAM
Project Name: Emergency Park Equipment Repairs
Project Dates: Ongoing Ongoing
188

Begin: Finish:
Future Operational Impact: Yes Operational Impact Category: Clean and Beautiful CityNo
2018 2019 2020 2021 2022 5 - Year TotalAdams County Open Space 25,000 25,000$
- - - -
Total Revenue 25,000$ -$ -$ -$ -$ 25,000$
2018 2019 2020 2021 2022 5 - Year TotalPlans/Studies -$ Design - Construction 25,000 25,000 Materials - Equipment - Other - - Other - -
Total Expenditures 25,000$ -$ -$ -$ -$ 25,000$
Comprehensive Project Cost: $25,000.00
Project Rationale: Water Conservation and Efficiency
X
Description/Justification:A Central Control system has been implemented during the past five years to assist in monitoring the efficiency of the use of water in city parks and rights ofway. Information is provided by the system that allows staff to monitor and adapt the system operation and irrigation run times in response to the condition ofthe system (e.g., wather conditions, irrigation pipe breaks, etc.) Utilization of a fully functioning central control system would allow water and cost savings of25-40% annually. This contination of the project includes the integration of the system with cellular control. Each controller requires a cell card that isannuallly updated. The cost to purchasea single card is $1,023 and costs $140 to operate annually. There are currently 29 cell cards in place, an additional15 cards are needed to complete this portion of the system. There is an ongoing operating cost of $6,160 that will need to be included int he operatingbudgget in subsequent years.
Source of Funding:
Expenditures:
5-YEAR CAPITAL IMPROVEMENT PROGRAM
Project Name: Irrigation Central Control
Project Dates: Mar-2018 Jul-2018
189

Begin: Finish:
Future Operational Impact: Yes Operational Impact Category: N/ANo
2018 2019 2020 2021 2022 5 - Year TotalOpen Space Tax (ADCOO) 100,000 100,000$
- - - -
Total Revenue -$ 100,000$ -$ -$ -$ 100,000$
2018 2019 2020 2021 2022 5 - Year TotalPlans/Studies -$ Design - Construction 100,000 100,000 Materials - Equipment - Other - - Other - - Total Expenditures -$ 100,000$ -$ -$ -$ 100,000$
5-YEAR CAPITAL IMPROVEMENT PROGRAM
Project Name: Senior Fitness Equipment
Project Dates: Jan-2019 Dec-2019
Expenditures:
Comprehensive Project Cost: $100,000.00
Project Rationale: Parks and Recreation Master Plan
XDescription/Justification:Design and Construction of new "Playground".
At the request of the senior center staff and senior center participants, a senior "playground" is proposed to be installed behind the recreation center. Thisspace would consist of 6-8 outdoor workout stations designed specifically for the senior population. The budget includes site preparation, purchase andinstallation of the equipment.
Source of Funding:
190

Begin: Finish:
Future Operational Impact: Yes Operational Impact Category: PositiveNo
2017 2018 2019 2020 2021 5 - Year TotalADCOO 400,000 400,000$
- - - -
Total Revenue 400,000$ -$ -$ -$ -$ 400,000$
2017 2018 2019 2020 2021 5 - Year TotalPlans/Studies -$ Design - Construction 400,000 400,000 Materials - Equipment - Other - - Other - -
Total Expenditures 400,000$ -$ -$ -$ -$ 400,000$
Comprehensive Project Cost: $500,000.00
Project Rationale: Facility Maintenance
X
Description/Justification:The existing bath house is the original structure, with minimal improvements made throughout the years. The improvements include electrical and plumbingrepairs, as well as functional and aesthetic improvements to the shower and changing areas.
Source of Funding:
Expenditures:
5-YEAR CAPITAL IMPROVEMENT PROGRAM
Project Name: Kiwanis Bath House Renovation
Project Dates: Jan-2017 Dec-2017
191

Begin: Finish:
Future Operational Impact: Yes Operational Impact Category: PositiveNo
2018 2019 2020 2021 2022 5 - Year Total1/2% Sales Tax 675,000 675,000$
- - - -
Total Revenue 675,000$ -$ -$ -$ -$ 675,000$
2018 2019 2020 2021 2022 5 - Year TotalPlans/Studies -$ Design 50,000 50,000 Construction 625,000 625,000 Materials - Equipment - Other - - Other - - Total Expenditures 675,000$ -$ -$ -$ -$ 675,000$
Comprehensive Project Cost: $675,000.00
Project Rationale: Facility Improvement
X
Description/Justification:Removal of existing parks storage area and replace with new storage and maintenance building
The existing parks barn/storage facility was originally constructed in 1950 by the school district for school busses. In 1996, the doors were re-sized and theelectric overhead door openers were installed. In 2000, North Metro Fire suggested that the building be removed, due to the lack of appropriate fire exits, andthe building was scheduled for demolition in 2004. This never occurred, and the building remained in use. In 2008, North Metro Fire again evaluated thebuilding, and required that all ignition sources and electric openers be removed. To meet this requirement, all gas lines and furnaces were removed at thattime. In addition to the safety concerns noted, the structure does not meet the current needs of the Parks Maintenance division. It lacks functional doors, andis not large enough to store the equipment used by the division. Both the roof and the siding have significant perforations, allowing for animals and water toenter the facility. This project includes the demolition and removal of the existing facility, and the design and construction of a new facility. The new facility isproposed to be approximately 50% larger than the existing facility and would include appropriate heating, electrical, and plumbing (ie. eye wash station, utilitysink) to meet the needs of the division.
Source of Funding:
Expenditures:
5-YEAR CAPITAL IMPROVEMENT PROGRAM
Project Name: Parks Barn Replacement
Project Dates: Jan-2015 Dec-2018
192

Begin: Finish:
Future Operational Impact: Yes Operational Impact Category: N/ANo
2018 2019 2020 2021 2022 5 - Year TotalAdams County Open Space 170,000 170,000$
- - - -
Total Revenue -$ 170,000$ -$ -$ -$ 170,000$
2018 2019 2020 2021 2022 5 - Year TotalPlans/Studies -$ Design - Construction 170,000 170,000 Materials - Equipment - Other - - Other - -
Total Expenditures -$ 170,000$ -$ -$ -$ 170,000$
Comprehensive Project Cost: $170,000.00
Project Rationale: Safety and Functionality
XDescription/Justification:The city owns and maintains two tennis facilities - a three-court facility at Wyco Park and a two-court facilty at Danahy Park. These are lighted, fenced,asphalt courts with an acrylic overlay. The thin acrylic overlay must be repaired every 1-3 years, to prevent a poor playing surface, trip hazards and/oradditional damage. The courts at Danahy Park were entirely reconstructed in 2014, the acrylic surface has some wear and needs minor patching. The courtat Wyco is cracking, with significant damage to the acrylic surface. The Wyco court needs acrylic repairs in 2016, and is recommended for reconstruction in2019.
Source of Funding:
Expenditures:
5-YEAR CAPITAL IMPROVEMENT PROGRAM
Project Name: Tennis Courts
Project Dates: Jan-2016 Dec-2019
193
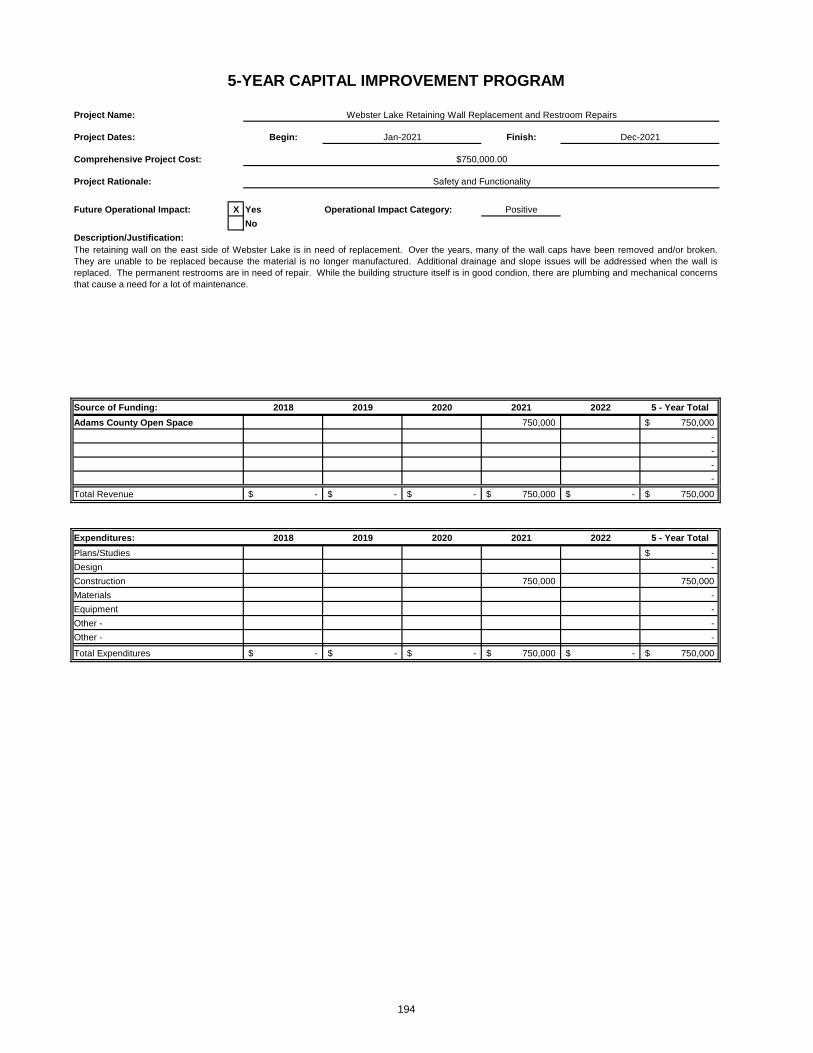
Begin: Finish:
Future Operational Impact: Yes Operational Impact Category: PositiveNo
2018 2019 2020 2021 2022 5 - Year TotalAdams County Open Space 750,000 750,000$
- - - -
Total Revenue -$ -$ -$ 750,000$ -$ 750,000$
2018 2019 2020 2021 2022 5 - Year TotalPlans/Studies -$ Design - Construction 750,000 750,000 Materials - Equipment - Other - - Other - -
Total Expenditures -$ -$ -$ 750,000$ -$ 750,000$
Description/Justification:
5-YEAR CAPITAL IMPROVEMENT PROGRAM
Project Name: Webster Lake Retaining Wall Replacement and Restroom Repairs
Project Dates: Jan-2021 Dec-2021
Comprehensive Project Cost: $750,000.00
Project Rationale: Safety and Functionality
X
The retaining wall on the east side of Webster Lake is in need of replacement. Over the years, many of the wall caps have been removed and/or broken.They are unable to be replaced because the material is no longer manufactured. Additional drainage and slope issues will be addressed when the wall isreplaced. The permanent restrooms are in need of repair. While the building structure itself is in good condion, there are plumbing and mechanical concernsthat cause a need for a lot of maintenance.
Source of Funding:
Expenditures:
194
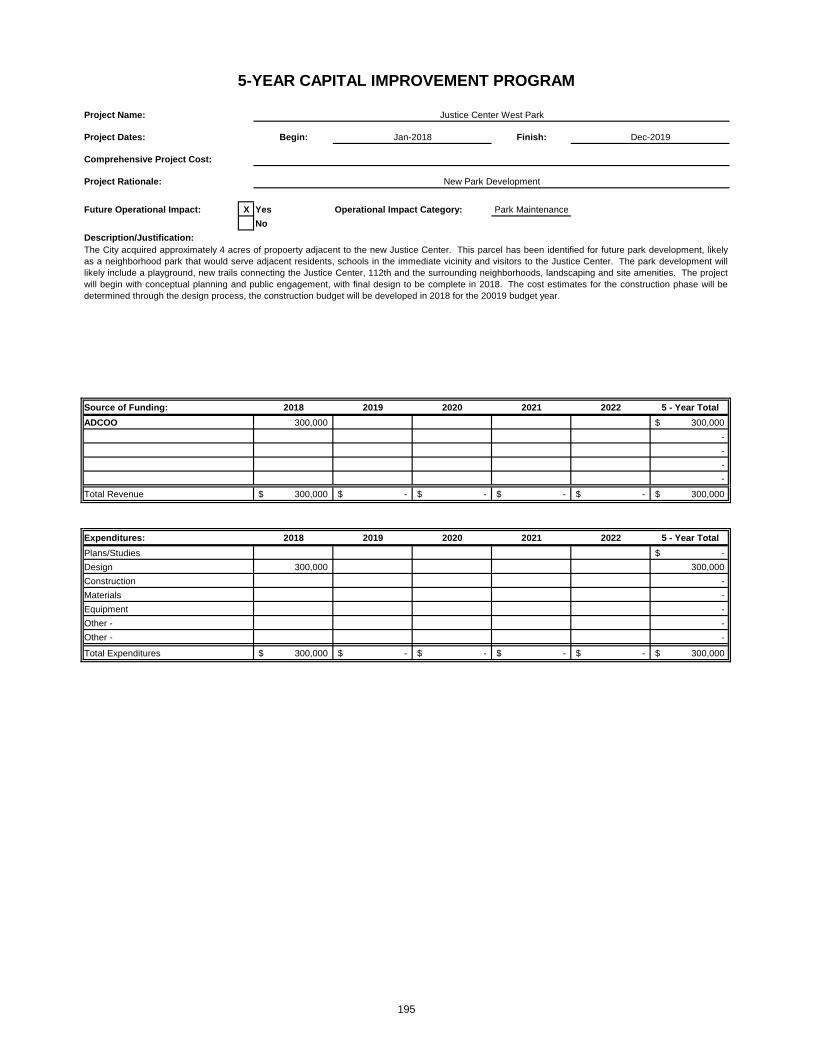
Begin: Finish:
Future Operational Impact: Yes Operational Impact Category: Park MaintenanceNo
2018 2019 2020 2021 2022 5 - Year TotalADCOO 300,000 300,000$
- - - -
Total Revenue 300,000$ -$ -$ -$ -$ 300,000$
2018 2019 2020 2021 2022 5 - Year TotalPlans/Studies -$ Design 300,000 300,000 Construction - Materials - Equipment - Other - - Other - -
Total Expenditures 300,000$ -$ -$ -$ -$ 300,000$
Comprehensive Project Cost:
Project Rationale: New Park Development
X
Description/Justification:The City acquired approximately 4 acres of propoerty adjacent to the new Justice Center. This parcel has been identified for future park development, likelyas a neighborhood park that would serve adjacent residents, schools in the immediate vicinity and visitors to the Justice Center. The park development willlikely include a playground, new trails connecting the Justice Center, 112th and the surrounding neighborhoods, landscaping and site amenities. The projectwill begin with conceptual planning and public engagement, with final design to be complete in 2018. The cost estimates for the construction phase will bedetermined through the design process, the construction budget will be developed in 2018 for the 20019 budget year.
Source of Funding:
Expenditures:
5-YEAR CAPITAL IMPROVEMENT PROGRAM
Project Name: Justice Center West Park
Project Dates: Jan-2018 Dec-2019
195

Begin: Finish:
Future Operational Impact: Yes Operational Impact Category: N/ANo
2018 2019 2020 2021 2022 5 - Year TotalTransportation Tax (ADCOT) 899,925 750,000 750,000 750,000 750,000 3,899,925$
- - - -
Total Revenue 899,925$ 750,000$ 750,000$ 750,000$ 750,000$ 3,899,925$
2018 2019 2020 2021 2022 5 - Year TotalPlans/Studies -$ Design - Construction 899,925 750,000 750,000 750,000 750,000 3,899,925 Materials - Equipment - Other - - Other - -
Total Expenditures 899,925$ 750,000$ 750,000$ 750,000$ 750,000$ 3,899,925$
XDescription/Justification:
Comprehensive Project Cost: $3,899,925 (5 Year Total)
Project Rationale: PCI Rating - Maintenance Program
5-YEAR CAPITAL IMPROVEMENT PROGRAM
Project Name: Residential Street Program
Project Dates: Ongoing Ongoing
The Residential Street Program is an annual program to maintain a minimum level of pavement condition for the residential street network.
On July 27, 2006, the City Council passed Resolution 06-92, making a City policy to maintain an average PCI rating of 70 or better. The Residential StreetProgram is an essential component in maintaining the 70 PCI rating. The Program includes resurfacing, restriping, patching, and concrete repair of selectedstreets. Additional services may include construction observation/inspection and quality control.
Source of Funding:
Expenditures:
196

Begin: Finish:
Future Operational Impact: Yes Operational Impact Category: N/ANo
2018 2019 2020 2021 2022 5 - Year TotalTransportation Tax (ADCOT) 100,000 100,000 100,000 100,000 100,000 500,000$
- - - -
Total Revenue 100,000$ 100,000$ 100,000$ 100,000$ 100,000$ 500,000$
2018 2019 2020 2021 2022 5 - Year TotalPlans/Studies -$ Design - Construction 100,000 100,000 100,000 100,000 100,000 500,000 Materials - Equipment - Other - - Other - -
Total Expenditures 100,000$ 100,000$ 100,000$ 100,000$ 100,000$ 500,000$
XDescription/Justification:
Comprehensive Project Cost: $500,000.00 (5 Year Total)
Project Rationale: Maintenance Program
5-YEAR CAPITAL IMPROVEMENT PROGRAM
Project Name: Traffic Signal Program
Project Dates: Ongoing Ongoing
Upgrade of traffic cabinets, signals and controllers on a citywide basis.
The traffic signal cabinets and associated wiring are an essential part of our traffic signal system. Many of the city's traffic signal cabinets have reached the endof their useful life and pose an electrical hazard. The replacement or upgrade of existing hardware is essential in keeping our traffic signals operating on anuninterrupted basis. Traffic Signal Improvements are due to corrosion of traffic signal poles and mast arms that can shorten the useful life of traffic signals. Thisprogram includes the cleaning and painting of a portion of the City's traffic signals. This program may also be used to fund pole replacement, LED and cameraupgrades, and other costly components of the traffic signal infrastructure. Additional services may include construction observation/inspection and qualitycontrol.
Source of Funding:
Expenditures:
197
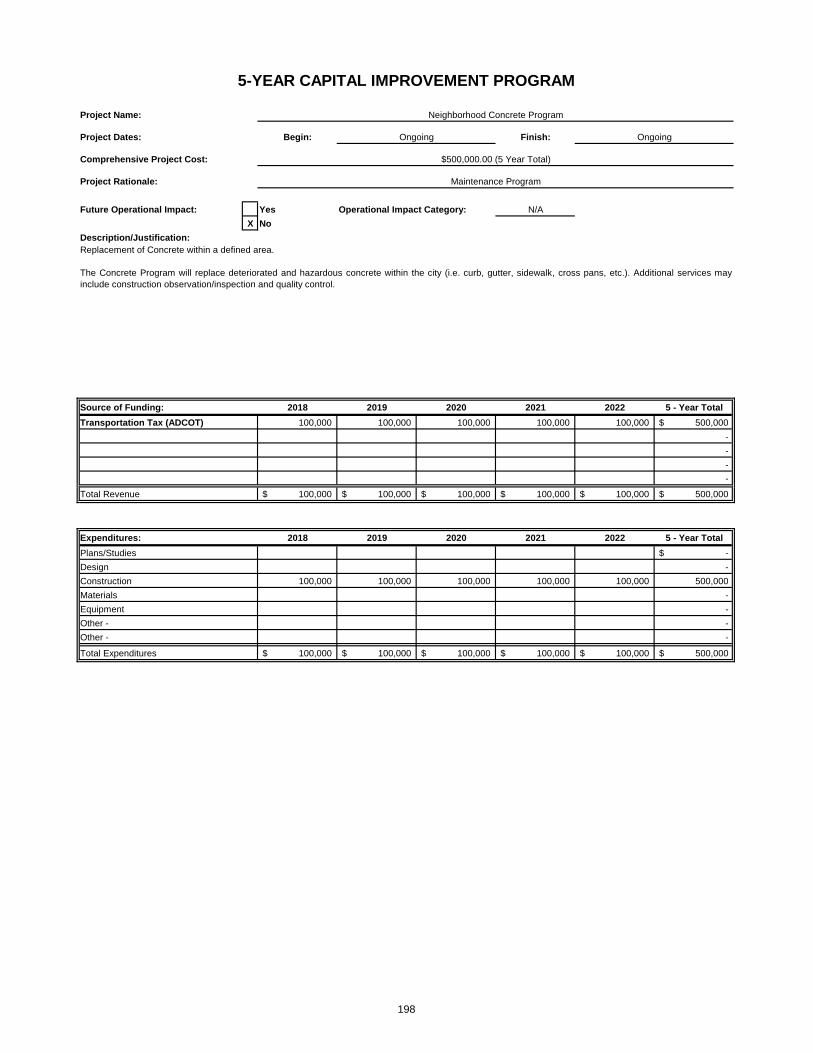
Begin: Finish:
Future Operational Impact: Yes Operational Impact Category: N/ANo
2018 2019 2020 2021 2022 5 - Year TotalTransportation Tax (ADCOT) 100,000 100,000 100,000 100,000 100,000 500,000$
- - - -
Total Revenue 100,000$ 100,000$ 100,000$ 100,000$ 100,000$ 500,000$
2018 2019 2020 2021 2022 5 - Year TotalPlans/Studies -$ Design - Construction 100,000 100,000 100,000 100,000 100,000 500,000 Materials - Equipment - Other - - Other - -
Total Expenditures 100,000$ 100,000$ 100,000$ 100,000$ 100,000$ 500,000$
XDescription/Justification:
Comprehensive Project Cost: $500,000.00 (5 Year Total)
Project Rationale: Maintenance Program
5-YEAR CAPITAL IMPROVEMENT PROGRAM
Project Name: Neighborhood Concrete Program
Project Dates: Ongoing Ongoing
Replacement of Concrete within a defined area.
The Concrete Program will replace deteriorated and hazardous concrete within the city (i.e. curb, gutter, sidewalk, cross pans, etc.). Additional services mayinclude construction observation/inspection and quality control.
Source of Funding:
Expenditures:
198
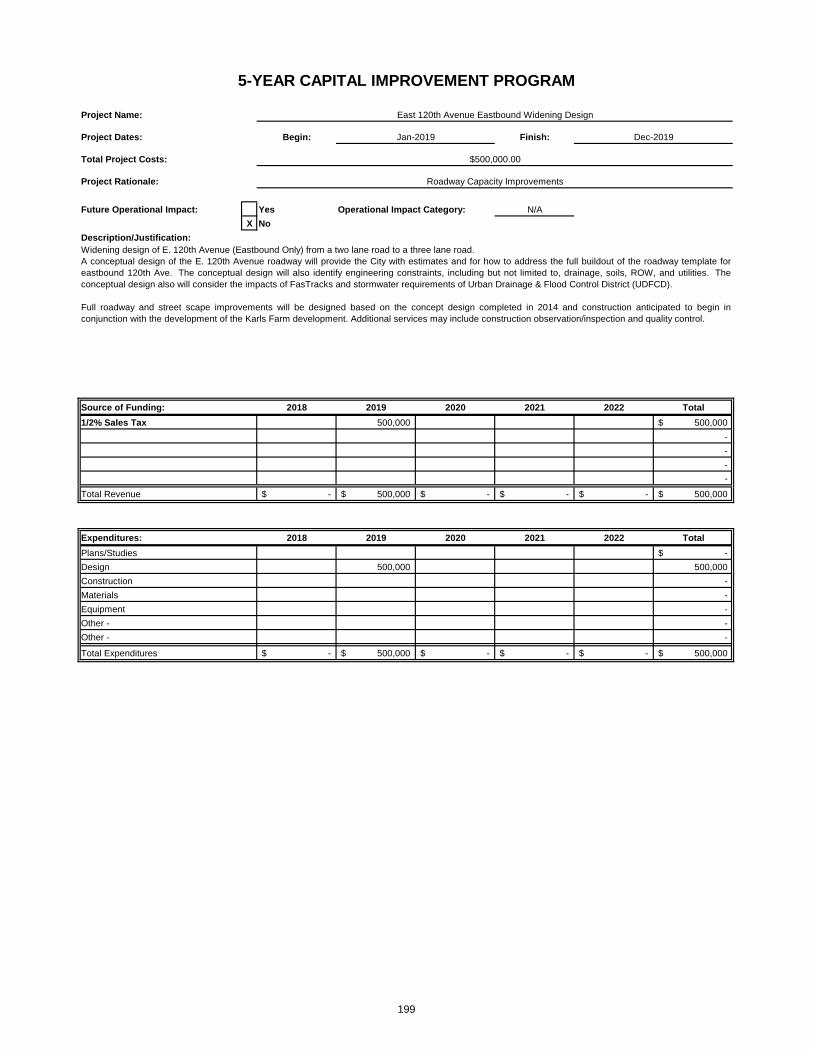
Begin: Finish:
Future Operational Impact: Yes Operational Impact Category: N/ANo
2018 2019 2020 2021 2022 Total1/2% Sales Tax 500,000 500,000$
- - - -
Total Revenue -$ 500,000$ -$ -$ -$ 500,000$
2018 2019 2020 2021 2022 TotalPlans/Studies -$ Design 500,000 500,000 Construction - Materials - Equipment - Other - - Other - -
Total Expenditures -$ 500,000$ -$ -$ -$ 500,000$
XDescription/Justification:
Total Project Costs: $500,000.00
Project Rationale: Roadway Capacity Improvements
5-YEAR CAPITAL IMPROVEMENT PROGRAM
Project Name: East 120th Avenue Eastbound Widening Design
Project Dates: Jan-2019 Dec-2019
Widening design of E. 120th Avenue (Eastbound Only) from a two lane road to a three lane road.A conceptual design of the E. 120th Avenue roadway will provide the City with estimates and for how to address the full buildout of the roadway template foreastbound 120th Ave. The conceptual design will also identify engineering constraints, including but not limited to, drainage, soils, ROW, and utilities. Theconceptual design also will consider the impacts of FasTracks and stormwater requirements of Urban Drainage & Flood Control District (UDFCD).
Full roadway and street scape improvements will be designed based on the concept design completed in 2014 and construction anticipated to begin inconjunction with the development of the Karls Farm development. Additional services may include construction observation/inspection and quality control.
Source of Funding:
Expenditures:
199
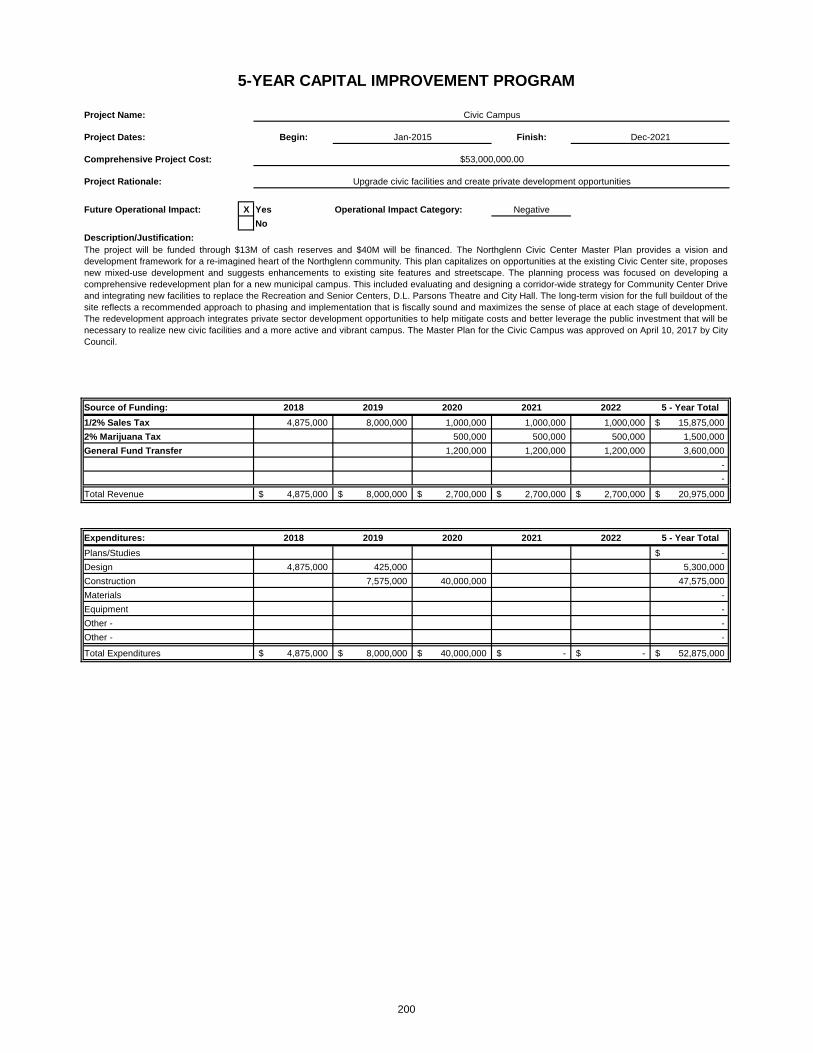
Begin: Finish:
Future Operational Impact: Yes Operational Impact Category: NegativeNo
2018 2019 2020 2021 2022 5 - Year Total1/2% Sales Tax 4,875,000 8,000,000 1,000,000 1,000,000 1,000,000 15,875,000$ 2% Marijuana Tax 500,000 500,000 500,000 1,500,000 General Fund Transfer 1,200,000 1,200,000 1,200,000 3,600,000
- -
Total Revenue 4,875,000$ 8,000,000$ 2,700,000$ 2,700,000$ 2,700,000$ 20,975,000$
2018 2019 2020 2021 2022 5 - Year TotalPlans/Studies -$ Design 4,875,000 425,000 5,300,000 Construction 7,575,000 40,000,000 47,575,000 Materials - Equipment - Other - - Other - -
Total Expenditures 4,875,000$ 8,000,000$ 40,000,000$ -$ -$ 52,875,000$
5-YEAR CAPITAL IMPROVEMENT PROGRAM
Project Name: Civic Campus
Project Dates: Jan-2015 Dec-2021
Expenditures:
Comprehensive Project Cost: $53,000,000.00
Project Rationale: Upgrade civic facilities and create private development opportunities
X
Description/Justification:The project will be funded through $13M of cash reserves and $40M will be financed. The Northglenn Civic Center Master Plan provides a vision anddevelopment framework for a re-imagined heart of the Northglenn community. This plan capitalizes on opportunities at the existing Civic Center site, proposesnew mixed-use development and suggests enhancements to existing site features and streetscape. The planning process was focused on developing acomprehensive redevelopment plan for a new municipal campus. This included evaluating and designing a corridor-wide strategy for Community Center Driveand integrating new facilities to replace the Recreation and Senior Centers, D.L. Parsons Theatre and City Hall. The long-term vision for the full buildout of thesite reflects a recommended approach to phasing and implementation that is fiscally sound and maximizes the sense of place at each stage of development.The redevelopment approach integrates private sector development opportunities to help mitigate costs and better leverage the public investment that will benecessary to realize new civic facilities and a more active and vibrant campus. The Master Plan for the Civic Campus was approved on April 10, 2017 by CityCouncil.
Source of Funding:
200

Begin: Finish:
Future Operational Impact: Yes Operational Impact Category: N/ANo
2018 2019 2020 2021 2022 5 - Year Total4.000 Mill Levy 600,000 1,200,000 1,800,000$
- - - -
Total Revenue -$ 600,000$ 1,200,000$ -$ -$ 1,800,000$
2018 2019 2020 2021 2022 5 - Year TotalPlans/Studies -$ Design 600,000 600,000 Construction 1,200,000 1,200,000 Materials - Equipment - Other - - Other - -
Total Expenditures -$ 600,000$ 1,200,000$ -$ -$ 1,800,000$
XDescription/Justification:
Comprehensive Project Cost: $1,960,000.00
Project Rationale: Roadway Rehabilitation
5-YEAR CAPITAL IMPROVEMENT PROGRAM
Project Name: Huron Street Rehabilitation
Project Dates: Jan-2017 Dec-2020
Rehabilitation of Huron Street South of 104th.
Design and construction of the Huron Street Rehabilitation South of 104th may include drainage and cross slope improvements. The total cost shown is forpavement rehabilitation only. Additional services may include construction observation/inspection and quality control.
Source of Funding:
Expenditures:
201
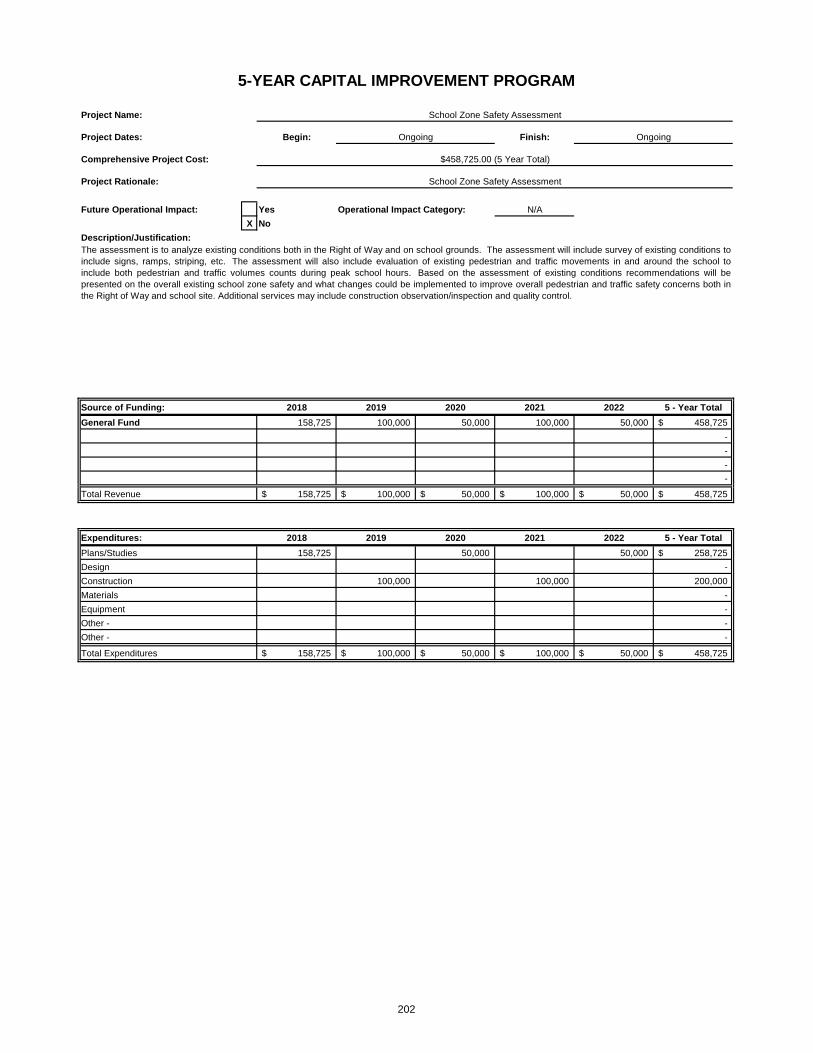
Begin: Finish:
Future Operational Impact: Yes Operational Impact Category: N/ANo
2018 2019 2020 2021 2022 5 - Year TotalGeneral Fund 158,725 100,000 50,000 100,000 50,000 458,725$
- - - -
Total Revenue 158,725$ 100,000$ 50,000$ 100,000$ 50,000$ 458,725$
2018 2019 2020 2021 2022 5 - Year TotalPlans/Studies 158,725 50,000 50,000 258,725$ Design - Construction 100,000 100,000 200,000 Materials - Equipment - Other - - Other - -
Total Expenditures 158,725$ 100,000$ 50,000$ 100,000$ 50,000$ 458,725$
XDescription/Justification:
Comprehensive Project Cost: $458,725.00 (5 Year Total)
Project Rationale: School Zone Safety Assessment
5-YEAR CAPITAL IMPROVEMENT PROGRAM
Project Name: School Zone Safety Assessment
Project Dates: Ongoing Ongoing
The assessment is to analyze existing conditions both in the Right of Way and on school grounds. The assessment will include survey of existing conditions toinclude signs, ramps, striping, etc. The assessment will also include evaluation of existing pedestrian and traffic movements in and around the school toinclude both pedestrian and traffic volumes counts during peak school hours. Based on the assessment of existing conditions recommendations will bepresented on the overall existing school zone safety and what changes could be implemented to improve overall pedestrian and traffic safety concerns both inthe Right of Way and school site. Additional services may include construction observation/inspection and quality control.
Source of Funding:
Expenditures:
202
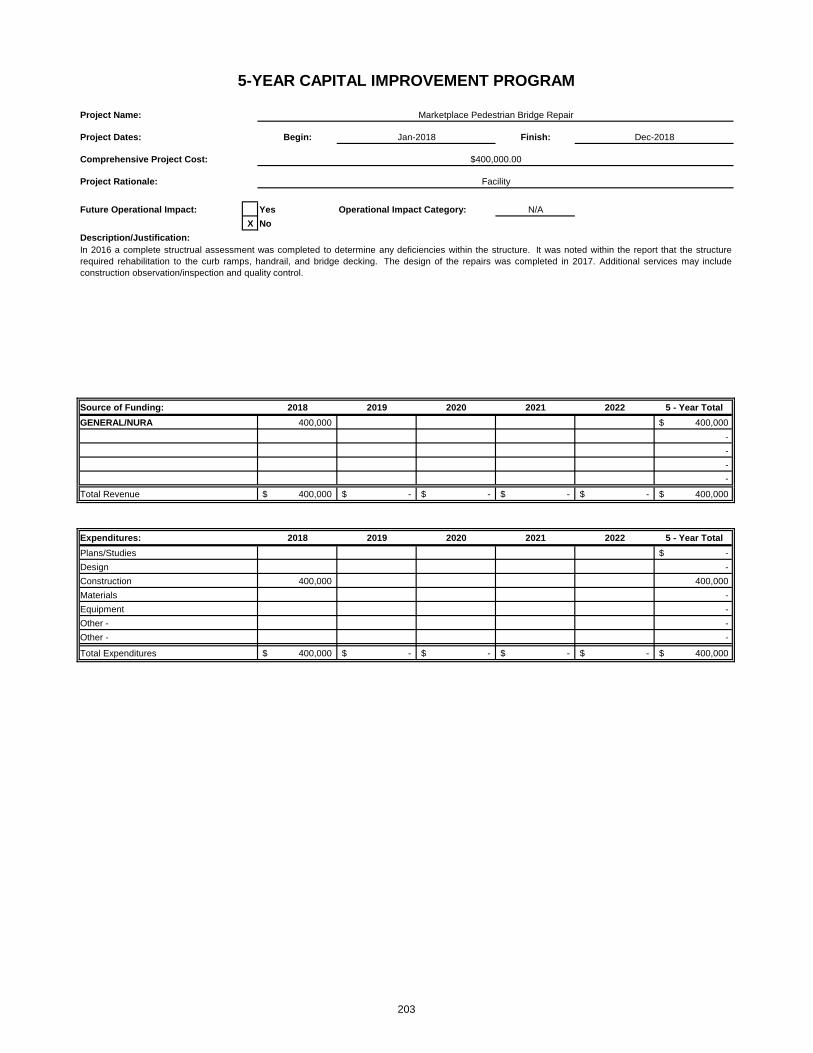
Begin: Finish:
Future Operational Impact: Yes Operational Impact Category: N/ANo
2018 2019 2020 2021 2022 5 - Year TotalGENERAL/NURA 400,000 400,000$
- - - -
Total Revenue 400,000$ -$ -$ -$ -$ 400,000$
2018 2019 2020 2021 2022 5 - Year TotalPlans/Studies -$ Design - Construction 400,000 400,000 Materials - Equipment - Other - - Other - -
Total Expenditures 400,000$ -$ -$ -$ -$ 400,000$
Comprehensive Project Cost: $400,000.00
Project Rationale:
5-YEAR CAPITAL IMPROVEMENT PROGRAM
Project Name: Marketplace Pedestrian Bridge Repair
Project Dates: Jan-2018 Dec-2018
Facility
Description/Justification:In 2016 a complete structrual assessment was completed to determine any deficiencies within the structure. It was noted within the report that the structurerequired rehabilitation to the curb ramps, handrail, and bridge decking. The design of the repairs was completed in 2017. Additional services may includeconstruction observation/inspection and quality control.
Source of Funding:
Expenditures:
X
203

Begin: Finish:
Future Operational Impact: Yes Operational Impact Category: NegativeNo
2018 2019 2020 2021 2022 5 - Year Total1/2% Sales Tax - Capital Projects -$ Certificates of Participation 10,020,445 10,020,445
- - -
Total Revenue 10,020,445$ -$ -$ -$ -$ 10,020,445$
2018 2019 2020 2021 2022 5 - Year TotalPlans/Studies -$
Design - Construction 8,270,445 8,270,445 Materials - Equipment 1,000,000 1,000,000 Roadway 750,000 750,000 Other - -
Total Expenditures 8,270,445$ 1,750,000$ -$ -$ -$ 10,020,445$
5-YEAR CAPITAL IMPROVEMENT PROGRAM
Project Name: Police and Municipal Court Complex
Project Dates: Jan-2016 Dec-2018
Comprehensive Project Cost: $23,000,000.00
Project Rationale: Facility
X
Description/Justification:A Master Plan was completed in 2015 to better understand the needs for the Police and Municipal Court Complex. In 2016 plans will include hiring of anArchitectural/Engineering firm to complete building and site improvement documents. Construction of the approximately 47,000 sq. ft. facility is expected to becompleted by the end of 2018. The new building will add to ongoing operational costs not currently being incurred.
Source of Funding:
Expenditures:
204
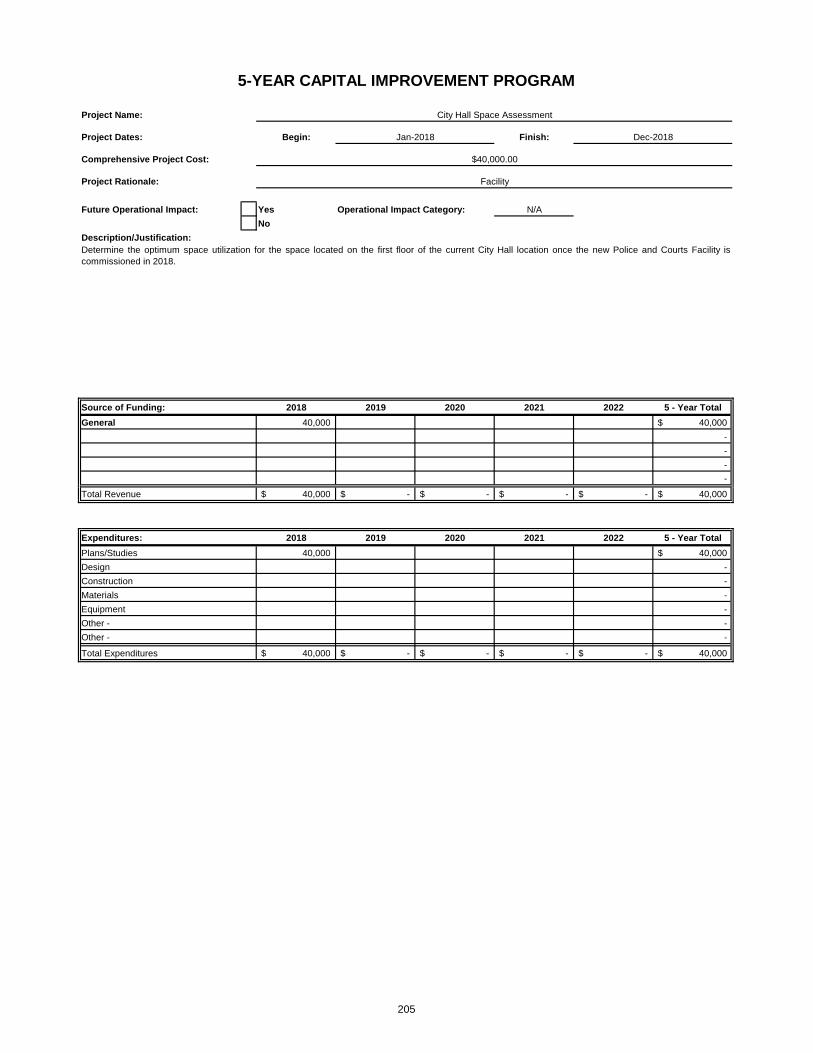
Begin: Finish:
Future Operational Impact: Yes Operational Impact Category: N/ANo
2018 2019 2020 2021 2022 5 - Year TotalGeneral 40,000 40,000$
- - - -
Total Revenue 40,000$ -$ -$ -$ -$ 40,000$
2018 2019 2020 2021 2022 5 - Year TotalPlans/Studies 40,000 40,000$ Design - Construction - Materials - Equipment - Other - - Other - -
Total Expenditures 40,000$ -$ -$ -$ -$ 40,000$
Comprehensive Project Cost: $40,000.00
Project Rationale:
5-YEAR CAPITAL IMPROVEMENT PROGRAM
Project Name: City Hall Space Assessment
Project Dates: Jan-2018 Dec-2018
Facility
Description/Justification:Determine the optimum space utilization for the space located on the first floor of the current City Hall location once the new Police and Courts Facility iscommissioned in 2018.
Source of Funding:
Expenditures:
205

2017AdoptedBudget
2017Year-End Forecast
2017EstimatedCarry Over
2018 Proposed Budget
2019Estimate
2020Estimate
2021Estimate
2022Estimate
5-YearTotal
Funding Source
Beginning Fund Balance 16,874,230$ 14,178,367$ 12,708,813$ 13,562,839$ 42,681,433$ 20,111,389$ 23,590,848$
Revenue Projections:Sales Tax 3,387,355$ 3,207,947$ 3,273,269$ 3,306,002$ 3,339,062$ 3,372,453$ 3,406,178$ 16,696,964$ Use Tax 394,859 490,739 497,951 502,931 507,960 513,040 518,170 2,540,052 Berthoud Pass IGA 3,500 2,500 3,500 3,500 3,500 3,500 3,500 17,500 Administrative Fees 15,639 15,323 15,323 15,323 15,323 15,323 15,323 76,615 FRICO Agreement 2,600 2,600 2,600 2,600 2,600 2,600 2,600 13,000 Past Due Penalties/Interest 91,537 91,724 91,724 91,724 91,724 91,724 91,724 458,620 Contracted Lab Services 7,834 6,500 6,500 6,500 6,500 6,500 6,500 32,500 Water Use Charges 6,858,780 7,579,378 7,920,450 8,276,870 8,649,329 8,908,809 9,176,073 42,931,531 Construction Water Sales 5,000 5,000 5,000 5,000 5,000 5,000 5,000 25,000 Water Lease Revenue 55,000 55,000 55,000 55,000 55,000 55,000 55,000 275,000 Sewer Use Charges 3,889,274 3,624,785 3,978,202 4,366,077 4,791,770 5,175,112 5,589,121 23,900,282 Tap Connection Fees - 30,000 - - - - - - Investment Earnings 73,000 65,000 65,000 67,814 213,407 100,557 117,954 564,732 Miscellaneous Revenue - 5,000 - - - - - - - Proceeds from Debt Issuance - - - 33,000,000 - - - 33,000,000 Total 14,784,378 15,181,496 15,914,519 49,699,341 17,681,175 18,249,618 18,987,143 120,531,796
Operating Expenditures 7,510,851$ 7,796,694$ 9,505,970$ 9,696,089$ 9,890,011$ 10,087,811$ 10,289,567$ 49,469,448$ Water Right Purchases 2,250,000 1,000,000 1,000,000 1,000,000 1,000,000 1,000,000 1,000,000 5,000,000 Debt Expenditures 977,033 977,033 979,300 2,576,158 3,177,708 3,178,848 3,174,578 13,086,592 Other 3,500 - - 3,500 3,500 3,500 3,500 14,000 Total Capital Expenditures* 7,858,733 6,877,323 37,368 3,537,855 7,305,000 26,180,000 500,000 500,000 38,060,223 Total Expenditures 18,600,117 16,651,050 37,368 15,023,125 20,580,747 40,251,219 14,770,159 14,967,645 105,630,263
Ending Fund Balance 13,058,491$ 12,708,813$ 13,562,839$ 42,681,433$ 20,111,389$ 23,590,848$ 27,610,346$
Restrictions, Commitments, & Assignments:3% TABOR Reserve Restriction 221,152$ 226,306$ 314,353$ 1,376,712$ 415,025$ 430,924$ 451,884$ Debt Service Reserve Restriction 247,538 65,148 87,570 111,412 133,704 154,856 180,278 Water Right Purchase Restriction 4,441,518 4,034,519 5,804,017 8,204,017 10,604,017 13,004,017 15,404,017 Capital/Infrastructure Commitment 2,000,000 2,000,000 2,000,000 2,000,000 2,000,000 2,000,000 2,000,000 Operating Reserve Commitment 2,135,713 2,014,724 2,177,493 2,424,022 2,472,503 2,521,953 2,572,392 Unassigned Fund Balance 4,012,570$ 4,368,116$ 3,179,406$ 28,565,270$ 4,486,140$ 5,479,098$ 7,001,775$
*See following page for project listing
CAPITAL IMPROVEMENT PROGRAM SUMMARYWater & Wastewater Fund
206

2017AdoptedBudget
2017Year-End Forecast
2017EstimatedCarry Over
2018 Proposed Budget
2019Estimate
2020Estimate
2021Estimate
2022Estimate
5-YearTotal
Funding Source
Capital Expenditures:Water Line Replacement 259,691 80,247 10,000 269,444 100,000 100,000 100,000 100,000 679,444 WFStandley Lake Pipeline 151,192 137,500 5,000 170,000 150,000 150,000 150,000 150,000 775,000 WFHigh Zone Storage Tank Painting - (2,495) - - - - - - - WFBerthoud Pass Ditch Maintenance 20,000 20,000 - 350,000 - - - - 350,000 WFWater Plant Filter Media Replacement 185,000 185,000 - 185,000 185,000 - - - 370,000 WFNorth Low Zone Tank Painting 180,000 180,000 - - - - - - - WFFarmers Highline Flume Gate 80,000 80,000 - - - - - - - WFFlume at Lupton Bottom 15,000 15,000 - - - - - - - WFTerminal Reservoir Phase II 800,000 30,200 - 769,800 - - - - 769,800 WFPlant Clarifier Rehabilitation - - - 170,000 170,000 - - - 340,000 WFWaste Handling Improvements - - - 300,000 2,700,000 - - - 3,000,000 WFLaboratory Information Management System - - - 180,000 - - - - 180,000 WFFilter to Waste Automation - - - - - 180,000 - - 180,000 WFCollection System Rehab 515,979 500,000 22,368 243,611 250,000 250,000 250,000 250,000 1,265,979 WWFBunker Hill Lift Station - - - 100,000 - - - - 100,000 WWFLift Station B Assessment - - - 250,000 250,000 - - - 500,000 WWFWWTP Headworks & Clarifier 5,651,871 5,651,871 - - - - - - - WWFLift Station A & Forcemain Replacement - - - - 3,500,000 25,000,000 - - 28,500,000 WWFLift Station Flow Meters - - - - - 500,000 - - 500,000 WWFUV Upgrades - - - 550,000 - - - - 550,000 WWFTotal 7,858,733$ 6,877,323$ 37,368$ 3,537,855$ 7,305,000$ 26,180,000$ 500,000$ 500,000$ 38,060,223$
CAPITAL IMPROVEMENT PROGRAM SUMMARYWater & Wastewater Fund (Project Listing)
207

Begin: Finish:
Future Operational Impact: Yes Operational Impact Category: N/ANo
2018 2019 2020 2021 2022 5 - Year TotalWater & Wastewater Fund 279,444 100,000 100,000 100,000 100,000 679,444$
- - - -
Total Revenue 279,444$ 100,000$ 100,000$ 100,000$ 100,000$ 679,444$
2018 2019 2020 2021 2022 5 - Year TotalPlans/Studies -$ Design - Construction 279,444 100,000 100,000 100,000 100,000 679,444 Materials - Equipment - Other - - Other - -
Total Expenditures 279,444$ 100,000$ 100,000$ 100,000$ 100,000$ 679,444$
XDescription/Justification:
Comprehensive Project Cost: $679,444.00 (5 Year Total)
Project Rationale: Maintenance Program
5-YEAR CAPITAL IMPROVEMENT PROGRAM
Project Name: Water Line Replacement Program
Project Dates: Ongoing Ongoing
Rehabilitation of water lines and other system components throughout the City.
The Water Line Replacement program includes the repair and replacement of the aging water lines and appurtenances throughout the City. The City's watermains are predominately Asbestos Concrete (AC) pipe and because of the corrosive nature of the soil have a shortened life span. In order to ensurecontinuous water service to the community, the failing water lines must be replaced. In addition to water mains, the City must maintain pressure reducingvalves (PRVs) within the system in order to maintain safe and consistent pressure and flow throughout the City. The pressure reducing valves are reachingthe end or there useful life and will require replacement and repair. Additional services may include construction observation/inspection and quality control.Addtional services may include construction observation/inspection and quality control.
Source of Funding:
Expenditures:
208

Begin: Finish:
Future Operational Impact: Yes Operational Impact Category: N/ANo
2018 2019 2020 2021 2022 5 - Year TotalWater & Wastewater Fund 175,000 150,000 150,000 150,000 150,000 775,000$
- - - -
Total Revenue 175,000$ 150,000$ 150,000$ 150,000$ 150,000$ 775,000$
2018 2019 2020 2021 2022 5 - Year TotalPlans/Studies -$ Design 50,000 50,000 50,000 50,000 50,000 250,000 Construction 125,000 100,000 100,000 100,000 100,000 525,000 Materials - Equipment -
- Other -
Total Expenditures 175,000$ 150,000$ 150,000$ 150,000$ 150,000$ 775,000$
Comprehensive Project Cost: $775,000 (5 Year Total)
5-YEAR CAPITAL IMPROVEMENT PROGRAM
Project Name: Standley Lake Pipeline Program
Project Dates: Ongoing Ongoing
Other
Project Rationale: Facility Maintenance
Repair and/or replacement of sections of the Standley Lake Pipeline.
The Standley Lake Pipeline is a 48” pipeline that conveys the City’s raw water from Standley Lake to the City of Northglenn Water Treatment Plant. In 2010, theCity completed the Standley Lake Pipeline Inspection that employed electromagnetic technology to inspect the entire length of the pipeline for wire breaks andidentified areas for future repairs and/or replacement. The Standley Lake Pipeline Inspection report identified approximately 120 feet of the 48" concrete pipe incritical condition and additional sections requiring repair or replacement within the next 5 to 10 years. Project Update: Standley Lake Pipeline Program, Ongoing- this program includes: an ongoing replacement of 120 feet of pipeline in critical condition, at a cost of approximately $100,000 per 16-foot section, b)surveying and repairing the pipeline's cathodic protection system, and c) additional piping joint repairs to be completed when the pipeline is dewatered forsection replacement. All costs associated with maintenance of the pipeline are shared 50/50 with the City of Thornton. Additional services may includeconstruction observation/inspection and quality control.
Source of Funding:
Expenditures:
Description/Justification:X
209

Begin: Finish:
Future Operational Impact: Yes Operational Impact Category: N/ANo
2018 2019 2020 2021 2022 5 - Year TotalWater & Wastewater Fund 350,000 350,000$
- - - -
Total Revenue 350,000$ -$ -$ -$ -$ 350,000$
2018 2019 2020 2021 2022 5 - Year TotalPlans/Studies -$ Design 350,000 350,000 Construction - Materials - Equipment - Other - - Other - -
Total Expenditures 350,000$ -$ -$ -$ -$ 350,000$
XDescription/Justification:
Comprehensive Project Cost: $370,000.00
Project Rationale: To improve deliveries of fully consumable Berthoud Pass water to the Northglenn system.
5-YEAR CAPITAL IMPROVEMENT PROGRAM
Project Name: Berthoud Pass Ditch Maintenance - Pipe Design Only
Project Dates: Jan-2017 Dec-2018
The Berthoud Pass ditch is a raw water conveyance structure owned by the City that conveys raw water from the Fraser River basin to Clear Creek for use inNorthglenn's municipal water supply. The water is a valuable part of the City's water portfolio.
In 2018, design of piping the ditch from US 40 to the siphon entrance will begin. The length of ditch to be piped is approximately 3,000 feet. Addtional servicesmay include construction observation/inspection and quality control. Additional services may include construction observation/inspection and quality control.
Source of Funding:
Expenditures:
210
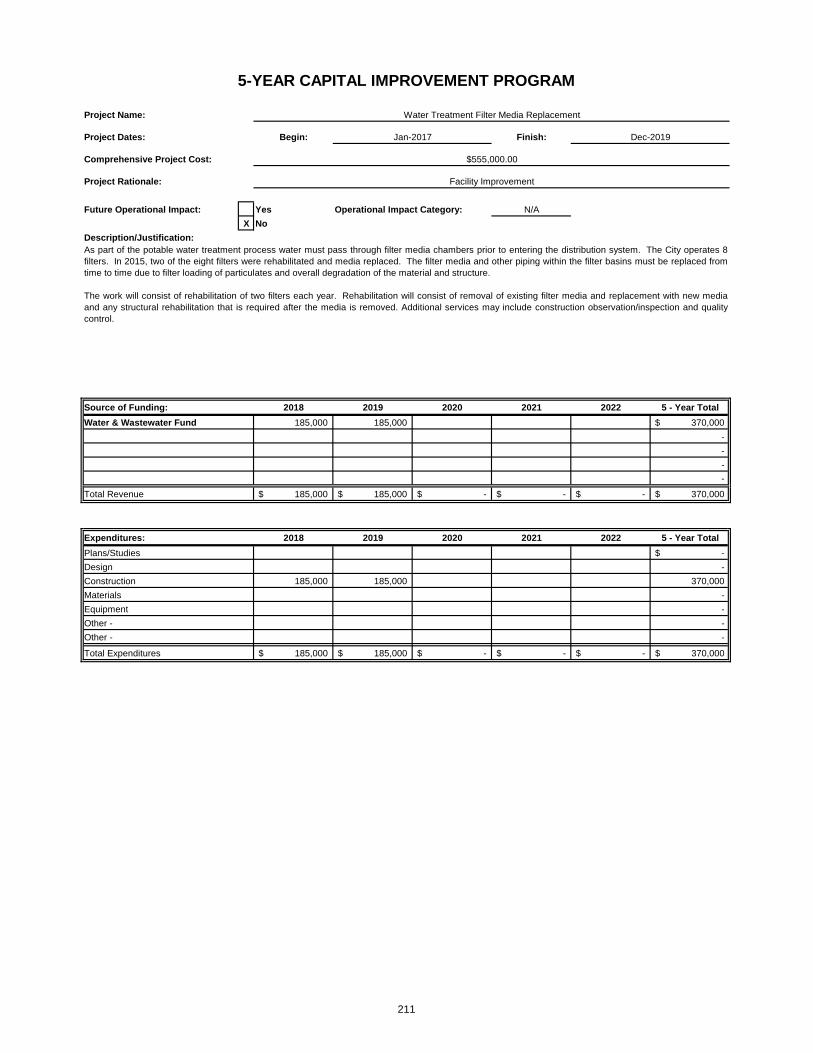
Begin: Finish:
Future Operational Impact: Yes Operational Impact Category: N/ANo
2018 2019 2020 2021 2022 5 - Year TotalWater & Wastewater Fund 185,000 185,000 370,000$
- - - -
Total Revenue 185,000$ 185,000$ -$ -$ -$ 370,000$
2018 2019 2020 2021 2022 5 - Year TotalPlans/Studies -$ Design - Construction 185,000 185,000 370,000 Materials - Equipment - Other - - Other - -
Total Expenditures 185,000$ 185,000$ -$ -$ -$ 370,000$
5-YEAR CAPITAL IMPROVEMENT PROGRAM
Project Name: Water Treatment Filter Media Replacement
Project Dates: Jan-2017 Dec-2019
Expenditures:
Comprehensive Project Cost:
Project Rationale:
XDescription/Justification:As part of the potable water treatment process water must pass through filter media chambers prior to entering the distribution system. The City operates 8filters. In 2015, two of the eight filters were rehabilitated and media replaced. The filter media and other piping within the filter basins must be replaced fromtime to time due to filter loading of particulates and overall degradation of the material and structure.
The work will consist of rehabilitation of two filters each year. Rehabilitation will consist of removal of existing filter media and replacement with new mediaand any structural rehabilitation that is required after the media is removed. Additional services may include construction observation/inspection and qualitycontrol.
Source of Funding:
$555,000.00
Facility Improvement
211
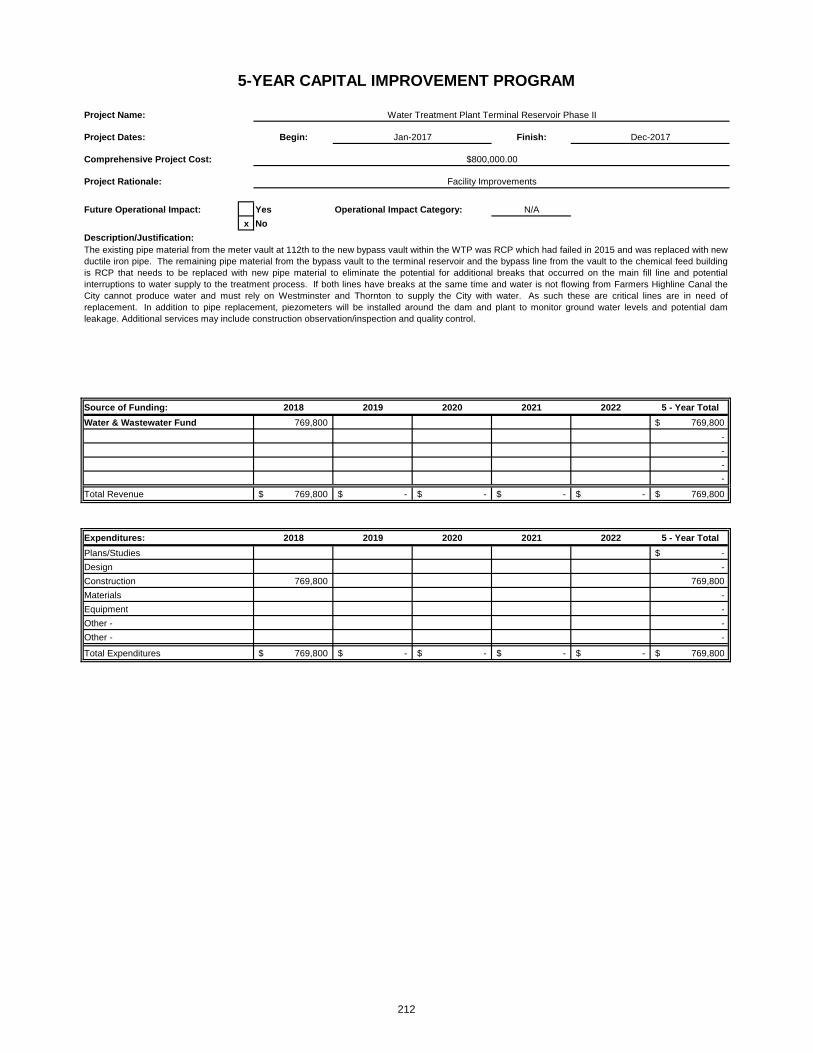
Begin: Finish:
Future Operational Impact: Yes Operational Impact Category: N/ANo
2018 2019 2020 2021 2022 5 - Year TotalWater & Wastewater Fund 769,800 769,800$
- - - -
Total Revenue 769,800$ -$ -$ -$ -$ 769,800$
2018 2019 2020 2021 2022 5 - Year TotalPlans/Studies -$ Design - Construction 769,800 769,800 Materials - Equipment - Other - - Other - -
Total Expenditures 769,800$ -$ -$ -$ -$ 769,800$
5-YEAR CAPITAL IMPROVEMENT PROGRAM
Project Name: Water Treatment Plant Terminal Reservoir Phase II
Project Dates: Jan-2017 Dec-2017
Expenditures:
Comprehensive Project Cost:
Project Rationale:
xDescription/Justification:The existing pipe material from the meter vault at 112th to the new bypass vault within the WTP was RCP which had failed in 2015 and was replaced with newductile iron pipe. The remaining pipe material from the bypass vault to the terminal reservoir and the bypass line from the vault to the chemical feed buildingis RCP that needs to be replaced with new pipe material to eliminate the potential for additional breaks that occurred on the main fill line and potentialinterruptions to water supply to the treatment process. If both lines have breaks at the same time and water is not flowing from Farmers Highline Canal theCity cannot produce water and must rely on Westminster and Thornton to supply the City with water. As such these are critical lines are in need ofreplacement. In addition to pipe replacement, piezometers will be installed around the dam and plant to monitor ground water levels and potential damleakage. Additional services may include construction observation/inspection and quality control.
Source of Funding:
$800,000.00
Facility Improvements
212

Begin: Finish:
Future Operational Impact: Yes Operational Impact Category: N/ANo
2018 2019 2020 2021 2022 5 - Year TotalWater & Wastewater Fund 170,000 170,000 340,000$
- - - -
Total Revenue 170,000$ 170,000$ -$ -$ -$ 340,000$
2018 2019 2020 2021 2022 5 - Year TotalPlans/Studies -$ Design - Construction 170,000 170,000 340,000 Materials - Equipment - Other - - Other - -
Total Expenditures 170,000$ 170,000$ -$ -$ -$ 340,000$
Comprehensive Project Cost: $340,000.00
Project Rationale: Facility Improvements
xDescription/Justification:The clarifier rakes and weirs for the both the east and west clarifier are original to the initial construction of the Northglenn Water Treatment Plant over 35years ago. Due to age of the equipment the coatings protecting the steel has degradation allowing rust and corrosion to form. The rehabilitation of the weirsand rakes will include structural repairs to the corroded areas and recoating of the steel equipment to protect against future corrosion. Additional services mayinclude construction observation/inspection and quality control.
Source of Funding:
Expenditures:
5-YEAR CAPITAL IMPROVEMENT PROGRAM
Project Name: Water Treatment Plant Clarifier Rehabilitation
Project Dates: Jan-2018 Dec-2019
213

Begin: Finish:
Future Operational Impact: Yes Operational Impact Category: N/ANo
2018 2019 2020 2021 2022 5 - Year TotalWater & Wastewater Fund 300,000 2,700,000 3,000,000$
- - - -
Total Revenue 300,000$ 2,700,000$ -$ -$ -$ 3,000,000$
2018 2019 2020 2021 2022 5 - Year TotalPlans/Studies -$ Design 300,000 300,000 Construction 2,700,000 2,700,000 Materials - Equipment - Other - - Other - -
Total Expenditures 300,000$ 2,700,000$ -$ -$ -$ 3,000,000$
Comprehensive Project Cost: $3,000,000.00
Project Rationale: Facility Improvement
xDescription/Justification:With the improvements in rapid mixing and flocculation completed at the Water Treatment Plant the City can now evaluate the remaining improvementrecommendations found in the 2009 HDR Water Treatment Plant Master Plan. The next recommendation is modifications to the waste handling systems fromthe filter backwash and clarifier.
HDR recommendations is to keep clarifier sludge separate from backwash water by installation of a new sludge vault that only accepts clarifier sludge.Backwash water would continue to be discharged into both the north and south recycle ponds. Sludge waste from the bottom of the recycle ponds would bewasted to the sewer system and recycle decant would be recycled to the terminal reservoir. In addition to the operation modifications, structural restorationand liner repairs are required to the existing north and south ponds prior to implementation of the operational changes.
With the implementation of these modifications the City will have the opportunity to reuse backwash water back into the treatment process and not completelywaste the water into the sewer system. Additional services may include construction observation/inspection and quality control.
Source of Funding:
Expenditures:
5-YEAR CAPITAL IMPROVEMENT PROGRAM
Project Name: Water Treatment Plant Waste Handling Improvements
Project Dates: Jan-2018 Dec-2019
214

Begin: Finish:
Future Operational Impact: Yes Operational Impact Category: N/ANo
2018 2019 2020 2021 2022 5 - Year TotalWater & Wastewater Fund 180,000 180,000$
- - - -
Total Revenue 180,000$ -$ -$ -$ -$ 180,000$
2018 2019 2020 2021 2022 5 - Year TotalPlans/Studies -$ Design - Construction - Materials - Equipment 180,000 180,000 Other - - Other - -
Total Expenditures 180,000$ -$ -$ -$ -$ 180,000$
Comprehensive Project Cost: $180,000.00
Project Rationale: Facility Improvement
XDescription/Justification:Our laboratory information management system (LIMS) system stores the cities drinking water laboratory data and has a database dating back to 1999. Thecurrent LIMS system is very outdated, is no longer fully supported, has very limited capabilities and is plagued with constant issues. Modern LIMS systemsallow much more flexibility for the staff to use our data to make informed decisions on treatment plant operations and would allow us to pull in data from thewater and wastewater treatment operations labs. Additional services may include construction observation/inspection and quality control.
Source of Funding:
Expenditures:
5-YEAR CAPITAL IMPROVEMENT PROGRAM
Project Name: Laboratory Information Management System (LIMS)
Project Dates: Jan-2018 Dec-2018
215

Begin: Finish:
Future Operational Impact: Yes Operational Impact Category: N/ANo
2018 2019 2020 2021 2022 5 - Year TotalWater & Wastewater Fund 180,000 180,000$
- - - -
Total Revenue -$ -$ 180,000$ -$ -$ 180,000$
2018 2019 2020 2021 2022 5 - Year TotalPlans/Studies -$ Design - Construction 180,000 180,000 Materials - Equipment - Other - - Other - -
Total Expenditures -$ -$ 180,000$ -$ -$ 180,000$
Comprehensive Project Cost: $180,000.00
Project Rationale: Facility Improvement
XDescription/Justification:Filter to waste is needed to allow operators the ability to recycle the filter effluent until water quality leaving the filter matches the turbidity goal before the filteris placed into service. 90% of all particles in the filter run are typically passed through during the first 10-15 minutes of the filter run, allowing this initial slug ofwater to be recycled will improve our finished product. Additional services may include construction observation/inspection and quality control.
Source of Funding:
Expenditures:
5-YEAR CAPITAL IMPROVEMENT PROGRAM
Project Name: Filter to Waste Automations
Project Dates: Jan-2020 Dec-2020
216

Begin: Finish:
Future Operational Impact: Yes Operational Impact Category: N/ANo
2018 2019 2020 2021 2022 5 - Year TotalWater & Wastewater Fund 265,979 250,000 250,000 250,000 250,000 1,265,979$
- - - -
Total Revenue 265,979$ 250,000$ 250,000$ 250,000$ 250,000$ 1,265,979$
2018 2019 2020 2021 2022 5 - Year TotalPlans/Studies -$ Design - Construction 265,979 250,000 250,000 250,000 250,000 1,265,979 Materials - Equipment - Other - - Other - -
Total Expenditures 265,979$ 250,000$ 250,000$ 250,000$ 250,000$ 1,265,979$
XDescription/Justification:
Comprehensive Project Cost: $1,265,979.00 (5 Year Total)
Project Rationale: Maintenance Program
5-YEAR CAPITAL IMPROVEMENT PROGRAM
Project Name: Collection System Rehabilitation Program
Project Dates: Ongoing Ongoing
Rehabilitation of Wastewater Lines throughout the City.
The Wastewater Line Rehabilitation program includes the repair and/or replacement of the aging wastewater pipelines throughout the City. The existingwastewater lines in the collection system are predominately concrete pipe. Wastewater contains high levels of hydrogen sulfide and when exposed to theatmosphere the hydrogen sulfide converts to sulfuric acid. The typical life expectancy of concrete pipe is approximately 100 years, however due to the highlycorrosive nature of wastewater, the life expectancy of concrete pipe in a collection system is reduced to 20 to 50 years. Initially sulfuric acid will remove theouter layer of concrete, exposing the aggregate. If the corrosion is allowed to continue the sulfuric acid will continue to remove concrete until it reaches thesteel. Once the reinforcement or steel in the pipe is exposed, structural failure is eminent. In order to preserve the existing wastewater pipelines and ensurecontinuous wastewater collection, pipes must be repaired or replaced that are beginning to show signs of corrosion. Additional services may includeconstruction observation/inspection and quality control.
Source of Funding:
Expenditures:
217
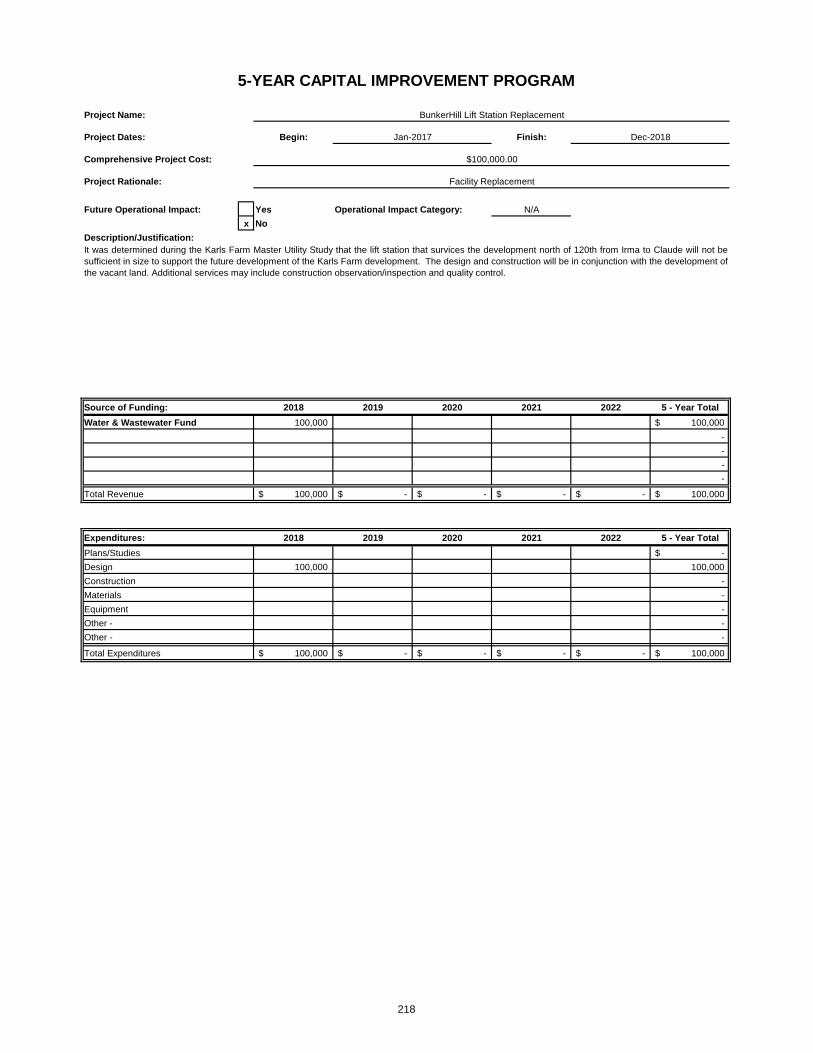
Begin: Finish:
Future Operational Impact: Yes Operational Impact Category: N/ANo
2018 2019 2020 2021 2022 5 - Year TotalWater & Wastewater Fund 100,000 100,000$
- - - -
Total Revenue 100,000$ -$ -$ -$ -$ 100,000$
2018 2019 2020 2021 2022 5 - Year TotalPlans/Studies -$ Design 100,000 100,000 Construction - Materials - Equipment - Other - - Other - -
Total Expenditures 100,000$ -$ -$ -$ -$ 100,000$
5-YEAR CAPITAL IMPROVEMENT PROGRAM
Project Name: BunkerHill Lift Station Replacement
Project Dates: Jan-2017 Dec-2018
Expenditures:
Comprehensive Project Cost:
Project Rationale:
xDescription/Justification:It was determined during the Karls Farm Master Utility Study that the lift station that survices the development north of 120th from Irma to Claude will not besufficient in size to support the future development of the Karls Farm development. The design and construction will be in conjunction with the development ofthe vacant land. Additional services may include construction observation/inspection and quality control.
Source of Funding:
$100,000.00
Facility Replacement
218

Begin: Finish:
Future Operational Impact: Yes Operational Impact Category: N/ANo
2018 2019 2020 2021 2022 5 - Year TotalWater & Wastewater Fund 250,000 250,000 500,000$
- - - -
Total Revenue 250,000$ 250,000$ -$ -$ -$ 500,000$
2018 2019 2020 2021 2022 5 - Year TotalPlans/Studies -$ Design - Construction 250,000 250,000 500,000 Materials - Equipment - Other - - Other - -
Total Expenditures 250,000$ 250,000$ -$ -$ -$ 500,000$
XDescription/Justification:
Comprehensive Project Cost: $500,000.00
Project Rationale: Maintenance Program
5-YEAR CAPITAL IMPROVEMENT PROGRAM
Project Name: Lift Station B Facility Rehabilitation
Project Dates: Jan-2018 Dec-2019
Completing facility assessment and rehabilitation of Lift Station B.
Lift Station B is a major component in the sanitary sewer system since it is the second largest lift station in the City's collection system. Completing a facilityassessment would provide recommendation and prioritize necessary improvements to extend the life of the facility. Repairs will be made based on therecommendations of the assessment. Additional services may include construction observation/inspection and quality control.
Source of Funding:
Expenditures:
219

Begin: Finish:
Future Operational Impact: Yes Operational Impact Category: N/ANo
2018 2019 2020 2021 2021 5 - Year TotalWater & Wastewater 3,500,000 25,000,000 28,500,000$
- - - -
Total Revenue -$ 3,500,000$ 25,000,000$ -$ -$ 28,500,000$
2018 2019 2020 2021 2021 5 - Year TotalPlans/Studies -$ Design 3,500,000 3,500,000 Construction 25,000,000 25,000,000 Materials - Equipment - Other - - Other - -
Total Expenditures -$ 3,500,000$ 25,000,000$ -$ -$ 28,500,000$
5-YEAR CAPITAL IMPROVEMENT PROGRAM
Project Name: Lift Station A and Forcemain Replacement
Project Dates: Jan-2019 Dec-2020
Expenditures:
Comprehensive Project Cost:
Project Rationale:
xDescription/Justification:The main lift station within the City that pumps 99% of all sewer flow north approximately 9 miles needs to be replaced. In addition to the replacement of thelift station the main forcemain is pre-stressed concrete cylindar pipe (PCCP) that is no longer suitable for repair and requires full replacement. A study hasbeen conducted to determine best locations for both the the lift station and forcemain. Additional services may include construction observation/inspection andquality control.
Source of Funding:
$28,500,000.00
Facility Replacement
220

Begin: Finish:
Future Operational Impact: Yes Operational Impact Category: N/ANo
2018 2019 2020 2021 2022 5 - Year TotalWater & Wastewater Fund 500,000 500,000$
- - - -
Total Revenue -$ -$ 500,000$ -$ -$ 500,000$
2018 2019 2020 2021 2022 5 - Year TotalPlans/Studies -$ Design 50,000 50,000 Construction 450,000 450,000 Materials - Equipment - Other - - Other - -
Total Expenditures -$ -$ 500,000$ -$ -$ 500,000$
5-YEAR CAPITAL IMPROVEMENT PROGRAM
Project Name: Lift Station Flow Meters
Project Dates: Jan-2020 Dec-2020
Expenditures:
Comprehensive Project Cost:
Project Rationale:
xDescription/Justification:The City operates 8 lift station throughout the City. Each lift station should have an individual flow meter installed. Currently 5 of the 8 stations do not haveflow meters. The work will include a new vault and meter be installed on the downstream side of each station to accurate measure the flows. Additionalservices may include construction observation/inspection and quality control.
Source of Funding:
$500,000.00
Facility Improvements
221

Begin: Finish:
Future Operational Impact: Yes Operational Impact Category: N/ANo
2018 2019 2020 2021 2022 5 - Year TotalWater & Wastewater Fund 550,000 550,000$
- - - -
Total Revenue 550,000$ -$ -$ -$ -$ 550,000$
2018 2019 2020 2021 2022 5 - Year TotalPlans/Studies -$ Design 50,000 50,000 Construction 500,000 500,000 Materials - Equipment - Other - - Other - -
Total Expenditures 550,000$ -$ -$ -$ -$ 550,000$
Description/Justification:Install an additional Ultra Violet (UV) disinfection bank at the WWTP discharge to meet City discharge permit disinfection requirements at peak hydraulicflows. Also the additional UV disinfection bank will give the WWTP redundancy for the disinfection process. The infrastructure is already in place for the UVbank and installation. Additional services may include construction observation/inspection and quality control.
Source of Funding:
Expenditures:
Facility Improvement
x
5-YEAR CAPITAL IMPROVEMENT PROGRAM
Project Name: WWTP UV Upgrades
Project Dates: Jan-2018 Dec-2018
Comprehensive Project Cost: $550,000.00
Project Rationale:
222

35223
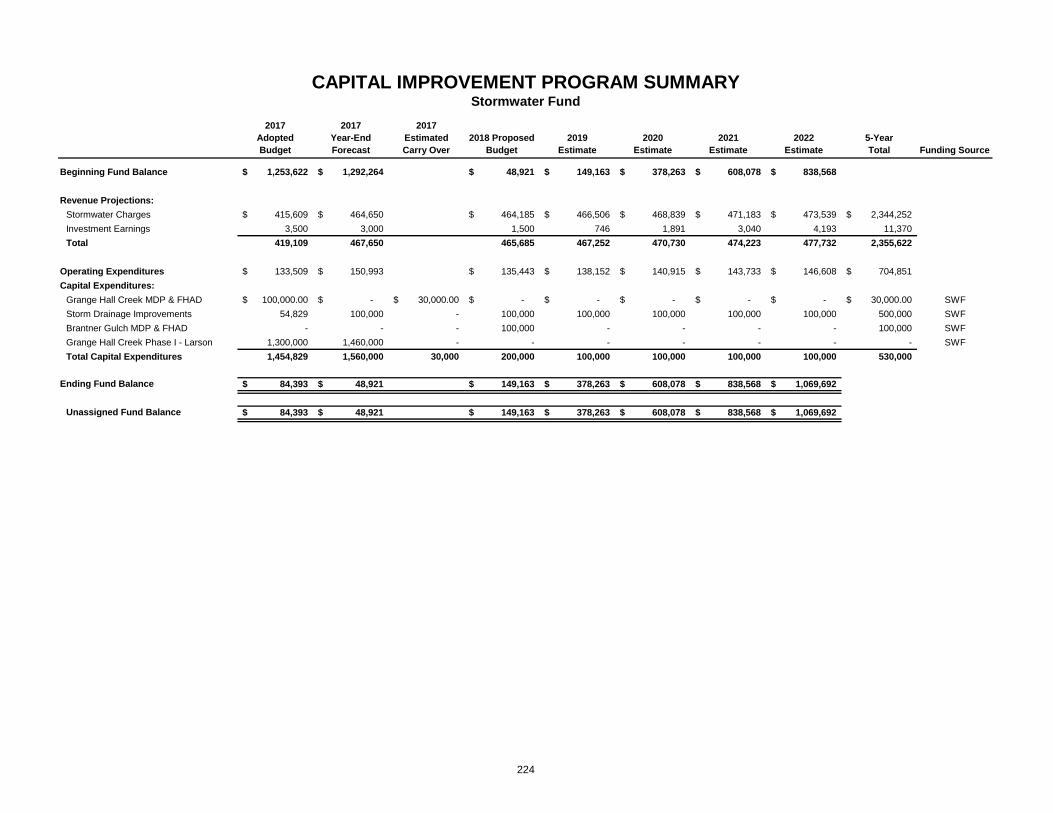
2017AdoptedBudget
2017Year-End Forecast
2017EstimatedCarry Over
2018 Proposed Budget
2019Estimate
2020Estimate
2021Estimate
2022Estimate
5-YearTotal Funding Source
Beginning Fund Balance 1,253,622$ 1,292,264$ 48,921$ 149,163$ 378,263$ 608,078$ 838,568$
Revenue Projections:Stormwater Charges 415,609$ 464,650$ 464,185$ 466,506$ 468,839$ 471,183$ 473,539$ 2,344,252$ Investment Earnings 3,500 3,000 1,500 746 1,891 3,040 4,193 11,370 Total 419,109 467,650 465,685 467,252 470,730 474,223 477,732 2,355,622
Operating Expenditures 133,509$ 150,993$ 135,443$ 138,152$ 140,915$ 143,733$ 146,608$ 704,851$ Capital Expenditures:
Grange Hall Creek MDP & FHAD 100,000.00$ -$ 30,000.00$ -$ -$ -$ -$ -$ 30,000.00$ SWFStorm Drainage Improvements 54,829 100,000 - 100,000 100,000 100,000 100,000 100,000 500,000 SWFBrantner Gulch MDP & FHAD - - - 100,000 - - - - 100,000 SWFGrange Hall Creek Phase I - Larson 1,300,000 1,460,000 - - - - - - - SWFTotal Capital Expenditures 1,454,829 1,560,000 30,000 200,000 100,000 100,000 100,000 100,000 530,000
Ending Fund Balance 84,393$ 48,921$ 149,163$ 378,263$ 608,078$ 838,568$ 1,069,692$
Unassigned Fund Balance 84,393$ 48,921$ 149,163$ 378,263$ 608,078$ 838,568$ 1,069,692$
CAPITAL IMPROVEMENT PROGRAM SUMMARYStormwater Fund
224

Begin: Finish:
Future Operational Impact: Yes Operational Impact Category: N/ANo
2018 2019 2020 2021 2022 5 - Year TotalStormwater Fund 100,000 100,000 100,000 100,000 100,000 500,000$
- - - -
Total Revenue 100,000$ 100,000$ 100,000$ 100,000$ 100,000$ 500,000$
2018 2019 2020 2021 2022 5 - Year TotalPlans/Studies -$ Design - Construction 100,000 100,000 100,000 100,000 100,000 500,000 Materials - Equipment - Other - - Other - -
Total Expenditures 100,000$ 100,000$ 100,000$ 100,000$ 100,000$ 500,000$
Comprehensive Project Cost: $500,000.00 (5 Year Total)
Project Rationale: Necessary Improvements & Preventative Maintenance
XDescription/Justification:Construct or repair manhole, inlet, repair piping or concrete channel locations throughout the city. Usually in conjunction with street repair projects. Routinemaintenance and upgrades must occur to maintain the expected level of service from the storm sewer infrastructure. Additional services may includeconstruction observation/inspection and quality control.
Source of Funding:
Expenditures:
5-YEAR CAPITAL IMPROVEMENT PROGRAM
Project Name: City-Wide Storm Drainage System Improvements
Project Dates: Ongoing Onging
225

Begin: Finish:
Future Operational Impact: Yes Operational Impact Category: N/ANo
2018 2019 2020 2021 2022 5 - Year TotalStormwater Fund 100,000 100,000$
- - - -
Total Revenue 100,000$ -$ -$ -$ -$ 100,000$
2018 2019 2020 2021 2022 5 - Year TotalPlans/Studies 100,000 100,000$ Design - Construction - Materials - Equipment - Other - - Other - -
Total Expenditures 100,000$ -$ -$ -$ -$ 100,000$
Comprehensive Project Cost: $100,000.00
Project Rationale: FEMA Mapping Updates
XDescription/Justification:In conjunction with the Urban Drainage & Flood Control District, Thornton and Adams County we would update the entire Brantner Gulch & Tributaries 1983Master Drainage Plan and Flood Hazard Area Delineation to develop documentation for application to FEMA on Letter of Map Revisions (LOMR) for areaswithin the City that should no longer be considered to be in the Floodplain. This would lead to obtaining approval from FEMA for the LOMRs.
Upstream development or storm sewer infrastructure upgrades completed since 1983 (and never formally documented and accepted by FEMA) havepositively impacted areas within the City that previously were mapped by FEMA as being within the 100-year floodplain. Removal of these areas from theofficial FEMA mapping would allow the property owners affected to potentially reduce or cease paying for flood insurance and reduce the City’s liabilities underthe National Flood Insurance Program. This action was suggested in the City-Wide Drainage Master Plan Update.
Source of Funding:
Expenditures:
5-YEAR CAPITAL IMPROVEMENT PROGRAM
Project Name: Brantner Gulch and Tributaries Master Drainage Plan Update & Flood Hazard Area Delineation
Project Dates: Jan-2018 Dec-2018
226
Financial Policies
The following policies were developed to provide guidance to the City of Northglenn regarding financial matters. The City’s intent is to support a sound and efficient financial management system which best utilizes available resources and provides an acceptable level of service to the citizens of Northglenn. The following statements are not intended to restrict the City Council’s authority when determining service requirements or the activities of the City. The 2018 budget for the City of Northglenn was prepared based on these policies where applicable. Financial Goals Financial goals are broad, fairly timeless statements of the financial position the City seeks to attain. The financial goals for the City of Northglenn are:
• To be a fiscally responsible City Government.
• To have adequate financial reserves for uncertain economic times.
• To invest to preserve or enhance our City facilities, buildings and infrastructure.
• To provide services in the most cost-effective manner. Financial Policies Financial policies support the financial goals. They allow the City Council to view their present approach to financial management from an overall, long-range vantage point. They are general statements that guide decision-making in specific situations to ensure that a decision will contribute to the attainment of the financial goals. Federal and state laws, rules and regulations, the City Charter, and generally accepted accounting principles (GAAP) promulgated by the Governmental Accounting Standards Board (GASB) and the Government Finance Officers Association of the United States and Canada (GFOA) govern and guide the City of Northglenn’s financial policies and processes. Budget Policies Sound financial practices and the desire to continue to be a fiscally responsible city government dictates that budgets be balanced, constantly monitored, and responsive to changes in service demands. With these concepts in mind, the City of Northglenn has adopted the following budget policy statements:
• The City will adopt an annual budget that contains operating budgets for all funds.
• Annual operating budgets will be adopted on a balanced basis, where current operating revenues (estimated revenues) are used to fund ongoing operating expenditures/expenses (appropriations). Nothing in this policy shall prohibit the use of operating revenues for capital expenditures/expenses.
• Unreserved and undesignated fund balance may be appropriated as part of the adopted budget to fund capital, one-time emergency expenditures/expenses, or one-time operating costs. Unreserved and undesignated fund balance should not be used to fund ongoing operating expenditures/expenses in the adopted budget.
• One-time revenues that are not required by law or agreement to be expended for a particular purpose will only be used to fund capital, emergency expenditures/expenses, or one-time operating costs in the adopted budget. Examples of one-time revenues include,
227
but are not limit to, proceeds from the sale of property or other major assets, governmental grants that are not regularly received and are unlikely to recur on a regular basis, major gifts or donations, and major insurance recoveries.
• Reservation and designation of fund balance will be estimated in the adopted budget for amounts of fund equity legally restricted or otherwise not available for appropriation, such as the 3% reserve requirement for TABOR.
• The City’s fiscal year is the calendar year and its budget calendar shall be as provided for in Article VIII of the Charter of the City of Northglenn, Section 8.1 through 8.13.
Operating Position Policies Operating position refers to the City’s ability to balance its budget on a current basis, maintain reserves for emergencies, and maintain sufficient cash to pay its bills on a timely basis. The City of Northglenn operating position policy requires that:
• The City will pay all current operating expenditures with current operating revenues. Ongoing operating costs will not be financed from fund balance.
• City staff shall prepare financial reports of the financial position and results of operating for the major funds of the City or any other fund requested by the City Council. The reports will contain the revenue and expenditures of the funds with an analysis of the results for the end of each month except for the month of January.
Revenue Policies Revenues determine the capacity of a local government to provide services. Under ideal conditions, revenues would grow at a rate equal to or greater than expenditures. To ensure that our revenues are balanced and capable of supporting our desired levels of services, the City of Northglenn has adopted the following revenue policy statements:
• A process to review diversified and stable revenues will be maintained to shelter the City from short-run fluctuations in any one revenue source.
• Each year and whenever appropriate, existing revenues will be re-examined and possible new sources of revenues will be explored to ensure that the City is maximizing its revenue potential.
• The City will strive to be informed and aware of all grants and other aid shall be carefully examined for matching requirements (dollar and level-of-effort) and restrictive covenants, to ensure that participation in such grants will be beneficial and cost-effective.
• Each year and whenever appropriate, intergovernmental revenues will be reviewed to determine their short and long-term stability, to minimize the impact of any adverse changes. Intergovernmental revenues shall be used as legally prescribed or otherwise set forth by policy.
• One-time revenues will be used for capital improvements, one-time expenditures or as legally restricted to a specific purpose.
• The City will carefully and routinely monitor any amounts due. An assertive collection of all receivables will be followed.
228
• Proprietary funds will generate revenue sufficient to support the costs of their services and to remain in compliance with debt covenants or lease agreements.
• Revenue forecasts shall be conservative, using generally accepted forecasting techniques and appropriate data.
• Each year and whenever appropriate, the City will review its schedule of fees. Expenditure/Expense Policies Expenditure/expenses are a rough measure of a local government’s service output. While many expenditures/expenses can be easily controlled, emergencies, unfounded mandates, and unanticipated service demands may strain the City’s ability to maintain a balanced budget. To ensure the proper control of expenditures/expenses and provide for a quick and effective response to adverse financial situations, the City of Northglenn has adopted the following expenditure/expense policy statements:
• Expenditures/expenses and purchase commitments will be made in a form and process that is legal, appropriate, funded, authorized, and sufficiently documented.
• Expenditures/expenses and purchase commitments will be recorded in an accurate and timely fashion.
• Encumbrances will be used in the City to properly show the commitment of funds against appropriations.
• The balances in appropriation accounts and programs will be monitored regularly to ensure that the total of expenditures/expenses and purchase commitments in any account do not exceed the authorized budget for that program.
• Requests for competitive bids, proposals, formal, and informal quotes, and other methods of seeking and encouraging vendor competition will be obtained as required by law or otherwise established by the City Council or City Manager.
• The City of Northglenn will maintain an effective risk management program that provides adequate coverage, minimizes losses and reduces costs.
• Appropriations for all operating funds shall lapse at the close of the fiscal year to the extent that they shall not have been expended or encumbered.
• Due to the multi-year nature of many capital improvement projects budget appropriations for the Capital Improvement Funds will continue through project completion and shall not lapse at year end. City of Northglenn Municipal Code Section 5-8-11(a).
• A contingency amount proposed by the City Manager and approved by the City Council may be proposed when the budget is adopted. This contingency will be used to provide for expenditures that were unknown or could not have been reasonably estimated at the time of preparation of the budget.
Capital Expenditure/Expense Policy Capital outlay is defined as the purchase of any tangible product which has a cost equal to, or greater than $5,000 and having a useful life in excess of one year.
229

• The cost of commissions, deliver, setup, and or accessories should be included in the final cost of the capital asset.
• All capital assets shall be recorded and tracked via a perpetual inventory system. The City will perform a physical inventory of its tangible capital assets, either simultaneously or on a rotating basis, so that all of the assets are physically accounted for at least once every three years.
• The City will develop capital asset replacement and maintenance schedules in accordance with accepted professional standards and best practices. The schedules will be utilized to commit adequate funding of re-investment in the City’s machinery, facilities, and infrastructure so as to prevent the deferment of required ongoing maintenance and replacement.
Capital Improvement Projects (CIP) Policies A capital improvement is defined as a non-recurring expenditure in association with the acquisition, construction, or physical improvement of land, buildings, facilities, or infrastructure, whereby such expenditure results in the creation of a new asset or the extension of an existing asset’s useful life, value, and/or operational capacity. The cost of the capital improvement is added to the basis of the asset and depreciated over time, in contrast to repairs and maintenance expenditures which are recorded as operating costs in the period in which they occur. The City of Northglenn will prepare a five-year CIP for all funds starting with the current year.
• The program shall include all projects that meet the definition of a CIP project.
• The program shall include the total estimated cost of the project and the potential impacts to ongoing operating costs.
• The program will be compiled during annual budget preparation.
• A prioritization matrix shall be used to rank CIP projects. Reserve Policies
• Reserves are used to buffer the City from downturns in the economy and to provide an additional source of accumulated funding for major capital improvement projects or redevelopment.
• When economic times are prosperous the City would ideally like to accumulate an unappropriated fund balance of 100% of the current operating budget.
• The unappropriated fund balance in the General Fund will not be allowed to fall below 25% of the current year General Fund operating budget.
• The difference between the 100% ceiling and the 25% floor may be used to: o Provide reserves for economic uncertainty o Provide a source of funds for major capital improvement undertakings and/or
redevelopment programs.
• Assignments, commitments, or restrictions will be established for anticipated future needs when appropriate to act as a savings account whereby specific future provisions have been identified and aid in the management of cash flows and financial planning.
230

Cash Management and Investment Policies
• The City of Northglenn shall use pooled city cash to invest in United States government, corporate, and money market instruments, assuming investments meet city standards for investment quality. Criteria for selecting investments, using the prudent investor rule, are safety, liquidity, and yield, in that order of priority.
• Cash and investment proceeds will be structured to utilize all available funds for investment
purposes.
• The City shall invest public funds in a manner that provides preservation of capital, meets daily liquidity needs, diversifies the City’s investments, conforms to all local and state statutes governing the investment of public funds, and generates market rates of return.
Debt Management Policies The City shall maintain a debt policy, which establishes criteria that will protect the City’s financial integrity while providing a funding mechanism to meet the City’s capital needs. The underlying approach of the City is to borrow only for capital improvements that cannot be funded on a pay-as-you-go basis. In some cases, debt can be an effective way to finance major capital improvements. Properly managed debt preserves the City’s credit rating, provides flexibility in current and future operating budgets, and provides long-term assets that maintain or improve our quality of life. To provide for the appropriate issuance and responsible use of debt, the City of Northglenn has adopted the following debt management policy statements:
• Long-term debt will not be issued to finance current operations.
• The maturity of the debt should not exceed 75% of the expected useful life of the resulting asset.
• Certificates of Participation (COPs) should not exceed 12% of the issuing funds total expenditures. Any COP project that generates revenue should have the revenues credited against the total lease payments before calculating the limit.
• General Obligation Bonds (GO) should be limited to projects with an asset life of greater than ten years. The total GO bonds issued should not exceed 5% of the actual taxable value of the property in the City. Limitations on debt shall meet all limits of Article X Section 20 of the Colorado Revised Statutes as interpreted by the City Attorney.
• Sales tax bonds or notes should be no greater than 15% of the revenues of the fund supporting the debt or lease unless it is a new tax that has been approved and dedicated by the voters.
• Enterprise revenue bonds, notes, or leases should be no greater than 15% of the revenues of the fund supporting the debt or lease unless it is an approved revenue source that is dedicated by the City Council or the voters to repayment of the debt.
• Each annual operating budget will include the full appropriation for repayment of the principal and interest due that year on each debt or lease issue.
• Debt limits established by law and policy will be calculated at least once each year, and whenever otherwise requested or appropriate.
• Good communications will be maintained with bond rating agencies, bond counsel, banks, financial advisors and other involved in debt issuance and management.
231
• The City’s comprehensive annual financial reports and official statements will reflect our
commitment to full and open disclosure concerning our debt. Periodic Review The Comprehensive Financial Policy Document and each of the policies contained within shall be reviewed by the City Council during even numbered years. The policy has been written to be flexible and easily amended to deal with the style of the times.
232
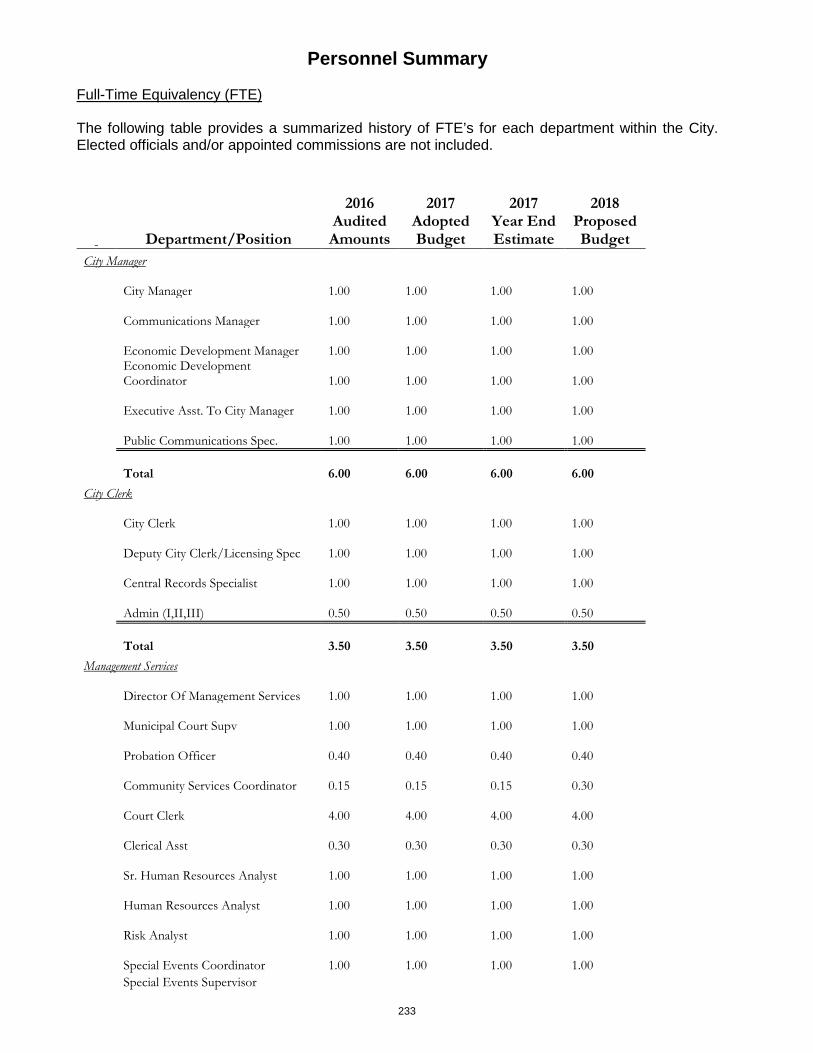
Personnel Summary
Full-Time Equivalency (FTE) The following table provides a summarized history of FTE’s for each department within the City. Elected officials and/or appointed commissions are not included.
Department/Position
2016 Audited Amounts
2017 Adopted Budget
2017 Year End Estimate
2018 Proposed Budget
City Manager
City Manager
1.00
1.00
1.00
1.00
Communications Manager
1.00
1.00
1.00
1.00
Economic Development Manager
1.00
1.00
1.00
1.00
Economic Development Coordinator
1.00
1.00
1.00
1.00
Executive Asst. To City Manager
1.00
1.00
1.00
1.00
Public Communications Spec.
1.00
1.00
1.00
1.00
Total
6.00
6.00
6.00
6.00
City Clerk
City Clerk
1.00
1.00
1.00
1.00
Deputy City Clerk/Licensing Spec
1.00
1.00
1.00
1.00
Central Records Specialist
1.00
1.00
1.00
1.00
Admin (I,II,III)
0.50
0.50
0.50
0.50
Total
3.50
3.50
3.50
3.50
Management Services
Director Of Management Services
1.00
1.00
1.00
1.00
Municipal Court Supv
1.00
1.00
1.00
1.00
Probation Officer
0.40
0.40
0.40
0.40
Community Services Coordinator
0.15
0.15
0.15
0.30
Court Clerk
4.00
4.00
4.00
4.00
Clerical Asst
0.30
0.30
0.30
0.30
Sr. Human Resources Analyst
1.00
1.00
1.00
1.00
Human Resources Analyst
1.00
1.00
1.00
1.00
Risk Analyst
1.00
1.00
1.00
1.00
Special Events Coordinator
1.00
1.00
1.00
1.00
Special Events Supervisor
233

1.00 1.00 1.00 1.00
Community Outreach Coord
1.00
1.00
1.00
1.00
Human Resources Technician
1.00
1.00
1.00
1.00
Custodian
1.80
1.80
1.80
1.80
Total
15.65
15.65
15.65
15.80
Technology
Director Of Technology
1.00
1.00
1.00
1.00
Software Engineer
1.00
1.00
1.00
1.00
Sr. Network Administrator
1.00
1.00
1.00
1.00
Criminal Information Sys Coord
1.00
1.00
1.00
1.00
IT Resource Coordinator
1.00
1.00
1.00
1.00
Technical Support Specialist II
1.00
1.00
1.00
1.00
Total
6.00
6.00
6.00
6.00
Finance
Director Of Finance
1.00
1.00
1.00
1.00
Controller/Acct Manager
1.00
1.00
1.00
1.00
Revenue Supervisor
1.00
1.00
1.00
1.00
Accountant II
1.00
1.00
1.00
1.00
Sales Tax Auditor II
1.00
1.00
1.00
1.00
Accounting Specialist
3.00
3.00
3.00
3.00
Sales Tax Specialist
1.00
1.00
1.00
1.00
Fiss Customer Service Representative
1.60
1.60
1.60
1.60
Sales Tax Manager
1.00
1.00
1.00
1.00
Total
11.60
11.60
11.60
11.60
Planning & Development
Director Of Planning & Development
1.00
1.00
1.00
1.00
Planning Manager
1.00
1.00
1.00
1.00
Senior Planner
2.00
2.00
2.00
2.00
Planner (Tech, I, II)
1.00
1.00
1.00
1.00
Neighborhood Services Supervisor
1.00
1.00
1.00
1.00
Neighborhood Services Officer
5.00
5.00
5.00
5.00
Admin (I,II,III)
1.00
1.00
1.00
1.00
234

Total
12.00
12.00
12.00
12.00
Parks, Recreation, & Culture
Director Of Parks And Recreation
1.00
1.00
1.00
1.00
Foreman - Parks
1.00
1.00
1.00
1.00
Parks Project Coordinator
1.00
1.00
1.00
1.00
Recreation Programs Supv.
3.00
3.00
3.00
3.00
Parks Maint Worker (I,II,III)
14.00
15.00
15.00
15.00
Customer Solutions Specialist
0.80
0.80
0.80
0.80
Recreation Coordinator
6.05
6.05
6.05
6.05
Theatre Tech
1.00
1.00
1.00
1.00
Admin (I,II,III)
1.00
1.00
1.00
1.00
Aquasize Instructor
0.51
0.51
0.51
0.51
Fitness (certified/special) Instructor
1.02
1.02
1.02
1.02
Weight Training Instructor
0.30
0.30
0.30
0.30
Custodian
2.80
2.80
2.80
2.80
Guest Relations Specialist
4.03
4.03
4.03
4.03
Day Camp Asst Director
0.20
0.20
0.20
0.20
Drop-In Sports Supervisor
1.60
1.60
1.60
1.60
Lifeguard (LGI, WSI)
6.39
6.39
6.39
6.39
Preschool Instructor
1.50
1.50
1.50
1.50
Preschool Aide
0.39
0.39
0.39
0.39
Recreation Assistant
1.00
1.00
1.00
1.00
Day Camp Aide
0.10
0.10
0.10
0.10
Total
48.69
49.69
49.69
49.69
Police
Chief Of Police
1.00
1.00
1.00
1.00
Division Commander
4.00
4.00
4.00
4.00
Sergeant
9.00
9.00
9.00
9.00
Police Officer/Sr. Police Officer
52.00
54.00
54.00
54.00
Crime Analyst/PIO
1.00
1.00
1.00
1.00
Criminalist
1.00
1.00
1.00
1.00
Records Unit Supervisor
1.00
1.00
1.00
1.00
235
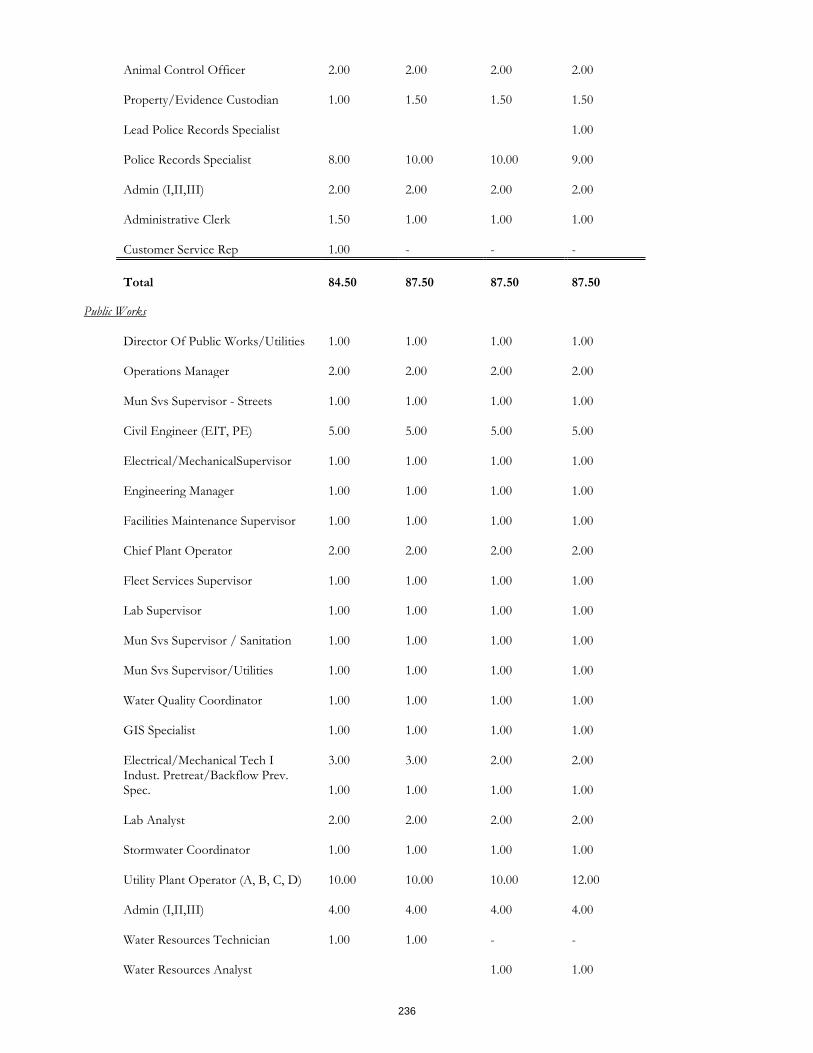
Animal Control Officer
2.00
2.00
2.00
2.00
Property/Evidence Custodian
1.00
1.50
1.50
1.50
Lead Police Records Specialist
1.00
Police Records Specialist
8.00
10.00
10.00
9.00
Admin (I,II,III)
2.00
2.00
2.00
2.00
Administrative Clerk
1.50
1.00
1.00
1.00
Customer Service Rep
1.00
-
-
-
Total
84.50
87.50
87.50
87.50
Public Works
Director Of Public Works/Utilities
1.00
1.00
1.00
1.00
Operations Manager
2.00
2.00
2.00
2.00
Mun Svs Supervisor - Streets
1.00
1.00
1.00
1.00
Civil Engineer (EIT, PE)
5.00
5.00
5.00
5.00
Electrical/MechanicalSupervisor
1.00
1.00
1.00
1.00
Engineering Manager
1.00
1.00
1.00
1.00
Facilities Maintenance Supervisor
1.00
1.00
1.00
1.00
Chief Plant Operator
2.00
2.00
2.00
2.00
Fleet Services Supervisor
1.00
1.00
1.00
1.00
Lab Supervisor
1.00
1.00
1.00
1.00
Mun Svs Supervisor / Sanitation
1.00
1.00
1.00
1.00
Mun Svs Supervisor/Utilities
1.00
1.00
1.00
1.00
Water Quality Coordinator
1.00
1.00
1.00
1.00
GIS Specialist
1.00
1.00
1.00
1.00
Electrical/Mechanical Tech I
3.00
3.00
2.00
2.00
Indust. Pretreat/Backflow Prev. Spec.
1.00
1.00
1.00
1.00
Lab Analyst
2.00
2.00
2.00
2.00
Stormwater Coordinator
1.00
1.00
1.00
1.00
Utility Plant Operator (A, B, C, D)
10.00
10.00
10.00
12.00
Admin (I,II,III)
4.00
4.00
4.00
4.00
Water Resources Technician
1.00
1.00
-
-
Water Resources Analyst
1.00
1.00
236
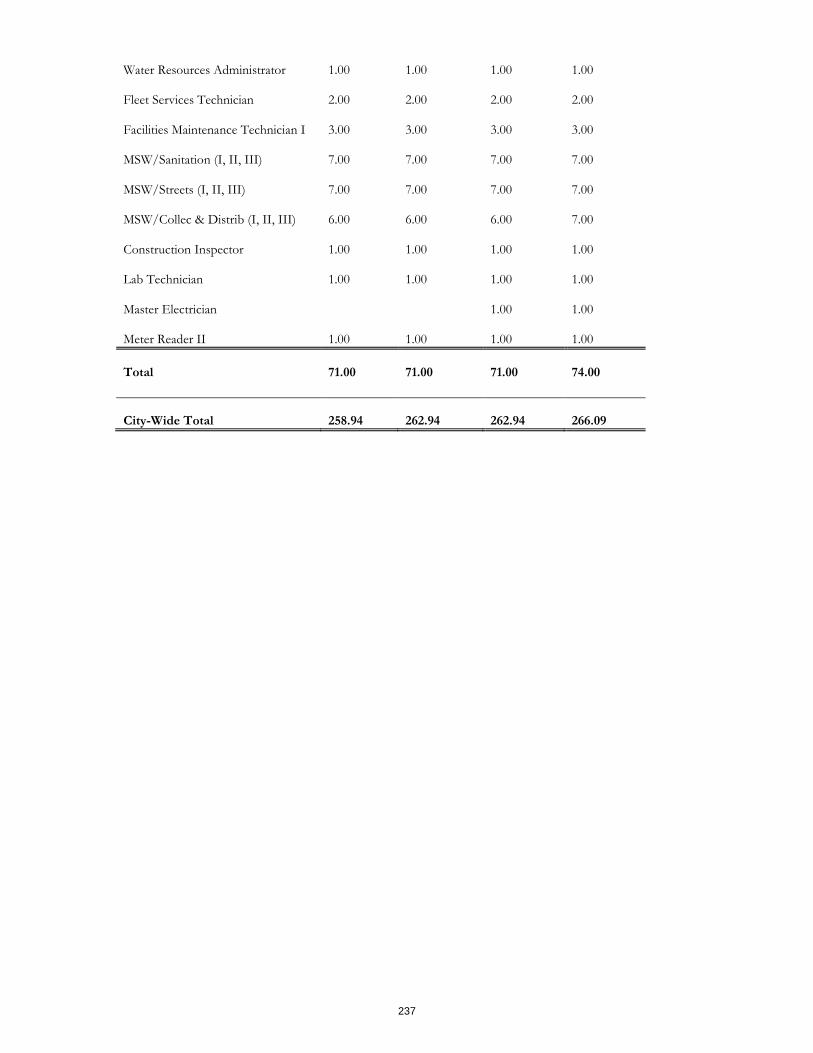
Water Resources Administrator
1.00
1.00
1.00
1.00
Fleet Services Technician
2.00
2.00
2.00
2.00
Facilities Maintenance Technician I
3.00
3.00
3.00
3.00
MSW/Sanitation (I, II, III)
7.00
7.00
7.00
7.00
MSW/Streets (I, II, III)
7.00
7.00
7.00
7.00
MSW/Collec & Distrib (I, II, III)
6.00
6.00
6.00
7.00
Construction Inspector
1.00
1.00
1.00
1.00
Lab Technician
1.00
1.00
1.00
1.00
Master Electrician
1.00
1.00
Meter Reader II
1.00
1.00
1.00
1.00
Total
71.00
71.00
71.00
74.00
City-Wide Total
258.94
262.94
262.94
266.09
237

Glossary of Terms Acronyms CAFR Comprehensive Annual Financial Report CIP Capital Improvement Program CDBG Community Development Block Grant FTE Full-Time Equivalent/Equivalency GAAP Generally Accepted Accounting Principles GFOA Government Finance Officers Association GASB Governmental Accounting Standards Board (GASB) TABOR Taxpayer’s Bill of Rights Definitions Abatement and Refunds A complete or partial cancellation of a levy. Accommodation Tax The City levies a 5.0% tax on all lodging and accommodations provided for a period of less than 30 consecutive days. Accounting Period A period at the end of which and for which financial statements are prepared. Accounting System The total structure of records and procedures which discover, record, classify, summarize, and report information on the financial position and results of operations of a government or any of its funds, balanced account groups, or organizational components. Accounts Payable Amounts owed to persons or organizations for goods and services received by the City but not yet paid for. Accounts Receivable Amounts owed from persons or organizations for goods and services furnished by the City but not yet paid for. Accrual Basis of Accounting The method of accounting under which revenues are recorded when they are earned and become measurable (whether or not cash is received at that time) and expenditures are recorded when goods and services are received (whether or not cash disbursements are made at that time or not). Accumulated Depreciation Accumulated costs associated with the expiration of the estimated service life of capital assets. Ad Valorem A tax imposed at a rate or percentage of the value of a particular good. Amortization The reduction of debt by payments of principal and interest sufficient to retire the debt by maturity.
238
Appropriation A legal authorization made by the City Council, which permits the City to incur obligations and to make expenditures of resources. Assessed Valuation A valuation set upon real estate or other property by a government as a basis for levying taxes. Assets Resources owned or held by governments which have monetary value. Audit A comprehensive examination of the manner in which the government’s resources were utilized. A financial audit is a review of the accounting system and financial information to determine how government funds were spent and whether expenditures complied with the legislative body’s appropriations. A performance audit consists of a review of how well the government met its stated goals. Balanced Budget A balanced budget is defined as a budget in which proposed expenditures and provisions of contingencies in the budget do not exceed the total estimated revenues including surpluses from prior years. Bond A written promise to pay a sum of money on a specific date at a specific interest rate. The interest payments and the repayment of principal are detailed in a bond ordinance. The most common types of bonds are general obligation and revenue bonds. These are most frequently used for construction of large capital projects, such as buildings, streets, and bridges. Budget A financial plan for a specified period of time (fiscal year) that matches estimated revenues and expenditures with various municipal services. Budget Document The official published statement prepared by the Finance Department that includes all budget information as approved by City Council. It is distributed to the press and the public following approval. Budgetary Basis of Accounting The basis of accounting used to prepare the budget. Budgetary Control The control or management of a governmental unit or enterprise in accordance with an approved budget for the purpose of keeping expenditures within the limitations of available appropriations and available revenues. Capital Assets Assets with an initial value greater than $5,000 and a useful life which exceeds one year (a.k.a. Fixed Assets). Capital Expenditures/Outlay Money spent to add or expand property, facilities, and capital assets with the expectation that they will benefit the organization for a length of time exceeding one year (also see Capital Assets & Capital Projects).
239
Capital Improvement Program (CIP) A plan of proposed capital outlays and the means of financing them for the current fiscal period. Capital Projects Projects, which purchase or construct capital assets which meet or exceed $25,000. Typically, a capital project encompasses a purchase of land and/or the construction of a building, facility, or infrastructure. Capital Projects Fund Established to account for the purchase or construction of major capital facilities that are not financed by proprietary funds or trust funds. Cash Basis of Accounting A basis of accounting in which revenues are recorded when received in cash and expenditures are recorded when cash is disbursed. Component Unit A legally separate organization for which the elected officials of the primary government are financially accountable. In addition, component units can be other organizations for which the nature and significance of their relationship with a primary government are such that exclusion would cause the reporting entity’s financial statements to be misleading or incomplete. Comprehensive Annual Financial Report (CAFR) A government unit’s official annual financial report prepared and published as a matter of public record. Community Development Block Grant (CDBG) A financial grant program offered by the U.S. Department of Housing and Urban Development typically restricted for use in low and moderate income areas. Contingency A budgetary reserve set aside for emergencies or unforeseen expenditures not otherwise budgeted for. Debt Reserves The City’s obligation to pay the principal and interest of all bonds and other debt instruments according to a predetermined payment schedule. Debt Service Fund Established to account for the transfers of resources from other governmental type funds for the payment of principal and interest of general long-term debt. Deficit The excess of liabilities over assets for any fund or organization. Department A major administrative division of the City, which has overall management responsibility for an operation or a group of related operation within a functional area. Depreciation The process of estimating and recording the lost usefulness, expired useful life or diminution of service from a capital asset that cannot or will not be restored by repair and will be replaced. The cost of the capital asset’s lost usefulness is the depreciation or the cost to reserve in order to replace the item at the end of its useful life.
240
Discrete Presentation Method of reporting financial data of component units in a column or columns separate from the financial data of the primary government. Emergency Reserves As defined in Colorado State Statutes in Article X, Section 20, “to use for declared emergencies only, each district shall reserve 3% or more of its fiscal year spending excluding bonded debt service.” Encumbrance The commitment of appropriated funds to purchase an item or service. To encumber funds means to set aside or commit funds for a future expenditure. Enterprise Fund Established to finance and account for the acquisition, operation, and maintenance of governmental facilities and services which are entirely or predominantly self-supported by user fees. All activities necessary to provide such services are accounted for in these funds. TABOR defines an Enterprise Fund as, “A government-owned business authorized to issue its own revenue bonds and receives less than 10% of its annual revenue from other government grants and/or subsidies”. Escrow A deed, bond, money, or a piece of property delivered to a third party (escrow agent) to be delivered by him/her to the grantee only upon the fulfillment of a condition. Excise Tax Selective sales taxes that are levied on specific transactions. They are levied separately from general sales taxes. Expenditure Decrease in net financial resources other than through interfund transfers. Fiduciary Funds Used to account for financial resources held or managed by the governmental entity in a trustee or agent capacity for individuals, private organizations, other governmental entities, and/or other funds. There are two types of fiduciary funds, trust and agency funds. Fiscal Year A 12-month period of time to which the annual operating budget applies and at the end of which a government determines its financial position and the results of its operations. Fixed Assets Assets with a value greater than $5,000 and useful life of several years (a.k.a. Capital Assets). Franchise Fee The City imposes franchise fees on utility companies that provide services within the City limits. This fee grants the company access to public streets and provides easements that enable them to supply and maintain services to City residents. Full-Time Equivalent (FTE) A standard measure of staffing. One FTE is equal to a 2,080 working hours which is the number of hours worked in a year by a full-time employee (40 hours per week x 52 weeks = 2,080 hours).
241
Fund An accounting entity that has a set of self-balancing accounts and that records all financial transactions for specific activities or government functions. Eight commonly used funds in public accounting are the general fund, special revenue funds, debt service funds, capital projects funds, enterprise funds, trust and agency funds, internal service funds, and special assessment funds. Fund Balance Fund balance is the excess of assets over liabilities. A negative fund balance is referred to as a deficit. Fund Type Any one of seven types into which all funds are classified in governmental accounting. The seven fund types are general, special revenue, debt service, capital projects, enterprise, internal service, and trust/agency. General Fund The General Fund is established to account for the revenues and expenditures necessary to carry out basic governmental activities of the City such as public safety, planning, administrative services, etc., which are not required to be accounted for in another fund. General Obligation Bonds Long-term debt backed by the full faith and credit of the issuing government. Generally Accepted Accounting Principles (GAAP) Uniform minimum standards and guidelines for financial accounting and reporting that govern the form and content of financial statements. They encompass the conventions, rules, and procedures necessary to define accepted accounting practice at a particular time. Generally accepted accounting principles are continually evolving as changes occur in the reporting environment. Government Finance Officers Association (GFOA) An organization which administers the Certificate of Achievement program, as well as others to encourage excellence in financial reporting and budgeting by state and local governments. Governmental Accounting Standards Board (GASB) The independent agency established as the official body designated to set accounting and financial reporting standards for state and local governments. Governmental Funds Used to account for general government activities which benefit the public as a whole such as administration, police protection, and maintenance of streets and roads. There are five types of governmental funds: general, special revenue, capital projects, debt service, and permanent funds. Grants Contributions or gifts of cash or other assets from another government to be used or expended for a specified purpose, activity, or facility. Impact Fees Fees imposed to fund expenditures on capital facilities needed to serve new development pursuant to CRS 29-20-104. Highway Users Tax This revenue is State collected, locally shared revenue that is distributed monthly. These funds are collected through gas taxes and motor vehicle registration fees and are earmarked specifically for the construction, maintenance or improvement of streets, roads and highways. These monies are distributed to municipalities based on a formula that includes the number of vehicles registered and
242
the miles of streets in each municipality. Distribution percentages are recalculated every year in July based upon the previous year vehicle registrations and the previous year miles of open and maintained streets. A Local Highway Finance Report must be completed and returned to the Colorado Department of Transportation each year in order to receive a portion of this revenue. Infrastructure Long-lived capital assets that normally are stationary in nature and normally can be preserved for a significantly greater number of years than most capital assets. Interfund Transfers Amounts transferred from one fund to another within a single government entity. Interfund Loans Loans made from one fund to another. Intergovernmental Revenue Revenue received from other governments in the form of grants, entitlements, shared revenues, or payments in lieu of taxes. Internal Service Fund A fund used to account for the financing of goods or services provided by one department or agency to other departments or agencies of a government, or to other governments, on a cost-reimbursement basis. Levy To impose taxes, special assessments, or service charges for the support of governmental activities. Long Term Debt Debt with a maturity of more than one year after the date of issuance. Marijuana Sales Tax The City levies 2.0% tax on retail marijuana sales. The sales tax is restricted for the purpose of maintenance and construction of City facilities and acquisition of water rights. The proceeds are tracked in the Capital Projects Fund. Mill The rate of tax which results in one dollar of taxes on each $1,000 of assessed valuation. Modified Accrual Accounting A basis of accounting in which expenditures are accrued but revenues are accounted for on a cash basis. This accounting technique is a combination of cash and accrual accounting since expenditures are immediately incurred as a liability while revenues are not recorded until they are actually received or are “measurable” and “available for expenditure”. Since this type of accounting basis is a conservative financial approach, it is recommended as the standard for most governmental funds. Operating Budget The portion of the budget that pertains to daily operations that provide basic governmental services. The operating budget contains appropriations for expenditures such as personnel, materials, supplies, capital assets, and debt service. Ordinance A formal legislative enactment by the governing body of a municipality. If it is not in conflict with any higher form of law, it has the full force and effect of law within the boundaries of the municipality.
243

Property Tax Taxes levied against both residential and commercial real property located within the City limits. Taxes are levied in the current year and due in the following year, i.e. 20014 receipts are for taxes levied in 2013. Property taxes are restricted by the “TABOR” Amendment and State Statutes. Currently all property taxes are reported in the General Fund. Proprietary Funds Account for a government’s business-type or commercial activities such as goods or services that are sold to the public, to other governments, or to other departments within the government. There are two types of proprietary funds, enterprise and internal services. Refunding Bonds Bonds issued to retire bonds already outstanding. The refunding bonds may be sold for cash and outstanding bonds redeemed in cash, or the refunding bonds may be exchanged with holders of outstanding bonds. Resolution A special or temporary order of legislative body requiring less legal formality than an ordinance or statute; used by governing boards for taking formal action. Revenue Funds that are received as income. It includes such items as tax payments, fees from specific services, receipts from other governments, fines, forfeitures, grants, and interest earnings. Revenue Bonds Bonds whose principal and interest are payable exclusively from earnings of a public enterprise. Road and Bridge Tax This revenue is a portion of the highway user taxes which are distributed to the counties. The County shares a portion of the taxes it receives to support City roads and bridges within the county. Sales Tax The City levies a 4.0% tax for all local retail sales. Sales taxes on the sale of all non-food items are allocated between funds as follows: General Fund receives 75%, and 25% of the collections (which is equal to a 1% tax rate) have been restricted exclusively for the purposes of increasing the City’s water supply (0.5%) and funding of capital improvement projects (0.5%). The food-related sales tax is restricted for the exclusive purpose of reducing water and sewer capital charges and is made up of a 3% tax. The proceeds are used to pay water/wastewater-related debt service. Special Assessment A compulsory levy made against certain properties to defray part or all of the cost of a specific improvement or service deemed to primarily benefit those properties. Special Revenue Fund Established to account for the proceeds of specific revenue sources (other than special assessments, pension trusts, proprietary fund operations and revenues received for major capital projects) that are legally restricted for specified purposes. GAAP only requires the use of special revenue funds when legally mandated. Specific Ownership Tax The County Department of Motor Vehicles collects specific ownership tax when a vehicle is licensed. This tax is collected based on the value of the vehicle when it was new. This taxable value does not change throughout the life of the vehicle; however the tax rate charged on the taxable value continues to decrease until the vehicle is 10 or more years old at which time the
244
taxes paid are $3.00 per year. The Adams County Treasurer’s Office distributes 29% of this tax to various local districts (including the City) based on their mill levy. Supplemental Appropriation An appropriation by the City Council when there is a need to transfer budgeted and appropriated monies from one fund to another fund or, if during the fiscal year, the governing body or any spending agency of such local government received unanticipated revenue or revenues not assured at the time of the adoption of the budget. Tax A compulsory charge levied by a government to finance services performed for the common benefit. Taxpayer’s Bill of Rights (TABOR) An amendment to the Colorado State Constitution passed by Colorado voters in November 1992 which limits the growth of local government revenues equal to that of the rate of inflation plus local growth (assessed valuation). Tobacco Tax A $0.01 tax is levied by the State of Colorado on each cigarette sold. Approximately 27% of this tax is distributed to municipalities based on the percentage of state sales taxes collected in the jurisdiction compared with the statewide collection. The City receives these taxes on or near the 15th of the month; two months after the vendor collects the taxes. Useful Life An estimation of the period of time over which machinery, equipment, property, facility, or other capital asset will be of value or use to its owner. User Fees Charged to the benefiting party for the direct receipt of a public service. Working Capital The amount of current assets that exceeds current liabilities.
245
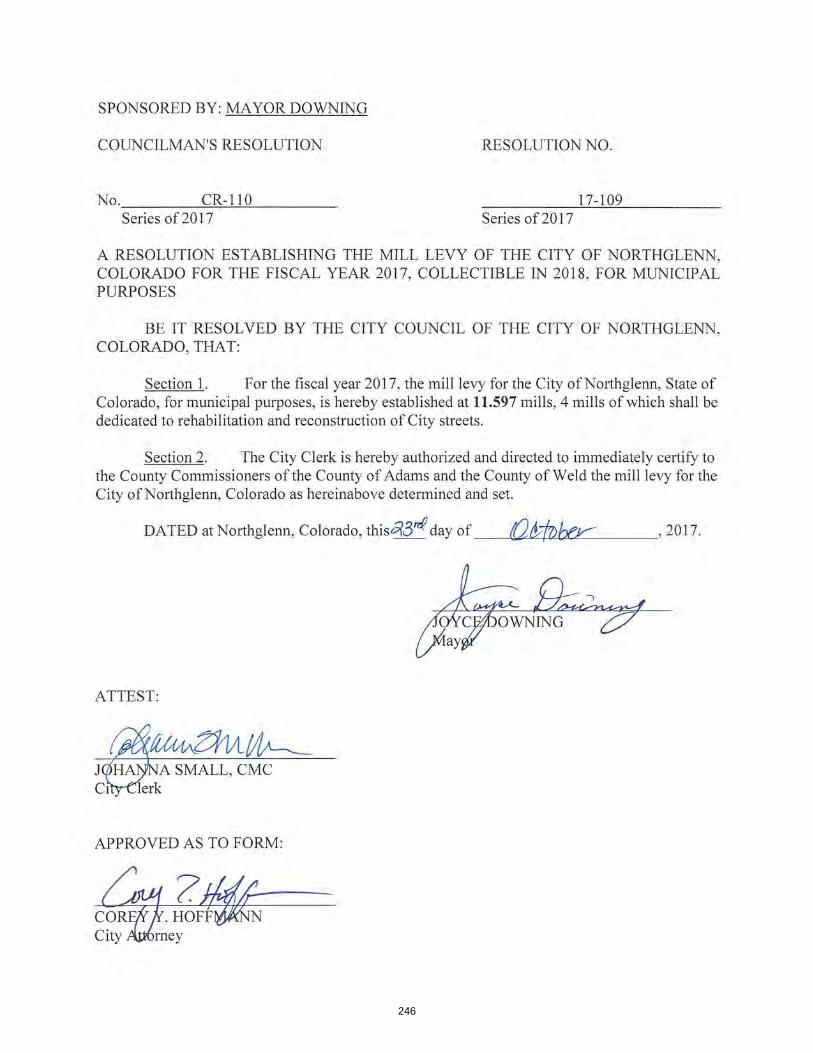
246
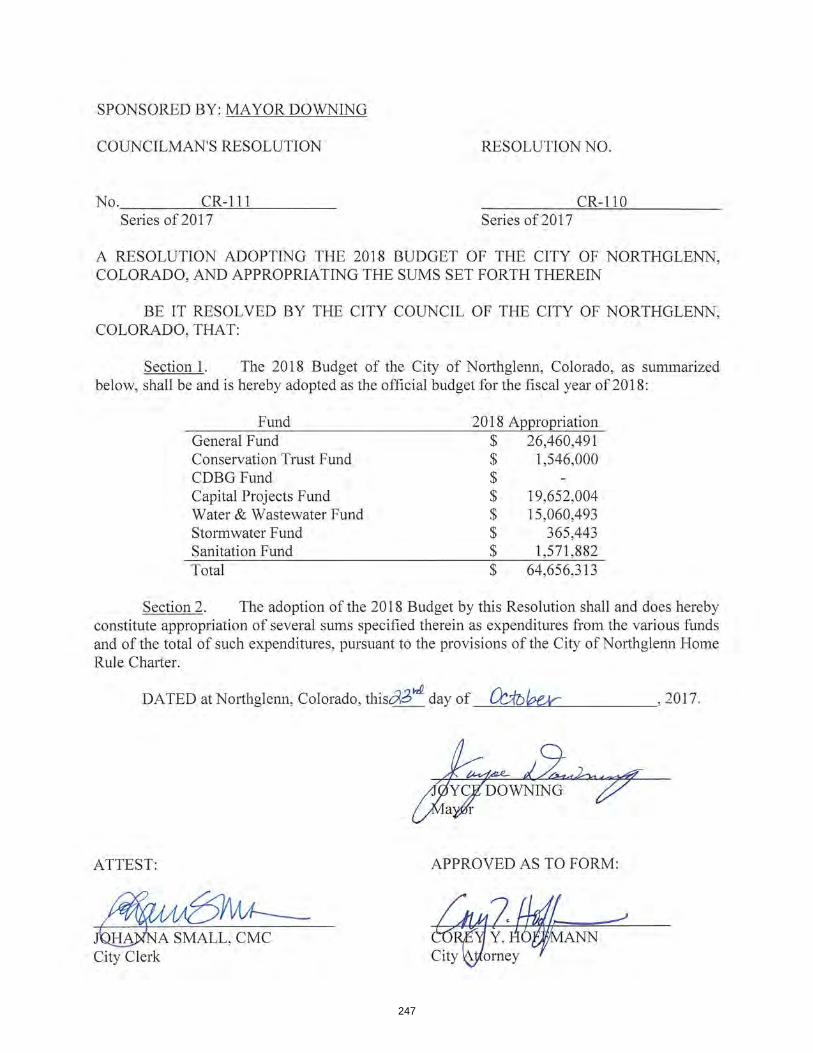
247