Embed Size (px)
Citation preview
1
T
J
t
F
This documen
Jannot, J.E., A
the U.S. west
Fisheries, NW
1NWFSC National MNorthwesFishery R2725 MonSeattle, W
2Pacific SNorthwes2725 MonSeattle, W
nt should be c
A.W. Al-Hum
coast IFQ gro
WFSC Observ
Observer ProMarine Fishert Fisheries Sc
Resource Analntlake Blvd. E
WA 98112
tates Marine t Fisheries Scntlake Blvd. E
WA 98112
cited as follow
maidhi, M.A. B
oundfish fishe
er Program, 2
ogram ries Service cience Centerlysis and MonE.
Fisheries Comcience CenterE.
ws:
Bellman, N.B
ery (2011) an
2725 Montlak
r nitoring Divis
mmission r
B. Riley and J
nd non-IFQ gr
ke Blvd E., Se
sion
. Majewski. 2
roundfish fish
eattle, WA 98
2012. Pacific
heries (2002-2
8112.
halibut bycat
2011). NOAA
2
tch in
A

3
TABLE OF CONTENTS EXECUTIVE SUMMARY ............................................................................................................ 4 INTRODUCTION .......................................................................................................................... 7
West Coast Groundfish Fishery .................................................................................................. 7 Northwest Fisheries Science Center (NWFSC) Groundfish Observer Program ........................ 8 Pacific Halibut Management and Fishery Interaction ................................................................ 9
METHODS ................................................................................................................................... 10 Data sources .............................................................................................................................. 10 Shore-based IFQ Fishery .......................................................................................................... 11
Pacific Halibut Data Collection in the shore-based IFQ Fishery .......................................... 11 Inseason reporting to the Vessel Account System ................................................................ 13 Final Shore-based IFQ Fishery Bycatch Estimation ............................................................. 17 Viability analysis .................................................................................................................. 18 Length Frequencies ............................................................................................................... 20
Non-nearshore Fixed Gear Fishery ........................................................................................... 20 Discard Estimation ................................................................................................................ 21 Discard Mortality Rates ........................................................................................................ 23
Other Fisheries .......................................................................................................................... 24 RESULTS ..................................................................................................................................... 25
IFQ Fishery ............................................................................................................................... 25 Non-nearshore Fixed Gear Fishery ........................................................................................... 26 Other Fisheries .......................................................................................................................... 27
SUMMARY & CONCLUSIONS ................................................................................................. 27 ACKNOWLEDGEMENTS .......................................................................................................... 28 REFERENCES ............................................................................................................................. 28 TABLES ....................................................................................................................................... 30 FIGURES ...................................................................................................................................... 48 APPENDIX A ............................................................................................................................... 53 APPENDIX B ............................................................................................................................... 55 APPENDIX C. .............................................................................................................................. 61 APPENDIX D ............................................................................................................................... 62

4
EXECUTIVE SUMMARY Pacific halibut mortality estimates are provided for 2002 through 2011 from all fishery sectors observed by the Northwest Fishery Science Center Groundfish Observer Program. These included:
IFQ fisheries (2011-present) Limited entry (LE) bottom trawl (2002-2010) Groundfish targeting non-nearshore fixed gear (2002-present) Nearshore fixed gear (2003-present) Pink shrimp trawl (2004-present) California halibut trawl (2002-present) At-sea Pacific hake (2002-present)
Final estimates are shown in Table ES-1, which is synonymous with Table 21 in the report. In 2011, the IFQ non-hake bottom trawl sector constituted the largest source of discard mortality of Pacific halibut among the sectors analyzed, followed by the non-nearshore fixed gear sector. Within the non-nearshore fixed gear sector, the majority of 2011 estimated discard mortality occurred in the limited entry (LE) sablefish endorsed component, which consists of federally permitted vessels fishing sablefish tier quota during the primary season from April through October. Specifically, discard rates were highest on LE sablefish endorsed vessels fishing with longline gear in the area north of Point Chehalis, Washington. A smaller amount of Pacific halibut mortality also occurred on LE non-sablefish endorsed vessels fishing longline gear and open access (OA) vessels targeting non-nearshore groundfish species with hook-&-line gear. The 2011 estimate of the IFQ P. halibut discard mortality was only slightly higher (33.2 mt) than the 2011 non-IFQ non-nearshore fixed gear estimate (Figure ES1). Results from prior years indicate that discard mortality of Pacific halibut increased from 2003 through 2006 and then dropped in 2007. Discard mortality increased gradually during the 2007-09 time period, but dropped again in 2010 (Figure ES-1). Pacific halibut discard in the nearshore fixed gear sector, pink shrimp trawl fishery, California halibut trawl fishery, and at-sea Pacific hake fishery represent a very small component of the overall total Pacific halibut mortality. There are a few significant changes in this (2012) report. First, data are reported from the first year of fishing under IFQ groundfish management (2011). This required revising our methods for estimating Pacific halibut discard, given 100% observer coverage and changes in sampling protocols. We use ratios to estimate the small amount of discard that was not sampled by observers. Note that, in 2011, the LE California halibut sector is covered under the IFQ fishery, whereas the OA California halibut sector is not part of the IFQ fishery. Second, we summarize P. halibut discard mortality by year for the at-sea Pacific hake fishery. The remainder of the 2011 Pacific halibut bycatch estimates were calculated as in the prior report.

5
Table ES1. Pacific halibut discard mortality estimates (metric tons, 2002-2011) for all sectors observed by the NWFSC Groundfish Observer Program. Discard mortality rates were applied in the bottom trawl fisheries (LE and IFQ), IFQ hook-&-line, IFQ pot, and non-IFQ, non-nearshore fixed gear sectors, for which some information regarding survivorship was available.
Table ES2. A comparison of 2011 Pacific halibut IBQ total discard mortality (mortality rates applied; mt, north of 40°10´ N latitude) between the Vessel Account System (VAS) and the NWFSC Observer Program final estimation. The two systems use different approaches (see Methods) to estimate P. halibut mortality.
Source Total IBQ mortality of P. halibut (mt) VAS 32.14
Observer Program 32.99
Shoreside Hake*
LE CA Halibut*
Bottom Trawl
Midwater Trawl*
Hook and Line Pot LE
endorsedLE non-
endorsedOA
2002 344.8 23.2 0.0 - - - 0.0 1.1 392.3
2003 124.4 32.5 0.0 - 0.0 - 0.0 2.6 192.1
2004 133.1 40.2 0.0 - 1.0 0.0 0.8 1.1 216.4
2005 286.5 36.7 0.0 - 2.2 0.1 0.0 2.0 364.2
2006 242.5 107.2 0.0 - 0.5 - 0.0 0.8 458.3
2007 208.8 21.0 0.2 3.6 0.1 0.2 0.1 1.2 256.3
2008 207.8 39.5 0.4 7.1 0.4 0.0 0.3 4.0 298.9
2009 251.1 49.7 0.0 6.4 1.3 0.0 0.0 0.3 358.5
2010 181.0 22.4 0.1 5.3 0.1 0.0 0.0 1.6 232.9
2011 0.03 0.0 31.3 *** 1.0 0.9 21.9 3.4 2.8 2.0 0.2 0.0 0.6 64.1
Total 1980.1 0.03 *** 31.3 0.00 1.0 0.9 394.3 4.2 25.2 7.6 0.5 1.3 15.3 2833.9
*Mortality rate of 100% applied
IFQ Fishery (first year: 2011)CA
halibut*‡
‡ Since 2011, CA Halibut only includes Open Access sector because the Limited Entry sector is covered under the IFQ Fishery.
At-sea Hake*
Total discard mortality
Year LE bottom trawl
Non-nearshore fixed gear Nearshore fixed gear*
Pink shrimp*
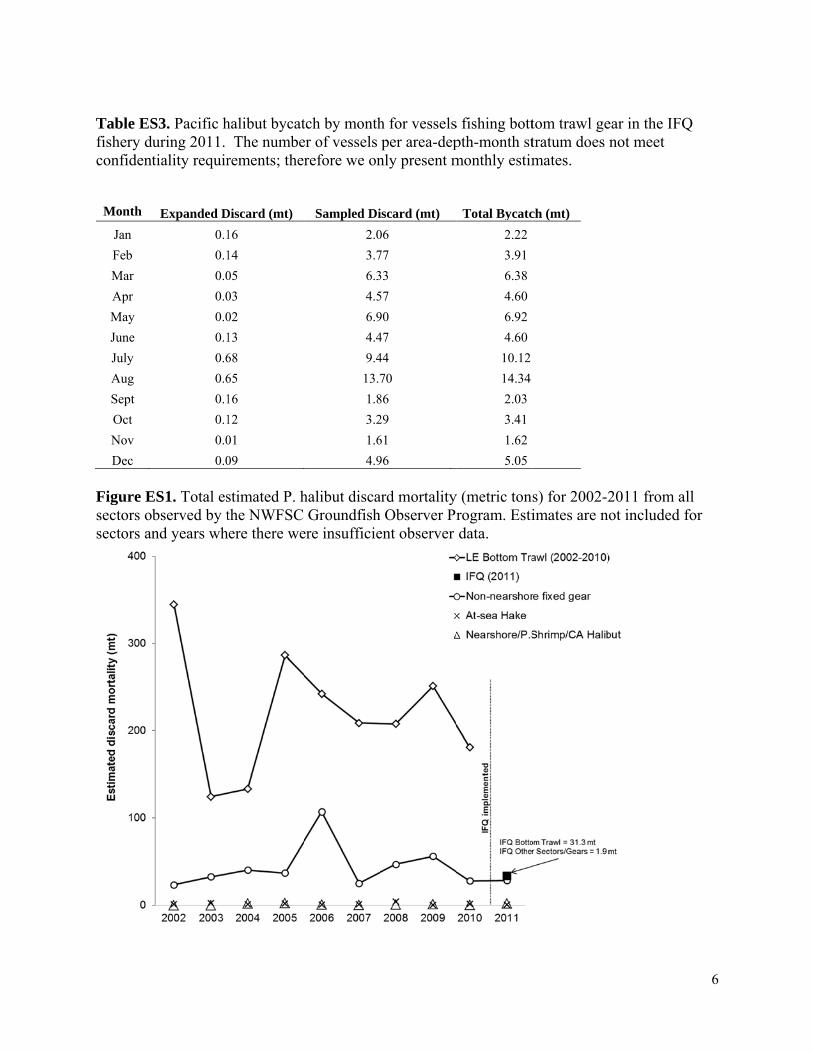
Table ESfishery dconfident
Month
Jan
Feb
Mar
Apr
May
June
July
Aug
Sept
Oct
Nov
Dec Figure Esectors osectors an
S3. Pacific hduring 2011. tiality requir
Expanded D
0.1
0.1
0.0
0.0
0.0
0.1
0.6
0.6
0.1
0.1
0.0
0.0
ES1. Total esbserved by tnd years wh
halibut bycat The numbe
rements; ther
Discard (mt)
16
14
05
03
02
13
68
65
16
12
01
09
stimated P. hthe NWFSC ere there we
tch by monther of vessels refore we on
Sampled Di
2.0
3.7
6.3
4.5
6.9
4.4
9.4
13.7
1.8
3.2
1.6
4.9
halibut discaGroundfish
ere insufficie
h for vesselsper area-dep
nly present m
iscard (mt)
06
77
33
57
90
47
44
70
86
29
61
96
ard mortalityh Observer Prent observer
s fishing bottpth-month stmonthly estim
Total Bycatc
2.22
3.91
6.38
4.60
6.92
4.60
10.12
14.34
2.03
3.41
1.62
5.05
y (metric tonrogram. Estidata.
tom trawl getratum does mates.
ch (mt)
s) for 2002-2imates are n
ear in the IFQnot meet
2011 from aot included f
6
Q
all for

7
INTRODUCTION Pacific halibut (Hippoglossus stenolepis) is found in coastal waters throughout the North Pacific. Off the west coast of the United States, it inhabits continental shelf areas (< 150 fm) from Washington to central California (Clark and Hare 1998). This species has long supported a directed commercial fishery in the US and Canada, but it is also caught as bycatch in other fisheries that target demersal species inhabiting similar depths and seafloor habitat types. The objective of this report is to provide estimates of Pacific halibut bycatch in the U.S. west coast groundfish fishery from 2002-2011.
West Coast Groundfish Fishery
The west coast groundfish fishery is a multi-species fishery that utilizes a variety of gear types. The fishery harvests species designated in the Pacific Coast Groundfish Fishery Management Plan (FMP; PFMC 2011) and is managed by the Pacific Fishery Management Council (PFMC). Over 90 species are listed in the groundfish FMP, including a variety of rockfish, flatfish, roundfish, skates, and sharks. These species are found in both federal (> 5.6 km) and state waters (0-5.6 km). Groundfish are both targeted and caught incidentally by trawl nets, hook-&-line gears, and fish pots. Under the FMP, the groundfish fishery consists of four management components: Limited Entry (LE) – The LE component includes all commercial fishers who hold a federal limited entry permit. The total number of limited entry permits available is capped and permitted vessels are allotted a larger portion of the total allowable catch for commercially desirable species than non-permitted vessels. Open Access (OA) – The OA component includes commercial fishers who are not federally permitted. However, California Department of Fish and Game, Oregon Department of Fish and Wildlife, and Washington Department of Fish and Wildlife have instituted permit programs for certain OA sectors. Recreational – This component includes recreational anglers who target or incidentally catch groundfish species. Tribal – This component includes native tribal commercial fishers in Washington State that have treaty rights to fish groundfish. Estimates of Pacific halibut bycatch from tribal fisheries are not included in this report. These four components can be further subdivided into sectors based on gear type, target species, permits and various regulatory factors. This report includes data from the following sectors:
IFQ fishery (formerly LE bottom trawl and At-Sea Hake, 2002-2010): This sector is subdivided into the following components due to differences in gear type and target strategy:
o Bottom trawl: Bottom trawl nets are used to catch a variety of groundfish species. Catch is delivered to shore-based processors.
8
o Mid-water non-hake trawl: Midwater trawl nets are used to target mid-water non-hake species, primarily yellowtail rockfish. Catch is delivered to shore-based processors.
o Pot: Pot gear is used to target groundfish species, primarily sablefish. Catch is delivered to shore-based processors.
o Hook-and-line: Longlines are primarily used to target groundfish species, mainly sablefish. Catch is delivered to shore-based processors.
o LE California halibut trawl: Bottom trawl nets are used to target California halibut by fishers holding a state California halibut permit and a LE federal trawl groundfish permit. Catch is delivered to shore-based processors.
o Shoreside hake trawl: Midwater trawl nets are used to catch Pacific hake. Catch is delivered to shore-based processors.
o At-sea motherships and catcher-processors: Midwater trawl nets are used to catch Pacific hake. Catcher vessels deliver unsorted catch to a mothership. The catch is sorted and processed aboard the mothership. Catcher-processors catch and process at-sea. This component also includes the at-sea processing component of the tribal sector. The tribal sector must operate within defined boundaries in waters off Northwest Washington. The catch can be delivered to a contracted mothership by catcher vessels for processing or be caught and processed by a contracted catcher-processor.
OA pink shrimp trawl: Trawl nets are used to target pink shrimp. Catch is delivered to shore-based processors.
OA California halibut trawl: Trawl nets are used to target California halibut by fishers holding a state California halibut permit. Catch is delivered to shore-based processors.
LE fixed gear (non-nearshore): This sector is subdivided into two components due to differences in permitting and management:
o LE sablefish endorsed season: Longlines and pots are used to target sablefish. Catch is generally delivered to shore-based processors.
o LE non-sablefish endorsed: Longlines and pots are used to target groundfish, primarily sablefish and thornyheads. Catch is delivered to shore-based processors or sold live.
OA fixed gear (non-nearshore): Fixed gear, including longlines, pots, fishing poles, stick gear, etc. is used to target non-nearshore groundfish, primarily sablefish. Catch is delivered to shore-based processors.
Nearshore fixed gear: A variety of fixed gear, including longlines, pots, fishing poles, stick gear, etc. are used to target nearshore rockfish and other nearshore species managed by state permits in Oregon and California. Catch is delivered to shore-based processors or sold live.
Northwest Fisheries Science Center (NWFSC) Groundfish Observer Program
The NWFSC Groundfish Observer Program observes commercial sectors that target or take groundfish as bycatch. The observer program has two units: the West Coast Groundfish Observer Program (WCGOP) and the At-Sea Hake Observer Program (A-SHOP). The NWFSC Groundfish Observer Program was established in May 2001 by NOAA Fisheries (NMFS) in accordance with the Pacific Fishery Management Plan (50 CFR Part 660) (50 FR
9
20609). This regulation requires all vessels that catch groundfish in the US EEZ from 3-200 miles offshore carry an observer when notified to do so by NMFS or its designated agent. Subsequent state rule-making has extended NMFS’s ability to require vessels fishing in the 0-3 mile state territorial zone to carry observers. The NWFSC Groundfish Observer Program’s goal is to improve estimates of total catch and discard by observing the shore-based and at-sea groundfish sectors along the U.S. west coast. The WCGOP and A-SHOP observe distinct sectors of the groundfish fishery. The WCGOP observes a number of different sectors of the groundfish fishery, including IFQ shore-based sectors, limited entry and open access (OA) fixed gear, and state-permitted nearshore fixed gear sectors. The WCGOP also observes several fisheries that incidentally catch groundfish, including the California halibut trawl and pink shrimp trawl fisheries. The A-SHOP observes the following Pacific hake, at-sea sub-sectors of the IFQ fishery: catcher-processor, mothership, mothership catcher-vessel, and tribal vessels. These components of the at-sea Pacific hake/whiting fishery are summarized for the first time in this report.
Pacific Halibut Management and Fishery Interaction
The International Pacific Halibut Commission (IPHC), a body founded through treaty agreement between the US and Canada, sets the Pacific halibut (P. halibut) annual total allowable catch (TAC) for area 2A. The IPHC refers to U.S. waters off the states of Washington, Oregon and California collectively as Area 2A. The TAC is based on bycatch mortality, which takes into account potential survival after being discarded. Regulations for Area 2A are set by NOAA Fisheries Northwest Regional Office. P. halibut catch in Area 2A is divided between tribal and non-tribal fisheries, between commercial and recreational fisheries, and between recreational fisheries in different states (Washington, Oregon and California). The Pacific Fishery Management Council describes this P. halibut catch division each year in a catch-sharing plan. In some years, the LE fixed gear sablefish endorsed sector is allowed to retain and land P. halibut. In all other West Coast commercial groundfish fishery sectors, P. halibut is prohibited and must be discarded at-sea.
In 2011, the limited entry (LE) bottom trawl sector of the U.S. west coast groundfish fishery began fishing under an Individual Fishing Quota (IFQ) management program. An IFQ is defined as a federal permit under a limited access system to harvest a quantity of fish, representing a portion of the total allowable catch of a fishery that can be received or held for exclusive use by a person (MSA 16 USC 1802(23)).
The implementation of the IFQ management program resulted in changes to the methods used for estimating fishing mortality. These changes include:
Vessels must carry NMFS observers on all IFQ fishing trips.
Observer sampling priorities.
The use of multiple gear types fished under a Federal groundfish permit (trawl or fixed gear).
New programs to monitor landings.

10
IFQ quota tracking system.
Mandatory electronic reporting of shore-based landings.
Limit of one (1) reporting area (IFQ area) fished per trip.
IFQs established for a subset of groundfish managed under the Fishery Management Plan (FMP).
Under the IFQ program, Pacific halibut is managed at the permit level, through Individual Bycatch Quota (IBQ) pounds. An IBQ accounts for bycatch mortality, which can assume some level of survivorship. This is the only species managed under IBQ for the west coast groundfish IFQ fishery. Each federal groundfish permit with a trawl endorsement is allocated IBQ pounds for P. halibut caught north of 40° 10’ N. latitude. Pacific halibut caught south of 40° 10’ N. latitude are not managed as an IFQ program quota. Data collection and reporting for this fishery is described in the “Pacific Halibut Data Collection in the shore-based IFQ Fishery” and “Inseason IBQ Weight Calculations” sections by gear type. The shore-based IFQ fishery includes all IFQ fishery components with the exception of at-sea motherships and catcher-processors. Motherships and catcher-processors have a bycatch quota for Pacific halibut, but it is not accounted for at the permit level. With the exception of the IFQ fishery, P. halibut bycatch mortality is accounted for at the fishery sector level only. P. halibut is regularly caught as bycatch in the LE sablefish endorsed fixed gear, LE non-sablefish endorsed fixed gear, and OA fixed gear sectors.
METHODS
Data sources
Data sources for this analysis include onboard observer data (from the WCGOP and A-SHOP), and landing receipt data (referred to as fish tickets). In 2011, observer data was used as the sole source for discard estimation in this fishery. State-collected trawl logbook data from 2011 are not used in this report. A list of fisheries, coverage priorities and data collection methods employed by WCGOP in each observed fishery can be found in the IFQ and Non-IFQ WCGOP manuals (NWFSC 2012). A-SHOP program information and documentation on data collection methods can be found in the observer manual (NWFSC 2012). The sampling protocol employed by the WCGOP is primarily focused on the discarded portion of catch. To ensure that the recorded weights for the retained portion of the observed catch are accurate, haul-level retained catch weights recorded by observers are adjusted based on trip-level fish ticket records. This process is described in further detail in annual reports produced by the WCGOP (NWFSC 2012) and was conducted prior to the analyses presented in this report. For data processing purposes, species and species groups were defined (NWFSC 2012) based on management. A complete listing of groundfish species is defined in the Groundfish Fishery Management Plan (PFMC 2011).
11
Fish ticket landing receipts are completed by fish-buyers in each port for each delivery of fish by a vessel. Fish tickets are trip-aggregated sales receipts for market categories that may represent single or multiple species. They are issued to fish-buyers by a state agency and must be returned to the agency for processing. Fish ticket and species-composition data are submitted by state agencies to the Pacific Fisheries Information Network (PacFIN) regional database. Annual fish ticket landings data were retrieved from the PacFIN database and subsequently divided into various sectors of the groundfish fishery as indicated in Figure 1.
Shore-based IFQ Fishery
The methods used to report inseason IBQ estimates are separate from those methods used to estimate final 2011 fleet-wide P. halibut mortality. However, in 2011, estimates from the two methods resulted in very similar fleet-wide estimates of P. halibut mortality (Table ES2).
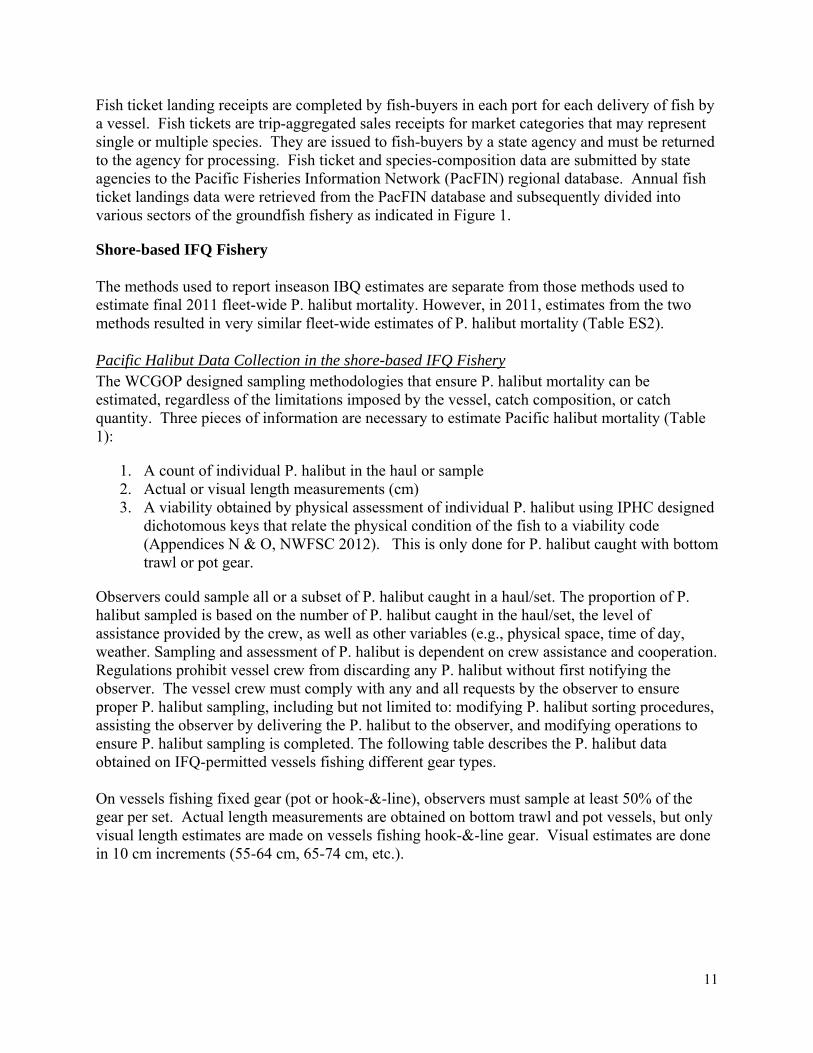
Pacific Halibut Data Collection in the shore-based IFQ Fishery The WCGOP designed sampling methodologies that ensure P. halibut mortality can be estimated, regardless of the limitations imposed by the vessel, catch composition, or catch quantity. Three pieces of information are necessary to estimate Pacific halibut mortality (Table 1):
1. A count of individual P. halibut in the haul or sample 2. Actual or visual length measurements (cm) 3. A viability obtained by physical assessment of individual P. halibut using IPHC designed
dichotomous keys that relate the physical condition of the fish to a viability code (Appendices N & O, NWFSC 2012). This is only done for P. halibut caught with bottom trawl or pot gear.
Observers could sample all or a subset of P. halibut caught in a haul/set. The proportion of P. halibut sampled is based on the number of P. halibut caught in the haul/set, the level of assistance provided by the crew, as well as other variables (e.g., physical space, time of day, weather. Sampling and assessment of P. halibut is dependent on crew assistance and cooperation. Regulations prohibit vessel crew from discarding any P. halibut without first notifying the observer. The vessel crew must comply with any and all requests by the observer to ensure proper P. halibut sampling, including but not limited to: modifying P. halibut sorting procedures, assisting the observer by delivering the P. halibut to the observer, and modifying operations to ensure P. halibut sampling is completed. The following table describes the P. halibut data obtained on IFQ-permitted vessels fishing different gear types. On vessels fishing fixed gear (pot or hook-&-line), observers must sample at least 50% of the gear per set. Actual length measurements are obtained on bottom trawl and pot vessels, but only visual length estimates are made on vessels fishing hook-&-line gear. Visual estimates are done in 10 cm increments (55-64 cm, 65-74 cm, etc.).

12
Table 1. Data collected from Pacific halibut caught on IFQ vessels using different types of gear.
The crew’s cooperation is vital to the observer’s sampling success when hook-&-line fishing. When an observer samples for P. halibut, the crew are not permitted to shake loose or discard any P. halibut before the observer has an opportunity to estimate the fish length, nor can they restrict the observer’s view of the line as it comes out of the water. If requested by the observer, the crew is required to physically hand an individual fish to the observer or slow the gear retrieval. Viability is assessed at the point of release when returned to sea. On vessels using “resuscitation boxes” or other techniques to increase the likelihood of survival, condition sampling is performed prior to the fish being returned to sea. Observations of several condition characteristics are used to assign each fish to one of three viability categories: Excellent, Poor, or Dead (Appendices N & O, NWFSC 2012, Williams and Chen 2004). Observer field estimates of viability for Pacific halibut discarded in the IFQ fishery by vessels fishing bottom trawl or pot gear are used to compute the total estimated mortality of discarded Pacific halibut. Below we refer to estimated mortality of discarded P. halibut, with appropriate mortality rate applied (Tables 2 & 3 or 100%) in the IFQ fishery, north of the 40°10´ N. latitude line as IBQ weight, or simply, IBQ. Viability categories are used to assign mortality rates to P. halibut. Mortality rates for vessels fishing bottom trawl gear are based on mortality data collected by Hoag (1975),who found some survivorship among fish in the dead condition category. Mortality rates for vessels fishing pot gear are based on research conducted by the IPHC. Table 2. Mortality rates used for each of the condition categories (mc) for IFQ bottom trawl vessels (Clark, Hoag 1992)
mc Rate mexc 0.20 mpoor 0.55 mdead 0.90
Table 3. Mortality rates used for each of the condition categories (mc) for IFQ pot gear vessels (IPHC)
mc Rate mexc 0.00 mpoor 1.00 mdead 1.00
Gear Count Length Measurement Viability Bottom trawl all in the haul actual, all or subset yes Pot all in sampled portion actual, all or subset yes Hook -and- line all in sampled portion visual, all or subset no

13
Inseason reporting to the Vessel Account System The Vessel Account System (VAS) is a NOAA, Northwest Regional Office (NWR) database that allows fishers to manage their IFQ quota pounds. On a weekly basis, the WCGOP provided trip-level estimates of discarded P. halibut IBQ to the Pacific States Marine Fisheries Commission (PSMFC). The PSMFC then uploaded the data to the VAS. Occasionally, non-automated (i.e., manual) calculations of P. halibut IBQ were necessary. Manual calculations of P. halibut IBQ occurred as observer program resources allowed and were uploaded directly to the VAS. In 2011, fishers experienced delays in the reporting of some trips to the VAS. The main cause of IBQ reporting delays to the VAS in 2011 was that the observer did not enter data in a timely manner. While the observer program set a requirement that all trips be entered within three days from the end of the trip, contract observer provider logistics and vessel activity prevented this from occurring. Private third-party companies function as contract observer providers in this fishery. Trip information could also be delayed because a manual calculation was required. A manual calculation was triggered when the observer did not collect all the required data or did not sample all the hauls in the trip. Scenarios triggering a manual calculation and the equations used for those calculations are given in Appendix B. Fishers were also concerned that IBQ weights could change throughout the year. This was due to the requirement that IBQ weight be reported to the VAS in “near-real-time”. “Near-real-time” reporting does not allow sufficient time for data quality control. Therefore, as data moved through the quality control process, changes to one or more of the data elements used to calculate IBQ weight could occur. When this happened, the database recalculated the IBQ weight and resent the data in the next weekly PSMFC upload. After the 2011 observer data had completed the QA/QC process and was finalized, the entire WCGOP dataset was reloaded to the VAS to ensure all discard was accounted for accurately.
The WCGOP database calculates IBQ weight at the haul-level when the observer collects all the required data elements. The calculation is dependent on which gear type is fished.
Inseason IBQ Weight Calculations for Bottom Trawl Gear The sampled P. halibut lengths are converted to weight using the IPHC length-weight conversion table (Appendix C). The total weight of P. halibut in the haul is calculated as:
∙
where, for each haul: W = total weight of P. halibut w = sampled weight of P. halibut n = sampled number of P. halibut N = total number of P. halibut
IBQ weight for each haul is then calculated as:

14
∑
∙ ∙
where, for each haul:
c = viability condition category = IBQ weight (mortality rate applied) of P. halibut
= total weight of P. halibut in haul = sampled weight of P. halibut
m = mortality rate (Table 2)
Inseason IBQ Weight Calculations for Pot Gear The sampled P. halibut lengths are converted to weight using the IPHC length-weight conversion table. Observers are not always able to sample 100% of all gear units due to time constraints and logistics, therefore sample weights need to be expanded to the haul/set level. The total weight of P. halibut in the set is calculated as:
∙ ∙
where, for each set: = total weight of P. halibut = sampled weight of P. halibut = sampled number of P. halibut = total number of P. halibut = total number of pots fished = sampled number of pots
IBQ weight for each set is then calculated as:
∑
∙ ∙
where, for each set: c = viability condition category
= IBQ weight (mortality rate applied) of P. halibut = total weight of P. halibut in set = sampled weight of P. halibut = mortality rate (Table 3)
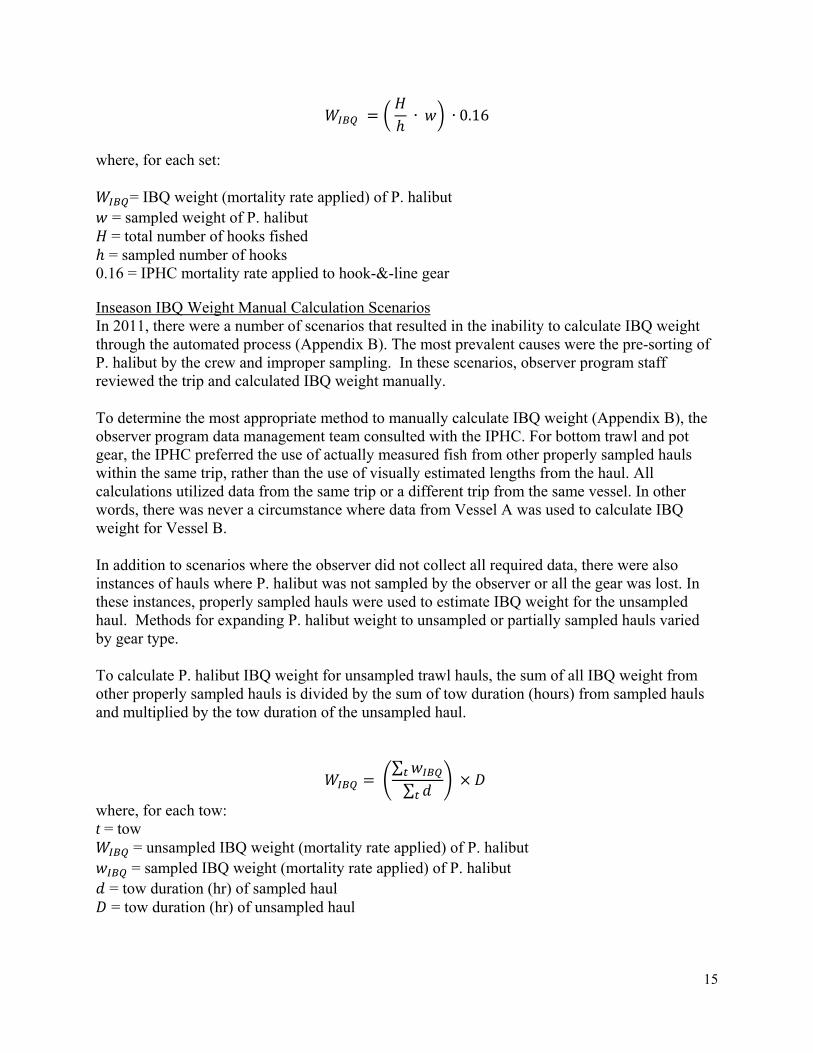
Inseason IBQ Weight Calculations for Hook-&-Line Gear The visual estimates of Pacific halibut length (10 cm increments) are converted to weight using the IPHC length-weight conversion table. Observers are not always able to sample 100% of all gear units due to time constraints and logistics, therefore sample weights need to be expanded to the haul/set level. The total weight of P. halibut in the set is calculated as:
15
∙ ∙ 0.16
where, for each set:
= IBQ weight (mortality rate applied) of P. halibut = sampled weight of P. halibut = total number of hooks fished = sampled number of hooks
0.16 = IPHC mortality rate applied to hook-&-line gear
Inseason IBQ Weight Manual Calculation Scenarios In 2011, there were a number of scenarios that resulted in the inability to calculate IBQ weight through the automated process (Appendix B). The most prevalent causes were the pre-sorting of P. halibut by the crew and improper sampling. In these scenarios, observer program staff reviewed the trip and calculated IBQ weight manually.
To determine the most appropriate method to manually calculate IBQ weight (Appendix B), the observer program data management team consulted with the IPHC. For bottom trawl and pot gear, the IPHC preferred the use of actually measured fish from other properly sampled hauls within the same trip, rather than the use of visually estimated lengths from the haul. All calculations utilized data from the same trip or a different trip from the same vessel. In other words, there was never a circumstance where data from Vessel A was used to calculate IBQ weight for Vessel B.
In addition to scenarios where the observer did not collect all required data, there were also instances of hauls where P. halibut was not sampled by the observer or all the gear was lost. In these instances, properly sampled hauls were used to estimate IBQ weight for the unsampled haul. Methods for expanding P. halibut weight to unsampled or partially sampled hauls varied by gear type.
To calculate P. halibut IBQ weight for unsampled trawl hauls, the sum of all IBQ weight from other properly sampled hauls is divided by the sum of tow duration (hours) from sampled hauls and multiplied by the tow duration of the unsampled haul.
∑∑
where, for each tow: t = tow
= unsampled IBQ weight (mortality rate applied) of P. halibut = sampled IBQ weight (mortality rate applied) of P. halibut
= tow duration (hr) of sampled haul = tow duration (hr) of unsampled haul

16
To calculate P. halibut IBQ weight when trawl gear is lost (i.e., entire net or codend is lost), the sum of all P. halibut expanded species weight from other properly sampled hauls is divided by the sum of tow durations from sampled hauls, multiplied by the tow duration of the unsampled haul. For lost trawl gear, a mortality rate for the “dead” P. halibut viability condition (0.90) is applied.
∑∑
0.90
where, for each tow with lost gear: t = tow
= IBQ weight (mortality rate applied) of unsampled P. halibut = weight of sampled P. halibut = tow duration of sampled haul = tow duration of unsampled haul
0.90 = mortality rate for “dead” P. halibut viability condition for trawl gear
To calculate P. halibut IBQ weight in unsampled fixed gear sets, the sum of all P. halibut IBQ weight from sets with similar properties (i.e., date, depth, target, gear type, area; determined by WCGOP data managers) is divided by the sum of the number of gear units sampled, and the result is multiplied by the total number of gear units fished from the unsampled set.
∑∑
where, for each set: t = set
= unsampled IBQ weight (mortality rate applied) of P. halibut = sampled IBQ weight (mortality rate applied) of P. halibut
= number of sampled gear units (e.g., hooks, pots) = total number of gear units (e.g., hooks, pots) fished in the unsampled set
To calculate P. halibut IBQ weight when fixed gear is lost, the sum of P. halibut weight from the sampled portion of the set, or, if all gear is lost, from sets with similar properties is divided by the sum of units sampled, and the result is multiplied by the total hooks from the unsampled set. For any lost fixed gear, a mortality rate for the “dead” P. halibut viability condition (1.0) is applied.
∑∑
1.0
where, for each set with lost gear: t = set

17
= unsampled IBQ weight (mortality rate applied) of P. halibut = sampled IBQ weight of P. halibut = number of sampled gear units (e.g., hooks, pots) = total number of gear units (e.g., hooks, pots) fished in the unsampled set
1.0 = mortality rate for “dead” P. halibut viability condition for fixed gear
Final Shore-based IFQ Fishery Bycatch Estimation We stratified IFQ Pacific halibut bycatch data based on sector (shoreside non-hake groundfish, shoreside Pacific hake, at-sea Pacific hake, and limited entry California halibut) and gear (bottom trawl, mid-water trawl, pot, hook-&-line). Within the shoreside non-hake groundfish sector, we further stratified using area and depth based on gear type (bottom trawl, pot, hook-&-line). We maintained area and depth strata that were applied to bottom trawl, hook-&-line, and pot gear in previous reports (see Table 4 of this report for specific strata; Heery, Bellman 2010, Jannot, Bellman 2011) because prior work had demonstrated that these variables were correlated with Pacific halibut bycatch (Heery et al. 2010). However, we removed the ‘retained catch of other species’ strata (see Heery et al. 2010) because qualitative information suggested that the incentives of the IFQ system had significantly changed fishing behavior and therefore, the utility of retained species as a stratum will need to be re-evaluated. Observations from IFQ vessels fishing mid-water trawl gear targeting Pacific hake or other mid-water target species were not post-stratified. Similarly, observations of IFQ vessels targeting California halibut with bottom trawl gear were not post-stratified. In addition to the strata described above, we also provide bycatch estimates north and south of the North/South groundfish management line (40°10´ N. lat.) for each sector and gear type.
Despite the 100% observer coverage mandate in 2011, there were some rare occasions (e.g., observer illness) when tows or sets were either only partially sampled, or not sampled. We used ratio estimators to apportion unsampled weight to specific species, including Pacific halibut, within each stratum. To obtain the estimated weight of Pacific halibut ( when the entire haul or set was unsampled, the unsampled weight, summed across unsampled hauls within the stratum, was multiplied by the ratio of the weight of Pacific halibut (summed across fully sampled hauls within a stratum) divided by the total weight of all species in all fully sampled hauls within a stratum:
, , ∑ ,
∑ ,
where, for each stratum: s = stratum, which could include, area, depth, gear, and sector p = unsampled haul f = fully sampled haul
weight of catch estimated weight of P. halibut
= sampled weight of P. halibut

18
The unsampled weight of partially sampled hauls or sets was categorized into weight of non-IFQ species (NIFQ) or IFQ species. Unsampled IFQ species weight was further categorized into IFQ flatfish (IFQFF), IFQ rockfish (IFQRF), IFQ roundfish (IFQRD) and IFQ mixed species (IFQM). IFQM included all 2011 IFQ managed species (see 76 FR 27508 for a listing of IFQ species in 2011). NIFQ included all species encountered that were not designated as an IFQ species in 2011 management. IFQFF included all 2011 IFQ flatfish species managed as a complex under the groundfish FMP. North of the 40°10´ North latitude groundfish management line, Pacific halibut would be included in unsampled IFQFF or IFQM categories. South of the groundfish management line, Pacific halibut would only be included in the unsampled NIFQ category.
To obtain the estimated weight of Pacific halibut ( in partially sampled hauls or sets, the unsampled weight, summed across partially sampled hauls within the stratum, was multiplied by the ratio of the weight of Pacific halibut (summed across fully sampled hauls within a stratum) divided by the weight of all species occurring within a category (NIFQ, IFQFF, IFQM) in all fully sampled hauls within a stratum. Estimated Pacific halibut weight was summed across unsampled categories and then added to the weight of any Pacific halibut that was sampled in the partially sampled hauls:
, , , ∑ ,
∑ , , + ,
where, for each stratum: s = stratum, which could include, area, depth, gear, and sector y = unsampled category (either NIFQ, IFQFF, or IFQM) p = partially sampled haul f = fully sampled haul
weight of catch estimated weight of P. halibut
= sampled weight of P. halibut
Expanded weights of Pacific halibut obtained using the equations above for unsampled or partially sampled hauls were then added to the sampled weight of Pacific halibut (from fully sampled hauls) within each stratum to obtain the total Pacific halibut weight per stratum.
Viability analysis We used observer field estimates of viability for Pacific halibut discarded in the IFQ fishery by vessels fishing bottom trawl or pot gear to compute the total estimated mortality of discarded Pacific halibut by IFQ gear/sector and stratum. To account for the impact of fish size on survivorship, we computed a weighted mortality rate for each condition category. Length measurements associated with each viability record were
19
converted to weight based on the IPHC length-weight relationship:
24.3610921.6 LW
where: L = fork length (cm) W = weight (lbs., head off, eviscerated) A discard mortality rate for each condition category was then computed as the proportion of P. halibut sampled weight in a viability category multiplied by the viability category-specific mortality rate (see Tables 2 & 3 above):
csjccsj PmDMR
where: s = stratum, which could include, area, depth, gear, and sector c = viability condition (Excellent, Poor, Dead) j = year mc = mortality rate P = proportion of sampled P. halibut weight (w) DMR = discard mortality rate
Discard mortality rates for each condition category c and stratum s were then multiplied by gross discard estimates to compute total estimated discard mortality for each of the two gear types:
∙
where: s = stratum, which could include, area, depth, gear, and sector c = viability condition (Excellent, Poor, Dead) j = year F = total estimated discard mortality B = estimated bycatch Viability data are collected from only a subsample of the Pacific halibut that observers encounter. Based on previous evaluations by Wallace and Hastie (2009), we expect that survivorship of Pacific halibut in bottom trawl tows are most directly affected by the length of the tow and the amount of catch that fills the net. These variables are not part of the bycatch ratio stratification process (above), and their use in stratifying viability data would make it difficult to then apply discard mortality rates to initial gross estimates of bycatch. We found that tow duration was directly related to depth, one of the variables used to stratify discard ratios and initial gross discard estimates for bottom trawl gear. Because depth and tow duration appeared to co-vary, we used depth and area to stratify IFQ viability data collected from bottom trawl gear. For IFQ viability data collected from pot gear, only area is used to stratify the data.

20
Final estimates of Pacific halibut bycatch and discard mortality are presented in the context of the estimated mortality of legal-sized halibut. This was computed by applying the proportion of sampled P. halibut weight in each depth stratum that was from legal-sized fish (82 cm or larger) to initial estimates. Viabilities were then applied to gross legal-sized discard estimates in the same manner as described above.
Length Frequencies The length frequency distribution for Pacific halibut in the 2011 IFQ fishery is provided in Table 9. Pacific halibut pose unique challenges for observer sampling. Observers typically measure the length of Pacific halibut and then convert the measurement to weight using the IPHC length-weight conversion table. Occasionally, observers actually weigh individual fish. Sometimes crew members presort the catch by removing Pacific halibut and immediately return them to sea. Vessel crews presort Pacific halibut to increase the likelihood of survival of the discarded fish. Presorting is most prevalent on vessels fishing with hook-&-line gear. If Pacific halibut were brought on-board using hook-&-line gear, almost all individuals would be injured because of their interaction with the vessel ‘crucifier’ (gear used to strip the bait and any catch off of the hook and gangion line). Therefore, shake-offs prior to the crucifier (a form of pre-sorting) is almost universal on IFQ hook-&-line vessels. Another case of pre-sorting can occur when halibut are too heavy and/or awkward to weigh in observer baskets. In all cases of pre-sorting, random samples are not available. Therefore, observers visually estimate the length of the halibut in ten-centimeter units (40cm, 50cm , 60cm, etc.), which are later converted to weight using the IPHC length-weight conversion table. Table A1 (Appendix A) provides the actual observed length frequency distributions of discarded Pacific halibut for vessels fishing IFQ using bottom trawl or pot gear. These length frequencies have been weighted based on the ratio of total estimated P. halibut discard weight to the weight of P. halibut that was measured in each stratum (see Appendix A for further details). Because size-specific mortality rates were not available, we were not able to compute the length frequency distribution of discarded fish that died. However, we have summarized the proportion of length measurements in each condition category (Excellent, Poor, and Dead) in Table 2A (Appendix A) to inform size-specific modeling of mortality. The frequency of sampled fish within each condition category was weighted in the same manner as length frequency distributions and then summarized for each 2 cm length bin.
Non-nearshore Fixed Gear Fishery
The WCGOP samples each non-nearshore fixed gear sector through separate random selection processes, with the limited entry (LE) sablefish endorsed season permits receiving the highest level of coverage, then LE non-sablefish endorsed permits, and open access (OA) fixed gear the lowest. LE sablefish endorsed vessels that fish outside of the primary season or that have reached their tier quota in the primary season are not observed. Given this sampling structure and anticipated differences in variance from one sector to the next, we chose to maintain sector as a stratification variable in our analysis. Testing of alternative stratification schemes (Heery et al. 2010) indicated that latitude and gear type were the most important variables with respect to Pacific halibut bycatch in the non-nearshore fixed gear groundfish fishery. Bycatch estimates were produced separately for each sector and gear combination. Two latitudinal strata were

21
applied to the LE sablefish endorsed longline sector (north and south of Point Chehalis, Washington = 46° 53.30´ N. lat.) because previous modeling demonstrated that these strata significantly improved the fit of predicted bycatch amounts to the amounts observed (Heery et al. 2010). Point Chehalis, WA was used in previous estimates of Pacific halibut bycatch in the LE sablefish endorsed season longline sector because of its relevance to groundfish management and its apparent ability to split out higher bycatch rates off the northern coast of Washington (Heery and Bellman 2009). Evaluations of latitudinal strata for the other fixed gear sectors did not improve the fit of models to an extent that justified their use. Thus, we maintained the same stratification for the other groundfish fixed gear sectors that was used previously (Heery and Bellman 2009; Heery et al. 2010; Jannot et al. 2011).
Discard Estimation A deterministic approach was used to estimate Pacific halibut discard for all sectors of the non-nearshore groundfish fixed gear fishery. Discard ratios were computed from observer data as the discarded weight of Pacific halibut divided by the retained weight of either sablefish or all FMP groundfish (except Pacific hake), depending on the sector (Table 11; FMP groundfish species: NWFSC 2012). Ratio denominators were identified for each sector of the non-nearshore fixed gear fishery based on the targeting behavior of that sector. Discard ratios were then multiplied by the total sector landed weight of either sablefish or FMP groundfish (except Pacific hake), corresponding to the denominator used to compute the observed discard ratio for each sector. This provided an expanded gross estimate of Pacific halibut discard for each sector. A discard mortality rate (discussed below) was then applied to compute estimated discard mortality. Total landed weights for each sector are obtained from fish ticket landing receipts. Fish tickets for fixed gear that included recorded weights for sablefish were included in the non-nearshore fixed gear sector. Commercial fixed gear fish tickets with recorded nearshore species weight were not used in this portion of the fixed gear analysis, regardless of whether they included recorded weights for sablefish (Figure 1). In addition, fixed gear fish tickets without recorded sablefish or nearshore species were included in the non-nearshore fixed gear sector only if groundfish landings were greater than non-groundfish landings based on a unique vessel and landing date. Non-nearshore fixed gear sector fish tickets were partitioned into the three commercial fixed-gear sectors (LE sablefish endorsed season, LE non-sablefish endorsed, and OA fixed gear) through the following process. Commercial fixed-gear fish tickets were first divided out by whether the vessel had a federal groundfish permit (limited entry) or no federal groundfish permit (open access). OA fish tickets were placed in the OA fixed gear groundfish sector. Next, LE fish tickets were separated based on whether the vessel’s federal groundfish permit(s) had a sablefish endorsement with tier quota for the primary season or if it was not endorsed (also referred to as ‘zero’ tier). Fish tickets for all LE sablefish vessels with tier endorsements that were operating within this period and within their allotted tier quota were placed in the LE sablefish endorsed sector. If LE sablefish endorsed vessels fished outside of the primary season (November through March) or made trips within the season after they had reached their tier quota, the fish tickets were placed in the LE non-sablefish endorsed sector. In addition, fish tickets from non-endorsed LE vessels were also placed in the LE non-sablefish endorsed sector.
22
Further processing of fish tickets identified and removed the directed commercial Pacific halibut fishery landings from the non-nearshore fixed gear analysis. The directed Pacific halibut fishery occurs for only a few days each year, during 10-hour openings that are designated by the IPHC. LE and OA fixed gear vessels that typically target groundfish can participate in the directed fishery. For most fixed gear vessels, (other than LE sablefish endorsed longline vessels north of Point Chehalis, prior to 2010) this is the only time during which they are allowed to land Pacific halibut. Fish tickets that included Pacific halibut landings on or within the 2 days after a directed fishery opening were considered to be part of the directed fishery and not part of the non-nearshore fixed gear fishery targeting federal FMP groundfish. These fish tickets were removed prior to our analysis. For years prior to 2010, this approach may have resulted in the removal of some non-directed fishery landings north of Point Chehalis, but any bias introduced by this step is considered to be extremely small given the short time period across which fish tickets were removed. In the previous Pacific halibut reports, derby fish tickets were identified as those for which Pacific halibut comprised the largest landed weight on the fish ticket. This filtering step was applied to the area north of Point Chehalis only. Estimates from the previous reports are maintained in the tables (Tables 10, 12-15) and presented here for comparison purposes. WCGOP observer data were stratified according to sector and gear type (longline and pot/trap). As discussed earlier, one additional latitudinal stratum at Point Chehalis, Washington (46° 53.30’ N lat.) was used for the LE sablefish endorsed longline sector. Some retention of Pacific halibut was allowed in the LE sablefish endorsed season in the area north of Point Chehalis up until October 2009. Since October 2009, retention of Pacific halibut north of Point Chehalis has not been permitted (75 FR 23615; 76 FR 14300). The Point Chehalis line was the only latitudinal stratification incorporated into our analysis and was only applied to the LE sablefish endorsed sector. Discard amounts provided for the other two fixed gear sectors represent coastwide estimates. The number of observed trips, sets, and vessels are summarized for each sector, gear type, and area and depth (where applicable) (Table 10). The landed weight of sablefish and FMP groundfish (excluding Pacific hake) is used as a measure for expanding discard from observed trips to the entire fleet (Table 11). Observed discard ratios were calculated by sector, gear group and area based on the following equation:
s
tt
tst
s Fr
dD
ˆ
where: s: stratum (sector / gear group / area) t: observed sets d: observed discard (mt) of Pacific halibut r: observed retained weight (mt) of sablefish or all FMP groundfish except Pacific hake F: weight (mt) of retained sablefish or all FMP groundfish excluding Pacific hake recorded on fish tickets in strata s

23
sD : Discard estimate for stratum s For all strata, except the LE non-sablefish endorsed longline and the OA sectors, discard ratios were calculated by dividing the stratum discard weight of Pacific halibut by the retained catch weight of sablefish. Retained groundfish was used as the ratio denominator for the LE non-sablefish endorsed longline and the OA sectors because these sectors target a wider range of groundfish species. A broader denominator was therefore necessary to effectively capture the level of fishing effort in these sectors. Please refer to earlier reports for further details of data pooling and discard ratios in prior years of observer coverage. Where FMP groundfish (excluding Pacific hake) was used to compute discard ratios, any retained weights recorded by the observer not appearing on fish tickets were excluded from the denominator. This prevents double-counting associated with differences in the species codes used by observers and processors. For instance, while observers may record rockfish catch at the species level; various species of rockfish are often grouped, weighed, and recorded together on the fish ticket by the processor under a grouped species code such as NUSP - northern unspecified slope rockfish. In some cases, this difference in species coding prevents observer and fish ticket weights from being matched and adjusted properly. Species coding on fish tickets varies considerably between processors and over time, and it is not possible to make assumptions regarding which individual observer-recorded species likely coincide with species grouping codes on fish tickets. By using only the retained groundfish weight from fish tickets in discard ratio denominators, we prevent double-counting of retained weights. This is not a factor when using a single species in the denominator, such as sablefish, as any retained weights in observer and fish ticket data that share the same species code will match and adjust properly. Table 12 demonstrates the expansion factors for each fishery sector and gear type. The discard rate applied yielded an expanded gross P. halibut discard estimate for each stratum. If landings were made by a fixed gear sector for which there were no or very few WCGOP observations, the most appropriate observed discard ratio was selected and applied to those landings based on similarities in the fishery management structure, fishing and discard behavior, and the gear fished. The LE sablefish endorsed vessels fishing outside of the primary season with pot gear often land a small amount of groundfish; however, this portion of the fleet is not observed by the WCGOP program. Given similarities in gear type and catch composition, OA fixed gear pot observations were selected as the most appropriate source of information for an observed discard rate (Table 11).
Discard Mortality Rates Once an initial gross estimate of P. halibut discard had been produced, this value was multiplied by a discard mortality rate (Table 14) to generate a final discard mortality estimate (Table 15 and Figure 3). Ideally, discard mortality would have been approximated based on viabilities in a manner similar to the approach used for IFQ bottom trawl and pot gear. WCGOP observers do record viability conditions as Pacific halibut are discarded from non-IFQ longline vessels. However, much of the time, Pacific halibut are removed from the line before being brought onboard. This is to ensure safety, as longline vessels are often small, and to have the least possible impact on Pacific halibut survivorship. Because these fish are not typically brought onboard, the observer is not able to effectively assess viability or gain a random sample from

24
Pacific halibut catch. Although viabilities from pot gear would be appropriate to use in estimating discard mortality, bycatch of Pacific halibut in pot gear is infrequent and the sample size of viability conditions from this gear type was too small to utilize in this analysis. Thus, Pacific halibut viabilities recorded from the non-nearshore fixed gear fishery were not used in our analysis. Discard mortality rates therefore had to be identified through other means. Review of the literature on Pacific halibut bycatch revealed little that could be applied to the entire discard estimate. Several studies have examined the survivorship of Pacific halibut in various conditions (Kaimmer and Trumble 1998, Trumble, Kaimmer 2000). However, without any information on the state of Pacific halibut that were being discarded, the findings from these examinations could not be put to use. Instead, we relied on discard mortality rates computed for groundfish fisheries off Alaska (Williams 2008). An 18% discard mortality rate was applied to estimates for pot gear, coinciding with the DMR used for the sablefish pot CDQ fishery in Alaska. For longline gear, we used a discard mortality rate of 16%, an average of DMRs over all years for the Bering Sea/Aleutian region longline fishery (Williams 2008). For additional context, we present the length frequency distribution of Pacific halibut from visual estimates and actual lengths measured in the LE sablefish endorsed sector (Table 16) and the proportion of sampled Pacific halibut discard of legal (>82 cm) and sublegal (< 82 cm) sizes in the non-nearshore fixed gear fishery (Table 17). The majority of Pacific halibut lengths recorded in this fishery have been collected through visual length estimation, rounded to the nearest 10 cm. In other words, specimens that are 76 cm and 82 cm are both visually estimated to be 80 cm. With this level of resolution, it was not possible to compute the exact proportion of sublegal versus legal Pacific halibut from visually estimated lengths. Visual estimates were instead summarized in the manner in which they are recorded; with sublegal and legal sized halibut falling within the 75-84 cm length bin. In 2011, observers were instructed to record more actual lengths from randomly sampled Pacific halibut on non-nearshore fixed gear boats, with the help of vessel crew. However, sample sizes from 2011 were too low for use in analyses.
Other Fisheries
Pacific halibut was also observed in the nearshore groundfish fixed gear sector and the pink shrimp and OA California halibut trawl fisheries. Bycatch estimates for these three fishery sectors were computed based on the following equation:
Fr
bB
tt
tt
ˆ
where: b: observed discard (mt) of Pacific halibut on set/haul t r: observed retained weight (mt) of target species on set/haul t F: weight (mt) of retained target species

25
B : Bycatch estimate The nearshore fixed gear fishery targets a variety of groundfish species that inhabit areas shallower than 50 fathoms. All species included in the nearshore target group as listed in the WCGOP data processing appendix were included in the denominator when calculating bycatch ratios for the nearshore fixed gear sector. Pink shrimp and California halibut were considered the target species in their respective fisheries. Bycatch estimates are presented for the nearshore fixed gear sector, pink shrimp trawl fishery, and the OA portion of the California halibut trawl fishery (LE California halibut is covered under the IFQ fishery). For more information regarding the differences between the two California halibut trawl components, see annual data reports published by the WCGOP (NWFSC 2012). Discard mortality rates were not applied to bycatch estimates for these other fishery sectors due to a lack of information regarding survivorship.
RESULTS
IFQ Fishery
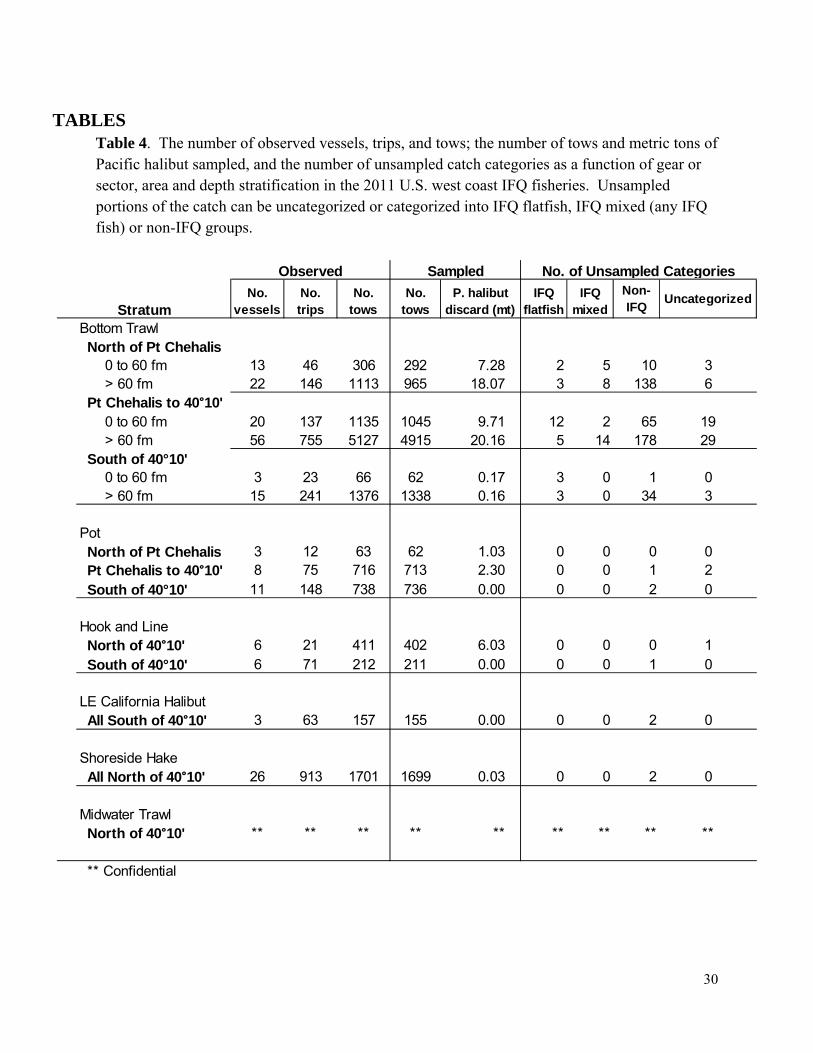
For most strata, 95% or more of the observed IFQ tows or sets were sampled (Table 4). The exceptions were vessels fishing bottom trawl gear: (a) greater than 60 fathoms north of Point Chehalis, WA (87% sampled); (b) less than 60 fathoms between Point Chehalis and 40°10' N. latitude (92% sampled); or (c) less than 60 fathoms south of 40°10' N. latitude (94% sampled; Table 4). Unsampled catch categorized as non-IFQ species represented the largest portion of the unsampled tows or sets (Table 4), as only every third haul or set was required to be sampled for non-IFQ species under WCGOP sampling protocol (NWFSC 2012). The total estimated weight of Pacific halibut from unsampled tows or sets represents a small fraction (2.2 mt ~ 3%) of the total gross discard weight of P. halibut in this fishery (Table 5). Fifty percent of the total estimated weight (1.1 mt) was from the IFQ mixed species category (Table 5). Most of the remainder was estimated from uncategorized (all species) unsampled catch (0.7 mt). Weight estimated from the IFQ flatfish and non-IFQ species groups represents a very small portion of the total estimated discard weight of Pacific halibut (Table 5). In terms of viability, the majority of individuals were classified as either Excellent or Dead, irrespective of gear type, area or depth (Table 6). Estimated discard mortality from all sectors and gears of the 2011 IFQ fishery was 87% less than the estimated discard mortality from the 2010 LE bottom trawl fishery (Figure ES1). There are at least two possible explanations for this drop. First, IBQs for P. halibut might have increased fisher incentives to avoid P. halibut bycatch and thereby changed fisher behavior (i.e., fish different grounds or gear differently than in past). Second, during 2011, the fleet was experimenting with P. halibut excluders, including cooperating with NMFS on developing and testing P. halibut excluders on trawl vessels (Lomeli and Wakefield). Gross bycatch estimates and total discard mortality estimates were largest for vessels fishing bottom trawl gear, north of the 40°10´ N. latitude management line in depths greater than 60 fathoms (Tables 7, 8). This
26
gear-area-depth stratum accounts for ~75% of 2011 Pacific halibut discard mortality in the fishery. The next largest fraction (~21%) of total discard mortality is found in the same gear-area combination in shallow waters (<60 fm). Together, bottom trawl gear fishing north of the 40°10´ N. latitude management line accounts for 96% of the 2011 Pacific halibut discard mortality in the IFQ fishery (Tables 7, 8). Estimated bycatch weight of P. halibut from the at-sea hake component of the 2011 IFQ fishery was low (0.6 mt) relative to the majority of prior years’ reported. At-sea hake sectors reported a range of P. halibut bycatch weight from 0.3 to 4 mt during the period from 2002 to 2011. This is the first report to incorporate P. halibut bycatch weight from at-sea hake sectors of the groundfish fishery.
Non-nearshore Fixed Gear Fishery
From 2010 to 2011, estimated discard mortality of Pacific halibut in the LE sablefish endorsed season longline sector increased in the area north of Point Chehalis, WA but decreased south of Point Chehalis (Table 14). In 2011, north of Point Chehalis fleet-wide sablefish landings decreased slightly but the observed P. halibut discard ratio nearly doubled relative to 2010 (Table 12). This indicates that perhaps vessels were encountering Pacific halibut more frequently in 2011 than in 2010. South of Point Chehalis, 2011 saw a drop in landings and in the discard ratio relative to 2010 values (Table 12), indicating that fishing effort by the LE sablefish endorsed longline sector might have been lower in 2011 relative to 2010 in this area. Increased P. halibut discard mortality north of Point Chehalis and decreased mortality south of Point Chehalis led to a 2011 coastwide estimate very close to the 2010 coastwide estimate for this sector (Table 14 & Figure 3). Gross estimated discard of P. halibut in the LE sablefish endorsed season pot sector was almost the same in 2011 as in 2010 (Table 14). Discard of Pacific halibut among the non-sablefish endorsed fixed gear sectors (LE and OA) during 2011 showed departures from previous years. First, in 2011, the LE non-sablefish endorsed longline sector showed a marked increase in estimated discard mortality relative to 2010 (Table 14). Conversely, the estimated discard mortality for OA fixed gear vessels fishing with hook-&-line gears in 2011 was about half (17.2 mt) of the discard mortality estimated for the same sector in 2010 (32.6 mt; Table 14). This follows the trend of decreasing estimated discard mortality in this sector since 2008 (Table 14). A large source of uncertainty in our estimates of Pacific halibut discard mortality on non-nearshore fixed gear vessels is the actual discard mortality rate applied to initial gross estimates computed from observer data. A small sample size of observed viability data are available from sablefish vessels fishing with pots, but not enough to be used in discard mortality estimation. Instead, we relied on findings from observed pot vessels in Alaska that assign specimens to the same condition codes used for trawl gear and then apply the discard mortality rates assumed by Williams (2008). This informed our decision to increase the discard mortality rate applied to pot estimates to 18% from 16%. As more viability information is collected by WCGOP observers from pot vessels, we intend to apply this directly to compute discard mortality in a manner consistent with the methods of Williams (2008).

27
Just as for trawl gear, discard mortality rates have been determined experimentally for Pacific halibut caught with longline gear (Kaimmer and Trumble 1998, Trumble et al. 2000). To apply these rates, Pacific halibut caught on longlines are assigned to one of four condition categories (minor, moderate, severe, and dead) based on the extent of their injuries at the time of release. Kaimmer and Trumble (1998) derived discard mortality rates for each of these categories using mark-recapture data. Their rates were later updated by Trumble et al. (2000) to account for hook sizes that are more consistent with gear used on the West Coast for commercial purposes. For reasons described earlier, Pacific halibut were infrequently brought onboard observed fixed gear vessels from 2002 to 2010, resulting in a small and potentially biased sample of viability data. Mortality rates specified by Trumble et al. (2000) cannot therefore be used in conjunction with these data to assess overall discard mortality. However, changes were implemented in the 2011 WCGOP data collection protocol that allowed observers on fixed gear vessels to collect a random sample of Pacific halibut from which to gather viability data. Sample sizes for the 2011 calendar year are too low for analytical purposes, but data will continue to be collected in 2012. In the interim, discard mortality rates of 16% for longline gear and 18% for pot gear (Williams 2008) are thought to be the best option currently available.
Other Fisheries
Very small amounts of Pacific halibut bycatch were observed in other fisheries. Even without the application of discard mortality rates, bycatch estimates for the nearshore groundfish fixed gear sector, pink shrimp trawl fishery, and the OA sector of the California halibut trawl fishery made up a minor portion of the total mortality estimate for Pacific halibut. Bycatch estimates of P. halibut for these sectors provided in Tables 18, 19, and 20 are not intended to represent mortality values, as discard mortality rates for these sectors are not available.
SUMMARY & CONCLUSIONS
• In the 2011 IFQ fishery, methods for estimating the relatively small amount of Pacific halibut weight in unsampled and partially sampled hauls were developed for each sector and gear type fished. The weight of P. halibut estimated from these hauls represents ~3% of the total discard mortality of P. halibut in the IFQ fishery. • Estimated discard mortality from the entire 2011 IFQ fishery represents an 87% decrease relative to the 2010 LE bottom trawl fishery. • The 2011 estimate of Pacific halibut mortality in the LE non-sablefish endorsed longline sector was much greater than in any prior year. The 2011 OA fixed gear longline sector exhibited a decline in estimated P. halibut mortality relative to the 2010 estimate. • Estimated P. halibut mortality in all other non-IFQ sectors are well within the range observed in previous years. • This report represents the first time we present summarized P. halibut discard from the at-sea Pacific hake fishery for the years 2002-2011. • The spatial distribution of P. halibut catch observed by the WCGOP (2002-2011) off the U.S. west coast is presented for the first time in this report. Gear types represented include a combination of bottom trawl, midwater trawl, shrimp trawl, fixed gear hook-&-line and pot gear.
28
ACKNOWLEDGEMENTS
The authors gratefully acknowledge the hard work and dedication of observers from the Northwest Fishery Science Center Groundfish Observer Program, as well as all other observer program staff. We also thank the Scientific and Statistical Committee of the PFMC, Jon McVeigh (WCGOP) and Gregg Williams (IPHC) for their contributions to this report.
REFERENCES Clark WG, Hare SR. 1998. Accounting for bycatch in management of the Pacific halibut fishery.
Journal of Fisheries Management 18: 809-821. Clark WG, Hoag SH, Trumble RJ, Williams GH. 1992. Re-estimation of survival for trawl
caught halibut released in different condition factors. International Pacific Halibut Commission, Report of Assessment and Research Activities 1992: 197-206.
Heery E, Bellman M. 2009. Observed and Estimated Total Discard of Pacific Halibut in the
2002-2008 U.S. West Coast Groundfish Non-Nearshore Fixed Gear Fishery. NWFSC, 2725 Montlake Blvd E., Seattle, WA 98112.
Heery E, Bellman M, Majewski J. 2010. Pacific halibut bycatch in the U.S. west coast
groundfish fishery from 2002 through 2009. West Coast Groundfish Observer Program. NWFSC, 2725 Montlake Blvd E., Seattle, WA 98112.
Hoag SH. 1975. Survival of Halibut Released After Capture By Trawls. International Pacific
Halibut Commission, Scientific Report No 57. p. 18. Jannot JE, Bellman M, Majewski J. 2011. Pacific Halibut Bycatch in the U.S. West Coast
Groundfish Fishery, 2002-2010. West Coast Groundfish Observer Program. NWFSC, 2725 Montlake Blvd E., Seattle, WA 98112.
Kaimmer SM, Trumble RJ. 1998. Injury, condition, and mortality of Pacific halibut bycatch
following careful release of Pacific cod and sablefish longline fisheries. Fisheries Research 38: 131-144.
Lomeli MJM, Wakefield WW. A flexible sorting grate to reduce Pacific halibut (Hippoglossus
stenolepis) bycatch in the U.S. west coast groundfish bottom trawl fishery. Fisheries Research In Review.
NWFSC 2012. Observer Manuals. NOAA Northwest Fisheries Science Center Groundfish
Observer Program; [updated 30 July 2012]; Available from: http://www.nwfsc.noaa.gov/research/divisions/fram/observer/observer_manuals.cfm.

29
NWFSC 2012. Sector Data Products. NOAA Northwest Fisheries Science Center Groundfish Observer Program[updated August 2012]; Available from: http://www.nwfsc.noaa.gov/research/divisions/fram/observer/sector_products.cfm.
NWFSC 2012. WCGOP Data Processing Appendix. NOAA Northwest Fisheries Science Center
Groundfish Observer Program[updated July 2012]; Available from: http://www.nwfsc.noaa.gov/research/divisions/fram/observer/xls/Appendix.xlsx.
PFMC. 2011. Pacific Groundfish Fishery Management Plan for the California, Oregon, and
Washington Groundfish Fishery. Trumble RJ, Kaimmer SM, Williams GH. 2000. Estimation of discard mortality rates for Pacific
halibut bycatch in groundfish longline fisheries. North American Journal of Fisheries Management 20: 931-939.
Wallace J, Hastie J. 2009. Pacific halibut bycatch in IPHC area 2A in the 2008 groundfish
bottom trawl fishery. NWFSC, 2725 Montlake Blvd E., Seattle, WA 98112. Williams GH. 2008. Pacific halibut discard mortality rates in the 2006 open access and CDQ
groundfish fisheries, and recommendations for discard mortality rates needed for monitoring halibut bycatch in 2008 CDQ fisheries. International Pacific Halibut Commission, Seattle, WA.
Williams GH, Chen D. 2004. Pacific halibut discard mortality rates in the 1990-2002 Alaskan
groundfish fisheries, with recommendations for monitoring in 2004. International Pacific Halibut Commission Report of Assessment and Research Activities 2003: 227-244.
30
TABLES Table 4. The number of observed vessels, trips, and tows; the number of tows and metric tons of Pacific halibut sampled, and the number of unsampled catch categories as a function of gear or sector, area and depth stratification in the 2011 U.S. west coast IFQ fisheries. Unsampled portions of the catch can be uncategorized or categorized into IFQ flatfish, IFQ mixed (any IFQ fish) or non-IFQ groups.
No. vessels
No. trips
No. tows
No. tows
P. halibut discard (mt)
IFQ flatfish
IFQ mixed
Non-IFQ Uncategorized
Bottom TrawlNorth of Pt Chehalis
0 to 60 fm 13 46 306 292 7.28 2 5 10 3> 60 fm 22 146 1113 965 18.07 3 8 138 6
Pt Chehalis to 40°10'0 to 60 fm 20 137 1135 1045 9.71 12 2 65 19> 60 fm 56 755 5127 4915 20.16 5 14 178 29
South of 40°10'0 to 60 fm 3 23 66 62 0.17 3 0 1 0> 60 fm 15 241 1376 1338 0.16 3 0 34 3
PotNorth of Pt Chehalis 3 12 63 62 1.03 0 0 0 0Pt Chehalis to 40°10' 8 75 716 713 2.30 0 0 1 2South of 40°10' 11 148 738 736 0.00 0 0 2 0
Hook and LineNorth of 40°10' 6 21 411 402 6.03 0 0 0 1South of 40°10' 6 71 212 211 0.00 0 0 1 0
LE California HalibutAll South of 40°10' 3 63 157 155 0.00 0 0 2 0
Shoreside HakeAll North of 40°10' 26 913 1701 1699 0.03 0 0 2 0
Midwater TrawlNorth of 40°10' ** ** ** ** ** ** ** ** **
** Confidential
Observed Sampled No. of Unsampled Categories
Stratum

31
Table 5. Values used to calculate the expanded weight (mt) of Pacific halibut (PHLB) from each unsampled category in the 2011 U.S. west coast groundfish IFQ fishery. Unsampled catch weight could be assigned to one of four categories: IFQ flatfish species, IFQ mixed species, non-IFQ species, or all species (IFQ & non-IFQ). The sampled weight (mt), discard ratio, unsampled weight (mt) and estimated Pacific halibut gross discard (mt) are presented within each category, as a function of gear or sector, depth (bottom trawl only), management area, and area north or south of Point Chehalis, WA. The sum of expanded weight (mt) is the sum of the estimated gross P. halibut discard across categories. The sampled PHLB in unsampled hauls (or sets) is the sampled weight of P. halibut in partially sampled hauls (or sets). The sum of the PHLB in unsampled hauls is the sum of the expanded weights plus the sampled PHLB in unsampled hauls. The total discard (gross) is the sum of the PHLB in unsampled hauls plus the sampled PHLB.
Gear or Sector
Depth (fm) Area
N. Pt Chehalis 7.28 58 0.126 0.16 0.02 78 0.094 5.22 0.49 56 0.000 2.66 0.00 133 0.055 2.29 0.13 0.64 0.16 0.80 8.07Pt Chehalis - 4010 9.71 90 0.108 0.97 0.10 110 0.088 2.40 0.21 171 0.000 6.76 0.00 281 0.035 5.71 0.20 0.51 0.95 1.46 11.18
S.4010 S. 4010 0.17 5 0.000 0.04 0.00 5 0.000 0.00 0.00 12 0.014 0.01 0.00 17 0.010 0.00 0.00 0.00 0.00 0.00 0.17N. Pt Chehalis 18.07 102 0.178 1.03 0.18 128 0.141 1.01 0.14 196 0.000 15.03 0.00 325 0.056 4.79 0.27 0.59 4.39 4.99 23.06Pt Chehalis - 4010 20.16 168 0.120 0.78 0.09 325 0.062 4.00 0.25 721 0.000 18.25 0.00 1046 0.019 7.54 0.15 0.49 1.90 2.38 22.55
S.4010 S. 4010 0.16 155 0.000 0.10 0.00 270 0.000 0.00 0.00 217 0.001 2.87 0.00 487 0.000 1.36 0.00 0.00 0.00 0.00 0.16N. Pt Chehalis 1.03 1 0.981 0.00 0.00 2 0.676 0.00 0.00 0 0.000 0.00 0.00 2 0.580 0.00 0.00 0.00 0.00 0.00 1.03Pt Chehalis - 4010 2.30 2 0.942 0.00 0.00 8 0.290 0.00 0.00 3 0.000 0.00 0.00 11 0.204 0.01 0.00 0.00 0.00 0.00 2.31
S.4010 S. 4010 0.00 0 0.000 0.00 0.00 6 0.000 0.00 0.00 7 0.000 0.00 0.00 13 0.000 0.00 0.00 0.00 0.00 0.00 0.00
N. 4010 6.03 7 0.845 0.00 0.00 22 0.276 0.00 0.00 56 0.000 0.00 0.00 78 0.077 0.00 0.00 0.00 0.02 0.02 6.06
S. 4010 0.00 0 0.000 0.00 0.00 4 0.000 0.00 0.00 21 0.000 0.00 0.00 25 0.000 0.00 0.00 0.00 0.00 0.00 0.00
Sho
resi
de
hake N.4010 0.03 0 0.991 0.00 0.00 521 0.000 0.00 0.00 3 0.000 1.37 0.00 525 0.000 0.00 0.00 0.00 0.00 0.00 0.03
LE C
AH
alib
ut
S. 4010 0.00 1 0.000 0.00 0.00 1 0.000 0.00 0.00 74 0.000 0.01 0.00 75 0.000 0.00 0.00 0.00 0.00 0.00 0.00
Mid
wat
er
Tra
wl
N. 4010 ** ** ** ** ** ** ** ** ** ** ** ** ** ** ** ** ** ** ** ** **
** Confidential
Pot N. 4010
Hoo
k &
Li
ne
Unsampled
Bot
tom
Tra
wl
0 -6
0 N. 4010
> 6
0 N. 4010
ManagementArea Sampled
DiscardRatio Unsampled Sampled
SampledPHLB
Mixed IFQ Species Non‐IFQ Species All Species (IFQ & Non‐IFQ)Sum of Est.
Discard Wght.
Sampled PHLB in Unsamp. hauls
Sum of PHLB in Unsamp. hauls
Total Discard
Est. Discard
Est. Discard
Est. Discard
Est. Discard
DiscardRatio Unsampled Sampled
DiscardRatio Unsampled Sampled
DiscardRatio
IFQ Flatfish

32
Table 6. Pacific halibut viabilities in the 2011 groundfish IFQ fishery by gear, depth (bottom trawl only), management area, and area north or south of Point Chehalis, WA. The condition of sampled Pacific halibut was identified as Excellent (Exc), Poor, or Dead (Appendices N and O, WCGOP manual 2012), consistent with IPHC protocol. The number of fish in each category was weighted based on the length-weight relationship as described in the Methods.
Year GearDepth (fm) Area
2011 Exc Poor Dead Total Exc Poor DeadN. Pt Chehalis 522 138 309 969 57% 14% 28%
Pt Chehalis - 4010 1217 182 201 1600 82% 9% 9%
S. 4010 S. 4010 0 0 10 10 0% 0% 100%N. Pt Chehalis 1168 455 941 2564 48% 18% 34%
Pt Chehalis - 4010 1005 562 1204 2771 38% 20% 42%
S. 4010 S. 4010 7 1 6 14 48% 6% 46%N. Pt Chehalis 53 3 19 75 84% 2% 14%
Pt Chehalis - 4010 149 10 65 224 69% 5% 26%
S. 4010 S. 4010 0 0 0 0
Pot N. 4010
> 6
0
Bot
tom
Tra
wl N. 4010
N. 4010
0 -
60
NumberWeighted percentages in
each categoryManagement
Area

33
Table 7. Estimated gross discard (mt) and discard mortality (mt) of Pacific halibut in the 2011 groundfish IFQ fishery by gear type, depth (bottom trawl only), management area, and area north or south of Point Chehalis, WA. Estimates were allocated to the three condition categories based on information presented in Table 6. DMR = Discard Mortality Rate.
Year GearDepth (fm) Area DMR
2011 Exc Poor Dead Total m(Exc) m(Poor) m(Dead) m(Total)N. Pt Chehalis 4.64 1.15 2.28 8.07 0.93 0.63 2.06 3.62 45%
Pt Chehalis - 4010 9.11 1.02 1.04 11.18 1.82 0.56 0.94 3.32 30%
S. 4010 S. 4010 0.00 0.00 0.17 0.17 0.00 0.00 0.15 0.15 90%N. Pt Chehalis 11.17 4.15 7.75 23.06 2.23 2.28 6.97 11.49 50%
Pt Chehalis - 40108.61 4.52 9.42 22.55 1.72 2.49 8.47 12.68 56%
S. 4010 S. 4010 0.08 0.01 0.08 0.16 0.02 0.01 0.07 0.09 54%N. Pt Chehalis 0.86 0.02 0.15 1.03 0.00 0.02 0.15 0.17 16%
Pt Chehalis - 40101.59 0.11 0.61 2.31 0.00 0.11 0.61 0.71 31%
S. 4010 S. 4010 0.00 0.00 0.00 0.00 0.00 0.00 0.00 0.00
Estimate Gross Discard (mt) Estimated Discard Mortality (mt)
Pot N. 4010
ManagementArea
Bot
tom
Tra
wl
0 -
60 N. 4010
> 6
0 N. 4010
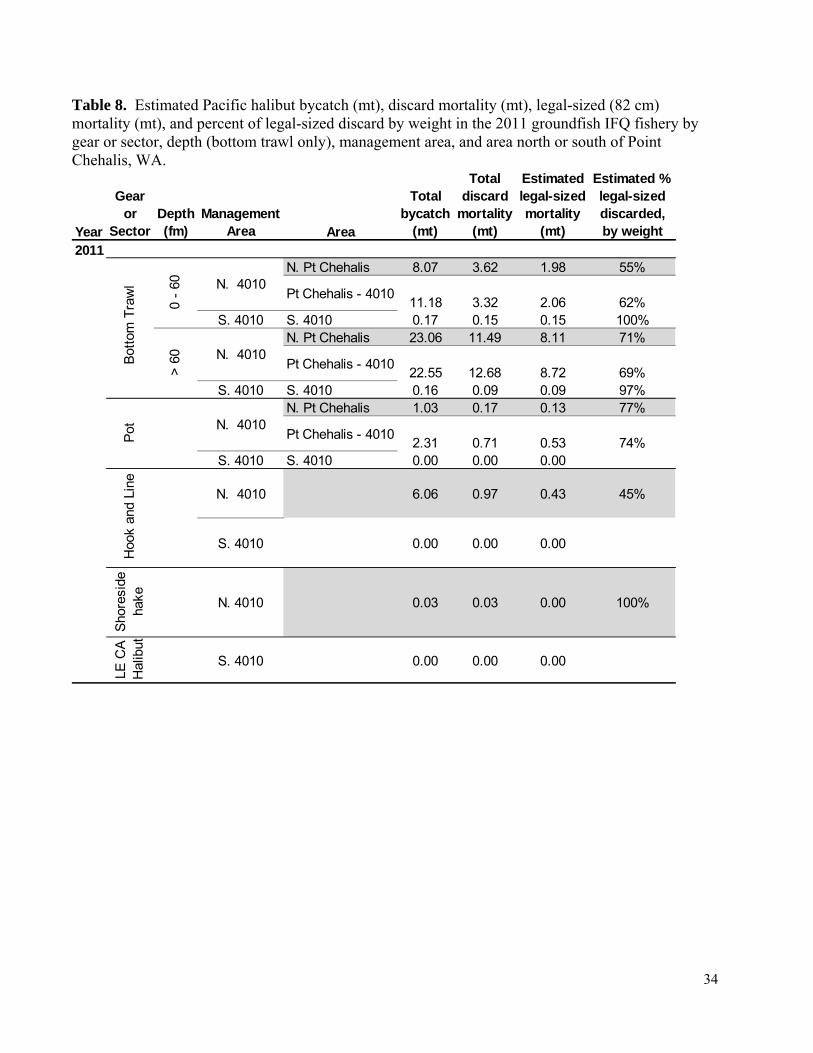
34
Table 8. Estimated Pacific halibut bycatch (mt), discard mortality (mt), legal-sized (82 cm) mortality (mt), and percent of legal-sized discard by weight in the 2011 groundfish IFQ fishery by gear or sector, depth (bottom trawl only), management area, and area north or south of Point Chehalis, WA.
Year
Gear or
SectorDepth (fm)
ManagementArea Area
Total bycatch
(mt)
Total discard
mortality (mt)
Estimated legal-sized mortality
(mt)
Estimated % legal-sized discarded, by weight
2011N. Pt Chehalis 8.07 3.62 1.98 55%
Pt Chehalis - 401011.18 3.32 2.06 62%
S. 4010 S. 4010 0.17 0.15 0.15 100%N. Pt Chehalis 23.06 11.49 8.11 71%
Pt Chehalis - 401022.55 12.68 8.72 69%
S. 4010 S. 4010 0.16 0.09 0.09 97%N. Pt Chehalis 1.03 0.17 0.13 77%
Pt Chehalis - 40102.31 0.71 0.53 74%
S. 4010 S. 4010 0.00 0.00 0.00
N. 4010 6.06 0.97 0.43 45%
S. 4010 0.00 0.00 0.00
Sho
resi
de
hake N. 4010 0.03 0.03 0.00 100%
LE C
AH
alib
ut
S. 4010 0.00 0.00 0.00
Hoo
k an
d Li
neB
otto
m T
raw
l
0 -
60 N. 4010
> 6
0 N. 4010
Pot N. 4010
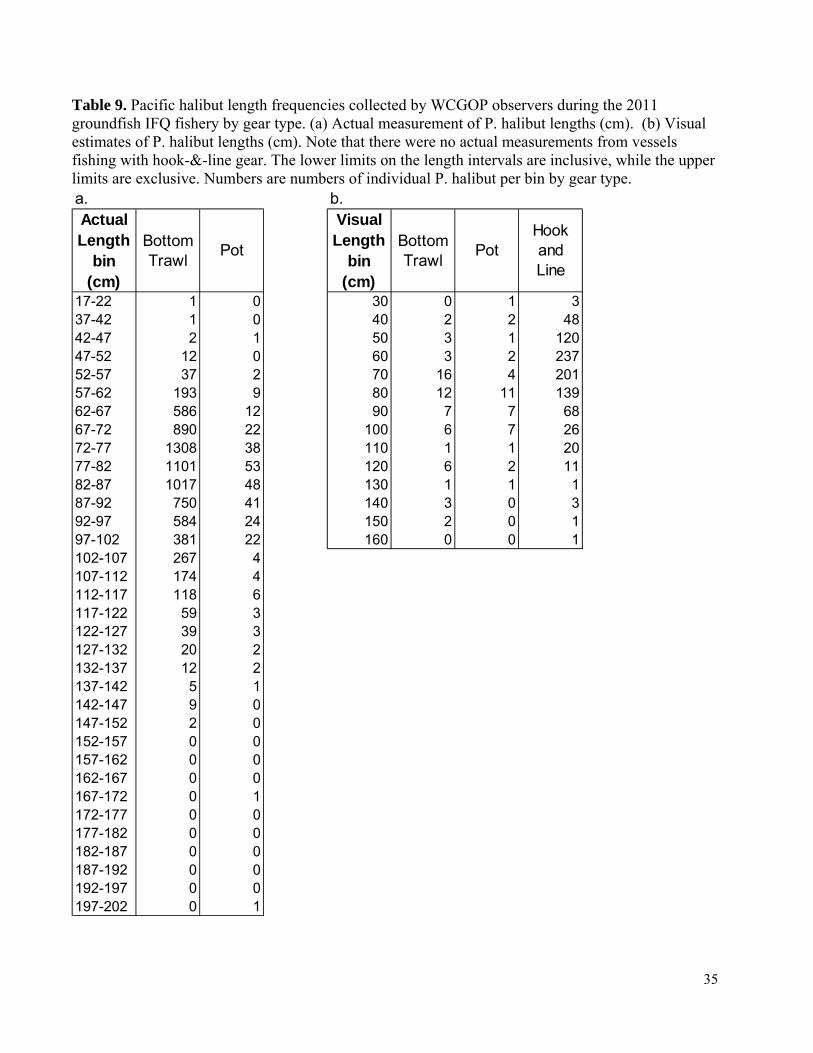
35
Table 9. Pacific halibut length frequencies collected by WCGOP observers during the 2011 groundfish IFQ fishery by gear type. (a) Actual measurement of P. halibut lengths (cm). (b) Visual estimates of P. halibut lengths (cm). Note that there were no actual measurements from vessels fishing with hook-&-line gear. The lower limits on the length intervals are inclusive, while the upper limits are exclusive. Numbers are numbers of individual P. halibut per bin by gear type.
a. b.Actual Length
bin (cm)
Bottom Trawl
Pot
Visual Length
bin (cm)
Bottom Trawl
PotHook and Line
17-22 1 0 30 0 1 337-42 1 0 40 2 2 4842-47 2 1 50 3 1 12047-52 12 0 60 3 2 23752-57 37 2 70 16 4 20157-62 193 9 80 12 11 13962-67 586 12 90 7 7 6867-72 890 22 100 6 7 2672-77 1308 38 110 1 1 2077-82 1101 53 120 6 2 1182-87 1017 48 130 1 1 187-92 750 41 140 3 0 392-97 584 24 150 2 0 197-102 381 22 160 0 0 1102-107 267 4107-112 174 4112-117 118 6117-122 59 3122-127 39 3127-132 20 2132-137 12 2137-142 5 1142-147 9 0147-152 2 0152-157 0 0157-162 0 0162-167 0 0167-172 0 1172-177 0 0177-182 0 0182-187 0 0187-192 0 0192-197 0 0197-202 0 1
y
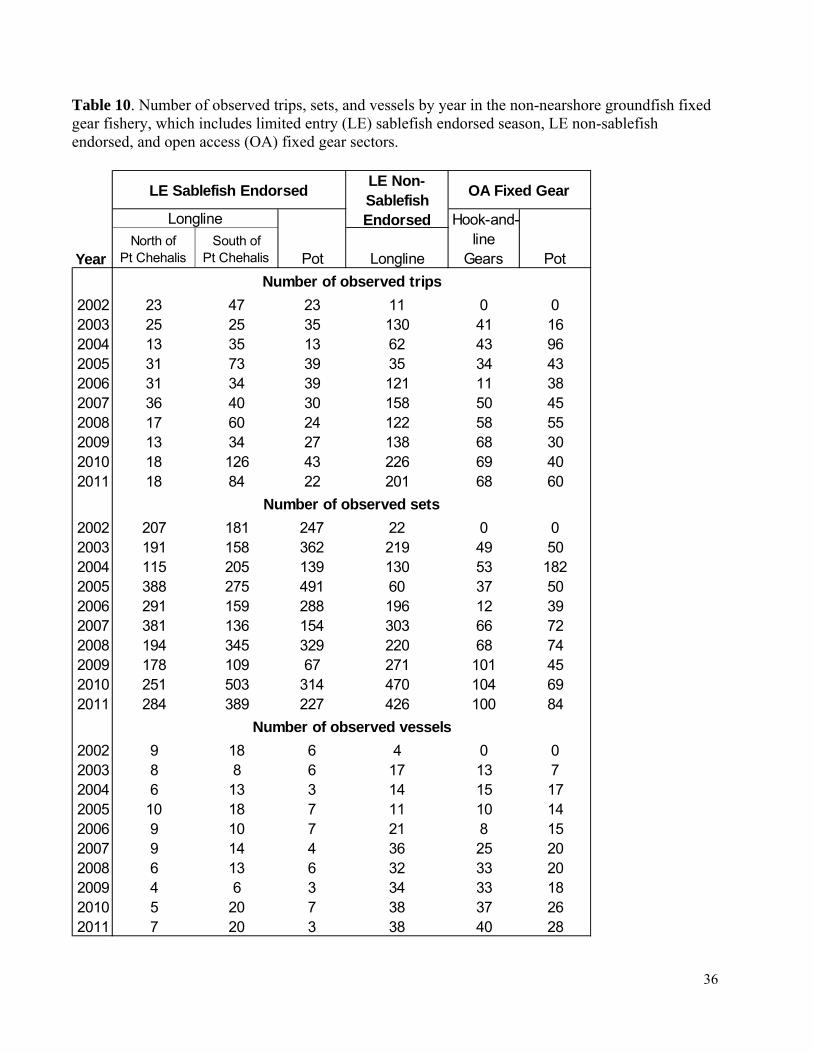
36
Table 10. Number of observed trips, sets, and vessels by year in the non-nearshore groundfish fixed gear fishery, which includes limited entry (LE) sablefish endorsed season, LE non-sablefish endorsed, and open access (OA) fixed gear sectors.
YearNorth of
Pt ChehalisSouth of
Pt Chehalis Longline
2002 23 47 23 11 0 02003 25 25 35 130 41 162004 13 35 13 62 43 962005 31 73 39 35 34 432006 31 34 39 121 11 382007 36 40 30 158 50 452008 17 60 24 122 58 552009 13 34 27 138 68 302010 18 126 43 226 69 402011 18 84 22 201 68 60
2002 207 181 247 22 0 02003 191 158 362 219 49 502004 115 205 139 130 53 1822005 388 275 491 60 37 502006 291 159 288 196 12 392007 381 136 154 303 66 722008 194 345 329 220 68 742009 178 109 67 271 101 452010 251 503 314 470 104 692011 284 389 227 426 100 84
2002 9 18 6 4 0 02003 8 8 6 17 13 72004 6 13 3 14 15 172005 10 18 7 11 10 142006 9 10 7 21 8 152007 9 14 4 36 25 202008 6 13 6 32 33 202009 4 6 3 34 33 182010 5 20 7 38 37 262011 7 20 3 38 40 28
Number of observed trips
LE Non-Sablefish Endorsed
Number of observed sets
Number of observed vessels
LE Sablefish Endorsed OA Fixed Gear
Longline
Pot
Hook-and-line
Gears Pot

37
Table 11. Expansion factors and WCGOP observed discard rate by gear type for limited entry (LE) and open access (OA) non-nearshore groundfish fixed gear sectors used to expand discard estimates of Pacific halibut to the fleet-wide level.
Fishery Expansion FactorLongline LonglinePot Pot
Longline Retained Groundfish LE Non-Sablefish Endorsed LonglinePot Retained Sablefish OA Fixed Gear * Pot
Hook-and-line Hook-and-linePot Pot
* No discard ratio or discard estimate was computed in the OA fixed gear sector for 2002-2006 because the WCGOP only covered OA vessels in California during this time.
LE Sablefish Endorsed
LE Non-Sablefish Endorsed
OA Fixed Gear
Retained Sablefish
Retained Groundfish
Observed Discard Rate Applied
OA Fixed Gear *
LE Sablefish Endorsed

38
Table 12. Total sablefish and groundfish landings (mt) and observed Pacific halibut discard ratios for each sector and gear type in the non-nearshore groundfish fixed gear fishery. Sablefish landings were used as the discard ratio denominator and expansion factor in all cases except the limited entry (LE) non-sablefish endorsed and OA fixed gear sectors, where target species include a variety of groundfish species.
North of Pt Chehalis
South of Pt Chehalis
Expansion factorTotal fleet landings(Based on fish tickets)
2002 390 407 354 452 6 387 1082003 499 569 604 485 7 547 1862004 698 654 626 377 6 474 1842005 641 676 615 519 7 625 3762006 684 708 611 441 4 487 4392007 489 607 426 462 9 270 2492008 385 663 421 652 18 430 2382009 418 984 487 695 18 671 3642010 259 1030 503 1021 34 769 3022011 223 919 377 1238 25 445 255
Observed Pacific halibut discard ratios2002 0.3297 0.0283 0.0114 0.0000 * * *2003 0.3532 0.0467 0.0005 0.0003 * * *2004 0.2369 0.0746 0.0526 0.0000 * * *2005 0.3318 0.0204 0.0043 0.0000 * * *2006 0.7827 0.1636 0.0271 0.0000 * * *2007 0.2184 0.0334 0.0092 0.0032 (0.0035) 0.0785 0.00352008 0.3715 0.1453 0.0151 0.0041 (0.0010) 0.0986 0.00102009 0.6436 0.0413 0.0017 0.0003 (0.0007) 0.0545 0.00072010 0.2642 0.0632 0.0088 0.0004 (0.0016) 0.0424 0.00162011 0.4780 0.0281 0.0110 0.0172 (0.0003) 0.0305 0.0003
PotPot Longline PotHook-and-
LineGears
* No discard ratio is provided for the OA fixed gear sector for 2002-2006 because the WCGOP only covered OA vessels in California during this time. Since 2007-2008 OA pot discard rates were used to estimate LE non-endorsed discard, discard ratios for this sector were also excluded.
Sablefish landings (mt)Groundfish
landings (mt)
Groundfish landings (mt)Sablefish landings
(mt)
LE Sablefish Endorsed LE Non-Sablefish Endorsed OA Fixed Gear
Longline

39
Table 13. Summary of the percent of observed trips that caught Pacific halibut by sector, gear, and area (where applicable) in the non-nearshore groundfish fixed gear fishery. Observed mean, minimum, and maximum annual catch and discard weight (mt) are provided, along with the percent of Pacific halibut catch weight that was discarded per year.
North of Pt Chehalis
South of Pt Chehalis
% of observed trips that caught Pacific halibut2002 95.7% 46.8% 17.4% 0.0% -- -- -- 2003 100.0% 52.0% 8.6% 0.8% -- 0.0% 0.0%2004 100.0% 71.4% 38.5% 0.0% -- 0.0% 0.0%2005 96.8% 58.9% 33.3% 0.0% -- 0.0% 0.0%2006 100.0% 76.5% 56.4% 0.0% -- 9.1% 0.0%2007 94.4% 47.5% 33.3% 1.9% -- 26.0% 6.7%2008 100.0% 78.3% 83.3% 3.3% -- 34.5% 5.5%2009 84.6% 35.3% 33.3% 7.0% -- 38.2% 10.0%2010 83.3% 46.8% 51.2% 1.3% -- 21.7% 2.5%2011 88.9% 42.9% 45.5% 6.0% -- 30.9% 6.7%
Observed annual catch (mt) of Pacific halibutMean 45.4 11.6 2.0 0.3 -- 0.9 0.0Min 12.1 2.3 0.1 0.0 -- 0.1 0.0Max 117.2 36.6 5.4 1.4 -- 1.6 0.0
Observed annual discard (mt) of Pacific halibut Mean 40.2 11.6 2.0 0.3 -- 0.9 0.0Min 9.5 2.3 0.1 0.0 -- 0.1 0.0Max 109.6 36.6 5.4 1.4 -- 1.6 0.0
% of Pacific halibut catch that was discarded2002 80.1% 95.5% 100.0% n.o.c. -- -- -- 2003 82.5% 99.5% 100.0% 100.0% -- n.o.c. n.o.c.2004 79.0% 97.7% 100.0% n.o.c. -- n.o.c. n.o.c.2005 84.8% 100.0% 100.0% n.o.c. -- n.o.c. n.o.c.2006 93.5% 97.9% 100.0% n.o.c. -- 100.0% n.o.c.2007 80.6% 100.0% 100.0% 100.0% -- 100.0% 100.0%2008 87.4% 100.0% 100.0% 100.0% -- 100.0% 100.0%2009 100.0% 100.0% 100.0% 100.0% -- 100.0% 100.0%2010 100.0% 100.0% 100.0% 100.0% -- 100.0% 100.0%2011 100.0% 100.0% 100.0% 100.0% -- 100.0% 100.0%
n.o.c. No observed catch of Pacific halibut and thus a % discarded calculation is not possible. -- No WCGOP observers were depolyed for the sector/year/gear type combination.
OA Fixed Gear
LonglinePot Longline Pot
Hook-and-Line
GearsPot
LE Sablefish Endorsed LE Non-Sablefish Endorsed
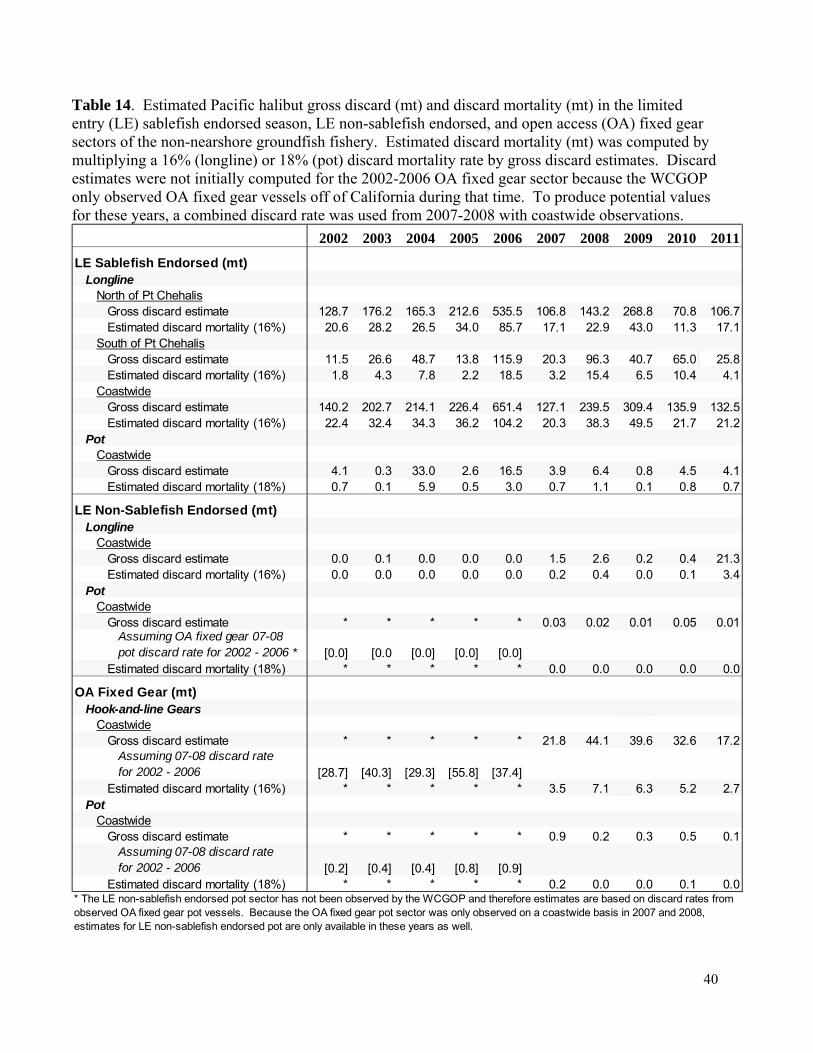
40
Table 14. Estimated Pacific halibut gross discard (mt) and discard mortality (mt) in the limited entry (LE) sablefish endorsed season, LE non-sablefish endorsed, and open access (OA) fixed gear sectors of the non-nearshore groundfish fishery. Estimated discard mortality (mt) was computed by multiplying a 16% (longline) or 18% (pot) discard mortality rate by gross discard estimates. Discard estimates were not initially computed for the 2002-2006 OA fixed gear sector because the WCGOP only observed OA fixed gear vessels off of California during that time. To produce potential values for these years, a combined discard rate was used from 2007-2008 with coastwide observations.
2002 2003 2004 2005 2006 2007 2008 2009 2010 2011
LE Sablefish Endorsed (mt)Longline
North of Pt ChehalisGross discard estimate 128.7 176.2 165.3 212.6 535.5 106.8 143.2 268.8 70.8 106.7Estimated discard mortality (16%) 20.6 28.2 26.5 34.0 85.7 17.1 22.9 43.0 11.3 17.1
South of Pt ChehalisGross discard estimate 11.5 26.6 48.7 13.8 115.9 20.3 96.3 40.7 65.0 25.8Estimated discard mortality (16%) 1.8 4.3 7.8 2.2 18.5 3.2 15.4 6.5 10.4 4.1
CoastwideGross discard estimate 140.2 202.7 214.1 226.4 651.4 127.1 239.5 309.4 135.9 132.5Estimated discard mortality (16%) 22.4 32.4 34.3 36.2 104.2 20.3 38.3 49.5 21.7 21.2
PotCoastwide
Gross discard estimate 4.1 0.3 33.0 2.6 16.5 3.9 6.4 0.8 4.5 4.1Estimated discard mortality (18%) 0.7 0.1 5.9 0.5 3.0 0.7 1.1 0.1 0.8 0.7
LE Non-Sablefish Endorsed (mt)Longline
CoastwideGross discard estimate 0.0 0.1 0.0 0.0 0.0 1.5 2.6 0.2 0.4 21.3Estimated discard mortality (16%) 0.0 0.0 0.0 0.0 0.0 0.2 0.4 0.0 0.1 3.4
PotCoastwide
Gross discard estimate * * * * * 0.03 0.02 0.01 0.05 0.01Assuming OA fixed gear 07-08 pot discard rate for 2002 - 2006 * [0.0] [0.0 [0.0] [0.0] [0.0]
Estimated discard mortality (18%) * * * * * 0.0 0.0 0.0 0.0 0.0
OA Fixed Gear (mt)Hook-and-line Gears
CoastwideGross discard estimate * * * * * 21.8 44.1 39.6 32.6 17.2
Assuming 07-08 discard rate for 2002 - 2006 [28.7] [40.3] [29.3] [55.8] [37.4]
Estimated discard mortality (16%) * * * * * 3.5 7.1 6.3 5.2 2.7Pot
CoastwideGross discard estimate * * * * * 0.9 0.2 0.3 0.5 0.1
Assuming 07-08 discard ratefor 2002 - 2006 [0.2] [0.4] [0.4] [0.8] [0.9]
Estimated discard mortality (18%) * * * * * 0.2 0.0 0.0 0.1 0.0* The LE non-sablefish endorsed pot sector has not been observed by the WCGOP and therefore estimates are based on discard rates from observed OA fixed gear pot vessels. Because the OA fixed gear pot sector was only observed on a coastwide basis in 2007 and 2008, estimates for LE non-sablefish endorsed pot are only available in these years as well.

41
Table 15. Estimated Pacific halibut discard mortality (mt) from each sector of the non-nearshore groundfish fixed gear fishery from 2002 through 2011.
LE Sablefish Endorsed
LE Non-Sablefish Endorsed
OA Fixed Gear All Sectors
2002 23.1 0.0 0.0 23.12003 32.5 0.0 0.0 32.52004 39.5 0.0 0.0 39.52005 36.6 0.0 0.0 36.62006 106.9 0.0 0.0 106.92007 21.0 0.2 3.6 24.82008 39.3 0.4 7.1 46.92009 49.7 0.0 6.4 56.12010 22.4 0.1 5.3 27.82011 21.9 3.4 2.8 28.1
Estimated discard mortality (mt)
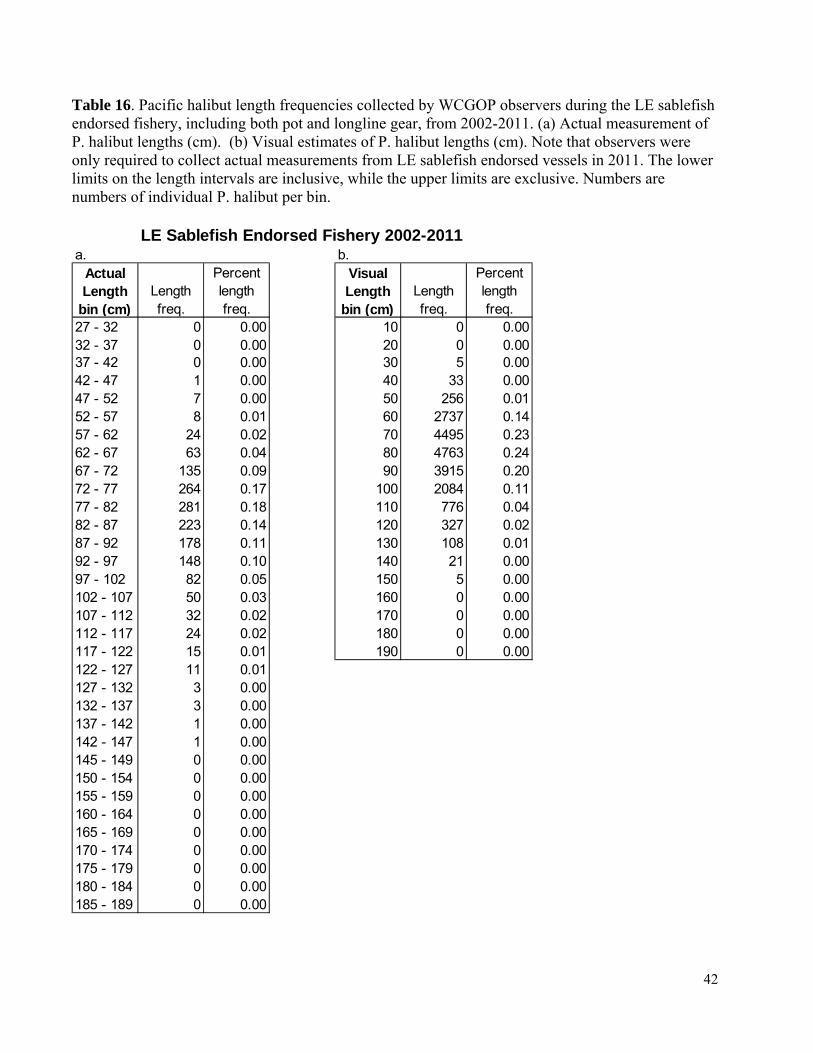
42
Table 16. Pacific halibut length frequencies collected by WCGOP observers during the LE sablefish endorsed fishery, including both pot and longline gear, from 2002-2011. (a) Actual measurement of P. halibut lengths (cm). (b) Visual estimates of P. halibut lengths (cm). Note that observers were only required to collect actual measurements from LE sablefish endorsed vessels in 2011. The lower limits on the length intervals are inclusive, while the upper limits are exclusive. Numbers are numbers of individual P. halibut per bin.
a. b.Actual Length
bin (cm)Length freq.
Percent length freq.
Visual Length
bin (cm)Length freq.
Percent length freq.
27 - 32 0 0.00 10 0 0.0032 - 37 0 0.00 20 0 0.0037 - 42 0 0.00 30 5 0.0042 - 47 1 0.00 40 33 0.0047 - 52 7 0.00 50 256 0.0152 - 57 8 0.01 60 2737 0.1457 - 62 24 0.02 70 4495 0.2362 - 67 63 0.04 80 4763 0.2467 - 72 135 0.09 90 3915 0.2072 - 77 264 0.17 100 2084 0.1177 - 82 281 0.18 110 776 0.0482 - 87 223 0.14 120 327 0.0287 - 92 178 0.11 130 108 0.0192 - 97 148 0.10 140 21 0.0097 - 102 82 0.05 150 5 0.00102 - 107 50 0.03 160 0 0.00107 - 112 32 0.02 170 0 0.00112 - 117 24 0.02 180 0 0.00117 - 122 15 0.01 190 0 0.00122 - 127 11 0.01127 - 132 3 0.00132 - 137 3 0.00137 - 142 1 0.00142 - 147 1 0.00145 - 149 0 0.00150 - 154 0 0.00155 - 159 0 0.00160 - 164 0 0.00165 - 169 0 0.00170 - 174 0 0.00175 - 179 0 0.00180 - 184 0 0.00185 - 189 0 0.00
LE Sablefish Endorsed Fishery 2002-2011
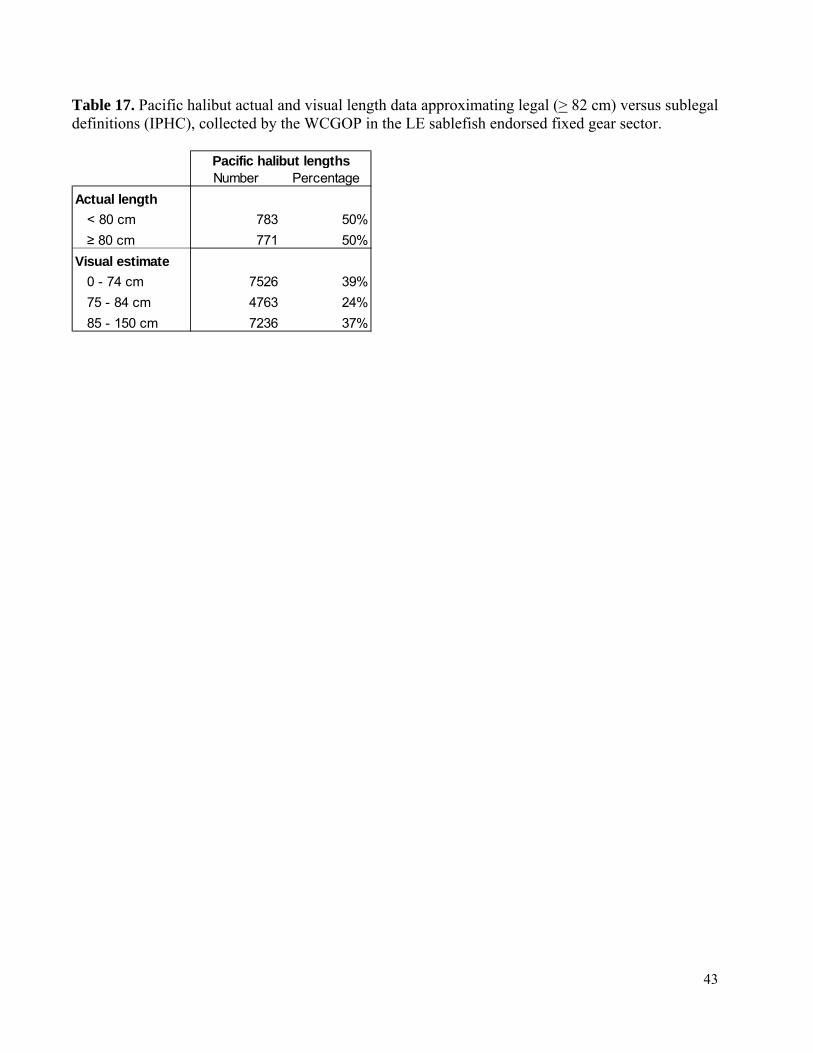
43
Table 17. Pacific halibut actual and visual length data approximating legal (> 82 cm) versus sublegal definitions (IPHC), collected by the WCGOP in the LE sablefish endorsed fixed gear sector.
Number Percentage
Actual length< 80 cm 783 50%
≥ 80 cm 771 50%
Visual estimate0 - 74 cm 7526 39%
75 - 84 cm 4763 24%
85 - 150 cm 7236 37%
Pacific halibut lengths
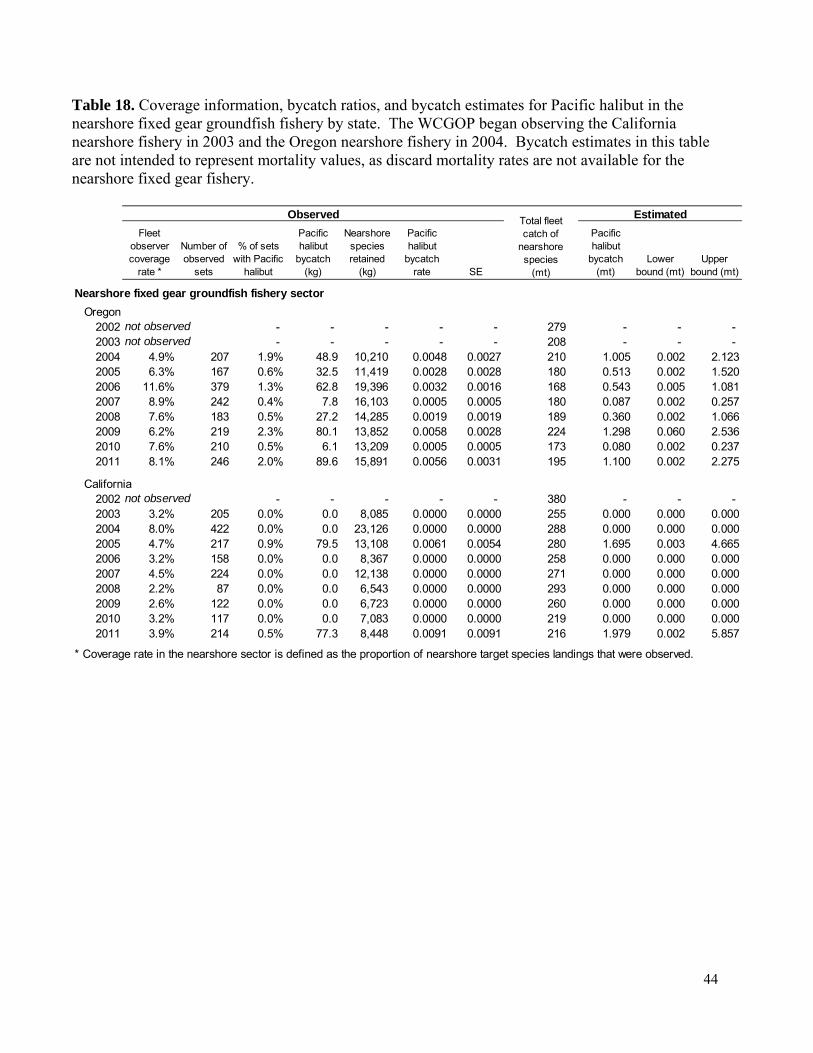
44
Table 18. Coverage information, bycatch ratios, and bycatch estimates for Pacific halibut in the nearshore fixed gear groundfish fishery by state. The WCGOP began observing the California nearshore fishery in 2003 and the Oregon nearshore fishery in 2004. Bycatch estimates in this table are not intended to represent mortality values, as discard mortality rates are not available for the nearshore fixed gear fishery.
Fleet observer coverage
rate *
Number of observed
sets
% of sets with Pacific
halibut
Pacific halibut
bycatch (kg)
Nearshore species retained
(kg)
Pacific halibut
bycatch rate SE
Pacific halibut
bycatch (mt)
Lower bound (mt)
Upper bound (mt)
Nearshore fixed gear groundfish fishery sectorOregon
2002 not observed - - - - - 279 - - - 2003 not observed - - - - - 208 - - - 2004 4.9% 207 1.9% 48.9 10,210 0.0048 0.0027 210 1.005 0.002 2.1232005 6.3% 167 0.6% 32.5 11,419 0.0028 0.0028 180 0.513 0.002 1.5202006 11.6% 379 1.3% 62.8 19,396 0.0032 0.0016 168 0.543 0.005 1.0812007 8.9% 242 0.4% 7.8 16,103 0.0005 0.0005 180 0.087 0.002 0.2572008 7.6% 183 0.5% 27.2 14,285 0.0019 0.0019 189 0.360 0.002 1.0662009 6.2% 219 2.3% 80.1 13,852 0.0058 0.0028 224 1.298 0.060 2.5362010 7.6% 210 0.5% 6.1 13,209 0.0005 0.0005 173 0.080 0.002 0.2372011 8.1% 246 2.0% 89.6 15,891 0.0056 0.0031 195 1.100 0.002 2.275
California2002 not observed - - - - - 380 - - - 2003 3.2% 205 0.0% 0.0 8,085 0.0000 0.0000 255 0.000 0.000 0.0002004 8.0% 422 0.0% 0.0 23,126 0.0000 0.0000 288 0.000 0.000 0.0002005 4.7% 217 0.9% 79.5 13,108 0.0061 0.0054 280 1.695 0.003 4.6652006 3.2% 158 0.0% 0.0 8,367 0.0000 0.0000 258 0.000 0.000 0.0002007 4.5% 224 0.0% 0.0 12,138 0.0000 0.0000 271 0.000 0.000 0.0002008 2.2% 87 0.0% 0.0 6,543 0.0000 0.0000 293 0.000 0.000 0.0002009 2.6% 122 0.0% 0.0 6,723 0.0000 0.0000 260 0.000 0.000 0.0002010 3.2% 117 0.0% 0.0 7,083 0.0000 0.0000 219 0.000 0.000 0.0002011 3.9% 214 0.5% 77.3 8,448 0.0091 0.0091 216 1.979 0.002 5.857
ObservedTotal fleet catch of
nearshore species
(mt)
Estimated
* Coverage rate in the nearshore sector is defined as the proportion of nearshore target species landings that were observed.
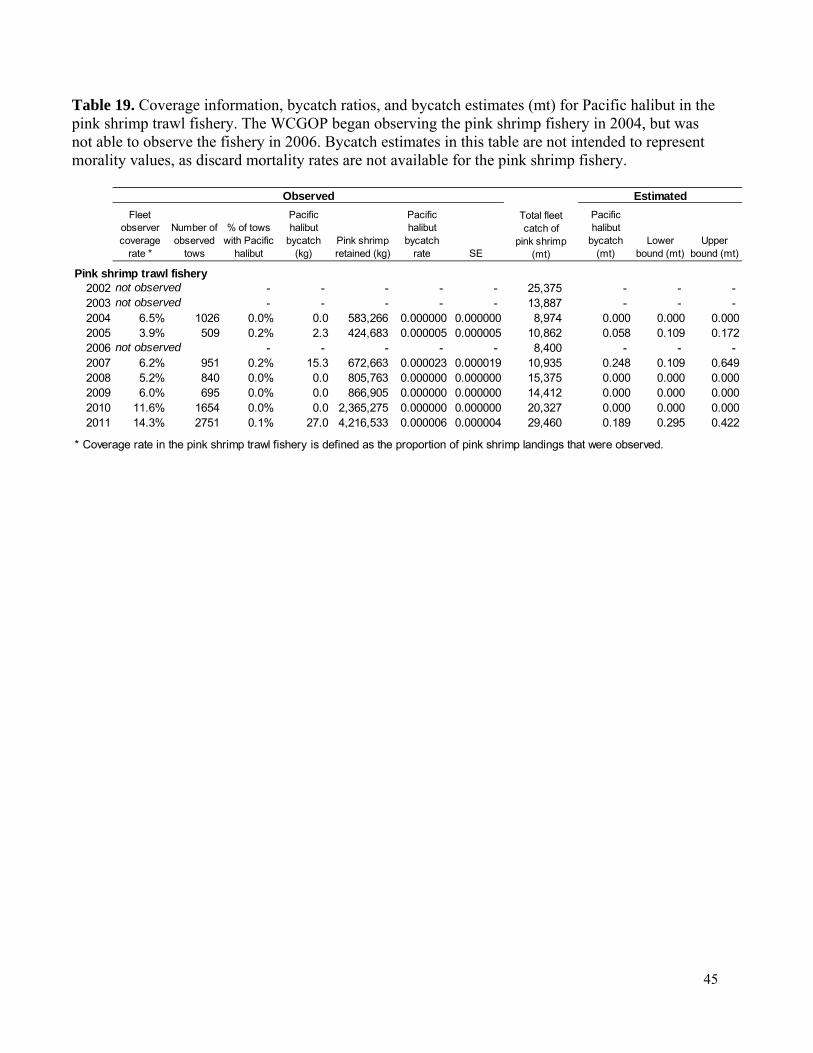
45
Table 19. Coverage information, bycatch ratios, and bycatch estimates (mt) for Pacific halibut in the pink shrimp trawl fishery. The WCGOP began observing the pink shrimp fishery in 2004, but was not able to observe the fishery in 2006. Bycatch estimates in this table are not intended to represent morality values, as discard mortality rates are not available for the pink shrimp fishery.
Fleet observer coverage
rate *
Number of observed
tows
% of tows with Pacific
halibut
Pacific halibut
bycatch (kg)
Pink shrimp retained (kg)
Pacific halibut
bycatch rate SE
Pacific halibut
bycatch (mt)
Lower bound (mt)
Upper bound (mt)
Pink shrimp trawl fishery2002 not observed - - - - - 25,375 - - - 2003 not observed - - - - - 13,887 - - - 2004 6.5% 1026 0.0% 0.0 583,266 0.000000 0.000000 8,974 0.000 0.000 0.0002005 3.9% 509 0.2% 2.3 424,683 0.000005 0.000005 10,862 0.058 0.109 0.1722006 not observed - - - - - 8,400 - - - 2007 6.2% 951 0.2% 15.3 672,663 0.000023 0.000019 10,935 0.248 0.109 0.6492008 5.2% 840 0.0% 0.0 805,763 0.000000 0.000000 15,375 0.000 0.000 0.0002009 6.0% 695 0.0% 0.0 866,905 0.000000 0.000000 14,412 0.000 0.000 0.0002010 11.6% 1654 0.0% 0.0 2,365,275 0.000000 0.000000 20,327 0.000 0.000 0.0002011 14.3% 2751 0.1% 27.0 4,216,533 0.000006 0.000004 29,460 0.189 0.295 0.422
* Coverage rate in the pink shrimp trawl fishery is defined as the proportion of pink shrimp landings that were observed.
ObservedTotal fleet catch of
pink shrimp (mt)
Estimated
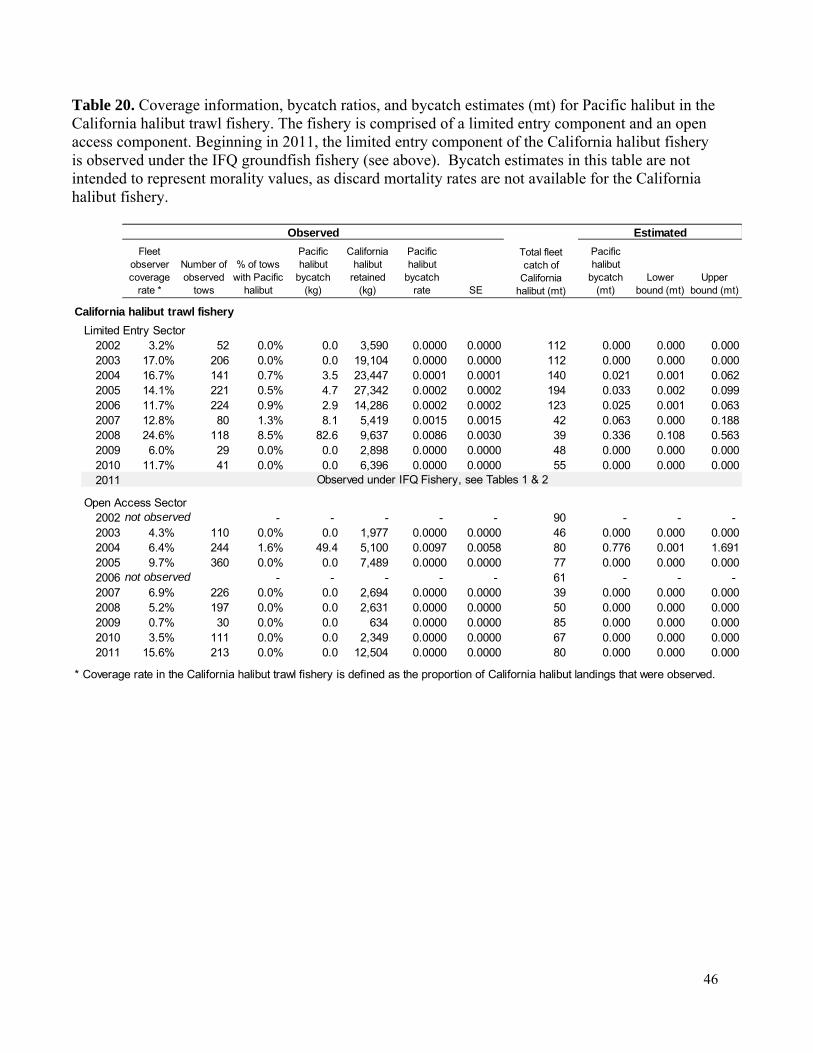
46
Table 20. Coverage information, bycatch ratios, and bycatch estimates (mt) for Pacific halibut in the California halibut trawl fishery. The fishery is comprised of a limited entry component and an open access component. Beginning in 2011, the limited entry component of the California halibut fishery is observed under the IFQ groundfish fishery (see above). Bycatch estimates in this table are not intended to represent morality values, as discard mortality rates are not available for the California halibut fishery.
Fleet observer coverage
rate *
Number of observed
tows
% of tows with Pacific
halibut
Pacific halibut
bycatch (kg)
California halibut
retained (kg)
Pacific halibut
bycatch rate SE
Pacific halibut
bycatch (mt)
Lower bound (mt)
Upper bound (mt)
California halibut trawl fisheryLimited Entry Sector
2002 3.2% 52 0.0% 0.0 3,590 0.0000 0.0000 112 0.000 0.000 0.0002003 17.0% 206 0.0% 0.0 19,104 0.0000 0.0000 112 0.000 0.000 0.0002004 16.7% 141 0.7% 3.5 23,447 0.0001 0.0001 140 0.021 0.001 0.0622005 14.1% 221 0.5% 4.7 27,342 0.0002 0.0002 194 0.033 0.002 0.0992006 11.7% 224 0.9% 2.9 14,286 0.0002 0.0002 123 0.025 0.001 0.0632007 12.8% 80 1.3% 8.1 5,419 0.0015 0.0015 42 0.063 0.000 0.1882008 24.6% 118 8.5% 82.6 9,637 0.0086 0.0030 39 0.336 0.108 0.5632009 6.0% 29 0.0% 0.0 2,898 0.0000 0.0000 48 0.000 0.000 0.0002010 11.7% 41 0.0% 0.0 6,396 0.0000 0.0000 55 0.000 0.000 0.0002011
Open Access Sector2002 not observed - - - - - 90 - - - 2003 4.3% 110 0.0% 0.0 1,977 0.0000 0.0000 46 0.000 0.000 0.0002004 6.4% 244 1.6% 49.4 5,100 0.0097 0.0058 80 0.776 0.001 1.6912005 9.7% 360 0.0% 0.0 7,489 0.0000 0.0000 77 0.000 0.000 0.0002006 not observed - - - - - 61 - - - 2007 6.9% 226 0.0% 0.0 2,694 0.0000 0.0000 39 0.000 0.000 0.0002008 5.2% 197 0.0% 0.0 2,631 0.0000 0.0000 50 0.000 0.000 0.0002009 0.7% 30 0.0% 0.0 634 0.0000 0.0000 85 0.000 0.000 0.0002010 3.5% 111 0.0% 0.0 2,349 0.0000 0.0000 67 0.000 0.000 0.0002011 15.6% 213 0.0% 0.0 12,504 0.0000 0.0000 80 0.000 0.000 0.000
* Coverage rate in the California halibut trawl fishery is defined as the proportion of California halibut landings that were observed.
Total fleet catch of
California halibut (mt)
EstimatedObserved
Observed under IFQ Fishery, see Tables 1 & 2
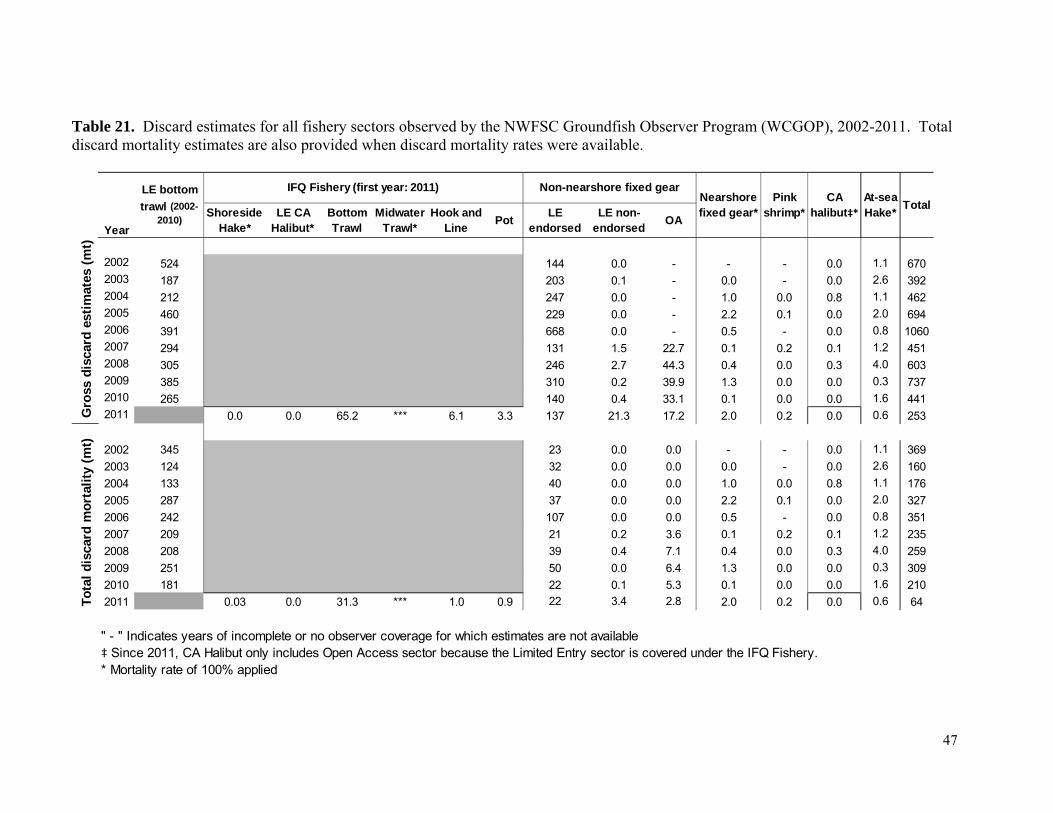
47
Table 21. Discard estimates for all fishery sectors observed by the NWFSC Groundfish Observer Program (WCGOP), 2002-2011. Total discard mortality estimates are also provided when discard mortality rates were available.
YearShoreside
Hake*LE CA
Halibut*Bottom Trawl
Midwater Trawl*
Hook and Line Pot LE
endorsedLE non-
endorsed OA
2002 524 144 0.0 - - - 0.0 1.1 6702003 187 203 0.1 - 0.0 - 0.0 2.6 3922004 212 247 0.0 - 1.0 0.0 0.8 1.1 4622005 460 229 0.0 - 2.2 0.1 0.0 2.0 6942006 391 668 0.0 - 0.5 - 0.0 0.8 10602007 294 131 1.5 22.7 0.1 0.2 0.1 1.2 4512008 305 246 2.7 44.3 0.4 0.0 0.3 4.0 6032009 385 310 0.2 39.9 1.3 0.0 0.0 0.3 7372010 265 140 0.4 33.1 0.1 0.0 0.0 1.6 4412011 0.0 0.0 65.2 *** 6.1 3.3 137 21.3 17.2 2.0 0.2 0.0 0.6 253
2002 345 23 0.0 0.0 - - 0.0 1.1 369
2003 124 32 0.0 0.0 0.0 - 0.0 2.6 160
2004 133 40 0.0 0.0 1.0 0.0 0.8 1.1 176
2005 287 37 0.0 0.0 2.2 0.1 0.0 2.0 327
2006 242 107 0.0 0.0 0.5 - 0.0 0.8 351
2007 209 21 0.2 3.6 0.1 0.2 0.1 1.2 235
2008 208 39 0.4 7.1 0.4 0.0 0.3 4.0 259
2009 251 50 0.0 6.4 1.3 0.0 0.0 0.3 309
2010 181 22 0.1 5.3 0.1 0.0 0.0 1.6 210
2011 0.03 0.0 31.3 *** 1.0 0.9 22 3.4 2.8 2.0 0.2 0.0 0.6 64
" - " Indicates years of incomplete or no observer coverage for which estimates are not available
LE bottom trawl (2002-
2010)
CA halibut‡*
At-sea Hake* Total
Non-nearshore fixed gearIFQ Fishery (first year: 2011)Nearshore fixed gear*
Pink shrimp*
* Mortality rate of 100% applied
Gro
ss d
isca
rd e
stim
ates
(mt)
Tota
l dis
card
mor
talit
y (m
t)
‡ Since 2011, CA Halibut only includes Open Access sector because the Limited Entry sector is covered under the IFQ Fishery.

48
FIGURES Figure 1. Fish ticket data processing for division into 2011 groundfish fishery sectors after retrieval from the Pacific Fisheries Information Network (PacFIN) database. Grey boxes indicate sectors for which federal observer data is available. Fish ticket processing methods are updated regularly, thus this figure might differ from similar figures in previous reports.
FiSH TICKET DATA
Tribal
Gear GroupShrimp
Fish Ticket Processing
Commercial
Research Exempted Fishing Permit Remaining
Gear GroupOther
Gear GroupFixed Gear
Gear GroupTrawl
Open Access Nearshore Species Landed - All FTs on Remaining
Limited Entry Open Access
Tier Endorsed Non-Tier Endorsed
Remaining (Non-Nearshore, Non-Sablefish, Non-Groundfish > Groundfish)
Non Season(DTL)
Primary SeasonAttaining Quota
Primary Season Reached Quota
(DTL)
Limited Entry Open Access
Tier Endorsed Non-Tier Endorsed
Gear GroupFixed Gear
Nearshore Species Landed - All FTs on Remaining
Sablefish Landed orGroundfish >= Non-Groundfish
Limited Entry
Tier Endorsed
IFQ
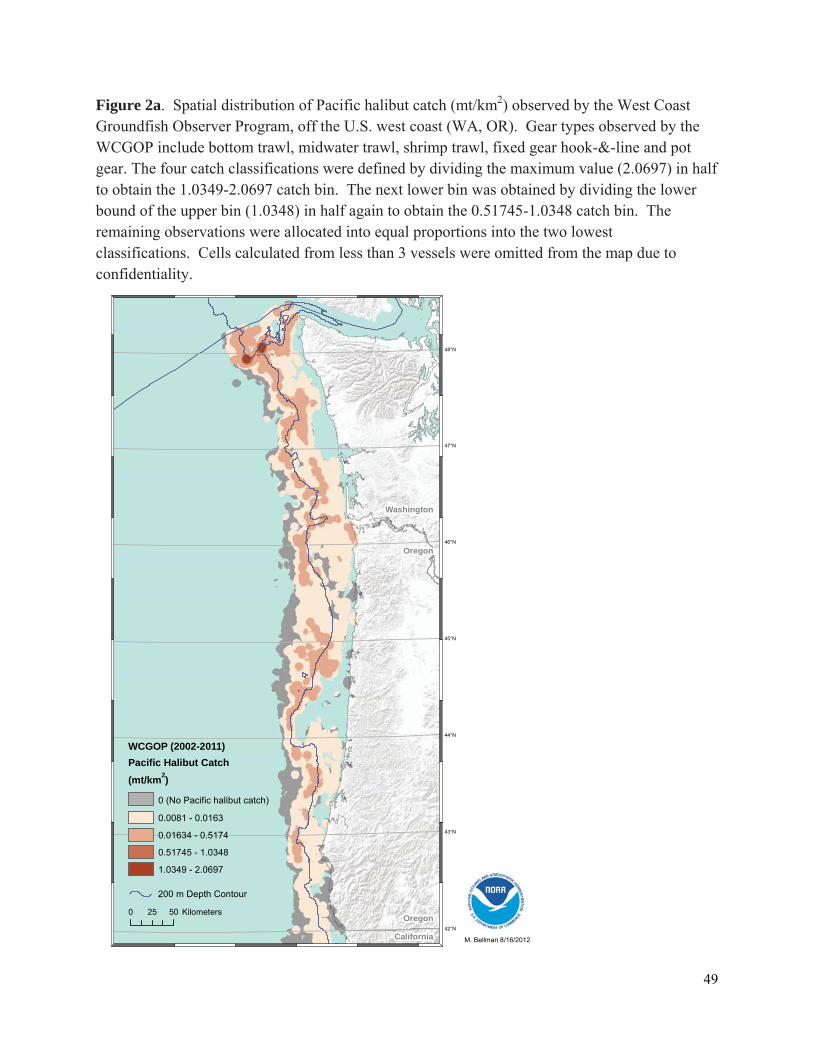
49
Figure 2a. Spatial distribution of Pacific halibut catch (mt/km2) observed by the West Coast Groundfish Observer Program, off the U.S. west coast (WA, OR). Gear types observed by the WCGOP include bottom trawl, midwater trawl, shrimp trawl, fixed gear hook-&-line and pot gear. The four catch classifications were defined by dividing the maximum value (2.0697) in half to obtain the 1.0349-2.0697 catch bin. The next lower bin was obtained by dividing the lower bound of the upper bin (1.0348) in half again to obtain the 0.51745-1.0348 catch bin. The remaining observations were allocated into equal proportions into the two lowest classifications. Cells calculated from less than 3 vessels were omitted from the map due to confidentiality.
48°N
47°N
46°N
45°N
44°N
43°N
42°N
Washington
0 5025 Kilometers
Pacific Halibut Catch(mt/km2)
WCGOP (2002-2011)
200 m Depth Contour
M. Bellman 8/16/2012
Oregon
0.0081 - 0.0163
0.01634 - 0.5174
0.51745 - 1.0348
1.0349 - 2.0697
California
Oregon
0 (No Pacific halibut catch)

50
Figure 2b. Spatial distribution of Pacific halibut catch (mt/km2) and fishing grounds observed by the West Coast Groundfish Observer Program, off the U.S. west coast (CA). See Figure 2a caption for full description.
120°W125°W
40°N
35°N
42°N
41°N
40°N
39°N
38°N
37°N
36°N
35°N
34°N
0 5025 Kilometers
Pacific Halibut Catch(mt/km2)
0
200 m Depth Contour
M. Bellman 8/16/2012
Oregon
California
WCGOP (2002-2011)
0.0081 - 0.0163
0.01634 - 0.5174
0.5175 - 1.0348
1.0349 - 2.0697
0 (No Pacific halibut catch)
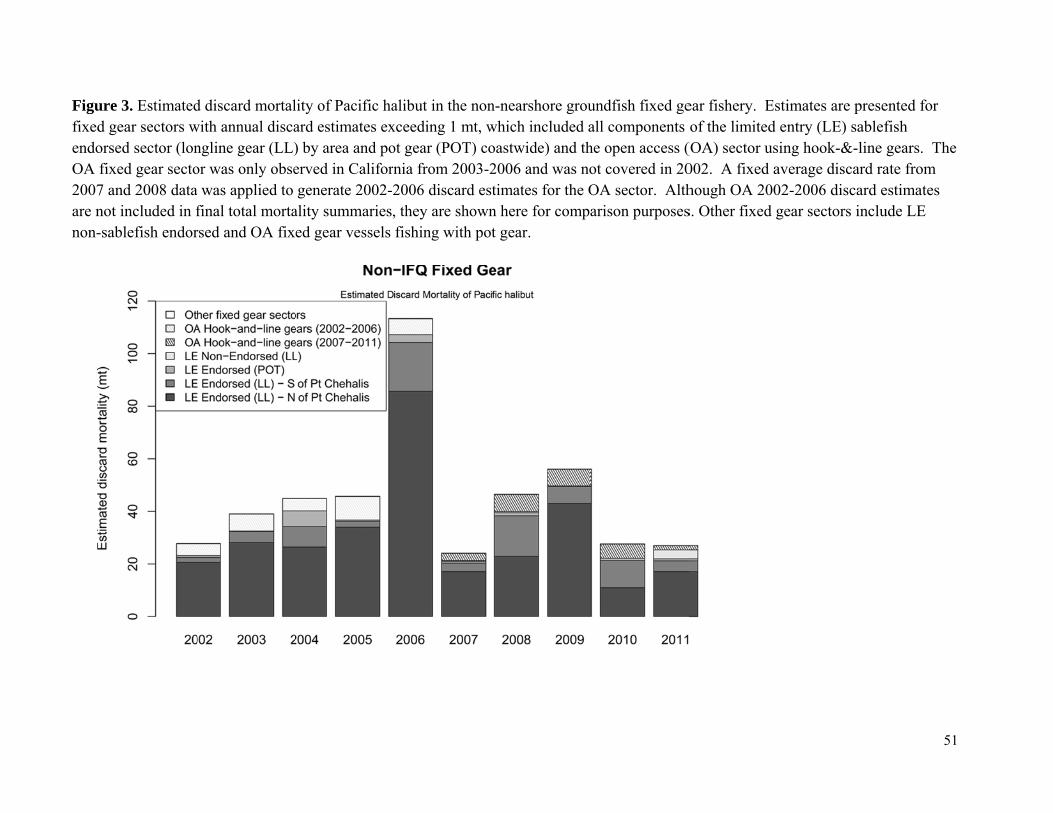
FigufixedendoOA 2007are nnon-
ure 3. Estimatedd gear sectors worsed sector (lonfixed gear secto7 and 2008 datanot included in f-sablefish endor
d discard mortalwith annual discangline gear (LL)or was only obsea was applied to final total mortarsed and OA fix
lity of Pacific haard estimates ex) by area and poerved in Califorgenerate 2002-2
ality summaries,ed gear vessels
alibut in the nonxceeding 1 mt, wot gear (POT) conia from 2003-22006 discard est, they are shownfishing with pot
n-nearshore grouwhich included aoastwide) and th2006 and was notimates for the On here for compt gear.
undfish fixed geall components he open access (ot covered in 20OA sector. Altharison purposes
ear fishery. Estiof the limited en
(OA) sector usin002. A fixed avhough OA 2002s. Other fixed ge
imates are presentry (LE) sablefng hook-&-lineverage discard ra2-2006 discard eear sectors inclu
51
ented for fish gears. The ate from estimates ude LE
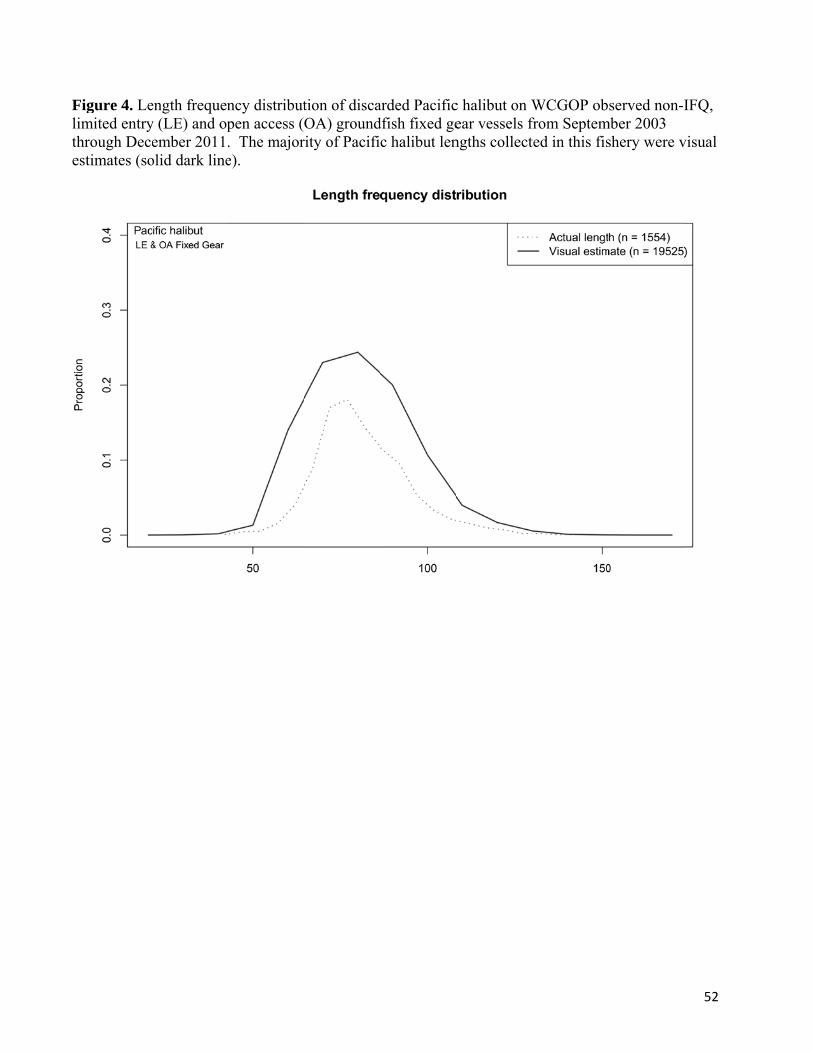
Flte
Figure 4. Lelimited entrythrough Deceestimates (so
ength frequeny (LE) and opember 2011.
olid dark line
ncy distributpen access (. The majore).
tion of discaOA) ground
rity of Pacifi
arded Pacificdfish fixed gec halibut len
c halibut on Wear vessels fngths collect
WCGOP obfrom Septemted in this fis
served non-Imber 2003 shery were v
52
IFQ,
visual

53
APPENDIX A
Weighted catch composition data from the IFQ fishery for bottom trawl and pot gears. The frequency within each length bin was weighted based on the following equation:
lstl
sl
tst
s
st
tst
lstl
stlwghtd w
Wn
W
W
W
W
w
Wnn
l
ˆˆ
where: nl: number of measured fish in length bin l wstl: total weight of length l fish measured, as determined through the IPHC length-weight relationship Wst: total observed discard weight of Pacific halibut on tow t, in stratum s
sW : estimated total discard weight of Pacific halibut in stratum s Table A1. Weighted length frequency distributions for Pacific halibut in the 2011 IFQ fishery for bottom trawl and pot gears.
Length bin
(cm)
Bottom Trawl
PotLength
bin (cm)Bottom Trawl
PotLength
bin (cm)Bottom Trawl
Pot
18 0.0065 0.0000 80 0.0575 0.1033 142 0.0001 0.0000
20 0.0000 0.0000 82 0.0471 0.0504 144 0.0001 0.0000
22 0.0000 0.0000 84 0.0457 0.0459 146 0.0000 0.0000
24 0.0000 0.0000 86 0.0306 0.0329 148 0.0000 0.0000
26 0.0000 0.0000 88 0.0282 0.0297 150 0.0000 0.0000
28 0.0000 0.0000 90 0.0263 0.0455 152 0.0000 0.0000
30 0.0000 0.0734 92 0.0213 0.0173 154 0.0000 0.0000
32 0.0000 0.0000 94 0.0168 0.0149 156 0.0000 0.0000
34 0.0000 0.0000 96 0.0135 0.0123 158 0.0000 0.0000
36 0.0000 0.0000 98 0.0097 0.0098 160 0.0000 0.0000
38 0.0000 0.0000 100 0.0090 0.0194 162 0.0000 0.0000
40 0.0041 0.0578 102 0.0071 0.0020 164 0.0000 0.0000
42 0.0023 0.0000 104 0.0055 0.0019 166 0.0000 0.0003
44 0.0000 0.0197 106 0.0040 0.0000 168 0.0000 0.0000
46 0.0003 0.0000 108 0.0031 0.0028 170 0.0000 0.0000
48 0.0029 0.0000 110 0.0025 0.0016 172 0.0000 0.0000
50 0.0054 0.0063 112 0.0020 0.0010 174 0.0000 0.0000
52 0.0045 0.0000 114 0.0018 0.0022 176 0.0000 0.0000
54 0.0078 0.0103 116 0.0011 0.0004 178 0.0000 0.0000
56 0.0073 0.0044 118 0.0009 0.0009 180 0.0000 0.0000
58 0.0191 0.0121 120 0.0005 0.0024 182 0.0000 0.0000
60 0.0330 0.0605 122 0.0005 0.0023 184 0.0000 0.0000
62 0.0435 0.0501 124 0.0006 0.0000 186 0.0000 0.0000
64 0.0556 0.0174 126 0.0003 0.0000 188 0.0000 0.0000
66 0.0579 0.0109 128 0.0003 0.0007 190 0.0000 0.0000
68 0.0561 0.0172 130 0.0001 0.0006 192 0.0000 0.0000
70 0.0771 0.0680 132 0.0002 0.0000 194 0.0000 0.0000
72 0.0727 0.0726 134 0.0000 0.0006 196 0.0000 0.0000
74 0.0851 0.0433 136 0.0001 0.0005 198 0.0000 0.0000
76 0.0665 0.0147 138 0.0000 0.0002 200 0.0000 0.0001
78 0.0556 0.0595 140 0.0001 0.0000
IFQ Fishery2011
IFQ Fishery2011
IFQ Fishery2011

54
Table A2. Percentage of weighted length measurements in each viability condition category, by gear type in the 2011 IFQ groundfish fishery.
Excellent Poor Dead Excellent Poor Dead Excellent Poor Dead Excellent Poor Dead18 100.0% 0.0% 0.0% 0.0% 0.0% 0.0% 110 56.3% 11.2% 32.5% 100.0% 0.0% 0.0%20 0.0% 0.0% 0.0% 0.0% 0.0% 0.0% 112 56.7% 22.5% 20.8% 100.0% 0.0% 0.0%22 0.0% 0.0% 0.0% 0.0% 0.0% 0.0% 114 49.8% 25.1% 25.0% 57.6% 0.0% 42.4%24 0.0% 0.0% 0.0% 0.0% 0.0% 0.0% 116 60.8% 13.4% 25.7% 0.0% 0.0% 100.0%26 0.0% 0.0% 0.0% 0.0% 0.0% 0.0% 118 55.9% 9.8% 34.3% 0.0% 0.0% 100.0%28 0.0% 0.0% 0.0% 0.0% 0.0% 0.0% 120 47.5% 28.3% 24.2% 100.0% 0.0% 0.0%30 0.0% 0.0% 0.0% 0.0% 0.0% 0.0% 122 54.3% 8.2% 37.5% 100.0% 0.0% 0.0%32 0.0% 0.0% 0.0% 0.0% 0.0% 0.0% 124 39.9% 21.7% 38.3% 0.0% 0.0% 0.0%34 0.0% 0.0% 0.0% 0.0% 0.0% 0.0% 126 41.9% 19.3% 38.8% 0.0% 0.0% 0.0%36 0.0% 0.0% 0.0% 0.0% 0.0% 0.0% 128 53.2% 35.4% 11.4% 100.0% 0.0% 0.0%38 0.0% 0.0% 0.0% 0.0% 0.0% 0.0% 130 75.3% 24.7% 0.0% 100.0% 0.0% 0.0%40 0.0% 100.0% 0.0% 0.0% 0.0% 0.0% 132 45.2% 18.4% 36.4% 0.0% 0.0% 0.0%42 48.7% 51.3% 0.0% 0.0% 0.0% 0.0% 134 79.1% 20.9% 0.0% 100.0% 0.0% 0.0%44 0.0% 0.0% 0.0% 100.0% 0.0% 0.0% 136 25.4% 49.1% 25.4% 100.0% 0.0% 0.0%46 0.0% 0.0% 100.0% 0.0% 0.0% 0.0% 138 0.0% 100.0% 0.0% 100.0% 0.0% 0.0%48 25.1% 25.1% 49.7% 0.0% 0.0% 0.0% 140 48.9% 51.1% 0.0% 0.0% 0.0% 0.0%50 29.8% 0.0% 70.2% 0.0% 0.0% 0.0% 142 24.9% 25.4% 49.7% 0.0% 0.0% 0.0%52 23.0% 42.3% 34.7% 0.0% 0.0% 0.0% 144 59.2% 40.8% 0.0% 0.0% 0.0% 0.0%54 15.7% 42.8% 41.5% 0.0% 0.0% 100.0% 146 100.0% 0.0% 0.0% 0.0% 0.0% 0.0%56 20.8% 45.3% 33.9% 100.0% 0.0% 0.0% 148 49.4% 0.0% 50.6% 0.0% 0.0% 0.0%58 19.9% 31.2% 48.9% 67.9% 0.0% 32.1% 150 0.0% 0.0% 0.0% 0.0% 0.0% 0.0%60 32.9% 24.2% 42.9% 57.3% 0.0% 42.7% 152 0.0% 0.0% 0.0% 0.0% 0.0% 0.0%62 37.8% 22.7% 39.6% 38.0% 0.0% 62.0% 154 0.0% 0.0% 0.0% 0.0% 0.0% 0.0%64 39.6% 18.7% 41.7% 34.5% 0.0% 65.5% 156 0.0% 0.0% 0.0% 0.0% 0.0% 0.0%66 36.7% 21.1% 42.3% 50.0% 0.0% 50.0% 158 0.0% 0.0% 0.0% 0.0% 0.0% 0.0%68 42.6% 12.0% 45.4% 69.9% 0.0% 30.1% 160 0.0% 0.0% 0.0% 0.0% 0.0% 0.0%70 41.6% 20.8% 37.7% 62.2% 3.4% 34.4% 162 0.0% 0.0% 0.0% 0.0% 0.0% 0.0%72 38.6% 20.9% 40.5% 77.3% 0.0% 22.7% 164 0.0% 0.0% 0.0% 0.0% 0.0% 0.0%74 40.2% 17.4% 42.4% 69.2% 9.1% 21.7% 166 0.0% 0.0% 0.0% 100.0% 0.0% 0.0%76 45.7% 16.9% 37.4% 43.2% 0.0% 56.8% 168 0.0% 0.0% 0.0% 0.0% 0.0% 0.0%78 41.3% 18.9% 39.8% 59.1% 7.9% 33.0% 170 0.0% 0.0% 0.0% 0.0% 0.0% 0.0%80 45.9% 15.9% 38.2% 57.6% 1.7% 40.7% 172 0.0% 0.0% 0.0% 0.0% 0.0% 0.0%82 45.8% 19.9% 34.3% 86.4% 5.6% 8.0% 174 0.0% 0.0% 0.0% 0.0% 0.0% 0.0%84 50.4% 14.7% 34.9% 59.3% 6.0% 34.7% 176 0.0% 0.0% 0.0% 0.0% 0.0% 0.0%86 44.9% 14.5% 40.6% 85.3% 7.4% 7.4% 178 0.0% 0.0% 0.0% 0.0% 0.0% 0.0%88 41.7% 16.1% 42.2% 92.4% 0.0% 7.6% 180 0.0% 0.0% 0.0% 0.0% 0.0% 0.0%90 48.5% 16.9% 34.5% 70.5% 0.0% 29.5% 182 0.0% 0.0% 0.0% 0.0% 0.0% 0.0%92 47.0% 17.2% 35.8% 55.8% 22.1% 22.1% 184 0.0% 0.0% 0.0% 0.0% 0.0% 0.0%94 51.2% 20.1% 28.7% 52.2% 23.9% 23.9% 186 0.0% 0.0% 0.0% 0.0% 0.0% 0.0%96 49.5% 14.6% 35.9% 45.6% 13.4% 41.0% 188 0.0% 0.0% 0.0% 0.0% 0.0% 0.0%98 50.0% 18.2% 31.8% 53.2% 0.0% 46.8% 190 0.0% 0.0% 0.0% 0.0% 0.0% 0.0%
100 53.9% 18.2% 27.9% 77.6% 0.0% 22.4% 192 0.0% 0.0% 0.0% 0.0% 0.0% 0.0%102 47.4% 16.1% 36.5% 100.0% 0.0% 0.0% 194 0.0% 0.0% 0.0% 0.0% 0.0% 0.0%104 53.0% 18.8% 28.2% 100.0% 0.0% 0.0% 196 0.0% 0.0% 0.0% 0.0% 0.0% 0.0%106 54.4% 18.4% 27.2% 0.0% 0.0% 0.0% 198 0.0% 0.0% 0.0% 0.0% 0.0% 0.0%108 54.3% 19.9% 25.8% 18.5% 0.0% 81.5% 200 0.0% 0.0% 0.0% 100.0% 0.0% 0.0%
Length bin (cm)
Bottom Trawl Pot
IFQ Fishery 2011
Bottom Trawl PotLength bin (cm)
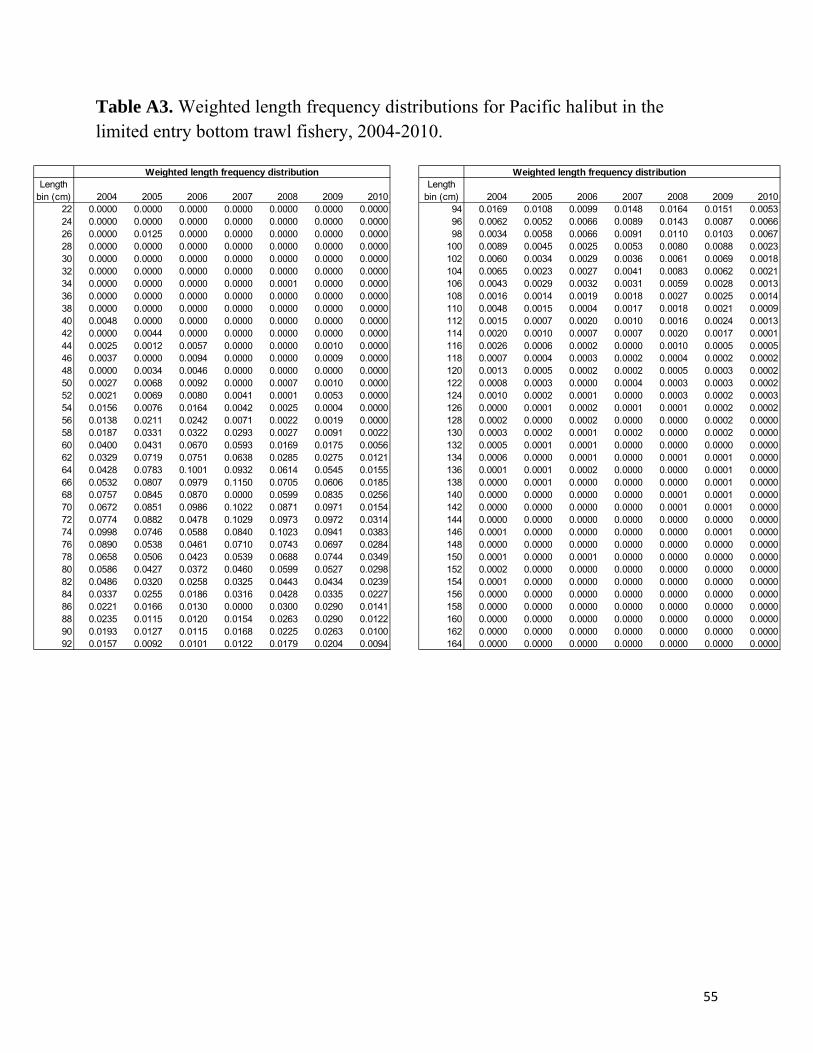
55
Table A3. Weighted length frequency distributions for Pacific halibut in the limited entry bottom trawl fishery, 2004-2010.
Length bin (cm) 2004 2005 2006 2007 2008 2009 2010
Length bin (cm) 2004 2005 2006 2007 2008 2009 2010
22 0.0000 0.0000 0.0000 0.0000 0.0000 0.0000 0.0000 94 0.0169 0.0108 0.0099 0.0148 0.0164 0.0151 0.005324 0.0000 0.0000 0.0000 0.0000 0.0000 0.0000 0.0000 96 0.0062 0.0052 0.0066 0.0089 0.0143 0.0087 0.006626 0.0000 0.0125 0.0000 0.0000 0.0000 0.0000 0.0000 98 0.0034 0.0058 0.0066 0.0091 0.0110 0.0103 0.006728 0.0000 0.0000 0.0000 0.0000 0.0000 0.0000 0.0000 100 0.0089 0.0045 0.0025 0.0053 0.0080 0.0088 0.002330 0.0000 0.0000 0.0000 0.0000 0.0000 0.0000 0.0000 102 0.0060 0.0034 0.0029 0.0036 0.0061 0.0069 0.001832 0.0000 0.0000 0.0000 0.0000 0.0000 0.0000 0.0000 104 0.0065 0.0023 0.0027 0.0041 0.0083 0.0062 0.002134 0.0000 0.0000 0.0000 0.0000 0.0001 0.0000 0.0000 106 0.0043 0.0029 0.0032 0.0031 0.0059 0.0028 0.001336 0.0000 0.0000 0.0000 0.0000 0.0000 0.0000 0.0000 108 0.0016 0.0014 0.0019 0.0018 0.0027 0.0025 0.001438 0.0000 0.0000 0.0000 0.0000 0.0000 0.0000 0.0000 110 0.0048 0.0015 0.0004 0.0017 0.0018 0.0021 0.000940 0.0048 0.0000 0.0000 0.0000 0.0000 0.0000 0.0000 112 0.0015 0.0007 0.0020 0.0010 0.0016 0.0024 0.001342 0.0000 0.0044 0.0000 0.0000 0.0000 0.0000 0.0000 114 0.0020 0.0010 0.0007 0.0007 0.0020 0.0017 0.000144 0.0025 0.0012 0.0057 0.0000 0.0000 0.0010 0.0000 116 0.0026 0.0006 0.0002 0.0000 0.0010 0.0005 0.000546 0.0037 0.0000 0.0094 0.0000 0.0000 0.0009 0.0000 118 0.0007 0.0004 0.0003 0.0002 0.0004 0.0002 0.000248 0.0000 0.0034 0.0046 0.0000 0.0000 0.0000 0.0000 120 0.0013 0.0005 0.0002 0.0002 0.0005 0.0003 0.000250 0.0027 0.0068 0.0092 0.0000 0.0007 0.0010 0.0000 122 0.0008 0.0003 0.0000 0.0004 0.0003 0.0003 0.000252 0.0021 0.0069 0.0080 0.0041 0.0001 0.0053 0.0000 124 0.0010 0.0002 0.0001 0.0000 0.0003 0.0002 0.000354 0.0156 0.0076 0.0164 0.0042 0.0025 0.0004 0.0000 126 0.0000 0.0001 0.0002 0.0001 0.0001 0.0002 0.000256 0.0138 0.0211 0.0242 0.0071 0.0022 0.0019 0.0000 128 0.0002 0.0000 0.0002 0.0000 0.0000 0.0002 0.000058 0.0187 0.0331 0.0322 0.0293 0.0027 0.0091 0.0022 130 0.0003 0.0002 0.0001 0.0002 0.0000 0.0002 0.000060 0.0400 0.0431 0.0670 0.0593 0.0169 0.0175 0.0056 132 0.0005 0.0001 0.0001 0.0000 0.0000 0.0000 0.000062 0.0329 0.0719 0.0751 0.0638 0.0285 0.0275 0.0121 134 0.0006 0.0000 0.0001 0.0000 0.0001 0.0001 0.000064 0.0428 0.0783 0.1001 0.0932 0.0614 0.0545 0.0155 136 0.0001 0.0001 0.0002 0.0000 0.0000 0.0001 0.000066 0.0532 0.0807 0.0979 0.1150 0.0705 0.0606 0.0185 138 0.0000 0.0001 0.0000 0.0000 0.0000 0.0001 0.000068 0.0757 0.0845 0.0870 0.0000 0.0599 0.0835 0.0256 140 0.0000 0.0000 0.0000 0.0000 0.0001 0.0001 0.000070 0.0672 0.0851 0.0986 0.1022 0.0871 0.0971 0.0154 142 0.0000 0.0000 0.0000 0.0000 0.0001 0.0001 0.000072 0.0774 0.0882 0.0478 0.1029 0.0973 0.0972 0.0314 144 0.0000 0.0000 0.0000 0.0000 0.0000 0.0000 0.000074 0.0998 0.0746 0.0588 0.0840 0.1023 0.0941 0.0383 146 0.0001 0.0000 0.0000 0.0000 0.0000 0.0001 0.000076 0.0890 0.0538 0.0461 0.0710 0.0743 0.0697 0.0284 148 0.0000 0.0000 0.0000 0.0000 0.0000 0.0000 0.000078 0.0658 0.0506 0.0423 0.0539 0.0688 0.0744 0.0349 150 0.0001 0.0000 0.0001 0.0000 0.0000 0.0000 0.000080 0.0586 0.0427 0.0372 0.0460 0.0599 0.0527 0.0298 152 0.0002 0.0000 0.0000 0.0000 0.0000 0.0000 0.000082 0.0486 0.0320 0.0258 0.0325 0.0443 0.0434 0.0239 154 0.0001 0.0000 0.0000 0.0000 0.0000 0.0000 0.000084 0.0337 0.0255 0.0186 0.0316 0.0428 0.0335 0.0227 156 0.0000 0.0000 0.0000 0.0000 0.0000 0.0000 0.000086 0.0221 0.0166 0.0130 0.0000 0.0300 0.0290 0.0141 158 0.0000 0.0000 0.0000 0.0000 0.0000 0.0000 0.000088 0.0235 0.0115 0.0120 0.0154 0.0263 0.0290 0.0122 160 0.0000 0.0000 0.0000 0.0000 0.0000 0.0000 0.000090 0.0193 0.0127 0.0115 0.0168 0.0225 0.0263 0.0100 162 0.0000 0.0000 0.0000 0.0000 0.0000 0.0000 0.000092 0.0157 0.0092 0.0101 0.0122 0.0179 0.0204 0.0094 164 0.0000 0.0000 0.0000 0.0000 0.0000 0.0000 0.0000
Weighted length frequency distribution Weighted length frequency distribution
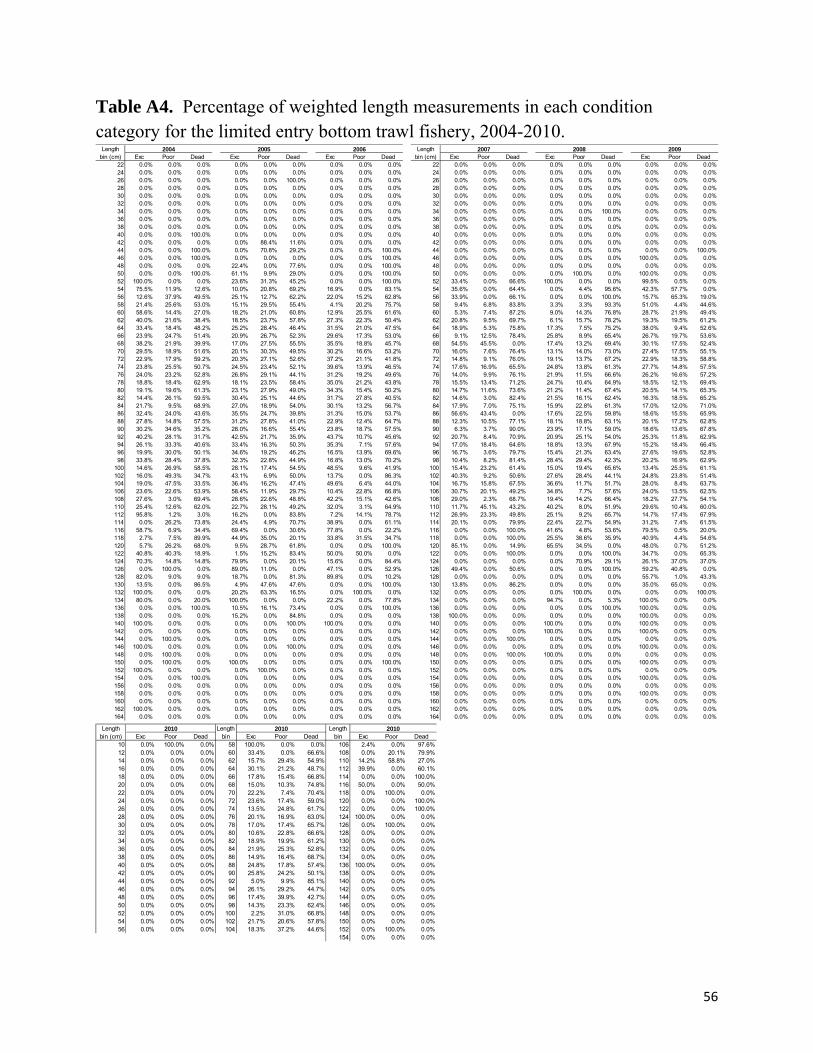
56
Table A4. Percentage of weighted length measurements in each condition category for the limited entry bottom trawl fishery, 2004-2010.
Exc Poor Dead Exc Poor Dead Exc Poor Dead Exc Poor Dead Exc Poor Dead Exc Poor Dead22 0.0% 0.0% 0.0% 0.0% 0.0% 0.0% 0.0% 0.0% 0.0% 22 0.0% 0.0% 0.0% 0.0% 0.0% 0.0% 0.0% 0.0% 0.0%24 0.0% 0.0% 0.0% 0.0% 0.0% 0.0% 0.0% 0.0% 0.0% 24 0.0% 0.0% 0.0% 0.0% 0.0% 0.0% 0.0% 0.0% 0.0%26 0.0% 0.0% 0.0% 0.0% 0.0% 100.0% 0.0% 0.0% 0.0% 26 0.0% 0.0% 0.0% 0.0% 0.0% 0.0% 0.0% 0.0% 0.0%28 0.0% 0.0% 0.0% 0.0% 0.0% 0.0% 0.0% 0.0% 0.0% 28 0.0% 0.0% 0.0% 0.0% 0.0% 0.0% 0.0% 0.0% 0.0%30 0.0% 0.0% 0.0% 0.0% 0.0% 0.0% 0.0% 0.0% 0.0% 30 0.0% 0.0% 0.0% 0.0% 0.0% 0.0% 0.0% 0.0% 0.0%32 0.0% 0.0% 0.0% 0.0% 0.0% 0.0% 0.0% 0.0% 0.0% 32 0.0% 0.0% 0.0% 0.0% 0.0% 0.0% 0.0% 0.0% 0.0%34 0.0% 0.0% 0.0% 0.0% 0.0% 0.0% 0.0% 0.0% 0.0% 34 0.0% 0.0% 0.0% 0.0% 0.0% 100.0% 0.0% 0.0% 0.0%36 0.0% 0.0% 0.0% 0.0% 0.0% 0.0% 0.0% 0.0% 0.0% 36 0.0% 0.0% 0.0% 0.0% 0.0% 0.0% 0.0% 0.0% 0.0%38 0.0% 0.0% 0.0% 0.0% 0.0% 0.0% 0.0% 0.0% 0.0% 38 0.0% 0.0% 0.0% 0.0% 0.0% 0.0% 0.0% 0.0% 0.0%40 0.0% 0.0% 100.0% 0.0% 0.0% 0.0% 0.0% 0.0% 0.0% 40 0.0% 0.0% 0.0% 0.0% 0.0% 0.0% 0.0% 0.0% 0.0%42 0.0% 0.0% 0.0% 0.0% 88.4% 11.6% 0.0% 0.0% 0.0% 42 0.0% 0.0% 0.0% 0.0% 0.0% 0.0% 0.0% 0.0% 0.0%44 0.0% 0.0% 100.0% 0.0% 70.8% 29.2% 0.0% 0.0% 100.0% 44 0.0% 0.0% 0.0% 0.0% 0.0% 0.0% 0.0% 0.0% 100.0%46 0.0% 0.0% 100.0% 0.0% 0.0% 0.0% 0.0% 0.0% 100.0% 46 0.0% 0.0% 0.0% 0.0% 0.0% 0.0% 100.0% 0.0% 0.0%48 0.0% 0.0% 0.0% 22.4% 0.0% 77.6% 0.0% 0.0% 100.0% 48 0.0% 0.0% 0.0% 0.0% 0.0% 0.0% 0.0% 0.0% 0.0%50 0.0% 0.0% 100.0% 61.1% 9.9% 29.0% 0.0% 0.0% 100.0% 50 0.0% 0.0% 0.0% 0.0% 100.0% 0.0% 100.0% 0.0% 0.0%52 100.0% 0.0% 0.0% 23.6% 31.3% 45.2% 0.0% 0.0% 100.0% 52 33.4% 0.0% 66.6% 100.0% 0.0% 0.0% 99.5% 0.5% 0.0%54 75.5% 11.9% 12.6% 10.0% 20.8% 69.2% 16.9% 0.0% 83.1% 54 35.6% 0.0% 64.4% 0.0% 4.4% 95.6% 42.3% 57.7% 0.0%56 12.6% 37.9% 49.5% 25.1% 12.7% 62.2% 22.0% 15.2% 62.8% 56 33.9% 0.0% 66.1% 0.0% 0.0% 100.0% 15.7% 65.3% 19.0%58 21.4% 25.6% 53.0% 15.1% 29.5% 55.4% 4.1% 20.2% 75.7% 58 9.4% 6.8% 83.8% 3.3% 3.3% 93.3% 51.0% 4.4% 44.6%60 58.6% 14.4% 27.0% 18.2% 21.0% 60.8% 12.9% 25.5% 61.6% 60 5.3% 7.4% 87.2% 9.0% 14.3% 76.8% 28.7% 21.9% 49.4%62 40.0% 21.6% 38.4% 18.5% 23.7% 57.8% 27.3% 22.3% 50.4% 62 20.8% 9.5% 69.7% 6.1% 15.7% 78.2% 19.3% 19.5% 61.2%64 33.4% 18.4% 48.2% 25.2% 28.4% 46.4% 31.5% 21.0% 47.5% 64 18.9% 5.3% 75.8% 17.3% 7.5% 75.2% 38.0% 9.4% 52.6%66 23.9% 24.7% 51.4% 20.9% 26.7% 52.3% 29.6% 17.3% 53.0% 66 9.1% 12.5% 78.4% 25.8% 8.9% 65.4% 26.7% 19.7% 53.6%68 38.2% 21.9% 39.9% 17.0% 27.5% 55.5% 35.5% 18.8% 45.7% 68 54.5% 45.5% 0.0% 17.4% 13.2% 69.4% 30.1% 17.5% 52.4%70 29.5% 18.9% 51.6% 20.1% 30.3% 49.5% 30.2% 16.6% 53.2% 70 16.0% 7.6% 76.4% 13.1% 14.0% 73.0% 27.4% 17.5% 55.1%72 22.9% 17.9% 59.2% 20.3% 27.1% 52.6% 37.2% 21.1% 41.8% 72 14.8% 9.1% 76.0% 19.1% 13.7% 67.2% 22.9% 18.3% 58.8%74 23.8% 25.5% 50.7% 24.5% 23.4% 52.1% 39.6% 13.9% 46.5% 74 17.6% 16.9% 65.5% 24.8% 13.8% 61.3% 27.7% 14.8% 57.5%76 24.0% 23.2% 52.8% 26.8% 29.1% 44.1% 31.2% 19.2% 49.6% 76 14.0% 9.9% 76.1% 21.9% 11.5% 66.6% 26.2% 16.6% 57.2%78 18.8% 18.4% 62.9% 18.1% 23.5% 58.4% 35.0% 21.2% 43.8% 78 15.5% 13.4% 71.2% 24.7% 10.4% 64.9% 18.5% 12.1% 69.4%80 19.1% 19.6% 61.3% 23.1% 27.9% 49.0% 34.3% 15.4% 50.2% 80 14.7% 11.6% 73.6% 21.2% 11.4% 67.4% 20.5% 14.1% 65.3%82 14.4% 26.1% 59.5% 30.4% 25.1% 44.6% 31.7% 27.8% 40.5% 82 14.6% 3.0% 82.4% 21.5% 16.1% 62.4% 16.3% 18.5% 65.2%84 21.7% 9.5% 68.9% 27.0% 18.9% 54.0% 30.1% 13.2% 56.7% 84 17.9% 7.0% 75.1% 15.9% 22.8% 61.3% 17.0% 12.0% 71.0%86 32.4% 24.0% 43.6% 35.5% 24.7% 39.8% 31.3% 15.0% 53.7% 86 56.6% 43.4% 0.0% 17.6% 22.5% 59.8% 18.6% 15.5% 65.9%88 27.8% 14.8% 57.5% 31.2% 27.8% 41.0% 22.9% 12.4% 64.7% 88 12.3% 10.5% 77.1% 18.1% 18.8% 63.1% 20.1% 17.2% 62.8%90 30.2% 34.6% 35.2% 28.0% 16.6% 55.4% 23.8% 18.7% 57.5% 90 6.3% 3.7% 90.0% 23.9% 17.1% 59.0% 18.6% 13.6% 67.8%92 40.2% 28.1% 31.7% 42.5% 21.7% 35.9% 43.7% 10.7% 45.6% 92 20.7% 8.4% 70.9% 20.9% 25.1% 54.0% 25.3% 11.8% 62.9%94 26.1% 33.3% 40.6% 33.4% 16.3% 50.3% 35.3% 7.1% 57.6% 94 17.0% 18.4% 64.6% 18.8% 13.3% 67.9% 15.2% 18.4% 66.4%96 19.9% 30.0% 50.1% 34.6% 19.2% 46.2% 16.5% 13.9% 69.6% 96 16.7% 3.6% 79.7% 15.4% 21.3% 63.4% 27.6% 19.6% 52.8%98 33.8% 28.4% 37.8% 32.3% 22.8% 44.9% 16.8% 13.0% 70.2% 98 10.4% 8.2% 81.4% 28.4% 29.4% 42.3% 20.2% 16.9% 62.9%
100 14.6% 26.9% 58.5% 28.1% 17.4% 54.5% 48.5% 9.6% 41.9% 100 15.4% 23.2% 61.4% 15.0% 19.4% 65.6% 13.4% 25.5% 61.1%102 16.0% 49.3% 34.7% 43.1% 6.9% 50.0% 13.7% 0.0% 86.3% 102 40.3% 9.2% 50.6% 27.6% 28.4% 44.1% 24.8% 23.8% 51.4%104 19.0% 47.5% 33.5% 36.4% 16.2% 47.4% 49.6% 6.4% 44.0% 104 16.7% 15.8% 67.5% 36.6% 11.7% 51.7% 28.0% 8.4% 63.7%106 23.6% 22.6% 53.9% 58.4% 11.9% 29.7% 10.4% 22.8% 66.8% 106 30.7% 20.1% 49.2% 34.8% 7.7% 57.6% 24.0% 13.5% 62.5%108 27.6% 3.0% 69.4% 28.6% 22.6% 48.8% 42.2% 15.1% 42.6% 108 29.0% 2.3% 68.7% 19.4% 14.2% 66.4% 18.2% 27.7% 54.1%110 25.4% 12.6% 62.0% 22.7% 28.1% 49.2% 32.0% 3.1% 64.9% 110 11.7% 45.1% 43.2% 40.2% 8.0% 51.9% 29.6% 10.4% 60.0%112 95.8% 1.2% 3.0% 16.2% 0.0% 83.8% 7.2% 14.1% 78.7% 112 26.9% 23.3% 49.8% 25.1% 9.2% 65.7% 14.7% 17.4% 67.9%114 0.0% 26.2% 73.8% 24.4% 4.9% 70.7% 38.9% 0.0% 61.1% 114 20.1% 0.0% 79.9% 22.4% 22.7% 54.9% 31.2% 7.4% 61.5%116 58.7% 6.9% 34.4% 69.4% 0.0% 30.6% 77.8% 0.0% 22.2% 116 0.0% 0.0% 100.0% 41.6% 4.8% 53.6% 79.5% 0.5% 20.0%118 2.7% 7.5% 89.9% 44.9% 35.0% 20.1% 33.8% 31.5% 34.7% 118 0.0% 0.0% 100.0% 25.5% 38.6% 35.9% 40.9% 4.4% 54.6%120 5.7% 26.2% 68.0% 9.5% 28.7% 61.8% 0.0% 0.0% 100.0% 120 85.1% 0.0% 14.9% 65.5% 34.5% 0.0% 48.0% 0.7% 51.2%122 40.8% 40.3% 18.9% 1.5% 15.2% 83.4% 50.0% 50.0% 0.0% 122 0.0% 0.0% 100.0% 0.0% 0.0% 100.0% 34.7% 0.0% 65.3%124 70.3% 14.8% 14.8% 79.9% 0.0% 20.1% 15.6% 0.0% 84.4% 124 0.0% 0.0% 0.0% 0.0% 70.9% 29.1% 26.1% 37.0% 37.0%126 0.0% 100.0% 0.0% 89.0% 11.0% 0.0% 47.1% 0.0% 52.9% 126 49.4% 0.0% 50.6% 0.0% 0.0% 100.0% 59.2% 40.8% 0.0%128 82.0% 9.0% 9.0% 18.7% 0.0% 81.3% 89.8% 0.0% 10.2% 128 0.0% 0.0% 0.0% 0.0% 0.0% 0.0% 55.7% 1.0% 43.3%130 13.5% 0.0% 86.5% 4.9% 47.6% 47.6% 0.0% 0.0% 100.0% 130 13.8% 0.0% 86.2% 0.0% 0.0% 0.0% 35.0% 65.0% 0.0%132 100.0% 0.0% 0.0% 20.2% 63.3% 16.5% 0.0% 100.0% 0.0% 132 0.0% 0.0% 0.0% 0.0% 100.0% 0.0% 0.0% 0.0% 100.0%134 80.0% 0.0% 20.0% 100.0% 0.0% 0.0% 22.2% 0.0% 77.8% 134 0.0% 0.0% 0.0% 94.7% 0.0% 5.3% 100.0% 0.0% 0.0%136 0.0% 0.0% 100.0% 10.5% 16.1% 73.4% 0.0% 0.0% 100.0% 136 0.0% 0.0% 0.0% 0.0% 0.0% 100.0% 100.0% 0.0% 0.0%138 0.0% 0.0% 0.0% 15.2% 0.0% 84.8% 0.0% 0.0% 0.0% 138 100.0% 0.0% 0.0% 0.0% 0.0% 0.0% 100.0% 0.0% 0.0%140 100.0% 0.0% 0.0% 0.0% 0.0% 100.0% 100.0% 0.0% 0.0% 140 0.0% 0.0% 0.0% 100.0% 0.0% 0.0% 100.0% 0.0% 0.0%142 0.0% 0.0% 0.0% 0.0% 0.0% 0.0% 0.0% 0.0% 0.0% 142 0.0% 0.0% 0.0% 100.0% 0.0% 0.0% 100.0% 0.0% 0.0%144 0.0% 100.0% 0.0% 0.0% 0.0% 0.0% 0.0% 0.0% 0.0% 144 0.0% 0.0% 100.0% 0.0% 0.0% 0.0% 0.0% 0.0% 0.0%146 100.0% 0.0% 0.0% 0.0% 0.0% 100.0% 0.0% 0.0% 0.0% 146 0.0% 0.0% 0.0% 0.0% 0.0% 0.0% 100.0% 0.0% 0.0%148 0.0% 100.0% 0.0% 0.0% 0.0% 0.0% 0.0% 0.0% 0.0% 148 0.0% 0.0% 100.0% 100.0% 0.0% 0.0% 0.0% 0.0% 0.0%150 0.0% 100.0% 0.0% 100.0% 0.0% 0.0% 0.0% 0.0% 100.0% 150 0.0% 0.0% 0.0% 0.0% 0.0% 0.0% 100.0% 0.0% 0.0%152 100.0% 0.0% 0.0% 0.0% 100.0% 0.0% 0.0% 0.0% 0.0% 152 0.0% 0.0% 0.0% 0.0% 0.0% 0.0% 0.0% 0.0% 0.0%154 0.0% 0.0% 100.0% 0.0% 0.0% 0.0% 0.0% 0.0% 0.0% 154 0.0% 0.0% 0.0% 0.0% 0.0% 0.0% 100.0% 0.0% 0.0%156 0.0% 0.0% 0.0% 0.0% 0.0% 0.0% 0.0% 0.0% 0.0% 156 0.0% 0.0% 0.0% 0.0% 0.0% 0.0% 0.0% 0.0% 0.0%158 0.0% 0.0% 0.0% 0.0% 0.0% 0.0% 0.0% 0.0% 0.0% 158 0.0% 0.0% 0.0% 0.0% 0.0% 0.0% 100.0% 0.0% 0.0%160 0.0% 0.0% 0.0% 0.0% 0.0% 0.0% 0.0% 0.0% 0.0% 160 0.0% 0.0% 0.0% 0.0% 0.0% 0.0% 0.0% 0.0% 0.0%162 100.0% 0.0% 0.0% 0.0% 0.0% 0.0% 0.0% 0.0% 0.0% 162 0.0% 0.0% 0.0% 0.0% 0.0% 0.0% 0.0% 0.0% 0.0%164 0.0% 0.0% 0.0% 0.0% 0.0% 0.0% 0.0% 0.0% 0.0% 164 0.0% 0.0% 0.0% 0.0% 0.0% 0.0% 0.0% 0.0% 0.0%
Length bin (cm)
2004 2005 2006 Length bin (cm)
2007 2008 2009
Exc Poor Dead Exc Poor Dead Exc Poor Dead10 0.0% 100.0% 0.0% 58 100.0% 0.0% 0.0% 106 2.4% 0.0% 97.6%12 0.0% 0.0% 0.0% 60 33.4% 0.0% 66.6% 108 0.0% 20.1% 79.9%14 0.0% 0.0% 0.0% 62 15.7% 29.4% 54.9% 110 14.2% 58.8% 27.0%16 0.0% 0.0% 0.0% 64 30.1% 21.2% 48.7% 112 39.9% 0.0% 60.1%18 0.0% 0.0% 0.0% 66 17.8% 15.4% 66.8% 114 0.0% 0.0% 100.0%20 0.0% 0.0% 0.0% 68 15.0% 10.3% 74.8% 116 50.0% 0.0% 50.0%22 0.0% 0.0% 0.0% 70 22.2% 7.4% 70.4% 118 0.0% 100.0% 0.0%24 0.0% 0.0% 0.0% 72 23.6% 17.4% 59.0% 120 0.0% 0.0% 100.0%26 0.0% 0.0% 0.0% 74 13.5% 24.8% 61.7% 122 0.0% 0.0% 100.0%28 0.0% 0.0% 0.0% 76 20.1% 16.9% 63.0% 124 100.0% 0.0% 0.0%30 0.0% 0.0% 0.0% 78 17.0% 17.4% 65.7% 126 0.0% 100.0% 0.0%32 0.0% 0.0% 0.0% 80 10.6% 22.8% 66.6% 128 0.0% 0.0% 0.0%34 0.0% 0.0% 0.0% 82 18.9% 19.9% 61.2% 130 0.0% 0.0% 0.0%36 0.0% 0.0% 0.0% 84 21.9% 25.3% 52.8% 132 0.0% 0.0% 0.0%38 0.0% 0.0% 0.0% 86 14.9% 16.4% 68.7% 134 0.0% 0.0% 0.0%40 0.0% 0.0% 0.0% 88 24.8% 17.8% 57.4% 136 100.0% 0.0% 0.0%42 0.0% 0.0% 0.0% 90 25.8% 24.2% 50.1% 138 0.0% 0.0% 0.0%44 0.0% 0.0% 0.0% 92 5.0% 9.9% 85.1% 140 0.0% 0.0% 0.0%46 0.0% 0.0% 0.0% 94 26.1% 29.2% 44.7% 142 0.0% 0.0% 0.0%48 0.0% 0.0% 0.0% 96 17.4% 39.9% 42.7% 144 0.0% 0.0% 0.0%50 0.0% 0.0% 0.0% 98 14.3% 23.3% 62.4% 146 0.0% 0.0% 0.0%52 0.0% 0.0% 0.0% 100 2.2% 31.0% 66.8% 148 0.0% 0.0% 0.0%54 0.0% 0.0% 0.0% 102 21.7% 20.6% 57.8% 150 0.0% 0.0% 0.0%56 0.0% 0.0% 0.0% 104 18.3% 37.2% 44.6% 152 0.0% 100.0% 0.0%
154 0.0% 0.0% 0.0%
Length bin
2010Length bin
2010Length bin (cm)
2010

57
APPENDIX B Manual Pacific Halibut IBQ Expansions for Inseason Management
Table B1. The number of vessels and trips that required manual expansions of P. halibut IBQ weight in the 2011 U.S. west coast groundfish IFQ fishery.
2011 IFQ Total
Number manually calculated
due to PHLB
scenarios
Number manually calculated
due to unsampled
hauls (Trawl)
Number manually calculated
due to lost trawl
gear
Number manually calculated
due to lost fixed
gear
Total number of manually calculated
discard events
% Manually Calculated
Number of
vessels 113 13 16 4 1 24 21.24 *
Number of trips
1164 19 21 4 3 38 3.26
*Percentage of vessels with manually calculated discard may be included in one or more categories
Scenario 1: Total count of PHLB exists with no length or viability data. Resolution: Determine an average mortality weight per individual PHLB in the trip from all sampled hauls. Multiply that average by the total count of PHLB to determine an IBQ. Scenario 2: Total count of PHLB exists with actual lengths and no viability data. Resolution: Determine catch weight for PHLB using the lengths in the haul and then apply that to the total count for a total weight. Determine CATCH_WEIGHT_MORT for all viabilities (E, P, D) from all other properly sampled hauls in the trip and apply to the CATCH_WEIGHT for IBQ estimate. Scenario 3: Total count of PHLB exists with visual estimates of PHLB lengths and no viabilities. Resolution: The use of visual lengths was discouraged by the IPHC so the most appropriate method is to determine an average IBQ per individual PHLB in the trip from all sampled hauls. Multiply that average by the total count of PHLB to determine an IBQ. Scenario 4: Total count of PHLB exists with visual estimates of PHLB lengths and proper in-hand viabilities. Resolution: The use of visual lengths was discouraged by the IPHC, so the most appropriate method here would be to determine an average IBQ per individual PHLB in the trip from all sampled

58
hauls. Multiply that average by the total count of PHLB to determine an IBQ. Scenario 5: Total count of PHLB does not exist without any length or viability data Resolution: Confirm PHLB was present in the haul, and no data was collected on them. Determine an average IBQ per haul for all sampled hauls in the trip. This scenario is unlikely and did not occur in 2011. Scenario 6: Total count of PHLB does not exist with length and no viability data. Resolution: Catch weight for the haul will be determined by taking the measured PHLB sample, convert to weight, divided by the number of fish sampled, multiplied by the average number of PHLB for all sampled hauls in the trip. Then the average mortality rates from the sampled hauls are applied to the calculated PHLB weight. This scenario is unlikely and did not occur in 2011. Scenario 7: Total count of PHLB does not exist with length and viability data. Resolution: Catch weight for the haul will be determined by taking the length of the PHLB sample, converted to weight, divided by the number of fish sampled, multiplied by the average number of PHLB for all sampled hauls in the trip. Since viabilities and lengths exist, IBQ can be determined using normal protocols and the calculated catch weight. This scenario is unlikely and did not occur in 2011. Scenario 8: Total count of PHLB does not exist with visual length and no viability data. Resolution: The use of visual lengths was discouraged by the IPHC so the most appropriate method here would be to determine an average IBQ per haul for all sampled hauls in the trip and apply to this haul as well.
Scenario 9: Total count of PHLB does not exist with visual length and viability data. Resolution: The use of visual lengths was discouraged by the IPHC so the most appropriate method here would be to determine an average IBQ per haul for all sampled hauls in the trip and apply to this haul as well. Scenario 10: Observer encounters predated fish that are dead and badly damaged so that accurate biological data cannot be collected. Resolution: If properly sampled PHLB exist in the haul they can be used to determine the portion of the catch weight attributed to the predated and non-predated fish. The IBQ for the PHLB not predated would be calculated separately using the data collected in the haul. The IBQ for the predated fish would be the portion of the PHLB catch weight attributed to the predated fish multiplied by the mortality rate for “dead” from the IPHC viability tables for that gear.

59
If all PHLB in the haul are heavily predated then a catch weight for the haul will need to be determined. This can be done by taking the total count of PHLB in the haul times an average catch weight (not IBQ estimates) per PHLB from other hauls in the trip (or like “sets” if PHLB doesn’t exist in any other hauls). The estimated catch weight will then be multiplied by the mortality rate for “dead” from the IPHC viability tables for that gear to determine IBQ. In 2011, there were only two instances where a Pacific halibut IBQ was manually calculated due to sand flea predation.
Table B2. Calculations used in manual Pacific halibut IBQ calculations in the 2011 U.S. west coast groundfish IFQ fishery. SCENARIO CALCULATION
1 ∑CATCH_WEIGHT_MORT for all sampled hauls x CATCH_COUNT for unsampled haul=PHLB IBQ ∑CATCH_COUNT for all sampled hauls
2
CATCH_WEIGHT = Σ SPECIMEN_LENGTH* x CATCH_COUNT #_PHLB_SAMPLED_IFQ CATCH_WEIGHT_MORT = CATCH_WEIGHT_MORT Σ (E) + CATCH_WEIGHT_MORT Σ (P) + CATCH_WEIGHT_MORT Σ (D) CATCH_WEIGHT_MORT Σ (E) = Σ (SPECIMEN_LENGTH* where VIABILITY = E) for all sampled hauls x CATCH_WEIGHT x (.20**) Σ SPECIMEN_LENGTH* for all sampled hauls CATCH_WEIGHT_MORT Σ (P) = Σ (SPECIMEN_LENGTH* where VIABILITY = P) for all for all sampled hauls x CATCH_WEIGHT x (.55**) Σ SPECIMEN_LENGTH* for all sampled hauls CATCH_WEIGHT_MORT Σ (D) = Σ (SPECIMEN_LENGTH* where VIABILITY = D) for all sampled hauls x CATCH_WEIGHT x (.90**) Σ SPECIMEN_LENGTH* for all sampled hauls
3, 4, 5 ∑CATCH_WEIGHT_MORT for all sampled hauls x CATCH_COUNT for unsampled haul=PHLB IBQ ∑CATCH_COUNT for all sampled hauls

60
6, 7
Average CATCH_COUNT for all sampled hauls = ∑CATCH_COUNT for all sampled hauls Total # sampled hauls CATCH_WEIGHT = Σ SPECIMEN_LENGTH* x Average CATCH_COUNT for all sampled hauls #_PHLB_SAMPLED_IFQ CATCH_WEIGHT_MORT = CATCH_WEIGHT_MORT Σ (E) + CATCH_WEIGHT_MORT Σ (P) + CATCH_WEIGHT_MORT Σ (D) CATCH_WEIGHT_MORT Σ (E) = Σ (SPECIMEN_LENGTH* where VIABILITY = E) for all sampled hauls x CATCH_WEIGHT x (.20**) Σ SPECIMEN_LENGTH* for all sampled hauls CATCH_WEIGHT_MORT Σ (P) = Σ (SPECIMEN_LENGTH* where VIABILITY = P) for all sampled hauls x CATCH_WEIGHT x (.55**) Σ SPECIMEN_LENGTH* for all sampled hauls CATCH_WEIGHT_MORT Σ (D) = Σ (SPECIMEN_LENGTH* where VIABILITY = D) for all sampled hauls x CATCH_WEIGHT x (.90**) Σ SPECIMEN_LENGTH* for all sampled hauls
8, 9
PHLB IBQ = ∑CATCH_WEIGHT_MORT for all sampled hauls
Total # of sampled hauls
10 CATCH_WEIGHT_MORT =
∑CATCH_WEIGHT _MORT for the properly sampled PHLB + (CATCH_WEIGHT estimate for the predated PHLB* Mortality rate for “dead” for that fishery)
* Converted to weight using P. halibut length-weight conversion table (Appendix C below) ** IPHC mortality rates

61
APPENDIX C. IPHC length weight conversion table for Pacific halibut
Centimeter Pounds Kilograms Centimeter Pounds Kilograms Centimeter Pounds Kilograms Centimeter Pounds Kilograms10 0.02 0.01 71 9.19 4.17 131 66.82 30.31 191 226.70 102.8311 0.02 0.01 72 9.61 4.36 132 68.48 31.06 192 230.56 104.5812 0.02 0.01 73 10.05 4.56 133 70.17 31.83 193 234.48 106.3613 0.04 0.02 74 10.49 4.76 134 71.89 32.61 194 238.45 108.1614 0.04 0.02 75 10.98 4.98 135 73.66 33.41 195 242.44 109.9715 0.07 0.03 76 11.44 5.19 136 75.44 34.22 196 246.50 111.8116 0.07 0.03 77 11.95 5.42 137 77.25 35.04 197 250.60 113.6717 0.09 0.04 78 12.46 5.65 138 79.08 35.87 198 255.74 116.0018 0.11 0.05 79 12.99 5.89 139 80.95 36.72 199 258.93 117.4519 0.13 0.06 80 13.51 6.13 140 82.87 37.59 200 263.17 119.3720 0.15 0.07 81 14.07 6.38 141 84.79 38.46 201 267.46 121.3221 0.18 0.08 82 14.64 6.64 142 86.75 39.35 202 271.79 123.2822 0.20 0.09 83 15.23 6.91 143 88.76 40.26 203 276.17 125.2723 0.24 0.11 84 15.83 7.18 144 90.79 41.18 204 280.60 127.2824 0.26 0.12 85 16.45 7.46 145 92.84 42.11 205 285.10 129.3225 0.31 0.14 86 17.09 7.75 146 94.93 43.06 206 289.62 131.3726 0.35 0.16 87 17.75 8.05 147 97.05 44.02 207 294.21 133.4527 0.40 0.18 88 18.41 8.35 148 99.21 45.00 208 298.84 135.5528 0.46 0.21 89 19.09 8.66 149 101.39 45.99 209 303.51 137.6729 0.51 0.23 90 19.80 8.98 150 103.62 47.00 210 308.25 139.8230 0.57 0.26 91 20.53 9.31 151 105.87 48.02 211 313.03 141.9931 0.62 0.28 92 21.25 9.64 152 108.16 49.06 212 317.86 144.1832 0.71 0.32 93 22.02 9.99 153 110.50 50.12 213 322.73 146.3933 0.77 0.35 94 22.80 10.34 154 112.83 51.18 214 327.67 148.6334 0.84 0.38 95 23.59 10.70 155 115.24 52.27 215 332.65 150.8935 0.93 0.42 96 24.41 11.07 156 117.66 53.37 216 337.70 153.1836 1.01 0.46 97 25.24 11.45 157 120.13 54.49 217 342.79 155.4937 1.10 0.50 98 26.08 11.83 158 122.62 55.62 218 347.93 157.8238 1.21 0.55 99 26.96 12.23 159 125.16 56.77 219 353.13 160.1839 1.32 0.60 100 27.87 12.64 160 127.71 57.93 220 358.38 162.5640 1.43 0.65 101 28.77 13.05 161 130.32 59.11 221 363.69 164.9741 1.59 0.72 102 29.70 13.47 162 132.96 60.31 222 369.05 167.4042 1.68 0.76 103 30.67 13.91 163 135.65 61.53 223 374.45 169.8543 1.81 0.82 104 31.64 14.35 164 138.36 62.76 224 379.92 172.3344 1.94 0.88 105 32.63 14.80 165 141.12 64.01 225 385.45 174.8445 2.09 0.95 106 33.64 15.26 166 143.90 65.27 226 391.03 177.3746 2.25 1.02 107 34.68 15.73 167 146.72 66.55 227 396.67 179.9347 2.43 1.10 108 35.74 16.21 168 149.54 67.83 228 402.36 182.5148 2.58 1.17 109 36.84 16.71 169 152.49 69.17 229 408.09 185.1149 2.76 1.25 110 37.94 17.21 170 155.45 70.51 230 413.91 187.7550 2.95 1.34 111 39.07 17.72 171 158.42 71.86 231 419.76 190.4051 3.15 1.43 112 40.21 18.24 172 161.44 73.23 232 425.69 193.0952 3.35 1.52 113 41.38 18.77 173 164.51 74.62 233 431.66 195.8053 3.57 1.62 114 42.59 19.32 174 167.60 76.02 234 437.68 198.5354 3.79 1.72 115 43.81 19.87 175 170.75 77.45 235 443.76 201.2955 4.01 1.82 116 45.06 20.44 176 173.92 78.89 236 449.91 204.0856 4.25 1.93 117 46.32 21.01 177 177.14 80.35 237 456.13 206.9057 4.52 2.05 118 47.62 21.60 178 180.40 81.83 238 462.39 209.7458 4.76 2.16 119 48.94 22.20 179 183.71 83.33 239 468.72 212.6159 5.05 2.29 120 50.29 22.81 180 187.06 84.85 240 475.09 215.5060 5.31 2.41 121 51.65 23.43 181 190.46 86.39 241 481.55 218.4361 5.62 2.55 122 53.07 24.07 182 193.87 87.94 242 488.05 221.3862 5.93 2.69 123 54.48 24.71 183 197.36 89.52 243 494.60 224.3563 6.24 2.83 124 55.93 25.37 184 200.86 91.11 244 501.24 227.3664 6.57 2.98 125 57.41 26.04 185 204.43 92.73 245 507.92 230.3965 6.90 3.13 126 58.91 26.72 186 208.03 94.36 246 514.66 233.4566 7.25 3.29 127 60.43 27.41 187 211.67 96.01 247 521.48 236.5467 7.61 3.45 128 61.99 28.12 188 214.71 97.39 248 528.36 239.6668 7.98 3.62 129 63.56 28.83 189 218.50 99.11 249 535.28 242.8069 8.38 3.80 130 65.17 29.56 190 222.89 101.10 250 542.29 245.9870 8.77 3.98

62
APPENDIX D Figure D1. IFQ groundfish fishery data flow from the West Coast Groundfish Observer Program (WCGOP) to the Vessel Account System (VAS) of the NW Regional Office.