Embed Size (px)
Citation preview


TABLE OF CONTENTS
1. Global Baby Food and Formula Industry
1.1. Consumer Behavior and Regulations
Consumer Buying Behavior
Regulations
1.2. Market Size and Forecast
Growing Middle Class
Rising Per-capita income
Rising Women Participation in Labor Force
Large Range of Products Offering
1.3. Market Segmentation
1.4. Industry Opportunities
1.4.1. Rising Awareness of Organic Baby Food
1.4.2. Rising Birth Rate in Developing Nations
2. Performance by Geography
3. The US Baby Food and Formula Industry
3.1. Market Size
Falling Birth Rate
3.2. Industry Segmentation-Retail Sales and Forecast
3.2.1. Baby Food Market and Forecast
3.2.1.1. Segmentation by Dry, Ready-to-feed and Other Baby Food
3.2.2. Formula Milk Demand and Segmentation by base Ingredient
3.3. The US Organic Baby Food Demand
3.4. SWOT Analysis
3.5. Industry Opportunities and Growth Drivers
Infants on Mother Feed vs Formula Milk
Working Women Population
US healthcare Spending
Rising Per Capita Income
The US Milk Powder Production
3.6. Country Analysis and Industry Insight
3.6.1. Key Findings
3.6.2. Political and Regulatory Structure
Regulatory Body
3.6.3. Macro Economic Indicators: Current and Projections
The US Economy, Impact over baby food demand
Population, 2006-2015
Personal Disposable Income 2005-2015
Inflation, 2006-2015
3.7. Export and Import of Baby Food Products in the US
3.8. Industry Players and Competition in the US
3.9. The US Baby Food Industry Forecast to 2016
4. France Baby Food and Infant Formula Industry
Market Scenario
4.1. Market Size, 2006-2011
4.2. Industry Segmentation - Retail Sales
4.2.1. Baby Food Retail Sales, 2007-2011
Baby Food Demand by Type, 2011
4.2.2. Formula Milk Demand by Retail Sales, 2007-2016
4.3. SWOT Analysis
4.4. Industry Opportunities and Growth Drivers
Rising Fertility Rate
Rising Women Participation in Labor Market
Urbanization
Role of Education in rising consumption of baby food
Cow Milk Production
4.5. Country Analysis and Industry Insights
4.5.1. Key Findings

4.5.2. Political Environment
Regulation on Baby Food
4.5.3. Macro-Economic and Industry Indicators
Population, 2006-2011
GDP, 2006-2015
Import/Export, 2007-2011
4.6. France Baby Food Industry Forecasts, 2012- 2016
5. Germany Baby Food and Formula Industry
5.1. Market Size
5.2. Industry Segmentation-Retail Sales and Forecast
5.2.1. Baby Food Demand and Forecast
5.2.1.1. Segmentation by Dry, Ready-to-feed and Other Baby Food
5.2.2. Formula Milk Demand and Segmentation by base Ingredient
5.3. SWOT Analysis
5.4. Industry Opportunities and Growth Drivers
Rising number of foreign citizens
Largest dairy producer in Europe
Intensifying Organic Food Demand
Convenience Food – A Recent Phenomenon
Working Women Population
5.5. Country Analysis and Industry Insight
5.5.1. Key Findings
5.5.2. Political Structure
5.5.3. Germany Macro Economic Indicators: Historical and Projections
Population, 2006-2015
GDP, 2006-2015
5.6. Export and Import
5.7. Germany Baby food Industry Players
5.8. Germany Baby Food and Formula Industry Forecast to 2016

6. India Baby Food and Infant Formula Industry
Market Scenario
6.1. Market Size
Role of birth rate in baby food demand
6.2. Industry Segmentation-Retail Sales and Forecast
6.2.1. Segmentation by Dry, Ready-to-feed and Other Baby Food
6.2.2. Formula Milk Demand and Segmentation by base Ingredient
6.3. SWOT Analysis
6.4. Industry Opportunities and Growth Drivers
Affluence of Working Population with Changing Lifestyles
Role of Urbanization in Baby Food and Formula Market
Annual Disposable Income
Surging Infant Population will showcase rise in Demand for Baby Food
Flourishing Dairy Market
6.5. Country Analysis and Industry Insights
6.5.1. Key Findings
6.5.2. Political Environment
Regulation on Baby Food
6.5.3. Macro-Economic and Industry Indicators
GDP Enabling Growth of Pharmaceuticals
Import/Export
Population and Projection
6.6. Industry Players and Competition
6.7. India Baby Food Industry Forecast
7. China Baby Food and Infant Formula Industry
7.1. Market Size
Consumer Spending on Baby food and Infant formula industry
7.2. Industry Segments
7.2.1. Infant Formula Milk Demand

7.2.2. Baby Food Demand
7.2.2.1. Baby Food Industry Segmentation
Baby Cereals Demand
Bottled Baby Food
7.3. SWOT Analysis
7.4. Industry Opportunities and Growth Drivers
Infants on Mother Feed
Child Birth Rate and Baby Population
Opportunities for New Players
Opportunities for Domestic Players
Disposable Income and Urbanization
Growing Middle Class and Working Women population
7.5. Country Analysis and Industry Insights
7.5.1. Key Findings
7.5.2. Political Environment and Government Regulations
Regulations
7.5.3. Macro-economic Indicators
GDP Recovery and Growth
Import/Export
Population and Literacy Rate
7.6. Industry Players and Competition
Multinational Producers
7.7. Future Outlook
8. Competitive Landscape and Profile of Major Players
8.1. Market Share
8.2. NESTLE
8.2.1. Business Overview
8.2.2. Key Financials
8.2.3. Major Developments and Strategies

8.3. Danone
8.3.1. Business Overview
8.3.2. Key Financials
8.3.3. Major Developments and Strategies
8.4. H. J. Heinz
8.4.1. Company Description
8.4.2. Key Financials
8.4.3. Major developments and Strategies
9. Appendix
9.1. Market Definition
9.2. Abbreviations
9.3. Research Methodology
Data Collection Methods
Approach
Multi Factor Based Sensitivity Model (SPSS Analysis)
Final Conclusion
9.4. Disclaimer
LIST OF FIGURES
Figure 1: Global Baby Food and Infant Formula Market and Forecast by Value (2006-2016)
Figure 2: Global Formula Milk Retail Sales (2006-2011)
Figure 3: Global Baby Food Retail Sales (2006-2011)
Figure 4: Baby Food and Formula Industry Demand by Geography in 2011 (%)
Figure 5: Baby Food and Formula Industry Market Value by Geography in 2011
Figure 6: The US Baby Food and Formula Retail Sales by Value (2006-2011)
Figure 7: Birth Rate in the US (2006-2011)
Figure 8: The US Baby Food and Formula Segmentation in Percentage, 2011
Figure 9: The US Baby Food Retail Sales and Forecast (2006-2016F)
Figure 10: The US Baby Food Retail Sales and Forecast by Segments (2007-2016F)
Figure 11: The US Formula Milk Retail Sales and Forecast (2007-2016F)
Figure 12: The US Formula Milk Demand by Base-Ingredients in 2010
Figure 13: The US Organic Formula Market (2006-2010)
Figure 14: US Breastfed Infants who are Supplemented With Infant Formula in Percentage (2011)
Figure 15: Exclusive Breastfeeding by Month since Birth among the US Infants Born in Percentage (2008)
Figure 16: The US Labor Force Contribution by Male and Female in Percentage May 2012
Figure 17: The US Women Population in Civilian Labor Force in Thousand, 2006-2010
Figure 18: The US Average Annual Cost of Healthcare (2006-2011)
Figure 19: The US Healthcare Expenditures (2000, 2005, 2008 & 2010)
Figure 20: Per Capita Income in the US (2000-2011)
Figure 21: The US Skim Milk Powder Market Production by Volume (2007-2015)
Figure 22: The US GDP at Current Prices (2000-2010)
Figure 23: The US Population in Million, 2006-2015
Figure 24: The US Personal Disposable Income in USD Billion, 2006-2015
Figure 25: Per Capita Income in the US (2006-2011)

Figure 26: The US inflation, Average Consumer Prices in % (2007-2015F)
Figure 27: Consumer Price Index in the US, 2006-2015
Figure 28: Import of Infant Foods of Cereals, Flour, Starch or Milk, by Value and Volume in the US (2006-2010)
Figure 29: Export of Infant Foods of Cereals, Flour, Starch or Milk by Value and Volume in the US (2006-2010)
Figure 30: The US Infant Milk Formula Players in 2011
Figure 31: Share of Leading Baby Food Brands in the US, 2011
Figure 32: The US Baby Food and Formula Retail Sales Forecast by Value (2011-2016F)
Figure 33: France Baby Food and Formula Retail Sales by Value (2006-2011)
Figure 34: France Baby food and Formula Segmentation in %, 2011
Figure 35: France Baby Food Retail Sales (2007-2011)
Figure 36: France Baby food Demand by Type in 2011
Figure 37: France Formula Milk Retail Sales and Forecast (2007-2016F)
Figure 38: Urban Population in France (2008-2010)
Figure 39: France Total Cow Milk Production Volume in Million Tonnes (2006-2010)
Figure 40: France Total Exports and Imports by Value (2007-2011)
Figure 41: France Baby Food and Formula Retail Sales Forecast by Value (2011-2016F)
Figure 42: Germany Baby Food and Formula Retail Sales by Value (2006-2011)
Figure 43: Total Fertility Rate (TFR) in Germany (2006-2011)
Figure 44: Germany Baby Food and Formula Segmentation in Percentage, 2011
Figure 45: Germany Baby Food Retail Sales and Forecast by Segments (2006-2016F)
Figure 46: Germany Baby Food Demand by Product Category, by Value (2009-2011)
Figure 47: Germany Formula Milk Retail Sales and Forecast (2006-2016F)
Figure 48: Foreign Population in Germany (2006-2011)
Figure 49: Total Cow Milk Production Volume in Germany '000 tones (2006-2010)
Figure 50: Europe Organic Food Per Capita Consumption in 2010 (EUR)
Figure 51: Germany Organic Baby Food Market Retail Sales and Forecast (2006-2016)
Figure 52: Working Women Population in Germany (2008-Q2 2011)
Figure 53: Women Share of the Labor Force in Germany (2006-2011)

Figure 54: Germany Baby Food and Formula Retail Sales Forecast by Value (2011-2016F)
Figure 55: Indian Baby Food and Formula Retail Sales by value (2006-2011)
Figure 56: Birth Rate in India (2006-2011)
Figure 57: India Baby food and Formula Segmentation in %, 2011
Figure 58: India Baby Food Demand by Type in % (2007-2011)
Figure 59: India Formula Milk Retail Sales and Forecast (2007-2016F)
Figure 60: India Formula Milk Demand by Base-Ingredient in 2011
Figure 61: Indian Urban Population in Million, 2006-2015
Figure 62: Total Annual Personal Disposable Income in India (2006-2016)
Figure 63: Child Population Age 0-6 Years Old in India (2006 & 2011)
Figure 64: Indian Dairy Products Export by Product Type (2010)
Figure 65: India’s GDP at Current Prices in USD Billion, 2006-2015
Figure 66: India’s Population in Million, 2006-2016
Figure 67: India Baby Food and Formula Retail Sales Forecast by Value (2011-2016F)
Figure 68: Distributor’s Share in China Baby Food Market in 2011
Figure 69: China Baby Food and Infant Formula Demand by Volume (2006-2011)
Figure 70: China Baby Food and Infant Formula Demand by Value (2006-2011)
Figure 71: Segmentation of China Baby Food and Infant Formula Market by Type in %, 2011
Figure 72: China Infant Formula Milk Demand by Volume (2006-2011)
Figure 73: China Infant Formula Milk Demand by Value (2006-2011)
Figure 74: China Baby Food Retail Sales by Value (2006-2011)
Figure 75: China Baby Food Market Segmentation by Type in 2011 (%)
Figure 76: China Baby Cereal Retail Sales by Value (2006-2011)
Figure 77: China Bottled baby food Demand by Value (2006-2011)
Figure 78: China Birth Rate of 1000 population in % (2006-2011)
Figure 79: Baby Population in China (Age 0-4 years), 1995-2050
Figure 80: Import of Milk Powder in China by Volume (2006-2010)
Figure 81: China Urban per Capita Disposable Income (2003-2010)
Figure 82: China Gross Domestic Product (2003-2011)
Figure 83: China Population (2003-2011)
Figure 84: Market Share of Players in China Baby food and Infant Formula Market, 2010
Figure 85: Market Share of Players in China Baby Food and Infant Formula Milk Market, 2011
Figure 86: China Baby Food and Infant Formula Market Forecast by Value (2011-2016F)
Figure 87: Baby Food Demand Forecast by Value (2011-2016F)
Figure 88: Infant Formula Demand Forecast by Value (2011-2016F)
Figure 89: Global Players Market Share in 2011
LIST OF TABLES
Table 1: The Global Middle Class, 2009: People and Spending
Table 2: Global Baby Food Demand by Type in 2011
Table 3: Country Overview
Table 4: France Total Fertility Rate (TFR) and Births (2006-2010)
Table 5: Women in Labor Force % (2006-2011)
Table 6: Country Overview
Table 7: France Population Trend in Million, 2006-2015
Table 8: France Gross Domestic Product in USD Billion, 2006-2015
Table 9: Infant Foods of Cereals, Flour, Starch or Milk Import Export by Value and Volume (2006-2010)
Table 10: Child Population in Germany (2008-2010)
Table 11: Country Overview
Table 12: Germany Population Trend in Million, 2006-2015
Table 13: Germany Gross Domestic Product in USD Billion, 2006-2015
Table 14: Germany Total Exports and Imports and Trade in Food Industry, by Volume (200-2011)

Table 15: Germany Trade of Infant Foods of Cereals, Flour, Starch or Milk (2006-2010)
Table 16: Leading Players in Baby Food and Formula Industry, Products and Market Share, 2011
Table 17: Labor Participation Rates by Gender and by Age Group in India, 2000 and 2008
Table 18: Production and consumption of Non-fat Dry Milk in India (2006-2011)
Table 19: Country Overview
Table 20: India Economy (2010-2012)
Table 21: Export/Import Statistics in India (2006-2010)
Table 22: Trade of Infant foods of cereals, flour, starch or milk in India (2006-2010)
Table 23: Income Distribution among Households in thousands in India, 2009-2012
Table 24: Popular Baby Food Brands by Type
Table 25: Baby Food Market Segmentation by Product Category in China, 2011
Table 26: Baby Milk Consumption in China
Table 27: Import of Milk Powder in China by value (2006-2010)
Table 28: China Comparison of Foreign Milk Power and Domestic Milk Powder on the Basis of Retail Price (2010&2011)
Table 29 : Country Overview
Table 30: China Economy (2010-2012)
Table 31: China Import & Export Statistics (Jan to May 2011)
Table 32: Domestic Players Business and Financials
Table 33: Nestle Sales and Profit in 2011
Table 34: Danone Financials by Business Segment (Q1 11 & Q1 2012)
Table 35: H. J. Heinz Company Financials in USD Million (2010-2012)
Table 36: Heinz Revenue by Business Segments (2010-2012)

1. GLOBAL BABY FOOD AND FORMULA INDUSTRY
1.1. MARKET SIZE AND FORECAST
Women has a big role in rapidly growing baby food market worldwide because with her changing role from being a mother to a professional, she look for food items which takes less time to prepare and even high in
nutrition. Rapidly expanding emerging economies such as in India and China the baby food market is witnessing intensifying demand, especially, since 2003; the industry has been registering phenomenal growth. From 2006-2011 the global baby food and formula industry grew at a CAGR 4.17% and expected to register 5.30% CAGR from 2011 to 2016…
Figure: Global Baby Food and Infant Formula Market and Forecast by Value (2006-2016)
MARKET SEGMENTATION
Formula milk for infants and toddlers accounts for the highest percentage of demand. This segment has been mainly driven by stage II (6-12 months) and stage III (12-18 months) because in 0-6 month’s breastfeeding rate is comparatively high. Formula milk is witnessing
fall in demand due to the impact of government initiatives to support breastfeeding and economy slowdown.
2006 2007 2008 2009 2010 2011 2012E 2013F 2014F 2015F 2016F
USD
Bill
ion
From 2006-2011 the global baby food and formula industry grew at a CAGR 4.17% and expected to register 5.30% CAGR between 2011-2016
Formula milk for infants and toddlers accounts for the highest percentage of demand and the segment recorded CAGR of 3.25% from 2006 to 2011

Figure: Global Formula Milk Retail Sales (2006-2011)
Ready-to-feed baby food forms the largest category worldwide and witnessing a continuous growth year on year; performance of this segment has been influenced by strong demand for baby cereals…
Figure: Global Baby Food Retail Sales (2006-2011)
Table: Global Baby Food Demand by Type in 2011
Market Value (USD Billion) Share in Baby Food Segment %
Dried Baby Food
Ready-to-eat Baby Food
Other Baby Food and Juices
PERFORMANCE BY GEOGRAPHY
The global baby food and formula market is dominated by North America region which contributed 28.63% of the industry worldwide and the market dominance in this region has
2006 2007 2008 2009 2010 2011
USD
Bill
ion
2006 2007 2008 2009 2010 2011
USD
Bill
ion

been felled by the strong economy and lifestyle. The US is the largest country in the region in terms of production and consumption of baby food and formula.
Figure: Baby Food and Formula Industry Demand by Geography in 2011 (%)
Figure: Baby Food and Formula Industry Market Value by Geography in 2011
THE US BABY FOOD AND FORMULA INDUSTRY
Fertility rate is falling in the country due to poor eating habits and changing lifestyle. This is a major concern for the US government and may affect the demand for baby food products. Consumption expenditure on baby food and formula market is constant from last 3 years due to low disposable income. There are bright prospects though for baby snacks and flavored baby juice segment.
Asia Pacific
Western Europe
Eastern and Central Europe
North America
Rest of the World
0 2 4 6 8 10 12
Rest of the World
Western Europe
Eastern and Central Europe
North America
Asia Pacific
USD Billion
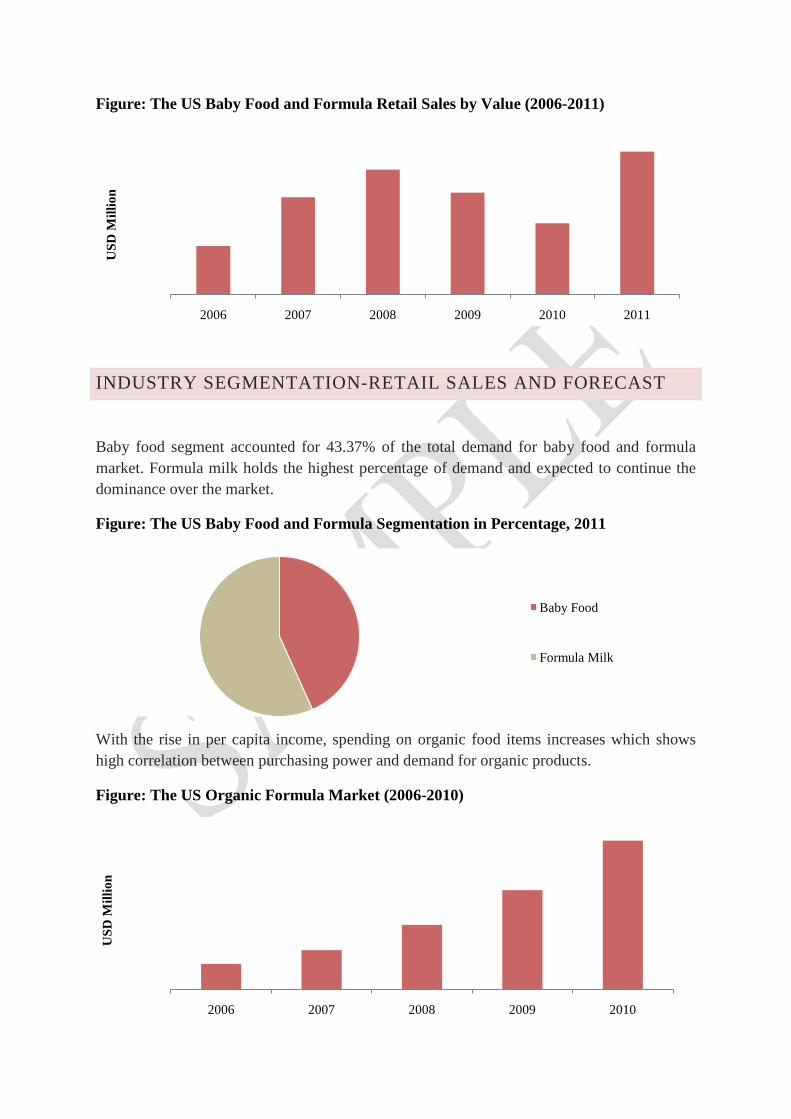
Figure: The US Baby Food and Formula Retail Sales by Value (2006-2011)
INDUSTRY SEGMENTATION-RETAIL SALES AND FORECAST
Baby food segment accounted for 43.37% of the total demand for baby food and formula market. Formula milk holds the highest percentage of demand and expected to continue the dominance over the market.
Figure: The US Baby Food and Formula Segmentation in Percentage, 2011
With the rise in per capita income, spending on organic food items increases which shows high correlation between purchasing power and demand for organic products.
Figure: The US Organic Formula Market (2006-2010)
2006 2007 2008 2009 2010 2011
USD
Mill
ion
Baby Food
Formula Milk
2006 2007 2008 2009 2010
USD
Mill
ion

FRANCE BABY FOOD AND INFANT FORMULA INDUSTRY
The French baby food and formula market performed negative during 2009 and 2010 due to the effect of financial crises. Market recuperated momentarily in 2011, supported by government initiatives to control inflation and trade but from mid of 2011, Eurozone crisis has wobbled consumer confidence once again and lowered down sales of baby food. In 2011, organic baby food recorded 11% growth, although this growth was low from 2010 by 2.70%.
Figure: France Baby Food and Formula Retail Sales by Value (2006-2011)
Figure: France Baby food and Formula Segmentation in %, 2011
FRANCE BABY FOOD INDUSTRY FORECASTS, 2012- 2016
The market for France baby food and formula is expected to grow at CAGR of 2.32% from 2012-2016 to USD 1,931.00 million. In coming years, the formula segment is expected to face major challenges in terms of price war, variety in product offering, government initiatives to support breastfeeding and change in regulations for import of powdered milk…
2007 2008 2009 2010 2011
USD
Mill
ion
Baby Food Formula Milk

Figure: France Baby Food and Formula Retail Sales Forecast by Value (2011-2016F)
GERMANY BABY FOOD AND FORMULA INDUSTRY
Germany is the largest dairy market in the European Union in terms of volume and value production. With the availability of cow milk, production cost of baby food has been observed to be low in the country as compared to the other European nations. In 2011, Germany baby food and formula segment accounted for 9.13% of the total European market, growing at CAGR 1.81% from 2006-2011 to USD ~ million. Growth in the past five years has witnessed a fall but industry continued to perform positively.
Figure: Germany Baby Food and Formula Retail Sales by Value (2006-2011)
INDUSTRY SEGMENTATION-RETAIL SALES AND FORECAST
In Germany, baby food (dry, ready-to-feed and other1
) account for the largest demand in the context of volume as well as value. This growth reflect that a large percentage of parents prefer functional food for their child, which is easy to feed and saves time and effort. Formula market also holds significant share but growth rate…
1 Other category includes, cheese, butter, semi cooked or prepared chicken for kids (2-3 year old kids), soups, noodles, Leafy green vegetables, etc.
2011 2012 2013 2014 2015 2016
USD
Mill
ion
2006 2007 2008 2009 2010 2011
USD
Mill
ion

Figure: Germany Baby Food and Formula Segmentation in Percentage, 2011
INTENSIFYING ORGANIC FOOD DEMAND
In 2011, European organic food retail sales reached EUR ~ billion from EUR ~ billion in the previous year. In terms of per capita consumption, Germany accounted for EUR ~ in 2010.
Figure: Germany Organic Baby Food Market Retail Sales and forecast (2006-2016)
GERMANY BABY FOOD AND FORMULA INDUSTRY FORECAST TO 2016
We expect economy growth to recover by 2013 but there will be only modest growth in high cost baby food products. The nature of Germans to save more will prohibit them to spend more even during the recovery period…
Baby Food Formula Milk
2006 2007 2008 2009 2010 2011 2012E 2013F 2014F 2015F 2016F
USD
Mill
ion

Figure: Germany Baby Food and Formula Retail Sales Forecast by Value (2011-2016F)
INDIA BABY FOOD AND INFANT FORMULA INDUSTRY
India is the potential destination for baby food manufacturers with huge untapped market. Out of the total baby food and formula market, formula milk continued to be on dominant position accounting for 50.52% in 2011. This percentage is low from 58% in 2006 with effect of rising acceptance of dried and ready to feed baby food products.
Figure: Indian Baby Food and Formula Retail Sales by value (2006-2011)
INDUSTRY SEGMENTATION-RETAIL SALES AND FORECAST
Baby food forms the largest segment and account for 50.52% of the total retail sales of baby food and formula market. This segment is expected to continue to grow with rising urban population, awareness and growing number of supermarkets in big cities.
2011 2012F 2013F 2014F 2015F 2016F
USD
Mill
ion
2006 2007 2008 2009 2010 2011
USD
Mill
ion

Figure: India Baby food and Formula Segmentation in %, 2011
INDIA BABY FOOD INDUSTRY FORECAST
In Indian market Nestle infant milk formula range includes- Lactogen 1, Lactogen 2, Nan 1, Nan 2 and baby food range includes- Cerelac and Nestum.
To compete in the Indian baby food market it is advisable for new brands to collaborate with existing well known brand. The overall baby food and formula market is expected to grow at 4.88% CAGR from 2011-2016…
Figure: India Baby Food and Formula Retail Sales Forecast by Value (2011-2016F)
CHINA BABY FOOD AND INFANT FORMULA INDUSTRY
China is the second largest baby food and infant formula market2
2 Baby food and infant formula market is consist of baby food (dry, ready-to-eat and baby juices) and milk formula (baby and infant powdered and liquid milk)
in the world and largest in Asia, which constitute of baby food such as- Dry baby food (cereals, bottled baby food), ready-to-eat baby food (canned baby food and snacks for one year and above babies), baby
Baby Food
Formula Milk
2011 2012 2013 2014 2015 2016
USD
Mill
ion

juices and infant formula milk segment. The domestic infant formula market is facing many challenges from foreign brands and had witnessed a continuous fall in demand in recent past. A major percentage of population in urban areas are shifting to premium and better quality of international brands with rising per-capita propensity to spend. Other segments such as bottled baby food, baby juices and dried baby food have also showcased a steady performance.
Figure: China Baby Food and Infant Formula Demand by Volume (2006-2011)
Note: Demand represent retail sales
Figure 1: China Baby Food and Infant Formula Demand by Value (2006-2011)
Note: Demand represent retail sales
BABY FOOD INDUSTRY SEGMENTATION
Baby food market is mainly divided into three parts:
Dried Baby Food: Cereals, bottled baby food, canned baby food Ready-to-eat Baby Food: Baby snacks, baby yogurts, others (fruit pulp, candies,
baked potatoes) Baby Juices
2006 2007 2008 2009 2010 2011
'000
Ton
es
2006 2007 2008 2009 2010 2011
USD
Mill
ion
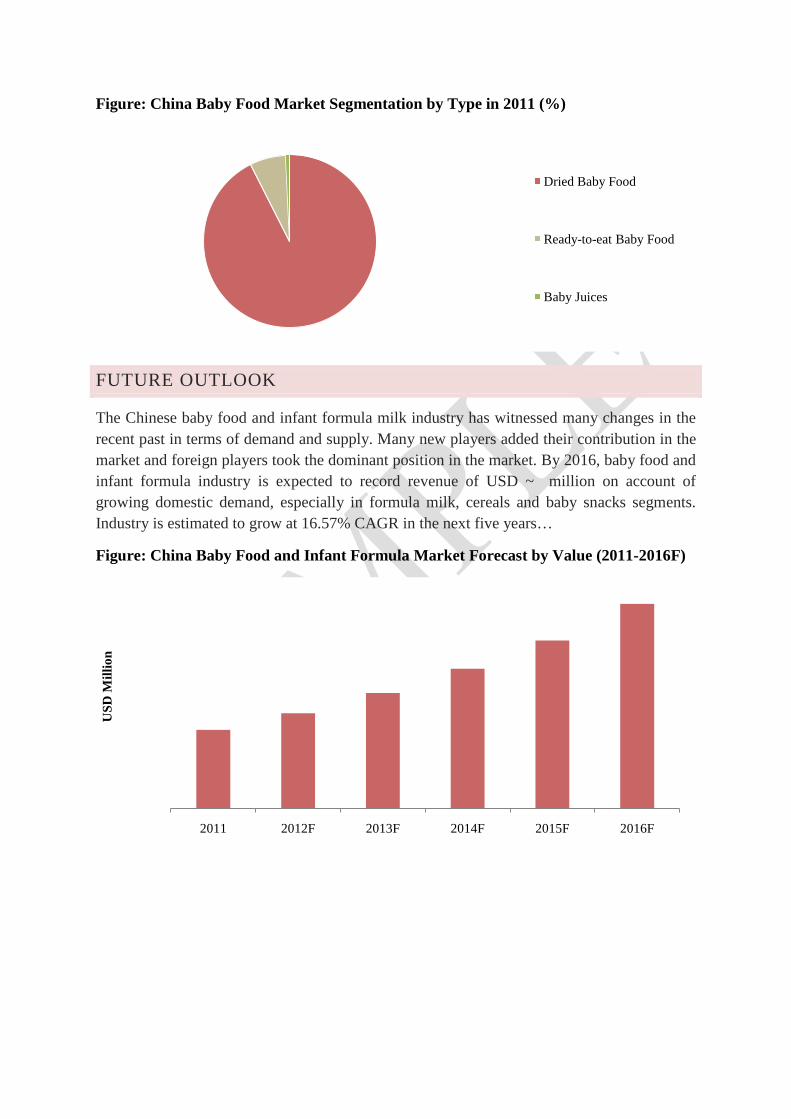
Figure: China Baby Food Market Segmentation by Type in 2011 (%)
FUTURE OUTLOOK
The Chinese baby food and infant formula milk industry has witnessed many changes in the recent past in terms of demand and supply. Many new players added their contribution in the market and foreign players took the dominant position in the market. By 2016, baby food and infant formula industry is expected to record revenue of USD ~ million on account of growing domestic demand, especially in formula milk, cereals and baby snacks segments. Industry is estimated to grow at 16.57% CAGR in the next five years…
Figure: China Baby Food and Infant Formula Market Forecast by Value (2011-2016F)
Dried Baby Food
Ready-to-eat Baby Food
Baby Juices
2011 2012F 2013F 2014F 2015F 2016F
USD
Mill
ion

DISCLAIMER
The research reports provided by AM Mindpower Solutions are for the personal information of the authorized recipient and is not for public distribution and should not be reproduced or redistributed without prior permission. You are permitted to print or download extracts from this material for your personal use only. None of this material may be used for any commercial or public use.
The information provided in the research documents is from publicly available data and other sources, which are reliable. Efforts are made to try and ensure accuracy of data. With respect to documents available, neither the company nor any of its employees makes any warranty, express or implied, including the warranties of merchantability and fitness for a particular purpose, or assumes any legal liability or responsibility for the accuracy, completeness, or usefulness of any information, apparatus, product, or process disclosed, or represents that its use will not infringe privately owned rights.
The report also includes analysis and views expressed by our research team. The research reports are purely for information purposes. The opinions expressed are our current opinions as of the date appearing in the material and may be subject to change from time to time without notice. Investors should not solely rely on the information contained in the research documents and must make investment decisions based on their own investment objectives, risk profile and financial position. The recipients of this material should take their own professional advice before acting on this information.
AM Mindpower Solutions will not accept returns of reports once dispatched due to the confidentiality of information provided in our reports. In case, a report qualify for return, we will issue a credit, minus shipping charges, of equal value to the original purchase price, toward a future purchase—no refunds. The decision about whether the product return can be accepted or not is solely at our discretion. Any dispute will be subject to laws of India and exclusive jurisdiction of Indian Courts.
No part of this manual or any material appearing may be reproduced, stored in or transmitted on any other Web site without written permission of AM Mindpower Solutions and any payments of a specified fee. Requests to republish any material may be sent to us.


![REPORT SAMPLE PAGES - MarketResearch.com: Market … · Marketplace Characterized via Primary Market Surveys where Data from Industry Participants [Researchers] Focusing on microRNAs](https://img.pdfslide.us/doc/110x75/60368e356d038e4d1f5d7541/report-sample-pages-market-marketplace-characterized-via-primary-market-surveys.jpg)


![PowerPoint Presentation...[1]"Pharmaceutical Drugs Global Market Report 2018", Marketresearch.com, 2019. [Online]. Available:](https://img.pdfslide.us/doc/110x75/5ff0c2a88540c36b5543be69/powerpoint-1pharmaceutical-drugs-global-market-report-2018-marketresearchcom.jpg)