Embed Size (px)
Citation preview
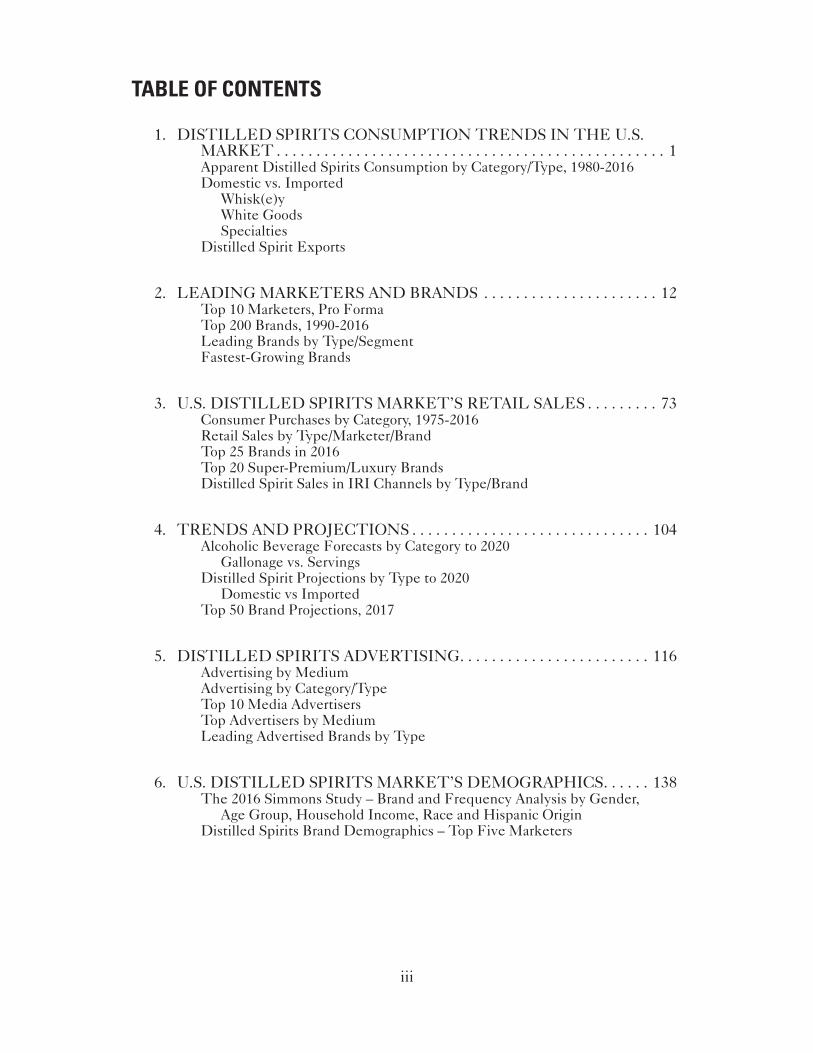
iii
1. DISTILLED SPIRITS CONSUMPTION TRENDS IN THE U.S. MARKET . . . . . . . . . . . . . . . . . . . . . . . . . . . . . . . . . . . . . . . . . . . . . . . . . 1Apparent Distilled Spirits Consumption by Category/Type, 1980-2016Domestic vs. Imported
Whisk(e)yWhite GoodsSpecialties
Distilled Spirit Exports
2. LEADING MARKETERS AND BRANDS . . . . . . . . . . . . . . . . . . . . . . 12Top 10 Marketers, Pro Forma Top 200 Brands, 1990-2016Leading Brands by Type/SegmentFastest-Growing Brands
3. U.S. DISTILLED SPIRITS MARKET’S RETAIL SALES . . . . . . . . . 73Consumer Purchases by Category, 1975-2016Retail Sales by Type/Marketer/BrandTop 25 Brands in 2016Top 20 Super-Premium/Luxury BrandsDistilled Spirit Sales in IRI Channels by Type/Brand
4. TRENDS AND PROJECTIONS . . . . . . . . . . . . . . . . . . . . . . . . . . . . . . 104Alcoholic Beverage Forecasts by Category to 2020
Gallonage vs. ServingsDistilled Spirit Projections by Type to 2020
Domestic vs ImportedTop 50 Brand Projections, 2017
5. DISTILLED SPIRITS ADVERTISING. . . . . . . . . . . . . . . . . . . . . . . . 116Advertising by MediumAdvertising by Category/TypeTop 10 Media AdvertisersTop Advertisers by MediumLeading Advertised Brands by Type
6. U.S. DISTILLED SPIRITS MARKET’S DEMOGRAPHICS. . . . . . 138The 2016 Simmons Study – Brand and Frequency Analysis by Gender,
Age Group, Household Income, Race and Hispanic OriginDistilled Spirits Brand Demographics – Top Five Marketers
TABLE OF CONTENTS
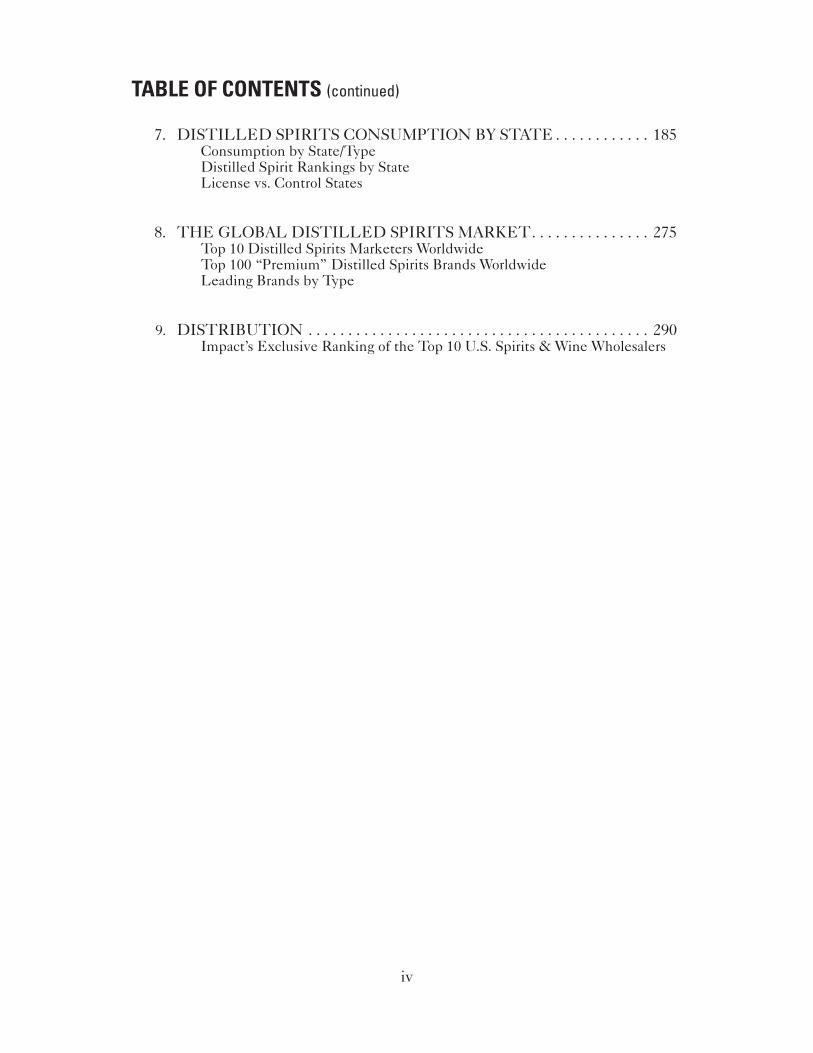
7. DISTILLED SPIRITS CONSUMPTION BY STATE . . . . . . . . . . . . 185Consumption by State/TypeDistilled Spirit Rankings by StateLicense vs. Control States
8. THE GLOBAL DISTILLED SPIRITS MARKET. . . . . . . . . . . . . . . 275Top 10 Distilled Spirits Marketers WorldwideTop 100 “Premium” Distilled Spirits Brands WorldwideLeading Brands by Type
9. DISTRIBUTION . . . . . . . . . . . . . . . . . . . . . . . . . . . . . . . . . . . . . . . . . . . 290 Impact’s Exclusive Ranking of the Top 10 U.S. Spirits & Wine Wholesalers
iv
TABLE OF CONTENTS (continued)
v
CHAPTER 11-1 Alcoholic Beverage Consumption by Category . . . . . . . . . . . . . . . . . . . . . . . . . . . . . . . . . . . . . . . . . 31-2 Apparent Distilled Spirits Consumption by Category . . . . . . . . . . . . . . . . . . . . . . . . . . . . . . . . . . . . 31-3 Apparent Distilled Spirits Consumption by Type . . . . . . . . . . . . . . . . . . . . . . . . . . . . . . . . . . . . . . . 41-4 Adult Per-Capita Distilled Spirits Consumption by Category/Type . . . . . . . . . . . . . . . . . . . . . . . . 61-5 Apparent Distilled Spirits Consumption by Origin . . . . . . . . . . . . . . . . . . . . . . . . . . . . . . . . . . . . . . 71-6 Apparent Distilled Spirits Consumption by Origin – Share of Market . . . . . . . . . . . . . . . . . . . . . . 7 1-7 Apparent Consumption of Imported Distilled Spirits by Category/Type . . . . . . . . . . . . . . . . . . . . 81-8 Apparent Scotch Whisky Consumption . . . . . . . . . . . . . . . . . . . . . . . . . . . . . . . . . . . . . . . . . . . . . . . 91-9 Apparent Canadian Whisky Consumption . . . . . . . . . . . . . . . . . . . . . . . . . . . . . . . . . . . . . . . . . . . . 101-10 Commercial Exports of U.S. Distilled Spirits by Country of Destination . . . . . . . . . . . . . . . . . . . 11
CHAPTER 22-1 Top 10 Distilled Spirit Companies . . . . . . . . . . . . . . . . . . . . . . . . . . . . . . . . . . . . . . . . . . . . . . . . . . 142-2 Top 20 Distilled Spirit Growth Brands Ranked by Volume Change, 2010-2016. . . . . . . . . . . . . . 152-3 2016 Top 200 Distilled Spirit Brands Recap by Category/Origin . . . . . . . . . . . . . . . . . . . . . . . . . . 162-4 Top 200 Distilled Spirit Brands . . . . . . . . . . . . . . . . . . . . . . . . . . . . . . . . . . . . . . . . . . . . . . . . . . . . . 172-5 Top 200 Distilled Spirit Brands by Category/Type . . . . . . . . . . . . . . . . . . . . . . . . . . . . . . . . . . . . . 242-6 Top 200 Distilled Spirit Brands – Distiller/Importer Performance Analysis . . . . . . . . . . . . . . . . . 252-7 Leading Distiller/Importer Major Brand Dependence Analysis. . . . . . . . . . . . . . . . . . . . . . . . . . . 272-8 2016 Distilled Spirits Brand Recap by Category/Origin . . . . . . . . . . . . . . . . . . . . . . . . . . . . . . . . . 352-9 Selected Bourbon Whisk(e)y Brand Depletions . . . . . . . . . . . . . . . . . . . . . . . . . . . . . . . . . . . . . . . 362-10 NEW - Top 10 Super-Premium Bourbon Brands. . . . . . . . . . . . . . . . . . . . . . . . . . . . . . . . . . . . . . . 382-11 Selected Domestic Blended Whiskey Brand Depletions . . . . . . . . . . . . . . . . . . . . . . . . . . . . . . . . 392-12 Selected Scotch Whisky Brand Depletions . . . . . . . . . . . . . . . . . . . . . . . . . . . . . . . . . . . . . . . . . . . 402-13 Selected Canadian Whisky Brand Depletions . . . . . . . . . . . . . . . . . . . . . . . . . . . . . . . . . . . . . . . . . 422-14 Leading Irish Whiskey Brands. . . . . . . . . . . . . . . . . . . . . . . . . . . . . . . . . . . . . . . . . . . . . . . . . . . . . . 432-15 “Better” Whisk(e)y Depletions by Origin/Type . . . . . . . . . . . . . . . . . . . . . . . . . . . . . . . . . . . . . . . 442-16 Share of “Better” Whisk(e)y Depletions by Origin/Type . . . . . . . . . . . . . . . . . . . . . . . . . . . . . . . . 442-17 Leading “Better” Whisk(e)y Brands . . . . . . . . . . . . . . . . . . . . . . . . . . . . . . . . . . . . . . . . . . . . . . . . . 452-18 Selected Gin Brand Depletions . . . . . . . . . . . . . . . . . . . . . . . . . . . . . . . . . . . . . . . . . . . . . . . . . . . . . 462-19 Selected Vodka Brand Depletions . . . . . . . . . . . . . . . . . . . . . . . . . . . . . . . . . . . . . . . . . . . . . . . . . . . 472-20 Domestic Vodka Depletions by Price Segment . . . . . . . . . . . . . . . . . . . . . . . . . . . . . . . . . . . . . . . . 502-21 Domestic Vodka Depletions, Share by Price Segment . . . . . . . . . . . . . . . . . . . . . . . . . . . . . . . . . . 502-22 Top 5 Premium Domestic Vodka Brands . . . . . . . . . . . . . . . . . . . . . . . . . . . . . . . . . . . . . . . . . . . . . 512-23 Top 10 Sub-Premium Domestic Vodka Brands . . . . . . . . . . . . . . . . . . . . . . . . . . . . . . . . . . . . . . . . 512-24 Imported Vodka Depletions by Price Segment . . . . . . . . . . . . . . . . . . . . . . . . . . . . . . . . . . . . . . . . 522-25 Imported Vodka Depletions, Share by Price Segment . . . . . . . . . . . . . . . . . . . . . . . . . . . . . . . . . . 522-26 Top 10 Premium Imported Vodka Brands. . . . . . . . . . . . . . . . . . . . . . . . . . . . . . . . . . . . . . . . . . . . . 532-27 Top Five Super-Premium Vodka Brands. . . . . . . . . . . . . . . . . . . . . . . . . . . . . . . . . . . . . . . . . . . . . . 532-28 Selected Rum Brand Depletions . . . . . . . . . . . . . . . . . . . . . . . . . . . . . . . . . . . . . . . . . . . . . . . . . . . . 542-29 Selected Tequila Brand Depletions. . . . . . . . . . . . . . . . . . . . . . . . . . . . . . . . . . . . . . . . . . . . . . . . . . 562-30 NEW - Leading Luxury-Priced Tequila Brands . . . . . . . . . . . . . . . . . . . . . . . . . . . . . . . . . . . . . . . 582-31 NEW - Leading Super-Premium Tequila Brands . . . . . . . . . . . . . . . . . . . . . . . . . . . . . . . . . . . . . . 582-32 NEW - Leading Premium-Priced Tequila Brands . . . . . . . . . . . . . . . . . . . . . . . . . . . . . . . . . . . . . . 592-33 NEW - Leading Sub-Premium Tequila Brands . . . . . . . . . . . . . . . . . . . . . . . . . . . . . . . . . . . . . . . . 592-34 Share of Tequila Depletions by Type . . . . . . . . . . . . . . . . . . . . . . . . . . . . . . . . . . . . . . . . . . . . . . . . 60
LISTING OF TABLES AND CHARTS
vi
2-35 Flavored White Goods Market by Type . . . . . . . . . . . . . . . . . . . . . . . . . . . . . . . . . . . . . . . . . . . . . . 602-36 Selected Brandy/Cognac Brand Depletions . . . . . . . . . . . . . . . . . . . . . . . . . . . . . . . . . . . . . . . . . . . 612-37 Selected Domestic Cordial and Whiskey Specialty Brand Depletions . . . . . . . . . . . . . . . . . . . . . 632-38 Selected Imported Liqueur and Whiskey Specialty Brand Depletions. . . . . . . . . . . . . . . . . . . . . 652-39 Top 10 Cream Cordials & Liqueurs . . . . . . . . . . . . . . . . . . . . . . . . . . . . . . . . . . . . . . . . . . . . . . . . . 672-40 U.S. – Top Ten Flavored Whiskies . . . . . . . . . . . . . . . . . . . . . . . . . . . . . . . . . . . . . . . . . . . . . . . . . . 682-41 Selected Cocktails & Mixed Drinks Brand Depletions. . . . . . . . . . . . . . . . . . . . . . . . . . . . . . . . . . 692-42 Fastest Growing Distilled Spirit Brands . . . . . . . . . . . . . . . . . . . . . . . . . . . . . . . . . . . . . . . . . . . . . . 712-43 Selected New Distilled Spirits Brand Introductions, 2015-2016 . . . . . . . . . . . . . . . . . . . . . . . . . . 72
CHAPTER 33-1 Alcoholic Beverage Consumer Purchases by Category . . . . . . . . . . . . . . . . . . . . . . . . . . . . . . . . . . 753-2 2016 U.S. Alcoholic Beverage Market – Estimated Retail Sales. . . . . . . . . . . . . . . . . . . . . . . . . . . 763-3 2016 U.S. Distilled Spirits Market – Estimated Retail Sales . . . . . . . . . . . . . . . . . . . . . . . . . . . . . 773-4 2016 Top 20 Distilled Spirit Marketers’ Retail Sales Rankings . . . . . . . . . . . . . . . . . . . . . . . . . . . 783-5 2016 Top 20 Distilled Spirit Marketers’ Major Brand Retail Sales Analysis . . . . . . . . . . . . . . . . . 793-6 2016 Top 25 Distilled Spirit Brands’ Retail Sales. . . . . . . . . . . . . . . . . . . . . . . . . . . . . . . . . . . . . . . 853-7 U.S. - Top 10 Distilled Spirit Brands’ Retail Sales, 1975-2016 . . . . . . . . . . . . . . . . . . . . . . . . . . . . 863-8 Top 20 Super-Premium/Luxury Distilled Spirit Brands Ranked by 2016 Retail Sales . . . . . . . . 893-9 Distilled Spirits Market by Category/Type in Supermarkets . . . . . . . . . . . . . . . . . . . . . . . . . . . . . 903-10 Top 20 Distilled Spirit Brands in Supermarkets. . . . . . . . . . . . . . . . . . . . . . . . . . . . . . . . . . . . . . . . 913-11 Top Eight Bourbon Brands in Supermarkets . . . . . . . . . . . . . . . . . . . . . . . . . . . . . . . . . . . . . . . . . . 923-12 Top Two Domestic Blended Whiskey Brands in Supermarkets. . . . . . . . . . . . . . . . . . . . . . . . . . . 923-13 Top 10 Scotch Whisky Brands in Supermarkets. . . . . . . . . . . . . . . . . . . . . . . . . . . . . . . . . . . . . . . . 933-14 Top 10 Canadian Whisky Brands in Supermarkets . . . . . . . . . . . . . . . . . . . . . . . . . . . . . . . . . . . . . 943-15 NEW - Top Five Irish Whiskey Brands in Supermarkets . . . . . . . . . . . . . . . . . . . . . . . . . . . . . . . . 953-16 Top 10 Gin Brands in Supermarkets . . . . . . . . . . . . . . . . . . . . . . . . . . . . . . . . . . . . . . . . . . . . . . . . . 963-17 Top 10 Vodka Brands in Supermarkets . . . . . . . . . . . . . . . . . . . . . . . . . . . . . . . . . . . . . . . . . . . . . . . 973-18 Top Seven Rum Brands in Supermarkets . . . . . . . . . . . . . . . . . . . . . . . . . . . . . . . . . . . . . . . . . . . . . 983-19 Top 10 Tequila Brands in Supermarkets. . . . . . . . . . . . . . . . . . . . . . . . . . . . . . . . . . . . . . . . . . . . . . 993-20 Top Five Domestic Brandy Brands in Supermarkets . . . . . . . . . . . . . . . . . . . . . . . . . . . . . . . . . . 1003-21 Top Three Cognac Brands in Supermarkets. . . . . . . . . . . . . . . . . . . . . . . . . . . . . . . . . . . . . . . . . . 1003-22 Top 15 Cordial/Liqueur Brands’ in Supermarkets . . . . . . . . . . . . . . . . . . . . . . . . . . . . . . . . . . . . . 1013-23 Top Three Flavored Whiskey Specialties in Supermarkets . . . . . . . . . . . . . . . . . . . . . . . . . . . . . 1023-24 NEW - Top Seven Pre-Mixed Cocktails in Supermarkets . . . . . . . . . . . . . . . . . . . . . . . . . . . . . . 1023-25 Private Label Spirit Sales in Supermarkets by Type . . . . . . . . . . . . . . . . . . . . . . . . . . . . . . . . . . . 103
CHAPTER 44-1 Alcoholic Beverage Consumption Trends by Category, 1970-2020E . . . . . . . . . . . . . . . . . . . . . . 1064-2 Alcoholic Beverage Consumption Trends by Category, 1950-2020E – Volume vs.
Number of Servings . . . . . . . . . . . . . . . . . . . . . . . . . . . . . . . . . . . . . . . . . . . . . . . . . . . . . . . . . . . 1074-3 Apparent Consumption of Distilled Spirits by Type, 2005-2020 . . . . . . . . . . . . . . . . . . . . . . . . . 1084-4 Distilled Spirits Consumption Growth Rates by Type, 2005-2020. . . . . . . . . . . . . . . . . . . . . . . . 1094-5 Adult Per-Capita Consumption of Distilled Spirits by Type, 2005-2020 . . . . . . . . . . . . . . . . . . . 1104-6 Adult Per-Capita Consumption of Distilled Spirits, 2005-2020, Growth Rates by Type . . . . . . 1114-7 Apparent Consumption of Distilled Spirits by Origin, 2005-2020 . . . . . . . . . . . . . . . . . . . . . . . . 1124-8 Distilled Spirits Growth Rates by Origin, 2005-2020. . . . . . . . . . . . . . . . . . . . . . . . . . . . . . . . . . . 1124-9 Adult Per-Capita Consumption of Distilled Spirits by Origin, 2005-2020 . . . . . . . . . . . . . . . . . . 1134-10 Adult Per-Capita Consumption of Distilled Spirits, 2005-2020, Growth Rates by Origin . . . . . 1134-11 Top 50 Distilled Spirit Brands . . . . . . . . . . . . . . . . . . . . . . . . . . . . . . . . . . . . . . . . . . . . . . . . . . . . . 114
vii
CHAPTER 55-1 Alcoholic Beverage Media Advertising Expenditures by Category . . . . . . . . . . . . . . . . . . . . . . . 1185-2 Alcoholic Beverage Per-Case Media Advertising by Category . . . . . . . . . . . . . . . . . . . . . . . . . . . 1185-3 2016 Distilled Spirits Media Recap, Dollar Change vs. 2015 . . . . . . . . . . . . . . . . . . . . . . . . . . . . 1195-4 Distilled Spirits Advertising Expenditures by Medium . . . . . . . . . . . . . . . . . . . . . . . . . . . . . . . . 1205-5 Share of Distilled Spirits Advertising Expenditures by Medium . . . . . . . . . . . . . . . . . . . . . . . . . 1205-6 Distilled Spirits Media Advertising Expenditures by Category/Type . . . . . . . . . . . . . . . . . . . . . 1215-7 Distilled Spirits Media Advertising Expenditures by Type/Origin . . . . . . . . . . . . . . . . . . . . . . . 1225-8 Top 10 Distilled Spirits Media Advertisers. . . . . . . . . . . . . . . . . . . . . . . . . . . . . . . . . . . . . . . . . . . 1235-9 Top 10 Distilled Spirits T.V. Advertisers. . . . . . . . . . . . . . . . . . . . . . . . . . . . . . . . . . . . . . . . . . . . . 1245-10 Top 10 Distilled Spirits Magazine Advertisers . . . . . . . . . . . . . . . . . . . . . . . . . . . . . . . . . . . . . . . . 1255-11 Distilled Spirits Media Advertising Recap by Category/Type –
Number of Brands Advertised. . . . . . . . . . . . . . . . . . . . . . . . . . . . . . . . . . . . . . . . . . . . . . . . . . . 1265-12 Top 25 Distilled Spirit Brand Media Advertisers . . . . . . . . . . . . . . . . . . . . . . . . . . . . . . . . . . . . . . 1275-13 Top 25 Distilled Spirit Brand T.V. Advertisers . . . . . . . . . . . . . . . . . . . . . . . . . . . . . . . . . . . . . . . . 1285-14 Top 25 Distilled Spirit Brand Magazine Advertisers . . . . . . . . . . . . . . . . . . . . . . . . . . . . . . . . . . . 1295-15 Top Eight Bourbon Whisk(e)y Brand Media Advertisers . . . . . . . . . . . . . . . . . . . . . . . . . . . . . . . 1305-16 Top Eight Scotch Whisky Brand Media Advertisers . . . . . . . . . . . . . . . . . . . . . . . . . . . . . . . . . . . 1315-17 Top Two Canadian Whisky Brand Media Advertisers . . . . . . . . . . . . . . . . . . . . . . . . . . . . . . . . . . 1325-18 Top Three Irish Whiskey Brand Media Advertisers . . . . . . . . . . . . . . . . . . . . . . . . . . . . . . . . . . . 1325-19 Top 13 Vodka Brand Media Advertisers . . . . . . . . . . . . . . . . . . . . . . . . . . . . . . . . . . . . . . . . . . . . . 1335-20 Top Three Gin Media Advertisers . . . . . . . . . . . . . . . . . . . . . . . . . . . . . . . . . . . . . . . . . . . . . . . . . 1345-21 Top Five Rum Brand Media Advertisers . . . . . . . . . . . . . . . . . . . . . . . . . . . . . . . . . . . . . . . . . . . . 1345-22 Top 10 Tequila Brand Media Advertisers . . . . . . . . . . . . . . . . . . . . . . . . . . . . . . . . . . . . . . . . . . . . 1355-23 Top 12 Cordial/Liqueur Brand Media Advertisers. . . . . . . . . . . . . . . . . . . . . . . . . . . . . . . . . . . . . 1365-24 Top Five Flavored Whisk(e)y Brand Media Advertisers. . . . . . . . . . . . . . . . . . . . . . . . . . . . . . . . 1375-25 Top Two Brandy/Cognac Brand Media Advertisers. . . . . . . . . . . . . . . . . . . . . . . . . . . . . . . . . . . . 137
CHAPTER 66-1 2016 Percentage of All Distilled Spirit Drinkers by Gender. . . . . . . . . . . . . . . . . . . . . . . . . . . . . 1406-2 2016 Percentage of All Distilled Spirit Drinkers by Age Group . . . . . . . . . . . . . . . . . . . . . . . . . . 1406-3 2016 Percentage of All Distilled Spirit Drinkers by Household Income . . . . . . . . . . . . . . . . . . . 1416-4 2016 Percentage of All Distilled Spirit Drinkers by Race and Hispanic Origin . . . . . . . . . . . . . 1416-5 2016 Top Five Marketers for Domestic & Imported Distilled Spirit Brands’ Consumption –
Share by Gender, Age Group, Household Income, Race and Hispanic Origin . . . . . . . . . . . 1426-6 2016 Bourbon Drinkers – Frequency of Drinks Consumed in Last Thirty Days,
Share of Gender, Age Group, Household Income, Race and Hispanic Origin . . . . . . . . . . . . 1456-7 2016 Bourbon Drinkers – Frequency of Drinks Consumed in Last Thirty Days,
Share by Gender, Age Group, Household Income, Race and Hispanic Origin . . . . . . . . . . . 1456-8 2016 Percentage of All Bourbon Drinkers by Brand – Share of Gender, Age Group,
Household Income, Race and Hispanic Origin . . . . . . . . . . . . . . . . . . . . . . . . . . . . . . . . . . . . . 1466-9 2016 Percentage of All Bourbon Drinkers by Brand – Share by Gender, Age Group,
Household Income, Race and Hispanic Origin . . . . . . . . . . . . . . . . . . . . . . . . . . . . . . . . . . . . . 1476-10 2016 Domestic Blended Whiskey Drinkers – Frequency of Drinks Consumed in Last
Thirty Days, Share of Gender, Age Group, Household Income, Race and Hispanic Origin. 1486-11 2016 Blended Whiskey Drinkers – Frequency of Drinks Consumed in Last Thirty Days, Share
by Gender, Age Group, Household Income, Race and Hispanic Origin . . . . . . . . . . . . . . . . . 1486-12 2016 Percentage of All Domestic Blended Whiskey Drinkers by Brand – Share of Gender, Age
Group, Household Income, Race and Hispanic Origin. . . . . . . . . . . . . . . . . . . . . . . . . . . . . . . 149
viii
6-13 2016 Percentage of All Domestic Blended Whiskey Drinkers by Brand – Share by Gender, Age Group, Household Income, Race and Hispanic Origin. . . . . . . . . . . . . . . . . . . . . . . . . . . . . . . 149
6-14 2016 Scotch Whisky Drinkers – Frequency of Drinks Consumed in Last Thirty Days, Share of Gender, Age Group, Household Income, Race and Hispanic Origin. . . . . . . 150
6-15 2016 Scotch Whisky Drinkers – Frequency of Drinks Consumed in Last Thirty Days, Share by Gender, Age Group, Household Income, Race and Hispanic Origin . . . . . . . . . . . . . . . . . . . 150
6-16 2016 Percentage of All Scotch Whisky Drinkers by Brand – Share of Gender, Age Group, Household Income, Race and Hispanic Origin. . . . . . . . . . . . . . . . . . . . . . . . . . . . . . . 151
6-17 2016 Percentage of All Scotch Whisky Drinkers by Brand – Share by Gender, Age Group, Household Income, Race and Hispanic Origin. . . . . . . . . . . . . . . . . . . . . . . . . . . . . . . 152
6-18 2016 Canadian Whisky Drinkers – Frequency of Drinks Consumed in Last Thirty Days, Share of Gender, Age Group, Household Income, Race and Hispanic Origin. . . . . . . 153
6-19 2016 Canadian Whisky Drinkers – Frequency of Drinks Consumed in Last Thirty Days, Share by Gender, Age Group, Household Income, Race and Hispanic Origin . . . . . . 153
6-20 2016 Percentage of All Canadian Whisky Drinkers by Brand – Share of Gender, Age Group, Household Income, Race and Hispanic Origin . . . . . . . . . . . . . . . . . . . . . . . . . . . 154
6-21 2016 Percentage of All Canadian Whisky Drinkers by Brand – Share by Gender, Age Group, Household Income, Race and Hispanic Origin . . . . . . . . . . . . . . . . . . . . . . . . . . . 155
6-22 2016 Irish Whiskey Drinkers – Frequency of Drinks Consumed in Last Thirty Days, Share of Gender, Age Group, Household Income, Race and Hispanic Origin. . . . . . . 156
6-23 2016 Irish Whiskey Drinkers – Frequency of Drinks Consumed in Last Thirty Days, Share by Gender, Age Group, Household Income, Race and Hispanic Origin . . . . . . 156
6-24 2016 Percentage of All Irish Whiskey Drinkers by Brand – Share of Gender, Age Group, Household Income, Race and Hispanic Origin. . . . . . . . . . . . . . . . . . . . . . . . . . . . . . . 157
6-25 2016 Percentage of All Irish Whiskey Drinkers by Brand – Share by Gender, Age Group, Household Income, Race and Hispanic Origin. . . . . . . . . . . . . . . . . . . . . . . . . . . . . . . 157
6-26 2016 Gin Drinkers – Frequency of Drinks Consumed in Last Thirty Days, Share of Gender, Age Group, Household Income, Race and Hispanic Origin . . . . . . . . . . . . . . . . . 158
6-27 2016 Gin Drinkers – Frequency of Drinks Consumed in Last Thirty Days, Share by Gender, Age Group, Household Income, Race and Hispanic Origin . . . . . . . . . . . . . . . . . 158
6-28 2016 Percentage of All Gin Drinkers by Brand – Share of Gender, Age Group, Household Income, Race and Hispanic Origin . . . . . . . . . . . . . . . . . . . . . . . . . . . . . . . . . . . . . 159
6-29 2016 Percentage of All Gin Drinkers by Brand – Share by Gender, Age Group, Household Income, Race and Hispanic Origin . . . . . . . . . . . . . . . . . . . . . . . . . . . . . . . . . . . . . 160
6-30 2016 Vodka Drinkers – Frequency of Drinks Consumed in Last Thirty Days, Share of Gender, Age Group, Household Income, Race and Hispanic Origin . . . . . . . . . . . . 161
6-31 2016 Vodka Drinkers – Frequency of Drinks Consumed in Last Thirty Days, Share by Gender, Age Group, Household Income, Race and Hispanic Origin . . . . . . . . . . . 161
6-32 2016 Percentage of All Vodka Drinkers by Brand – Share of Gender, Age Group, Household Income, Race and Hispanic Origin . . . . . . . . . . . . . . . . . . . 162
6-33 2016 Percentage of All Vodka Drinkers by Price Segment – Share by Gender, Age Group, Household Income, Race and Hispanic Origin . . . . . . . . . . . . . . . . . . . 164
6-34 2016 Rum Drinkers – Frequency of Drinks Consumed in Last Thirty Days, Share of Gender, Age Group, Household Income, Race and Hispanic Origin . . . . . . . . . . . . 166
6-35 2016 Rum Drinkers – Frequency of Drinks Consumed in Last Thirty Days, Share by Gender, Age Group, Household Income, Race and Hispanic Origin . . . . . . . . . . . . . . . . . 166
6-36 2016 Percentage of All Rum Drinkers by Brand – Share of Gender, Age Group, Household Income, Race and Hispanic Origin . . . . . . . . . . . . . . . . . . . . . . . . . . . . . . . . . . . . . 167
6-37 2016 Percentage of All Rum Drinkers by Brand – Share by Gender, Age Group, Household Income, Race and Hispanic Origin . . . . . . . . . . . . . . . . . . . . . . . . . . . . . . . . . . . . . 168
6-38 2016 Tequila Drinkers – Frequency of Drinks Consumed in Last Thirty Days, Share of Gender, Age Group, Household Income, Race and Hispanic Origin . . . . . . . . . . . . 169
ix
6-39 2016 Tequila Drinkers – Frequency of Drinks Consumed in Last Thirty Days, Share by Gender, Age Group, Household Income, Race and Hispanic Origin . . . . . . . . . . . 169
6-40 2016 Percentage of All Tequila Drinkers by Brand – Share of Gender, Age Group, Household Income, Race and Hispanic Origin . . . . . . . . . . . . . . . . . . . . . . . . . . . . . . . . . . . . . 170
6-41 2016 Percentage of All Tequila Drinkers by Brand – Share by Gender, Age Group, Household Income, Race and Hispanic Origin. . . . . . . . . . . . . . . . . . . . . . . . . . . . . . . 171
6-42 2016 Brandy & Armagnac Drinkers – Frequency of Drinks Consumed in Last Thirty Days, Share of Gender, Age Group, Household Income, Race and Hispanic Origin . . . . . . . . . . . . 172
6-43 2016 Brandy & Armagnac Drinkers – Frequency of Drinks Consumed in Last Thirty Days, Share by Gender, Age Group, Household Income, Race and Hispanic Origin . . . . . . . . . . . 172
6-44 2016 Percentage of All Brandy & Armagnac Drinkers by Brand – Share of Gender, Age Group, Household Income, Race and Hispanic Origin . . . . . . . . . . . . . . . . . . . 173
6-45 2016 Percentage of All Brandy & Armagnac Drinkers by Brand – Share by Gender, Age Group, Household Income, Race and Hispanic Origin . . . . . . . . . . . . . . . . . . . 174
6-46 2016 Cognac Drinkers – Frequency of Drinks Consumed in Last Thirty Days, Share of Gender, Age Group, Household Income, Race and Hispanic Origin . . . . . . . . . . . . 175
6-47 2016 Cognac Drinkers – Frequency of Drinks Consumed in Last Thirty Days, Share by Gender, Age Group, Household Income, Race and Hispanic Origin . . . . . . . . . . . 175
6-48 2016 Percentage of All Cognac Drinkers by Brand – Share of Gender, Age Group, Household Income, Race and Hispanic Origin . . . . . . . . . . . . . . . . . . . . . . . . . . . . . . . . . . . . . 176
6-49 2016 Percentage of All Cognac Drinkers by Brand – Share by Gender, Age Group, Household Income, Race and Hispanic Origin . . . . . . . . . . . . . . . . . . . . . . . . . . . . . . . . . . . . . 176
6-50 2016 Cordial & Liqueur Drinkers – Frequency of Drinks Consumed in Last Thirty Days, Share of Gender, Age Group, Household Income, Race and Hispanic Origin. . . . . . . 177
6-51 2016 Cordial & Liqueur Drinkers – Frequency of Drinks Consumed in Last Thirty Days, Share by Gender, Age Group, Household Income, Race and Hispanic Origin . . . . . . 177
6-52 2016 Percentage of All Cordial & Liqueur Drinkers by Brand – Share of Gender, Age Group, Household Income, Race and Hispanic Origin . . . . . . . . . . . . . . . . . . . . . . . . . . . 178
6-53 2016 Percentage of All Cordial & Liqueur Drinkers by Brand – Share by Gender, Age Group, Household Income, Race and Hispanic Origin . . . . . . . . . . . . . . . . . . . . . . . . . . . 180
6-54 2016 Cocktails & Mixed Drinks Drinkers – Frequency of Drinks Consumed in Last Thirty Days, Share of Gender, Age Group, Household Income, Race and Hispanic Origin. . . . . . . 182
6-55 2016 Cocktails & Mixed Drinks Drinkers – Frequency of Drinks Consumed in Last Thirty Days, Share by Gender, Age Group, Household Income, Race and Hispanic Origin . . . . . . 182
6-56 2016 Percentage of Cocktails & Mixed Drinks Drinkers by Brand – Share of Gender, Age Group, Household Income, Race and Hispanic Origin . . . . . . . . . . . . . . . . . . . 183
6-57 2016 Percentage of Cocktails & Mixed Drinks Drinkers by Brand – Share by Gender, Age Group, Household Income, Race and Hispanic Origin . . . . . . . . . . . . . . . . . . . 184
CHAPTER 77-1 Apparent Consumption of Distilled Spirits by State . . . . . . . . . . . . . . . . . . . . . . . . . . . . . . . . . . . 1877-2 Total Distilled Spirits Per-Capita Consumption. . . . . . . . . . . . . . . . . . . . . . . . . . . . . . . . . . . . . . . 1897-3 Apparent Consumption of Distilled Spirits Ranked by State . . . . . . . . . . . . . . . . . . . . . . . . . . . . 1917-4 2016 Apparent Distilled Spirits Consumption by State/Category . . . . . . . . . . . . . . . . . . . . . . . . 1937-5 2016 Total Whisk(e)y Consumption by State/Type . . . . . . . . . . . . . . . . . . . . . . . . . . . . . . . . . . . . 1957-6 2016 White Good Consumption by State/Type . . . . . . . . . . . . . . . . . . . . . . . . . . . . . . . . . . . . . . . 1977-7 2016 Total Specialties Consumption by State/Type . . . . . . . . . . . . . . . . . . . . . . . . . . . . . . . . . . . 1997-8 Total Whisk(e)y Consumption by State . . . . . . . . . . . . . . . . . . . . . . . . . . . . . . . . . . . . . . . . . . . . . 2017-9 Total Whisk(e)y Per-Capita Consumption . . . . . . . . . . . . . . . . . . . . . . . . . . . . . . . . . . . . . . . . . . . 2037-10 Total Domestic Whisk(e)y Consumption by State. . . . . . . . . . . . . . . . . . . . . . . . . . . . . . . . . . . . . 205
x
7-11 Total Domestic Whisk(e)y Per-Capita Consumption . . . . . . . . . . . . . . . . . . . . . . . . . . . . . . . . . . 2077-12 Total Bourbon Consumption by State. . . . . . . . . . . . . . . . . . . . . . . . . . . . . . . . . . . . . . . . . . . . . . . 2097-13 Total Bourbon Per-Capita Consumption. . . . . . . . . . . . . . . . . . . . . . . . . . . . . . . . . . . . . . . . . . . . . 2117-14 Total Domestic Blended Whiskey Consumption by State . . . . . . . . . . . . . . . . . . . . . . . . . . . . . . 2137-15 Total Domestic Blended Whiskey Per-Capita Consumption . . . . . . . . . . . . . . . . . . . . . . . . . . . . 2157-16 Total Imported Whisk(e)y Consumption by State . . . . . . . . . . . . . . . . . . . . . . . . . . . . . . . . . . . . . 2177-17 Total Imported Whisk(e)y Per Capita Consumption . . . . . . . . . . . . . . . . . . . . . . . . . . . . . . . . . . . 2197-18 Total Scotch Whisky Consumption by State . . . . . . . . . . . . . . . . . . . . . . . . . . . . . . . . . . . . . . . . . 2217-19 Total Scotch Whisky Per-Capita Consumption . . . . . . . . . . . . . . . . . . . . . . . . . . . . . . . . . . . . . . . 2237-20 Total Canadian Whisky Consumption by State . . . . . . . . . . . . . . . . . . . . . . . . . . . . . . . . . . . . . . . 2257-21 Total Canadian Whisky Per-Capita Consumption . . . . . . . . . . . . . . . . . . . . . . . . . . . . . . . . . . . . . 2277-22 Total Irish Whiskey Consumption by State . . . . . . . . . . . . . . . . . . . . . . . . . . . . . . . . . . . . . . . . . . 2297-23 Total White Goods Consumption by State . . . . . . . . . . . . . . . . . . . . . . . . . . . . . . . . . . . . . . . . . . . 2317-24 Total White Goods Per-Capita Consumption . . . . . . . . . . . . . . . . . . . . . . . . . . . . . . . . . . . . . . . . . 2337-25 Total Gin Consumption by State . . . . . . . . . . . . . . . . . . . . . . . . . . . . . . . . . . . . . . . . . . . . . . . . . . . 2357-26 Total Gin Per-Capita Consumption. . . . . . . . . . . . . . . . . . . . . . . . . . . . . . . . . . . . . . . . . . . . . . . . . 2377-27 Total Vodka Consumption by State . . . . . . . . . . . . . . . . . . . . . . . . . . . . . . . . . . . . . . . . . . . . . . . . . 2397-28 Total Vodka Per-Capita Consumption. . . . . . . . . . . . . . . . . . . . . . . . . . . . . . . . . . . . . . . . . . . . . . . 2417-29 Total Domestic Vodka Consumption by State . . . . . . . . . . . . . . . . . . . . . . . . . . . . . . . . . . . . . . . . 2437-30 Total Imported Vodka Consumption by State . . . . . . . . . . . . . . . . . . . . . . . . . . . . . . . . . . . . . . . . 2457-31 Total Rum Consumption by State . . . . . . . . . . . . . . . . . . . . . . . . . . . . . . . . . . . . . . . . . . . . . . . . . . 2477-32 Total Rum Per-Capita Consumption. . . . . . . . . . . . . . . . . . . . . . . . . . . . . . . . . . . . . . . . . . . . . . . . 2497-33 Total Tequila Consumption by State. . . . . . . . . . . . . . . . . . . . . . . . . . . . . . . . . . . . . . . . . . . . . . . . 2517-34 Total Tequila Per-Capita Consumption . . . . . . . . . . . . . . . . . . . . . . . . . . . . . . . . . . . . . . . . . . . . . 2537-35 Total Specialties Consumption by State . . . . . . . . . . . . . . . . . . . . . . . . . . . . . . . . . . . . . . . . . . . . . 2557-36 Total Specialties Per-Capita Consumption . . . . . . . . . . . . . . . . . . . . . . . . . . . . . . . . . . . . . . . . . . . 2577-37 Total Brandy Consumption by State . . . . . . . . . . . . . . . . . . . . . . . . . . . . . . . . . . . . . . . . . . . . . . . . 2597-38 Total Brandy Per-Capita Consumption . . . . . . . . . . . . . . . . . . . . . . . . . . . . . . . . . . . . . . . . . . . . . . 2617-39 Total Cordials and Liqueurs Consumption by State . . . . . . . . . . . . . . . . . . . . . . . . . . . . . . . . . . . 2637-40 Total Cordials and Liqueurs Per-Capita Consumption . . . . . . . . . . . . . . . . . . . . . . . . . . . . . . . . . 2657-41 Total Domestic Cordials Consumption by State . . . . . . . . . . . . . . . . . . . . . . . . . . . . . . . . . . . . . . 2677-42 Total Imported Liqueurs Consumption by State . . . . . . . . . . . . . . . . . . . . . . . . . . . . . . . . . . . . . . 2697-43 Total Cocktails and Mixed Drinks Consumption by State . . . . . . . . . . . . . . . . . . . . . . . . . . . . . . 2717-44 Total Cocktails and Mixed Drinks Per-Capita Consumption . . . . . . . . . . . . . . . . . . . . . . . . . . . . 273
CHAPTER 88-1 Top 10 Distilled Spirit Marketers Worldwide, Pro Forma. . . . . . . . . . . . . . . . . . . . . . . . . . . . . . . 2778-2 Top 100 “Premium” Distilled Spirit Brands Worldwide . . . . . . . . . . . . . . . . . . . . . . . . . . . . . . . . 2788-3 Top 15 Growth Brands Within the 100 “Premium” Distilled Spirits Worldwide . . . . . . . . . . . . 2828-4 Top 100 “Premium” Distilled Spirit Brands Worldwide by Company. . . . . . . . . . . . . . . . . . . . . 2838-5 Top 100 “Premium” Distilled Spirit Brands Worldwide by Category/Type . . . . . . . . . . . . . . . . 2848-6 Bourbon – Top 10 Brands Worldwide . . . . . . . . . . . . . . . . . . . . . . . . . . . . . . . . . . . . . . . . . . . . . . . 2858-7 Vodka – Top 20 Brands Worldwide . . . . . . . . . . . . . . . . . . . . . . . . . . . . . . . . . . . . . . . . . . . . . . . . . 2868-8 Vodka – Top 15 “Premium” Brands Worldwide . . . . . . . . . . . . . . . . . . . . . . . . . . . . . . . . . . . . . . . 2878-9 Rum – Top 10 “Premium” Brands Worldwide . . . . . . . . . . . . . . . . . . . . . . . . . . . . . . . . . . . . . . . . 2888-10 Tequila – Top 10 Brands Worldwide . . . . . . . . . . . . . . . . . . . . . . . . . . . . . . . . . . . . . . . . . . . . . . . . 289
CHAPTER 99-1 Top 10 U.S. Spirits and Wine Wholesalers . . . . . . . . . . . . . . . . . . . . . . . . . . . . . . . . . . . . . . . . . . . 2929-2 Leading U.S. Spirits and Wine Wholesalers by Market. . . . . . . . . . . . . . . . . . . . . . . . . . . . . . . . . 2939-3 Distributors of the Top 10 Spirits & Wine Brands in Key Markets . . . . . . . . . . . . . . . . . . . . . . . 296