Embed Size (px)
Citation preview

Table of Contents LNG Monthly (YTD – through January 2018)
1 Cumulative Map of LNG Exports ................................................................................ 1 1a Table of Shipments of Domestically-Produced LNG Delivered – from February 2016 ................... 2 1b Volumes and Percentages of FTA and nFTA Shipments of Domestically-Produced LNG
Delivered .................................................................................................................................................. 3 1c Destination of Domestically-Produced LNG Delivered by Country and Region with Trade
Agreement Status .................................................................................................................................... 4
2 LNG Activity 2a Shipments of Domestically-Produced LNG Delivered YTD 2018 ....................................................... 5 2b Shipments of Domestically-Produced LNG Shipped by ISO Container YTD 2018 .......................... 6 2c Shipments of LNG Re-Exported YTD 2018 ............................................................................................. 7 2d LNG Imports by Country, Receiving Terminal, and Importer ............................................................ 8 2e Shipments of LNG Received YTD 2018 ................................................................................................... 9 2f Shipments of LNG Received YTD 2018, Puerto Rico .......................................................................... 10
3 Graphical Summaries ................................................................................................................ 11 4 Notes and Definitions .............................................................................................................. 14
Office of Fossil Energy Office of Oil & Natural Gas
Office of Regulation and International Engagement Division of Natural Gas Regulation
Phone: 202-586-7991
To be placed on the LNG Monthly email distribution list, please send an email request to [email protected].
For electronic version: https://www.energy.gov/fe/listings/lng-reports
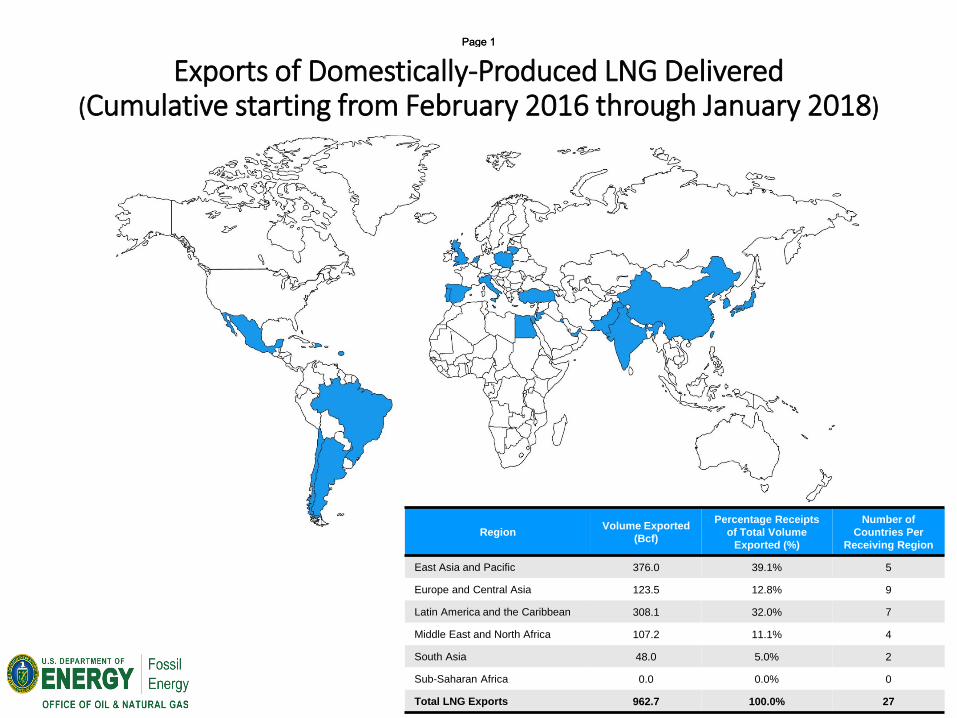
Exports of Domestically-Produced LNG Delivered(Cumulative starting from February 2016 through January 2018)
Region Volume Exported (Bcf)
Percentage Receipts of Total Volume
Exported (%)
Number of Countries Per
Receiving Region
East Asia and Pacific 376.0 39.1% 5
Europe and Central Asia 123.5 12.8% 9
Latin America and the Caribbean 308.1 32.0% 7
Middle East and North Africa 107.2 11.1% 4
South Asia 48.0 5.0% 2
Sub-Saharan Africa 0.0 0.0% 0
Total LNG Exports 962.7 100.0% 27
Page 1Page 1

1a. Shipments of Domestically-Produced LNG Delivered(Cumulative starting from February 2016 through January 2018)
Note: Volume and Number of Cargos are the cumulative totals of each individual Country of Destination by Type of Export starting from February 2016.* Split cargos counted as both individual cargos and countries.Vessel = LNG Exports by Vessel and ISO container = LNG Exports by Vessel in ISO Containers.Does not include re-exports of previously-imported LNG. See table 2c for re-exports data.Totals may not equal sum of components because of independent rounding.
Country of Destination
Type of Export
Number of Cargos
Percentage of Total U.S LNG
Exports (%)1. Mexico* Vessel 53 178.2 18.5%2. South Korea Vessel 47 161.6 16.8%3. China Vessel 40 134.2 13.9%4. Japan Vessel 19 68.1 7.1%5. Chile* Vessel 19 58.1 6.0%6. Jordan* Vessel 14 46.2 4.8%7. India Vessel 12 41.4 4.3%8. Turkey Vessel 11 37.3 3.9%9. Argentina* Vessel 11 32.9 3.4%10. Spain* Vessel 11 32.3 3.4%11 Kuwait Vessel 8 27.3 2.8%12. Brazil* Vessel 9 26.8 2.8%13. Portugal* Vessel 8 26.5 2.7%14. Egypt Vessel 5 16.9 1.8%15. U.A.E. Vessel 5 16.8 1.7%16. Dominican Republic Vessel 4 11.6 1.2%17. Italy Vessel 3 9.8 1.0%18. Taiwan Vessel 3 9.0 0.9%19. Lithuania Vessel 2 6.8 0.7%20 Pakistan Vessel 2 6.5 0.7%21. Poland Vessel 1 3.4 0.4%22. United Kingdom Vessel 1 3.4 0.4%23. Thailand Vessel 1 3.1 0.3%24. Netherlands Vessel 1 3.0 0.3%25. Malta* Vessel 1 0.9 0.1%
Total Exports by Vessel 291 962.4
26. Barbados ISO Container 89 0.3 0.0%27. Bahamas ISO Container 4 0.0 0.0%
Total Exports by ISO 93 0.3
Total Exports by Vessel and ISO 384 962.7
Volume (Bcf of Natural Gas)
Page 2Page 2

1b. Volumes and Percentages of FTA and nFTA Shipments of Domestically-Produced LNG Delivered
(Cumulative starting from February 2016 through January 2018)
FTA, 455.8, 47.3%
nFTA, 507.0, 52.7%
FTA nFTA
Volume (Bcf)Percentage
of Total Volume
Number of Countries
FTA 455.8 47.3% 5
nFTA 507.0 52.7% 22
Total LNG Exports 962.7 27
FTA Countries that Require National Treatment for Trade in Natural Gas -As of October 31, 2012, the United States has FTAs that require national treatment for trade in natural gas with Australia, Bahrain, Canada, Chile, Colombia, Dominican Republic, El Salvador, Guatemala, Honduras, Jordan, Mexico, Morocco, Nicaragua, Oman, Panama, Peru, Republic of Korea and Singapore. Panama is the most recent country with which the United States has entered into a FTA that requires national treatment for trade in natural gas, effective October 31, 2012. Not all countries that have a FTA with the United States require national treatment for trade in natural gas (i.e. Costa Rica and Israel). A list of all countries with which the United States has a FTA can be found at: http://www.ustr.gov/trade-agreements/free-trade-agreements.
More information can be found on DOE’s website - https://energy.gov/fe/services/natural-gas-regulation/how-obtain-authorization-import-andor-export-natural-gas-and-lng
Totals may not equal sum of components because of independent rounding.
Spot cargos total 257.3 Bcf of the 962.7 Bcf total volume of shipments of domestically-produced LNG delivered, for a total percentage of 26.7 percent.
These totals are cumulative starting from February 2016 through January 2018, with a current-year listing in Table 1a.
Page 3Page 3

1c. Destination of Domestically-Produced LNG Delivered by Country and Region with Trade Agreement Status
(Cumulative starting from February 2016 through January 2018)
Country of Destination Region FTA or
nFTAType of
FTA Name of FTA
Argentina Latin America and the Caribbean nFTABahamas Latin America and the Caribbean nFTA
Barbados (ISO) Latin America and the Caribbean nFTABrazil Latin America and the Caribbean nFTAChile Latin America and the Caribbean FTA Bilateral United States-Chile Free Trade AgreementChina East Asia and Pacific nFTA
Dominican Republic Latin America and the Caribbean FTA Multilateral CAFTA-DREgypt Middle East and North Africa nFTAIndia South Asia nFTAItaly Europe and Central Asia nFTA
Japan East Asia and Pacific nFTAJordan Middle East and North Africa FTA Bilateral United States-Jordan Free Trade AgreementKuwait Middle East and North Africa nFTA
Lithuania Europe and Central Asia nFTAMalta1 Europe and Central Asia nFTA
Mexico2 Latin America and the Caribbean FTA Multilateral NAFTA - North American Free Trade AgreementNetherlands Europe and Central Asia nFTA
Pakistan South Asia nFTAPoland Europe and Central Asia nFTA
Portugal Europe and Central Asia nFTASouth Korea East Asia and Pacific FTA Bilateral KORUS - U.S.-Korea Free Trade Agreement
Spain Europe and Central Asia nFTATaiwan East Asia and Pacific nFTA
Thailand East Asia and Pacific nFTATurkey Europe and Central Asia nFTAU.A.E. Middle East and North Africa nFTA
United Kingdom Europe and Central Asia nFTA
Source: Office of the United States Trade Representative and the World Bank
2For classification purposes, Mexico is included in the Latin America and the Caribbean region.
1For classification purposes, Malta is included in the Europe and Central Asia region.
Page 4Page 4
Office of Fossil EnergyOffice of Oil & Natural GasOffice of Regulation and International EngagementDivision of Natural Gas RegulationPhone: 202-586-7991Email: [email protected]
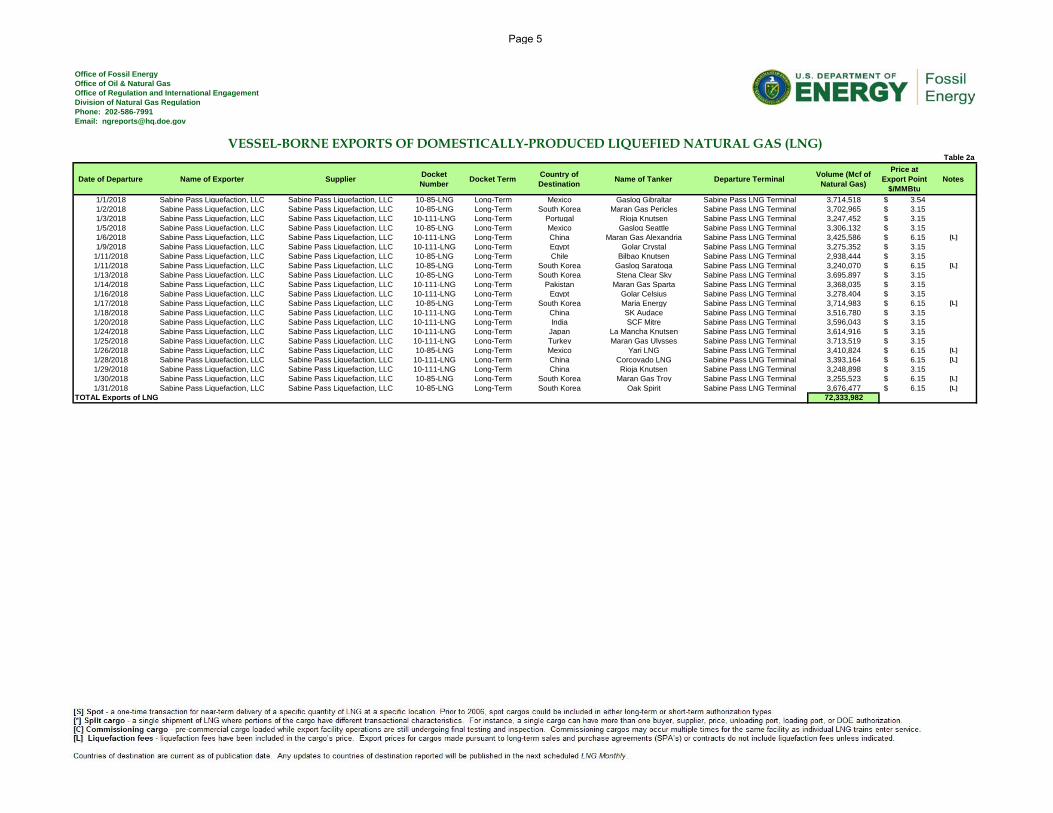
Table 2a
Date of Departure Name of Exporter Supplier Docket Number Docket Term Country of
Destination Name of Tanker Departure Terminal Volume (Mcf of Natural Gas)
Price at Export Point
$/MMBtuNotes
1/1/2018 Sabine Pass Liquefaction, LLC Sabine Pass Liquefaction, LLC 10-85-LNG Long-Term Mexico Gaslog Gibraltar Sabine Pass LNG Terminal 3,714,518 3.54$ 1/2/2018 Sabine Pass Liquefaction, LLC Sabine Pass Liquefaction, LLC 10-85-LNG Long-Term South Korea Maran Gas Pericles Sabine Pass LNG Terminal 3,702,965 3.15$ 1/3/2018 Sabine Pass Liquefaction, LLC Sabine Pass Liquefaction, LLC 10-111-LNG Long-Term Portugal Rioja Knutsen Sabine Pass LNG Terminal 3,247,452 3.15$ 1/5/2018 Sabine Pass Liquefaction, LLC Sabine Pass Liquefaction, LLC 10-85-LNG Long-Term Mexico Gaslog Seattle Sabine Pass LNG Terminal 3,306,132 3.15$ 1/6/2018 Sabine Pass Liquefaction, LLC Sabine Pass Liquefaction, LLC 10-111-LNG Long-Term China Maran Gas Alexandria Sabine Pass LNG Terminal 3,425,586 6.15$ [L]1/9/2018 Sabine Pass Liquefaction, LLC Sabine Pass Liquefaction, LLC 10-111-LNG Long-Term Egypt Golar Crystal Sabine Pass LNG Terminal 3,275,352 3.15$
1/11/2018 Sabine Pass Liquefaction, LLC Sabine Pass Liquefaction, LLC 10-85-LNG Long-Term Chile Bilbao Knutsen Sabine Pass LNG Terminal 2,938,444 3.15$ 1/11/2018 Sabine Pass Liquefaction, LLC Sabine Pass Liquefaction, LLC 10-85-LNG Long-Term South Korea Gaslog Saratoga Sabine Pass LNG Terminal 3,240,070 6.15$ [L]1/13/2018 Sabine Pass Liquefaction, LLC Sabine Pass Liquefaction, LLC 10-85-LNG Long-Term South Korea Stena Clear Sky Sabine Pass LNG Terminal 3,695,897 3.15$ 1/14/2018 Sabine Pass Liquefaction, LLC Sabine Pass Liquefaction, LLC 10-111-LNG Long-Term Pakistan Maran Gas Sparta Sabine Pass LNG Terminal 3,368,035 3.15$ 1/16/2018 Sabine Pass Liquefaction, LLC Sabine Pass Liquefaction, LLC 10-111-LNG Long-Term Egypt Golar Celsius Sabine Pass LNG Terminal 3,278,404 3.15$ 1/17/2018 Sabine Pass Liquefaction, LLC Sabine Pass Liquefaction, LLC 10-85-LNG Long-Term South Korea Maria Energy Sabine Pass LNG Terminal 3,714,983 6.15$ [L]1/18/2018 Sabine Pass Liquefaction, LLC Sabine Pass Liquefaction, LLC 10-111-LNG Long-Term China SK Audace Sabine Pass LNG Terminal 3,516,780 3.15$ 1/20/2018 Sabine Pass Liquefaction, LLC Sabine Pass Liquefaction, LLC 10-111-LNG Long-Term India SCF Mitre Sabine Pass LNG Terminal 3,596,043 3.15$ 1/24/2018 Sabine Pass Liquefaction, LLC Sabine Pass Liquefaction, LLC 10-111-LNG Long-Term Japan La Mancha Knutsen Sabine Pass LNG Terminal 3,614,916 3.15$ 1/25/2018 Sabine Pass Liquefaction, LLC Sabine Pass Liquefaction, LLC 10-111-LNG Long-Term Turkey Maran Gas Ulysses Sabine Pass LNG Terminal 3,713,519 3.15$ 1/26/2018 Sabine Pass Liquefaction, LLC Sabine Pass Liquefaction, LLC 10-85-LNG Long-Term Mexico Yari LNG Sabine Pass LNG Terminal 3,410,824 6.15$ [L]1/28/2018 Sabine Pass Liquefaction, LLC Sabine Pass Liquefaction, LLC 10-111-LNG Long-Term China Corcovado LNG Sabine Pass LNG Terminal 3,393,164 6.15$ [L]1/29/2018 Sabine Pass Liquefaction, LLC Sabine Pass Liquefaction, LLC 10-111-LNG Long-Term China Rioja Knutsen Sabine Pass LNG Terminal 3,248,898 3.15$ 1/30/2018 Sabine Pass Liquefaction, LLC Sabine Pass Liquefaction, LLC 10-85-LNG Long-Term South Korea Maran Gas Troy Sabine Pass LNG Terminal 3,255,523 6.15$ [L]1/31/2018 Sabine Pass Liquefaction, LLC Sabine Pass Liquefaction, LLC 10-85-LNG Long-Term South Korea Oak Spirit Sabine Pass LNG Terminal 3,676,477 6.15$ [L]
TOTAL Exports of LNG 72,333,982
VESSEL-BORNE EXPORTS OF DOMESTICALLY-PRODUCED LIQUEFIED NATURAL GAS (LNG)
Page 5

Office of Fossil EnergyOffice of Oil & Natural GasOffice of Regulation and International EngagementDivision of Natural Gas RegulationPhone: 202-586-7991Email: [email protected]
Table 2b
Date of Departure Name of Exporter Supplier Docket Number
Country of Destination
Name of Ocean Going Vessel
ISO Conatainer Loading Facility
& Location
U.S. Export Port or Terminal
Volume (Mcf of Natural Gas)
Price at Export Point
$/MMBtuNotes
1/4/2018 American LNG Marketing, LLC Peninsula Energy Services Co 14-209-LNG Barbados Hoheriff Hialeah, FL Ft. Lauderdale, FL 4,956 10.00$ 1/10/2018 American LNG Marketing, LLC Peninsula Energy Services Co 14-209-LNG Bahamas Allegro Hialeah, FL Doral, FL 1,696 10.00$ 1/11/2018 American LNG Marketing, LLC Peninsula Energy Services Co 14-209-LNG Barbados Hoebank Hialeah, FL Ft. Lauderdale, FL 4,956 10.00$ 1/13/2018 American LNG Marketing, LLC Peninsula Energy Services Co 14-209-LNG Bahamas Amihan Hialeah, FL Doral, FL 826 10.00$ 1/18/2018 American LNG Marketing, LLC Peninsula Energy Services Co 14-209-LNG Barbados Vega Sagittarius Hialeah, FL Ft. Lauderdale, FL 4,956 10.00$ 1/19/2018 American LNG Marketing, LLC Peninsula Energy Services Co 14-209-LNG Bahamas Amihan Hialeah, FL Doral, FL 1,696 10.00$ 1/25/2018 American LNG Marketing, LLC Peninsula Energy Services Co 14-209-LNG Barbados Vega Luna Hialeah, FL Ft. Lauderdale, FL 4,956 10.00$
TOTAL Exports of LNG (ISO) 24,042
VESSEL-BORNE EXPORTS OF DOMESTICALLY-PRODUCED LIQUEFIED NATURAL GAS (LNG)SHIPPED BY ISO CONTAINER
[S] Spot - a one-time transaction for near-term delivery of a specific quantity of LNG at a specific location. Prior to 2006, spot cargos could be included in either long-term or short-term authorization types.
[*] Split cargo - a single shipment of LNG where portions of the cargo have different transactional characteristics. For instance, a single cargo can have more than one buyer, supplier, price, unloading port, loading port, or DOE authorization.
ISO container - LNG delivered into approved ISO LNG containers (truck or rail-mounted), then loaded onto container ships or roll-on / roll-off ocean-going carriers for transport.
Page 6

Office of Fossil EnergyOffice of Oil & Natural GasOffice of Regulation and International EngagementDivision of Natural Gas RegulationPhone: 202-586-7991Email: [email protected]
Table 2c
Date of Departure Authorization Holder Supplier(s) Exporter Purchaser Docket Number
Country of Destination Name of Tanker Departure Terminal Volume (Mcf of
Natural Gas)
Price at Export Point Price $/MMBtu
Notes
None.TOTAL Re-Exports of LNG 0
[S] Spot - a one-time transaction for near-term delivery of a specific quantity of LNG at a specific location. Prior to 2006, spot cargos could be included in either long-term or short-term authorization types.
[*] Split cargo - a single shipment of LNG where portions of the cargo have different transactional characteristics. For instance, a single cargo can have more than one buyer, supplier, price, unloading port, loading port, or DOE authorization.
[C] Commissioning cargo - pre-commercial cargo loaded while export facility operations are still undergoing final testing and inspection. Commissioning cargos may occur multiple times for the same facility as individual LNG trains enter service.
VESSEL-BORNE RE-EXPORTS OF LIQUEFIED NATURAL GAS (LNG)
Page 7

Office of Fossil EnergyOffice of Oil & Natural GasOffice of Regulation and International EngagementDivision of Natural Gas RegulationPhone: 202-586-7991Email: [email protected]
Table 2d2018 Jan Feb March April May June July Aug Sept Oct Nov Dec TOTAL
Egypt - - - - - - - - - - - - 0.0Nigeria - - - - - - - - - - - - 0.0Norway - - - - - - - - - - - - 0.0Qatar - - - - - - - - - - - - 0.0Trinidad 13.5 - - - - - - - - - - - 13.5United Kingdom 3.1 - - - - - - - - - - - 3.1Yemen - - - - - - - - - - - - 0.0TOTAL Imports of LNG 16.6 0.0 0.0 0.0 0.0 0.0 0.0 0.0 0.0 0.0 0.0 - 16.6
Table 2d(i)2018 Jan Feb March April May June July Aug Sept Oct Nov Dec TOTAL
Cameron, LA - - - - - - - - - - - - 0.0Cove Point, MD 2.9 - - - - - - - - - - - 2.9Elba Island, GA 2.9 - - - - - - - - - - - 2.9Everett, MA 10.8 - - - - - - - - - - - 10.8Freeport, TX - - - - - - - - - - - - 0.0Golden Pass, TX - - - - - - - - - - - - 0.0Gulf LNG, MS - - - - - - - - - - - - 0.0Lake Charles, LA - - - - - - - - - - - - 0.0Neptune Deepwater Port - - - - - - - - - - - - 0.0Northeast Gateway Energy Bridge - - - - - - - - - - - - 0.0Sabine Pass, LA - - - - - - - - - - - - 0.0TOTAL Imports of LNG 16.6 0.0 0.0 0.0 0.0 0.0 0.0 0.0 0.0 0.0 0.0 0.0 16.6
Table 2d(ii)2018 Jan Feb March April May June July Aug Sept Oct Nov Dec TOTAL
BG LNG Services, LLC 2.9 - - - - - - - - - - 2.9BP Energy - - - - - - - - - - - 0.0Cheniere Marketing LLC - - - - - - - - - - - 0.0ConocoPhillips - - - - - - - - - - - 0.0Engie Gas & LNG LLC 10.8 - - - - - - - - - - - 10.8Excelerate Energy Gas Marketing L.P. - - - - - - - - - - - 0.0Sempra LNG Marketing - - - - - - - - - - - 0.0Shell NA LNG LLC 2.9 - - - - - - - - - - 2.9Statoil Natural Gas - - - - - - - - - - - 0.0Total Gas & Power - - - - - - - - - - - 0.0Total Imports of LNG 16.6 0.0 0.0 0.0 0.0 0.0 0.0 0.0 0.0 - - - 16.6
LNG Imports by Country of Origin
LNG Imports by Receiving Terminal
(Bcf of Natural Gas)
(Bcf of Natural Gas)
(Bcf of Natural Gas)
LNG Imports by Company
Page 8

Office of Fossil EnergyOffice of Oil & Natural Gas Office of Regulation and International EngagementDivision of Natural Gas RegulationPhone: 202-586-7991Email: [email protected]
Table 2e(i)Date of Arrival Name of Importer Seller Docket
NumberCountry of
Origin Name of Tanker Receiving Terminal Volume (Mcf of Natural Gas)
Landed Price ($/MMBtu) Notes
1/7/2018 BG LNG Services, LLC Point Fortin LNG Exports Ltd. 16-01-LNG Trinidad Gallina Elba Island, GA 2,948,160 2.48$ [S]1/15/2018 Shell NA LNG LLC Shell International Trading Middle East Limited 16-10-LNG Trinidad Madrid Spirit Cove Point, MD 2,852,622 10.75$ [S]1/28/2018 Engie Gas & LNG LLC Engie S.A. 17-10-LNG United Kingdom Gaselys Everett, MA 3,118,676 12.28$ [S]
8,919,458
Table 2e(ii)Date of Arrival Name of Importer Seller Docket
NumberCountry of
Origin Name of Tanker Receiving Terminal Volume (Mcf of Natural Gas)
Landed Price($/MMBtu) Notes
1/5/2018 Engie Gas & LNG LLC Atlantic LNG 2/3 Company 95-100-LNG Trinidad Provalys Everett, MA 2,756,066 3.82$ [*]1/5/2018 Engie Gas & LNG LLC Atlantic LNG Company 95-100-LNG Trinidad Provalys Everett, MA 51,588 3.55$ [*]1/10/2018 Engie Gas & LNG LLC Atlantic LNG Company 95-100-LNG Trinidad BW GDF Suez Boston Everett, MA 2,487,682 6.30$
1/19/2018 Engie Gas & LNG LLC Atlantic LNG Company 95-100-LNG Trinidad BW GDF Suez Everett Everett, MA 2,414,765 6.26$ 7,710,101
TOTAL LNG IMPORTS 16,629,559
[E-P] - a portion of this cargo was delivered to Everett, MA on 16 February 2017 and a portion was delivered to Ponce, Puerto Rico on 22 February 2017.
LONG-TERM VESSEL-BORNE IMPORTS OF LIQUEFIED NATURAL GAS
SHORT-TERM VESSEL-BORNE IMPORTS OF LIQUEFIED NATURAL GAS
[S] Spot - a one-time transaction for near-term delivery of a specific quantity of LNG at a specific location. Prior to 2006, spot cargos could be included in either long-term or short-term authorization types. [*] Split cargo - a single shipment of LNG where portions of the cargo have different transactional characteristics. For instance, a single cargo can have more than one buyer, supplier, price, unloading port, loading port, or DOE authorization.
[S] Spot - a one-time transaction for near-term delivery of a specific quantity of LNG at a specific location. Prior to 2006, spot cargos could be included in either long-term or short-term authorization types.[*] Split cargo - a single shipment of LNG where portions of the cargo have different transactional characteristics. For instance, a single cargo can have more than one buyer, supplier, price, unloading port, loading port, or DOE authorization.
Page 9

Office of Fossil EnergyOffice of Oil & Natural Gas Office of Regulation and International EngagementDivision of Natural Gas RegulationPhone: 202-586-7991Email: [email protected]
Table 2f
Date of Arrival Name of Importer Seller Docket
Number Country of Origin Name of Tanker Receiving Terminal
Volume (Mcf of Natural Gas)
Landed Price
($/MMBtu)Notes
1/3/2018 Gas Natural Aprovisionamientos SDG, S.A. Gas Natural Aprovisionamientos SDG, S.A 16-199-NG Trinidad Catalunya Spirit Ponce, PR 2,880,087 7.63$
1/23/2018 EcoElectrica, L.P. Engie Gas & LNG LLC 94-91-LNG Trinidad British Diamond Ponce, PR 2,573,027 4.33$
5,453,114
VESSEL-BORNE IMPORTS OF LIQUEFIED NATURAL GAS (LNG) TO PUERTO RICO
[*] Split cargo - a single shipment of LNG where portions of the cargo have different transactional characteristics. For instance, a single cargo can have more than one buyer, supplier, price, unloading port, loading port, or DOE authorization. [E-P] - a portion of this cargo was delivered to Everett, MA on 16 February 2017 and a portion was delivered to Ponce, Puerto Rico on 22 February 2017.
Page 10

7.38.5
4.9 5.0 5.3 5.4 5.07.6
2.6 2.3 2.6
7.6
10.8
2.8 3.2
2.92.9
3.6
2.9
LNG Import Volume by Terminal(Bcf)
Everett, MA Cove Point, MD Elba Island, GA
10.28.5
4.9 5.0 5.3 5.4 5.07.6
2.6 2.3
6.27.6
13.5
3.1
2.8
3.2
LNG Import Volume by Country(Bcf)
Trinidad and Tobago United Kingdom Nigeria
Page 11Page 11

7.3 8.5
4.9 5.0 5.3 5.4 5.07.6
2.6 2.3 2.6
7.6
10.8
2.9
3.6
2.92.8
3.2
2.9
LNG Import Volume by Company(Bcf)
Engie Gas & LNG LLC BG LNG Services, LLC Shell NA LNG Statoil Natural Gas LLC
12.9 8.5 4.9 5.0 5.3 5.4 5.0 7.6 2.6 2.3 6.2 10.9 16.6
$5.30 $6.08
$4.13 $3.39 $3.47 $3.21 $3.05 $3.03 $3.56 $4.00
$3.30
$5.30
$7.08
Volume and Weighted Average Price of Vessel-borne LNG Imports by Month
(Bcf, $/MMBtu)
Volume Price
Page 12Page 12

2.8 2.6 2.7
5.7
2.8 2.92.0
2.9
1.5
2.9
1.91.4 1.4
2.8
2.62.9
2.5
2.6 2.6
2.6
LNG Import Volume by Company, Puerto Rico(Bcf)
Gas Natural Aprovisionamientos SDG, S.A. EcoElectrica, L.P.
51.2 52.043.5
50.660.7
52.4 53.545.5 51.0
79.7 80.0 82.572.3
0.4
LNG Vessel Exports and Re-Exports by Month(Bcf)
Exports Re-Exports
Does not include volumes shipped by ISO container.
Page 13Page 13

NOTES AND DEFINITIONS
Our web address is: www.fossil.energy.govClick "Services," then click "Natural Gas Regulation."
2) The data are provided by importers and exporters as a condition of their authorizations (which are issued by this office). They arereported as filed, after DOE review and any subsequent revisions by importers and exporters.
1) Import prices are "landed" which is the commodity price plus transportation to the US terminal. They do NOT includeregassification. They DO include off-loading.
11) Prices for re-exports are the prices at the point of export, also known as FOB (free on board).
12) Export prices for cargos made pursuant to long-term SPA’s/contracts typically do not include liquefaction fees. Exceptions whereliquefaction fees have been included in a cargo’s price will be noted with Note [L].
8) Long-term imports or exports are those cargos imported or exported under a company's long-term authorization. This type ofauthorization is tied to one specific supply contract with a term of more than two years. Redacted copies of the contracts are available onour website (please see below).
4) Split cargos [*] refer to a single shipment of LNG where portions of the cargo have different transactional characteristics. Forinstance, a single cargo can have more than one buyer, supplier, price, unloading port, loading port, or DOE authorization.
7) Short-term imports or exports are those cargos imported or exported under a company's short-term or "blanket" authorization. Thistype of authorization covers supply contracts with terms up to 2 years, including spot cargos. The authorization is not based on a specificsupply contract, but covers all of the importer's short-term supply deals. DOE does not have copies of those contracts and they are notfiled with the applications.
9) Authorization holders are required to file volume data in thousand cubic feet (Mcf). Therefore, data collected does not necessarilyinclude equivalent amounts of energy, measured in million British thermal units (MMBtu).
10) Prices for exports from Kenai, Alaska are "delivered." This is the commodity price plus transportation to the receiving terminal inthe destination country.
3) Spot cargos [S] are a one-time transaction for near-term delivery of a specific quantity of LNG at a specific location. Prior to 2006,spot cargos could be included in either long-term or short-term authorization types.
5) Commissioning cargos [C] refer to pre-commercial cargos loaded while export facility operations are still undergoing final testing andinspection. Commissioning cargos may occur multiple times for the same facility as individual LNG trains enter service.
6) Liquefaction fees [L] - liquefaction fees have been included in the cargo's price. Export prices for cargos made pursuant to long-termsales and purchase agreements (SPA's) or contracts do not include liquefaction fees unless indicated.
Page 14Page 14


![Table of Contents LNG Monthly - US Department of Energy Monthly 20… · [S] Spot - a one-time transaction for near-term delivery of a specific quantity of LNG at a specific location](https://img.pdfslide.us/doc/110x75/5eacefb20c7bc53fab0e598a/table-of-contents-lng-monthly-us-department-of-energy-monthly-20-s-spot-.jpg)


![Table of Contents LNG Monthly - energy.gov Monthly 2017.pdfOffice of Fossil Energy ... Mexico Stena Crystal Sky; Sabine Pass LNG Terminal 3,706,516 $ 7.52 [L] 1/28/2017 Sabine Pass](https://img.pdfslide.us/doc/110x75/5aaed76e7f8b9aa8438c92ec/table-of-contents-lng-monthly-monthly-2017pdfoffice-of-fossil-energy-mexico.jpg)