Embed Size (px)
Citation preview

EXPLORING THE EFFECTIVENESS OF PHONICS-BASED INSTRUCTION
FOR CHILDREN WITH DOWN SYNDROME
By
Christopher J. Lemons
Dissertation
Submitted to the Faculty of the
Graduate School of Vanderbilt University
in partial fulfillment of the requirements
for the degree of
DOCTOR OF PHILOSOPHY
in
Special Education
December, 2008
Nashville, Tennessee
Approved:
Professor Douglas Fuchs
Professor Lynn S. Fuchs
Professor Donald L. Compton
Professor Robert M. Hodapp
Professor Thomas M. Smith

ii
TABLE OF CONTENTS
Page
LIST OF TABLES......................................................................................................... iv
LIST OF FIGURES ........................................................................................................ v
Chapter
I. INTRODUCTION........................................................................................... 1
Sight word approach ....................................................................................... 3
Phonics based approach .................................................................................. 4
Purpose........................................................................................................... 6
II. METHOD...................................................................................................... 7
Participants ................................................................................................ 7
Staff ........................................................................................................... 8
Assessment procedures............................................................................... 9
Test training .......................................................................................... 9
Test schedule......................................................................................... 9
Test condition........................................................................................ 9
Scoring and data management .................................................................. 10
Descriptive and predictor measures .......................................................... 11
Reading measures................................................................................ 11
Cognitive measures ............................................................................. 14
Parent and tutor measures .................................................................... 15
Outcome measures ................................................................................... 16
Intervention.............................................................................................. 19
Overview............................................................................................. 19
Session 1 lesson components ............................................................... 20
Session 2 lesson components ............................................................... 22
Behavior management ......................................................................... 23
Tutor training ...................................................................................... 24
Fidelity of implementation................................................................... 24
Study design............................................................................................. 25
III. RESULTS .................................................................................................. 27
Growth models......................................................................................... 27
Model assumptions .............................................................................. 27
Descriptive statistics and correlations .................................................. 28
Unconditional growth models.............................................................. 28

iii
Models conditional on control word list............................................... 30
Models conditional on individual predictors ........................................ 34
Best-fitting models .............................................................................. 42
Evaluation of individual responsiveness............................................... 44
Speech analysis ........................................................................................ 46
IV. DISCUSSION ............................................................................................ 50
Effectiveness of phonics-based intervention ............................................. 50
Fidelity and program completion ......................................................... 50
Reading growth ................................................................................... 50
Pattern of response .............................................................................. 51
Predictors of responsiveness..................................................................... 52
Implications for practice........................................................................... 54
Limitations............................................................................................... 55
Future work.............................................................................................. 57
REFERENCES.................................................................................................. 60

iv
LIST OF TABLES
Table Page
1. Summary statistics for descriptive and predictor measures ...................................... 12
2. Categorization of IEP goals and summary of responses from parent survey............. 17
3. Descriptive statistics for the study sample on outcome measures at each timepoint.. 29
4. Intercorrelations among ongoing assessments at Time 0 and Time 10 ..................... 30
5. Unconditional models and conditional models with the control word list as
time-varying level-1 covariate ................................................................................. 31
6. Correlations among pretreatment and cognitive measures........................................ 35
7. Control words ......................................................................................................... 36
8. Taught sight words.................................................................................................. 37
9. Letter sounds........................................................................................................... 38
10. Decodable words..................................................................................................... 39
11. Nonsense words ...................................................................................................... 40
12. Model-based (Empirical Bayes) estimates of slope and evaluation of
nonresponsiveness................................................................................................... 45
13. Inter-rater reliabilities for measures for speech analysis........................................... 48
14. Regression analysis of inter-rater reliability with low speech impairment group as
comparison.............................................................................................................. 49

v
LIST OF FIGURES
Figure Page
1. Estimated individual growth curves for ongoing-assessment ................................... 33

1
CHAPTER 1
INTRODUCTION
Reading is one of the most important skills in our society. Mastery of this skill leads to
enhanced academic learning, long term success in school, and improved quality of life (Lyon,
1998; Snow, Burns, & Griffin, 1998; Stanovich, 1986). The importance of learning to read is
reflected in the No Child Left Behind (NCLB) Act of 2001 (PL 107-110), which established as a
national goal that all children will read on grade level by the end of third grade. To meet this
unprecedented, ambitious goal, practitioners are required to use instruction and curricula based
on two decades of scientific research. This “evidence-based” approach is summarized in several
documents (Adams, 1990; National Reading Panel, 2000; Partnership for Reading, 2001; Snow
et al., 1998). Its primary focus is teaching students to make connections between the sounds in
our spoken language and the written letters we use to represent these sounds. Key areas of
instruction include phonological awareness, phonics, vocabulary, comprehension, and fluency.
However, this evidence-based phonics instruction is not effective for every child.
Estimates of students who do not respond to this instruction provided in the early grades range
from 2% to 6% (Torgesen, 2000). Additionally, researchers have reported even higher rates of
nonresponse for children at risk for reading difficulties (30%) and for those with special needs
(50%, Al Otaiba & Fuchs, 2002). This should serve as a red flag for researchers, practitioners,
and parents with interest in teaching reading to the children with significant cognitive disabilities
for whom reading is an important, appropriate goal. Put differently, questions are being asked
whether the “all” written into NCLB includes those students with significant cognitive

2
disabilities and whether the type of instruction mandated by the law is “best practice” for this
group of students.
These are valid questions since most of the relevant research in the past two decades did
not include students with cognitive disabilities (Browder, Wakeman, Spooner, Ahlgrim-Delzell,
& Algozzine, 2006; National Reading Panel, 2000). Furthermore, a majority of reading research
conducted with students with cognitive disabilities has focused on the use of a sight-word
approach (Browder & Xin, 1998), whereby students learn to recognize whole words based upon
their visual appearance with little emphasis placed on phonics, or learning the sounds represented
by individual letters or combinations of letters. Evidence demonstrates that a sight-word
approach can be useful in teaching these students how to read some words. But generalization to
words not directly taught, as well as strengthening reading fluency and comprehension, have not
been demonstrated (Browder et al., 2006).
Given the increasing appreciation of the importance of reading to children with cognitive
disabilities, and the very limited extant research to guide policy and practice, it is important to
determine whether the phonics-based reading instruction currently mandated is effective for
students with cognitive disabilities and, if so, which of these students are most likely to benefit.
If there are students for whom phonics instruction does not work, practitioners need to know how
to identify these students and what instructional strategies may be more likely to increase their
academic performance.
A group of students with cognitive disabilities identified by some as unlikely to benefit
from phonics instruction is students with Down syndrome (DS) (A. Byrne, Buckley, MacDonald,
& Bird, 1995; Cossu, Rossini, & Marshall, 1993; Fidler & Nadel, 2007). The main argument for
not providing phonics instruction to these students is that they do not develop phonological
3
awareness, a prerequisite to learning to read in a phonics-based approach. Additionally,
researchers have suggested that individuals with DS exhibit relative strengths in visual
processing (cf. D. Fuchs, 2006). This has led some to argue that these students should be taught
in a qualitatively different way from what is currently considered “best practice,” namely
through a visual—or sight word—approach. Following is a brief overview of the research
literature on the effectiveness of sight-word and phonics-based approaches to teaching reading to
children with DS.
Sight Word Approach
Thirty years ago, several researchers reported positively on the benefits of teaching
students with DS to read (Brown et al., 1972; Folk & Campbell, 1978; Jackson, 1974; Sidman,
Cresson, & Willson-Morris, 1974). These researchers focused on teaching students to visually
identify words and match them to corresponding objects or pictures. More recently, Cooke and
colleagues (1982) described the case of one child who was able to learn to read 77 of 140 words
in a sight-based approach. A peer who presented the words on flash cards and provided
corrective feedback taught the child. The studies are primarily descriptive (i.e., a one-shot case
study or single subject A-B design), and generalizations from them are necessarily limited.
However, they do provide an indication that students with DS are able to learn to read, at least
functionally.
Mechling and colleagues (2007) provided a more rigorous evaluation of a sight-based
approach through a single-subject multiple probe design. In this study, 1 of 3 participants was a
child with DS. The students were taught to read 9 functional grocery words and to match them to
photos of corresponding objects through interactions with an interactive computer board

4
monitored by a teacher. The child with DS mastered all words following the intervention and
during a follow-up probe. Generalization to non-taught words was not assessed.
Phonics Based Approach
Several researchers have also explored the benefits of aspects of phonics-based
instruction for students with DS. van Bysterveldt and colleagues (2006) trained parents of seven
preschoolers with DS (age 4.3 to 4.9 yrs) to conduct an early reading, print-referencing
intervention. Parents focused the children’s attention on the names and sounds of four targeted
letters, and words that began with these letters, during 10-minute book reading sessions, four
times per week for six weeks. A comparison of the children’s grouped posttest performance
compared to pretest performance indicated overall improvements in letter sound knowledge,
print concepts (i.e., pointing to words and letters taught in the intervention), and initial phoneme
identity. However, improvements were not seen for all seven children; one child demonstrated
no growth and another only a two-point increase on the print concepts measure.
Kennedy and Flynn (2003) reported improvements in targeted skills for three children
with DS between the ages of 6.9 and 8.3 years following an 8-hr intervention primarily focusing
on phonological awareness skills. The intervention focused on alliteration detection, initial
phoneme isolation, rhyme recognition, and the spelling of CVC and CVCC words. Results
indicated improvements for all three children in spelling words using targeted rime units (e.g.,
‘ump’) and for one to two children on each phonological awareness task. Furthermore, there was
no generalization to a more difficult task of phoneme segmentation.
Cupples and Iacono (2002) compared the effectiveness of two instructional approaches to
teaching students to read taught and nontaught words. They randomly assigned seven children

5
with DS between the ages of 8 and 12 to one of two conditions. In whole-word instruction
students learned new words by matching them to pictures or spoken words. In word-analysis
instruction, students learned words by identifying those with the same rime and then practiced
building words from onsets and rimes. After six hours of intervention, six children improved
their reading of taught words and five children improved their phoneme blending. Three of the
children in the word-analysis condition demonstrated gains in the reading of nontaught words.
Their enhanced generalization skills may have been due to the instruction received, but it may
have also been a result of learning words from a single word family (e.g., words ending in ‘og’)
instead of words from multiple word families during each session. One of the children made no
progress in word reading during the intervention. It is unclear why progress was made by some,
not others.
Goetz and colleagues (2008) evaluated the effects of providing a more intensive
intervention than those conducted by Cupples and Iacono (2002). Gotez et al’s instruction
focused on letter sounds, blending and segmenting, sound production, sight word reading, and
book reading. Instruction was provided to 15 students with DS (age 8.3 to 14.5 yrs) by “learning
support assistants.” Students were placed into one of two groups with the second group (n=7)
beginning intervention 8 weeks after the first. The first group made statistically significantly
greater gains compared to the second group on measures of letter sound knowledge and early
word recognition. Positive trends favoring the treatment group were found for measures of
nonword reading and alliteration, but large within-group variability and small sample size
limited the conclusions that could be drawn. The second group did not demonstrate statistically
significant improvements over their pre-intervention performance, but moderate to large effect
sizes were found for measures of letter knowledge and early word recognition. Overall, it

6
appears the intervention was effective at improving targeted reading skills. However, these
improvements were educationally limited and not demonstrated by all children with 6 children
demonstrating no increase in reading age between the beginning and end of the intervention.
These studies suggest instruction focused on phonological awareness and letter-sound
knowledge may be beneficial for at least some children with DS. However, not all children in
these studies benefited, and it is unclear which child characteristics may be associated with this
differential responsiveness. Additionally, more information is needed on whether children with
DS can apply their phonics skills to decode novel words and how this may affect more advanced
reading skills such as fluency and comprehension.
Purpose
The purpose of this study was to evaluate the efficacy of an explicit, phonics-based
reading intervention for children with DS and to explore predictors of growth in targeted reading
skills. Tutors provided 30 hours of one-to-one instruction to two cohorts of students. Children in
the first cohort (n=10) were found through local DS organizations and attended a summer day
camp for children with DS sponsored by the Vanderbilt Kennedy Center. Those in the second
cohort (n=14) were recruited through two local school districts and received the intervention
during the academic school year in their home schools. This study extends current knowledge by
evaluating the potential effectiveness of a phonics-based reading intervention for children with
DS and examining child characteristics predictive of differential response to this intervention.
Finally, the study adds to the literature by exploring these questions using a larger sample of
children than has been included in prior work.

7
CHAPTER II
METHOD
Participants
Participants were 24 children with DS between 7 and 16 years who were able: (a) to
participate in two 30-minute periods of one-on-one instruction on each of 5 days for 6 weeks; (b)
to hear and see well enough to benefit from typical classroom instruction; (c) to articulate speech
well enough for an adult unfamiliar with the child to understand what he or she was saying; and
(d) to correctly read at least one word or identify one letter sound. Students were excluded from
study participation if they read more than 10 nonwords and identified more than 30 letter sounds
on the pretreatment assessments.
All 24 children were native speakers of English. Eleven were females; 21 were
Caucasian, 2 African-American, and 1 Hispanic. The average age was 11.97 years, ranging from
7.58 to 16.96 years. Pretreatment assessments were conducted for 8 children who did not
participate in the study. Five of the 8 did not meet study criteria (1 student had severe behavior
problems, 2 students were unable to read at least one word or identify one letter sound, and 2
students’ reading level was too high) and 3 children qualified but did not participate due to
changes in their summer plans.
Staff from local DS organizations and two local school districts distributed a flyer to
parents and guardians of students who were likely to qualify for the study. The flyer included
information on the purpose of the study and qualification criteria. The project director contacted
parents who returned the flyer and he provided additional information on the study, the

8
assessment process, and participation criteria. Parents were informed that they could contact the
project director to discuss aspects of the study they did not understand or if they changed their
mind about their child’s participation.
Once the signed parent consent form was returned, the project director contacted the
child’s parent (summer cohort) or teacher (fall cohort) to schedule the pretreatment assessment.
For a child to qualify, he or she had to meet the just-mentioned qualification criteria, which were
designed to identify a group of students with DS most likely to benefit from the reading
intervention. Eligibility decisions were based on information provided by teachers and parents
and on data collected during the initial assessment. Following this initial assessment, parents
were notified of their child’s eligibility and arrangements were made to begin the reading
intervention. Across the summer and fall cohorts, all aspects of the study, with the exception of
the tutoring location and recruitment process, were the same. No statistically significant
differences were found between the cohorts in age or reading performance at study entry.
Staff
Project staff included the project director, who was a doctoral student in special education
and a certified special education teacher, and two research assistants (RAs). Both RAs were
certified teachers with master’s degrees in special education. Thirteen tutors provided one-to-one
reading instruction. Eleven tutors were enrolled in graduate programs of education (4 were
certified teachers), 1 tutor was a certified teacher who had a master’s degree in education, and 1
tutor was an undergraduate student. Four of the 13 tutors were male. Five tutors instructed the
summer cohort; 8 tutors worked with the fall cohort.

9
Assessment Procedures
Test training. Prior to the reading intervention, the staff participated in assessment
training conducted by the project director. The assessments included (a) descriptive and predictor
measures (i.e., reading measures, cognitive measures, and parent and tutor measures) and (b)
outcome measures. RAs completed 20 hours of training on all measures; tutors participated in 10
hours of similar training, but only for the outcome measures. Following training, the three staff
responsible for the reading and cognitive assessments demonstrated inter-rater agreement of 98%
or higher on each measure. Tutors individually administered the outcome measures to the project
director and were required to do so with 100% accuracy.
Test schedule. The reading measures were conducted one time prior to intervention and
the cognitive measures were conducted one time during the fourth week of intervention. These
were administered by either the project director or an RA. Outcome measures were administered
once prior to intervention and following the completion of each lesson (approximately every 3rd
day of intervention). Thus, the outcome measures were administered 11 times during the study.
The project director or an RA gave the outcome measures prior to intervention and the tutors did
so during the intervention.
Test condition. All testing took place at a table in a quiet, private room and took between
15-60 minutes. The child sat across from the tester. The child was told, “We are going to play
some games. I want you to work hard and try your best. If you work hard, you will get a prize
when we are done. Here are 3 choices of prizes. Which one would you like to have when you are
finished?” Small picture icons representing the measures to be administered and the chosen prize
were attached with Velcro to a strip of cardstock and placed in front of the child on the table. The
tester explained that this “schedule” showed how many tests were remaining and reminded the

10
child that she or he was working for a prize. One icon was removed from the schedule after each
test was completed. The child was given the opportunity to ask questions regarding the
procedures prior to testing.
The child was praised after every 3-5 responses with statements such as “I really like how
you are working” and “You are doing a great job of trying your best.” Breaks were provided as
needed and the testing was stopped if the child showed signs of non-compliance or serious
frustration (e.g., crying). Two instances of noncompliance resulted in termination of the
assessment. All assessments were recorded on audiotape. The measures were presented in
random order for each child.
Scoring and Data Management
The project director or an RA used the audiotapes to double-score all one-time
assessments (i.e., reading and cognitive measures). Disagreements in scoring were resolved by
the three staff members who listened to the taped assessment. Additionally, the project director
or an RA used the tapes to double-score the first three administrations of outcome measures
conducted by each tutor for each child. Scoring disagreements were resolved by consensus and
retraining was provided to the tutor if inter-rater agreement was lower than 95%, or if the testing
procedure had not been followed correctly. After a tutor had demonstrated three consecutive
assessments with greater than 95% inter-rater agreement, double-scoring was conducted on a
random sample of 10% of assessments.
Children were not penalized for speech impairments. Words and sounds consistently
pronounced in the same manner by the children were counted as correct. During the assessment,
the tester was also encouraged to ask the child to repeat his or her answer or to say a different
11
word that included the difficult-to-understand sound if the tutor was struggling with
understanding the child. For example, if a child said ‘/zh/’ for the letter ‘j’ on the letter sound
assessment, she or he may have been asked to repeat several words that started with the ‘j’ such
as ‘jump’ and ‘jog’. If the child said ‘/zh/’consistently, across the words, it was counted correct.
Prior to data entry, scoring accuracy on each measure was checked. Then, project staff
independently entered the data from the measures’ protocols into two separate databases that,
when completed, were electronically compared. If there were discrepant scores on a measure, the
items in question were identified, re-scored, and re-entered into the database and the two
databases were compared again. This process continued until the two databases were identical.
Descriptive and Predictor Measures
As indicated, descriptive and predictor measures were conducted one time for each child.
These measures included reading and cognitive measures as well as parent and tutor measures.
The purpose of these measures was to describe the sample and to measure child characteristics
that could be used to predict variation in the outcome measures.
Reading measures. The reading measures included blending, segmenting, word
identification, word attack, and oral reading fluency (see Table 1 for descriptive statistics).
Developed by Fuchs and colleagues (D. Fuchs, Fuchs, Thompson, Al Otaiba, Yen, Yang et al.,
2001), the Blending measure consists of 22 one-syllable words. Students listen to the tester say
individual sounds (e.g., /s/ /oa/ /p/) and guess the correct word (e.g., ‘soap’). Testers place one
cube for each sound into Elkonin boxes as a form of visual support for the task. Students
continue this test until four consecutive incorrect responses are given or the test is completed.
Scores range from 0 to 22.

12
Table 1
Summary Statistics for Descriptive and Predictor Measures
Measure M SD Min Max
Blendinga 4.79 6.01 0 17
Segmenting*a 13.75 16.39 0 52
Word Identification*b 21.83 18.19 0 49
Word Attackb 1.13 1.75 0 5
Fluency
1st-grade passagec 25.25 27.35 0 89.5
Intervention-aligned passaged 19.79 22.60 0 73
KBITe
Verbal Raw Score 12.83 5.59 3 25
Riddle Raw Score 8.46 3.89 1 19
Matrices Raw Score 12.13 3.93 3 18
IQ Composite 44.63 6.76 40 68
Verbal IQ (Age Adjusted)*f 0.00 5.06 -9.91 8.34
WMTB-Cg
Digit Recall
Raw Score 14.92 4.94 4 24
Span 2.46 0.88 1 4
Block Recall
Raw Score 16.42 6.49 1 29
Span 2.71 1.23 0 5
Inattention*h 3.18 1.14 1.67 5.22
Prior Phonics Instruction*i 4.00 1.86 0 6
Age*j 11.97 2.61 7.58 16.96
Note. * denotes measures used as predictors in growth models. a(D. Fuchs, Fuchs, Thompson, Al Otaiba, Yen, Yang, et. al., 2001) bWoodcock Johnson Reading Mastery Test - Revised (Woodcock, 1987). cComprehensive Reading Assessment Battery (CRAB; L.S.
Fuchs, Fuchs, & Maxwell, 1988) d(Peer-Assisted Learning Strategies; D. Fuchs, Fuchs, Yen, Thompson, McMaster, et al., 2001; D.
Fuchs, Fuchs, Thompson, Al Otaiba, Yen, McMaster, et al., 2001). eKaufman Brief Intelligence Test, Second Edition (KBIT-2;
Kaufman & Kaufman, 2004) fAdjusted for age by regressing out age at start of intervention. gWorking Memory Test Battery for
Children (WMTB-C; Pickering & Gathercole, 2001) hComposite score from SWAN (J. Swanson et al., 2004) completed by tutors. iComposite score representing prior phonics reading instruction based on parent report and Individualized Education Program goals. jAge in years at beginning of intervention.

13
The Segmenting measure (D. Fuchs, Fuchs, Thompson, Al Otaiba, Yen, Yang et al.,
2001) consists of 22 one-syllable words. Students listen to the tester say a word (e.g., ‘dog’) and
are asked to say each individual sound in the word (e.g., /d/ /o/ /g/). Cubes representing each
sound are placed in Elkonin boxes as a form of visual support for the task. Students continue this
test until they commit four consecutive errors or until they complete it. Scores can range from 0
to 56.
Developed by Woodcock (1998), the Word Identification subtest of the Woodcock
Johnson Reading Mastery Test – Revised (WRMT-R) requires students to read as many as 100
single words, ordered by difficulty. Corrective feedback is given for the first item only. The test
is discontinued after six consecutive errors. Students receive one point for each correctly
pronounced word. Scores range from 0 to 100. Split-half and test-retest reliabilities are .99 and
.94, respectively, for first grade.
The Word Attack subtest of the Woodcock Johnson Reading Mastery Test – Revised
(WRMT-R; Woodcock, 1998) evaluates whether students can decode 45 nonsense words (e.g.,
dee) ordered from easiest to most difficult. The test is discontinued after six consecutive errors.
Students receive one point for each correctly pronounced word. Scores range from 0 to 45. Split-
half and test-retest reliabilities are .95 and .90, respectively, for first grade.
Students read three oral-reading fluency passages. Students first read two end-of-the-year
first-grade passages from the Comprehensive Reading Assessment Battery (CRAB; L. S. Fuchs,
Fuchs, & Maxwell, 1988). The tester directs the child to read as quickly and correctly as he or
she could in one minute. The child is prompted to continue with the next word if a correct
response is not provided in 3 seconds. If a child does not read any words correctly on the first
line of the passage, the test is stopped and the child receives a zero score. Total words correct for

14
these two passages are averaged. For typically-developing individuals, test-retest reliability
ranges between .93 and .96 (L. S. Fuchs, Marston, & Deno, 1983) and concurrent validity with
the Stanford Achievement Test--Reading Comprehension is .91 (L. S. Fuchs et al., 1988).
Additionally, students read aloud for one minute from one intervention-aligned passage
leveled to correspond to the 25 lessons included in the intervention. They were adapted from
Peer-Assisted Learning Strategies (PALS; D. Fuchs, Fuchs, Swenson et al., 2001; D. Fuchs,
Fuchs, Thompson, Al Otaiba, Yen, McMaster et al., 2001) and range from mid-kindergarten to
mid-second grade reading levels. The stories include words and letter sounds taught in the
intervention. The story that corresponds to one level higher than the child’s final lesson is
selected to provide a near transfer measure and to ensure the child did not have an opportunity to
practice the story during the intervention. Thus, if a child started the intervention at Lesson 5, he
or she was assessed with the story from Lesson 15 at pre- and posttreatment. As with the first-
grade passages from the CRAB, total number of words read correctly is calculated and a score of
zero is recorded if the child does not read one word on the first line of the passage.
Cognitive measures. Two additional assessments were completed once for each
participant during approximately the fourth week of intervention (see Table 1 for descriptive
statistics). The Kaufman Brief Intelligence Test, Second Edition (KBIT-2; Kaufman & Kaufman,
2004) is a brief, individually administered assessment of verbal and nonverbal intelligence. It
includes three subtests, verbal knowledge, riddles, and matrices, which require individuals to
indicate their responses by pointing to pictures (a verbal response is required for advanced
responses on the riddles subtest). The assessment provides an IQ composite score. For 7 to 16
year olds, correlations between the IQ composite score and the full-scale IQ score from the
Wechsler Abbreviated Scale of Intelligence (WASI) are .81 and .77 (4 and 2 subtests,

15
respectively), and .76 for the full scale IQ score from the Wechsler Intelligence Scale for
Children – Third Edition (WISC-III). The lowest possible IQ composite score on the KBIT is 40,
which was the score earned by 11 study participants. To control for this floor effect and to
remove the influence of age from the score, age was regressed out of the verbal raw score and
the residual was used as a predictor in the growth models.
Two subtests, digit recall and block recall, from the Working Memory Test Battery for
Children (WMTB-C; Pickering & Gathercole, 2001) were given. For the first subtest, students
repeat lists of numbers spoken to them. The second subtest requires students to tap on numbered
blocks in the same pattern as modeled by the tester. The subtests take 5 to 15 minutes.
Parent and tutor measures. Additional information regarding the participants was
collected from parents and tutors. Tutors completed the SWAN rating scale developed by J.
Swanson et al. (2004) on which they rated various child behaviors related to inattentiveness on a
scale of one to seven in comparison to same age, typically-developing peers (1 far below, 2
below, 3 slightly below, 4 average, 5 slightly above, 6 above, 7 far above). Factor analysis was
used to generate a composite score for each child to operationalize inattentive behavior or
reduced ability to maintain focus of attention. Nine items on the measure had loadings greater
than .60 onto the factor representing inattentive behavior. The average response to these nine
items was 3.18 (SD=1.14, Min=1.67, Max=5.22). The standardized composite score (M=0,
SD=1) ranged from -2.26 to 1.71.
Parents provided the most recent copy of student’s Individualized Education Program
(IEP) goals that were categorized based upon instructional focus. The number of children with
reading goals in each of seven categories of reading instruction is represented in Table 2.
Additionally, Parents completed a reading survey that asked questions regarding the importance

16
of reading instruction for the child, the amount of reading that occurred within the home each
week, and the amount and focus of reading instruction provided to the child in the last academic
year. Parents indicated that reading instruction was important to family (n=24) and teachers
(n=22), and that the children participating in the study wanted to learn to read (n=24). Most
parents indicated that family members read aloud to the child and more than half indicated that
the child read aloud to the family or silently to him or herself each week. Only 2 children were
reported to have not participated in reading instruction during the last school year. A summary of
responses is displayed in Table 2.
A composite variable was generated for each child to represent the content of reading
instruction. This was done by giving a child one point for each area of reading instruction
(excluding sight word reading) parents either indicated the child had received or in which a child
had an IEP goal. For example, a child whose parent indicated they had received instruction only
in letter sounds and who had an IEP goal in phonological awareness would receive a score of 2
for this variable. Scores ranged from 0 to 6 with a mean of 4 (SD = 1.86).
Outcome Measures
Five outcome measures were administered prior to intervention and following each
lesson (i.e., after every third 60-minute session). These measures were estimates of growth and
final level of performance. All letters and words were printed in a 36-point font in black ink on
an 8 by 12 inch sheet of white paper. None of these measures were timed. Eleven alternate forms
were created for each measure and they were administered in the same order for all students
(e.g., after the first lesson, one set of alternate forms for the measures was administered to all
children; following lesson two, another set of alternate forms was administered).

17
Table 2
Categorization of IEP Goals and Summary of Responses from Parent Survey
Questions M (SD)
n (%) n (%) n (%)
Child has an IEP goal in the area of:
Sight word reading 15 (62.50%) 9 (37.50%)
Letter sounds 5 (20.83%) 19 (79.17%)
Phonological awareness 3 (12.50%) 21 (87.50%)
Decoding 6 (25.00%) 18 (75.00%)
Fluency 1 (4.17%) 23 (95.83%)
Vocabulary 4 (16.67%) 20 (83.33%)
Reading comprehension 15 (62.50%) 9 (37.50%)
If reading instruction was provided during last
school year, it included a focus on:
Sight word reading 21 (95.45%) 0 (0.00%) 1 (4.55%)
Letter sounds 20 (90.91%) 0 (0.00%) 2 (9.09%)
Phonological awareness 15 (68.18%) 2 (9.09%) 5 (22.73%)
Decoding 14 (63.64%) 4 (18.18%) 4 (18.18%)
Fluency 10 (45.45%) 5 (22.73%) 7 (31.82%)
Vocabulary 12 (54.55%) 3 (13.64%) 7 (31.82%)
Reading comprehension 15 (68.18%) 2 (9.09%) 5 (22.73%)
Parent or family member reads aloud to the
child.21 (87.50%) 3 (12.50%)
Number of minutes per week 92.14 (71.14)
Child reads aloud to parent or family member. 14 (58.33%) 10 (41.67%)
Number of minutes per week 53.89 (60.67)
Child reads silently to self. 13 (54.17%) 11 (45.83%)
Number of minutes per week 44.04 (33.40)
Child participated in reading instruction during
last school year.22 (91.67%) 2 (8.33%)
Number hours per week. 4.69 (2.89)
Yes No Unsure
Note. IEP=Individualized Education Program.

18
On Letter Sounds, the child is asked to say the sounds of the letters of the alphabet. The
letters included all single vowels, single consonants, and letter combinations included in the
scope and sequence for the 25-lesson intervention. Items are placed in the order in which they
are taught, which was presumed to be from most familiar to least familiar. Alternate forms were
created by randomly ordering the letters within each lesson. Students are told, “I am going to
show you some letters. I want you to tell me the sounds these letters make. What sound does this
letter make?” The tester points to each letter. Letters are scored as correct if the child says the
most common sound for the letter. Any time the child says the letter name instead of its sound,
the tester says, “That is the letter’s name. What sound does it make?” Additional corrective
feedback is given on the first three items only. For correct responses, the tester says, “You’re
right. That letter makes the sound /b/. What sound does this letter make?” For incorrect
responses, “That’s not quite right. That letter makes the sound /b/. What sound does this letter
make?” Students continue the test until they either complete the list or make 6 consecutive
errors.
Four different sets of Word Lists were created. No corrective feedback is provided and
students continue the test until they either complete the list or make 6 consecutive errors. The
first list included taught sight words (i.e., those included in the intervention). Two words were
randomly selected for each alternative form from each level of the scope and sequence. The
words were placed in same order as the scope and sequence. Only 1 taught sight word was
included in two lessons, thus the total possible number of words correct was 48. The second list
consisted of decodable words taught in the intervention. The lists were created in the same
manner as the taught sight word lists. The highest possible score was 50 words correct.
19
The third list included nonsense words that were aligned with the intervention. These
words were created by combining the rime unit of taught decodable words (e.g., ‘ump’) and
taught letter sounds (e.g. ‘v’) to create a nonword (e.g., ‘vump’). Between 4 and 6 words were
created for each level of the scope and sequence and two were randomly selected for each
alternate form, again placed in order of the scope and sequence. The highest possible score was
50.
The final word list consisted of a control word list of nontaught sight words. Prior to the
intervention, the child was presented with a list of 48 words selected from the Dolch list of high
frequency words. These words were not taught, nor were they decodable based on skills taught
during the intervention. These 48 words were ordered from most to least frequently used. An
individual list of unknown sight words was created for each child by selecting the first 20 words
the child did not know. If the child did not miss 20 words on this measure, additional unknown
words were selected in the same manner from the Word Identification subtest of the WRMT-R.
This word list was randomly ordered for each alternate form and the child was asked to attempt
all 20 words at each administration. (For more information, see the Study Design section below.)
Intervention
Overview. Tutoring took place in two 30-minute sessions delivered daily, 5 days per
week for approximately 6 weeks. If a child missed one or more sessions, the intervention
continued until each child had either received 30-hours or the child was no longer available (i.e.,
end of the summer camp or end of the fall semester). The average amount of instruction received
was 29.30 hours (SD=1.77 hours). Two children received 28 hours; three received 24 hours.
There was no attrition once intervention began. The starting lesson for each student was

20
individually determined based on pre-treatment reading performance. The children who knew
more letter sounds and words started in lessons that corresponded to higher levels in the
intervention program’s scope and sequence. Students repeated each lesson for 3 days, followed
by administration of the outcome measures, before moving to the next lesson. Students’
progression through the lessons was not dependent on their performance on the assessments.
Session 1 lesson components. The scripted lesson plan and the scope and sequence of
skills to be taught were adapted from Peer-Assisted Learning Strategies (PALS) grades K and 1
(D. Fuchs, Fuchs, Swenson et al., 2001; D. Fuchs, Fuchs, Thompson, Al Otaiba, Yen, McMaster
et al., 2001). Modifications were made to the program to make it suitable for one-on-one tutoring
and to provide additional support for students with cognitive deficits. The scripted lesson plan
provided the tutor with explicit directions regarding the order of activities, the prompts to be
used, and the time to be spent on each activity. The scope and sequence included 25 lessons.
Each lesson included targeted letters or letter combinations, decodable words, sight words, and
an intervention-aligned story. Previously taught letters and sight words were included for review
in 2 to 3 lessons after they were introduced.
Session 1 started with a “Sound Box” activity adapted from the Phonological Awareness
Kit, Primary level (Robertson & Salter, 1995). The student was shown a picture (e.g., a bug),
told the name of the picture, and asked to repeat the word. The tutor then modeled “saying the
word in a funny way” by slowly segmenting the word into individual phonemes. A cube was
placed into one of a set of Elkonin boxes for each sound. The child was then asked to repeat the
sounds while touching the cubes. Scaffolding was provided as needed. Next, the tutor modeled
saying the sounds and then blending them into the word. The student was asked to repeat and
assistance was provided as needed. This was repeated for 2 minutes.

21
Next, the student played “Guess My Word,” adapted from Kindergarten Peer-Assisted
Learning Strategies (K-PALS) (D. Fuchs, Fuchs, Thompson, Al Otaiba, Yen, McMaster et al.,
2001). The student was shown a page that included Elkonin boxes at the top and four pictures,
each with Elkonin boxes below them, at the bottom of the page. First, the tutor said the name for
each picture and had the child repeat. Next, the tutor said the sounds of one of the words while
placing cubes representing the sounds into the Elkonin boxes at the top of the page. The child
was asked to “guess” which word the tutor had said in the “funny way.” Assistance was provided
as needed. After the child had either guessed the word or the tutor had provided the correct
response, the child was directed to say the sounds in the word while touching the cubes. This was
repeated for all four pictures. Next, the child was directed to say the sounds in each of the words
while placing the cubes in the corresponding boxes for each picture. Assistance was provided as
needed and the tutor repeated the sounds and the word for each item before moving onto the next
picture. This was done for 3 minutes.
Students then practiced saying the sounds of letters. The tutor introduced new letters by
showing the letter, providing the sound, and asking the child to repeat the sound. The child was
asked to provide the sound for each letter in the lesson as the letter was shown to him or her. The
tutor corrected incorrect responses by providing the correct sound then asking the child to repeat
the sound correctly. After all sounds had been attempted, those on which the child had made a
mistake were reviewed 3 to 5 times. Then all sounds were practiced again. This process
continued for 5 minutes.
This was followed by reading decodable words (10 minutes). First, the tutor said the
sounds in a word while touching corresponding cubes placed in Elkonin boxes and the tutor
asked the child to guess the word. Corrective feedback was provided if needed and the child was

22
asked to repeat the sounds and the word. A card representing the word was then placed under the
set of cubes. The child was asked to “Sound it out” by touching the dots corresponding to each
sound that were printed under the letters in the word. The child was then asked to “Read it fast”
as they ran their finger from left to right over the dots. Corrective feedback and modeling were
provided until the child demonstrated the correct response. This process was repeated with the
set of words and any words on which a child had made a mistake were reviewed. One nonsense
word was included in each lesson. This word was printed on a yellow card. When the child got to
this card, the tutor would say, “Now we’re going to try this with a silly word. This isn’t a real
word. Remember to say each sound and put those sounds together to make a silly word.”
For the next 10 minutes, Sight words were presented to the child and he or she was asked,
“What word?” Corrective feedback was provided as needed and the set of incorrect words were
reviewed 3 to 5 times. This was followed by another review of the complete word set. Then, the
child took a break before moving onto the second daily session.
Session 2 lesson components. The first activity of the Session 2 was a 15-minute review
of the sounds, decodable words, and sight words included in the first session. Sounds and sight
words were presented exactly as they were in session one. For the decodable words, the child
sounded the word out and read it fast, but did not complete the phonological awareness activities
of guessing the word and saying the sounds in the word.
The next 10 minutes were spent practicing fluency and reading in connected text. The
child was shown a story and the tutor modeled reading it aloud. Next, the child was asked to
read. When the child made an error or paused for more than 4 seconds, the correct words were
provided by the tutor and repeated by the child. Next, the child was timed reading the story aloud
for 30 seconds. The child circled the last word read and then attempted to read more words on a

23
second timed reading. This activity was modified for students who struggled significantly with
reading fluency. For these students, the tutor selected between 2 – 5 words from the lesson and
had the child find them in the story and circle them. Next, the tutor read the story aloud and the
child was asked to read the circled words at the appropriate time.
The final 5 minutes of the intervention served as a review session. The tutor played “word
games” with the child for extra points. These games focused on parts of the lesson where the
child was struggling. The games included “Beat Your Time” where children tried to read words
or say letter sounds faster on each attempt, “Matching” where two copies of the words were
combined and placed on the table face down and the child tried to make matching pairs, “Word
Hunt” where students located the words in the story, and “Writing” where students could write
challenging words on paper or a dry erase board.
Session 2 on assessment days was modified to include 5 minutes of word games and
review, followed by administration of the outcome measures. The assessment typically took
between 10-20 minutes for each child.
Behavior management. A similar “schedule” to the one used during assessment was used
during intervention sessions. Small icons representing each segment of the lesson were placed on
a strip in front of the child sequentially ordered from left to right. An icon representing a
preferred activity (e.g., ball, bubbles, drink) selected by the child was placed to the right of all
lesson components. Icons were removed as the lesson progressed and the child received the
preferred activity following the intervention. Additionally, students earned points for positive
behaviors (e.g., cooperating, working hard, following directions) that were recorded on a point-
sheet. These points could be used to purchase inexpensive items (e.g., balloons, pencils, stickers)
after students completed each lesson (i.e., every 3rd
day). Behavior management was

24
individualized to optimize the performance of each child. Thus, some students made purchases
with points every day and others took more frequent breaks with a preferred activity.
Tutor training. Tutors participated in 10 hours of intervention training conducted by the
project director. The training included lecture, demonstration, and practice. Characteristics of
students with DS were discusses, as were behavior management strategies. They were required
to “teach” a lesson to the project director. Those scoring less than 95% on a fidelity checklist
received additional training until they reached that criterion of mastery.
Fidelity of implementation. Once tutoring began, audiotaped lessons were scored by the
project director or an RA using a fidelity of implementation checklist. The staff demonstrated
inter-rater reliability of 95% on this checklist prior to evaluating lessons. This checklist reflected
critical components of the intervention, behavior management, and overall quality of instruction.
All tapes for each tutor were scored until he or she had demonstrated correct performance on
95% or more of the items on the checklist on three consecutive lessons. Once a tutor established
this level of proficiency, a random sample of 10% of audiotaped lessons was monitored for
fidelity. Tutors with a score lower than 95% received additional training and were then again
required to demonstrate proficiency on three consecutive lessons prior to returning to the 10%
rate of random fidelity monitoring. The average score on the fidelity of implementation checklist
was 97.64% (SD 4.30). Scores ranged from 76% to 100%. Additionally, the project director
observed tutoring sessions throughout the study’s duration. Weekly project meetings were also
held to monitor tutor performance, troubleshoot emerging problems, and provide support.
25
Study Design
As indicated previously, the study’s purpose was to evaluate the efficacy of an explicit,
phonics-based reading intervention for children with DS and to explore various child
characteristics as predictors of growth in targeted reading skills. A control group was not
included due to limited resources and to the inclusion criteria that restricted the number of
children who would qualify. However, in an attempt to exert some experimental control, a
pseudo-control condition was devised – a control word list. This was accomplished by creating a
child-specific measure on which growth would be evaluated that consisted of words the child
could not read prior to the intervention and that were not taught as part of it. It was expected that
the children’s performance on this word list would not change during the intervention and that it
would serve as a benchmark against which the children’s performance on more intervention
sensitive measures could be compared. In this way, gains obtained on measures of targeted skills
(i.e., identification of letter-sounds and reading of taught sight words, decodable words, and
nonsense words) might be attributed to the instruction each child received and not to
improvement in speech intelligibility, familiarity with the testers, or other non-intervention
instruction.
It was hypothesized that a nonstatistically significant slope estimate would be found for
the control word list, indicating a lack of improvement in the reading of non-targeted words. As
will be explained in the following section, the slope estimate for this measure was found to be
small (an increase of 0.05 words per week), yet statistically significant (p<.01), indicating that
average growth was reliably different from zero. Thus, it was decided that performance on the
control word list would be used as a level-1 time-varying covariate. This would permit a more
rigorous evaluation of the intervention by statistically controlling for the unexpected growth on

26
the non-taught word measure. Additionally, this would allow the final intercept and slope
estimates for each outcome measure to represent those that would be expected when a student’s
score on the control word list remained at zero.

27
CHAPTER III
RESULTS
Results are presented in two parts. In the first part, model-fitting results for the outcome
measures will be presented, beginning with an overview of model assumptions and a summary of
related descriptive statistics and correlations. Next, results will be reported from a series of
statistical models. The sequence of models proceeds from unconditional growth models with no
covariate or predictor variables for the outcome measures to (a) models that include the control
word list as a level-1 time-varying covariate, (b) models that include individually entered level-2
predictor variables, and (c) the “final” or best-fitting models in which the combination of level-2
predictor variables was examined. The second part of this section explores whether children’s
speech impairments may have influenced the scoring of their performance on the outcome
measures.
Growth Models
Model assumptions. Fitting multilevel growth models involves a set of assumptions about
functional form, normality, and heteroscedasticity (Singer & Willett, 2003). These assumptions
were examined for the unconditional model and for the best-fitting conditional model for each
reading outcome measure. Regarding the assumption of functional form, scatter plots of each
child’s scores confirm that linear models adequately represent change for most. For a few
children, the use of a quadratic term would have better captured the deceleration in slope for
taught sight words and decodable words and the acceleration of slope for nonsense words. Level-

28
1 residuals were approximately normally distributed with very few outliers in the tails of the
distributions on all measures. Level-2 residuals for intercepts and slopes suggested normality
with some floor effects apparent on nonsense words, decodable words, and control words.
Finally, residual variances were approximately equivalent across differing levels of the predictor
variables. However, sample size limited the evaluation of this assumption.
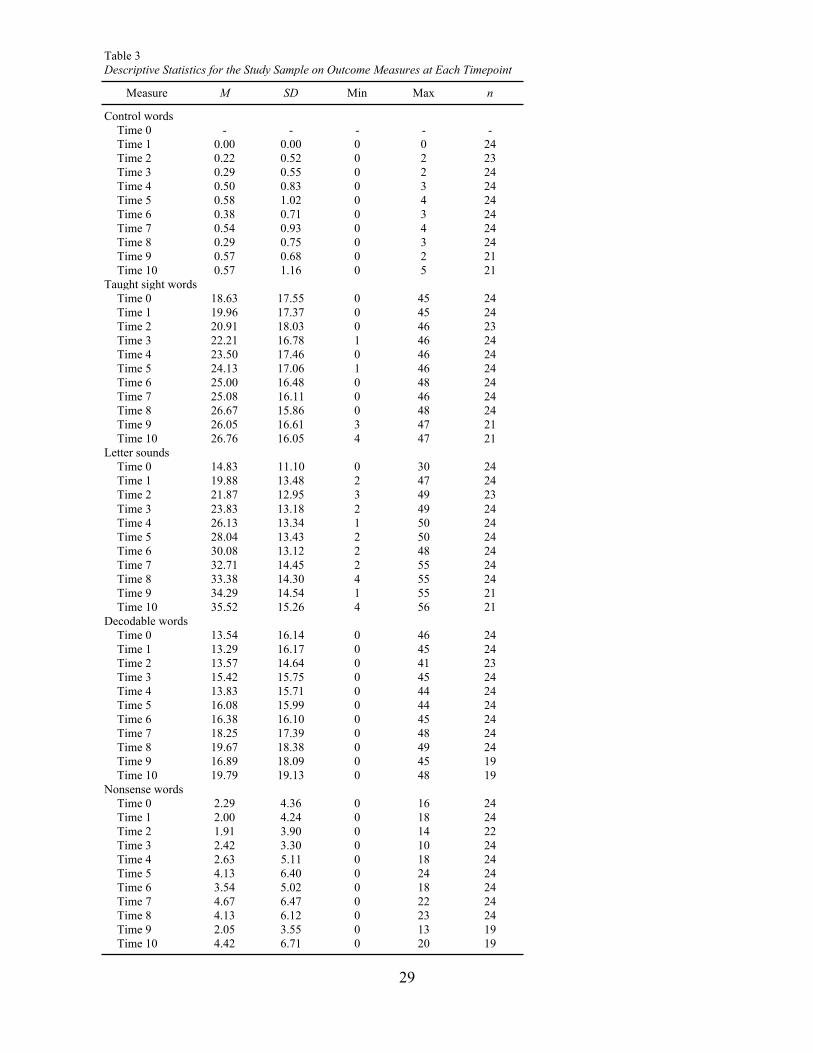
Descriptive statistics and correlations. Descriptive statistics for the outcome measures
are presented in Table 3. The control word list was generated for each child based on
pretreatment performance. No score was given at Time 0. As indicated in the table, average
performance on each outcome measure increased over time. Five students entered the study with
near-ceiling scores on taught sight words and decodable words. Eleven students knew most of
their letter sounds toward the end of the intervention. Correlations among the five outcome
measures at pretreatment testing (Time 0) and posttreatment testing (Time 10) are displayed in
Table 4. As would be expected, moderate-to-high and statistically significant correlations were
found for all measures of targeted skills at Time 0 and Time 10. Additionally, test-retest
correlations comparing performance on each task across the two time-points ranged from .71 to
.96, indicating that the rank ordering of children on the measures remained stable across the
intervention. Performance on the control word list was not statistically significantly correlated
with performance on any of the measures of targeted skills.
Unconditional growth models. To evaluate the efficacy of the intervention, individual
growth models were estimated for the five reading outcome measures using Hierarchical Linear
Modeling (HLM; Raudenbush & Bryk, 2002; Raudenbush, Bryk, & Congdon, 2000).
Unconditional growth models were fitted for each measure. At level-1, the measure was
expressed as a linear function of time corresponding to the amount of intervention received,
29
Table 3
Descriptive Statistics for the Study Sample on Outcome Measures at Each Timepoint
Measure M SD Min Max n
Control words
Time 0 - - - - -
Time 1 0.00 0.00 0 0 24
Time 2 0.22 0.52 0 2 23
Time 3 0.29 0.55 0 2 24
Time 4 0.50 0.83 0 3 24
Time 5 0.58 1.02 0 4 24
Time 6 0.38 0.71 0 3 24
Time 7 0.54 0.93 0 4 24
Time 8 0.29 0.75 0 3 24
Time 9 0.57 0.68 0 2 21
Time 10 0.57 1.16 0 5 21
Taught sight words
Time 0 18.63 17.55 0 45 24
Time 1 19.96 17.37 0 45 24
Time 2 20.91 18.03 0 46 23
Time 3 22.21 16.78 1 46 24
Time 4 23.50 17.46 0 46 24
Time 5 24.13 17.06 1 46 24
Time 6 25.00 16.48 0 48 24
Time 7 25.08 16.11 0 46 24
Time 8 26.67 15.86 0 48 24
Time 9 26.05 16.61 3 47 21
Time 10 26.76 16.05 4 47 21
Letter sounds
Time 0 14.83 11.10 0 30 24
Time 1 19.88 13.48 2 47 24
Time 2 21.87 12.95 3 49 23
Time 3 23.83 13.18 2 49 24
Time 4 26.13 13.34 1 50 24
Time 5 28.04 13.43 2 50 24
Time 6 30.08 13.12 2 48 24
Time 7 32.71 14.45 2 55 24
Time 8 33.38 14.30 4 55 24
Time 9 34.29 14.54 1 55 21
Time 10 35.52 15.26 4 56 21
Decodable words
Time 0 13.54 16.14 0 46 24
Time 1 13.29 16.17 0 45 24
Time 2 13.57 14.64 0 41 23
Time 3 15.42 15.75 0 45 24
Time 4 13.83 15.71 0 44 24
Time 5 16.08 15.99 0 44 24
Time 6 16.38 16.10 0 45 24
Time 7 18.25 17.39 0 48 24
Time 8 19.67 18.38 0 49 24
Time 9 16.89 18.09 0 45 19
Time 10 19.79 19.13 0 48 19
Nonsense words
Time 0 2.29 4.36 0 16 24
Time 1 2.00 4.24 0 18 24
Time 2 1.91 3.90 0 14 22
Time 3 2.42 3.30 0 10 24
Time 4 2.63 5.11 0 18 24
Time 5 4.13 6.40 0 24 24
Time 6 3.54 5.02 0 18 24
Time 7 4.67 6.47 0 22 24
Time 8 4.13 6.12 0 23 24
Time 9 2.05 3.55 0 13 19
Time 10 4.42 6.71 0 20 19

30
centered at the end of the intervention. Each time-point represented an outcome measure
administered after 3 hours of instruction (i.e., following the completion of 1 lesson). The
intercept represented the estimated final status of each child. Results from the unconditional
models are presented in the top half of Table 5. Slope estimates were statistically significant for
all measures, indicating that the average rate of growth was reliably different from zero.
Models conditional on control word list. Because of the statistically significant growth
obtained on the control word list, a set of conditional models with performance on the control
word list as a time-varying covariate were fitted for the other four outcome measures. This
covariate was added as a main effect and as an interaction with time to evaluate its influence on
final status and growth (Singer & Willett, 2003). In these models, the intercept represents the
estimated final status when performance on the control word list is held at zero. The slope
represents a conditional rate of change controlling for unexpected improvements in the reading
of non-taught, non-decodable words (i.e., the control word list).
Results from these conditional models are shown in the bottom half of Table 5.
Controlling for improvements on the control word list, positive and statistically significant slope
Table 4
Intercorrelations Among Ongoing Assessments at Time 0 and Time 10
Measure 1 2 3 4 5 6 7 8 9
Time 0
1 Taught sight words -
2 Letter sounds .70 *** -
3 Decodable words .92 *** .56 *** -
4 Nonsense words .64 *** .44 * .81 *** -
Time 10
5 Control words -.04 -.27 -.06 -.16 -
6 Taught sight words .94 *** .80 *** .82 *** .65 *** -.05 -
7 Letter sounds .88 *** .77 *** .76 *** .61 *** -.02 .93 *** -
8 Decodable words .97 *** .75 *** .96 *** .76 *** -.03 .95 *** .88 *** -
9 Nonsense words .61 ** .31 .77 *** .71 *** -.02 .55 * .51 * .73 *** -
Note. Time 0=Pretreatment; Time 10=Final status. Control word measure not administered at Time 0. *p<.05. **p<.01. ***p<.001,
two-tailed.

31
Table 5
Parameter SE Reliability
Unconditional Models
Control list
Intercept 00 0.61 ** 0.18 0.65 *** .85
Slope 10 0.05 ** 0.02 0.00 * .53
Taught sight words
Intercept 00 28.42 *** 3.20 243.73 *** .99
Slope 10 0.92 *** 0.12 0.28 *** .86
Letter sounds
Intercept 00 37.94 *** 3.01 213.49 *** .98
Slope 10 2.08 *** 0.15 0.40 *** .78
Decodable words
Intercept 00 19.59 *** 3.54 296.39 *** .99
Slope 10 0.69 *** 0.13 0.30 *** .72
Nonsense words
Intercept 00 4.86 ** 1.31 38.98 *** .94
Slope 10 0.30 * 0.11 0.25 *** .80
Conditional Models Controlling for Performance on Control Word List
Taught sight words
Intercept 00 28.18 *** 3.17 242.11 *** .99
Slope 10 0.88 *** 0.14 0.31 *** .82
Controla20 0.96 0.78
Control by Timeb30 -0.10 0.12
Letter sounds
Intercept 00 37.38 *** 2.88 204.53 *** .99
Slope 10 1.90 *** 0.16 0.49 *** .87
Controla20 0.36 0.53
Control by Timeb30 0.05 0.11
Decodable words
Intercept 00 19.72 *** 3.68 315.86 *** .99
Slope 10 0.75 ** 0.19 0.68 *** .84
Controla20 0.48 0.57
Control by Timeb30 0.03 0.12
Nonsense words
Intercept 00 4.73 ** 1.47 48.59 *** .95
Slope 10 0.32 0.16 0.49 *** .86
Controla20 0.58 0.35
Control by Timeb30 0.02 0.07
Unconditional Models and Conditional Models with the Control Word List as Time-Varying Level-1
Covariate
Note. aScore on control word measure. bScore on control word measure interacted with time. p<.10 *p<.05. **p<.01.
***p<.001, two-tailed.
Fixed Effects Random Effects
Coefficient Variance
32
estimates were obtained for taught sight words, letter sounds, and decodable words. The average
increase per lesson on these measures was 0.88 for taught sight words, 1.90 for letter sounds, and
0.75 for decodable words. The slope estimate for nonsense words was small (0.32 words per
lesson) and marginally significant (p<.10), indicating that average growth was not reliably
different from zero.
The parameter estimates for the control word list were nonsignificant in a majority of the
conditional models. However, performance on this measure was related to final status on
nonsense words when segmenting ability was added to the model (See Table 11). This suggests
that children with higher scores on the control word list were more likely to read more nonsense
words at the end of the intervention. A similar, albeit marginally statistically significant, effect
was indicated when prior phonics instruction was added to the model.
To illustrate the variability in growth between children, individual growth curves for the
outcome measures are presented in Figure 1. Most children exhibited limited growth on control
words and greater growth on taught sight words, letter sounds, and decodable words. As
displayed by the figure, there was notable variation of performance on these measures with some
children demonstrating more rapid growth than others. Ceiling effects are apparent among the
growth curves on taught sight words, with several children reading almost all of the words
correctly at the start of the intervention. Whereas most children displayed limited or no growth
on nonsense words, several children made gains. Reliabilities of these models ranged from .82 to
.99. Results from a test of homogeneity of growth parameters confirmed the statistically
significant variation in final status and growth rates depicted in Figure 1 and warranted the
exploration of predictors of this variation.

33
0
5.00
10.00
15.00
20.00
Wo
rd
s C
orre
ct
Control Words
-10.00 -7.50 -5.00 -2.50 0
Time
-10.00 -7.50 -5.00 -2.50 0
0
12.00
24.00
36.00
48.00
Time
Wo
rds
Co
rre
ct
Taught Sight Words
0
14.00
28.00
42.00
56.00
Le
tte
r S
ou
nd
s C
orre
ct
-10.00 -7.50 -5.00 -2.50 0
Time
Le tter Sounds
-10.00 -7.50 -5.00 -2.50 0
0
12.50
25.00
37.50
50.00
Time
Wo
rd
s C
orre
ct
De codable Words
-10.00 -7.50 -5.00 -2.50 0
0
12.50
25.00
37.50
50.00
Time
Wo
rd
s C
orre
ct
Nons e nse Words
Figure 1.
Estimated Individual Growth Curves for Ongoing-Assessment

34
Models conditional on individual predictors. Conditional models that included
individually entered level-2 predictors were estimated for the outcome measures. The purpose of
these models was to examine the contribution of child characteristics as predictors of reading
growth. Based on preliminary analyses, and the examination of the correlations between the
variables (see Table 6), a subset of variables was selected for use as predictors. These included
reading performance (word identification), phonological awareness (segmenting), verbal IQ
(residual verbal raw score from the KBIT after regressing out age), inattention (factor score from
the SWAN), prior phonics instruction (composite score from the parent survey and IEP goals),
and age at the start of intervention. Each variable was standardized (M=0, SD=1) such that
coefficients represented change in outcome associated with a 1 SD change in the predictor,
holding other variables in the model constant.
In the models for the four targeted outcome measures, the control word list was retained
as a time-varying covariate for two reasons. First, to control for the statistically significant
growth on this measure that was hypothesized to result from non-intervention related factors
(e.g., familiarity with the tutor, enhanced speech understanding, maturation, and other reading
instruction). Second, goodness-of-fit statistics indicated that the models with the covariate
provided a better fit than the models without it. Fit for each of these models was calculated by
comparing the reduction in the deviance score from the model conditional on the control word
list. The comparison model for the control word list was the unconditional model. The chi-square
test was used to determine if the addition of the level-2 predictors significantly improved model-
fit. Estimates of random and fixed effects and goodness-of-fit statistics for this series of fitted
models are displayed in Tables 7-11.

35
Table 6
Correlations among Pretreatment and Cognitive Assessments
1 2 3 4 5 6 7 8 9 10 11 12 13 14 15 16 17 18
1 Blendinga -
2 Segmenting*a .62 -
3 Word Identification*b .43 .55 -
4 Word Attackb .47 .50 .73 -
5 Fluency (1st-grade)c .23 .51 .91 .69 -
6 Fluency (Intervention Aligned)d .27 .49 .87 .72 .97 -
7 Verbal Raw Scoree .67 .55 .67 .48 .58 .54 -
8 Riddle Raw Scoree .63 .48 .59 .34 .46 .48 .84 -
9 Matrices Raw Scoree .37 .45 .57 .35 .55 .50 .60 .67 -
10 IQ Compositee .35 .62 .25 .30 .29 .30 .48 .49 .45 -
11 Verbal IQ (Age Adjusted)*ef .63 .58 .51 .51 .47 .47 .90 .71 .38 .65 -
12 Digit Recall Raw Scoreg .53 .47 .47 .48 .45 .47 .60 .53 .36 .54 .67 -
13 Digit Recall Spang .44 .49 .47 .52 .47 .48 .54 .45 .27 .52 .64 .94 -
14 Block Recall Raw Scoreg .22 .37 .65 .40 .68 .63 .66 .55 .65 .30 .49 .45 .51 -
15 Block Recall Spang .20 .42 .64 .44 .70 .65 .65 .51 .63 .32 .52 .50 .57 .97 -
16 Inattention*h .32 .41 .64 .42 .62 .58 .53 .51 .72 .28 .37 .28 .23 .69 .66 -
17 Prior Phonics Inst.*i .55 .60 .54 .25 .38 .36 .55 .47 .40 .29 .48 .34 .26 .42 .40 .58 -
18 Age*j .23 .05 .48 .05 .36 .29 .43 .46 .61 -.26 .00 .00 -.09 .49 .42 .47 .26 -
Note. n=24. * denotes measures used as predictors in growth models. a(D. Fuchs, Fuchs, Thompson, Al Otaiba, Yen, Yang, et. al., 2001) bWoodcock Johnson Reading Mastery Test - Revised (Woodcock, 1987). cComprehensive Reading Assessment Battery (CRAB; L.S. Fuchs, Fuchs, & Maxwell, 1988) d(Peer-Assisted Learning Strategies; D. Fuchs, Fuchs, Yen, Thompson, McMaster, et al., 2001; D. Fuchs, Fuchs,
Thompson, Al Otaiba, Yen, McMaster, et al., 2001). eKaufman Brief Intelligence Test, Second Edition (KBIT-2; Kaufman & Kaufman, 2004) fAdjusted for age by regressing out age at start of intervention. gWorking Memory Test Battery for Children (WMTB-C; Pickering & Gathercole, 2001) hComposite score from SWAN (J. Swanson et al., 2004) completed by tutors. iComposite score representing prior phonics
reading instruction based on parent report and Individualized Education Program goals. jAge in years at beginning of intervention. Correlations above .41 were significant at p<.05; above .52 at p<.01; above .64
at p<.001, two-tailed.

36
Table 7
Control Words
Parameter
Reliabilities Final status 0.85 0.85 0.85 0.85 0.83 0.85 0.85 Final status 0.85
Rate of
change0.53 0.53 0.54 0.53 0.49 0.54 0.54
Rate of
change0.53
Fixed Effects
Final Status, !0i Intercept "00 0.61 ** 0.61 ** 0.61 ** 0.61 ** 0.62 ** 0.62 ** 0.62 ** Intercept "00 0.61 **
(0.18) (0.18) (0.17) (0.18) (0.17) (0.17) (0.18) (0.18)
"01 0.00 -0.11 -0.03 0.27 -0.09 0.02
(0.13) (0.15) (0.10) (0.14) (0.19) (0.10)
Rate of Change, !1i Intercept "10 0.05 ** 0.05 ** 0.05 ** 0.05 ** 0.05 ** 0.05 ** 0.05 ** Intercept "10 0.05 **
(0.02) (0.02) (0.02) (0.02) (0.02) (0.02) (0.02) (0.02)
"11 0.00 0.00 0.00 0.03 * 0.00 0.01
(0.01) (0.01) (0.01) (0.01) (0.02) (0.01)
Variance Components
Level 2In final
status#20 0.65 *** 0.65 *** 0.64 *** 0.65 *** 0.58 *** 0.64 *** 0.65 *** 0.65 ***
In rate of
change #21 0.00 * 0.00 ** 0.00 ** 0.00 ** 0.00 * 0.00 ** 0.00 * 0.00 *
Level 1Within-
person#2$ 0.29 0.29 0.29 0.29 0.29 0.29 0.29 0.29
Goodness-of-Fit Statistics
Deviance 430.61 430.60 429.52 430.28 427.99 429.33 429.61 430.61
Number of Parameters
Estimated6 8 8 8 8 8 8 6
Chi-squareg 0.00 1.09 0.33 2.61 1.27 0.99
DF 2 2 2 2 2 2
p-value >.500 >.500 >.500 0.270 >.500 >.500
AIC 442.61 446.60 445.52 446.28 443.99 445.33 445.61 442.61
BIC 449.68 456.02 454.94 455.70 453.41 454.75 455.03 449.68
Proportion of Variance
Explained
In Final Status 0.0% 1.5% 0.0% 10.8% 1.1% 0.0%
In Rate of Change 0.0% -1.1% -0.2% 16.0% -2.0% -1.1%
Models Conditional on Individual Predictors
Word
IdentificationaBest-Fitting Model
Note. AIC=Akaike Information Criterion. BIC=Bayesian Information Criterion. aWoodcock Johnson Reading Mastery Test - Revised (Woodcock, 1987). b(D. Fuchs, Fuchs, Thompson, Al Otaiba, Yen, Yang, et. al., 2001) cVerbal raw score from the Kaufman Brief Intelligence Test,
Second Edition (KBIT-2; Kaufman & Kaufman, 2004) adjusted for age by regressing out age at start of intervention. dAge in years at beginning of intervention.gWorking Memory Test Battery for Children (WMTB-C; Pickering & Gathercole, 2001) eComposite score representing
prior phonics reading instruction based on parent report and Individualized Education Program goals. fComposite score from SWAN (J. Swanson et al., 2004) completed by tutors. gModel fit compared to unconditional model. p<.10. *p<.05. **p<.01. ***p<.001 (two-tailed).
Unconditional
Growth Model InattentionfSegmentingb Verbal IQc AgedPrior Phonics
Instructione

37
Table 8
Taught Sight Words
Parameter
Reliabilities Final status 0.99 0.99 0.91 0.99 0.99 0.99 0.99 0.99 0.82
Rate of
change0.86 0.84 0.82 0.83 0.84 0.84 0.83 0.84 0.82
Fixed Effects
Final Status, !0i Intercept "00 28.42 *** 28.18 *** 28.21 *** 28.17 *** 28.17 *** 28.23 *** 28.11 *** 28.20 *** "00 28.18 ***
(3.20) (3.17) (0.93) (2.61) (2.74) (2.72) (2.32) (2.35) (0.69)
"01 15.25 *** 9.17 ** 8.35 * 7.85 ** 11.19 *** 10.54 ***Word
Identificationa"01 13.54 ***
(0.86) (2.44) (3.43) (2.19) (1.48) (1.66) (0.72)
Prior Phonics
Instructione"02 3.17 ***
(0.64)
Rate of Change,
!1i
Intercept "10 0.92 *** 0.88 *** 0.88 *** 0.88 *** 0.88 *** 0.88 *** 0.87 *** 0.88 *** "10 0.88 ***
(0.12) (0.14) (0.13) (0.13) (0.13) (0.14) (0.13) (0.14) (0.13)
"11 -0.20 -0.10 -0.03 0.01 0.11 0.01Word
Identificationa"11 -0.20
(0.12) (0.11) (0.13) (0.10) (0.11) (0.10)Control Word
List, !1i
Intercept "20 0.96 -0.13 -0.08 -0.09 -0.16 0.09 -0.08 "20 -0.15
(0.78) (0.56) (0.56) (0.54) (0.60) (0.48) (0.55) (0.53)Control Word List
X Time, !1i
Intercept "30 -0.10 -0.09 -0.10 -0.11 -0.12 -0.07 -0.10 "30 -0.11
(0.12) (0.12) (0.12) (0.12) (0.13) (0.11) (0.12) (0.12)
Variance
Components
Level 2In final
status#20 243.73 *** 242.11 *** 19.12 *** 161.44 *** 174.97 *** 183.16 *** 122.97 *** 136.34 *** 8.24 ***
In rate of
change#21 0.28 *** 0.31 *** 0.27 *** 0.30 *** 0.31 *** 0.32 *** 0.29 *** 0.31 *** 0.28 ***
Level 1Within-
person#2$ 4.74 4.48 4.48 4.48 4.48 4.47 4.49 4.48 4.47
Goodness-of-Fit
Statistics
Deviance 1325.94 1202.82 1128.96 1192.91 1195.15 1196.00 1182.96 1188.65 1114.88
Number of
Parameters
Estimated
6 8 10 10 10 10 10 10 11
Chi-squareg 123.12 73.85 9.90 7.67 6.82 19.85 14.17 14.08
DF 2 2 2 2 2 2 2 1
p-value 0.000 0.000 0.007 0.021 0.032 0.000 0.001 0.000
AIC 1337.94 1218.82 1148.96 1212.91 1215.15 1216.00 1202.96 1208.65 1136.88
BIC 1345.01 1228.24 1160.74 1224.69 1226.93 1227.78 1214.74 1220.43 1149.84
Proportion of
Variance Explained
In Final Status 92.1% 33.3% 27.7% 24.3% 49.2% 43.7% 96.6%
In Rate of Change 12.9% 3.2% 0.0% -3.2% 6.5% 0.0% 9.7%
Models Conditional on Individual Predictors
Word
Identificationa Segmentingb Verbal IQc AgedPrior Phonics
Instructione InattentionfUnconditional
Growth Model
Model Conditional on
Control Word ListBest-Fitting Model
Note. AIC=Akaike Information Criterion. BIC=Bayesian Information Criterion. aWoodcock Johnson Reading Mastery Test - Revised (Woodcock, 1987). b(D. Fuchs, Fuchs, Thompson, Al Otaiba, Yen, Yang, et. al., 2001) cVerbal raw score from the Kaufman Brief Intelligence Test, Second Edition (KBIT-2;
Kaufman & Kaufman, 2004) adjusted for age by regressing out age at start of intervention. dAge in years at beginning of intervention.gWorking Memory Test Battery for Children (WMTB-C; Pickering & Gathercole, 2001) eComposite score representing prior phonics reading instruction based on parent report
and Individualized Education Program goals. fComposite score from SWAN (J. Swanson et al., 2004) completed by tutors. gModel fit compared to model conditional on control word list. Best fitting model compared to best-fitting single individual predictor model (Word identification). p<.10. *p<.05.
**p<.01. ***p<.001 (two-tailed).

38
Table 9
Letter Sounds
Param
eter
Reliabilities Final status 0.98 0.99 0.96 0.99 0.98 0.99 0.98 0.98 0.96
Rate of
change0.78 0.87 0.87 0.87 0.87 0.87 0.86 0.86 0.87
Fixed Effects
Final Status, !0i Intercept "00 37.94 *** 37.38 *** 37.31 *** 37.33 *** 37.32 *** 37.31 *** 37.29 *** 37.33 *** "00 37.31 ***
(3.01) (2.88) (1.39) (2.47) (2.37) (2.61) (2.21) (2.11) (1.40)
"01 12.79 *** 7.78 ** 8.33 * 6.00 ** 9.64 *** 9.88 ***Word
Identificationa"01 11.88 ***
(1.49) (2.30) (3.27) (1.63) (2.02) (2.09) (1.11)Rate of Change,
!1i
Intercept "10 2.08 *** 1.90 *** 1.90 *** 1.91 *** 1.90 *** 1.90 *** 1.90 *** 1.90 *** "10 1.9 ***
(0.15) (0.16) (0.16) (0.15) (0.16) (0.16) (0.15) (0.15) (0.16)
"11 0.14 -0.08 -0.05 0.08 0.25 0.24
(0.16) (0.17) (0.21) (0.18) (0.18) (0.16)Control Word
List, !1i
Intercept "20 0.36 0.35 0.31 0.37 0.34 0.40 0.35 "20 0.34
(0.53) (0.54) (0.50) (0.51) (0.57) (0.51) (0.54) (0.55)Control Word List
X Time, !1i
Intercept "30 0.05 0.06 0.04 0.05 0.05 0.06 0.05 "30 0.06
(0.11) (0.11) (0.10) (0.10) (0.11) (0.11) (0.11) (0.11)
Variance
Components
Level 2In final
status#20 213.49 *** 204.53 *** 47.90 *** 146.45 *** 138.31 *** 170.02 *** 115.66 *** 111.48 *** 48.74 ***
In rate of
change#21 0.40 *** 0.49 *** 0.47 *** 0.48 *** 0.49 *** 0.49 *** 0.43 *** 0.44 *** 0.49 ***
Level 1Within-
person#2$ 11.03 5.42 5.42 5.42 5.41 5.42 5.42 5.42 5.42
Goodness-of-Fit
Statistics
Deviance 1496.45 1237.93 1196.06 1223.36 1222.72 1233.20 1224.43 1223.55 1195.88
Number of
Parameters
Estimated
6 8 10 10 10 10 10 10 9
Chi-squareg 258.52 42.87 14.57 15.21 4.72 13.50 14.39 0.82
DF 2 2 2 2 2 2 2 1
p-value 0.000 0.000 0.001 0.001 0.092 0.002 0.001 >.500
AIC 1508.45 1253.93 1216.06 1243.36 1242.72 1253.20 1244.43 1243.55 1213.88
BIC 1515.52 1263.35 1227.84 1255.14 1254.50 1264.98 1256.21 1255.33 1224.48
Proportion of
Variance Explained
In Final Status 76.6% 28.4% 32.4% 16.9% 43.5% 45.5% 76.2%
In Rate of Change 4.1% 2.0% 0.0% 0.0% 12.2% 10.2% 0.0%
Prior Phonics
Instructione Inattentionf Best-Fitting Model
Note. AIC=Akaike Information Criterion. BIC=Bayesian Information Criterion. aWoodcock Johnson Reading Mastery Test - Revised (Woodcock, 1987). b(D. Fuchs, Fuchs, Thompson, Al Otaiba, Yen, Yang, et. al., 2001) cVerbal raw score from the Kaufman Brief Intelligence Test, Second
Edition (KBIT-2; Kaufman & Kaufman, 2004) adjusted for age by regressing out age at start of intervention. dAge in years at beginning of intervention.gWorking Memory Test Battery for Children (WMTB-C; Pickering & Gathercole, 2001) eComposite score representing prior phonics
reading instruction based on parent report and Individualized Education Program goals. fComposite score from SWAN (J. Swanson et al., 2004) completed by tutors. gModel fit compared to model conditional on control word list. Best fitting model compared to best-fitting single individual
predictor model (Word identification). p<.10. *p<.05. **p<.01. ***p<.001 (two-tailed).
Models Conditional on Individual Predictors
Unconditional
Growth Model
Model Conditional on
Control Word List
Word
Identificationa Segmentingb Verbal IQc Aged

39
Table 10
Decodable Words
Parameter
Reliabilities Final status 0.99 0.99 0.72 0.98 0.98 0.99 0.98 0.98 0.72
Rate of
change0.72 0.84 0.79 0.83 0.85 0.81 0.78 0.79 0.79
Fixed Effects
Final Status, !0i Intercept "00 19.59 *** 19.72 *** 20.10 *** 19.72 *** 19.70 *** 19.82 *** 19.68 *** 19.76 *** "00 20.1 ***
(3.54) (3.68) (0.76) (2.96) (3.15) (3.33) (3.03) (2.95) (0.76)
"01 17.82 *** 10.85 ** 9.52 * 8.30 ** 10.25 *** 11.20 ***Word
Identificationa"01 17.82 ***
(0.55) (2.75) (3.97) (2.42) (2.13) (1.93) (0.55)
Rate of Change,
!1i
Intercept "10 0.69 *** 0.75 ** 0.80 *** 0.75 ** 0.75 ** 0.77 *** 0.75 *** 0.76 *** "10 0.8 ***
(0.13) (0.19) (0.16) (0.19) (0.19) (0.18) (0.16) (0.17) (0.16)
"11 0.49 ** 0.26 -0.01 0.38 * 0.49 ** 0.49 *Word
Identificationa"11 0.49 **
(0.16) (0.14) (0.27) (0.17) (0.16) (0.19) (0.16)Control Word
List, !1i
Intercept "20 0.48 -0.10 0.50 0.53 0.31 0.62 0.46 "20 -0.10
(0.57) (0.35) (0.57) (0.58) (0.54) (0.59) (0.54) (0.35)Control Word List
X Time, !1i
Intercept "30 0.03 -0.05 0.03 0.04 0.00 0.05 0.02 "30 -0.05
(0.12) (0.11) (0.12) (0.12) (0.13) (0.12) (0.12) (0.11)
Variance
Components
Level 2In final
status#20 296.39 *** 315.86 *** 9.43 *** 203.03 *** 229.58 *** 248.28 *** 215.24 *** 196.38 *** 9.43 ***
In rate of
change#21 0.30 *** 0.68 *** 0.46 *** 0.62 *** 0.68 *** 0.54 *** 0.45 *** 0.46 *** 0.46 ***
Level 1Within-
person#2$ 11.05 8.76 8.79 8.76 8.76 8.76 8.76 8.74 8.79
Goodness-of-Fit
Statistics
Deviance 1481.19 1320.43 1243.72 1309.73 1307.15 1313.89 1308.91 1307.35 1243.72
Number of
Parameters
Estimated
6 8 10 10 10 10 10 10 10
Chi-squareg 160.75 76.72 10.71 13.28 6.54 11.53 13.09 76.72
DF 2 2 2 2 2 2 2 2
p-value 0.000 0.000 0.005 0.002 0.037 0.004 0.002 0
AIC 1493.19 1336.43 1263.72 1329.73 1327.15 1333.89 1328.91 1327.35 1263.72
BIC 1500.26 1345.85 1275.50 1341.51 1338.93 1345.67 1340.69 1339.13 1275.50054
Proportion of
Variance Explained
In Final Status 97.0% 35.7% 27.3% 21.4% 31.9% 37.8% 97.0%
In Rate of Change 32.4% 8.8% 0.0% 20.6% 33.8% 32.4% 32.4%
Inattentionf
Note. AIC=Akaike Information Criterion. BIC=Bayesian Information Criterion. aWoodcock Johnson Reading Mastery Test - Revised (Woodcock, 1987). b(D. Fuchs, Fuchs, Thompson, Al Otaiba, Yen, Yang, et. al., 2001) cVerbal raw score from the Kaufman Brief Intelligence Test, Second Edition (KBIT-2; Kaufman &
Kaufman, 2004) adjusted for age by regressing out age at start of intervention. dAge in years at beginning of intervention.gWorking Memory Test Battery for Children (WMTB-C; Pickering & Gathercole, 2001) eComposite score representing prior phonics reading instruction based on parent report and Individualized
Education Program goals. fComposite score from SWAN (J. Swanson et al., 2004) completed by tutors. gModel fit compared to model conditional on control word list. Best fitting model is individual predictor model with Word Identification. p<.10. *p<.05. **p<.01. ***p<.001 (two-tailed).
Best-Fitting Model
Models Conditional on Individual Predictors
Unconditional
Growth Model
Model Conditional on
Control Word List
Word
Identificationa Segmentingb Verbal IQc AgedPrior Phonics
Instructione
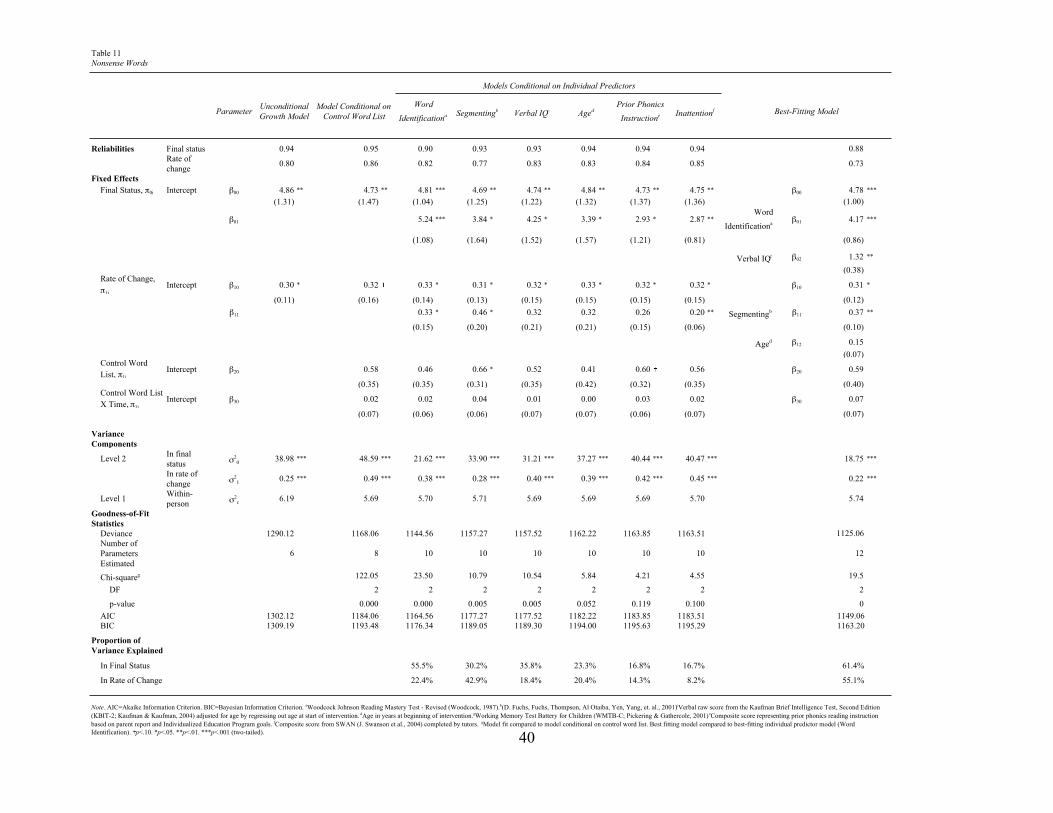
40
Table 11
Nonsense Words
Parameter
Reliabilities Final status 0.94 0.95 0.90 0.93 0.93 0.94 0.94 0.94 0.88
Rate of
change0.80 0.86 0.82 0.77 0.83 0.83 0.84 0.85 0.73
Fixed Effects
Final Status, !0i Intercept "00 4.86 ** 4.73 ** 4.81 *** 4.69 ** 4.74 ** 4.84 ** 4.73 ** 4.75 ** "00 4.78 ***
(1.31) (1.47) (1.04) (1.25) (1.22) (1.32) (1.37) (1.36) (1.00)
"01 5.24 *** 3.84 * 4.25 * 3.39 * 2.93 * 2.87 **Word
Identificationa"01 4.17 ***
(1.08) (1.64) (1.52) (1.57) (1.21) (0.81) (0.86)
Verbal IQc "02 1.32 **
(0.38)Rate of Change,
!1i
Intercept "10 0.30 * 0.32 0.33 * 0.31 * 0.32 * 0.33 * 0.32 * 0.32 * "10 0.31 *
(0.11) (0.16) (0.14) (0.13) (0.15) (0.15) (0.15) (0.15) (0.12)
"11 0.33 * 0.46 * 0.32 0.32 0.26 0.20 ** Segmentingb "11 0.37 **
(0.15) (0.20) (0.21) (0.21) (0.15) (0.06) (0.10)
Aged "12 0.15
(0.07)Control Word
List, !1i
Intercept "20 0.58 0.46 0.66 * 0.52 0.41 0.60 0.56 "20 0.59
(0.35) (0.35) (0.31) (0.35) (0.42) (0.32) (0.35) (0.40)Control Word List
X Time, !1i
Intercept "30 0.02 0.02 0.04 0.01 0.00 0.03 0.02 "30 0.07
(0.07) (0.06) (0.06) (0.07) (0.07) (0.06) (0.07) (0.07)
Variance
Components
Level 2In final
status#20 38.98 *** 48.59 *** 21.62 *** 33.90 *** 31.21 *** 37.27 *** 40.44 *** 40.47 *** 18.75 ***
In rate of
change#21 0.25 *** 0.49 *** 0.38 *** 0.28 *** 0.40 *** 0.39 *** 0.42 *** 0.45 *** 0.22 ***
Level 1Within-
person#2$ 6.19 5.69 5.70 5.71 5.69 5.69 5.69 5.70 5.74
Goodness-of-Fit
Statistics
Deviance 1290.12 1168.06 1144.56 1157.27 1157.52 1162.22 1163.85 1163.51 1125.06
Number of
Parameters
Estimated
6 8 10 10 10 10 10 10 12
Chi-squareg 122.05 23.50 10.79 10.54 5.84 4.21 4.55 19.5
DF 2 2 2 2 2 2 2 2
p-value 0.000 0.000 0.005 0.005 0.052 0.119 0.100 0
AIC 1302.12 1184.06 1164.56 1177.27 1177.52 1182.22 1183.85 1183.51 1149.06
BIC 1309.19 1193.48 1176.34 1189.05 1189.30 1194.00 1195.63 1195.29 1163.20
Proportion of
Variance Explained
In Final Status 55.5% 30.2% 35.8% 23.3% 16.8% 16.7% 61.4%
In Rate of Change 22.4% 42.9% 18.4% 20.4% 14.3% 8.2% 55.1%
Best-Fitting Model
Note. AIC=Akaike Information Criterion. BIC=Bayesian Information Criterion. aWoodcock Johnson Reading Mastery Test - Revised (Woodcock, 1987). b(D. Fuchs, Fuchs, Thompson, Al Otaiba, Yen, Yang, et. al., 2001) cVerbal raw score from the Kaufman Brief Intelligence Test, Second Edition
(KBIT-2; Kaufman & Kaufman, 2004) adjusted for age by regressing out age at start of intervention. dAge in years at beginning of intervention.gWorking Memory Test Battery for Children (WMTB-C; Pickering & Gathercole, 2001) eComposite score representing prior phonics reading instruction
based on parent report and Individualized Education Program goals. fComposite score from SWAN (J. Swanson et al., 2004) completed by tutors. gModel fit compared to model conditional on control word list. Best fitting model compared to best-fitting individual predictor model (Word
Identification). p<.10. *p<.05. **p<.01. ***p<.001 (two-tailed).
Models Conditional on Individual Predictors
Unconditional
Growth Model
Model Conditional on
Control Word List
Word
Identificationa Segmentingb Verbal IQc AgedPrior Phonics
Instructione Inattentionf
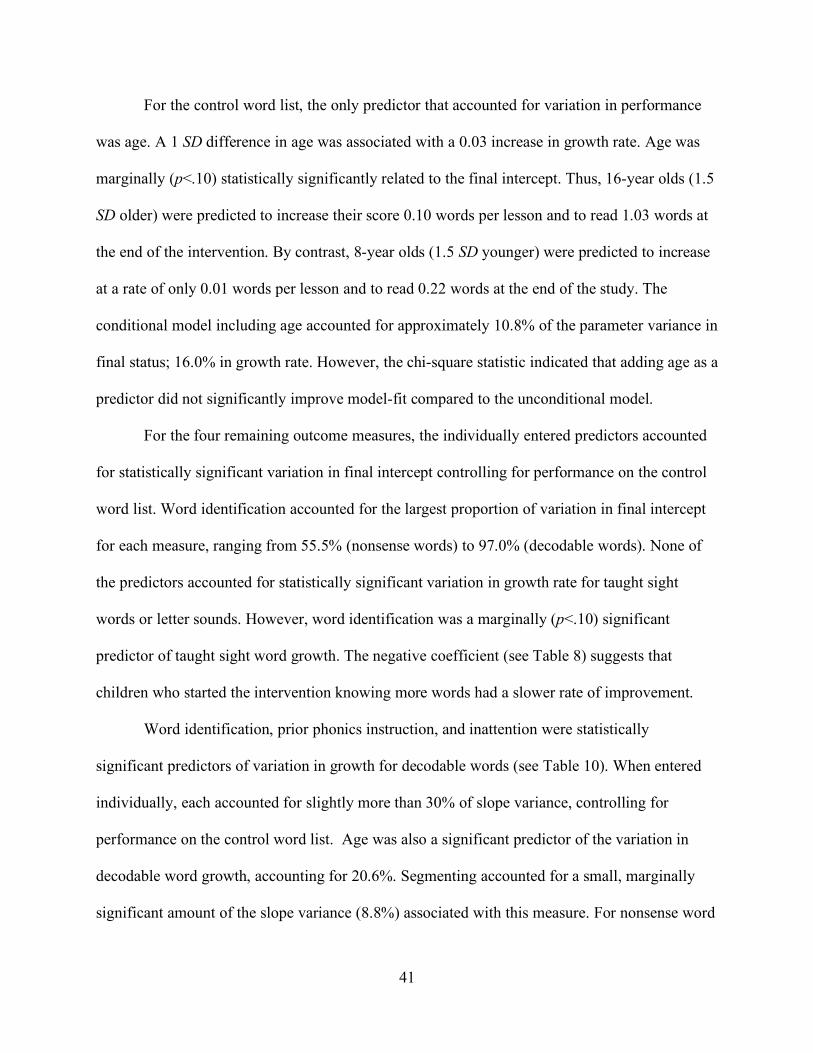
41
For the control word list, the only predictor that accounted for variation in performance
was age. A 1 SD difference in age was associated with a 0.03 increase in growth rate. Age was
marginally (p<.10) statistically significantly related to the final intercept. Thus, 16-year olds (1.5
SD older) were predicted to increase their score 0.10 words per lesson and to read 1.03 words at
the end of the intervention. By contrast, 8-year olds (1.5 SD younger) were predicted to increase
at a rate of only 0.01 words per lesson and to read 0.22 words at the end of the study. The
conditional model including age accounted for approximately 10.8% of the parameter variance in
final status; 16.0% in growth rate. However, the chi-square statistic indicated that adding age as a
predictor did not significantly improve model-fit compared to the unconditional model.
For the four remaining outcome measures, the individually entered predictors accounted
for statistically significant variation in final intercept controlling for performance on the control
word list. Word identification accounted for the largest proportion of variation in final intercept
for each measure, ranging from 55.5% (nonsense words) to 97.0% (decodable words). None of
the predictors accounted for statistically significant variation in growth rate for taught sight
words or letter sounds. However, word identification was a marginally (p<.10) significant
predictor of taught sight word growth. The negative coefficient (see Table 8) suggests that
children who started the intervention knowing more words had a slower rate of improvement.
Word identification, prior phonics instruction, and inattention were statistically
significant predictors of variation in growth for decodable words (see Table 10). When entered
individually, each accounted for slightly more than 30% of slope variance, controlling for
performance on the control word list. Age was also a significant predictor of the variation in
decodable word growth, accounting for 20.6%. Segmenting accounted for a small, marginally
significant amount of the slope variance (8.8%) associated with this measure. For nonsense word

42
reading, significant predictors of slope were word identification, segmenting, and inattention;
segmenting accounted for the largest proportion (42.9%).
Best-fitting models. Finally, statistically significant predictors were combined in pairs to
develop the model that accounted for the greatest variation in slope and intercept for each
outcome measure. Due to the small sample size and the moderate-to-high correlations between
predictors, no more than two predictors of each parameter were added at a time. These
limitations warrant caution in the interpretation of the final models, which is offered below. The
best-fitting model for each measure was the most parsimonious model for which the chi-square
test indicated a statistically significantly reduced deviance score compared to other examined
models. Parameter estimates from these models are presented in the right-hand columns of
Tables 7-11.
The best-fitting model for performance on the control word list was the unconditional
growth model. And, although age was a statistically significant predictor of slope, adding age did
not result in a statistically significantly reduced deviance statistic (See Table 7). The best-fitting
model of taught sight word reading included word identification and prior phonics instruction as
statistically significant predictors of final status. Word identification was a marginally
statistically significant predictor of slope (p<.10). The final model indicated that a child who
started the intervention 1 SD above average on word identification or prior phonics instruction
was predicted to have an increased outcome of 13.54 and 3.17 taught sight words, respectively.
Also, the negative coefficient for word identification on the slope parameter indicated
that children who started the intervention knowing more words had a slower rate of improvement
(See Table 8). For example, a child who entered the study with a word identification score of 40
and a prior-phonics instruction composite score of 6 (i.e., they had received reading instruction

43
in letter sounds, phonological awareness, decoding, fluency, vocabulary, and reading
comprehension) was predicted to have a growth rate of 0.68 words per lesson and to complete
the study knowing 44.89 taught sight words. By contrast, a child entering the study with a word
identification score of 4 and a prior-phonics instruction composite score of 2 was predicted to
improve at a rate of only 1.08 taught sight words per week and to complete the study knowing
only 11.47 taught sight words. The combined-predictor model accounted for 96.6% of the
variation of final intercept; 9.7% in slope.
The best-fitting model of letter sounds included word identification as a statistically
significant predictor of final status (See Table 9). On average, children increased the number of
letter sounds they could identify at a rate of 1.9 sounds per lesson and they could identify 37.31
letter sounds at the end of the intervention, controlling for performance on the control word list.
A 1 SD increase in word identification was associated with a 11.88 letter sound increase in final
status. The final model accounted for 76.2% of variation in final status; 0.0% in growth rate.
The conditional model including word identification as a predictor of slope and intercept
was the best-fitting model of decodable word reading (See Table 10). On average, children
increased their decodable word reading by 0.80 words per lesson and were able to read 20.10
decodable words at the end of the intervention, controlling for performance on the control word
list. A 1 SD increase in word identification was associated with a 17.82 decodable word increase
in final status and a 0.49 increase in growth rate. This model accounted for 97.0% of the
variation in final status and 32.4% in slope.
The best-fitting model of nonsense word reading included word identification and verbal
IQ as significant predictors of final status and segmenting as a significant predictor of slope.
Additionally, age was included as a marginally significant predictor of slope (See Table 11).
44
Controlling for performance on the control word list, a 1 SD increase in word identification and
verbal IQ was associated with an increase in final status of 4.17 and 1.32 nonsense words,
respectively. A 1 SD increase in segmenting was associated with a 0.37 increase in nonsense
word growth. The marginally significant association (p<.10) between age and slope indicated
that a 1 SD increase in age was related to a 0.15 increase in nonsense word growth. The
combined-predictor model accounted for 61.4% of the students’ final status and 55.1% of their
growth.
Evaluation of individual responsiveness. As an additional evaluation of the effectiveness
of the intervention, model-based or empirical Bayes estimates of growth on each measure for
each child were derived. These estimates combine each individual’s set of residuals (i.e., level-1
and level-2) with fitted values from the best-fitting model to provide more precise estimates of
individual growth trajectories (see Singer & Willett, 2003, p. 132). Following the method
proposed by Stage (2001), growth on each measure was considered significant if it was greater
than a critical slope value equal to twice the standard error. Students whose slope estimates did
not exceed this critical value were considered nonresponsive to the phonics-based instruction.
Results from this analysis are displayed in Table 12. For each measure, students deemed
nonresponsive are indicated with an asterisk. As can be seen, most children demonstrated growth
that was reliably greater than zero in taught sight words and letter sounds. The two children
(Students 6 and 15) designated as nonresponsive to taught sight word instruction were
performing at ceiling on this measure prior to the intervention. Greater numbers of
nonresponders were indicated for the measures of decodable and nonsense words (n=9 and 15,
respectively).

45
Table 12
Child
1 0.99 2.44 3.20 0.57 0.09
2 0.43 2.14 2.18 0.56 0.02 *
3 1.42 1.35 1.70 0.51 0.11
4 1.69 2.06 1.18 0.65 0.07
5 0.37 1.81 1.05 0.91 0.00 *
6 0.28 * 2.50 0.94 0.46 0.00 *
7 1.35 0.84 0.88 0.76 0.06
8 0.33 2.39 0.84 1.00 0.01 *
9 0.34 0.72 0.68 2.80 0.03 *
10 0.50 2.56 1.51 -0.13 * 0.00 *
11 0.42 2.72 1.37 -0.19 * 0.12
12 0.93 2.15 0.97 -0.28 * 0.29
13 2.07 2.06 0.74 -0.29 * 0.08
14 1.46 1.45 0.72 -0.03 * 0.07
15 0.20 * 1.71 0.59 0.13 * 0.01 *
16 1.37 2.51 0.38 * 0.03 * 0.00 *
17 0.79 2.51 0.23 * 0.09 * 0.07
18 1.22 2.08 0.12 * -0.12 * 0.02 *
19 0.96 2.40 0.03 * 0.16 * 0.00 *
20 0.68 0.96 0.02 * 0.07 * 0.00 *
21 0.39 1.73 0.00 * -0.13 * 0.01 *
22 0.42 1.98 -0.03 * -0.02 * 0.00 *
23 1.52 2.33 -0.05 * -0.03 * 0.02 *
24 0.89 0.21 * 0.04 * 0.07 * 0.06
M 0.88 1.90 0.75 0.32 0.05
SE 0.14 0.16 0.19 0.16 0.02
Critical
slope
value 0.28 0.32 0.38 0.32 0.04
Nonresponders
n 2 1 9 15 14
(%) (8.33%) (4.17%) (37.50%) (62.50%) (58.33%)
Model-based (Empirical Bayes) Estimates of Slope and Evaluation of
Nonresponsiveness
Note. * designates children deemed nonresponsive due to a slope estimate less than twice the
SE.
Taught
sight
Control
words
Nonsense
words
Decodable
words
Letter
sounds

46
There appears to be a relationship between response across the measures of letter sounds,
decodable words, and nonsense words. The child who was nonresponsive on letter sounds (Child
24) also demonstrated limited growth on decodable and nonsense words. Similarly, children who
did not exhibit growth on decodable words (Children 16 – 23) did not improve on nonsense
words. The children who made gains in nonsense word reading (Children 1 – 9) also
demonstrated improvements on letter sounds and decodable words. Thus, it appears that
nonsense word reading develops only after children demonstrate some success in decoding and
that decoding relies upon letter sound knowledge. All children demonstrated significant
improvements in one or more targeted skills. Finally, the significance of growth on the control
word measures does not appear to be systematically related to growth on the other measures.
Speech Analysis
In an additional attempt to explore whether students’ observed growth on the outcome
measures was due to instruction, an analysis was conducted of the influence of the students’
speech articulation on assessment scores. The purpose here was to determine whether ongoing
interactions between the tutor and child biased the tutor’s scoring because of the tutor’s
improved ability to understand the child’s speech. Put differently, the positive growth observed
on the various reading measures may have reflected growing tutor familiarity with students’
speech patterns and their familiarity may have caused tutors to count more items correct during
the course of the intervention.
For this analysis, the project director and tutors designated children as having a low
(n=12), moderate (n=7), or high (n=5) level of speech impairment based on taped lessons and
interactions with the child. Two time-points were randomly selected for each child. Two tutors

47
blindly double-scored from audiotape the outcome measures administered at each of these time-
points for each child. The tutors first listened to the taped lesson and made notes about the
child’s pronunciation of words and sounds (e.g., produces the /j/ sound like /zh/). Next, they
scored each measure. Items were excluded from the analysis if a child’s response was judged
unscoreable. Item-by-item reliability scores were calculated comparing the scoring of the
original and double-scored measures. If more than 10% of any measure could not be scored, the
tutor attempted to score another measure of the same child from a different randomly selected
time-point. This resulted in two of each of the outcome measures being double-scored for 21 of
the children. Due to poor tape quality, inter-rater reliability was calculated on only one measure
of letter sounds for 3 children and on one measure of control words for 1 child. It was
hypothesized that if increased exposure to the child influenced scoring, this should affect only
the tutor’s scoring, thereby decreasing the inter-rater reliability between the presumably biased
tutor and the non-biased double-scorer.
Means and standard deviations of reliability scores for each group of children are
presented in Table 13. Average inter-rater reliability scores ranged from 87.40% to 98.33% on
the measures. Regression analyses were conducted in which dummy codes representing the
speech impairment groups and the interaction of these variables with time were regressed onto
the inter-rater reliability scores for each measure. The low-speech impairment group was
designated as the comparison group, thus the corresponding dummy variable and interaction with
time for this group were not included in the model. This set of analyses allowed for an
exploration of whether the reliabilities for each measure differed between the groups and
whether the scores changed reliably over time. Results are presented in Table 14. The main
effects of time and group and the interactions between the two were not statistically significant
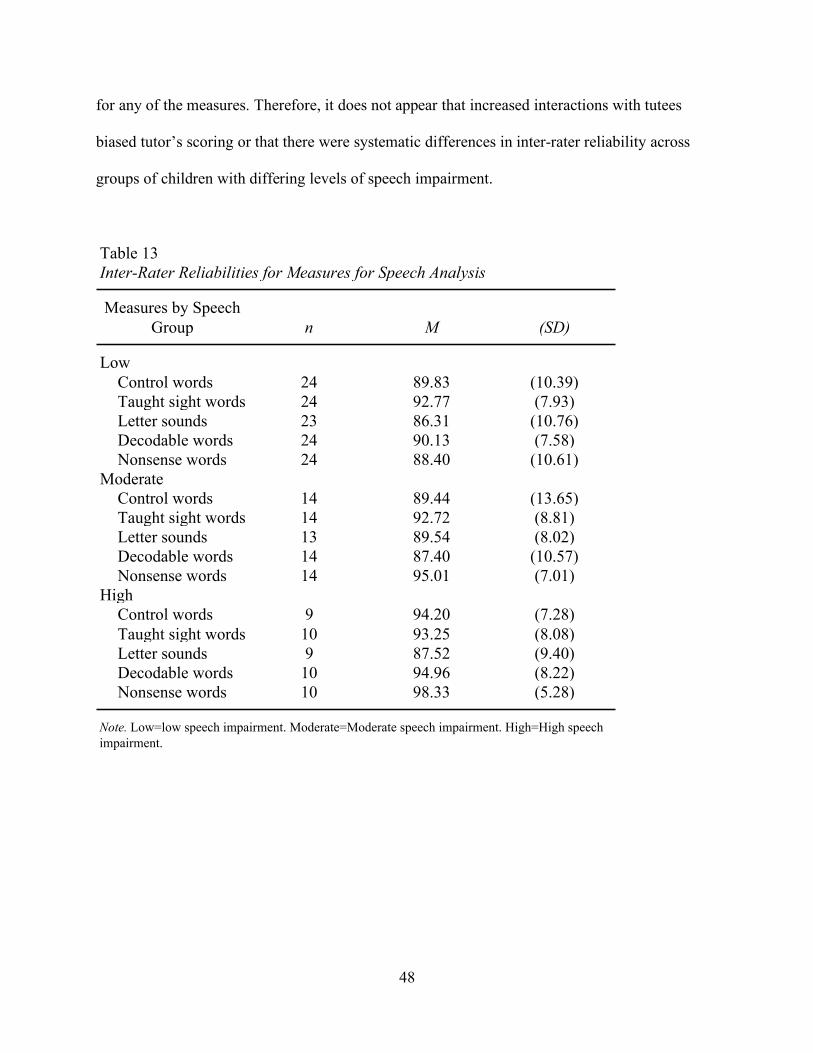
48
for any of the measures. Therefore, it does not appear that increased interactions with tutees
biased tutor’s scoring or that there were systematic differences in inter-rater reliability across
groups of children with differing levels of speech impairment.
Table 13
Inter-Rater Reliabilities for Measures for Speech Analysis
Measures by Speech
Group n M (SD)
Low
Control words 24 89.83 (10.39)
Taught sight words 24 92.77 (7.93)
Letter sounds 23 86.31 (10.76)
Decodable words 24 90.13 (7.58)
Nonsense words 24 88.40 (10.61)
Moderate
Control words 14 89.44 (13.65)
Taught sight words 14 92.72 (8.81)
Letter sounds 13 89.54 (8.02)
Decodable words 14 87.40 (10.57)
Nonsense words 14 95.01 (7.01)
High
Control words 9 94.20 (7.28)
Taught sight words 10 93.25 (8.08)
Letter sounds 9 87.52 (9.40)
Decodable words 10 94.96 (8.22)
Nonsense words 10 98.33 (5.28)
Note. Low=low speech impairment. Moderate=Moderate speech impairment. High=High speech
impairment.

49
Table 14
SE df F p
Control words
Intercept 96.19 *** 5.04 (5, 41) 1.09 0.38
Time -1.16 0.82
Moderate 0.52 7.76
High -5.46 9.64
Moderate X Time -0.36 1.35
High X Time 1.80 1.59
Taugh sight words (5, 42) 0.53 0.75
Intercept 94.69 *** 3.83
Time -0.35 0.63
Moderate 2.54 5.90
High 4.08 7.24
Moderate X Time -0.59 1.03
High X Time -0.67 1.20
Letter sounds (5, 39) 1.56 0.20
Intercept 87.55 *** 4.37
Time -0.23 0.72
Moderate 11.42 6.84
High 9.99 8.33
Moderate X Time -1.88 1.26
High X Time -1.61 1.38
Decodable words (5, 42) 1.62 0.18
Intercept 86.24 *** 4.00
Time 0.71 0.65
Moderate 5.68 6.15
High 2.42 7.55
Moderate X Time -1.65 1.07
High X Time 0.46 1.26
Nonsense words (5, 42) 2.27 0.07
Intercept 90.71 *** 4.17
Time -0.42 0.68
Moderate 6.83 6.42
High 4.26 7.88
Moderate X Time -0.11 1.12
High X Time 1.04 1.31
Coefficient
Note. Low=low speech impairment. Moderate=Moderate speech impairment. High=High speech
impairment.
Regression Analysis of Inter-Rater Reliability with Low Speech Impairment
Group as Comparison

50
CHAPTER IV
DISCUSSION
Phonics-based instruction is currently seen as the best method to teach a majority of
children how to read. However, it is unclear whether such instruction should be considered a
“best practice” for children with DS. The purpose of this study was to explore whether phonics-
based instruction accelerates the acquisition of early reading skills among children with DS, and
whether child characteristics may be identified that predict differential responsiveness to it.
Effectiveness of Phonics-Based Intervention
Fidelity and program completion. Tutors implemented the intervention with a high
degree of treatment fidelity and no child withdrew from the study. On average, tutors correctly
performed 97.64% of required components included on a fidelity checklist. The few tutors who
scored below 95% on this checklist met and maintained the 95% criterion after only one
retraining session. These findings indicate that implementation of a phonics-based intervention is
feasible for children with DS. In other words, contrary to what some might expect, tutors
accurately delivered instruction to children with DS and the children actively participated in the
program.
Reading growth. To determine whether phonics instruction may be considered a “best-
practice” for children with DS, their growth on outcome measures was examined while
controlling for their improvement in non-taught, non-decodable word reading. On average,
children with DS demonstrated statistically significant growth on taught sight words, letter

51
sounds, and decodable words. For nonsense words, the growth rate was statistically significant
only after conditional predictor variables were added to the model, indicating a high amount of
between-child variability. Overall, these findings support the idea that children with DS can learn
early reading skills and that phonics instruction may be an effective method of instruction. These
results are similar to those of Goetz and colleagues (2008) who found that many children with
DS demonstrated gains in early reading skills (i.e., letter-sound knowledge and early word
recognition) as a function of their participation in a phonics-based intervention. These generally
positive results notwithstanding, some children in the present study did not benefit from the
instruction.
Pattern of response. Model-based estimates of individual growth (Table 12) were
examined to determine which students did and did not demonstrate growth. These estimates
suggest that the phonics-based intervention was most effective at improving taught sight word
reading and letter sound knowledge. Only 2 children—both of whom entered the study reading a
majority of taught sight words—exhibited no growth on this measure. Only one child showed no
growth on letter sounds. Findings also suggest that 15 children improved their reading of
decodable words; and 9 children improved their reading of nonsense words.
The data in Table 12 also indicate an interesting pattern in reading growth across the
measures. Namely, children demonstrated gains in nonword reading only if they also made
improvements in decodable word reading. Similarly, children gained in decodable word reading
only if they made growth in letter sound knowledge. This pattern appears to support the findings
of Byrne and Fielding-Barnsley (1989) who suggested that typically developing children are able
to read nonwords only after they have a firm understanding of the alphabetic principle. As
explained by Byrne and Fielding-Barnsley, this understanding includes knowing that: (a)

52
phonemes represent distinct parts of words; (b) these parts occur in a variety of words (i.e.,
phonemic invariance); and (c) letters are used to represent these phonemes. Hohn and Ehri
(1983) have indicated that teaching letter sounds may lead to improvements in children’s
phonological awareness. However, Caroll’s (2004) results indicate that improvement in letter
knowledge contributes to the first component of the alphabetic principle (i.e., the ability to
segment phonemes), but not to the second component (i.e., phoneme invariance).
Results from this study suggest that learning to read taught decodable words may be key
to establishing phoneme invariance and developing a fuller understanding of the connections
between letters and the units of sound they represent. Further, the pattern of performance across
measures, depicted in Table 12, suggests that many children with DS are likely learn to read in a
similar way to their typically developing peers—albeit at a delayed rate. Roch and Jarrold (2008)
have suggested a similar pattern of development for nonword reading; one that is not atypical,
but simply delayed. Therefore, currently mandated “best practice” reading instruction is likely to
prove effective for many children with DS, although it may take more intensive doses of it to
accelerate their reading performance. That said, it is also clear that many children with DS may
not benefit from phonics-based instruction, which is why we need to understand these children’s
differential responsiveness to phonics instruction—or who seems to benefit and who does not?
Predictors of Responsiveness
We did not find a consistent set of predictors of growth across outcome measures.
Instead, we found that different predictors were associated with growth on different measures.
For taught sight words, word identification skill was negatively associated with growth, perhaps
because of a ceiling effect on the taught sight word measure. Alternatively, children who started

53
the intervention knowing more words may have made less growth because the taught sight words
they were learning were more difficult. This reflects the fact that children with higher levels of
pretreatment reading performance started the intervention in more advanced instructional lessons
(i.e., lessons including more challenging letter combinations and words) than children with lower
levels of pretreatment performance. None of the predictors were associated with letter sound
growth. This reflects the overall positive growth on this measure across children. In other words,
there were no predictors of differential growth because almost all demonstrated similar positive
gains.
Decodable word growth was predicted by word identification, age, prior phonics
instruction, and inattention. Word identification was the best predictor, accounting for 32.4%.
Children who entered the intervention knowing more words improved their decoding at a faster
rate than those knowing fewer words. Arguably, children with greater reading skill were more
capable of learning the decodable words by making connections with prior learning. This is
important because it suggests children may benefit more from phonics instruction after they have
demonstrated learning from sight word instruction. This interpretation is consonant with the
suggestion made by Buckley, Bird, and Byrne (1996) that decoding instruction may be most
effective for children with DS only after they have learned a number of sight words.
Nonsense word growth was most accurately predicted by a child’s pretreatment
performance on phoneme segmentation. When entered separately into the model, this predictor
accounted for 42.9% of the variation in growth. Further, as indicated by the final model, children
who started the study 1 SD above the group on segmenting performance had a rate of growth
0.37 nonwords per week higher than a child performing at the mean. This lends additional

54
support to the idea that, among children with DS, phonological awareness plays a role in learning
to read.
It is also consistent with results reported by Kay-Raining Bird and colleagues (2000) who
found that phoneme segmentation was moderately and statistically significantly correlated with
word attack measured 4.5 years later for a sample of children with DS after controlling for
chronological age and mental age. Other researchers have also demonstrated statistically
significant relationships for children and young adults with DS between nonword reading and
measures of phonemic awareness (Cupples & Iacono, 2000; Fowler, Doherty, & Boynton, 1995;
Roch & Jarrold, 2008; Snowling, Hulme, & Mercer, 2002). Taken together, current and prior
evidence does not support the notion that children with DS develop reading skill in the absence
of phonological awareness as proposed by Cossu and colleagues (Cossu et al., 1993) and others.
Implications for Practice
Results from this study clearly support the idea that children with DS can benefit from an
intensive, phonics-based reading intervention. Apparently, at least for a portion of these children,
“evidence-based” practice may prove effective and practitioners should not shy away from
providing this type of reading instruction to a child solely because she or he is a child with DS. It
is also clear, however, that not all children with DS will benefit from this instruction, at least
initially.
Children who knew more words at the start of instruction were more likely to show
greatest improvement in decoding; children with stronger phonological awareness skills at the
start of the study were more likely to show growth in nonword reading. In other words, children
who met eligibility criteria, but who knew few words and were unable to segment words, did less

55
well on measures addressing the more advanced skills of decoding and reading of nonwords.
These children probably lacked prerequisite skills and may have been better served if the
intervention had been more individually targeted to their current levels of functioning; if it had
more strongly addressed letter sounds and phonological awareness.
The limited growth of the few children with DS on decodable words and nonsense words
may also have been due to the way the instruction was implemented; that is children were
advanced through lessons regardless of performance. Practitioners should consider which skills
should be addressed and how much time should be directed to these skills by considering the
instructional needs of individual children. This may be particularly important when planning
instruction for our most academically vulnerable children. Connor and colleagues (Connor,
Morrison, Fishman, Schatschneider, & Underwood, 2007; Connor, Morrison, & Petrella, 2004)
have shown that this more individualized instruction may result in greater gains for a wider
number of children than instruction that is not individualized.
Limitations
This study has at least several important limitations. First, it did not include a control
group. The use of a control word list as a time-varying covariate was an attempt to reduce the
influence of extraneous factors (e.g., maturation, improved speech understanding by the tutor,
and other non-intervention reading instruction) and to increase the confidence that could be
placed in the estimates of growth on the reading outcome measures. Whereas it is believed this
control word list has value, it is not a substitute for a traditional control group. Second, the
study’s inclusion criteria limited participation to a group of children with DS who appeared
ready for reading instruction. Students were deemed “ready” if they demonstrated a low level of

56
initial reading skill (i.e., could read one word or identify one letter sound) and appeared likely to
successfully participate in the instruction (i.e., minimal behavior problems, vision and hearing
that did not require modifications). Thus, findings are generalizable only to children with DS
who have similar characteristics to the children included in the study sample.
Third, due to limited resources, one-on-one instruction was provided for only 30 hours.
This amount of instruction exceeded that provided to children with DS in several previous
studies (Cupples & Iacono, 2002; Kennedy & Flynn, 2003; van Bysterveldt et al., 2006) and less
than that provided by Goetz and colleagues (2008) to half of their sample of children with DS. In
all of these studies, however, the brief duration likely limited the growth that could be expected
on targeted skills. In the current study, this is especially likely for the near-transfer measure of
nonsense word reading. Thus, students in the current study deemed nonresponsive may simply
have needed a longer period of intervention to demonstrate adequate growth, a suggestion
supported by response patterns across the measures and shown in Table 12.
Fourth, small sample size and strong intercorrelations between predictors decreased the
likelihood of detecting reliable relationships among predictors and outcomes measures,
especially when more than one predictor was included in a model. The predictors included in the
final models may be accounting for some of the variance due to predictors not included. Thus,
caution is advised in interpreting these predictors as strictly accounting for the skills they were
operationalized to represent. It should be noted that, although this sample size (n=24) is small for
intervention studies involving non-disabled children, or children with high-incidence disabilities
(e.g., learning disabilities), it represents the largest sample of children with DS in a published
reading intervention study.

57
And there is good reason why intervention studies involving children with DS have
samples of only modest size. First, there are many fewer children with DS compared to non-
disabled children or children with learning disabilities. Second, children with DS are often
included in a variety of instructional programs within a school district, thereby decreasing the
likelihood that more than one or two participating children will be located at the same location.
Third, children with DS are a heterogeneous group and they exhibit a wide-range of academic
skills that often are coupled with difficult behavior and speech, hearing, and vision difficulties.
In other words, it’s difficult to find an adequately large sample of children with DS who are
likely to benefit from the same academic intervention who are also in reasonable physical
proximity to one another.
Future Work
While the current study offers support for including explicit, phonics-based instruction
into the curriculum for children with DS, it is clear that much work is needed. Additional studies
involving larger numbers of participants are necessary. This type of work will increase the
statistical power needed to examine the influences of multiple child characteristics as predictors
of growth. Also, it will permit evaluations of causal claims regarding the effectiveness of
interventions by allowing random assignment of children to control conditions. One means of
accomplishing this would be to design interventions that are more likely to benefit a wider
spectrum of children. For example, the intervention included in the current study would likely
have been ineffective for children who did not meet eligibility requirements (e.g., a child who
knew no letter sounds and could read no words). Additional students may have qualified if the

58
scope of the intervention had been expanded to include components that would address the needs
of less advanced and more advanced readers.
The effects of longer interventions should also be examined. An understanding is needed
of the influences of phonics instruction on reading outcomes over significantly longer periods of
time, particularly on advanced skills such as fluency and comprehension. Longitudinal studies
are needed to determine what level of reading skill can be obtained by children with DS and the
most effective methods for providing reading instruction over time.
Findings also suggest that phonics instruction may be more effective for children with DS
who know a greater number of words prior to receiving this instruction. Buckley and colleagues
(1996) suggested that children with DS are better able to learn decoding skills after they have
mastered a number of sight words. It is plausible that this would provide children with prior
knowledge with which they could connect new learning. It would be valuable to evaluate this
claim empirically.
Finally, more work is needed to understand the needs of those children who do not
benefit from phonics-based instruction. As in studies of typically developing children, this study
found a group of children for whom the intervention was less effective. Al Otaiba and Fuchs
(2002) identified several child characteristics associated with nonresponse to early phonics
instruction for typically developing children. Future work should aim to determine whether
nonresponders with DS exhibit similar characteristics to these non-disabled children or whether
children with DS, as a group, share unique features. In either case, interventions designed to
meet the unique needs of groups of nonresponsive children who share similar characteristics are
likely to lead to increased learning for these children. This type of research will provide
practitioners with the tools they need to meet the academic needs of those children who do not

59
benefit from the same instructional practices as a majority of their peers. Additionally, it is only
with this knowledge that teachers will be able to ensure that exceptional learners, including
children with cognitive disabilities, are included in the all of NCLB.

60
REFERENCES
Adams, M. J. (1990). Beginning to read: Thinking and learning about print. Cambridge, MA:
MIT Press.
Al Otaiba, S., & Fuchs, D. (2002). Characteristics of children who are unresponsive to early
literacy intervention. Remedial and Special Education, 23, 300-316.
Browder, D. M., Wakeman, S. Y., Spooner, F., Ahlgrim-Delzell, L., & Algozzine, R. (2006).
Research on reading instruction for individuals with significant cognitive disabilities.
Exceptional Children, 72, 392-408.
Browder, D. M., & Xin, Y. P. (1998). A meta-analysis and review of sight word research and its
implications for teaching functional reading to individuals with moderate and severe
disabilities. The Journal of Special Education, 32, 130-153.
Brown, L., Jones, S., Troccolo, E., Heiser, C., Bellamy, T., & Sontag, E. (1972). Teaching
functional reading to young trainable students: Toward longitudinal objectives. The
Journal of Special Education, 6, 237-246.
Buckley, S. J., Bird, G., & Byrne, A. (1996). Reading acquisition by young children with Down
syndrome. In B. Stratford & P. Gunn (Eds.), New approaches to Down syndrome (pp.
268-279). London: Cassell.
Byrne, A., Buckley, S., MacDonald, J., & Bird, G. (1995). Investigating the literacy, language
and memory skills of children with Down's syndrome. Down's syndrome: Research and
Practice, 3, 53-58.
Byrne, B., & Fielding-Barnsley, R. (1989). Phonemic awareness and letter knowledge in the
child's acquisition of the alphabetic principle. Journal of Educational Psychology, 81,
313-321.
Carroll, J. M. (2004). Letter knowledge precipitates phoneme segmentation, but not phoneme
invariance. Journal of Research in Reading, 27, 212-225.
Connor, C. M., Morrison, F. J., Fishman, B. J., Schatschneider, C., & Underwood, P. (2007).
Algorithm-guided individualized reading instruction. Science, 315, 464-465.
Connor, C. M., Morrison, F. J., & Petrella, J. N. (2004). Effective reading comprehension
instruction: Examining child x instruction interactions. Journal of Educational
Psychology, 96, 682-698.
Cooke, N. L., Heron, T. E., Heward, W. L., & Test, D. W. (1982). Integrating a Down's
syndrome child in a classwide peer tutoring system: A case report. Mental Retardation,
20, 22-25.
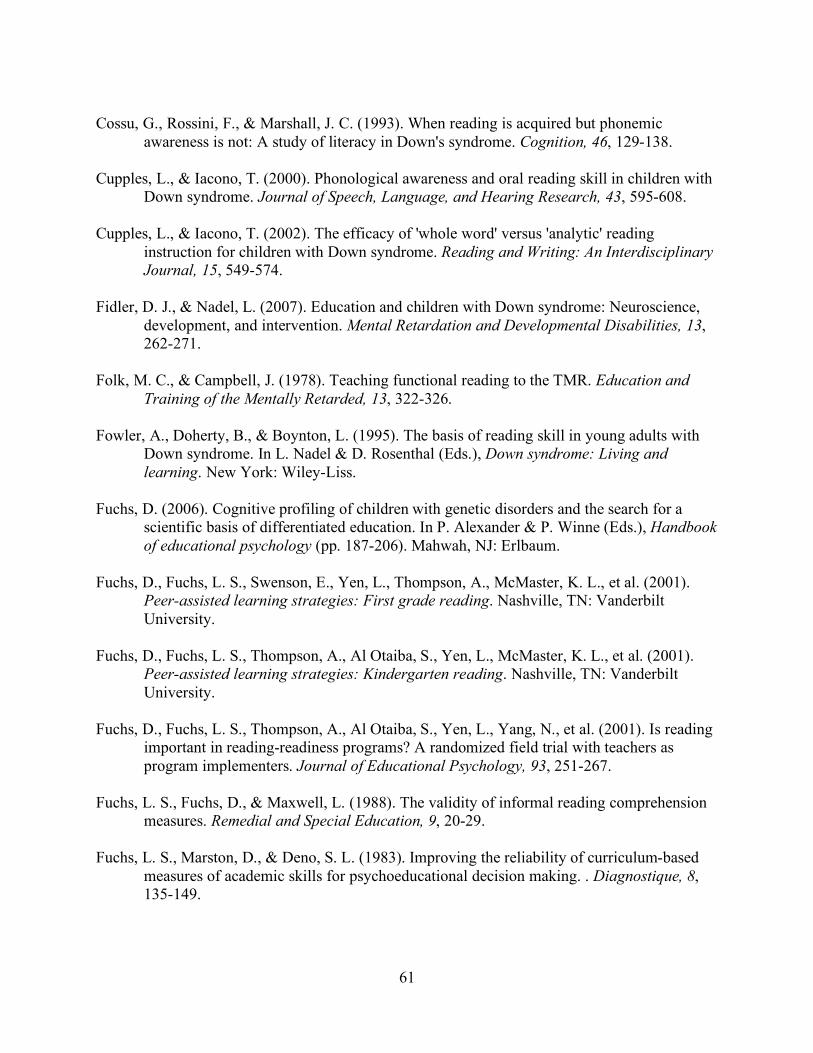
61
Cossu, G., Rossini, F., & Marshall, J. C. (1993). When reading is acquired but phonemic
awareness is not: A study of literacy in Down's syndrome. Cognition, 46, 129-138.
Cupples, L., & Iacono, T. (2000). Phonological awareness and oral reading skill in children with
Down syndrome. Journal of Speech, Language, and Hearing Research, 43, 595-608.
Cupples, L., & Iacono, T. (2002). The efficacy of 'whole word' versus 'analytic' reading
instruction for children with Down syndrome. Reading and Writing: An Interdisciplinary
Journal, 15, 549-574.
Fidler, D. J., & Nadel, L. (2007). Education and children with Down syndrome: Neuroscience,
development, and intervention. Mental Retardation and Developmental Disabilities, 13,
262-271.
Folk, M. C., & Campbell, J. (1978). Teaching functional reading to the TMR. Education and
Training of the Mentally Retarded, 13, 322-326.
Fowler, A., Doherty, B., & Boynton, L. (1995). The basis of reading skill in young adults with
Down syndrome. In L. Nadel & D. Rosenthal (Eds.), Down syndrome: Living and
learning. New York: Wiley-Liss.
Fuchs, D. (2006). Cognitive profiling of children with genetic disorders and the search for a
scientific basis of differentiated education. In P. Alexander & P. Winne (Eds.), Handbook
of educational psychology (pp. 187-206). Mahwah, NJ: Erlbaum.
Fuchs, D., Fuchs, L. S., Swenson, E., Yen, L., Thompson, A., McMaster, K. L., et al. (2001).
Peer-assisted learning strategies: First grade reading. Nashville, TN: Vanderbilt
University.
Fuchs, D., Fuchs, L. S., Thompson, A., Al Otaiba, S., Yen, L., McMaster, K. L., et al. (2001).
Peer-assisted learning strategies: Kindergarten reading. Nashville, TN: Vanderbilt
University.
Fuchs, D., Fuchs, L. S., Thompson, A., Al Otaiba, S., Yen, L., Yang, N., et al. (2001). Is reading
important in reading-readiness programs? A randomized field trial with teachers as
program implementers. Journal of Educational Psychology, 93, 251-267.
Fuchs, L. S., Fuchs, D., & Maxwell, L. (1988). The validity of informal reading comprehension
measures. Remedial and Special Education, 9, 20-29.
Fuchs, L. S., Marston, D., & Deno, S. L. (1983). Improving the reliability of curriculum-based
measures of academic skills for psychoeducational decision making. . Diagnostique, 8,
135-149.

62
Goetz, K., Hulme, C., Brigstocke, S., Carroll, J. M., Nasir, L., & Snowling, M. (2008). Training
reading and phoneme awareness skills in children with Down syndrome. Reading and
Writing: An Interdisciplinary Journal, 21, 395-412.
Hohn, W. E., & Ehri, L. C. (1983). Do alphabet letters help prereaders acquire phonemic
segmentation skill? Journal of Educational Psychology, 75, 752-762.
Jackson, M. (1974). Visual feedback in word aquisition behavior in moderately retarded subjects.
Slow Learning Child: The Australian Journal of the Education of Backward Children, 21,
155-163.
Kaufman, A. S., & Kaufman, N. L. (2004). Kaufman Brief Intelligence Test - Second Edition.
Minneapolis, MN: NCS Pearson, Inc.
Kay-Raining Bird, E., Cleave, P. L., & McConnell, L. (2000). Reading and phonological
awareness in children with Down syndrome: A longitudinal study. American Journal of
Speech-Language Pathology, 9, 319-330.
Kennedy, E. J., & Flynn, M. C. (2003). Training phonological awareness skills in children with
Down syndrome. Research in Developmental Disabilities, 24, 44-57.
Lyon, G. R. (1998). Why reading is not a natural process. Educational Leadership, 55, 14-18.
Mechling, L. C., Gast, D. L., & Krupa, K. (2007). Impact of SMART board technology: An
investigation of sight word reading and observational learning. Journal of Autism and
Developmental Disorders, 37, 1869-1882.
National Reading Panel. (2000). Teaching children to read: An evidence-based assessment of the
scientific research literature on reading and its implications for reading instruction.
Washington, DC: U.S. Department of Health and Human Services.
Partnership for Reading. (2001). Put reading first: The research building blocks for teaching
children to read. Washington, D.C.: Center for the Improvement of Early Reading
Achievement.
Pickering, S., & Gathercole, S. (2001). Working Memory Test Battery for Children (WMTB-C).
London: The Psychological Corporation.
Raudenbush, S. W., & Bryk, A. S. (2002). Hierarchical linear models: Applications and data
analysis methods (2nd ed.). Thousand Oaks, CA: Sage.
Raudenbush, S. W., Bryk, A. S., & Congdon, R. (2000). HLM 6: Hierarchical linear and
nonlinear modeling. Lincolnwood, IL: Scientific Software International.
Robertson, C., & Salter, W. (1995). The Phonological Awareness Kit: Primary. East Moline, IL:
Linguisystems, Inc.

63
Roch, M., & Jarrold, C. (2008). A comparison between word and nonword reading in Down
syndrome: The role of phonological awareness. Journal of Communication Disorders,
41, 305-318.
Sidman, M., Cresson, O., & Willson-Morris, M. (1974). Acquisition of matching to sample via
mediated transfer. Journal of the Experimental Analysis of Behavior, 22, 261-273.
Singer, J. D., & Willett, J. B. (2003). Applied longitudinal data analysis: Modeling change and
event occurence. New York: Oxford University Press.
Snow, C., Burns, M. S., & Griffin, P. (Eds.). (1998). Preventing reading difficulties in young
children. Washington, D.C.: National Academy Press.
Snowling, M. J., Hulme, C., & Mercer, R. C. (2002). A deficit in rime awareness in children with
Down syndrome. Reading and Writing, 15, 471-495.
Stage, S. A. (2001). Program evaluation using hierarchical linear modeling with curriculum-
based measurement reading probes. School Psychology Quarterly, 16, 91-112.
Stanovich, K. E. (1986). Matthew effects in reading: Some consequences of individual
differences in the acquisition of literacy. Reading Research Quarterly, 21, 361-406.
Swanson, J., Schuck, S., Mann, M., Carlson, C., Hartman, K., Sergeant, J., et al. (2004).
Categorical and dimensional definitions and evaluations of symptoms of ADHD: The
SNAP and the SWAN rating scales. [Electronic Version]. Retrieved from
http://www.adhd.net.
Torgesen, J. K. (2000). Individual differences in response to early interventions in reading: The
lingering problem of treatment resisters. Learning Disabilities Research and Practice, 18,
147-156.
van Bysterveldt, A. K., Gillon, G. T., & Moran, C. (2006). Enhancing phonological awareness
and letter knowledge in preschool children with Down syndrome. International Journal
of Disability, Development, and Education, 53, 301-329.
Woodcock, R. W. (1998). Woodcock Reading Mastery Test - Revised. Circle Pines, MN:
American Guidance Service.