Embed Size (px)
Citation preview

Table of Contents
Articles
INFRONICS SYSTEMS LTD: TRIGGERING ENTREPRENEURIAL BUG
Lakshmaiah Botla
AWARENESS OF CONSUMERS ON THE GREEN MARKETING INITIATIVES OF CORPORATES
Chaarlas Lazar Jaganathan, Noorunnisha Syed Abbas, Rajkumar Ramachandran
FREIGHT FORWARDERS HURDLES IN THE OPERATIONS – AN EXPLORATORY STUDY WITH SPECIAL REFERENCE TO TAMIL NADU - INDIA
Paul Sundar Kirubakaran
ASSESSING FARMER PERCEPTION TOWARDS INTERNET BASED INTERVENTION: AN EMPIRICAL STUDY
Sudeepa Banerjee
FINANCAIL INCLUSION FOR SUSTAINABLE DEVELOPMENT:ACRITICAL LITERATURE REVIEW-THE ROLE OF COMMERCIAL BANKS &LOW INCOME PEOPLES
MR.CHITTA RANJAN MISHRA
DETERMINANTS OF JOB SATISFACTION: A STUDY ON BANGLADESH PERSPECTIVE
Ahasanul Haque
ETHICAL ISSUES IN ACCESSING PEOPLE'S KNOWLEDGE AND INNOVATIONS: A STUDY ON SPECIFIC REFERENCE TO LOW COST HEALTH SYSTEM IN INDIA
Suniti Chandiok
INFLUENCE ON BRAND IN FEMALE CONSUMER BEHAVIOR IN APPAREL PURCHASE IN LUCKNOW
Shalini Bariar
TEST OF PRICING EFFICIENCY AND DISTRIBUTIONAL PROPERTIES: INDIAN COMMODITY MARKET
Dr. Namita Rajput
www.theinternationaljournal.org > RJCBS: Volume: 01, Number: 08, June-2012 Page 1
Case Study: Infronics Systems Ltd: Triggering
Entrepreneurial Bug
Lakshmaiah Botla
Faculty at Institute of Advanced Management Education and Entrepreneurship (IAMEE), Hyderabad
Lakshmaiah Botla is a Faculty Member at Institute of
Advanced Management Education and Entrepreneurship
(IAMEE), Hyderabad, prepared this case for an assignment
of ISB, under the supervision of Professor Ramachandran
Kavil, Indian School of Business and Professor
Ramakrishna Velamuri, CEIBS, to serve as the basis for
class discussion rather than to illustrate either effective or
ineffective handling of an organizational situation. Case
writer can be reached at [email protected] &
[email protected]. This case study is presented in the
“International Conference on Management Practices for
Sustainable Growth” during 28-30 July 2010, conducted by
Dept. of Business Management, Annamalai University,
Tamilnadu, India.
Infronics Systems Ltd: Triggering Entrepreneurial Bug
Abstract: The case study discusses the entrepreneurial
journey of a young engineer who left his lucrative software
job abroad when triggered by entrepreneurial bug to realize
his dream of starting his own company in India. The case
study discusses the opinions of an entrepreneur and how
they have influenced his path of success. The case study
says that the appetite for risks open up new opportunities
hence to be exploited to realize the hidden treasury.
A young and medium built, MS Raju is very busy with his
preparation for Netherlands business trip to expand his
business into Europe when case writer reaches his office at
Kondapur in Hyderabad at around 10.30 am on the day of
appointment for the interview. He readily invited case writer
into his chamber and made him to relax by offering water
and that followed by refreshments while attending to his
phone calls and laptop. He has been doing multiple tasks
simultaneously while speaking with the case writer to
optimize his time on various important things.
Stepping into unknown is a game MS Raju plays to explore
the possibilities but he as well knows where and when to
control things and measures each step with calculated risk to
the extent of mathematical precision, may be habituated
because of his engineering background. He says every
problem is a disguised opportunity and one should discover
critical points in each opportunity to exploit the hidden
treasure. He believes strategy is the best tool to face risk and
people management is the highest priority in all of his
endeavors to create and exploit opportunities. His career
path is the testimony of his strategy and his vision is the
telescope of his destiny.
MS Raju is the person who has started his entrepreneurial
journey in the year 2000; and has started a new venture
Infronics Systems limited in the year 2007, headquartered
at Hyderabad, with a turnover of Rs.70 million now, is one
of the few companies in India with capabilities of
developing business critical systems consisting of both
hardware and software components.
Infronics Systems Limited: A Profile
Infronics Systems Ltd., a technology-enabled IT solutions
company has started galloping by foreseeing future needs
and exigencies of the market. It is delivering excellent
products of high quality and reliability with unflinching
commitment to its customers and having emphatic global
market presence with a vision to become a global player. It
specializes in industry-specific software and hardware
solutions, with proven reputation for delivering high quality
solutions to a broad spectrum of industry verticals.
The core technology areas of the company are
RFID
Smart Cards
Biometrics
Enterprise Mobility
Embedded Design & Hardware Production
Some of the products*** are as follows. (See the Appendix
III)
BioMoRF: Centralized Monitoring Tool to
authenticate or identify an individual from a remote
location
AVLS (Automatic Vehicle Location System): It
enables accurate tracking of the vehicles plying any
time, anywhere including fleet management and
container tracking
RFID based Smart Certificate: Solutions for the
award of University degree Certificates to students
eZSMS: It enables to send one or many SMSes to
all the recipients for various business and personal
communications
eZBanking: solution helps banks and Micro
Finance Institutions to reach the unbanked rural
population with branchless banking
Infronics has over 1000 major clients across various
industry verticals like Software Houses, Banks,
Manufacturing facilities, Defence establishments, Textile
industry, Educational institutions, Oil Refineries and System
Integrators. Few of the clients include TCS, Nokia, Nipuna,
www.theinternationaljournal.org > RJCBS: Volume: 01, Number: 08, June-2012 Page 2
Hyundai, Hero Honda, Pepsi, Ford, University of
Hyderabad, Concorde, Indian Oil, Mahindra, SBI etc.
Infronics designs various indigenous applications and
products for India and Overseas. The company exports its
products to Kingdom of Saudi Arabia, Dubai, UK, Ireland
and United States.
Triggering Entrepreneurial Bug
There is a consensus in India that Software boom has done
one great thing to Indians and that is awakening of the
entrepreneurial bug dormant in them who have visited
foreign lands. MS Raju is another testimony, who has been
triggered by entrepreneurial bug when working for a Korean
company of ENPIA Business Group. Soon after returned
from Korea in 2004 he has started a Dotcom company
“telugupictures.com” under company name Suchi Infotech
Ltd in 2005, where people can watch movies online by
paying a fee through online. A customer can watch any
latest movie at this site with a fee. MS Raju has diversified
his Suchi Infotech Ltd. into technology-enabled IT Solutions
Company with a new name- Infronics Systems Ltd in the
year 2007 and has become a brand by itself now.
Entrepreneur Background
MS Raju has completed his M.S. Post Graduate Degree in
Engineering during 1991-96 from BITS, Pilani, India. Soon
after completion of his Masters Degree he joined WIPRO as
Software Developer and continued for five year but most of
his tenure has been spent in US working for various
assignments with General Electric and other reputed
companies of the US. He has left WIPRO and joined a
Korean company HANWA and stayed there for about 3
years before joining into another Korean company ENPIA
and has spent there till he left for his home country India to
give a shape to his entrepreneurial drive.
MS Raju does not have any family background of
entrepreneurs. His father worked for TISCO and wanted his
son to be an engineer to work for a big company and never
dreamt of becoming his son an entrepreneur.
Entrepreneurship is inside-out
Ms Raju believes that entrepreneurs are born but they can be
refined with training and mentoring. He says that triggering
of entrepreneurial bug is possible only when the
entrepreneurial gene exists dormant in the personality and
context also plays a dominant role initially for triggering.
When the entrepreneurial bug is triggered, it is very difficult
to be non-entrepreneurial hence, creates opportunities for
himself and fires his entrepreneurial drive and nurtures his
entrepreneurial spirit. His inner passions mould the context
to suit his drive and channel his spirit. The inside-out drive
of any entrepreneur is manifested in many forms like start
ups, change in personality, transforming organization,
building new network etc. The inside-out drive of MS Raju
has manifested in the form of Infronics Systems Ltd., a new
startup. MS Raju’s work experiences in US where working
for General Electric, in Korea working for HANWA and
ENPIA have provided the right context for triggering of his
entrepreneurial bug.
Risk is an Opportunity
MS Raju has always prepared himself to take calculated
risks and is also having a presupposition that ‘risks provide
opportunities’ hence, considers risks as “poly metallic
noodles” loaded with treasures. His attitude strengthens the
law ‘risks and rewards are directly proportional’ and his
actions are also proving that ‘the law’ is correct. His
entrepreneurial journey from ‘Dotcom Company’ to Suchi
Infotech to Infronics Systems Ltd. proves that the
opportunities are expanding proportionally with the risks
that he has prepared to take. He is also expanding his
company into overseas and making it a global player
because risks are opening new opportunities. His presence in
Europe, Middle East, US shows that he has ingrained the
law in his personality.
The appetite for risks has taken a quantum leap after
triggering of entrepreneurial bug and the upwelling of
entrepreneurial push is coming out from inside forcibly to
face challenges that are influencing all the situations
towards his way of drive and vision.
Networking with Partners
MS Raju concentrates on two important things while
choosing his partners, the first is wave length of the partner
and the second one is the experience of the partner. He
understands people within few conversations and catches
someone’s wave length with highest precision. He becomes
very careful if wave length doesn’t match. He gives lot of
importance to his partner’s experience also because that
saves lot of time and is very important ingredient for any
business to be successful. The dual dimensions of partners
play a vital role in synerzyzing their efforts towards
organizational vision and mission. His partnership with Assa
Abloy ITG, Germany; IBM, USA; Nedap, Netherlands; etc.
is the result of negotiations out of understanding the wave
length of participants and the reputation of the partners
involved in the deliberations.
Technology and Strategic Partners
He has collaborated with many global players for
technology and expertise. The strategic partnership is crucial
because he doesn’t want to reinvent the wheel. Wherever
new innovations are there he wants to collaborate with them
to serve customers by offering more value and latest
technology. He has a passion for offering the best in the
technology and delighting customers with the best product.
Infronics strategic partners include the following reputed
companies of the world.
Assa Abloy ITG, Germany for RFID Tags
IBM, USA for Enterprise Solutions and
Middleware
Nedap, Netharlands for RFID based Automatic
Vehicle Identification
NXP (Philips), Netharlands for NFC, RFID
www.theinternationaljournal.org > RJCBS: Volume: 01, Number: 08, June-2012 Page 3
Sagem Defence (Safran group), France for Finger
Print Technology
Symbol (Motorola), USA for RFID Hardware
Entrepreneurship and Innovation**
MS Raju says entrepreneurship and innovation are
synonymous and two sides of the same coin. He is an
entrepreneur to invent things and innovator to materialize
his entrepreneurship. He is a two-headed man but with one
vision. His vision is to take Infronics to the top by 2012 and
is possible only through integration of entrepreneurship and
innovation hence, his personality with two dimensions. He
has understood this relationship while working in US where
innovation and entrepreneurship is considered as similar
things. He himself has been a software developer while
working for Wipro, Hanwa, Enpia, GE etc. He has now
developed many products indigenously in India and offering
to the world by expanding his market all over the globe.
He has already filed four patents and applied five trade
marks to date to demonstrate his innovative capacity and
entrepreneurial drive. See the Appendix II for details.
Indian Intelligentsia
MS Raju has worked with many people and has understood
the capacity of various minds of both the west and the East.
His working in abroad has provided a scale to measure
Indian minds with the rest of the best minds hence, his
conviction that ‘Indian intelligence is par excellence’ and
his R & D is loaded with Indian minds to give a shape to his
innovative ideas by their creative talents. He softly warns
Indians that ‘they waste their creative energies in 3-C’s:
chitchat, cricket and cinema’ and that to be channelized for
higher things of the life. He says that Indians waste nearly 3
hours everyday in unproductive pursuits hence, a challenge
to Indian entrepreneurs to channelize their best energies for
productive use.
Mentor Influence
MS Raju is very much influenced by his mentor Krishnam
Raju. K, former Finance Director of Visual Soft. He has
understood the importance of mentorship and its impact on
one’s life. He also has started mentoring his employees too
to derive the extraordinary results of this process. His
mentor Krishnam Raju K not only mentors MS Raju but
also many other entrepreneurs because he has a passion to
build as many entrepreneurs as possible in this country. MS
Raju says he reveals everything to his mentor before taking
any decision that facilitates detachment in his actions hence,
the possibility of psychological balance in his decision
making. He says mentoring plays a strategic role in
nurturing entrepreneurial mind hence, to be given the
highest priority to nurture entrepreneurs. Transformation of
his earlier company ‘Suchi Infotech Ltd.’ into the present
company ‘Infronics Systems Ltd.’ is the result of many
hours of discussion with his mentor, Krishnam Raju and the
mentorship can be seen in the every fiber of the company.
Time Management
MS Raju works nearly sixteen hours a day with rigor and
vigor because he enjoys working hard and long. He says one
has to sacrifice his family in the initial years of a venture
and subsequently as the venture takes-off and reaches the
success plateau, one can relax a bit and spend longer hours
with the family. He also admits that but with the success of
the venture one becomes more busy because more
opportunities flood the door hence, creating time for family
is utmost important. He also works from home while
spending time with the family. He attends many works
simultaneously to leverage time and he believes time is the
most important resource. He again says balance of time
between family and office is crucial for success in the long
run. He starts his office work at around 9.00 am in the
morning and goes up to 6.00 pm in the evening. He does
office work at home during office holidays too.
Managing People
MS Raju follows a very interesting principle while
managing resources and people. Infronics is presently run by
140 employees and many of them are talented engineers. He
gives people enough freedom but controls at critical points.
It appears as if the principle of determinism and free-will
that is seen in many scriptures. He gives the example of
God, how he provides enough freedom to people but
controls at strategic points of life. MS Raju borrows this
philosophy while dealing his employees. He provides
enough freedom to employees but that freedom is cross-
checked at various strategic locations. He gives the example
of 1----10--------20-------30----------40---------------50
mathematical series to understand the concept. He controls
employees at point 10, 20, 30, 40, 50 and so on and provides
enough freedom to people in between 1 and 10, 10 and 20,
20 and 30 and so on. He gives the freedom but also control
with a strategic intent.
The Role of Money
MS Raju shatters the myth of importance of ‘money’ and its
role attached in the success of any entrepreneur. He says the
role of money in entrepreneurship is absolutely zero and he
assumes that money is abundantly available around us if we
have the strategy to exploit an opportunity. He truly fits into
the definition of entrepreneurship that says ‘entrepreneurs
pursue opportunities without regard to the resources they
currently control’. He emphasizes more of partnerships and
strategic partners who play a strong role in the success of
entrepreneurship and simply ignores the parameter of money
in the success of entrepreneurship. He says entrepreneurship
attracts money from all the corners and is never be a
constraint for entrepreneurs. His networking with world
leaders in technology say, IBM, Nedap, NXP, Motorola etc.
has provided him the competitive edge in the market rather
than the money.
Entrepreneurship and Strategy
The success of any entrepreneur he says depends on the
strategy that he adopts to influence the context and driving
the context towards his vision. MS Raju gives the first
www.theinternationaljournal.org > RJCBS: Volume: 01, Number: 08, June-2012 Page 4
priority to strategy for maintaining a leadership position in
the market. He strongly advocates that strategy shapes the
success. Strategy is the true lever that shapes the context
towards your vision and mission. It is the strategy that
optimizes the partners’ linkages to serve customers and to
expand customer base. He goes to the extent of equating
entrepreneurship with strategy. Strategy links partners and
employees with the company to leverage all the
relationships consistently. Entrepreneur delivers
entrepreneurship by strategy hence, a synonymous
relationship.
Stretching Employees and (n+1) strategy
Stretching employees is crucial for higher productivity and
the strategy of Infronics is always demand driven. Many
organizations go for supply-side to stretch employee like
more incentives or other reward oriented strategies. MS
Raju follows demand-driven strategy where he brings more
projects to less number of employees and creates a challenge
among employees to complete the projects. Employees
naturally stretch to meet the demand and raise their
productivity. He follows (n+1) strategy where for ‘n’
number of employees, he brings ‘(n+1)’ projects and keeps
employees always on toes to attack the complacency, a virus
to be killed consistently.
Success mantra is Integrity*
MS Raju knows the secret of success, and he says ‘integrity
is the engine of successes; this cannot be substitutable with
anything else’. Integrity is the glue that binds everyone for
team work to produce quality conscious products for
customers to sustain their trust and commanding respect and
serving community. Infronics believes in six values that
guide each and every employee of the organization and that
are “Team Work, Respect, Trust, Integrity, Quality and
Community”. The values can be seen in Appendix I.
Dream is yet to be seen
MS Raju is exploring his lands because he says ‘I have yet
to realize my dreams’ and is working incessantly to achieve
his ambitions day in and day out. He has ‘Insatiable Desire’
to take his company into higher levels even though his
vision is to take Infronics Systems into one of the top tier-2
IT companies of India by 2012. It is a proven fact that
entrepreneurial dreams are never reached because they
consistently dream higher and higher with the each
achievement, hence MS Raju is certainly not an exception.
*Appendix I: Infronics Systems Ltd (Source-
www.infronics.com)
VISSION
“Be one of the Top Tier-2 IT companies of India by 2012”
MISSION
“Achieve Technological, Operational and Performance
Excellence through Innovation”
VALUES
We believe in
Teamwork – Believe in "Together Everyone Achieves More".
Respect – Value the Individual, Others and Our Diversity.
Trust – Keep Our Promises
Integrity – Conduct Ourselves Honestly, Professionally and
Ethically.
Quality – Employ Quality Conscious Processes.
Community – Believe in Corporate Social Responsibility
**Appendix II: Corporate Highlights (Source-
www.infronics.com)
Established in the year 2000
IT Products and Solutions Company headquartered
at Hyderabad, India
In the year 2006 the company expanded its
footprint to UK and Ireland, and is now planning to
expand to USA
A growing, strong, dedicated, specialized and
highly qualified engineering team from some of the
best universities of India
One of the leading organizations in Biometrics,
RFID and e-mobility
Immense expertise in design, development and
deployment of highly secure and scalable
enterprise products and solutions
In-house Hardware Design and Manufacturing,
catering to Domestic and Overseas Markets
Four patents filed to date
Five Trademarks applied
Infronics has over 1000 major clients spreading
across various
***
www.theinternationaljournal.org > RJCBS: Volume: 01, Number: 08, June-2012 Page 5
Awareness of Consumers on the Green Marketing
Initiatives of Corporates
Dr. LJ. Chaarlas, Associate Professor & Research Advisor in Commerce,
St.Joseph’s College(Autonomous), Tiruchirappalli – 2.
Ms. A. Noorunnisha, Assistant Professor in Commerce,
Holy Cross College (Autonomous), Tiruchirappalli – 2
Mr. R. Rajkumar, Ph.D Research Scholar in commerce(F.T.),
St.Joseph’s College(Autonomous), Tiruchirappalli – 2.
Abstract— The threatening alarm of Global Warming
pushes the coporates towards sharing the responsibility of
making a safe environment for all by involving themselves
as a party to the Social Contract – an invisible agreement
lying between the society and coporates. This growing
importance of an eco-friendly approach, has paved the way
for a new dimension of marketing – the Green Marketing.
Green marketing is still found at its nascent stage due to the
lack of awareness of consumers on eco-friendly activities of
corporates. In order to bring in the awareness of green
marketing, the corporates are bound to educate their
consumers on the importance of environmental protection
rather than adopting the green marketing initiatives. To
make green marketing successful it is essential that the
coporates adopt these functions with the approach of
volunteerism and responsibility over the society and
environment which has given them existence and survival.
Keywords— Green Marketing, Green issues,
Environment-Friendly, FMCGs and services, Consumer
awareness.
I. INTRODUCTION
An intelligent marketer is the one who not only convinces
the consumer, but also involves the consumer in marketing
his product. Today, many corporates have started realizing
that they should be environment-friendly. They believe in
the achievement of both social and environmental objectives
as well as financial objectives. The threatening alarm of
Global Warming pushes the coporates towards sharing the
responsibility of making a safe environment for all by
involving themselves as a party to the Social Contract – an
invisible agreement lying between the society and coporates.
This growing importance of an eco-friendly approach, has
paved the way for a new dimension of marketing – the
Green Marketing.
According to the American Marketing Association,
“green marketing is the marketing of products that are
presumed to be environmentally safe”[1]. Hence, green
marketing involves a broad range of activities, including
product modification, changes to the production process,
changes in packaging, as well as modifying advertising.
Green marketing cannot be perceived to be just one more
approach to marketing, but has to be pursued with much
vitality, as it has an environmental and social dimension
involved into it. It is highly important for the marketers that
they make green marketing as one of the norms of
marketing procedure rather than an exception or just a fad.
Though environmental protection is the trend of the
day, green marketing is still found at its nascent stage due to
the lack of or low awareness of consumers on the eco-
friendly activities performed by the manufacturers and
service providers. Yet the limited awareness of consumers
on green marketing pressurises the marketers and
researchers to do a lot of research on green marketing to
fully explore its potential. Measuring the level of awareness
of consumers has been of great importance to the marketers
as they need to bear the greatest responsibility to make the
consumers understand the need for and benefits of green
products as compared to non-green ones and motivate them
to pay more to maintain a cleaner and greener environment.
II. GREEN MARKETING – A REVIEW
India is growing at 9% annually and expected to
double its energy consumption between 2005 and 2030, is
under pressure to take action for providing clean
environment for all future generations to come. In
India, around 25% of the consumers prefer environmental-
friendly products, and around 28% may be considered
healthy conscious. Therefore, there is a lot of diverse and
fairly sizeable untapped segment in India which green
marketers can serve through offering eco-friendly products
for profitability and survival in the era of globalization[2].
The first wave of Green Marketing occurred in the
1980s. Corporate Social Responsibility (CSR) Reports
started with the ice cream seller Ben & Jerry's where the
financial report was supplemented by a greater view on the
company's environmental impact.
In 1987, a document prepared by the World
Commission on Environment and Development defined
sustainable development as meeting "the needs of the
present without compromising the ability of future
generations to meet their own need". This became known as
www.theinternationaljournal.org > RJCBS: Volume: 01, Number: 08, June-2012 Page 6
the Brundtland Report and was another step towards
widespread thinking on sustainability in everyday activity.
Two tangible milestones for wave of green
marketing came in the form of published books, both of
which were called Green Marketing. They were by Ken
Peattie (1992) in the United Kingdom and by Jacquelyn
Ottman (1993) in the United States of America.
In the years after 2000 a second wave of Green
marketing emerged. By now CSR and the Triple Bottom
Line (TBL) were widespread. Such publications as a 2005
United Nations Report, a book by Al Gore in 2006 and the
UK Stern Report brought scientific-environmental
arguments to the public in an easy-to-understand way[3].
Therefore, surely this is time right to inject
sustainable development into the marketing mix to help
address some of the gritty issues currently facing our planet.
III. STATEMENT OF THE PROBLEM
As resources are limited and human wants are
unlimited, it is important for the marketers to utilize the
resources efficiently without waste as well as to achieve the
organization's objective. There is growing interest among
the consumers all over the world regarding protection of
environment. As a result, green marketing which speaks for
growing market for sustainable and socially responsible
products and services becomes inevitable for corporates.
Various studies by environmentalists indicate that
consumers are concerned with the environment and are
changing their behavioural pattern so as to be less hostile
towards it. The level of green marketing initiatives of
manufacturers and marketers is based on the level of
awareness of consumers on green marketing.
Therefore, the present study “AWARENESS OF
CONSUMERS ON THE GREEN MARKETING
INITIATIVES OF CORPORATES” has been endeavoured
by the researcher to analyse the level of awareness of
consumers on green marketing initiatives of corporates.
IV. OBJECTIVES OF THE STUDY
The following are the objectives of this study,
Primary Objective
To study the level of awareness of consumers on
green marketing initiatives of corporates.
Secondary Objectives
1. To find out the level of awareness of consumers of
FMCGs on green marketing initiatives of corporates.
2. To understand the level of awareness of consumers of
durable goods on green marketing initiatives of
corporates.
3. To identify the level of awareness of consumers of
services sector on green marketing initiatives of
corporates.
4. To provide suitable suggestion to the marketers of
FMCGs, Durables and Services Sector with regard to the
level of awareness of consumers on green marketing
initiatives of corporates.
V. RESEARCH HYPOTHESES OF THE STUDY
To test the level of awareness of consumers on
green marketing initiatives of corporates, the following
research hypotheses have been proposed:
1. There is a significant association between the level
of awareness of consumers of FMCGs on green
marketing initiatives of corporates and their age.
2. There is a significant association between the level
of awareness of consumers of durable goods on
green marketing initiatives of corporates and their
age.
3. There is a significant association between the level
of awareness of consumers of services sector on
green marketing initiatives of corporates and their
age.
4. There is a significant association between the level
of awareness of consumers of FMCGs on green
marketing initiatives of corporates and their sex.
5. There is a significant association between the level
of awareness of consumers of durable goods on
green marketing initiatives of corporates and their
sex.
6. There is a significant association between the level
of awareness of consumers of services sector on
green marketing initiatives of corporates and their
sex.
7. There is a significant association between the level
of awareness of consumers of FMCGs on green
marketing initiatives of corporates and their level
of education.
8. There is a significant association between the level
of awareness of consumers of durable goods on
green marketing initiatives of corporates and their
level of education.
9. There is a significant association between the level
of awareness of consumers of services sector on
green marketing initiatives of corporates and their
level of education.
VI. SCOPE OF THE STUDY
The study focuses to understand level of awareness
of consumers about green marketing of FMCGs, durables
and services sector. The present study has been conducted
covering consumer-respondents of the district of
Tiruchirappalli. The study may be of help to the marketers
of FMCGs, durables and services sector to work out a good
green marketing campaign for their products, after
understanding level of awareness of consumers on green
marketing initiatives of corporates.
VII. METHODOLOGY
The consumers of the district of Tiruchirappalli were the
sample units of this study. The sample size comprised of 51
consumer-respondents who have been targeted in the retail
www.theinternationaljournal.org > RJCBS: Volume: 01, Number: 08, June-2012 Page 7
stores of the district of Tiruchirappalli. The study is based
on the primary data collected using a structured as well as
illustrative questionnaire which has also been used as an
interview schedule. The hypotheses of the study have been
analysed and proved using Chi-Square Test.
VIII. LIMITATIONS OF THE STUDY
The findings and suggestions derived out of the study may
not be applicable to any period other the period from 15th
November, 2011 to 15th December, 2011 and also may not
be relevant to any area other than the district of
Tiruchirappalli.
IX. ANALYSIS AND FINDINGS
The analysis of the study focuses on measuring the level of
awareness possessed by the consumers of FMCGs, durables,
and services sector on the green marketing initiatives of
corporates.
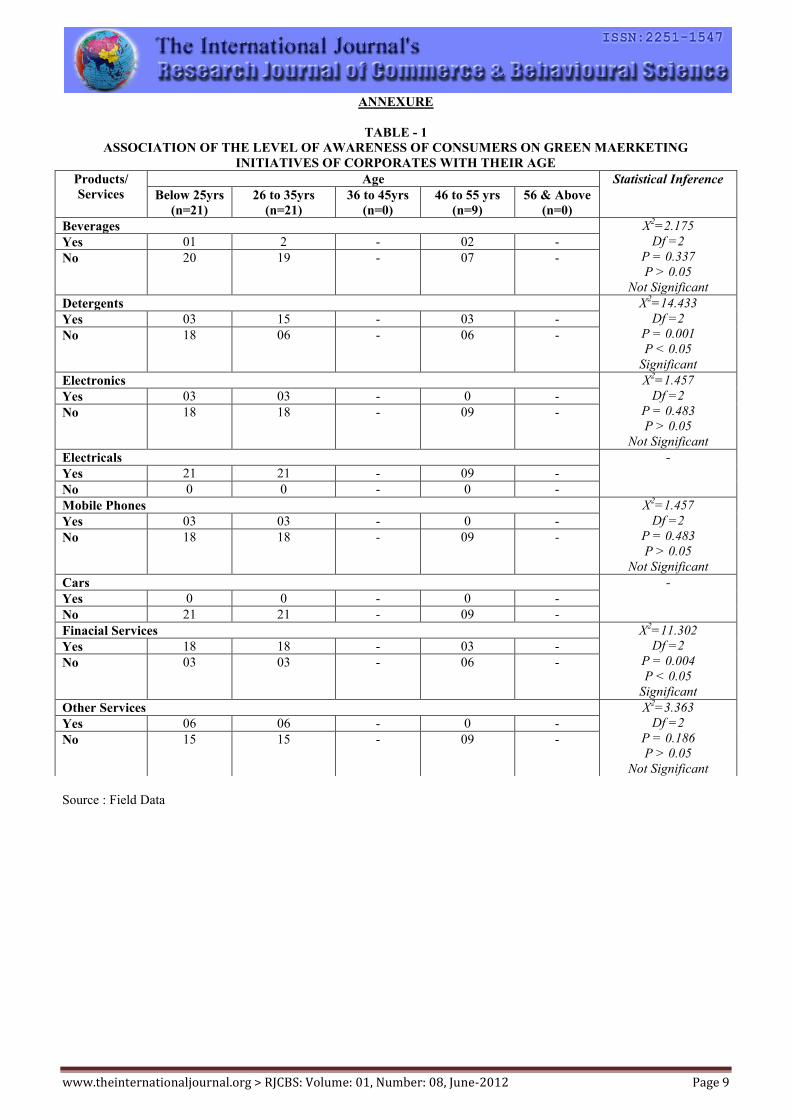
The Table – 1 explains the relationship between the age of
consumer-respondents and their level of awareness on the
green marketing initiatives of corporates of FMCGs,
durables and services. It may be located from the table that:
There is no significant association between the age
of consumers and their level of awareness on the green
marketing initiatives of corporates of beverages, electronic
products, mobile phones, and services other than financial
services.
There is a significant association between the age
of consumers and their level of awareness on the green
marketing initiatives of corporates of detergent products and
financial services.
The consumers of electrical products possessed
wide knowledge of the green marketing features of their
products irrespective of their level of age.
The consumers who purchase cars did not hold
extensive knowledge of the green marketing aspects of their
products irrespective of their level of age.
Hence, from the Table – 1, it has been inferred that
the independent variable age has no association with the
level of awareness of consumers on green marketing
initiatives of corporates.
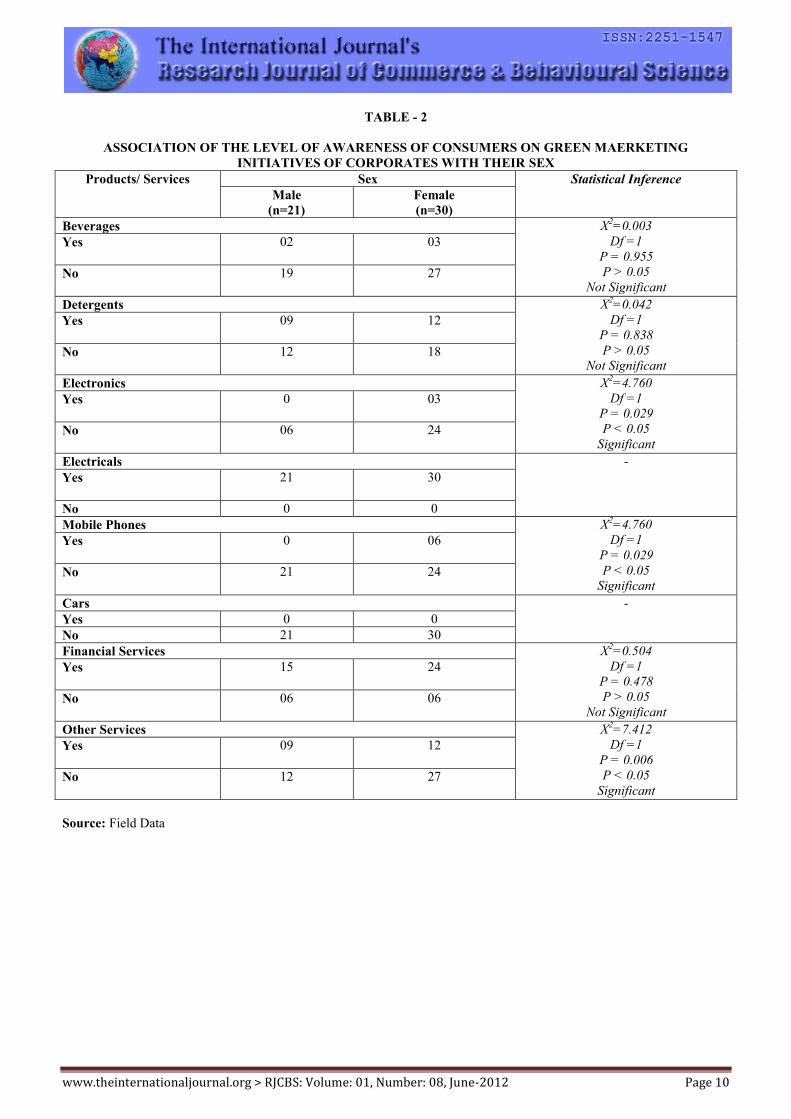
The Table – 2 demonstrates the relationship
between the sex of consumer-respondents and their level of
awareness on the green marketing initiatives of corporates
of FMCGs, durables and services. The following findings
have been inferred from the table:
There is no significant association between the sex
of consumers and their level of awareness on the green
marketing initiatives of corporates of beverages, detergent
products and financial services.
There is a significant association between the sex
of consumers and their level of awareness on the green
marketing initiatives of corporates of electronic products,
mobile phones and services other than financial services.
Again the consumers of electrical products have
been found having complete awareness of the green
marketing initiatives of marketers of electrical products
irrespective of their sex.
As found in the previous table the consumers of
cars do not embrace extensive knowledge of the green
marketing aspects of their products irrespective of their sex.
Hence, from Table – 2, it has been recognised that
there is an association between sex of respondents and their
level of awareness on the green marketing initiatives of
corporates.
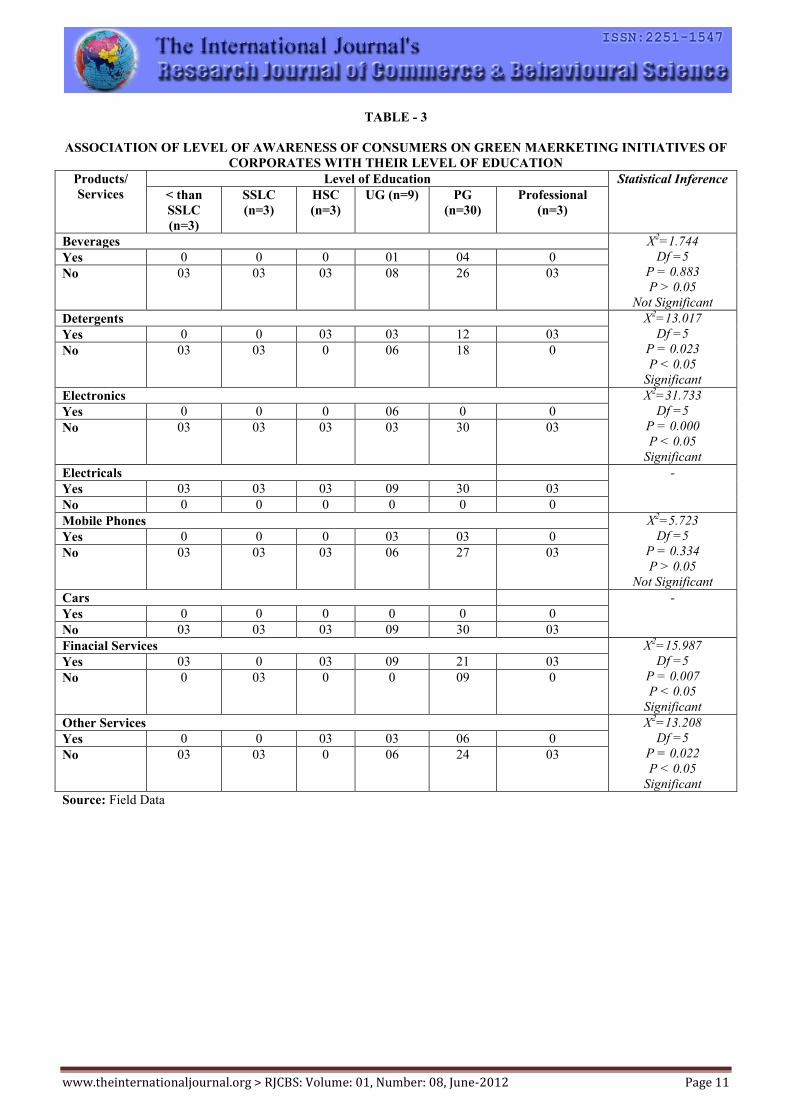
Table – 3 throws light on the relationship between
the level of education of consumer-respondents and their
level of awareness on the green marketing initiatives of
corporates of FMCGs, durables and services. The table
provides the following inferences:
There is no significant association between the
level of education of consumers and their level of awareness
on the green marketing initiatives of corporates of beverages
and mobile phones.
There is a significant association between the level
of education of consumers and their level of awareness on
the green marketing initiatives of corporates of detergent
products, electronic products, financial services and services
other than financial services.
Again the consumers of electrical products have
been found having complete awareness of the green
marketing initiatives of corporates of electrical products
irrespective of their level of education.
The consumers of cars were found having no
extensive knowledge of the green marketing features of their
products irrespective of their level of education.
Hence, from the Table – 3, it has been identified
that there is an association between level of education of
consumers and their level of awareness on the green
marketing initiatives of corporates.
X. SUGGESTIONS
From the analyses and findings of the study the following
suggestions were proposed:
The corporates should make sure that the consumers are
aware of and concerned about the green issues that the
product attempts to address.
The corporates may take an initiatives to educate the
consumers and letting them know what the corporates are
doing to protect the environment, also by making them
www.theinternationaljournal.org > RJCBS: Volume: 01, Number: 08, June-2012 Page 8
know why it is important and educating them on eco-
certifications.
Consumers must be reassured of the fact that the product
performs the job it's supposed to do and the green issues of
the product are only the additional features. They must be
given the confidence that companies will never forego the
product quality in the name of the environment.
Consumers need to be given an opportunity to participate by
means of personalizing the benefits of environment-friendly
actions of the corporates, through the promotion and
positioning of the consumer desired value into
environmental products and making the green product
attributes as “solutions” for consumer needs.
XI. CONCLUSION
As the whole world is moving towards
environmental protection, this seems to be the right time for
the corporate to select “Green Marketing”, because it is the
vital ingredient to save the world from man-made hazards. It
might bring a radical change in the world of business if all
the nations undertake to perform strict roles of being
environment-friendly. The approach of green marketing
should be practiced with much care, as it has an
environmental as well as social dimension into it. Recycling
activities, treatment of waste material, recovery of used
materials, environment-friendly production etc., in a safe
and harmless style should become a universal practice
among corporates. Educating the consumers on the
importance of environmental protection should be more
important than adopting the green marketing initiatives. To
design the strategy to implement green marketing, it is
imperative for corporates to gauge the level of awareness of
their consumers on their green marketing initiatives. Apart
from all these practices, the prime most consideration of any
sustainable activity of the corporates must be done beyond
legalities and without the compulsion of government and
non-governemental agencies, so that it becomes the part of
one of the objectives and functions of a corporate.
REFERENCES
[1]Available:http://www.indianmba.com/Occasional_Papers
/OP248/op248.html
[2]Available:http://www.indianmba.com/Occasional_Papers
/OP248/op248.html
[3]Available:http://www.indianmba.com/Faculty_Column/F
C1071/fc1071.html
www.theinternationaljournal.org > RJCBS: Volume: 01, Number: 08, June-2012 Page 9
ANNEXURE
TABLE - 1
ASSOCIATION OF THE LEVEL OF AWARENESS OF CONSUMERS ON GREEN MAERKETING
INITIATIVES OF CORPORATES WITH THEIR AGE
Source : Field Data
Products/
Services
Age Statistical Inference
Below 25yrs
(n=21)
26 to 35yrs
(n=21)
36 to 45yrs
(n=0)
46 to 55 yrs
(n=9)
56 & Above
(n=0)
Beverages X2=2.175
Df =2
P = 0.337
P > 0.05
Not Significant
Yes 01 2 - 02 -
No 20 19 - 07 -
Detergents X2=14.433
Df =2
P = 0.001
P < 0.05
Significant
Yes 03 15 - 03 -
No 18 06 - 06 -
Electronics X2=1.457
Df =2
P = 0.483
P > 0.05
Not Significant
Yes 03 03 - 0 -
No 18 18 - 09 -
Electricals -
Yes 21 21 - 09 -
No 0 0 - 0 -
Mobile Phones X2=1.457
Df =2
P = 0.483
P > 0.05
Not Significant
Yes 03 03 - 0 -
No 18 18 - 09 -
Cars -
Yes 0 0 - 0 -
No 21 21 - 09 -
Finacial Services X2=11.302
Df =2
P = 0.004
P < 0.05
Significant
Yes 18 18 - 03 -
No 03 03 - 06 -
Other Services X2=3.363
Df =2
P = 0.186
P > 0.05
Not Significant
Yes 06 06 - 0 -
No 15 15 - 09 -
www.theinternationaljournal.org > RJCBS: Volume: 01, Number: 08, June-2012 Page 10
TABLE - 2
ASSOCIATION OF THE LEVEL OF AWARENESS OF CONSUMERS ON GREEN MAERKETING
INITIATIVES OF CORPORATES WITH THEIR SEX
Source: Field Data
Products/ Services Sex Statistical Inference
Male
(n=21)
Female
(n=30)
Beverages X2=0.003
Df =1
P = 0.955
P > 0.05
Not Significant
Yes 02
03
No 19
27
Detergents X2=0.042
Df =1
P = 0.838
P > 0.05
Not Significant
Yes 09
12
No 12
18
Electronics X2=4.760
Df =1
P = 0.029
P < 0.05
Significant
Yes 0
03
No 06
24
Electricals -
Yes 21
30
No 0 0
Mobile Phones X2=4.760
Df =1
P = 0.029
P < 0.05
Significant
Yes 0
06
No 21
24
Cars -
Yes 0 0
No 21 30
Financial Services X2=0.504
Df =1
P = 0.478
P > 0.05
Not Significant
Yes 15
24
No 06
06
Other Services X2=7.412
Df =1
P = 0.006
P < 0.05
Significant
Yes 09
12
No 12
27
www.theinternationaljournal.org > RJCBS: Volume: 01, Number: 08, June-2012 Page 11
TABLE - 3
ASSOCIATION OF LEVEL OF AWARENESS OF CONSUMERS ON GREEN MAERKETING INITIATIVES OF
CORPORATES WITH THEIR LEVEL OF EDUCATION
Products/
Services
Level of Education Statistical Inference
< than
SSLC
(n=3)
SSLC
(n=3)
HSC
(n=3)
UG (n=9) PG
(n=30)
Professional
(n=3)
Beverages X2=1.744
Df =5
P = 0.883
P > 0.05
Not Significant
Yes 0 0 0 01 04 0
No 03 03 03 08 26 03
Detergents X2=13.017
Df =5
P = 0.023
P < 0.05
Significant
Yes 0 0 03 03 12 03
No 03 03 0 06 18 0
Electronics X2=31.733
Df =5
P = 0.000
P < 0.05
Significant
Yes 0 0 0 06 0 0
No 03 03 03 03 30 03
Electricals -
Yes 03 03 03 09 30 03
No 0 0 0 0 0 0
Mobile Phones X2=5.723
Df =5
P = 0.334
P > 0.05
Not Significant
Yes 0 0 0 03 03 0
No 03 03 03 06 27 03
Cars -
Yes 0 0 0 0 0 0
No 03 03 03 09 30 03
Finacial Services X2=15.987
Df =5
P = 0.007
P < 0.05
Significant
Yes 03 0 03 09 21 03
No 0 03 0 0 09 0
Other Services X2=13.208
Df =5
P = 0.022
P < 0.05
Significant
Yes 0 0 03 03 06 0
No 03 03 0 06 24 03
Source: Field Data
www.theinternationaljournal.org > RJCBS: Volume: 01, Number: 08, June-2012 Page 12
Freight Forwarders Hurdles In The Operations – An
Exploratory Study With Special Reference To
Tamil Nadu - India
Dr. J. PAUL SUNDAR KIRUBAKARAN
Faculty in Business Studies, Ibra College of Technology, Ibra, Sultanate of Oman
ABSTRACT
The goods are moved from the manufacturers to the
customers/consumers by the freight forwarders with their
effective utilization of the road/sea/air transportations. The
key concept in freight forwarding is the delivery of the
cargo till the destination point or at the doorsteps of the
consignee. Most of the manufacturers are rely on
international freight forwarders to perform the operations to
bring the goods to their end users. The international freight
forwarders act as bridge between the
manufacturers/exporters to the destination of the consumers.
An empirical study was conducted in the study area to
limelight the problems faced by the freight forwarders
whoever is involved towards the sea transportations. To
identify and select the respondents in the study area Simple
Random Sampling method was employed and a well
structured questionnaire was employed to gather the first-
hand information. The questionnaire covers information of
various kinds of their personal, operations and the problems
faced by them towards their operations. The problems faced
by the freight forwarders were chosen for the analysis. The
details of analysis and interpretation s are given in this
article.
I.INTRODUCTION
Freight forwarding agents are licensed by the customs.
The name and address of the freight forwarding agents
operating from different ports can be obtained from customs
house or from their local association. The exporter should
due care in various selecting criteria of fixing freight
forwarder Viz., location, facilities rates, services,
flexibilities and efficiency.
Freight forwarding agents are one who specializes in
arranging of shipping, insurance, and many of them today
arrange land, sea and air transportation for goods. They take
a major portion of the exporters work and their risks. A
forwarding agent receives a large number of consignments
and often group together a number of small ones and, by
putting them into one large consignment, obtain preferential
freight rates from the shipping line or the airline. On behalf
of the shippers, they do all procedural and documentation
formalities involved in the customs and port clearance.
They also look after the warehousing and transshipment of
cargoes before shipment of export consignments and after
discharge of import cargoes, by the sea carriers.
II. NEED FOR THE STUDY
Freight Forwarders play a vital role in transacting
the goods along with doing all the documentation work on
behalf of the Exporters/Importers. Freight Forwarders are
applying different formula for the effective Logistics
business transaction.
The study aims at analyzing the problems faced by
the Freight Forwarders in Tamil Nadu, India and giving
suggestions for improving their services.
III. SCOPE OF THE STUDY
The present study focuses the variety of aspects of
the performance of Freight Forwarders in Indian marine
cargo industry. It highlights the Freight Forwarding
operations, and the problems faced by them. Among all
these aspects of freight forwarding operations,
containerization is essential for speedy and safety reach.
Hence, the study encompasses the role of freight forwarders
in containerization.
IV. OBJECTIVES OF THE STUDY
The present study is aimed to analyze the following
objectives empirically.
1. To limelight the overview of the Freight
Forwarders.
2. To identify the problems faced by the Freight
Forwarders.
3. To analyze the problems faced by the freight
forwarders towards their operations.
4. To suggest ways and means for effective overseas
sea operations.
V. METHODOLOGY OF THE STUDY
In the present study, an extensive use of both
primary and secondary data was made. The study has been
made in a descriptive and analytical way.
SAMPLING DESIGN
Judgment sampling was followed to select the
sample respondent for the study. To obtain primary data, the
researcher approached 300 respondents out of 640 registered
freight forwarders in the area of Chennai, Tuticorin, Tirupur,
Coimbatore and Karur. The data collected from the sample
respondents has been subdued in to suitable tabulated forms.
www.theinternationaljournal.org > RJCBS: Volume: 01, Number: 08, June-2012 Page 13
COLLECTION OF DATA
The study has been used both primary and
secondary data.
PRIMARY DATA
The primary data collected from the selected
respondents, viz., Logistics operators, freight forwarding
agents and multi model transport operators in the study area.
Field survey techniques were used to collect the first hand
information from the respondents. A well structured
interview schedule was prepared to collect data from the
freight forwarders. Pilot study has been conducted with the
help of the few sample schedules and necessary
modification was carried down as and when required.
SECONDARY DATA
The Secondary data was gathered from the records
of freight forwarders association, internet sources, libraries
in Bangalore, Tuticorin, Chennai and Coimbatore.
VI. FRAME WORK OF ANALYSIS
The data collected were analyzed by applying the
tools viz -
Total Score multiplied by the values and Mean
Score and also Garrent Ranking has been used
to analyze the problems faced by the Freight
Forwarders.
VII. MAJOR FINDINGS OF THE STUDY
Major Findings of the study has been given in the following
heads:
The Freight Forwarders in the study area have
encountered innumerable problems with the exporters,
insurance companies, financial companies and port
authorities. The common problems faced by them were
studied with the help of Henry Garrent Ranking methods.
The problem related to the exporters are (i) nature of
product in different types (ii) over expectation regarding
promptness in service (iii) poor co-operation (iv) breach in
contract and lack of export knowledge. Ranking on each
problem was analyzed and rank based on the quantum of
problem faced by them, and the rank thus earmarked by the
respondents are converted into percentage position. For
each percentage Garrent score was calculated from the
standard table developed by Henry Garrent Ranking. The
details of ranking are shown in the following table:
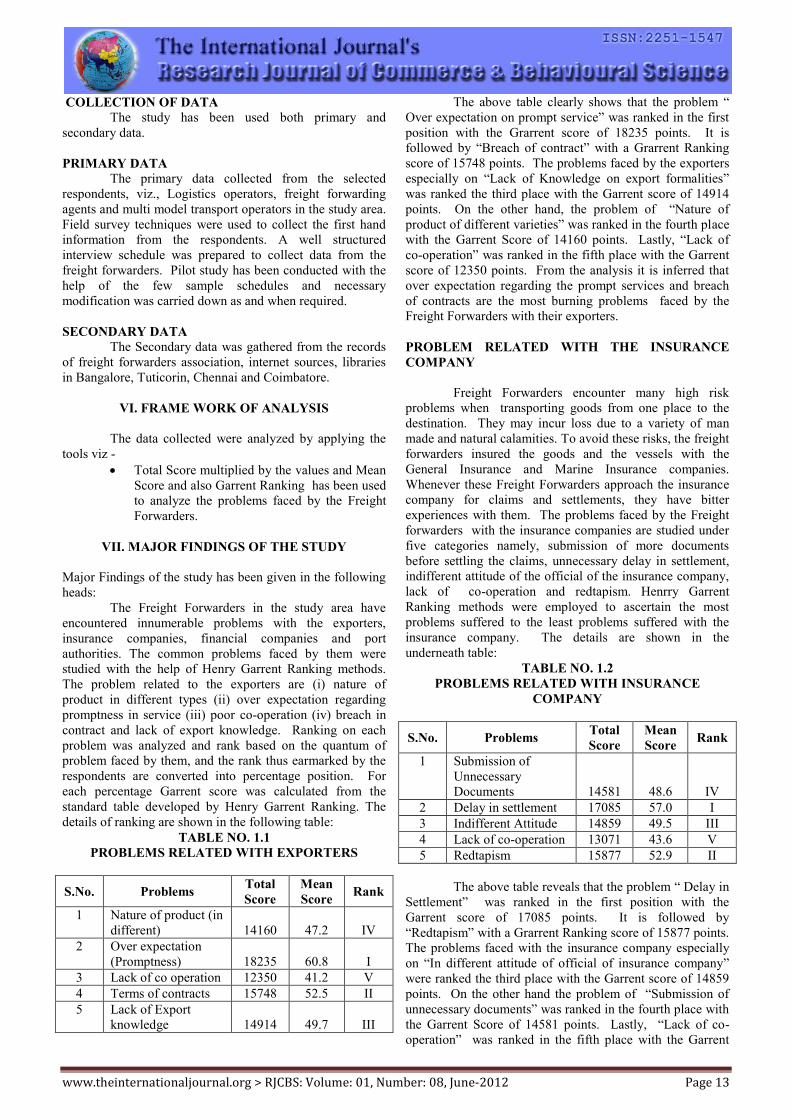
TABLE NO. 1.1
PROBLEMS RELATED WITH EXPORTERS
S.No. Problems Total
Score
Mean
Score Rank
1 Nature of product (in
different) 14160 47.2 IV
2 Over expectation
(Promptness) 18235 60.8 I
3 Lack of co operation 12350 41.2 V
4 Terms of contracts 15748 52.5 II
5 Lack of Export
knowledge 14914 49.7 III
The above table clearly shows that the problem “
Over expectation on prompt service” was ranked in the first
position with the Grarrent score of 18235 points. It is
followed by “Breach of contract” with a Grarrent Ranking
score of 15748 points. The problems faced by the exporters
especially on “Lack of Knowledge on export formalities”
was ranked the third place with the Garrent score of 14914
points. On the other hand, the problem of “Nature of
product of different varieties” was ranked in the fourth place
with the Garrent Score of 14160 points. Lastly, “Lack of
co-operation” was ranked in the fifth place with the Garrent
score of 12350 points. From the analysis it is inferred that
over expectation regarding the prompt services and breach
of contracts are the most burning problems faced by the
Freight Forwarders with their exporters.
PROBLEM RELATED WITH THE INSURANCE
COMPANY
Freight Forwarders encounter many high risk
problems when transporting goods from one place to the
destination. They may incur loss due to a variety of man
made and natural calamities. To avoid these risks, the freight
forwarders insured the goods and the vessels with the
General Insurance and Marine Insurance companies.
Whenever these Freight Forwarders approach the insurance
company for claims and settlements, they have bitter
experiences with them. The problems faced by the Freight
forwarders with the insurance companies are studied under
five categories namely, submission of more documents
before settling the claims, unnecessary delay in settlement,
indifferent attitude of the official of the insurance company,
lack of co-operation and redtapism. Henrry Garrent
Ranking methods were employed to ascertain the most
problems suffered to the least problems suffered with the
insurance company. The details are shown in the
underneath table:
TABLE NO. 1.2
PROBLEMS RELATED WITH INSURANCE
COMPANY
S.No. Problems Total
Score
Mean
Score Rank
1 Submission of
Unnecessary
Documents 14581 48.6 IV
2 Delay in settlement 17085 57.0 I
3 Indifferent Attitude 14859 49.5 III
4 Lack of co-operation 13071 43.6 V
5 Redtapism 15877 52.9 II
The above table reveals that the problem “ Delay in
Settlement” was ranked in the first position with the
Garrent score of 17085 points. It is followed by
“Redtapism” with a Grarrent Ranking score of 15877 points.
The problems faced with the insurance company especially
on “In different attitude of official of insurance company”
were ranked the third place with the Garrent score of 14859
points. On the other hand the problem of “Submission of
unnecessary documents” was ranked in the fourth place with
the Garrent Score of 14581 points. Lastly, “Lack of co-
operation” was ranked in the fifth place with the Garrent
www.theinternationaljournal.org > RJCBS: Volume: 01, Number: 08, June-2012 Page 14
score of 13071 points. From the analysis it is identified that
delay in settlement of their claims and Redtapism are the
most burning problems faced by the Freight Forwarders
with the insurance companies.
PROBLEMS RELATED WITH FINANCIAL
ASPECTS
The Freight Forwarders in the study area have
faced innumerable problems related with finance aspects.
The exporters are not properly settling their payment to the
freight forwarders for various reasons. The problem related
with financial aspects are (i) delay in payment (ii) cheque
bouncing (iii) demanding for extention of credit period (iv)
demand for less freight cost and (v) financial loss on the
exporter’s side. Ranking on each problem was analyzed and
rank based on the quantum of problem encountered by them
and the rank thus earmarked by the respondents are
converted into percentage position. The details of ranking
are shown in the following table:
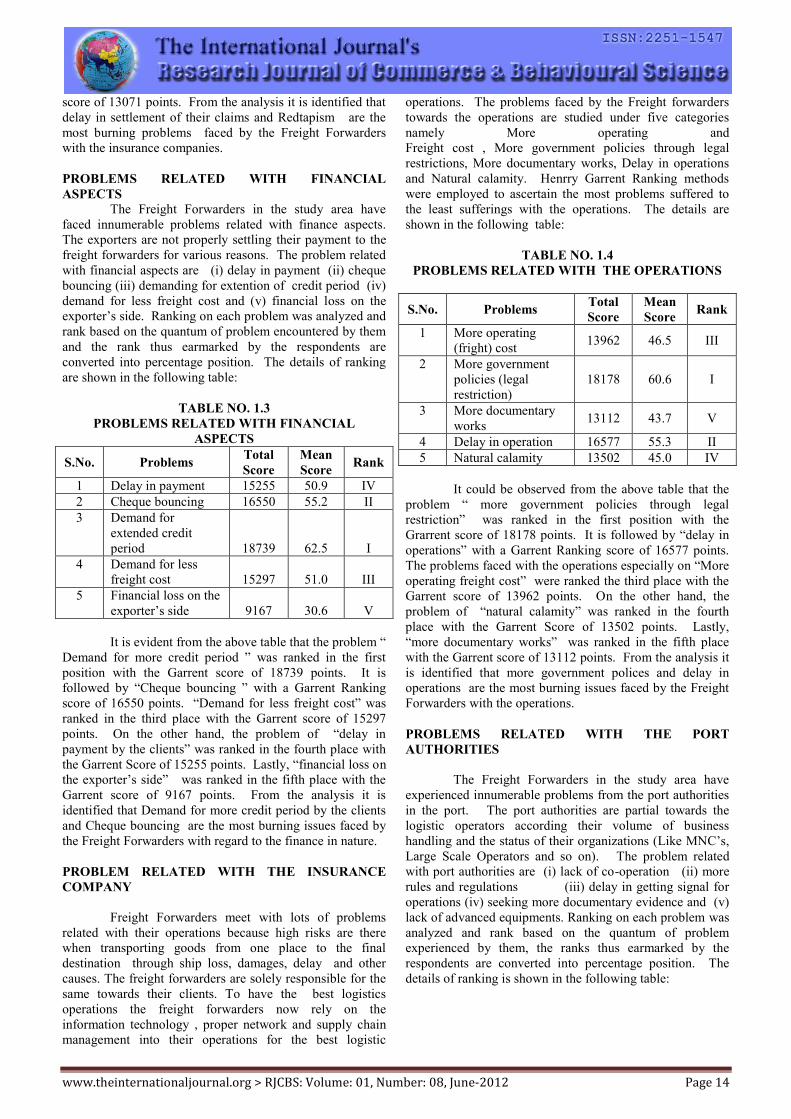
TABLE NO. 1.3
PROBLEMS RELATED WITH FINANCIAL
ASPECTS
S.No. Problems Total
Score
Mean
Score Rank
1 Delay in payment 15255 50.9 IV
2 Cheque bouncing 16550 55.2 II
3 Demand for
extended credit
period 18739 62.5 I
4 Demand for less
freight cost 15297 51.0 III
5 Financial loss on the
exporter’s side 9167 30.6 V
It is evident from the above table that the problem “
Demand for more credit period ” was ranked in the first
position with the Garrent score of 18739 points. It is
followed by “Cheque bouncing ” with a Garrent Ranking
score of 16550 points. “Demand for less freight cost” was
ranked in the third place with the Garrent score of 15297
points. On the other hand, the problem of “delay in
payment by the clients” was ranked in the fourth place with
the Garrent Score of 15255 points. Lastly, “financial loss on
the exporter’s side” was ranked in the fifth place with the
Garrent score of 9167 points. From the analysis it is
identified that Demand for more credit period by the clients
and Cheque bouncing are the most burning issues faced by
the Freight Forwarders with regard to the finance in nature.
PROBLEM RELATED WITH THE INSURANCE
COMPANY
Freight Forwarders meet with lots of problems
related with their operations because high risks are there
when transporting goods from one place to the final
destination through ship loss, damages, delay and other
causes. The freight forwarders are solely responsible for the
same towards their clients. To have the best logistics
operations the freight forwarders now rely on the
information technology , proper network and supply chain
management into their operations for the best logistic
operations. The problems faced by the Freight forwarders
towards the operations are studied under five categories
namely More operating and
Freight cost , More government policies through legal
restrictions, More documentary works, Delay in operations
and Natural calamity. Henrry Garrent Ranking methods
were employed to ascertain the most problems suffered to
the least sufferings with the operations. The details are
shown in the following table:
TABLE NO. 1.4
PROBLEMS RELATED WITH THE OPERATIONS
S.No. Problems Total
Score
Mean
Score Rank
1 More operating
(fright) cost 13962 46.5 III
2 More government
policies (legal
restriction)
18178 60.6 I
3 More documentary
works 13112 43.7 V
4 Delay in operation 16577 55.3 II
5 Natural calamity 13502 45.0 IV
It could be observed from the above table that the
problem “ more government policies through legal
restriction” was ranked in the first position with the
Grarrent score of 18178 points. It is followed by “delay in
operations” with a Garrent Ranking score of 16577 points.
The problems faced with the operations especially on “More
operating freight cost” were ranked the third place with the
Garrent score of 13962 points. On the other hand, the
problem of “natural calamity” was ranked in the fourth
place with the Garrent Score of 13502 points. Lastly,
“more documentary works” was ranked in the fifth place
with the Garrent score of 13112 points. From the analysis it
is identified that more government polices and delay in
operations are the most burning issues faced by the Freight
Forwarders with the operations.
PROBLEMS RELATED WITH THE PORT
AUTHORITIES
The Freight Forwarders in the study area have
experienced innumerable problems from the port authorities
in the port. The port authorities are partial towards the
logistic operators according their volume of business
handling and the status of their organizations (Like MNC’s,
Large Scale Operators and so on). The problem related
with port authorities are (i) lack of co-operation (ii) more
rules and regulations (iii) delay in getting signal for
operations (iv) seeking more documentary evidence and (v)
lack of advanced equipments. Ranking on each problem was
analyzed and rank based on the quantum of problem
experienced by them, the ranks thus earmarked by the
respondents are converted into percentage position. The
details of ranking is shown in the following table:
www.theinternationaljournal.org > RJCBS: Volume: 01, Number: 08, June-2012 Page 15
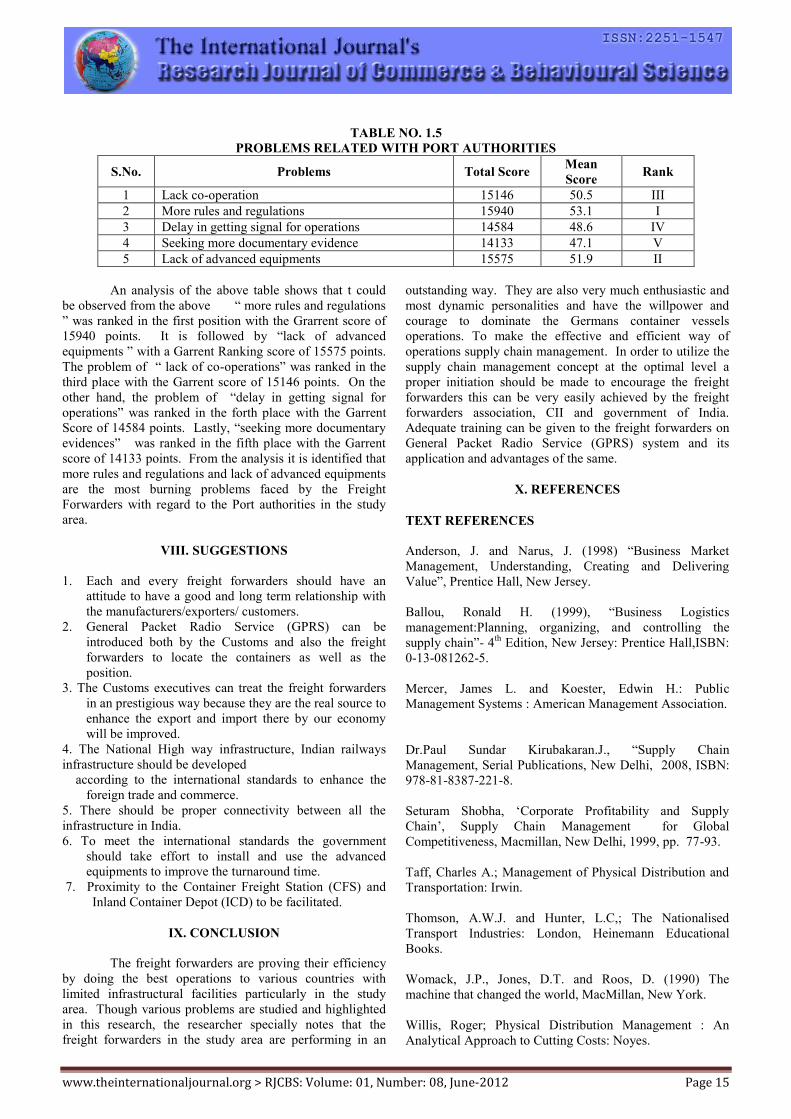
TABLE NO. 1.5
PROBLEMS RELATED WITH PORT AUTHORITIES
S.No. Problems Total Score Mean
Score Rank
1 Lack co-operation 15146 50.5 III
2 More rules and regulations 15940 53.1 I
3 Delay in getting signal for operations 14584 48.6 IV
4 Seeking more documentary evidence 14133 47.1 V
5 Lack of advanced equipments 15575 51.9 II
An analysis of the above table shows that t could
be observed from the above “ more rules and regulations
” was ranked in the first position with the Grarrent score of
15940 points. It is followed by “lack of advanced
equipments ” with a Garrent Ranking score of 15575 points.
The problem of “ lack of co-operations” was ranked in the
third place with the Garrent score of 15146 points. On the
other hand, the problem of “delay in getting signal for
operations” was ranked in the forth place with the Garrent
Score of 14584 points. Lastly, “seeking more documentary
evidences” was ranked in the fifth place with the Garrent
score of 14133 points. From the analysis it is identified that
more rules and regulations and lack of advanced equipments
are the most burning problems faced by the Freight
Forwarders with regard to the Port authorities in the study
area.
VIII. SUGGESTIONS
1. Each and every freight forwarders should have an
attitude to have a good and long term relationship with
the manufacturers/exporters/ customers.
2. General Packet Radio Service (GPRS) can be
introduced both by the Customs and also the freight
forwarders to locate the containers as well as the
position.
3. The Customs executives can treat the freight forwarders
in an prestigious way because they are the real source to
enhance the export and import there by our economy
will be improved.
4. The National High way infrastructure, Indian railways
infrastructure should be developed
according to the international standards to enhance the
foreign trade and commerce.
5. There should be proper connectivity between all the
infrastructure in India.
6. To meet the international standards the government
should take effort to install and use the advanced
equipments to improve the turnaround time.
7. Proximity to the Container Freight Station (CFS) and
Inland Container Depot (ICD) to be facilitated.
IX. CONCLUSION
The freight forwarders are proving their efficiency
by doing the best operations to various countries with
limited infrastructural facilities particularly in the study
area. Though various problems are studied and highlighted
in this research, the researcher specially notes that the
freight forwarders in the study area are performing in an
outstanding way. They are also very much enthusiastic and
most dynamic personalities and have the willpower and
courage to dominate the Germans container vessels
operations. To make the effective and efficient way of
operations supply chain management. In order to utilize the
supply chain management concept at the optimal level a
proper initiation should be made to encourage the freight
forwarders this can be very easily achieved by the freight
forwarders association, CII and government of India.
Adequate training can be given to the freight forwarders on
General Packet Radio Service (GPRS) system and its
application and advantages of the same.
X. REFERENCES
TEXT REFERENCES
Anderson, J. and Narus, J. (1998) “Business Market
Management, Understanding, Creating and Delivering
Value”, Prentice Hall, New Jersey.
Ballou, Ronald H. (1999), “Business Logistics
management:Planning, organizing, and controlling the
supply chain”- 4th
Edition, New Jersey: Prentice Hall,ISBN:
0-13-081262-5.
Mercer, James L. and Koester, Edwin H.: Public
Management Systems : American Management Association.
Dr.Paul Sundar Kirubakaran.J., “Supply Chain
Management, Serial Publications, New Delhi, 2008, ISBN:
978-81-8387-221-8.
Seturam Shobha, ‘Corporate Profitability and Supply
Chain’, Supply Chain Management for Global
Competitiveness, Macmillan, New Delhi, 1999, pp. 77-93.
Taff, Charles A.; Management of Physical Distribution and
Transportation: Irwin.
Thomson, A.W.J. and Hunter, L.C,; The Nationalised
Transport Industries: London, Heinemann Educational
Books.
Womack, J.P., Jones, D.T. and Roos, D. (1990) The
machine that changed the world, MacMillan, New York.
Willis, Roger; Physical Distribution Management : An
Analytical Approach to Cutting Costs: Noyes.

www.theinternationaljournal.org > RJCBS: Volume: 01, Number: 08, June-2012 Page 16
JOURNAL – RESEARCH PAPER REFERENCES
Anderson, D.L. and Lee Han, “Synchronized Supply Chains
: The New Frontiers,
Achieving Supply chain Excellence through Technology”,
Montgomery Research Inc., san Francisco, 1999, pp 12-21.
Ansari, A. and Modarress, B., “Just-in-Time Purchasing”,
The Free Press, 1990.
Mason, J. (1999). “Total cycle time compression and the
agile supply chain”.
International Journal of production economics,
1999. P.62.
Sheth, J.N. “A Model of Industrial Buyer Behavior”,
Journal of Marketing, October 1973.
REPORTS REFERENCES
Freight Forwarders Association Reports.
Indian Ports Associations Annual Reports.
Imaritime research report 2003.
The Economic Times - ET Knowledge series2002.
WEBSITES
http://www.imaritime.com
http://www.atlaslogistics.co.in
http://www.tradeport.org
http://www.ais.misstate.edu
http://www.cio.com/summaries/enterprise/scm/
http://www.apldirectlogistics.com
http://www.clml.org/
***
www.theinternationaljournal.org > RJCBS: Volume: 01, Number: 08, June-2012 Page 17
Assessing farmer perception towards Internet based
intervention: an empirical study
Dr. Sudeepa Banerjee, Associate professor,
MIS .Teach in MBA, MHRM and MPSM programs of the Calcutta University,
‘A quiet digital revolution is reshaping the lives of farmers
in remote Indian villages. In these villages farmers grow
soyabeans, wheat and coffee in small plots of land as they
have for thousand years. A typical village has no reliable
electricity and has antiquated telephone lines. The farmers
are largely illiterate and have never seen a computer. But
farmers in these villages are conducting e-business through
an initiative called e-Choupal, created by ITC, one of India’s
largest consumer and agribusiness communities.’ (Mohanbir
Sawhney, 2002).
Background
A large part of the Indian population lives in rural areas.
They have mostly low incomes, they are largely dependent
on monsoons for their harvest, they are plagued by illiteracy,
limited media reach and poor infrastructure and their
markets have unviable direct distribution systems.
The vicious circle of low incomes continues due to several
reasons. Some of them are the fragmentation of land that
adversely impacts productivity and quality of produce,
thereby reducing the bargaining power of the farmer. Wide
geographical dispersion results in limited or no real time
access to information and also makes whatever information
delivered, very expensive. The heterogeneity of farmers
imply, single farmer and multiple crops, so it becomes
difficult to customize the land or other requirements like soil
conditions; there is a perpetual need for investment and
hence cash and finally the weak infrastructure- whether it is
roads, telecommunication, power, irrigation or a distribution
system leading the farmers to depend heavily on middlemen
and money lenders.
Rural marketers also suffer a lot for the fragmentation on
account of low effort ratio, high cost of reaching due to the
geographical dispersion, not possible or worth customizing
on account of heterogeneity and a passive distribution
system because of poor infrastructure.
The major problems that are being faced by farmers are lack
of institutional support, lack of information on best farming
practices and weather, quality and information of inputs.
The presence of middle men in the chain lead to incorrect
pricing, quality and weightment, handling losses and waste
of time.
Information and Communication Technology
The revolution in information and communication
technology (ICT) is affecting people in all walks of life
today. Internationally, this revolution has facilitated the
globalization of the economy, business, finance and culture
(Gomez 1997; Heeks 1999). Today ICT constitutes the
fastest growing component of the global economy and the
Indian ICT spending is expected to grow 10.3 percent in
2012 and in that Services and Software will be the fastest
growing segment till the end of 2014(Gartner Press releases
, 2012 and 2011).
However, the rural community in most countries is out of
this growth map and Internet access in these areas is usually
very marginal if at all. India is no exception- while the
spread and use of information technology has been
phenomenal in urban areas the rural communities are still
largely left out (Agarwal, 2009).
There is a growing consensus that knowledge and
information are essential for empowering rural communities.
Communication is central to this process. Convergence of
technologies can help people share knowledge and
information. Information intermediaries like social workers,
educators and mass media can help rural communities
access relevant information. Internet technology can be used
for strengthening research and increasing farmer linkages
through better agricultural marketing, disaster mitigation
through forecasting, monitoring and early warning systems.
Relevance of use of Internet technology in Agriculture lies
in it ability to reduce isolation, facilitate dialogue, provide
information and skills training and encourage orderly
structure in the system.
Social empowerment
Participatory development is necessary in terms of
sustainability, relevance and empowerment and is
considered better than top-down development approaches
(Cooke and Kothari , 2002). The main endeavor in such
processes is to involve economically and socially backward
and neglected population in the decisions that affect their
lives (Guijt, 1999,Khwaja,2004). Participation, especially in
the context of community, is deeply linked to issues of
democracy, power, and asymmetries that historically exist
within communities. International organizations like the
World Bank and UNICEF have been dealing with
community participation through rapid rural appraisal,
participative rural appraisal and participative learning for
action. “Participation is viewed pragmatically and
ideologically—something that helps efficiency, satisfaction
and progress, but which is also morally right” (Mumford
1984) .The role and relevance of modern communication
technology towards social development and its improvement
is being studied by various researchers (Sahay and Avgerou,
2002; Madon and Sahay, 2002).
www.theinternationaljournal.org > RJCBS: Volume: 01, Number: 08, June-2012 Page 18
The extent to which a farmer can understand and adopt a
new technology depends on his experience with it. Strong
and positive experiences will influence better acceptability
amongst individuals and also groups. Certain group
characteristics influence empowerment. When participants
of a new technology interact with each other they make
meaningful changes in their behavior and influences
resulting in individual and collective empowerment.
Research has shown that participation and empowerment are
related to each other (Berger and Neuhaus, 1977; Thomas
and Velthouse, 1990; Rappaport, 1987).
The two underlying theoretical components in
empowerment are information and influence (Khwaja,2005,
pp.273-275). Information is a component of empowerment
where an individual or a community is able to provide
information about their own preference and gain information
from outside that may enhance their capacity to make
optimal choices. Thus access to information can help by
allowing people to make more informed decisions.
Participation can be considered a means of providing and
gaining information. Information exchange as a component
of empowerment implies that the users have to be otherwise
empowered as well as they may else perceive that there is
little chance of their preferences being considered.
While information is necessary it is not sufficient o produce
the desired outcome .There is another component called
influence or ‘bargaining power’(Khwaja, 2005,pp.274) that
is also required. Users may have access to information , but
unless they have the ability to influence the decision and
also know that they have this ability, they will have little
motivation to either provide or gain the requisite
information-this is the influence component of
empowerment which leads to decisions that may be
considered a less tangible asset.
Research question
Internet as a medium has been put to use in some rural areas
of India. It is necessary to investigate how the farmers have
perceived its use. A positive response and experience is
necessary for more farmers to use this medium thus
contributing to the ‘critical mass’ that can convert this
technology to a mass media.
The objective of this research includes an examination of the
perception of empowerment amongst farmers who use
Internet technology through e-Choupals. A modest attempt
has been made to fill up the gap by identifying the following
research question :
What are the effects of different elements of the e-Choupal
on the overall empowerment of farmers?
Study design
To answer this research question the researcher will be using
the case of ITC’s e-choupal. ITC is well known for its
corporate and social responsibility and it is this philosophy
that initiated the e-choupal system, where the business
model increased shareholders value as well as contributed to
social development. ITC envisioned this project by using
Internet as a medium.
ITC and e-Choupal
The ITC group of companies has a yearly turnover of Rs 7.5
billion and is involved in tobacco, cigarettes, paper and
packaging, paperboard manufacturing, hotels and tourism,
information technology and agricultural exports.
Of these its Agri Business Division is one of India’s largest
exporters of agricultural commodities. Initially the
agricultural commodity trading business was small
compared to International players. The opening up of the
Indian market around 1996 brought in international
competition. ITC took the route of information technology
through e-Choupals to create a competitive business that did
not need a large asset base. The e-Choupal has been able to
install computers with Internet access in rural farming
villages, where it serves both as a social gathering place for
exchange of information and an e-commerce hub. The
computer is typically housed in the Sanchalak’s house, who
is also a local farmer and is linked to the Internet via phone
lines or VSAT connectivity and normally serves around 10
villages within a radius of about five kilometers. There is an
initial investment to set it up and an annual maintenance
charge normally shared between ITC and the Sanchalak.
Using the system costs nothing to the farmer. While a pure
trading model does not require much capital investment, the
e-Choupal model, in contrast, has required ITC to make
significant investments to create and maintain its own IT
network in rural India and to identify and train local farmers
(Sanchalaks and Samayojaks ) to set up and manage each e-
Choupal.
Users of e-Choupal can use the computer to access daily
closing prices on local mandis(government –fair price
mandated markets),as well as to track global price trends or
find information about new farming techniques or about
fertilizers, weather , best global practices etc either by
themselves or with assistance from the Sanchalak who is
trained by ITC. Further they can also order quality seeds,
fertilizers and other products such as consumer goods from
ITC or its partners, at prices lower than those from village
traders ; the Sanchalak basically aggregates the village
demand of the various products and sends the order to an
ITC representative. At harvest time, ITC offers to buy the
crop directly from any farmer at prevailing prices, the
testing of quality is done scientifically and the farmer is
informed about the quality of his produce and the altered
price if any in view of poorer quality. If the farmer is willing
to sell , he then transports his produce to the local collecting
centre where it is weighed electronically and reassessed for
quality .The farmer gets paid for the crop as well as a
transportation and bagging fee immediately. The Sanchalak
on the other hand benefits from increased prestige and a
commission paid to him for all e-Choupal transactions. This
is in contrast to the normal trade route where the farmer sells
his produce to a small trader called a kaccha adat, who sells
the produce to a larger trader called pakka adat, who in turn
takes the produce to a local mandi or a market place, where
www.theinternationaljournal.org > RJCBS: Volume: 01, Number: 08, June-2012 Page 19
a larger trader buys the same. The mandi traders then
operate through brokers to negotiate prices with specific
companies like ITC and then sell. This long route results in
high procurement cost for companies, unfair price recovery
for farmers, loss in handling and also deterioration of the
quality of produce due to this time-consuming system.
Additionally, there is a long wait at mandi’s for farmers as
well as harassment in the hands of the various middlemen.
Further, the payment for the crops is also not scientific and
farmers have to wait very long to recover their dues.
Methodology
Model
An additive form of multiple regression model has been
considered for the research question as mentioned earlier
and postulated as:
Y= b0 + bi
n
i 1
Xi + , i=1…..4
where,
Y = mean value of overall empowerment for each
respondent
b0 = constant
bi = regression coefficient of the ith
constraint
Xi = [ (
N
j 1
Xj ) / N ] for each respondent
Xj = score on jth
item of each respondent
N= number of items of ith
construct
= Random error terms is assumed to be normally
distributed.
Hypothesis
The perception of farmers towards ith
construct will have a
positive impact on overall empowerment. Mathematically
H0 : B i= 0 against
H1 : Bi > 0
Questionnaire design
In the early stage of concept development (what is to be
measured and what can be measured), an extensive review
of literature on the subject and an analysis of possible
components to be measured have been done. Some were
established measures,while others were modified or
developed for this study based on intuition, knowledge and
experience.After identifying a set of possible items an
intensive discussion with a group of target respondents
(farmers using e-Choupal for trade and information) has
been conducted to assess the proposed concepts, definition,
terminology and final selection of the relevant items. In the
next stage, face-to-face in-depth interviews with managers
from ITC have been conducted to discuss all the items. After
consultation with two academicians, these items have been
confirmed and questions framed on them on a 5-point Likert
scale (1 = strongly disagree to 5 = strongly agree). The
Likert scale has been used as it is a reliable and commonly
used scale that can be easily interpreted .All the items are
framed in closed-end form.
For the purpose of pre testing the questionnaire a pilot
survey had been performed on 22 respondents.
Therefore, in this study farmer perception was
operationalized as a multidimensional concept and thus the
questionnaire finally consists of 19 items. These are all
refined items, which have been derived from 39 items by
repetitive factor analysis as well as consideration of standard
deviation of each item (rejected when standard deviation
was below 1). The dimensions or constructs that have been
considered are fair price, price information-current as well
as trend, faster recovery of dues, reduced dependence on
money lenders, language barrier, ease of use, soil testing
facility, weather information, information on fertilizers,
pesticides and best practices, increased productivity of land,
reduced wastage, availability of newer and better farming
products that include seeds, tools, fertilizers and pesticides,
reduced harassment and overall sense of empowerment.
To measure the underlying dimensions of these items,
exploratory factor analysis (PCA) has been performed and 4
dimensions have been revealed: (1) increase in income,
(2) inclusion/participation (Khwaja,2005, P.272), (3)
decision-making power (Renuka and Lekshmi, 2003) and
(4) additional benefits .The number of items varies from 3
to 5 between constructs. This ensures the questionnaire
satisfies the construct validity. As far as reliability is
concerned Cronbach alpha for each construct has been
calculated and it varies between 0.6 and 0.8 (Nunnally,
1994).
A single item that measures overall empowerment has been
also framed on a 5-point Likert scale which has been used as
a dependent variable in subsequent analysis.
Sampling technique and sampling size
The sample frame of the farmers was available; hence
simple random sampling technique was used. By this
technique a sample size of 200 had been drawn from a
population of 584.The sample size was more than 5% of the
population and hence this was a finite population and so the
sample size (180) has been given an adjustment by finite
population correction factor (FPCF) of 0.83, calculated as
FPCF= (N-n)/(N-1); N=population size, n=sample
size. Finally data have been collected from 150 , (FPCF x n)
respondents.
Method of interview
The researcher conducted a questionnaire-based survey with
farmers of wheat of the Basai ki Nagla village e-Choupal
near Hathras in western UP in 2009. Interviews were
conducted with Rana Sharma- Sanchalak, samyojaks, Mandi
adatiyas and ITC personnels to gain a better understanding
of the linkages among Internet, participatory development,
social development and empowerment.
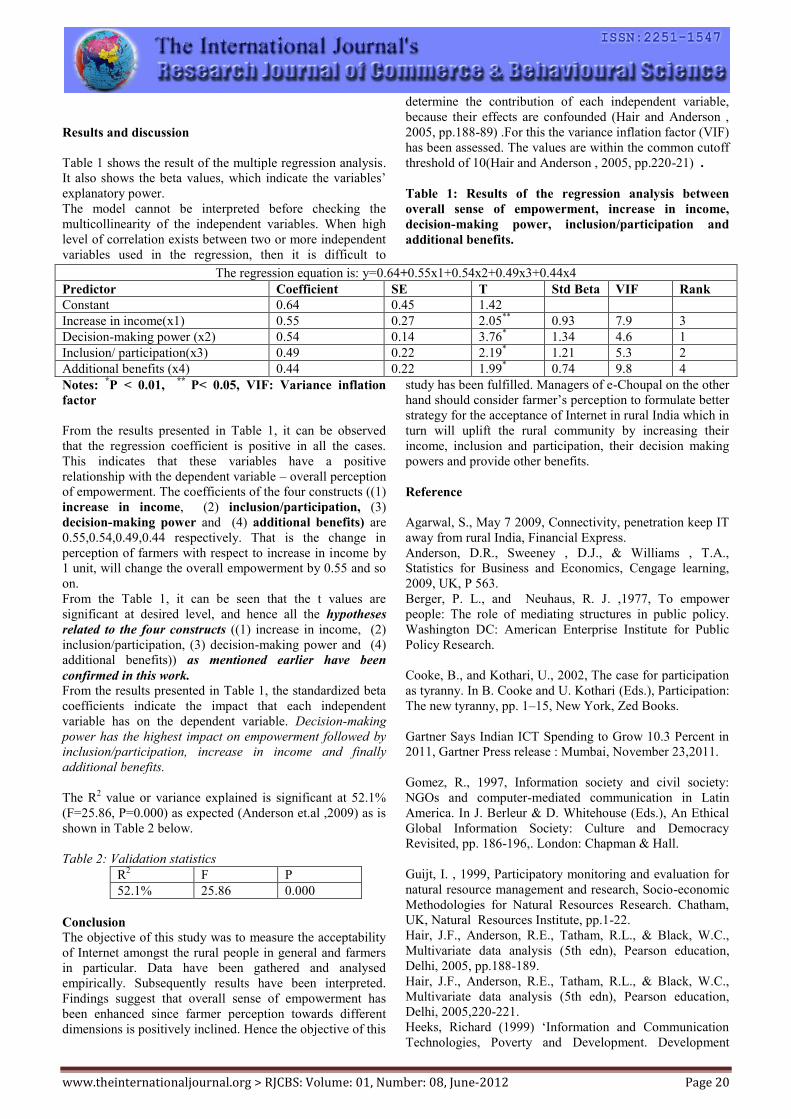
www.theinternationaljournal.org > RJCBS: Volume: 01, Number: 08, June-2012 Page 20
Results and discussion
Table 1 shows the result of the multiple regression analysis.
It also shows the beta values, which indicate the variables’
explanatory power.
The model cannot be interpreted before checking the
multicollinearity of the independent variables. When high
level of correlation exists between two or more independent
variables used in the regression, then it is difficult to
determine the contribution of each independent variable,
because their effects are confounded (Hair and Anderson ,
2005, pp.188-89) .For this the variance inflation factor (VIF)
has been assessed. The values are within the common cutoff
threshold of 10(Hair and Anderson , 2005, pp.220-21) .
Table 1: Results of the regression analysis between
overall sense of empowerment, increase in income,
decision-making power, inclusion/participation and
additional benefits.
Notes: *P < 0.01,
** P< 0.05, VIF: Variance inflation
factor
From the results presented in Table 1, it can be observed
that the regression coefficient is positive in all the cases.
This indicates that these variables have a positive
relationship with the dependent variable – overall perception
of empowerment. The coefficients of the four constructs ((1)
increase in income, (2) inclusion/participation, (3)
decision-making power and (4) additional benefits) are
0.55,0.54,0.49,0.44 respectively. That is the change in
perception of farmers with respect to increase in income by
1 unit, will change the overall empowerment by 0.55 and so
on.
From the Table 1, it can be seen that the t values are
significant at desired level, and hence all the hypotheses
related to the four constructs ((1) increase in income, (2)
inclusion/participation, (3) decision-making power and (4)
additional benefits)) as mentioned earlier have been
confirmed in this work.
From the results presented in Table 1, the standardized beta
coefficients indicate the impact that each independent
variable has on the dependent variable. Decision-making
power has the highest impact on empowerment followed by
inclusion/participation, increase in income and finally
additional benefits.
The R2 value or variance explained is significant at 52.1%
(F=25.86, P=0.000) as expected (Anderson et.al ,2009) as is
shown in Table 2 below.
Table 2: Validation statistics
R2 F P
52.1%
25.86 0.000
Conclusion
The objective of this study was to measure the acceptability
of Internet amongst the rural people in general and farmers
in particular. Data have been gathered and analysed
empirically. Subsequently results have been interpreted.
Findings suggest that overall sense of empowerment has
been enhanced since farmer perception towards different
dimensions is positively inclined. Hence the objective of this
study has been fulfilled. Managers of e-Choupal on the other
hand should consider farmer’s perception to formulate better
strategy for the acceptance of Internet in rural India which in
turn will uplift the rural community by increasing their
income, inclusion and participation, their decision making
powers and provide other benefits.
Reference
Agarwal, S., May 7 2009, Connectivity, penetration keep IT
away from rural India, Financial Express.
Anderson, D.R., Sweeney , D.J., & Williams , T.A.,
Statistics for Business and Economics, Cengage learning,
2009, UK, P 563.
Berger, P. L., and Neuhaus, R. J. ,1977, To empower
people: The role of mediating structures in public policy.
Washington DC: American Enterprise Institute for Public
Policy Research.
Cooke, B., and Kothari, U., 2002, The case for participation
as tyranny. In B. Cooke and U. Kothari (Eds.), Participation:
The new tyranny, pp. 1–15, New York, Zed Books.
Gartner Says Indian ICT Spending to Grow 10.3 Percent in
2011, Gartner Press release : Mumbai, November 23,2011.
Gomez, R., 1997, Information society and civil society:
NGOs and computer-mediated communication in Latin
America. In J. Berleur & D. Whitehouse (Eds.), An Ethical
Global Information Society: Culture and Democracy
Revisited, pp. 186-196,. London: Chapman & Hall.
Guijt, I. , 1999, Participatory monitoring and evaluation for
natural resource management and research, Socio-economic
Methodologies for Natural Resources Research. Chatham,
UK, Natural Resources Institute, pp.1-22.
Hair, J.F., Anderson, R.E., Tatham, R.L., & Black, W.C.,
Multivariate data analysis (5th edn), Pearson education,
Delhi, 2005, pp.188-189.
Hair, J.F., Anderson, R.E., Tatham, R.L., & Black, W.C.,
Multivariate data analysis (5th edn), Pearson education,
Delhi, 2005,220-221.
Heeks, Richard (1999) ‘Information and Communication
Technologies, Poverty and Development. Development
The regression equation is: y=0.64+0.55x1+0.54x2+0.49x3+0.44x4
Predictor Coefficient SE T Std Beta VIF Rank
Constant 0.64 0.45 1.42
Increase in income(x1) 0.55 0.27 2.05**
0.93 7.9 3
Decision-making power (x2) 0.54 0.14 3.76*
1.34 4.6 1
Inclusion/ participation(x3) 0.49 0.22 2.19* 1.21 5.3 2
Additional benefits (x4) 0.44 0.22 1.99* 0.74 9.8 4
www.theinternationaljournal.org > RJCBS: Volume: 01, Number: 08, June-2012 Page 21
Informatics’, Working Paper Series, Working Paper No. 5. ,
Manchester: Institute for Development Policy and
Management, University of Manchester.
Khwaja, A.I., Measuring the empowerment at the
community level : an economists’s perspective. In
Narayan,D(Eds),Measuring empowerment, cross discipline
perspectives. Washington,D.C, The World Bank, 2005,
pp.267-284.
Khwaja, A.I.,2004,Is increasing community participation
always good thing?, Journal of the European Economic
Association ,Vol.2(2-3), pp.427-436.
Madon, S., and Sahay, S., 2002, An information-based
model of NGO mediation for the empowerment of slum
dwellers in Bangalore, The Information Society, Vol.18 (1),
pp.13–19.
Mumford, E. , 1984, Participation—from Aristotle to today ,
in T. Bemelmans (Ed.), Beyond productivity: Information
Systems Development for Organisational Effectiveness
,pp.95–104,Amsterdam, the Netherlands, North-Holland
Press.
Nunnaly, J.L., and Bernstein, I.H., Psychometric theory, 3rd
ed, McGraw-Hill, New York, 1994, pp.83-112.
Rappaport ,J ,1987, Terms of empowerment / Exemplars of
prevention- Towards a Theory for Community Psychology,
American Journal of Community Psychology, Vol.15(2),
pp.121-148.
Renuka ,P., and Lekshmi ,D., 2003, Influence of female
earners on the economic status of the family-Some evidence
from the micro-level, Asian Economic Review., pp. 45-54.
Sahay, S., and Avgerou, C., 2002, Introducing the special
issue on information and communication technologies in
developing countries, The Information Society, Vol.18,
pp.73–76.
Sawhney Mohanbir , Fields of online dreams ,CIO
Magazine, October 15, 2002, accessed and downloaded
from http://www.itcportal.com/newsroom/press_oct15.htm
on 10/12/2008.
Thomas, K.W, and Velthouse, B.A ,1990,Cognitive
elements of empowerment,Academy of management
review,Vol.15,pp.661-681.
***
www.theinternationaljournal.org > RJCBS: Volume: 01, Number: 08, June-2012 Page 22
Financial inclusion for sustainable development: a
critical literature review-the role of commercial
banks & low-income peoples.
Prof. CHITTA RANJAN MISHRA.
ABSTRACT
This report examines evidence from the academic and
policy literature review about the financial capability &
saving of low-income people. The purposes of the study are
to provide a critical review of evidence about the low-
income people’s financial savings & the role of commercial
banks measurement, the programs used to promote their
saving capability & aware their knowledge about financial
product, services and the information uncovered about the
programs by evaluations. Financial knowledge & saving is
the most important for financial inclusion. Financial product
knowledge has been proposed widely as an effective
approach to preparing people to manage their finances.
Financial capability includes both the ability to act
(knowledge, skills, confidence, and motivation) and the
opportunity to act (through access to quality financial
products and services). The data required for the study have
collected from the secondary sources. Banks are essential
for each country’s economy, since no growth can be
achieved unless savings are efficiently channeled into
investment. In this respect, the lack of a full-fledged banking
system has often been identified as a major weakness of the
centrally planned economies. Therefore, reforming the
banking sector in the former communist countries and
creating a new culture of trust and confidence has been a
crucial task in the process of transition to a market economy.
The banks should encourage the people to access banking
services by ways of no frills account, financial inclusion
campaign and business correspondent etc. As a financial
inclusion strategy, developing inclusive financial systems
should give priority, which is financially and socially
sustainable.
Keywords: Financial Inclusion , role of commercial bank,
poverty Alleviation , Economic development, knowledge
about Financial product & services.
INTRODUCTION
Financial inclusion is an idea whose time has finally come
in India. It will enable hundreds of millions of low-income
people to improve their economic and social status by
participating in the financial system. Not only have the
government and the Reserve Bank of India become very
keen to promote inclusion, successful business models have
at last emerged to serve the poor in a profitable manner.
Capital, both debt and equity, is now available for this sector
at reasonable cost even as better technology and Internet
connectivity are making it easier and less expensive to reach
the poor. Financial inclusion is the delivery of financial
services at an affordable cost to low-income households. It
is estimated that nearly 500 millions Indians are not served
well (or even at all) by the current financial system. There is
a close connection between poverty and financial exclusion,
which can lead to estrangement, disaffection and reduced
participation in society by low-income families. The
government of India and the Reserve Bank of India have
been very concerned about financial exclusion and the great
harm it causes to the society. The RBI has taken many
initiatives to spread banking services such as expanding the
number of rural bank branches as well as allowing the
banking correspondent model. The scale of the problem of
financial exclusion can be daunting. Nearly half of the
population and a majority in rural Indians do not have bank
accounts. Less than 10% of India’s 600,000 villages have a
bank branch. Nearly 80% of the Indian population is without
life or health insurance. Penetration of mortgages, mutual
funds and pension products is also very low. The world is
full of poverty reducing strategies. Human imagination and
creativity know no boundaries in how to overcome poverty.
If they were all successful, the abolition of poverty might be
in sight. However, only few of the many imaginable poverty
reducing strategies are actually put to use, and most of those
are incomplete in the sense that they are put only to partial
use. There are many reasons for this situation. Lack of
resources is the reason most often mentioned. Lack of
knowledge on how to obtain efficient poverty reduction is
one. Inaccurate use, or misuse of knowledge is another.
Administrative inadequacy in organizing and implementing
a poverty reducing strategy can be considered another
reason for failure. Such arguments can be classified as
technical reasons. The underlying assumption is that if
knowledge, resources and administrative expertise increase,
then poverty reduction would also increase. The explicit aim
for donors and others is to work towards improving such
technical defaults. It is important that they continue to do so.
At the same time, we know that other and much stronger
forces intervene to prevent poverty reduction. On the one
hand we have forces that have a direct interest in neglecting
poverty reduction or even trying to stop it from being
implemented and carried out in an efficient manner. There
are many reasons for such an attitude. It may be the dislike
of poor people, the dislike of sharing resources or the fear of
changing a social structure in favor of the poor. Some of
those poverty producing forces are intended because vested
interests are linked to continued poverty. Other poverty
producing forces are unintentional, but still powerful. As a
matter of fact, it can be argued that unintentional poverty
production has a larger impact on poverty formation than
www.theinternationaljournal.org > RJCBS: Volume: 01, Number: 08, June-2012 Page 23
direct poverty production. The relevance of the argument is
here that poverty reducing strategies cannot be understood
unless one takes into account also the forces that work
against poverty reduction. The negative forces built into a
counter-strategy can be political, cultural, economic or
symbolic. The latter might be as important in terms of
resistance to a poverty reducing strategy as the other three.
If this argument is correct poverty reducing strategies need
to be analyzed and understood not only in terms of intended
positive effects. It is just as necessary to analyze and
understand the likely counter forces that come into play
when a new poverty reducing strategy is introduced.
Otherwise the poverty reducing strategy is doomed to fail.
The measures that need to be taken to bring the counter-
strategies under control, or neutralize their effect on the
intended poverty reduction, are not part of the ordinary
curriculum of poverty reduction. It is taken for granted that
“everybody” wants poverty reduction. The reality is
different. There are severe conflicts surrounding most
poverty reducing efforts, in particular those that call for
more comprehensive redistribution or changes in the social
structure. A model of conflict is more adequate. However, to
work within a model of conflict calls for a reorientation of
those responsible for poverty reduction. It means among
other things to identify the counteractive forces and to
develop ways of dealing with actors who are often among
the powerful people. So far poverty reducing measures have
not been developed within such a context. In the following I
shall outline a set of current poverty reducing strategies as
they are played out on different levels. The readers will be
invited to identify counteracting strategies and the actors
and interests behind such strategies. The time ate goal is to
learn how to protect poverty reducing strategies from
counterstrategies and carry them through to greater
efficiency. This may be asking too much since this is a
infield hat politicians and administrators have so far been
reluctant to enter, and perhaps with good reason. Financial
literacy levels are extremely low. Even though microfinance
institutions have expanded very fast in the last five years,
they still only cover about one fifth of low-income
households and they to meet only one tenth of the credit
needs of the poor. While it is a daunting challenge in size
and scope, financial inclusion is also a great social and
business opportunity. Among the potential businesses that
will benefit from more inclusion are business
correspondents who can bring simple banking services as
wells insurance and even pension schemes to the poor.
LITERATURE REVIEW
Banks play an important role in meeting credit need of
people. More studies have attempted to analyze the role of
commercial banks in financial inclusion for sustainable
development. The RRBs and commercial banks in the
economic development and relation with other
developmental programmes. An attempt in this section has
been made to review some important research studies.
Finance Minister Pranab Mukherjee (2010) said financial
inclusion was a key determinant of sustainable and inclusive
growth which could unlock the vast hidden potential of
savings consumption and investment propensities of the
poorer sections of society.
Transact the national forum for financial inclusion, (2007 )
Financial inclusion is a state in which all people have access
to appropriate, defined financial products and services in
order to manage their money effetely. It is achieved by
financial literacy and financial capability on the part of the
consumer and financial access on the part of product,
services and advice suppliers.
Farhat Husain (1986) has made a detailed analysis of the
development of Commercial banks in India in the light of
reorientation of banking policy, credit planning and resource
mobilization for the regional development.
Choubey, B.N. (1983) has evaluated that Commercial Banks
have failed to fill the serious gap and deficiencies in farm
credit, which the RRBs could manage to do. Choubey
emphasized that the NABARD would be required to pay
special attention to the depoliticisation of the agricultural
credit and government credit agencies. He suggested that
NABARD might help the agricultural and rural sector in
raising their productivity at reasonable faster rate.
Shetty (1997) in his studies that the ‘social banking’ policies
being followed by the country resulted in widening the
‘geographical spread and functional reach’ of commercial
banks in rural area in the period that followed the
nationalization of banks.
NABARD (1999) remarked that the despite having a wide
network of rural bank branches in India which implemented
specific poverty alleviation programmes that sought creation
of self employment opportunities through bank credit, a very
large number of the poorest of the poor continued to remain
outside the fold of the formal banking systems.
Gundannavar, V.R. (1992) has highlighted the role of banks
in implementing social banking schemes to keep pace with
changing social needs. He has strongly opposed any move to
reduce resources allocation to priority sectors, which will
have an adverse impact on the agricultural credit. He has
suggested to increase higher interest rate on commercial
lending and to continue concessional rate of lending to
priority sectors.
Barman, K.K. (1994) has made an analytical study on the
implications of financial sector reforms on rural credit
delivery system. He has found that implications are of wide
spread; on interest rate of agricultural loans, lending rates,
priority sector lending, reserve requirements and
institutional restructuring.
Rangarajan, C. (1996) has identified three to four major
factors which would have impact over the future banking
operation including progressive de-regulation of interest
rates, a diversified competitive market place, market
determined exchange rate mechanism and technological
progress. He suggested the banks to provide credit to
agriculture and allied sector as provision of credit to high-
www.theinternationaljournal.org > RJCBS: Volume: 01, Number: 08, June-2012 Page 24
tech agriculture which is almost equal to providing credit to
industry.
Vaidya, B.V. (2002) has made a comprehensive effort to
highlight some of the aspects of rural development of the
country under the policy of liberalisation and globalisation,
including economic aspect, agricultural aspect, industrial
aspect, infrastructural aspect and management aspect. From
his analysis, he has drawn the conclusion that a
comprehensive methodology will be necessary for rural
development which is the bed-rock of development for the
whole country.
Ansari (2007) in her study reveals that reaching the poorest
and whose credit requirements were very small, frequent
and unpredictable, was found to be difficult. Further, the
emphasis was on providing credit rather than financial
products and services including savings, insurance, etc. to
the poor to meet their simple requirements. Therefore, need
was felt for alternative policies, systems and procedures,
savings and loans products, other complementary services
and new delivery mechanisms, which would fulfill the
requirements of the poorest.
Shylendra, (1998) spoke of SHGs as meaning small
informal associations created for the purpose of enabling
members to reap economic benefit out of mutual help,
solidarity, and joint responsibility. The benefits include
mobilization of savings and credit facilities and pursuit of
group enterprise activities. The group-based approach not
only enables the poor to accumulate capital by way of small
savings but also helps them to get access to formal credit
facilities.
To Beck & De la Torre, (2006) financial inclusion should
signify access to a range of different financial services, the
percentage of people in a given area with access to a bank
account is the typical measuring stick for breadth of
financial services.
Karmarkar, K.G.(1997) has highlighted the role of Micro
financing (SHGs) on the rural credit delivery system in the
state of Orissa with example of successful projects in the
different parts of the state. He has suggested for active
participation of banks and other development agencies to
promote micro financing in large scale to accelerate the pace
of rural development.
Biswal, D. and Dash, H. (1997) have attempted to study the
recovery phenomenon of rural bank credit in Orissa. The
banks in financing rural development are of the view that
poor recovery and mounting overdue are the major huddles
faced by them. They have suggested for adequate
development of rural infrastructure in the state to improve
the income and financial condition of rural poor which in
turn will improve the recovery performance of banks in the
state.
Verrashekharappa (1997) in his work on “Institutional
Finance for Rural Development” has highlighted the
importance of institutional finance on farm sector in a
changing perceptive. Taking into account the transaction
cost, utilization of loan, repayments and over dues, he has
advocated for policy implications to be implemented more
cautiously to reduce the gap between bank credit and farm
sector and to remove the size of landholding as collateral
security against farm credit..
World Bank (2008) financial inclusion is also influenced by
specific credit needs of various segment people arises for a
number activities such as housing, microenterprises,
agriculture difficulties in accessing formal sources of credit,
the poor individuals and small savings or internal resources
to invest in housing, health and education, and opportunities.
NEED FOR THE STUDY
The economy is presently in a phase of rapidly rising
income, rural and urban, arising from an expansion of extant
economic activities as well as the creation of new activities
including corporate profitability which has exhibited
sustainable trends and increasing consumer incomes thereby
riding on the growth momentum. All of these developments
suggest that the demand for financial services, both for
savings as well as production purposes, will be greater than
has been the case in the past, and there will be many new
entrants in need of financial services who have not hitherto
been served. Financial inclusion as a topic has attracted
global attention in the recent past. For our own country
where almost 70 percent of population lives in the rural
areas and engages in agriculture and allied activities,
financial inclusion assumes paramount importance indeed,
and is an utmost necessity for a country where a large
number of the world’s highest poverty stricken population
resides. The bank provides a no frills Savings Bank Account
to all members of the lower income groups. As a next step,
small overdraft facilities are allowed in the Savings Bank
Accounts in order to cater to the account holder’s general
purpose or consumption needs. Those who are engaged in
income generation activities were provided with general
credit card facility with a flexibility of roll over facility.
Opening no frills account with a small overdraft or GCC is
only the first step in building the relationship which would
require sustained efforts to ensure that the banking
relationship with the customer is fashioned to meet his
needs. The technology should have a clear focus on
relatively unbanked and under reserved areas rather than
competing aggressively in already well served areas. There
is a clear need to vastly increase the numbers served by
existing branches for saving, loan and remittances. It is
hoped that the new KYC norms for male value accounts will
go a long way in ensuring this. The financial services for
rural areas will need to be supplemented by organizing
support for ancillary activities and knowledge
dissemination. Farmers training centers, village knowledge
centers, RUDSET as set up by a few banks will need
multiplication for ensuring sustainable development. With
the gradual mushrooming of SHG programmers in the rural
areas, there is a need for scaling up to cover productive
loans while ensuring that the process of group formation and
capacity building is given sufficient time to allow social
capital and democratic processes to take root.
www.theinternationaljournal.org > RJCBS: Volume: 01, Number: 08, June-2012 Page 25
OBJECTIVES OF THE STUDY
This study has the main objectives:
To determine the level of awareness of people in
various financial products and services and more
importantly quality as a factor of financial
inclusion.
To study the impact of SHG bank linkage program
& low income people on promotion of financial
inclusion in rural and urban areas in term of access
to banks, saving and loan by the SHG members.
To make suggestions for improvement of the
present situation which will lead to sustainable
development?
STATEMENT OF THE PROBLEM
Financial exclusion is excluding people without of
affordable credit, savings, insurance assets and money and
bank advices. The financial excluded section largely
comprises marginal framers, landless laborers, self
employed and unorganized sector enterprises, urban slum
dwellers, migrants, ethnic minorities and socially excluded
groups, senior sector and women. To achieve greater
financial inclusion, financial services should reach the poor
of socially excluded group’s particularly poor people micro
finance banks and other financial institution has played a
vital role in filling up this gap. This study helps us to know
the financial inclusion position, awareness level, towards no
frills account and saving and credit behavior of the low
income groups.
RESEARCH DESIGN AND METHODOLOGY
The research shall focus on the problems they face with
regard to basic banking needs and identify a range of
particular difficulties likely to be faced relating to the use of
bank accounts, products and services. The study is analytical
and exploratory in nature and makes use of Secondary data.
The data of the study has been collected mostly from the
secondary sources. The secondary data have been collected
from various publications and different government and
non-governmental sources. The data collected from
secondary sources have been suitably edited, analyzed and
interpreted according to requirement of the study. The
purposes of the study are to provide a critical review of
evidence about low-income and at-risk people on how their
financial capability is measured, what programs are used to
promote their financial literacy, and what evaluations of the
programs uncover about them.
THE ROLE OF COMMERCIAL BANKS
‘Banking’’ activity involves acceptance of deposits and
lending for investment of money. It facilitates business
activities by providing money and certain services that help
in exchange of goods and services. Banks are such places
where people can deposit their savings with the assurance
that they will be able to withdraw money from the deposits
whenever required. Banks have an important role in helping
people to deal with financial distress. People earn money to
meet their day-to-day expenses on food, clothing, education
of children, housing etc. They also need money to meet
future expenses on marriage, higher education of children, a
building of their own and other social functions. These are
heavy expenses in the long run which can be met if some
money is saved out of the present income. Savings is also
necessary to meet the exigencies of old age and ill health
when it may not be possible for people to work and earn
their living. People who wish to borrow money for
business and other purposes can also get loans from the
banks at reasonable rates of interest. On the basis of their
deposit, the banks also grant loans and advances to farmers,
traders and business men for productive purposes. The rate
of interest is generally higher than the rate of interest
allowed on deposits. Fees are also levied for the various
other services rendered to the business community and
public in general. Therefore banks contribute to the
economic development of the country. In order to
understand the relationship of banks and the environment,
the basic role of a bank is to receive funds from customers
by way of deposits and allocate these funds where there is a
need or shortage of capital, which is called financial
intermediation. However through the evolution of financial
services, the role has a broader means so as to include
among others, consumer credit, mortgage leasing, treasury,
securities trading and insurance. Finance is universally
acknowledged as the most important contributor to growth
and empowerment in modern day context; financial
inclusion has emerged as a concept uppermost before
government, planners, financial sector players, socio-
economic organizations etc. All across the globe, a
definition of financial inclusion, embracing all its essential
aspects could be like this. ‘‘It is the delivery of financial
services at an affordable cost to the vast sections of
disadvantaged and low income groups.’’ In the Indian
context, a specialty will be the coverage of rural areas as the
main target in view of the concentration of these vulnerable
groups in such areas. It is true that financial inclusion and
poverty alleviation cannot be separated but components like
saving, investment, credit, insurance and remittance should
be included in financial inclusion.
Moreover, financial inclusion emphasizes the need to
include maximum number of people under formal financial
systems. The most important part of financial services in a
region is typically measured by the number of people who
have access to bank accounts. The financial inclusion in the
forms of the growth in bank accounts of scheduled
commercial banks and the changes below poverty line
population. As a poverty education strategy, developing
inclusive financial systems should be given priority, which
is financially and socially sustainable.
The role of commercial banks for sustainable development
is linked to increased savings mobilization and credit
provision in rural areas which allows rural households to
better accumulate capital and to obtain loans for longer term
productive investments. Interest rates on loans and deposits
are attractive relative to those available in informal markets.
www.theinternationaljournal.org > RJCBS: Volume: 01, Number: 08, June-2012 Page 26
THE ROLE OF BANKS IN FINANCIAL INCLUSION
The economy is presently in a phase of rapidly rising
income, rural and urban, arising from an expansion of extant
economic activities as well as the creation of new activities
including corporate profitability which has exhibited
sustainable trends and increasing consumer incomes thereby
riding on the growth momentum. All of these developments
suggest that the demand for financial services, both for
savings as well as production purposes, will be greater than
has been the case in the past, and there will be many new
entrants in need of financial services who have not hitherto
been served. Financial inclusion as a topic has attracted
global attention in the recent past. For our own country
where almost 70 percent of population lives in the rural
areas and engages in agriculture and allied activities,
financial inclusion assumes paramount importance indeed,
and is an utmost necessity for a country where a large
number of the world’s highest poverty stricken population
resides.
The bank provides a no frills Savings Bank Account to all
members of the lower income groups. As a next step, small
overdraft facilities are allowed in the Savings Bank
Accounts in order to cater to the account holder’s general
purpose or consumption needs. Those who are engaged in
income generation activities were provided with general
credit card facility with a flexibility of roll over facility.
Opening no frills account with a small overdraft or GCC is
only the first step in building the relationship which would
require sustained efforts to ensure that the banking
relationship with the customer is fashioned to meet his
needs. The technology should have a clear focus on
relatively unbanked and under reserved areas rather than
competing aggressively in already well served areas. There
is a clear need to vastly increase the numbers served by
existing branches for saving, loan and remittances. It is
hoped that the new KYC norms for male value accounts will
go a long way in ensuring this. The financial services for
rural areas will need to be supplemented by organizing
support for ancillary activities and knowledge
dissemination. Farmers training centers, village knowledge
centers, RUDSET as set up by a few banks will need
multiplication for ensuring sustainable development. With
the gradual mushrooming of SHG programmes in the rural
areas, there is a need for scaling up to cover productive
loans while ensuring that the process of group formation and
capacity building is given sufficient time to allow social
capital and democratic processes to take root.
CONCLUSION
Financial inclusion becomes a major pre-requisite to poverty
alleviation. Reserve Bank of Indias vision for 2020 is to
open nearly 600 million new customers' accounts and
service them through a variety of channels by leveraging on
information technology. However, improper repayment need
for additional workforce, time consumption, high cost and
illiteracy are continued to be a road block to financial
inclusion in many areas. Consequently, many banks are not
adopting full fledged financial inclusion plan. The banks
should step up to overwhelm all these problems and to
disseminate its service to remote area. The banks should
encourage the people to access banking services by ways of
no frills account, financial inclusion campaign and business
correspondent. The government should encourage the banks
to adopt financial inclusion by means of financial assistance,
advertisement and awareness programme etc. to achieve the
Inclusive Growth.
SUGGESTION
India needs to develop a low-cost bank branch
model, possibly attached to village post office.
Bank should open small extension counters at
organization providing public utility services such
as local schools, primary health care centre, village
mandies, farmers association and bus stops etc.
Reserve Bank and Government should give the
suggestion to commercial banks to promote the
financial product and services of banking through
all the educational institution (primary, secondary
& higher secondary)
The RBI should mandate that commercial banks
have a certain percent of their portfolio in small
loans. In addition, important social considerations
should be factored into loan decisions. The children
have to be attending a school before they are
eligible for a loan. Similar conditions should be
imposed for eligibility of loans in India. The
government could also add extra incentives to lend
in Rural areas
India needs to expand the current business
correspondents model to allow microfinance
institutions, NBFCs and other profit-powered
companies to use correspondents.
The government of India should help develop
financial literacy among the population,
particularly in low-income families. That can be
done by teaching it in primary schools, high
schools and colleges.
Telecom companies should be allowed to provide
payments and money transfer services.
The community-based financial systems like the
chit funds need to be revived and strengthened.
They serve as a very useful savings and credit
function and result in local growth and
employment.
Post office employees should be trained and given
incentives to market savings, investment and
pension products. Some of these products have
already been developed by the post office but have
not been marketed effectively.
The banks should step up to over whelm all these
problems and to disseminate its service to remote
area. The banks should encourage the people to
access banking services by ways of no frills
account, financial inclusion campaign and business
correspondent. The government should encourage
the banks to adopt financial inclusion by means of
financial assistance, advertisement and awareness
www.theinternationaljournal.org > RJCBS: Volume: 01, Number: 08, June-2012 Page 27
programme etc. to achieve the Inclusive Growth.
We must promote the financial
inclusion aggressively to serve our own low-
income families but also to show ways to improve
the life of poor people around the world.
REFERENCES
1- Ghorude, K.N. (2009). “Micro Finance for Financial
Inclusion and Sustainable Rural Development”, Southern
Economist, Vol. 48, No.1, PP.47 – 50. �
2- Manoharan, B. “A study on commercial banks in India –
An overview”, Indian Journal of Marketing, Vol. 45, No.1
3- Muthiah Manoharan, P., and Krishnaveni Muthiah.
(2010). “Financial Inclusion in the Indian Rural Area
Context – A Micro level Study” Research Highlights,
Vol. 20, No.2, PP.71 – 74.
4- Narendra. M (2011). “Financial Inclusion Gains
Urgency”, The Hindu Survey of Indian Industry.
5- Beck, T., Demirguc - Kunt, A. & Levine, R. (2007)
‘‘Finance, Inequality and the Poor’’, Journal of Banking and
Finance, 28, 423-442.
6- Raj Kapila, and Uma Kapila, (Eds.) (2008). “Inclusive
Growth: The Role of Banksin Emerging Economies”,
Economic Developments in India, Academia Foundation.
7- Sendhilvelan, M., and Karthikeyan, K., (2006) „No Frills
Account: A Basic Drive for Financial Inclusion”, Southern
Economist, Vol. 45, PP.13 – 14.
8- Subhash Narayan, (2011). “Fund to Boost Financial
Inclusion in the Works”,
http://news.in.msn.com/business/article.aspx?cp-
documentid=4833211
9- Usha Thorat (2007). Financial Inclusion - the Indian
Experience. Financial Inclusion Conference. London. BIS
Review.
10- Vighneswara Swamy and Vijayalakshmi, “Role of
Financial Inclusion for Inclusive Growth in India – Issues
and challenges”,http://skoch.in/fir/Role%20of%20Financial
%20Inclusion%20for %20Inclusive%20Growth%20in%20I
ndia.pdf
11- Chandan Kumar Goyal, (2008), “Financial inclusion in
the North Eastern Region of India with Special Reference to
Assam”, The ICFAI Journal of Applied
Finance, Vol. 14, No. 12.
12- Dr.Rakesh Mohan, (2006), “Economic Growth,
Financial Deepening and Financial Inclusion”, Deputy
Governor of the RBI at the Annual Bankers’ Conference,
Hyderabad, November, 3.
13- Dweep, I., Rakesh Mohan Annual Bankers’ Conference,
(2006), “Economic Growth, Financial Deepening and
Financial Inclusion”, Hyderabad, November.
14- Mitra Rona, (2006), “Financial Inclusion: Meeting the
Challenge”, People’s Democracy, April 22 and 29, available
at 222.pd.cpim.org.18.
***
www.theinternationaljournal.org > RJCBS: Volume: 01, Number: 08, June-2012 Page 28
Determinants of Job Satisfaction: A Study on
Bangladesh Perspective
Fazlul Kabir Rabbanee, Graduate School of Business Curtin University, Perth Australia
Sanoara Yasmin, University of Information Technology and Science
Chittagong Campus, Bangladesh
Abdullah Al Mamun, Faculty of Economics and Management Sciences
International Islamic University, Malaysia, Kuala Lumpur
Abstract:
Job satisfaction as an attitude resulting from a balancing and
summation of many specific likes and dislikes experienced
in connection with the job. Extant literature mostly focused
on job satisfaction in developed world context.
Determinants of job satisfaction in developing world context
are largely ignored whereas there are significant difference
among the nature, personality and culture of the employees
of developed and developing countries. This paper attempts
to explore the determinants of job satisfaction in Bangladesh
perspective. It focused on six factors – Job, Pay, Promotion,
Supervision, Colleagues and Environment as the key
determinants of job satisfaction based on the extant
literature. The study conducted a survey based on structured
questionnaire, which revealed that job, pay, promotion,
supervision have significant impact on job satisfaction while
other two factors – colleagues and environment are not
found to have significant impact on job satisfaction of
Bangladeshi employees. At the end, this paper suggest that,
in order to attain the job satisfaction of the employees, the
human resource managers of Bangladesh should concentrate
more on the nature of the job, promotion, payment and
supervision more than colleagues and the environment of
the office / job.
Prologue
Specific employee attitude relating to job satisfaction is of
major interest in the field of organizational behavior and the
practice of human resources management now (Tett and
Meyer 1993). The interest steamed from the belief that the
satisfied employees are more productive than dissatisfied
employees are. This interest induces the management
academics to conduct many researches regarding different
issues in the field of job satisfaction. However, most of
these researches had been conducted in the organizations
operating in developed countries. A very little number of
researches were conducted in the organizations owned by
third world countries and operating there. It is undeniable
that the characteristics of the environment where the
organizations operate vary from country to country;
especially they vary significantly from developed to
underdeveloped countries. In addition, the characteristics of
members of those organizations in developed countries vary
significantly from those of developing countries due to
difference in cultures, norms, values, ethos and other issues.
The bundle of variables that gains plaudit from employees’
point of view for igniting job satisfaction in a country may
not work out in similar way and to the same extent in
another country. A bundle with different combination of
variables may be required. In this article, the authors have
selected 6 variables that play significant role in determining
job satisfaction and tried to figure out the latent
relationships, if any exist and which are unnoticeable in
ordinary view, among them in context of Bangladesh. The
authors believe that the disclosure of such latent
relationships will make practicing manager more
knowledgeable to determine effective package of motivating
variables to make the employees more satisfied in their job.
Literature Review
Job Satisfaction
Job satisfaction has been widely studied over the last four
decades of organizational research (Currivan, 1999).
However, defining job satisfaction with a single definition is
impossible (Abdulla, Djebarni and Mellahi, 2011). In
general, job satisfaction has been defined as “a function of
the perceived relationship between what one wants from
one’s job and what one perceives it as offering” (Locke,
1969 as cited in Daulatram, 2003). According to Spector,
job satisfaction refers to “the degree to which people like
their jobs” (Spector, 1997, p. 7).
Job satisfaction is defined as “a pleasurable or
positive emotional state resulting from the appraisal of one’s
job or job experience” (Locke 1976, p.1300). It refers to an
individual’s general attitude towards his/her job (Robins
2003, p.78). According to Bullock (1952), job satisfaction is
an attitude that results from a balancing and summation of
many specific likes and dislikes experienced in connection
with the job. Smith (1955, p.322) has defined job
satisfaction as an employee’s judgment of how well his job
has satisfied his various needs. Blum & Naylor (1968) have
defined job satisfaction as a general attitude formed because
of specific job factors, individual characteristics, and
relationships outside the job.
A person with high level of job satisfaction holds
positive attitude towards the job, while a person who is
dissatisfied with his or her job holds negative attitude about
www.theinternationaljournal.org > RJCBS: Volume: 01, Number: 08, June-2012 Page 29
the job (Robins 2003, p.72). It is also defined as an affective
or emotional response toward various facets of one’s job.
This definition means job satisfaction is not a unitary
concept. Rather a person can be relatively satisfied with one
aspect of his or her job and dissatisfied with one or more
other aspects (Kinicki and Kreitner 2003, p.125). As it is an
attitude not exerted behavior i.e. emotional response,
thereby only can be inferred (Luthans 1998, p.144). As it
can be inferred only, it is always difficult to measure exactly
to what extent employees are satisfied or dissatisfied.
Determinants of Job Satisfaction
Job satisfaction may come from a wide variety of sources
(Quarstein and Glassman, 1993, Smith et al. 1969). One
study even found that if college students’ major coincide
with their job, they were satisfied with that job (Fricko and
Beehr 1992, p.99). McGregor (1960), Argyris (1964), and
Bass (1965) argued that job satisfaction lies in the need-
satisfying potential of the job environment. However, we
will consider the following factors discussed below as
causes of job satisfaction.
The Job
The characteristics of job that allow individuals to fulfill
their needs are determinants of job satisfaction (Kinicki and
Kreitnen 2003, p.127). Job satisfaction is enhanced by the
task that is mentally challenging but allows individual to
experience success, and is personally interesting. (Locke
1976). Ciabattari (1986, p.48) also argued identically saying
task that is interesting and challenging can be a source of job
satisfaction. Challenging job along with performance
feedback was identified as variable, which makes employees
intrinsically motivated (Csikszentmihalyi 1990,
Csikszentmihalyi 1997, Mainemelis 2001). Katzell et al
(1992, p.195) also argued the same that under the condition
of moderate challenge, most employees experience pleasure
and satisfaction. People with high growth need look for job
that is meaningful and be satisfied when they get it
(Hackman and Oldham, 1976). Thomas (2000) also argued
that job that is meaningful provides intrinsic stimulus for job
satisfaction. Hackman and Oldham (1976) maintained that
‘autonomy over the job’ and ‘performance feedback’ are
another two major sources of job satisfaction. However,
Kanungo (1979, p.199) maintains that job satisfaction does
not necessarily depend on job characteristics like autonomy
over the job. Thomas (2000) also argued that when
employees be able to accomplish something skillfully
performing task activities, they be internally motivated. For
performing task successfully employees need to develop
competence. Purohit and Belal (1998, p.49) conducted a
survey on professional accountants in Bangladesh and found
‘opportunity for competence development’ as a source of
job satisfaction. So it is assumed that the job that provides
opportunity for competence development will contribute to
job satisfaction. Besides, because of job scarcity in
Bangladesh being employed at the right post is difficult. To
get to the right job with right position, most people start
their career in some job which provides them the
opportunity for competence development. It is assumed that
people expect at least such a job and when they get such,
that job provides them satisfaction. Therefore, it is
hypothesized that
H1: The nature of job has positive impact on job
satisfaction
Pay
Job satisfaction is a function of how fairly an individual is
treated at work. Employees want pay system and promotion
policies that they perceive just, unambiguous, and in line
with their expectations. Their perceived fairness of pay and
promotion were found significantly correlated with job
satisfaction (Witt and Nye 1992). Lambert, Hogan and
Barton (2001) have identified salary as an important factors
that influence job satisfaction. According to Benjamin
(2010), worker’s compensation package is an important part
of the employee job satisfaction and it cannot be ignored.
Wages and salaries are recognized to be significant
but cognitively complex (Carraher and Buckley, 1996,
p.102) and also multidimensional factor in job satisfaction
(Judge 1993, p.331). Purohit and Belal (1998) found ‘pay
and other facilities’ as a source of job satisfaction in
Bangladesh while conducting a survey on professional
accountants. Islam and Swierczerk (2003, p.47) also
identified fair pay and other financial benefits influence job
satisfaction of garments women workers in Bangladesh.
Money not only helps people attain their basic needs but
also is instrumental in providing upper-level needs
satisfaction. Employees often see pay as a reflection of how
management views their contribution to the organization
(Luthans 1998,p.145). When pay is seen as fair based on job
demands, individual skill level, community pay standards,
satisfaction is likely to result (Locke 1976). However,
Luthans (1998) argued that fringe benefits are also
important but they are not as influential. Therefore, it is
hypothesized that
H2: Pay has positive impact on job satisfaction
Promotion
Promotional opportunities seem to have a varying effect on
job satisfaction. This is because promotions take a number
of different forms and have a variety of accompanying
rewards (Luthans 1998, p.145). Promotions provide
opportunities for personal growth, more responsibilities and
increased social status. Individual who perceived that
promotion decisions are made in a fair and just manner, are
likely to experience satisfaction (Witt and Nye 1992).
Promotion plays a significant role that is also a key indicator
of employee job satisfaction (Lambert et al., 2001). Islam
and Swierczerk (2003) identified promotional opportunities
influence job satisfaction of garments women workers in
Bangladesh. Therefore, it has been hypothesized that
H3: Promotion has positive impact on job satisfaction
Supervision
Supervision is another major determinant of job satisfaction.
Studies generally found that employee satisfaction is
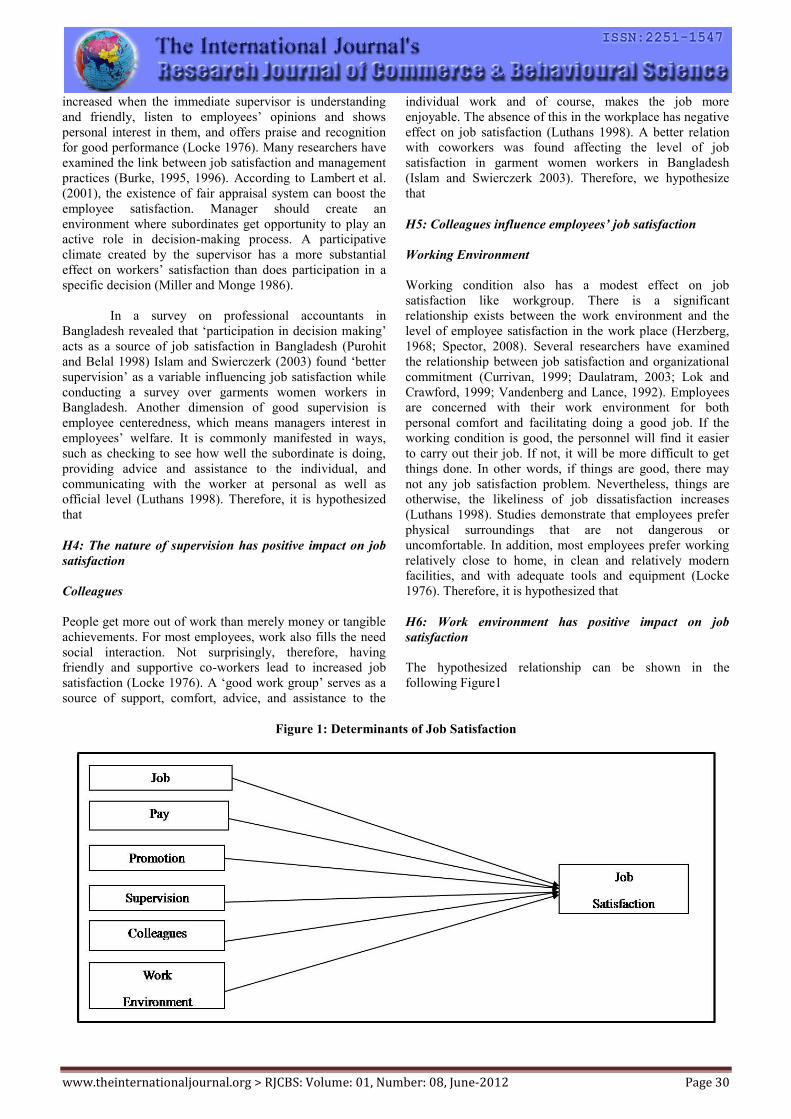
www.theinternationaljournal.org > RJCBS: Volume: 01, Number: 08, June-2012 Page 30
increased when the immediate supervisor is understanding
and friendly, listen to employees’ opinions and shows
personal interest in them, and offers praise and recognition
for good performance (Locke 1976). Many researchers have
examined the link between job satisfaction and management
practices (Burke, 1995, 1996). According to Lambert et al.
(2001), the existence of fair appraisal system can boost the
employee satisfaction. Manager should create an
environment where subordinates get opportunity to play an
active role in decision-making process. A participative
climate created by the supervisor has a more substantial
effect on workers’ satisfaction than does participation in a
specific decision (Miller and Monge 1986).
In a survey on professional accountants in
Bangladesh revealed that ‘participation in decision making’
acts as a source of job satisfaction in Bangladesh (Purohit
and Belal 1998) Islam and Swierczerk (2003) found ‘better
supervision’ as a variable influencing job satisfaction while
conducting a survey over garments women workers in
Bangladesh. Another dimension of good supervision is
employee centeredness, which means managers interest in
employees’ welfare. It is commonly manifested in ways,
such as checking to see how well the subordinate is doing,
providing advice and assistance to the individual, and
communicating with the worker at personal as well as
official level (Luthans 1998). Therefore, it is hypothesized
that
H4: The nature of supervision has positive impact on job
satisfaction
Colleagues
People get more out of work than merely money or tangible
achievements. For most employees, work also fills the need
social interaction. Not surprisingly, therefore, having
friendly and supportive co-workers lead to increased job
satisfaction (Locke 1976). A ‘good work group’ serves as a
source of support, comfort, advice, and assistance to the
individual work and of course, makes the job more
enjoyable. The absence of this in the workplace has negative
effect on job satisfaction (Luthans 1998). A better relation
with coworkers was found affecting the level of job
satisfaction in garment women workers in Bangladesh
(Islam and Swierczerk 2003). Therefore, we hypothesize
that
H5: Colleagues influence employees’ job satisfaction
Working Environment
Working condition also has a modest effect on job
satisfaction like workgroup. There is a significant
relationship exists between the work environment and the
level of employee satisfaction in the work place (Herzberg,
1968; Spector, 2008). Several researchers have examined
the relationship between job satisfaction and organizational
commitment (Currivan, 1999; Daulatram, 2003; Lok and
Crawford, 1999; Vandenberg and Lance, 1992). Employees
are concerned with their work environment for both
personal comfort and facilitating doing a good job. If the
working condition is good, the personnel will find it easier
to carry out their job. If not, it will be more difficult to get
things done. In other words, if things are good, there may
not any job satisfaction problem. Nevertheless, things are
otherwise, the likeliness of job dissatisfaction increases
(Luthans 1998). Studies demonstrate that employees prefer
physical surroundings that are not dangerous or
uncomfortable. In addition, most employees prefer working
relatively close to home, in clean and relatively modern
facilities, and with adequate tools and equipment (Locke
1976). Therefore, it is hypothesized that
H6: Work environment has positive impact on job
satisfaction
The hypothesized relationship can be shown in the
following Figure1
Figure 1: Determinants of Job Satisfaction
www.theinternationaljournal.org > RJCBS: Volume: 01, Number: 08, June-2012 Page 31
Research Methodology
Questionnaire and its Construct Validity
Based on the above literature review, an eleven-
item questionnaire is prepared following 5–point Likart
scale (1 = Strongly Disagree, 5 = Strongly Agree and 3 =
Neutral). Conceptually ‘3’ represents neither satisfied nor
dissatisfied with the variable. Thus, recording ‘4’ and ‘5’
represent satisfaction, the higher the number, the greater the
satisfaction level. Similarly, recording ‘1’ and ‘2’ represent
dissatisfaction, the lower the number, the greater the level of
dissatisfaction.
For this study, 600 questionnaires were distributed
among the employees of 18 different private companies in
Dhaka, Bangladesh out of which 467 questionnaires were
received. Each of the response received systematically
screened for errors, incomplete and missing responses.
However, those responses that still contained questions in
the survey questionnaire that had been remained unanswered
or left incorrectly answered finally discarded from data
analysis in order to establish a rationality of analysis through
proper representation. After having the screening process
completed, 437 responses found valid for data analysis. This
represents a rate of 72.8%, which is considered extremely
well in view of time, cost, certainty and geographical
constraints (Sandelowski, 1995).
The results obtained from 437 respondents have been
thoroughly analyzed and the outputs of the results have been
clearly explained in this section. Applying SPSS, the
principal component analysis (PCA) was carried out to
explore the underlying factors associated with 11 items. The
constructs validity was tested applying Bartlett’s Test of
Sphericity and The KMO measure of sampling adequacy
analyzing the strength of association among variables. The
KMO measure of sampling adequacy (KMO) was first
computed to determine the suitability of using factor
analysis. It helps to predict whether data are suitable to
perform factor analysis. KMO is used to assess which
variables to drop from the model due to multicollinearity
problem. The value of KMO varies from 0 to 1, and KMO
overall should be 0.60 or higher to perform factor analysis.
If this does not have achieved, then it is necessary to drop
the variables with lowest anti image value until KMO
overall rises above .60.
The analysis began with an examination of the
measurement in terms of its reliability and its construct
validity. The composite reliability coefficients of the
measurements scale satisfied Nunally’s (1978) guidelines
(Cornbatch Alpha = 0.87). The scale items of job, pay,
promotion, supervision, colleague and working environment
are shown in the following Table 1 along with the
corresponding descriptive statistics and reliability. Result for
the Bartlett’s Test of Sphericity and the KMO reveal that
both were highly significant and eventually concluded that
this variable was suitable for the factor analysis. According
to the Sekeran (2000) Cronbach alpha is reliability
coefficient that indicates how well the items are positively
correlated to one another. Reliability coefficient tested by
using Cronbach’s alpha (α) analysis. In order to measure the
reliability for a set of two or more constructs, Cronbach
alpha is a commonly used method where alpha coefficient
values range between 0 and 1 with higher values indicating
higher reliability among the indicators (Hair, et al., 2010).
After the re-allocation of the eleven items, the Reliability
test was conducted to ensure that, the extracted three factors
are appropriate for this grouping. In accordance with the
Cronbach alpha test, the total scale of reliability for this
study varies from 0.72 to 0.81, indicating an overall higher
reliability factors. The reliability of this study is substantial
in every perspective, as the highest reliability value that can
be achieved is 1.0.
Results and Discussion
Results from the primary data focused on the descriptive
analysis based on the frequency Table 1. Regarding the
length of employment as shown in (Table 1), with three
categories: firstly, those below 10 years are 32.7 %.
Secondly, between 10 to 20 years is 42.3 % where as those
above 20 years, which is 25 %. It showed that, 75 % of the
respondents have the opportunity to serve for the next 10 to
20 years.
Respondent’s demographic profile is shown in
Table 3, out of the total participation of 437, 80.6 % were
males and 19.4 % were females. As for the education level,
22.6 % were degree holders while 77.4 % were those with
diploma, secondary and primary schools qualifications.
Types of employee indicated that, 27.7 % were executives
and 72.3 % were nonexecutive. Out of this 27.7 %
executives, 5.8 % are managers and above.
Further, regression analysis was conducted in order
to find out respective strength of the determinants of job
satisfaction. The dependent variable Job satisfaction has
been regressed by job, pay, promotion, supervision,
colleagues, and environment. The regression results are
shown in Table 4.
Table 4 shows that H1, H2, H3, H4 are accepted (p
< 0.05) while H5 and H6 are rejected. The factors of interest
of this study (i.e. the independent variables) claim 70% of
the variance explained by the dependent variable Job
Satisfaction. Out of the six determinants, four factors (Job,
Pay, Promotion, and Supervision) are found to have
significant positive impact on job satisfaction. The rest two
factors – colleagues and environment are not found to have
significant impact on job satisfaction. Out of the four
significant factors, job has the strongest impact on job
satisfaction with beta value 0.462 followed by promotion,
pay and supervision.
Therefore, employees of Bangladesh consider their
job, pay promotion and supervision as the key factors of
perceiving their job as satisfied. Among these factors, they
consider the job itself as the most important factor followed
by the scope for promotion, pay and supervision. On the
other hand, they do not consider colleagues and environment
as influencing factors to be satisfied with their jobs.
www.theinternationaljournal.org > RJCBS: Volume: 01, Number: 08, June-2012 Page 32
Conclusion and Future Implications
Satisfied employees are more committed to their job than
that of dissatisfied. This is because a person with high level
of job satisfaction holds a positive attitude towards the job,
while a person who is dissatisfied with his or her job holds
negative attitude about the job (Robins, 2003). This paper
focuses on determinants of job satisfaction in Bangladesh
perspective. It offers key contributions in the human
resource management literature of Bangladesh by
suggesting the key considering factors to attain job
satisfaction of the Bangladeshi employees. It has significant
managerial implications. In order to attain the job
satisfaction of the employees, the human resource managers
of Bangladesh should concentrate more on the nature of the
job, promotion, payment and supervision more than
colleagues and the environment of the office / job. To be
more specific, this paper emphasize the most on the Job
itself as the key determining factor for attaining job
satisfaction. By performing the job in real life situation an
employee experience day-to-day pressures and meet variety
of challenges which makes him/her capable of developing
insights that enhances his/her aptitude, ability, skill and
knowledge. Therefore, a job itself can be a key source for
human resource development. It is undeniable that a job
becomes a solid source of learning when it delivers
motivation. A task that provides satisfaction can attract and
contain employees with it. Organizations should always try
to attain job satisfaction of their employees in order to
improve their productivity and attain desired profitability by
focusing on these determinants of job satisfactions.
References
Abdulla, J., Djebarni, R. and Mellahi, K. (2011),
"Determinants of job satisfaction in the UAE: A
case study of the Dubai police", Personnel Review,
Vol. 40 Iss: 1, pp.126 – 146.
Argyris, C. (1964), Integrating the Individual and the
organization, John Wiley and Sons, New York.
Bass, B.M. (1965), Organizational Psychology, Allyn &
Bacon, Boston.
Benjamin, A. (2010), "Fringe benefits and job satisfaction",
International Journal of Manpower, Vol. 31 Iss: 6,
pp. 626 – 644.
Blum, M.L. and Naylor, J.C. (1968), “Industrial
Psychology: Its Theoretical and Social Foundations,”
Harper and Row, New York.
Bullock, R.P. (1952), “Social Factors Related to Job
Satisfaction,” Research Monograph No. 70, Ohio
State University, Bureau of Business Research,
Columbus.
Burke, R.J. (1995), "Management practices, employees’
satisfaction and perceptions of quality of
service", Psychological Reports, Vol. 77, pp. 748-
50.
Burke, R.J. (1996), "Sources of job satisfaction among
employees of a professional service
rim", Psychological Reports, Vol. 78, pp. 1231-4.
Carraher, S.M. and Buckley, M.R. (1996), “Cognitive
Complexity and Perceived Dimensionality of Pay
Satisfaction”, Journal of Applied Psychology, vol. 81,
no. 1, pp. 102 – 109.
Ciabattari, J. (1986), “The Biggest Mistake the Top
Managers Make,” Working Women, October, p.48.
Csikszentmihalyi, M. (1990), Flow: The Psychology of
Optimal Experience, New York: HerperCollins.
Csikszentmihalyi, M. (1997), Finding Flow, New York,
Basis Books.
Currivan, D.B. (1999), "The causal order of job satisfaction
and organizational commitment in models of
employee turnover", Human Resource
Management Review, Vol. 9, pp. 495-524.
Daulatram, B.L. (2003), "Organizational culture and job
satisfaction", Journal of Business & Industrial
Marketing, Vol. 18 Iss: 3, pp. 219 – 236.
Fricko, M.A.M. and Beehr, T.A. (1992), “A Longitudinal
Investigation of Interest Congruence and Gender
Concentration as Predictors of Job Satisfaction,”
Personnel psychology, September, pp. 99 – 118.
Hackman, J.R. and Oldham, G.R. (1976), “Motivation
through the Design of the Work: Test of a Theory,”
Organizational Behavior and Human Performance,
vol. 16, pp. 250 – 279.
Hair, J.F., Anderson, R.E., Tatham, R.L. and Black, W.C.
(2010), Multivariate Data Analysis: A Global
Perspective (7th ed), Pearson Prentice-Hall, Upper
Saddle River, NJ.
Herzberg, F. (1968), "One more time: how do you motivate
employees?", Harvard Business Review, Vol. 46
No. 1, pp. 53-62.
Islam, N. and Swierczek, F.W. (2003), “Job satisfaction
Impact of Technological Change on Women Garment
Workers in Bangladesh,” Journal of Business
Administration, Vol 29, No. 1& 2, January & April,
pp. 47 – 72.
Judge, T.A. (1993), “Validity of the Dimensions of the Pay
Satisfaction Questionnaire: Evidence of Differential
Prediction”, Personnel Psychology, Summer, pp. 331
– 355.
Kanungo, R.N. (1979), “The Concept of Alienation and
Involvement Revisited,” Psychological Bulletin, Vol.
86, pp. 119 – 138.
Katzell, F.A., Thomson, D.E. and Guzzo, R.A. (1992),
“How job satisfaction and Job Performance are and
are not Linked,” in C. J. Cranny, P. C. Smith, E. F.
Stone (eds), Job satisfaction, (New York: Lexington
Books), pp. 195 – 217.
Kinicki, A. and Kreitner, R. (2003), Organizational
Behavior: Key concepts, skills and Best Practices,
McGraw-Hill Irwin.
Lambert, E.G., Hogan, N.L. and Barton, S.M. (2001), "The
impact of job satisfaction on turnover intent: a test
of structural measurement model using a national
sample of workers", Social Science Journal, Vol.
38, pp. 233-51.
Locke, E.A. (1969), "What is job
satisfaction?", Organizational Behavior and
Human Performance, Vol. 4, pp. 309-36.
Locke, E.A. (1976), “The Nature and Cause of Job
Satisfaction”, in M. D. Dunnette (ed), Handbook of
Industrial and organizational Psychology, Rand
McNally, Chicago, p. 1300.
www.theinternationaljournal.org > RJCBS: Volume: 01, Number: 08, June-2012 Page 33
Lok, P., Crawford, J. (1999), "The relationship between
commitment and organizational culture, subculture,
leadership style and job satisfaction in
organizational change and
development", Leadership and Organizational
Development Journal, Vol. 20, pp. 365-73.
Luthans, F. (1998), Organizational Behavior, 8th
ed.,
Irwin/McGraw- Hill.
Mainemelis, C. (2001), “When the Muse Takes It all: A
model for the Experience of Timelessness in
Organizations,” Academy of Management Review,
October, pp. 548 – 65.
Miller, K.I. and Monge, P.R. (1986), “Participation,
Satisfaction, and Productivity: A Meta-Analytic
Review”, Academy of Management Journal,
December, p. 748.
Nunally, J (1978), “Psychometric Methods,” 2nd
Edition,
McGraw-Hill, New York, NY.
Purohit, K.K. and Belal, A.R. (1998), “Job Satisfaction of
the Professional Accounts in Bangladesh,” The Cost
Management, July- August, p. 49.
Quarstein, V.A., McAfee, R.B. and Glassman, M. (1993),
“The Situational Occurrences Theory of Job
Satisfaction, ” Human Relations, August, pp. 859 –
873.
Robins, Stephen P. (2003), Organizational Behavior, 10th
ed. Prentice Hall, , p. 78.
Sandelowski, M. (1995), “Sample size in qualitative
research”, Research in Nursing & Health, Vol. 18
No. 2, 179-183.
Sekaran, U. (2000), Research Methods for Business: A Skill
Building Approach (3rd Ed), John Wiley & Sons,
New York.
Smith, P.C. (1955), “The Prediction of Individual
Differences In Susceptibility to Industrial
Monotony,” Journal of Applied Psychology, Vol. 39,
pp. 322 – 329.
Smith, P.C., Kendall, L.M. and Hulin, C.L. (1969), The
Measurement of Satisfaction in Work and Retirement,
Rand McNally, Chicago.
Spector, P. (1997), Job Satisfaction: Application,
Assessment, Causes and Consequences, Sage,
Thousand Oaks, CA.
Spector, P. (2008), Industrial and Organizational
Psychology: Research and Practice, 5th ed., John
Wiley & Sons, New York, NY.
Tett, R.P. and Meyer, J.P. (1993), “Job Satisfaction,
Organizational Commitment, Turnover Intention, and
Turnover: Path analyses Based on Meta-Analytic
Findings,” Personal Psychology, vol. 46, p. 259.
Thomas, K.W. (2000), “Intrinsic Motivation and How it
works,” Training October 2000, pp. 130 – 35.
Vandenberg, R.J., Lance, C.E. (1992), "Examining the
causal order of job satisfaction and organizational
commitment", Journal of Management, Vol. 18,
pp. 153-67.
Witt, L.A. and Nye, L.G. (1992), “Gender and the
Relationship between Perceived Fairness of Pay or
Promotion and Job satisfaction”, Journal of Applied
Psychology, December, pp. 910 – 17.
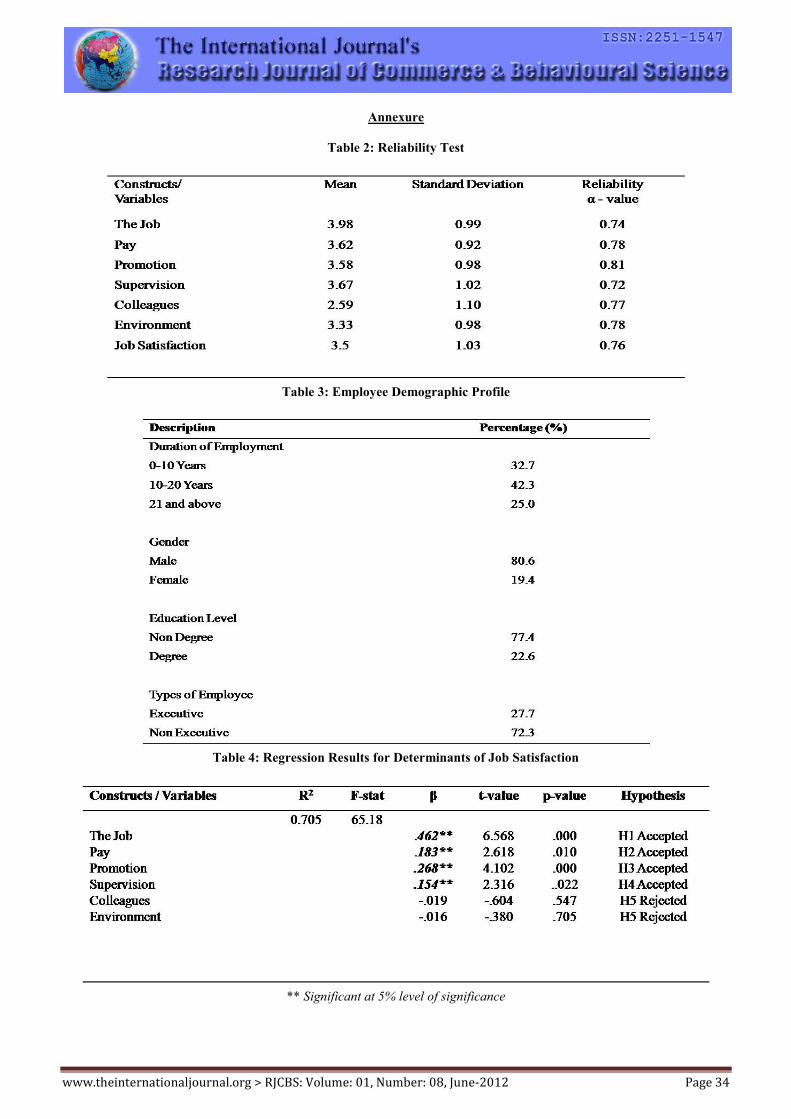
www.theinternationaljournal.org > RJCBS: Volume: 01, Number: 08, June-2012 Page 34
Annexure
Table 2: Reliability Test
Table 3: Employee Demographic Profile
Table 4: Regression Results for Determinants of Job Satisfaction
** Significant at 5% level of significance
www.theinternationaljournal.org > RJCBS: Volume: 01, Number: 08, June-2012 Page 35
Abstract— There is a widespread concern all over the world
about the emerging tensions in the local, regional and global
dialogues on relationship between formal and informal
knowledge systems. It is realized that the basic social
contract between knowledge producing communities and the
knowledge valorizing corporations and professionals needs
redefinition. Several professional societies have incorporated
discussions on ethical issues in accessing knowledge,
innovations and practices of local communities involving use
of local biodiversity resources. The situation becomes even
more complex when we realize that the healthcare needs of
large majority of poor people still are met by their own
survival strategies dependent upon use of local knowledge
and resources. It is obvious that this knowledge is precious
and can generate viable and productive alternatives valued by
modern markets. At the same time, it is also true that if this
knowledge was sufficiently robust as it stands, the local
health conditions would not have been as precarious as these
often are in many regions because of nutritional and other
economic hardships. The linkage with formal science and
technology is therefore vital. The paper deals with four issues
like what can we learn from the analysis of a country wide
campaign in India on documenting more than 300 local
health traditions maintained by communities and individuals,
whether the health priorities and the options for addressing
them require new technological and institutional paradigms,
how can new partnership between people, professionals,
public policy makers and profit-oriented corporations be
conceptualized so that not only benefits are shared fairly but
also the knowledge systems grow and thrive and what should
be the ethical code of conduct guiding the knowledge
exchange, value addition and benefit sharing for generating
viable health options for knowledge rich, economically poor
people. The paper would thus provide an overview of the
global debate on this subject and also suggest how an
ethnobotanist can become the watchdog of, as well as the
advocates for, the interests of healers, herbalists and other
traditional knowledge rich communities.
Key Words: Ethical issues, local communities, local
biodiversity resources
I. INTRODUCTION
Knowledge happens when our expectations are belied,
modified and sometimes confirmed. Because the asymmetry
in our expectations is influenced by our access to resources,
institutions, technology and cultural platforms, we get
different kinds of knowledge, even when we confront similar
situations. In any community living close to nature,
asymmetry in knowledge generation and its utilization is
inevitable. The experts exist not just in our profession, but in
every profession.
This raises the issue about conceptualizing the functional
asymmetry without which knowledge systems cannot grow
or provide incentives for experimentation, innovation and
dissemination of either the knowledge itself or its
applications for community well being. Why would a
community encourage asymmetry becomes apparent when
we look at the problems of survival with particular reference
to health. Whether a child is to be born, a bone has to be
repaired or a chronic ailment has to be relieved, one needs
advice. In one of the Shodh Yatras in a village in Karnataka,
a young person felt very disturbed when we paid respect and
appreciated the expertise of a particular healer who seemed
to be very effective in curing the cases of snake bite. This
village was located in the western ghat region with very rich
biodiversity.
This young person felt that everybody in the village knew
about the herbs to be used in such cases, what was so special
about the old person whom we seemed to revere so much.
We asked a question to all the people sitting there, as to how
many people had had a case snake bite in their family in the
last three months. Three people raised hands. We asked them
who they went to, for consulting. All three pointed towards
the old healer whom we were honouring. Everybody laughed
and the answer became obvious. While many people in the
village know, not everybody knows, how to use the specific
knowledge in a specific case such that it works. The specific
part of a generalized knowledge is available with only a few
experts. Society respects such experts but does not adequately
incentivise them. The result is, they often remain poor.
Therefore, despite having walked for more than 2600 kms.,
during every summer and winter Shodh Yatra in last eight
years, we have not come across many young healers. This is
the crisis. If younger generation no more feels inspired and
emboldened to learn, acquire, specialize and improvise the
knowledge that has been generated by the older generation,
the knowledge systems come under threat of erosion. I have
argued that when knowledge erodes, a plant becomes a weed.
How does one ensure that this knowledge system grows,
becomes vibrant, encourages innovations and welcomes
fusion of external, institutional and formal knowledge at its
own terms? The ethical dilemma arise when we have to
decide the terms, mediate the exchange and generate the
portfolio of incentives for the community, local experts and
those who add value to local knowledge. Ethical dilemma
also arises when we the intellectuals, document people’s
knowledge in good faith, publish it and become the author
Ethical issues in accessing people's knowledge and
innovations: A study on specific reference to low
cost health system in India Suniti Chandiok, Asst-Professor,
Banrasidas Chandiwala Institute of Professional Studies, Dwarka, New Delhi
www.theinternationaljournal.org > RJCBS: Volume: 01, Number: 08, June-2012 Page 36
without even acknowledging the knowledge providers or
protecting their intellectual property rights. The question of
sharing benefits seldom arises.
When resources are allocated for adding value to local
diversity and associated knowledge, decision about which
problems/whose problems get how much priority also
involves ethical dilemma. The irony is that healers who help
us cannot provide even the primary health care to the
children, when need arises because public infrastructure and
market forces are invariably very weak in the regions which
are rich in biodiversity. Sixteen years ago, in a paper entitled,
“Why regions of high biodiversity have high poverty”, I
asked this question as to why such regions have poorest
public infrastructure, highest rate of drop out in the primary
education and lowest level of literacy, particularly of women,
highest level of male emigration and consequently high
proportion of households managed or headed by women, low
level of employment and high degree of poverty. Ironically,
the public representatives from these regions are also not very
articulate and are unable to put pressure on the policy making
process. It is not surprising, particularly in Indian context,
almost all the insurgent groups are active in precisely these
regions where social, economic and institutional disparities
have widened over time. The last straw on the camel’s back
would be, if we the ethnobotanists or socio ecologists or
natural resource experts/scholars add to the disparity and
asymmetry. This conference has to resolve some basic
principles which should guide the exchange between local
communities and outsiders.
II. LITERATURE REVIEW
Yamin (1995) suggests that new theories of distributed
justice are required so that the distribution of resources not
only among humans but also humans and the non-humans, present and the future generation may be pursued fairly in
future. The moral and ethical issues underlying these theories
will require decision about how we relate to ourselves and the
nature around us. The perception of nature and its social
context raises tremendous ethical difficulties. Not all of us
use similar language to describe the same human nature
interaction. The very term, ‘ethnobotany’ itself is a
problematic in its orientation. Why should knowledge of
local communities be ethnic in orientation whereas the music
of the similar kind in western context becomes classical. The
contradiction between what is ‘classical’ and what is ‘ethno’
is not going to be easily resolved. But it is useful, as Mary
Douglas (1995:264) suggests (cited in Cooper, 2000:10125)
the word, ‘construal’ vis-à-vis ‘construction’ as less
problematic, perhaps more consensual. Whether one should
use the term, Cooper asks, ‘forests’ or ‘wood’ depends upon
the ethical and moral position one takes in relating to specific
part of nature. Both are socially construed/constructed terms.
Amartya Sen (1980) in his famous paper entitled,
“Description as Choice” asked a similar question. When does
description inherently suggest prescription or prediction, he
said, was a function of the underlying values. Thus, the poor
people after sixth five year plan in India were named, in the
planning documents, as ‘weaker section’. He draws attention
to the fact that language in this case turned the responsibility
from the external forces and actors to the poor people
themselves who were supposed to be weak. He asks as to
how could weaker section carry the heaviest burden. When
we use the term, ‘disadvantaged’ vis-à-vis just the ‘poor’, we
highlight the dialectics in one case and mask it in another.
Culture specific to a region provides different ways of
construing nature.
Just as I mentioned in the beginning, the moment the
knowledge about a plant is lost, it becomes weed, i.e., a plant
out of its place. Come to think of it, can a plant ever be out of
its place? How do we determine what its place is and who
determines it? Imagine a library without a catalogue. Will we
be able to locate the books? Perhaps those of us who have
walked through the carrels may through recollection reach
the point where probability of finding a particular book is
high. But then, librarians are creative people. The
cataloguing assistants can interpret the titles and the subjects
ingeniously. Book may not be where we suspect it to be.
Catalogues, therefore, have a place. They need to be
developed, preserved, updated and shared. Local
communities have been trying to do it, but with more and
more difficulty. The outsiders use Latin names (difficult to
argue why only Latin), but a common classification scheme
is necessary to pool the knowledge and make it accessible to
the entire profession.
The cultural project is just the opposite. As Margret Mead
had stressed that the emphasis on etic meanings vis-à-vis the
emic meanings was a reflection of dominating global over
local. The communities create meanings which are accessed
more easily by the members and are often inaccessible to
outsiders. Conservation, perhaps requires respect for
particular. The scholars, used to dealing with generalized
meanings construct newer and newer projects which deny the
locality of the meanings. This tension is understandable and
to some extent desirable. The problem arises when assertion
of locality and within locality, expertise is construed as
contrary to the communitarian spirit. Attempt to reinforce the
respect for individual experts is interpreted as an assault on
assumed communitarian process of production of knowledge.
The spirit is confused with the structure. The communitarian
spirit does not in any case violate the need for individual
expertise and location specific knowledge, language, terms
and above all ethical norms. Should our profession consider
its duty to understand, and then expand the space, both in
policies and institutions for knowledge, institutions and
technologies that originate in a specific socially construed
spaces and cultural contexts. If we have to do that, we will
have to use modern science and technology to validate and
value add in this knowledge according to the local parameters
so that social benefits in the form of drugs for masses raise
the status of the little science. I will come back to the issue
of building bridges between the ‘little’ and the ‘big’ science
without comprising much with the rules of each system of
knowledge. First let us understand, ‘who gets to tell the
story’, (Lease, 1995 in Cooper, 20006) implies the power of
those who describe, as Sen says often to prescribe. Toulmin
(1982 in Cooper, 20007) teased out the ethical dimension of
ecological concepts and terms. Those who narrate, also select
what to narrate and how. Therefore, the evaluation of the
local knowledge only on the basis of narration by third
parties may not always do justice to the dynamics and
www.theinternationaljournal.org > RJCBS: Volume: 01, Number: 08, June-2012 Page 37
complexity of the knowledge system. Since most researchers
seldom share their findings with the knowledge providers
before publishing or presenting at the conferences, the ethical
dimension of the discourse also deserves attention.
Bodeker (20038) reviews various examples where the
knowledge rights of the local communities have not been
respected adequately. The South African example where the
San people objected to the patent by CSIR on their
knowledge from which a drug was developed for anti obesity,
illustrates the conflict between CBD and TRIPS. Bodeker
strongly endorses SRISTI’s proposal for a global registry of
traditional knowledge and grassroots innovations. He also
supports the SRISTI’s arguments in support of a disclosure
requirement from every patent applicant. Our proposal has
been that every applicant should declare that source material
and/or knowledge associated with it has been ‘rightfully’ and
‘lawfully’ acquired. The ‘rightful’ refers to moral as well as
ethical issues in accessing biodiversity (also see Pew Ethical
Guidelines and background papers prepared for the purpose,
Gupta 1994a & b). However, the task of making databases is
fraught with risks. He refers to the Ethiopian example in 80s
when government required traditional healers to register
themselves as practitioner.
Many healers, ‘submitted inaccurate information’ with the
result that this database was not taken seriously (Bishaw,
1991 in Bodeker 2003). He describes an initiative on Global
Information Hub on Integrated Medicine as a part of
Commonwealth Working Group on Traditional and
Complimentary Health Systems which will build a database
of various stakeholders as well as information resource
regarding the intellectual property rights in traditional
medicine and associated biodiversity. The concept of Prior
Informed Consent (PIC) articulated in CBD but never
incorporated in TRIPS has created considerable tensions with
regard to the ethical aspect of information exchange. Ragavan
(200110) feels that the concept of ‘free’ and ‘informed’
consents have not been defined. CBD does not provide
framework of consequences when the consent is not informed
or adequate. She asks several other questions about the right
of knowledge holders to withhold or not to disclose or keep
information trade secrets. The legal respect for traditional
knowledge has been debated in different courts. She provides
an interesting example of a case, Hodosh v. Block Drug
Company (786F 2d 1136 Fed.Cir., 1986) in which a Chinese
traditional medicine example was considered unacceptable as
a prior art because the court observed that a “skilled person
exercising reasonable diligence, would not be able to locate
the prior art, given the esoteric nature of references. The
constant dilemma of applying statutory law or common law is
referred as one of the persistent problems. She questions
whether codification of knowledge is a necessary condition
for a traditional knowledge system to be recognized as legally
valid system. Toffel (200211) reviews the possibility of using
code of conduct in the absence of legal provisions for guiding
the knowledge exchange between providers and receivers. He
refers to the code of conduct developed by various
indigenous communities as well as Association of Social
Anthropologists, Society for Economic Botany, International
Society for Ethnobiology, NIH, NCI, etc. In 1994, we had
reviewed many of these guidelines and found that most did
not posit any consequences for violation. Gupta and Sinha
(2001) felt that the Honey Bee philosophy has not yet
permeated the discourse on ethical ways of knowledge
exchange, although it was enunciated way back in 1988-89.
Toffel’s advice that ad hoc contract between indigenous
groups and pharmaceutical companies seemed to be the
best answer for getting compensation may be a pragmatic
response but is not a long term institutional solution. Many
others such as Posey, Dutfield and Brush have made
familiar arguments questioning the concept of graduated
and gradient rights in the community. I define ‘graduated’
rights as those which are modified subject to the value
which is added in different stages of the value chain
(sometime referred as milestone based payments or rights)
and the ‘gradient’ rights as the asymmetrical knowledge
distribution within a community and thus knowledge
experts not being treated at par with those who are either
only aware or sometimes not even aware of the details.
The knowledge and ability to practice it in specific
contexts is a skill developed over a period of time with
enormous effort and perseverance. Knowledge systems
would not grow or survive without such gradients being
recognized as an inalienable feature of knowledge systems.
In professional and institutional contexts, we recognize this
concept very well but hesitate in according it the same
respect in informal context and community context.
Ogumanam believes that the alternative world view of
traditional healers is not fully captured in the western bio
medical approaches. He considers two systems as basically
incompatible. However, he hopes that a global framework
for protection of indigenous knowledge would emerge
consistent with cultural and philosophical diversity of local
health traditions. Norchi (200014) refers to the traditional
Onge people of Indian Nicobar and Andaman Islands and
suggests that customary laws evolved by Onges need to be
recognized by forming Onge Corporation. The corporate
firm could respect the trust of the community who could be
share holders. The corporation would then enter into
contract for their knowledge to be accessed by outsiders.
He refers to the work of Ashish Kothari and many others
who have raised the issue of Onges. The health leads from
one had suggested a new eco-ethno ethics, essentially
enforced by not the law but the professional societies. He
warned that anthropologists and ethnobiologists would lose
the respect of native people if they did not follow proper
ethics. Brush (1993) also feels that ethnobiological
information collected so far did not touch upon several
issues that were arising due to commercialization
prospects. Former are non-negotiable and latter are subject
to debate and can be improved. Knowledge rights are at
the root of cultural and other rights. Gadgil, et al (2000)
explains the concept of People’s Biodiversity Register
(PBR) and suggests that these registers could be a tool for
conserving and respecting folk knowledge. They also
suggest that compensation could follow according to the
quality of documentation. They propose that in due course
this knowledge could be fed back to the people from whom
it is collected. Recently, National Innovation Foundation
(NIF) and a community in Karnataka having developed
PBR signed an MOU to honour the knowledge rights of
the communities, already articulated in the PIC framework
www.theinternationaljournal.org > RJCBS: Volume: 01, Number: 08, June-2012 Page 38
used by NIF (see of the oldest tribes of the world would
obviously be of interest to the Indian society. Whether
utilitarian logic will suffice in this context, is the issue that
we need to address. Posey
(1990151617www.nifindia.org/pic.htm). Simpson, Sedjo
and Reid (199618) had earlier cautioned that despite much
hype about the biodiversity use in pharmaceutical research,
not much benefit may flow to the people either for
conservation or for consumption because the companies
had several options and the biodiversity based options
were necessarily the most attractive ones. Lewis and
Ramani (2003) feel that ICBG proposal in Peru was fair on
account of communication, confidentiality and
compensation. Cochran (200519) describes the ethical
guidelines of the Yukon First Nation people from Alaska
region. The Alaska Federation of Natives (AFN) requires
that native people be advised about the purpose, goal,
timeframe, data gathering technique, impact – positive and
negative of the research; the informed consent of
appropriate governing body. Fund the monitoring
committee of the native people to track the research project
and ensure the compliance, protect the sacred knowledge
and cultural and intellectual property, hire and train native
people in the study, use native language whenever English
is the second language, ensure confidentiality, incorporate
native people’s view points, acknowledge local
contribution, inform the community about the major
findings and provide the copies for the local library. This,
to me, is a neat summary of what the local communities
aspire. We could benchmark our practices against this
expectation and judge for ourselves as to how far have we
reached. However, as we know, no ethnobiology or
ethnobotany has follows the concepts of PIC, sharing of
knowledge with the knowledge providers in the manner
and language they understand before sharing it with third
party, not treating knowledge providers anonymously,
ensuring that any benefits generated by the knowledge are
shared with the knowledge providers in fair and just
manner and the rights of individual experts vis-à-vis
community are differentiated as per the local norms.
III. OBJECTIVE AND RESEARCH METHODOLOGY
There is a widespread concern all over the world about the
emerging tensions in the local, regional and global dialogues
on relationship between formal and informal knowledge
systems. It is realized that the basic social contract between
knowledge producing communities and the knowledge
valorizing corporations and professionals needs redefinition.
Several professional societies have incorporated discussions
on ethical issues in accessing knowledge, innovations and
practices of local communities involving use of local
biodiversity resources. The situation becomes even more
complex when we realize that the healthcare needs of large
majority of poor people still are met by their own survival
strategies dependent upon use of local knowledge and
resources. It is obvious that this knowledge is precious and
can generate viable and productive alternatives valued by
modern markets. The linkage with formal science and
technology is therefore vital. The research deals with four
objectives of study:
(a) What can we learn from the analysis of a country wide
campaign in India on documenting more than 300 local
health traditions maintained by communities and individuals?
(b) Whether the health priorities and the options for
addressing them require new technological and institutional
paradigms
(c) How can new partnership between people, professionals,
public policy makers and profit-oriented corporations be
conceptualized so that not only benefits are shared fairly but
also the knowledge systems grow and thrive?
(d) What should be the ethical code of conduct guiding the
knowledge exchange, value addition and benefit sharing for
generating viable health options for knowledge rich,
economically poor people.
The field of study are rural villages of India and this study is
based on field study and explorative research design. Data
was collected from 300 local health centers which rural
people use for their treatments.
IV. ANALYSIS OF STUDY:
Healing strategies and ethical engagement with people’s
knowledge systems:The way ahead Herbal formulations
developed by local communities involve not just the plants,
or their derivatives but also a process, a perception, and
sometimes a deep philosophy. It is true that in most of the
cases when we do documentation, we often get information
about plants, their uses and in some cases the methodology.
There are also cases when the formulations are accompanied
with some hymns or chants, essentially combining the
material world with spiritual consciousness. The scientific
evidence on the effect of prayers is not robust. Recent study
led by Krucoff in July 16, 2005 issue of Lancet does not
provide much support for the therapeutic effect of the
prayers. Surely, it will not change our tendency to pray when
either we or our dear ones are in pain. We cannot say the
same thing about a herbal medicine. Prayer relaxes us and to
that extent its effect is instantaneous. Herbal medicine needs
to interact with our metabolic or physiological pathways and
demonstrate results compatible with expectations. More than
60 per cent people in India rely on herbal and alternative
medicine for meeting their regular or occasional health
needs. Even among the 40 per cent, the popularity of herbal
medicine from different traditions (ayurveda, siddha, unani,
homeopathic, etc.) is increasing.
The story of Chinese medicine is well known. One in five
persons in US is supposed to have used Chinese herbal
medicine or food additives. The knowledge about the herbal
medicine abounds in most developing countries. In last five
years, NIF scouted about 51000 grassroots green innovations
and traditional knowledge practices. More than 70 per cent
deal with herbal knowledge for curing human, animal or
plant diseases/pests or disorders. Formulations developed by
people are often multi ingredient based. Scientists find it very
difficult to deal with formulations having more than 3 or 4
ingredients. The limits of modern science therefore define
the range of opportunities one can create for local knowledge
holders. Most ethnobotanists have documented the
knowledge governed by private, community or public
domain. Often the scientists will document proprietary
knowledge from individuals and/or communities and bring it
www.theinternationaljournal.org > RJCBS: Volume: 01, Number: 08, June-2012 Page 39
in public domain without any possibility of reciprocity. In
Conferences like this have to raise fundamental question
about ethics of such appropriation. If we follow ethical
practice and people voluntarily share their knowledge with
mutual faith and respect, how can this knowledge become the
basis of improving societal health.
There are five ways in which we can achieve the health
objectives using herbal knowledge:
a. Large number of diseases in rural areas are water borne
and therefore herbal substances that can purify water of
various impurities and eliminate the chances of even
viral diseases should be the top priority. We must
recognize the social gain of such substances for safe,
affordable, accessible and widely available solution to
this persistent global problem.
b. In a study of about 8000 entries from our database, we
found about 1000 remedies for pain and aches. Pick up
any public health document and look for any reference
to pains and aches. I doubt if we will find any. I myself
did not realize it till my colleagues in analysed the
frequency distribution of disease wise herbal leads.
When we look at the fact that large majority of poor
people and their livelihood by essentially using labour
and are not able to obtain sufficient nutrition for
meeting their needs, it is understandable that they
would suffer from certain deficiencies. In addition to
these deficiencies, the inability to compensate the loss
of energy may also add to the burden. Further, the
physical drudgery involved in various activities takes
toll of one’s stamina. Pains and aches are also caused
by the hazardous occupations. For working class,
solutions to this problem which may be caused by a
variety of reasons (ranging from excess fluorides to
other deficiencies or sprains and other injuries. Various
analgesics may have to be discovered to supplement the
effect of aspirin which itself originated from plants.
c. Nutraceuticals seem to be the next major category of
solutions that can lead to healthy communities at low
costs and perhaps by strengthening preventive health
care. One of the problems of the working class is that it
ages faster. Nutraceuticals could help in extending the
working life and therefore the wellbeing of the families
of poor people.
d. The diarrohea, diabetes, jaundice, wound, malaria and many
other tropical diseases are well known candidates for
discovering herbal solution. The important concern should
be to distinguish four kinds of ingredients in any herbal
formulation: curative, carrier, bio enhancer, suppresser of
side effects or stimulator of supporting/suppressing
hormonal secretions. Unless we do careful analysis, we may
bark the wrong tree. While National Cancer Institute of US
screened 35000 plants and could isolate only seven leads,
taxol being one of them, it does not mean that hit rate
should be so low. One reason why scientists often fail in
confirming the claims of local communities or individual
healers is because of the basic difference in the protocol of
extraction, delivery and dosage. There are many examples
where healers find something effective and scientists fail to
find appropriate results. The heuristics of validation also
will have to be taken into account while developing
solutions for various diseases.
e. The problems of women whose access to basic
sanitation and hygiene facilities is severely restricted.
Many problems occur because they don’t take enough
water lest they have to keep their bladder under control
in situations where public toilets are often absent or
available infrequently. There are large number of other
institutional conditions which create stress and other
problems for women. Millions of women have to carry
water and other loads on their head and back, perform
farm operations by using inappropriately designed
tools, have to transplant paddy by keeping their feet
under water attracting fungal infections. Why should
not such problems be the priority for scholars and
scientists? Having identified five major areas which
affect working class and their children and women,
how would changing the ethical discourse provide a
solution?
Towards solutions: Learning from Gandhi :Gandhiji was
once asked by a group of young students as to what should
they do for rural development. Gandhiji replied that he had
never worked rural areas and therefore how could he answer
this question. The students insisted, assuming that Gandhiji
was being unnecessarily modest. After a while, Gandhiji
relented. He said that while he lacks experience, he has a
proposal to make. Assume that we have to work in a
particular problem area, say livestock development, in a
given group of villages. He described what he would do in
such a situation. He will go to the villages and look for the
most efficient livestock producer whose animals produce
maximum milk or other products. He will study from
morning till evening all the practices of feeding, managing,
watering, sanitation, hygiene and even psychological care of
the animals. He will write them down. Then he will study
the similar practices of the average livestock producer. The
gap between the two will be his plan of work. Can we
follow Gandhiji’s advice in using ethnobotanical knowledge
for solving widespread global health problems of common
people? Can we focus on identifying those members of the
working class whose health is far superior to the rest, and
study the entire set of strategies including herbal medicine
that they use? Likewise, we could identify local experts who
specialize in solving specific problems. After assuring them
that the solutions will be used exactly as per their advice
and with all the conditions they would impose in the PIC
form, we pool the best practices and develop new products.
There is no reason why our hit rate will not be higher and
gains to all the partners in building herbal value chain not
be commensurate with their expectation.
V. RESULT DISCUSSION AND CONCLUSION:
We have minimum protocol to be followed by all the
ethnobotanists and health researchers. We should aim the the
next discussion, the ethical barometer will show a much
www.theinternationaljournal.org > RJCBS: Volume: 01, Number: 08, June-2012 Page 40
higher reading than is the case today. The key elements of
this protocol discussed many times in past are:
a. Complete disclosure of the purpose of research,
documentation or any other research interaction with the
local communities/researchers.
b. Disclosure of the advantages and disadvantages of
saying ‘yes’ or ‘no’ to different choices in local
language.
c. Clarification about two stage PIC process so that benefit
sharing in general may be discussed in stage one but
specific elements of agreement may be discussed in
stage two when something useful has been found out.
d. Clarification about the risks and chances in developing
products through various stages and therefore
moderating expectations, linking them with the
milestone based performance indicators and assuring
sharing of findings in the manner that can understand at
each stage.
e. Respecting the identity of knowledge providers and
publishing only those results which are authorized by
the knowledge providers with their name and identity.
Unless requested otherwise, knowledge providers will
always be named either as knowledge provider or as
knowledge holder or innovator.
f. The responsibility of taking permission of the
community or informing it as the case that may be,
fulfilled without compromising. It should be understood
that this process can take lot of time and trouble.
g. The benefits can be in monetary or non-monetary terms
and can be targeted at individual or communities. A
portfolio of incentives will have to be evolved for
different situations. It cannot be same everywhere.
h. The ethical basis of knowledge exchange will need to be
recalibrated from time to time so that the learning at the
level of community or scholars is factored in the
evolving ethical framework.
i. If the drug has to be patented, the patentee must take
prior permission from the knowledge providers and
disclose that moral and legal provisions of ethical
knowledge exchange have been followed scrupulously.
There can be many more suggestions. Protocol can be
modified, tested and improved. The plants which are
endangered have to be conserved. It has to be recognized that
medicines based on such plants can pose threat to the
environment, particularly when such plants may also be
endemic. The use of biotechnology or other such means to
propagate such plants must be encouraged. Health solutions
are often developed by understanding the problem of disease,
disability or disorder. I am proposing that the study health,
wisdom and wellbeing. Very seldom, do we ask the question
why are some people are more healthy than others. Let us
learn from those knowledge rich, economically poor people
who have solved problems through their own genius and
have managed to survive sometimes sustainably and
sometime precariously. It is the balance between holistic and
reductionist vision which will help blend informal and formal
science. We need both. Without reductionism, we cannot
specialize. If a bone setter does not focus only on bone
setting, he or she will never become an expert. We need
general physicians but we also need experts. Holism is the
context, the reductionism is the content. Without one, the
other cannot sustain. Let me conclude by suggesting that
good ethics also makes good science. Only when people have
trust in our intentions, they will share the cases where they
fail in treating a problem or cases where they had remarkable
results. Unless we get to learn the extreme values in the
repertoire, we will not be able to dissect the problem in parts
that make it comprehensible and also assimilable with
modern science. Let us remember that health is not absence
of sickness. It is a moral state in which we feel responsible
and because we feel responsible, we have joy, and because
we have joy, we are able to build relationships full of trust
and respect with people who have as much right to enjoy the
same state of happiness despite all the deprivations they
suffer form.
References
[1] Bodeker,G., 2003, Traditional Medical Knowledge,
Intellectual Property Rights & Benefit Sharing,
Cardozo J. of Intl. & Comp. Law [Vol.11:785-814]
[2] Darrell Posey, Intellectual Property Rights: And
Just Compensation for Indigenous Knowledge,
Anthropology Today, Vol6, No.4 (Aug., 1990), 13-
16
[3] Douglas M (1995) Acceptance of the 1994 Bernal
prize. Science, Technology and Human Values 20
(2): 262 – 266
[4] Farhana Yamin, Biodiversity, Ethics and
International Law, International Affairs (Royal
Institute of International Affairs 1944), Vol.71,
No.3, Ethics, the Environment and the Changing
International Order (Jul., 1995), 529-546
[5] Gupta, Anil K., Dilemma in Conservation of
Biodiversity: Ethical, Equity and Moral Issues a
review, Prepared for a workshop of Pew
Conservation Scholars on Developing Ethical
Guidelines for Accessing Biodiversity, Arizona,
October, 1994, published under the title, “Ethical
Dilemmas in Conservation of Biodiversity: Towards
Developing Globally Acceptable Ethical
Guidelines” in Eubios Journal of Asian and
International Bioethics 5 (Japan), March 1995,
pp.40-4 .
[6] Gupta, Anil K., and Riya Sinha, 2001, Should we
save, what serves only human ends? A review on
Environmental Ethics, published under the title,
www.theinternationaljournal.org > RJCBS: Volume: 01, Number: 08, June-2012 Page 41
‘Environmental Conservation: Ethical Concerns’ in
International Encyclopedia of the Social &
Behavioral Sciences, Elsevier Science Ltd., p. 4602
– 4607.
[7] K.L.Chair Professor of Entrepreneurship, Indian
Institute of Management, Ahmedabad, India;
Executive Vice Chair, National Innovation
Foundation, Ahmedabad, [email protected] and
[8] Lease G (1995) Introduction: Nature under fire. In
Soul ME and Lease G (eds) Reinventing Nature :
Responses to Postmodern Deconstrution, pp 3 – 16,
Island Press, Washington DC
[9] Madhav Gadgil; P.R.Seshagiri Rao; G.Utkarsh;
P.Pramod; Ashwini Chhatre; Members of the
People’s Biodiversity Initiative, New Meanings for
Old Knowledge: The People’s Biodiversity
Registers Program, Ecological Applications, Vol.10,
No.4 (Oct., 2000), 1307-1317.
[10] Makonnen Bisha, Promoting Traditional Medicine
in Ethiopia: A Brief Historical Review of
Government Policy, 33 Social Science & Medicine
193, 193-200 (1991)
[11] Nigel S Cooper, Speaking and listening to nature:
ethics within ecology, Biodiversity and
Conservation 9: 1009-1027, 2000.
[12] Norchi, Charles H, 2000, Indigenous knowledge as
intellectual property, Policy Sciences, 33: 387-398.
[13] Oguamanam, Chidi, 2004, Localizing intellectual
property in the globalization epoch: the integration
of indigenous knowledge, Indiana Journal of Global
Legal Studies, June 2004 - http://www. Find
articles. com/p
/articles/mi_hb3300/is_200406/ai_n13064680
[14] Patricia Longley Cochran, Ethical Guidelines for the
Use of Traditional Knowledge in Research and
Science (Adapted from Traditional Knowledge
Research Guidelines Council of Yukon First
Nations—http://www.cyfn.ca/index.html)
Downloaded on 18th August 2005 from
http://www.ed.psu.edu/icik/
2004Proceedings/section8-cochran.pdf.
[15] Paper prepared for presentation at the IV
International Congress of Ethnobotany, Istanbul,
August 21 – 26, 2005
[16] R.David Simpson; Roger A Sedjo and John W Reid,
Valuing Biodiversity for Use in Pharmaceutical
Research, The Journal of Politicla Economy,
Vol.104, No.1 (Feb., 1996), 163-185.
[17] Stephen B. Brush, Indigenous Knowledge of
Biological Resources and Intellectual Property
Rights: The Role of Anthropology, American
Anthropologist, New Series, Vol.95, No.3 (Sep.,
1993), 653-671.
[18] Toffel, Michael W., 2002, Intellectual property
rights and traditional resources: Indigenous
challenge, downloaded on August 18, 2005 from
http://faculty.haas.berkeley.edu /toffel/papers/
indigenous_ manuscript.pdf
[19] Toulmin S (1982) The Return to Cosmology:
Postmodern Science and the Theology of Nature,
University of California Press, Berkeley.
***
www.theinternationaljournal.org > RJCBS: Volume: 01, Number: 08, June-2012 Page 42
Influence on Brand in Female Consumer behavior
in Apparel Purchase in Lucknow
Shalini Bariar
Sr. Lecturer, Babu Banarsi Das University, Lucknow, UP
Dr. Gaurav pande
Associate Professor, Babu Banarsi Das University, Lucknow, UP
Abstract
In the Indian scenario, the branded female apparels are
facing tough competition with in-house brands especially in
the Indian casual wear. The female costumers prefer to
purchase garments according to regional requirements and
culture from the local outlets. The trend of national brands
is growing importance due to the recent development in
retail industry. It is very important for the marketers to
understand the various factors influencing the apparel
purchase to formulate appropriate marketing strategies to
attract consumers towards branded apparels. The purpose
of this research is to examine the female consumer behavior
and to understand the influence branded apparels on
consumer behavior in purchase of apparels.
A survey was conducted from female consumers aged from
25-35, to obtain evidences. Approximately, 100 respondents
were interviewed during the survey which results into
indicating the Brand loyalty, Brand awareness, Brand
Association, Quality Perceptions, and self-concepts were
found to have positive impact on female consumers on
purchase behavior in apparel.
Key words: Brands, Apparels, Consumer Behavior, Female
consumers, Influencing factors.
INTRODUCTION
The Apparel industry is one of the leading Industries in
Indian economy and claims to be the biggest revenue
earners in industrial sectors in India. In the recent years the
Apparel industry especially in Female Garments section, is
witnessing robust growth and grabbing attention of various
marketers in India. Due to the introduction of in-house
brands in apparel industry the national brands are facing
tough challenge in maintaining leading position in the
industry. The female apparel sector in India has been
dominated by in-house clothing brands
The total value for women’s branded apparel as compared to
unbranded apparel for women accounts for one fourth of
total apparel market.
The changing economical condition, lifestyle and increase in
working woman segment resulted in the growth in demand
of branded apparel for females. Also, the rising trend of
family shopping in malls has prompted apparel brands to get
attracted towards branded apparels due to a wide range of
products to customers. And now, brand expansion is the
next step in the Indian branded apparel sector to cater to the
varied tastes and preferences of the Indian customer.
Considering the recent development in the retail trends and
apparel sector, clothing sector firms are competing to
increase their profit share in the market and among these
firms; branded clothing has shifted the conventional clothing
interest of people.
Objective of the study
During the recent years, India has witnessed increasing
attention of females towards branded and unbranded
fashionable apparels for casual as well as formal clothing, it
has also grabbed attention of foreign brands and in-house
branded apparels in the female segment. The purpose of this
study is to analyze the influence of brands in Lucknow and
its impact on consumer purchasing behavior in apparels.
Five dynamic factors of branded clothing adoption are
defined and their relationship is explored with consumer
behavior namely: Brand loyalty, Brand awareness, Brand
Association, Quality Perceptions, and self-concepts. A
survey of general female consumers is conducted in this
study, with help of personal interview.
Branding
Brand is a new business warrior in times of tough
competition as it etches consumer’s mind that signifies what
they stand for and what can be expected from them. In the
times on tough competition with various in house labels, the
brands can create clutter through its brand image. The
product can be copied but the brand can not be. In the
increasingly complex world, a strong brand’s ability to
simplify consumer’s decision making, reduce risk and sets
expectations is invaluable. Brands can be symbolic devices
allowing consumers to project their self-image. A brand can
generate consumer interest, patronage, and loyalty. The
retailers have come up with their respective brand in for of
in-house brands to create its own brand image and
establishing positioning. Creating strong brands that deliver
a promise, maintains and enhances the strength of brands
overtime is a management imperative. As we know that
branded products have always attracted consumers attraction
and marketers preference it has become utmost important
for the marketers to understand the various factors
www.theinternationaljournal.org > RJCBS: Volume: 01, Number: 08, June-2012 Page 43
influencing the purchase of branded products. Various
research has been conducted in past regarding the
importance of brand. Brands are increasingly viewed as
offering a vital point of differentiation and a sustainable
form of competitive advantage in the market place for firms
(Beverland et.al., 2007; Low & Blois, 2002). Brand serves a
pivotal role for distinguishing goods and services from those
of the competitors (Aaker, 1991; Murphy, 1998). The
emergence of brand equity underlies the importance of
brand in marketing tactics and hence provides useful
insights for managers and further research (Keller, 2003).
Consumers like to buy and use brand-name products with a
view to highlight their personality in different situational
contexts (Aaker, 1999; Fennis and Pruyn,2006). A brand can
be an everlasting and lucrative asset as long as it is
maintained in a good manner that can continue satisfying
consumers’ needs (Batchelor,1998; Murphy, 1998).
Apparels
As stated above apparel sector is witnessing robust growth
in the retail sector, it has become a leading industry
contributing to the growth of Indian economy. As India is
one of the emerging markets , it has also attracted global
attention in the various retail industries like food and
grocery and apparels etc. As stated by Bearden and Etzel (as
cited in Hogg et al., 1998), clothing is a kind of public
necessity with weak reference group influence on the
product category but strong reference group influence on the
brand choice. Owing to the proliferation of brands in the
clothing sector, consumers need to take serious
consideration during the buying processes. As mentioned by
Rayport and Jaworski (2003), the purchasing processes can
be divided into three stages, namely pre-purchase, purchase
and post-purchase. Each stage is of equal importance that
can alter the consumer buying decision. Once consumers
make a purchasing decision, consumers may need to
recognize their personal needs, read product information,
decide which and where to buy, determine whether to buy
again from the same retailer, choose the buying modes,
show satisfaction to the services or product quality and
finally be loyal to the brand.
These highlight the complication of buying processes and
the potential impact a brand could impose in between them.
Several brands, under the influence of globalization and
concerted efforts from media advertising, have become
popular not only in their country of origin, but also in other
markets with high potential. Having a strong and remarkable
brand image could help establish an identity in marketplace
(Aaker, 1996), widen the profit margins, encourage greater
intermediary co-operation as well as increase the chance for
further brand extension (Delgado-Ballester and Munuera-
Aleman, 2005). In accordance with Delong et al. (2004),
consumers appear to rely on the brand image as long as they
have little knowledge about the brand. In this way,
managing brand image is of utmost importance. In order to
differentiate one brand from another, marketers would
develop retail brands with unique image so as to continue to
gain popularity and market share (Abend, 2000; Ailawadi,
2001; Corstjens and Lal, 2000).
Consumer behavior
Consumer behavior refers to the activities in which people
acquire, consume and dispose products and services
(Blackwell et al., 2001).Consumer behavior focuses on how
individual consumers and families or households make
decisions to spend their available resources in form of time
money and effort on consumption related items. This
includes what they buy, why they buy, when they buy,
where they buy, how often they buy and use, how they
evaluate it after purchasing, impact of such evaluations on
future purchases and how they dispose it off. It is interesting
to note that the importance of understanding consumer
behavior was realized much before the establishment of
marketing concepts. To identify consumer’s satisfied and
unsatisfied needs it is important for companies to
continuously monitor consumer buying behavior. Owing to
the proliferation of brands in the recent decades, there is a
growing number of researches conducted in the field of
consumer buying behavior. Changing life styles,
technological development in textiles and international trade
have brought about changes in the clothing preferences of
the present day consumers. Consumers with the same needs
may want different clothes depending upon their cultural
background, age, socio-economic status and personality
(Sumathi, 2005) consumer tend to prefer clothes that are
attractive, socially acceptable, economical and suits the
climatic conditions and personality well. It is found that
consumers’ emotions are one of the major determinants
which affect their buying behaviour (Berry, 2000).
According to a research conducted by Freeride Media LLC
(1998) on shopping habits, nearly one-fourth of the
respondents are likely to impulse-buy clothes and
accessories. When deciding which products to purchase,
consumers would have their preferences, which are
developed in accordance with their perceptions towards the
brand. Successful branding could make consumers aware of
the presence of the brand and hence could increase the
chance of buying the company’s products and services
(Doyle, 1999).
In India the purchasing pattern of consumers especially in
case of woman apparels is highly influenced by the
demographic, socio cultural, economical and household
structure. Others influencers may be family, friends,
reference groups, needs, emotions, personality and
information processing etc.
Research methodology
According to the various researches conducted in past on
apparel branding suggest that branded clothes are of high
preference in consumers but in case of females in Lucknow
branded apparels are not much popular especially in case of
Indian wear. There are only limited branded apparel outlets
in comparison to the retailer’s own labels. But still, female
Branded apparels are gaining high acceptance since last
decade, therefore it’s important for the marketers to study
the influence of brands in apparel purchase. This study was
conducted to analyze the various factors like Brand loyalty,
Brand awareness, Brand Association, Quality Perceptions,
www.theinternationaljournal.org > RJCBS: Volume: 01, Number: 08, June-2012 Page 44
and self-concepts, particularly in case of Indian Woman,
influencing the purchase of branded apparels. Around 100
females of 25-35 years were interviewed and further study
was done on the basis of these five factors which influence
brand equity.
Brand loyalty
Brand loyalty has always been a key concern for the
marketers. It provides a dramatic insulation against the
competition and provides an opportunity to command the
premium. Brand loyalty is one of the core components of
brand equity and also positively and directly affected brand
equity (Atilgan et al., 2005). Under the influence of brand
loyalty, consumers continue to buy the brand, regardless of
the superior features, prices and convenience owned by its
competitors (Aaker, 1991). Brand loyalty leads to repeat
purchase, brand recommendation, word of mouth and
customer satisfaction. In case of apparels, it was found that
almost 80% female consumers of lucknow are loyal to retail
outlets rather than being loyal to a particular brand specially
in case of Indian casual wear. The factors which influence
the customer loyalty are accessibility, current fashion trends,
quality of dress material, aesthetics of the apparel available
at specific outlet.
Brand awareness
It refers to the ability of a potential consumer to recall and
recognize the brand, linking the brand with its
corresponding product class (Aaker, 1991). Brand
awareness includes brand recognition and recall i.e., the
ability to confirm prior exposure and remember the brand.
This sort of awareness is essential for a brand to be able to
take part in the decision process. It is very important for a
marketer to create brand awareness so that a consumer
knows and makes it one of the purchasing choice.
It has been noted that brands with higher level of awareness
would be more likely to be purchased (Yasin et al., 2007)
and consumers tend to buy a recognizable brand rather than
an unfamiliar one (Hoyer, 1990; Macdonaldand Sharp,
2000). As mentioned by Keller (1998), brand awareness can
be enhanced through repeat exposure to the brand. The top-
of-the-mind awareness indicates the relative superiority a
brand enjoys over others and develops a stronger positioning
in the mind. During the research it was also found that
female consumers at Lucknow prefers to purchase the
apparel brands which are known to them as it easily access
the association of the brand with attributes and benefits. It
also generates familiarity in the mind of consumers in
apparel purchase and supports during the decision making
process. According the female consumers at lucknow , they
consider brand awareness as a very important factor in
purchasing of Indian casual apparel .
Brand Association
Brand association is defined as the specific linkage between
the memory and the brand (Aaker, 1991). Keller (1998) and
Yasin et al. (2007) further note that equity of a brand is
largely supported by consumers’ associations towards the
brand, which contribute to a specific brand image. A brand
may have connected associations of feelings , characters,
symbols, lifestyle users etc. and can influence recall of
information and is especially important during decision
making. Keller (1993, 1998) further divides brand
associations into three categories, namely attributes, benefits
and attitudes. As in case of luckow consumers mentioned
above that the females purchasing Indian casual apparel
brands are not much loyal to branded clothes but shows
brand loyalty towards retail outlets, brand association
provides bases to them to purchase the branded clothes and
even make them brand loyal. According to consumers at
lucknow, the apparel brands are preferred due to its
association with the endorser or the local culture. The brand
association triggers to the customers to recall the past
experiences, and its unique sets of associations to
differentiate one brand from another.
Perceived Quality
Perceived quality can be defined as the customer's
perception of the overall quality or superiority of a product
or service with respect to its intended purpose, relative to
alternatives (Aaker 1991). According to various research
work conducted in past , it is know that a brand name
enhances the perceived quality of a product. Perceived
quality of a product gives a powerful reason to the customer
to consider and buy a specific brand. Only brands that are
perceived to be of a good quality are considered for a
purchase decision and rest are all eliminated. it also allows
the brand to acquire a position and differentiate and gives
branded products an option for charging premium. In case of
females purchasing apparel in lucknow feels that the
branded apparel are considered to be of high quality only
where the customer involvement is low. The branded
apparels are considered to be of good quality but this is not
the only reason to end up purchasing the branded apparels.
Taking the quality considerations in a brand, the gap
between the actual and perceived quality and its pricing
plays a big role in apparel purchase.
Self-Concepts
According to Pervin and John (2001), selfconcept is often
viewed as a component of personality. A number of
researchers have suggested that there is a positive
association between self-concept and brand image (Levy,
1959; Sirgy 1982; Sirgy and Su, 2000; Sirgy, Grewal and
Mangleburg, 2000; Johar and Sirgy, 1991). Self-concept is
hypothesised to consist of four components, actual self-
concept, ideal self-concept, social self-concept and ideal
social self-concept (Schiffman et al., 2001). To understand
consumer’s self-perception, self-concept and self-image has
a greater importance for marketers to be familiar with their
consumption behavior and the reason is mostly when
consumer’s take any buying decision when they are
influenced by their self-image. People purchase products to
help them show a certain image of themselves to other
people. Individuals use fashion related products to reflect
their self-image and fashion related clothes to reflect their
self-concept. It is seen that in apparel purchase self-concept
plays the most important role during the decision making.
www.theinternationaljournal.org > RJCBS: Volume: 01, Number: 08, June-2012 Page 45
During purchase of apparel, female consumers consider
their age, personality, occupation, culture, style statement
etc. The consumers believe that due to presence of brand
name in their clothing their social image is presented in a
better way. Thus the self-concept is one of the most
important factors to influence the purchase of branded
apparel.
Conclusion
It is seen that the most important factor which influence the
purchase of female branded apparel in the city of Lucknow
is self-concept. The females also believe that the quality of
the branded apparel is better than non-branded ones but the
gap between that actual and perceived quality influences the
repeat purchase. The factor like brand awareness and brand
association plays a key role during the decision making as it
helps in recognizing and recalling the connection of brand
with the previous exposure or emotional attachment. Brand
loyalty is not a very important factor for influencing the
purchase as females of Lucknow are more into convenience
shopping and also give more importance to fashion trends,
quality of dress material and aesthetics of the apparel which
makes them loyal towards a specific outlet.
References
1. Apaydın, F. (2009). Dimensions of global brand
buying behavior: An empirical investigation . 5Th
International Conference on Business,
Management, and Economics, İzmir, Turkey
2. Farquhar, P. H. (1989). Managing Brand Equity.
Marketing Research , 1(Sep.), 24-33
3. Jacoby, J., & Chestnut, R.W. (1978). Brand loyalty
measurement and management . New York, NY:
Wiley
4. Wood, L.M. (2004). Dimensions of Brand
Purchasing Behavior: Consumers in the 18-24 Age
Group. Journal of Consumer Behavior, 4 (1), 9-24.
http://dx.doi.org/10.1002/cb.154
5. A note on branded apparel industry in India,
http://www.icmrindia.org/
6. Consumer Awareness towards Ready Made
Garments , Dr.N.Vasugi Raaja & Dr.Kanikicherla
Rani, www.fashion2fiber.com
7. Sumathi, G.J., Elements of Fashion and Apparel
Design, New Age International Publishers, New
Delhi, P.46 (2005).
8. Murugaiah, V., and Vishvas, R., Women and
Shopping-An Empirical Study of Banglore City,
Indian Journal Marketing, XXXVIII, (7), July, P.47
(2008).
9. Frings, G.S., Fashion from Concept to Consumers,
Pearson Education, New Delhi, Pp.366-368,
(2005).
10. Jasuja, G.D.,), Consumer Choices; Understanding
Apparel and Furnishing Textiles, The New Cloth
Market.20, (3), March, P.37 (2006).
11. Hareem Zeb, Kashif Rashid, and M.Bilal Javeed,
Influence of Brands on Female Consumer’s Buying
Behavior in Pakistan, International Journal of
Trade, Economics and Finance, Vol. 2, No. 3, June
2011
12. Vieira, A.A. (2009), An extended theoretical model
of fashion clothing involvement, Journal of Fashion
Marketing and Management, 13(2), 179-200.
13. Ben Webb and John Gountas, La Trobe University,
Australia, An Integrative Model of Brand
Personality, Self–Concept and Consumer
Personality Orientations
14. Aaker, J., 1997. Dimensions of Brand Personality.
Journal of Marketing Research, 34, (August), 347-
356.
15. Aaker, J., Fournier, S. and Brasel, S., 2004. When
Good Brands Do Bad. Journal of Consumer
Research. 31(1), 1-16.
16. Blackwell, R. D., Miniard, P. W. & Engel, J. F.
(2006). Consumer behavior. Mason: Thomson.
17. Aaker, D. A (1991). Managing brand equity. New
York: Macmillan.
18. Aaker, D. A (1996). Building strong brands. New
York: The Free Press.
19. Dholakia, R. R. (1999). Going shopping: Key
determinants of shopping behaviors and
motivations. International Journal of Retail &
Distribution Management, 27 (4), 154-165.
20. Keller(2008), Strategic Brand management ,
Pearson education
21. Harsh V Verma , (2006) 2nd edition, Brand
management, Excel books
22. www.fashion2fiber.com

www.theinternationaljournal.org > RJCBS: Volume: 01, Number: 08, June-2012 Page 46
ANNEXURE
1.1 Consumer preference of apparel types:
Apparel Types Preference of Apparel Types
Branded 47
In-house Apparels 11
Both 26
1.2 Influence of Factors
Influence of factors on branded
apparels
1
Least
Important
2
Not
important
3
Important
4
very
Important
5
Most
important
Brand Loyalty 2 36 42 16 4
Brand awareness 0 15 25 45 15
Brand association 0 12 21 44 25
Perceived quality 1 8 18 41 32
self concepts 1 2 16 27 54
www.theinternationaljournal.org > RJCBS: Volume: 01, Number: 08, June-2012 Page 47
Abstract— In this paper we perform the test of random walk
for Indian Commodity Market. Spot price data is used for
thirteen commodities from 2006-2011.We find that daily
commodity returns are not normally distributed and exhibit
short term serial dependence which can be exploited by
technical traders. Commodity return parameters such as mean
returns and volatility do not vary significantly across
commodity classes i.e. agriculture, metal and energy. Further
commodity return characteristics are sensitive to observation
frequency and tend to follow a random walk on monthly
observation hence commodity traders, investors and
researchers shall find more appropriate to work on low
frequency data. The study contributes to both market
efficiency and alternate Asset literature of emerging markets.
Index Terms— Weak-form market efficiency, emerging
market, Indian commodity Markets, trading strategies,
observation frequency.
Jel Codes: G14, G15, C12, C14, C46.
I. INTRODUCTION
luctuations in commodity prices are of interest
because they affect the decisions taken by producers and
consumers; they play a crucial role in commodity-related
investments, project appraisals, and strategic planning; and
they reflect and influence general economic activity. The
ability to accurately forecast the price of these various
natural resource products is therefore an important concern
in both policy and business circles. The Efficient Markets
Hypothesis (EMH) states that an efficient capital market is
one in which security prices adjust rapidly to the arrival of
new information, and therefore, the current prices of
securities reflect all information about them (FAMA 1970).
Three sets of assumptions imply an efficient capital market:
(a) new information regarding securities come to the market
in a random fashion, and the timing of one announcement is
generally independent of others, (b) an efficient market
requires that a large number of competing profit-maximizing
participants analyze and value securities, each independently
of others, (c) the competing investors attempt to adjust
.
Dr. Namita Rajput is an Associate Professor in Department of Commerce
at Sri Aurobindo College (M), University of Delhi, India (phone: +91-
9312180054; +91-8285888860; e-mail: [email protected]). Prof. Sanjay Sehgal is a Professor of finance in Department Of
Financial Studies, south campus at University of Delhi, India, ESC-PAU,
France, (e-mail: [email protected]).
security prices rapidly to reflect the effect of new
information. Although the price adjustment may be
imperfect, it is unbiased. This means that sometimes the
market will under-adjust or over-adjust, but an investor
cannot predict which will occur at any given time. The main
corollary of the idea that markets are efficient is that price
movements do not follow any patterns or trends; hence past
price movements cannot be used to predict future prices.
Rather, prices follow what is known as a ‘random walk’, an
intrinsically unpredictable patterni. If we believe that
efficient market hypothesis is a valid proposition, then the
current asset prices should reflect all generally available
information. The efficient market hypothesis implies that
since market prices reflect all available information,
including the information about the future, the only
difference between the prices at Pt and Pt+1 are events that
we cannot possibly predict, i.e. a random event. Hence, in an
efficient market, stock prices can be statistically tested for
random walk hypothesis.
Recently the efficient markets hypothesis and the notions
connected with it have provided the basis for a great deal of
research in financial economics. Voluminous literature has
developed supporting this hypothesis. Briefly stated, the
EMH claims that asset prices are rationally related to
economic realities and always incorporate all the
information available to the market. This implies the
absence of exploitable excess profit opportunities. The EMH
has received a lot of empirical support in the academic
literature during seventies and eighties. This line of thought
has always been viewed with a lot of skepticism in the
professional community, which led to the use of charts and
technical analysis rules for trading strategies in markets.
Numerous researchers conducted empirical studies in
testing weak-form efficiency for several stock markets and
employed various techniques but the empirical evidence is
controversial. There is a substantial body of literature on
market efficiency and stock return behavior, but similar
research for commodity market is limited. Mainly the
studies are concentrated in the developed stock markets
particularly US market. However, the needs of more
research in the emerging and less developed markets are
well recognized, especially in commodity market.
EMH can be tested in various forms; most common are
“Weak Form” tests in which the set of available information
is simply the history of market prices. Rejection of
hypothesis requires the researchers to demonstrate
dependencies in the history of prices which can be profitably
Test of Pricing Efficiency and Distributional
Properties: Indian Commodity Market
Prof. Sanjay Sehgal Associate Professor in Department of Commerce at Sri Aurobindo College (M), University of Delhi,
Dr. Namita Rajput Professor of finance in Department Of Financial Studies, south campus at University of Delhi
F
www.theinternationaljournal.org > RJCBS: Volume: 01, Number: 08, June-2012 Page 48
be exploited .A trading strategy based only on past prices
must be shown consistently to outperform a naïve strategy
based only on past prices must be shown inconsistently to
outperform a naïve strategy such as buying at the start of the
trading period and selling at its end (buy-and-hold).
Examples of weak form tests of efficiency in commodity
markets are Houthakker (1961), Smidt (1968), Srevenson
and bear (1970), Leuthold (1972), and Peterson and
Leuthold (1982).This paper reports the results of weak form
efficiency tests which samuelson (1965), Cootner (1964)
and Danthine (1978) have all argued that weak form
efficiency is valid only for futures market. Alchian (1974)
claims, however, that cash markets should exhibit efficiency
properties.
The empirical evidence is controversial in the field of
weak form of commodity markets. In this section we
provide a brief review of literature. Financial and economic
time series have often been modelled as random-walk
processes (e.g., Mercer and Smith, 1959; Cheng and Deets,
1971; Cogley, 1990). However, the random walk has been
proven to fit real market data poorly in many cases. For
examples, see Mandelbrot (1963a); Fama (1965); Greene
and Fielitz (1977); Helms and Martell (1985); Hsieh (1989);
Baillie and Bollerslev (1994); Barkoulas et al. (1997). Other
models with trends and cycles have been suggested, and one
category of such models is characterized by long memory or
long-term memory. Memory means that observations are not
independent; each observation is affected by the events that
preceded it. Even a simple autoregressive series exhibits
memory, but autoregressive behaviour is considered short
memory. Early studies on testing weak form efficiency
generally agree with the preposition considering a low
degree of serial correlation and transaction cost (Cootner,
1962; Fama, 1965; Kendall 1953). All these studies support
the proposition that price changes are random and past price
changes are not useful in forecasting future price changes
particularly after transaction costs are taken into account.
Granger and Morgenstern (1970) tested random walk theory
covering more than fifty stock market price series with
differing sampling intervals. Various cues of randomness of
short-term stock prices were found and some deviations
from random walk were also noted in both high and low
frequency regions of the spectrum. However, there are some
studies, which found the predictability of share price
changes (e.g., Fama and French 1988 a and b) in developed
markets but they did not reach a conclusion about profitable
trading rules. Nicolaas, (1997) conceded that past returns
have predictive power but the degree of predictability of
returns was not high. Though it is generally believed that
emerging markets are less efficient, the empirical evidence
does not always support this thought.
A World Bank study by Claessens, Dasgupta and Glen
(1995) noted significant serial dependence in equity returns
from 19 emerging markets that violates weak form EMH. It
explained that the inefficiency might be due to delay in
operations and high transaction cost, thinness of trading and
illiquidity in a market. In India, weak form market
efficiency has been widely researched and studies have
generated a large amount of evidence in favor of weak form
efficiency, e.g. Barua (1981), Barua and Raghunathan
(1987), Rao and Mukherjee (1971), Sharma and Kennedy
(1977), Sharma (1983), Gupta (1985), Ramachandran
(1985), Dhankar (1991), Saxena (1992), Belgaumi (1995),
Mittal (1995), Yalawar (1988), Mishra (2000), and Gupta
(2001).There have been only a few studies (e.g. Chaudhury,
1991; Kulkarni, 1978) which did to support the weak
efficiency hypothesis. Subramanian (1993) studied weak
form of market efficiency and noted prominent spikes at
lower frequency range through spectral analysis. It noted the
presence of periodic cycles in the movement of share prices,
which are against the assertion of the weak form of EMH.
Gupta and Gupta (1997) opined that phenomenon of large
departures from random price behaviour might have been
due to structural transformation taking place in the Indian
Capital Market. Deb (2003) tested weak form efficiency
using both parametric and nonparametric tests across five
major market indices of the Indian stock market. It depicted
that prices in the Indian stock market do not follow the
random walk model except for BSE 100 indices, which
endorses efficiency for the variance ratio test.
Among the studies on commodity futures prices, Larson
[13], using autocorrelograms, found evidence to support
Working's [17] theory of anticipatory prices which implies
that prices move randomly. Stevenson and Bear [16], who
used an assortment of statistical tools and mechanical
trading rules, concluded that corn and soybean futures prices
move in a systematic rather than a random fashion. This
tends to agree with earlier work done by Houthakker [11]
who applied a stop-loss scheme to corn trading. On the other
hand, Cargill and Rausser [3], utilizing spectral analysis on
various futures contracts for 1967, including corn,
concluded that "a simple stochastic process appears
consistent with commodity markets price behavior."
Singh (2001) found that Indian commodity market is
efficient especially when the time of maturity comes closer.
He found Gur and Potato futures market, confirmed to
efficient market hypothesis throughout. Whereas, he found
efficiency in Castroseed, Hapur and Turmeric futures
market was sensitive to period for maturity. On the whole,
since strong co integration in spot market and the futures
market was identified thus, Singh concluded that Indian
commodity futures market was efficient.
A major shortcoming of the entire analysis and a possible
reason for the lack of wide acceptance for any single result.
The consequence has been varying results, depending upon
data and tests used. Only Stevenson and Bear have
attempted to apply alternative statistical tools and
mechanical trading rules to similar data.
Thus, a large majority of studies favor prevalence of weak
form stock market efficiency in Indian commodity market.
Some studies deny its existence to keep the academic debate
alive on the subject. Under this backdrop, the present study
was conceptualized to explore plausibility of profitable
trading strategies based on past prices. In this regard, it may
be constructed as yet another attempt to re-examine the
weak form efficiency proposition in commodity market in
India.
This paper is organized into following sections, first
www.theinternationaljournal.org > RJCBS: Volume: 01, Number: 08, June-2012 Page 49
section gives the introduction of commodity market and
about the EMH i.e. the present section, second section
explains about the research objectives, hypothesis, data and
the period of study. Third section deals with time series
Behaviour of commodity prices and returns in India:
distributional, descriptive, autoregressive analysis is done.
Section four describes about observation frequency and its
impact on aggregate commodity price behaviour and section
five gives Summary and conclusions.
II. RESEARCH OBJECTIVES, HYPOTHESIS AND
DATA
A. RESEARCH OBJECTIVES
As outlined earlier, the basic objective of this paper is to
assess whether spot/cash prices in the Indian commodity
markets move as the random walks theory suggests. In other
words, is the Indian commodity market mechanism efficient
in the manner stipulated in its weak form preposition? To be
more precise, the following objectives are conceptualized in
the paper under consideration: Whether commodity cash
prices tend to follow a normal distribution, to empirically
test whether the weak form of efficient market hypothesis
holds well in Indian commodity markets encompassing
observable interdependence and non randomness, do
commodity parameters vary across risk return parameters
across different commodity classes.
B. HYPOTHESIS
The paper attempts to test on the commodity market
efficiency in its weak form variant for India an emerging
market. In this regard, it tends to examine validity of the
following hypotheses:
H 1: Commodity prices in India are normally distributed.
H 2: Successive price movements are random and are not
interdependent.
H 3: Whether commodity parameters tend to vary across
alternative commodity class i.e. agriculture, metal and
energy.
H 4: The characteristics of commodity return series are
sensitive to observation frequency i.e. use of daily, weekly,
monthly data.
H 5: There is no significant co-incident lead/lag/ between
prices of different commodities.
C. DATA
Daily closing price data of thirteen commodities have
been taken from MCX from may 2006 to January 2010.
There are 1092 observations for each commodity. The
commodity prices were converted into percentage returns by
the following formula Rt = (Pt – Pt-1), where Rt = Returns
of commodities, in period t, Pt = Price of commodities at
day t, Pt-1 = Price of commodities at day t-1. Commodities
include basket of commodities which include agricultural
(pepper, channa, jeera, wheat, refined soya oil, soya bean),
energy (natural gas, crude oil), and metal (gold, silver,
copper, zinc, aluminum). Daily prices were converted into
weekly and monthly by taking closing prices for each week
and month respectively and converted into percentage
returns using the above said formula.
III. TIME SERIES BEHAVIOUR OF COMMODITY RETURNS
We start by testing the stationarity of sample price series.
Augmented Dickey–Fuller Test (ADF) test was performed
on the sample price data using 5% level of significance. The
sample time series exhibit non stationarity as shown in table
1.Next we repeat stationarity test for sample return series.
The daily return series seem to be stable over time as
indicated in table 11 implying that commodity price are
integrated to order 1. After that Descriptive Analysis is done
which exhibits, very low Mean returns .While standard
deviations are quiet high for most of the commodities. High
standard deviation signify very high volatility in asset
returns which is common across all commodity classes, i.e
in agricultural, energy and metal .The result of natural gas
is exceptionally different with large mean and standard
deviations. It provides an annualized return of 1250%
(Assuming 250 trading days in a year), followed by jeera
and pepper. Zinc and wheat provide 25% annualized returns,
while other commodities show low negative returns. There
seems to be no distinct pattern in the mean and volatility
characteristics across commodity classes. it is evidenced that
there is negative skewness in eight out of thirteen
commodities and five are positively skewed. Aluminium,
jeera and natural gas have high positive skweness. Further
the commodity returns distributions series exhibit
leptokurtic. So negative skewness and leptokurtic series of
commodity return series indicates that the distribution is not
normal. Normality violations patterns are also confirmed by
Jarque-bera (parametric test) at 5% level of significance p
value is less than 0.05. In other words, the non-normal series
of commodity return series deviate from the prior condition
of random walk model as shown in table 11.
To confirm the pattern of non –normality Jarque-bera test
was performed. The j b statistics is computed as follows
Where n=no of observations
S=measure of skewness
K=measure of kurtosis
Under large samples the J&B statistic tends to follow chi-
square distribution with two degree of freedom and can be
used to test the null hypothesis that the data are from a
normal distribution. The null hypothesis is a joint hypothesis
of the skewness being zero and the excess kurtosis being 0,
since samples from a normal distribution have an expected
skewness of 0 and an expected excess kurtosis of 0 (which is
the same as a kurtosis of 3). As the definition of JB shows,
any deviation from this increases the JB statistic. Our results
show that no value is less than 0.05, which confirms non
normality. To reconfirm the distribution pattern of the
commodity return series, Kolmogrov–Smirnov Goodness of
Fit test is also used, (K-S test) is a non-parametric test and is
used to determine how well a random sample of data fits a
particular distribution (uniform, normal and Poisson).,
which provides further evidence whether the distribution
confirms to a normal distribution or not.
www.theinternationaljournal.org > RJCBS: Volume: 01, Number: 08, June-2012 Page 50
Results of (K-S test) show very low p –values, which
clearly indicates that daily return series of sample
commodities do not follow normal distribution.
Next we test the statistical dependencies of the daily
return series using parametric test i.e. serial correlation
(parametric test) and non parametric test i.e. runs test (non –
parametric) .Test statistic which is used to notice any
perceptible trend in commodity returns is the serial
correlation matrices that measures correlation between price
changes in consecutive time periods, and is a measure of
how much price change in any period depends upon price
change over the previous time period. A serial correlation of
zero would imply that price changes in consecutive time
periods are uncorrelated with each other, and can thus be
viewed as a rejection of the hypothesis that investors can
learn about future price changes from the past ones. A
positive and statistically significant serial correlation could
be viewed as evidence of price momentum in markets, and
would suggest that returns in a period are more likely to be
positive (negative) if the prior period returns were positive
(negative). Similarly, a negative and statistically significant
serial correlation could be evidence of price reversals, and
would be consistent with a market where positive returns
were to follow negative returns and vice versa. In a more
precise way, serial correlation coefficients provide a
measure of relationship between value of a random variable
(Xt) in time t and its value k-periods earlier. It indicates
whether price changes in the time t are influenced by price
changes occurring k-periods earlier, where k = 1, 2, 3….n.
In the present study we have considered time lags of 1, 2,
3… 16 days. The autocorrelation matrix is estimated by:
Wherein,
C0 = Variance of Xt, and
N = number of observation.
Statistical testing of auto correlation matrices requires
standard error of estimated matrices (S.E. (k)), which is
obtained as:
S.E. (k) = 1/ (n-k)1/2, When n is sufficiently large (n>50),
approximate value of the standard error of estimated
(S.E. (k)) matrices is given by:
S.E. (k) = 1/ (n) ½
From the analysis it is evident that at lag one (5 %) level
of significance there are negative autocorrelation factor
(ACF) values of all thirteen commodities i.e. mean reversion
nature is exhibited for all sample commodities. The results
reported in Table 11 do not support randomness in the
commodity prices as none of p values was greater than 0.05
hence found to be significant .hypothesis is rejected and
series are negatively auto correlated. Market is not
efficient and market information is not symmetric. In
trading behaviour there is no maturity because the
information is not complete. Auto correlation exists in the
series except in case of wheat and soya bean where p
value is >0.05.
The run test, is used to detect statistical dependencies
(non randomness), which may not be diagnosed by the
parametric auto-correlation test. The test is well known
and widely used to prove the random walk model because
it ignores the properties of distribution. Null hypothesis
of the test is that the observed series is a random series.
The numbers of runs are computed as a sequence of the
price changes of the same sign (such as: ++, −−, 0
0).When the expected number of run is significantly
different from the observed first number of runs implies
that the null hypothesis of randomness of the daily return
series is rejected. The run test converts the total number of
runs into a Z statistic. For large samples the Z statistics
gives the probability of difference between the actual and
expected number of runs. The Z value is greater than or
equal to ± 1.96; reject the null hypothesis at 5% level of
significance. The question of whether a sequence of
observed numbers (i.e., the individual daily commodity
price series or daily commodity returns series) is a random
sequence can be studied by the number of runs observed in,
Wherein,
M = Expected number of runs
n1 = Number of positive price changes
n2 = Number of negative changes.
n3 = Number of zero price changes.
N = Total number of price changes (n1+n2+n3)
A process is said to be random if observed number of
runs is given by:
R = M ± 1.96 S. E.
Wherein, standard error (S. E.) is given as:
The difference between the actual and expected number
of runs is expressed by a Standard normal z variate as:
Z = [(R-M)/S.E.]
Adjusted z variate (taking into consideration continuity
adjustment factor, i.e., 0.5) is as follows:
Z = [(R + 0.5 -M)/S.E.]
The independence hypothesis is again rejected at 5% level
of significance for majority of commodities with exception
of three agricultural commodities like wheat, pepper and
THE KOLMOGOROV-SMIRNOV TEST IS DEFINED BY:
H0: The data follow a specified distribution
Ha: The data do not follow the specified distribution
Test
Statistic:
The Kolmogorov-Smirnov test statistic is defined as
where F is the theoretical cumulative distribution of the
distribution being tested which must be a continuous distribution (i.e., no discrete distributions such as the binomial or Poisson or
normal), and it must be fully specified (i.e., the location, scale,
and shape parameters cannot be estimated from the data).
Sig. Level: .
Critical
values:
The hypothesis regarding the distributional form is rejected if the
test statistic, D, is greater than the critical value obtained from a table. There are several variations of these tables in the literature
that use somewhat different scaling for the K-S test statistic and critical regions.
www.theinternationaljournal.org > RJCBS: Volume: 01, Number: 08, June-2012 Page 51
refined soya, as shown in table 11. Thus the daily
commodity returns in India do not seem to follow a random
walk as they are not independently and identically
distribution. Typically, they exhibit thick tails and high
peakdness, which are the properties of stable paretian
distributionii. Such distribution follows a biased random
Walk and behaves as nonlinear dynamical or chaotic
systems. They combine long term trends with noise and
confirm a presence of noise trader risk in such markets.
IV. OBSERVATION FREQUENCY AND ITS IMPACT ON
AGGREGATE COMMODITY PRICE BEHAVIOUR
In this section, we focus on weekly and monthly time
series of commodity returns. The objective is to ascertain
how time series properties of sample distribution change.
When one shifts from high observation frequency (daily
returns) to low observation frequency (weekly and monthly
returns).We replicate the statistical analysis executed in the
previous sections.
Weekly analysis: Weekly returns series exhibit
stationarity when we performed unit root test as shown in
table-111.Further seven out of thirteen commodity return
series show negative skewness, while many of them are
leptokurtic. J&b statistics confirms that seven out of thirteen
commodity returns are non normal in nature. The K.S
statistics provides even stronger results against non
normality as the null hypothesis does hold for any of the
sample distribution. We next evaluate the time series
dependence of weekly commodity returns using ACF (one
lag) it is observed that nine out of thirteen return series
commodities exhibit negative autocorrelation thus
confirming their mean reversion tendency. The sample
return series however seem to exhibit no short term memory
process as per runs test. It is interesting to note that that the
results for both distributional properties and as well as time
series dependence are somewhat conflicting when one uses
parametric and non parametric version of statistical tests.
This is not surprising in case of sample time series which
show i.i.d violations. On overall basis, major of return series
do not seem to be random on weekly basis.
Monthly analysis: The monthly commodity return series
are stable over time. The mean returns and volatility seem to
have sobered down with an exception of Natural Gas with
extremely high mean return and volatility parameters.
Soyabean tend to provide an annualized return of 36% while
Jeera, Pepper wheat and zinc give 24% returns on
annualized basis. Skewness and kurtosis have also become
small over sample distribution. Both JB and KS statistics
confirm that the distribution is normal .The serial correlation
and runs test suggest that the sample distributions are also
independent over time. Thus monthly commodity returns
seem to be randomly distributed, as shown in Table 1V.
This implies that monthly returns are weak form efficient.
This precludes any possibility of employing technical
analysis of employing any profitable strategies further the
sample series are normally distributed and hence
commodities can be suitable analyzed using mean and
volatility statistics.
V. SUMMERY AND CONCLUSION
Indian commodity market, in organized form is relatively
nascent in nature. In India there are 25 recognized future
exchanges, of which there are three national levels. It has
operationalized from November 26, 2002 and got its
recognition in October 2002. In this paper we attempt to
analyze the time series behaviour of selected commodities
.Such a study is essential before any meaningful investment
strategies could be developed for the asset class. The daily
commodity returns behaviour exhibit low mean returns and
high volatility. Further theses commodity return series are
not normally distributed owing to leptokurtosis and high
skewness (which is negative in majority of cases).The
commodity returns also exhibit serial dependence and hence
can be exploited by technical traders.
Commodity return characteristics seem to be sensitive to
observation frequency for instance mean and standard
deviation of return sobered down as we move from daily to
weekly then from weekly to monthly returns. The monthly
commodity returns also follow a random walk as they are
normally distributed and have no short term memory.
Commodity characteristics do not seem to vary significantly
across various asset classes like metal, agriculture and
energy products. Natural Gas is an exception with extremely
high mean returns and volatility parameters; in addition
Jeera, Pepper wheat and zinc tend to provide high annual
returns.
Our findings are extremely pertinent for commodity
traders who are on a look out for profit trading strategies.
They must concentrate on high observation frequency for
trading purpose but must bear in mind that profit from
transaction intensive strategy may get eroded by high costs
of trading. From researchers point of view it is advisable
that empirical work is conducted mainly on monthly return
series at this observation frequency no i.i.d violations are
exhibited. Our empirical work shall provide a foundation for
analyzing relevant research issue in commodity market
including the interrelationship between spot and future
market characteristics.
ACKNOWLEDGMENT
I would like to thank the editor and an anonymous referee
for useful inputs. I gratefully acknowledge the help received
from reviewers. The remaining errors, if any, are my
responsibility.
REFERENCES
Baillie, R. T., Bollerslev, T. and Mikkelsen, H. O. (1996). Fractionally integrated generalized autoregressive conditional
heteroskedasticity. J. Econometrics, 73: 5–59.
Barkoulas, J., Labys, W. C. and Onochie, J. (1997). Fractional dynamics in international commodity prices. The J. Futures
Markets, 17(2): 161–89.
Barua, S.K. 1981, Short-run Price Behaviour of Securities:
Some Evidence from Indian Capital Market. Vikalapa (April-
June), 6 (2): 93-100.
Barua, S.K. and V. Raghunathan (1987). Efficiency and
Speculation in the Indian Capital Market. Vikalapa (Jul-Sept). 12 (3): 53-589.
Belgaumi, M.S. (1995). Efficiency of the Indian Stock Market: An Empirical Study. Vikalapa, 20 (2): 43-47.
www.theinternationaljournal.org > RJCBS: Volume: 01, Number: 08, June-2012 Page 52
Cootner, P.H. (1962). Stock Prices: Random vs. Systematic
Changes. Industrial Management Review. 3 (spring): 24-45.
Deb, S.S. 2003, In Search of Weak Form of Efficiency in Indian
Capital Market. The ICFAI J. Applied Finance. 9(9): 31-50.
Cootner, P.H (1964). Comments on the variation of certain speculative prices, in The Random Character of Stock Market
Prices. (Ed) P.H.Cootner. MIT Press. Cambridge.
Massachusetts.
Cheng, P. and Deets, M. (1971). Portfolio returns and the
random walk theory. J. Finance. 26: 11–30.
Cogley, T. (1990). International evidence on the size of the
random walk in output. The J. Political Economy. 98(3): 501–18.
Claessens, Stijin, Dasgupta Susmita, and Glen Jack, (1995).
Return Behavior in Emerging Stock Market. The world Bank economic Review. 9 (1): 131-151.
Chan, K. (1992). A Further Analysis of the Lead-Lag Relationship between the Cash Market and Stock Index Futures
Market. The Review of Financial Studies. 5(1): 123-152.
Chen, Ping (1996). A Random-Walk or Color-Chaos on the
Stock Market? - Time-Frequency Analysis of S & P Indexes.
Studies in Nonlinear Dynamics & Econometrics. 1(2): 87-103.
Danthine P. (1978). Information, futures Prices, and stabilizing
speculation. J. Economic Theory. 17: 79-98.
Fama, Eugene (1965). The Behavior of Stock Market Prices. J.
Business. 38: 34-105.
Fama, E.F (1970). Efficient capital markets: a review of theory and empirical work. J. finance, 25: 383-426.
Fama, Eugene and Kenneth French (1988a). Dividend Yields and Expected Stock Returns. J. Financial Economics, 22: 3-25.
Fama, Eugene and Kenneth French (1988b). Permanent and Temporary Components of Stock Prices. J. Political Economy,
96: 246-273.
Fama, E. F. (1991). Efficient Capital Market: II. The J. Finance. 46(5): 1575-1617.
Granger, C. W. J. et al., (1998). A Bivariate Causality between Stock Prices and Exchange Rates: Evidence from Recent Asia
Flu. Discussion Paper. Department Of Economics. University of California. San Diego: 1-24.
Granger, C. W. J. et al., (2000). A Bivariate Causality between
Stock Prices and Exchange Rates: Evidence from Recent Asian Flu. The Quarterly Review of Economics and Finance Elsevier,
40(3): 337-354.
Granger, C.W.I., and Oskar Morgenstern (1970). What the
Random Walk Model Does Not Say. Financial Analysis
Journal. 26 (3): 91-93.
Greene, M. T. and Fielitz, B. D. (1977). Long-term dependence
in common stock returns. J. Financial Economics. 4: 339–49.
Houthakker S (1961). Systematic and random elements in short
term price movements. American Economic Review. 51: 164-172.
Helms, B. P. and Martell, T. F. (1985). An examination of the
distribution of futures price changes. The J. Futures Markets. 5(2): 259–72.
Singh J. B. (2001). Weak Form Efficiency of Indian Commodity Futures. UTI Indian Capital Market Conference. December: 3-
23.
28. Kendall, M. G. and Hill, B. A. (1953). The Analysis of
Economic Time Series Part I: Prices. J. Royal Statistical
Society. 96: 11-25.
Kulkarni, N. Suresh (1978). Share Price Behavior in India: A
Spectral Analysis of Random Walk Hypothesis. Sankhya. The
Indian J. Statistics. 40:135-162.
Mittal, R.K. (1995). Weak Form Market Efficiency: Empirical
Tests on the Indian Stock Market. Pranjan, and XXIII (3): 297-313.
Mishra, B. (2000). Is there any Monthly Seasonal Pattern in Indian Stock Market? New Delhi, Tata McGraw-Hills: 372-393.
Hsieh, D. A. (1989). Testing for nonlinear dependence in daily
foreign exchange rate changes. J. Business. 62: 339–68.
Leuthold, R.M. (1972). Random Walk and price trends: The live
cattle future market. J. Finance. 24: 879-889.
Leuthold, R.M. (1976). On the methodology of testing for
independence in future prices: Reply. J. Finance. 31: 984-985.
Mandelbrot, B. B. (1963a). The variation of certain speculative
prices. J. Business. 36: 394–419.
Nicolaas Groenewold (1997). Share Market Efficiency Tests
Using Daily Data for Australia and New Zealand Markets.
Applied Financial Economics. 7: 645-657.
Gupta, O.P. (1985). Behavior of Share Prices in India: A Test of
Market Efficiency. National Publishing House. New Delhi.
Gupta, O. P. (2001). A Study of Stock Market Efficiency in
India. Finance India. XV(2): 665-673.
Gupta, O.P. and Gupta, Vandana (1997). A Re-examination of
Weak-form Efficiency of Indian Stock Market. Finance India. XI (3): 619-632.
Ramachandran, J. (1985). Behaviour of Stock Market Prices,
Trading Rules, Information & Market Efficiency. Doctoral Dissertation. Indian Institute of Management. Ahmadabad.
Rao, K.N. and Mukherjee, K (1971). Random-Walk Hypothesis: An Empirical Study. Arthaniti. 14(142) Sharma, J.L. 1983.
Efficient Capital Markets and Random Character of Stock Prices
Behaviour in a Developing Economy. The Indian Economic Journal. 31 (2):53-70.
Sharma, J.L. (1983). Efficient Capital Markets and Random Character of Stock Prices Behaviour in a Developing Economy.
The Indian Economic Journal. 31(2): 53-70.
Samuelson, P.A. (1965). Proof that properly anticipated prices fluctuate randomly. Industrial Management Review. 6: 41-48.
Sharma, J.L. and Kennedy, Robert E (1977). A Comparative Analysis of Stock Price Behavior on the Bombay, London and
New York Stock Exchanges. J. Financial and Quantitative
Analysis. September: 391-413.
Subhash Chander and Philip (2003). Behaviour of Stock Market
Prices at BSE and NSE: An Application of Runs Test. J. Accounting and Finance. 17(2): 41-57.
Yalawar, Y.B. (1988). Bombay Stock Exchange: Rate of Return and Efficiency. Indian Economic Journal. 35(4): 68-121.
i The term random does not imply that price movements are
erratic or chaotic, just that prices respond only to new
information. This information may be randomly good or bad
and prices will therefore move in an unpredictable manner.
The movements themselves are a perfectly rational response
to the available information (Keane, 1983). The market
efficiency theory is inconsistent with the possibility for
analysts and investors to spot over- and undervalued stocks
with different investment strategies in order to earn excess
return. An efficient market is one where market price is an
unbiased estimate of the true value of investment. Contrary
to the popular view, it does not require that the market price
be equal to true value at every point in time. All it requires
is that errors in the market price be unbiased, i.e., that price
can be greater than or less than true value, as long as these
deviations are random.
ii Non-normal stable distributions have "fat tails" that
generally satisfy a convergence property defined by Wilfred
Pareto. For this reason, non-normal stable distributions are
often called stable Paretian distributions.

www.theinternationaljournal.org > RJCBS: Volume: 01, Number: 08, June-2012 Page 53
APPENDIX
TABLE-1: ADF TEST OF PRICES
Commodities t-Statistic Prob.* ADF Statistics
1)GOLD -0.276069 0.9258 -2.863972
2)SILVER -2.863977 0.6058 -1.354392
3)COPPER -1.917971 0.3241 -2.863974
4)ZINC -1.332403 0.6162 -2.863974
5)ALUM -2.863974 0.4715 -1.620845
6)NATGAS -17.92243 0 -2.864649
7)CRUDEOIL -2.863972 0.5642 -1.43908
8)REFSOYA -2.864031 0.4165 -1.728647
9)SOYABEAN -1.301508 0.6302 -2.867496
10)PEPPER -2.863974 0.0321 -3.034252
11)CHANA -2.864013 0.0594 -2.79384
12)ZEERA -2.863977 0.2143 -2.178846
13)WHEAT -0.647119 0.8569 -2.867949
TABLE-11: DESCRITIVE ANALYSIS OF DAILY RETURNS
DAILY ADF (TVAL) ADF(ST) MEAN SD
ENERGY
NATU GAS -2.8 -16.0 0.0567 1.2175
CRUDEOIL -2.864 -15.755 0.0004 0.0163
AGRI COMM
JEERA -2.863 -16.071 0.0028 0.0738
CHANNA -2.877 -9.0478 0.0004 0.0164
PEPPER -2.863 -11.368 0.0016 0.0142
REFINED SOYA -2.864 -19.734 0.0005 0.0056
SOYABEAN -2.867 -13.155 0.0007 0.0142
WHEAT -2.899 -9.7441 -0.001 0.0487
METAL
ZINC -2.863 -13.774 -0.001 0.0236
ALUMINIUM -2.877 -9.1853 -0.008 0.0209
COPPER -2.877 -5.0726 0 0.0191
SILVER -2.863 -12.96 0 0.0152
GOLD -2.863 -11.767 0.0002 0.0095
DAILY SK KURT J&BERA (P V) KS (P V)
ENERGY
NATU GAS 20.792 434.26 3425897.94 (0) 13.447 (0)
CRUDEOIL -0.042 3.7932 11.6130587 (0) 5.5727 (0)
AGRI COMM
JEERA 14.923 317.14 1817292.73 (5.95E-11)
11.902 (0)
CHANNA -0.645 6.6052 267.643148
(0.003007851)
7.4592 (0)
PEPPER 0.6188 5.6637 157.447936 (0) 8.2581 (0)
REFINED SOYA 0.6177 3.7607 38.4205162 (0) 9.8324 (0)
SOYABEAN -6.425 91.125 144744.33 (0) 6.9686 (0)
WHEAT -19.76 405.19 29805.4
(-4.54E-09)
7.6134 (0)
METAL
ZINC -0.417 4.3915 48.0814395 (0) 4.6484 (0)
ALUMINIUM 3.1649 78.943 105987.188 (0) 6.6341 (0)
COPPER -0.291 4.4968 47.0915449 (0) 5.3402 (0)
SILVER -0.39 5.313 108.812321 (3.62E-11)
7.1522 (0)
GOLD -0.453 498 128.914701 (0) 8.3672 (0)
DAILY ACF(AC) ACF -P VA RUNS (ZA) RUNS(PV
ENERGY
NATU GAS -0.04 0.242 0.946 0.343
CRUDEOIL -0.035 0.241 1.562 0.118
AGRI COMM
JEERA -0.239 0.011 -3.74 0.0001
CHANNA 0.027 0.366 -1.949 0.0512
PEPPER 0.03 0.321 -6.016 1.78E-09
REFINED SOYA 0.027 0.369 -6.022 1.72E-09
SOYABEAN 0.026 0.569 -1.11 0.2667
WHEAT 0.01 0.841 -5.549 0
METAL
ZINC 0.014 0.646 2.143 0.03
ALUMINIUM -0.058 0.052 2.324 0.02
COPPER 0.007 0.811 1.518 1.518
SILVER 0.007 0.811 -1.089 0.275
GOLD 0.008 0.793 -0.755 0.449
TABLE-111: DESCRITIVE ANALYSIS OF WEELY RETURNS
WEEKLY ADF(T-VAL) ADF(STAS) MEAN SD
NATL GAS -2.864 -16.001 0 0.04
CRUDEOIL -2.864 -15.755 0.001 0.02
AGRI COM
JEERA -2.863 -16.071 0.032 0.23
CHANNA -2.877 -9.0478 0.003 0.03
PEPPER -2.863 -11.368 0.037 0.28
REFINED SOYA -2.864 -19.734 -0.01 0.1
SOYABEAN -2.867 -13.15 0.035 0.28
WHEAT -2.899 -9.7441 0.004 0.01
METAL
ZINC -2.863 -13.774 0 0.03
ALUMINIM -2.877 -9.1853 0 0.01
COPPER -2.877 -5.0726 0.004 0.02
SILVER -2.863 -12.96 0.001 0.03
GOLD -2.863 -11.767 0 0.01
WEEKLY SKEWNES
S
KURTOSI
S
JARQUEBER
A (P
VALUE)
KS (p)
value)
NATL GAS -0.713 4.961 18.36134 (0.100923)
13.447 (0)
CRUDEOIL -0.081 2.624 0.523536
(0)
5.5727(0
)
AGRI COM
JEERA 8.398 72.02 15769.1
(0.692813)
11.902(0
)
CHANNA -0.295 4.056 4.574182
(0.000103)
7.4592(0
)
PEPPER 8.341 71.4 15488.74
(0.76969)
8.2583
(0)
REFINEDSOY
A
-8.351 71.51 15539.96
(0)
9.8324
(0)
SOYABEAN 8.337 71.42 15499.38
(0)
6.9686(0
)
WHEAT 1.408 5.889 50.85251
(0)
7.6007(0
)
METAL
ZINC -0.331 3.613 2.545997
(0.101561)
4.6484(0
)
ALUMINIM 0.193 3.292 0.73399 (0)
6.6341(0)
COPPER -0.015 3.95 2.824737
(0)
5.3402(0
)
SILVER 2.296 15.77 575.5493 (0)
7.1522(0)
GOLD -0.23 4.121 4.586791
(0.279991)
8.3672(0
)
WEEKLY ACF
(AC)
ACF(PVAL) RUNS
(ZA)
RUNS(P)
NATL GAS -0.518 0 1.23 0.2173 CRUDEOIL -0.582 0 -1.31 0.188 AGRI COM JEERA -0.115 0 1.23 0.2173 CHANNA -0.148 0 -1.31 0.188 PEPPER -0.078 0.01 0.65 0.5113 REFINEDSOYA -0.078 0.011 -0.07 0.9415 SOYABEAN -0.078 0.092 -2.4 0.0162
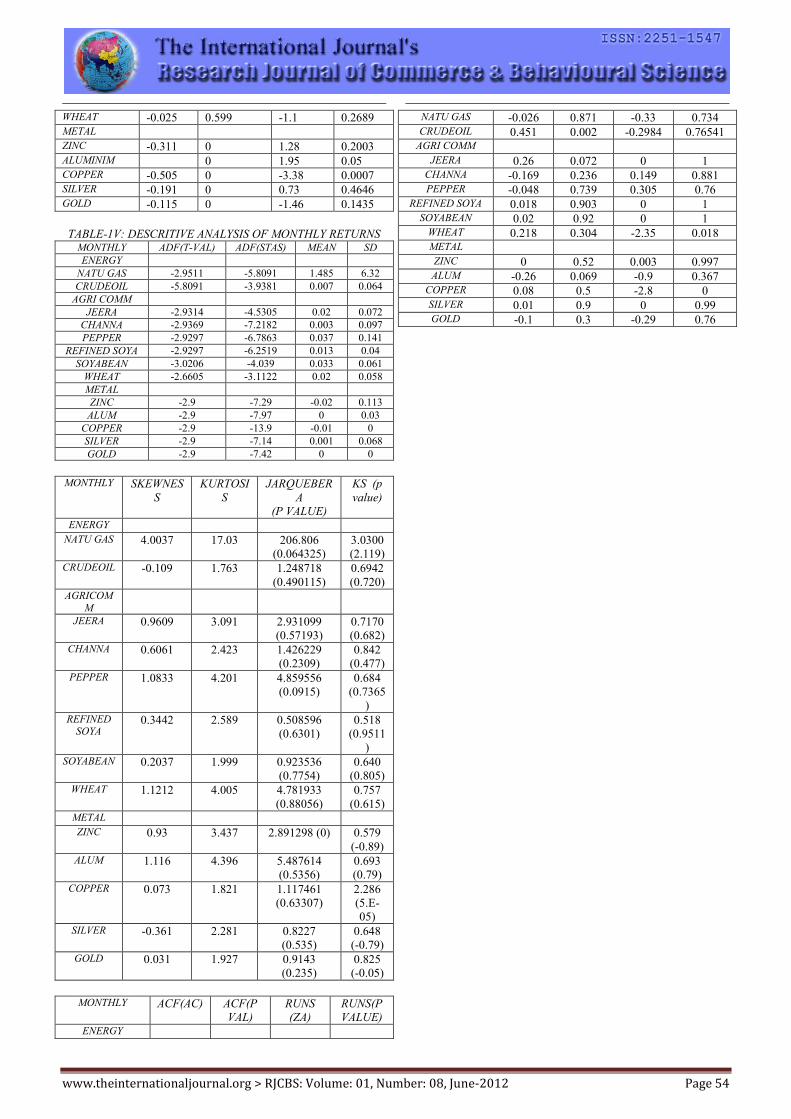
www.theinternationaljournal.org > RJCBS: Volume: 01, Number: 08, June-2012 Page 54
WHEAT -0.025 0.599 -1.1 0.2689 METAL ZINC -0.311 0 1.28 0.2003 ALUMINIM 0 1.95 0.05 COPPER -0.505 0 -3.38 0.0007 SILVER -0.191 0 0.73 0.4646 GOLD -0.115 0 -1.46 0.1435
TABLE-1V: DESCRITIVE ANALYSIS OF MONTHLY RETURNS
MONTHLY ADF(T-VAL) ADF(STAS) MEAN SD
ENERGY
NATU GAS -2.9511 -5.8091 1.485 6.32
CRUDEOIL -5.8091 -3.9381 0.007 0.064
AGRI COMM
JEERA -2.9314 -4.5305 0.02 0.072
CHANNA -2.9369 -7.2182 0.003 0.097
PEPPER -2.9297 -6.7863 0.037 0.141
REFINED SOYA -2.9297 -6.2519 0.013 0.04
SOYABEAN -3.0206 -4.039 0.033 0.061
WHEAT -2.6605 -3.1122 0.02 0.058
METAL
ZINC -2.9 -7.29 -0.02 0.113
ALUM -2.9 -7.97 0 0.03
COPPER -2.9 -13.9 -0.01 0
SILVER -2.9 -7.14 0.001 0.068
GOLD -2.9 -7.42 0 0
MONTHLY SKEWNES
S
KURTOSI
S
JARQUEBER
A
(P VALUE)
KS (p
value)
ENERGY NATU GAS 4.0037 17.03 206.806
(0.064325)
3.0300
(2.119) CRUDEOIL -0.109 1.763 1.248718
(0.490115)
0.6942
(0.720) AGRICOM
M
JEERA 0.9609 3.091 2.931099
(0.57193)
0.7170
(0.682) CHANNA 0.6061 2.423 1.426229
(0.2309)
0.842
(0.477) PEPPER 1.0833 4.201 4.859556
(0.0915)
0.684
(0.7365
) REFINED
SOYA 0.3442 2.589 0.508596
(0.6301)
0.518
(0.9511
) SOYABEAN 0.2037 1.999 0.923536
(0.7754)
0.640
(0.805) WHEAT 1.1212 4.005 4.781933
(0.88056)
0.757
(0.615) METAL ZINC 0.93 3.437 2.891298 (0) 0.579
(-0.89) ALUM 1.116 4.396 5.487614
(0.5356)
0.693
(0.79) COPPER 0.073 1.821 1.117461
(0.63307)
2.286
(5.E-
05) SILVER -0.361 2.281 0.8227
(0.535)
0.648
(-0.79) GOLD 0.031 1.927 0.9143
(0.235)
0.825
(-0.05)
MONTHLY ACF(AC) ACF(P
VAL)
RUNS
(ZA)
RUNS(P
VALUE) ENERGY
NATU GAS -0.026 0.871 -0.33 0.734 CRUDEOIL 0.451 0.002 -0.2984 0.76541
AGRI COMM JEERA 0.26 0.072 0 1
CHANNA -0.169 0.236 0.149 0.881 PEPPER -0.048 0.739 0.305 0.76
REFINED SOYA 0.018 0.903 0 1 SOYABEAN 0.02 0.92 0 1
WHEAT 0.218 0.304 -2.35 0.018 METAL ZINC 0 0.52 0.003 0.997 ALUM -0.26 0.069 -0.9 0.367
COPPER 0.08 0.5 -2.8 0 SILVER 0.01 0.9 0 0.99 GOLD -0.1 0.3 -0.29 0.76
![3D CFD ANALYSIS IN AN AFTERBURNER USING NUMECA · 3D CFD ANALYSIS IN AN AFTERBURNER USING NUMECA Anand R[1], Lokesharun D[2], Rajkumar S[3], Kirubakaran R[4] [1]Assistant Professor](https://img.pdfslide.us/doc/110x75/5e794cbc550f4e05872885e5/3d-cfd-analysis-in-an-afterburner-using-3d-cfd-analysis-in-an-afterburner-using.jpg)