Embed Size (px)
Citation preview

Table of Contents
No. Experiment/Test Title Page no.
1. FUNDAMENTAL OF TEMPERATURE MEASUREMNET 2
2. MEASUREMENT OF THE ATMOSPHERIC PRESSURE “THE
BAROMETER ". 10
3. DETERMINATION OF THE CRITICAL POINT FOR THE GAS AS WELL AS
THE RECORDING OF ISOTHERMS FOR AN ADIABATIC P-V DIAGRAM.
14
4.1 COMPRESSION AT CONSTANT VOLUME. 21
4.2 DEPRESSION AT CONSTANT VOLUME. 25
5. CALCULATION OF COEFFICIENT OF PERFORMANCE OF A SIMPLE
REFRIGERATION CYCLE
30
6. REFRIGERATION - HEAT PUMP SYSTEM 36
Course code and Name: EngM 223 – Thermodynamics (1).
Level: (4)
Lab. Name: Thermodynamics.
Supervisor Name: Dr. Mohammed Mansur
2
KINGDOM OF SAUDI ARABIA المملكة العربية السعىدية
Ministry of Higher Education وزارة التعليم العالي
JAZAN UNIVERSITY جامعة جازان
College of Engineering الهندســـــة كليـــــة
Mechanical Engineering Department الميكانيكيةقسم الهندسة
Experiment no. (1)
Title: FUNDAMENTALS OF TEMPERATURE MEASUREMENT
EXPERIMENT / TEST DESCRIPTION
Test Description: Several instruments are used in this experiment to measure the temperature. Comparison between these instruments are studied .Also thermocouple is calibrated in this experiment.
Test Objectives: The objectives of this test:
To understand several temperature measurement techniques and calibration.
Theoretical Background:
1- What is temperature?
Qualitatively, the temperature of an object is determined by the sensation of heat or cold felt by touching an object. Technically, temperature is a measure of the average kinetic energy of the particles in a sample of matter, expressed in units of degrees on a standardized scale.
The main temperature measurements instruments are:
a. Thermometer. b. Thermocouple. c. Dial Thermometer. d. Digital Thermometers
1.2 How a thermometer works?
When you look at a regular outside bulb thermometer, you'll see a thin red or silver line that grows longer when it is hotter. The line goes down in cold weather.
This liquid is sometimes colored alcohol but can also be metallic liquid called mercury. Both mercury and alcohol grow bigger when heated and smaller when cooled. Inside the glass tube of a thermometer, the liquid has no place to go but up when the temperature is hot and down when the temperature is cold.
Numbers are placed alongside the glass tube that mark the temperature when the line is at that point. The other type of common thermometer is a "spring" thermometer. A coiled piece of metal that is sensitive to heat is used. One end of the spring is attached to the pointer. As the air heats, the metal expands and the pointer moves higher. As the air cools, the metal contracts and the pointer moves lower. Typically, these type of

3
KINGDOM OF SAUDI ARABIA المملكة العربية السعىدية
Ministry of Higher Education وزارة التعليم العالي
JAZAN UNIVERSITY جامعة جازان
College of Engineering الهندســـــة كليـــــة
Mechanical Engineering Department الميكانيكيةقسم الهندسة
thermometers are less accurate than bulb or digital thermometers.
Fig.1: A thermometer.
1.3 What is a thermocouple?
A thermocouple or thermocouple thermometer is a junction between two different metals that produces a voltage related to a temperature difference. Thermocouples are a widely used type of temperature sensor for measurement and control and can also be used to convert heat into electric power. They are inexpensive and interchangeable, are supplied fitted with standard connectors, and can measure a wide range of temperatures.
A thermocouple circuit has at least two junctions: the measurement junction and a reference junction. Typically, the reference junction is created where the two wires connect to the measuring device. This second junction it is really two junctions: one for each of the two wires, but because they are assumed to be at the same temperature (isothermal) they are considered as one (thermal) junction. It is the point where the metals change - from the thermocouple metals to what ever metals are used in the measuring device - typically copper.
Several types of thermocouples are available, and different types are designated by capital letters that indicate their composition according to American National Standards Institute (ANSI) conventions. For example, a J-Type thermocouple has one iron conductor and one constantan (a copper-nickel alloy) conductor. You can see a complete list of thermocouples in Table 1.
4
KINGDOM OF SAUDI ARABIA المملكة العربية السعىدية
Ministry of Higher Education وزارة التعليم العالي
JAZAN UNIVERSITY جامعة جازان
College of Engineering الهندســـــة كليـــــة
Mechanical Engineering Department الميكانيكيةقسم الهندسة
Thermocouple
Type Conductors – Positive Conductors – Negative
B Platinum-30% rhodium Platinum-6% rhodium
E Nickel-chromium alloy Copper-nickel alloy
J Iron Copper-nickel alloy
K Nickel-chromium alloy Nickel-aluminum alloy
N Nickel-chromium-silicon alloy
Nickel-silicon-magnesium alloy
R Platinum-13% rhodium Platinum
S Platinum-10% rhodium Platinum
T Copper Copper-nickel alloy
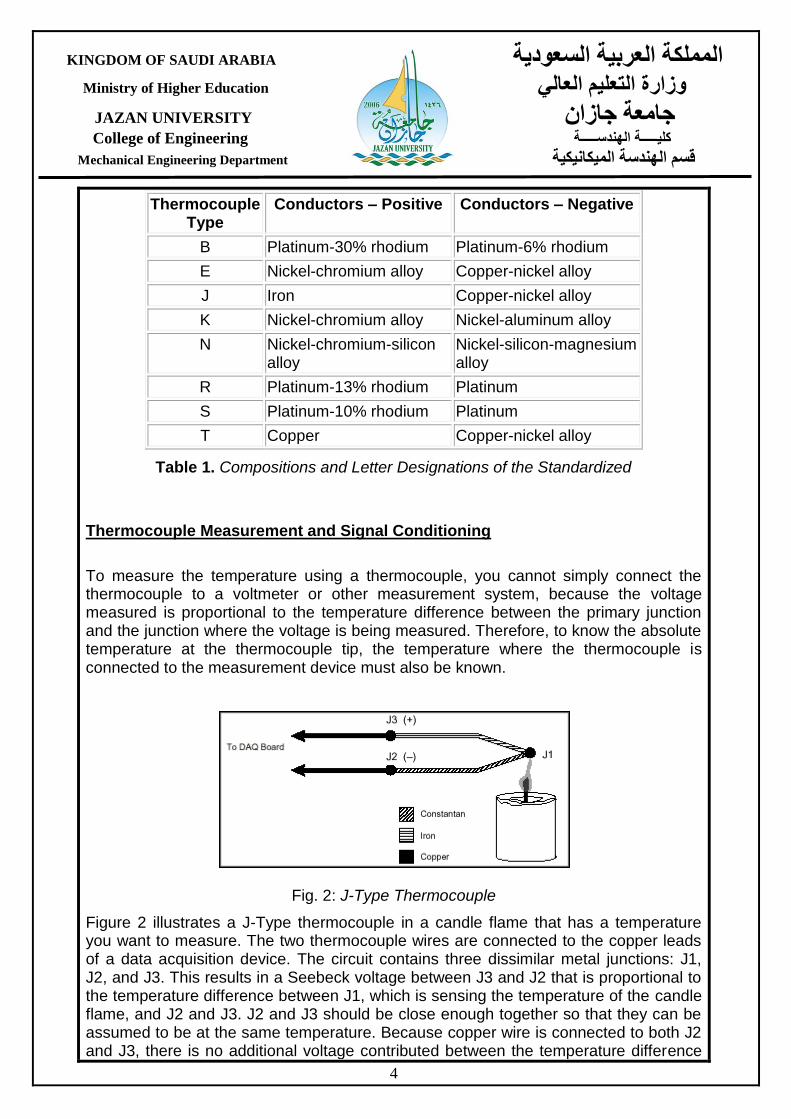
Table 1. Compositions and Letter Designations of the Standardized
Thermocouple Measurement and Signal Conditioning
To measure the temperature using a thermocouple, you cannot simply connect the thermocouple to a voltmeter or other measurement system, because the voltage measured is proportional to the temperature difference between the primary junction and the junction where the voltage is being measured. Therefore, to know the absolute temperature at the thermocouple tip, the temperature where the thermocouple is connected to the measurement device must also be known.
Fig. 2: J-Type Thermocouple
Figure 2 illustrates a J-Type thermocouple in a candle flame that has a temperature you want to measure. The two thermocouple wires are connected to the copper leads of a data acquisition device. The circuit contains three dissimilar metal junctions: J1, J2, and J3. This results in a Seebeck voltage between J3 and J2 that is proportional to the temperature difference between J1, which is sensing the temperature of the candle flame, and J2 and J3. J2 and J3 should be close enough together so that they can be assumed to be at the same temperature. Because copper wire is connected to both J2 and J3, there is no additional voltage contributed between the temperature difference

5
KINGDOM OF SAUDI ARABIA المملكة العربية السعىدية
Ministry of Higher Education وزارة التعليم العالي
JAZAN UNIVERSITY جامعة جازان
College of Engineering الهندســـــة كليـــــة
Mechanical Engineering Department الميكانيكيةقسم الهندسة
of the J2/J3 junction and the point where the voltage is measured by the data acquisition device. To determine the temperature at J1, you must know the temperatures of junctions J2 and J3. You can then use the measured voltage and the known temperature of the J2/J3 junction to infer the temperature at J1.
1.4 Dial thermometer : Dial thermometers use a metal pointer on a circular scale to indicate temperature measurements. They have two main components: the needle and a temperature sensor.
Fig.3: Dial thermometer. How do dial thermometers work? The way a dial thermometer works depends on the type of thermometer it is. Options include bimetal, liquid or gas-filled and vapor-tension, they are described below 1.5 Digital thermometer:
Digital thermometers are the most commonly used temperature measuring instruments in the food industry. They are easier to read than glass thermometers, generally more accurate than the older dial-type thermometers based on bimetal coils, have a great range of specialized uses and applications and tend to have a

6
KINGDOM OF SAUDI ARABIA المملكة العربية السعىدية
Ministry of Higher Education وزارة التعليم العالي
JAZAN UNIVERSITY جامعة جازان
College of Engineering الهندســـــة كليـــــة
Mechanical Engineering Department الميكانيكيةقسم الهندسة
much quicker response-time. Digital probe thermometers are generally of two types: thermocouple digital thermometers and thermistor digital thermometers.
Fig. 4: Digital thermometer.
1.6 Calibration of thermocouples
A thermocouple is calibrated by comparing its response with a standard thermometer at the same temperature. The standard thermometer may be another thermocouple, a platinum resistance thermometer or a liquid in glass thermometer.
The thermocouples are calibrated by one or more of three general methods, depending on:
the type of thermocouple, the temperature range, the accuracy required.
TEST ACTIVITIES
Equipment and Tools:

7
KINGDOM OF SAUDI ARABIA المملكة العربية السعىدية
Ministry of Higher Education وزارة التعليم العالي
JAZAN UNIVERSITY جامعة جازان
College of Engineering الهندســـــة كليـــــة
Mechanical Engineering Department الميكانيكيةقسم الهندسة
Using the apparatus located in the thermodynamics lab. which is equipped with a variety of temperature measuring devices including thermometers ,digital thermometer, dial gauge thermometer and thermocouples to understand the different temperature measurements instruments and thermocouples calibration.
Test Procedure: 1-The students use the different temperature measurements to compare between the accuracy of used devices.
2- Thermocouple calibration procedure:
The following information gives the detail of equipment requirements and proper techniques needed to accurately calibrate thermocouples and thermocouple materials.
Controlled temperature source:
The temperature source used in the process of calibrating should be stable enough to provide a constant temperature for a short length of time at any temperature at which the temperature bath or other source is to be used..
Reference junctions:
A thermocouple's output is based on the difference in temperature between the measuring junction (hot junction) and the reference junction (cold junction) .
Reference junction temperature:
A controlled temperature must be provided in which the reference junction is maintained at a constant chosen temperature..
Ice bath:
One of the most common reference junctions is the ice bath. The ice bath is made up of a mixture of melting shaved ice and water. The ice bath is a convenient and inexpensive way to achieve an ice point, it can be reproduced with ease and with exceptional accuracy. Junctions formed between the thermocouple materials and instrument leads can be simply immersed into the slush mixture, or alternatively glass "U" tubes containing mercury into the slush mixture. Quick electrical connection can then be made between thermocouple and instrument leads through the mercury.
Electronic compensation:
This method employs a compensation circuit containing a source of current and a combination of fixed resistors and a temperature sensitive resistor. This device can be designed to produce similar EMF to that of the thermocouple being calibrated.
Measuring instruments:
The choice of a specific instrument for measuring the thermocouple output will depend

8
KINGDOM OF SAUDI ARABIA المملكة العربية السعىدية
Ministry of Higher Education وزارة التعليم العالي
JAZAN UNIVERSITY جامعة جازان
College of Engineering الهندســـــة كليـــــة
Mechanical Engineering Department الميكانيكيةقسم الهندسة
on the accuracy required of the calibration being performed.
Reference thermometers:
Liquid- in- glass thermometers is an example of reference thermometers.
.
Thermocouple calibration wiring procedure:
When calibrating thermocouples, it is faster and more convenient to use a thermocouple switching box. The extension wires from the thermocouples are placed into one side of the reference junction. Multiple pairs of copper lead wire will exit the reference junction and will be connected to the switch box. One pair of copper lead wires will run from the readout instrument to the thermocouple switch box.
Junction location:
One of the primary advantages of calibrating thermocouple materials against a base-metal standard of similar EMF output is that the sample to be calibrated are welded to the base-metal standard forming a common junction thus achieving good isothermal conditions between the test thermo element and the standard. Furthermore, because the test thermo element and the standard produce nominally the same EMF vs. platinum the EMF output changes little over a fairly broad temperature range, thereby reducing the need for precise temperature source control.
Measurement:
Set your controlled temperature source to the specified temperature and allow it to adequately stabilize. Immerse the test assembly into the test temperature medium and provide sufficient time for the test assembly to stabilize. Once the test assembly is stable the EMF generated between the test specimen and the reference standard can be recorded. Avoid soaking the test assembly at temperature for a prolonged period of time, as it can cause permanent changes to occur in the thermo elements.
Once the reading is taken, raise the test temperature to the next higher temperature, first removing the test assembly from the temperature source, or advance the test assembly to the next temperature source. Allow the temperature source and the test assembly to stabilize as before, and take a second set of readings at the new temperature. In all cases take the reading in sequence from the lowest to the highest temperature. A base metal reference standard shall be used for one series of temperature changes only.
Thermocouple calibration:
The Test thermocouple junction should be located so that it is in intimate contact with the junction of the standard. Without making a radiograph of the thermocouple it is impossible to know exactly where the junction is located. A few generalizations can be made which enables junctions to be located quite closely. First, the cap weld on a metal sheathed thermocouple is normally about as thick as one-half the sheathed diameter. Second, a "U" junction is normally about one-half the sheathed diameter. The thermocouple standard should be tied to the thermocouple with a fine gauge wire.
9
KINGDOM OF SAUDI ARABIA المملكة العربية السعىدية
Ministry of Higher Education وزارة التعليم العالي
JAZAN UNIVERSITY جامعة جازان
College of Engineering الهندســـــة كليـــــة
Mechanical Engineering Department الميكانيكيةقسم الهندسة
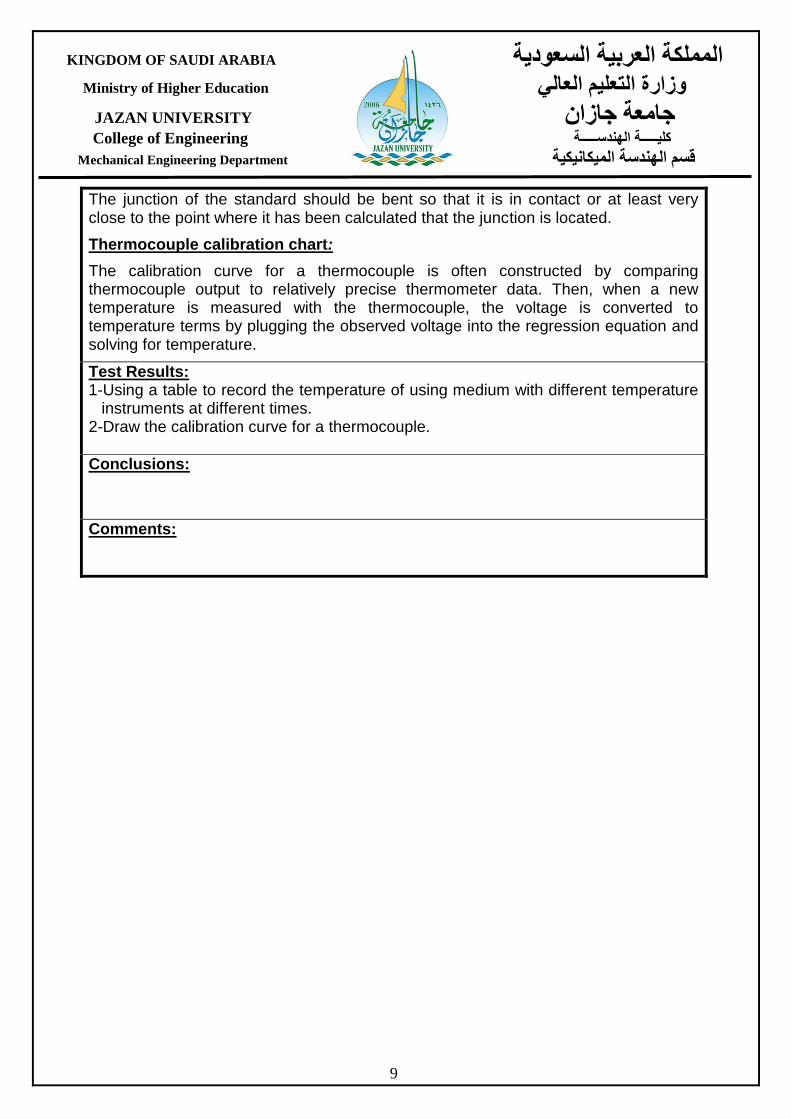
The junction of the standard should be bent so that it is in contact or at least very close to the point where it has been calculated that the junction is located.
Thermocouple calibration chart:
The calibration curve for a thermocouple is often constructed by comparing thermocouple output to relatively precise thermometer data. Then, when a new temperature is measured with the thermocouple, the voltage is converted to temperature terms by plugging the observed voltage into the regression equation and solving for temperature.
Test Results: 1-Using a table to record the temperature of using medium with different temperature
instruments at different times. 2-Draw the calibration curve for a thermocouple.
Conclusions:
Comments:
10
KINGDOM OF SAUDI ARABIA المملكة العربية السعىدية
Ministry of Higher Education وزارة التعليم العالي
JAZAN UNIVERSITY جامعة جازان
College of Engineering الهندســـــة كليـــــة
Mechanical Engineering Department الميكانيكيةقسم الهندسة
Experiment/Test no. (2)
Title: MEASUREMENT OF THE ATMOSPHERIC PRESSURE
“THE BAROMETER”
TEST DESCRIPTION
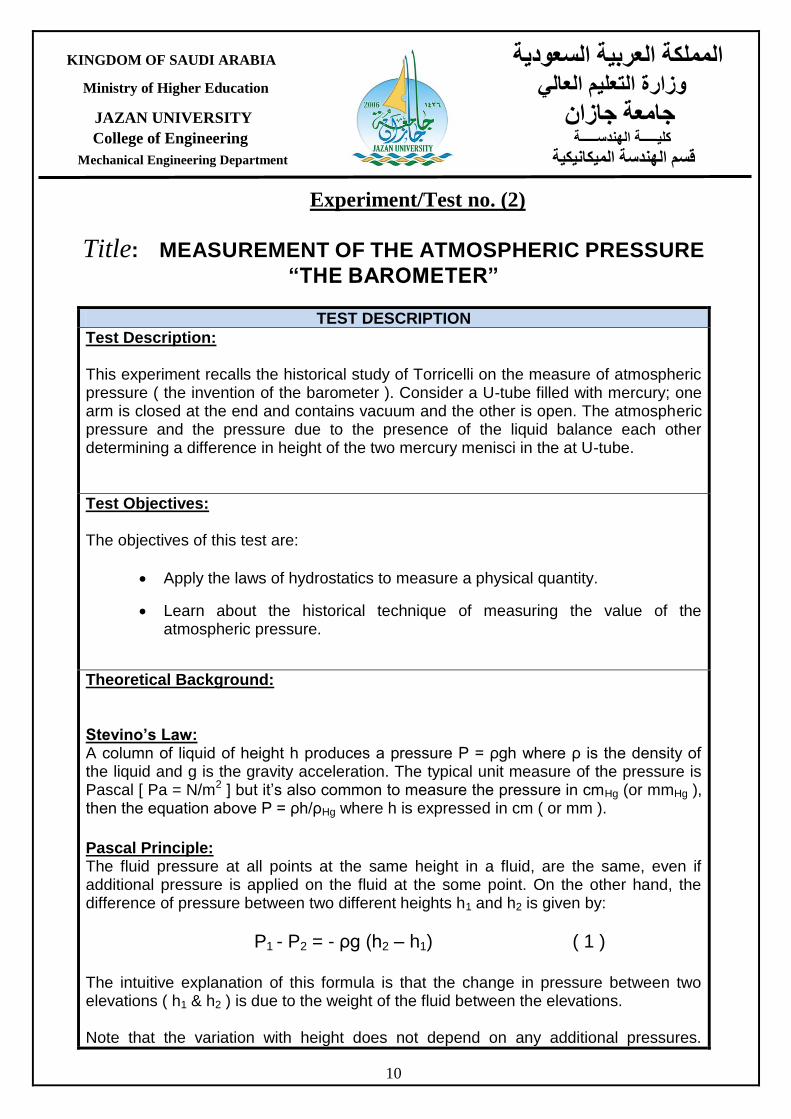
Test Description: This experiment recalls the historical study of Torricelli on the measure of atmospheric pressure ( the invention of the barometer ). Consider a U-tube filled with mercury; one arm is closed at the end and contains vacuum and the other is open. The atmospheric pressure and the pressure due to the presence of the liquid balance each other determining a difference in height of the two mercury menisci in the at U-tube.
Test Objectives: The objectives of this test are:
Apply the laws of hydrostatics to measure a physical quantity.
Learn about the historical technique of measuring the value of the atmospheric pressure.
Theoretical Background: Stevino’s Law: A column of liquid of height h produces a pressure P = ρgh where ρ is the density of the liquid and g is the gravity acceleration. The typical unit measure of the pressure is Pascal [ Pa = N/m2 ] but it’s also common to measure the pressure in cmHg (or mmHg ), then the equation above P = ρh/ρHg where h is expressed in cm ( or mm ). Pascal Principle: The fluid pressure at all points at the same height in a fluid, are the same, even if additional pressure is applied on the fluid at the some point. On the other hand, the difference of pressure between two different heights h1 and h2 is given by:
P1 - P2 = - ρg (h2 – h1) ( 1 )
The intuitive explanation of this formula is that the change in pressure between two elevations ( h1 & h2 ) is due to the weight of the fluid between the elevations. Note that the variation with height does not depend on any additional pressures.

11
KINGDOM OF SAUDI ARABIA المملكة العربية السعىدية
Ministry of Higher Education وزارة التعليم العالي
JAZAN UNIVERSITY جامعة جازان
College of Engineering الهندســـــة كليـــــة
Mechanical Engineering Department الميكانيكيةقسم الهندسة
Therefore Pascal’s law can be interpreted as saying that any change in pressure applied at any given point of the fluid is transmitted undiminished throughout the fluid.
Torricelli’s Experiment: Let us consider the schema below ( Fig. 1 ) . On the right arm on the tube, at height h2 , acts no pressure since above this above this point there is vacuum; at height h1 the pressure is due to the column of mercury above (h2 – h1):
P = ρg (h2 – h1)
Fig. 1 : Schema of the Torricelli’s experiment with Boyle’s Law Apparatus
On the left arm at height h1 the pressure is the atmospheric one ( Patm ). From Pascal principle, one can write:
Patm = ρg (h2 – h1)
Where ρ is the density of mercury ( ρatm = 13.595 g/cm3 ).
TEST ACTIVITIES
Equipment and Tools:
Mount the apparatus ( Boyle’s Law Apparatus ) and pour inside the plastic tube a sufficient amount of mercury to fill the tube completely and expansion chamber over the stopcock, as shown in Fig. 2.

12
KINGDOM OF SAUDI ARABIA المملكة العربية السعىدية
Ministry of Higher Education وزارة التعليم العالي
JAZAN UNIVERSITY جامعة جازان
College of Engineering الهندســـــة كليـــــة
Mechanical Engineering Department الميكانيكيةقسم الهندسة
Fig. 2: Boyle’s Law Apparatus.
Completely remove the actual air trapped inside the tube.
Close the stopcock, as shown in Fig. 3.
Fig. 3: Close the stopcock

13
KINGDOM OF SAUDI ARABIA المملكة العربية السعىدية
Ministry of Higher Education وزارة التعليم العالي
JAZAN UNIVERSITY جامعة جازان
College of Engineering الهندســـــة كليـــــة
Mechanical Engineering Department الميكانيكيةقسم الهندسة
Test Procedure:
1. To measure the atmospheric pressure, it is necessary to obtain a vacuum above one of the two menisci. That can easily be done in move the two containers along the guides until the mercury is a little above the stopcock. Close the stopcock. Lower the expansion container. The vacuum is now contained in the part between the mercury meniscus and the stopcock in the graduated container).
2. Read on the scale the levels h1 and h2 of the two mercury menisci. The difference of level Δh between the two menisci represents the atmospheric pressure expressed in cmHg.
Test Results:
h1
[cm] h2
[cm] h2 – h1
[cm] P = ρg (h2 – h1)
[Pa]
Conclusions:
Please write your observations.
Comments:

14
KINGDOM OF SAUDI ARABIA المملكة العربية السعىدية
Ministry of Higher Education وزارة التعليم العالي
JAZAN UNIVERSITY جامعة جازان
College of Engineering الهندســـــة كليـــــة
Mechanical Engineering Department الميكانيكيةقسم الهندسة
Experiment/Test no. (3)
Title: DETERMINATION OF THE CRITICAL POINT FOR THE GAS AS WELL
AS THE RECORDING OF ISOTHERMS FOR AN ADIABATIC P-V DIAGRAM.
TEST DESCRIPTION
Test Description: The critical point apparatus allows us to investigate the compressibility and liquefaction of a gas. Measurements allow determination of the critical point for the gas as well as the recording of isotherms for an adiabatic p-V diagram. The gas used for testing is sulphur hexafluoride (SF6). SF6 has a critical temperature of 318.6°K (45.5°C) and a critical pressure of 3.76 MPa (37.6 bar) which makes for a simple experiment set-up.
Test Objectives: The objectives of this test are:
1. Investigate the compressibility and liquefaction of a gas. 2. Determination of the critical point for the gas. 3. Recording of isotherms for an adiabatic p-V diagram.
Theoretical Background: The P-v Diagram
The general shape of the P-v diagram of a pure substance is very much like the T-v diagram, but the T = constant lines on this diagram have a downward trend, as shown in Fig. 1.
Fig. 1: P-v diagram of a pure substance.
15
KINGDOM OF SAUDI ARABIA المملكة العربية السعىدية
Ministry of Higher Education وزارة التعليم العالي
JAZAN UNIVERSITY جامعة جازان
College of Engineering الهندســـــة كليـــــة
Mechanical Engineering Department الميكانيكيةقسم الهندسة
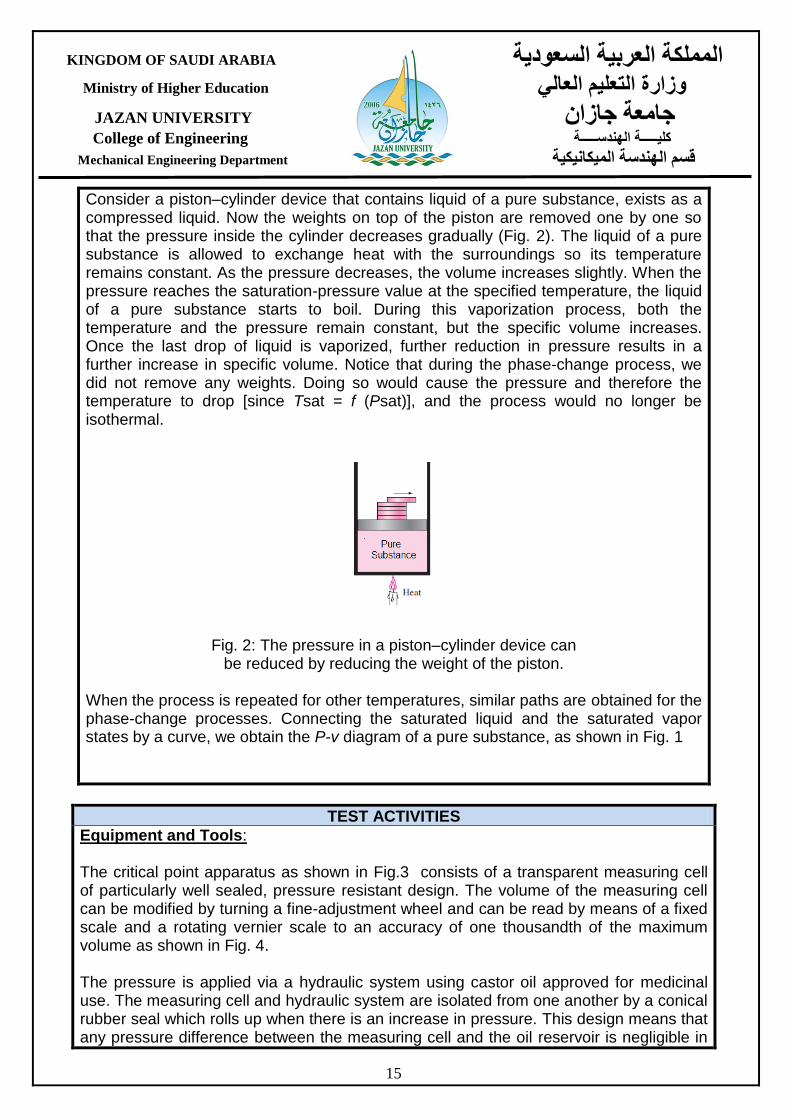
Consider a piston–cylinder device that contains liquid of a pure substance, exists as a compressed liquid. Now the weights on top of the piston are removed one by one so that the pressure inside the cylinder decreases gradually (Fig. 2). The liquid of a pure substance is allowed to exchange heat with the surroundings so its temperature remains constant. As the pressure decreases, the volume increases slightly. When the pressure reaches the saturation-pressure value at the specified temperature, the liquid of a pure substance starts to boil. During this vaporization process, both the temperature and the pressure remain constant, but the specific volume increases. Once the last drop of liquid is vaporized, further reduction in pressure results in a further increase in specific volume. Notice that during the phase-change process, we did not remove any weights. Doing so would cause the pressure and therefore the temperature to drop [since Tsat = f (Psat)], and the process would no longer be isothermal.
Fig. 2: The pressure in a piston–cylinder device can be reduced by reducing the weight of the piston.
When the process is repeated for other temperatures, similar paths are obtained for the phase-change processes. Connecting the saturated liquid and the saturated vapor states by a curve, we obtain the P-v diagram of a pure substance, as shown in Fig. 1
TEST ACTIVITIES
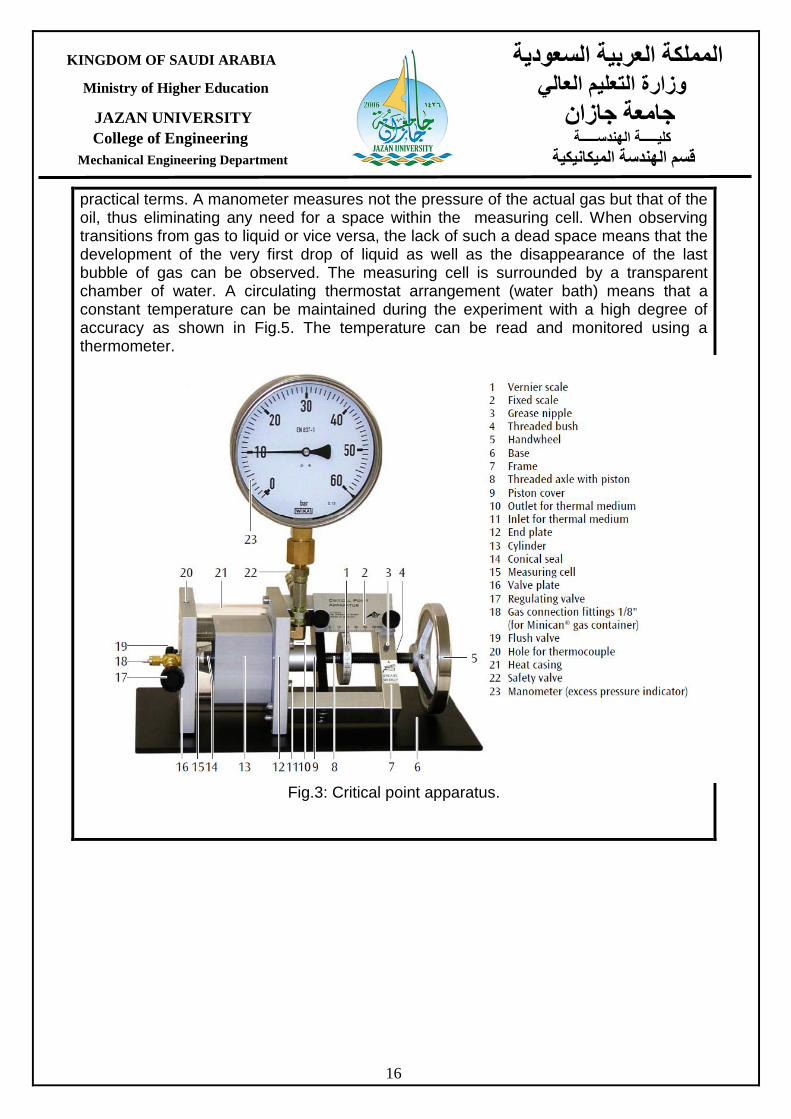
Equipment and Tools: The critical point apparatus as shown in Fig.3 consists of a transparent measuring cell of particularly well sealed, pressure resistant design. The volume of the measuring cell can be modified by turning a fine-adjustment wheel and can be read by means of a fixed scale and a rotating vernier scale to an accuracy of one thousandth of the maximum volume as shown in Fig. 4. The pressure is applied via a hydraulic system using castor oil approved for medicinal use. The measuring cell and hydraulic system are isolated from one another by a conical rubber seal which rolls up when there is an increase in pressure. This design means that any pressure difference between the measuring cell and the oil reservoir is negligible in
16
KINGDOM OF SAUDI ARABIA المملكة العربية السعىدية
Ministry of Higher Education وزارة التعليم العالي
JAZAN UNIVERSITY جامعة جازان
College of Engineering الهندســـــة كليـــــة
Mechanical Engineering Department الميكانيكيةقسم الهندسة
practical terms. A manometer measures not the pressure of the actual gas but that of the oil, thus eliminating any need for a space within the measuring cell. When observing transitions from gas to liquid or vice versa, the lack of such a dead space means that the development of the very first drop of liquid as well as the disappearance of the last bubble of gas can be observed. The measuring cell is surrounded by a transparent chamber of water. A circulating thermostat arrangement (water bath) means that a constant temperature can be maintained during the experiment with a high degree of accuracy as shown in Fig.5. The temperature can be read and monitored using a thermometer.
Fig.3: Critical point apparatus.
17
KINGDOM OF SAUDI ARABIA المملكة العربية السعىدية
Ministry of Higher Education وزارة التعليم العالي
JAZAN UNIVERSITY جامعة جازان
College of Engineering الهندســـــة كليـــــة
Mechanical Engineering Department الميكانيكيةقسم الهندسة
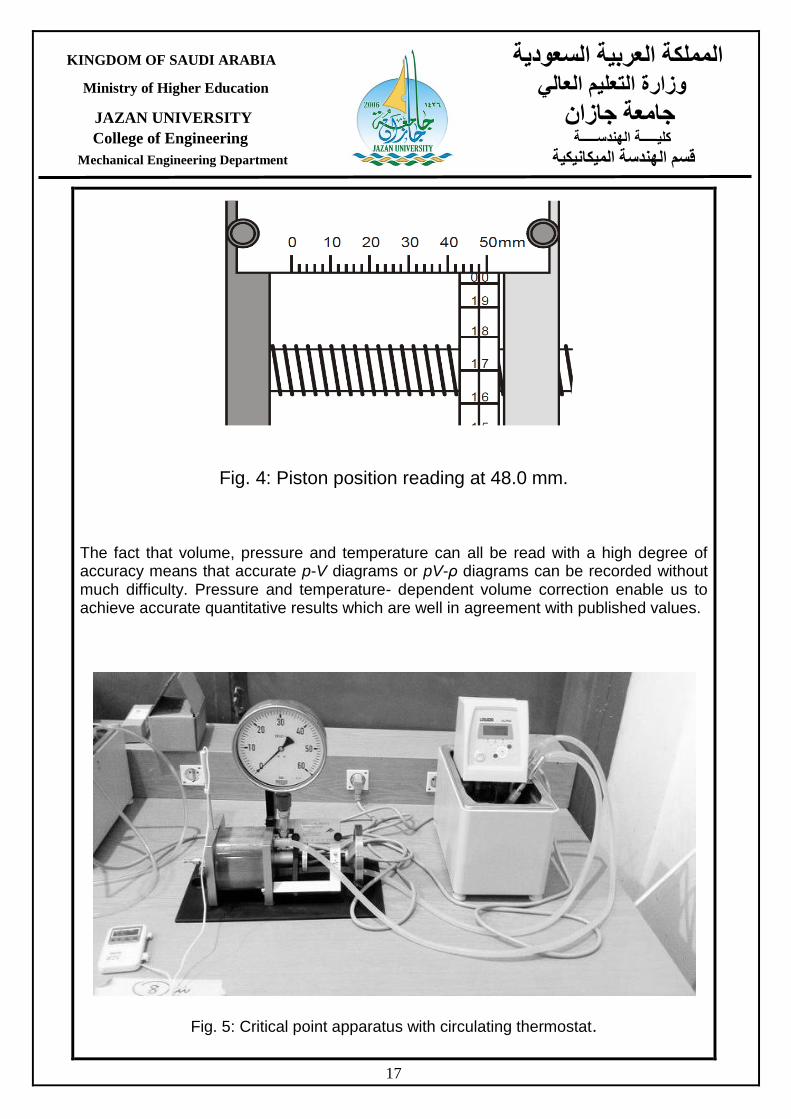
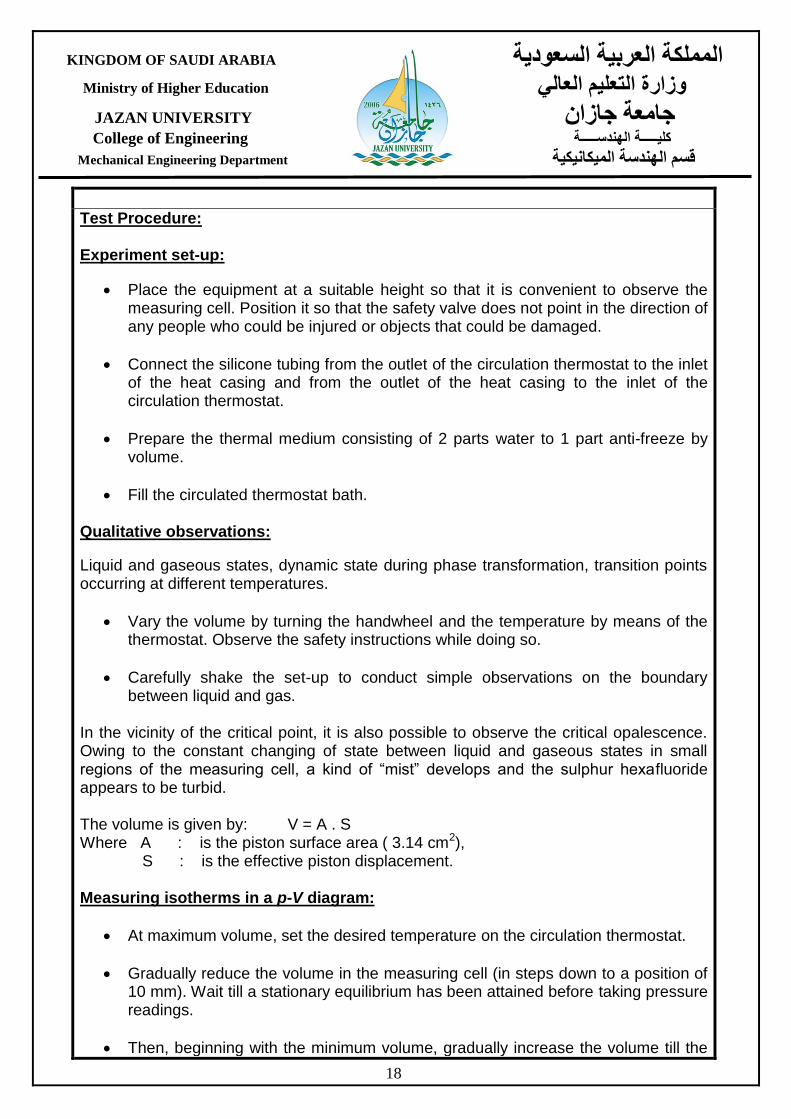
Fig. 4: Piston position reading at 48.0 mm. The fact that volume, pressure and temperature can all be read with a high degree of accuracy means that accurate p-V diagrams or pV-ρ diagrams can be recorded without much difficulty. Pressure and temperature- dependent volume correction enable us to achieve accurate quantitative results which are well in agreement with published values.
Fig. 5: Critical point apparatus with circulating thermostat.
18
KINGDOM OF SAUDI ARABIA المملكة العربية السعىدية
Ministry of Higher Education وزارة التعليم العالي
JAZAN UNIVERSITY جامعة جازان
College of Engineering الهندســـــة كليـــــة
Mechanical Engineering Department الميكانيكيةقسم الهندسة
Test Procedure: Experiment set-up:
Place the equipment at a suitable height so that it is convenient to observe the measuring cell. Position it so that the safety valve does not point in the direction of any people who could be injured or objects that could be damaged.
Connect the silicone tubing from the outlet of the circulation thermostat to the inlet of the heat casing and from the outlet of the heat casing to the inlet of the circulation thermostat.
Prepare the thermal medium consisting of 2 parts water to 1 part anti-freeze by volume.
Fill the circulated thermostat bath.
Qualitative observations:
Liquid and gaseous states, dynamic state during phase transformation, transition points occurring at different temperatures.
Vary the volume by turning the handwheel and the temperature by means of the thermostat. Observe the safety instructions while doing so.
Carefully shake the set-up to conduct simple observations on the boundary between liquid and gas.
In the vicinity of the critical point, it is also possible to observe the critical opalescence. Owing to the constant changing of state between liquid and gaseous states in small regions of the measuring cell, a kind of “mist” develops and the sulphur hexafluoride appears to be turbid. The volume is given by: V = A . S Where A : is the piston surface area ( 3.14 cm2), S : is the effective piston displacement. Measuring isotherms in a p-V diagram:
At maximum volume, set the desired temperature on the circulation thermostat.
Gradually reduce the volume in the measuring cell (in steps down to a position of 10 mm). Wait till a stationary equilibrium has been attained before taking pressure readings.
Then, beginning with the minimum volume, gradually increase the volume till the

19
KINGDOM OF SAUDI ARABIA المملكة العربية السعىدية
Ministry of Higher Education وزارة التعليم العالي
JAZAN UNIVERSITY جامعة جازان
College of Engineering الهندســـــة كليـــــة
Mechanical Engineering Department الميكانيكيةقسم الهندسة
piston position is once again at 10 mm. Wait till a stationary equilibrium has been attained before taking pressure readings.
Convert the excess pressure readings into absolute pressure and the piston positions into volume.
In the low-volume region, stationary equilibrium is attained more quickly during transition from higher to lower pressure – i.e. from a lower volume to a greater volume – since the phase boundary layer for the phase transition from liquid to gas is created by vapour bubbles present throughout the liquid. Stationary equilibrium then takes around 1 to 5 minutes to attain, whereby the measurements on the fringe of the region where both phases exist take longest. The recommended threshold value of 10 mm refers to a filling pressure of 10 bar. Above this value, there will certainly be no occurrence of a liquid phase in the permissible temperature range. The threshold value shifts to the “right” if the filling pressure is higher. Measuring isochores in a p-T diagram:
Set the desired initial temperature. Subsequently set the desired volume.
Gradually allow the temperature to decrease.
Wait till a stationary equilibrium has been attained then take the pressure reading. Measurements where both phases are present can be plotted to generate a vapour pressure curve. Attainment of equilibrium takes up to 20 minutes after each change of temperature due to the fact that the water bath and the measuring cell must attain the desired temperature first. Determining the mass of gas:
Blow the gas out of the measuring cell into a gas-tight plastic bag and then weigh it:
If necessary, remove the gas supply pipe and attach gas connection fittings.
Wind out the handwheel, say to 46 mm.
Open the regulating valve a little and release the gas through the gas connection fittings into the plastic bag.
Shut the regulating valve.

20
KINGDOM OF SAUDI ARABIA المملكة العربية السعىدية
Ministry of Higher Education وزارة التعليم العالي
JAZAN UNIVERSITY جامعة جازان
College of Engineering الهندســـــة كليـــــة
Mechanical Engineering Department الميكانيكيةقسم الهندسة
Determine the mass of the released gas. In doing this, take into consideration the empty weight of the bag and the buoyancy of air.
Reduce the volume of the measuring cell till the pressure in the measuring cell has reached its original value.
Calculate the original mass of gas from the volume difference before and after emptying the measuring cell and the volume which is still present in the measuring cell.
Test Results: Present all results in the following table then draw P-v chart.
No. V (mL/g)
P (MPa)
T ( oC)
1
2
3
4
5
6
Conclusions:
Comments:

21
KINGDOM OF SAUDI ARABIA المملكة العربية السعىدية
Ministry of Higher Education وزارة التعليم العالي
JAZAN UNIVERSITY جامعة جازان
College of Engineering الهندســـــة كليـــــة
Mechanical Engineering Department الميكانيكيةقسم الهندسة
Experiment/Test no. (4-1)
Title: COMPRESSION AT CONSTANT VOLUME
TEST DESCRIPTION
Test Description: This experiment is a demonstration of compression processes of a perfect gas. It uses the air to carry out the experiments and so to demonstrate the basic principles of Thermodynamics. In the industry, the expansion and compression processes of different gases are treated in a continuous way. The TEPGC unit allows the student to deepen in its knowledge to later understand other more complex units.
Test Objectives: The objective of this test is to familiarize the student with a compression process of a gas.
TEST ACTIVITIES
Equipment and Tools: The TEPGC unit for demonstration of the expansion process of perfect gases as shown in Fig. 1 is a bench-top equipment which is mounted on a structure of anodized aluminum profiles on which steel panels finished with epoxy paint are screwed. The equipment base supports two tanks made in methacrylate, what makes easier the experiments visualization and, at the same time, they thermally isolate their content from the external atmosphere. Between the two tanks there is an air pump which has a set of pipes and valves which will be activated to select the different experiments. One of the tasks of the pump will be to pressurize the pressure tank with air and to evacuate the air from the vacuum tank. As shown in Fig. 2, the pressure tank ( 18.7 L) has a pressure sensor, a thermocouple and an adjusted relief valve of over-pressure mounted on its upper cover. It has a connection to the pump which allows it to pressurize the tank. The vacuum tank has a lower capacity ( 10.5 L) than the other one. On the upper cover,

22
KINGDOM OF SAUDI ARABIA المملكة العربية السعىدية
Ministry of Higher Education وزارة التعليم العالي
JAZAN UNIVERSITY جامعة جازان
College of Engineering الهندســـــة كليـــــة
Mechanical Engineering Department الميكانيكيةقسم الهندسة
There is a pressure sensor and its thermocouple. It is directly connected to the pump which allows to evacuate its internal air. If we connect both tanks, there are two different section pipes: one pipe of large bore, which separates them by a quick valve, and pipe of small bore, which separates both tanks by a fine valve. As shown in Fig. 1 a Computer Controlled Unit is supplied with the EDIBON Computer Control System (SCADA), including: Control Interface Box + Data Acquisition Board + Computer Control and Data Acquisition Software, for controlling the process and the parameters involved Instrumentation
The TEPGC unit consists of the following measurement instruments:
Two type J temperature sensors, one installed in each tank. They are useful to
analyze the experiments developments.
One type J sensor for room temperature.
Two pressure sensor, one in each tank, which measure relative pressures.
Fig. 1: TEPGC. Expansion Processes of a Perfect Gas Unit.

23
KINGDOM OF SAUDI ARABIA المملكة العربية السعىدية
Ministry of Higher Education وزارة التعليم العالي
JAZAN UNIVERSITY جامعة جازان
College of Engineering الهندســـــة كليـــــة
Mechanical Engineering Department الميكانيكيةقسم الهندسة
Fig. 2: Process diagram and elements allocation.

24
KINGDOM OF SAUDI ARABIA المملكة العربية السعىدية
Ministry of Higher Education وزارة التعليم العالي
JAZAN UNIVERSITY جامعة جازان
College of Engineering الهندســـــة كليـــــة
Mechanical Engineering Department الميكانيكيةقسم الهندسة
Test Procedure: To carry out the experiment, follow these instructions:
1. Connect the Interface and execute the SCADA – TEGPC program, supplied with
the equipment. Place the valves in order to the air pump is supplied with external
air and pressurized the larger pressure tank.
2. Once the unit is ready, press “ SAVE DATA “ and write a sampling time of 1
second in the software. Write down the data.
3. Activate AB – 1 by means of the
software. Observe that SP1 increases its value until reaching a preselected
value. At this point we have:
4. Stop the data acquisition process
by pressing “ SAVE DATA “. If you need some previous datum, it can be extracted
from here.
Initial temperature (ST1)
Initial pressure (SP1)
Initial volume (V1)
Final temperature (ST1)
Final pressure (SP1)
Final volume (V1)
Test Results: Present the results in the following tables:
1- Initial values:
2- Final values:
Initial temperature (ST1)
Initial pressure (SP1)
Initial volume (V1)
Final temperature (ST1)
Final pressure (SP1)
Final volume (V1)
Conclusions:
Comments:

25
KINGDOM OF SAUDI ARABIA المملكة العربية السعىدية
Ministry of Higher Education وزارة التعليم العالي
JAZAN UNIVERSITY جامعة جازان
College of Engineering الهندســـــة كليـــــة
Mechanical Engineering Department الميكانيكيةقسم الهندسة
Experiment/Test no. (4-2)
Title: DEPRESSION AT CONSTANT VOLUME
TEST DESCRIPTION
Test Description: This experiment is a demonstration of depression processes of a perfect gas. It uses the air to carry out the experiments and so to demonstrate the basic principles of Thermodynamics. In the industry, the expansion and compression processes of different gases are treated in a continuous way. The TEPGC unit allows the student to deepen in its knowledge to later understand other more complex units.
Test Objectives: The objective of this test is to familiarize the student with a depression process of a gas.
Theoretical Background: THE IDEAL-GAS EQUATION OF STATE Any equation that relates the pressure, temperature, and specific volume of a substance is called an equation of state. Property relations that involve other properties of a substance at equilibrium states are also referred to as equations of state. There are several equations of state, some simple and others very complex. The simplest and best-known equation of state for substances in the gas phase is the ideal-gas equation of state. This equation predicts the P-v-T behavior of a gas quite accurately within some properly selected region. Gas and vapor are often used as synonymous words. The vapor phase of a substance is customarily called a gas when it is above the critical temperature. Vapor usually implies a gas that is not far from a state of condensation. In 1662, Robert Boyle, an Englishman, observed during his experiments with a vacuum chamber that the pressure of gases is inversely proportional to their volume. In 1802, J. Charles and J. Gay-Lussac, Frenchmen, experimentally determined that at low pressures the volume of a gas is proportional to its temperature. That is,
𝑃 = 𝑅 𝑇
𝑣
Or
𝑃𝑣 = 𝑅𝑇

26
KINGDOM OF SAUDI ARABIA المملكة العربية السعىدية
Ministry of Higher Education وزارة التعليم العالي
JAZAN UNIVERSITY جامعة جازان
College of Engineering الهندســـــة كليـــــة
Mechanical Engineering Department الميكانيكيةقسم الهندسة
where the constant of proportionality R is called the gas constant. Equation (1) is called the ideal-gas equation of state, or simply the ideal-gas relation, and a gas that obeys this relation is called an ideal gas. In this equation, P is the absolute pressure, T is the absolute temperature, and v is the specific volume. The gas constant R is different for each gas and is determined from:
𝑅 =𝑅𝑢
𝑀
where Ru is the universal gas constant and M is the molar mass (also called molecular weight) of the gas. The constant Ru is the same for all substances, and its value is
The molar mass M can simply be defined as the mass of one mole (also called a gram-mole, abbreviated gmol) of a substance in grams, or the mass of one kmol (also called a kilogram-mole, abbreviated kgmol) in kilograms. In English units, it is the mass of 1 lbmol in lbm. Notice that the molar mass of a substance has the same numerical value in both unit systems because of the way it is defined. When we say the molar mass of air is 28.97, it simply means the mass of 1 kmol of air is 28.97 kg, or the mass of 1 lbmol of air is 28.97 lbm. That is, M = 28.97 kg/kmol = 28.97 lbm/lbmol. The mass of a system is equal to the product of its molar mass M and the mole number N:
𝑚 = 𝑀𝑁
The ideal-gas equation of state can be written in several different forms:
Where 𝑉 is the molar specific volume, that is, the volume per unit mole (in m3/kmol or ft3/lbmol). A bar above a property denotes values on a unit-mole basis.
27
KINGDOM OF SAUDI ARABIA المملكة العربية السعىدية
Ministry of Higher Education وزارة التعليم العالي
JAZAN UNIVERSITY جامعة جازان
College of Engineering الهندســـــة كليـــــة
Mechanical Engineering Department الميكانيكيةقسم الهندسة
TEST ACTIVITIES
Equipment and Tools: The TEPGC unit for demonstration of the expansion process of perfect gases as shown in Fig. 1 is a bench-top equipment which is mounted on a structure of anodized aluminum profiles on which steel panels finished with epoxy paint are screwed. The equipment base supports two tanks made in methacrylate, what makes easier the experiments visualization and, at the same time, they thermally isolate their content from the external atmosphere. Between the two tanks there is an air pump which has a set of pipes and valves which will be activated to select the different experiments. One of the tasks of the pump will be to pressurize the pressure tank with air and to evacuate the air from the vacuum tank. As shown in Fig. 2, the pressure tank ( 18.7 L) has a pressure sensor, a thermocouple and an adjusted relief valve of over-pressure mounted on its upper cover. It has a connection to the pump which allows it to pressurize the tank. The vacuum tank has a lower capacity ( 10.5 L) than the other one. On the upper cover, There is a pressure sensor and its thermocouple. It is directly connected to the pump which allows to evacuate its internal air. If we connect both tanks, there are two different section pipes: one pipe of large bore, which separates them by a quick valve, and pipe of small bore, which separates both tanks by a fine valve. As shown in Fig. 1 a Computer Controlled Unit is supplied with the EDIBON Computer Control System (SCADA), including: Control Interface Box + Data Acquisition Board + Computer Control and Data Acquisition Software, for controlling the process and the parameters involved Instrumentation The TEPGC unit consists of the following measurement instruments:
Two type J temperature sensors, one installed in each tank. They are useful to
analyze the experiments developments.
One type J sensor for room temperature.
Two pressure sensor, one in each tank, which measure relative pressures.

28
KINGDOM OF SAUDI ARABIA المملكة العربية السعىدية
Ministry of Higher Education وزارة التعليم العالي
JAZAN UNIVERSITY جامعة جازان
College of Engineering الهندســـــة كليـــــة
Mechanical Engineering Department الميكانيكيةقسم الهندسة
Fig. 1: TEPGC. Expansion Processes of a Perfect Gas Unit.
Fig. 2: Process diagram and elements allocation.
29
KINGDOM OF SAUDI ARABIA المملكة العربية السعىدية
Ministry of Higher Education وزارة التعليم العالي
JAZAN UNIVERSITY جامعة جازان
College of Engineering الهندســـــة كليـــــة
Mechanical Engineering Department الميكانيكيةقسم الهندسة
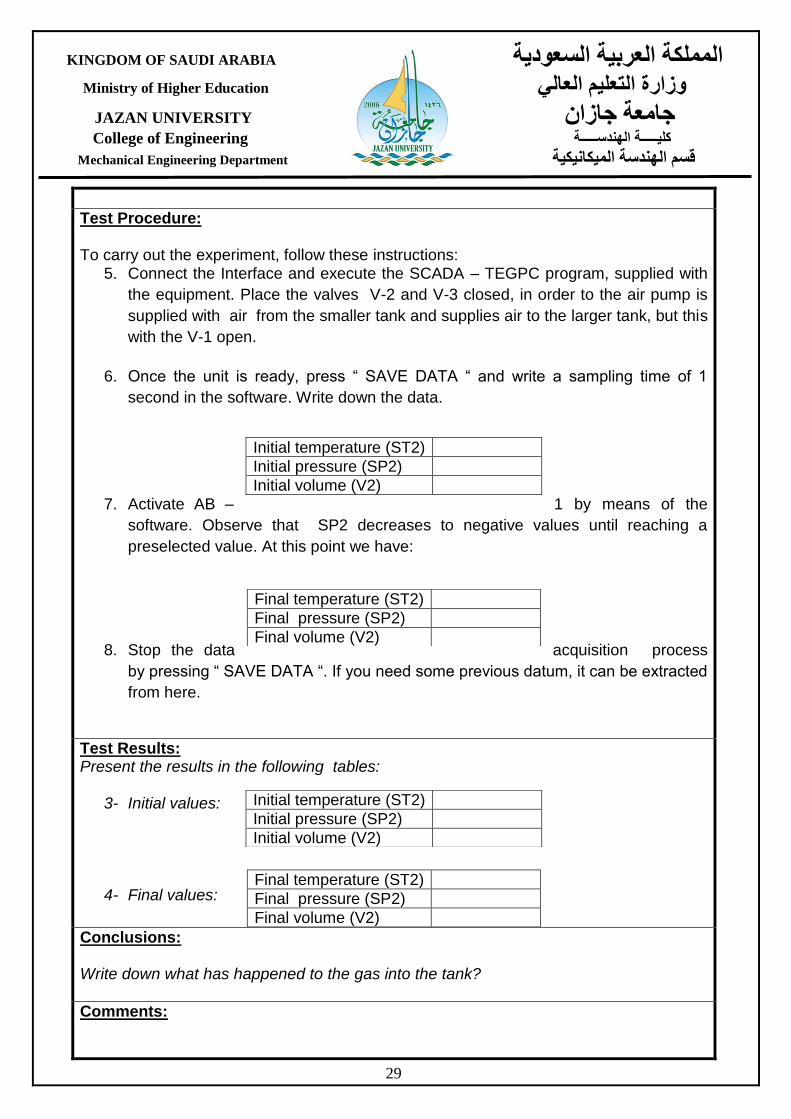
Test Procedure: To carry out the experiment, follow these instructions:
5. Connect the Interface and execute the SCADA – TEGPC program, supplied with
the equipment. Place the valves V-2 and V-3 closed, in order to the air pump is
supplied with air from the smaller tank and supplies air to the larger tank, but this
with the V-1 open.
6. Once the unit is ready, press “ SAVE DATA “ and write a sampling time of 1
second in the software. Write down the data.
7. Activate AB – 1 by means of the
software. Observe that SP2 decreases to negative values until reaching a
preselected value. At this point we have:
8. Stop the data acquisition process
by pressing “ SAVE DATA “. If you need some previous datum, it can be extracted
from here.
Initial temperature (ST2)
Initial pressure (SP2)
Initial volume (V2)
Final temperature (ST2)
Final pressure (SP2)
Final volume (V2)
Test Results: Present the results in the following tables:
3- Initial values:
4- Final values:
Initial temperature (ST2)
Initial pressure (SP2)
Initial volume (V2)
Final temperature (ST2)
Final pressure (SP2)
Final volume (V2)
Conclusions: Write down what has happened to the gas into the tank?
Comments:
30
KINGDOM OF SAUDI ARABIA المملكة العربية السعىدية
Ministry of Higher Education وزارة التعليم العالي
JAZAN UNIVERSITY جامعة جازان
College of Engineering الهندســـــة كليـــــة
Mechanical Engineering Department الميكانيكيةقسم الهندسة
Experiment no. (5)
Title: CALCULATION OF COEFFICIENT OF PERFORMANCE OF A
SIMPLE REFRIGERATION CYCLE
EXPERIMENT / TEST DESCRIPTION
Test Description: The performance of refrigerators and heat pumps is expressed in terms of coefficient of performance, so basic cooling training set is used to calculate this coefficient.
Test Objectives: The objectives of this test: To observe and understand the principle operation of an ideal refrigeration cycle and calculation of coefficient of performance experimentally.
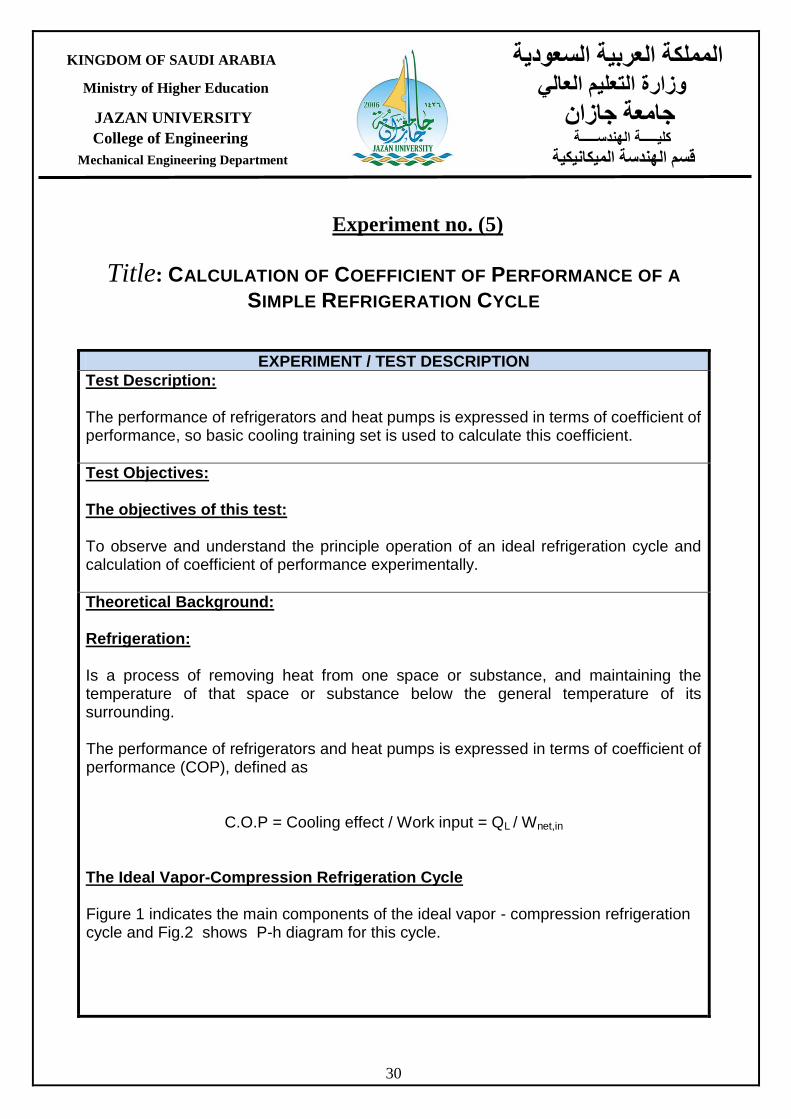
Theoretical Background: Refrigeration: Is a process of removing heat from one space or substance, and maintaining the temperature of that space or substance below the general temperature of its surrounding. The performance of refrigerators and heat pumps is expressed in terms of coefficient of performance (COP), defined as
C.O.P = Cooling effect / Work input = QL / Wnet,in
The Ideal Vapor-Compression Refrigeration Cycle Figure 1 indicates the main components of the ideal vapor - compression refrigeration cycle and Fig.2 shows P-h diagram for this cycle.

31
KINGDOM OF SAUDI ARABIA المملكة العربية السعىدية
Ministry of Higher Education وزارة التعليم العالي
JAZAN UNIVERSITY جامعة جازان
College of Engineering الهندســـــة كليـــــة
Mechanical Engineering Department الميكانيكيةقسم الهندسة
Fig.(1) Fig.(2)
Fig.(3)
For this cycle Process Description 1-2 Isentropic compression. 2-3 Constant pressure heat rejection in the condenser. 3-4 Throttling in an expansion valve 4-1 Constant pressure heat addition in the evaporator.
32
KINGDOM OF SAUDI ARABIA المملكة العربية السعىدية
Ministry of Higher Education وزارة التعليم العالي
JAZAN UNIVERSITY جامعة جازان
College of Engineering الهندســـــة كليـــــة
Mechanical Engineering Department الميكانيكيةقسم الهندسة
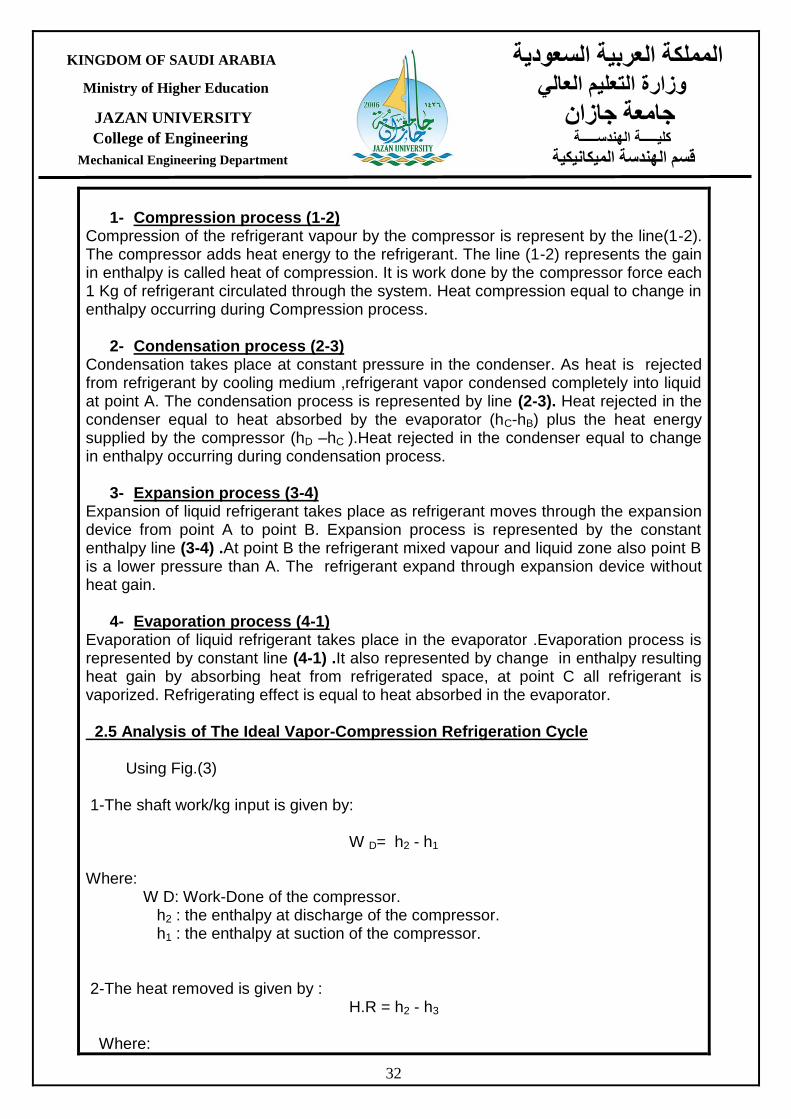
1- Compression process (1-2)
Compression of the refrigerant vapour by the compressor is represent by the line(1-2). The compressor adds heat energy to the refrigerant. The line (1-2) represents the gain in enthalpy is called heat of compression. It is work done by the compressor force each 1 Kg of refrigerant circulated through the system. Heat compression equal to change in enthalpy occurring during Compression process.
2- Condensation process (2-3) Condensation takes place at constant pressure in the condenser. As heat is rejected from refrigerant by cooling medium ,refrigerant vapor condensed completely into liquid at point A. The condensation process is represented by line (2-3). Heat rejected in the condenser equal to heat absorbed by the evaporator (hC-hB) plus the heat energy supplied by the compressor (hD –hC ).Heat rejected in the condenser equal to change in enthalpy occurring during condensation process.
3- Expansion process (3-4) Expansion of liquid refrigerant takes place as refrigerant moves through the expansion device from point A to point B. Expansion process is represented by the constant enthalpy line (3-4) .At point B the refrigerant mixed vapour and liquid zone also point B is a lower pressure than A. The refrigerant expand through expansion device without heat gain.
4- Evaporation process (4-1) Evaporation of liquid refrigerant takes place in the evaporator .Evaporation process is represented by constant line (4-1) .It also represented by change in enthalpy resulting heat gain by absorbing heat from refrigerated space, at point C all refrigerant is vaporized. Refrigerating effect is equal to heat absorbed in the evaporator. 2.5 Analysis of The Ideal Vapor-Compression Refrigeration Cycle Using Fig.(3) 1-The shaft work/kg input is given by:
W D= h2 - h1 Where: W D: Work-Done of the compressor. h2 : the enthalpy at discharge of the compressor. h1 : the enthalpy at suction of the compressor. 2-The heat removed is given by :
H.R = h2 - h3 Where:
33
KINGDOM OF SAUDI ARABIA المملكة العربية السعىدية
Ministry of Higher Education وزارة التعليم العالي
JAZAN UNIVERSITY جامعة جازان
College of Engineering الهندســـــة كليـــــة
Mechanical Engineering Department الميكانيكيةقسم الهندسة
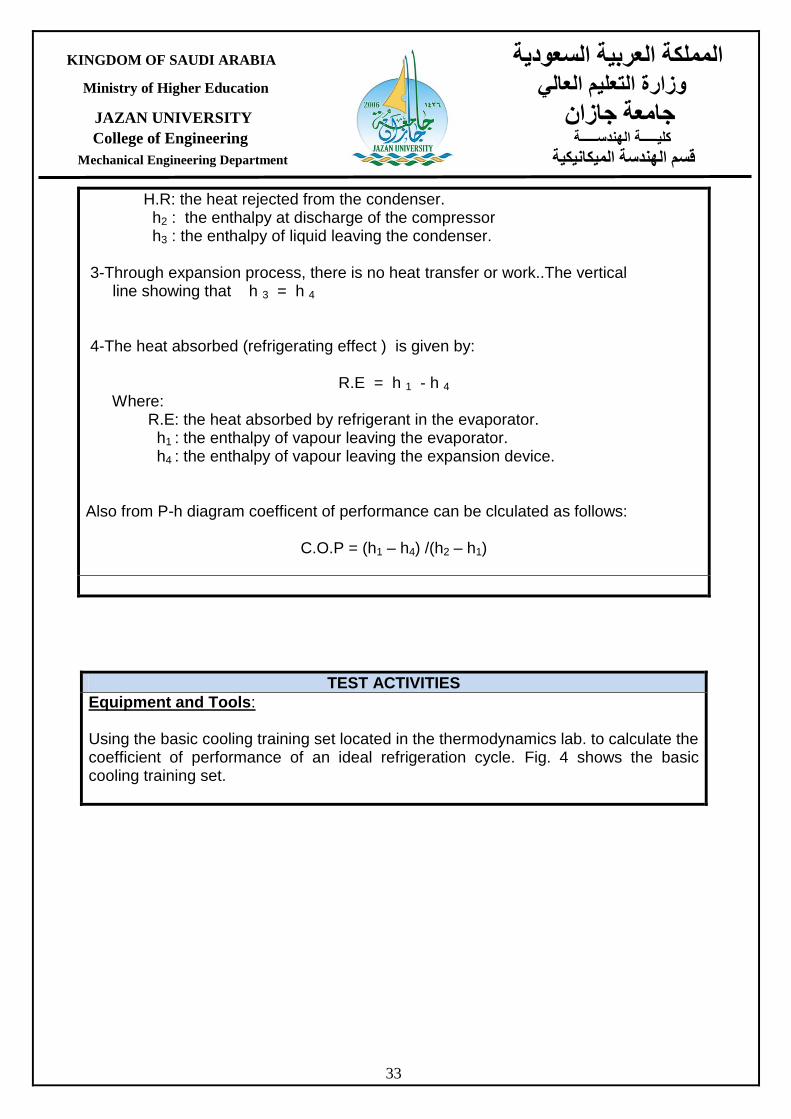
H.R: the heat rejected from the condenser. h2 : the enthalpy at discharge of the compressor h3 : the enthalpy of liquid leaving the condenser. 3-Through expansion process, there is no heat transfer or work..The vertical line showing that h 3 = h 4 4-The heat absorbed (refrigerating effect ) is given by:
R.E = h 1 - h 4 Where: R.E: the heat absorbed by refrigerant in the evaporator. h1 : the enthalpy of vapour leaving the evaporator. h4 : the enthalpy of vapour leaving the expansion device. Also from P-h diagram coefficent of performance can be clculated as follows:
C.O.P = (h1 – h4) /(h2 – h1)
TEST ACTIVITIES
Equipment and Tools: Using the basic cooling training set located in the thermodynamics lab. to calculate the coefficient of performance of an ideal refrigeration cycle. Fig. 4 shows the basic cooling training set.

34
KINGDOM OF SAUDI ARABIA المملكة العربية السعىدية
Ministry of Higher Education وزارة التعليم العالي
JAZAN UNIVERSITY جامعة جازان
College of Engineering الهندســـــة كليـــــة
Mechanical Engineering Department الميكانيكيةقسم الهندسة
The Basic Cooling Training Set should have been designed to operate and observe the cooling system and also to study the performance of this set. TECHNICAL SPECIFICATIONS
Supply Voltage : 220V - 240V AC, 50/60Hz.
The structure should show the basic cooling system.
Low and High pressure indicators.
The transparent Plexiglass structure should exam and observe the system.

35
KINGDOM OF SAUDI ARABIA المملكة العربية السعىدية
Ministry of Higher Education وزارة التعليم العالي
JAZAN UNIVERSITY جامعة جازان
College of Engineering الهندســـــة كليـــــة
Mechanical Engineering Department الميكانيكيةقسم الهندسة
The sight glass to observe the gas flow.
Start - Stop - Emergency stop buttons.
Leakage current and fuse protection.
Block scheme of operation of the system.
Digital heating indicator.
The following items have been avaible on the set.
Digital thermostat, Manometers, Hermetic Compressor.
Evaporator and Condenser. As indicated in Fig. 4, two pressures gauges are connected to the high and low sides of the unit.
Test Procedure:
1- Start the unit.
2- Record the evaporator and condenser pressures every ten min.
3- Calculte the absolute pressure.
4- Using the steam tables to find the values of enthalpies or p-h chart.
5- Calculate the coefficient of performance for each case.
6- Compare between the different values.
Test Results:
Condenser pressure
Evaporator pressure
h1 h2 h3 h4 C.O.P
Conclusions:
Comments:
36
KINGDOM OF SAUDI ARABIA المملكة العربية السعىدية
Ministry of Higher Education وزارة التعليم العالي
JAZAN UNIVERSITY جامعة جازان
College of Engineering الهندســـــة كليـــــة
Mechanical Engineering Department الميكانيكيةقسم الهندسة
Experiment no. (6)
Title: REFRIGERATION - HEAT PUMP SYSTEM
EXPERIMENT / TEST DESCRIPTION
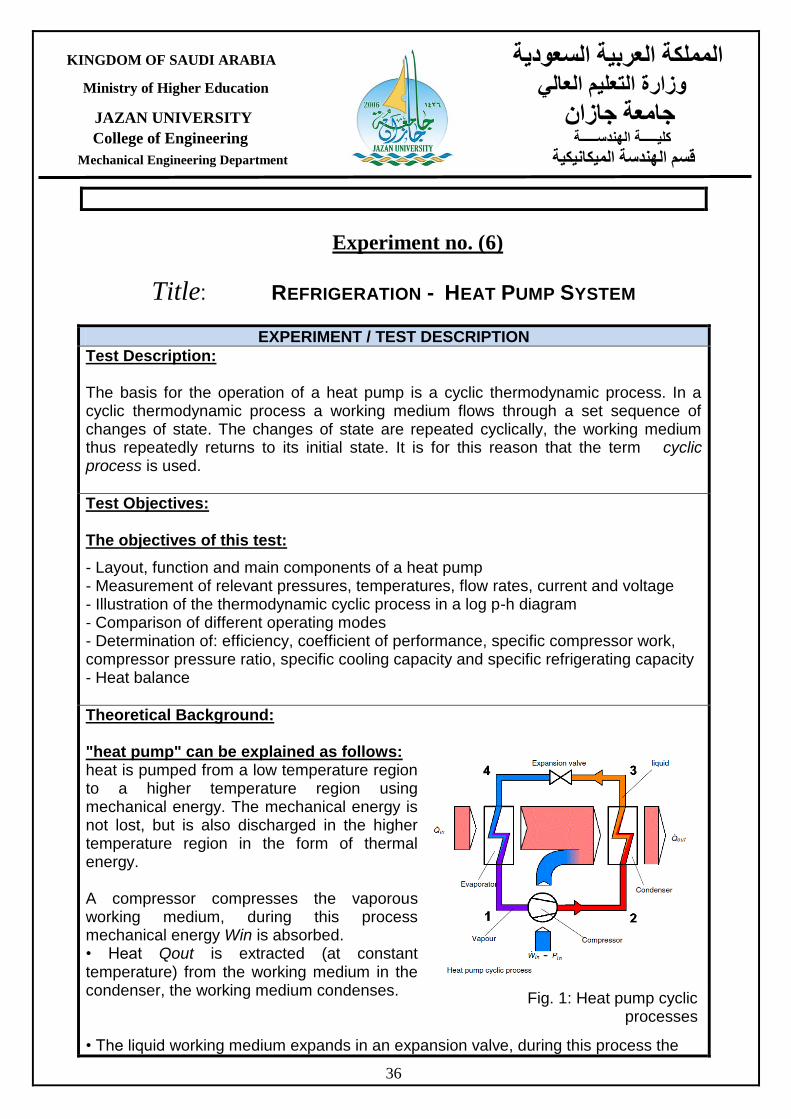
Test Description: The basis for the operation of a heat pump is a cyclic thermodynamic process. In a cyclic thermodynamic process a working medium flows through a set sequence of changes of state. The changes of state are repeated cyclically, the working medium thus repeatedly returns to its initial state. It is for this reason that the term cyclic process is used.
Test Objectives: The objectives of this test:
- Layout, function and main components of a heat pump - Measurement of relevant pressures, temperatures, flow rates, current and voltage - Illustration of the thermodynamic cyclic process in a log p-h diagram - Comparison of different operating modes - Determination of: efficiency, coefficient of performance, specific compressor work, compressor pressure ratio, specific cooling capacity and specific refrigerating capacity - Heat balance
Theoretical Background: "heat pump" can be explained as follows: heat is pumped from a low temperature region to a higher temperature region using mechanical energy. The mechanical energy is not lost, but is also discharged in the higher temperature region in the form of thermal energy. A compressor compresses the vaporous working medium, during this process mechanical energy Win is absorbed. • Heat Qout is extracted (at constant temperature) from the working medium in the condenser, the working medium condenses. • The liquid working medium expands in an expansion valve, during this process the
Fig. 1: Heat pump cyclic processes

37
KINGDOM OF SAUDI ARABIA المملكة العربية السعىدية
Ministry of Higher Education وزارة التعليم العالي
JAZAN UNIVERSITY جامعة جازان
College of Engineering الهندســـــة كليـــــة
Mechanical Engineering Department الميكانيكيةقسم الهندسة
working medium cools. • The working medium is evaporated in an evaporator, heat being absorbed during this process Qin. The working medium is now fed back to the compressor and the cyclic process begins again.
TEST ACTIVITIES
Equipment and Tools:
Fig.2: The Heat pump system Components.

38
KINGDOM OF SAUDI ARABIA المملكة العربية السعىدية
Ministry of Higher Education وزارة التعليم العالي
JAZAN UNIVERSITY جامعة جازان
College of Engineering الهندســـــة كليـــــة
Mechanical Engineering Department الميكانيكيةقسم الهندسة
Test Procedure: Experimental Determination of the Ideal / Real Output Coefficient Here the output coefficient is determined from the differences in the enthalpies on the log p-h diagram. To do this the cyclic process must be plotted on the log p-h diagram. Performing the Experiment • Switch on the compressor., • Switch on the fans., • Switch on the circulation pump., • If cooling via tap water, connect to the cold water supply with hoses., • Leave the test stand to run until the pressures on the suction and delivery side have stabilized., • At the control valve set the flow in the water circuit such that the flow rate is around 20l/h. • Read off and note the working medium pressures on the suction and delivery side.
Fig.3: Measured parameters of the heat pump system.
39
KINGDOM OF SAUDI ARABIA المملكة العربية السعىدية
Ministry of Higher Education وزارة التعليم العالي
JAZAN UNIVERSITY جامعة جازان
College of Engineering الهندســـــة كليـــــة
Mechanical Engineering Department الميكانيكيةقسم الهندسة
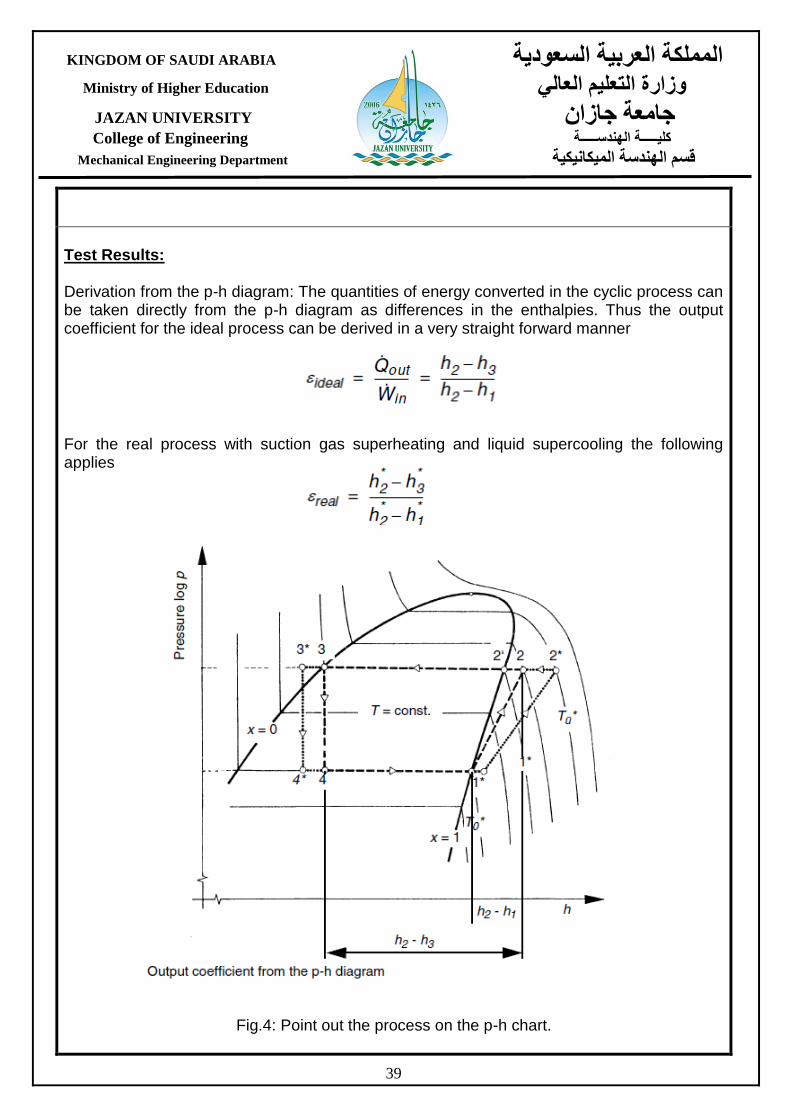
Test Results: Derivation from the p-h diagram: The quantities of energy converted in the cyclic process can be taken directly from the p-h diagram as differences in the enthalpies. Thus the output coefficient for the ideal process can be derived in a very straight forward manner
For the real process with suction gas superheating and liquid supercooling the following applies
Fig.4: Point out the process on the p-h chart.

40
KINGDOM OF SAUDI ARABIA المملكة العربية السعىدية
Ministry of Higher Education وزارة التعليم العالي
JAZAN UNIVERSITY جامعة جازان
College of Engineering الهندســـــة كليـــــة
Mechanical Engineering Department الميكانيكيةقسم الهندسة
Results
h1
h2 h3 h4 Output coefficient (ideal)
h1’
h2
’ h3’ h4
’ Output coefficient (Real)
Conclusions:
Comments: