Embed Size (px)
Citation preview


BSBPMG512 Manage project time © Australis College Pty Ltd V040316 2
Table of Contents
Unit Overview .............................................................................................................................. 3
1.0 Determine project schedule ........................................................................................ 4
1.1 Develop work breakdown structure .................................................................................... 7
1.2 Estimate tasks to achieve project deliverables .................................................................. 8
1.3 Scheduling tools & techniques ........................................................................................... 19
1.4 Develop Schedule Process .................................................................................................. 26
2.0 Implement project schedule ..................................................................................... 34
2.1 Measure, record & report activities progress ................................................................... 34
2.2 Identify baseline variance ................................................................................................... 38
2.3 Impact of changes to schedule .......................................................................................... 39
2.4 Review progress & implement schedule changes ........................................................... 44
2.5 Develop responses to schedule changes .......................................................................... 46
3.0 Assess time-management outcomes ....................................................................... 47
3.1 Review schedule performance records ............................................................................. 47
3.2 Review time-management issues ...................................................................................... 49
References .................................................................................................................................. 55

BSBPMG512 Manage project time © Australis College Pty Ltd V040316 3
Unit Overview
This unit describes the performance outcomes, skills and knowledge required to manage time in projects. It involves determining and implementing the project schedule, and assessing time-management outcomes.
Unit Objectives
On successful completion of this unit, you will be able to:
- Determine the project schedule. - Implement the project schedule. - Assess time-management outcomes.

BSBPMG512 Manage project time © Australis College Pty Ltd V040316 4
1.0 Determine project schedule
Module Overview
At the end of this module, you will be able to:
- Develop the work breakdown structure with sufficient detail to enable effective planning and control.
- Estimate the duration and effort, sequence, and dependencies of tasks to achieve project deliverables.
- Use project-scheduling tools and techniques to identify schedule impact on project time management, resource requirements, costs, and risks.
- Contribute to achieving an agreed schedule baseline and communication of the schedule to stakeholders.
Introduction
This unit is about Managing Project Time, however most references to time will be about how it affects the project Schedule. Planning for project time requirements starts early in the planning phase of a project.
The Knowledge Area called Project Time Management is responsible for establishing the policies and procedures for planning, estimating, managing, and controlling the project schedule to keep it within the approved time frame.

BSBPMG512 Manage project time © Australis College Pty Ltd V040316 5
Project Time Management is divided into seven (7) interrelated processes:
1. Plan Schedule Management.
2. Define Activities.
3. Sequence Activities.
4. Estimate Activity Resources.
5. Estimate Activity Durations.
6. Develop Schedule.
7. Control Schedule.
The time and resources spent using these 7 processes should always reflect the needs and size of the project.
These processes are so inter-related that they may be mistakenly viewed as a single process. However, the tools and techniques for each process are different and so for larger projects, can be split between multiple project team members rather than only being completed by the Project Manager.
The final result of these 7 processes is the project Schedule Baseline which is used as a reference point to show whether the project activities are on track with respect to time.
The Plan Schedule Management process creates the Schedule Management Plan which becomes a component of the Project Management Plan. The Plan Schedule Management process creates the documentation, policies, processes, and procedures that guide the Project Manager on how to develop, manage, and control the project schedule.
BSBPMG512 Manage project time © Australis College Pty Ltd V040316 6
Schedule Management Plan Process
Schedule Management Plan Process
Inputs
Project Management Plan - The PMP contains information on Scope Baseline (Project Scope Statement and WBS) and other time-related information from other knowledge areas, e.g. cost, risk, and communications.
Project Charter - This Charter contains the summary of the project milestones schedule and the project approval requirements. These will influence the management of the project schedule.
Enterprise Environmental Factors - Factors that can influence this process include resource availability, project management software, scheduling tools, and any organisational work authorisation systems.
Organisational Process Assets - These contain information that can influence this process, e.g. the monitoring and reporting tools to be used, templates, risk control procedures, and change control.
BSBPMG512 Manage project time © Australis College Pty Ltd V040316 7
Tools & Techniques
Expert judgement - This is used to provide insights about the project environment and information learned from prior similar projects.
Analytical techniques - These may require choosing between strategic options to estimate and schedule the project, e.g. scheduling methodology, scheduling tools and techniques, estimating approaches, formats, and project management software.
Meetings of the project team members - These are held to develop the Schedule Management Plan, and usually include the Project Manager, Sponsor, and others with project scheduling or execution responsibilities.
Outputs
Schedule Management Plan - This forms a part of the Project Management Plan and establishes how the Project Schedule will be developed, monitored, and controlled.
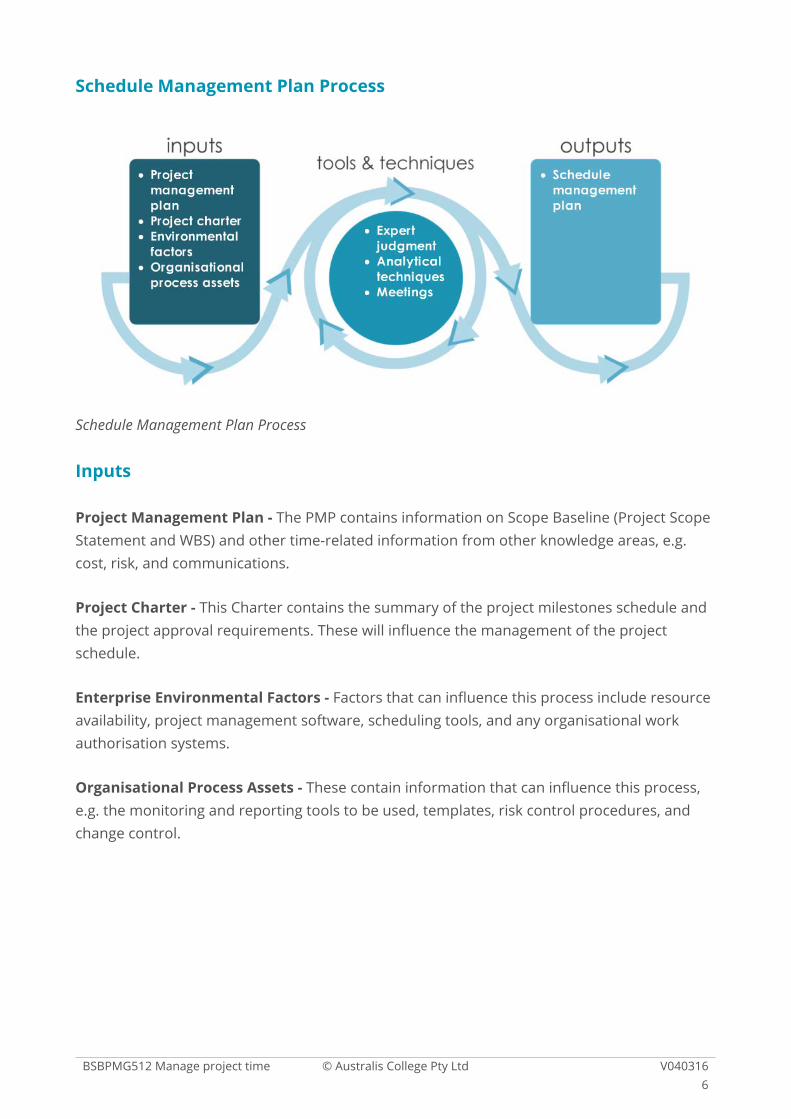
1.1 Develop work breakdown structure
How does the project determine all the resources (including time) needed to complete its objectives? This information is recorded in the Scope Baseline document, created during the scoping of the project.
The total scope of work that the project needs to successfully complete to create the project objectives is defined in the Work Breakdown Structure (WBS). The WBS is a hierarchical decomposition structure that breaks down all the project deliverables into smaller, more manageable components.
Information contained within the Scope Baseline (including the WBS) is used in the Define Activities Process. All the project deliverables, constraints and assumptions are fully considered when defining project activities and the time, cost, and resources needed to complete them.

BSBPMG512 Manage project time © Australis College Pty Ltd V040316 8
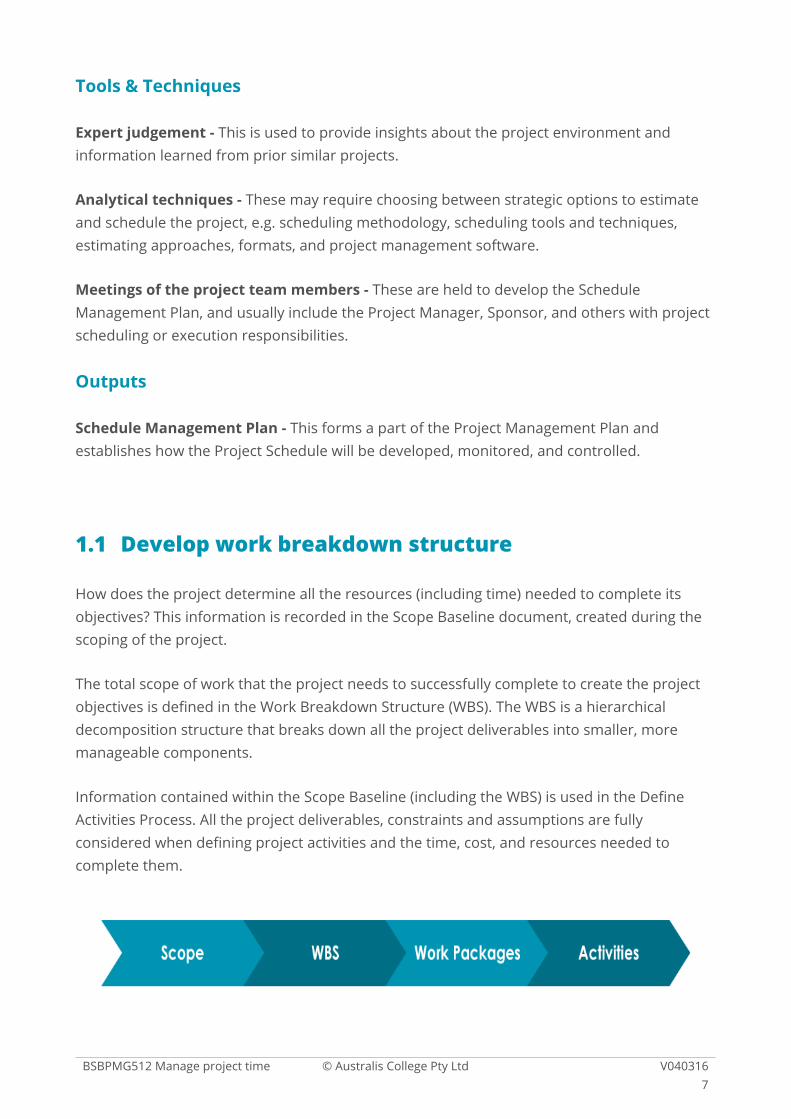
The technique of decomposition breaks down the work packages in the WBS into activities (tasks) that can be used for estimating, scheduling, executing, monitoring, and controlling the project work. Have a look at the example of a WBS decomposition shown below.
WBS Decomposition Example
The work packages shown above can be decomposed into smaller activities so that the time for completion can be estimated. This is shown in the WBS below.
1.2 Estimate tasks to achieve project deliverables
If we continue to use the Surfboard project WBS below, we can see that each of the activities can now be assigned an estimated effort (time) for its completion using bottom-up estimation.
Bottom-up estimation works upwards from the smallest task at the bottom and uses the time and cost of each activity to provide a total time and cost estimate for the entire Phase.
BSBPMG512 Manage project time © Australis College Pty Ltd V040316 9
Now that estimations have been made for each of the activities, bottom-up estimating can be made for the whole project.
In this example: Design Phase 1: time = 80 hours, cost = $100,000. The cost and time of Design Phase 2 is then added to provide a total cost and time estimate for the design phase 1.1. If all activities are added together, the surfboard project is estimated to take 720 hours at a cost of $450,000.

BSBPMG512 Manage project time © Australis College Pty Ltd V040316 10
Decomposition is one of the techniques used in the Define Activities Process that follows:
Define Activities Process
Define Activities Process
Inputs
Schedule management plan - Contains information on how the Project Schedule will be developed, monitored, and controlled.
Scope baseline - Contains the project WBS, deliverables, constraints, and assumptions for all project work.
Enterprise environmental factors - Factors that can influence this process include organisation structures and processes, and the Project Management Information System.
Organisational process assets - Contain information that can influence this process, e.g. lessons learned from prior similar projects, templates, and existing scheduling methodologies.

BSBPMG512 Manage project time © Australis College Pty Ltd V040316 11
Tools & Techniques
Decomposition - This is the process used for the dividing and subdividing the project scope and project deliverables into smaller, more manageable work packages. The process uses this technique to divide each work package found in the WBS into activities.
Activities represent the work required to produce the work package deliverable. To clarify, the WBS and WBS dictionary are used as the basis for development of the final activity list.
Rolling wave planning - This is an iterative process where work that is close in time is planned in detail, and work further away in time is planned in less detail. As works that is further away gets closer in time, it is planned in more detail. This allows for current project knowledge and information to be used in the planning. This may have changed since the start of the project.
Expert judgement - This is used by project team members who have experience in the development of detailed project scope statements, the WBS, and project schedules. They can use their experience in defining the activities.
Outputs
Activity List - This is a comprehensive list of all activities required to complete all the project work. Each activity should have a unique title, activity identifier, and a scope of work description.
Activity attributes - These extend the description of the activity by identifying the multiple components associated with each activity. These components include the activity identifier (ID), WBS ID, and activity label or name.
When the activities are completed, they may include activity codes, activity descriptions, predecessor activities, successor activities, logical relationships, leads and lags, resource requirements, imposed dates, constraints, and assumptions.
Milestone list - This is a list of the significant points or events in the project. Milestones are similar to schedule activities, with the same structure and attributes, but have zero duration because milestones represent a moment in time.

BSBPMG512 Manage project time © Australis College Pty Ltd V040316 12
Sequence Activities Process
Now that all the project activities have been identified, a schedule for their execution should be created. Some activities need to occur sequentially (one after the other), while others may occur in parallel (at the same time).
The sequence of activities should represent a logical flow of work that gives the greatest efficiency considering the projects constraints. The 3 outputs of the Define Activities Process (activity list, activity attributes and Milestone list) are used as inputs for the Sequence Activities Process to help define the logical flow of work for the project activities.
Sequence Activities Process
Inputs
Schedule management plan - This plan contains information on how the Project Schedule will be developed, monitored, and controlled. This includes the scheduling method and any tool to be used to create the project schedule.
Activity list - This list contains all the activities that need to be scheduled to complete the project work.
Activity attributes - These may contain information on a necessary sequence of events or defined predecessor or successor relationships, e.g. item (a) needs to be made before item (b).
Milestone list - This list contains information on project milestones which may affect how certain activities are scheduled.

BSBPMG512 Manage project time © Australis College Pty Ltd V040316 13
Project scope statement - This contains the scope description which may affect activity sequencing. Other factors that may affect activity sequencing include project constraints, deliverables, and assumptions.
Enterprise environmental factors - Factors which may affect the Sequence Activities process include governmental and industry standards, Project Management Information System, and the selected scheduling tool.
Organisational process Assets - Assets that may influence this process include information from corporate knowledge based on scheduling, scheduling policies, templates, procedures, and guidelines.
Tools & Techniques
Precedence diagramming method (PDM) - This is a graphical technique used to represent the project schedule, by linking the activities through one or more logical relationships to display the sequence in which the activities are to be performed.
A predecessor activity is an activity that logically comes before a dependent activity in a schedule. A successor activity is a dependent activity that logically comes after another activity in a schedule.
Dependency determination - Dependency can be either mandatory or discretionary, and either internal or external. They can be combined into mandatory external dependencies, mandatory internal dependencies, discretionary external dependencies, or discretionary internal dependencies.
- Mandatory dependences are those that are legally or contractually inherent in the type of work the project is undertaking. e.g. You cannot test a new phone’s functionality without first building a prototype to test.
- Discretionary dependences can be made based on a knowledge of best practices or when a specific series of activities is desired, even if there are other acceptable sequences.
- External dependences involve a relationship between project activities and a non-project activity that is generally outside the control of the project team e.g. a project to create a new corporate website will have an external dependency to another project that is creating the new corporate logo to be used in the new website.
- Internal dependencies involve a predecessor relationship between different project activities that is generally inside the control of the project team e.g. The project team cannot test a new machine until it is assembled.

BSBPMG512 Manage project time © Australis College Pty Ltd V040316 14
Leads and lags - A lead is the amount of time that a successor activity can be brought forward in time compared to the completion of its predecessor activity. A lag is the amount of time a successor activity is delayed with respect to its predecessor.
Outputs
Project schedule network diagrams - The project schedule can be represented graphically as a series of activities linked by their logical relationship (dependency). These diagrams can be created manually or with the aid of project management software.
Project documents updates - Updates that may be required include Activities lists, milestone list, and the risk register.
The Sequence Activities process creates the Project schedule network diagrams which can be represented graphically as a series of activities linked by their logical relationship (dependency). These diagrams can be created manually or with the aid of project management software.
Precedence diagramming method (PDM)
The Precedence diagramming method (PDM) which is one of the tools in the Sequence Activities process, is a graphical method used to show the sequence of activities in a project. It uses arrows to show the dependencies between activities and nodes (boxes) to represent activities.
Activity-on-node (AON)
A common method for representing the activity sequence is using ‘Activity-on-node’ (AON) and this is the method most frequently used by software packages. This method uses boxes referred to as nodes, to represent activities and connects them with arrows to show the dependencies (relationships) between them. Some basic rules for PDM are:
- Network diagrams flow from left to right. - Activities are represented by a rectangle (start on the left, finish on the right). - Arrows represent precedence and flow. - Arrows can cross over each other. - Each activity should have a unique identification tag (usually the WBS item number is
used). - Looping is not allowed. - Conditional statements must not be used (if, then, or else conditions are not allowed).

BSBPMG512 Manage project time © Australis College Pty Ltd V040316 15
Activity-on-arrow (AOA)
Another method commonly used is called ‘Activity-on-arrow’ (AOA). In this method, activities are represented by arrows. Here is an example of how this is represented:
Dependencies
The Precedence diagramming method (PDM) uses 4 types of dependencies or logical relationships. A predecessor activity is an activity that logically comes before a dependent activity in a schedule. A successor activity is a dependent activity that logically comes after another activity in a schedule.

BSBPMG512 Manage project time © Australis College Pty Ltd V040316 16
The four (4) types of dependencies are:
- Finish-to-start (FS) - The successor activity does not start until the predecessor activity is finished e.g. The underground water pipe cannot be installed (successor) until the trench is dug (predecessor).
- Finish-to-finish (FF) - The successor activity does not finish until the predecessor activity is completed e.g. Writing a user manual (predecessor) must be completed before editing it (successor) can be completed.
- Start-to-start (SS) - The successor activity does not start until the predecessor activity starts e.g. Level the concrete (successor) cannot start until pour concrete (predecessor) has started.
- Start-to-finish (SF) - The successor activity does not finish until the predecessor activity starts e.g. The first security guard shift (successor) cannot finish until the second security guard shift (predecessor) starts.
‘Finish-to-start’ is the most common dependency used by PDM, while ‘Start-to-finish’ is the least used. The following diagram illustrates these dependencies.
Dependencies can also be split into different types. They can be either mandatory or discretionary, and either internal or external. These can then be combined into mandatory external dependencies, mandatory internal dependencies, discretionary external dependencies, or discretionary internal dependencies.
- Mandatory dependencies - those that are legally or contractually inherent in the type of work the project is undertaking e.g. You cannot test a new phone’s functionality without first building a prototype to test.
- Discretionary dependencies - can be made based on a knowledge of best practices or when a specific series of activities is desired, even if there is another acceptable sequence.

BSBPMG512 Manage project time © Australis College Pty Ltd V040316 17
- External dependencies - involve a relationship between project activities and non-project activities that are generally outside the control of the project team e.g. A project to create a new corporate website will have an external dependency to another project that is creating the new corporate logo that must be used in the new website.
- Internal dependencies - involve a predecessor relationship between different project activities that is generally inside the control of the project team. Example: The project team cannot test a new machine until it is assembled.
Leads and Lags
A lead is the amount of time a successor activity can be brought forward with respect to its predecessor. Sometimes it does not make sense, from a project Time point of view, to complete an activity 100% before starting the successor activity.
In the above diagram, the time taken to complete laying the fibre optic cable has been reduced from 15 days to 9 days. This process of leads is sometimes known as project acceleration or compression.
Example: The rollout of the National Broadband Network (NBN) is currently estimated to take ten years and cost approximately $40 billion, with a phased roll-out to certain geographical areas around Australia.
For this type of large projects, it would not make sense to dig all the trenches, then install the cables, connect them all up, test them, fill in all the trenches, and then turn them all on. It would take many more years and the cost would increase substantially. It is always useful to examine the project schedule and look for opportunities to reduce the overall project time, if at all possible.

BSBPMG512 Manage project time © Australis College Pty Ltd V040316 18
A lag is the delay in time between the predecessor and successor activities. Here is an example of a lag: Constructing the walls of a house may not begin until 3 days after the concrete slab is poured to allow the concrete to set properly.
The project management team determines whether a lag or lead best represents the logical relationship between activities.

BSBPMG512 Manage project time © Australis College Pty Ltd V040316 19
Project Schedule Network Diagrams
The end result of this process is the development of the Project Schedule Network Diagrams which link the projects activities together. These diagrams should also have a summary of the approach used to sequence the activities provided with them. The following example has 12 activities labelled A to L. Any unlabelled dependency (arrow) has a Finish-to-Start (FS) relationship with no lead or lag.
Project Schedule Network Diagram
1.3 Scheduling tools & techniques
Now that all the activities have been sequenced, the project team needs to estimate the resources and time required to complete the activities.
The Estimate Activity Resources process identifies the type and quantity of resources required to complete each activity. Resources include materials, equipment, human resources, or supplies. This identification of resources allows for a more accurate estimation of costs and duration.
BSBPMG512 Manage project time © Australis College Pty Ltd V040316 20
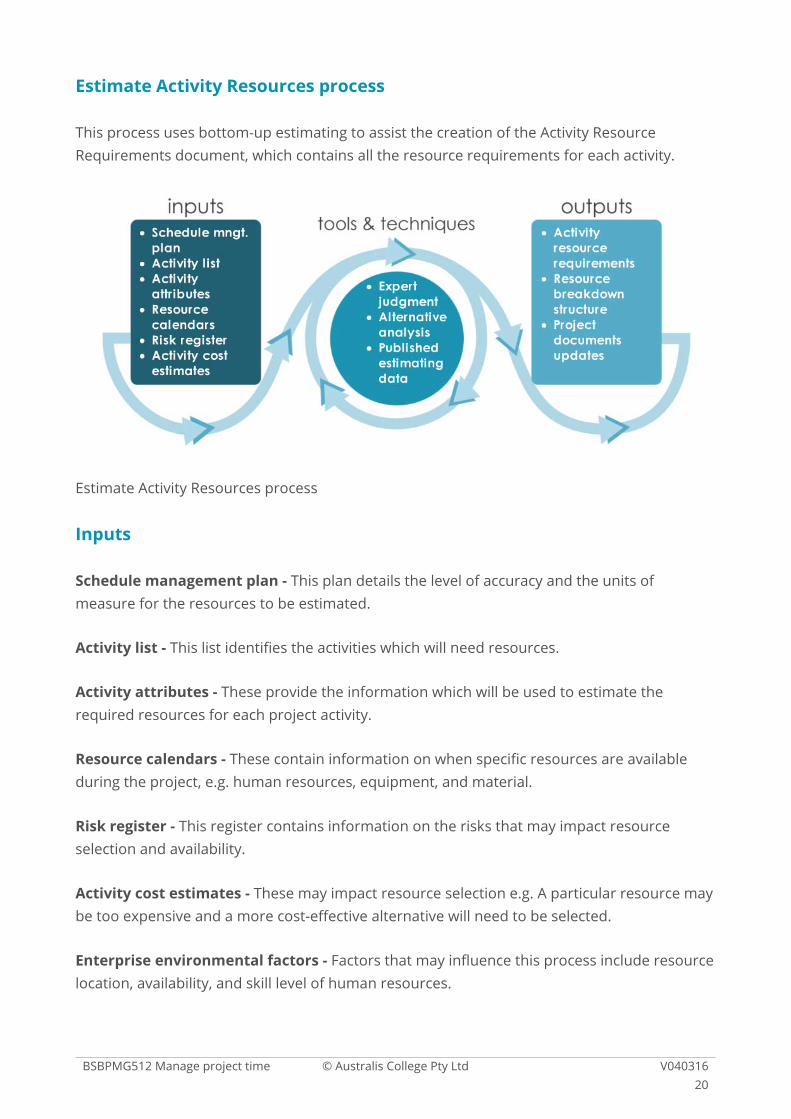
Estimate Activity Resources process
This process uses bottom-up estimating to assist the creation of the Activity Resource Requirements document, which contains all the resource requirements for each activity.
Estimate Activity Resources process
Inputs
Schedule management plan - This plan details the level of accuracy and the units of measure for the resources to be estimated.
Activity list - This list identifies the activities which will need resources.
Activity attributes - These provide the information which will be used to estimate the required resources for each project activity.
Resource calendars - These contain information on when specific resources are available during the project, e.g. human resources, equipment, and material.
Risk register - This register contains information on the risks that may impact resource selection and availability.
Activity cost estimates - These may impact resource selection e.g. A particular resource may be too expensive and a more cost-effective alternative will need to be selected.
Enterprise environmental factors - Factors that may influence this process include resource location, availability, and skill level of human resources.

BSBPMG512 Manage project time © Australis College Pty Ltd V040316 21
Organisational process Assets - Assets that can influence this process include any policies and procedures related to staffing, rental, purchase of supplies and equipment, plus any information from prior similar projects regarding resources.
Tools & Techniques
Expert judgement - Used to assess the resource inputs of this process.
Alternative analysis - This highlights the different ways activities can be accomplished. Selecting the best option to fit the project needs is a part of this technique.
Published estimating data - This is obtained from external organisations and can provide insights into current production rates and unit costs of resources for an extensive array of labour trades, material, and equipment for different countries.
Bottom-up estimating - This is used when the duration or cost of each work package in the WBS is totalled to provide an estimate of the total duration or cost of the project.
Project management Software - Examples including scheduling tools can help plan, organise, manage resource pools, and estimate required resources.
Outputs
Activity Resource Requirements - For each activity, the requirements can be aggregated (added) together to form an estimation of resources for each work package and each work period.
Resource breakdown structure - This is a hierarchical representation of resources by category and type.
Project documents updates - Updates that may be required include updates to the Activity List, Activity Attributes, and resource calendars.
BSBPMG512 Manage project time © Australis College Pty Ltd V040316 22
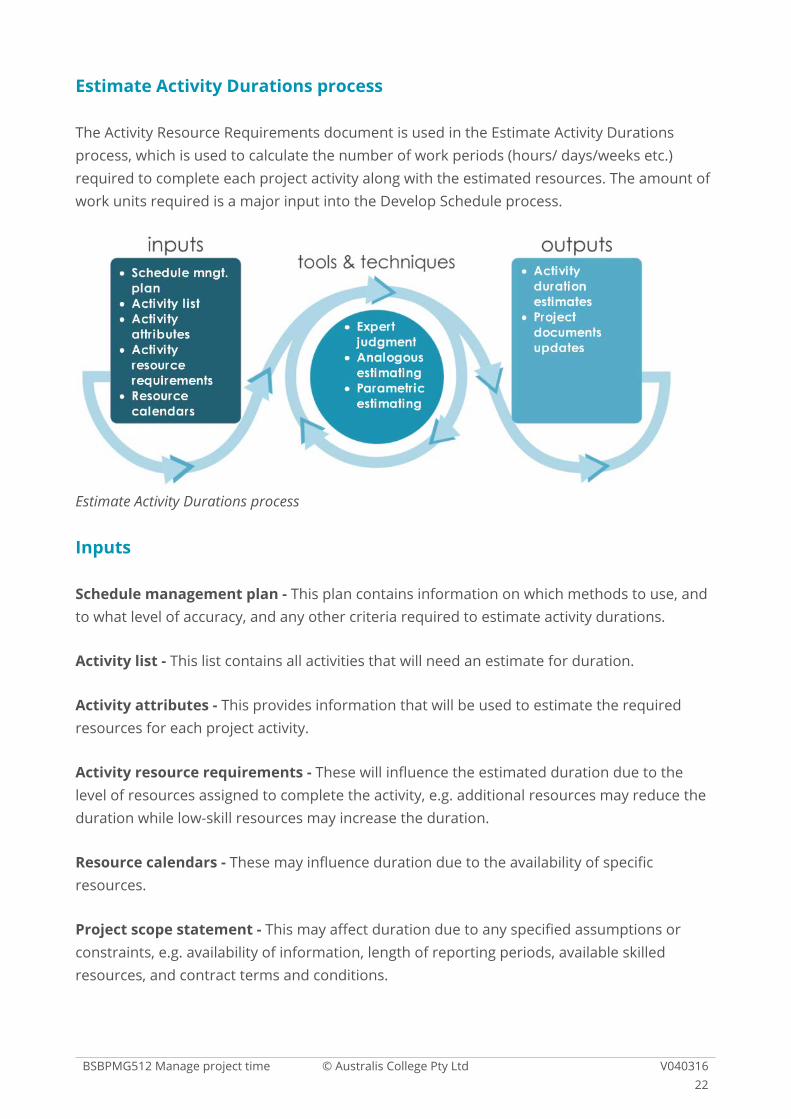
Estimate Activity Durations process
The Activity Resource Requirements document is used in the Estimate Activity Durations process, which is used to calculate the number of work periods (hours/ days/weeks etc.) required to complete each project activity along with the estimated resources. The amount of work units required is a major input into the Develop Schedule process.
Estimate Activity Durations process
Inputs
Schedule management plan - This plan contains information on which methods to use, and to what level of accuracy, and any other criteria required to estimate activity durations.
Activity list - This list contains all activities that will need an estimate for duration.
Activity attributes - This provides information that will be used to estimate the required resources for each project activity.
Activity resource requirements - These will influence the estimated duration due to the level of resources assigned to complete the activity, e.g. additional resources may reduce the duration while low-skill resources may increase the duration.
Resource calendars - These may influence duration due to the availability of specific resources.
Project scope statement - This may affect duration due to any specified assumptions or constraints, e.g. availability of information, length of reporting periods, available skilled resources, and contract terms and conditions.
BSBPMG512 Manage project time © Australis College Pty Ltd V040316 23
Risk register - This register contains the risk analysis and planned responses to those risks, should they occur. The likelihood of the risk and the planned response may affect the duration estimate of an activity.
Resource breakdown structure - This structure is a hierarchical representation of resources by category and type.
Enterprise environmental factors - Factors that may influence duration estimates include productivity metrics and the location of team members.
Organisational process assets - Those that may influence duration estimates include project calendars, scheduling methodology, and any lessons learned from prior projects.
Tools & Techniques
Expert judgement - This will be discussed in detail in the next section on Schedule Estimating Methods.
Analogous estimating, parametric estimating, 3-point estimating - These will be discussed in detail in the next section.
Group decision-making techniques - These can improve the duration estimates by engaging team members in activities, e.g. brainstorming, Delphi, and nominal group techniques.
Reserve analysis - These will be discussed in detail in the next section.
Outputs
Activity duration estimates - These estimates are an assessment of the probable time periods (hours/ days/ etc.) to complete an activity. These estimates do not include any lags. The duration may be expressed as a range of possible time frames, e.g. 4 days +/- 1days - the activity will take at least 3 days but may take as long as 5 days.
Project documents updates - Those that may be required include Activity Attributes and any assumptions used in schedule estimation, e.g. skill levels and availability.
This process uses various techniques to provide a time estimate for project activities. Each one can be used to estimate the whole project, or only a part of it, while using other methods to estimate the rest of the project. The estimating activities should reflect the needs, size, and risk of the project.

BSBPMG512 Manage project time © Australis College Pty Ltd V040316 24
Schedule estimating methods
Projects tend to use different estimation methods for different types of project activities, based on what worked best on prior similar projects.
Some estimation techniques require a lot of effort and may not be worth the required resource investment to use them across the whole project, while others may not be accurate enough for particular types of activities.
Expert judgement is used to provide insights about the project environment and information learned from prior similar projects, for estimating duration. It can be used to determine what technique is to be used for which project activities.
Analogous estimating is a like-for-like estimation technique. It uses actual duration from prior similar projects to estimate the duration for the current project, and takes into account any known differences between the projects. This is also called Top-Down estimating.
Analogous estimating tends to be cheaper and quicker than other methods, but is less accurate. It tends to be used where there is limited detailed information about the project, e.g. during the early phases of the project.
Parametric estimating uses a statistical relationship between historical data and other variables to estimate activity parameters which can include duration, cost, and budget, e.g. if the resource can lay 40 meters of fibre optic cable per hour, then the duration needed to lay 10 kilometres can be estimated to be 250 hours (10,000 metres divided by 40 metres per hour). This estimation method can give a high level of accuracy depending on the validity of the data used.
3-point estimating originated with the Program Evaluation and Review Technique (PERT), and can be used to increase the accuracy of an activity duration estimate by considering its uncertainty and risk.
PERT uses 3 different estimates to define a range of possible activity durations:
- Most Likely (tM) - This duration estimate is based on a realistic appraisal of the likely resources assigned to the activity and their productivity, availability, dependencies and likely interruptions.
- Optimistic (tO) - This duration estimate is based on an analysis of the best case (shortest possible) scenario for the activity.
- Pessimistic (tP) - This duration estimate is based on an analysis of the worst case (longest possible) scenario for the activity.

BSBPMG512 Manage project time © Australis College Pty Ltd V040316 25
The expected duration (tE) of an activity can use these 3 range points and can be calculated in different ways based on the assumed distribution of values within that range.
2 of the more commonly used formulae are:
- Triangular Distribution where tE = (tO + tM + tP) / 3. - Beta Distribution where tE = (tO + 4tM + tP) / 6 (This calculation emphasises tM over
tO and tP, it was used in the original PERT technique).
Example: An estimate to complete an activity is:
3 weeks +5/- 2 days, (assuming 5 day weeks)
The tM is 15 days, tO is 13 days, and tP is 20 days.
Using triangular distribution, the estimate would be:
13+15+20 / 3 = 16 days
Using beta distribution, the estimate would be:
13 + (4*15) + 20 / 6 = 15 ½ days
Both methods give an estimate for activity duration, both of which can be valid. It is up to expert judgement to define what method of estimation is the best for the current project.
Reserve analysis considers the risks and uncertainties of the project schedule, and creates a reserve pool of time and resources that can be used to offset the issues that arise where no estimation was made.
- Contingency reserves are a part of the Schedule Baseline that are allocated for dealing with known risks and uncertainties within the project.
- Management reserves are used for unforeseen work that is still within the scope of the project. Management reserves are not included in the Schedule Baseline but are still a part of the overall project duration.

BSBPMG512 Manage project time © Australis College Pty Ltd V040316 26
Most projects will use a combination of estimation techniques rather than just using one for each activity.
All the inputs required to make the Schedule Baseline are now in place.
1.4 Develop Schedule Process
This process analyses the sequence of activities, their duration, resource requirements, and schedule constraints to create the Project Schedule that contains all the planned start and finish dates for all activities and milestones. (This is no simple task, in fact the Project management Institute (PMI) offers a separate certification for scheduling professionals (PMI_SP) so they can learn how to do this in the correct way).
Computer software is often used to assist the creation of the schedule. The benefit of using a software package is that, the software automatically recalculates any changes to the Project Schedule and updates it, saving hours of rework that would be required if it was to be updated manually.
BSBPMG512 Manage project time © Australis College Pty Ltd V040316 27
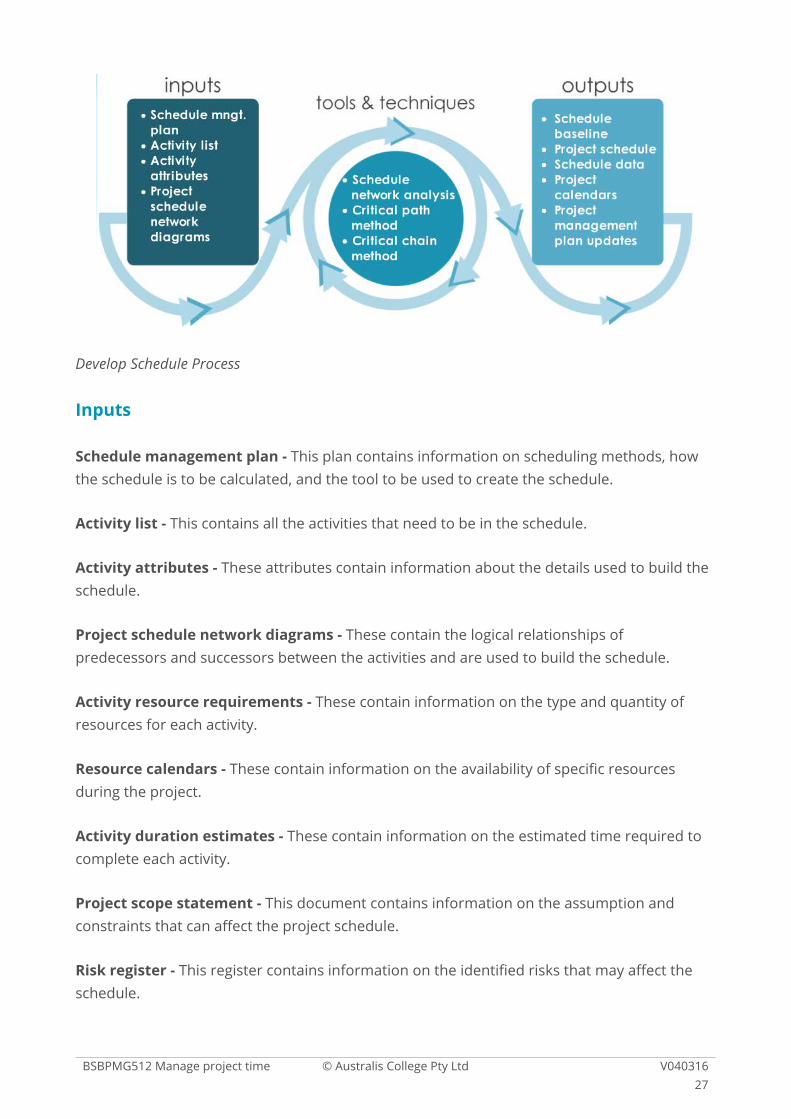
Develop Schedule Process
Inputs
Schedule management plan - This plan contains information on scheduling methods, how the schedule is to be calculated, and the tool to be used to create the schedule.
Activity list - This contains all the activities that need to be in the schedule.
Activity attributes - These attributes contain information about the details used to build the schedule.
Project schedule network diagrams - These contain the logical relationships of predecessors and successors between the activities and are used to build the schedule.
Activity resource requirements - These contain information on the type and quantity of resources for each activity.
Resource calendars - These contain information on the availability of specific resources during the project.
Activity duration estimates - These contain information on the estimated time required to complete each activity.
Project scope statement - This document contains information on the assumption and constraints that can affect the project schedule.
Risk register - This register contains information on the identified risks that may affect the schedule.

BSBPMG512 Manage project time © Australis College Pty Ltd V040316 28
Project staff assignments - These contain information on the resources assigned to each activity.
Resource breakdown structure - This contains details by which resource analysis and organisational reporting can be conducted.
Enterprise environmental factors - Factors that may influence the schedule include standards, communication channels, and the scheduling tool used to create the schedule.
Organisational process Assets - Assets that may influence the schedule include the scheduling methodology and project calendars.
Tools & Techniques
Schedule network analysis - This generates the Project Schedule Model. This analysis employs several techniques, e.g. the critical path method, critical chain method, what-if analysis, resource levelling, and resource optimisation to calculate the early and late start date, as well the early and late finish date for uncompleted project schedule activities.
Critical path method (CPM) - This will be discussed in detail in the next section, Develop Schedule Tools and Techniques.
Critical chain method (CCM) - This will be discussed in detail in the next section, Develop Schedule Tools and Techniques.
Resource optimisation techniques - This will be discussed in detail in the next section, Develop Schedule Tools and Techniques.
Modelling techniques – Examples of these include:
- What if Scenario Analysis tries to predict what would happen to the project schedule IF ‘x’ happens. (x could be a worker strike, late delivery of critical resources, etc.) A schedule network analysis can be used to calculate what would happen to the project schedule if x happened, and can be used to assess the project schedule feasibility under adverse conditions. This allows for the preparation of contingency plans to respond to x, should it occur.
- Simulation of the project schedule using different assumptions for the duration of activities, e.g. using the 3 point estimates from PERT. This gives a range of possible outcomes for the project duration.

BSBPMG512 Manage project time © Australis College Pty Ltd V040316 29
Leads and lags - This will be discussed in detail in the next section, Develop Schedule Tools and Techniques.
Schedule compression - This will be discussed in detail in the next section, Develop Schedule Tools and Techniques.
Scheduling tool(s) - This will be discussed in detail in the next section, Develop Schedule Tools and Techniques.
Outputs
Schedule Baseline - This will be discussed in detail in the next section, Develop Schedule Outputs.
Project Schedule - This will be discussed in detail in the next section, Develop Schedule Outputs.
Schedule Data - This information is collected and used to describe and control the schedule. The information collected includes the schedule milestones, schedule activities, activity attributes, identified assumptions and constraints, resource requirements by time, alternative schedules (best/worst case), and any contingency reserves.
Project Calendars - These identify the working days available for schedule activities, taking into account public holidays, weekends, etc.
Project Management Plan - Updates that maybe required include the Schedule Baseline and the Schedule Management Plan.
Project documents updates - Updates that may be required include Activity Resource Requirements, Risk Register, Activity Attributes, and calendars.
The Project Schedule and Schedule Baseline are the major outputs of this process and are created using various tool and techniques.

BSBPMG512 Manage project time © Australis College Pty Ltd V040316 30
Develop Schedule Tools & Techniques
Critical Path Method
The Critical Path Method (CPM) is used to calculate the minimum amount of time to complete a project. Any change in the time these tasks take, will affect the project completion date.
The critical path is the path of project activities that represent the longest path (time taken) through a project, but gives the shortest project length.
Each task is assigned the longest time, the normal time, and the shortest time – to complete. The normal time is used for the critical path (the shortest time is in the top middle box of each task, e.g. A = 5).
Using the diagram that follows, the Critical Path is A-C-D with a duration of 30 days (5+10+15) compared to A-B-D which is 25 days. A-C-D is the longest path in terms of estimated time. Activity B Resources could be assigned to Activity C if required, as Activity B has 5 days total float (5 days slack time).

BSBPMG512 Manage project time © Australis College Pty Ltd V040316 31
Critical Chain Method
The Critical chain method (CCM) is used to modify the project schedule to make allowances for limited resources and project uncertainties. It does this using time buffers that are added to the project schedule.
The resource constrained critical path is known as the critical chain. The Project Buffer is added at the end of the critical chain and Feeding Buffers are added at the end of activity sequences that are not on the critical chain.
Example: Allocation of a time buffer to debug software - Programmers try to write software without mistakes (bugs), however, experience shows that the larger and more complicated the software, the more bugs it will have. Time, therefore needs to be set aside to address the issues in the software even though it was not an intended activity.
Resource optimisation techniques are used to adjust the schedule model due to the demand and availability of resources. Techniques include:
- Resource Levelling - This modifies the start and finish dates based on resource constraints. The goal is to balance demand for a resource against its availability.
- Resource Smoothing - This adjusts the activities of the schedule so that the use of a resource does not exceed pre-defined resource limits.
BSBPMG512 Manage project time © Australis College Pty Ltd V040316 32
Leads and lags are used to refine the project schedule by adjusting the start time of successor activities:
- Leads can be used to advance successor activities. - Lags can be used to set the period of time to elapse between the predecessor and
successor.
(Refer to the diagram on Leads and Lags in section 1.2)
Schedule compression can be used to shorten the schedule duration without modifying the project scope. Examples include:
- Crashing where the estimated duration of an activity is shortened by adding extra resources (overtime, extra staff, paying extra to reduce delivery time, etc.). Crashing only works for activities on the critical path.
- Fast tracking where activities that normally occur in sequence are now performed in parallel, e.g. pouring the concrete slab for a building before completing all the architectural drawings.
Scheduling tool(s) tend to be computer-based and contain the schedule model, and calculate the start and finish dates of activities by taking into account activity durations, network diagrams, and resource availability.
Develop Schedule outputs
Schedule Baseline is the approved version of the schedule model and can be changed only through the formal change procedures. The Schedule Baseline becomes a part of the Project Management Plan.
The draft Schedule Baseline is submitted for approval to the relevant stakeholders and after approval, it becomes the basis for determining where the project is compared to where it should be.
The Project Schedule presents linked activities with planned dates, resources, durations, and milestones. The project schedule maybe represented as a summary (sometimes referred to as the master schedule or milestone schedule), or in detail.
The project schedule model is usually represented graphically in the form of presentations.

BSBPMG512 Manage project time © Australis College Pty Ltd V040316 33
Examples of presentations include:
- Bar Charts (also known as Gantt charts) have activities listed on the vertical axis and time on the horizontal axis. The activity duration is represented as a horizontal bar according to its start-finish date. Arrows between the horizontal bars represent the dependencies between linked activities. See the example of a Gantt chart on the next slide.
- Milestone Charts are similar to bar charts but only show the start or finish of major deliverables and key external interfaces.
- Project Schedule Network Diagrams are commonly presented in the activity-on-node format. They show the activities date information and logical relationships, as well as the critical path.

BSBPMG512 Manage project time © Australis College Pty Ltd V040316 34
2.0 Implement project schedule
Module Overview
The implementation of the project schedule is controlled and monitored by the Control Schedule process. This process can detect if there is a difference (variance) between where the project actually is compared to where it should be, and allow for any corrective actions required to put the schedule back on track.
At the end of this module, you will be able to:
- Implement mechanisms to measure, record, and report the progress of activities in relation to the agreed schedule.
- Conduct ongoing analysis to identify baseline variance. - Analyse and forecast the impact of changes on the schedule. - Review progress throughout the project life cycle and implement agreed schedule
changes. - Develop responses to potential or actual schedule changes and implement them to
maintain project objectives.
2.1 Measure, record & report activities progress
The schedule needs to be monitored to determine the actual project performance. This allows the Project Manager to make informed decisions and forecasts about the project schedule.
Control Schedule Process
Control Schedule Process
BSBPMG512 Manage project time © Australis College Pty Ltd V040316 35
Inputs
Project Management Plan - This plan contains the Schedule Management Plan (describes how the schedule will be monitored and controlled), and the Schedule Baseline (provides a reference point for comparison for project progress).
Project schedule - This contains information on the most recent version of the schedule with all the updates, completed and started activities.
Work performance data - This contains information on project progress, which activities have started, their progress, and completed activities, information on actual duration to complete, estimated remaining duration, and percentage complete.
Project calendars - These contain information on the working days available for schedule activities taking into account public holidays, weekends, etc.
Schedule data - This data is reviewed and updated during this process.
Organisational process Assets - Assets that can influence this process may include schedule related policies, procedures and guidelines, schedule control tools, and monitoring and reporting methods.
Tools & Techniques
Performance reviews - These measure, compare, and analyse schedule performance, e.g. actual start and finish dates, percentage complete, remaining work duration etc.
Techniques for performance reviews include:
- Trend Analysis which examines project performance over a set period of time. - Critical Path Method (CPM): Examining the progress of the critical path can help
determine schedule status. Any critical path variance will impact the project finish date. - Critical Chain Method (CCM): Comparing the buffer remaining with the buffer
needed to complete the project on the time path can help determine schedule status. This comparison can determine if corrective action is required.
- Earned Value Management (EVM): Schedule performance measurements are used to assess the magnitude of variation to the original schedule baseline, e.g. schedule variance (SV) and schedule performance index (SPI).
Project management software - This can keep track of the planned dates against the actual dates, and report any variances of progress against the baseline. This can then be used by the software to forecast the effects of changes on the project schedule model.

BSBPMG512 Manage project time © Australis College Pty Ltd V040316 36
Resource optimisation techniques - These involve the scheduling of activities due to the demand and availability of resources.
Modelling techniques - These use a range of scenarios to bring the schedule model back into line with the project management plan and the approved baseline.
Leads and lags - These are used to align project activities that are running late with the plan.
Schedule compression - This can be used to shorten the schedule duration of activities to align the schedule with the plan, e.g. fast tracking or crashing.
Scheduling tool and other project management software - These can be used to perform schedule network analysis and to generate an updated project schedule.
Outputs
Work performance information - Earned value management (EVM) metrics for Schedule variance and Schedule performance index (SPI) for WBS components (particularly work packages and control accounts) are documented and communicated to the appropriate stakeholders.
Schedule forecasts - These are estimates of the project’s future performance based on information about the project available at the time the forecast is made. Forecasts are based on work performance data from the project and include earned value performances that could impact the project’s future performance.
Change requests - These may be generated due to schedule analysis, progress reports, and any required changes to the project scope or project baseline. All change requests must go through the formal change control process.
Project management plan updates - These may include updates to the:
- Schedule Baseline - related to approved change requests to the Scope, activity resources, and activity duration. The Schedule Baseline may be updated due to compression (acceleration) techniques.
- Schedule Management Plan - may be updated due to a change in the way the schedule is managed.
- Cost Baseline - may be updated to reflect approved changes caused by the compression techniques.

BSBPMG512 Manage project time © Australis College Pty Ltd V040316 37
Project documents updates - The updates that may be required include:
- Schedule Data - Schedule network diagrams may need to be updated to reflect approved changes.
- Project Schedule – If the Schedule Data is updated, then a new updated Project Schedule will be generated to reflect these changes.
- Risk Register – This will be updated with the risk response, based on any new or modified risks generated by the compression techniques.
Organisational process assets - These updates that may be required include causes of variance, corrective action and why it was necessary, and other types of lessons learned from the project schedule control process.
The Control Schedule Process is used to monitor and update the project schedule and manages any updates to the project Schedule Baseline. This process runs on a continual basis throughout the project lifetime.
Monitoring of schedule activities include:
Performance reviews to measure, compare, and analyse schedule performance, e.g. actual start and finish dates, percentage complete, remaining work duration.
Techniques for performance reviews include:
- Trend Analysis - examines project performance over a set period of time. - Critical Path Method (CPM) - examines the progress of the critical path to help
determine the schedule status. Any critical path variance will impact the project finish date.
- Critical chain method (CCM) - comparing the buffer remaining to the buffer needed to complete the project on the time path can help determine schedule status. This comparison can determine if corrective action is required.
- Earned value management (EVM) Schedule performance measurements are used to assess the magnitude of variation to the original schedule baseline, e.g. schedule variance (SV) and schedule performance index (SPI).
Project management software - This can keep track of the planned dates against the actual dates, and report any variances of progress against the baseline. This can then be used by the software to forecast the effects of changes on the project schedule model.
This information is collated and reported to relevant stakeholders, usually graphically in the form of presentations, e.g. Bar Charts (also known as Gantt charts), Milestone Charts, and updated Project Schedule Network Diagrams.
BSBPMG512 Manage project time © Australis College Pty Ltd V040316 38
2.2 Identify baseline variance
Various methods are available for the task of monitoring and analysing the project schedule. These are essential to the Project Manager as they provide insights about where exactly the project is, compared to where it should be.
The Project Manager must select the appropriate schedule analysis tools that are in keeping with the size and complexity of the project. These tools are used to identify any schedule variations within the project. The PM must then evaluate alternative actions and take corrective action, if required.
Example: Due to a forecast time overrun for the production of glass windows for a new 27 story building, an extra 100 hours per week of overtime has been assigned to the production team. This will enable them to put production back within the approved schedule baseline.
The Schedule Baseline is the basis for comparison when identifying time variations within the project, e.g. to complete activities during the course of a project, time used is recorded in specific accounts and can be compared with the original time estimates.
Reasons for cost variations may include:
- Higher than estimated time for an activity. - Lower than expected project productivity - the project takes longer compared to the
estimated value. - Low productivity indicators can also be caused by insufficient training, lack of specified
resources, e.g. specialist equipment or tools. - Increases in labour times could indicate unscheduled re-work to correct quality
problems or changes to the scope.
Earned Value Management (EVM) is a methodology that combines scope (scope baseline), schedule (schedule baseline), and resource measurements (cost baseline) to assess the progress and performance of the project by creating an overall project performance baseline.
Planned Value (PV) is the estimated value of the work to be completed by your project within a specific time period, excluding any Management reserve. The Schedule Baseline is used for the Planned Value when calculating schedule variance.
Earned Value (EV) is the estimated value of the work actually completed by the project on the review date. It is often used to calculate the percentage of the project completed.
BSBPMG512 Manage project time © Australis College Pty Ltd V040316 39
Schedule Variance (SV) is a measurement of the schedule performance for a project, expressed as the difference between the earned value and the planned value. This can determine if the project is ahead or behind schedule. A positive SV indicates the project is ahead of schedule, whereas a negative SV indicates the project is behind schedule.
Schedule Variance = Earned Value - Planned Value
Schedule Variance percentage provides a percentage value of how much ahead or behind schedule the project is.
Schedule Variance % = Schedule Variance / Planned Value
Schedule Performance Index (SPI) measures the progress achieved against that which was planned. It is a measure of how well the project is using time. An SPI of <1 means that less work was completed than planned. An SPI of >1 means that more work has been completed than planned.
Schedule Performance Index = Earned Value / Planned Value
The information generated from these calculations will be placed in the scheduling reports and sent to the appropriate stakeholders for review.
2.3 Impact of changes to schedule
The Earned Value Management (EVM) method provides an understanding of where the project is compared to where it should be, and answers the questions “Is the project on track?” and “If not, what needs to change?”
The method for determining whether change is required is done by forecasting. The project team may develop a forecast for the total time to complete the project based on the time already taken, plus the estimated time to complete the remaining activities not yet completed. The Schedule Performance Index (SPI) can be taken into account in estimating the time required to complete the project.
Example: At week 10, a 40 week project has a SPI of 0.85 (<1, so the project is behind schedule). If no changes are made, and the time used remains the same, then the project is going to be about 7 weeks overdue if no corrective action is taken (40 weeks / SPI (0.85) = 47 weeks).
BSBPMG512 Manage project time © Australis College Pty Ltd V040316 40
This is when the project manager and the project team need to take corrective action, if possible. This issue will be reported to the sponsor and other relevant stakeholders, with any known causes and recommendations for actions, to correct the situation.
Important aspects of schedule control include:
- Determining the cause and degree of variance relative to the schedule baseline. - Estimating the implications of those variances on future work to be completed. - Deciding whether corrective or preventive action is required.
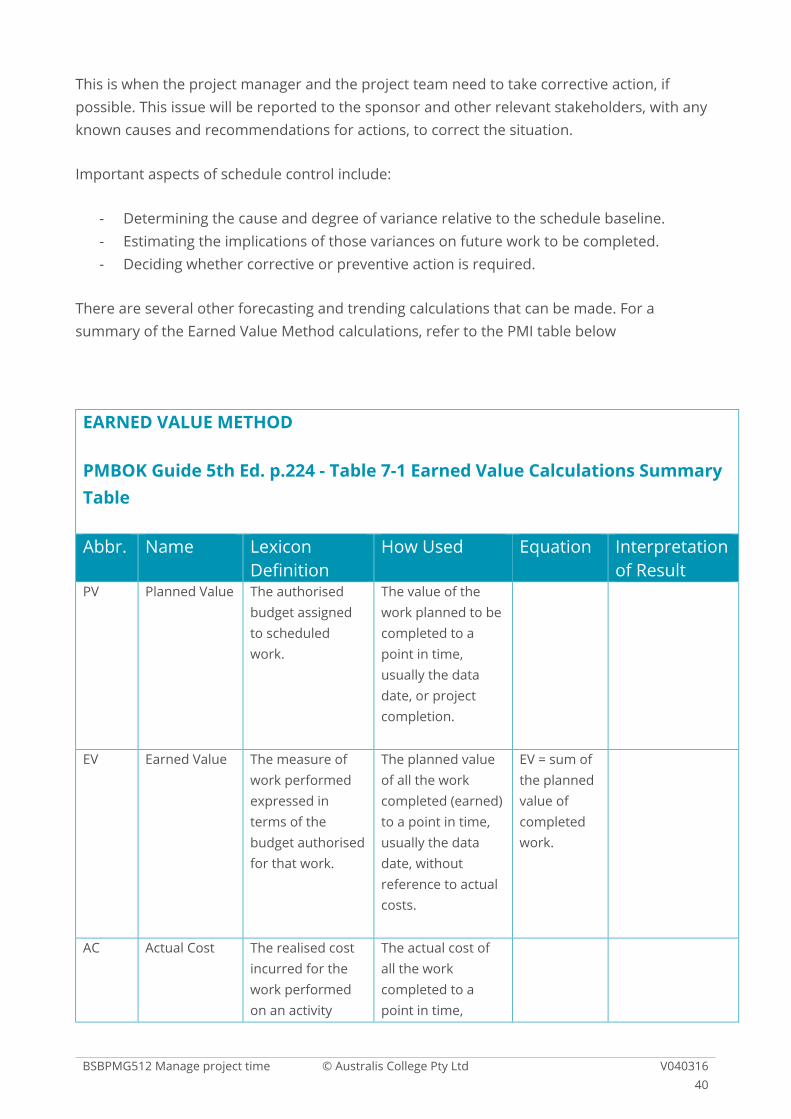
There are several other forecasting and trending calculations that can be made. For a summary of the Earned Value Method calculations, refer to the PMI table below
EARNED VALUE METHOD
PMBOK Guide 5th Ed. p.224 - Table 7-1 Earned Value Calculations Summary Table
Abbr. Name Lexicon Definition
How Used Equation Interpretation of Result
PV Planned Value The authorised budget assigned to scheduled work.
The value of the work planned to be completed to a point in time, usually the data date, or project completion.
EV Earned Value The measure of work performed expressed in terms of the budget authorised for that work.
The planned value of all the work completed (earned) to a point in time, usually the data date, without reference to actual costs.
EV = sum of the planned value of completed work.
AC Actual Cost The realised cost incurred for the work performed on an activity
The actual cost of all the work completed to a point in time,

BSBPMG512 Manage project time © Australis College Pty Ltd V040316 41
during a specific time period.
usually the data date.
BAC Budget at Completion
The sum of all budgets established for the work to be performed.
The value of total planned work, the project cost baseline.
CV Cost Variance The amount of budget deficit or surplus at a given point in time, expressed as the difference between the earned value and the actual cost.
The difference between the value of work completed to a point in time, usually the data date, and the actual costs to the same point in time.
CV = EV – AC
Positive = Under planned cost
Neutral = On planned cost
Negative = Over planned cost
SV Schedule Variance
The amount by which the project is ahead or behind the planned delivery date, at a given point in time, expressed as the difference between the earned value and the planned value.
The difference between the work completed to a point in time, usually the data date, and the work planned to be completed to the same point in time.
SV = EV – PV
Positive = Ahead of Schedule
Neutral = On schedule
Negative = Behind Schedule
VAC Variance at Completion
A projection of the amount of budget deficit or surplus, expressed as the difference between the budget at completion and the estimate at completion.
The estimated difference in cost at the completion of the project.
VAC = BAC – EAC
Positive = Under planned cost
Neutral = On planned cost
Negative = Over planned cost
CPI Cost
Performance
A measure of the cost efficiency of budgeted resources
A CPI of 1.0 means the project is
CPI = EV/AC Greater than 1.0 = Under planned

BSBPMG512 Manage project time © Australis College Pty Ltd V040316 42
Index
expressed as the ratio of earned value to actual cost.
exactly on budget, that the work
actually done so far is exactly the same as the cost so far. Other values
show the percentage of how much
costs are over or under the budgeted
amount for work accomplished.
cost
Exactly 1.0 = On planned cost
Less than 1.0 = Over planned cost
SPI Schedule
Performance
Index
A measure of schedule efficiency expressed as the ratio of earned value to planned value.
An SPI of 1.0 means that the project is exactly on schedule, that the work actually done so far is exactly the same as the work planned to be done so far. Other values show the percentage of how much costs are over or under the budgeted amount for work planned.
SPI = EV/PV Greater than 1.0 = Ahead of
schedule
Exactly 1.0 = On schedule
Less than 1.0 = Behind schedule
EAC Estimate At
Completion
The expected total cost of completing all work expressed as the sum of the actual cost to date and the estimate to complete.
If the CPI is expected to be the same for the remainder of the project, EAC can be calculated using:
If future work will be accomplished at
EAC = BAC/CPI
EAC = AC + BAC – EV

BSBPMG512 Manage project time © Australis College Pty Ltd V040316 43
the planned rate, use:
If the initial plan is no longer valid, use:
If both the CPI and SPI influence the remaining work, use:
EAC = AC + Bottom-up ETC
EAC = AC + [(BAC – EV)/
(CPI x SPI)]
ETC Estimate to
Complete
The expected cost to finish all the remaining project work.
Assuming work is proceeding on plan, the cost of completing the remaining authorised work can be calculated using:
Re-estimate the remaining work from the bottom up.
ETC = EAC – AC
ETC = Re-estimate
TCPI To Complete
Performance
Index
A measure of the cost performance that must be achieved with the remaining resources in order to meet a specified management goal,
expressed as the ratio of the cost to finish the outstanding work to the budget available.
The efficiency that must be maintained in order to complete on plan.
The efficiency that must be maintained in order to complete the current EAC.
TCPI = (BAC – EV)/(BAC – AC)
TCPI = (BAC – EV)/(EAC – AC)
Greater than 1.0 = Harder to
complete
Exactly 1.0 = Same to complete
Less than 1.0 = Easier to complete
Greater than 1.0 = Harder to
complete
Exactly 1.0 = Same to complete

BSBPMG512 Manage project time © Australis College Pty Ltd V040316 44
Less than 1.0 = Easier to complete
2.4 Review progress & implement schedule changes
The work performance information which includes the Earned Value Management (EVM) metrics (which are used to estimate the Schedule Variance and Schedule Performance Index for WBS components, particularly work packages and control accounts) is documented and communicated to the appropriate stakeholders. The Project Team can then review this information and make recommendations for any required corrective actions.
The Schedule Baseline can be changed in response to changes in the project environment or scope, opportunities to reduce the schedule, or recognising that the project will take longer than originally estimated.
No matter what the reason is for changing the Schedule Baseline, the change must first be agreed formally. The formal change control process is detailed in the Project Management Plan.
Implement Changes
If corrective action is required, the normal change request procedures are used. When implementing changes, consideration should be given to: what corrective action is needed, how is it implemented, and how will it be monitored to see if it had the desired effect?
BSBPMG512 Manage project time © Australis College Pty Ltd V040316 45
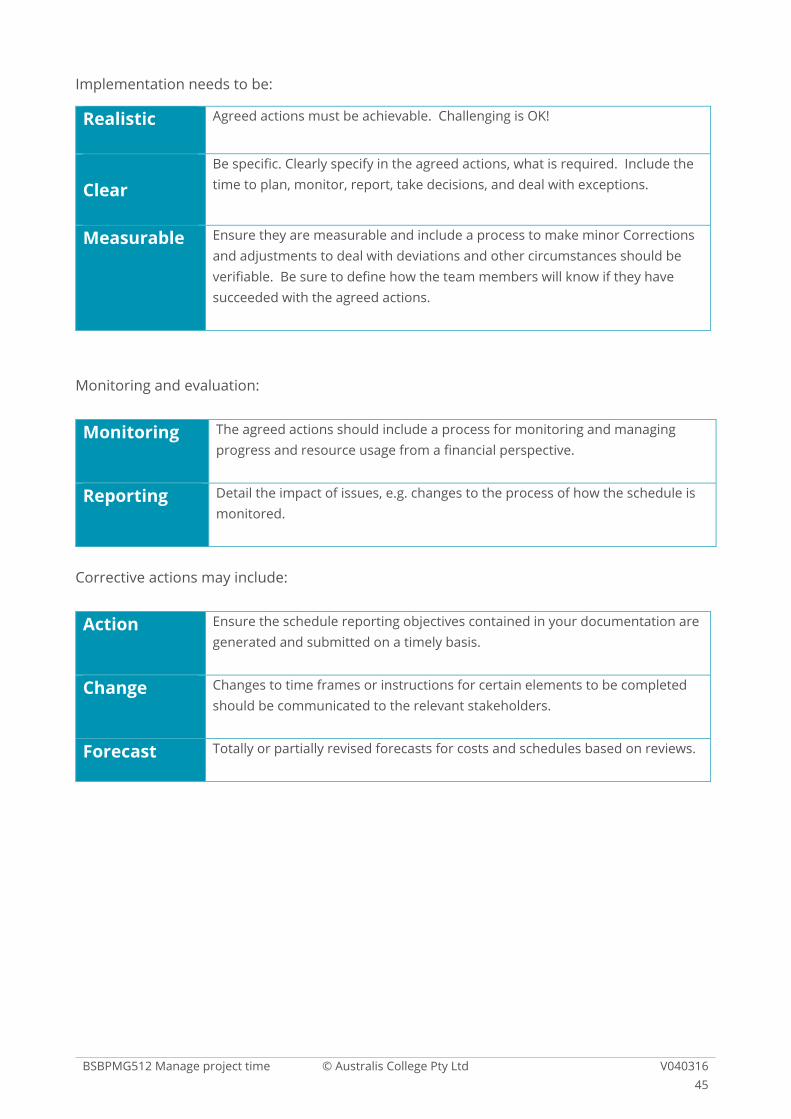
Implementation needs to be:
Realistic
Agreed actions must be achievable. Challenging is OK!
Clear
Be specific. Clearly specify in the agreed actions, what is required. Include the time to plan, monitor, report, take decisions, and deal with exceptions.
Measurable Ensure they are measurable and include a process to make minor Corrections and adjustments to deal with deviations and other circumstances should be verifiable. Be sure to define how the team members will know if they have succeeded with the agreed actions.
Monitoring and evaluation:
Monitoring
The agreed actions should include a process for monitoring and managing progress and resource usage from a financial perspective.
Reporting
Detail the impact of issues, e.g. changes to the process of how the schedule is monitored.
Corrective actions may include:
Action Ensure the schedule reporting objectives contained in your documentation are generated and submitted on a timely basis.
Change Changes to time frames or instructions for certain elements to be completed should be communicated to the relevant stakeholders.
Forecast Totally or partially revised forecasts for costs and schedules based on reviews.

BSBPMG512 Manage project time © Australis College Pty Ltd V040316 46
2.5 Develop responses to schedule changes
Project Managers have several tools and techniques at their disposal to implement agreed schedule changes. These include:
Schedule compression - This can be used to shorten the schedule duration of activities and align the schedule with the plan. This technique does not modify the project scope. Some examples include:
- Crashing where the estimated duration of an activity is shortened by adding extra resources (overtime, extra staff, paying extra to reduce delivery time, etc). Crashing only works for activities on the critical path as this reduces the overall time for the longest path.
- Fast tracking where activities that normally occur in sequence are now performed in parallel, e.g. pouring the concrete slab for a building before completing all the architectural drawings.
Modelling techniques - These use a range of scenarios that can be used to guide how to bring the schedule model back into line with the project management plan and the approved baseline.
Resource optimisation techniques - These involve scheduling of activities based on the demand and availability of resources.
Leads and lags - These are used to align project activities that are running late with the Schedule Baseline. This is also known as project acceleration.
REMEMBER: No changes to the schedule can be made without being agreed using the formal change request process.

BSBPMG512 Manage project time © Australis College Pty Ltd V040316 47
3.0 Assess time-management outcomes
Module Overview
A major review of all project activities including project costs occurs in the closure phase of the project. However, to stay on top of project changes or issues, all project processes need to be monitored and updated throughout the project.
At the end of this module, you will be able to:
- Review schedule performance records to determine the effectiveness of time-management activities.
- Identify and document time-management issues and recommend improvements.
3.1 Review schedule performance records
Reviewing the effectiveness of schedule control and management should be carried out throughout the lifecycle of a project. However, it is particularly important during project closure activities. One of the key indicators of project success is “Was the project completed within the time allocated?”
The review may affect the way all future projects have their schedules estimated. This process provides the Project Manager, and others responsible for the review process, time to reflect on the strengths, weaknesses, opportunities, threats, and areas for schedule management improvement used in the project.
Too often not enough time is allowed for this process, as the PM may have already been assigned a new project, and the team members dispersed to other duties unrelated to the project under review.
The review for the project schedule mainly looks at any variance between the estimated time and the actual time of completing a work package, control account, or any other project activity. The Schedule Variance (SV), the Schedule Performance Index (SPI), and any other relevant Earned Value Management (EVM) metrics are reviewed for this purpose.

BSBPMG512 Manage project time © Australis College Pty Ltd V040316 48
Project Schedule example
This portion of the Post Project Review describes the project’s planned schedule or timeline, and how the project measured against this plan. This information is helpful in identifying and understanding what may have contributed to project delays or allowed the project to complete early or on time.
This can then be used by the team members on future projects or referenced by other project teams for future projects. Archiving project information during the project closure phase is one of the best ways for an organisation to improve its project management methodologies and effectiveness.
The Cable Tech MicroFiber Project schedule called for a one year project with initiation beginning on January 1, 2011 and project closeout ending on December 31, 2011. There were initial concerns by the project team that the schedule would potentially slip due to the small number of resources assigned to the project. The chart below shows each phase of the project lifecycle, the planned schedule dates, and the actual completion dates of each phase.
Project Phase Scheduled Completion Actual Completion Comments Initiation January 15, 20xx January 15, 20xx Completed on time
Design February 28, 20xx February 28, 20xx Completed on time
Prototype Build April 30, 20xx April 30, 20xx Completed on time
Testing June 30, 20xx June 30, 20xx Completed on time
Trial Build/Install September 30, 20xx September 30, 20xx Completed on time
Transition to Ops November 30, 20xx November 30, 20xx Completed on time
Project Closure December 31, 20xx TBD Progressing on time

BSBPMG512 Manage project time © Australis College Pty Ltd V040316 49
Many Cable Tech projects do not complete a thorough project closure phase. This is usually due to earlier project phases completing late, which results in having to cut short or omit this important, final phase. The MicroFiber Project successfully completed each phase on time, which can be attributed to effective planning and communication, as well as Sponsor and executive level support for this important initiative. Throughout the project, there was a strong sense of cooperation across the organisation as the importance of this project was stressed and its benefits were realised.
During the initiation and planning phases, team members were concerned that inadequate resources were assigned to this project. However, due to the many similarities between MicroFiber and the previous product line, additional resources were not needed, and the assigned staff was adequate to complete all work packages within the planned timeframes.
The only project phase which encountered schedule problems was the prototype build phase. This was due to a cable line malfunctioning and a prototype cable having to be rebuilt. The project team was able to reallocate its resources and complete the rebuild within the planned timeframe.
(Piscopo 2013)
3.2 Review time-management issues
When a review of a process has shown that there is a better (improved) way to do it, that information should be recorded as a lesson learned.
Lessons learned are identified and recorded throughout the project, not just at the end of the project. They can be added to the Lessons Learned Knowledge Base as historical information that can guide the current and future projects.
Lessons learned seek to record:
- Events or issues within the project. - Which aspects of the project were affected (scope, cost, time, risk, etc.)? - The impact. - How they were resolved.
This allows future performance improvements of the current project or for new projects to be improved.
BSBPMG512 Manage project time © Australis College Pty Ltd V040316 50
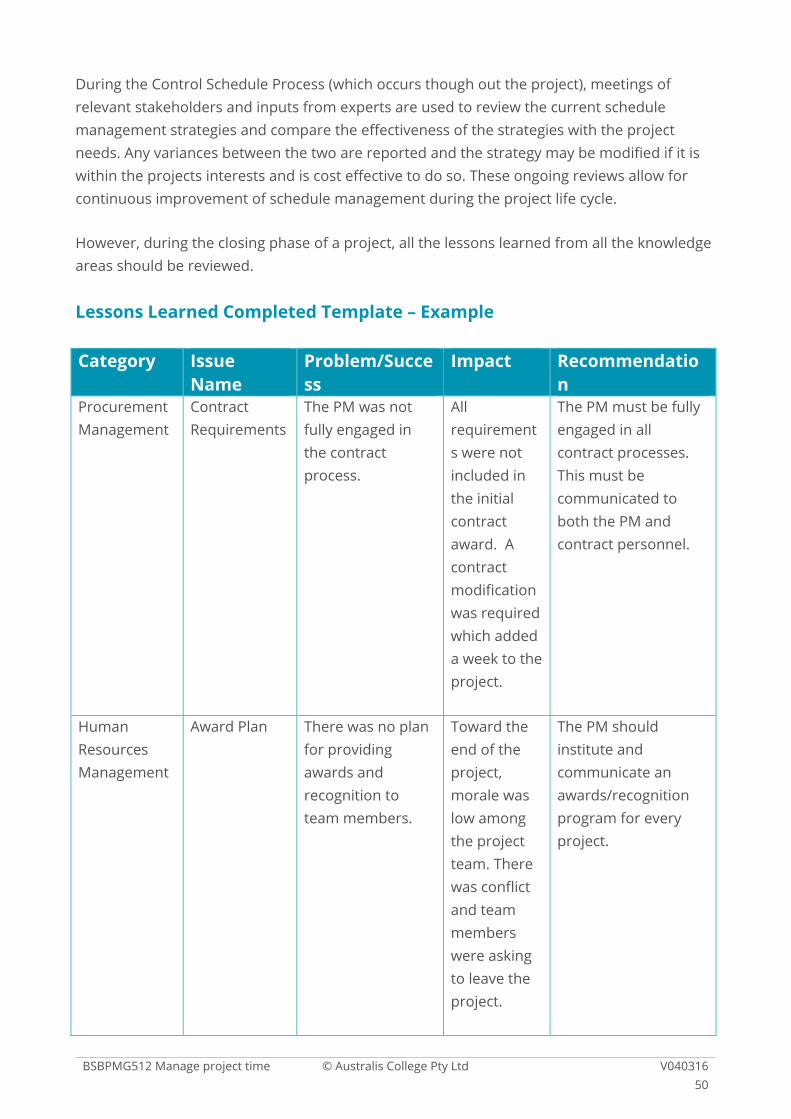
During the Control Schedule Process (which occurs though out the project), meetings of relevant stakeholders and inputs from experts are used to review the current schedule management strategies and compare the effectiveness of the strategies with the project needs. Any variances between the two are reported and the strategy may be modified if it is within the projects interests and is cost effective to do so. These ongoing reviews allow for continuous improvement of schedule management during the project life cycle.
However, during the closing phase of a project, all the lessons learned from all the knowledge areas should be reviewed.
Lessons Learned Completed Template – Example
Category Issue Name
Problem/Success
Impact Recommendation
Procurement Management
Contract Requirements
The PM was not fully engaged in the contract process.
All requirements were not included in the initial contract award. A contract modification was required which added a week to the project.
The PM must be fully engaged in all contract processes. This must be communicated to both the PM and contract personnel.
Human Resources Management
Award Plan There was no plan for providing awards and recognition to team members.
Toward the end of the project, morale was low among the project team. There was conflict and team members were asking to leave the project.
The PM should institute and communicate an awards/recognition program for every project.
BSBPMG512 Manage project time © Australis College Pty Ltd V040316 51
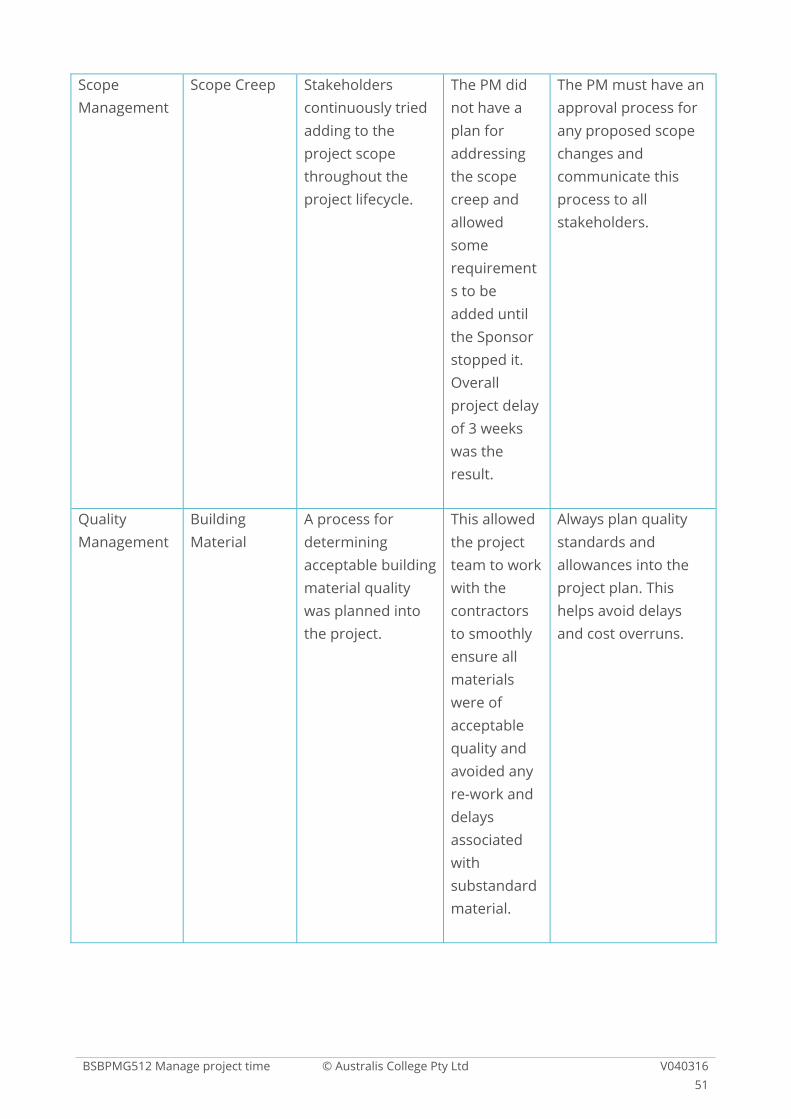
Scope Management
Scope Creep Stakeholders continuously tried adding to the project scope throughout the project lifecycle.
The PM did not have a plan for addressing the scope creep and allowed some requirements to be added until the Sponsor stopped it. Overall project delay of 3 weeks was the result.
The PM must have an approval process for any proposed scope changes and communicate this process to all stakeholders.
Quality Management
Building Material
A process for determining acceptable building material quality was planned into the project.
This allowed the project team to work with the contractors to smoothly ensure all materials were of acceptable quality and avoided any re-work and delays associated with substandard material.
Always plan quality standards and allowances into the project plan. This helps avoid delays and cost overruns.

BSBPMG512 Manage project time © Australis College Pty Ltd V040316 52
Schedule Management
Overtime budget not used to keep project schedule on track
Several team leaders failed to approve overtime to staff to keep their work packages to schedule. This was not identified until the end of phase 2 review.
A schedule overrun of 4 days was recorded which was outside of tolerance, and should have been dealt with the use of approved over time budget. This delayed 3 other teams.
Team leaders must have a clear understanding of the limits of their authority and that there is an overtime budget for a reason.
Risk Management
Zoning Approval
A risk was identified that there may be delays in receiving approval from the county zoning board. This was a success because it was identified early and planned for.
Impact was minimal because the PM included potential zoning delays into the project schedule.
Always consider external impacts on the project cost and schedule. This must be continuous throughout the project lifecycle.
(Piscopo 2013)
In this lessons learned table, there is one example of a lesson learned from schedule management. For the next phase of the project and for future projects, the team leaders will be informed of the limits of their authority and provided training, if necessary, on when to use extra resources like overtime from the project contingency funds.

BSBPMG512 Manage project time © Australis College Pty Ltd V040316 53
When reviewing the schedule lessons learned, it is about evaluating the success or otherwise of the project’s use of time management. Some questions that should be asked include:
- What worked well, what did not? - What needs to be done in a different way in the future and how will that be achieved? - What is the best practice and how do we achieve it? - What were the issues that were not anticipated, and why? - How were the project objectives affected by information and communication
processes? Were these effects effect positive or negative?
The lessons learned review can be conducted by the Project Manager with team members and/or the Sponsor. It can use a formal evaluation process with relevant stakeholders. The point of the review is to learn from the lessons and improve the information and communication processes for future projects.
The best way to approach these reviews is to:
- Be open and accurate in your review and try not to bring personalities into the discussion.
- Be objective and detail what actually happened in objective, non-emotive terms in the review and then focus on outcomes or suggested changes. Look at both the positive and negative results of the schedule management issues.
- Provide specific examples of issues instead of vague descriptions and referring to ‘unknowns’. Look closely at risk identification with schedule management.
- The purpose of open and accurate reviews is to focus on the future and learn from mistakes.
- Document successes and failures, best practices, and new and improved procedures that will assist in project successes. Make specific schedule management recommendations for application in similar future projects.
Information on improvements may be based on:
- Stakeholder satisfaction surveys about the impact on schedule management. - Input from teams, staff, and management. - Exception reports of schedule variances and when they occurred. - Reports on efficiency, performance, and quality of schedule management.
The bottom line in any review is to ask the following questions, “What did the organisation get for the money and other resources spent in completing the project?” and “Did it represent value to the organisation?”

BSBPMG512 Manage project time © Australis College Pty Ltd V040316 54
Unit Completion / Outcome
You have now completed the unit Manage Project Time. It involves determining and implementing the project schedule, and assessing time-management outcomes.
You are now able to:
- Determine the project schedule. - Implement the project schedule. - Assess time-management outcomes.

BSBPMG512 Manage project time © Australis College Pty Ltd V040316 55
References
- Hartley, S. 2008. Project Management: Principles, Processes and Practices. 2nd ed. Pearson Education Australia, Frenchs Forest NSW.
- Pearson, N., Larson, E. W. & Gray, C. F. 2013. Project Management in Practice. McGraw-Hill Education, NSW, Australia.
- Piscopo, M. 2013. Lessons learned template. [ONLINE] Available at: http://www.projectmanagementdocs.com/. [June 2014].
- Piscopo, M. 2013. Post project review template. [ONLINE] Available at: http://www.projectmanagementdocs.com/. [June 2014].
- Project Management Institute 2013. A Guide to the Project Management Body of Knowledge (PMBoK® Guide). 5th ed. Project Management Institute, Newton Square, PA.


![Chapter [4] Strategic Planning Strategic planning is the process to determining organizational strategy. It involves making decisions and allocating](https://img.pdfslide.us/doc/110x75/56649d0b5503460f949de62d/chapter-4-strategic-planning-strategic-planning-is-the-process-to-determining.jpg)


![CLINICAL EVIDENCE GUIDE EARLY WARNING SCORES · rate, body temperature) and observations (e.g., level of consciousness [AVPU]). Determining an EWS involves assigning a number between](https://img.pdfslide.us/doc/110x75/5e818736f3e2174e900651d8/clinical-evidence-guide-early-warning-scores-rate-body-temperature-and-observations.jpg)