Embed Size (px)
Citation preview

Page 2
TABLE OF CONTENTS
The statements contained in this supplemental may include forward-looking statements within the meaning of the federal securities law. These forward-looking statements include statements relating to, amongothers things, achievement of strategic targets, expectations for our operating results, business and financial condition, business and our growth prospects, as well as statements that are generally accompanied bywords such as believes, anticipates, expects, estimates, should, seeks, intends, proposed, planned, outlook, remain confident, and goal or similar expressions. Although Liberty believes that the expectations reflectedin such forward-looking statements are based on reasonable assumptions, it can give no assurance that its expectations will be achieved. As forward-looking statements, these statements involve risks, uncertaintiesand other factors that could cause actual results to differ materially from the expected results. These risks, uncertainties and other factors include, without limitation, uncertainties affecting real estate businessgenerally (such as entry into new leases, renewals of leases and dependence on tenants’ business operations), risks relating to the integration of the operations of entities that we have acquired or may acquire, risksrelating to our plans for disposing of certain properties, risks relating to financing arrangements and sales of securities, possible environmental liabilities, risks relating to leverage and debt service (including availabilityof financing terms acceptable to the company and sensitivity of the company’s operations and financing arrangements to fluctuations in interest rates), dependence on the primary markets in which the company’sproperties are located, the existence of complex regulations relating to status as a REIT and the adverse consequences of the failure to qualify as a REIT, risks relating to litigation, including without limitation litigationinvolving entities that we have a acquired or may acquire, and the potential adverse impact of market interest rates on the market price for the company’s securities, and other risks and uncertainties detailed in thecompany’s filings with the Securities and Exchange Commission. The company assumes no obligation to update or supplement forward-looking statements that become untrue because of subsequent events.
NEWS RELEASE 3
HIGHLIGHTS 6
FINANCIAL INFORMATION Consolidated Balance Sheets 7 Consolidated Statements of Comprehensive Income 8 Funds from Operations and Adjusted Funds from Operations 9 Adjusted EBITDA 10
OPERATIONS Portfolio Profile 11 Lease Analysis 16 Lease Expirations 19 Top Ten Largest Tenants 21 Same Store Properties 22 Fully Stabilized Properties 23
REAL ESTATE INVESTMENTS Completed Development Properties 24 Development Starts 25 Development Properties 26 Acquisitions 28 Dispositions 29 Unconsolidated Joint Ventures 30
CAPITALIZATION Debt & Preferred Unit Analysis 31 Debt Statistics & Ratios 32 Debt Covenants & Credit Ratings 33
GUIDANCE 34
NET ASSET VALUE COMPONENTS 35
NON-GAAP FINANCIAL MEASURES AND OTHER DEFINED TERMS 36
SECOND QUARTER 2017 SUPPLEMENTAL

NEWS RELEASE
SECOND QUARTER 2017 SUPPLEMENTAL
Inquiries: Jeanne Leonard, Liberty Property Trust, 610.648.1704
Liberty Property Trust Announces Second Quarter 2017 Results
Malvern, PA, July 25, 2017 - Liberty Property Trust announced financial and operating results for the quarter ended June 30, 2017.
Management Comments”Liberty’s results at mid-year reflect the continued strength of the industrial real estate market,” said Bill Hankowsky, chairman and chiefexecutive officer. “We anticipate consistently strong leasing volumes, rent growth and occupancy gains for the remainder of the year.” Highlights for Second Quarter 2017
▪ Net income available to common shareholders $0.35 per diluted share▪ NAREIT Funds from Operations $0.65 per diluted share▪ Same store operating income increased by 1.4%, over prior year quarter▪ Same store operating income for the industrial portfolio increased by 2.7%▪ Portfolio occupancy on a commenced basis at quarter-end 95.6%, and on a signed basis 97.2%▪ 6.5 million square feet of lease transactions completed▪ Rents on industrial leases up 11.9%▪ Rents on office leases up 5.7%▪ $73.6 million in development starts
Earnings Guidance▪ Liberty increased Funds from Operations guidance range for 2017 to be $2.49 - $2.55 per diluted share
Financial ResultsNet income: Net income available to common shareholders for the second quarter of 2017 was $51.4 million, or $0.35 per diluted share,compared to $49.6 million, or $0.34 per diluted share, for the second quarter of 2016.
For the six months ended June 30, 2017, net income available to common shareholders was $94.4 million, or $0.64 per diluted share,compared to $107.2 million, or $0.73 per diluted share, for the first six months of 2016.
Funds from Operations: The company uses the National Association of Real Estate Investment Trusts (“NAREIT”) definition of Funds fromOperations (“FFO”) as an operating measure of the company’s financial performance. A reconciliation of U.S. GAAP net income to NAREITFFO is included in the financial data tables accompanying this press release.
NAREIT FFO available to common shareholders for the second quarter of 2017 was $98.2 million, or $0.65 per diluted share, compared to$102.2 million, or $0.68 per diluted share, for the second quarter of 2016.
Net income and NAREIT FFO for the second quarter of 2017 were impacted by gain on the sale of non-depreciable assets of $3.8 million($0.025 per diluted share).
FFO available to common shareholders for the six months ended June 30, 2017 was $188.8 million, or $1.25 per diluted share, compared to$195.3 million, or $1.30 per diluted share, for the first six months of 2016.
Operating PerformanceSame Store Performance: Property level operating income for same store properties increased by 0.7% on a cash basis and by 1.4% on astraight line basis for the second quarter of 2017, compared to the same quarter in 2016. For the six months ended June 30, 2017, propertylevel operating income for same store properties increased by 1.1% on a cash basis and on a straight line basis, compared to the same periodin 2016.
▪ Same store operating income for the industrial portfolio increased by 2.1% on a cash basis and 2.7% on a straight line basis. For thesix months ended June 30, 2017, industrial same store operating income increased by 2.3% on a cash basis and 2.4% on a straightline basis, compared to the same period in 2016.

NEWS RELEASE
SECOND QUARTER 2017 SUPPLEMENTAL
▪ Same store operating income for the office portfolio decreased by 6.6% on a cash basis and by 5.5% on a straight line basis. For thesix months ended June 30, 2017, office same store operating income decreased by 5.2% on a cash basis and on a straight line basis,compared to the same period in 2016.
Occupancy: At June 30, 2017, Liberty’s operating portfolio of 98.9 million square feet was 95.6% occupied, compared to 96.1% at the end ofthe first quarter 2017. During the quarter, Liberty completed lease transactions totaling 6.5 million square feet of space, and occupancy on asigned but not yet commenced basis is 97.2%.
Industrial Portfolio: The primary driver of Liberty’s results is the performance of its industrial portfolio. The 92.3 million square footindustrial portfolio was 95.9% leased at quarter-end, compared to 96.6% for the previous quarter. Industrial distribution rents increased11.9% on renewal and replacement leases signed during the quarter. 96% of these leases have built-in rent escalators.
Office Portfolio: Occupancy of Liberty’s 6.6 million square foot office portfolio was 91.5%, up from 88.4% from the previous quarter. Duringthe quarter, a previously announced lease for 170,000 square feet of office space commenced. This lease resulted in a significant increase inoffice occupancy, as well as a higher than usual tenant improvement costs. Office rents increased 5.7% on renewal and replacement leasessigned in the office portfolio, and 97% of these leases contain built-in rent escalators.
Real Estate InvestmentsDevelopment Deliveries: In the second quarter, Liberty brought into service four wholly-owned development properties for a totalinvestment of $65.2 million. The properties contain 724,000 square feet of leasable space and were 100% occupied as of the end of thequarter. The yield on these properties at June 30, 2017 was 7.9%.
Development Starts: In the second quarter, Liberty began development of two wholly-owned properties totaling 1,026,000 square feet ofleasable space at a projected investment of $73.6 million. The properties consist of:
▪ 7157 Ridge Road, Hanover, MD, 220,000 square feet, 100% leased▪ 100 Carolina Way, Carlisle, PA 805,600 square feet for inventory
Real Estate AcquisitionsDuring the second quarter, Liberty purchased one 101,000 square foot industrial building currently under development in Gardena, CA for$20.1 million.
Real Estate DispositionsDuring the second quarter, Liberty sold two suburban office buildings totaling 94,000 square feet for $8.1 million.
2017 OutlookA reconciliation of projected NAREIT FFO per share to projected U.S. GAAP net income available to common shareholders per share for 2017is below (all amounts projected). Additional information on assumptions underlying this guidance is included in Liberty’s second quartersupplemental financial report on the company’s website.
About the CompanyLiberty Property Trust (NYSE:LPT) is a leader in commercial real estate, serving customers in the United States and United Kingdom, throughthe development, acquisition, ownership and management of superior office and industrial properties. Liberty's 99 million square footoperating portfolio includes 560 properties which provide office, distribution and light manufacturing facilities to 1,200 tenants.
Revised 2017 Outlook Previous 2017 Outlook
Net income available to common shareholders per diluted share $1.99 - $2.19 $1.42 - $1.75
Depreciation and amortization of unconsolidated joint ventures 0.05 - 0.07 0.06 - 0.08
Depreciation and amortization 1.18 - 1.20 1.24 - 1.28
Gain on property dispositions (1) (0.74) - (0.92) (0.30) - (0.60)
Noncontrolling interest share of addbacks 0.01 - 0.01 0.00 - 0.01
NAREIT FFO, per diluted share $2.49 - $2.55 $2.42 - $2.52
(1) Includes equity share of gain on disposition of unconsolidated joint ventures.
NEWS RELEASE
SECOND QUARTER 2017 SUPPLEMENTAL
Additional information about the company, including Liberty’s Quarterly Supplemental Package with detailed financial information, isavailable in the Investors section of the Company’s web site at www.libertyproperty.com. If you are unable to access the web site, a copy ofthe supplemental package may be obtained by contacting Liberty by phone at 610-648-1704, or by e-mail to [email protected].
Liberty will host a conference call during which management will discuss second quarter results on Tuesday, July 25, 2017, at 1 p.m. EasternTime. To access the conference call, please dial 855-277-7530. The passcode needed for access is 46839831. A replay of the call will beavailable until August 25, 2017, by dialing 1-855-859-2056 using the same passcode as above. The call can also be accessed via the Interneton the Investors page of Liberty’s web site at www.libertyproperty.com.
The statements contained in this press release may include forward-looking statements within the meaning of the federal securities law.These forward-looking statements include statements relating to, among others things, achievement of strategic targets, expectations for ouroperating results, business and financial condition, business and our growth prospects, as well as statements that are generally accompanied by words such as “believes,” “anticipates,” “expects,” “estimates,” “should,” “seeks,” “intends,” “proposed,” “planned,”“outlook,” “remain confident,” and “goal” or similar expressions. Although Liberty believes that the expectations reflected in such forward-looking statements are based on reasonable assumptions, it can give no assurance that its expectations will be achieved. As forward-lookingstatements, these statements involve risks, uncertainties and other factors that could cause actual results to differ materially from theexpected results. These risks, uncertainties and other factors include, without limitation, uncertainties affecting real estate businessgenerally (such as entry into new leases, renewals of leases and dependence on tenants’ business operations), risks relating to our ability tomaintain and increase property occupancy and rental rates, risks relating to the continued repositioning of the Company's portfolio, risksrelating to construction and development activities, risks relating to acquisition and disposition activities, risks relating to the integration ofthe operations of entities that we have acquired or may acquire, risks relating to joint venture relationships and any possible need toperform under certain guarantees that we have issued or may issue in connection with such relationships, risks related to propertiesdeveloped by the Company on a fee basis, risks associated with tax abatement, tax credit programs, or other government incentives,possible environmental liabilities, risks relating to leverage and debt service (including availability of financing terms acceptable to theCompany and sensitivity of the Company's operations and financing arrangements to fluctuations in interest rates), dependence on theprimary markets in which the Company's properties are located, the existence of complex regulations relating to status as a REIT and theadverse consequences of the failure to qualify as a REIT, risks relating to litigation and the potential adverse impact of market interest rateson the market price for the Company's securities, and other risks and uncertainties detailed in the company’s filings with the Securities andExchange Commission. The company assumes no obligation to update or supplement forward-looking statements that become untruebecause of subsequent events.
# # #

HIGHLIGHTS
SECOND QUARTER 2017 SUPPLEMENTAL
EARNINGS
Quarter Ended Year to Date
6/30/2017 6/30/2016 6/30/2017 6/30/2016
Net income per share - diluted $ 0.35 $ 0.34 $ 0.64 $ 0.73
NAREIT FFO per share - diluted $ 0.65 $ 0.68 $ 1.25 $ 1.30
Dividend per share $ 0.40 $ 0.475 $ 0.80 $ 0.95
OPERATIONS
Straight Line Cash
Quarter ended6/30/2017 Year to Date 2017
Quarter ended6/30/2017 Year to Date 2017
Same store NOI growth 1.4 % 1.1 % 0.7 % 1.1 %
Same store NOI growth - Industrial 2.7 % 2.4 % 2.1 % 2.3 %
Same store NOI growth- Office (5.5)% (5.2)% (6.6)% (5.2)%
Rent growth 9.6 % 13.1 % 0.9 % 4.0 %
Rent growth - Industrial 11.9 % 14.9 % 3.5 % 5.8 %
Rent growth - Office 5.7 % 6.1 % (4.0)% (3.1)%
OCCUPANCY (includes joint ventures at 100%)
6/30/2017 3/31/2017 12/31/2016
Total Company 95.6% 96.1% 96.4 %
Industrial 95.9% 96.6% 96.7 %
Office 91.5% 88.4% 92.0 %
REAL ESTATE INVESTMENTS (includes joint ventures at 100%)
Quarter ended 6/30/2017
# of bldgs Square Feet OccupancyInvestment
(in 000s)Development starts (1) 2 1,025,600 21.5% $ 73,579
Development completions 4 723,505 100.0% 65,198
Acquisitions 1 100,580 — (2) 20,069
Dispositions 2 93,502 29.4% 8,068
6/30/2017
# of bldgs Square Feet Percent LeasedInvestment
(in 000s)Development under construction 30 8,358,017 52.7% $ 1,600,700
(1) Occupancy for development starts represents percent pre-leased.
(2) This property was under development when acquired. It is 100% pre-leased.
Page 6

CONSOLIDATED BALANCE SHEETS
SECOND QUARTER 2017 SUPPLEMENTAL
(unaudited and in thousands)
June 30, 2017 December 31, 2016
Assets Real estate:
Land and land improvements $ 1,094,121 $ 1,094,470
Building and improvements 4,562,908 4,501,921
Less: accumulated depreciation (995,032) (940,115)
Operating real estate 4,661,997 4,656,276
Development in progress 410,027 267,450
Land held for development 351,933 336,569
Net real estate 5,423,957 5,260,295
Cash and cash equivalents 14,748 43,642
Restricted cash 18,115 12,383
Accounts receivable 14,509 13,994
Deferred rent receivable 120,124 109,245
Deferred financing and leasing costs, net 159,112 153,393
Investments in and advances to unconsolidated joint ventures 268,346 245,078
Assets held for sale 2,731 4,548
Prepaid expenses and other assets 137,993 150,235
Total assets $ 6,159,635 $ 5,992,813
Liabilities
Mortgage loans, net $ 271,851 $ 276,650
Unsecured notes, net 2,281,650 2,280,286
Credit facility 177,000 —
Accounts payable 56,188 65,914
Accrued interest 21,718 21,878
Dividend and distributions payable 60,334 71,501
Other liabilities 222,697 206,124
Total liabilities 3,091,438 2,922,353
Noncontrolling interest 7,537 7,537
Equity Shareholders' equity
Common shares of beneficial interest 147 147
Additional paid-in capital 3,666,703 3,655,910
Accumulated other comprehensive loss (45,332) (56,031)
Distributions in excess of net income (619,929) (596,635)
Total shareholders' equity 3,001,589 3,003,391
Noncontrolling interest - operating partnership 54,170 54,631
Noncontrolling interest - consolidated joint ventures 4,901 4,901
Total equity 3,060,660 3,062,923
Total liabilities, noncontrolling interest - operating partnership and equity $ 6,159,635 $ 5,992,813
Page 7
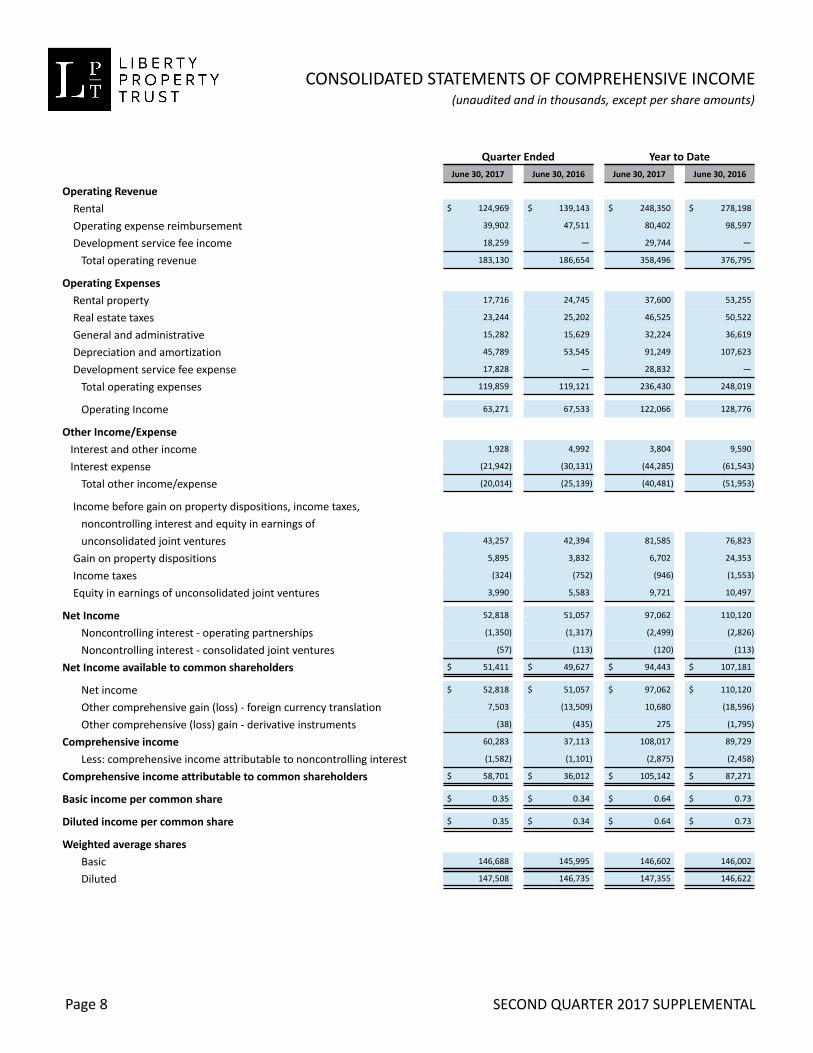
CONSOLIDATED STATEMENTS OF COMPREHENSIVE INCOME
SECOND QUARTER 2017 SUPPLEMENTAL
(unaudited and in thousands, except per share amounts)
Quarter Ended Year to DateJune 30, 2017 June 30, 2016 June 30, 2017 June 30, 2016
Operating Revenue
Rental $ 124,969 $ 139,143 $ 248,350 $ 278,198
Operating expense reimbursement 39,902 47,511 80,402 98,597
Development service fee income 18,259 — 29,744 —
Total operating revenue 183,130 186,654 358,496 376,795
Operating Expenses
Rental property 17,716 24,745 37,600 53,255
Real estate taxes 23,244 25,202 46,525 50,522
General and administrative 15,282 15,629 32,224 36,619
Depreciation and amortization 45,789 53,545 91,249 107,623
Development service fee expense 17,828 — 28,832 —
Total operating expenses 119,859 119,121 236,430 248,019
Operating Income 63,271 67,533 122,066 128,776
Other Income/Expense
Interest and other income 1,928 4,992 3,804 9,590
Interest expense (21,942) (30,131) (44,285) (61,543)
Total other income/expense (20,014) (25,139) (40,481) (51,953)
Income before gain on property dispositions, income taxes,
noncontrolling interest and equity in earnings of
unconsolidated joint ventures 43,257 42,394 81,585 76,823
Gain on property dispositions 5,895 3,832 6,702 24,353
Income taxes (324) (752) (946) (1,553)
Equity in earnings of unconsolidated joint ventures 3,990 5,583 9,721 10,497
Net Income 52,818 51,057 97,062 110,120
Noncontrolling interest - operating partnerships (1,350) (1,317) (2,499) (2,826)
Noncontrolling interest - consolidated joint ventures (57) (113) (120) (113)
Net Income available to common shareholders $ 51,411 $ 49,627 $ 94,443 $ 107,181
Net income $ 52,818 $ 51,057 $ 97,062 $ 110,120
Other comprehensive gain (loss) - foreign currency translation 7,503 (13,509) 10,680 (18,596)
Other comprehensive (loss) gain - derivative instruments (38) (435) 275 (1,795)
Comprehensive income 60,283 37,113 108,017 89,729
Less: comprehensive income attributable to noncontrolling interest (1,582) (1,101) (2,875) (2,458)
Comprehensive income attributable to common shareholders $ 58,701 $ 36,012 $ 105,142 $ 87,271
Basic income per common share $ 0.35 $ 0.34 $ 0.64 $ 0.73
Diluted income per common share $ 0.35 $ 0.34 $ 0.64 $ 0.73
Weighted average shares
Basic 146,688 145,995 146,602 146,002
Diluted 147,508 146,735 147,355 146,622
Page 8

SECOND QUARTER 2017 SUPPLEMENTAL
Quarter Ended Year to Date
June 30, 2017 June 30, 2016 June 30, 2017 June 30, 2016
NAREIT FFO
Reconciliation of net income available to common shareholders to NAREITFFO available to common shareholders:
Net income available to common shareholders $ 51,411 $ 49,627 $ 94,443 $ 107,181
Adjustments:
Depreciation and amortization of unconsolidated joint ventures 2,295 2,262 4,620 4,938
Depreciation and amortization 45,343 53,142 90,421 106,894
Gain on property dispositions / impairment - real estate assets ofunconsolidated joint ventures — (153) — (1,993)
Gain on property dispositions / impairment - real estate assets (2,108) (3,832) (2,915) (24,353)
Noncontrolling interest share in addback for depreciation and amortizationand gain on property dispositions / impairment - real estate assets (1,065) (1,213) (2,155) (2,017)
NAREIT FFO available to common shareholders - basic 95,876 99,833 184,414 190,650
Noncontrolling interest share in addback for depreciation and amortizationand gain on property dispositions / impairment - real estate assets 1,065 1,213 2,155 2,017
Noncontrolling interest excluding preferred unit distributions 1,232 1,199 2,263 2,590
NAREIT FFO available to common shareholders - diluted $ 98,173 $ 102,245 $ 188,832 $ 195,257
NAREIT FFO available to common shareholders - basic per share $ 0.65 $ 0.68 $ 1.26 $ 1.31
NAREIT FFO available to common shareholders - diluted per share $ 0.65 $ 0.68 $ 1.25 $ 1.30
AFFO
NAREIT FFO available to common shareholders - diluted $ 98,173 $ 102,245 $ 188,832 $ 195,257
Straight line rent adjustment, net of related bad debt expense (4,979) (3,179) (9,946) (7,603)
Share - based compensation expense 2,324 1,615 8,864 8,802
Tenant Improvements and Lease Transaction Costs (18,213) (18,515) (28,012) (29,928)
Non-reimbursed Capital Expenditures (4,527) (2,871) (4,933) (4,459)
Gain on sale of non-depreciable assets (3,801) — (3,817) —
Gain on debt extinguishment — (3,331) — (4,243)
AFFO available to common shareholders - diluted $ 68,977 $ 75,964 $ 150,988 $ 157,826
Reconciliation of weighted average shares:
Weighted average common shares - all basic calculations 146,688 145,995 146,602 146,002
Dilutive shares for long term compensation plans 820 740 753 620
Diluted shares for net income calculations 147,508 146,735 147,355 146,622
Weighted average common units 3,528 3,539 3,528 3,539
Diluted shares for NAREIT FFO calculations 151,036 150,274 150,883 150,161
(in thousands, except per share amounts)
Page 9
FUNDS FROM OPERATIONSADJUSTED FUNDS FROM OPERATIONS

ADJUSTED EBITDA
SECOND QUARTER 2017 SUPPLEMENTAL
(in thousands)
Quarter Ended Year to Date
June 30, 2017 June 30, 2016 June 30, 2017 June 30, 2016
Net Income $ 52,818 $ 51,057 $ 97,062 $ 110,120
Depreciation and amortization expense 45,789 53,545 91,249 107,623
Interest expense 21,942 30,131 44,285 61,543
Gain on property dispositions (5,895) (3,832) (6,702) (24,353)
Income taxes 324 752 946 1,553
Share-based compensation expense 2,324 1,615 8,864 8,802
Adjusted EBITDA $ 117,302 $ 133,268 $ 235,704 $ 265,288
Page 10

PORTFOLIO PROFILE - TOTAL COMPANY
SECOND QUARTER 2017 SUPPLEMENTAL
MarketsNumber ofProperties Square Feet
Percent ofSF Occupancy Net Rent
Net Rent perOccupied SF
Percent ofNet Rent
WHOLLY OWNED
Operating:
Arizona 2,390,625 2.6% 93.1% $ 15,619,577 $ 7.02 3.3%
Atlanta 2,090,709 2.2% 93.2% 7,468,941 3.83 1.6%
Carolinas 8,163,114 8.7% 98.1% 36,387,430 4.54 7.8%
Chicago/Milwaukee 7,222,412 7.7% 93.7% 29,164,814 4.31 6.3%
Cincinnati/Columbus/Indianapolis 3,948,376 4.2% 99.6% 13,146,497 3.34 2.8%
Dallas 2,202,641 2.4% 100.0% 9,971,290 4.53 2.1%
Houston 7,439,119 8.0% 89.0% 39,551,386 5.97 8.5%
Lehigh Valley/Central PA 25,920,067 27.8% 98.0% 127,356,986 5.01 27.3%
Maryland 3,708,262 4.0% 95.2% 18,288,792 5.18 3.9%
Minnesota 2,984,807 3.2% 85.9% 12,117,060 4.73 2.6%
New Jersey 825,985 0.9% 100.0% 3,356,800 4.06 0.7%
Orlando 2,350,932 2.5% 94.5% 15,265,122 6.87 3.3%
Philadelphia 1,417,853 1.5% 98.2% 30,983,925 22.25 6.6%
Richmond/Hampton Roads 4,519,206 4.9% 95.6% 19,551,867 4.52 4.2%
South Florida 2,437,157 2.6% 98.3% 17,029,707 7.11 3.6%
Southeastern PA 2,618,893 2.8% 93.0% 37,616,921 15.44 8.1%
Southern California 2,089,212 2.2% 92.3% 9,463,290 4.91 2.0%
Tampa 1,805,494 1.9% 99.5% 9,103,833 5.07 2.0%
United Kingdom 1,518,861 1.6% 98.6% 12,479,910 8.33 2.7%
Washington D.C. 146,472 0.2% 66.6% 2,682,925 27.50 0.6%
Total Operating Properties 497 85,800,197 91.9% 95.7% $ 466,607,073 $ 5.68 100.0%
Development:
Arizona 894,847 1.0%
Atlanta 235,234 0.3%
Carolinas 574,220 0.6%
Chicago/Milwaukee 95,962 0.1%
Dallas 562,468 0.6%
Houston 415,272 0.4%
Lehigh Valley/Central PA 1,905,600 2.0%
Maryland 436,000 0.4%
New Jersey 182,000 0.2%
Philadelphia 266,971 0.3%
South Florida 536,520 0.6%
Southern California 256,843 0.3%
United Kingdom 206,865 0.2%
Total Development Properties 27 6,568,802 7.0%
Redevelopment:
Atlanta 247,000 0.3%
Maryland 125,469 0.1%
Southeastern PA 380,974 0.4%
Washington D.C. 290,762 0.3%
Total Redevelopment Properties 10 1,044,205 1.1%
Total Wholly Owned Properties 534 93,413,204 100.0%
Page 11

PORTFOLIO PROFILE - TOTAL COMPANY
SECOND QUARTER 2017 SUPPLEMENTAL
Markets
Numberof
PropertiesPercentOwned Square Feet
Percentof SF Occupancy Net Rent
Net Rentper
OccupiedSF
Percent ofNet Rent
JOINT VENTURES AT 100%
Operating:
Chicago/Milwaukee 25% 4,857,179 32.6% 93.9% $ 16,271,539 $ 3.57 14.3%
New Jersey 25% 4,502,278 30.3% 99.2% 22,396,902 5.01 19.7%
Orlando 50% 1,505,353 10.1% 88.5% 7,452,921 5.59 6.5%
Philadelphia 20% 1,253,876 8.5% 99.6% 42,490,898 34.01 37.3%
United Kingdom 20% 488,786 3.3% 78.2% 8,894,621 23.28 7.8%
Washington D.C. 25% 451,284 3.1% 93.7% 16,465,244 38.93 14.4%
Total Operating Properties 63 13,058,756 87.9% 95.1% $ 113,972,125 $ 9.18 100.0%
Development:
New Jersey 25% 302,400 2.0%
Orlando 50% 154,400 1.1%
Philadelphia 20% 1,332,415 9.0%
Total Development Properties 3 1,789,215 12.1%
Total Joint Venture Properties 66 14,847,971 100.0%
SUMMARY
Operating properties 560 98,858,953 91.3% 95.6% $ 580,579,198 $ 6.14
Development properties 30 8,358,017 7.7%
Redevelopment 10 1,044,205 1.0%
Total Company 600 108,261,175 100.0%
Joint ventures at 100%
Page 12

PORTFOLIO PROFILE - INDUSTRIAL PROPERTIES
SECOND QUARTER 2017 SUPPLEMENTAL
MarketsNumber ofProperties Square Feet
Percent ofSF Occupancy Net Rent
Net Rent perOccupied SF
Percent ofNet Rent
WHOLLY OWNED
Operating:
Arizona 1,821,010 2.1% 90.9% $ 6,550,264 $ 3.96 1.7%
Atlanta 2,090,709 2.4% 93.2% 7,468,941 3.83 1.9%
Carolinas 8,163,114 9.3% 98.1% 36,387,430 4.54 9.2%
Chicago/Milwaukee 7,222,412 8.2% 93.7% 29,164,814 4.31 7.4%
Cincinnati/Columbus/Indianapolis 3,948,376 4.5% 99.6% 13,146,497 3.34 3.3%
Dallas 2,202,641 2.5% 100.0% 9,971,290 4.53 2.5%
Houston 7,232,311 8.2% 90.9% 38,622,931 5.87 9.8%
Lehigh Valley/Central PA 25,920,067 29.5% 98.0% 127,356,986 5.01 32.3%
Maryland 3,708,262 4.2% 95.2% 18,288,792 5.18 4.6%
Minnesota 2,639,807 3.0% 84.1% 10,654,560 4.80 2.7%
New Jersey 825,985 0.9% 100.0% 3,356,800 4.06 0.9%
Orlando 2,200,181 2.5% 94.5% 13,580,945 6.54 3.4%
Philadelphia 625,571 0.7% 100.0% 8,666,259 13.85 2.2%
Richmond/Hampton Roads 4,519,206 5.2% 95.6% 19,551,867 4.52 5.0%
South Florida 2,437,157 2.8% 98.3% 17,029,707 7.11 4.3%
Southeastern PA 552,797 0.6% 94.9% 6,476,024 12.34 1.6%
Southern California 2,089,212 2.4% 92.3% 9,463,290 4.91 2.4%
Tampa 1,805,494 2.1% 99.5% 9,103,833 5.07 2.3%
United Kingdom 1,380,878 1.6% 100.0% 9,719,349 7.04 2.5%
Total Industrial Operating Properties 447 81,385,190 92.7% 96.0% $ 394,560,579 $ 5.05 100.0%
Development:
Arizona 658,716 0.8%
Atlanta 235,234 0.3%
Carolinas 574,220 0.6%
Chicago/Milwaukee 95,962 0.1%
Dallas 562,468 0.6%
Houston 415,272 0.5%
Lehigh Valley/Central PA 1,905,600 2.2%
Maryland 436,000 0.5%
New Jersey 182,000 0.2%
South Florida 536,520 0.6%
Southern California 256,843 0.3%
United Kingdom 206,865 0.2%
Total Industrial DevelopmentProperties 24 6,065,700 6.9%
Redevelopment:
Atlanta 247,000 0.3%
Maryland 125,469 0.1%
Total Industrial RedevelopmentProperties 2 372,469 0.4%
Total Wholly Owned IndustrialProperties 473 87,823,359 100%
Page 13

PORTFOLIO PROFILE - INDUSTRIAL PROPERTIES
SECOND QUARTER 2017 SUPPLEMENTAL
MarketsNumber ofProperties
PercentOwned
SquareFeet
Percent ofSF Occupancy Net Rent
Net Rentper
OccupiedSF
Percent ofNet Rent
JOINT VENTURES AT 100%
Operating:
Chicago/Milwaukee 25% 4,857,179 42.9% 93.9% $ 16,271,539 $ 3.57 35.3%
New Jersey 25% 4,502,278 39.8% 99.2% 22,396,902 5.01 48.6%
Orlando 50% 1,505,353 13.3% 88.5% 7,452,921 5.59 16.1%
Total Industrial OperatingProperties 46 10,864,810 96.0% 95.4% $ 46,121,362 $ 4.45 100.0%
Development:
New Jersey 25% 302,400 2.7%
Orlando 50% 154,400 1.3%
Total Industrial DevelopmentProperties 2 456,800 4.0%
Total Joint Venture IndustrialProperties 48 11,321,610 100.0%
SUMMARY
Operating properties 493 92,250,000 93.0% 95.9% $440,681,941 $ 4.98
Development properties 26 6,522,500 6.6%
Redevelopment properties 2 372,469 0.4%
Total Industrial Properties 521 99,144,969 100.0%
Joint ventures at 100%
Page 14

PORTFOLIO PROFILE - OFFICE PROPERTIES
SECOND QUARTER 2017 SUPPLEMENTAL
MarketsNumber ofProperties
PercentOwned Square Feet
Percent ofSF Occupancy Net Rent
Net Rentper
Occupied SFPercent ofNet Rent
WHOLLY OWNED
Operating:
Arizona 569,615 10.2% 100.0% $ 9,069,313 $ 15.92 12.6%
Houston 206,808 3.7% 21.6% 928,455 20.82 1.3%
Minnesota 345,000 6.2% 100.0% 1,462,500 4.24 2.0%
Orlando 150,751 2.7% 94.6% 1,684,177 11.81 2.4%
Philadelphia 792,282 14.2% 96.8% 22,317,666 29.10 31.0%
Southeastern PA 2,066,096 36.9% 92.5% 31,140,897 16.29 43.2%
United Kingdom 137,983 2.5% 85.1% 2,760,561 23.50 3.8%
Washington D.C. 146,472 2.6% 66.6% 2,682,925 27.50 3.7%
Total Office Operating Properties 50 4,415,007 79.0% 90.5% $ 72,046,494 $ 18.03 100.0%
Development:
Arizona 236,131 4.2%
Philadelphia 266,971 4.8%
Total Office Developmentproperties 3 503,102 9.0%
Redevelopment:
Southeastern PA 380,974 6.8%
Washington D.C. 290,762 5.2%
Total Office RedevelopmentProperties 8 671,736 12.0%
Total Office Wholly OwnedProperties 61 5,589,845 100.0%
JOINT VENTURES AT 100%
Operating:
Philadelphia 20% 1,253,876 35.5% 99.6% $ 42,490,898 $ 34.01 62.6%
United Kingdom 20% 488,786 13.9% 78.2% 8,894,621 23.28 13.1%
Washington D.C. 25% 451,284 12.8% 93.7% 16,465,244 38.93 24.3%
Total Office Operating Properties 17 2,193,946 62.2% 93.6% $ 67,850,763 $ 33.03 100.0%
Philadelphia 20% 1,332,415 37.8%
Total Office DevelopmentProperties 1 1,332,415 37.8%
Total Joint Venture OfficeProperties 18 3,526,361 100.0%
SUMMARY
Operating properties 67 6,608,953 72.5% 91.5% $ 139,897,257 $ 23.12
Development properties 4 1,835,517 20.1%
Redevelopment properties 8 671,736 7.4%
Total Office Properties 79 9,116,206 100.0%
Joint Ventures at 100%
Page 15
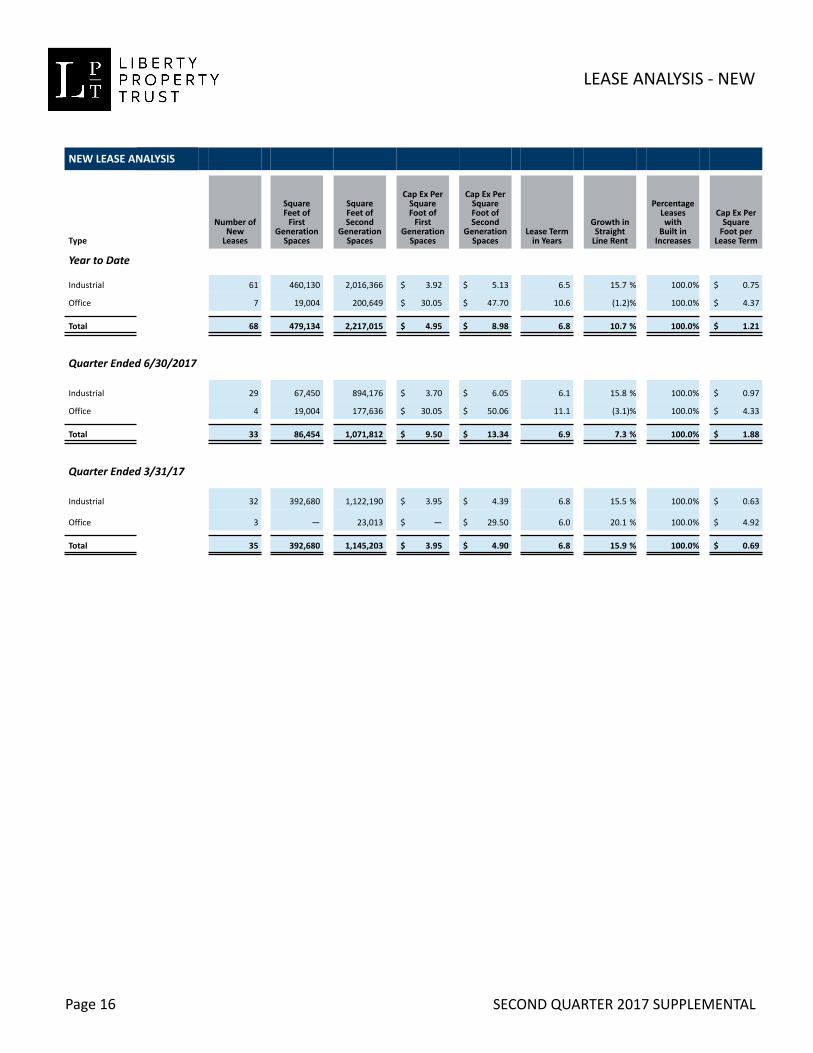
LEASE ANALYSIS - NEW
SECOND QUARTER 2017 SUPPLEMENTAL
NEW LEASE ANALYSIS
Type
Number ofNew
Leases
SquareFeet of
FirstGeneration
Spaces
SquareFeet ofSecond
GenerationSpaces
Cap Ex PerSquareFoot of
FirstGeneration
Spaces
Cap Ex PerSquareFoot ofSecond
GenerationSpaces
Lease Termin Years
Growth inStraight
Line Rent
PercentageLeaseswith
Built inIncreases
Cap Ex PerSquare
Foot perLease Term
Year to Date
Industrial 61 460,130 2,016,366 $ 3.92 $ 5.13 6.5 15.7 % 100.0% $ 0.75
Office 7 19,004 200,649 $ 30.05 $ 47.70 10.6 (1.2)% 100.0% $ 4.37
Total 68 479,134 2,217,015 $ 4.95 $ 8.98 6.8 10.7 % 100.0% $ 1.21
Quarter Ended 6/30/2017
Industrial 29 67,450 894,176 $ 3.70 $ 6.05 6.1 15.8 % 100.0% $ 0.97
Office 4 19,004 177,636 $ 30.05 $ 50.06 11.1 (3.1)% 100.0% $ 4.33
Total 33 86,454 1,071,812 $ 9.50 $ 13.34 6.9 7.3 % 100.0% $ 1.88
Quarter Ended 3/31/17
Industrial 32 392,680 1,122,190 $ 3.95 $ 4.39 6.8 15.5 % 100.0% $ 0.63
Office 3 — 23,013 $ — $ 29.50 6.0 20.1 % 100.0% $ 4.92
Total 35 392,680 1,145,203 $ 3.95 $ 4.90 6.8 15.9 % 100.0% $ 0.69
Page 16

LEASE ANALYSIS - RENEWAL
SECOND QUARTER 2017 SUPPLEMENTAL
RENEWAL ANALYSIS
Expiring Leases Leases RenewedPercentage
SquareFeet
Renewed
Cap Ex perSquare
FootLease Term
in Years
Growth inStraight
Line Rent
PercentageLeases
with Builtin
Increases
Cap Ex PerSquare
Foot perLease TermType Number
SquareFeet Number
SquareFeet
Year to Date
Industrial 160 9,283,511 94 5,515,607 59.4% $ 1.53 4.6 14.5% 96.9% $ 0.33
Office 27 598,956 15 249,773 41.7% $ 11.84 10.2 11.2% 95.2% $ 1.16
Total 187 9,882,467 109 5,765,380 58.3% $ 1.98 4.9 14.1% 96.6% $ 0.41
Quarter Ended 6/30/2017
Industrial 69 4,765,087 37 2,668,338 56.0% $ 1.52 4.9 10.5% 94.3% $ 0.31
Office 19 310,516 13 229,951 74.1% $ 12.38 10.7 11.8% 94.9% $ 1.16
Total 88 5,075,603 50 2,898,289 57.1% $ 2.38 5.4 10.8% 94.5% $ 0.44
Quarter Ended 3/31/2017
Industrial 91 4,518,424 57 2,847,269 63.0% $ 1.54 4.3 18.5% 99.3% $ 0.36
Office 8 288,440 2 19,822 6.9% $ 5.57 3.9 4.7% 100.0% $ 1.45
Total 99 4,806,864 59 2,867,091 59.6% $ 1.57 4.3 18.0% 99.3% $ 0.36
Page 17

LEASE ANALYSIS - COMBINED
SECOND QUARTER 2017 SUPPLEMENTAL
SECOND GENERATION AND RENEWAL ANALYSIS
TypeTotal Square
FeetCap Ex per
Square Foot
Growth inStraight Line
Rent
PercentageLeases with
Built inIncreases
Year to Date
Industrial 7,531,973 $ 2.49 14.9% 97.8%
Office 450,422 $ 27.81 6.1% 97.1%
Total 7,982,395 $ 3.92 13.1% 97.6%
Quarter ended 6/30/2017
Industrial 3,562,514 $ 2.65 11.9% 95.9%
Office 407,587 $ 28.8 5.7% 96.8%
Total 3,970,101 $ 5.34 9.6% 96.2%
Quarter ended 3/31/2017
Industrial 3,969,459 $ 2.35 17.8% 99.5%
Office 42,835 $ 18.43 11.6% 100.0%
Total 4,012,294 $ 2.52 17.5% 99.5%
Page 18

LEASE EXPIRATIONS
SECOND QUARTER 2017 SUPPLEMENTAL
(by type)
Square Feet Net Rent per Square Foot (at end of lease term)
Year of Expiration Total Industrial Office Total Industrial Office
WHOLLY OWNED - TOTAL
2017 (remaining) 3,170,403 3,096,621 73,782 $ 4.90 $ 4.80 $ 9.31
2018 10,217,887 9,942,857 275,030 5.23 4.82 20.04
2019 12,986,358 12,757,063 229,295 5.54 5.24 22.44
2020 13,389,014 13,060,485 328,529 5.94 5.50 23.06
2021 7,883,345 7,709,454 173,891 6.00 5.69 19.59
Thereafter 34,474,532 31,559,677 2,914,855 7.86 6.37 23.92
Total LeasedSquare Feet 82,121,539 78,126,157 3,995,382 $ 6.56 $ 5.72 $ 23.04
Total Square Feet 85,800,197 81,385,190 4,415,007
JOINT VENTURES - TOTAL
2017 (remaining) 626,466 529,289 97,177 $ 8.33 $ 5.07 $ 26.08
2018 2,134,273 1,792,002 342,271 9.30 4.33 35.32
2019 856,642 783,062 73,580 7.38 5.35 28.94
2020 2,226,448 2,176,621 49,827 4.66 4.15 26.84
2021 600,009 500,146 99,863 10.58 5.45 36.28
Thereafter 5,971,230 4,579,715 1,391,515 13.27 5.44 39.01
Total LeasedSquare Feet 12,415,068 10,360,835 2,054,233 $ 10.26 $ 4.95 $ 36.99
Total Square Feet 13,058,756 10,864,810 2,193,946
PORTFOLIO - TOTAL
2017 (remaining) 3,796,869 3,625,910 170,959 $ 5.47 $ 4.84 $ 18.84
2018 12,352,160 11,734,859 617,301 5.93 4.74 28.51
2019 13,843,000 13,540,125 302,875 5.66 5.25 24.02
2020 15,615,462 15,237,106 378,356 5.75 5.31 23.56
2021 8,483,354 8,209,600 273,754 6.32 5.68 25.68
Thereafter 40,445,762 36,139,392 4,306,370 8.66 6.26 28.80
Total LeasedSquare Feet 94,536,607 88,486,992 6,049,615 $ 7.04 $ 5.63 $ 27.78
Total Square Feet 98,858,953 92,250,000 6,608,953
Page 19

LEASE EXPIRATIONS
SECOND QUARTER 2017 SUPPLEMENTAL
(by city)
SQUARE FEET
Markets2017
(remaining) 2018 2019 2020 2021 Thereafter
WHOLLY OWNED
Arizona 55,574 83,029 189,608 73,781 180,420 1,642,325
Atlanta 19,999 352,752 262,501 347,727 295,570 669,751
Carolinas 444,885 1,287,169 1,073,305 1,262,203 1,156,703 2,784,469
Chicago/Milwaukee 175,725 914,010 386,733 2,149,848 88,613 3,052,085
Cincinnati/Columbus/Indianapolis 85,800 1,844,982 1,003,600 135,456 387,929 473,433
Dallas 268,071 184,251 329,992 227,825 483,416 709,086
Houston 401,110 735,195 1,649,330 639,875 583,167 2,610,922
Lehigh Valley/Central PA 691,966 531,678 4,865,083 5,385,271 2,332,095 11,603,474
Maryland 250,581 492,328 308,545 197,843 59,842 2,222,308
Minnesota 44,780 127,412 340,892 532,635 180,472 1,337,898
New Jersey — 204,369 — 209,106 — 412,510
Orlando 177,812 272,961 421,123 96,046 306,662 946,094
Philadelphia — 5,082 28,276 22,170 3,769 1,333,198
Richmond/Hampton Roads 158,223 1,281,854 948,266 637,329 400,397 895,394
South Florida 265,526 206,922 346,850 359,303 403,131 812,989
Southeastern PA 62,742 201,590 316,274 440,440 207,995 1,207,441
Southern California — 44,507 373,771 172,500 230,981 1,107,447
Tampa 58,965 575,619 96,597 460,973 168,131 436,978
United Kingdom 6,897 855,397 12,024 6,537 409,716 207,757
Washington D.C. 1,747 16,780 33,588 32,146 4,336 8,973
Total Leased Square Feet 3,170,403 10,217,887 12,986,358 13,389,014 7,883,345 34,474,532
JOINT VENTURES
Chicago/Milwaukee 223,005 973,760 54,375 2,083,897 251,151 975,752
New Jersey 219,502 706,819 228,687 92,724 215,623 3,003,063
Orlando 86,782 111,423 500,000 — 33,372 600,900
Philadelphia 14,449 29,702 16,414 — 1,123 1,187,504
United Kingdom 79,157 58,429 51,850 49,827 42,329 100,473
Washington D.C. 3,571 254,140 5,316 — 56,411 103,538
Total Leased Square Feet 626,466 2,134,273 856,642 2,226,448 600,009 5,971,230
Page 20

TOP TEN LARGEST TENANTS
SECOND QUARTER 2017 SUPPLEMENTAL
(by type)
Square Feet(1) Percent of Net Rent(2)
INDUSTRIAL TENANTS
Uline, Inc. 1,683,876 2.5%
Amazon.com 2,710,370 2.2%
Home Depot U.S.A., Inc. 1,318,590 1.7%
The Procter & Gamble Distributing LLC 1,692,159 1.5%
Kellogg Sales Company 1,561,460 1.3%
XPO Last Mile, Inc. 1,825,525 1.3%
Wakefern Food Corp. 1,029,600 1.2%
Geodis Logistics LLC 1,317,906 1.2%
Ryder Integrated Logistics, Inc. 1,200,000 1.1%
The Clorox Company 1,081,720 0.9%
15,421,206 14.9%
OFFICE TENANTS
The Vanguard Group, Inc. 1,094,970 4.2%
Comcast Corporation 1,203,610 1.7%
GlaxoSmithKline LLC 207,779 1.6%
United States of America 757,172 1.2%
The Pennsylvania Hospital 153,242 0.9%
Yellow Book USA, Inc. 154,820 0.7%
Deutsche Post DHL Group 312,813 0.6%
Franklin Square Holdings, LP 80,050 0.5%
Centene Management Company, LLC 116,857 0.4%
Iroko Intermediate Holdings, Inc. 67,816 0.3%
4,149,129 12.1%
TOTAL 19,570,335 27.0%
(1) Joint Ventures included at 100%
(2) Joint Ventures included at equity share.
Page 21

SAME STORE PROPERTIES
SECOND QUARTER 2017 SUPPLEMENTAL
(dollars in thousands)
TOTAL COMPANYQuarter Ended Year to Date
6/30/2017 6/30/2016 % Change 6/30/2017 6/30/2016 % Change
Number of Properties 472 472 472 472
Square Feet 79,075,380 79,075,380 79,075,380 79,075,380
Average Occupancy 95.6% 95.9% 96.0% 95.8%
Rental Revenue $ 109,768 $ 109,091 0.6 % $ 218,907 $ 217,557 0.6 %
Operating Expenses: Rental Property Expense 16,642 16,511 34,838 35,795
Real Estate Taxes 19,221 18,296 38,100 36,528
Operating Expense Recovery (35,914) (34,072) (72,235) (70,503)
Unrecovered Operating Expenses (51) 735 703 1,820
NOI - Straight Line Basis 109,819 108,356 1.4 % 218,204 215,737 1.1 %
Less Straight Line Rent 3,472 2,761 6,679 6,424
NOI - Cash Basis $ 106,347 $ 105,595 0.7 % $ 211,525 $ 209,313 1.1 %
INDUSTRIALQuarter Ended Year to Date
6/30/2017 6/30/2016 % Change 6/30/2017 6/30/2016 % Change
Number of Properties 428 428 428 428
Square Feet 75,286,857 75,286,857 75,286,857 75,286,857
Average Occupancy 95.9% 96.1% 96.3% 96.1%
Rental Revenue $ 92,668 $ 90,898 1.9 % $ 184,896 $ 181,518 1.9 %
Operating Expenses: Rental Property Expense 11,579 11,682 24,444 25,300
Real Estate Taxes 16,976 16,163 33,638 32,247
Operating Expense Recovery (28,825) (27,433) (57,817) (56,356)
Unrecovered Operating Expenses (270) 412 265 1,191
NOI - Straight Line Basis 92,938 90,486 2.7 % 184,631 180,327 2.4 %
Less Straight Line Rent 2,605 2,033 5,193 4,850
NOI - Cash Basis $ 90,333 $ 88,453 2.1 % $ 179,438 $ 175,477 2.3 %
OFFICEQuarter Ended Year to Date
6/30/2017 6/30/2016 % Change 6/30/2017 6/30/2016 % Change
Number of Properties 44 44 44 44
Square Feet 3,788,523 3,788,523 3,788,523 3,788,523
Average Occupancy 89.7% 92.1% 89.3% 89.2%
Rental Revenue $ 17,100 $ 18,193 (6.0)% $ 34,011 $ 36,039 (5.6)%
Operating Expenses: Rental Property Expense 5,063 4,829 10,394 10,495
Real Estate Taxes 2,245 2,133 4,462 4,281
Operating Expense Recovery (7,089) (6,639) (14,418) (14,147)
Unrecovered Operating Expenses 219 323 438 629
NOI - Straight Line Basis 16,881 17,870 (5.5)% 33,573 35,410 (5.2)%
Less Straight Line Rent 867 728 1,486 1,574
NOI - Cash Basis $ 16,014 $ 17,142 (6.6)% $ 32,087 $ 33,836 (5.2)%
Page 22

FULLY STABILIZED PROPERTIES
SECOND QUARTER 2017 SUPPLEMENTAL
(dollars in thousands)
TOTAL COMPANYQuarter Ended Year to Date
6/30/2017 6/30/2016 % Change 6/30/2017 6/30/2016 % Change
Number of Properties 484 484 480 480
Square Feet 81,045,419 81,045,419 80,523,129 80,523,129
Average Occupancy 95.3% 95.0% 95.8% 94.8%
Rental Revenue $ 113,210 $ 111,255 1.8 % $ 223,615 $ 220,642 1.3 %
Operating Expenses: Rental Property Expense 16,969 16,633 35,399 35,857
Real Estate Taxes 20,010 19,014 39,462 37,716
Operating Expense Recovery (36,986) (34,475) (73,837) (71,104)
Unrecovered Operating Expenses (7) 1,172 1,024 2,469
NOI - Straight Line Basis 113,217 110,083 2.8 % 222,591 218,173 1.1 %
Less Straight Line Rent 3,804 3,423 7,102 7,465
NOI - Cash Basis $ 109,413 $ 106,660 2.6 % $ 215,489 $ 210,708 2.3 %
INDUSTRIALQuarter Ended Year to Date
6/30/2017 6/30/2016 % Change 6/30/2017 6/30/2016 % Change
Number of Properties 437 437 434 434
Square Feet 76,815,229 76,815,229 76,363,717 76,363,717
Average Occupancy 95.7% 95.2% 96.3% 95.3%
Rental Revenue $ 94,797 $ 91,843 3.2 % $ 187,721 $ 182,860 2.7 %
Operating Expenses: Rental Property Expense 11,577 11,539 24,551 25,040
Real Estate Taxes 17,457 16,607 34,390 32,929
Operating Expense Recovery (29,529) (27,629) (58,871) (56,651)
Unrecovered Operating Expenses (495) 517 70 1,318
NOI - Straight Line Basis 95,292 91,326 4.3 % 187,651 181,542 2.4 %
Less Straight Line Rent 2,789 2,328 5,507 5,243
NOI - Cash Basis $ 92,503 $ 88,998 3.9 % $ 182,144 $ 176,299 3.3 %
OFFICEQuarter Ended Year to Date
6/30/2017 6/30/2016 % Change 6/30/2017 6/30/2016 % Change
Number of Properties 47 47 46 46
Square Feet 4,230,190 4,230,190 4,159,412 4,159,412
Average Occupancy 87.7% 91.2% 86.0% 85.7%
Rental Revenue $ 18,413 $ 19,412 (5.1)% $ 35,894 $ 37,782 (5.0)%
Operating Expenses: Rental Property Expense 5,392 5,094 10,848 10,817
Real Estate Taxes 2,553 2,407 5,072 4,787
Operating Expense Recovery (7,457) (6,846) (14,966) (14,453)
Unrecovered Operating Expenses 488 655 954 1,151
NOI - Straight Line Basis 17,925 18,757 (4.4)% 34,940 36,631 (5.2)%
Less Straight Line Rent 1,015 1,095 1,595 2,222
NOI - Cash Basis $ 16,910 $ 17,662 (4.3)% $ 33,345 $ 34,409 (3.1)%
Page 23

COMPLETED DEVELOPMENT PROPERTIES
SECOND QUARTER 2017 SUPPLEMENTAL
(dollars in thousands)
WHOLLY OWNED DEVELOPMENT COMPLETIONS
Investment Square Feet Occupancy 6/30/2017 Stabilized Yield
First Quarter 2017 $ 16,307 215,000 81.7% 10.3%
Second Quarter 2017 65,198 723,505 100.0% 7.9%
Third Quarter 2017
Fourth Quarter 2017
Year to Date 2017 $ 81,505 938,505 95.8% 8.4%
JOINT VENTURE DEVELOPMENT COMPLETIONS
Investment Square Feet Occupancy 6/30/2017 Stabilized Yield
First Quarter 2017 $ — — —% —%
Second Quarter 2017 — — —% —%
Third Quarter 2017
Fourth Quarter 2017
Year to Date 2017 $ — — —% —%
COMPLETED DEVELOPMENT IN SECOND QUARTER 2017
Address
Inv.or
BTSBldgType Invest.
SquareFeet Occupancy
%Own
ShellCompDate
Operatingas of:
CurrentYield
StabilizedYield
Wholly Owned:
951 Valleyview Lane Irving, TX Inv. I $ 18,685 341,442 100.0% 100% Aug-16 May-17
1930 W Rio SaladoParkway
Tempe, AZ Inv. O 29,831 135,663 100.0% 100% Oct-16 May-17
3525 Gravel SpringsRoad
Buford, GA Inv. I 7,492 120,400 100.0% 100% Sep-16 Jun-17
1953 TW AlexanderDrive
Durham, NC Inv. I 9,190 126,000 100.0% 100% Jan-17 Jun-17
Total Wholly Owned $ 65,198 723,505 100.0% 7.9% 7.9%
Page 24

DEVELOPMENT STARTS
SECOND QUARTER 2017 SUPPLEMENTAL
(dollars in thousands)
WHOLLY OWNED DEVELOPMENT STARTS
Projected Investment Square Feet
First Quarter 2017 $ 84,239 777,313
Second Quarter 2017 73,579 1,025,600
Third Quarter 2017
Fourth Quarter 2017
Year to Date 2017 157,818 1,802,913
JOINT VENTURE DEVELOPMENT STARTS
Projected Investment Square Feet
First Quarter 2017 $ 11,918 154,400
Second Quarter 2017 — —
Third Quarter 2017
Fourth Quarter 2017
Year to Date 2017 $ 11,918 154,400
DEVELOPMENT STARTS IN SECOND QUARTER 2017
Address Location
Invor
BTSBldgType
ProjectedInvestment
PercentComplete
SquareFeet
PercentPre-Leased
%Own
AnticipatedIn Service
Date
WHOLLY OWNED:
7157 Ridge Road Hanover, MD BTS I $ 23,721 24.9% 220,000 100.0% 100% 2Q2018
100 Carolina Way Carlisle, PA Inv I 49,858 27.3% 805,600 - 100% 2Q2019
Total Wholly Owned $ 73,579 26.5% 1,025,600 21.5%
JOINT VENTURE:
Total Joint Venture $ — —
Total Development Starts $ 73,579 26.5% 1,025,600 21.5%
Page 25

DEVELOPMENT PROPERTIES
SECOND QUARTER 2017 SUPPLEMENTAL
(dollars in thousands)
Address LocationInv orBTS
BldgType
ProjectedInvestment
PercentComplete
SquareFeet
PercentPre-
Leased
AnticipatedIn Service
DateProjectedSL Yield
WHOLLY OWNED: (1)
11440 NW 122 Street Medley, FL Inv I $ 17,309 95.7% 159,180 100.0% 3Q2017
4485 Premier Drive High Point, NC Inv I 8,656 93.8% 140,000 57.1% 3Q2017
5430 FAA Boulevard Irving, TX Inv I 14,404 82.1% 196,560 - 3Q2017
1200 Intrepid Avenue Philadelphia, PA Inv O 35,114 83.9% 91,971 60.5% 3Q2017
2988 Green Road Greer, SC Inv I 9,817 87.8% 171,600 100.0% 3Q2017
3535 Gravel Springs Road Buford, GA Inv I 13,970 85.1% 235,234 43.7% 3Q2017
1801 South 16th Street LaPorte, TX Inv I 31,540 77.6% 415,272 100.0% 4Q2017
1951 TW Alexander Drive Durham, NC Inv I 4,924 91.9% 58,500 100.0% 4Q2017
6017 Southern Boulevard West Palm Beach, FL Inv I 14,677 87.8% 140,400 69.2% 4Q2017
6035 Southern Boulevard West Palm Beach, FL Inv I 8,767 86.8% 77,760 33.3% 4Q2017
7205 W Buckeye Road Phoenix, AZ Inv I 14,342 88.0% 222,910 39.2% 4Q2017
1720 West 135th Street Gardena, CA Inv I 20,531 96.9% 100,580 100.0% 4Q2017
1870 W Rio SaladoParkway
Tempe, AZ BTS O 51,278 52.9% 236,131 100.0% 1Q2018
7157 Ridge Road Hanover, MD BTS I 23,721 24.9% 220,000 100.0% 2Q2018
1050 Constitution Avenue Philadelphia, PA BTS O 45,527 76.2% 175,000 100.0% 2Q2018
1075 King George PostRoad
Edison, NJ Inv I 17,130 79.7% 182,000 100.0% 2Q2018
1200 Claybrick Road Landover, MD Inv I 22,447 90.5% 216,000 60.0% 2Q2018
2250 East Bardin Road Arlington, TX BTS I 38,279 30.6% 365,908 100.0% 2Q2018
1500 S 71st Avenue Phoenix, AZ Inv I 27,091 81.8% 435,806 60.1% 3Q2018
Worcester 1 - Plot 4 Worcester, UK Inv I 4,889 81.8% 44,835 - 3Q2018
Worcester 2 - Plot 3 Worcester, UK Inv I 14,770 75.8% 162,030 - 3Q2018
3929 Shutterfly Road Charlotte, NC Inv I 13,579 72.2% 204,120 - 3Q2018
8801 Congdon Hill Drive Mertztown, PA Inv I 85,379 70.8% 1,100,000 - 4Q2018
11430 NW 122 Street Medley, FL Inv I 18,418 52.9% 159,180 - 4Q2018
9724 Alabama Street San Bernardino, CA Inv I 15,525 44.2% 156,263 - 4Q2018
350 North York Road Bensenville, IL Inv I 12,017 32.7% 95,962 - 1Q2019
100 Carolina Way Carlisle, PA Inv I 49,858 27.3% 805,600 - 2Q2019
Total Wholly Owned (1) $ 633,959 66.8% 6,568,802 44.5% 7.8%
Page 26

DEVELOPMENT PROPERTIES
SECOND QUARTER 2017 SUPPLEMENTAL
(dollars in thousands)
Address Location
Invor
BTSBldgType
ProjectedInvestment
PercentComplete
SquareFeet
PercentPre-
Leased%
Own
AnticipatedIn Service
DateProjectedSL Yield
JOINT VENTURE:
1800 Arch Street (1) Philadelphia, PA BTS O $ 934,307 89.3% 1,332,415 99.5% 20% 3Q2017
2904 Tradeport Drive Orlando, FL BTS I 11,918 40.4% 154,400 100.0% 50% 4Q2017
200 Arlington Boulevard Swedesboro, NJ Inv I 20,516 76.5% 302,400 - 25% 4Q2018
Total Joint Venture $ 966,741 88.4% 1,789,215 82.7% 8.1%
Total Development Properties (2) $ 1,600,700 79.9% 8,358,017 52.7% 8.0%
(2) Includes a 217-room Four Seasons Hotel.
Page 27
(1) Amounts above exclude $43.4M investment, 88,415 SF for the active redevelopment of a portion of2100 M Street NW, Washington DC Property

ACQUISITIONS
SECOND QUARTER 2017 SUPPLEMENTAL
(dollars in thousands)
WHOLLY OWNED ACQUISITIONS
Investment Square Feet Occupancy 6/30/2017Projected Stabilized
Yield
First Quarter 2017 $ — — —% —%
Second Quarter 2017 20,069 100,580 —% 5.2%
Third Quarter 2017
Fourth Quarter 2017
Year to Date 2017 $ 20,069 100,580 —% 5.2%
JOINT VENTURE ACQUISITIONS
Investment Square Feet Occupancy 6/30/2017Projected Stabilized
Yield
First Quarter 2017 $ — — —% —%
Second Quarter 2017 — — —% —%
Third Quarter 2017
Fourth Quarter 2017
Year to Date 2017 $ — — —% —%
SECOND QUARTER 2017
Address City/State Bldg TypePercentOwned Square Feet Occupancy Investment
Wholly Owned:
1720 W 135th Street Gardena, CA I 100% 100,580 —% $ 20,069 (1)
Total Wholly Owned: 100,580 —% $ 20,069
(1) This property was under development when acquired. See Development Properties schedule on page 26.
Page 28

DISPOSITIONS
SECOND QUARTER 2017 SUPPLEMENTAL
(dollars in thousands)
WHOLLY OWNED DISPOSITIONS
Sale Proceeds Square FeetOccupancy
(at sale date)
First Quarter 2017 $ 2,075 33,027 4.1%
Second Quarter 2017 8,068 93,502 29.4%
Third Quarter 2017
Fourth Quarter 2017
Year to Date 2017 $ 10,143 126,529 22.8%
JOINT VENTURE DISPOSITIONS
Sale Proceeds Square FeetOccupancy
(at sale date)
First Quarter 2017 — — —
Second Quarter 2017 — — —
Third Quarter 2017
Fourth Quarter 2017
Year to Date 2017 — — —
SECOND QUARTER 2017
Address Date Sold City/State Bldg TypePercentOwned
SquareFeet Occupancy
SalesProceeds
Wholly Owned:
7777 Golden Triangle Drive 5/31/2017 Eden Prairie, MN O 100% 31,116 — $ 3,100
10, 20 Liberty Boulevard 6/15/2017 Malvern, PA O 100% 62,386 44.4% 4,968
Total Wholly Owned: 93,502 29.4% $ 8,068
Page 29

UNCONSOLIDATED JOINT VENTURES
SECOND QUARTER 2017 SUPPLEMENTAL
(dollars in thousands)
LibertyVenture I,
LPKings HillUnit Trust
LibertyIllinois, LP
LibertyAIPO LP
LibertyWashington,
LP
Liberty/Comcast1701 JFKBlvd, LP
LibertyProperty18th andArch (D) Other Total
BALANCE SHEET (A) as of June 30, 2017
Real estate assets $ 227,581 $ 145,069 $ 251,306 $ 71,710 $ 289,454 $ 495,866 $ — $ — $ 1,480,986
Accumulated depreciation (45,908) (28,834) (54,459) (10,557) (46,608) (131,977) — — (318,343)
Real estate assets, net 181,673 116,235 196,847 61,153 242,846 363,889 — — 1,162,643
Development in progress 15,630 — — 4,205 — — 785,918 — 805,753
Land held for development — — 32,376 10,708 — — — 30,165 73,249
Other assets 20,865 10,864 18,346 9,276 17,606 46,318 44,374 16,430 184,079
Total assets $ 218,168 $ 127,099 $ 247,569 $ 85,342 $ 260,452 $ 410,207 $ 830,292 $ 46,595 $ 2,225,724
Debt $ 160,018 $ 88,645 $ 137,203 $ 58,194 $ 103,151 $ 307,358 $ — $ — $ 854,569
Other liabilities 7,290 25,684 7,407 3,686 3,817 8,514 91,692 6,915 155,005
Equity 50,860 12,770 102,959 23,462 153,484 94,335 738,600 39,680 1,216,150
Total liabilities and equity $ 218,168 $ 127,099 $ 247,569 $ 85,342 $ 260,452 $ 410,207 $ 830,292 $ 46,595 $ 2,225,724
LPT's ownership percentage 25% 20% 25% 50% 25% 20% 20% 20-50%
LPT's share of equity $ 10,661 $ 5,546 $ 15,032 $ 12,108 $ 38,253 $ 17,686 $ 158,158 $ 10,902 $ 268,346
RESULTS OF OPERATIONS (A) Year to Date June 30, 2017
Total revenue $ 15,228 $ 5,936 $ 11,862 $ 4,560 $ 12,658 $ 32,356 $ — $ 490 $ 83,090
Operating expenses 3,732 2,276 3,781 1,173 4,524 12,982 222 137 28,827
NET OPERATING INCOME 11,496 3,660 8,081 3,387 8,134 19,374 (222) 353 54,263
Interest 2,906 1,145 3,056 1,399 1,993 9,662 — — 20,161
Depreciation and amortization 3,770 1,550 3,466 1,037 2,986 7,243 — — 20,052
Other (income)/expense 82 (85) 44 4 30 166 (148) (12,027) (11,934)
NET INCOME $ 4,738 $ 1,050 $ 1,515 $ 947 $ 3,125 $ 2,303 $ (74) $ 12,380 $ 25,984
LPT's share of net income $ 1,407 $ 274 $ 583 $ 458 $ 1,024 $ 819 $ (15) $ 5,171 $ 9,721
LPT's share of depr and amort 929 278 724 519 747 1,423 — — 4,620
LPT's share of NAREIT FFO $ 2,336 $ 552 $ 1,307 $ 977 $ 1,771 $ 2,242 $ (15) $ 5,171 $ 14,341
LPT's share of NOI $ 2,874 $ 732 $ 2,020 $ 1,694 $ 2,034 $ 3,875 $ (44) $ 74 $ 13,259
DEBT as of June 30, 2017
Interest rate 3.20% -3.95%
2.00% 2.66% -6.05%
4.02% -4.95%
3.40% -3.89%
6.00% — —
LPT's share of debt (B) $ 40,005 $ 17,729 $ 34,301 $ 29,097 $ 25,788 $ 61,472 $ — $ — $ 208,392
Debt maturity date (C) 7/18 - 11/25 11/20 10/17 -12/17 6/19 - 1/27 4/19 - 7/24 4/18 — —
JV DEBT MATURITIES(INCLUDING AMORITIZATION)(A) Reported at 100% of joint venture.
(B) All joint venture debt is non-recourse. (In 000's)(C) The maturity dates and corresponding future maturities are shown at the debt's first call date. Total LPT Share(D) Represents the combined results of two joint ventures related to the property at 2017 $ 140,810 $ 35,244 18th and Arch, Philadelphia. 2018 317,531 64,441(E) Includes deferred financing costs and market adjustments. 2019 51,379 13,195
2020 92,377 18,9722021 2,941 1,108
Thereafter 253,673 76,573$ 858,711 $ 209,533
Reconciling Items (E) (4,142) (1,141)
$ 854,569 $ 208,392
Page 30

DEBT & PREFERRED UNIT ANALYSIS
SECOND QUARTER 2017 SUPPLEMENTAL
(dollars in thousands)
DEBT MATURITIES
Mortgages (1)
Amortization Maturities TotalsUnsecured
Notes (2)Credit
Facility (3) Total
WeightedAverage
Interest Rate
2017 $ 3,919 $ — $ 3,919 $ — $ — $ 3,919 4.94%
2018 6,565 26,995 33,560 — 177,000 210,560 2.50%
2019 6,504 50,043 56,547 — — 56,547 4.02%
2020 3,539 67,361 70,900 350,000 — 420,900 4.93%
2021 2,504 65,009 67,513 — — 67,513 4.06%
2022 2,172 — 2,172 400,000 — 402,172 4.13%
2023 2,281 — 2,281 300,000 — 302,281 3.39%
2024 2,395 — 2,395 450,000 — 452,395 4.40%
2025 2,503 — 2,503 400,000 — 402,503 3.76%
2026 and thereafter 22,294 1,946 24,240 400,000 — 424,240 3.34%
$ 54,676 $ 211,354 $ 266,030 $ 2,300,000 $ 177,000 $ 2,743,030
Reconciling Items (4) — — 5,821 (18,350) — (12,529)
$ 54,676 $ 211,354 $ 271,851 $ 2,281,650 $ 177,000 $ 2,730,501 3.91%
(1) Mortgages are fixed rate bearing interest at a weighted average interest rate of 4.74%.
(2) The unsecured notes include $350,000 principal bearing interest at 4.75%,
$400,000 principal bearing interest at 4.125%, $300,000 principal bearing interest at 3.375%,
$450,000 principal bearing interest at 4.40%, $400,000 principal bearing interest at 3.75% and
$400,000 principal bearing interest at 3.25%, for a blended weighted average interest rate of 3.96%
(3) The $800 million credit facility bears interest at LIBOR + 105 basis points and expires on March 26, 2018.
(4) Includes deferred financing costs, premium/discount and market adjustments.
PREFERRED UNITS
SecurityDividend
RateLiquidationPreference Optional Redemption Date
Series I -2 6.25% $7,537 November 2016 - July 2027
Page 31

DEBT STATISTICS & RATIOS
SECOND QUARTER 2017 SUPPLEMENTAL
Quarter Ended Year to Date
6/30/2017 6/30/2016 6/30/2017 6/30/2016
Average Net Debt to Adjusted EBITDA 5.7x 6.0x 5.6x 5.9x
Interest Expense Coverage 5.3x 4.4x 5.3x 4.3x
Cash Interest Expense Coverage 4.2x 3.7x 4.3x 3.6x
Fixed Charge Coverage 3.9x 3.5x 4.0x 3.4x
As of
6/30/2017 6/30/2016
Debt to Gross Assets 38.2% 41.9%
Debt to Total Market Capitalization 30.8% 35.3%
Page 32

DEBT COVENANTS & CREDIT RATINGS
SECOND QUARTER 2017 SUPPLEMENTAL
SENIOR UNSECURED NOTES
Required 6/30/2017 6/30/2017
Covenant (1) (2)
Debt/Total Assets ≤ 60% 39% 39%
Annual Service Charge Coverage ≥ 1.5 4.5 4.5
Secured Debt ≤ 40% 4% 4%
Unencumbered Total Asset Value/Unsecured Debt ≥ 1.5 2.4 2.4
UNSECURED LINE OF CREDIT
Covenant (1) (2)
Unsecured Debt : Unencumbered Properties ≤ 60% 46% 46%
Unencumbered NOI : Unsecured Interest Expense ≥ 1.75 4.0 4.0
Total Debt : Total Assets (Gross) ≤ 60% 40% 40%
Secured Debt : Total Assets (Gross) ≤ 35% 6% 6%
EBITDA : Fixed Charges ≥ 1.5 3.3 3.3
Dividend : FFO ≤ 90% 80% 80%
(1) Defined terms used in the above covenant calculations may differ between the Senior UnsecuredNotes and the Unsecured Line of Credit.
(2) Ratios use calculations that are defined in the Trust Indenture or Credit Facility Credit Agreementas appropriate.
CREDIT RATINGS
Agency Rating Outlook Last Update
Moody's Investor Services, Inc. Baa1 Stable January 2017
Standard and Poor's Ratings Services BBB Stable March 2017
Fitch, Inc. BBB Stable June 2016
Page 33

GUIDANCE
SECOND QUARTER 2017 SUPPLEMENTAL
(dollars in millions)
2017 Range
GuidanceRevised Q2-17 Prior Guidance
Low High Low HighProjected net income available tocommon shareholders per share
$1.99 $2.19 $1.42 $1.75
Projected NAREIT FFO per diluted share $2.49 $2.55 $2.42 $2.52
Capital Activity
Total Investment Average Yield
Acquisitions $50 - $200 4.5% - 6.5%
Land Acquisitions $20 - $50
Dispositions $200 - $350 5.5% - 8.5%
Development Deliveries $250 - $350 7.5% - 8.5%
Development Deliveries (JV) $750 8.2%
Development Starts $400 - $500
Development Starts (JV) $0 - $50
Development Spend $400 - $475
Development Spend (JV) $50
Same Store Property Level Operating Income (2017 - 2016) Percent Change
GuidanceRevised Q2-17 Prior Guidance
Total 1% - 2% 0% - 2%
Industrial 2% - 3% 1% - 3%
Office (3%) - (4%) (3%) - (5%)
Portfolio Performance Assumptions
GuidanceRevised Q2-17 Prior Guidance
Average Occupancy
Industrial 95% - 97% 95% - 97%
Office 90% - 92% 88% - 90%
Rental Rate Change - Straight Line 10% - 12% 9% - 11%
Industrial 11% - 13% 9% - 11%
Office 7% - 10% 10% - 12%
Rental Rate Change - Cash 3% - 5% 1% - 3%
Industrial 3% - 6% 1% - 3%
Office (1%) - 1% 0% - 2%
Page 34
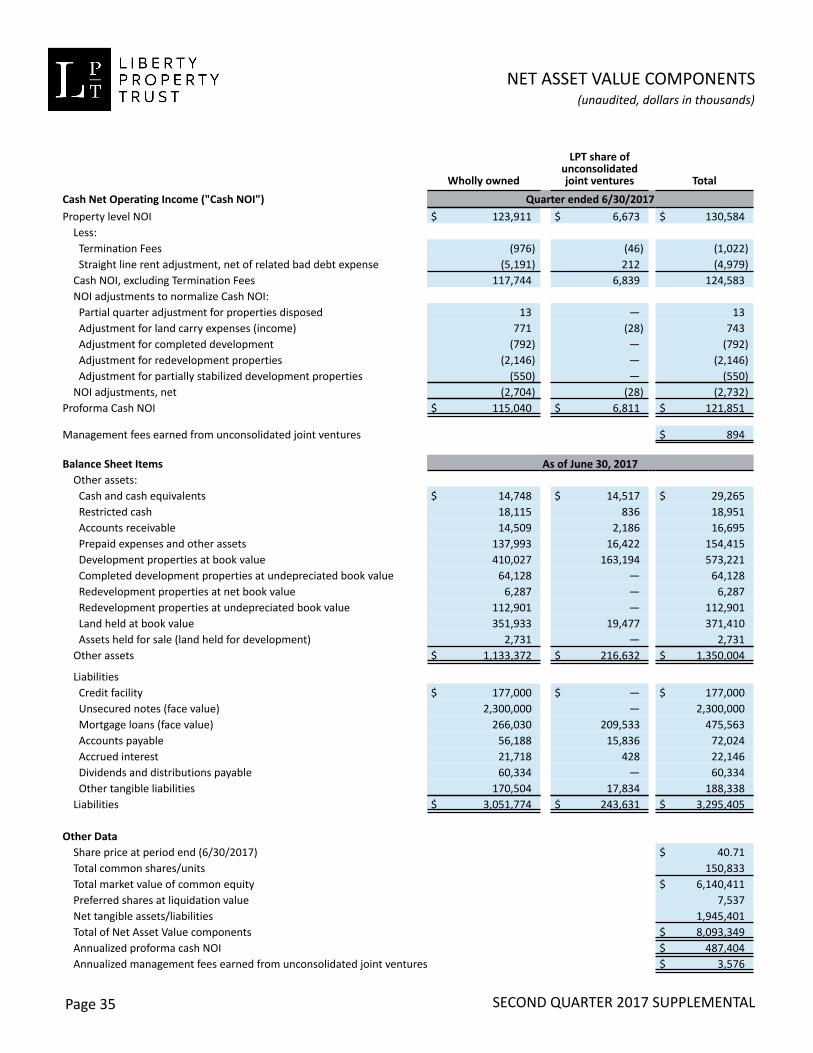
NET ASSET VALUE COMPONENTS
SECOND QUARTER 2017 SUPPLEMENTAL
(unaudited, dollars in thousands)
Wholly owned
LPT share ofunconsolidatedjoint ventures Total
Cash Net Operating Income ("Cash NOI") Quarter ended 6/30/2017
Property level NOI $ 123,911 $ 6,673 $ 130,584 Less: Termination Fees (976) (46) (1,022) Straight line rent adjustment, net of related bad debt expense (5,191) 212 (4,979) Cash NOI, excluding Termination Fees 117,744 6,839 124,583 NOI adjustments to normalize Cash NOI: Partial quarter adjustment for properties disposed 13 — 13 Adjustment for land carry expenses (income) 771 (28) 743 Adjustment for completed development (792) — (792) Adjustment for redevelopment properties (2,146) — (2,146) Adjustment for partially stabilized development properties (550) — (550) NOI adjustments, net (2,704) (28) (2,732)Proforma Cash NOI $ 115,040 $ 6,811 $ 121,851
Management fees earned from unconsolidated joint ventures $ 894
Balance Sheet Items As of June 30, 2017 Other assets: Cash and cash equivalents $ 14,748 $ 14,517 $ 29,265 Restricted cash 18,115 836 18,951 Accounts receivable 14,509 2,186 16,695 Prepaid expenses and other assets 137,993 16,422 154,415 Development properties at book value 410,027 163,194 573,221 Completed development properties at undepreciated book value 64,128 — 64,128 Redevelopment properties at net book value 6,287 — 6,287 Redevelopment properties at undepreciated book value 112,901 — 112,901 Land held at book value 351,933 19,477 371,410 Assets held for sale (land held for development) 2,731 — 2,731 Other assets $ 1,133,372 $ 216,632 $ 1,350,004
Liabilities Credit facility $ 177,000 $ — $ 177,000 Unsecured notes (face value) 2,300,000 — 2,300,000 Mortgage loans (face value) 266,030 209,533 475,563 Accounts payable 56,188 15,836 72,024 Accrued interest 21,718 428 22,146 Dividends and distributions payable 60,334 — 60,334 Other tangible liabilities 170,504 17,834 188,338 Liabilities $ 3,051,774 $ 243,631 $ 3,295,405
Other Data Share price at period end (6/30/2017) $ 40.71 Total common shares/units 150,833 Total market value of common equity $ 6,140,411 Preferred shares at liquidation value 7,537 Net tangible assets/liabilities 1,945,401 Total of Net Asset Value components $ 8,093,349 Annualized proforma cash NOI $ 487,404 Annualized management fees earned from unconsolidated joint ventures $ 3,576
Page 35

NON-GAAP FINANCIAL MEASURES AND OTHER DEFINED TERMS
SECOND QUARTER 2017 SUPPLEMENTAL
(dollars in thousands)
Non-GAAP Financial Measures and Other Defined Terms The Company uses certain non-GAAP financial measures and other defined terms in this Supplemental. The non-GAAP financialmeasures include Funds from Operations (FFO), Adjusted Funds from Operations (AFFO), Adjusted EBITDA, Net Operating Income(NOI), and other defined terms. The definitions of non-GAAP financial measures are listed below. The Company uses these measuresto monitor the operating and financial performance of the Company and believes that these measures are helpful to investors inmeasuring financial performance and/or liquidity and comparing such performance and/or liquidity to other REITs. These non-GAAPfinancial measures are supplemental measures of operating performance that do not represent and should not be considered asan alternative to net income or cash flow from operating, investing or financing activities as determined under U.S. GAAP, and theCompany’s calculation thereof may not be comparable to similar measures reported by other companies.
Adjusted EBITDAAdjusted EDITDA is defined as net income, after adjusting for depreciation and amortization expense, interest expense, impairmentcharges and the effect of other non-cash items, debt extinguishment gains (losses), gains (losses) on property dispositions, incometax expense (benefit), and share-based compensation expenses, as applicable.
The Company uses Adjusted EBITDA as a supplemental measure of its operating performance. The Company believes it providesinvestors and analysts with relevant and useful information to view its operating performance on an unleveraged basis before theeffects of interest, income taxes, depreciation and amortization, gains (losses) on the sales of property, debt extinguishment gains(losses) and other non-cash items noted above. By excluding interest expense, Adjusted EBITDA allows investors and analysts tomeasure the Company’s operating performance independent of its capital structure and indebtedness that allows a moremeaningful comparison to similar measures reported by other companies. The Company also believes that Adjusted EBITDAassists investors and analysts in analyzing its ability to meet debt service obligations and make quarterly dividend payments.While Adjusted EBITDA is a relevant and widely used measure of operating performance, it does not represent net income asdefined by U.S. GAAP, and it should not be considered as an alternative to those measures in evaluating the Company’s operatingperformance or liquidity. Further, the Company’s computation of Adjusted EBITDA may not be comparable to EBITDA or AdjustedEBITDA reported by other companies. The Company believes that the line on its consolidated statements of comprehensiveincome entitled “net income” is the most directly comparable U.S. GAAP measure to Adjusted EBITDA - see reconciliation on page10.
Adjusted Funds from Operations (AFFO)AFFO is defined as FFO less Tenant improvement and Lease Transaction Costs and Non-reimbursed Capital Expenditures, and afteradjusting for the impact of straight-line rents adjustments, share-based compensation expense, impairment charges and the effectof other non-cash items, gains (losses) on sales of non-depreciable assets, and debt extinguishment gains (losses), as applicable.AFFO is used as an additional measure in evaluating Company performance, as an indication of the REIT’s ability to fund its operatingcapital expenditures through earnings and in reviewing its common dividend policy over time. In addition, since other equity REITsprovide AFFO, or similar supplemental measures, to the investment community, the Company believes that AFFO is a usefulsupplemental measure for comparing the Company to other equity REITs. The Company believes that the line on its consolidatedstatements of comprehensive income entitled “net income available to common shareholders” is the most directly comparable U.S.GAAP measure to AFFO - see reconciliation on page 9.
Capital Expenditures (Cap Ex)Capital expenditures include costs incurred for roof or HVAC replacements, parking lot replacements, drainage solutions, pavingreplacements, exterior building coatings and landscaping renovations or other costs that extend the life of the property. Capitalexpenditures do not include costs for redevelopments, or that otherwise would be considered revenue-generating, or are includedin the underwriting for acquisition properties.
Current YieldCurrent Yield is the straight line net operating income generated at period end divided by the total cost of the investment.
Page 36

NON-GAAP FINANCIAL MEASURES AND OTHER DEFINED TERMS
SECOND QUARTER 2017 SUPPLEMENTAL
(dollars in thousands)
Debt Statistics and RatiosThe Company uses a number of debt statistics and ratios as supplemental measures of its capital structure and indebtedness, aswell as to assist investors and analysts in evaluating its ability to meet its debt service obligations and make quarterly dividendpayments. The numerator and/or the denominator of certain of these statistics and/or ratios include non-GAAP financial measuresthat have been reconciled to the most directly comparable U.S. GAAP financial measure. The calculation of these debt statistics andratios is provided below:
Cash Interest Expense CoverageQuarter Ended
June 30, 2017 June 30, 2016 June 30, 2017 June 30, 2016 Adjusted EBITDA $ 117,302 $ 133,268 $ 235,704 $ 265,288
Interest expense 21,942 30,131 44,285 61,543Capitalized interest 5,907 6,195 10,888 11,260Cash interest expense $ 27,849 $ 36,326 $ 55,173 $ 72,803
Cash Interest Expense Coverage 4.2x 3.7x 4.3x 3.6x
Fixed Charge CoverageQuarter Ended Year to Date
June 30, 2017 June 30, 2016 June 30, 2017 June 30, 2016Adjusted EBITDA $ 117,302 $ 133,268 $ 235,704 $ 265,288
Interest expense 21,942 30,131 44,285 61,543 Capitalized interest 5,907 6,195 10,888 11,260 Preferred dividends 118 118 236 236 Principal amortization 1,946 2,080 3,875 4,337Total fixed charges $ 29,913 $ 38,524 $ 59,284 $ 77,376
Fixed Charge Coverage 3.9x 3.5x 4.0x 3.4x
Average Net Debt to Adjusted EBITDAQuarter Ended Year to Date
June 30, 2017 June 30, 2016 June 30, 2017 June 30, 2016 Average Debt $ 2,725,926 $ 3,222,319 $ 2,673,433 $ 3,194,759 less: average unrestricted cash (29,996) (36,460) (33,809) (38,804) Average net debt 2,695,930 3,185,859 2,639,624 3,155,955
Adjusted EBITDA $ 117,302 $ 133,268 $ 235,704 $ 265,288
Average Net Debt to Adjusted EBITDA 5.7x 6.0x 5.6x 5.9x
Debt to Gross Assets
June 30, 2017 June 30, 2016Debt at period end $ 2,730,501 $ 3,261,555
Total assets 6,159,635 6,584,868Accumulated depreciation 995,032 1,199,941Gross assets $ 7,154,667 $ 7,784,809
Debt to Gross Assets 38.2% 41.9%
Page 37
Interest Expense CoverageQuarter Ended Year to Date
June 30, 2017 June 30, 2016 June 30, 2017 June 30, 2016 Adjusted EBITDA $ 117,302 $ 133,268 $ 235,704 $ 265,288
Interest expense $ 21,942 $ 30,131 $ 44,285 $ 61,543
Interest Expense Coverage 5.3x 4.4x 5.3x 4.3x
NON-GAAP FINANCIAL MEASURES AND OTHER DEFINED TERMS
SECOND QUARTER 2017 SUPPLEMENTAL
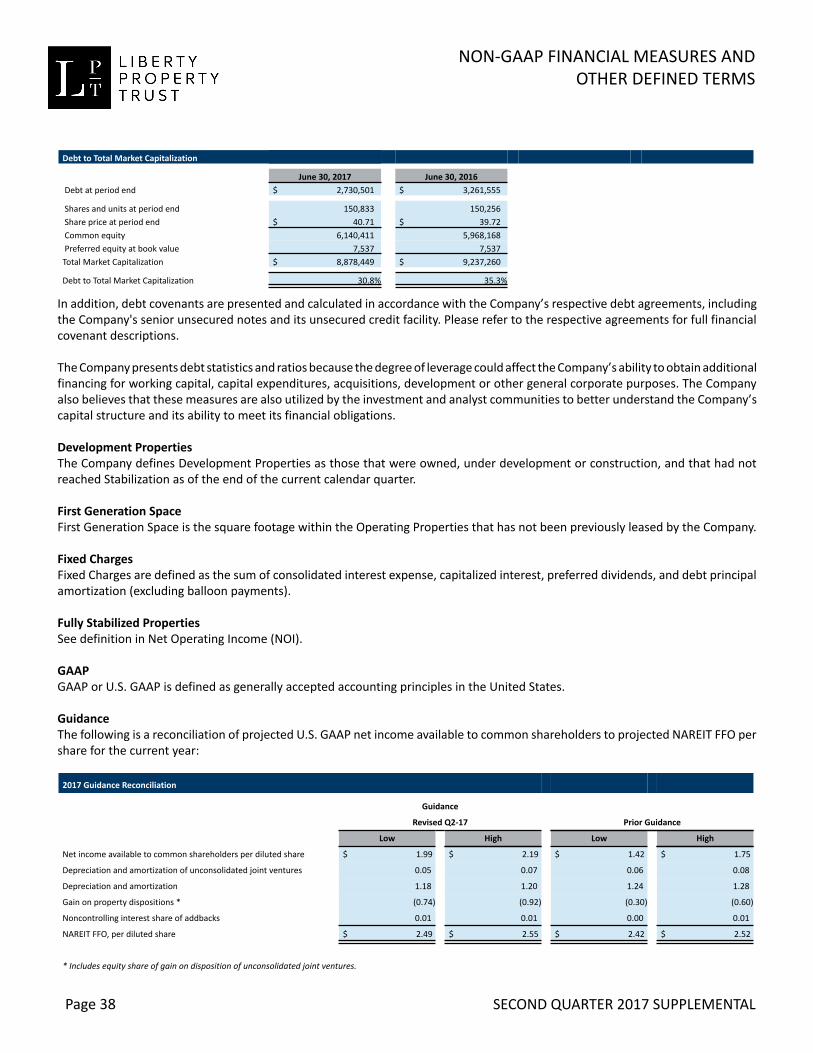
In addition, debt covenants are presented and calculated in accordance with the Company’s respective debt agreements, includingthe Company's senior unsecured notes and its unsecured credit facility. Please refer to the respective agreements for full financialcovenant descriptions.
The Company presents debt statistics and ratios because the degree of leverage could affect the Company’s ability to obtain additionalfinancing for working capital, capital expenditures, acquisitions, development or other general corporate purposes. The Companyalso believes that these measures are also utilized by the investment and analyst communities to better understand the Company’scapital structure and its ability to meet its financial obligations.
Development PropertiesThe Company defines Development Properties as those that were owned, under development or construction, and that had notreached Stabilization as of the end of the current calendar quarter.
First Generation Space First Generation Space is the square footage within the Operating Properties that has not been previously leased by the Company.
Fixed ChargesFixed Charges are defined as the sum of consolidated interest expense, capitalized interest, preferred dividends, and debt principalamortization (excluding balloon payments).
Fully Stabilized PropertiesSee definition in Net Operating Income (NOI).
GAAPGAAP or U.S. GAAP is defined as generally accepted accounting principles in the United States.
GuidanceThe following is a reconciliation of projected U.S. GAAP net income available to common shareholders to projected NAREIT FFO pershare for the current year:
Debt to Total Market Capitalization
June 30, 2017 June 30, 2016 Debt at period end $ 2,730,501 $ 3,261,555
Shares and units at period end 150,833 150,256 Share price at period end $ 40.71 $ 39.72 Common equity 6,140,411 5,968,168 Preferred equity at book value 7,537 7,537Total Market Capitalization $ 8,878,449 $ 9,237,260
Debt to Total Market Capitalization 30.8% 35.3%
2017 Guidance Reconciliation
Guidance
Revised Q2-17 Prior Guidance
Low High Low High
Net income available to common shareholders per diluted share $ 1.99 $ 2.19 $ 1.42 $ 1.75
Depreciation and amortization of unconsolidated joint ventures 0.05 0.07 0.06 0.08
Depreciation and amortization 1.18 1.20 1.24 1.28
Gain on property dispositions * (0.74) (0.92) (0.30) (0.60)
Noncontrolling interest share of addbacks 0.01 0.01 0.00 0.01
NAREIT FFO, per diluted share $ 2.49 $ 2.55 $ 2.42 $ 2.52
* Includes equity share of gain on disposition of unconsolidated joint ventures.
Page 38

NON-GAAP FINANCIAL MEASURES AND OTHER DEFINED TERMS
NAREIT Funds from Operations (FFO)NAREIT Funds from Operations available to common shareholders is defined by NAREIT as net income (computed in accordancewith U.S. GAAP), excluding gains (or losses) from sales of depreciable property and impairments of depreciable real estate assets,plus depreciation and amortization, and after adjustments for unconsolidated partnerships and joint ventures. The SEC has agreedto the disclosure of this non-GAAP financial measure on a per share basis in its Release No. 34-47226, Conditions for Use of Non-GAAP Financial Measures. The Company believes that the calculation of NAREIT FFO is helpful to investors and management as it isa measure of the Company’s operating performance that excludes depreciation and amortization and gains and losses from operatingproperty dispositions. As a result, year over year comparison of NAREIT FFO reflects the impact on operations from trends inoccupancy rates, rental rates, operating costs, development activities, general and administrative expenses, and interest costs,providing perspective not immediately apparent from net income. In addition, management believes that NAREIT FFO providesuseful information to the investment community about the Company’s financial performance when compared to other REITs sinceNAREIT FFO is generally recognized as the standard for reporting the operating performance of a REIT. NAREIT FFO available tocommon shareholders does not represent net income or cash flows from operations as defined by U.S. GAAP and does not necessarilyindicate that cash flows will be sufficient to fund cash needs. It should not be considered as an alternative to net income as anindicator of the Company’s operating performance or to cash flows as a measure of liquidity. NAREIT FFO available to commonshareholders also does not represent cash flows generated from operating, investing or financing activities as defined by U.S. GAAP.The Company believes that the line on its consolidated statements of comprehensive income entitled “net income available tocommon shareholders” is the most directly comparable U.S. GAAP measure to FFO - see reconciliation on page 9.
Net Asset Value (NAV)The Company considers NAV to be a useful supplemental measure of its operating performance because it enables investors toestimate the fair value of its business and its underlying net real estate assets. This Supplemental provides the components andadjustments to certain U.S. GAAP financial measures and NOI that the Company uses internally to calculate NAV. The assessmentof NAV is subjective and can be calculated using different methods. Therefore, the Company has presented components andadjustments to property operating results and other net assets that it believes are important in calculating NAV, but have notpresented any specific methodology, nor provided any guidance on the assumptions or estimates that should be used in calculatingNAV.
Within its NAV disclosure the Company presents NOI for properties that have reached Stabilization as of the 1st day of the applicablequarter ended (including its share of unconsolidated joint ventures), so that a capitalization rate may be applied and an approximatevalue for the assets determined. Properties not stabilized as of the 1st day of the applicable quarter are presented at undepreciatedcost, or in certain instances, at net book value. Other tangible assets and liabilities are presented at book value. Preferred sharesare presented at liquidation value.
Net Operating Income (NOI)The Company uses NOI, including Same Store NOI and Fully Stabilized NOI, as operating performance measures. NOI is defined asrental and operating expense reimbursements less property and real estate tax expenses from real estate operations. The Companybelieves that NOI is an important measure of operating performance for a REIT’s operating real estate because it provides a measureof the core operations, rather than factoring in depreciation and amortization, financing costs and general and administrativeexpenses generally incurred at the corporate level. This measure is particularly useful, in the opinion of the Company, in evaluatingthe performance of Same Store and Fully Stabilized properties. Additionally, the Company believes that NOI, as defined, is a widelyaccepted measure of comparative operating performance in the real estate investment community. The Company believes that theline on its consolidated statement of operations entitled “net income” is the most directly comparable U.S. GAAP measure to propertyNOI, reconciled as follows:
SECOND QUARTER 2017 SUPPLEMENTALPage 39

NON-GAAP FINANCIAL MEASURES AND OTHER DEFINED TERMS
SECOND QUARTER 2017 SUPPLEMENTAL
(dollars in thousands)
Same Store PropertiesThe Company presents comparable operating results for a same store group of properties that it defines once per year at thebeginning of the current calendar year. Same Store Properties include Operating Properties that were owned and had reachedStabilization as of January 1, 2016 (i.e., properties owned and stabilized in both the current and prior year), and exclude propertiesheld for redevelopment or that had been sold as the end of the current quarter. Same Store revenues and NOI exclude TerminationFees.
Fully Stabilized Properties The Company presents comparable operating results for a fully stabilized group of properties it defines at the beginning of eachcurrent calendar quarter. Fully Stabilized Properties include Operating Properties that were owned and substantially completeas of the 1st day of the applicable prior year period, and that had reached Stabilization as the 1st day of the current quarterended. Fully Stabilized Properties also exclude properties held for redevelopment or that had been sold as the end of the currentquarter. Fully Stabilized revenues and NOI also exclude Termination Fees.
Management generally considers the performance of the Same Store Properties to be a useful financial performance measurebecause the results are directly comparable from period to period. Management also considers the performance of the FullyStabilized Properties to be a useful financial performance measure because in addition to the operating results of Same StoreProperties that are directly comparable from period to period, Fully Stabilized Properties includes the results of substantiallycompleted properties that reached Stabilization since January 1, 2016. Management further believes that these performancecomparisons should exclude Termination Fees since they are more event specific and are not representative of ordinaryperformance results. In addition, Same Store and Fully Stabilized NOI exclusive of Termination Fees is considered by managementto be a more reliable indicator of the portfolio’s baseline performance. Same Store and Fully Stabilized NOI are non-GAAP measuresand do not represent income before property dispositions, income taxes and noncontrolling interest because it does not reflectthe consolidated operations of the Company.
Quarter Ended Year to Date
June 30, 2017 June 30, 2016 June 30, 2017 June 30, 2016
Net income $ 52,818 $ 51,057 $ 97,062 $ 110,120
Equity in earnings of unconsolidated joint ventures (3,990) (5,583) (9,721) (10,497)
Income taxes 324 752 946 1,553
Gain on property dispositions (5,895) (3,832) (6,702) (24,353)
Interest expense 21,942 30,131 44,285 61,543
Interest and other income (1,928) (4,992) (3,804) (9,590)
Development service fee expense 17,828 — 28,832 —
Depreciation and amortization 45,789 53,545 91,249 107,623
General and administrative 15,282 15,629 32,224 36,619
Development service fee income (18,259) — (29,744) —
NOI $ 123,911 $ 136,707 $ 244,627 $ 273,018
Non-same store properties NOI (9,718) (25,833) (20,044) (52,998)
Termination fees (976) (791) (1,992) (1,847)
Fully Stabilized Properties NOI $ 113,217 $ 110,083 $ 222,591 $ 218,173
Adjustment for Fully Stabilized Properties (3,398) (1,727) (4,387) (2,436)
Same Store Properties $ 109,819 $ 108,356 $ 218,204 $ 215,737
Rent revenue $ 124,969 $ 139,143 $ 248,350 $ 278,198
Operating expense reimbursement 39,902 47,511 80,402 98,597
Rental property expense (17,716) (24,745) (37,600) (53,255)
Real estate taxes (23,244) (25,202) (46,525) (50,522)
NOI $ 123,911 $ 136,707 $ 244,627 $ 273,018
Page 40
NON-GAAP FINANCIAL MEASURES AND OTHER DEFINED TERMS
SECOND QUARTER 2017 SUPPLEMENTAL
Net Rent Net Rent represents the contractual rent per square foot multiplied by the tenants’ square feet leased at period end for tenantswith a lease term that has commenced. Net rent does not include the tenant’s obligation to pay property operating expenses andreal estate taxes.
New LeasesNew Leases are First Generation and Second Generation Leases that have commenced during the applicable period.
Occupancy Occupancy is defined as the percentage of the total square feet of a property or a group of properties that is contractually encumberedby a lease and such lease term has commenced.
Operating PropertiesOperating Properties are those properties that were owned and had reached Stabilization as of the end of the current calendarquarter. Operating Properties exclude properties defined as Development Properties and Redevelopment Properties.
Percentage Leased Percentage Leased is defined as the percentage of the total square feet of a property or a group of properties that is contractuallyencumbered by a lease.
Redevelopment PropertiesThe Company defines Redevelopment Properties as those that were owned, under redevelopment or being held for redevelopment,and that have not reached Stabilization as of the end of the current calendar quarter.
Renewal LeasesRenewal leases are those leases that have expired in the applicable period and the lease term was extended for a period of greaterthan one year.
Rent Growth - Cash Rent Growth - Cash represents the percentage change in starting net rent per the lease agreements compared to the previous netrent in that same space. Rent growth - cash is calculated for the leases where the lease term has commenced during the currentperiod and excludes leases with a term of less than one year. This measure excludes any free rent periods.
Rent Growth - GAAP Rent Growth - GAAP represents the percentage change in straight line rent (average rate over the lease term) per the lease agreementscompared to the previous straight line rent in that same space. Rent growth - straight line is calculated for the leases where thelease term has commenced during the current period and excludes leases with a term of less than one year.
Second Generation Space Second Generation Space is the square footage within the Operating Properties that has been previously leased by the Company.
Same Store PropertiesSee definition in Net Operating Income (NOI).
StabilizationThe Company considers Development Properties or Redevelopment Properties to have reached Stabilization based upon the earlierto occur of 12-months after substantial completion of shell construction (or redevelopment), or upon reaching 90% Occupancy.Upon Stabilization, Development Properties or Redevelopment Properties are considered to be Operating Properties.
Page 41

NON-GAAP FINANCIAL MEASURES AND OTHER DEFINED TERMS
SECOND QUARTER 2017 SUPPLEMENTAL
Stabilized SL YieldStabilized SL Yield is the straight line net operating income expected to be generated at Stabilization divided by the total cost of theinvestment.
Tenant Improvements and Lease Transaction CostsTenant Improvements and Lease Transaction Costs include the costs to prepare a space for a new tenant and for a lease renewalwith the existing tenant. Leasing commissions are the compensation paid to a real estate broker for services rendered to sourceand execute a Lease and are included in Tenant Improvements and Lease Transaction Costs.
Termination FeesTermination fees are fees that the Company agrees to accept in consideration for permitting certain tenants to terminate their leasesprior to the contractual expiration date.
Total Market CapitalizationTotal Market Capitalization is defined as total indebtedness and the liquidation value of preferred shares on the Company’sconsolidated balance sheets, plus the period-end market value of the Company’s total common shares and units outstanding.
Page 42