Embed Size (px)
Citation preview

1

2
Table of Contents
Table of Contents .............................................................................. 2
Organizational Overview .................................................................... 4
Quick Facts ........................................................................................ 5
Organizational Chart .......................................................................... 6
Letter from Principal and Vice-Chancellor Prof. Suzanne Fortier .......... 7
Foreword – Prof. Christopher P. Manfredi, Provost and Vice-Principal (Academic) ........................................................................................ 8
1 Budget Book FY2018: Executive Summary...................................... 10
1.1 FY2017 Key Variances in Budget versus Year-End Forecast ......... 10
1.2 Provincial reinvestment over the next five years ......................... 10
1.3 Enrolment Forecasts ..................................................................... 11
1.4 Academic Renewal ........................................................................ 11
1.5 Compensation and Salary Policy ................................................... 11
1.6 Deferred Maintenance .................................................................. 11
1.7 Significant one-time and ongoing expenses ................................. 11
1.8 Budget Measures .......................................................................... 12
1.9 Risk factors .................................................................................... 12
1.10 Projected financed operating revenues, expenses and accumulated deficit ............................................................................ 12
2 Economic and Political Environment .............................................. 14
2.1 Current Economic and Political Realities ...................................... 14
2.2 Federal funding ............................................................................. 15
2.3 Interest Rates ................................................................................ 15
2.4 Currency Exchange Rate ............................................................... 15
2.5 Inflation ......................................................................................... 16
2.6 Tuition and fees ............................................................................ 16
2.7 Regulatory Environment ............................................................... 16
3 Enterprise Risk Management (ERM) ............................................... 18
4 Overall Budget: Design and Framework of McGill’s Budget ............. 19
4.1 Budget Cycle ................................................................................. 19
4.2 Design of the FY2018-2022 Budget .............................................. 19
4.3 A multi-year, multi-fund Budgetary Framework .......................... 21
5 McGill University Strategic Plans ................................................... 22
5.1 Principal’s Priorities ...................................................................... 22
5.2 McGill University Strategic Academic Plan 2017-2022 ................. 23
5.3 McGill Strategic Research Plan 2013-2017 ................................... 26
5.4 McGill University Physical Master Plan ........................................ 26
5.5 Royal Victoria Hospital Feasibility Study ....................................... 26
6 Goals and Objectives of the University, Faculties and Administrative Units ............................................................................................... 27
6.1 Academic Units ............................................................................. 27
6.2 Administrative Units ..................................................................... 28
6.3 Partners ........................................................................................ 29
6.4 Unit Objectives, Actions, Achievements, Challenges and Targets 30
7 Operating Funds: FY2018 Budget ................................................... 54
7.1 Operating Revenues ..................................................................... 54
7.2 Expenditures aligned with Priorities ............................................. 62
7.3 Significant one-time and on-going expenses ................................ 70
7.4 Target Surplus / Deficit ................................................................. 71
7.5 Carry forwards and Deficits .......................................................... 72

3
8 Restricted Funds ........................................................................... 74
8.1 Allocation of Indirect Costs of Research ....................................... 74
8.2 Research revenues ........................................................................ 74
9 Endowment Funds ........................................................................ 75
9.1 Donations and Gifts ...................................................................... 75
9.2 Endowments ................................................................................. 75
10 Plant Fund .................................................................................. 77
10.1 Capital Budget ............................................................................. 77
10.2 Impact of Capital Expenditures on the Operating Budget .......... 79
11 Overall Borrowing and Debt Position ........................................... 81
11.1 Interest and Bank Charges Expense assumptions ...................... 81
12 Conclusion .................................................................................. 82
Appendix 1: FY2017 Operating Fund Forecast vs. budget .................. 83
Appendix 2: Multi-year Financial Outlook by Revenue and Expense .. 84
Appendix 3: Pro-forma Financials FY2018 Budget, FY2017 Forecast, FY2016 Actual – All Funds ................................................................ 88
Appendix 4: Statement of change in net assets – 5 years .................. 89
Appendix 5: Unit Level Operating Fund Financials FY2014-FY2016 – Academic Units ................................................................................ 90
Appendix 6: Unit Level Operating Fund Financials FY2014-FY2016 – Administrative Units ........................................................................ 93
Appendix 7: Unit Level Restricted Fund Financials FY2014–FY2016 – Academic Units ................................................................................ 96
Appendix 8: Unit Level Restricted Fund Financials FY2014–FY2016 – Administrative Units ........................................................................ 99
Appendix 9: MEES Operating Grant ................................................ 102
Appendix 10: Full-Time Tenured and Tenure-Track Faculty Staff Counts ........................................................................................... 103
Appendix 11: Other Full-time Ranked Academic Staff Counts .......... 104
Appendix 12: Administrative and Support Staff Counts ................... 106
Appendix 13: Summary of Carry forwards & fund balances – Operating funds FY2017 ($’000)...................................................................... 108
Appendix 14: Deferred Maintenance Repayment Impact on Operating Budget ($’M) ................................................................................. 109
Appendix 15: Endowment Income Contribution to Restricted Fund by unit - FY2016 details & FY2009-FY2015 totals ($’000) ...................... 110
Appendix 16: Capital Borrowings Summary FY2017 ........................ 111
Appendix 17: University Significant Accounting Policies .................. 112
Appendix 18: Administrative Groupings ......................................... 113
Appendix 19: List of Abbreviations ................................................. 115
Appendix 20: Glossary of Terms ..................................................... 116

4
Organizational Overview
MCGILL UNIVERSITY - ORGANIZATIONAL OVERVIEW
MISSION The mission of McGill University is the advancement of learning and the creation and dissemination of knowledge, by offering the best possible education, by carrying out research and scholarly activities judged to be excellent by the highest international standards, and by providing service to society. PRINCIPLES In fulfilling its mission, McGill University embraces the principles and values of academic freedom, integrity, responsibility, equity and inclusiveness.
MOTTO Grandescunt Aucta Labore (By work, all things increase and grow)
NOTABLE FIRSTS • Nature of radioactivity (Ernest Rutherford) • Discovery of the role of the hippocampus in memory (Brenda
Milner) • First artificial cell (Thomas Chang) • First Internet Search Engine (Peter Deutsch, Alan Emtage, Bill
Heelan) • Invention of the Charge Coupled Device used in digital cameras
and photocopiers (Willard Boyle, BSc'47, MSc'48 and PhD'50) • Solving how cells protect their DNA from damage (Jack Szostak,
BSc’72) • Discovery of the fastest spinning neutron star (Vicky Kaspi)
HEALTH AFFAIRS
• Canada's first Faculty of medicine, established in 1829 • 4 teaching hospitals affiliated with McGill, including the McGill
University Health Centre, an amalgamation of 6 hospitals and institutes.
• Through its Faculty of Medicine and teaching hospitals, McGill is responsible for tertiary health care services, teaching and research in a region (Réseau universitaire intégré de santé or RUIS) covering 63% of Quebec’s territory – and about 1.7 million people.
TUITION (2017-2018) Rates for Québec students, Canadian non-residents of Quebec, and international students can all be found on the McGill Tuition & Fees website.

5
Quick Facts
MCGILL UNIVERSITY - QUICK FACTS
FOUNDING DATE 1821 INSTITUTIONAL LEADERSHIP Chancellor: Michael A. Meighen Chair, Board of Governors: Stuart H. “Kip” Cobbett (to June 30, 2017) Ram Panda (from July 1, 2017) Principal and Vice-Chancellor: Prof. Suzanne Fortier Provost and Vice-Principal (Academic): Prof. Christopher P. Manfredi CAMPUSES Downtown – 845 Sherbrooke Street West, Montreal, Quebec Macdonald – 21111 Lakeshore Road, Ste. Anne de Bellevue, Quebec FACULTIES AND SCHOOLS 10 faculties and 12 schools
DEGREES GRANTED (in 2015-2016) 9,022 STUDENTS (as of fall 2016) 40,493 FACULTY (tenured and tenure-track) 1,677 RESEARCH FUNDING $473 million awarded in research funding in 2014-2015 (McGill and affiliated hospitals) RHODES SCHOLARS 142 (most of any Canadian University)

6
Organizational Chart

7
LETTER FROM PRINCIPAL AND VICE-CHANCELLOR PROF. SUZANNE FORTIER
Letter from Principal and Vice-Chancellor Prof. Suzanne Fortier
Dear Members of the McGill Community,
I am pleased to introduce the University’s five-year budget plan for Fiscal Years 2017-2018 (FY2018) to 2021-2022 (FY2022). Building on the cautious optimism described in last year’s Budget Book, this budget plan reflects the continuing commitment from government to reinvest in higher education. In its Quebec Economic Plan, Budget 2017-2018, the provincial government committed to considerable investments in university operating funds, research support and student financial aid. Similarly, the federal government continues to invest in science and innovation, as described in its FY2018 budget plan.
Together with other universities in Quebec and Canada, McGill will continue to work collaboratively with the public sector to build on these recent investments in the interest of better solidifying the foundation of financial support for higher education and research.
The budget plan described in this document articulates the way in which McGill University’s priorities for the coming five years will be realized. These activities are in support of the five priorities I have established, as well as the Provost and Vice-Principal (Academic)’s pending strategic academic plan, with the goal of making McGill a more open, connected and purposeful university.
I thank Provost and Vice-Principal Manfredi and his team, as well as all contributing members of the McGill community, for their excellent work in developing this year’s budget.
Sincerely,
Prof. Suzanne Fortier Principal and Vice-Chancellor McGill University

8
FOREWORD – PROF. CHRISTOPHER P. MANFREDI, PROVOST AND VICE PRINCIPAL (ACADEMIC)
Foreword – Prof. Christopher P. Manfredi, Provost and Vice-Principal (Academic) McGill University’s budget enables the implementation of the
University’s strategic plans and initiatives. Based on the Principal’s five priority projects, my own strategic academic plan, the strategic research plan and others, the budget reflects the decisions the University has made regarding its activities for FY2018 to FY2022.
The main source of University revenue is student enrolment, including enrolment-driven provincial government grants and tuition and fees. In its recent budget, the Government of Quebec continued the modest but encouraging reinvestment in higher education first signaled in 2016. Over the coming years, these new funds will have a positive impact on McGill’s financial health, better enabling the University to maintain its status as a world-class institution of higher learning.
The budget plan described in this document continues to support the Principal’s existing priorities, which include improvements to the student experience, the physical state of McGill’s campuses, the enhancement of the University’s partnerships, the realization of our research potential, and the development of the administrative workforce. In addition, the FY2018 budget sets the stage for the initial implementation of the University’s strategic academic plan for the coming years, focusing on five key objectives:
Be open to the world McGill will strive to remain an institution of choice for international students and faculty, and will make a commitment to providing undergraduate and graduate students with a 21st century education by increasing the number of enriched educational opportunities that offer opportunity for global engagement.

9
Expand diversity We will deepen our commitment to excellence and diversity in faculty recruitment and career progression. We will also enhance accessibility for students from underrepresented groups, especially Indigenous students.
Lead innovation We commit to supporting pedagogical and curricular innovation, including increased numbers and availability of active learning classrooms, and the implementation of robust programs to prepare undergraduate and graduate students for the full range of careers available to them, as well as to contribute to the innovation ecosystem of Montreal, Quebec, and Canada.
Connect across disciplines and sectors We will reduce administrative barriers to academic appointments across academic units and facilitate interdisciplinary teaching and research.
Connect with our communities We will embrace our cultural milieu and physical location to build collaborative relationships with educational, commercial and policy sectors in Montreal and Quebec and across Canada.
The Budget Book forecasts an operating deficit of $2.0M for FY2017, slightly lower than the budgeted deficit of $2.7M. I am budgeting deficits of $9.9M, $5.1M, $9.7M and $1.0M in the following four years, followed by a surplus of $3.1 million in FY2022.
Achieving these targets will continue to require the collaboration and good will of the entire McGill community, and the Analysis, Planning, and Budget personnel devoted to budget will be there to accompany units in this process.
I would like to thank the academic and administrative staff in my office and across the University for their commitment to sound financial management and their hard work in contributing to this budget plan. Our collective efforts ensure the ongoing well-being of our great institution.
Christopher P. Manfredi Provost and Vice-Principal (Academic)

10
1 Budget Book FY2018: Executive Summary
McGill prepares its budget on a modified accrual basis. With the exception of unused vacation days, post-retirement benefit obligations, and accrued pension liabilities, which are recorded as year-end audit adjustments, we recognize transactions when the generating activity takes place rather than when the revenue is received or the expense is incurred.
The preparation of McGill’s Budget Book FY2018 has been guided by the following considerations:
• That general funding reinvestments in the Universities from the government announced in the Quebec Economic Plan (March 2017) will flow through the envelopes that comprise the subvention normée (teaching, support, and building and grounds);
• That we have used the most defensible information contained in the public record or as revealed to us in private meetings with officials from MEES;
• That these first two criteria cover each of the operating fund, restricted fund, endowment fund, and plant fund;
• That the Budget Book conforms with the directives of the Board of Governors and its Finance Committee to project revenues and expenses in a five-year framework for the period from May 1, 2017 to April 30, 2022 (FY2018 to FY2022);
• That the budget plan is explicitly designed to meet the targets established by the senior administration in consultation with the Board of Governors;
• That the budgeting process is adequately described with the aim of soliciting input for continuous improvement;
• That uncertainties and risks that could have a negative impact on the University’s financial results are considered;
• That the structure and constraints under which the University operates and how we must report and comply with governmental requirements are explained;
• That we illustrate how proposed future investments are aligned with the strategic objectives of the University.
We present Budget Book FY2018 as a document that supports transparency, accountability, and communication with members of our community. In order to facilitate communication, when a term appears in bold typeface within the text, the reader will find a description in the List of Abbreviations (Appendix 19), or a definition in the Glossary of Terms (Appendix 20).
1.1 FY2017 Key Variances in Budget versus Year-End Forecast
As of March 31, 2017, we forecasted a deficit of $2.0M for FY2017 compared to the initial budgeted deficit of $2.7M.
The most notable positive variances occurring in FY2017 included:
• Higher than anticipated federal grants: $3.0M • Higher than anticipated tuition & fees: $3.5M
These were offset by the following negative variances:
• Additional in-year allocations ($6.0M) • Decreased sales of goods and services ($0.9M)
A summary of variances by revenue and expense category is provided in Appendix 1.
Our projected FY2017 operating deficit of $2.0M is based on management’s best estimate and could fluctuate depending on various year-end adjustments including internal loan repayments and inter-fund transfers. This estimate also excludes year-end audit adjustments.
1.2 Provincial reinvestment over the next five years
With the unveiling of the Quebec Economic Plan (March 2017), universities were pleased to learn that no new cuts had been introduced for FY2017 and beyond. The indexation and additional operating amounts committed were relatively minimal. However, the additional investment committed for infrastructure upgrades was significant: $620M for higher education over three years. When combined with the 2016 federal budget announcement of $2B to be allocated based on matching funds from the

11
province, the new infrastructure envelope available for Quebec higher education over the next three years should therefore be in the order of $1.2B. The study on deferred maintenance finalized by Quebec in 2016 called out the poor state of university infrastructure and has helped support McGill’s requests for investment in this area.
Over the last four years, Quebec universities have seen their operating budgets reduced by an estimated $270M. In FY2015, the MEES had committed to a review of funding formulas, tuition policy, and accountability. Five workgroups linked to review various dimensions were created with an expectation that recommendations would be released in FY2016 and universities believed that the implementation of these recommendations would lead to a reinvestment starting in FY2017. Unfortunately, a significant hiatus occurred with respect to the working group looking at the new weighting grid, and thus no recommendations were released. As such, our five-year budget outlook does not include provisions for changes in the funding formula.
The MEES signaled that it is looking to adopt a new tuition policy for non-Quebec students. McGill continues to actively participate in these discussions.
1.3 Enrolment Forecasts
We base the five-year enrolment forecasts for the University on admissions targets discussed in fall 2016 with each Faculty for all degree programs and service teaching (see Section 7.1.1).
Enrolment-driven grants, related adjustments, and fees account for approximately three-quarters of McGill’s total operating revenues. Revenue forecasts are therefore highly sensitive to enrolment variations.
The total number of full-time equivalent (FTE) regulated students (i.e., those funded by the MEES and for whom basic tuition and supplement are set by the government) is expected to grow by 0.1% in FY2018 and by 1.2% over 5 years (from 30,148 FTEs in FY2017 to 30,502 FTEs in FY2022).
For students registered in deregulated programs, the number of full-time equivalent students is expected to grow by 2.9% in FY2018, and by 8.3% over five years (from 1,813 FTEs in FY2017 to 1,964 in FY2022).
1.4 Academic Renewal
Academic Renewal remains at the top of our strategic priorities and, as a result, related investments will continue in the years to come. FY2017 saw the hiring of 71 new tenure stream staff, and going forward, the number of new hires per year is expected to stabilize at around 65 per year. With departures planned to be approximately 55 each year, the net increase in the annual tenure stream complement should be approximately ten. The objective is to reach a total complement of 1,727 tenure stream staff in FY2022. Costs will nonetheless be contained as the higher salaries of departing senior faculty members will compensate for the cost of additional positions, most of which are expected to be at the entry-level. (See the Academic Renewal Model in Section 7.2.2.)
1.5 Compensation and Salary Policy
Our authorized salary policies for FY2018 are estimated to cost a total of over $16M, including pension and benefits costs.
1.6 Deferred Maintenance
The Board of Governors approved the borrowing of up to $400M in order to address our most urgent builiding deferred maintenance and IT infrastructure needs. During FY2016, the Quebec Ministry of Finance, on recommendation from the MEES, approved the borrowing plan. A bond issuance valued at $160M was transacted in FY2016. Further bonds will be issued in the years to come until the $400M target is reached. Related expenses on the operating budget representing capital payments are expected to be $21M in FY2020, and $27M in each of FY2021 and FY2022. (see Section 7.3.3 and Section 10.)
1.7 Significant one-time and ongoing expenses
The annual cost of financing the pension shortfall, net of cost sharing by plan members, has been included in the five-year model at a cost of $12.9M per annum. Given that the actual amounts depend on interest rates, market returns, and the number and composition of those taking retirement settlements, this is a line item for which we expect a variance

12
when year-end valuations are prepared for the purpose of issuing the audited financial statements.
On the other hand, year-end audit adjustments related to the valuation of post-retirement benefit obligations and accrued pension liabilities are not included within the budget projections. Our actuaries provide these figures after year-end.
An accrual for pay equity of $2M was budgeted in FY2017, given that pay equity maintenance is expected to entail costs of approximately $10M every five years, but with the exact distribution of the total amount unknown.
1.8 Budget Measures
Current budget measures are being maintained. In recognition that our continued investment in the academic complement has left gaps in staff that support these hires, however, effective FY2018, we are allowing the equivalent of four replacements for every five support staff departures, which is distributed to the major units as a monetary value equivalent to the budget measure.
Given the reality of chronic underfunding and uncertainties in the extent of committed liabilities, such as pension and pay equity, caution should be the watchword in spending decisions and additional budget measures may be implemented as necessity dictates.
1.9 Risk factors
As outlined above, the overall picture offers some significant challenges. The current budget outlook leads to a balanced budget by FY2022 with the following assumptions:
• No changes to the MEES funding formula detrimental to McGill; • Interest rates remain low (small increase in rates budgeted); • Currency exchange rates remain at or above $0.75USD; • No significant changes to one-time payments (e.g., pension fund,
pay equity); • adherence to annual operating budgets; • Willingness and ability to effect any required budget measures.
1.10 Projected financed operating revenues, expenses and accumulated deficit
Figure 1 provides the 5-year operating budget outlook while Figure 2 illustrates the total financed accumulated operating deficit.

13
Figure 1: 5-year operating budget outlook
Figure 2: Total Financed Accumulated Deficit – 2017 Projection

14
2 Economic and Political Environment
2.1 Current Economic and Political Realities
The planning represented by the McGill Budget Book FY2018 is shaped by the economic and political environment. Approximately half of McGill’s overall operating budget comes from the Quebec government, largely in support of teaching activities. In addition, the government sets the tuition rates for most of the University’s students, which represents a major source of University revenue, within a mainly regulated framework. The province also supports our research, but on this front, the federal research granting agencies are major contributors. More than half the plant fund revenues are also provided by the Provincial government. The University’s financial position, therefore, is strongly influenced by economic and fiscal factors that affect governments at both levels.
Provincial Funding
On May 19, 2017, the MEES held a meeting with the universities to present the Orientations Budgétaires and the Règles Budgétaires. A new envelope of $66M for the MEES’s réinvestissement was incorporated, with details for distribution of this envelope to follow. As had been reported in the FY2017 Budget Book, stemming from the recommendations of a taskforce on university funding (Chantier sur la politique de financement des universités), McGill is participating in the following workgroups for:
I. Review of funding weights per discipline and level of study;
II. Review of adjustments needed for small regional universities;
III. Review of tuition fees for non-Quebec students;
IV. Review of envelopes for priorities and targeted measures;
V. Review of accountability framework.
1 http://www.budget.finances.gouv.qc.ca/budget/2017-2018/en/documents/Budget1718_Education.pdf
On December 19, 2016, over seven months into the fiscal year, the Règles Budgétaires for FY2017 were received. Two rules were abolished for FY2017: the Frais indirects de recherche subventionnée rule was abolished and the envelope transferred to the volet-recherche of the buildings and grounds envelope, and the Collaboration entre les universités et les collèges rule was abolished outright. In contrast to the Règles budgétaires for FY2016, the parametric envelopes saw a slight increase. Discretionary envelopes, from which McGill does not benefit, also saw a slight increase.
The MEES is pushing hard for the first workgroup to complete its work by fall 2017 with a target of implementing the results for FY2019. Because of the uncertainties of the impact this work might have on McGill’s revenues, this budget book retains the current model for projecting out all five years of revenue originating from this source.
On May 12, 2017, the Stratégie québécoise de la recherche et de l’innovation (SQRI) 2017-2022 was announced with the promise to invest $2.8B in research and innovation over the next five years, including $585M specifically for the SQRI. The goal of the initiative is to make Quebec one of the most innovative and creative societies in the world by 2030, and to this end the strategy outlines 36 measures and seven projects. Of the $585M, $133M is for talent development, including $50M for Mitacs internships; $267M is for research funding of which $40M is targeted to Genome Quebec, and $185M is targeted to commercialization and technology transfer, of which $100M is dedicated to the Artificial Intelligence supercluster, which has already been announced.
In this context, the 2017 Provincial Budget was presented on March 28, 2017. Education was again one of the priorities within the Quebec Economic Plan as illustrated by the separate publication entitled “A Plan for Success: A Lifelong Process from Early Childhood”1. The budget planned nearly $1.5B over the next five years on higher education, with $497M earmarked to improve general funding for universities. $363M was announced to improve student aid in the province. Additional amounts were announced to “enhance the success and integration of all students,” “promote partnerships and collaboration between establishment and the

15
regional presence,” “satisfy labour market needs,” and “other measures.” Of note, while some of this reinvestment begins in FY2018, the bulk comes in the years four and five of the announcement.
Since the MEES has indicated that the $497M will be distributed through the parametric envelopes, McGill’s estimated share has been included in the revenue budget for the next five years.
In terms of IT infrastructure, additional funds are being dedicated towards implementation of the MEES’s digital strategy, at this time consisting of a general online learning portal.
Targeted investments in research, innovation and entrepreneurship were also unveiled in the provincial budget, but a general investment in the Fonds de recherche du Québec of $180M over five years will benefit McGill researchers.
2.2 Federal funding
Considerable federal dollars have traditionally been allocated to universities for research grants and research infrastructure. McGill continues to perform well in programs offered by the major federal agencies for research funding and our revenues are stable from year to year. We have also obtained significant funding through Canada Foundation for Innovation (CFI) for research infrastructure, and in September 2016 it was announced that McGill was awarded $84M over seven years for neuroscience research from the Canada First Research Excellence Fund (CFREF). As has become common practice with many other federal research programs (e.g. CFI, CERC), any such award will need to be accompanied by contributions from the provincial government, external partners and the University.
In its latest budget, released on March 22, 2017, the federal government did not allocate new funding for the Tri-Agencies or the CFI, but two new programs – Canada 150 Research Chairs and Innovations Clusters – were announced as well as additional funding for Mitacs for the training of graduate students with industry. The Fundamental Science Review report, released in April 2017, revealed that Canada’s global research competitiveness has eroded in recent years as funding from federal government sources has stagnated in recent years. We look forward to
working with the government to ensure Canada returns to an internationally competitive research-funding environment in the long term. This budget assumes that McGill will maintain its share of federal research grants and has assumed a commensurate increase in its grant from the Research Support Fund, which assist universities with the indirect costs of research.
From an infrastructure perspective, McGill was awarded over $70M for nine projects from the 2016 budget Post-Secondary Institutions Strategic Investment Fund.
As with the provincial infrastructure reinvestment, additional funds are not incorporated into the budget.
2.3 Interest Rates
Interest rates continue to be at record lows, but are trending towards slight increases.
2.4 Currency Exchange Rate
In part as a result of low interest rates and commodity prices, the Canadian dollar has continued to decrease in value over the past three years as compared to its American counterpart. From trading at par in January 2013 to valuations of $0.90 USD in January 2014, $0.80 USD in January 2015, and below $0.70 USD in January 2016, the Canadian dollar has since rebounded and was trading at the end of March 2017 at around $0.75 USD. Median forecasts suggest that the dollar will weaken to around $0.74 USD mark by the end of 2017. Still, there are strong indications that as the U.S. Federal Reserve raises its rates, the Canadian dollar may weaken further.
Effectively, this makes McGill’s tuition significantly lower for American students than it has been in recent years. This will no doubt increase McGill’s appeal to our neighbours south of the border. Conversely, the costs of many of the goods purchased using US currency, including library serial collections, books, and research equipment have increased at the same rate. A lower Canadian dollar may also make McGill less attractive when recruiting and retaining the talented faculty from other countries.

16
2.5 Inflation
Inflation remains relatively low; having increased from 1.6% in 20162 the rate is expected to end 2017 at 2.0% and to average slightly above 2.0% in 2018. Both the provincial grant and tuition are typically adjusted according to the disposable income in Quebec, although with a time lag.
The cost of several items in the University’s basket of goods typically increases more rapidly than inflation. Chief among these is salaries. As well, the cost of books and serials, and many research supplies have increased significantly and is predicted to continue to increase more quickly than inflation. A significant portion of these purchases is also affected by volatility in exchange rates.
In terms of energy costs, the past year saw the market price of natural gas continue to drop, resulting in a 20% savings for McGill’s portfolio. McGill operates using a three-year portfolio consumption approach for the purchase of natural gas that is proving effective in balancing risks and costs while allowing for improved budgetary forecasts. Natural gas distribution services are forecasted to increase by approximately 1% in the coming year. An increase of 2% for electricity rates in the coming year has also been confirmed by the Québec Energy Board. Given the monopolies over electricity and natural gas distribution in the province, it is not possible to use financial instruments to hedge against the impact of rate increases.
From a budget planning perspective, apart from salary policy, additional resources are typically not allocated to deal specifically with inflation. From time to time, allocation parameters are updated and adjustments are made to deal with sizeable changes in big ticket items (e.g., library collections), but in the majority of cases the University counts on units finding ways to adjust their operations in order to meet the higher costs.
2.6 Tuition and fees
Tuition revenues are discussed in detail in section 7.1.3. Apart from the ability to set tuition for a few self-funded programs and those of undergraduate international students registered in deregulated activities under selected disciplines, our tuition framework for all other students is
2 CPI Index, refer to https://www.focus-economics.com/country-indicator/canada/inflation
set by the MEES according to mechanisms established in 2013. All regulated students pay a base tuition fee, or “Quebec tuition.” This tuition is indexed by the rate of increase of disposable family revenue per inhabitant from two years back as published by the Quebec Statistics Institute (i.e., the 2017-2018 tuition increase is based on the increase between 2015 and 2014), confirmed annually by the MEES. For 2017-2018, Quebec tuition will increase by 2.7% or $63 per year for a full-time student. The same rate applies to all our ancillary fees as well unless an agreement is reached with the students to apply a higher rate.
Non-Quebec Canadian (NQC) students are charged an additional out-of-province supplement (or forfaitaire) to bring their total tuition bill to the average tuition paid in the rest of the provinces. This supplement is returned to the government. As of fall 2015, undergraduate students from France who were previously assessed as Quebec residents, started paying the same as non-Quebec Canadians (currently registered students from France were grandfathered) with the supplement being clawed back by the MEES as it is for the non-Quebec Canadians. Graduate students from France will continue to pay the Quebec rates. The NQC supplement will be indexed by 2.29% or $112.20 per year for a full-time student starting in fall 2017.
Regulated international students are also charged an additional supplement (or forfaitaire) that is returned to the government. Universities are allowed to charge an additional 10% over and above the forfaitaire to help cover the costs of recruitment and support related to this population. The international student supplements will increase by 2.7% or between $294 and $380 per year for a full-time student starting in fall 2017.
2.7 Regulatory Environment
Pension Funds
The McGill University Pension Plan (MUPP) is a hybrid plan with both a defined benefit and a defined contribution component for McGill employees enrolled before January 1, 2009, and a defined contribution only for those hired after that date. Under government regulations, every three years McGill’s pension plan is required to undertake an

17
actuarial valuation exercise. The most recent actuarial variation of the pension plans for funding purposes was at December 31, 2015, and the next required valuation will be no later than as at December 31, 2018. Increased longevity not foreseen in the design of the plan has contributed to a deficit for those who were allowed to buy internal annuities prior to January 1, 2011. In addition, lower interest rates and equity returns since the 2008 financial crisis have further exacerbated financial shortfalls in the MUPP.
The University is obliged to make supplementary contributions from the operating budget to the pension plan to make up for any shortfalls in the ability to cover the defined pension benefits to departing employees as well as shortfalls in annuity plans written for some retirees. These supplementary contributions are expected to continue to represent a considerable expense over the coming years.3 Amendments have been made to the MUPP, including Amendment 24, which has several provisions including cost sharing of the pension shortfall starting January 1, 2014 for MUPP members eligible for the defined benefit portion of the plan.
Immigration and Work Permits
Over the past several years, the federal government has tightened certain rules and regulations for renewing work permits. For example, recruiting or retaining a professor who has an existing right to work in another country but who would lose that status by applying for Canadian permanent residence rather than simply holding a work permit, might be discouraged from accepting employment.
Work permit renewals for citizens of countries with which Canada does not have a free trade agreement require an application to be submitted and a relevant fee to be paid. This complicates the process for Assistant Professors who seek to renew their work permit in line with their pre-tenure reappointment, following their initial three-year appointment.
The Quebec government has tightened both French and English language requirements to qualify for immigrant status, entailing increased costs for demonstrating language competence, but also posing challenging time limits for mid-career and senior scholars to acquire the language
3 McGill University, Information for employees in the hybrid pension plan (hired before 2009), https://www.mcgill.ca/hr/pre-2009
competency needed under Quebec’s immigration point system. The Quebec processing times have increased as well, which has resulted in the necessity of renewing work permits instead of professors acquiring permanent residency. These regulations and factors also present budgetary challenges.
Citizenship and Immigration Canada (CIC) requires employers of temporary workers, including research trainees and postdoctoral fellows, to submit forms and pay application and compliance fees. Similar bureaucratic processes affect many contract academic staff, such as visiting professors, while the costs are borne by the academic units supporting these students, visitors and staff.
Inspection of buildings – higher safety norms
In 2013, in order to protect the public against the hazards caused by materials falling from buildings, the provincial government updated its building safety code (Bill 122) requiring the inspection of high-rise building façades and multi-level parking lots on a regular basis. The requirement to inspect more frequently and proceed with immediate repair work has resulted in significant additional costs for the University. This will be a priority within the deferred maintenance work performed in the next few years.

18
3 Enterprise Risk Management (ERM)
The Enterprise Risk Management (ERM) initiative was first mandated by the Audit Committee of the Board of Governors in late 2009. Reporting to the Vice-Principal, Administration and Finance, Risk Management and Insurance reports annually to the Audit Committee regarding the ongoing evolution of the ERM initiative. The ERM process provides a disciplined methodology to report and track mitigation plans aimed at managing the potential adverse effects of identifiable risks.
Several units completed the risk register exercise, and a list of the Top Risks was generated and updated over the years. In order to further advance the maturity of ERM at McGill, a refresh of the Top Risks was initiated through targeted discussions with the Principal and her executive team. The results of these exercises have elevated the visibility and value of the ERM initiative at the most senior level. The ERM process has provided a means to identify and focus on McGill’s key risks and to evaluate their potential impact upon the strategic direction of the University. These are milestones for the ERM program, and the significance speaks to ERM evolving at McGill. The evolution is evident – previous top risks were operational in nature, while the new risks are strategic overarching risks that affect the University as a whole. There is also a clear connection to the Principal’s Priorities. Below is a diagram of the updated top risk categories:
Figure 3: McGill University’s Updated Top Risk Categories
This past year, the focus of the ERM program included the development of the action plans for each of the Top Risks. It involved validating the initial action plans previously identified and modifying them as necessary, and outlining specific actions that would be put into place to address each Risk Statement. An Action Plan Owner was assigned to support the Risk Owner where appropriate. Costs, including staff or other resources, and time estimates were also identified in this stage. A self-assessment questionnaire was developed to permit the Risk Owner to reflect on the action plans they were proposing. This phase’s emphasis was also on creating an action plan that would either decrease the likelihood or the severity of the particular risk.
Going forward, the attention has now shifted to the implementation and tracking of these concrete action plans. The main tasks involve validating with each Risk Owner and/or Action Plan Owner regarding the progress of their plans, as well as their expected completion date.
The next steps involve an ongoing monitoring of the existing Top Risks with the Principal’s Executive Team to identify potential changes in the risk profile as we continue to capture new and emerging risks that the University may face. The Operational Risks that were earlier identified when ERM was first initiated at McGill using facilitated workshops will continue to be reviewed and updated during this period.
As such, the ERM cycle continues to evolve by following best practices and industry standards, and also incorporating and adapting it to McGill’s culture and environment.
CROSS FUNCTIONAL AND EMERGING VIEW OF RISKS
FUN
CTIO
NAL
RIS
K VI
EW
Business Continuity
Compliance
Information Technology
Infrastructure & Facilities
Recruitment & Retention
Public
Financial

19
4 Overall Budget: Design and Framework of McGill’s Budget
This section describes the overall budget design and framework that is employed by McGill University. The budget processes used at McGill are variants on the so-called “Provostial model” that is widely employed by major North American research universities, both public and private. Within that model, and McGill’s implementation of it, the Provost and Vice-Principal (Academic) (PVPA) serves as the University’s chief academic officer and ensures the alignment of resource allocations with the institution’s priorities, objectives and goals by serving as well as the chief budget officer.
4.1 Budget Cycle
In preparing McGill’s budget, the PVPA consults directly with the Principal, Vice-Principals, the Deans, and other senior administrators, as well as with the two governance bodies of the University, Senate and Board of Governors. The community-at-large is kept informed of developments prior to finalizing the budget and submitting it to the Board of Governors for approval.
The major presentations occur as follows:
1. November: “Budget Presentation 1” provides a general orientation to the major parameters that are likely to have an impact on the revenues and expenses for the coming year(s). The Finance Committee of the Board provides advice and counsel on these matters and Senate is apprised of their general directions.
2. February: “Budget Presentation 2” goes into significantly more detail
on the budgetary outlook. It also provides updates on the trajectory of revenues and expenses in the current year. Estimates of current year-end results are presented to Senate, the Board of Governors and various committees, as well as with the Principal’s cabinet and the Deans. The targets for the upcoming year are finalized for each academic and administrative unit.
3. April: Before the start of the new fiscal year on May 1, and after it has been presented to the Principal and the Vice-Principals, a presentation of the final budget in draft gives the Finance Committee and the whole Board the opportunity for final input on the draft budget before seeking final approval from the Board of Governors. It is then presented to Senate, and the entire McGill community for information. The Budget Book itself is made available on the PVPA’s website once finalized. For ease of reference, the term “Budget Presentation 3” is used to represent this process in the timeline presented. A schedule of this year’s timeline is presented in Figure 4.
Figure 4: Budget Cycle
The calendar that governs the availability of key information that informs budget status and budget progress is being evaluated with a view toward rationalizing the process to increase its informative value and usefulness. Furthermore, system limitations are being examined to ensure that budget progress monitoring can be timely and informative, even as McGill looks forward to the implementation of a modern finance and budget planning tool.
4.2 Design of the FY2018-2022 Budget
The overall University budget is comprised of four funds:
1. Operating Fund (unrestricted) 2. Restricted Fund (mostly research) 3. Endowment Fund 4. Plant Fund

20
The first two funds deal with activities normally associated with the University’s day-to-day teaching and research operations. The primary difference between these two funds is that monies received with external restrictions on their use (e.g., research grants and research contracts) need to be recorded in the restricted fund and cannot cross-over to cover shortfalls in the operating fund. Of course, the associated expenditures must also be recorded separately to facilitate tracking and reporting. The endowment fund consists of all assets related to gifts, donations, and bequests, including those for named chairs, financial aid, research support, and other specific purposes for which the principal has been awarded to the University to be held in perpetuity. The plant fund records all revenues from sources other than operating or restricted funds that are specifically earmarked for the acquisition, construction, and/or renovation of capital assets like buildings, IT infrastructure, and other property.
Figure 5 provides a schematic of the most prevalent components of the University’s budget planning for the operating fund and provides indications as to possible impacts on other funds.
Figure 5: High-level illustration of Budget Planning (Operating Fund)
Figure 6 provides a breakdown of the overall revenues for each of the four funds. No revenues appear for the endowment fund, as revenues earned
from Endowment investments are distributed according to a predetermined rate to the operating fund and restricted fund.
Figure 6: Breakdown of overall revenues ($M)
Appendix 3 illustrates the overall combination of the four funds into one column, for three years: the FY2016 actual, the FY2017 forecast and the FY2018 budget. While all four funds are important, particular attention is put on the operating fund as it is through this fund that the University has most discretion and pays for the vast majority of its operations. Changes to the University’s net asset positions are shown in Appendix 4.
Section 7 (operating fund), Section 8 (restricted fund), Section 9 (endowment fund) and Section 10 (plant fund) provide descriptive elements related to each of the respective funds.

21
4.3 A multi-year, multi-fund Budgetary Framework
The multi-year, multi-fund framework integrates and aligns McGill’s planning, budgeting, and reporting processes across all units of the University. Under this framework financial tools are developed, metrics that facilitate the planning, analysis, and management of unit budgets are shared and linked to performance measures and targets. The Framework encompasses four components:
1) Overall Strategic backdrop
The Principal’s five priorities, the PVPA’s strategic academic plan, and the strategic research plan serve as the backdrop to help frame the strategic priorities and objectives of the University (refer to Section 5).
2) Multi-Year, Multi-fund Budget Development Process
Based on the broad parameters at the University-level, estimates of revenues, major projects, deficit targets and budget measures allow the University to develop an overall multi-year, multi-fund budget. Input from the institutional stakeholders feeds this iterative process, which culminates in the Board of Governors approval.
3) Budget Planning Agreements
The budget planning agreement process aims to develop timely operational and financial plans that are used as inputs into the overall multi-year McGill budget plan. The process includes outlining the elements of the unit plans with identified activities and defined timelines both at the institutional level and at the Faculty and Administrative Unit level. These budget planning agreements align unit activities and financial plans at the major organization level with the strategic objectives of the University. The documents are co-authored between each Faculty and administrative unit and the office of the Associate Provost (Academic Priorities and Resource Allocation) who helps ensure that:
i. Financial requests are adequately justified; ii. All relevant academic and financial aspects of a proposed
initiative are taken into account; iii. The three-year financial plans are coherent; and
iv. Performance indicators and targets are captured in order to measure progress towards achieving objectives
4) Financial Budget Model
The Financial Budget Model (FBM) is a multi-year, multi-fund financial tool that allows units to input their three-year financial plans (all resources) and across all fund types) based on the allocations confirmed in the budget planning agreements. The organization-level FBMs then roll up into a consolidated multi-year, multi-fund budget plan for the University.

22
5 McGill University Strategic Plans
5.1 Principal’s Priorities
Since her appointment in 2013, Principal Suzanne Fortier engaged in conversation and consultation across the University to identify McGill’s priority areas for action. Five priority areas constitute a framework for implementing strategic objectives by means of specific and concrete projects:
1) The McGill Commitment: Providing all students with a stimulating, innovative, and inquiry-based educational experience.
• Cultivating a seamless continuum from the classroom to the world • Re-imagining the curriculum and co-curricular activities • Re-energizing advising, supervising and mentoring • Combining life and learning in a single, unique, innovative higher
education experience for all McGill students
2) Unleashing Our Full Research Potential: Laying the foundation for McGill to excel in the increasingly competitive and challenging global research environment.
• Ensuring McGill remains one of the world’s top research-intensive universities
• Extending the global impact of McGill’s research activities • Encouraging new and stronger partnerships • Delivering efficient support for researchers and quality research
experiences for trainees • Tapping into, and contributing to, the worldwide pool of knowledge
3) Enhancing Our Community Partnerships: Making McGill a responsive and dynamic collaborator with a wide range of communities and partners, locally, nationally and globally.
• Nurturing lifelong and mutually beneficial relationships between McGill and its global community of alumni, parents, friends and supporters
• Fostering an atmosphere of innovation, creativity and discovery that encourages and benefits from industry, community and university partnerships
• Increasing McGill’s visibility as a welcoming, open place in order to reach and engage external partners locally, nationally and globally
4) My Workplace: Turning McGill into a true learning organization, where administrative and support staff are empowered to use their knowledge to increase agility and effectiveness. • Empowering employees to identify opportunities for greater
efficiency, simplification and process improvement • Better aligning McGill’s resources to needs and priorities • Identifying measures to ensure that hiring of new administrative
staff is done strategically • Using technological tools to make McGill’s operations more
efficient • Continuing to ensure that employees are well trained for their jobs,
and developing more ways for them to learn from each other • Encouraging a culture that embraces changes and welcomes new
ideas
5) Transforming Our Campus: Providing our physical and virtual campuses with the resources necessary to continue our mission in a sustainable, safe and welcoming environment. • Developing a Campus Space Plan for the next 10-15 years. The plan
will guide the University’s campus development, particularly with regard to our most critical space needs, major renovation requirements, and property acquisitions and disposals
• Continuing the program started in 2009 to improve campus green spaces, to develop more exterior student spaces, and more sustainable landscapes
• Improving the University’s classrooms and teaching labs by undertaking major renovations and equipment renewal and including “active”, collaborative and innovative teaching environments
23
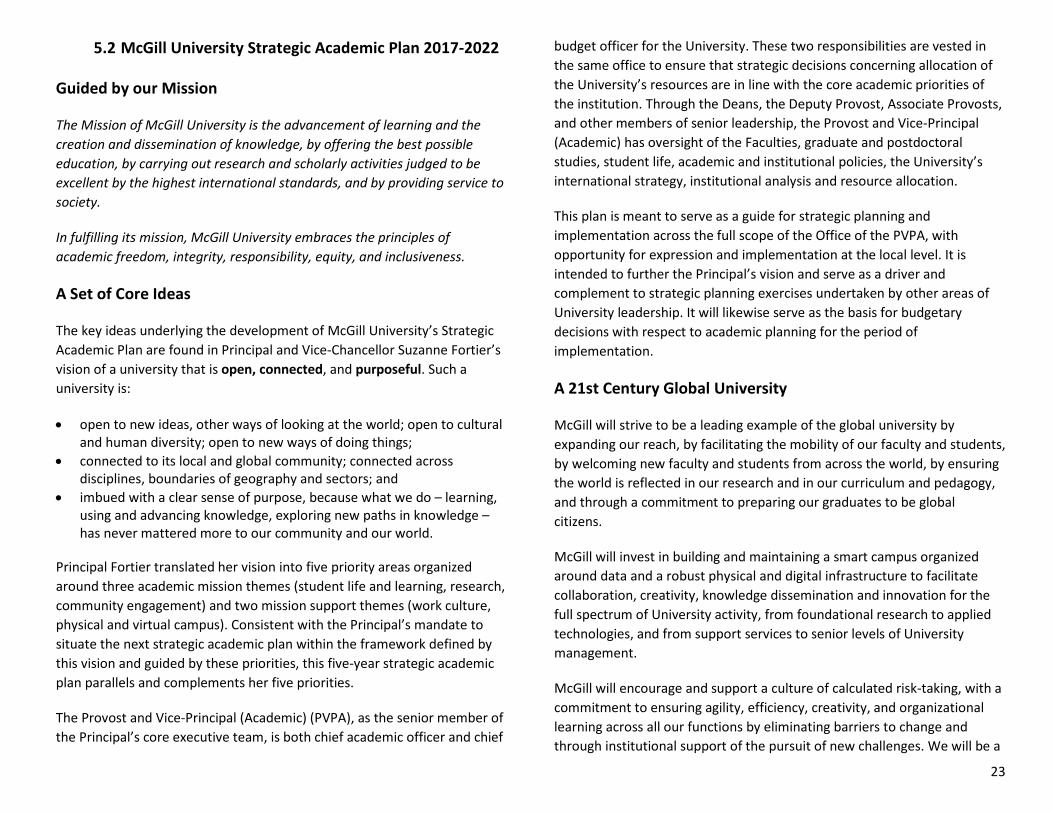
5.2 McGill University Strategic Academic Plan 2017-2022
Guided by our Mission
The Mission of McGill University is the advancement of learning and the creation and dissemination of knowledge, by offering the best possible education, by carrying out research and scholarly activities judged to be excellent by the highest international standards, and by providing service to society.
In fulfilling its mission, McGill University embraces the principles of academic freedom, integrity, responsibility, equity, and inclusiveness.
A Set of Core Ideas
The key ideas underlying the development of McGill University’s Strategic Academic Plan are found in Principal and Vice-Chancellor Suzanne Fortier’s vision of a university that is open, connected, and purposeful. Such a university is:
• open to new ideas, other ways of looking at the world; open to cultural and human diversity; open to new ways of doing things;
• connected to its local and global community; connected across disciplines, boundaries of geography and sectors; and
• imbued with a clear sense of purpose, because what we do – learning, using and advancing knowledge, exploring new paths in knowledge – has never mattered more to our community and our world.
Principal Fortier translated her vision into five priority areas organized around three academic mission themes (student life and learning, research, community engagement) and two mission support themes (work culture, physical and virtual campus). Consistent with the Principal’s mandate to situate the next strategic academic plan within the framework defined by this vision and guided by these priorities, this five-year strategic academic plan parallels and complements her five priorities.
The Provost and Vice-Principal (Academic) (PVPA), as the senior member of the Principal’s core executive team, is both chief academic officer and chief
budget officer for the University. These two responsibilities are vested in the same office to ensure that strategic decisions concerning allocation of the University’s resources are in line with the core academic priorities of the institution. Through the Deans, the Deputy Provost, Associate Provosts, and other members of senior leadership, the Provost and Vice-Principal (Academic) has oversight of the Faculties, graduate and postdoctoral studies, student life, academic and institutional policies, the University’s international strategy, institutional analysis and resource allocation.
This plan is meant to serve as a guide for strategic planning and implementation across the full scope of the Office of the PVPA, with opportunity for expression and implementation at the local level. It is intended to further the Principal’s vision and serve as a driver and complement to strategic planning exercises undertaken by other areas of University leadership. It will likewise serve as the basis for budgetary decisions with respect to academic planning for the period of implementation.
A 21st Century Global University
McGill will strive to be a leading example of the global university by expanding our reach, by facilitating the mobility of our faculty and students, by welcoming new faculty and students from across the world, by ensuring the world is reflected in our research and in our curriculum and pedagogy, and through a commitment to preparing our graduates to be global citizens.
McGill will invest in building and maintaining a smart campus organized around data and a robust physical and digital infrastructure to facilitate collaboration, creativity, knowledge dissemination and innovation for the full spectrum of University activity, from foundational research to applied technologies, and from support services to senior levels of University management.
McGill will encourage and support a culture of calculated risk-taking, with a commitment to ensuring agility, efficiency, creativity, and organizational learning across all our functions by eliminating barriers to change and through institutional support of the pursuit of new challenges. We will be a

24
university whose teaching and research has direct impact by embracing innovation and responding to the needs of its students and the challenges of the communities to which it is connected.
No university can lead globally in the 21st century without putting sustainability at the centre of its operations, research, and teaching. To this end, McGill will leverage the Advisory Council on Sustainability to promote carbon neutrality, climate literacy, climate resilience, and the development of sustainability-focused research and teaching. We will work with various sectors of the University to implement additional institution-level programs to facilitate individual and collective action to reduce the University’s carbon footprint, including reducing and/or offsetting carbon-intensive university travel.
This commitment to sustainability also applies to the well-being of all of our community members. McGill will continue to develop more robust support services, including mental health services, for students, faculty and staff across the institution.
Five Key Objectives
Be open to the world
McGill will strive to remain an institution of choice for international students and faculty. Our objective is to maintain international undergraduate student enrolment at 25-30% and continue to be a leader in attracting top graduate students from around the world, while developing an academic complement that places us among the top ten North American research universities for proportion of faculty of international origin.4
We will also make a commitment to providing undergraduate and graduate students with a 21st century education by increasing the number of enriched educational opportunities that create occasion for global
4 International undergraduate enrolment is currently 27%; combined Masters and Doctoral international enrolment is currently 34.4%; and McGill ranks 11th among Association of American Universities (AAU) institutions with respect to international faculty. 5 Current student mobility funding is approximately $1.5M annually. 6 The proportion is currently 20.5%.
engagement through internships, field courses and field semesters, research internships, international competitions, and international exchanges. In particular, we will double the proportion of undergraduate students undertaking these global engagements. To facilitate this, over the next five years we will establish a special enriched annual educational opportunities and student mobility fund of $5M,5 reduce administrative barriers to achieving transfer credit, and expand the number of co-tutelle programs with partner universities.
We will further enhance McGill’s presence abroad by developing key partnerships to support research activity and delivery of academic programs outside of Canada and online, and by facilitating the international engagement of our faculty members.
Expand diversity
McGill University believes that social, economic, and intellectual diversity among our student body and workforce is a matter both of fairness and of enriching the advancement of our academic mission. Opportunities for intellectual, academic, and professional growth flourish in communities that reflect a diverse set of social identities and experiences.
We will deepen our commitment to excellence and diversity in faculty recruitment and career progression. To this end, McGill aims to increase the proportion of women at the rank of full professor to 25% in five years,6 and to increase the proportion of all tenured and tenure-track staff self-identifying as members of all other equity groups to 20%.7
We will also enhance accessibility for students from underrepresented groups, especially Indigenous students, with the goal of increasing Indigenous student enrolment to 1000 University-wide by developing pathway programs in partnership with Indigenous communities.8 In pursuit of accessibility, we will aim to increase student aid from all sources to 30%
7 The most recent year for which employment equity data are available is 2015. These data indicate that for the three federally-designated equity groups other than women, the proportion is 12%. 8 Current self-identified Indigenous student enrolment is approximately 300.

25
of total net tuition revenues.9 Beyond financial assistance, we will also take measures that enhance physical accessibility and cultural inclusivity in support of student success.
McGill will likewise support policies and take actions that strongly protect freedom and diversity of inquiry and intellectual exchange, respecting openness to the broad range of intellectual points of view that is a crucial element of diversity.
Lead innovation
We commit to supporting pedagogical and curricular innovation, including increased numbers and availability of collaborative and active learning classrooms, and the implementation of robust programs to prepare undergraduate and graduate students for the full range of careers available to them, as well as to contribute to the innovation ecosystem of Montreal, Quebec, and Canada. In the spirit of institutional risk-taking McGill will diversify on-campus academic programming and modes of delivery, explore alternatives to traditional degree organization and academic timetabling. We will likewise accelerate the development and delivery of online degree programs and professional Masters programs, with the goal of implementing five online programs in five years.
The University is also committed to exploring and implementing new modes of organizing intellectual activity, including alternatives to traditional single-discipline departments and investment in new information technologies with a view to connecting our academic history and traditions with emerging fields, modes of inquiry and fora for knowledge transfer and dissemination.
Connect across disciplines and sectors
We will reduce administrative barriers to academic appointments across academic units and facilitate interdisciplinary teaching and research. In support of interdisciplinary efforts, the University will invest resources (human and financial) in large interdisciplinary and inter-sectoral projects,
9 Current proportion of net tuition revenues directed to student aid is 25%.
including interdisciplinary degree programs. It will refine policies and practices to ensure faculty members have meaningful incentives to connect across disciplines and beyond the scholarly community, and review academic performance criteria to better assess and credit interdisciplinary work.
Connect with our communities
We will embrace our cultural milieu and physical location to build collaborative relationships with educational, commercial and policy sectors in Montreal and Quebec and across Canada. We will aim to increase application and yield rates from Quebec CEGEPs to ensure that we are the institution of choice for Quebec’s best students. Because McGill is anchored in Quebec, we will focus in particular on the French language CEGEP system, with a target of increasing new registrations from that system by 15% over five years. The University will also enhance internship and entrepreneurship opportunities for undergraduate and graduate students, thus linking on-campus learning with first-hand experience in a variety of related employment sectors.
We will encourage and facilitate activities that allow all our members to engage in activities that serve their local communities, as well as the broader world.
A Clear Mission for the Office of the Provost and Vice-Principal (Academic)
To facilitate implementation of the strategic academic plan, the Office of the Provost and Vice-Principal (Academic) (OPVPA) will be guided by a clear mission statement.
The OPVPA will ensure that university policies and practices, in both design and implementation, maximize institutional efficiency and local empowerment. While ensuring adherence to University standards, the OPVPA will strive to facilitate local expression and implementation of McGill’s academic mission. The OPVPA will also provide administrative

26
assistance, encouragement, support, and strategic guidance to academic units. The OPVPA will be further guided by principles of collaboration and integration, both across its own functions and in relation to other University units and offices.
In executing this mission, the OPVPA will provide the Provost and Vice-Principal (Academic) (PVPA) with high-level, professional support in fulfilling the office’s key mandate to plan, develop, and implement McGill’s strategic academic plan; to develop and execute the University’s budget framework and process; and to ensure alignment of the University’s resources with academic priorities.
5.3 McGill Strategic Research Plan 2013-2017
The McGill Strategic Research Plan 2013-17 (SRP) was endorsed by the University Senate in November 2012 and by the Board of Governors in February 2013. A new plan to replace the current Strategic Research Plan will be put in place soon after the new Vice-Principal (Research and Innovation) takes her position in July 2017.
5.4 McGill University Physical Master Plan
The McGill University Physical Master Plan was developed with extensive consultation with McGill and greater Montreal communities. The plan was approved by the Board of Governors in April 2008 and continues to be updated.
In support of the University’s mission, this Master Plan was intended to guide infrastructure projects and future physical growth in order to help create a dynamic intellectual community and academic experience. Guided by nine overarching principles, the Plan was designed to modernize both the Downtown and Macdonald campuses, improve spaces for teaching and research, steward our historic and green spaces to further campus sustainability, and ensure that future development meets the needs of the McGill community.
Base budget increases are allocated to address the needs as well as make provisions for increased costs associated with rentals, renovations, and project management.
5.5 Royal Victoria Hospital Feasibility Study
The University is undertaking a feasibility study in partnership with the Quebec government to determine the potential for McGill to make use of the Royal Victoria Hospital site to address its pressing space deficit. The RVH site, now vacant, could be transformed into modern academic and research space. This study is expected to cost $8.0M, shared equally between the Quebec government and McGill. The final project could cost as much as $1B.
Principal Fortier has championed the project in various public announcements, outlining that the RVH site will:
• Provide approximately 700,000 square feet of space, vital to mitigate McGill’s space deficit
• Create a real estate reserve that will ensure McGill’s long-term development
• Create a landmark site that will be the pride of Montreal, Quebec, and the McGill community

27
6 Goals and Objectives of the University, Faculties and Administrative Units
The organizational chart found at the beginning of the document presents the University’s leadership structure.
For the purposes of McGill’s Budget Book, academic units refer to ten Faculties, the School of Continuing Studies, and McGill University Library and Archives. Administrative units are high-level entities, generally at the Vice-Principal level, with exceptions such as the Office of the Deputy Provost (Student Life and Learning) and the Office of the Dean of Graduate and Postdoctoral Studies. Units may have sub-components, but the allocations described herein generally refer to the top level of each organization.
McGill’s academic and administrative units, as described above, all contribute to the design and development of the University’s strategic plans. Consequently, they have the responsibility for aligning their specific goals, objectives and actions with the Principal’s five priority areas.
To that end, the Office of the PVPA enters into annual budget planning agreement with each academic and administrative unit. The multi-year and multi-fund budget planning agreement describes various actions pertaining to the academic or administrative unit’s development objectives and priorities within the context of the University’s strengths and values. Each academic and administrative unit at McGill is expected to find concrete and specific expressions and actions for the Principal’s five priority areas.
Units are allocated budgets from the University’s overall operating fund, and generate revenue from other sources which are usually, but not exclusively, restricted, such as research grants, contracts, annual donations, or endowed gifts. Appendices 5 through 8 provide three years of historical operating fund and restricted fund financials, which represent the resources that have been available to each major unit on the above-noted organizational chart. A historical breakdown of employee FTE or headcounts by unit is presented in Appendices 10 and 11.
6.1 Academic Units
The ten Faculties, the School of Continuing Studies, and the Library and Archives are each led by a Dean, who is appointed for a renewable five-year term.The Dean’s mandate is to ensure the academic unit carries out teaching, research and/or other scholarly activities that meet the highest international standards of excellence.
The Deans, in consultation with the PVPA, align their plans with the overall University strategic priorities and objectives. The academic units are:
Faculty of Agricultural and Environmental Sciences www.mcgill.ca/macdonald/
Faculty of Arts www.mcgill.ca/arts/
School of Continuing Studies www.mcgill.ca/continuingstudies/
Faculty of Dentistry www.mcgill.ca/dentistry/
Faculty of Education www.mcgill.ca/education/
Faculty of Engineering www.mcgill.ca/engineering/
Faculty of Law www.mcgill.ca/law/
Desautels Faculty of Management www.mcgill.ca/desautels/
Faculty of Medicine (Deanery and Vice-Principal Health Affairs) www.mcgill.ca/medicine/
Schulich School of Music www.mcgill.ca/music/
Faculty of Science www.mcgill.ca/science/
McGill University Library and Archives www.mcgill.ca/library/
For additional information on the academic units, including goals and objectives, please refer to the corresponding websites.

28
Each Dean administers the affairs, academic and administrative, of her or his unit, including the preparation of the budget and unit plans, in consultation with department chairs and directors. As indicative of each academic unit’s share, Figure 7 below shows the breakdown of the total operating budget devoted to academic units for FY2018.
Figure 7: FY2018 Academic Unit Operating Budget: $484.2M (58.7% of total University budget)
6.2 Administrative Units
Administrative units support one or more of the following University essential missions: teaching, research and community service. The administrative units are:
Principal and Vice-Chancellor http://www.mcgill.ca/principal/
Provost and Vice-Principal (Academic) http://www.mcgill.ca/provost/
Student Life and Learning http://www.mcgill.ca/studentlifeandlearning/
Graduate and Postdoctoral Studies http://mcgill.ca/gps/
Administration and Finance http://www.mcgill.ca/vpadmin/
Research and Innovation http://www.mcgill.ca/research/
University Advancement http://www.mcgill.ca/vp-dar/vp-university-advancement
Communications and External Relations http://www.mcgill.ca/communications/vp
Secretariat http://www.mcgill.ca/secretariat/
Legal Services http://www.mcgill.ca/legal/
As indicative of each administrative unit’s share, Figure 8 shows the breakdown of the total operating budget devoted to administrative units for FY2018.
Institutional Services are central revenues and expenses not initially attributed to a specific unit.

29
Figure 8: FY2018 Administrative Unit Operating Budget: $340.8M (41.3% of total University budget)
6.3 Partners
6.3.1 McGill University Affiliated Hospitals
The teaching hospital network of McGill University is an integral part of the research, teaching, and clinical activities of the Faculty of Medicine and the reason why the Dean of Medicine is also the Vice-Principal (Health Affairs). By agreement and tradition, the administration, medical staff, and scientific personnel of these institutions are closely integrated with McGill University and form the basis of the clinical departments of the Faculty of Medicine. Some of these hospitals include:
The Douglas Mental Health University Institute www.douglas.qc.ca
The McGill University Health Centre (MUHC) www.muhc.ca
Sir Mortimer B. Davis - Jewish General Hospital www.jgh.ca/
St. Mary's Hospital Centre www.smhc.qc.ca/en/
In addition, the University is affiliated with the various research institutes associated with each teaching hospital, the largest one of which is the MUHC Research Institute (MUHC-RI). As part of its association, McGill and the MUHC-RI signed an agreement in March 2015 whereby the MUHC and MUHC-RI will pay for compensation of agreed upon tenured and tenure-track academic staff of the Faculty appointed to the MUHC-RI up to an annual maximum of $3.5M. This agreement expires March 31, 2020.
6.3.2 Other Affiliated units
The University keeps close ties, at times sharing services, with other separate entities, including student and staff associations. The list of affiliated units, including student and staff groups, includes:
Unions, Employee Associations, Student and Staff groups:
• Association of McGill Support Employees – non-academic casuals (AMUSE)
• Association of McGill Support Employees – Floor Fellows (AMUSE) • Association of McGill Research Employees – Research Associates &
Research Assistants (AMURE) • Association of McGill Research Employees- Post-Doctoral Fellows
(AMURE) • Association of Graduate Students employed at McGill – Teaching
Assistants and Demonstrators (AGSEM/TAs) • Association of Graduate Students employed at McGill – Invigilators
(AGSEM/Invg.) • The service Employees Union, Local 800, QFL – Facilities
Management/Residences/Faculty Club • The service Employees Union, Local 800, QFL – Printing services • The service Employees Union, Local 800, QFL – Computing Center • The service Employees Union, Local 800, QFL – Trades Downtown

30
• The service Employees Union, Local 800, QFL – Power House Downtown
• The service Employees Union, Local 800, QFL – Power house and Trades MacDonald Campus
• McGill Course Lecturers and Instructors Union (MCLIU) • Macdonald Campus Student Society (MCSS) • McGill Association of University Teachers (MAUT) • McGill Student Society (SSMU) • McGill University Non-Academic Certified Association (MUNACA) • McGill University Non-Academic Staff Association (MUNASA) • McGill Women’s Networking Group • Post-Graduate Students’ Society (PGSS)
Some other groups include:
• McCord Museum • McGill Childcare Centre • McGill – MCH Learning Centre (The Learning Centre of Quebec) • McGill – Queens University Press • Mont-St-Hilaire Nature Conservation Centre • Morgan Arboretum Association • Pulp and Paper Research Institute • Valacta
6.4 Unit Objectives, Actions, Achievements, Challenges and Targets
Through the iterative budget planning agreement process, academic units briefly describe their objectives and actions as expressions of McGill’s overall strategic objectives, specifically along five themes:
1. Research intensiveness 2. Student centeredness and providing a rich learning environment 3. Commitment to excellence 4. International orientation 5. Sense of public purpose
Administrative Units also provide a brief summary of their activities in relation to the University’s mission.
All units present their major achievements and challenges for FY2017.
The following sections summarize each academic unit’s objectives, actions and performance assumptions based on student-staff ratios and research grant dollars per tenure stream staff. A summary of each administrative unit’s budget planning agreement follows.

31
FACULTY OF AGRICULTURAL
& ENVIRONMENTAL SCIENCES
FY2018 Operating Budget: $21.3M (4% of Academic Unit Operating Budget)
Faculty Overview McGill’s Faculty of Agricultural and Environmental Sciences focuses on discovery and innovation in agriculture, food, nutrition and environmental sciences. The Faculty stands out nationally and worldwide through its activities in food production, food security, food safety, food product development, water resources management, and environmental sustainability around the food system.
FY2017 Achievements • Creation of 3 major initiatives strategically regrouping key
players within and outside the institution • Successful launch of the Sustainability Sciences and
Technologies Initiative together with McGill’s Faculties of Science and Engineering
• McGill Agri-Food Innovation Network (MAIN) received $5M over five years from the Ministère de l’Agricultutre des Pêcheries et de l’Alimentation to promote industrial innovation in the agri-food sector
FY2017 Challenges • School of Dietetics and Human Nutrition received
provisional accreditation from the Partnership for Dietetic Education and Practice and must correct specific requirements by Spring 2018 to achieve full accreditation
• Farm has lost +50% of its staff and is reaching a level that is unsustainable.
FY2016 actual
FY2017 updated
FY2018 planned
FY2019 planned
FY2020 planned
TENURE-TRACK STAFF Start of year complement 96.2 99.2 96.2 97.2 98.2 New hires 4.0 3.0 4.0 4.0 4.0 Resignations 0.0 (2.0) (2.0) (2.0) (1.0) Retirements (1.0) (4.0) (1.0) (1.0) (1.0) Year-end complement* 99.2 96.2 97.2 98.2 100.2 Target complement 101.3 Under (over) complement 1.1 *Excluded from count (senior admin & Provostial appointments) 2.0 2.0 3.0 3.0 3.0 CRCs, AWARDS & ENDOWED CHAIRS CRC I 2.5 2.5 3.5 3.5 3.5 CRC II 6 5 2 2 2 James McGill Professor 6 6 6 6 6 William Dawson Scholar 3 3 3 3 3 Endowed Chairs 3 3 3 3 3 Total 20.5 19.5 17.5 17.5 17.5 ADMINISTRATIVE & SUPPORT STAFF Clerical/Management/Technical 50 47 47 47 47 PERFORMANCE ASSUMPTIONS Undergrad FTE students 1,206.3 1,220.3 1,224.0 1,227.6 1,231.3 Grad FTE students 423.7 465.1 466.5 467.9 469.3 Deregulated FTE students 36.7 41.9 42.0 42.2 42.3 UG FTEs/Prof 12.2 12.7 12.6 12.5 12.3 Masters FTEs/Prof 2.9 3.3 3.3 3.2 3.2 PhD FTEs/Prof 1.4 1.5 1.5 1.5 1.5 Research $/Prof ($000) $165 $171 $172 $173 $169 RESEARCH ($000) $16,350 $16,490 $16,750 $16,970 $16,970
FUNDRAISING ($000) $3,085 $3,100 $3,120 $3,140 $3,140

32
FACULTY OF ARTS
FY2018 Operating Budget: $62.8M (13% of Academic Unit Operating Budget)
Faculty Overview The Faculty of Arts is a comprehensive social sciences and humanities Faculty that includes 15 departments, 3 professional schools and 4 institutes. It contributes significantly to McGill’s leading position ranking 3rd in citation counts, 1st in SSHRC funding, and 2nd overall in the Social Sciences and Humanities disciplines in Canada (according to a 2012 study by Higher Education Strategy Associates).
FY2017 Achievements • Recruited 15 new tenure-track faculty members in FY2016 • Saw continued success of Arts Internship Office • Secured 58 grants in tri-council and provincial funding
agencies for a total $5.4M (increase of 33% from FY2015)
FY2017 Challenges • Continuing pressure on salary mass of administrators and
clerical staff • Undergraduate enrolment pressures, despite the slight
downward turn in first year enrolments, as measured by student-staff ratios. Six units are above the Faculty average. Goal is to stay below 15.
• Deteriorating physical condition of key buildings and continued difficulty finding physical space for research activities and for administrative and support staff
FY2016 actual
FY2017 updated
FY2018 planned
FY2019 planned
FY2020 planned
TENURE-TRACK STAFF Start of year complement 299.6 318.1 322.6 323.6 323.6 New hires 13.0 15.0 12.0 11.0 11.0 Resignations (5.0) (6.5) (8.0) (8.0) (9.0) Retirements (2.0) (4.0) (3.0) (3.0) (2.0) Year-end complement* 305.6 322.6 323.6 323.6 323.6 Target complement 323.3 Under (over) complement (0.3) *Excluded from count (senior admin & Provostial appointments) 11.5 12.0 12.5 12.5 12.5 CRCs, AWARDS & ENDOWED CHAIRS CRC I 12 12 12 12 12 CRC II 9 8 8 8 8 James McGill Professor 14 15 15 15 15 William Dawson Scholar 12 15 15 15 15 Endowed Chairs 24 25 25 25 25 Honorary named chairs 1 2 1 1 1 Named professorships 1 1 1 1 1 Total 73 77 77 77 77 ADMINISTRATIVE & SUPPORT STAFF Clerical/Management/Technical 122 124 124 124 124 PERFORMANCE ASSUMPTIONS Undergrad FTE students 5,890.4 5,926.2 5,944.0 5,961.8 5,979.7 Grad FTE students 783.9 767.5 769.8 772.1 774.4 Deregulated FTE students - - - - - UG FTEs/Prof 19.3 18.4 18.4 18.4 18.5 Masters FTEs/Prof 1.7 1.5 1.5 1.5 1.5 PhD FTEs/Prof 0.9 0.9 0.9 0.9 0.9 Research $/Prof ($000) $30 $29 $30 $31 $32 RESEARCH ($000) $9,195 $9,380 $9,570 $9,900 $10,250 FUNDRAISING ($000)
$7,000 $7,245 $7,275 $8,015 $8,036

33
SCHOOL OF CONTINUING
STUDIES
FY2018 Operating Budget: $23.4M (5% of Academic Unit Operating Budget)
Faculty Overview The McGill School of Continuing Studies (SCS) has an international reputation as a leader in continuing education. Our instructors are dynamic and engaged, our student body, smart and diverse, bringing with them a wide range of experience from all walks of life.
FY2017 Achievements • New initiatives including review of academic programs and
specialized programming in entrepreneurship and leadership • Exceeded fundraising target • Multiple awards for SCS marketing campaign FY2017 Challenges • Limited progress advancing SCS space plan • Limited progress on implementation of an activity-based
financial model for SCS credit-based activities • Need for succession planning
FY2016 actual
FY2017 updated
FY2018 planned
FY2019 planned
FY2020 planned
ADMINISTRATIVE & SUPPORT STAFF Clerical/Management/Technical 29.1 28.4 29.4 29.4 29.4 PERFORMANCE ASSUMPTIONS Undergrad students Headcount 3,823 3,905 3,944 4,143 4,282 New admissions 1,292 1,468 1,570 1,620 1,673 Grad students Headcount 1,342 1,347 1,360 1,368 1,382 New admissions 743 755 770 786 801 CEU Programs Headcount 2,966 3,099 3,227 3,316 3,409 New admissions 936 959 997 1,027 1,058 FUNDRAISING ($000)
$200 $200 $300 $300 $300

34
FACULTY OF DENTISTRY
FY2018 Operating Budget: $11.2M (2% of Academic Unit Operating Budget)
Faculty Overview The Faculty aims to be the top dental school in Canada and to be among the 10 best dental schools in the world. In preliminary analyses, our Faculty has higher absolute and per professor research indicators than any other Canadian dental school. Our researchers and a number of our clinical staff are international leaders in their fields and have collaborations with colleagues and institutions across the globe.
FY2017 Achievements • Successful relocation of clinical and preclinical training
facilities, dry laboratory researchers and Dean’s Office and administrative staff to a new facility located at 2001 McGill College
• Introduced new clinical learning opportunities for students and community dental professionals
• The Faculty has the largest graduate student program in all dental schools across the country with 88 graduate students and postdoctoral fellows
FY2017 Challenges • Increased costs associated with the move to the new facility • DMD student admissions: introduced a new system to test
the non-cognitive skills of candidates. This is a significant improvement on the previous process but it is resource-intensive and expensive.
• Increased administrative loads for research and graduate student programs
FY2016 actual
FY2017 updated
FY2018 planned
FY2019 planned
FY2020 planned
TENURE-TRACK STAFF Start of year complement 18.0 19.0 19.0 20.5 22.0 New hires 1.0 1.0 1.5 1.5 0.0 Resignations 0.0 (0.5) 0.0 0.0 0.0 Retirements 0.0 (0.5) 0.0 0.0 0.0 Year-end complement* 19.0 19.0 20.5 22.0 22.0 Target complement 20.5 Under (over) complement (1.5) *Excluded from count (senior admin & Provostial appointments) 0.0 0.0 0.0 0.0 0.0 CRCs, AWARDS & ENDOWED CHAIRS CERC 0.5 0.5 0.5 0.5 0.5 CRC I 0.5 0 0 0 0 CRC II 3.5 2 2 2 2 James McGill Professor 1 1 1 1 1 William Dawson Scholar 0 0 0 0 0 Endowed Chairs 0 0 0 0 0 Total 5.5 3.5 3.5 3.5 3.5 ADMINISTRATIVE & SUPPORT STAFF Clerical/Management/Technical 61 65 60.5 61 61 PERFORMANCE ASSUMPTIONS Undergrad FTE students 178.9 187.5 188.1 188.6 189.2 Grad FTE students 92.3 92.8 93.1 93.4 93.6 Deregulated FTE students - - - - - UG FTEs/Prof 9.4 9.9 9.2 8.6 8.6 Masters FTEs/Prof 3.4 3.5 3.3 3.0 3.1 PhD FTEs/Prof 1.4 1.4 1.3 1.2 1.2 Research $/Prof ($000) $184 $184 $195 $193 $216 RESEARCH ($000) $3,500 $3,500 $4,000 $4,250 $4,750 FUNDRAISING ($000) $1,500 $1,600 $1,700 $1,780 $1,870

35
FACULTY OF EDUCATION
FY2018 Operating Budget: $15.8M (3% of Academic Unit Operating Budget)
Faculty Overview The Faculty comprises three academic units serving both undergraduate and graduate students. Faculty members not only teach within their respective disciplines, but participate in a wide diversity of basic and applied research projects locally, nationally and internationally. Research initiatives inform our teacher training programs educating graduates who enter the classroom as teachers with current, relevant, and optimized professional skill-sets.
FY2017 Achievements • Collaboration with the Mic’maq community of Listuguj to
recruit a cohort of 25 students to enroll in the first Bachelor of Education for First Nations and Inuit Education
• Approval of a new graduate certificate in the area of international leadership (iLEAD) – the first completely self-funded program in The Faculty of Education to be developed mostly online
• Opened an Office for International Relations which started relations and contacts for new partnerships in Asia
FY2017 Challenges • Some initiatives will depend on the attraction of funds for
continuing their development through the next years
FY2016 actual
FY2017 updated
FY2018 planned
FY2019 planned
FY2020 planned
TENURE-TRACK STAFF Start of year complement 62.5 68.5 67.5 71.5 75.5 New hires 9.0 2.0 8.0 7.0 7.0 Resignations (1.0) 0.0 (2.0) (2.0) (2.0) Retirements (2.0) (3.0) (2.0) (1.0) (2.0) Year-end complement* 68.5 67.5 71.5 75.5 78.5 Target complement 78.5 Under (over) complement 0.0 *Excluded from count (senior admin & Provostial appointments) 0.5 0.0 0.0 0.0 0.0 CRCs, AWARDS & ENDOWED CHAIRS CRC I 2 2 3 3 3 CRC II 3 3 7 7 7 James McGill Professor 3 3 3 3 3 William Dawson Scholar 3 3 3 3 3 Endowed Chairs 1 1 2 2 2 Total 12 12 18 18 18 ADMINISTRATIVE & SUPPORT STAFF Clerical/Management/Technical 40.5 43.3 45.3 45.3 45.3 PERFORMANCE ASSUMPTIONS Undergrad FTE students 1,264.8 1,229.7 1,233.4 1,237.1 1,240.8 Grad FTE students 601.6 581.0 582.7 584.5 586.2 Deregulated FTE students - - - - - UG FTEs/Prof 18.5 18.2 17.3 16.4 15.8 Masters FTEs/Prof 6.6 6.7 6.3 6.0 5.8 PhD FTEs/Prof 2.2 1.9 1.8 1.7 1.7 Research $/Prof ($000) $65 $69 $74 $66 $73 RESEARCH ($000) $4,433 $4,673 $5,271 $5,010 $5,752 FUNDRAISING ($000)
$857 $880 $900 $920 $940

36
FACULTY OF ENGINEERING
FY2018 Operating Budget: $38.6M (8% of Academic Unit Operating Budget)
Faculty Overview The Faculty of Engineering is committed to maintaining a body of faculty members who are renowned leading-edge researchers, and supporting researchers with cutting-edge facilities and support services. Engineering is working to establish an inclusive and diverse community of students, faculty and staff to create an environment that attracts a high quality and diverse body of students from across the world.
FY2017 Achievements • Approval of the undergraduate Bachelors of Engineering
program in Bioengineering by MEES, with admission of the first class of 30 students in September 2016
• Provided more than $82,000 in funding over the past academic year to support student activities and help them in their personal/professional development
• The Faculty maintains active leadership in the University in terms of diversity initiatives in support of recruitment and retention of women in the Faculty and student body
FY2017 Challenges • Growth in student numbers in the Faculty has not been
accompanied by a commensurate level of resources support including budgets, support personnel, equipment, and space
• New accreditation process has become an excessive burden to the Faculty
• Workshops remain a major challenge with respect to safety, equipment renewal, labour issues, and training of students in support of engineering programs
FY2016 actual
FY2017 updated
FY2018 planned
FY2019 planned
FY2020 planned
TENURE-TRACK STAFF Start of year complement 155.0 154.0 158.5 162.5 162.5 New hires 5.0 9.0 11.0 6.0 6.0 Resignations (5.0) (3.5) (3.0) (5.0) (3.0) Retirements (1.0) (1.0) (4.0) (1.0) (3.0) Year-end complement* 154.0 158.5 162.5 162.5 162.5 Target complement 162.0 163.0 163.0 163.0 Under (over) complement 0.5 *Excluded from count (senior admin & Provostial appointments) 0.0 1.0 1.0 1.0 1.0 CRCs, AWARDS & ENDOWED CHAIRS CRC I 7 8 8 8 8 CRC II 12 10 10 10 10 James McGill Professor 9 9 9 9 9 William Dawson Scholar 4 6 6 6 6 Endowed Chairs 14 14 14 14 14 Total 46 47 47 47 47 ADMINISTRATIVE & SUPPORT STAFF Clerical/Management/Technical 136 134 138 138 139 PERFORMANCE ASSUMPTIONS Undergrad FTE students 2,102.1 2,162.9 2,169.4 2,175.9 2,182.4 Grad FTE students 803.6 784.2 786.6 788.9 791.3 Deregulated FTE students 708.6 756.6 758.9 761.1 763.4 UG FTEs/Prof 13.7 13.6 13.4 13.4 13.4 Masters FTEs/Prof 3.0 2.8 2.8 2.8 2.8 PhD FTEs/Prof 2.2 2.1 2.1 2.1 2.1 Research $/Prof ($000) $184 $180 $175 $175 $175 RESEARCH ($000) $28,283 $28,500 $28,500 $28,500 $28,500 FUNDRAISING ($000) $1,000 $1,080 $1,100 $1,100 $1,100

37
FACULTY OF LAW
FY2018 Operating Budget: $9.6M (2% of Academic Unit Operating Budget)
Faculty Overview The Faculty of Law strives to be among foremost research-intensive law faculties in Quebec, Canada, and the world, and a prime site for comparative, trans-systemic, and interdisciplinary scholarship. The Faculty has been a leader in innovative legal education for over 50 years and aspires to remain in leading ranks of the world’s publicly-funded law faculties.
FY2017 Achievements • Ranked #2 in Canada and #26 (up from #33) in the world
(2016 QS Rankings by Subject) • Rollout of curriculum renewal – BCL/LLB program • Extensive interaction with local and global partners FY2017 Challenges • Operating budget one-half that of comparable Canadian
institutions • Need to preserve appropriate UG student/faculty ratio • Visible minorities remain under-represented among faculty
and students
FY2016 actual
FY2017 updated
FY2018 planned
FY2019 planned
FY2020 planned
TENURE-TRACK STAFF Start of year complement 43.0 43.0 44.0 46.0 46.0 New hires 1.0 2.5 2.0 0.0 0.0 Resignations (1.0) 0.0 0.0 0.0 0.0 Retirements 0.0 (1.5) 0.0 0.0 0.0 Year-end complement* 43.0 44.0 46.0 46.0 46.0 Target complement 45.0 Under (over) complement (1.0) *Excluded from count (senior admin & Provostial appointments) 1.0 1.0 1.0 1.0 1.0 CRCs, AWARDS & ENDOWED CHAIRS CRC I 1 1 1 1 1 CRC II 0 0 0 0 0 James McGill Professor 3 3 3 3 3 William Dawson Scholar 2 1 1 1 1 Endowed Chairs 13 13 13 13 13 Total 19 18 18 18 18 ADMINISTRATIVE & SUPPORT STAFF Clerical/Management/Technical 31 31 31 31 31 PERFORMANCE ASSUMPTIONS Undergrad FTE students 605.5 631.0 632.9 634.8 636.7 Grad FTE students 114.0 109.7 110.0 110.4 110.7 Deregulated FTE students 13.9 16.4 16.4 16.5 16.5 UG FTEs/Prof 14.1 14.3 13.8 13.8 13.8 Masters FTEs/Prof 1.8 1.5 1.5 1.5 1.5 PhD FTEs/Prof 0.9 1.0 0.9 0.9 0.9 Research $/Prof ($000) $28 $28 $28 $29 $30 RESEARCH ($000) $1,193 $1,252 $1,265 $1,328 $1,395 FUNDRAISING ($000) $3,520 $3,872 $4,000 $4,000 $4,400

38
DESAUTELS FACULTY OF
MANAGEMENT
FY2018 Operating Budget: $42.3M (9% of Academic Unit Operating Budget)
Faculty Overview The Desautels Mission is to make organizations better by fostering rigorous original research and influential thought leadership, taking an integrated, worldly, ethical and lifelong approach to educating current and future leaders, and showing dedication to economic and social value creation. The Faculty is committed to innovative leading, excellence in research, teaching and program delivery. Desautels is innovative, integrative and invested in providing a world-class educational experience.
FY2017 Achievements • 630 new undergraduate students - 41% originate from
outside Canada • 75 students from 21 countries joined our full-time MBA,
another 17 students joined our part-time Professional MBA • PhD Program in Management received 172 applications for
its September 2016 admission cycle and continues to attract outstanding candidates from around the globe
FY2017 Challenges • Attracting and retaining top professors • Balancing the public budget • Developing attractive compensation packages, specifically
through funded chairs and financial resources for research to attract top professors
FY2016 actual
FY2017 updated
FY2018 planned
FY2019 planned
FY2020 planned
TENURE-TRACK STAFF Start of year complement 76.0 74.0 76.0 81.0 84.0 New hires 4.0 6.0 8.0 6.0 3.0 Resignations (5.0) (4.0) (2.0) (2.0) (2.0) Retirements (1.0) 0.0 (1.0) (1.0) 0.0 Year-end complement* 74.0 76.0 81.0 84.0 85.0 Target complement 85.0 Under (over) complement 0.0 *Excluded from count (senior admin & Provostial appointments) 3.0 5.0 5.0 5.0 5.0 CRCs, AWARDS & ENDOWED CHAIRS CRC I 0 0 0 0 0 CRC II 1 1 1 1 1 James McGill Professor 3 3 3 3 3 William Dawson Scholar 0 1 1 1 1 Endowed Chairs 5 5 5 5 5 Total 9 10 10 10 10 ADMINISTRATIVE & SUPPORT STAFF Clerical/Management/Technical 95 95 98 99 100 PERFORMANCE ASSUMPTIONS Undergrad FTE students 1,762.1 1,788.3 1,793.7 1,799.1 1,804.4 Grad FTE students 118.9 105.1 105.4 105.7 106.0 Deregulated FTE students 336.5 321.6 322.6 323.5 324.5 UG FTEs/Prof 23.8 23.5 22.1 21.4 21.2 Masters FTEs/Prof 1.2 1.0 1.0 0.9 0.9 PhD FTEs/Prof 0.4 0.4 0.3 0.3 0.3 Research $/Prof ($000) $24 $29 $28 $27 $27 RESEARCH ($000) $1,806 $2,235 $2,280 $2,307 $2,332 FUNDRAISING ($000)
$5,900 $10,500 $10,900 $10,900 $10,900

39
FACULTY OF MEDICINE
FY2018 Operating Budget: $144.1M (30% of Academic Unit Operating Budget)
Faculty Overview The McGill Faculty of Medicine envisions healthier societies through education, research, clinical care and collaboration. Its mission is to educate health care practitioners and scientists based on the highest standards of excellence and principles of life-long learning and to pursue novel research and clinical innovation to improve health in the communities it serves.
FY2017 Achievements • Implementation of the Strategic Research Plan • MDMC curriculum will graduate the first cohort of students
who have completed all four years of the Program FY2017 Challenges • Uncertainty of research funding due to instability at CIHR;
for this reason the projected revenues from research and contract activities are taken as the same as in the last official available report (FY2015).
• Lack of sufficient wet lab space, teaching lab space, and large classrooms
• Ongoing challenges with several programs, including staffing, accreditation and space
FY2016 actual
FY2017 updated
FY2018 planned
FY2019 planned
FY2020 planned
TENURE-TRACK STAFF Start of year complement 564.9 564.9 569.4 569.4 569.4 New hires 14.0 21.5 15.0 15.0 14.0 Resignations (3.0) (5.5) (6.0) (6.0) (6.0) Retirements (11.0) (11.5) (9.0) (9.0) (9.0) Year-end complement* 564.9 569.4 569.4 569.4 568.4 Target complement 568.0 Under (over) complement (0.4) *Excluded from count (senior admin & Provostial appointments) 4.5 5.5 6.0 6.0 6.0 CRCs, AWARDS & ENDOWED CHAIRS CERC 0.5 0.5 0.5 0.5 0.5 CRC I 28 28.5 28.5 28.5 28.5 CRC II 36.5 37.5 37.5 37.5 37.5 James McGill Professor 46 46 46 46 46 William Dawson Scholar 9 9.5 9.5 9.5 9.5 McGill Endowed Chairs 63 63 63 63 63 Hospital-based Chairs 12 12 12 12 12 Honorary Named Chairs 3 3 3 3 3 Named Professorships 3 3 3 3 3 Direct Funded Professorships 1 1 1 1 1 Total 189 185 185 185 185 PERFORMANCE ASSUMPTIONS Undergrad FTE students 3,099.5 2,997.5 3,006.5 3,015.5 3,024.6 Grad FTE students 1,544.0 1,623.4 1,628.3 1,633.2 1,638.1 Deregulated FTE students - - - - - UG FTEs/Prof 5.5 5.3 5.3 5.3 5.3 Masters FTEs/Prof 1.8 1.9 1.9 1.9 1.9 PhD FTEs/Prof 4.3 4.5 4.5 4.5 4.5 Research $/Prof ($000) $327 $327 $327 $327 $327 RESEARCH ($000) $185,000 $185,000 $185,000 $185,000 $185,000
FUNDRAISING ($000) $21,000 $15,000 $15,000 $15,000 $15,000
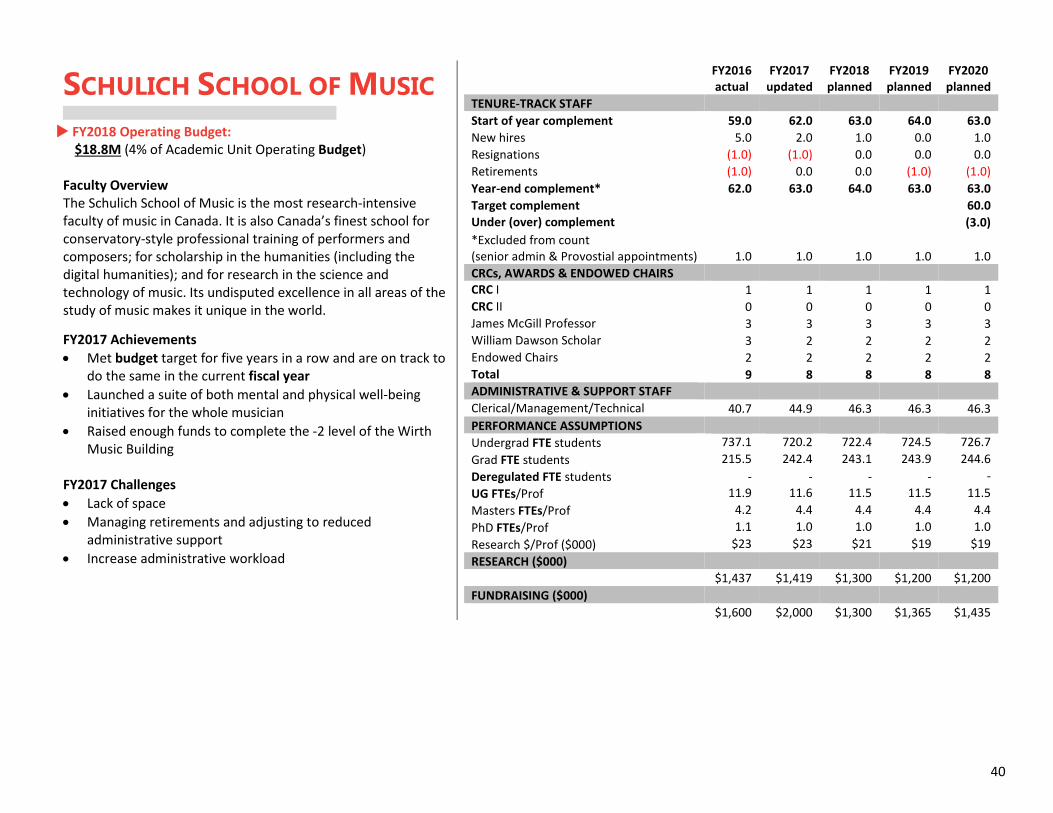
40
SCHULICH SCHOOL OF MUSIC
FY2018 Operating Budget: $18.8M (4% of Academic Unit Operating Budget)
Faculty Overview The Schulich School of Music is the most research-intensive faculty of music in Canada. It is also Canada’s finest school for conservatory-style professional training of performers and composers; for scholarship in the humanities (including the digital humanities); and for research in the science and technology of music. Its undisputed excellence in all areas of the study of music makes it unique in the world.
FY2017 Achievements • Met budget target for five years in a row and are on track to
do the same in the current fiscal year • Launched a suite of both mental and physical well-being
initiatives for the whole musician • Raised enough funds to complete the -2 level of the Wirth
Music Building FY2017 Challenges • Lack of space • Managing retirements and adjusting to reduced
administrative support • Increase administrative workload
FY2016 actual
FY2017 updated
FY2018 planned
FY2019 planned
FY2020 planned
TENURE-TRACK STAFF Start of year complement 59.0 62.0 63.0 64.0 63.0 New hires 5.0 2.0 1.0 0.0 1.0 Resignations (1.0) (1.0) 0.0 0.0 0.0 Retirements (1.0) 0.0 0.0 (1.0) (1.0) Year-end complement* 62.0 63.0 64.0 63.0 63.0 Target complement 60.0 Under (over) complement (3.0) *Excluded from count (senior admin & Provostial appointments) 1.0 1.0 1.0 1.0 1.0 CRCs, AWARDS & ENDOWED CHAIRS CRC I 1 1 1 1 1 CRC II 0 0 0 0 0 James McGill Professor 3 3 3 3 3 William Dawson Scholar 3 2 2 2 2 Endowed Chairs 2 2 2 2 2 Total 9 8 8 8 8 ADMINISTRATIVE & SUPPORT STAFF Clerical/Management/Technical 40.7 44.9 46.3 46.3 46.3 PERFORMANCE ASSUMPTIONS Undergrad FTE students 737.1 720.2 722.4 724.5 726.7 Grad FTE students 215.5 242.4 243.1 243.9 244.6 Deregulated FTE students - - - - - UG FTEs/Prof 11.9 11.6 11.5 11.5 11.5 Masters FTEs/Prof 4.2 4.4 4.4 4.4 4.4 PhD FTEs/Prof 1.1 1.0 1.0 1.0 1.0 Research $/Prof ($000) $23 $23 $21 $19 $19 RESEARCH ($000) $1,437 $1,419 $1,300 $1,200 $1,200 FUNDRAISING ($000)
$1,600 $2,000 $1,300 $1,365 $1,435
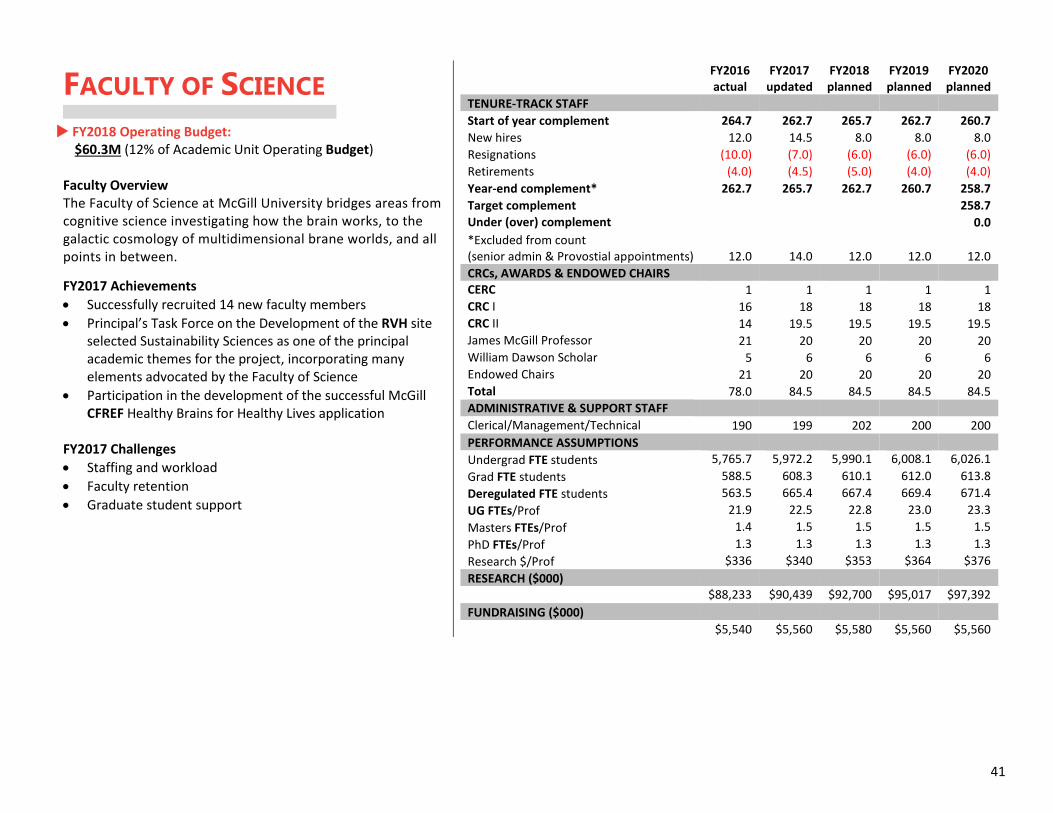
41
FACULTY OF SCIENCE
FY2018 Operating Budget: $60.3M (12% of Academic Unit Operating Budget)
Faculty Overview The Faculty of Science at McGill University bridges areas from cognitive science investigating how the brain works, to the galactic cosmology of multidimensional brane worlds, and all points in between.
FY2017 Achievements • Successfully recruited 14 new faculty members • Principal’s Task Force on the Development of the RVH site
selected Sustainability Sciences as one of the principal academic themes for the project, incorporating many elements advocated by the Faculty of Science
• Participation in the development of the successful McGill CFREF Healthy Brains for Healthy Lives application
FY2017 Challenges • Staffing and workload • Faculty retention • Graduate student support
FY2016 actual
FY2017 updated
FY2018 planned
FY2019 planned
FY2020 planned
TENURE-TRACK STAFF Start of year complement 264.7 262.7 265.7 262.7 260.7 New hires 12.0 14.5 8.0 8.0 8.0 Resignations (10.0) (7.0) (6.0) (6.0) (6.0) Retirements (4.0) (4.5) (5.0) (4.0) (4.0) Year-end complement* 262.7 265.7 262.7 260.7 258.7 Target complement 258.7 Under (over) complement 0.0 *Excluded from count (senior admin & Provostial appointments) 12.0 14.0 12.0 12.0 12.0 CRCs, AWARDS & ENDOWED CHAIRS CERC 1 1 1 1 1 CRC I 16 18 18 18 18 CRC II 14 19.5 19.5 19.5 19.5 James McGill Professor 21 20 20 20 20 William Dawson Scholar 5 6 6 6 6 Endowed Chairs 21 20 20 20 20 Total 78.0 84.5 84.5 84.5 84.5 ADMINISTRATIVE & SUPPORT STAFF Clerical/Management/Technical 190 199 202 200 200 PERFORMANCE ASSUMPTIONS Undergrad FTE students 5,765.7 5,972.2 5,990.1 6,008.1 6,026.1 Grad FTE students 588.5 608.3 610.1 612.0 613.8 Deregulated FTE students 563.5 665.4 667.4 669.4 671.4 UG FTEs/Prof 21.9 22.5 22.8 23.0 23.3 Masters FTEs/Prof 1.4 1.5 1.5 1.5 1.5 PhD FTEs/Prof 1.3 1.3 1.3 1.3 1.3 Research $/Prof $336 $340 $353 $364 $376 RESEARCH ($000) $88,233 $90,439 $92,700 $95,017 $97,392 FUNDRAISING ($000) $5,540 $5,560 $5,580 $5,560 $5,560

42
MCGILL UNIVERSITY LIBRARY & ARCHIVES
FY2018 Operating Budget: $35.8M (7% of Academic Unit Operating Budget)
Faculty Overview The McGill University Library and Archives advances teaching, learning, research and community service by providing outstanding collections, excellent user-focused services and expansive access to a world of knowledge, helping McGill’s students and researchers fulfill their academic potential. The Library system comprises a network of five downtown campus libraries (Humanities and Social Sciences Library, Schulich Library of Physical Sciences, Life Sciences and Engineering, Nahum Gelber Law Library, Islamic Studies library and Marvin Duchow Music Library), the MacDonald Campus Library on the West Island and ROARr (Rare Books and Special Collections, Osler Library of the History of Medicine, Art and Archives and Records Management) plus the Birks Reading Room.
FY2017 Achievements • Completed an exhaustive nine-month planning process to
reimagine the Library for the 21st century (Fiat Lux Master Plan and Fundraising Campaign)
• Library Collection boasts over 6 million items and one of the largest journal (~100,000 titles), databases and e-book collections in Canada
• Strategic leadership hires in 2016 • Analyze and coordinate the best deployment of library staff,
which is running extremely lean
STAFF FTEs & SALARY MASS
FY2016 actual
FY2017 updated
FY2018 planned
FY2019 planned
FY2020 planned
TENURE-TRACK STAFF Clerical # 3 3 3 2 2 Clerical ($000) 151.0 160.0 165.3 113.5 117.0 Librarian Non- TT, Curators, Archivists # 5 7 7 7 7 Librarian Non- TT, Curators, Archivists ($000) 635.4 720.0 743.8 766.1 789.1 Librarian TT # 60 68 67 67 67 Librarian TT ($000) 5,347.2 6,080.4 6,188.7 6,374.4 6,565.6 M- regular # 22 28 30 30 30 M- regular ($000) 1,457.9 2,142.0 2,370.7 2,441.9 2,515.1 M- term # - - - - - M- term ($000) - - - - - Technical (including. Library Assistants) # 72 78 74 72 72 Technical (including. Library Assistants) ($000) 3,862.9 4,212.0 4,127.9 4,136.8 4,260.9 TOTAL Total # 162 184 181 178 178 Total ($000) 11,454.3 13,314.4 13,596.4 13,832.6 14,247.6 FUNDRAISING ($000)
200 200 300 300 300

43
OFFICE OF THE PRINCIPAL AND
VICE-CHANCELLOR
FY2018 Operating Budget: $1.6M (<1% of Administrative Unit Operating Budget)
Unit Overview Principal and Vice-Chancellor Suzanne Fortier is the academic head and chief executive officer of McGill University. She is appointed by, and a member of, the Board of Governors. Professor Fortier oversees all aspects of McGill, from the University’s day-to-day operations to setting strategic directions in education, research and global initiatives.
FY2017 Achievements • Planning and prioritizing the Principal’s schedule in support of her
highest priorities • Implemented means to ensure transparency to the community
regarding Principal’s activities and meetings being “open, connected, and purposeful”
• Oversaw preparation of Principal’s briefings, events and communication to the community to ensure they were relevant, well prepared and provided in a timely manner
FY2017 Challenges My Workplace - Given the reduction in the OPVC staff, the office team looks for improved efficiencies and simpler processes with other units with whom they collaborate. STAFF FTEs AND SALARY MASS PER ADMINISTRATIVE AND SUPPORT STAFF CATEGORIES
FY2016 actual
FY2017 updated
FY2018 planned
FY2019 planned
FY2020 planned
OPERATING 1A FUNDS AND NON 1A FUNDS Clerical/Management # 7 6 6 6 6 Clerical/Management ($000) 500.8 504.2 504.2 504.2 504.2

44
OFFICE OF THE PROVOST AND
VICE-PRINCIPAL (ACADEMIC)
FY2018 Operating Budget: $12.0M (4% of Administrative Unit Operating Budget)
Unit Overview The mission of the Office of the Provost and Vice-Principal (Academic) (OPVPA) is to provide the Provost and Vice-Principal (Academic) (PVPA) with high-level, professionalized support in fulfilling the Office’s key mandate to plan, develop, and implement McGill’s strategic academic plan; to develop and execute the University’s budget framework process; and to ensure alignment of the University’s resources with academic priorities.
FY2017 Achievements and Challenges • Successful conclusion of merger of the Faculty of Religious Studies and the
Faculty of Arts, creating the School of Religious Studies within the Faculty of Arts.
• Successful conclusion of agreement with the Max Bell Foundation to provide a total of $10 million over ten years in support of the new School of Public Policy in the Faculty of Arts
• Progress of planning for possible acquisition and redevelopment of the Royal Victoria Hospital site
STAFF FTEs AND SALARY MASS PER ADMINISTRATIVE AND SUPPORT STAFF CATEGORIES
FY2016 actual
FY2017 updated
FY2018 planned
FY2019 planned
FY2020 planned
OPERATING 1A FUNDS Clerical/Management # 51.4 46.3 45.6 44.3 43.3 Clerical/Management ($000) 2,928.9 2,989.5 3,105.3 3,186.2 3,158.7

45
DEPUTY PROVOST (STUDENT LIFE AND LEARNING)
FY2018 Operating Budget:
$107.0M (31% of Administrative Unit Operating Budget)
Unit Overview The mission of Student Life and Learning is to create an environment that amplifies the mission of the University through support, creativity, compassion and synergies. Student Life and Learning supports students inside and outside the classroom by offering essential services, and programs that encourage intellectual, social, cultural, and physical development and opportunities to explore local, national, and international interests that complement the academic curriculum. SLL is comprised of seven units: 1. Student Housing and Hospitality Services (SHHS) 2. Teaching and Learning Services (TLS) 3. Enrolment Services (ES) 4. Student Services (SS) 5. Athletics and Recreation (A&R) 6. Office of the Dean of Students (DoS) 7. Office of Student Life and Learning (OSLL)
FY2017 Achievements • Completion of the Office of Student Life and Learning
administrative unit review and implementation of review committee recommendations
• Consulted and worked with the Associate Provost (Equity and Academic Policies) on the development of McGill’s Policy Against Sexual Violence
• Created the Student Life and Learning Staff Council
FY2017 Challenges • Collective agreements and pay equity settlements • Deferred maintenance, especially in A&R and SHHS facilities • Insufficient space in TLS, S2, OSLL and DoS
STAFF FTEs AND SALARY MASS PER ADMINISTRATIVE AND SUPPORT STAFF CATEGORIES
FY2017 updated
FY2018 planned
FY2019 planned
FY2020 planned
Senior Academic Admin # 5 5 5 5 Senior Academic Admin ($000) 407.9 456.5 466.4 476.6 Executive # 3 4 4 4 Executive ($000) 534.8 696.6 713.3 730.6 Clerical/Management/Technical # 740.3 767.8 768.5 768.5 Clerical/Management/Technical ($000) 19,285.9 21,031.5 21,631.1 22,154.7 Nurses # 10 10 10 10 Nurses ($000) 542.3 558.5 575.3 592.6 Contract Academics 7 8 8 8 Contract Academics ($000) 125.7 668.3 673.3 673.3 Trades # 141 143 143 143 Trades ($000) 4,815.9 5,066.1 5,212.9 5,364.0 Casuals # 808 833 833 833 Casuals ($000) 3,177.9 4,082.9 4,177.6 4,275.1 Total # 1,714.3 1,770.8 1,771.5 1,771.5 Total ($000) 28,830.4 32,560.5 33,449.9 34,266.9
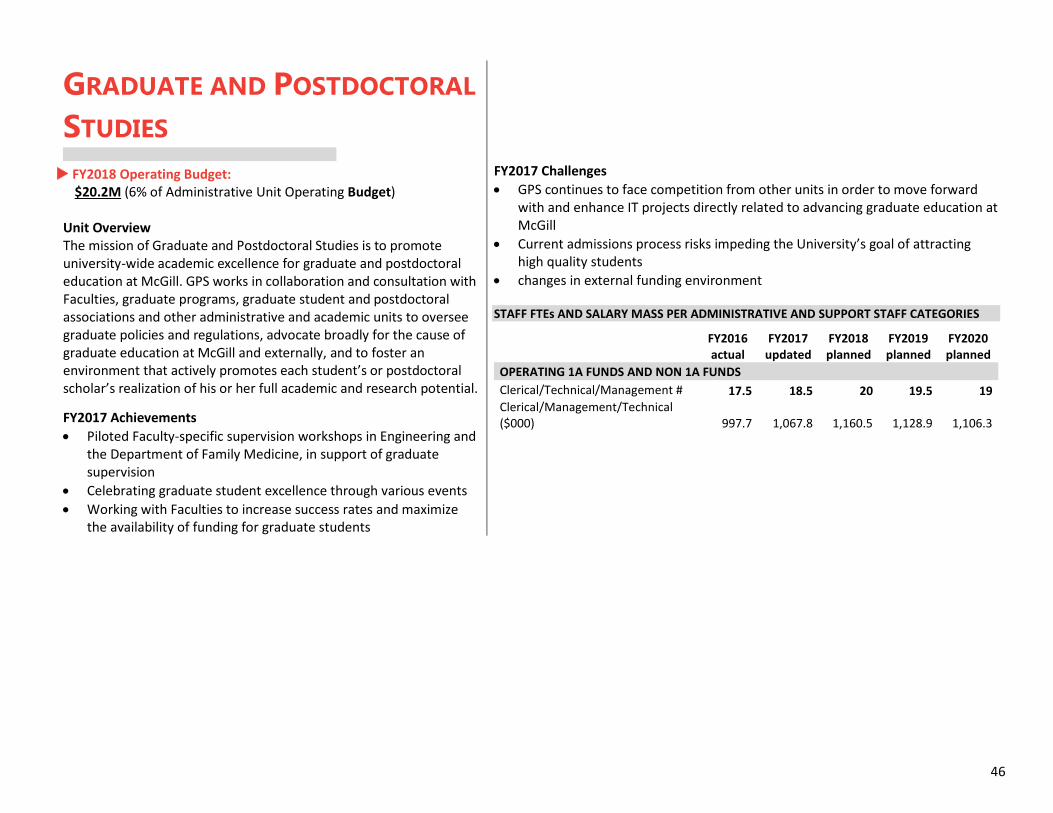
46
GRADUATE AND POSTDOCTORAL
STUDIES
FY2018 Operating Budget: $20.2M (6% of Administrative Unit Operating Budget)
Unit Overview The mission of Graduate and Postdoctoral Studies is to promote university-wide academic excellence for graduate and postdoctoral education at McGill. GPS works in collaboration and consultation with Faculties, graduate programs, graduate student and postdoctoral associations and other administrative and academic units to oversee graduate policies and regulations, advocate broadly for the cause of graduate education at McGill and externally, and to foster an environment that actively promotes each student’s or postdoctoral scholar’s realization of his or her full academic and research potential.
FY2017 Achievements • Piloted Faculty-specific supervision workshops in Engineering and
the Department of Family Medicine, in support of graduate supervision
• Celebrating graduate student excellence through various events • Working with Faculties to increase success rates and maximize
the availability of funding for graduate students
FY2017 Challenges • GPS continues to face competition from other units in order to move forward
with and enhance IT projects directly related to advancing graduate education at McGill
• Current admissions process risks impeding the University’s goal of attracting high quality students
• changes in external funding environment STAFF FTEs AND SALARY MASS PER ADMINISTRATIVE AND SUPPORT STAFF CATEGORIES
FY2016 actual
FY2017 updated
FY2018 planned
FY2019 planned
FY2020 planned
OPERATING 1A FUNDS AND NON 1A FUNDS Clerical/Technical/Management # 17.5 18.5 20 19.5 19 Clerical/Management/Technical ($000) 997.7 1,067.8 1,160.5 1,128.9 1,106.3

47
MACDONALD CAMPUS
FY2018 Operating Budget: $2.0M (1% of Administrative Unit Operating Budget )
Unit Overview The Macdonald Campus is home to the Faculty of Agricultural and Environmental Sciences, the Macdonald Farm, and the Morgan Arboretum. Located in Sainte-Anne-de-Bellevue on the West Island, the campus comprises a total area of 650 hectares. The Campus is shared with the CEGEP John Abbott College and the Macdonald High School. Other McGill units which have operations on the Campus include the McGill Weather Radar Observatory, the Brace Centre for Water Resources Management, and the Faculty of Music West Island Conservatory. Some professors based on the city campus also use the facilities on the Macdonald Campus for their research.
FY2017 Achievements • Growth in student population • Campus is increasingly recognized by external stakeholders • Continuing open dialogue with Mayors of communities
surrounding the campus FY2017 Challenges • Aging infrastructure • Lack of adequate services (food services, athletics facilities) • Lack of representation on P7
STAFF FTEs AND SALARY MASS PER ADMINISTRATIVE AND SUPPORT STAFF CATEGORIES
FY2016 actual
FY2017 updated
FY2018 planned
FY2019 planned
FY2020 Planned
OPERATING 1A FUNDS Clerical/Management/Technical (#) 14 13.7 13.7 13.7 13.7 Clerical/Management/Technical ($000) 875.3 866.6 866.6 816.6 816.6 NON 1A FUNDS Clerical/Management/Technical (#) 5 5 5 5 5 Clerical/Management/Technical ($000) 227.0 263.3 263.3 263.3 263.3
TOTAL Total (#) 19 18.7 18.7 18.7 18.7 Total ($000) 1,102.3 1,129.9 1,129.9 1,079.9 1,079.9

48
ADMINISTRATION & FINANCE
FY2018 Operating Budget: $142.5M (42% of Administrative Unit Operating Budget)
[including Facilities Management and Ancillary Services] Unit Overview The VP Administration and Finance is responsible for providing prudent and progressive management of McGill University’s financial and procurement resources, human resources, information technology services and facilities management and ancillary services. The Vice-Principal’s primary role is to support the vision, mission and goals of the University by ensuring long-term economic strength and continuous improvement of services for faculty, researchers, staff and students in order to increase productivity and satisfaction. FY2017 Achievements • My Workplace: Completion of Phase I projects and launch of
Phase II projects • Capital investments, physical and technological infrastructure
and space planning, including developing preliminary plans for the RVH site
FY2017 Challenges • Interim leadership and transition to a new VP introduced certain unavoidable
delays STAFF FTEs AND SALARY MASS PER ADMINISTRATIVE AND SUPPORT STAFF CATEGORIES
FY2016 actual
FY2017 updated
FY2018 planned
FY2019 planned
FY2020 planned
OPERATING 1A FUNDS AND NON 1A FUNDS Clerical Tech Trades # 446 442 483 483 483 Clerical Tech Trades ($000) 19,234.6 19,616.9 22,076.9 22,623.3 23,187.5 Management regular & term # 526 533 559 560 558 Management regular & term ($000) 36,806.3 39,000.9 41,524.0 42,287.8 42,985.5 TOTAL Total # 972 975 1042 1043 1041 Total ($000) 56,049.9 58,617.8 63,600.9 64,911.1 66,173.0

49
RESEARCH AND INNOVATION
FY2018 Operating Budget: $13.5M (4% of Administrative Unit Operating Budget)
Unit Overview Research and Innovation (R&I) is responsible for directing McGill University’s overall institutional research mandate, managing the support services framework for all aspects of research administration and compliance, leading strategic research projects at the institutional level, and driving McGill’s expanding innovation agenda through our work in the Office of Innovation and Partnerships.
R&I supports the Faculties and affiliated research institutes in their commitment to excellence in research at many levels. Administrative functions include support for grants, contracts, prizes and awards, compliance, and intellectual property management. The unit also provides policy, planning, strategic research development, and management of internal programs and resources. Finally, R&I has responsibility for a wide range of outreach activities and engagement with the community, partner universities, government, corporations, organizations, and the general public at the local, regional, national, or international levels.
FY2017 Achievements • R&I led the development and submission of the Healthy Brains
for Healthy Lives (HBHL), which ultimately received $84 million over seven years from the second round of the Canada First Research Excellence Fund (CFREF) in September 2016
• McGill continues its strong performance in federal and provincial funding programs, continuing to rank among Canada’s most research-intensive universities
• Hiring of a new Associate Vice-Principal, Innovation and Partnerships
FY2017 Challenges • The increased complexity of the external research funding landscape in Quebec,
Canada, and internationally • Challenges remain in research funding, especially in the field of biomedical and
health sciences, as the Tri-Agency total funding has seen minimal or no growth over the past five years
• R&I remains involved in fully resolving issues arising from the Tri-Agency monitoring visit to assess the effectiveness of the administrative and financial controls in place for the administration of grants and awards.
STAFF FTEs AND SALARY MASS PER ADMINISTRATIVE AND SUPPORT STAFF CATEGORIES
FY2016 actual
FY2017 updated
FY2018 planned
FY2019 planned
FY2020 planned
OPERATING 1A FUNDS Clerical/Management # 79 78 79 78 77 Clerical/Management ($000) 5,697.9 5,784.8 5,703.7 5,718.2 5,624.5

50
UNIVERSITY ADVANCEMENT
FY2018 Operating Budget: $16.6M (5% of Administrative Unit Operating Budget)
Unit Overview University Advancement is committed to enhancing the long-term vitality and success of McGill University. This vision is achieved by forging lifelong, mutually beneficial relationships with alumni, donors, students, parents and friends and by ensuring ongoing philanthropic support to help the University advance its mission and achieve its priority objectives.
FY2017 Achievements • Performance for FY2016 was very solid with final achievements of
$94.8M – an increase of 13% compared to FY2015 • UA philanthropic activities generated $88M of cash in FY2016,
similar to the FY2015 results of $87M • UA initiated a process to secure financing for the University’s
upcoming Bicentennial Campaign
STAFF FTEs AND SALARY MASS PER ADMINISTRATIVE AND SUPPORT STAFF CATEGORIES
FY2016 actual
FY2017 updated
FY2018 planned
FY2019 planned
FY2020 planned
OPERATING 1A FUNDS Clerical/Technical/Management # 151 154 161 161 161 Clerical/Technical/Management ($000) 9,180 9,753 10,045 10,045 10,045 NON 1A FUNDS Clerical/Technical/Management # - 9 47 49 56 Clerical/Technical/Management ($000) - 877 3,952 4,317 4,905
TOTAL Total # 151 163 208 210 217 Total ($000) 9,180 10,630 13,997 14,362 14,905

51
COMMUNICATIONS & EXTERNAL
RELATIONS FY2018 Operating Budget:
$5.1M (1% of Administrative Unit Operating Budget)
Unit Overview Communications The central Communications portfolio at McGill includes the full range of central communications activities, including media relations, internal and strategic communications, graphic design, and web content. External Relations The External Relations portfolio at McGill covers the range of government relations – at municipal, federal and provincial levels, inter-institutional relations and relations with a growing number of organizations in the local community. The team works extensively with other offices at McGill, particularly as concerns government and inter-institutional relations at the provincial and federal levels. FY2017 Achievements • Launch of the RVH feasibility study and guarantee of
reimbursement of McGill’s $4M investment by the Conseil du trésor • Elimination of the structural deficit of $200K p.a. that we inherited
when we took over Multimedia Office • Two campaigns aimed at attracting more francophone students to
McGill and increasing awareness of McGill in Quebec: Vivre McGill en français (led by School of Continuing Studies) and McGill c’est pour moi (with Enrolment Services)
FY2017 Challenges • Taken on considerable additional responsibility in the past 2-3 years including
Web Communications – will be taking on responsibility for the use of McGill’s trademarks
• No confirmed budget for community outreach activities. • Need additional financial and moral backing from senior administration to fully
realize objectives of promoting McGill in the 21st century STAFF FTEs AND SALARY MASS PER ADMINISTRATIVE AND SUPPORT STAFF CATEGORIES
FY2016 actual
FY2017 updated
FY2018 planned
FY2019 planned
FY2020 planned
OPERATING 1A FIMDS AND NON 1A FUNDS Clerical/Management/Technical (#) 42
41.5
42
42
42
Clerical/Management/Technical ($000) 3,029.7 2,995.1 3,116.0 3,116.0 3,116.0

52
SECRETARIAT
FY2018 Operating Budget: $1.3M (<1% of Administrative Unit Operating Budget)
Unit Overview The Secretariat is McGill University's governance office responsible for the Board of Governors, the Senate and their committees. The Secretariat is also: • an impartial office responsible for: University-wide elections,
academic staff and student grievances and appeals, administration of the tenure and promotions processes, support for senior advisory committees (Deans, Vice-Principals, PVPA and Principal)
• in accordance with Quebec legislation, the office has been delegated responsibility for access to information requests and the protection of personal information on behalf of the University and for insuring compliance with the Act
• responsible for the University Safe Disclosure Policy ("whistleblowing policy"); and responsible for maintaining the University policies on the web site
• corporate head office for the Royal Institution for the Advancement of Learning and McGill University
• responsible for ceremonial matters and protocols including the McGill coat of arms and "signature," letters of credence, the University seal and permission to use the University coat of arms and Logo
• responsible for oversight regarding the corporate information assets of the institution and the reporting channel for the McGill University Archives.
FY2017 Achievements • Successful completion of the Advisory Committees’ work on recommendation of
the following decanal appointments: Dean of Law; Dean of Arts; Dean of Students and the reappointment of Vice-Principal (Communications and External Relations)
• Maintained effective support for governance of the University • Completed the Triennial review of the Board of Governors committees’ terms of
reference
FY2017 Challenges • Succession planning to new Secretary-General • Internal Audit of Secretariat • Review of University signing regulations
STAFF FTEs AND SALARY MASS PER ADMINISTRATIVE AND SUPPORT STAFF CATEGORIES
FY2016 actual
FY2017 updated
FY2018 planned
FY2019 planned
FY2020 planned
OPERATING 1A FUNDS Clerical Technical Management # 11 10 10 10 10 Clerical Technical Management ($000) 771.8 717.1 718.2 718.2 718.2

53
LEGAL SERVICES
FY2018 Operating Budget: $2.9M (1% of Administrative Unit Operating Budget)
Unit Overview From an operational perspective, the role of Legal Services delves deep into the operations of the University. It is to provide sound, relevant and timely legal advice to senior administrators of the University: the Principal, the PVPA, Vice-Principals, Deans, and Executive Directors or various administrative staff as a function of institutional priorities. Legal Services must continuously adapt in order to remain relevant, strategic and useful to the University in the fulfilment of its ambitious mission to remain one of the leading research-intensive universities in the world and leader in innovation and research.
FY2017 Achievements • Maintained quality and frequency in terms of output overall
despite staff leaves • Successful relocation of lawyer dedicated to Facilities
Management and Ancillary Services who is now working from the offices of the client group
• Integration of a full-time Legal Counsel as a generalist
FY2017 Challenges • Employment and labour matters remain a source of high volume of work • Service to the Faculty of Medicine on a great variety of matters requires an
expense of in-house resources that is not sustainable in the long-term • Staff fluctuations have resulted in a backlog and overload of work on the current
workforce, particularly for administrative and support staff STAFF FTEs AND SALARY MASS PER ADMINISTRATIVE AND SUPPORT STAFF CATEGORIES
FY2016 actual
FY2017 updated
FY2018 planned
FY2019 planned
FY2020 planned
OPERATING 1A FUNDS AND NON 1A FUNDS Clerical/Management # 7 8 8 8 8 Clerical/Management ($000) 665.5 792.6 995.9 995.9 995.9

54
7 Operating Funds: FY2018 Budget
7.1 Operating Revenues
The sources of revenue for McGill’s $815.0M operating budget for FY2018 appear in Figure 9:
Figure 9: Projected Operating Revenues FY2018 Budget ($’000)
With relatively small enrolment increases projected for the coming years, modest revenue increases are projected as shown in Figure 10, while the distribution of the projected revenue appears in Table 1 below:
Figure 10: Operating Revenue from FY2016 to FY2022 ($M)
Table 1: Evolution of Operating Revenue from FY2016 to FY2022 ($’000)

55
7.1.1 Student Enrolment and the MEES Operating Grant
All tuition, approximately 75% of the provincial grant, and a significant portion of the sale of goods and services are a direct function of the University’s enrolments. Consequently, establishing targets, being able to project actual student registrations, and understanding what might cause variances, represent important factors in forecasting the University’s operating revenues.
During the course of the year, different groups at McGill engage in a number of established activities that help the OPVPA to project student numbers and related fees, and thus to build this component of the budget. The following list highlights some of the activities that aid in this forecasting process:
• A workgroup, led by the Registrar, meets with the Dean or authoritative delegate of each Faculty to discuss undergraduate admissions targets that are then reviewed by the Budget Working Group and ultimately approved by the PVPA
• The Office of the Dean of Graduate and Postdoctoral Studies meets with the Dean of each Faculty to determine graduate program enrolment targets to propose to the PVPA for approval
• The Deregulated Tuition Advisory Committee, chaired by the Deputy Provost (Student Life and Learning), with representatives from Enrolment Services, Financial Services, and the OPVPA, reviews and proposes deregulated program tuition levels
• The Fee Advisory Committee, chaired by the Deputy Provost (Student Life and Learning), with representatives from Financial Services, OPVPA, Graduate and Postdoctoral Studies, reviews and proposes Ancillary Fees and helps coordinate agreements with student groups
• Analysts from the OPVPA model and forecast admissions targets, translating these into headcounts, full-time equivalents (FTEs), and weighted full-time equivalents (WFTEs)
The OPVPA uses the results from the above workgroups to project annual (and multi-year) enrolment targets. The latter are then incorporated into each Faculty’s budget planning agreement along with a portion of the related revenue streams. Certain expenditure line items, such as student
aid, are then derived and incorporated into a five-year budgetary outlook that is also propagated to the Faculty level.
Five-year admission targets by Faculty and degree are used to forecast full-time equivalent student counts (FTEs) and weighted full-time equivalents (WFTEs) over the five-year budget planning horizon. The WFTEs are meant to reflect FTEs adjusted for the relative cost weights of disciplines and levels of study with respect to a baseline. Weights, as determined by the MEES, vary between 1.0 and 9.73 at the Bachelors level, 2.29 and 9.41 at the Masters level, and 6.4 and 10.69 at the PhD level. For budget planning purposes, enrolments at the University are divided into three major groups:

56
1. Regulated students: Students conforming to the tuition rates set by the Government and for which government grants are received. FTEs and
WFTEs are important student enrolment measures through which the MEES funds Quebec universities. (Refer to Figure 11).
Figure 11: Regulated Student FTE and WFTE Forecast

57
2. Deregulated students: These are undergraduate international students enrolled in six disciplines (Management, Law, Engineering, Computer Science, Mathematics and Pure Sciences) for which universities are allowed to set the fees, but no teaching grant is received, although universities continue to receive administrative support grants. Increases are forecast, particularly in Engineering and Science in order
to take advantage of capacity in areas which are currently in greater demand from international students. (Refer to Table 2) It should be noted that there is no need to compute the number of Weighted FTEs in the case of deregulated students, since the University does not receive a teaching grant based on the weightings.
Table 2: Deregulated Program FTE Forecast

58
3. Self-funded students: These are students for which universities are allowed to set the fees but no grant is received. This represents a small number of students enrolled in specialized Masters-level programs, mainly in Management, as well as non-Quebec students studying in distance programs outside Quebec (refer to Figure 12).
Figure 12: Self-funded Masters Programs FTE Forecast
As enrolment-driven revenues represent approximately 80% of the University’s operating fund revenues, it is often a tempting reflex to increase enrolments in order to help address our financial issues. To a certain extent, we do this selectively, in programs where we believe we have capacity. There is a general consensus, however, that in order to maintain quality in undergraduate education we are nearing this capacity limit, as measured by the student-to-tenure-track-staff ratio. On the other hand, as part of our objective to remain one of the most research-intensive universities in Canada, we have capacity to grow enrolment at the graduate
level, especially for doctoral students. Figure 13 depicts the evolution of university-wide student-to-tenure-track-staff ratios that have informed our enrolment target setting.
Figure 13: Evolution of Student-Staff Ratios
7.1.2 Other components of MEES Operating Grant
For Quebec universities as a whole, approximately 75% of the MEES grant is enrolment-driven, while 25% is provided via special envelopes, which are either reserved for certain universities, or are restricted to short-term project-based allocations. In recent years, the MEES grant distribution for McGill has been more along the lines of 95% for enrolment-driven allocations, and 5% via special envelopes. This disproportionally small allocation for special envelopes means that McGill must be more efficient in delivering its enrolment-driven component. The distribution of the MEES operating grant for McGill is detailed in Appendix 9.
The “coûts de systèmes” or indexation is a regular incremental part of the existing MEES envelopes. Within our budget model, we have estimated indexation as follows:
• 1.2% in FY2018 • 1.4% in FY2019 • 1.6% in FY2020 • 1.8% in FY2021 • 2.0% in FY2022

59
7.1.3 Tuition and Ancillary fees
As described in the previous section, the tuition fees for most students at McGill are regulated. As a result, the Provincial government determines both the percentage increases to their tuition fees and their ancillary fees. The indexation for the base tuition rate applicable to Quebec students, beginning in fall 2017 is limited to the percentage increase in available family income per person from the calendar year 2014 to the calendar year 201510. In the case of regulated tuition fees, the result is that they will increase in fall 2017 by 2.7%, or $63 per FTE, for a total tuition of $2,391 per FTE. We have estimated the increases in subsequent years as follows:
• 2.2% beginning fall 2018 • 2.5% beginning fall 2019 • 2.5% beginning fall 2020 • 2.5% beginning fall 2021
It should be noted that 30% of the increase is recuperated by the MEES in order to help fund the Quebec Student Loans and Bursaries program. The net tuition increase kept by the University is therefore only $44.10 per FTE.
Canadians from other provinces and regulated international students pay tuition supplements, known as forfaitaires, over and above the base Quebec tuition rates. These amounts are deducted from the grant, effectively being returned to the government, which results in McGill receiving the equivalent per-student grants received for Quebec students. Tuition for students from the rest of Canada, comprised of the base Quebec rate plus the out-of-province supplement, is set at a level equivalent to the average tuition across the other nine provinces of Canada. The international rate is now being set at the rate approximately equivalent to the average teaching grant received for all international students in the Quebec system.
Apart from a 10% surcharge universities are allowed to assess on international student tuition fees, the supplements are returned to the
10 Refer to document from l’Institut de la statistique de Québec found at http://www.stat.gouv.qc.ca/statistiques/economie/comptes-economiques/revenu-menage/revenu-disponible-2015.pdf
government and are therefore considered in tuition revenue but deducted from the government grant.
There are fee exemptions for certain groups of international students, such as those from France, who, although international, paid the Quebec rate until 2015. Starting in fall 2015, the out-of-province supplements were also applied to newly enrolled undergraduate students from France. Those students who were enrolled prior to fall 2015 as well as those registered in graduate programs will continue to pay the Quebec tuition rates. The out-of-province supplement for fall 2017 will increase by 2.29% over the fall 2016 rate while the international supplements will increase by 2.7%%.
As was noted in Section 2, the tuition framework for out-of-province and international students is a current topic of discussion and is likely to be modified in the coming years. Eventual changes may impact tuition rates, revenues, student assistantships and possibly the number of international students registered at McGill. At this stage, information is too preliminary for any monetary adjustments in the budget, but it is noted here as a future opportunity and/or risk factor.
Tuition fees for deregulated students are set by the University. For each new entering cohort, we have adopted a “guaranteed” tuition model so that a student’s tuition rate is applicable for the duration of his/her studies. The rates are set to be priced competitively with our peers across Canada. For the fall 2017 cohort, the increase is set at 3% compared to the fall 2016 rate, with 3% increases planned for each of the four years after that. These rates are subject to being adjusted on a program-by-program basis based on our admissions yield figures and comparisons with peer programs.
Increases in ancillary student fees (frais institutionnels obligatoires or FIOs), have been regulated by the MEES since FY2011. Indexation of FIOs is set at the same rate as the base tuition (2.7% for FY2018) unless specific agreements are signed with the student associations. As with base regulated tuition, we assume a 2.7% increase in FY2018, followed by 2.2% for FY2019, and 2.5% for FY2020, FY2021, and FY2022.

60
7.1.4 Indirect costs of research and projections related to federal and provincial government funding
The federal and provincial governments recognize the need to cover costs related to supporting the administration and management of world-class research activities. Indirect costs of research relate to those activities that cannot be directly attributed to a specific research project, such as maintaining and heating buildings and providing a large array of services from the optical backbone network to Library subscriptions to research journals to hazardous waste removal and other such charges. Research contracts and grants are generally expected to provide some compensation to the University for the increased operating costs that it incurs in conjunction with such research. Below, we highlight the two most important programs to support indirect costs: 1) the Federal Research Support Fund for Tri-Agency Funding and 2) the provincial indirect costs of research (PICOR). Researchers who obtain contracts or grants from other sponsors are expected to include indirect costs in their budget at standard rates. 1-Federal: Research Support Fund Program (RSF)
“The Research Support Fund assists Canadian postsecondary institutions and their affiliated research hospitals and institutes with the expenses associated with managing the research funded by the three federal research granting agencies.”11 Research Support Fund Grants are calculated based on a three-year average of eligible Tri-Agency grants received by researchers affiliated with an institution, but the formula provides higher rates for smaller institutions12. While research-intensive universities have been funded at an average rate of 21% in the past 10 years, McGill has been funded at 19.5% because of its greater research intensity. Despite yearly increases in its eligible direct research funding, McGill has seen its rate of RSF grants drop from 22.6% in FY2007 to 19.8% in FY2017. Figure 14 details the increase in Federal Research Grants versus the decreasing share of RSF received at McGill. The main reason for this trend is that the
11 See the program description in more detail here: http://www.rsf-fsr.gc.ca/about-au_sujet/index-eng.aspx
total amount for this program has not grown at the same pace as the direct research funding. The figure shows that the reinvestments in the past two years (discussed below) have brought the rate back from a low of 17.6%, but the reinvestments have not brought the rate back to levels that allow Universities to cover the increasing costs associated with their research activities.
12 Details are available on the program website : http://www.rsf-fsr.gc.ca/apply-demande/calculations-eng.aspx

61
Figure 14: Evolution of federal research grants versus RSF rate
The 2016 Federal Budget included an additional $19 million for the RSF program, in addition to the $9 million already announced in the 2015 budget for FY2017. The total awarded under the RSF program for FY2017 was $369.4M, representing an increase of 8.2% from the $341.4M disbursed in FY2016. In FY2017, McGill received a grant of $28.9M, an increase of $3M compared to the previous year. The 2017 Federal Budget did not announce new investments (nor cuts) to support indirect costs. Based on the federal government Estimates, the total envelope will be $369.6M in FY2018.
Projection: McGill’s share of the total envelope has averaged 7.6% in the past 10 years, going up to 7.8% in FY2017. McGill’s notional grant for FY2018 is $28,422,046. Unless a significant new investment is made in the program, the notional amount should not change significantly.
$105.6 M
$113.1 M$117.6 M
$123.1 M$129.2 M
$135.5 M $138.4 M $138.8 M $140.9 M $142.7 M $145.5 M
$23.9 M $24.8 M $25.3 M $24.3 M $24.4 M $24.8 M $24.9 M $24.8 M $25.8 M $25.8 M$28.9 M
22.6%21.9% 21.5%
19.8%18.9%
18.3% 18.0% 17.9% 18.3% 18.1%
19.8%
10.0%
15.0%
20.0%
25.0%
30.0%
35.0%
$.0 M
$20.0 M
$40.0 M
$60.0 M
$80.0 M
$100.0 M
$120.0 M
$140.0 M
$160.0 M
2006-07 2007-08 2008-09 2009-10 2010-11 2011-12 2012-13 2013-14 2014-15 2015-16 2016-17
TRI (three year average of eligible amount) IC Allocation Ratio of Allocation to Eligible Amount

62
2-Provincial frais indirects de recherche FIR (indirect costs of research)
In FY2015, the MEES initiated a reform of the allocation formula related to the provincial indirect costs of research. According to the reform, the FIR envelopes would gradually be transformed to cover the cost of research space. The non-space related indirect costs would be covered by the granting agencies and allocated along with each provincial research grant (fixed at 27%). In parallel, it would be each university’s responsibility to obtain the equivalent 27% from non-provincial sources. FY2016 was the last year of the transitional PICOR grant. In FY2018, the Research Space grant is expected to be $20.0M. Indirect cost allocations flowing through each grant received by McGill and its affiliated institutions was $2.4M for FY2015 and FY2016 combined, and forecasted at $1.1M for FY2017.
7.2 Expenditures aligned with Priorities
Several processes and allocation models support the budgetary processes by providing on-going, documented and transparent mechanisms of resource allocation. As described in the sections below, our expenditures are aligned with priorities:
• salary policy to recruit and retain high calibre staff, tenure stream academic renewal for our research and teaching mission
• efficient administrative support for our research and academic mission and resource stewardship
• deferred maintenance plan to address capital and IT infrastructure needs
• incentive allocations for incremental enrolment, research activity, and the creation of endowed research chairs
• allocations for activities aligned with specific strategic priorities (e.g.: School of Public Policy and Indigenous studies initiative)
• Support for the creation of new revenue-generating programs • allocations for undergraduate student assistance and to support
graduate students • support for the Library • self-financed activities and overhead revenues • application of budget measures to create room for priorities
Projected operating expenditures over the next five years are described in Figure 15. Overall expenditures are expected to increase by 2.1% in FY2018, and 12.7% in the next five years.
Figure 15: Operating Expenditure Projections FY2016 – FY2022 ($M)
Figure 16: Projected Operating Expenditures – FY2018 Budget ($825.0M)
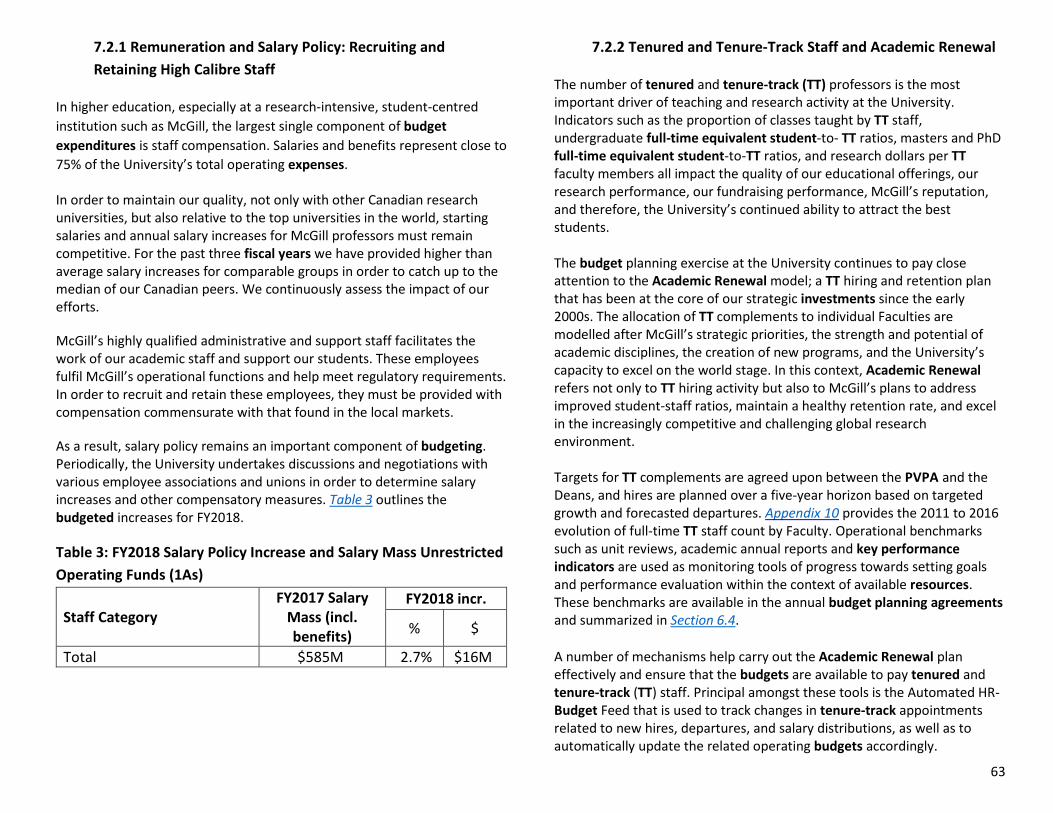
63
7.2.1 Remuneration and Salary Policy: Recruiting and Retaining High Calibre Staff
In higher education, especially at a research-intensive, student-centred institution such as McGill, the largest single component of budget expenditures is staff compensation. Salaries and benefits represent close to 75% of the University’s total operating expenses.
In order to maintain our quality, not only with other Canadian research universities, but also relative to the top universities in the world, starting salaries and annual salary increases for McGill professors must remain competitive. For the past three fiscal years we have provided higher than average salary increases for comparable groups in order to catch up to the median of our Canadian peers. We continuously assess the impact of our efforts.
McGill’s highly qualified administrative and support staff facilitates the work of our academic staff and support our students. These employees fulfil McGill’s operational functions and help meet regulatory requirements. In order to recruit and retain these employees, they must be provided with compensation commensurate with that found in the local markets.
As a result, salary policy remains an important component of budgeting. Periodically, the University undertakes discussions and negotiations with various employee associations and unions in order to determine salary increases and other compensatory measures. Table 3 outlines the budgeted increases for FY2018.
Table 3: FY2018 Salary Policy Increase and Salary Mass Unrestricted Operating Funds (1As)
Staff Category FY2017 Salary
Mass (incl. benefits)
FY2018 incr.
% $
Total $585M 2.7% $16M
7.2.2 Tenured and Tenure-Track Staff and Academic Renewal
The number of tenured and tenure-track (TT) professors is the most important driver of teaching and research activity at the University. Indicators such as the proportion of classes taught by TT staff, undergraduate full-time equivalent student-to- TT ratios, masters and PhD full-time equivalent student-to-TT ratios, and research dollars per TT faculty members all impact the quality of our educational offerings, our research performance, our fundraising performance, McGill’s reputation, and therefore, the University’s continued ability to attract the best students. The budget planning exercise at the University continues to pay close attention to the Academic Renewal model; a TT hiring and retention plan that has been at the core of our strategic investments since the early 2000s. The allocation of TT complements to individual Faculties are modelled after McGill’s strategic priorities, the strength and potential of academic disciplines, the creation of new programs, and the University’s capacity to excel on the world stage. In this context, Academic Renewal refers not only to TT hiring activity but also to McGill’s plans to address improved student-staff ratios, maintain a healthy retention rate, and excel in the increasingly competitive and challenging global research environment. Targets for TT complements are agreed upon between the PVPA and the Deans, and hires are planned over a five-year horizon based on targeted growth and forecasted departures. Appendix 10 provides the 2011 to 2016 evolution of full-time TT staff count by Faculty. Operational benchmarks such as unit reviews, academic annual reports and key performance indicators are used as monitoring tools of progress towards setting goals and performance evaluation within the context of available resources. These benchmarks are available in the annual budget planning agreements and summarized in Section 6.4.
A number of mechanisms help carry out the Academic Renewal plan effectively and ensure that the budgets are available to pay tenured and tenure-track (TT) staff. Principal amongst these tools is the Automated HR-Budget Feed that is used to track changes in tenure-track appointments related to new hires, departures, and salary distributions, as well as to automatically update the related operating budgets accordingly.

64
A series of central allocations from the operating budget, supplemented by financial resources from federal and provincial research agencies, salary award agencies, industry awards, endowed chairs, philanthropy activities, and Faculty resources support the activities related to academic renewal. The Academic Renewal Envelope (ARE) funded from the operating budget includes:
• recruitment cost allocation ($8,000 allocation per new hire; $12,000 allocation for CRC I or CERC)
• operating start-up allocation (between $9,600 and $14,400 depending on discipline) to support operating research costs for new hires
• capital start-up allocation (between $9,000 and $84,000 depending on discipline) to support capital research costs for new hires
• financial incentive for salary award contributions to regular salary of 45% except for clinical medical staff which is limited to 25%
• payment of tenure-track retirement allowance packages • contribution of 100% of tenure-track spousal hire salaries as well as
exclusion to complement count for duration of tenure-track appointments
• contribution to the home Faculty of the minimum of rank for each absented senior administrator
• financial incentive for newly created endowed chairs (25% as of June 2006 and 50% as of June 2010 of the chair income contribution towards professorial salary)
• contribution of half the minimum annual salary of an assistant professor salary for each pre-tenure departure
McGill benefits from 162 Canada Research Chairs (CRCs) from the federal government, and they are allocated to the Faculties based on the University’s strategic priorities. Nineteen of the 162 chairs are vacant as of March 31, 2017, of which 13 are new applications or renewals included in the spring 2017 submission round, leaving four vacant for retention and recruitment incentives in FY2018 and two that have been set aside for delayed applications in the fall 2017 round. Decisions on the fall 2016 round of applications (14 in total) are still pending as of March 31, 2017. To this federal contribution, the very selective Canada Excellence Research Chairs (CERC) program provides unique opportunities to attract exceptional researchers. In FY2014, we recruited our first CERC, the first female CERC awardee in the country, a specialist in human pain studies. In FY2015 our second CERC in Green Chemistry was hired. Unfortunately, the Green
Chemistry CERC chair holder is resigning at the end of FY2017 to pursue entrepreneurial projects. Each CERC chair holder receives significant contributions from the federal government ($10M for seven years) and a corresponding $10M committed by the University. The Provincial government typically provides a portion equivalent to the Federal government for research infrastructure costs. In addition there is approximately $8M contributed by the University to each CERC to create a research team and sustain the CERC investment. This takes the form of five additional tenure-track positions, their start-up allocations and graduate student support.
The University plans to have eight net new hires in years FY2018 to FY2019 and nine net new hires in years FY2020 to FY2022 in order to reach the target complement of 1,716 before exclusions (illustrated in Figure 17), or 1,727 in total in FY2022.
Figure 17: Tenured and Tenure-Track Complement Before Exclusions
Source: Office of the Associate Provost (Academic Priorities and Resource Allocation) Note: Year-End Complement in Figure 17 includes approximately 30 spousal hires and 6 senior administrators in “vacated academic positions” holding positions in administration and not teaching, that cannot be used for tenured and tenure-track hiring. A Provostial Complement of fifty academic positions was created in FY2017 to support priority hiring and simplify the spousal hire process. This central pool consists of opportunistic hires in various Faculties, hires aligned with Provostial strategic priority areas, and spousal hires for a six-year period of exclusion. Hires made from this pool are extra-to-complement for the implicated Faculty and positions will return to the Provostial pool when vacated.

65
Figure 18: Net New Tenured and Tenure-Track Hires (Departures)
Source: Office of the Associate Provost (Academic Priorities and Resource Allocation)
The cost of the Academic Renewal Envelope (ARE) is described in Figure 19.
Figure 19: Incremental Cost of Academic Renewal ($M)
Source: Office of the Associate Provost (Academic Priorities and Resource Allocation)
7.2.3 Ensuring Efficient Administrative Support
McGill’s dedicated administrative and support personnel are vital to the success of the University in fulfilling its mission and achieving its strategic objectives. Our administrative and support staff count increased from 3,462
at the beginning of FY2016, to 3,539 at the beginning of FY2017, a 2.2% increase.
As part of the budget measures introduced in fall 2014 a freeze on administrative and support staff external hiring was announced in October 2014. At the time, it had been proposed to claw back salaries of departing staff and have proposals for position replacements vetted by Human Resources staff and forwarded to the Budget Executive Committee (BEC) for approval. In summer 2015, the process was deemed overly cumbersome. As a result, it was decided to distribute the monetary value equivalent to the budget measure to each of the major units. From that point onwards, the staff reductions would be handled locally with budgets of departing staff members applied against the measure. The target was therefore changed from a headcount reduction to a monetary reduction. This measure is planned to impact the units until FY2021, albeit at reduced levels if conditions permit.
7.2.4 Enrolment-Driven Allocation
This activity-based budgeting mechanism provides funding to Faculties based on the incremental full-time equivalent (FTE) students multiplied by a Faculty-and-cycle-specific unit rate allocation (amounts are detailed in Figure 20). The enrolment-driven allocation model introduced in FY2012 used academic year 2010-2011 enrolment data as the baseline. Effective FY2016, the model was updated using the prior year’s FTEs as the baseline. To illustrate, the increment in FTEs for FY2017 is calculated as follows: the difference between the 2016-2017 FTEs (summer 2016, fall 2016 and winter 2017 semesters) and the 2015-2016 confirmed FTEs.

66
Figure 20: Budgetary Allocations to Faculties ($) for changes in enrolment (per FTE)
For FTEs associated with deregulated programs, the same rates apply to the teaching units and the Faculties managing the relevant degree program receive an additional allocation based on student growth and level of tuition.
In total, enrolment-driven allocations provided an incremental $8.7M to Faculties in FY2017 to spend on their top academic priorities. Given the enrolment forecasts, this amount is expected to remain relatively stable for the next five years.
For the self-funded programs in the Desautels Faculty of Management, revenues flow directly to the Faculty and an overhead is charged to cover central administrative and institutional costs.
7.2.5 Allocations related to Research
1-Research investment:
A large portion of the Vice-Principal (Research and Innovation) (VP-RI) sector budget is redistributed to enhance research activity in the Faculties, spent on intellectual property protection, institutional matching funds for various grant applications, or institutional memberships that allow researchers to apply for research funding, access resources, or participate in networks (e.g., Mitacs, Compute Canada, etc.). Here are some noteworthy examples: Institutional matching to CFI Major Rounds: CFI funding generally follows a fixed formula: 40% from CFI, 40% from the provincial government, and up to 20% in vendor rebates or direct University contributions. In major rounds of CFI investments, there are cases where the vendor rebates do not meet the target and due to the strategic value of these awards, McGill provides the balance through the CFI matching funds envelope, administered through the Office of the VP-RI. McGill’s direct contribution to awarded projects under CFI competitions (Innovation Fund 2013 and 2015) follows an established formula for institutional cash commitment. Institutional matching to other major grants: Over the past decade, public research funding in Canada has shifted toward an increasingly competitive system of partnership programs that require matching funds from multiple sources. Contributions by the principal investigator’s (PI) institution are frequently requested as part of a funding formula for large-scale research projects (networks, large teams, etc.). Although this represents a small portion of the total grant budget, the institutional contribution serves to demonstrate the commitment to the area of research and to better position our PIs and teams to access major external multiyear funding, available through federal and provincial funding programs including NCE, FRQ, and Tri-Agency partnership programs.
2-Support for the indirect cost of research
As explained above, research activities generate costs beyond what can be

67
directly attributed to a specific research project, i.e. indirect cost of research. McGill receives three types of support for these costs: federal research support fund, Quebec government frais indirects de recherche (FIR), and indirect cost recovery on research contracts and other grants. McGill allocates this support internally and with its affiliated research institutes in the following way:
Federal Research Support Fund (RSF) and provincial FIR: McGill receives an institutional RSF grant, which is reallocated to Faculties and affiliated institutions where the research takes place. For hospital-based research, the agreed RSF formula is that 80% of the indirect costs attributable to their research is transferred to the appropriate research institute; 20% remains with McGill to pay for central services such as IP protection, libraries, etc. For McGill-based research, 25% of the RSF grant is allocated to Faculties in their annual budget, who also receive 50% of both the incremental Federal and Provincial indirect cost rates above a baseline (calculated on a 3-year average FY2007-FY2009). For example, of the total RSF grant ($28M) in FY2017, $8.6M was distributed to the affiliated hospitals and $5.1M to the Faculties. The FIR from the Government of Quebec is principally to cover expenses related to research space and is managed centrally.
Contracts: The longstanding policy regarding research contracts is that 60% of indirect costs requested from the sponsor is allocated to the hospitals for research performed in the affiliated institutes. For campus-based research, it is split 1/3 to the Faculty and 2/3 central.
7.2.6 Student Assistance
For Quebec residents, the Provincial government has a comprehensive Loans and Bursaries program. A portion of the fees paid by all students is deducted from the university’s grant and contributes towards this program, McGill’s share being approximately $9M. Since the mid-1990s, for every dollar of Quebec tuition increase, the universities have contributed 25 cents to the Loans and Bursaries program. In FY2016, the recuperation increased to 30 cents per every tuition dollar increase. For FY2018, this translates into $10 per full-time student deduction out of the $34 total annual increase per student in the Quebec tuition rate.
13 2015/16 Senate Report on Scholarships and Student Aid, March 2017
The government supplements these contributions with its own allocations. In FY2016, McGill students received $41.5M in Quebec Loans and Bursaries. Another $36.1M was provided from other North American jurisdictions. Over 36% of McGill’s full-time students with access to Canadian and U.S. government aid programs received government aid.13 It is important to note that these amounts are not reported within our financial statements as they are paid directly to the students.
Restricted funds for aid/awards, such as donor direct-funded gifts and endowment income, as well as stipends from research grants ($76.9M in FY2016) and salaries paid to students through the operating and restricted funds ($37.3M in FY2016), also help support students.
In addition to these amounts, McGill continues its commitment to accessibility by contributing at least 30% of incremental net tuition towards student aid and support, taking into account incremental amounts received from donations. Figure 21 shows total student assistance from the operating fund. Included is an estimate of the 30% portion of net tuition increases that are directed toward students.

68
Figure 21: Student Assistance from Operating Fund ($M)
7.2.7 Strategic Priorities
In order to be true to McGill’s mission and to the University’s aspirations, we must be committed to investing continually and incrementally in strategic priorities (refer to Section 5). This means setting aside envelopes from operating funds, developing strategies to generate additional revenues, encouraging new ways of doing things on our campuses, and entering into partnerships to leverage resources.
Financial requests relating to academic and administrative activities are analysed by the Associate Provost (Academic Priorities and Resource Allocation) via the budget planning agreement process.
Recommendations are forwarded to the PVPA who, based on the financial viability and its strategic importance, determines whether requests are funded and the level of resources to allocate.
7.2.8 Graduate Student Support
McGill has recognized the need to provide competitive graduate student support in order to attract the highest quality graduate students to work alongside our professors. The Dean of Graduate and Postdoctoral Studies (GPS) allocates funds to each Faculty, on a formula-driven basis, to support the recruitment and retention of graduate students in line with the university’s strategic priorities. This central funding allocation forms the
0.8%1.3%
2.2%2.6%
2.9% 3.2%3.6% 3.4% 3.5% 3.7% 3.7% 3.9% 3.8% 3.9%
3.5% 3.5%
$4.2
$7.2
$13.0
$16.7$18.5
$22.7
$25.7 $26.0$27.0
$29.1$30.1
$31.6 $31.7$32.8
$31.6 $32.2
0.0%
1.0%
2.0%
3.0%
4.0%
5.0%
6.0%
7.0%
8.0%
9.0%
10.0%
0
5
10
15
20
25
30
35
% of Operating Revenue Total Student Aid

69
basis of all graduate student support. GPS works with the academic units to optimize the use of the allocation as part of effective funding packages to attract the best students.
Figure 22: Doctoral average financial support in 2015/16 for Quebec, Canadian, and International fee-exempt students
Note: Fall 2015 Full-time PhD enrolment: 3,327
Figure 23: Doctoral average financial support in 2015/16 for International non-fee exempt students
Notes: Only students registered full-time in both the fall and winter terms of an academic year are included.
Year in program is a derived field based on the admit term of the student. Includes Provincial FQR agency (FQRNT, FQRSC, FQRS) awards paid directly to the student, Excludes funding from sources where students are paid directly (other than the Provincial agencies) and financial support received from affiliated hospitals/research institutes.
7.2.9 McGill Library collections funding
The Library remains a top priority for the University and we wish to maintain our commitment to demonstrate the potential for digital resources to enhance education and continue to serve both students and faculty.
As a result, budget cuts within the Library system did not occur within collections spending. The collections budget remains whole and is dominated by the scholarly journal budget in accordance with the University’s status as one of Canada’s top ranked research intensive institution and the concomitant user demand for journal literature.
The US dollar exchange rate and increase in inflation are factors to consider as we strive to maintain a quality number of resources in the face of a flat budget. One time funding of $2.4M to mitigate inflation and currency devaluation was allocated to the Library in FY2015 (based on a Canadian dollar at approximately $0.78 - $0.80 US.) With the further drop of the Canadian currency, the University committed a one-time allocation of $3.7M for FY2016, followed by a permanent injection of $2.4M and a one-time allocation of $1.3M for FY2017. The PVPA will continue to support the collection with one-time annual adjustments, as it is one of the reputational pillars of McGill.
7.2.10 Self-financed activities and overhead charges
The University charges an overhead recovery fee on revenues earned in non-core operating funds in order to cover part of the central services provided and for the use of the infrastructure. As planned, the overhead recovery fee is increasing from 4.0% in FY2017 to 5.0% in FY2018. The process for collecting and recording of this fee is applied on a quarterly basis.
Unrestricted start-up grants and service agreements are excluded from this charge.
$0
$5,000
$10,000
$15,000
$20,000
$25,000
$30,000
$35,000
$40,000
$0
$5,000
$10,000
$15,000
$20,000
$25,000
$30,000
$35,000
$40,000
1 2 3 4 5 6 7+
Year in Program
Employment Earnings
Research Stipends
External Awards
Internal Awards
2015/16 Tuition & Fees(full-time)
2015/16 Tuition & Fees(additional session)
$0
$5,000
$10,000
$15,000
$20,000
$25,000
$30,000
$35,000
$40,000
$0
$5,000
$10,000
$15,000
$20,000
$25,000
$30,000
$35,000
$40,000
1 2 3 4 5 6 7+
Year in Program
Employment Earnings
Research Stipends
External Awards
Internal Awards
2015/16 Tuition & Fees(full-time)
2015/16 Tuition & Fees(additional session)

70
7.2.11 Budget Measures
Aside from the overhead charges increase described in section 7.2.10, no new budget measures are being introduced beyond those implemented in FY2016.
One of the original budget measures was relaxed moving forward, as explained next. The permanent cut on 1A administrative and support staff salaries was originally modelled based on a historical number of annual staff departures across the institution, the average salary of those departures (in FY2014), and the projected proportion of departures that would be replaced. In FY2017, the permanent cut was equal to 50% of salaries for the number of anticipated departures (or the equivalent of one out of every two departures not being replaced). Effective FY2018, the permanent cut was to have been equal to 40% of salaries for the number of anticipated departures (or the equivalent of two out of five departures not being replaced). However, this budget measure is being relaxed, and the permanent cut in FY2018 is reduced to 20% of salaries for the number of anticipated departures (or the equivalent of one out of five departures not being replaced).
Naturally, according to the evolution of the university’s financial situation, new budget measures may be applied, or old budget measures can be modified or extended.
7.3 Significant one-time and on-going expenses
In building its budget, the University needs to take into account one-time expenses that often arise from its fiscal obligations. Three current areas of expense include pay equity, pension and post retirement-related expenses and deferred maintenance.
7.3.1 Pay Equity
The Quebec Pay Equity Act of 1996 sought to redress differences in compensation for persons in predominantly female job classes that require similar skills, effort, and responsibility similar to male dominated job classes. This is not the same as employment equity which deals with individual differences, but both attempt to deal with the issue of “equal pay
for work of equal value”. The Act further stipulates how pay equity is to be evaluated and implemented.
In 2001 McGill accepted and submitted a pay equity program modelled after that used by the Treasury Board of Quebec. Quebec granted the University a one-time-only award for completing this task. However, several years later the Pay Equity Commission decided to reconsider the methodology employed by McGill to determine the settlement amounts. The new method resulted in additional retroactive pay awards to all individuals in certain classes of employees along with ongoing salary increases. Payments in respect of the 2001 and 2005 pay equity exercises were completed in May 2015 for a total cost of $33M.
The results of the 2010 pay equity exercise are currently being finalized with the unions and the employee associations. Shortly, McGill will start processing the retro payments and corresponding salary increases covering the period between the end of 2010 and the actual dates of payments. The 2015 pay equity exercise is also outstanding. We are setting aside $10M over the next five years for this purpose.
7.3.2 Pension Liability and Post-retirement Obligations
The McGill University Pension Plan (MUPP) has a defined contribution (DC) pension plan for employees hired on or after January 1, 2009 and a hybrid DC / defined benefit (DB) plan for employees hired before that date. Some trades and services groups have different capital accumulation plan types, but the amounts involved are relatively small. The defined benefit minimum in the hybrid plan requires periodic actuarial valuation to determine the plan’s funding adequacy to meet its obligations. In the past, the pension plan underwrote annuities for some employees which are also subject to valuation for funding adequacy. The December 31, 2015 triennial valuation showed an improvement in funded position of the plan with respect to the 2012 valuation, however additional contributions to the pension fund continue to be necessary. The funding deficit as at December 31, 2015 was $78M, down from $97.2M as at December 31, 2012. Contributions to fund the shortfall are being amortized over 15 years. In addition, MUPP Amendment 24 introduced

71
shortfall cost sharing with plan members as of January 1, 2014. Taking into account both cost sharing and the pension deficit amortization, University contributions are budgeted at $12.9M annually, until the next valuation. In order to allow departing members or those attaining age 65 to access 100% of their pension holdings, additional funding from the University is required.
Post-employment benefit obligations cost approximately $5M per annum. However, for those retiring on or after June 1, 2016, cost sharing for the Supplemental Health Plan was set at 30% for the University and 70% for the retirees. As for the Dental Plan, retirees are responsible for 100% of the plan as of the same date.
FY2018 will also be the last year of the Supplemental Notional Arrangement (SNA) program. This program, established in FY2012, provided University contributions towards the pension plan of those employees who continued to work beyond normal retirement age (65).
7.3.3 Deferred Maintenance
Beyond the day-to-day operational needs and priorities, the University must tend to and modernize its infrastructure in order to maintain state-of-the art facilities and technology, including its ERP (Enterprise Resource Planning). The amount required for deferred maintenance, both for buildings and information technology is estimated to exceed $1.3B. With an annual provincial capital grant of approximately $45M and other sources adding close to another $50M, it would take nearly 10 years simply to maintain our current infrastructure if the University were to invest its complete capital grant with no additional resources. When the need for additional space is factored in, particularly for wet research lab space, the physical constraints need to be studied, scenarios built and multiyear phased planning carried out. Thankfully, both the latest provincial and federal budgets announced significant investments in university infrastructure.
The deferred maintenance issue is subdivided into three themes: buildings, IT infrastructure, and inadequate and inappropriate space. In FY2015, the Board of Governors approved a $400M borrowing plan with a payback period of up to 40 years. During FY2016, the Quebec Ministry of Finance,
on recommendation from the MEES, approved the borrowing plan. A bond issuance of $160M was transacted, with 18 investors, at a rate of 3.975% maturing on January 29, 2056. We anticipate our next bond issuance to occur in 2018. The annual net cost to the operating fund for each of FY2018 through FY2022 is detailed in Appendix 14.
7.4 Target Surplus / Deficit
MEES requires Quebec universities to submit a balanced budget, based on a predetermined formula, or to submit a plan to return to a balanced budget within an acceptable time period. The University defines a “balanced budget” as having annual operating revenues sufficient to meet all operating expenses. An annual budgeted breakeven position would mean operating revenues exactly equal to operating expenses (excluding year-end audit adjustments).
Given the documented underfunding of universities within the Quebec university network, maintaining McGill’s excellence while trying to balance the budget represents a significant challenge. Nonetheless, any decision to run a deficit cannot be and is not taken lightly. Accumulated over many years, deficits can severely jeopardize a university’s ability to take on new initiatives or even maintain existing services in the future. Yet, there can be a time when running a deficit is the correct option. Consultation with the senior administration and the Board provides a sound system of checks and balances on the proposed bottom-line of McGill’s annual budget. The University is expected to run an annual deficit for each year until FY2022, when it returns to a surplus.
7.4.1 MEES Constraints on Target Deficits
If a university runs a deficit, the Règles Budgétaires state that it must provide a plan to return to a balanced budget in order to be eligible for its conditional grant. Failure to conform to this requirement comes with a substantial penalty: postponement of the conditional grant until an acceptable plan to return to balanced budget is accepted by MEES. Given our current forecast of a deficit for each of FY2018 to FY2021, adhering to a long-term balanced budget plan will be critical. We anticipate that changes in revenue streams, whether through a reinvestment or further liberalization of tuition fees will allow us to re-establish a deficit repayment

72
plan. For the moment however, as we cannot quantify any such revenue growths, our budget objectives are to moderate any growth in our accumulated deficit.
7.4.2 McGill GAAP deficit in comparison with other Quebec universities
Over the years, McGill has benchmarked against our Quebec peers to help better understand the efficacy of our approach compared to theirs in a shared context of dependence on provincial financial support for a significant proportion of operating revenues. We are able to see where McGill is following common trends and where the University is truly out on its own. Figure 24, illustrates that in FY2016 McGill’s accumulated deficit compared favourably to other universities in the Province that have medical schools (Laval, Sherbrooke and University of Montreal). This is largely due to the measures we took in the past couple of years to protect ourselves from optimistic outlooks.
Figure 24: GAAP Accumulated Surplus (Deficit) of Universities in Quebec for FY2016 ($M)
Notwithstanding our relatively positive position among comparable peers, we have taken the position that McGill, in the medium term, should commit to reducing the financed or cash accumulated deficit and develop
policies and approaches to prevent the GAAP deficit from rising and jeopardizing our financial rating.
7.4.3 Accumulated deficits
As shown in Figure 25, McGill’s accumulated (financed or cash) operating deficit of $94.3M forecasted for April 2018 would represent an amount equal to 11.6% of total operating revenue. To put this in perspective, since FY1991, the highest level of accumulated deficits as a percentage of operating revenue was 24.9% in FY1991, but the lowest was 3.2% in FY2002. The small blip upward in FY2011 was due primarily to an 11-month year in the transition to a new fiscal year ending April 30 vs. May 31. Plans are to maintain the accumulated financed deficit below 15% of total operating revenues.
Figure 25: Accumulated (financed) Deficit of McGill as a % of Operating Revenue
7.5 Carry forwards and Deficits
Carry forward and Deficit policies vary depending on the fund type. For plant funds and restricted funds, year-end balances are carried forward. This is due to the fact that the related activities are typically project based and often times the expenditure pattern does not follow the fiscal year. These funds are not allowed to run a deficit and any shortfall, at any point in time, triggers the end of further expenses.

73
For endowment funds, whether the spendable income fund is restricted or unrestricted, all current year unspent income is capitalized unless a formal request is made to Endowment Accounting and approved by the OPVPA to carry unspent income funds over to the following fiscal year. For operating funds the situation is somewhat more complex. It is important to note that while all operating funds are reported to external bodies as one fund, they are treated internally as many separate fund types:
• 1A: Operating / University Allocation: funds for which the University allocates operating budget
• 1B: Operating / Self-financing: ongoing self-funded operations • 1C: Special Purpose / Self-financing: short-term self-funded operations • 1D: Clearing Funds: used to book revenues / expenditures which are to
be redistributed or cleared before the end of each year • 1E: Special Purpose / related to an event: unrestricted funds related to
a special event, which may span multiple years • 1F: Unrestricted Funded Research: research funds for individuals
supported through operating funds
For 1A funds, the carry forward is calculated at the major organization level (i.e. Dean, Vice-Principal or Associate Vice-Principal level). For both administrative units and Faculties, deficits incurred at the end of a fiscal year have to be repaid in the subsequent fiscal year. On the other hand, positive carry forward amounts are treated differently. In the case of administrative units, carry forwards are recuperated by the University. For Faculties, positive carry forwards are placed in a reserve fund from which balances can only be accessed with the permission of the PVPA. It should be noted that there are a few exceptions to this process for Faculties, where certain funds are allowed to carry forward positive balances. For all unrestricted funds other than the 1A funds, fund holders can carry forward any free balances and can spend these at their discretion. Deficits, however, are not tolerated. Appendix 13 provides a summary of carry forwards and fund balances by major unit at the beginning of FY2017. Within the context of an overall accumulated operating deficit, with total carry forwards hovering at around $100M and a significant portion sitting in fund types that have no
spending restrictions, the potential liability risk is significant. As a result, the PVPA’s authorization is necessary to spend down positive carry forwards. The University is in the process of reviewing carry forward policies to better integrate within our planning.

74
8 Restricted Funds
The two major components of the restricted fund are the research grants and contracts, and the spendable income from endowments along with non-endowed gifts and bequests that must be spent in accordance with the terms of the donor. As well there are yet other relatively restricted sources of revenue whose purposes are tightly controlled and entered under restricted revenues.
8.1 Allocation of Indirect Costs of Research
Several allocation mechanisms are associated with research activity in the Faculties. Indirect costs of research are precisely those expenses that cannot be directly attributed to a specific research project and must be supported by University funds. Research contracts are expected to provide overheads to help support the cost of infrastructure employed in research. Federal and provincial governments have programs that make contributions to part of the indirect costs of research, and also flow through the operating budget.
8.2 Research revenues
Figure 26 represents a projection of research revenues, grants and contracts, as per the target assumptions set out in the budget planning agreements for each Faculty. The 5.1% increase in research revenues between FY2017 and FY2022 represents a conservative 1% increase per year.
Figure 26: Research Revenue Projection ($M)
We have included a modest 0.9% growth in grants and contracts revenues for the FY2018 budget, in line with the annual increase reflected in the budget planning agreements.

75
9 Endowment Funds
9.1 Donations and Gifts
Pledges from fundraising and other donations are recorded in the period in which they are collected (excluding commitments). In terms of McGill’s predicted philanthropic revenues, total “cash in” (gifts plus pledge payments) is forecasted to be between $105M - $115M in FY2017and budgeted to be between $105M - $125M for FY2018.. These amounts include a forecast of around $30M in endowed gifts for FY2017 and a projected $30M to $35M in FY2018.
For the most part, donations are received for restricted purposes with more than half being destined towards the endowment fund. Figure 27 provides a breakdown for FY2016.
Figure 27: FY2016 Donations by type ($’000)
9.2 Endowments
The University is a careful steward of the gifts and donations it receives. We are also very mindful of the obligations we undertake whenever we accept philanthropic support. Principal among these obligations is the alignment of endowments with University needs and to ensure that the funds are indeed spent to support our mission. Minimizing capitalization and decapitalization (refer to Figure 28) are to some extent measures of this alignment.
Figure 28: FY2016 Capitalization and Decapitalization of Endowment funds ($’000)
The market value of McGill’s endowment, including trust funds, has achieved steady growth during the past few years (refer to Figure 29). Additional donations to the endowment fund as well as capitalizations allow the purchase of more units while the performance of related investments impacts the unit value.

76
Figure 29: Market value of McGill Investment Pool (including trust funds) as at April 30
The McGill Investment Pool (MIP) consists of investments for the McGill endowments and accounts managed on behalf of McGill units and affiliated entities. Management fees contributed by the MIP to the operating fund are approximately 50 basis points (bps) (i.e. 0.5%). An additional 40 bps (0.4%) are paid for associated external charges related to investment management and custodial and service provider fees and for costs associated with the Office of Investments.
In FY2016 an income distribution rate of 4.25% was established, consistent with the rate of the previous year. Due to the exceptional performance of the MIP, the Board of Governors approved to maintain the income distribution rate at 4.25% as well as an additional distribution of 0.25% until FY2019, thus bringing the total distribution to 4.50% for the next three years. For FY2018, the distribution rate per MIP unit will be set at $17.53, 5.1% greater per unit than the rate of $16.68 in FY2017.
Table 4 reflects the actual growth in the Endowment due to continued gifts and also outlines particular investment returns for FY2016. Overall, the Fund lost 1% in value during FY2016, as compared to a gain of 12% in the prior year. Although new gifts provided a 2.3% increase (FY2015: 3.3%), the combination of realized gains on sale of investments and change in the unrealized market values of the investments contributed to a decrease in fund value of 0.4% (2015: 11.8% increase). The annual income
distribution/payment, including other transfers, contributed to an additional 2.9% reduction (2015: 3.1% net reduction).
Table 4: Change in McGill Endowment Fund market value for the year ended April 30, 2016
Reflecting the performance of financial markets over the past year, preliminary indications are that the endowment, including gifts received during the year, will experience an increase in excess of 10%.
Appendix 15 highlights the scholarships, bursaries, fellowships and endowed chairs that flowed from the endowment fund to the benefit of each Faculty and major unit, totalling $42.1M in FY2016 versus FY2009-FY2014 totals.

77
10 Plant Fund The plant fund includes capital grants received primarily for the purposes of renovating existing space, addressing deferred maintenance projects, and from time to time, constructing new space in addition to purchasing capital assets. As well, there are contributions in the way of gifts and bequests as well as contributions from student groups.
Facilities Management and Ancillary Services (FMAS) is presently implementing a portfolio management process to help with the prioritization of all requests to ensure that capital expenditures are aligned with McGill’s strategic goals and the Principal’s Priorities. To that effect, FMAS assigns all capital expenditure efforts to one of the following six portfolios:
1. Campus Development (CD) 2. Institutional Priorities (IP) 3. Research Infrastructure (RI) 4. Student Life and Learning (SLL) 5. Physical Infrastructure (PI) 6. IT Infrastructure (IT)
10.1 Capital Budget
The FY2018 Capital Budget is summarized in Figure 30:
14 Excluding the reallocated Library envelope
Figure 30: Projected McGill Capital Budget from MEES FY2018 ($M)
Excluded from this total are other capital grants received by the University, which include the Canada Foundation for Innovation (CFI) grants (i.e. Research Portfolio), Quebec’s matching contributions to CFI, and capital donations from private sources.
In addition to these funds, in December 2016, McGill received $65M from the Federal Strategic Investment Fund (SIF), along with an additional $2.2M from Quebec, for the completion of various infrastructure projects across the campus. More specifically, this funding will be directed toward the following projects over FY2018:
• Stewart Biology asbestos abatement (Phase 1) $33.0M (CD Portfolio) • Construction of a new Power House $5.8M (CD Portfolio) • Duff Building HVAC $13.2M (PI Portfolio) • Rutherford Building HVAC $7.1M (PI Portfolio) • Macdonald-Stewart Library Building HVAC $1.5 M (PI Portfolio) • Nanotools Laboratory $2.3M (RI Portfolio) • Wong Foundry $2.1M (+ $2.2M from QC) (RI Portfolio)
It is important to note, that McGill’s capital grant has steadily decreased over the past three years (FY2016: $48.2M FY2017: $46M FY2018: $45.1M)14. This decrease is not the result of a reduction in the total provincial capital grant allocation, but rather a reduction in McGill’s

78
proportional share of that Grant. This reduced share is mostly the result of the age factor of University buildings being maximized at 50 years old. Each year, the average age of McGill’s heritage campus gets closer to that of the newer campuses, and our share of the renovation grant is thereby reduced. It is expected that McGill’s proportional share will continue to decrease, but at a slower rate.
As was the case last year, in order to build our multi-year capital budget projections, we have assumed that the current funding level from MEES will continue for the next five years, and that the envelopes for deferred maintenance will continue for a 15-year period (beginning in 2007), as indicated in Quebec’s own budget. We have built these MEES allocations into the budget for FY2018 and into preliminary planning for subsequent fiscal years.
In FY2016, a Province-wide exercise led by Bureau de Coopération Inter-universitaire (BCI) sought to identify our deferred maintenance inventory. Officially, our deferred maintenance deficit, in MEES-subsidized buildings (excluding downtown residences, etc.), is estimated at $728M. Because of limitations in the methodology, this number is an absolute minimum (e.g. it does not include building facades, etc.) and McGill believes the actual deficit is above $1B. Since the release of this BCI report, the University has obtained authorization from the provincial government to issue $400M in bonds, of which $300M is to address critical deferred maintenance projects. To date, $160M has been issued. (Please see Section 7.3.3.)
As of FY2015, the Quebec Government has changed its Plan quinquennal d’investissment (PQI) program to become a ten-year program, now called the Plan décennal d'investissements universitaires (PDIU). MEES has also required that the Plan include the capital priorities for University research projects and priority capital projects for all affiliated institutes (i.e. the research institutes of the teaching hospitals). For new construction and other capital initiatives related to teaching, McGill submitted the following six projects as part of the PDIU 2017-2027, in order of priority:
• Stewart Biology Building – asbestos abatement (Phases 2 & 3) (CD Portfolio)
• Bioengineering office space (IP Portfolio) • Purchase of 680 Sherbrooke West (CD Portfolio) • Renovation and redevelopment of the McLennan-Redpath Library
Complex (CD Portfolio)
• Macdonald campus student life & learning building (new construction / CD Portfolio)
• Projects for universal design and access (SLL Portfolio)
In addition, 15 major deferred maintenance projects were submitted, with an estimated cost of $219M, which McGill is planning to address as part of the $300M financed by the bond issuance. Furthermore, 45 research projects, 6 teaching & research projects, plus 15 projects related to McGill’s affiliated hospital research institutes were submitted.
Indications continue that MEES funds will be extremely limited for new capital initiatives for the next few years.
The University anticipates allocating $45.1M in capital monies for FY2018, as shown in Figure 31.
Figure 31: Projected McGill Capital Allocations from the Capital Budget FY2018
Faculty priorities for space needs, maintenance work, and capital projects drive the planning of the institutional priorities segment of the capital budget, which is determined in meetings with the Faculties each fall. The space and maintenance issues are reviewed further by the new Portfolio Management Technical Review Committee.
The $9.5M Institutional Priorities budget is managed by the Associate Provost, Academic Priorities and Resource Allocation. It includes $4.5M for capital start-ups funds for new tenure-track professors and Faculty base

79
allocations, and $5M for the Institutional Priorities Capital Projects (IPCAP). A new approval process for IPCAP was implemented in FY2017 to manage the funding of projects, excluding deferred maintenance. The IPCAP list is reviewed and prioritized by an advisory committee to the PVPA and preliminary recommendation for approval is given to projects that will require further feasibility study and costing. The cost of pre-design is shared between the University and Faculty. The IPCAP committee meets in mid-December; recommendations are presented to PVPA and Vice-Principal, Administration and Finance in mid-January and funding decisions are included in budget planning agreement documents as PVPA response.
The Student Life and Learning (SLL) Portfolio is comprised of 5 programs, 3 of which already have a well-establish prioritization committee:
1. The Teaching and Learning Spaces Working Group (TLSWG); 2. The University Teaching Labs Working Group (UTLWG) and; 3. The Universal Access Capital Projects Working Group
Figure 32 and Figure 33 below reflect these efforts.
Figure 32: Classroom Renovation Projects Approved for FY2018 ($’000):
Figure 33: UTLWG recommended capital allocations FY2018
10.2 Impact of Capital Expenditures on the Operating Budget
All capital asset purchases over $1,000 are recorded in the plant fund. Due to MEES capital budget rules, under normal circumstances, equipment and small renovations are funded from operating funds and restricted funds. In these instances, the expense on these latter funds is negated, as an inter-fund transfer debits the funding source and increases the capital assets in the plant fund. Over time, these assets are expensed as amortization in the plant fund.
Any renovations undertaken in leased properties are not eligible to be funded from the capital budget and are sometimes funded from the operating budget.
For large equipment, significant renovations and any construction, capital funds are secured at the start of a project. If such a project requires a borrowing instrument, details are arranged ahead of time as to the contributions from various sources. The planning and financial arrangements are under the purview of the Buildings and Properties Committee of the Board of Governors.
Capital expenditures can therefore have important impacts – both positive and negative – on the operating budget.

80
On the positive side, McGill University has adopted an overall sustainability strategy, which includes buildings and utilities through its Master Plan commitments. Buildings are generally the largest consumers of energy and the largest source of greenhouse gas emissions on our campuses. Buildings also use significant amounts of potable water. We design, build, and maintain buildings in ways that provide a safe and healthy indoor environment for occupants while simultaneously mitigating the building’s impact on the outdoor environment. For new buildings, McGill forecasts the operating costs and funding sources to help cover those costs.
As well, wherever possible, energy efficiency is a major consideration when building and renovating facilities. The University has an established process to quantify the savings and payback period for energy saving investments in existing buildings. These forecasts provide justification to the Board for borrowing to undertake the investment. These energy saving projects are funded by borrowing rather than the capital budget, which has provincially set restrictions on use. For example, in FY2014, the University set forth a $1.36M project to reduce energy consumption by retrofitting lighting in 14 buildings on the two campuses as part of a 5-year Energy Management Program. A similar energy model is used to quantify energy costs in research laboratory renovations. The University also plans to move academic units out of small, inefficient row houses and mansions to reduce operating costs and the deferred maintenance backlog.
For smaller projects, such as renovations of research lab space for academic staff funded by the capital budget and by research grants (restricted), we do not quantify changes to the operating costs. Changes in energy costs are sometimes quantified, particularly when the project involves installation of energy-intensive equipment.
On the negative side, the lack of adequate space limits our capacity for student enrolment (at all levels) and for research and therefore limits our capacity to increase revenues. Our deferred maintenance planning over the coming years will attempt, in part, to address this issue. The $400M investment in deferred maintenance will come at a significant financial cost, which will be part of the operating budget over the next 40 years.

81
11 Overall Borrowing and Debt Position
As at January 31, 2017, the University’s total borrowings were $1,078.2M, including long-term debt of $985.2M and bank indebtedness of $93.0M. Included in the long-term debt is $160M of McGill Senior Unsecured Debentures issued in January 2016 and $150M of McGill Senior Unsecured Debentures issued in 2002. The remaining $675.2M is substantially all due from MEES, for which University charges MEES interest. Overall long-term debt decreased by $38.4M in FY2017 as compared to FY2016. The projected MEES total debt is expected to be approximately $680M by April 2017.
The indebtedness is supported by unsecured and uncommitted lines of credit, totalling $350M available to McGill and is normally drawn through bankers’ acceptances for periods of up to one year. McGill’s Board of Governors has approved maximum borrowings in FY2017 totalling $300M under short-term credit facilities.
Our short-term bank borrowing in FY2017 included approximately $79M temporarily borrowed on behalf of MEES and for capital projects ($29M) for which current fundraising efforts are on-going (see Appendix 16). The net remainder is comprised of cash generated from working capital items and the financing of the accumulated deficit.
Any carrying costs associated with MEES temporary borrowings are charged back to the Government at the monthly CDOR rate plus 30 basis points (currently at approximately 1.15%). Other interest rate assumptions are discussed below.
11.1 Interest and Bank Charges Expense assumptions
The cost of borrowing is expected to be approximately 0.93% over the course of FY2017 and total interest and bank charges expenses are forecast to be $2.0M in FY2017. We have anticipated that our borrowing rate will rise modestly to 1.10% in FY2018 and that our borrowings will increase for purposes of extrapolation of future budget estimates. The increase in borrowings is attributed to temporary borrowings for the Strategic Investment Fund (SIF) projects. As such, our interest and bank charges expenses will be approximately $2.5M.
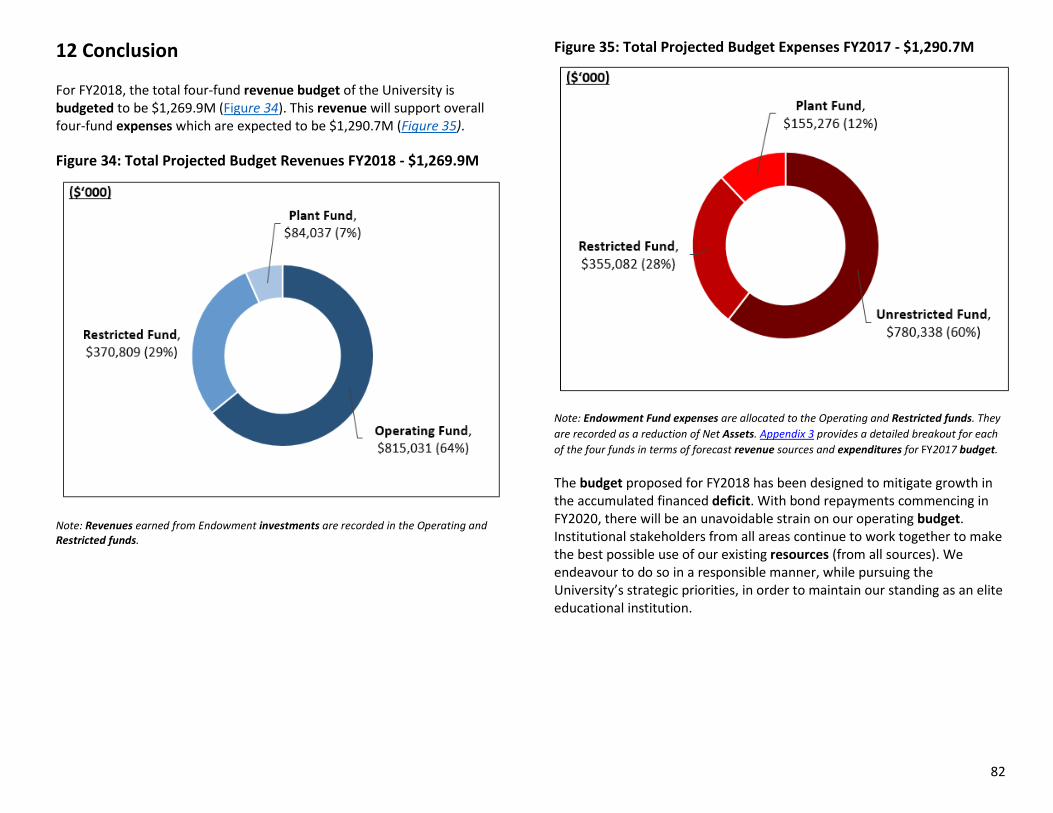
82
12 Conclusion
For FY2018, the total four-fund revenue budget of the University is budgeted to be $1,269.9M (Figure 34). This revenue will support overall four-fund expenses which are expected to be $1,290.7M (Figure 35).
Figure 34: Total Projected Budget Revenues FY2018 - $1,269.9M
Note: Revenues earned from Endowment investments are recorded in the Operating and Restricted funds.
Figure 35: Total Projected Budget Expenses FY2017 - $1,290.7M
Note: Endowment Fund expenses are allocated to the Operating and Restricted funds. They are recorded as a reduction of Net Assets. Appendix 3 provides a detailed breakout for each of the four funds in terms of forecast revenue sources and expenditures for FY2017 budget.
The budget proposed for FY2018 has been designed to mitigate growth in the accumulated financed deficit. With bond repayments commencing in FY2020, there will be an unavoidable strain on our operating budget. Institutional stakeholders from all areas continue to work together to make the best possible use of our existing resources (from all sources). We endeavour to do so in a responsible manner, while pursuing the University’s strategic priorities, in order to maintain our standing as an elite educational institution.
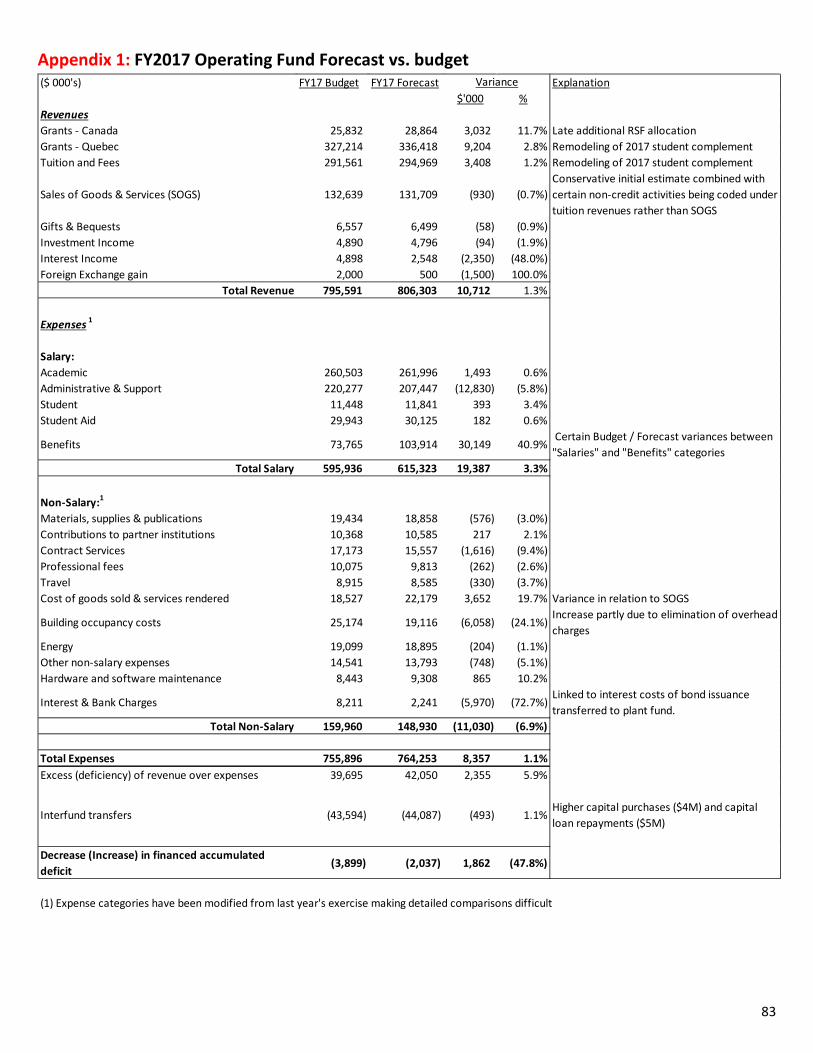
83
Appendix 1: FY2017 Operating Fund Forecast vs. budget
($ 000's) FY17 Budget FY17 Forecast Explanation$'000 %
RevenuesGrants - Canada 25,832 28,864 3,032 11.7% Late additional RSF allocationGrants - Quebec 327,214 336,418 9,204 2.8% Remodeling of 2017 student complementTuition and Fees 291,561 294,969 3,408 1.2% Remodeling of 2017 student complement
Sales of Goods & Services (SOGS) 132,639 131,709 (930) (0.7%)Conservative initial estimate combined with certain non-credit activities being coded under tuition revenues rather than SOGS
Gifts & Bequests 6,557 6,499 (58) (0.9%)Investment Income 4,890 4,796 (94) (1.9%)Interest Income 4,898 2,548 (2,350) (48.0%)Foreign Exchange gain 2,000 500 (1,500) 100.0%
Total Revenue 795,591 806,303 10,712 1.3%
Expenses 1
Salary:Academic 260,503 261,996 1,493 0.6%Administrative & Support 220,277 207,447 (12,830) (5.8%)Student 11,448 11,841 393 3.4%Student Aid 29,943 30,125 182 0.6%
Benefits 73,765 103,914 30,149 40.9% Certain Budget / Forecast variances between "Salaries" and "Benefits" categories
Total Salary 595,936 615,323 19,387 3.3%
Non-Salary:1
Materials, supplies & publications 19,434 18,858 (576) (3.0%)Contributions to partner institutions 10,368 10,585 217 2.1%Contract Services 17,173 15,557 (1,616) (9.4%)Professional fees 10,075 9,813 (262) (2.6%)Travel 8,915 8,585 (330) (3.7%)Cost of goods sold & services rendered 18,527 22,179 3,652 19.7% Variance in relation to SOGS
Building occupancy costs 25,174 19,116 (6,058) (24.1%)Increase partly due to elimination of overhead charges
Energy 19,099 18,895 (204) (1.1%)Other non-salary expenses 14,541 13,793 (748) (5.1%)Hardware and software maintenance 8,443 9,308 865 10.2%
Interest & Bank Charges 8,211 2,241 (5,970) (72.7%)Linked to interest costs of bond issuance transferred to plant fund.
Total Non-Salary 159,960 148,930 (11,030) (6.9%)
Total Expenses 755,896 764,253 8,357 1.1%Excess (deficiency) of revenue over expenses 39,695 42,050 2,355 5.9%
Interfund transfers (43,594) (44,087) (493) 1.1%Higher capital purchases ($4M) and capital loan repayments ($5M)
Decrease (Increase) in financed accumulated deficit
(3,899) (2,037) 1,862 (47.8%)
(1) Expense categories have been modified from last year's exercise making detailed comparisons difficult
Variance

84
Appendix 2: Multi-year Financial Outlook by Revenue and Expense
Operating Fund($ 000's) Actual Actual Forecast Budget
FY2015 FY2016 FY2017 FY2018RevenueGrants Canada 25,788 25,832 28,864 25,708 Quebec 341,640 336,956 336,418 332,544 United States - - - - Other Sources - - - - Contracts - - - - Tuition & Fees 258,489 274,322 294,969 307,836Sales of Goods & Services 129,678 133,522 131,709 134,067Gifts & Bequests 6,099 6,989 6,499 6,884Foreign Exchange Gain 3,811 791 500 500Investment and Interest Income 5,887 9,127 7,344 7,492Unrealized Gains (Losses)1 5,284 (6,284) - -
Total Revenues 776,676 781,255 806,303 815,031ExpensesSalary: Academic 237,332 249,433 261,996 271,147 Administrative & Support 202,061 209,495 207,447 217,038 Student 11,674 11,786 11,841 12,119Student Aid 27,001 29,120 30,125 31,562Benefits 101,197 103,303 103,914 94,177 Year-end actuarial adjustments (pension liability & post-employment benefit remeasurements)2 (24,766) (26,853) - - Year-end accruals (vacation, pension obligation, post-employment benefits)2 (10,400) 13,949 - -
Total Salary 544,099 590,233 615,323 626,043Non-Salary: Materials, Supplies & Publications 15,925 15,590 18,858 12,584 Contributions to Partner Institutions 10,503 9,832 10,585 9,933 Contract Services 13,920 12,004 15,557 7,875 Professional Fees 10,661 9,059 9,813 7,342 Travel 9,015 9,031 8,585 8,101 Cost of Goods Sold & Services Rendered 17,059 17,193 22,179 21,547 Building Occupancy Costs 16,652 23,101 19,116 15,677 Energy 19,469 18,427 18,895 18,143 Other Non-Salary Expenses 10,122 13,291 13,793 38,650 Hardware and Software Maintenance 6,925 8,069 9,308 11,703 Interest and Bank Charges 3,111 10,334 2,241 2,740
Total Non-Salary 133,362 145,931 148,930 154,295
Total Expenses 677,461 736,164 764,253 780,338
Gain on Sale of Land - 20,638 - -
Excess (deficiency) of revenue over expenses 99,215 65,729 42,050 34,693Inter-Fund Transfers (negative is a debit, positive is a credit)Net change in fund balance - - - - Pension Liability and Post-Employment Benefit Remeasurements2 (24,766) (26,853) - - Inter-Fund Transfers (2,853) 3,830 (1,644) (1,529)Internal Loan Repayments (22,810) (11,447) (10,000) (10,000)Capital purchases via interfund transfers (34,532) (31,202) (30,000) (30,000)Over (under) Distributed Endowment Income (581) (4,213) (2,500) (2,500)Book to Market Adjustment1 (5,284) 6,284 - - (Capitalization) Decapitalization of Current Year Investment Income (285) (336) 57 (593)
Total Inter-Fund Transfers (91,111) (63,937) (44,087) (44,622)Increase (Decrease) in Net Assets 8,104 1,792 (2,037) (9,929)
Net Assets, Beginning of Year (334,861) (326,757) (324,965) (327,002)
Net Assets, End of Year (326,757) (324,965) (327,002) (336,932)
Decrease (Increase) in Accumulated Financed Deficit2 (2,296) 15,741 (2,037) (9,929)
Notes:(1) Unrealized gains (losses) and the offsetting Book-to-Market Adjustment are not forecasted or budgeted(2) The forecast and budget do not include estimates for year-end actuarial adjustments: pension liability and post-employment benefit remeasurement, as well as accruals for vacation, pension obligation and post employment benefits

85
Appendix 2: Multi-year financial outlook by Revenue and Expense (2 of 4)
Restricted Fund($ 000's) Actual Actual Forecast Budget
FY2015 FY2016 FY2017 FY2018RevenueGrants Canada 166,269 174,928 180,176 183,779 Quebec 43,785 52,054 53,616 54,688 United States 7,126 7,302 7,433 7,508 Other Sources 27,596 9,074 9,625 10,150Contracts 18,204 21,133 20,898 21,525Tuition & Fees - - - - Sales of Goods & Services 8,714 6,386 6,168 6,784Gifts & Bequests 34,183 41,031 42,262 42,685Foreign Exchange Gain - - - - Investment and Interest Income 43,155 42,829 43,257 43,690Unrealized Gains (Losses)1 45 82 - -
Total Revenues 349,077 354,819 363,435 370,809ExpensesSalary: Academic 65,796 69,340 71,037 74,056 Administrative & Support 21,579 22,597 24,328 25,362 Student 25,682 25,532 25,128 25,378Student Aid 75,852 76,902 78,196 78,978Benefits 16,103 16,609 17,560 18,087
Total Salary 205,012 210,980 216,248 221,860Non-Salary: Materials, Supplies & Publications 27,886 28,071 29,050 29,100 Contributions to Partner Institutions 35,276 30,836 31,761 31,811 Contract Services 10,061 10,638 9,457 9,507 Professional Fees 11,062 11,622 12,255 12,305 Travel 16,700 16,999 17,018 17,068 Cost of Goods Sold & Services Rendered - - - - Building Occupancy Costs 2,961 4,870 4,794 4,844 Energy 398 (174) - - Other Non-Salary Expenses 26,391 27,966 28,237 28,287 Hardware and Software Maintenance 295 225 250 300 Interest and Bank Charges 9 3 - -
Total Non-Salary 131,039 131,056 132,822 133,222
Total Expenses 336,051 342,036 349,070 355,082
Excess (deficiency) of revenue over expenses 13,026 12,783 14,364 15,727Inter-Fund Transfers (negative is a debit, positive is a credit)Net change in fund balance - - - - Pension Liability and Post-Employment Benefit Remeasurements2 - - - - Inter-Fund Transfers 7,767 2,480 9,750 3,200Internal Loan Repayments (118) (739) (11,464) (500)Capital purchases via interfund transfers (10,378) (13,672) (9,992) (12,500)Over (under) Distributed Endowment Income - - - - Book to Market Adjustment1 - - - - (Capitalization) Decapitalization of Current Year Investment Income (7,698) - - -
Total Inter-Fund Transfers (10,427) (11,931) (11,706) (9,800)Increase (Decrease) in Net Assets 2,599 852 2,658 5,927
Net Assets, Beginning of Year (3,570) (971) (119) 2,539
Net Assets, End of Year (971) (119) 2,539 8,466
Notes:(1) Unrealised gains (losses) and the offsetting Book-to-Market Adjustment are not forecasted or budgeted(2) The forecast and budget do not include estimates for year-end actuarial adjustments: pension liability and post-employment benefit remeasurement, as well as accruals for vacation, pension obligation and post employment benefits

86
Appendix 2: Multi-year financial outlook by Revenue and Expense (3 of 4)
Plant Fund($ 000's) Actual Actual Forecast Budget
FY2015 FY2016 FY2017 FY2018RevenueGrants Canada 16,457 16,412 15,135 16,648 Quebec 59,545 54,567 53,061 58,367 United States - - - - Other Sources - - - - Contracts - - - - Tuition & Fees - - - - Sales of Goods & Services 334 338 343 348Gifts & Bequests 6,142 6,131 6,092 6,701Foreign Exchange Gain - - - - Investment and Interest Income 505 778 1,793 1,973Realized losses - - (11,729) - Unrealized Gains (Losses)1 10,752 (2,032) - -
Total Revenues 93,735 76,194 64,695 84,037ExpensesSalary: Academic - - - - Administrative & Support - - - - Student - - - - Student Aid - - - - Benefits - - - -
Total Salary 0 0 0 0Non-Salary: Materials, Supplies & Publications - - - - Contributions to Partner Institutions - - - - Contract Services - - - - Professional Fees - - - - Travel - - - - Cost of Goods Sold & Services Rendered - - - - Building Occupancy Costs - - - - Energy - - - - Other Non-Salary Expenses 2,087 3,610 4,000 5,000 Hardware and Software Maintenance - - - - Amortization 109,009 113,432 113,775 113,889 Interest and Bank Charges 27,943 29,521 35,887 36,387
Total Non-Salary 139,039 146,563 153,662 155,276
Total Expenses 139,039 146,563 153,662 155,276
Extraordinary Revenues 2,513
Excess (deficiency) of revenue over expenses (45,304) (67,856) (88,967) (71,238)Inter-Fund Transfers (negative is a debit, positive is a credit)Net change in fund balance 914 387 600 750 Pension Liability and Post-Employment Benefit Remeasurements2 - - - - Inter-Fund Transfers 3,628 1,431 400 400 Internal Loan Repayments 22,928 12,186 21,464 10,500 Capital purchases via interfund transfers 44,910 44,874 39,992 42,500 Over (under) Distributed Endowment Income - - - - Book to Market Adjustment1 - - - - (Capitalization) Decapitalization of Current Year Investment Income - - - -
Total Inter-Fund Transfers 72,380 58,878 62,456 54,150Increase (Decrease) in Net Assets 27,076 (8,978) (26,511) (17,088)
Net Assets, Beginning of Year 243,869 270,945 261,967 235,456
Net Assets, End of Year 270,945 261,967 235,456 218,368
Notes:(1) Unrealized gains (losses) and the offsetting Book-to-Market Adjustment are not forecasted or budgeted(2) The forecast and budget do not include estimates for year-end actuarial adjustments: pension liability and post-employment benefit remeasurement, as well as accruals for vacation, pension obligation and post employment benefits

87
Appendix 2: Multi-year financial outlook by Revenue and Expense (4 of 4)
Endowment Fund($ 000's) Actual Actual Forecast Budget
FY2015 FY2016 FY2017 FY2018RevenueGrants Canada - - - - Quebec - - - - United States - - - - Other Sources - - - - Contracts - - - - Tuition & Fees - - - - Sales of Goods & Services - - - - Gifts & Bequests - - - - Foreign Exchange Gain - - - - Investment and Interest Income - - - - Unrealized Gains (Losses)1 - - - -
Total Revenues 0 0 0 0ExpensesSalary: Academic - - - - Administrative & Support - - - - Student - - - - Student Aid - - - - Benefits - - - -
Total Salary 0 0 0 0Non-Salary: Materials, Supplies & Publications - - - - Contributions to Partner Institutions - - - - Contract Services - - - - Professional Fees - - - - Travel - - - - Cost of Goods Sold & Services Rendered - - - - Building Occupancy Costs - - - - Energy - - - - Other Non-Salary Expenses - - - - Hardware and Software Maintenance - - - - Interest and Bank Charges - - - -
Total Non-Salary 0 0 0 0
Total Expenses 0 0 0 0
Excess (deficiency) of revenue over expenses 0 0 0 0Inter-Fund Transfers (negative is a debit, positive is a credit)Net change in fund balance 148,433 (4,499) 175,000 215,000Pension Liability and Post-Employment Benefit Remeasurements2 - - - Inter-Fund Transfers (8,542) (7,741) (8,506) (2,071)Internal Loan Repayments - - - - Capital purchases via interfund transfers - - - - Over (under) Distributed Endowment Income 581 4,213 2,500 2,500Book to Market Adjustment1 5,284 (6,284) - - (Capitalization) Decapitalization of Current Year Investment Income 7,983 336 (57) 593
Total Inter-Fund Transfers 153,739 (13,975) 168,937 216,022Increase (Decrease) in Net Assets 153,739 (13,975) 168,937 216,022
Net Assets, Beginning of Year 1,282,392 1,436,131 1,422,156 1,591,093
Net Assets, End of Year 1,436,131 1,422,156 1,591,093 1,807,115
Notes:(1) Unrealized gains (losses) and the offsetting Book-to-Market Adjustment are not forecasted or budgeted(2) The forecast and budget do not include estimates for year-end actuarial adjustments: pension liability and post-employment benefit remeasurement, as well as accruals for vacation, pension obligation and post employment benefits

88
Appendix 3: Pro-forma Financials FY2018 Budget, FY2017 Forecast, FY2016 Actual – All Funds
For the twelve month period ending April 30, 2018 Budget Forecast Actuals($000's) FY2018 FY2017 FY2016
Operating Fund
Restricted Fund
Plant Fund
Endowment Fund All Funds All Funds All Funds
Total Total Total Total Total Total Total
RevenueGrants Canada 25,708 183,779 16,648 - 226,135 224,175 217,172 Quebec 332,544 54,688 58,367 - 445,599 443,095 443,577 United States - 7,508 - - 7,508 7,433 7,302 Other Sources - 10,150 - - 10,150 9,625 9,074 Contracts - 21,525 - - 21,525 20,898 21,133 Tuition & Fees 307,836 - - - 307,836 294,969 274,322 Sales of Goods & Services 134,067 6,784 348 - 141,199 138,220 140,246 Gifts & Bequests 6,884 42,685 6,701 - 56,270 54,853 54,151 Foreign Exchange Gain 500 - - - 500 500 791 Investment and Interest Income 7,492 43,690 1,973 - 53,155 52,395 52,734 Realized losses - - (11,729) - Unrealized Gains (Losses)1 - - - - - - (8,234)
Total Revenues 815,031 370,809 84,037 - 1,269,877 1,234,433 1,212,268 ExpensesSalary: Academic 271,147 74,056 - - 345,203 333,033 318,773 Administrative & Support 217,038 25,362 - - 242,400 231,775 232,092 Student 12,119 25,378 - - 37,497 36,969 37,318 Student Aid 31,562 78,978 - - 110,540 108,321 106,022 Benefits 94,177 18,087 - - 112,264 121,474 119,912 Year-end actuarial adjustments (pension liability & post-employment benefit remeasurements)2 - - - - - - (26,853) Year-end accruals (vacation, pension obligation, post-employment benefits)2 - - - - - - 13,949
Total Salary 626,043 221,860 - - 847,903 831,572 801,213 Non-Salary: Materials, Supplies & Publications 12,584 29,100 - - 41,684 47,908 43,661 Contributions to Partner Institutions 9,933 31,811 - - 41,744 42,346 40,668 Contract Services 7,875 9,507 - - 17,382 25,014 22,642 Professional Fees 7,342 12,305 - - 19,647 22,068 20,681 Travel 8,101 17,068 - - 25,169 25,603 26,030 Cost of Goods Sold & Services Rendered 21,547 - - - 21,547 22,179 17,193 Building Occupancy Costs 15,677 4,844 - - 20,521 23,910 27,971 Energy 18,143 - - - 18,143 18,895 18,253 Other Non-Salary Expenses 38,650 28,287 5,000 - 71,937 46,030 44,867 Hardware and Software Maintenance 11,703 300 - - 12,003 9,558 8,294 Amortization - 113,889 - 113,889 113,775 113,432 Interest and Bank Charges 2,740 - 36,387 - 39,127 38,128 39,858
Total Non-Salary 154,295 133,222 155,276 - 442,792 435,414 423,550 -
Total Expenses 780,338 355,082 155,276 - 1,290,696 1,266,985 1,224,763 Extraordinary Revenues - - 23,151
Excess (deficiency) of revenue over expenses 34,693 15,727 (71,238) - (20,819) (32,553) 10,656 Inter-Fund Transfers (negative is a debit, positive is a credit)Net change in fund balance - - 750 215,000 215,750 175,600 (4,112) Pension Liability and Post-Employment Benefit Remeasur - - - - - - (26,853) Inter-Fund Transfers (1,529) 3,200 400 (2,071) - - - Internal Loan Repayments (10,000) (500) 10,500 - - - - Capital purchases via interfund transfers (30,000) (12,500) 42,500 - - - - Over (under) Distributed Endowment Income (2,500) - - 2,500 - - - Book to Market Adjustment1 - - - - - - - (Capitalization) Decapitalization of Current Year Investme (593) - - 593 - - -
Total Inter-Fund Transfers (44,622) (9,800) 54,150 216,022 215,750 175,600 (30,965) Increase (Decrease) in Net Assets (9,929) 5,927 (17,088) 216,022 194,931 143,047 (20,309)
Net Assets (deficiency), Beginning of Year (327,002) 2,539 235,456 1,591,093 1,502,086 1,359,039 1,379,348
Net Assets (deficiency), End of Year (336,932) 8,466 218,368 1,807,115 1,697,017 1,502,086 1,359,039 Notes:(1) Unrealized gains (losses) and the offsetting Book-to-Market Adjustment are not forecasted or budgeted(2) The forecast and budget do not include estimates for year-end actuarial adjustments: pension liability and post-employment benefit remeasurement, as well as, accruals for vacation, pension obligation and post employment benefits
BudgetFY2018

89
Appendix 4: Statement of change in net assets – 5 years
For the Year ending April 30, 2018($000's)
Actual Actual Actual Forecast BudgetFY2014* FY2015 FY2016 FY2017 FY2018
Net Assets, beginning of year 1,003,574 1,187,830 1,379,348 1,359,039 1,502,086
Excess (deficiency) of revenue over expenses 60,084 66,937 10,656 (32,553) (20,819)
Pension Liability and Post-Employment Benefit Remeasurements (29,539) (24,766) (26,853) - -
Endowment contributions 40,964 43,533 33,382 75,000 100,000
Investment income items reported as direct increase (decrease) in net assets 145,354 105,814 (37,494) 100,600 115,750
Net Assets, end of year 1,187,830 1,379,348 1,359,039 1,502,086 1,697,017
* Includes adjustment due to change in accounting policy per note 2 of the FY2015 Audited Financial Statements

90
Appendix 5: Unit Level Operating Fund Financials FY2014-FY2016 – Academic Units
FY14 FY15 FY16 FY14 FY15 FY16 FY14 FY15 FY16 FY14 FY15 FY16 FY14 FY15 FY16RevenueCanada - - - - - - - - - - - - - - - Quebec 15 15 17 - - - - - - - - - - - - Tuition & Fees 569 581 519 610 561 748 4,774 5,304 6,104 793 828 556 38 39 38 Sales of Goods & Services 2,000 2,696 2,515 450 466 505 2,260 3,586 3,729 2,644 2,601 2,943 679 762 862 Gifts & Bequests 67 84 88 794 801 1,032 84 106 103 3 236 427 154 129 146 Investment and interest Income 3 4 4 3 3 3 - - - 25 27 31 - - - Unrealized Gains (Losses) - - - - - - - - - - - - - - -
Total Revenue 2,654 3,380 3,143 1,857 1,831 2,288 7,118 8,996 9,936 3,465 3,692 3,957 871 930 1,046 ExpensesSalary ExpensesAcademic 11,085 11,577 12,506 32,491 34,513 36,165 8,579 9,087 10,085 4,056 4,263 4,708 11,176 10,914 11,265 Administrative and support 3,908 3,409 3,450 6,219 5,500 5,372 3,283 3,366 3,604 2,132 2,375 2,598 2,715 2,499 2,383 Student 599 615 558 2,649 2,652 2,573 2 4 10 21 46 17 356 292 248 Student Aid 161 172 236 494 610 575 - - (5) 144 123 156 93 32 41 Benefits 1,683 2,438 2,579 4,304 6,347 6,510 1,384 2,099 2,310 682 1,037 1,141 1,492 2,048 2,137
Total Salaries 17,436 18,211 19,329 46,157 49,622 51,195 13,248 14,556 16,004 7,035 7,844 8,620 15,832 15,785 16,074 Non-Salary ExpensesMaterials, Supplies and Publications 396 383 504 108 115 104 83 82 161 267 612 569 68 86 91 Transfer to Partner Institutions - - 13 22 4 - - - - 43 33 51 1 - - Contract Services 141 100 168 559 525 760 1,069 892 299 251 99 320 184 176 190 Professional Fees 19 11 26 87 68 28 950 832 476 109 119 187 92 21 44 Travel 552 524 588 518 661 634 286 350 329 126 113 119 202 181 202 Cost of Goods & Services Rendered 14 30 11 - - - - - - 476 426 481 - - - Building & Occupancy Costs 182 190 223 42 81 73 221 179 478 89 76 80 14 8 6 Energy 34 36 23 - - - - - - - - - - - - Other Non-Salary Expenses 1,328 1,072 1,120 1,870 1,549 1,461 1,686 1,657 1,899 522 727 565 464 318 368 Hardware and software maintenance 1 2 1 5 2 4 14 13 10 6 11 41 - - - Interest - - - - - - - - - - - - - - - Bank Charges 1 5 2 2 2 1 84 97 84 20 22 24 2 2 1
Total Non-Salary 2,668 2,353 2,679 3,213 3,007 3,065 4,393 4,102 3,736 1,909 2,238 2,437 1,027 792 902 Total Expenses 20,104 20,564 22,008 49,370 52,629 54,260 17,641 18,658 19,740 8,944 10,082 11,057 16,859 16,577 16,976
(Deficiency) Excess of Revenues over Expenses, Before the Undernoted (17,450) (17,184) (18,865) (47,513) (50,798) (51,972) (10,523) (9,662) (9,804) (5,479) (6,390) (7,100) (15,988) (15,647) (15,930) Extraordinary Item (Gain on sale of land)
(Deficiency) Excess of Revenues over Expenses (17,450) (17,184) (18,865) (47,513) (50,798) (51,972) (10,523) (9,662) (9,804) (5,479) (6,390) (7,100) (15,988) (15,647) (15,930) Interfund Transfers (295) 1,313 879 (1,780) 74 708 (882) (145) (264) (413) (42) 179 (646) 225 195 Net capz & decapz of investement income (2) - (1) - - - - - - (3) - (27) - - - Capital Purchases via interfund transfers - (221) (864) - (166) (300) - (137) (345) - (24) (32) - (56) (63) Internal loan repayments - - - - - - - - - - (14) - - - -
Total Change in Net Assets (17,747) (16,092) (18,851) (49,293) (50,890) (51,564) (11,405) (9,944) (10,413) (5,895) (6,470) (6,980) (16,634) (15,478) (15,798)
Agricultural & Environmental Sciences
Arts School of Continuing Studies
Dentistry Education

91
Appendix 5: Unit Level Operating Fund Financials FY2014-FY2016 – Academic Units (2 of 3)
FY14 FY15 FY16 FY14 FY15 FY16 FY14 FY15 FY16 FY14 FY15 FY16 FY14 FY15 FY16RevenueCanada - - - - - - - - - - - - - - - Quebec - - - - - - - - - 837 816 883 - - - Tuition & Fees 723 736 769 - - - 8,004 8,610 8,792 81 80 85 812 863 880 Sales of Goods & Services 2,740 2,246 2,780 267 310 141 6,215 6,246 6,774 17,031 24,862 26,013 2,185 2,110 2,167 Gifts & Bequests 845 803 1,022 141 94 95 309 225 436 982 1,215 957 115 99 200 Investment and interest Income 1 1 1 23 23 29 - - - 325 339 380 38 41 47 Unrealized Gains (Losses) - - - - - - - - - - - - - - -
Total Revenue 4,309 3,786 4,572 431 427 265 14,528 15,081 16,002 19,256 27,312 28,318 3,150 3,113 3,294 ExpensesSalary ExpensesAcademic 18,542 20,231 20,115 5,471 5,629 5,955 16,421 17,913 18,463 65,011 67,838 74,238 9,702 10,169 10,959 Administrative and support 6,198 5,962 6,096 1,613 1,510 1,629 5,669 5,645 5,920 23,298 22,532 23,952 3,130 2,773 2,715 Student 2,034 2,528 2,500 94 75 89 491 352 338 688 787 918 253 232 238 Student Aid 539 644 839 57 26 90 1,359 1,510 1,315 491 638 543 51 32 23 Benefits 2,769 4,191 4,279 746 1,094 1,170 2,176 3,274 3,437 9,596 14,155 15,387 1,392 2,072 2,229
Total Salaries 30,082 33,556 33,829 7,981 8,334 8,933 26,116 28,694 29,473 99,084 105,950 115,038 14,528 15,278 16,164 Non-Salary ExpensesMaterials, Supplies and Publications 294 431 310 27 30 20 245 249 207 1,689 2,075 2,255 48 55 65 Transfer to Partner Institutions 1 21 42 - - - - 3 - 1,637 2,790 1,995 - - - Contract Services 115 127 214 186 190 172 472 865 1,050 228 (8) (342) 89 382 428 Professional Fees 56 113 114 32 44 61 1,798 1,876 1,585 416 1,008 662 207 89 247 Travel 661 662 800 135 162 126 1,298 1,559 1,651 937 1,387 1,251 160 173 219 Cost of Goods & Services Rendered - - - - - - - - - 65 180 106 - - - Building & Occupancy Costs 261 292 218 23 13 27 61 82 13 3,652 3,513 3,566 294 219 193 Energy - - - - - - - - - 294 336 478 - - - Other Non-Salary Expenses 1,567 724 994 294 313 278 2,598 2,694 3,279 2,163 1,443 2,849 641 543 607 Hardware and software maintenance 19 16 68 - - - 104 127 135 140 104 281 7 1 3 Interest - - - - - - - - - - - - - - - Bank Charges 2 1 5 4 3 1 40 50 47 23 26 19 35 36 39
Total Non-Salary 2,976 2,387 2,765 701 755 685 6,616 7,505 7,967 11,244 12,854 13,120 1,481 1,498 1,801 Total Expenses 33,058 35,943 36,594 8,682 9,089 9,618 32,732 36,199 37,440 110,328 118,804 128,158 16,009 16,776 17,965
(Deficiency) Excess of Revenues over Expenses, Before the Undernoted (28,749) (32,157) (32,022) (8,251) (8,662) (9,353) (18,204) (21,118) (21,438) (91,072) (91,492) (99,840) (12,859) (13,663) (14,671) Extraordinary Item (Gain on sale of land)
(Deficiency) Excess of Revenues over Expenses (28,749) (32,157) (32,022) (8,251) (8,662) (9,353) (18,204) (21,118) (21,438) (91,072) (91,492) (99,840) (12,859) (13,663) (14,671) Interfund Transfers (642) 1,108 1,199 (500) (65) (27) (822) 391 498 (2,094) (3,487) (1,011) (951) (352) (128) Net capz & decapz of investement income (1) - (1) (1) (100) (18) - - - (20) - (31) (38) - (47) Capital Purchases via interfund transfers - (1,615) (251) - (11) (43) - (103) (119) - (1,531) (2,283) - (123) (110) Internal loan repayments - (1) - - (21) - - - - - (30) - - (38) -
Total Change in Net Assets (29,392) (32,665) (31,075) (8,752) (8,859) (9,441) (19,026) (20,830) (21,059) (93,186) (96,540) (103,165) (13,848) (14,176) (14,956)
Engineering Law Desautels Faculty of Management
Medicine Schulich School of Music

92
Appendix 5: Unit Level Operating Fund Financials FY2014-FY2016 – Academic Units (3 of 3)
FY14 FY15 FY16 FY14 FY15 FY16 FY14 FY15 FY16 FY14 FY15 FY16RevenueCanada - - - - - - - - - - - - Quebec - - - - - - - - - 852 831 900 Tuition & Fees 10 11 - 544 559 282 151 144 102 17,109 18,316 18,876 Sales of Goods & Services 90 98 84 1,231 1,773 2,597 143 67 117 37,935 47,823 51,227 Gifts & Bequests 28 5 66 278 347 325 35 23 30 3,835 4,167 4,928 Investment and interest Income - - - 17 18 21 328 326 365 763 782 881 Unrealized Gains (Losses) - - - - - - - - - - - -
Total Revenue 128 114 150 2,070 2,697 3,225 657 560 614 60,494 71,919 76,812 ExpensesSalary ExpensesAcademic 1,639 1,629 1,661 29,560 31,382 32,624 5,299 5,506 6,036 219,032 230,649 244,780 Administrative and support 468 501 446 8,159 7,709 7,883 7,220 5,857 5,755 74,012 69,639 71,804 Student 125 132 132 3,695 3,683 3,931 53 6 - 11,060 11,407 11,552 Student Aid 34 22 4 664 745 1,078 - - - 4,087 4,552 4,895 Benefits 240 347 346 4,247 6,243 6,575 1,374 1,871 2,059 32,085 47,217 50,159
Total Salaries 2,506 2,631 2,589 46,325 49,762 52,091 13,946 13,240 13,850 340,276 363,464 383,190 Non-Salary ExpensesMaterials, Supplies and Publications 1 1 2 227 190 157 16,352 1,955 1,946 19,805 6,264 6,390 Transfer to Partner Institutions - - - 13 (1) 3 - - - 1,717 2,850 2,104 Contract Services 17 14 52 460 431 390 1,081 937 982 4,852 4,730 4,683 Professional Fees 4 - 9 110 254 182 8 276 90 3,888 4,711 3,711 Travel 32 16 28 912 972 881 162 153 164 5,981 6,913 6,992 Cost of Goods & Services Rendered - - - 439 511 449 - - - 994 1,147 1,047 Building & Occupancy Costs 1 1 1 376 416 422 269 136 146 5,485 5,206 5,446 Energy - - - 82 79 281 - - - 410 451 782 Other Non-Salary Expenses 22 62 76 1,383 723 1,171 640 492 583 15,178 12,317 15,252 Hardware and software maintenance - - - 27 30 41 555 562 613 878 868 1,198 Interest - - - - - - - - - - - - Bank Charges - - - 4 6 3 7 7 5 224 257 232
Total Non-Salary 77 94 168 4,033 3,611 3,980 19,074 4,518 4,529 59,412 45,714 47,837 Total Expenses 2,583 2,725 2,757 50,358 53,373 56,071 33,020 17,758 18,379 399,688 409,178 431,027
(Deficiency) Excess of Revenues over Expenses, Before the Undernoted (2,455) (2,611) (2,607) (48,288) (50,676) (52,846) (32,363) (17,198) (17,765) (339,194) (337,259) (354,215) Extraordinary Item (Gain on sale of land)
(Deficiency) Excess of Revenues over Expenses (2,455) (2,611) (2,607) (48,288) (50,676) (52,846) (32,363) (17,198) (17,765) (339,194) (337,259) (354,215) Interfund Transfers (102) 77 103 (2,735) 442 349 (772) (693) 81 (12,634) (1,154) 2,761 Net capz & decapz of investement income - - - - - (4) - - - (65) (100) (129) Capital Purchases via interfund transfers - - (2) - (996) (1,464) - (16,589) (18,230) - (21,571) (24,105) Internal loan repayments - - - - (17) - - - - - (121) -
Total Change in Net Assets (2,557) (2,534) (2,506) (51,023) (51,247) (53,965) (33,135) (34,480) (35,914) (351,893) (360,205) (375,688)
Religious Studies Science University Library and Archives
Total

93
Appendix 6: Unit Level Operating Fund Financials FY2014-FY2016 – Administrative Units
FY14 FY15 FY16 FY14 FY15 FY16 FY14 FY15 FY16 FY14 FY15 FY16 FY14 FY15 FY16RevenueCanada 0 0 0 - 0 0 0 0 0 0 0 0 0 0 0Quebec 0 0 0 - 0 0 2,339 2,413 2,452 0 0 0 0 0 0Tuition & Fees 0 0 0 - 0 0 15,557 15,920 16,168 0 0 0 0 0 0Sales of Goods & Services 1 221 0 9 11 25 53,858 56,340 57,107 1 31 6 716 774 742Gifts & Bequests 0 22 0 - 919 929 424 464 485 0 0 0 0 0 0Foreign exchange gain 0 0 0 0 0 0 0Investment and interest Income 0 0 0 - 1 1 215 225 254 13 13 16 0 0 0Unrealized Gains (Losses) 0 0 0 - 0 0 0 0 0 0 0 0 0 0 0
Total Revenue 1 243 0 9 931 955 72,393 75,362 76,466 14 44 22 716 774 742ExpensesSalary ExpensesAcademic 0 23 20 57 112 115 2,777 2,606 2,737 124 273 65 0 0 0Administrative and support 827 2,231 2,146 3,092 3,947 3,674 29,713 30,275 30,985 1,127 1,334 1,394 1,031 972 1,026Student 0 0 0 1 77 68 218 184 150 0 1 7 5 5 6Student Aid 0 0 0 10 3 2 5,686 6,742 7,334 16,215 15,679 16,868 0 0 0Benefits 88 344 342 343 645 639 4,428 6,690 7,038 142 253 243 140 192 204
Total Salaries 915 2,598 2,508 3,503 4,784 4,498 42,822 46,497 48,244 17,608 17,540 18,577 1,176 1,169 1,236Non-Salary ExpensesMaterials, Supplies and Publications 5 16 12 18 25 26 3,842 5,215 5,125 1 1 2 63 54 54Transfer to Partner Institutions 0 0 0 - 0 0 0 0 0 0 0 0 0 0 0Contract Services 3 366 157 28 645 24 3,532 5,195 5,294 43 17 20 213 560 563Professional Fees 2,332 1,347 1,539 12 47 70 246 456 436 0 0 0 0 0 0Travel 2 92 97 55 106 71 1,333 1,336 1,134 18 21 34 45 25 38Cost of Goods & Services Rendered 0 0 0 - 0 0 6,698 4,860 5,320 0 0 0 0 0 0Building & Occupancy Costs 0 141 37 4 20 (6) 13,907 4,555 4,376 0 2 1 337 254 209Energy 0 0 0 - 0 0 4,416 4,440 3,873 0 0 0 67 79 64Other Non-Salary Expenses 54 405 496 138 741 983 5,260 4,482 6,134 93 218 93 1 55 74Hardware and software maintenance 0 0 0 24 1 0 133 146 150 1 0 0 0 0 0Interest 0 0 0 - 0 0 10 9 7 0 0 0 0 0 0Bank Charges 0 2 0 - 109 118 230 260 251 0 0 0 0 0 1
Total Non-Salary 2,396 2,369 2,338 279 1,694 1,286 39,607 30,954 32,100 156 259 150 726 1,027 1,003Total Expenses 3,311 4,967 4,846 3,782 6,478 5,784 82,429 77,451 80,344 17,764 17,799 18,727 1,902 2,196 2,239
(Deficiency) Excess of Revenues over Expenses, Before the Undernoted (3,310) (4,724) (4,846) (3,773) (5,547) (4,829) (10,036) (2,089) (3,878) (17,750) (17,755) (18,705) (1,186) (1,422) (1,497)Extraordinary Item (Gain on sale of land)
(Deficiency) Excess of Revenues over Expenses (3,310) (4,724) (4,846) (3,773) (5,547) (4,829) (10,036) (2,089) (3,878) (17,750) (17,755) (18,705) (1,186) (1,422) (1,497)Interfund Transfers (45) (5) (10) (195) 16 (2,408) (2,947) (327) (211) (123) (225) (322) (24) 6 25Net capz & decapz of investement income 0 0 0 - 0 0 (50) (2,582) (68) 0 0 (16) 0 0 0Capital Purchases via interfund transfers 0 (15) (2) - (206) (105) 0 (8,348) (3,137) 0 (5) (19) 0 (74) (2)Internal loan repayments 0 0 0 - 0 0 0 (47) (7,823) 0 (14) 0 0 0 0
Total Change in Net Assets (3,355) (4,744) (4,858) (3,968) (5,737) (7,342) (13,033) (13,393) (15,117) (17,873) (17,999) (19,062) (1,210) (1,490) (1,474)
Principal and Vice Chancellor
PVPA Macdonald CampusDeputy Provost(Student Life & Learning)
Graduate and Postdoctoral Studies

94
Appendix 6: Unit Level Operating Fund Financials FY2014-FY2016 – Administrative Units (2 of 3)
FY14 FY15 FY16 FY14 FY15 FY16 FY14 FY15 FY16 FY14 FY15 FY16 FY14 FY15 FY16RevenueCanada - 0 0 0 0 0 0 0 0 0 0 0 - 0 0Quebec 1,034 0 0 0 0 0 0 0 0 0 0 0 - 0 0Tuition & Fees - 0 0 0 0 0 0 0 0 0 0 0 9 7 20Sales of Goods & Services 2 19 21 4,830 2,023 2,935 1,053 1,072 1,009 7 49 22 18,225 16,757 16,049Gifts & Bequests - 0 0 0 2 0 56 80 198 0 0 0 464 442 448Foreign exchange gain 0 0 0 0 0Investment and interest Income (4) 4 5 19 6 0 0 0 0 0 0 0 95 99 118Unrealized Gains (Losses) - 0 0 0 0 0 0 0 0 0 0 0 - 0 0
Total Revenue 1,032 23 26 4,849 2,031 2,935 1,109 1,152 1,207 7 49 22 18,793 17,305 16,635ExpensesSalary ExpensesAcademic - 0 0 461 2,858 564 1 0 6 0 0 0 25 65 29Administrative and support 975 2,095 1,917 3,255 5,725 6,024 8,440 9,310 10,026 1,963 3,083 2,942 31,875 29,815 30,129Student - 0 0 0 0 0 0 0 0 0 0 0 - 0 3Student Aid - 0 0 0 19 10 0 1 0 0 0 0 10 5 11Benefits 105 330 312 392 1,028 1,082 966 1,604 1,689 233 532 527 4,016 5,726 5,888
Total Salaries 1,080 2,425 2,229 4,108 9,630 7,680 9,407 10,915 11,721 2,196 3,615 3,469 35,926 35,611 36,060Non-Salary ExpensesMaterials, Supplies and Publications 45 27 11 (4) 8 21 109 201 279 79 64 56 3,682 3,636 3,334Transfer to Partner Institutions - 0 0 0 0 0 0 0 0 0 0 0 - 0 0Contract Services 3 72 97 120 256 261 644 677 654 121 143 165 11,793 15,488 14,999Professional Fees 8 192 119 869 920 867 123 30 187 3 80 26 360 682 579Travel 3 32 10 38 103 145 199 429 498 8 20 20 (182) (269) (226)Cost of Goods & Services Rendered - 0 0 0 0 0 14 0 0 0 0 0 12,485 8,321 8,101Building & Occupancy Costs 5,355 (1,064) 504 4 235 (35) 16 58 51 1 12 7 (551) (4,288) 1,273Energy - 0 0 0 0 0 0 0 0 0 0 0 13,967 14,318 13,707Other Non-Salary Expenses 1,076 78 119 (314) 750 631 1,756 1,495 1,519 217 168 179 (4,909) (1,979) (1,051)Hardware and software maintenance - 0 0 1 1 3 115 121 261 0 2 0 66 27 27Interest - 0 0 0 0 0 0 0 0 0 0 0 48 70 60Bank Charges - 0 0 0 0 0 10 13 11 0 0 0 171 152 154
Total Non-Salary 6,490 (663) 860 714 2,273 1,893 2,986 3,024 3,460 429 489 453 36,930 36,158 40,957Total Expenses 7,570 1,762 3,089 4,822 11,903 9,573 12,393 13,939 15,181 2,625 4,104 3,922 72,856 71,769 77,017
(Deficiency) Excess of Revenues over Expenses, Before the Undernoted (6,538) (1,739) (3,063) 27 (9,872) (6,638) (11,284) (12,787) (13,974) (2,618) (4,055) (3,900) (54,063) (54,464) (60,382)Extraordinary Item (Gain on sale of land)
(Deficiency) Excess of Revenues over Expenses (6,538) (1,739) (3,063) 27 (9,872) (6,638) (11,284) (12,787) (13,974) (2,618) (4,055) (3,900) (54,063) (54,464) (60,382)Interfund Transfers (151) (299) (2,573) (351) (4,512) (1,649) (486) (714) 19 (124) (7) (6) (1,989) 187 632Net capz & decapz of investement income - 0 (5) 0 0 0 0 0 0 0 0 0 - (1,814) (118)Capital Purchases via interfund transfers - (30) (17) 0 (47) (102) 0 (38) (31) 0 (38) (39) - (1,436) (1,853)Internal loan repayments - (5) 0 0 0 0 0 0 0 0 0 0 - (99) (2,504)
Total Change in Net Assets (6,689) (2,073) (5,658) (324) (14,431) (8,389) (11,770) (13,539) (13,986) (2,742) (4,100) (3,945) (56,052) (57,626) (64,225)
Administration and Finance Facilities Management and Ancillary Services
Research and Innovation University Advancement Communications and External Relations

95
Appendix 6: Unit Level Operating Fund Financials FY2014-FY2016 – Administrative Units (3 of 3)
FY14 FY15 FY16 FY14 FY15 FY16 FY14 FY15 FY16 FY14 FY15 FY16 FY14 FY15 FY16RevenueCanada 0 0 0 - 0 0 0 0 0 24,840 25,788 25,832 24,840 25,788 25,832Quebec 0 0 0 - 0 0 0 0 0 348,513 338,396 333,605 351,886 340,809 336,056Tuition & Fees 10 7 8 - 0 0 104 100 96 212,452 224,140 239,153 228,132 240,174 255,446Sales of Goods & Services 192 245 242 742 859 498 3,162 2,679 2,793 1,152 777 845 83,950 81,857 82,295Gifts & Bequests 0 0 0 - 0 0 0 0 0 1,436 0 0 2,380 1,929 2,061Foreign exchange gain 0 0 0 1,500 3,811 791 1,500 3,811 791Investment and interest Income 0 0 0 - 0 0 0 0 0 6,400 4,757 7,853 6,738 5,105 8,246Unrealized Gains (Losses) 0 0 0 - 0 0 0 0 0 6,462 5,284 (6,284) 6,462 5,284 (6,284)
Total Revenue 202 252 250 742 859 498 3,266 2,779 2,889 602,755 602,953 601,795 705,888 704,757 704,443ExpensesSalary ExpensesAcademic 0 5 0 2 3 0 0 0 0 1,537 738 1,115 4,984 6,683 4,653Administrative and support 7,045 6,426 6,682 5,996 5,607 5,575 21,715 20,608 21,796 21,574 10,994 13,376 138,628 132,421 137,691Student 0 0 0 - 0 0 0 0 0 31 0 0 255 267 234Student Aid 0 0 0 - 0 0 0 0 0 15 0 0 21,936 22,449 24,225Benefits 847 1,171 1,240 1,088 (1,143) 550 2,334 3,446 3,730 8,369 (2,003) 16,757 23,491 18,815 40,240
Total Salaries 7,892 7,602 7,922 7,086 4,467 6,125 24,049 24,054 25,526 31,526 9,729 31,248 189,294 180,635 207,043Non-Salary ExpensesMaterials, Supplies and Publications 16 17 11 5 2 11 226 359 216 (14,156) 34 42 (6,069) 9,659 9,200Transfer to Partner Institutions 0 0 0 - 0 0 0 0 0 7,248 7,653 7,729 7,248 7,653 7,728Contract Services 110 106 112 339 90 214 1,522 1,451 441 (10,327) (15,877) (15,682) 8,144 9,189 7,321Professional Fees 20 2 0 477 526 581 181 93 0 842 1,576 946 5,473 5,951 5,348Travel 10 12 11 18 13 14 33 39 35 594 143 159 2,174 2,102 2,039Cost of Goods & Services Rendered 0 0 0 - 0 0 0 0 0 (2,002) 2,732 2,725 17,195 15,913 16,146Building & Occupancy Costs 5 10 12 5 3 14 131 230 225 (2,805) 11,277 10,985 16,409 11,445 17,655Energy 0 0 0 - 0 0 0 0 0 (273) 179 0 18,177 19,016 17,645Other Non-Salary Expenses 741 191 305 358 420 430 (2,679) (5,455) (5,404) (8,178) (3,765) (6,470) (6,386) (2,196) (1,961)Hardware and software maintenance 66 237 15 - 0 0 1,742 5,523 6,413 4,078 0 0 6,226 6,058 6,871Interest 0 0 0 - 0 0 0 0 0 2,390 1,892 9,132 2,448 1,971 9,199Bank Charges 3 2 3 - 0 0 1 1 0 353 347 365 768 886 903
Total Non-Salary 971 577 469 1,202 1,054 1,264 1,157 2,241 1,926 (22,236) 6,191 9,931 71,807 87,647 98,094Total Expenses 8,863 8,179 8,391 8,288 5,521 7,389 25,206 26,295 27,452 9,290 15,920 41,179 261,101 268,282 305,137
(Deficiency) Excess of Revenues over Expenses, Before the Undernoted (8,661) (7,927) (8,141) (7,546) (4,662) (6,891) (21,940) (23,516) (24,563) 593,465 587,033 560,616 444,787 436,475 399,306Extraordinary Item (Gain on sale of land) 20,638 20,638
(Deficiency) Excess of Revenues over Expenses (8,661) (7,927) (8,141) (7,546) (4,662) (6,891) (21,940) (23,516) (24,563) 593,465 587,033 581,254 444,787 436,475 419,944Interfund Transfers (447) 0 70 (577) 9 26 (1,212) 120 3 (19,951) (26,580) (17,309) (28,622) (32,331) (23,713)Net capz & decapz of investement income 0 0 0 - 0 0 0 0 0 (4) (18,314) 0 (54) (22,710) (207)Capital Purchases via interfund transfers 0 (3) (1) - (19) (6) 0 (2,643) (1,663) (28,855) (57) (122) (28,855) (12,959) (7,097)Internal loan repayments 0 0 (171) - 0 0 0 0 0 (22,367) 0 (949) (22,367) (165) (11,447)
Total Change in Net Assets (9,108) (7,930) (8,243) (8,123) (4,672) (6,871) (23,152) (26,039) (26,223) 522,288 542,082 562,874 364,889 368,310 377,480
TotalInstitutional ServicesInformation Technology Services
Human ResourcesFinancial Services

96
Appendix 7: Unit Level Restricted Fund Financials FY2014–FY2016 – Academic Units
FY14 FY15 FY16 FY14 FY15 FY16 FY14 FY15 FY16 FY14 FY15 FY16 FY14 FY15 FY16RevenueCanada 17,518 16,155 10,235 9,849 12,278 12,196 166 1,258 1,471 4,585 3,012 3,259 4,755 4,746 4,916 Quebec 2,108 2,609 3,326 2,176 2,798 2,185 10 10 19 1,433 367 630 903 553 801 United States 763 107 256 156 (121) 86 - - - 145 113 262 (103) (33) - Other Sources 679 744 1,153 319 747 1,306 - (44) - 10 157 (197) 284 908 526 Contracts 534 (341) 640 23 232 29 - (94) - (44) 197 32 518 1 203 Tuition & Fees - - - - - - - - - - - - - - - Sales of Goods & Services 88 103 327 114 51 31 - 169 455 40 54 111 14 144 37 Gifts & Bequests 1,024 886 390 3,083 3,103 4,111 50 102 121 1,239 612 1,302 430 880 579 Investment and interest Income 730 351 1,066 3,867 3,853 3,753 16 16 19 769 954 184 324 400 362 Unrealized Gains (Losses) - - - - - - - - - - - - - - -
Total Revenue 23,444 20,614 17,393 19,587 22,941 23,697 242 1,417 2,085 8,177 5,466 5,583 7,125 7,599 7,424 ExpensesSalary ExpensesAcademic 4,020 3,505 3,493 4,320 4,306 5,030 40 761 869 1,468 1,725 1,615 1,465 1,495 1,430 Administrative and support 786 757 463 891 867 778 35 409 501 450 420 470 105 141 149 Student 1,500 1,456 1,108 2,160 2,354 2,416 - 2 - 309 389 415 624 564 553 Student Aid 3,237 2,968 3,244 6,988 7,294 7,023 32 23 33 484 534 476 2,140 2,297 2,701 Benefits 1,025 872 769 1,012 967 1,065 14 195 220 348 388 388 294 304 294
Total Salaries 10,568 9,558 9,077 15,371 15,788 16,312 121 1,390 1,623 3,059 3,456 3,364 4,628 4,801 5,127 Non-Salary ExpensesMaterials, Supplies and Publications 1,870 1,778 1,691 329 360 330 1 2 3 727 760 819 110 94 77 Transfer to Partner Institutions 4,486 7,326 2,120 (1,949) 1,143 1,461 - - - 136 214 164 480 808 405 Contract Services 174 220 126 449 263 574 1 96 8 148 96 244 106 93 58 Professional Fees 142 182 477 632 735 1,042 46 12 52 181 154 140 242 171 232 Travel 1,233 1,067 1,053 2,471 2,375 2,481 - 11 31 120 137 127 478 421 433 Building & Occupancy Costs 435 391 378 202 119 57 1 6 15 135 42 80 73 35 59 Energy - 1 1 3 - - - - - - - - - - - Other Non-Salary Expenses 2,031 2,306 4,083 4,902 2,327 2,031 59 124 344 4,809 1,879 1,052 794 847 954 Hardware and software maintenance - 2 1 7 28 5 - - - - - 2 2 - 2 Interest - - - - - - - - - - - - - - - Bank Charges - - - - 1 - - - - - - - - - -
Total Non-Salary 10,371 13,273 9,930 7,046 7,351 7,981 108 251 453 6,256 3,282 2,628 2,285 2,469 2,220 Total Expenses 20,939 22,831 19,007 22,417 23,139 24,293 229 1,641 2,076 9,315 6,738 5,992 6,913 7,270 7,347
(Deficiency) Excess of Revenues over Expenses, Before the Undernoted 2,505 (2,217) (1,614) (2,830) (198) (596) 13 (224) 9 (1,138) (1,272) (409) 212 329 77 Interfund Transfers (218) (413) (235) 493 635 580 4 - (9) (356) 408 409 49 466 (37) Net capz & decapz of investement income (135) (213) 13 (759) (784) 15 (7) (10) - (233) (351) - (89) (81) - Capital Purchases via interfund transfers - - - - - - - - - - - - - - - Internal loan repayments - - - - - - - - - - - - - - -
Total Change in Net Assets 2,152 (2,843) (1,836) (3,096) (347) (1) 10 (234) - (1,727) (1,215) - 172 714 40
Agricultural & Environmental Sciences
Arts School of Continuing Studies Dentistry Education

97
Appendix 7: Unit Level Restricted Fund Financials FY2014–FY2016 – Academic Units (2 of 3)
FY14 FY15 FY16 FY14 FY15 FY16 FY14 FY15 FY16 FY14 FY15 FY16 FY14 FY15 FY16RevenueCanada 20,848 21,979 24,189 1,495 7,746 (465) 1,517 1,817 1,472 73,877 63,907 80,366 2,103 2,079 3,592 Quebec 3,353 3,794 4,387 194 103 233 318 192 514 27,071 24,857 37,601 308 1,340 1,453 United States 537 793 977 - (3) - 212 313 - 4,477 4,907 4,814 - 5 - Other Sources 3,193 2,412 1,691 494 178 97 208 (1,081) (192) 25,057 22,040 9,188 26 (63) (2,539) Contracts 5,207 4,770 4,444 (22) (109) - 400 (5) 2 6,665 11,429 13,355 (39) (355) - Tuition & Fees - - - - - - - - - - - - - - - Sales of Goods & Services 35 166 113 423 145 100 57 138 221 4,813 6,104 3,912 15 5 59 Gifts & Bequests 2,635 3,980 754 1,341 654 1,369 2,921 2,218 4,290 12,763 13,441 15,459 994 759 899 Investment and interest Income 3,983 4,306 3,674 2,040 2,249 1,918 1,925 2,411 2,380 12,755 12,776 12,236 1,002 984 961 Unrealized Gains (Losses) - - - - - - - - - - - - - - -
Total Revenue 39,791 42,200 40,229 5,965 10,963 3,252 7,558 6,003 8,687 167,478 159,461 176,931 4,409 4,754 4,425 ExpensesSalary ExpensesAcademic 4,938 4,636 5,660 1,094 1,172 1,294 503 814 640 34,486 36,494 37,062 565 606 664 Administrative and support 1,413 1,343 1,274 334 449 449 470 412 408 12,868 13,241 14,239 280 226 309 Student 3,528 4,094 4,302 719 884 709 270 217 306 10,890 10,116 10,166 222 263 382 Student Aid 13,814 13,539 13,042 1,148 1,191 1,324 1,494 1,747 1,613 16,623 16,731 16,271 2,053 2,328 2,280 Benefits 1,135 1,067 1,185 332 357 365 192 194 194 8,920 9,313 9,601 138 133 160
Total Salaries 24,828 24,679 25,463 3,627 4,053 4,141 2,929 3,384 3,161 83,787 85,895 87,339 3,258 3,556 3,795 Non-Salary ExpensesMaterials, Supplies and Publications 2,298 2,906 2,875 35 31 27 52 38 41 17,110 18,268 18,522 61 42 35 Transfer to Partner Institutions 1,205 1,442 1,830 55 113 522 351 546 168 19,259 18,850 20,133 - 91 133 Contract Services 1,151 459 478 25 41 22 336 283 572 5,827 7,894 7,595 23 7 28 Professional Fees 195 147 87 76 136 135 207 274 141 2,329 2,937 3,312 154 196 118 Travel 2,233 2,174 2,100 568 662 618 778 715 770 4,385 4,110 4,461 377 398 405 Building & Occupancy Costs 513 532 432 46 74 44 3,026 270 1,530 1,913 1,507 3,456 31 142 157 Energy - - - - - - - - - - - 5 - - - Other Non-Salary Expenses 8,524 7,836 7,438 438 1,008 201 1,061 869 511 24,835 21,926 34,600 349 586 498 Hardware and software maintenance 159 67 42 - - - - - 17 197 72 25 - - - Interest - - - - - - - - - - - 1 - - - Bank Charges - - - - - - - - - 1 1 - - - -
Total Non-Salary 16,278 15,563 15,282 1,243 2,065 1,569 5,811 2,995 3,750 75,856 75,565 92,110 995 1,462 1,374 Total Expenses 41,106 40,242 40,745 4,870 6,118 5,710 8,740 6,379 6,911 159,643 161,460 179,449 4,253 5,018 5,169
(Deficiency) Excess of Revenues over Expenses, Before the Undernoted (1,315) 1,958 (516) 1,095 4,845 (2,458) (1,182) (376) 1,776 7,835 (1,999) (2,518) 156 (264) (744) Interfund Transfers (355) 535 510 45 411 (54) 1,304 (793) (1,049) 5,355 8,372 6,130 626 661 851 Net capz & decapz of investement income (680) (1,237) (34) (673) (737) - (254) (298) 12 (1,578) (2,008) 43 (166) (185) 1 Capital Purchases via interfund transfers - - - - - - - - - - - - - - - Internal loan repayments - - - - - - - - (739) - - - - - -
Total Change in Net Assets (2,350) 1,256 (40) 467 4,519 (2,512) (132) (1,467) - 11,612 4,365 3,655 616 212 108
Engineering Law Desautels Faculty of
Management Medicine Schulich School of Music

98
Appendix 7: Unit Level Restricted Fund Financials FY2014–FY2016 – Academic Units (3 of 3)
FY14 FY15 FY16 FY14 FY15 FY16 FY14 FY15 FY16 FY14 FY15 FY16RevenueCanada 157 105 370 42,044 36,356 39,611 - (47) - 178,914 171,391 181,212 Quebec 12 1 17 12,816 8,969 11,338 - (26) - 50,702 45,567 62,504 United States - - - 831 1,044 906 - - - 7,018 7,125 7,301 Other Sources - (460) 14 3,142 (1,059) (200) - (175) 371 33,412 24,304 11,218 Contracts - (198) - 2,142 2,664 2,438 - - - 15,384 18,191 21,143 Tuition & Fees - - - - - - - - - - - - Sales of Goods & Services 3 - 17 231 645 168 21 11 7 5,854 7,735 5,558 Gifts & Bequests 108 94 47 1,030 604 1,115 1,251 1,395 978 28,869 28,728 31,414 Investment and interest Income 280 287 329 3,306 3,364 3,436 1,214 1,295 1,462 32,211 33,246 31,780 Unrealized Gains (Losses) - - - - - - - - - - - -
Total Revenue 560 (171) 794 65,542 52,587 58,812 2,486 2,453 2,818 352,364 336,287 352,130 ExpensesSalary ExpensesAcademic 88 81 187 9,635 9,717 10,164 104 131 106 62,726 65,444 68,214 Administrative and support - 1 - 1,889 1,658 1,684 145 256 200 19,666 20,179 20,924 Student 10 2 18 5,843 5,178 4,889 - 5 - 26,075 25,523 25,264 Student Aid 148 184 212 14,747 14,807 14,905 2 2 2 62,910 63,646 63,126 Benefits 16 16 40 2,166 2,002 2,068 37 61 43 15,629 15,868 16,392
Total Salaries 262 284 457 34,280 33,362 33,710 288 455 351 187,006 190,660 193,920 Non-Salary ExpensesMaterials, Supplies and Publications 4 1 3 3,316 3,372 3,317 1,617 1,985 1,751 27,530 29,637 29,491 Transfer to Partner Institutions - - - 3,335 4,504 3,665 - - - 27,358 35,037 30,601 Contract Services 8 2 48 1,424 625 801 262 153 290 9,934 10,232 10,844 Professional Fees 2 21 - 471 466 517 11 5 19 4,688 5,436 6,272 Travel 119 61 145 3,852 4,288 4,045 16 20 30 16,630 16,439 16,699 Building & Occupancy Costs - 4 3 788 1,524 1,466 132 293 316 7,295 4,939 7,993 Energy - - - 445 378 (210) - - - 448 379 (204) Other Non-Salary Expenses 107 25 116 18,478 13,252 12,252 144 534 278 66,531 53,519 64,358 Hardware and software maintenance - - - 31 127 131 - - - 396 296 225 Interest - - - - 3 2 - - - - 3 3 Bank Charges - - - 2 4 - - - - 3 6 -
Total Non-Salary 240 114 315 32,142 28,543 25,986 2,182 2,990 2,684 160,813 155,923 166,282 Total Expenses 502 398 772 66,422 61,905 59,696 2,470 3,445 3,035 347,819 346,583 360,202
(Deficiency) Excess of Revenues over Expenses, Before the Undernoted 58 (569) 22 (880) (9,318) (884) 16 (992) (217) 4,545 (10,296) (8,072) Interfund Transfers 14 (12) (22) 2,062 927 878 118 919 217 9,141 12,116 8,169 Net capz & decapz of investement income (80) (73) - (100) (577) 6 (8) (42) - (4,762) (6,598) 56 Capital Purchases via interfund transfers - - - - - - - - - - - - Internal loan repayments - - - - - - - - - - - (739)
Total Change in Net Assets (8) (654) - 1,082 (8,968) - 126 (115) - 8,924 (4,778) (586)
Total University Library and
Archives Science Religious Studies

99
Appendix 8: Unit Level Restricted Fund Financials FY2014–FY2016 – Administrative Units
FY14 FY15 FY16 FY14 FY15 FY16 FY14 FY15 FY16 FY14 FY15 FY16 FY14 FY15 FY16RevenueCanada (49) - - - - 181 143 (1,996) 68 938 805 736 - - - Quebec - - - - - - 2,930 2,736 2,244 - - - - - - United States - - - - - - - - - - - - - - - Other Sources - - (10) - 91 287 120 (473) 196 45 98 41 - (14) 75 Contracts - - - - - - - - - - - - - - - Sales of Goods & Services - - - 133 132 139 217 160 84 162 80 68 1 5 2 Gifts & Bequests 38 - 6 27 9 37 1,406 47 907 87 201 118 - (3) - Investment and interest Income 86 86 126 60 75 (31) 5,938 6,170 7,095 1,883 1,995 2,302 198 218 220 Unrealized Gains (Losses) - - - - - - - - - - - - - - -
Total Revenue 75 86 122 220 307 613 10,754 6,644 10,594 3,115 3,179 3,265 199 206 297 ExpensesSalary ExpensesAcademic - - - 355 223 429 7 11 23 - - - 1 - - Administrative and support - - - 1 8 165 993 998 875 - - - 1 1 - Student - - - 2 - 1 157 109 145 131 50 14 - - - Student Aid - - - - - - 8,012 8,626 9,914 4,117 3,590 3,841 5 5 5 Benefits - - - - 1 21 96 110 97 - - - - - -
Total Salaries - - - 358 232 616 9,265 9,854 11,054 4,248 3,640 3,855 7 6 5 Non-Salary ExpensesMaterials, Supplies and Publications - - - 0 - - 89 75 99 - - 1 0 - 3 Transfer to Partner Institutions - - - - - - 4 - - - - - - - - Contract Services 33 - - - - - 53 112 92 1 - 1 8 1 2 Professional Fees - - 29 - - 5 8 9 23 - - - - 15 - Travel 0 7 7 - - 7 216 235 245 (0) 1 13 1 - - Building & Occupancy Costs - - - - - 2 87 36 39 - - - 25 16 7 Energy - - - - - - - - - - - - - - - Other Non-Salary Expenses 76 - 1 60 - 10 745 1,308 1,816 28 - 4 13 12 23 Hardware and software maintenance - - - - - - - - - - - - - - - Interest - - - - - - - - - - - - - - - Bank Charges - - - - - - - - - - - - - - -
Total Non-Salary 109 7 37 60 - 24 1,202 1,775 2,314 29 1 19 48 44 35 Total Expenses 109 7 37 418 232 640 10,467 11,629 13,368 4,277 3,641 3,874 55 50 40
(Deficiency) Excess of Revenues over Expenses, Before the Undernoted (34) 79 85 (198) 75 (27) 287 (4,985) (2,774) (1,162) (462) (609) 144 156 257 Interfund Transfers (1) (79) (85) 1 (58) (63) 763 2,983 2,898 634 621 610 (163) (127) (258) Net capz & decapz of investement income - - - - - 90 (556) (648) (124) (146) (132) (1) (9) (17) 1 Capital Purchases via interfund transfers - - - - - - - - - - - - - - - Internal loan repayments - - - - - - - - - - - - - - -
Total Change in Net Assets (35) - - (197) 17 - 494 (2,650) - (674) 27 - (28) 12 -
Graduate and Postdoctoral Studies
Macdonald CampusPVPAPrincipal and Vice Chancellor
Deputy Provost(Student Life & Learning)

100
Appendix 8: Unit Level Restricted Fund Financials FY2014–FY2016 – Administrative Units (2 of 3)
FY14 FY15 FY16 FY14 FY15 FY16 FY14 FY15 FY16 FY14 FY15 FY16 FY14 FY15 FY16RevenueCanada - (16) - 698 445 856 - - - - - - - - - Quebec - - - - (24) 281 - (61) - - - - - - - United States - - - - - - - - - - - - - - - Other Sources - (174) 114 - (30) (189) (1,478) (492) 316 - - - - - 2 Contracts - - - - 154 - - (1) - - - - - - - Sales of Goods & Services (38) 1 (69) 95 118 168 9 105 4 - - - - 1 1 Gifts & Bequests - (8) - - 5 - 8,092 11,515 6,125 - - - - 92 1 Investment and interest Income 217 312 172 137 164 140 259 303 462 - - - 535 558 620 Unrealized Gains (Losses) - - - - - - - - - - - - - - -
Total Revenue 179 115 217 930 832 1,256 6,882 11,369 6,907 - - - 535 651 624 ExpensesSalary ExpensesAcademic - - - 212 205 189 - - - - - - - - - Administrative and support 1 - - 329 248 198 - - 76 - - - 4 - - Student 7 - - 13 - 108 - - - - - - - - - Student Aid - - - - - - - - - - - - - - - Benefits 1 - - 124 100 88 - - 23 - - - - - -
Total Salaries 9 - - 678 553 583 - - 99 - - - 4 - - Non-Salary ExpensesMaterials, Supplies and Publications 3 - - 59 82 110 0 - 1 - - - 3 - 1 Transfer to Partner Institutions - - - - - - - - - - - - - - - Contract Services 1 - - (204) (292) (324) 1 4 1 - - - 0 5 1 Professional Fees - - - 37 102 57 13 6 8 - - - - - - Travel 0 - - 45 19 30 4 - - - - - 0 - - Building & Occupancy Costs - - - 26 21 40 0 1 - - - - - 93 - Energy - - - - - - - - - - - - - - - Other Non-Salary Expenses 206 198 207 96 80 26 36 26 28 - - - (1) (5) 2 Hardware and software maintenance - - - - - - - - - - - - - - - Interest - - - - - - - - - - - - - - - Bank Charges - - - - - - 97 - - - - - - - -
Total Non-Salary 211 198 207 59 12 (61) 151 37 38 - - - 2 93 4 Total Expenses 220 198 207 737 565 522 151 37 137 - - - 6 93 4
(Deficiency) Excess of Revenues over Expenses, Before the Undernoted (41) (83) 10 193 267 734 6,731 11,332 6,770 - - - 529 558 620 Interfund Transfers 92 31 12 (1,192) (1,338) (734) (3,703) (8,853) (9,032) - - - (531) (553) (618) Net capz & decapz of investement income (8) (30) (22) (48) (13) - (46) (252) - - - - (3) (4) (2) Capital Purchases via interfund transfers - - - - - - - - - - - - - - - Internal loan repayments - - - - - - - - - - - - - - -
Total Change in Net Assets 43 (82) - (1,047) (1,084) - 2,982 2,227 (2,262) - - - (5) 1 -
Facilities Management and Ancillary Services
Administration and Finance Communications and External Relations
University AdvancementResearch and Innovation

101
Appendix 8: Unit Level Restricted Fund Financials FY2014–FY2016 – Administrative Units (3 of 3)
FY14 FY15 FY16 FY14 FY15 FY16 FY14 FY15 FY16 FY14 FY15 FY16 FY14 FY15 FY16RevenueCanada (6,050) 4,111 6,824 - - - - - - (10,989) (8,472) (14,949) (15,309) (5,124) (6,284) Quebec 530 424 (2,863) - - - - - - (13,159) (4,858) (10,111) (9,699) (1,782) (10,450) United States - - - - - - - - - 666 - - 666 - 1 Other Sources (2,344) 879 (2,227) - - - - - - (5,005) 3,407 (750) (8,662) 3,293 (2,144) Contracts 154 (140) (11) - - - - - - 4,129 - - 4,283 13 (10) Sales of Goods & Services 273 377 339 - - - - - - 117 - 93 969 979 828 Gifts & Bequests - (154) (70) - - - 1 - - (5,777) (6,247) 2,492 3,874 5,457 9,617 Investment and interest Income 4 21 16 6 7 7 - - - (1,563) - (82) 7,760 9,909 11,049 Unrealized Gains (Losses) - - - - - - - - - 107 45 82 107 45 82
Total Revenue (7,433) 5,518 2,008 6 7 7 1 - - (31,474) (16,125) (23,225) (16,011) 12,790 2,689 ExpensesSalary ExpensesAcademic - - - - - - - - - (156) (86) 485 419 352 1,126 Administrative and support - - - - - - - - - (1,712) 145 357 (383) 1,400 1,673 Student - - - - - - - - - - - - 310 159 268 Student Aid - (14) 14 - - - - - - - - - 12,134 12,206 13,776 Benefits - - - - - - - - - (93) 24 (10) 128 235 217
Total Salaries - (14) 14 - - - - - - (1,961) 83 832 12,608 14,352 17,060 Non-Salary ExpensesMaterials, Supplies and Publications 4 - 4 - - - - - - (1,578) (1,907) (1,639) (1,419) (1,750) (1,420) Transfer to Partner Institutions 329 238 234 - - - - - - - - - 333 238 235 Contract Services 95 - 19 - - - - - - - - - (12) (171) (206) Professional Fees - 24 - - - - - - - 4,983 5,468 5,230 5,042 5,624 5,350 Travel - - - - - - - - - - - - 266 262 300 Building & Occupancy Costs 44 4 3 - - - - - - (4,587) (2,148) (3,213) (4,405) (1,977) (3,123) Energy 25 18 30 - - - - - - - - - 25 18 30 Other Non-Salary Expenses (394) (903) (1,932) 6 7 7 - - - (40,053) (27,851) (36,583) (39,181) (27,128) (36,392) Hardware and software maintenance - - - - - - - - - - - - - - - Interest - - - - - - - - - - - - - - - Bank Charges - - - - - - - - - - - - 97 - -
Total Non-Salary 102 (619) (1,642) 6 7 7 - - - (41,234) (26,438) (36,205) (39,255) (24,884) (35,223) Total Expenses 102 (633) (1,628) 6 7 7 - - - (43,195) (26,355) (35,373) (26,647) (10,532) (18,163)
(Deficiency) Excess of Revenues over Expenses, Before the Undernoted (7,535) 6,151 3,636 (0) - - 1 - - 11,721 10,230 12,148 10,636 23,322 20,855 Interfund Transfers (913) (1,846) (3,638) - - - - - - 5,700 4,872 5,222 687 (4,350) (5,689) Net capz & decapz of investement income (4) (4) 2 - - - - - - - - - (820) (1,100) (56) Capital Purchases via interfund transfers - - - - - - - - - (13,417) (10,378) (13,671) (13,417) (10,378) (13,672) Internal loan repayments - - - - - - - - - (1,877) (118) - (1,877) (118) -
Total Change in Net Assets (8,452) 4,301 - (0) - - 1 - - 2,127 4,606 3,699 (4,791) 7,376 1,438
TotalInstitutional ServicesFinancial Services Human Resources Information Technology Services

102
Appendix 9: MEES Operating Grant
2014-15 2015-16 2016-17 2017-2018 Notes$000s Actual Actual Forecast Budget
Teaching grant 282,238 282,257 285,013 291,477 Based on student weighted FTEs Bill 100 cut (1,673) (1,673) (1,673) (1,673) Based on certain selected expensesBudget Cut FY2013 and FY2014 - - Cut introduced in FY2013 and then folded into normed grants in FY2015 Gain de productivité (2,226) (2,226) (2,226) (2,226) Additional FY2015 mid-year cut (1,849) - - Administrative and support services 50,782 51,053 51,722 53,789 Based on unweighted FTEsEnrolment Grant accrual 6,095 8,699 675 - No accruals are booked in budgeting as the grants are based on our most recent estimates MELS reinvestment - ongoing 8,403 8,266 8,147 8,387 Facilities and buildings (Teaching) 36,538 36,284 37,038 37,779 Facilities and buildings (Research) 1,999 10,967 19,640 20,033 Shift from indirect costs of research to this envelopeGeneral fixed costs 2,386 2,377 2,404 2,432 Quebec Economic Plan Investment 4,288
Total Operating (Permanent) Grant 382,693 396,004 400,740 414,286
Contribution to student aid (9,011) (9,017) (9,077) (9,853) Qc recovers 30% of base tuition increases to fund the loans and bursaries programCanadian fee supplements (34,926) (37,324) (36,758) (41,179) International fee supplements (37,254) (37,470) (42,206) (49,870) French students supplement - (771) (1,593) -
Total MELS Recoveries: (81,191) (84,582) (89,634) (100,902)
Allocation for graduation premiums 7,475 - - - Envelope discontinued as of FY2016Indirect Cost of Research Grant 16,978 7,961 - - Reduction in indirect envelope as a result of the creation of research space maintenance envelopeInformation technology and libraries 2,646 2,605 2,541 2,572 Rentals grant 688 735 735 735 Placement Universités 4,724 5,966 5,966 5,966 Disabled Students Grant 1,114 942 942 942 Target Hiring Chantier 1 and 2 3,253 3,800 3,823 3,696 Other grants 839 883 883 883 Includes other Chantiers and support envelopes from MEESOther Adjustments 6 401 295 237
Specific (Temporary) Grants 37,724 23,293 15,186 15,031
Subtotal 1A Operating Grant 339,225 334,715 326,291 328,415
Student Services not captured above 2,415 2,454 2,475 2,525 Note that a portion of MEES grant flows directly to student services.
Total Operating Grant 341,640 337,169 328,766 330,940

103
Appendix 10: Full-Time Tenured and Tenure-Track Faculty Staff Counts
Notes: 1) Joint appointments are counted by splitting the staff count among respective Faculties, where applicable. Joint appointments are formalized in the Board letter of appointment. 2) Excludes tenure-track librarians, see the relevant section on librarian staff below. 3) Includes the McGill School of Environment (MSE) which for reporting purposes reports to the Dean of the Faculty of Agricultural and Environmental Sciences. The MSE is a multi-
faculty unit shared with the Faculty of Arts, the Faculty of Law, and the Faculty of Science. 4) On May 1, 2014, the School of Information Studies (12.5 faculty members) was formally transferred from Education to Arts. 5) On May 1, 2016 the Faculty of Religious Studies was transformed into the School of Religious Studies under the Faculty of Arts. This shift will be reflected in next year’s report. 6) The total count of 0.5 from FY2011 onwards reflects the appointment of the Dean of Libraries who holds a 0.5 joint appointment in the School of Information Studies (Faculty of
Arts) and a 0.5 joint appointment in the University Library and Archives. See the librarian section for an accounting of the other 0.5 portion.
Faculty1, 2 2011 2012 2013 2014 2015 2016 # % # %
Agricultural and Environmental Sciences 3 93.7 91.7 94.2 96.7 96.2 99.2 3.0 3.1% 5.5 5.9%
Arts4,5,6 263.3 275.6 280.1 286.8 299.6 305.1 5.5 1.8% 41.8 15.9%Dentistry 17.5 19.5 19 19.5 18 19 1.0 5.6% 1.5 8.6%Education4 80 81 80 80 62.5 68.5 6.0 9.6% (11.5) (14.4%)Engineering 150 149 152 158 155 155 0.0 0.0% 5.0 3.3%Law 40 38.5 40 43 43 43.5 0.5 1.2% 3.5 8.8%Desautels Faculty of Management 72.5 74.5 74 80 77 74 (3.0) (3.9%) 1.5 2.1%Medicine* 562.2 571.9 575.9 574.8 566.9 565.9 (1.0) (0.2%) 3.7 0.7%Schulich School of Music 57 59 58 59 59 62 3.0 5.1% 5.0 8.8%Religious Studies5 12.5 12.5 12.5 13.5 13.5 12.5 (1.0) (7.4%) 0.0 0.0%Science 252.8 263.3 257.8 264.3 264.8 262.8 (2.0) (0.8%) 10.0 4.0%Total 6 1601.5 1636.5 1643.5 1675.6 1655.5 1667.5 12.0 0.7% 66.0 4.1%* Clinicians included in Medicine totals above 178 178 177 173 164 165 1.0 0.6% (13.0) (7.3%)
Period Ending (30-Apr-YYYY)1-year net change(FY2016 - FY2015)
5-year net change(FY2016 - FY2011)

104
Appendix 11: Other Full-time Ranked Academic Staff Counts
Notes: 1) 0.5 tenure-track position from FY2011 onwards reflects the Dean of Libraries’ joint appointment in the School of Information Studies, Faculty of Arts. For the other 0.5 portion,
see the previous section on tenure-track and tenured professoriate.
Full-Time, Ranked, Tenure-Track/Tenured Libraries Staff Counts
Type 2011 2012 2013 2014 2015 2016 # % # %Tenure-Track 64.5 60.5 59.5 60.5 58.5 57.5 (1.0) (1.7%) (7.0) (10.9%)Total 1 64.5 60.5 59.5 60.5 58.5 57.5 (1.0) (1.7%) (7.0) (10.9%)
Period Ending (30-Apr-YYYY)1-year net change(FY2016 - FY2015)
5-year net change(FY2016 - FY2011)
Full-Time, Ranked, Non-Tenure-Track Libraries Staff Counts
Type 2011 2012 2013 2014 2015 2016 # % # %Full-Time 7 2 3 6 4 6 2 50.0% (1) (14.3%)Total 7 2 3 6 4 6 2 50.0% (1) (14.3%)
Period Ending (30-Apr-YYYY)1-year net change(FY2016 - FY2015)
5-year net change(FY2016 - FY2011)

105
Appendix 11: Other Full-time Ranked Academic Staff Counts (2 of 2)
Notes: 7) Staff counts are weighted for joint appointments between differing Faculties. 8) Ranked Librarians are not counted here as they are considered non-tenure-track and thus fall out of the scope of the CAS Regulations. See the previous section on Librarian staff
for more information. This count represents the Curators who are unranked CAS.
Full-Time, Ranked, Contract Academic Staff Counts
Faculty/Area1 2011 2012 2013 2014 2015 2016 # % # %Agricultural and Environmental Sciences 23 20 23 23 24 27 3.0 12.5% 4.0 17.4%Arts 55 37 48.5 51.5 50 50 0.0 0.0% (5.0) (9.1%)School of Continuing Studies 15 21 18.5 20.5 18.5 21.5 3.0 16.2% 6.5 43.3%Dentistry 0 0 0 0 2 3 1.0 50.0% 3.0 n/aEducation 7 7 8 9 9 8 (1.0) (11.1%) 1.0 14.3%Engineering 11 11 8 6 7 8 1.0 14.3% (3.0) (27.3%)Law 5 6 6 6 6 5 (1.0) (16.7%) 0.0 0.0%Desautels Faculty of Management 22 21 22.5 22.5 24.5 26.5 2.0 8.2% 4.5 20.5%Medicine 63 77 94.5 113 178.5 204 25.5 14.3% 141.0 223.8%Schulich School of Music 2 2 3 3 3 2 (1.0) (33.3%) 0.0 0.0%Religious Studies 2 2 1 1 1 4 3.0 300.0% 2.0 100.0%Science 32 29 36 37.5 35.5 36 0.5 1.4% 4.0 12.5%University Library and Archives2 1 1 1 1 1 2 1.0 100.0% 1.0 100.0%Non-Faculty Other 11 10 7 5 5 5 0.0 0.0% (6.0) (54.5%)Total 249 244 277 299 365 402 37.0 10.1% 153.0 61.4%
Period Ending (30-Apr-YYYY)1-year net change(FY2016 - FY2015)
5-year net change(FY2016 - FY2011)

106
Appendix 12: Administrative and Support Staff Counts
Notes: 1) The McGill School of Environment (MSE) and its staff counts have been folded into the Faculty of Agricultural & Environmental Sciences, for all reporting years, as this unit now
reports to the Dean of FAES, although overall responsibility of the MSE is shared with the Faculty of Arts, the Faculty of Law, and the Faculty of Science. 2) The Faculty Religious Studies was transformed into the School of Religious Studies within the Faculty of Arts effective May 1, 2016. In next year’s report its staff counts will be
folded into the Faculty of Arts for all reporting years. 3) Table excludes staff on long-term disability and placement transition.
Full-Time counts within the Faculties and Libraries
2011 2012 2013 2014 2015 2016 # % # %Agricultural and Environmental Sciences1 89 83 83 78 76 78 2 2.6% (11) (12.4%)Arts 118 120 126 114 116 112 (4) (3.4%) (6) (5.1%)School of Continuing Studies 46 49 54 57 63 68 5 7.9% 22 47.8%Dentistry 43 41 46 42 50 58 8 16.0% 15 34.9%Education 52 44 46 45 43 46 3 7.0% (6) (11.5%)Engineering 133 135 134 120 123 129 6 4.9% (4) (3.0%)Law 31 30 31 31 29 30 1 3.4% (1) (3.2%)Desautels Faculty of Management 82 78 91 82 88 94 6 6.8% 12 14.6%Medicine 663 649 637 603 638 668 30 4.7% 5 0.8%Schulich School of Music 59 60 56 47 48 48 0 0.0% (11) (18.6%)Religious Studies2 8 7 8 7 7 5 (2) (28.6%) (3) (37.5%)Science 176 179 182 168 170 165 (5) (2.9%) (11) (6.3%)University Library and Archives 142 142 132 105 100 102 2 2.0% (40) (28.2%)Total 3 1642 1617 1626 1499 1551 1603 52 3.4% (39) (2.4%)
Period Ending (30-Apr-YYYY)1-year net change(FY2016 - FY2015)
5-year net change(FY2016 - FY2011)
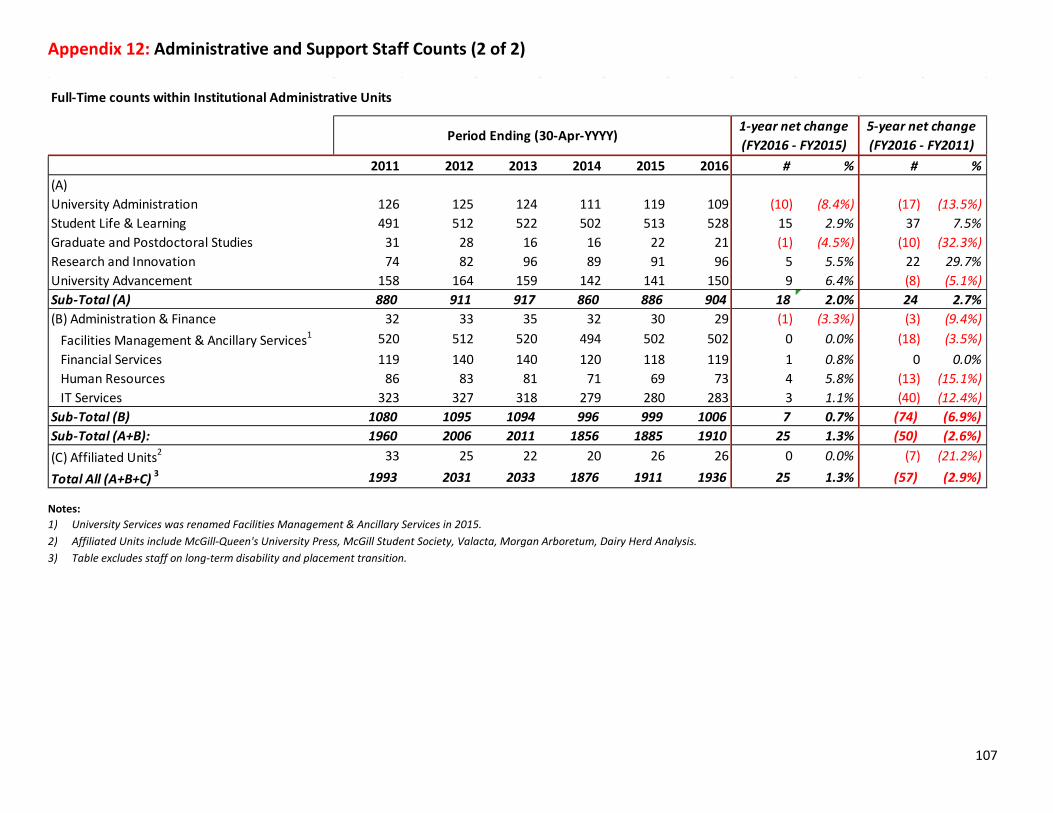
107
Appendix 12: Administrative and Support Staff Counts (2 of 2)
Notes: 1) University Services was renamed Facilities Management & Ancillary Services in 2015. 2) Affiliated Units include McGill-Queen's University Press, McGill Student Society, Valacta, Morgan Arboretum, Dairy Herd Analysis. 3) Table excludes staff on long-term disability and placement transition.
Full-Time counts within Institutional Administrative Units
2011 2012 2013 2014 2015 2016 # % # %(A)University Administration 126 125 124 111 119 109 (10) (8.4%) (17) (13.5%)Student Life & Learning 491 512 522 502 513 528 15 2.9% 37 7.5%Graduate and Postdoctoral Studies 31 28 16 16 22 21 (1) (4.5%) (10) (32.3%)Research and Innovation 74 82 96 89 91 96 5 5.5% 22 29.7%University Advancement 158 164 159 142 141 150 9 6.4% (8) (5.1%)Sub-Total (A) 880 911 917 860 886 904 18 2.0% 24 2.7%(B) Administration & Finance 32 33 35 32 30 29 (1) (3.3%) (3) (9.4%)
Facilities Management & Ancillary Services1 520 512 520 494 502 502 0 0.0% (18) (3.5%)Financial Services 119 140 140 120 118 119 1 0.8% 0 0.0%Human Resources 86 83 81 71 69 73 4 5.8% (13) (15.1%)IT Services 323 327 318 279 280 283 3 1.1% (40) (12.4%)
Sub-Total (B) 1080 1095 1094 996 999 1006 7 0.7% (74) (6.9%)Sub-Total (A+B): 1960 2006 2011 1856 1885 1910 25 1.3% (50) (2.6%)(C) Affiliated Units2 33 25 22 20 26 26 0 0.0% (7) (21.2%)
Total All (A+B+C) 3 1993 2031 2033 1876 1911 1936 25 1.3% (57) (2.9%)
Period Ending (30-Apr-YYYY)1-year net change(FY2016 - FY2015)
5-year net change(FY2016 - FY2011)

108
Appendix 13: Summary of Carry forwards & fund balances – Operating funds FY2017 ($’000)
FY2017 (Beginning of Year)1A
Overex-penditure(1)
1AReserve
(2)
1AExceptions
(3)
1AProfessor funds(4)
1ANet Carry Forward
1B 1C to 1F Total: FY2017(Beginning of
Year)
Total: FY2016(Beginning of
Year)
Change
Agricultural and Environmental Sciences (200) 245 65 7 117 172 3,018 3,307 3,947 (640)Arts(5) (469) 176 406 123 236 - 3,563 3,799 2,227 1,572School of Continuing Studies (310) 3 91 - (216) 4,721 2,455 6,960 6,437 523Dentistry (428) 30 90 1 (307) - 1,546 1,239 1,606 (367)Education - 872 115 9 996 - 1,910 2,906 2,188 718Engineering - 1,435 305 362 2,102 - 9,445 11,547 9,888 1,659Law (97) 99 - 2 4 122 1,202 1,328 1,610 (282)Desautels Faculty of Management (303) 127 - 37 (139) 16 5,800 5,677 5,797 (120)Medicine - 2,892 3,217 82 6,191 630 39,960 46,781 41,021 5,760Schulich School of Music - 360 - 36 396 108 727 1,231 1,033 198Science - 4,286 1,170 6 5,462 - 7,023 12,485 13,332 (847)Library (181) 399 - - 218 - 104 322 481 (159)Principal and Vice-Chancellor - - - - - - - - 145 (145)Provost and Vice Principal (Academic) (3,515) - 801 - (2,714) - 7 (2,707) 314 (3,021)Macdonald Campus (Associate Vice-Principal) (71) - - - (71) 400 37 366 196 170Student Life and Learning (Deputy Provost) - - - - - 8,793 2,003 10,796 11,450 (654)Graduate & Postdoctoral Studies (Dean) - - - - - - 25 25 - 25Administration and Finance (Vice-Principal) (16,667) - - - (16,667) - (55) (16,722) 298 (17,020)Administration and Finance (Information Technology)(6) - - - - - 580 - 580 398 182Administration and Finance (FMAS)(6) - - 1,102 - 1,102 10,197 75 11,374 (1,780) 13,154Research and Innovation (Vice-Principal) - - 566 - 566 - 1,882 2,448 (1,014) 3,462University Advancement (Vice-Principal) - - - - - - 1,373 1,373 1,270 103Communications and External Relations (Vice-Principal) - - - - - - - - (16) 16Institutional - - - - - - (6,585) (6,585) (5,857) (728)Total: FY2017 (Beginning of Year) (22,241) 10,924 7,928 665 (2,724) 25,739 75,515 98,530 94,971 3,559
Total: FY2016 (Beginning of Year) (17,495) 9,387 6,319 682 (1,107) 25,302 70,776 94,971Change (4,746) 1,537 1,609 (17) (1,617) 437 4,739 3,559Notes:(1) Overexpenditures are automatically carried forward unless written off against institutional offsets.(2) Positive carry forwards are placed in a reserve for Faculties only, and can only be used upon approval of Provost. For administrative units, they are used to reduce the insitutional offsets.(3) Exceptions include those positive carry forwards that are kept by the units (authorized by Associate Provost).(4) The amount replenished in the Professor Funds takes into account carry forwards.(5) Religious Studies is included with the Faculty of Arts, in both fiscal years.(6) The surplus in the Administration and Finance (IT) and the Administration and Finance (FMAS) 1B funds is the result of revenues from ancillary operations (e.g. parking, book store, u-print etc.). It is not for use by the units.

109
Appendix 14: Deferred Maintenance Repayment Impact on Operating Budget ($’M)

110
Appendix 15: Endowment Income Contribution to Restricted Fund by unit - FY2016 details & FY2009-FY2015 totals ($’000)
Medals Prizes Scholarships Bursaries Fellowships Chairs Others TotalAgricultural and Environmental Sciences 5 42 142 1 158 118 274 740Arts 13 424 288 - 926 1,147 1,027 3,825School of Continuing Studies 5 1 1 - - 3 11Dentistry - 19 28 - 22 43 547 659Education - 30 40 - 44 67 29 209Engineering 6 97 510 - 788 578 1,325 3,304Graduate and Postdoctoral Studies - 18 6 - 2,103 - 88 2,215Law 10 77 82 11 257 576 359 1,371Desautels Faculty of Management 1 81 190 5 157 226 1,378 2,037Medicine 1 218 542 9 1,310 4,186 6,326 12,592Schulich School of Music 1 45 756 5 93 92 163 1,154Religious Studies - 31 9 11 0 92 199 342Science 14 48 486 - 700 1,240 1,039 3,528University Library and Archives - - 2 - 4 100 1,288 1,393Administrative Units - 2 31 - 14 54 1,173 1,273Student Life and Learning 1 244 4,989 1,527 - - 642 7,402Total FY2016 51 1,379 8,103 1,568 6,575 8,519 15,859 42,054
Total FY2015 45 1,184 7,600 1,215 6,759 9,447 18,583 44,833Total FY2014 44 1,068 7,158 964 6,185 8,975 16,808 41,202Total FY2013 42 964 6,644 830 5,783 8,033 15,638 37,934Total FY2012 42 837 6,636 752 5,807 8,662 16,032 38,768Total FY2011 (11 months) 41 779 6,768 643 4,843 7,412 15,384 35,870Total FY2010 44 812 7,078 571 4,738 7,802 16,101 37,146Total FY2009 54 997 8,530 602 5,230 9,296 17,396 42,105
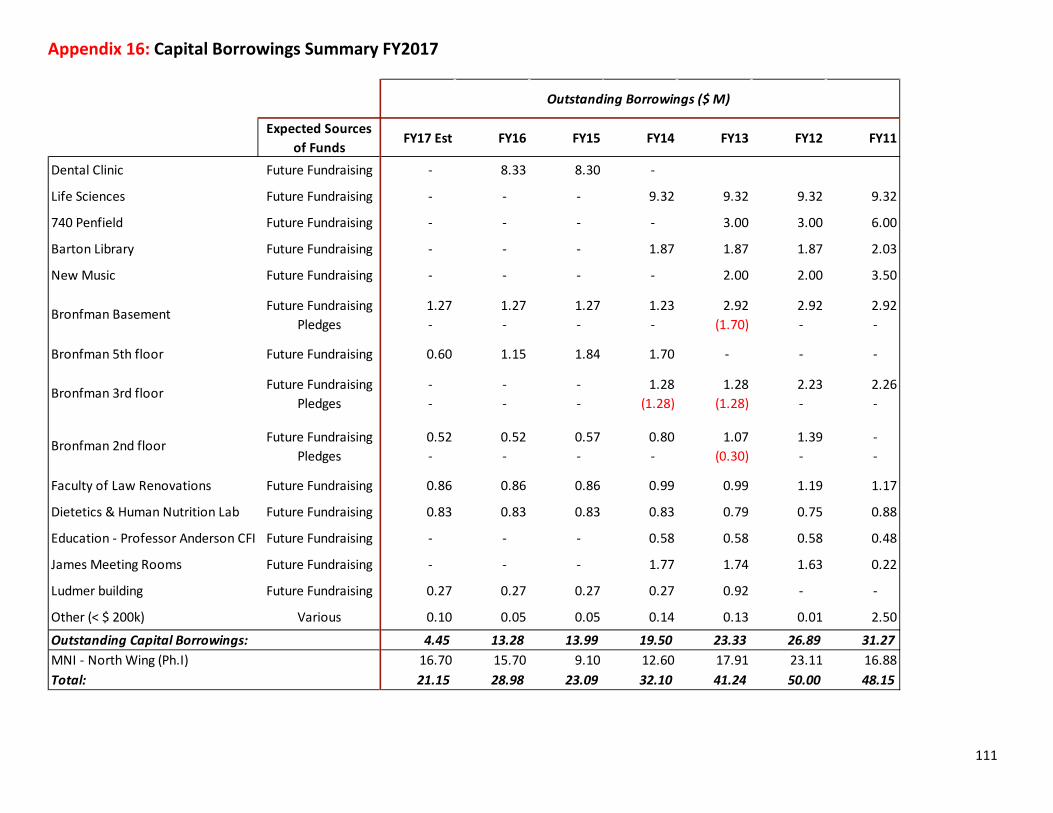
111
Appendix 16: Capital Borrowings Summary FY2017
Expected Sourcesof Funds
FY17 Est FY16 FY15 FY14 FY13 FY12 FY11
Dental Clinic Future Fundraising - 8.33 8.30 -
Life Sciences Future Fundraising - - - 9.32 9.32 9.32 9.32
740 Penfield Future Fundraising - - - - 3.00 3.00 6.00
Barton Library Future Fundraising - - - 1.87 1.87 1.87 2.03
New Music Future Fundraising - - - - 2.00 2.00 3.50
Future Fundraising 1.27 1.27 1.27 1.23 2.92 2.92 2.92Pledges - - - - (1.70) - -
Bronfman 5th floor Future Fundraising 0.60 1.15 1.84 1.70 - - -
Future Fundraising - - - 1.28 1.28 2.23 2.26Pledges - - - (1.28) (1.28) - -
Future Fundraising 0.52 0.52 0.57 0.80 1.07 1.39 - Pledges - - - - (0.30) - -
Faculty of Law Renovations Future Fundraising 0.86 0.86 0.86 0.99 0.99 1.19 1.17
Dietetics & Human Nutrition Lab Future Fundraising 0.83 0.83 0.83 0.83 0.79 0.75 0.88
Education - Professor Anderson CFI Future Fundraising - - - 0.58 0.58 0.58 0.48
James Meeting Rooms Future Fundraising - - - 1.77 1.74 1.63 0.22
Ludmer building Future Fundraising 0.27 0.27 0.27 0.27 0.92 - -
Other (< $ 200k) Various 0.10 0.05 0.05 0.14 0.13 0.01 2.50
Outstanding Capital Borrowings: 4.45 13.28 13.99 19.50 23.33 26.89 31.27MNI - North Wing (Ph.I) 16.70 15.70 9.10 12.60 17.91 23.11 16.88Total: 21.15 28.98 23.09 32.10 41.24 50.00 48.15
Outstanding Borrowings ($ M)
Bronfman Basement
Bronfman 3rd floor
Bronfman 2nd floor

112
Appendix 17: University Significant Accounting Policies
The University’s audited financial statements are prepared in accordance with Canadian accounting standards for not-for-profit organizations (“ASNPO”) using the deferral method.
The following significant accounting policies are included in the annual audited financial statements of the University: 1. Revenue Recognition
The University follows the deferral method of accounting for contributions, which include gifts and bequests, contracts and government grants. Research grants are recognized as revenue in the year in which related expenses are recognized.
Interest and dividend revenue is recorded on an accrual basis. Realized gains or losses on sales of investments are recorded when securities are sold based on the cost. Unrealized gains and losses related to the change in market value are recorded as investment income.
2. Capital assets
Capital assets are recorded at cost. Purchases made using operating funds or restricted funds are capitalized directly in the plant fund. Restricted fund contributions will be recorded in the plant fund as deferred contributions and recognized as revenue simultaneous to the amortization expense. Constructed assets do not include interest incurred during construction. Contributed capital assets are recorded at appraised fair value at the date of contribution when fair value can be reasonably estimated; otherwise they are recorded at a nominal amount. Amortization of assets under development commences when development is completed.
3. Grants receivable
Under GAAP, these amounts meet the criteria of an asset. An offsetting liability is recorded as a corresponding deferred contribution. Please refer to 21.2 regarding “revenue recognition” for grants.
4. Pledges Donation pledges are not recognized until received and are disclosed in the notes to the financial statements, consistent with other Canadian Universities and accounting standards for not-for-profit organizations.
5. Discounting of Long-Term Grants Receivable
Under GAAP, long-term receivables are discounted to their present value. A rate based on risk of the counter party will be agreed to.
6. Deferral of Research and Capital Grants
Under the deferral method, unspent research and capital grants are recorded as deferred contributions, rather than as grant revenue. Revenue recognition occurs in the year as related expenses are incurred.
7. Long-term debt
Long-term debt is presented at the gross value of all outstanding debt.
8. Unused Vacation Days, Post-Retirement Benefit Obligations, and
Accrued Pension Liabilities In the case of unused vacation days, post-retirement benefit obligations, and accrued pension liabilities, accruals are recorded over the periods of service. An actuarial accounting valuation is performed annually at year-end to determine the amounts related to the pension liability and the post-employment benefit obligation. The valuation will use estimates and assumptions as agreed to by management. The tri-annual actuarial valuation for the pension plan was last performed as at December 31, 2015.

113
Appendix 18: Administrative Groupings
Faculties – Departments and Schools Faculty of Agricultural and Environmental Sciences
Agricultural Economics Animal Science Bioresource Engineering Dietetics and Human Nutrition Farm Management and Technology Program Food Science and Agricultural Chemistry McGill School of Environment Natural Resource Sciences Parasitology Plant Science
Faculty of Arts Anthropology Art History and Communication Studies East Asian Studies Economics English French Language Centre French Language and Literature Gender, Sexuality and Feminist Studies History and Classical Studies Information Studies Institute for the Study of International Development Islamic Studies Jewish Studies Languages, Literatures, and Cultures McGill Institute for the Study of Canada Linguistics Philosophy Political Science Quebec Studies Program Religious Studies Social Work Sociology
School of Continuing Studies
Career and Professional Development Language and Intercultural Communication Personal and Cultural Enrichment Translation and Written Communication
Faculty of Dentistry Faculty of Education
Educational and Counselling Psychology Integrated Studies in Education Kinesiology and Physical Education Learning and Information Technologies
Faculty of Engineering Architecture Bioengineering Chemical Engineering Civil Engineering and Applied Mechanics Electrical and Computer Engineering Mechanical Engineering Mining and Materials Urban Planning
Faculty of Law Desautels Faculty of Management Faculty of Medicine
Anatomy and Cell Biology Anesthesia Biochemistry Biomedical Engineering Communications Sciences and Disorders Diagnostic Radiology Epidemiology, Biostatistics and Occupational Health Family Medicine Gerald Bronfman Department of Oncology Human Genetics Ingram School of Nursing Medicine Microbiology and Immunology Neurology and Neurosurgery Nutrition and Food Science Centre Obstetrics & Gynecology Ophthalmology
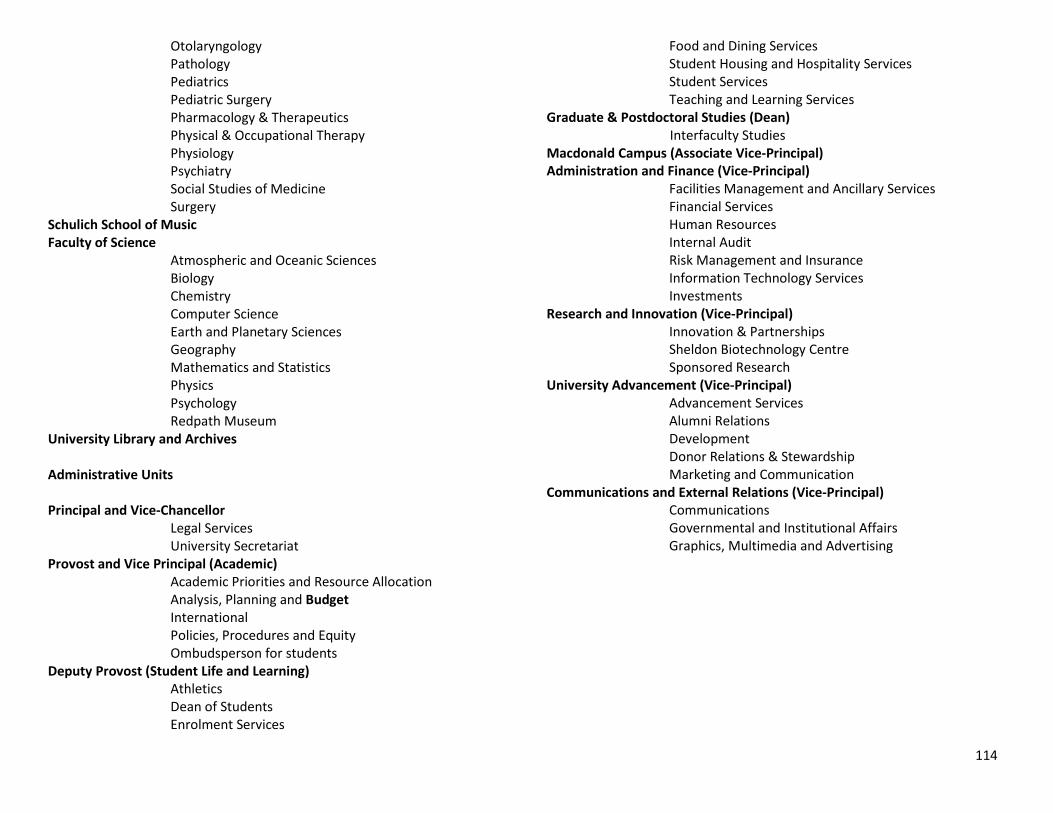
114
Otolaryngology Pathology Pediatrics Pediatric Surgery Pharmacology & Therapeutics Physical & Occupational Therapy Physiology Psychiatry Social Studies of Medicine Surgery
Schulich School of Music Faculty of Science
Atmospheric and Oceanic Sciences Biology Chemistry Computer Science Earth and Planetary Sciences Geography Mathematics and Statistics Physics Psychology Redpath Museum
University Library and Archives Administrative Units Principal and Vice-Chancellor
Legal Services University Secretariat
Provost and Vice Principal (Academic) Academic Priorities and Resource Allocation Analysis, Planning and Budget International Policies, Procedures and Equity Ombudsperson for students
Deputy Provost (Student Life and Learning) Athletics Dean of Students Enrolment Services
Food and Dining Services Student Housing and Hospitality Services Student Services Teaching and Learning Services
Graduate & Postdoctoral Studies (Dean) Interfaculty Studies
Macdonald Campus (Associate Vice-Principal) Administration and Finance (Vice-Principal)
Facilities Management and Ancillary Services Financial Services Human Resources Internal Audit Risk Management and Insurance Information Technology Services Investments
Research and Innovation (Vice-Principal) Innovation & Partnerships Sheldon Biotechnology Centre Sponsored Research
University Advancement (Vice-Principal) Advancement Services Alumni Relations Development Donor Relations & Stewardship Marketing and Communication
Communications and External Relations (Vice-Principal) Communications Governmental and Institutional Affairs Graphics, Multimedia and Advertising

115
Appendix 19: List of Abbreviations
BCI
CAS
CERC
CFI
CFREF
CRC
FBM
FIR
FMAS
FTE
MEES
MIP
Bureau de Coopération Interuniversitaire
Contract Academic Staff
Canada Excellence Research Chair
Canada Foundation for Innovation
Canada First Research Excellence Fund
Canada Research Chair
Financial Budget Model
Frais indirects de recherche
Facilities Management and Ancillary Services
Full-time equivalent (student)
Ministère de l’Éducation et de l'Enseignement supérieur
McGill Investment Pool
MUPP
OPVPA
PICOR
PVPA
RSF
RVH
SIF
TT
U15
UG
WFTE
McGill University Pension Plan
Office of the Provost and Vice-Principal (Academic)
Provincial indirect costs of research
Provost and Vice-Principal (Academic)
Research Support Fund
Royal Victoria Hospital
Strategic Investment Fund
Tenure-track (faculty member)
Consortium of 15 most research intensive Canadian universities
Undergraduate (student)
Weighed full-time equivalent (student)

116
Appendix 20: Glossary of Terms
Academic Renewal: The program by which the University sets Faculty-based tenure-track academic targets and provides Faculties with the operating support needed to reach the targets, including operating salaries, start-ups, and recruitment funds.
Accrual: The accrual accounting method reports revenue when earned (rather than received), and expenses when incurred (rather than paid).
Accumulated Operating Deficit: The total debt (i.e., the sum of the operating deficits) incurred to support the accumulated spending that is in excess of revenues.
Actual: Earned revenues, incurred salaries, and expenditures, or transfers that have been posted to a fund.
Amortization: The accounting of a purchased asset, which represents a non-cash expense over a period of time. Also, for those units required to repay internal loans, it represents the systematic repayment of the debt over the agreed period.
Asset: A tangible or intangible item of positive value to the University (e.g., cash, government receivables, a building, or a piece of equipment).
Bequest: A gift given to the university at the time of a person’s death as set forth in the individual’s last will and testament. Bequests can have a variety of forms including, but not limited to: cash, marketable securities, tangible fixed assets, and consumable commodities. Bequests are classified according to the absence or presence of donor stipulations as unrestricted, temporarily restricted, or permanently restricted.
Budget: An organizational plan stated in monetary terms; functions as a tool to measure revenue levels and expenditures against expectations.
Budget Executive Committee (BEC): A committee comprised of the Principal, the PVPA, and the Vice-Principal, Administration and Finance, which is responsible for vetting and approving high-level budget directions as well as arbitrating
Budget Planning Agreement: A multi-year and multi-fund operating plan signed by the PVPA, and the Dean or Vice-Principal, which reports on
previous year achievements and challenges, and describes activities that support strategic objectives, aspirations and priorities. It includes a summary of key performance indicators over a multi-year time frame. Finally, it includes all financial requests for a three-year period and the related decisions made by the PVPA.
Capital Assets: Assets used in operations, either tangible (e.g., infrastructure, and, vehicles) or intangible (e.g., software) that have an initial useful life of more than one year. See also plant fund.
Capitalization: Term used in relation to the endowment fund when unspent distributed income is reinvested in the endowment fund
Contract Academic Staff (CAS): A staff member who holds an academic appointment for a definite or indefinite term that does not lead to tenure.
Conditional grant: 10% of the provincial grant, which can be withheld by the MEES if a university runs an annual deficit, based on a predetermined formula (excluding year-end audit adjustments), without providing a plan to return to a balanced budget. This grant is accrued and typically paid subsequent to year-end.
Contribution: Gifts, grants, bequests and any similar transfer of resources (both monetary and in-kind).
Decapitalization: Term used in relation to the endowment fund when previously capitalized distributed income is credited back to the spendable fund.
Deferred Maintenance: The amount of renovation and upgrade required for the University’s physical infrastructure. The repairs are serious and urgent in-nature as preventive maintenance was not performed in prior years. Examples include: upgrading ventilation systems, roof replacements, and building facade replacements.
Deficit: Also known as overdraft; the amount by which a fund’s expenses and transfers out exceed revenues and transfers in, resulting in a balance of less than $0.
Deregulated: Refers to tuition fees that are set by the University rather than by government regulation. See also Regulated.

117
Donation: An act of presenting something as gift, bequest, or contribution, especially to a public institution or charity.
Endowment Fund: Consists of all gifts, donations, and bequests, including those for Chairs, financial aid, and other specific purposes, held in perpetuity and invested to earn a reasonable rate of return over time, while attempting to protect the purchasing power of the original gift. The earned income is distributed according to the University policy in effect, and is spent as specifically designated by the donor.
Envelope: A purse of money dedicated to a specific purpose.
Expenditure: The amount spent for goods delivered or services rendered, whether paid or accrued, including expenses, debt service, and capital outlays.
Expense: Charges incurred, whether paid or accrued, for operation, maintenance, interest, and other charges that are presumed to benefit the current fiscal period. Fiscal Year (FY): Twelve consecutive months used for accounting purposes. As of 2011-2012 the 12-month financial year starts on May 1 and ends on April 30.
Forfaitaires: (also called tuition supplements) the additional tuition, above the Quebec student tuition, charged to out-of-province Canadians and International students. These amounts are determined by MEES annually and the universities remit them back to the Province in exchange for having the students funded through the grant at the level for in-province students.
Full-time equivalent (FTE) students: Students who are taking 30 or more credits per year.
Fund Balance: The difference between assets and liabilities in a fund; also defined as the cumulative results of a fund.
Gift: A resource provided by a donor who enters into the transaction voluntarily and receives nothing other than a token of appreciation in exchange for the resource he/she is providing. Contributions can have a variety of forms including, but not limited to: cash, marketable securities, tangible fixed assets, and consumable commodities. Gifts are classified according to the absence or presence of donor stipulations as unrestricted,
temporarily restricted, or permanently restricted. See also Bequest, Contribution, and Donation.
Grant: A monetary award, allowance or subsidy.
Indirect cost of research: The institutional costs incurred by the University to support research projects. Costs include items such as central administrative support, Library, computing infrastructure, utilities and other plant costs.
Investment: Refers to an exchange of cash for a less liquid asset that is expected to increase in value beyond the initial purchase price. Investment vehicles include corporate stocks and bonds, government bonds and real estate.
Key Performance Indicators (KPIs): Key performance indicators were established to provide tangible evidence of progress toward a stated strategic objective. The University-wide accountability indicators, developed in conjunction with Quebec, were approved by the Board of Governors in May 2012. Each Faculty and Administrative Unit determines and develops their own set of performance indicators to measure their success in achieving their strategic objectives.
MEES grant: The grant received from the Quebec Ministry of Higher Education in support of teaching and research.
Operating Fund: Revenue is primarily from grants, tuition and fees, overhead on research grants, Investment and endowment income, and annual gifts. The revenue is pooled and then allocated to units concerned with fundamental and on-going operations, dealing primarily with those activities normally associated with the University’s core teaching and research. The operating fund is unrestricted and there are no external constraints as to how these funds are spent as long as the University policies and procedures are respected.
Plant Fund: Capital projects and assets; including those funds from Quebec capital grants, donations, and other sources.
Regulated: Refers to tuition rates set by the government (MEES), either frozen or indexed to changes in disposable family income.
Resources: Assets available (actual and anticipated) for University operations; includes people, equipment, and facilities.
118
Resource allocation: The process of distributing resources to units in order for them to conduct their designated activities and to absorb operating and/or facilities costs in order to achieve goals.
Restricted Fund: Any fund with stipulations imposed by a sponsor or donor external to the University. A particular project or activity is specified in writing by the donor. These funds also refer to research-related funds from Canadian, Quebec, and international sources.
Revenue: Income generated by the supply of goods or services by the University unit to an external customer. Some examples are: tuition and fees, sales of goods and services to external entities, and earnings on investments. Self-funded: Students for whom universities in Quebec are allowed to establish the fees but for whom no grant is received. This represents a small number of students enrolled in specialized Masters-level programs in Management as well as non-Quebec students studying in distance programs outside Quebec. Self-financing: Funds for which the source and/or use are outside the realm of operating budgets. They represent unrestricted activity for a unit, with continuation dependent on participation and availability of funding. See also operating fund.
Tenure stream. A term that refers to either tenured or tenure-track academic staff.
Tenured: permanent academic appointment granted to Associate and Full Professors who have demonstrated excellence in teaching and research.
Tenure-track: academic appointment that includes future consideration for tenured status.
Weighted Full-Time Equivalent (WFTE) Student: a full-time student is one who takes a 30-credit course load. In Quebec courses are divided into 23 funding families based on codes of disciplines. These are then weighted with values from 1 to 10.69 based on academic levels and curriculum. Higher weights are intended to denote courses that are more expensive to deliver.
Year-End Audit Adjustments: Costs related to major institutional obligations – unused vacation days, post-retirement benefit obligations, and accrued pension liabilities – for which we are required to record accruals over the periods of service. These three adjustments explain the difference between the GAAP Accumulated Deficit and the University Financed Accumulated Deficit. These adjustments are also excluded from the provincial calculation of annual operating results in determining eligibility for the conditional grant.