Embed Size (px)
Citation preview
Condensed Consolidated Balance Sheets, July 2, 2016 and January 2, 2016…………….……………………… 1
Trended Condensed Consolidated Balance Sheets………..……………………………………………………… 2
Condensed Consolidated Income Statements for the Three and Six Months Ended July 2, 2016 and July 4, 2015………………………………………………………………………………………………… 3
Trended Condensed Consolidated Income Statements……….……………………………………..………….. 4
Condensed Consolidated Statements of Cash Flows for the Six Months Ended July 2, 2016 and July 4, 2015….………………………………………………………………………………………… 5
Trended Condensed Consolidated Statements of Cash Flows…………………………………………………… 6
Revenue Mix by Geography………...……………………………………………………………………..……… 7
Revenue Mix by Product Group………...……………………………………………………………………..… 7
Impact of Non-GAAP Adjustments on Forward Looking Diluted Net Income Per Share, as of July 25, 2016……..………………………………………………………………………………………… 8
Impact of Non-GAAP Adjustments on Forward Looking Net Income, as of July 25, 2016……..……………… 8
Reconciliation of GAAP Net Income to Non-GAAP Net Income, for the Three and Six Months Ended July 2, 2016 and July 4, 2015……..………………………………………………………………………… 9
Reconciliation of GAAP Diluted Net Income Per Share to Non-GAAP Diluted Net Income Per Share, for the Three and Six Months Ended July 2, 2016 and July 4, 2015……..………………………… 10
Reconciliation of GAAP Financial Measures to Non-GAAP Financial Measures……….……………………… 11
Supplemental Reconciliation of Certain GAAP to Non-GAAP Measures for the Three Months Ended July 2, 2016……..…………………………………………………………………………………………… 12
Supplemental Reconciliation of Certain GAAP to Non-GAAP Measures for the Three Months Ended July 4, 2015……..…………………………………………………………………………………………… 13
Supplemental Reconciliation of Certain GAAP to Non-GAAP Measures for the Six Months Ended July 2, 2016……..…………………………………………………………………………………………… 14
Supplemental Reconciliation of Certain GAAP to Non-GAAP Measures for the Six Months Ended July 4, 2015……..…………………………………………………………………………………………… 15
TABLE OF CONTENTS
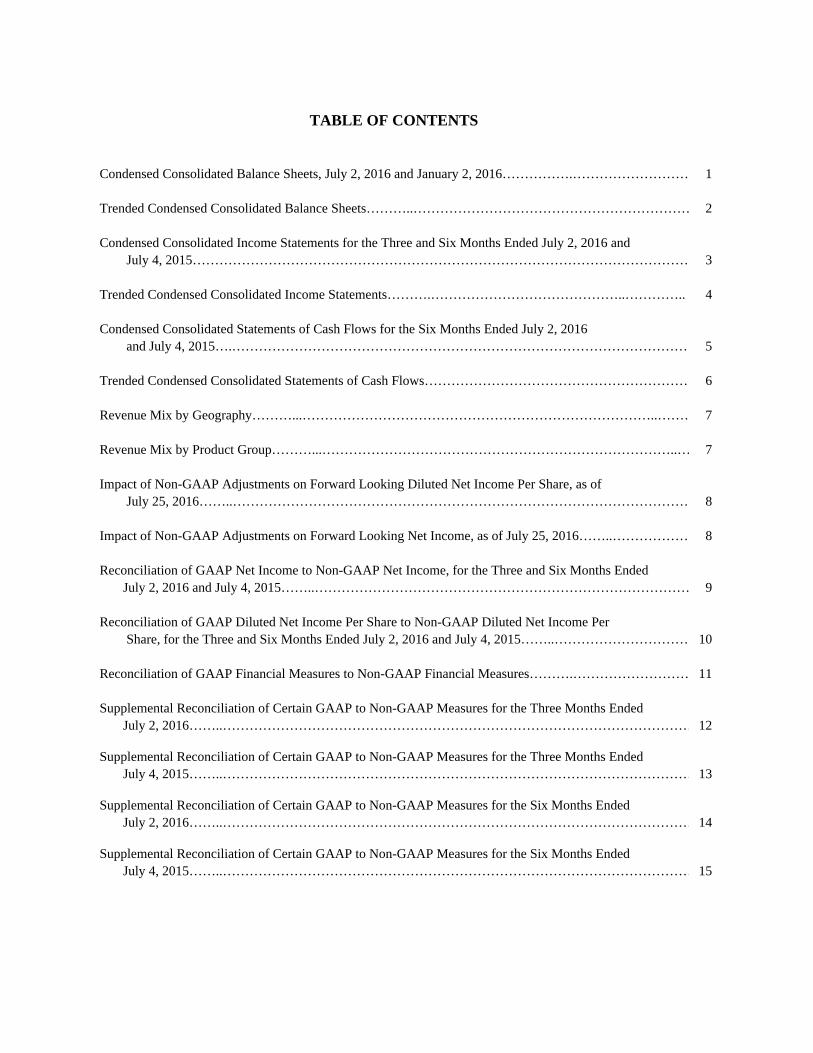
Cadence Design Systems, Inc.Condensed Consolidated Balance Sheets
July 2, 2016 and January 2, 2016
July 2, 2016 January 2, 2016
Current assets:Cash and cash equivalents 669,573$ 616,686$ Short-term investments 34,745 94,498 Receivables, net 156,444 164,848 Inventories 61,932 56,762 Prepaid expenses and other 39,485 31,441
Total current assets 962,179 964,235
Property, plant and equipment, net of accumulated depreciation of $604,532 and $581,345, respectively 235,911 228,599 Goodwill 573,714 551,772 Acquired intangibles, net of accumulated amortization of
$239,170 and $216,589, respectively 287,888 296,482 Long-term receivables 17,368 4,498 Other assets 300,813 299,929 Total assets 2,377,873$ 2,345,515$
Current liabilities:Revolving credit facility 50,000$ -$ Accounts payable and accrued liabilities 224,685 238,022 Current portion of deferred revenue 289,786 298,285
Total current liabilities 564,471 536,307
Long-term liabilities:Long-term portion of deferred revenue 38,094 30,209 Long-term debt 643,073 343,288 Other long-term liabilities 56,842 59,596
Total long-term liabilities 738,009 433,093
Stockholders' equity 1,075,393 1,376,115 Total liabilities and stockholders' equity 2,377,873$ 2,345,515$
(In thousands)(Unaudited)
1
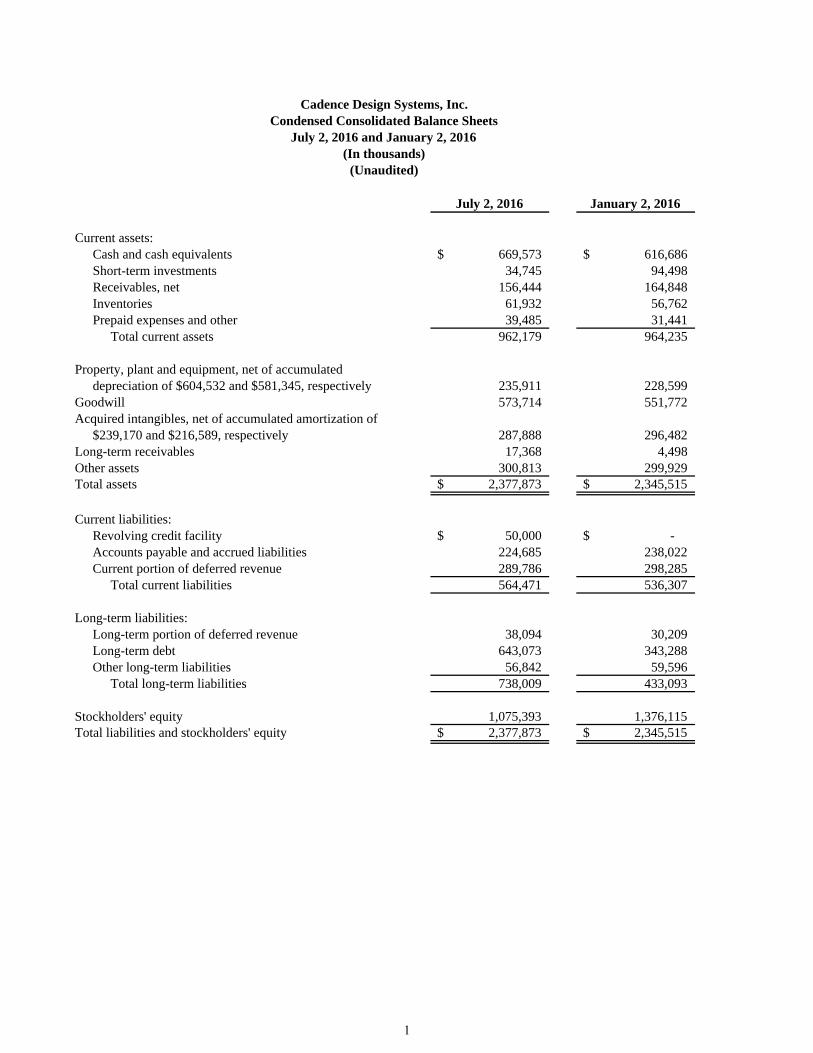
Cadence Design Systems, Inc.Trended Condensed Consolidated Balance Sheets
July 4, 2015
October 3, 2015
January 2, 2016
April 2, 2016
July 2, 2016
Current assets:Cash and cash equivalents 647,851$ 616,091$ 616,686$ 810,400$ 669,573$ Short-term investments 96,560 95,104 94,498 96,317 34,745 Receivables, net 131,325 133,665 164,848 147,533 156,444 Inventories 62,172 57,690 56,762 56,634 61,932 Prepaid expenses and other 128,806 139,015 31,441 41,360 39,485
Total current assets 1,066,714 1,041,565 964,235 1,152,244 962,179
Property, plant and equipment, net 229,838 227,689 228,599 231,180 235,911 Goodwill 553,831 552,411 551,772 551,897 573,714 Acquired intangibles, net 328,338 312,405 296,482 283,825 287,888 Long-term receivables 1,628 1,568 4,498 11,365 17,368 Other assets 194,552 189,876 299,929 308,513 300,813
Total assets 2,374,901$ 2,325,514$ 2,345,515$ 2,539,024$ 2,377,873$
Current liabilities:Revolving credit facility -$ -$ -$ 50,000$ 50,000$ Accounts payable and accrued liabilities 202,794 194,427 238,022 195,216 224,685 Current portion of deferred revenue 324,569 315,220 298,285 322,684 289,786
Total current liabilities 527,363 509,647 536,307 567,900 564,471
Long-term liabilities:Long-term portion of deferred revenue 36,402 31,234 30,209 38,447 38,094 Long-term debt 342,981 343,134 343,288 642,862 643,073 Other long-term liabilities 70,940 56,937 59,596 55,763 56,842
Total long-term liabilities 450,323 431,305 433,093 737,072 738,009
Stockholders' equity:Common stock and capital in excess of par value 1,886,421 1,853,284 1,863,086 1,844,287 1,851,724 Treasury stock, at cost (256,476) (307,408) (400,555) (587,348) (800,059) Retained earnings (accumulated deficit) (231,989) (154,365) (73,991) (15,622) 33,713 Accumulated other comprehensive loss (741) (6,949) (12,425) (7,265) (9,985)
Total stockholders' equity 1,397,215 1,384,562 1,376,115 1,234,052 1,075,393 Total liabilities and stockholders' equity 2,374,901$ 2,325,514$ 2,345,515$ 2,539,024$ 2,377,873$
(In thousands)(Unaudited)
2
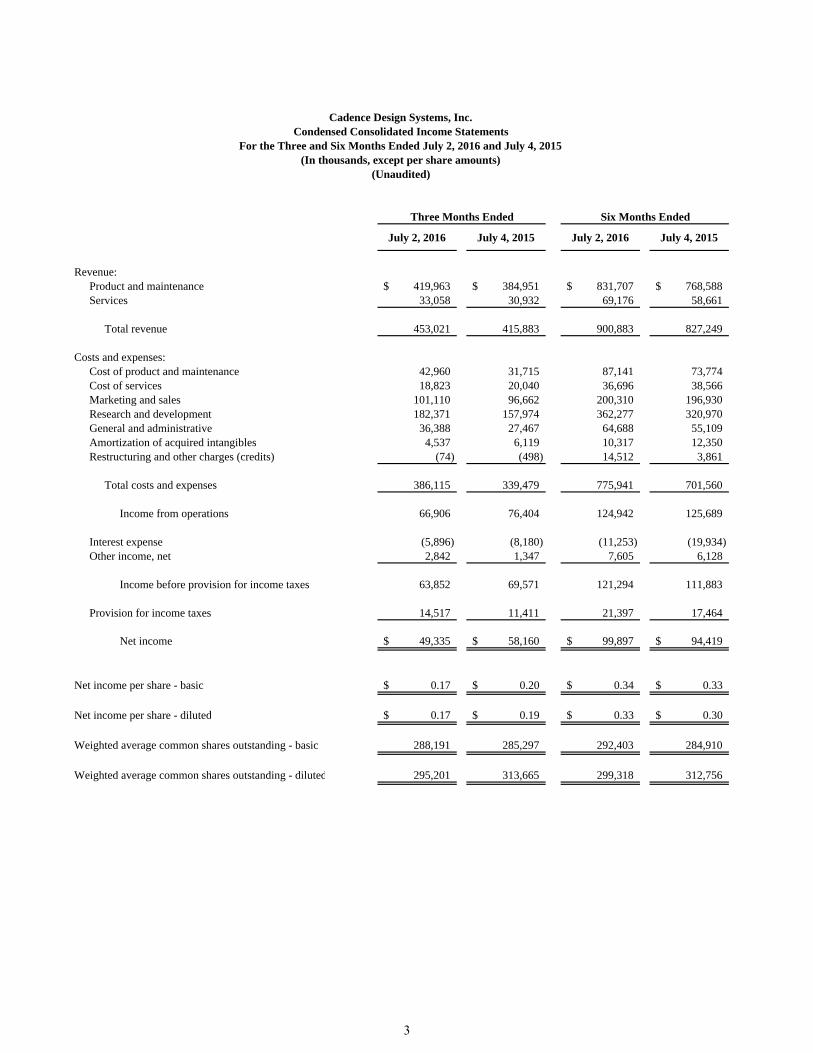
Cadence Design Systems, Inc.Condensed Consolidated Income Statements
For the Three and Six Months Ended July 2, 2016 and July 4, 2015(In thousands, except per share amounts)
(Unaudited)
Three Months Ended Six Months Ended
July 2, 2016 July 4, 2015 July 2, 2016 July 4, 2015
Revenue:Product and maintenance 419,963$ 384,951$ 831,707$ 768,588$ Services 33,058 30,932 69,176 58,661
Total revenue 453,021 415,883 900,883 827,249
Costs and expenses:Cost of product and maintenance 42,960 31,715 87,141 73,774 Cost of services 18,823 20,040 36,696 38,566 Marketing and sales 101,110 96,662 200,310 196,930 Research and development 182,371 157,974 362,277 320,970 General and administrative 36,388 27,467 64,688 55,109 Amortization of acquired intangibles 4,537 6,119 10,317 12,350 Restructuring and other charges (credits) (74) (498) 14,512 3,861
Total costs and expenses 386,115 339,479 775,941 701,560
Income from operations 66,906 76,404 124,942 125,689
Interest expense (5,896) (8,180) (11,253) (19,934) Other income, net 2,842 1,347 7,605 6,128
Income before provision for income taxes 63,852 69,571 121,294 111,883
Provision for income taxes 14,517 11,411 21,397 17,464
Net income 49,335$ 58,160$ 99,897$ 94,419$
Net income per share - basic 0.17$ 0.20$ 0.34$ 0.33$
Net income per share - diluted 0.17$ 0.19$ 0.33$ 0.30$
Weighted average common shares outstanding - basic 288,191 285,297 292,403 284,910
Weighted average common shares outstanding - diluted 295,201 313,665 299,318 312,756
3
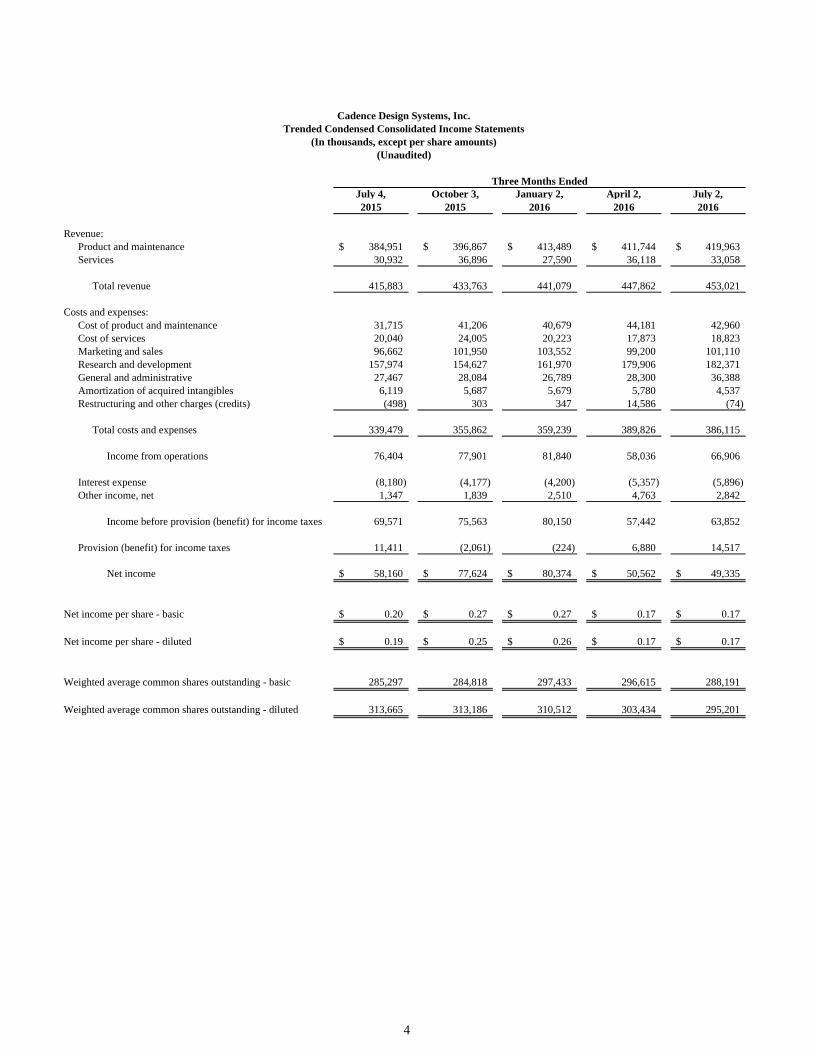
Cadence Design Systems, Inc.Trended Condensed Consolidated Income Statements
(In thousands, except per share amounts)(Unaudited)
Three Months EndedJuly 4, 2015
October 3, 2015
January 2, 2016
April 2, 2016
July 2, 2016
Revenue:Product and maintenance 384,951$ 396,867$ 413,489$ 411,744$ 419,963$ Services 30,932 36,896 27,590 36,118 33,058
Total revenue 415,883 433,763 441,079 447,862 453,021
Costs and expenses:Cost of product and maintenance 31,715 41,206 40,679 44,181 42,960 Cost of services 20,040 24,005 20,223 17,873 18,823 Marketing and sales 96,662 101,950 103,552 99,200 101,110 Research and development 157,974 154,627 161,970 179,906 182,371 General and administrative 27,467 28,084 26,789 28,300 36,388 Amortization of acquired intangibles 6,119 5,687 5,679 5,780 4,537 Restructuring and other charges (credits) (498) 303 347 14,586 (74)
Total costs and expenses 339,479 355,862 359,239 389,826 386,115
Income from operations 76,404 77,901 81,840 58,036 66,906
Interest expense (8,180) (4,177) (4,200) (5,357) (5,896) Other income, net 1,347 1,839 2,510 4,763 2,842
Income before provision (benefit) for income taxes 69,571 75,563 80,150 57,442 63,852
Provision (benefit) for income taxes 11,411 (2,061) (224) 6,880 14,517
Net income 58,160$ 77,624$ 80,374$ 50,562$ 49,335$
Net income per share - basic 0.20$ 0.27$ 0.27$ 0.17$ 0.17$
Net income per share - diluted 0.19$ 0.25$ 0.26$ 0.17$ 0.17$
Weighted average common shares outstanding - basic 285,297 284,818 297,433 296,615 288,191
Weighted average common shares outstanding - diluted 313,665 313,186 310,512 303,434 295,201
4
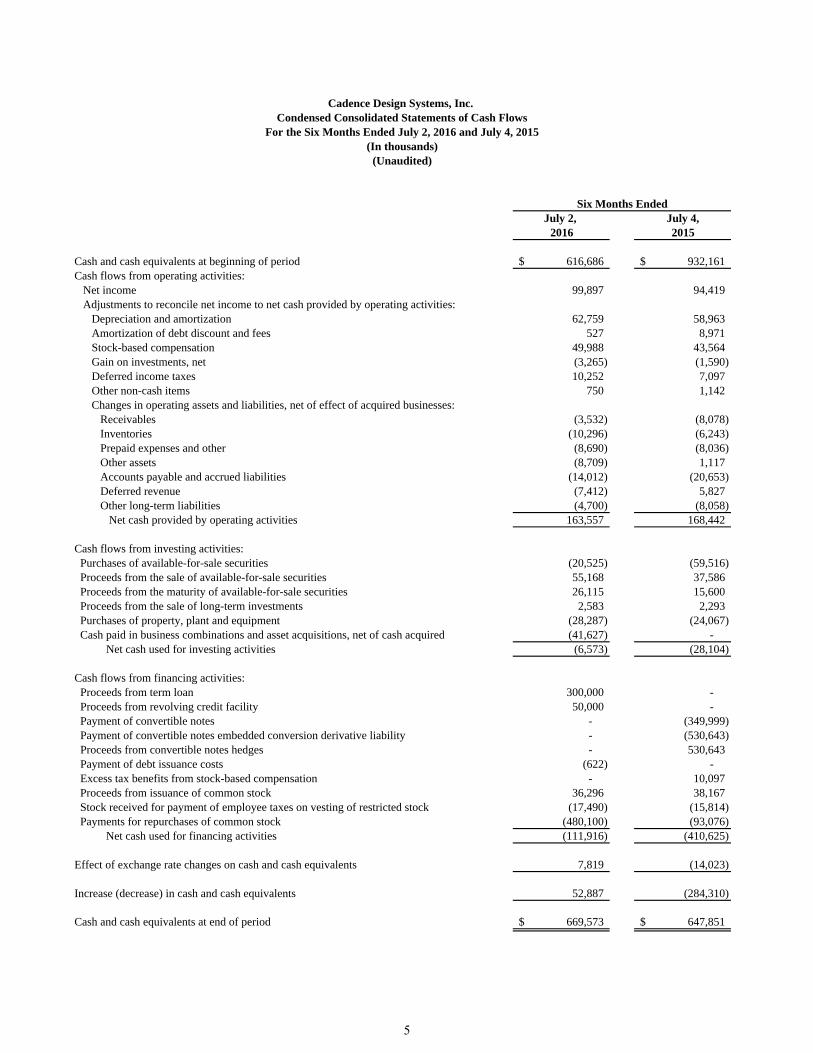
July 2, July 4,2016 2015
Cash and cash equivalents at beginning of period 616,686$ 932,161$ Cash flows from operating activities: Net income 99,897 94,419 Adjustments to reconcile net income to net cash provided by operating activities: Depreciation and amortization 62,759 58,963 Amortization of debt discount and fees 527 8,971 Stock-based compensation 49,988 43,564 Gain on investments, net (3,265) (1,590) Deferred income taxes 10,252 7,097 Other non-cash items 750 1,142 Changes in operating assets and liabilities, net of effect of acquired businesses: Receivables (3,532) (8,078) Inventories (10,296) (6,243) Prepaid expenses and other (8,690) (8,036) Other assets (8,709) 1,117 Accounts payable and accrued liabilities (14,012) (20,653) Deferred revenue (7,412) 5,827 Other long-term liabilities (4,700) (8,058) Net cash provided by operating activities 163,557 168,442
Cash flows from investing activities: Purchases of available-for-sale securities (20,525) (59,516) Proceeds from the sale of available-for-sale securities 55,168 37,586 Proceeds from the maturity of available-for-sale securities 26,115 15,600 Proceeds from the sale of long-term investments 2,583 2,293 Purchases of property, plant and equipment (28,287) (24,067) Cash paid in business combinations and asset acquisitions, net of cash acquired (41,627) - Net cash used for investing activities (6,573) (28,104)
Cash flows from financing activities: Proceeds from term loan 300,000 - Proceeds from revolving credit facility 50,000 - Payment of convertible notes - (349,999) Payment of convertible notes embedded conversion derivative liability - (530,643) Proceeds from convertible notes hedges - 530,643 Payment of debt issuance costs (622) - Excess tax benefits from stock-based compensation - 10,097 Proceeds from issuance of common stock 36,296 38,167 Stock received for payment of employee taxes on vesting of restricted stock (17,490) (15,814) Payments for repurchases of common stock (480,100) (93,076) Net cash used for financing activities (111,916) (410,625)
Effect of exchange rate changes on cash and cash equivalents 7,819 (14,023)
Increase (decrease) in cash and cash equivalents 52,887 (284,310)
Cash and cash equivalents at end of period 669,573$ 647,851$
Six Months Ended
Cadence Design Systems, Inc. Condensed Consolidated Statements of Cash Flows
For the Six Months Ended July 2, 2016 and July 4, 2015(In thousands)
(Unaudited)
5
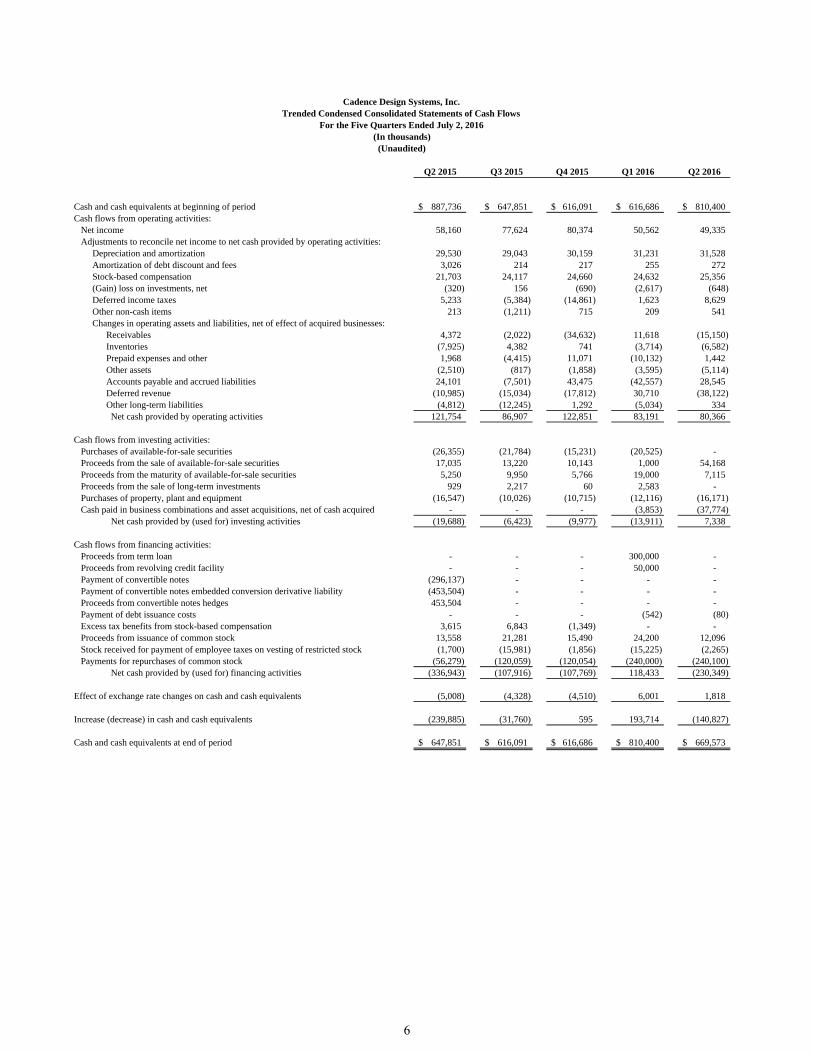
Q2 2015 Q3 2015 Q4 2015 Q1 2016 Q2 2016
Cash and cash equivalents at beginning of period 887,736$ 647,851$ 616,091$ 616,686$ 810,400$ Cash flows from operating activities: Net income 58,160 77,624 80,374 50,562 49,335 Adjustments to reconcile net income to net cash provided by operating activities: Depreciation and amortization 29,530 29,043 30,159 31,231 31,528 Amortization of debt discount and fees 3,026 214 217 255 272 Stock-based compensation 21,703 24,117 24,660 24,632 25,356 (Gain) loss on investments, net (320) 156 (690) (2,617) (648) Deferred income taxes 5,233 (5,384) (14,861) 1,623 8,629 Other non-cash items 213 (1,211) 715 209 541 Changes in operating assets and liabilities, net of effect of acquired businesses: Receivables 4,372 (2,022) (34,632) 11,618 (15,150) Inventories (7,925) 4,382 741 (3,714) (6,582) Prepaid expenses and other 1,968 (4,415) 11,071 (10,132) 1,442 Other assets (2,510) (817) (1,858) (3,595) (5,114) Accounts payable and accrued liabilities 24,101 (7,501) 43,475 (42,557) 28,545 Deferred revenue (10,985) (15,034) (17,812) 30,710 (38,122) Other long-term liabilities (4,812) (12,245) 1,292 (5,034) 334 Net cash provided by operating activities 121,754 86,907 122,851 83,191 80,366
Cash flows from investing activities: Purchases of available-for-sale securities (26,355) (21,784) (15,231) (20,525) - Proceeds from the sale of available-for-sale securities 17,035 13,220 10,143 1,000 54,168 Proceeds from the maturity of available-for-sale securities 5,250 9,950 5,766 19,000 7,115 Proceeds from the sale of long-term investments 929 2,217 60 2,583 - Purchases of property, plant and equipment (16,547) (10,026) (10,715) (12,116) (16,171) Cash paid in business combinations and asset acquisitions, net of cash acquired - - - (3,853) (37,774) Net cash provided by (used for) investing activities (19,688) (6,423) (9,977) (13,911) 7,338
Cash flows from financing activities: Proceeds from term loan - - - 300,000 - Proceeds from revolving credit facility - - - 50,000 - Payment of convertible notes (296,137) - - - - Payment of convertible notes embedded conversion derivative liability (453,504) - - - - Proceeds from convertible notes hedges 453,504 - - - - Payment of debt issuance costs - - - (542) (80) Excess tax benefits from stock-based compensation 3,615 6,843 (1,349) - - Proceeds from issuance of common stock 13,558 21,281 15,490 24,200 12,096 Stock received for payment of employee taxes on vesting of restricted stock (1,700) (15,981) (1,856) (15,225) (2,265) Payments for repurchases of common stock (56,279) (120,059) (120,054) (240,000) (240,100) Net cash provided by (used for) financing activities (336,943) (107,916) (107,769) 118,433 (230,349)
Effect of exchange rate changes on cash and cash equivalents (5,008) (4,328) (4,510) 6,001 1,818
Increase (decrease) in cash and cash equivalents (239,885) (31,760) 595 193,714 (140,827)
Cash and cash equivalents at end of period 647,851$ 616,091$ 616,686$ 810,400$ 669,573$
Cadence Design Systems, Inc.Trended Condensed Consolidated Statements of Cash Flows
For the Five Quarters Ended July 2, 2016(In thousands)
(Unaudited)
6
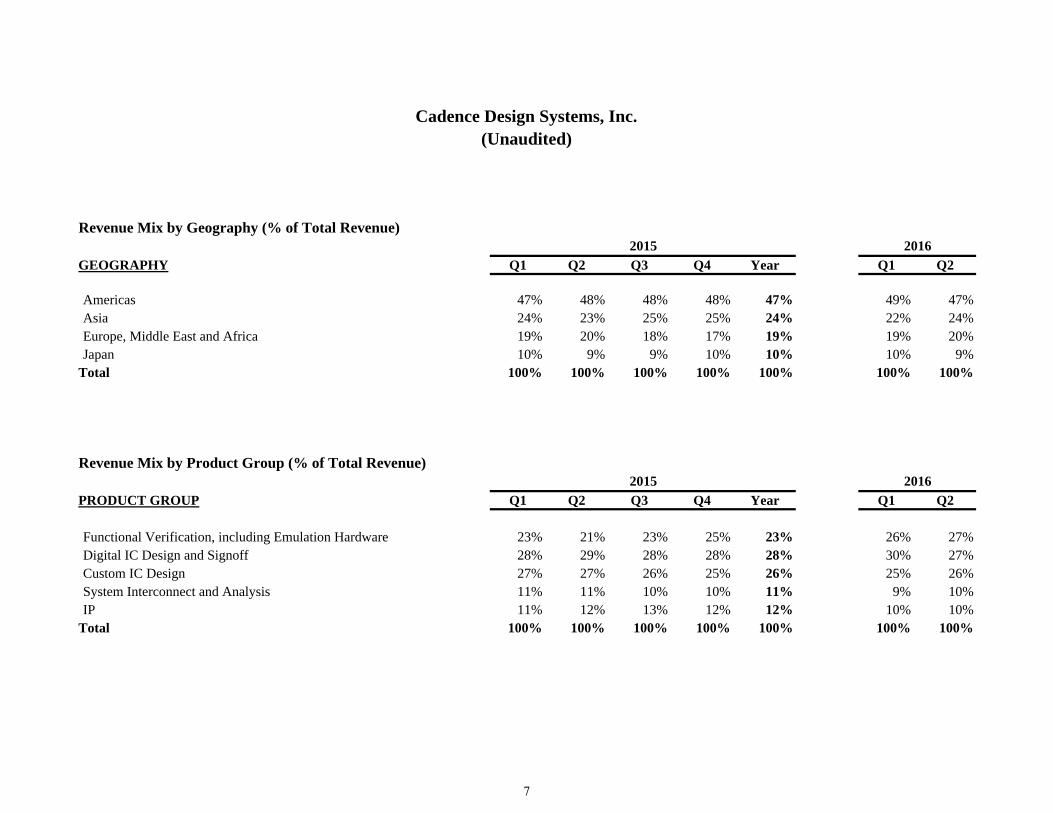
Revenue Mix by Geography (% of Total Revenue)2015 2016
GEOGRAPHY Q1 Q2 Q3 Q4 Year Q1 Q2
Americas 47% 48% 48% 48% 47% 49% 47%Asia 24% 23% 25% 25% 24% 22% 24%Europe, Middle East and Africa 19% 20% 18% 17% 19% 19% 20%Japan 10% 9% 9% 10% 10% 10% 9%
Total 100% 100% 100% 100% 100% 100% 100%
Revenue Mix by Product Group (% of Total Revenue)2015 2016
PRODUCT GROUP Q1 Q2 Q3 Q4 Year Q1 Q2
Functional Verification, including Emulation Hardware 23% 21% 23% 25% 23% 26% 27%Digital IC Design and Signoff 28% 29% 28% 28% 28% 30% 27%Custom IC Design 27% 27% 26% 25% 26% 25% 26%System Interconnect and Analysis 11% 11% 10% 10% 11% 9% 10%IP 11% 12% 13% 12% 12% 10% 10%
Total 100% 100% 100% 100% 100% 100% 100%
Cadence Design Systems, Inc.(Unaudited)
7
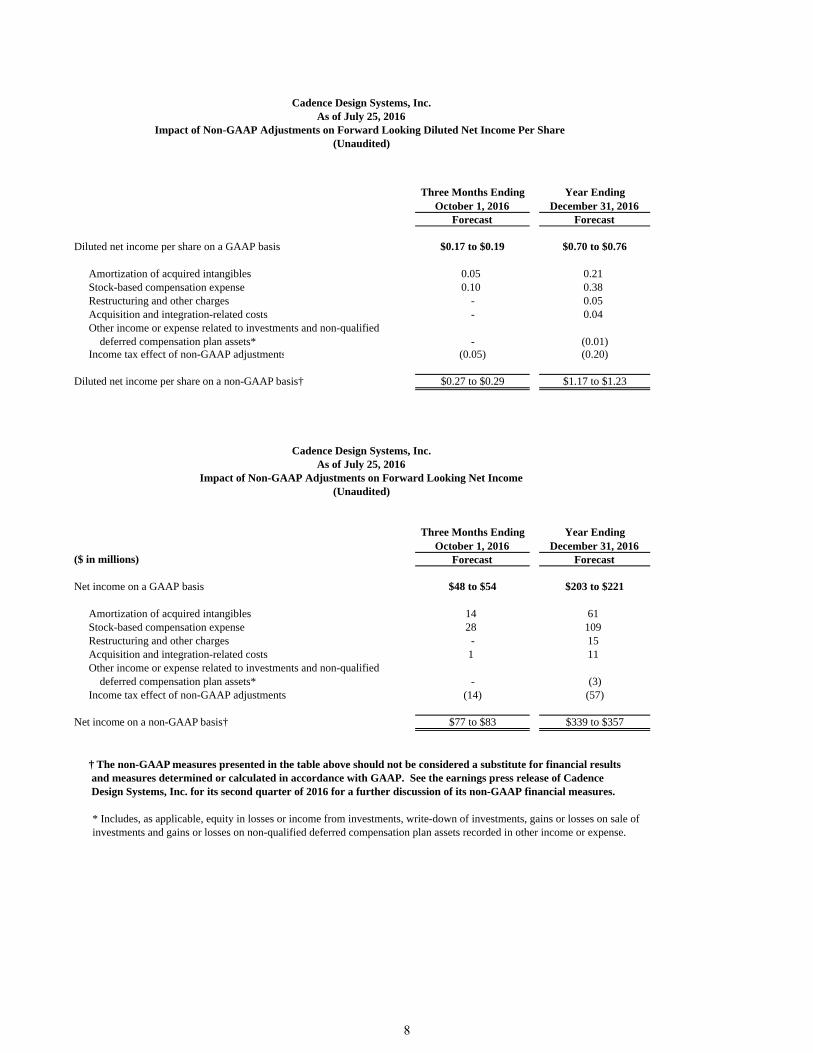
Cadence Design Systems, Inc.As of July 25, 2016
Impact of Non-GAAP Adjustments on Forward Looking Diluted Net Income Per Share (Unaudited)
Three Months Ending Year EndingOctober 1, 2016 December 31, 2016
Forecast Forecast
Diluted net income per share on a GAAP basis $0.17 to $0.19 $0.70 to $0.76
Amortization of acquired intangibles 0.05 0.21Stock-based compensation expense 0.10 0.38Restructuring and other charges - 0.05Acquisition and integration-related costs - 0.04Other income or expense related to investments and non-qualified deferred compensation plan assets* - (0.01)Income tax effect of non-GAAP adjustments (0.05) (0.20)
Diluted net income per share on a non-GAAP basis† $0.27 to $0.29 $1.17 to $1.23
Cadence Design Systems, Inc.As of July 25, 2016
Impact of Non-GAAP Adjustments on Forward Looking Net Income(Unaudited)
Three Months Ending Year EndingOctober 1, 2016 December 31, 2016
($ in millions) Forecast Forecast
Net income on a GAAP basis $48 to $54 $203 to $221
Amortization of acquired intangibles 14 61Stock-based compensation expense 28 109Restructuring and other charges - 15Acquisition and integration-related costs 1 11Other income or expense related to investments and non-qualified deferred compensation plan assets* - (3)Income tax effect of non-GAAP adjustments (14) (57)
Net income on a non-GAAP basis† $77 to $83 $339 to $357
† The non-GAAP measures presented in the table above should not be considered a substitute for financial results and measures determined or calculated in accordance with GAAP. See the earnings press release of Cadence Design Systems, Inc. for its second quarter of 2016 for a further discussion of its non-GAAP financial measures.
* Includes, as applicable, equity in losses or income from investments, write-down of investments, gains or losses on sale of investments and gains or losses on non-qualified deferred compensation plan assets recorded in other income or expense.
8
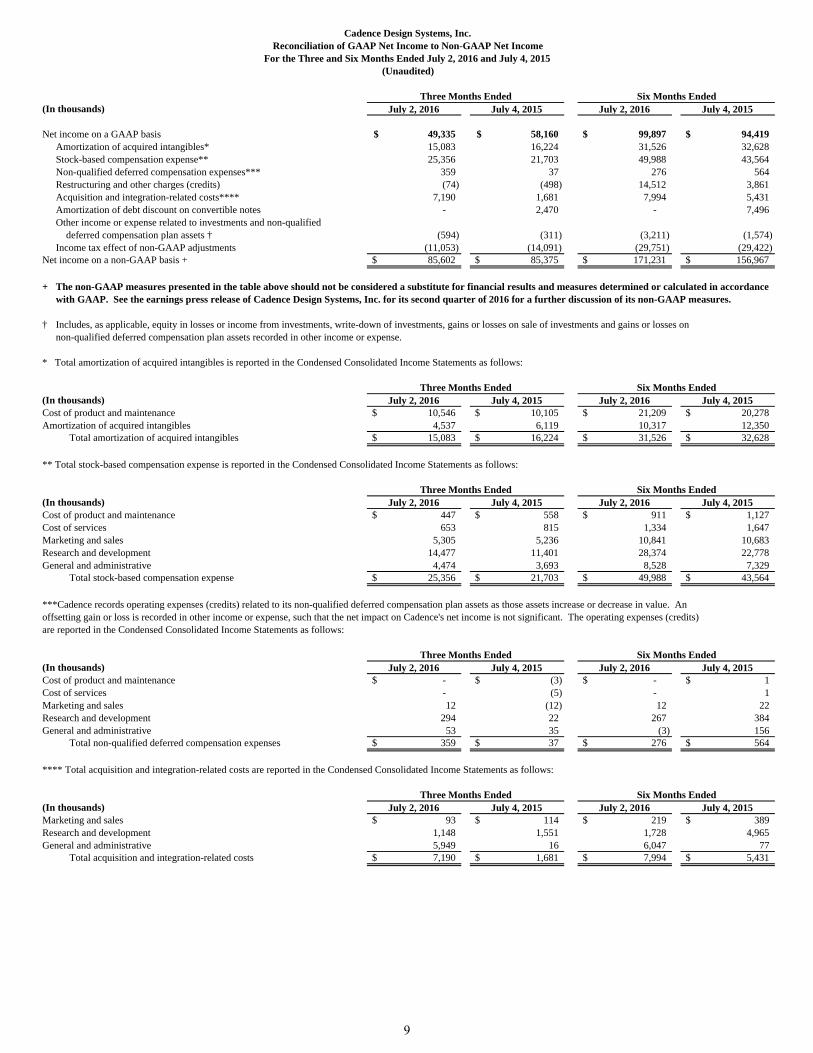
Cadence Design Systems, Inc.Reconciliation of GAAP Net Income to Non-GAAP Net Income
For the Three and Six Months Ended July 2, 2016 and July 4, 2015(Unaudited)
Three Months Ended Six Months Ended(In thousands) July 2, 2016 July 4, 2015 July 2, 2016 July 4, 2015
Net income on a GAAP basis 49,335$ 58,160$ 99,897$ 94,419$ Amortization of acquired intangibles* 15,083 16,224 31,526 32,628 Stock-based compensation expense** 25,356 21,703 49,988 43,564 Non-qualified deferred compensation expenses*** 359 37 276 564 Restructuring and other charges (credits) (74) (498) 14,512 3,861 Acquisition and integration-related costs**** 7,190 1,681 7,994 5,431 Amortization of debt discount on convertible notes - 2,470 - 7,496 Other income or expense related to investments and non-qualified deferred compensation plan assets † (594) (311) (3,211) (1,574) Income tax effect of non-GAAP adjustments (11,053) (14,091) (29,751) (29,422)
Net income on a non-GAAP basis + 85,602$ 85,375$ 171,231$ 156,967$
+ The non-GAAP measures presented in the table above should not be considered a substitute for financial results and measures determined or calculated in accordancewith GAAP. See the earnings press release of Cadence Design Systems, Inc. for its second quarter of 2016 for a further discussion of its non-GAAP measures.
† Includes, as applicable, equity in losses or income from investments, write-down of investments, gains or losses on sale of investments and gains or losses on non-qualified deferred compensation plan assets recorded in other income or expense.
* Total amortization of acquired intangibles is reported in the Condensed Consolidated Income Statements as follows:
Three Months Ended Six Months Ended(In thousands) July 2, 2016 July 4, 2015 July 2, 2016 July 4, 2015Cost of product and maintenance 10,546$ 10,105$ 21,209$ 20,278$ Amortization of acquired intangibles 4,537 6,119 10,317 12,350
Total amortization of acquired intangibles 15,083$ 16,224$ 31,526$ 32,628$
** Total stock-based compensation expense is reported in the Condensed Consolidated Income Statements as follows:
Three Months Ended Six Months Ended(In thousands) July 2, 2016 July 4, 2015 July 2, 2016 July 4, 2015Cost of product and maintenance 447$ 558$ 911$ 1,127$ Cost of services 653 815 1,334 1,647 Marketing and sales 5,305 5,236 10,841 10,683 Research and development 14,477 11,401 28,374 22,778 General and administrative 4,474 3,693 8,528 7,329
Total stock-based compensation expense 25,356$ 21,703$ 49,988$ 43,564$
***Cadence records operating expenses (credits) related to its non-qualified deferred compensation plan assets as those assets increase or decrease in value. Anoffsetting gain or loss is recorded in other income or expense, such that the net impact on Cadence's net income is not significant. The operating expenses (credits)are reported in the Condensed Consolidated Income Statements as follows:
Three Months Ended Six Months Ended(In thousands) July 2, 2016 July 4, 2015 July 2, 2016 July 4, 2015Cost of product and maintenance -$ (3)$ -$ 1$ Cost of services - (5) - 1 Marketing and sales 12 (12) 12 22 Research and development 294 22 267 384 General and administrative 53 35 (3) 156
Total non-qualified deferred compensation expenses 359$ 37$ 276$ 564$
**** Total acquisition and integration-related costs are reported in the Condensed Consolidated Income Statements as follows:
Three Months Ended Six Months Ended(In thousands) July 2, 2016 July 4, 2015 July 2, 2016 July 4, 2015Marketing and sales 93$ 114$ 219$ 389$ Research and development 1,148 1,551 1,728 4,965 General and administrative 5,949 16 6,047 77
Total acquisition and integration-related costs 7,190$ 1,681$ 7,994$ 5,431$
9
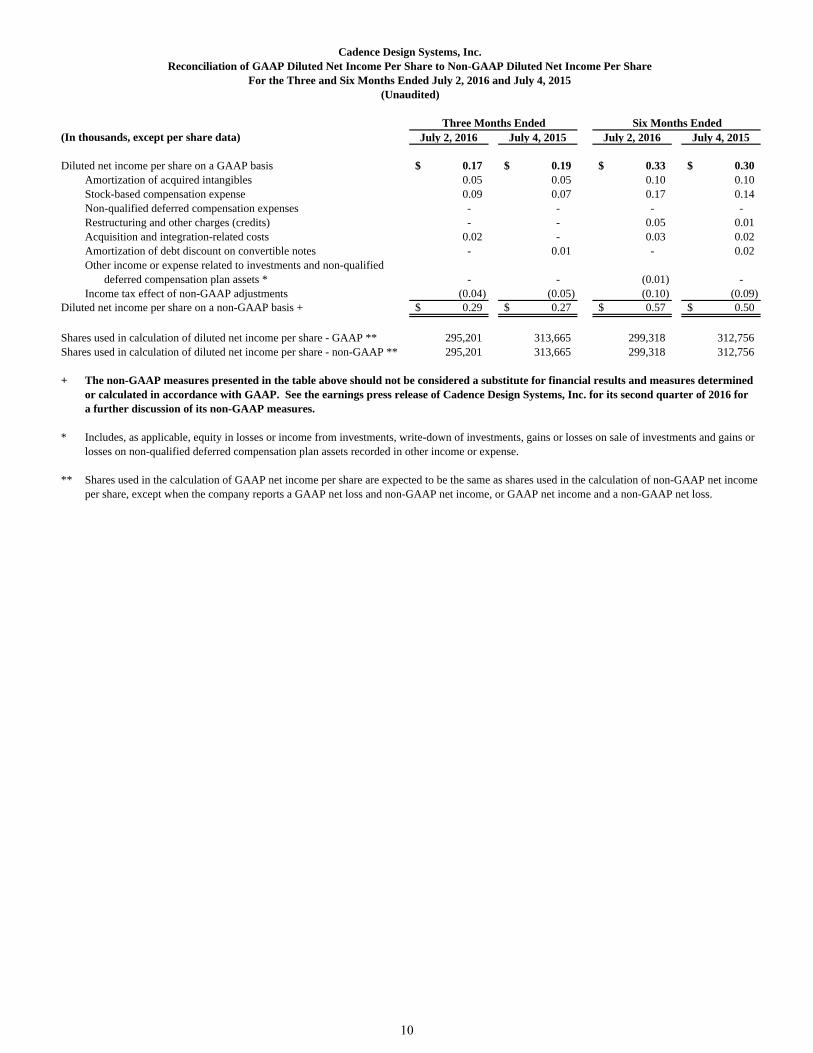
Cadence Design Systems, Inc.Reconciliation of GAAP Diluted Net Income Per Share to Non-GAAP Diluted Net Income Per Share
For the Three and Six Months Ended July 2, 2016 and July 4, 2015(Unaudited)
Three Months Ended Six Months Ended(In thousands, except per share data) July 2, 2016 July 4, 2015 July 2, 2016 July 4, 2015
Diluted net income per share on a GAAP basis 0.17$ 0.19$ 0.33$ 0.30$ Amortization of acquired intangibles 0.05 0.05 0.10 0.10 Stock-based compensation expense 0.09 0.07 0.17 0.14 Non-qualified deferred compensation expenses - - - - Restructuring and other charges (credits) - - 0.05 0.01 Acquisition and integration-related costs 0.02 - 0.03 0.02 Amortization of debt discount on convertible notes - 0.01 - 0.02 Other income or expense related to investments and non-qualified
deferred compensation plan assets * - - (0.01) - Income tax effect of non-GAAP adjustments (0.04) (0.05) (0.10) (0.09)
Diluted net income per share on a non-GAAP basis + 0.29$ 0.27$ 0.57$ 0.50$
Shares used in calculation of diluted net income per share - GAAP ** 295,201 313,665 299,318 312,756 Shares used in calculation of diluted net income per share - non-GAAP ** 295,201 313,665 299,318 312,756
+ The non-GAAP measures presented in the table above should not be considered a substitute for financial results and measures determined or calculated in accordance with GAAP. See the earnings press release of Cadence Design Systems, Inc. for its second quarter of 2016 fora further discussion of its non-GAAP measures.
* Includes, as applicable, equity in losses or income from investments, write-down of investments, gains or losses on sale of investments and gains or losses on non-qualified deferred compensation plan assets recorded in other income or expense.
** Shares used in the calculation of GAAP net income per share are expected to be the same as shares used in the calculation of non-GAAP net incomeper share, except when the company reports a GAAP net loss and non-GAAP net income, or GAAP net income and a non-GAAP net loss.
10
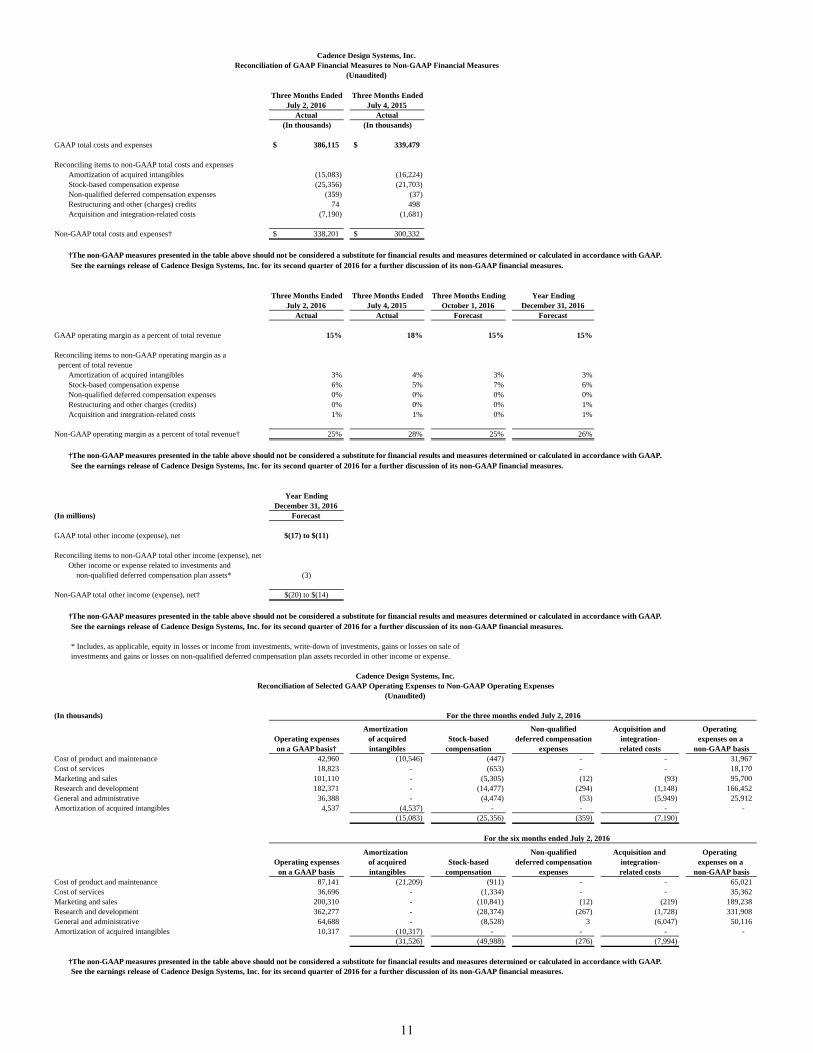
Three Months Ended Three Months EndedJuly 2, 2016 July 4, 2015
Actual Actual (In thousands) (In thousands)
GAAP total costs and expenses 386,115$ 339,479$
Reconciling items to non-GAAP total costs and expensesAmortization of acquired intangibles (15,083) (16,224) Stock-based compensation expense (25,356) (21,703) Non-qualified deferred compensation expenses (359) (37) Restructuring and other (charges) credits 74 498 Acquisition and integration-related costs (7,190) (1,681)
Non-GAAP total costs and expenses† 338,201$ 300,332$
†The non-GAAP measures presented in the table above should not be considered a substitute for financial results and measures determined or calculated in accordance with GAAP. See the earnings release of Cadence Design Systems, Inc. for its second quarter of 2016 for a further discussion of its non-GAAP financial measures.
Three Months Ended Three Months Ended Three Months Ending Year EndingJuly 2, 2016 July 4, 2015 October 1, 2016 December 31, 2016
Actual Actual Forecast Forecast
GAAP operating margin as a percent of total revenue 15% 18% 15% 15%
Reconciling items to non-GAAP operating margin as a percent of total revenue
Amortization of acquired intangibles 3% 4% 3% 3%Stock-based compensation expense 6% 5% 7% 6%Non-qualified deferred compensation expenses 0% 0% 0% 0%Restructuring and other charges (credits) 0% 0% 0% 1%Acquisition and integration-related costs 1% 1% 0% 1%
Non-GAAP operating margin as a percent of total revenue† 25% 28% 25% 26%
†The non-GAAP measures presented in the table above should not be considered a substitute for financial results and measures determined or calculated in accordance with GAAP. See the earnings release of Cadence Design Systems, Inc. for its second quarter of 2016 for a further discussion of its non-GAAP financial measures.
Year EndingDecember 31, 2016
(In millions) Forecast
GAAP total other income (expense), net $(17) to $(11)
Reconciling items to non-GAAP total other income (expense), netOther income or expense related to investments and non-qualified deferred compensation plan assets* (3)
Non-GAAP total other income (expense), net† $(20) to $(14)
†The non-GAAP measures presented in the table above should not be considered a substitute for financial results and measures determined or calculated in accordance with GAAP. See the earnings release of Cadence Design Systems, Inc. for its second quarter of 2016 for a further discussion of its non-GAAP financial measures.
* Includes, as applicable, equity in losses or income from investments, write-down of investments, gains or losses on sale of investments and gains or losses on non-qualified deferred compensation plan assets recorded in other income or expense.
Cadence Design Systems, Inc.Reconciliation of Selected GAAP Operating Expenses to Non-GAAP Operating Expenses
(Unaudited)
(In thousands)
Amortization Non-qualified Acquisition and Operating Operating expenses of acquired Stock-based deferred compensation integration- expenses on a on a GAAP basis† intangibles compensation expenses related costs non-GAAP basis
Cost of product and maintenance 42,960 (10,546) (447) - - 31,967 Cost of services 18,823 - (653) - - 18,170 Marketing and sales 101,110 - (5,305) (12) (93) 95,700 Research and development 182,371 - (14,477) (294) (1,148) 166,452 General and administrative 36,388 - (4,474) (53) (5,949) 25,912 Amortization of acquired intangibles 4,537 (4,537) - - - -
(15,083) (25,356) (359) (7,190)
Amortization Non-qualified Acquisition and Operating Operating expenses of acquired Stock-based deferred compensation integration- expenses on a
on a GAAP basis intangibles compensation expenses related costs non-GAAP basisCost of product and maintenance 87,141 (21,209) (911) - - 65,021 Cost of services 36,696 - (1,334) - - 35,362 Marketing and sales 200,310 - (10,841) (12) (219) 189,238 Research and development 362,277 - (28,374) (267) (1,728) 331,908 General and administrative 64,688 - (8,528) 3 (6,047) 50,116 Amortization of acquired intangibles 10,317 (10,317) - - - -
(31,526) (49,988) (276) (7,994)
†The non-GAAP measures presented in the table above should not be considered a substitute for financial results and measures determined or calculated in accordance with GAAP. See the earnings release of Cadence Design Systems, Inc. for its second quarter of 2016 for a further discussion of its non-GAAP financial measures.
Cadence Design Systems, Inc.Reconciliation of GAAP Financial Measures to Non-GAAP Financial Measures
(Unaudited)
For the three months ended July 2, 2016
For the six months ended July 2, 2016
11
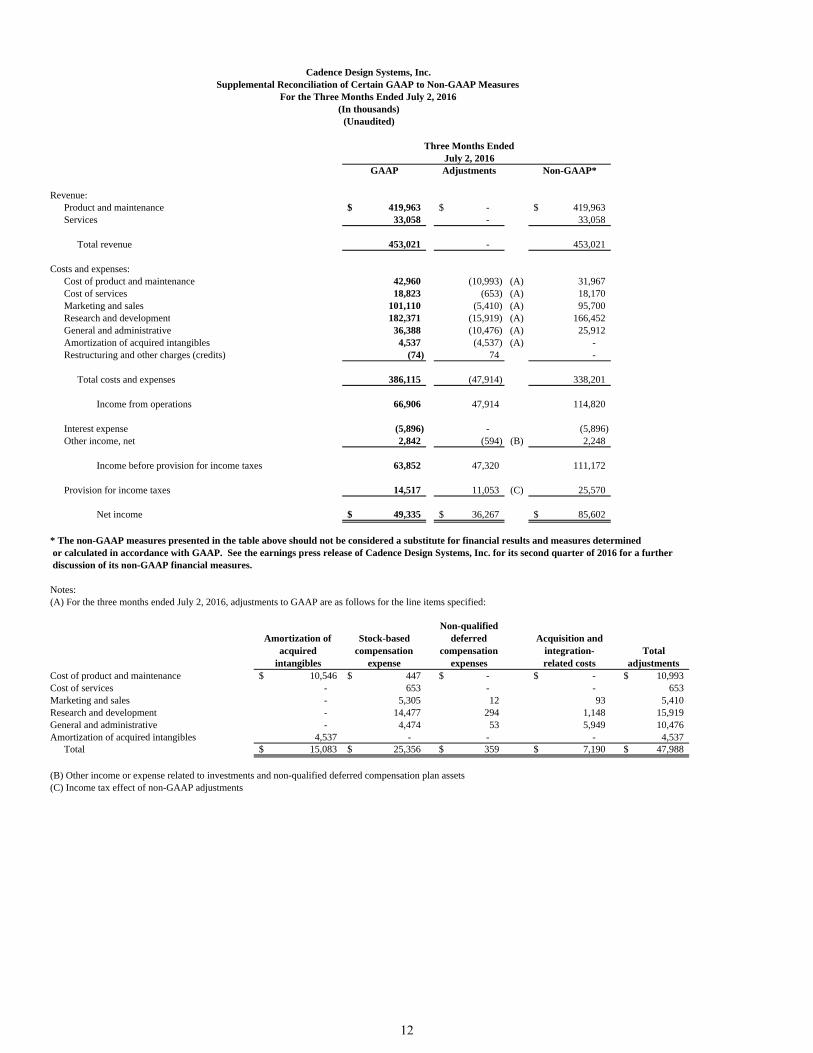
Three Months EndedJuly 2, 2016
GAAP Adjustments Non-GAAP*
Revenue:Product and maintenance 419,963$ -$ 419,963$ Services 33,058 - 33,058
Total revenue 453,021 - 453,021
Costs and expenses:Cost of product and maintenance 42,960 (10,993) (A) 31,967 Cost of services 18,823 (653) (A) 18,170 Marketing and sales 101,110 (5,410) (A) 95,700 Research and development 182,371 (15,919) (A) 166,452 General and administrative 36,388 (10,476) (A) 25,912 Amortization of acquired intangibles 4,537 (4,537) (A) - Restructuring and other charges (credits) (74) 74 -
Total costs and expenses 386,115 (47,914) 338,201
Income from operations 66,906 47,914 114,820
Interest expense (5,896) - (5,896) Other income, net 2,842 (594) (B) 2,248
Income before provision for income taxes 63,852 47,320 111,172
Provision for income taxes 14,517 11,053 (C) 25,570
Net income 49,335$ 36,267$ 85,602$
* The non-GAAP measures presented in the table above should not be considered a substitute for financial results and measures determined or calculated in accordance with GAAP. See the earnings press release of Cadence Design Systems, Inc. for its second quarter of 2016 for a further discussion of its non-GAAP financial measures.
Notes: (A) For the three months ended July 2, 2016, adjustments to GAAP are as follows for the line items specified:
Amortization of acquired
intangibles
Stock-based compensation
expense
Non-qualified deferred
compensation expenses
Acquisition and integration-related costs
Total adjustments
Cost of product and maintenance 10,546$ 447$ -$ -$ 10,993$ Cost of services - 653 - - 653 Marketing and sales - 5,305 12 93 5,410 Research and development - 14,477 294 1,148 15,919 General and administrative - 4,474 53 5,949 10,476 Amortization of acquired intangibles 4,537 - - - 4,537
Total 15,083$ 25,356$ 359$ 7,190$ 47,988$
(B) Other income or expense related to investments and non-qualified deferred compensation plan assets(C) Income tax effect of non-GAAP adjustments
Cadence Design Systems, Inc.Supplemental Reconciliation of Certain GAAP to Non-GAAP Measures
For the Three Months Ended July 2, 2016(In thousands)
(Unaudited)
12
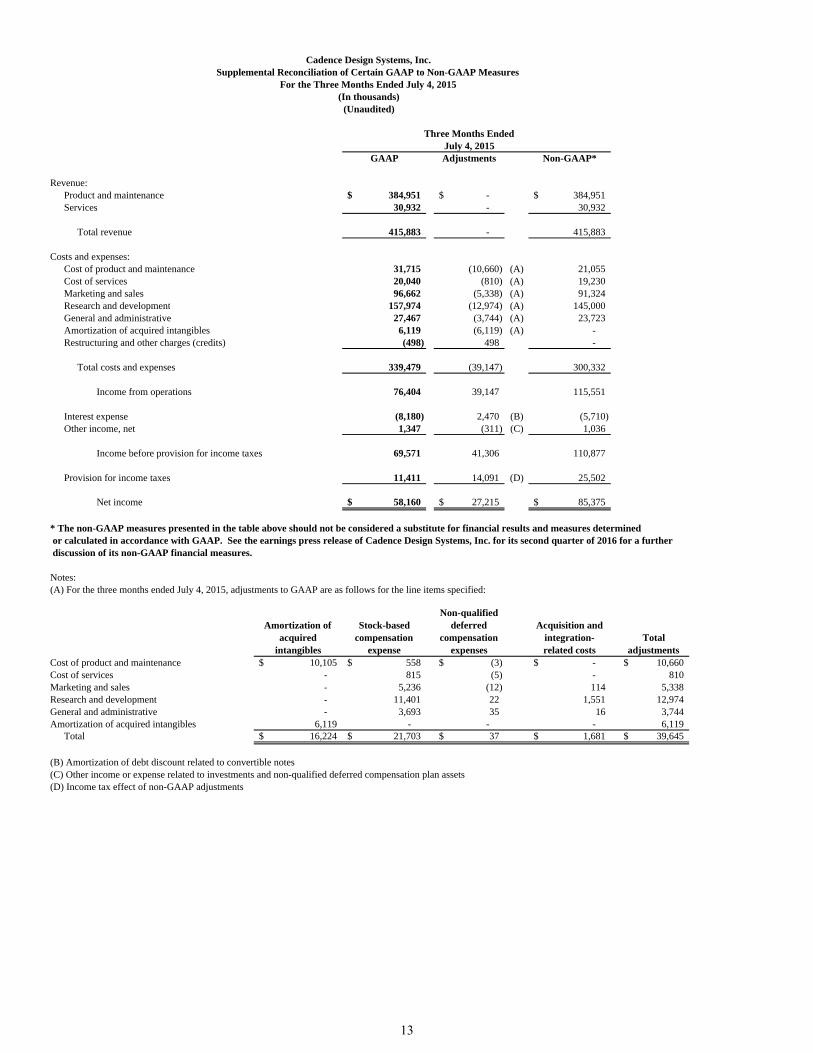
Three Months EndedJuly 4, 2015
GAAP Adjustments Non-GAAP*
Revenue:Product and maintenance 384,951$ -$ 384,951$ Services 30,932 - 30,932
Total revenue 415,883 - 415,883
Costs and expenses:Cost of product and maintenance 31,715 (10,660) (A) 21,055 Cost of services 20,040 (810) (A) 19,230 Marketing and sales 96,662 (5,338) (A) 91,324 Research and development 157,974 (12,974) (A) 145,000 General and administrative 27,467 (3,744) (A) 23,723 Amortization of acquired intangibles 6,119 (6,119) (A) - Restructuring and other charges (credits) (498) 498 -
Total costs and expenses 339,479 (39,147) 300,332
Income from operations 76,404 39,147 115,551
Interest expense (8,180) 2,470 (B) (5,710) Other income, net 1,347 (311) (C) 1,036
Income before provision for income taxes 69,571 41,306 110,877
Provision for income taxes 11,411 14,091 (D) 25,502
Net income 58,160$ 27,215$ 85,375$
* The non-GAAP measures presented in the table above should not be considered a substitute for financial results and measures determined or calculated in accordance with GAAP. See the earnings press release of Cadence Design Systems, Inc. for its second quarter of 2016 for a further discussion of its non-GAAP financial measures.
Notes: (A) For the three months ended July 4, 2015, adjustments to GAAP are as follows for the line items specified:
Amortization of acquired
intangibles
Stock-based compensation
expense
Non-qualified deferred
compensation expenses
Acquisition and integration-related costs
Total adjustments
Cost of product and maintenance 10,105$ 558$ (3)$ -$ 10,660$ Cost of services - 815 (5) - 810 Marketing and sales - 5,236 (12) 114 5,338 Research and development - 11,401 22 1,551 12,974 General and administrative - 3,693 35 16 3,744 Amortization of acquired intangibles 6,119 - - - 6,119
Total 16,224$ 21,703$ 37$ 1,681$ 39,645$
(B) Amortization of debt discount related to convertible notes(C) Other income or expense related to investments and non-qualified deferred compensation plan assets(D) Income tax effect of non-GAAP adjustments
Supplemental Reconciliation of Certain GAAP to Non-GAAP MeasuresFor the Three Months Ended July 4, 2015
(In thousands)(Unaudited)
Cadence Design Systems, Inc.
13
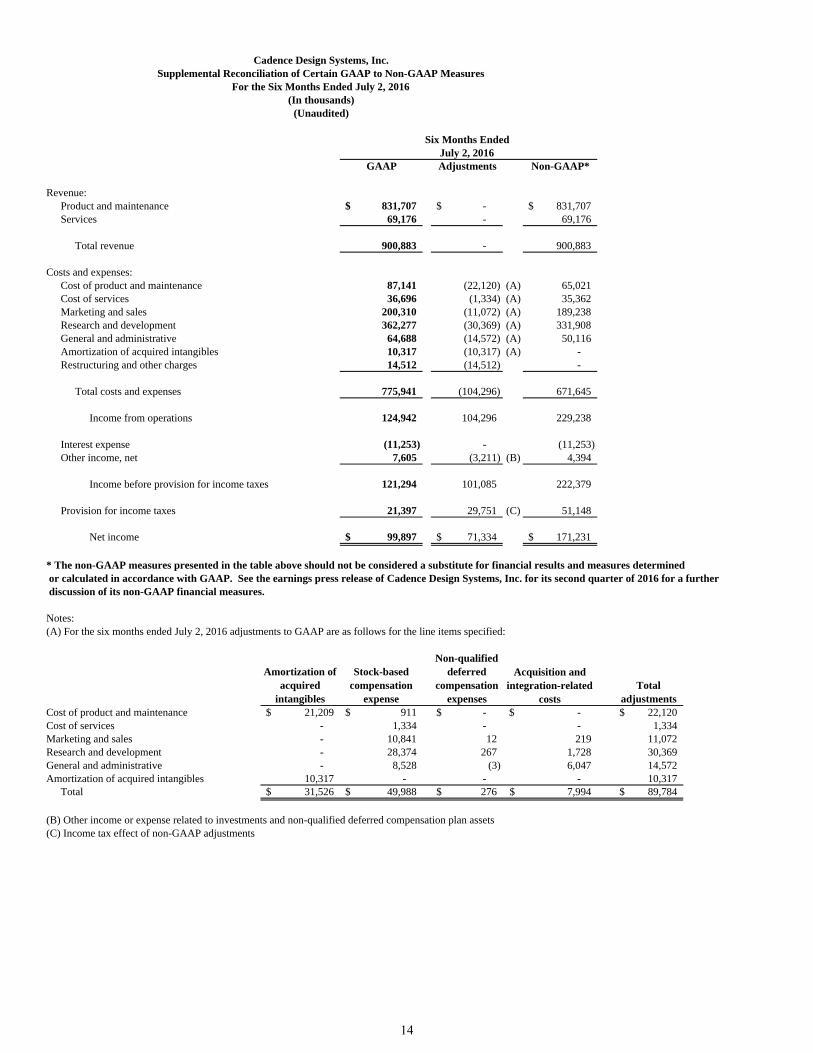
Six Months EndedJuly 2, 2016
GAAP Adjustments Non-GAAP*
Revenue:Product and maintenance 831,707$ -$ 831,707$ Services 69,176 - 69,176
Total revenue 900,883 - 900,883
Costs and expenses:Cost of product and maintenance 87,141 (22,120) (A) 65,021 Cost of services 36,696 (1,334) (A) 35,362 Marketing and sales 200,310 (11,072) (A) 189,238 Research and development 362,277 (30,369) (A) 331,908 General and administrative 64,688 (14,572) (A) 50,116 Amortization of acquired intangibles 10,317 (10,317) (A) - Restructuring and other charges 14,512 (14,512) -
Total costs and expenses 775,941 (104,296) 671,645
Income from operations 124,942 104,296 229,238
Interest expense (11,253) - (11,253) Other income, net 7,605 (3,211) (B) 4,394
Income before provision for income taxes 121,294 101,085 222,379
Provision for income taxes 21,397 29,751 (C) 51,148
Net income 99,897$ 71,334$ 171,231$
* The non-GAAP measures presented in the table above should not be considered a substitute for financial results and measures determined or calculated in accordance with GAAP. See the earnings press release of Cadence Design Systems, Inc. for its second quarter of 2016 for a further discussion of its non-GAAP financial measures.
Notes: (A) For the six months ended July 2, 2016 adjustments to GAAP are as follows for the line items specified:
Amortization of acquired
intangibles
Stock-based compensation
expense
Non-qualified deferred
compensation expenses
Total adjustments
Cost of product and maintenance 21,209$ 911$ -$ 22,120$ Cost of services - 1,334 - 1,334 Marketing and sales - 10,841 12 11,072 Research and development - 28,374 267 30,369 General and administrative - 8,528 (3) 14,572 Amortization of acquired intangibles 10,317 - - 10,317
Total 31,526$ 49,988$ 276$ 89,784$
(B) Other income or expense related to investments and non-qualified deferred compensation plan assets(C) Income tax effect of non-GAAP adjustments
Acquisition and integration-related
costs
Cadence Design Systems, Inc.Supplemental Reconciliation of Certain GAAP to Non-GAAP Measures
For the Six Months Ended July 2, 2016(In thousands)
(Unaudited)
-$ - 219
1,728 6,047
- 7,994$
14
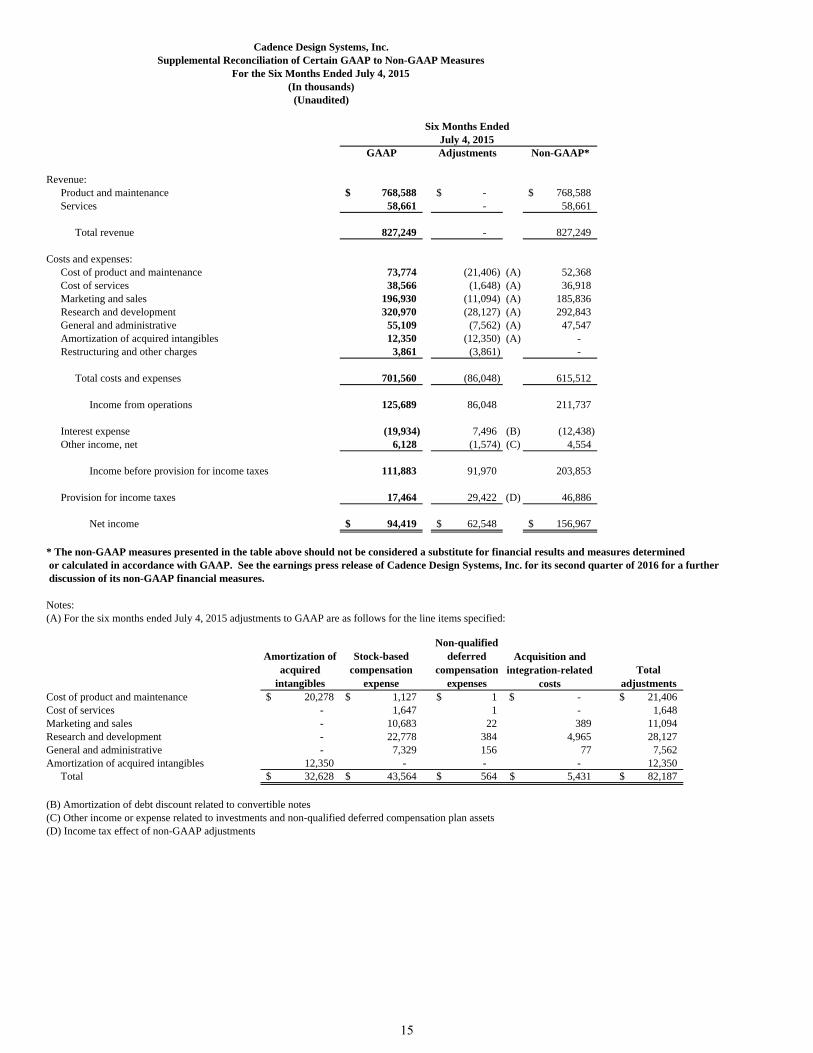
Six Months EndedJuly 4, 2015
GAAP Adjustments Non-GAAP*
Revenue:Product and maintenance 768,588$ -$ 768,588$ Services 58,661 - 58,661
Total revenue 827,249 - 827,249
Costs and expenses:Cost of product and maintenance 73,774 (21,406) (A) 52,368 Cost of services 38,566 (1,648) (A) 36,918 Marketing and sales 196,930 (11,094) (A) 185,836 Research and development 320,970 (28,127) (A) 292,843 General and administrative 55,109 (7,562) (A) 47,547 Amortization of acquired intangibles 12,350 (12,350) (A) - Restructuring and other charges 3,861 (3,861) -
Total costs and expenses 701,560 (86,048) 615,512
Income from operations 125,689 86,048 211,737
Interest expense (19,934) 7,496 (B) (12,438) Other income, net 6,128 (1,574) (C) 4,554
Income before provision for income taxes 111,883 91,970 203,853
Provision for income taxes 17,464 29,422 (D) 46,886
Net income 94,419$ 62,548$ 156,967$
* The non-GAAP measures presented in the table above should not be considered a substitute for financial results and measures determined or calculated in accordance with GAAP. See the earnings press release of Cadence Design Systems, Inc. for its second quarter of 2016 for a further discussion of its non-GAAP financial measures.
Notes: (A) For the six months ended July 4, 2015 adjustments to GAAP are as follows for the line items specified:
Amortization of acquired
intangibles
Stock-based compensation
expense
Non-qualified deferred
compensation expenses
Total adjustments
Cost of product and maintenance 20,278$ 1,127$ 1$ 21,406$ Cost of services - 1,647 1 1,648 Marketing and sales - 10,683 22 11,094 Research and development - 22,778 384 28,127 General and administrative - 7,329 156 7,562 Amortization of acquired intangibles 12,350 - - 12,350
Total 32,628$ 43,564$ 564$ 82,187$
(B) Amortization of debt discount related to convertible notes(C) Other income or expense related to investments and non-qualified deferred compensation plan assets(D) Income tax effect of non-GAAP adjustments
(Unaudited)
Cadence Design Systems, Inc.Supplemental Reconciliation of Certain GAAP to Non-GAAP Measures
For the Six Months Ended July 4, 2015(In thousands)
- 5,431$
Acquisition and integration-related
costs-$ - 389
4,965 77
15