Embed Size (px)
Citation preview
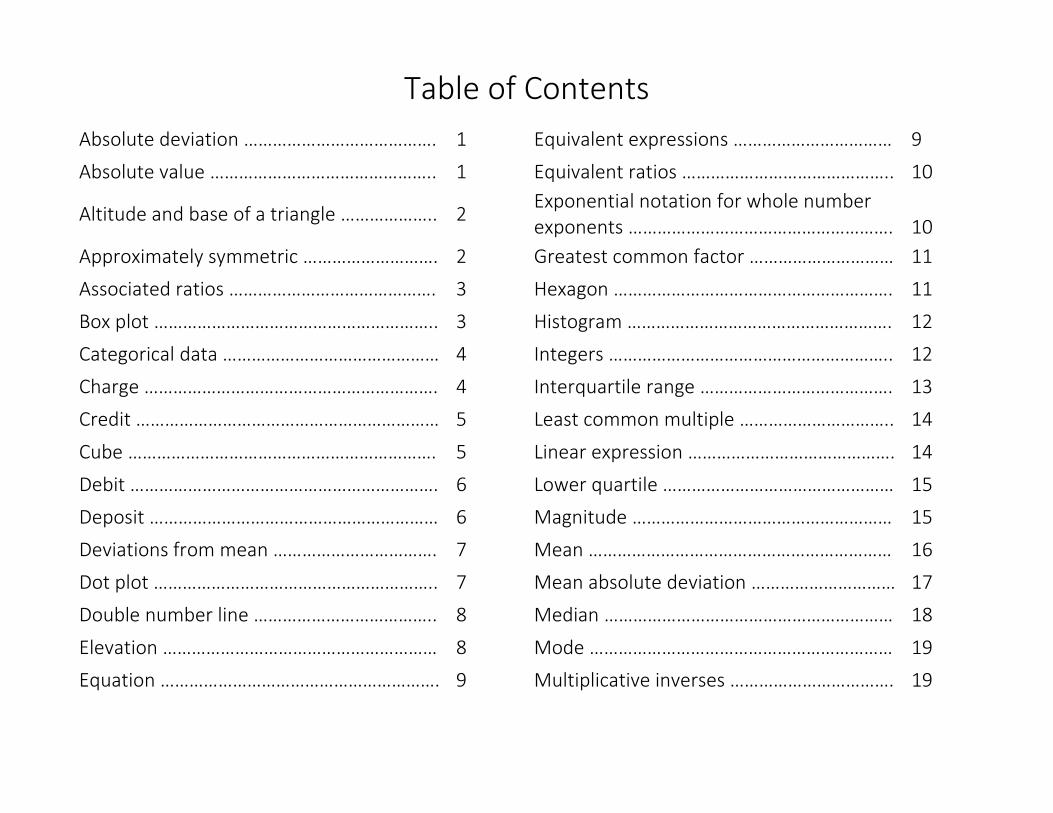
Table of Contents
Absolute deviation …………………………………. 1 Equivalent expressions …………………………… 9
Absolute value ……………………………………….. 1 Equivalent ratios …………………………………….. 10
Altitude and base of a triangle ……………….. 2 Exponential notation for whole number exponents ………………………………………………. 10
Approximately symmetric ………………………. 2 Greatest common factor ………………………… 11
Associated ratios ……………………………………. 3 Hexagon …………………………………………………. 11
Box plot ………………………………………………….. 3 Histogram ………………………………………………. 12
Categorical data ……………………………………… 4 Integers ………………………………………………….. 12
Charge ……………………………………………………. 4 Interquartile range …………………………………. 13
Credit ……………………………………………………… 5 Least common multiple ………………………….. 14
Cube ………………………………………………………. 5 Linear expression ……………………………………. 14
Debit ………………………………………………………. 6 Lower quartile ………………………………………… 15
Deposit …………………………………………………… 6 Magnitude ……………………………………………… 15
Deviations from mean ……………………………. 7 Mean ……………………………………………………… 16
Dot plot ………………………………………………….. 7 Mean absolute deviation ………………………… 17
Double number line ……………………………….. 8 Median …………………………………………………… 18
Elevation ………………………………………………… 8 Mode ……………………………………………………… 19
Equation …………………………………………………. 9 Multiplicative inverses ……………………………. 19

Negative number ……………………………………. 20 Triangular region …………………………………….. 29
Numerical data ……………………………………….. 20 Truth values of a number sentence ………… 30
Opposite …………………………………………………. 21 Unit rate …………………………………………………. 30
Parallel planes ………………………………………… 21 Upper quartile ………………………………………… 31
Pentagon ………………………………………………… 22 Value of a ratio ……………………………………….. 31
Percent …………………………………………………… 22 Variability ……………………………………………….. 32
Positive number ……………………………………… 23 Withdraw ………………………………………………… 33
Quadrants ………………………………………………. 23 Withdrawal ……………………………………………… 33
Range ……………………………………………………… 24
Rate ………………………………………………………… 24
Ratio ……………………………………………………….. 25
Ratio table ………………………………………………. 25
Rational number …………………………………….. 26
Relative frequency ………………………………….. 26
Right rectangular prism …………………………… 27
Simple expression …………………………………… 27
Skewed …………………………………………………… 28
Statistical question …………………………………. 28
Surface of a prism …………………………………… 29
MSP Math Dictionary Grade 6 2016-2017 Page | 1
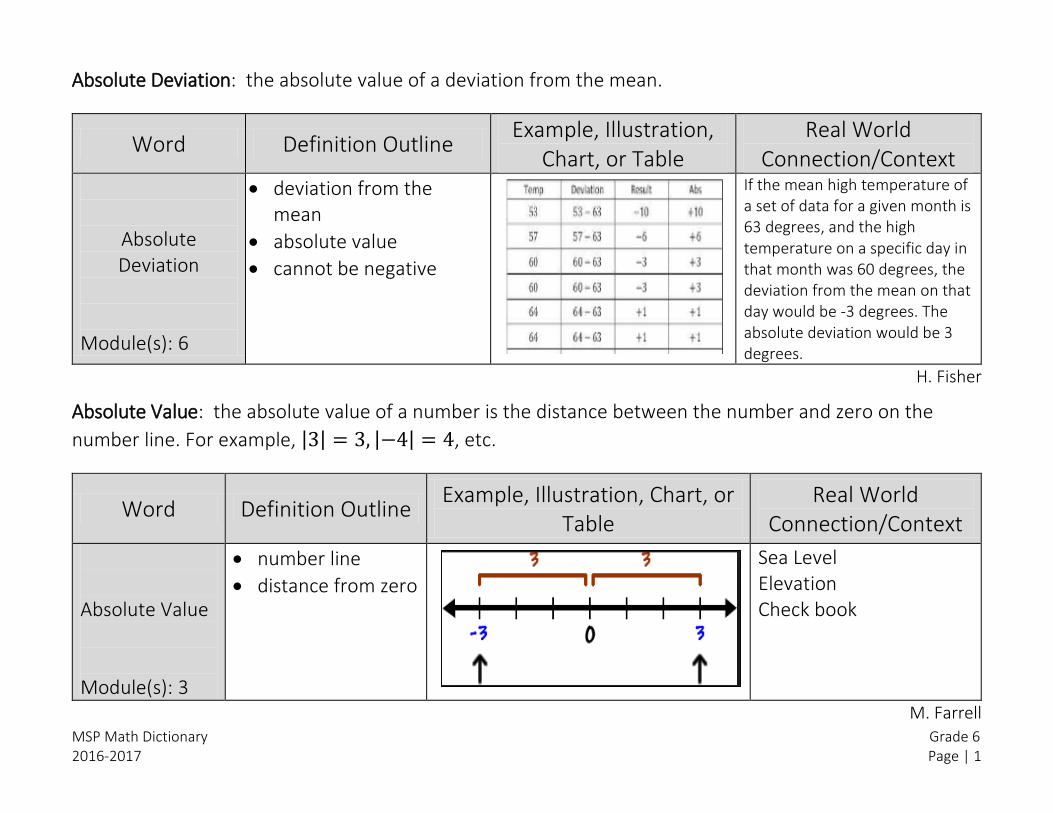
Absolute Deviation: the absolute value of a deviation from the mean.
Word Definition Outline Example, Illustration,
Chart, or Table Real World
Connection/Context
Absolute Deviation
Module(s): 6
deviation from the mean
absolute value
cannot be negative
If the mean high temperature of a set of data for a given month is 63 degrees, and the high temperature on a specific day in that month was 60 degrees, the deviation from the mean on that day would be -3 degrees. The absolute deviation would be 3 degrees.
H. Fisher
Absolute Value: the absolute value of a number is the distance between the number and zero on the
number line. For example, |3| = 3, |−4| = 4, etc.
Word Definition Outline Example, Illustration, Chart, or
Table Real World
Connection/Context
Absolute Value Module(s): 3
number line
distance from zero
Sea Level Elevation Check book
M. Farrell
MSP Math Dictionary Grade 6 2016-2017 Page | 2
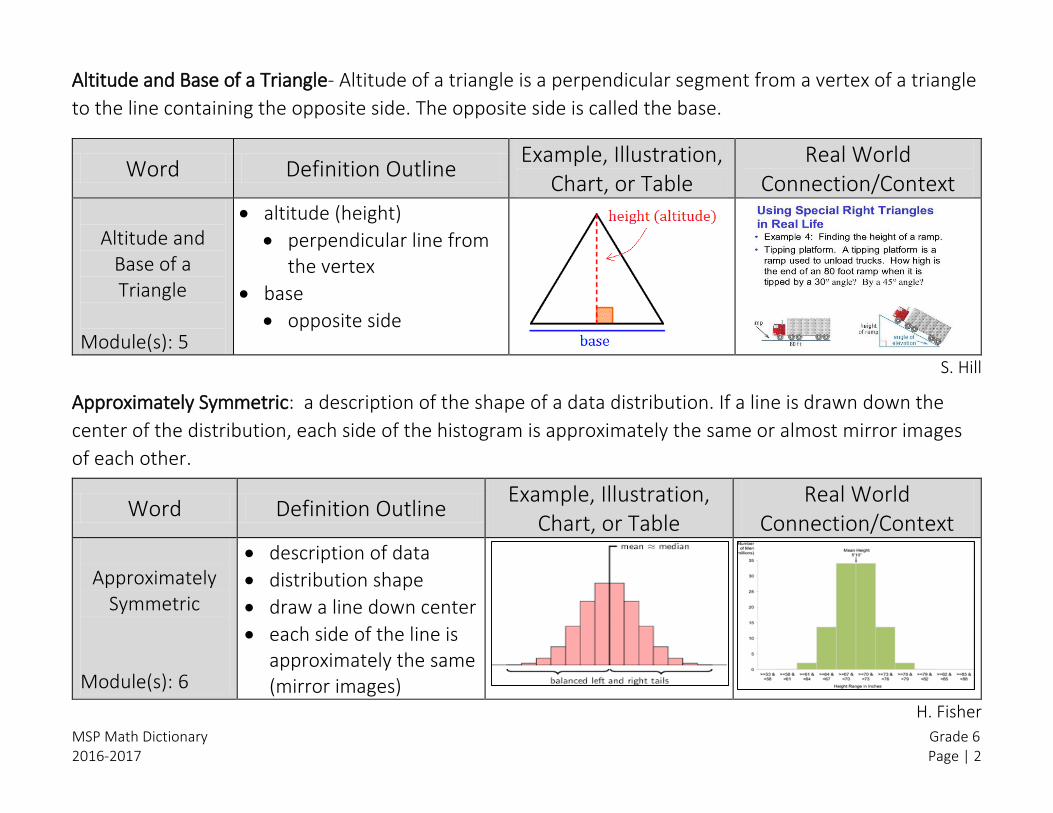
Altitude and Base of a Triangle- Altitude of a triangle is a perpendicular segment from a vertex of a triangle
to the line containing the opposite side. The opposite side is called the base.
Word Definition Outline Example, Illustration,
Chart, or Table Real World
Connection/Context
Altitude and Base of a Triangle
Module(s): 5
altitude (height)
perpendicular line from the vertex
base
opposite side
S. Hill
Approximately Symmetric: a description of the shape of a data distribution. If a line is drawn down the
center of the distribution, each side of the histogram is approximately the same or almost mirror images
of each other.
Word Definition Outline Example, Illustration,
Chart, or Table Real World
Connection/Context
Approximately Symmetric
Module(s): 6
description of data
distribution shape
draw a line down center
each side of the line is approximately the same (mirror images)
H. Fisher

MSP Math Dictionary Grade 6 2016-2017 Page | 3
Associated Ratios: fraction 𝐴
𝐵 associated with the ratio 𝐴:𝐵 as the value of the ratio 𝐴 to 𝐵.
Word Definition Outline Example, Illustration,
Chart, or Table Real World
Connection/Context
Associated Ratios
Module(s): 1
means the same
written multiple ways
𝐴
𝐵 = A:B = A to B
K. Connolly
Box Plot: a graph of five numerical summary measures: the minimum, lower quartile, median, upper
quartile, and the maximum. It conveys information about center and variability in a data set.
Word Definition Outline Example, Illustration,
Chart, or Table Real World
Connection/Context
Box Plot Module(s): 6
a graph
shows the center of data
shows variability of data
includes the 5 number summary (minimum, lower
quartile, median, upper quartile, maximum)
H. Fisher

MSP Math Dictionary Grade 6 2016-2017 Page | 4
Categorical Data: a set of data where values can be words or categories.
Word Definition Outline Example, Illustration,
Chart, or Table Real World
Connection/Context
Categorical Data Module(s): 6
data values are usually words, categories, or labels
answers to questions are found by naming things
H. Fisher
Charge: a charge is the amount of money a person must pay, as in a charge to an account, or a fee
charged.
Word Definition Outline Example, Illustration,
Chart, or Table Real World
Connection/Context
Charge Module(s): 3
money paid out
amount to pay for an item
Write an integer to represent the following situation: A fee charged of $2 -2
M. Farrell

MSP Math Dictionary Grade 6 2016-2017 Page | 5
Credit: a credit is represented as a positive number on a number line that is located to the right of (or
above) zero.
Word Definition Outline Example, Illustration,
Chart, or Table Real World
Connection/Context
Credit
Module(s): 3
right of the number line
positive number
can be represented above the number line
D.Lupini
Cube: a cube is a right rectangular prism all of whose edges are of equal length.
Word Definition Outline Example, Illustration,
Chart, or Table Real World
Connection/Context
Cube Module(s): 5
prism
edges are equal length
vertices are right angles
faces are squares
D. Kennedy
MSP Math Dictionary Grade 6 2016-2017 Page | 6
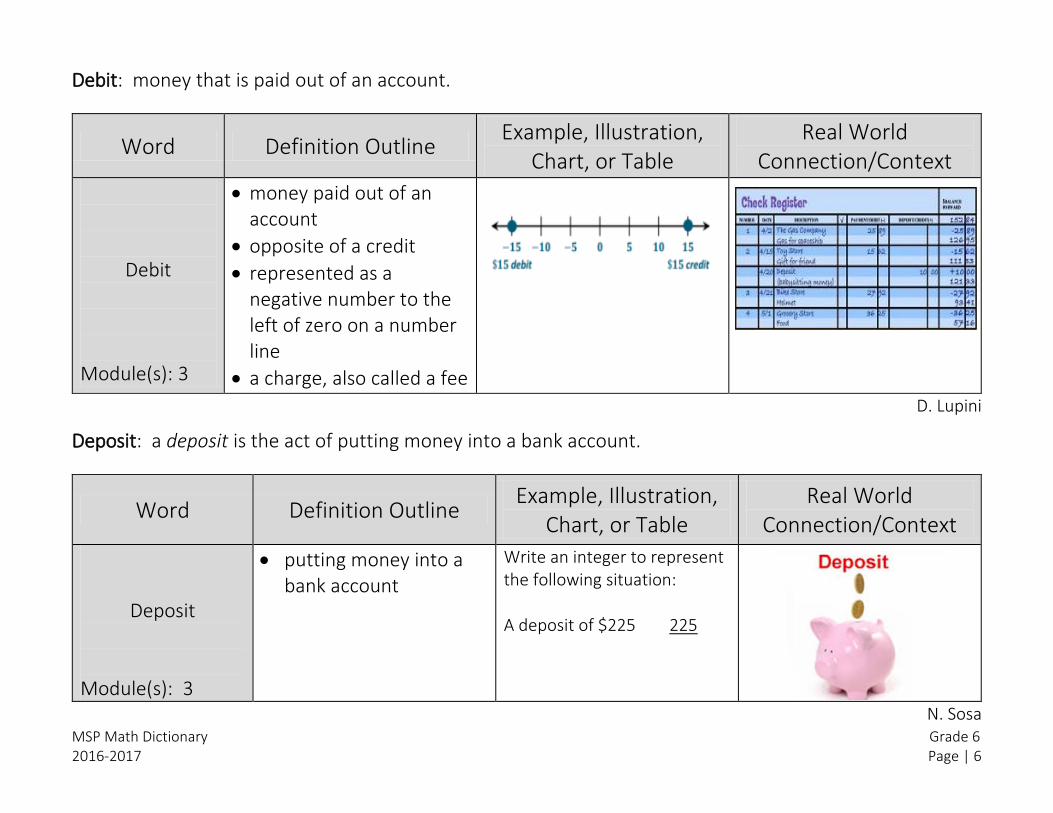
Debit: money that is paid out of an account.
Word Definition Outline Example, Illustration,
Chart, or Table Real World
Connection/Context
Debit Module(s): 3
money paid out of an account
opposite of a credit
represented as a negative number to the left of zero on a number line
a charge, also called a fee
D. Lupini
Deposit: a deposit is the act of putting money into a bank account.
Word Definition Outline Example, Illustration,
Chart, or Table Real World
Connection/Context
Deposit Module(s): 3
putting money into a bank account
Write an integer to represent the following situation: A deposit of $225 225
N. Sosa
This is a debit

MSP Math Dictionary Grade 6 2016-2017 Page | 7
Deviations from the Mean: the differences calculated by subtracting the mean from the observations in a
data set.
Word Definition Outline Example, Illustration,
Chart, or Table Real World
Connection/Context Deviations from
the Mean Module(s): 6
data value – mean = deviation
values can be positive or negative
the sum of all deviations is 0
H. Fisher
Dot Plot: a plot of numerical data along a number line.
Word Definition Outline Example, Illustration,
Chart, or Table Real World
Connection/Context
Dot Plot Module(s): 6
visual representation
dots used for data
number line
N. Sosa
MSP Math Dictionary Grade 6 2016-2017 Page | 8
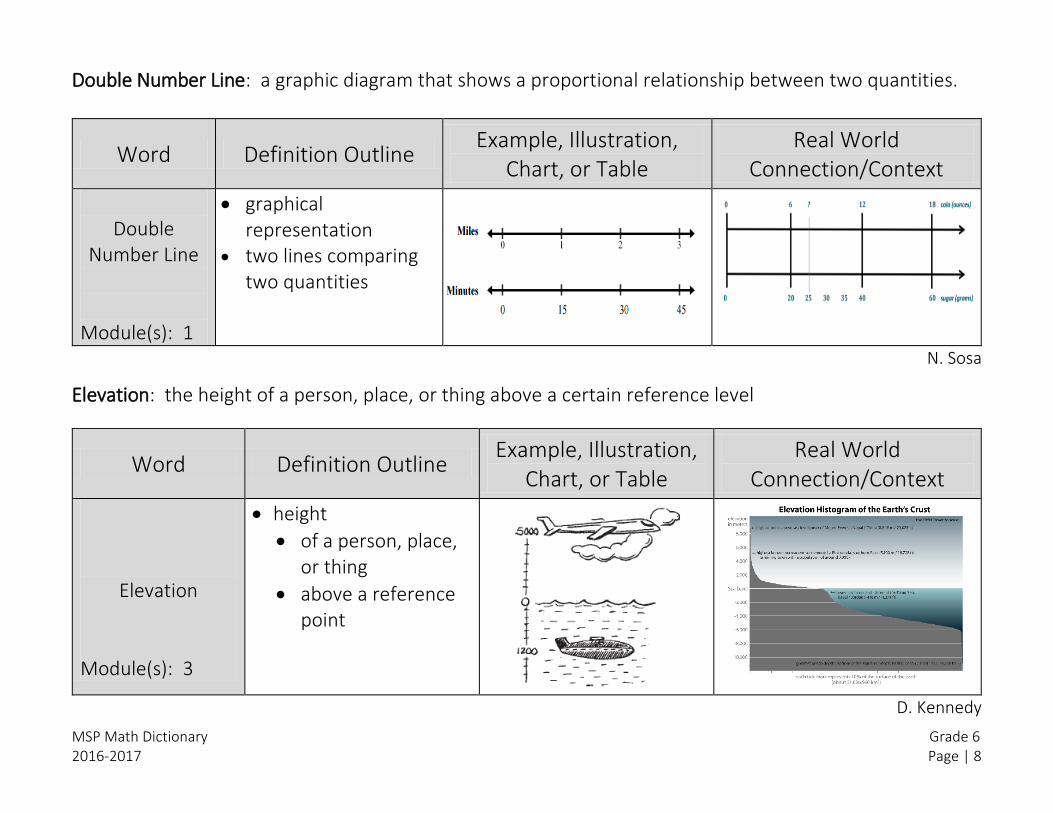
Double Number Line: a graphic diagram that shows a proportional relationship between two quantities.
Word Definition Outline Example, Illustration,
Chart, or Table Real World
Connection/Context
Double
Number Line Module(s): 1
graphical representation
two lines comparing two quantities
N. Sosa
Elevation: the height of a person, place, or thing above a certain reference level
Word Definition Outline Example, Illustration,
Chart, or Table Real World
Connection/Context
Elevation Module(s): 3
height
of a person, place, or thing
above a reference point
D. Kennedy
MSP Math Dictionary Grade 6 2016-2017 Page | 9
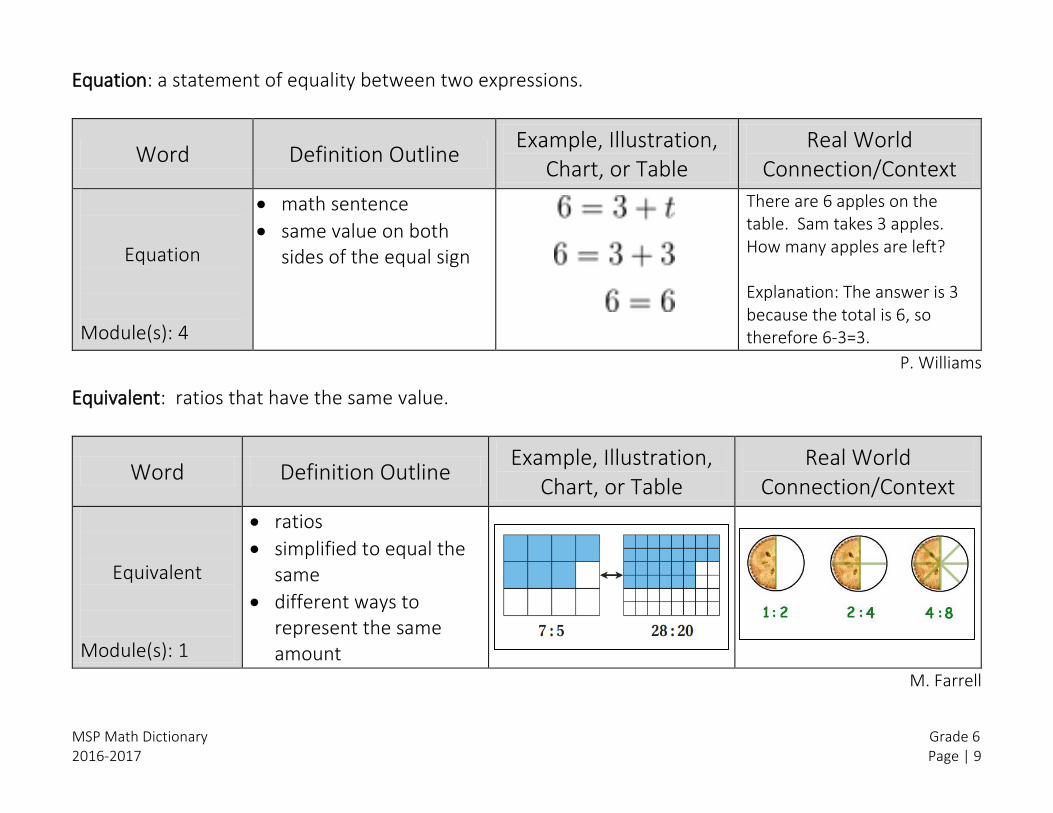
Equation: a statement of equality between two expressions.
Word Definition Outline Example, Illustration,
Chart, or Table Real World
Connection/Context
Equation Module(s): 4
math sentence
same value on both sides of the equal sign
There are 6 apples on the table. Sam takes 3 apples. How many apples are left? Explanation: The answer is 3 because the total is 6, so therefore 6-3=3.
P. Williams
Equivalent: ratios that have the same value.
Word Definition Outline Example, Illustration,
Chart, or Table Real World
Connection/Context
Equivalent Module(s): 1
ratios
simplified to equal the same
different ways to represent the same amount
M. Farrell

MSP Math Dictionary Grade 6 2016-2017 Page | 10
Equivalent Expressions: two simple expressions are equivalent to the same number for every substitution.
Word Definition Outline Example, Illustration,
Chart, or Table Real World
Connection/Context
Equivalent Expressions
Module(s): 4
two expressions
equal
simplify to the same value
S. Hill
Exponential Notation for Whole Number Exponents: let 𝑚 be a non-zero whole number. For any number
𝑎, we define 𝑎𝑚 to be the product of 𝑚 factors of 𝑎.
Word Definition Outline Example, Illustration,
Chart, or Table Real World
Connection/Context
Exponential Notation for
Whole Number Exponents
Module(s): 4
exponent
the number of times to multiply the base by itself
M. Farrell

MSP Math Dictionary Grade 6 2016-2017 Page | 11
Greatest Common Factor (GCF): the largest positive integer that divides into two or more integers without
a remainder; the GCF of 24 and 36 is 12 because when all of the factors of 24 and 36 are listed, the largest
factor they share is 12.
Word Definition Outline Example, Illustration,
Chart, or Table Real World
Connection/Context
Greatest Common
Factor (GCF)
Module(s): 2
list factors
of two or more numbers
find the largest number that is on all lists
There are 24 boys and 36 girls who signed up for a dodge ball tournament. What is the greatest number of teams that can be made if all teams have an equal number of boys and girls?
H. Fisher
Hexagon: Given 6 different points A, B, C, D, E, and F in the plane, a 6-sided polygon, or hexagon, is the
union of 6 segments AB, BC, CD, DE, EF, and FA such that (1) the segments intersect only at their
endpoints, and (2) no two adjacent segments are collinear.
Word Definition Outline Example, Illustration,
Chart, or Table Real World
Connection/Context
Hexagon
Module(s): 5
polygon
6 sides
straight edges
D. Kennedy

MSP Math Dictionary Grade 6 2016-2017 Page | 12
Histogram: A graphical representation of a numerical data set that has been grouped into intervals. Each
interval is represented by a bar drawn above that interval that has a height corresponding to the number
of observations in that interval.
Word Definition Outline Example, Illustration,
Chart, or Table Real World
Connection/Context
Histogram Module(s): 6
type of graph
uses bars to represent intervals
shows numerical data
similar to a bar graph
Based on the histogram, how many roller coasters have a maximum drop between 170 – 210 ft.?
H. Fisher
Integers: The numbers …, -3, -2, -1, 0, 1, 2, 3….are integers on the number line.
Word Definition Outline Example, Illustration,
Chart, or Table Real World
Connection/Context
Integers
Module(s): 3
numbers
on a number line
positives
negatives
S. Hill
MSP Math Dictionary Grade 6 2016-2017 Page | 13
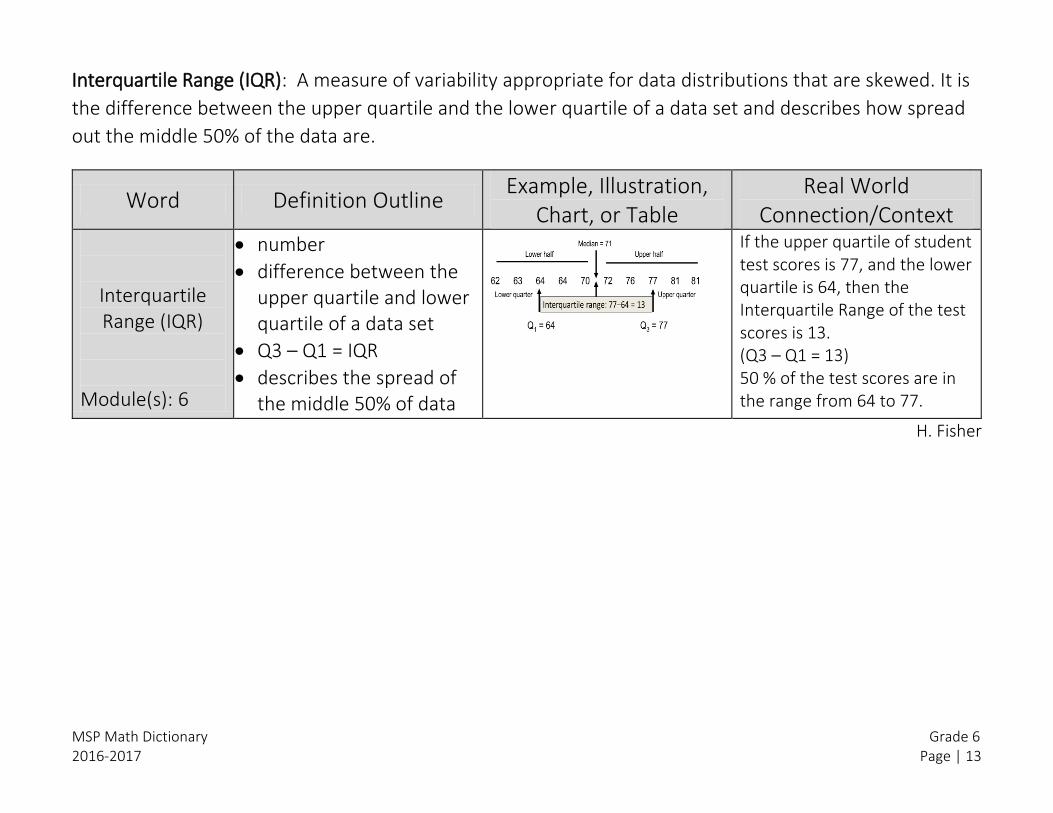
Interquartile Range (IQR): A measure of variability appropriate for data distributions that are skewed. It is
the difference between the upper quartile and the lower quartile of a data set and describes how spread
out the middle 50% of the data are.
Word Definition Outline Example, Illustration,
Chart, or Table Real World
Connection/Context
Interquartile Range (IQR)
Module(s): 6
number
difference between the upper quartile and lower quartile of a data set
Q3 – Q1 = IQR
describes the spread of the middle 50% of data
If the upper quartile of student test scores is 77, and the lower quartile is 64, then the Interquartile Range of the test scores is 13. (Q3 – Q1 = 13) 50 % of the test scores are in the range from 64 to 77.
H. Fisher
MSP Math Dictionary Grade 6 2016-2017 Page | 14
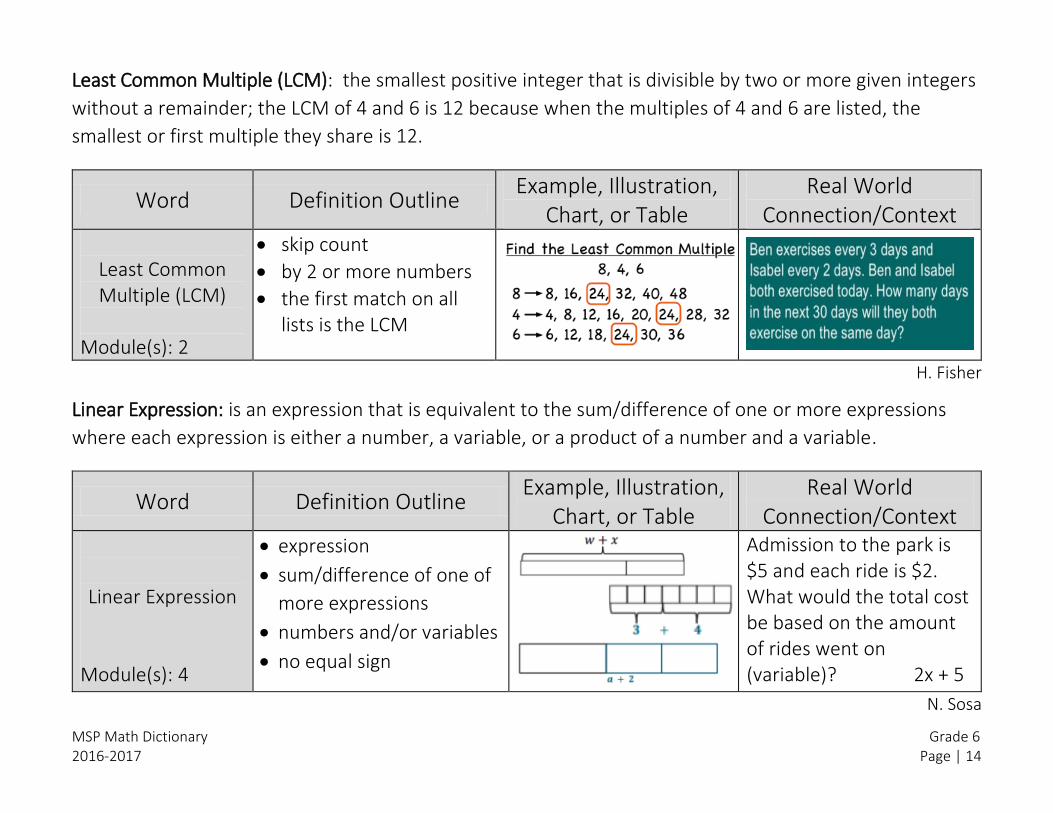
Least Common Multiple (LCM): the smallest positive integer that is divisible by two or more given integers
without a remainder; the LCM of 4 and 6 is 12 because when the multiples of 4 and 6 are listed, the
smallest or first multiple they share is 12.
Word Definition Outline Example, Illustration,
Chart, or Table Real World
Connection/Context
Least Common Multiple (LCM)
Module(s): 2
skip count
by 2 or more numbers
the first match on all lists is the LCM
H. Fisher
Linear Expression: is an expression that is equivalent to the sum/difference of one or more expressions
where each expression is either a number, a variable, or a product of a number and a variable.
Word Definition Outline Example, Illustration,
Chart, or Table Real World
Connection/Context Linear Expression
Module(s): 4
expression
sum/difference of one of
more expressions
numbers and/or variables
no equal sign
Admission to the park is $5 and each ride is $2. What would the total cost be based on the amount of rides went on (variable)? 2x + 5
N. Sosa

MSP Math Dictionary Grade 6 2016-2017 Page | 15
Lower Quartile: the median of the lower half of the ordered data (does not include the median of the
complete set). It is also called Quartile 1 or “Q1.”
Word Definition Outline Example, Illustration,
Chart, or Table Real World
Connection/Context
Lower Quartile Module(s): 6
median of lower half of data
also called quartile 1 or Q1
H. Fisher
Magnitude: the magnitude is the absolute value of a measurement, given the measurement of a positive
or negative number.
Word Definition Outline Example, Illustration,
Chart, or Table Real World
Connection/Context
Magnitude
Module(s): 3
positive value of a measurement
N. Fiorella
MSP Math Dictionary Grade 6 2016-2017 Page | 16
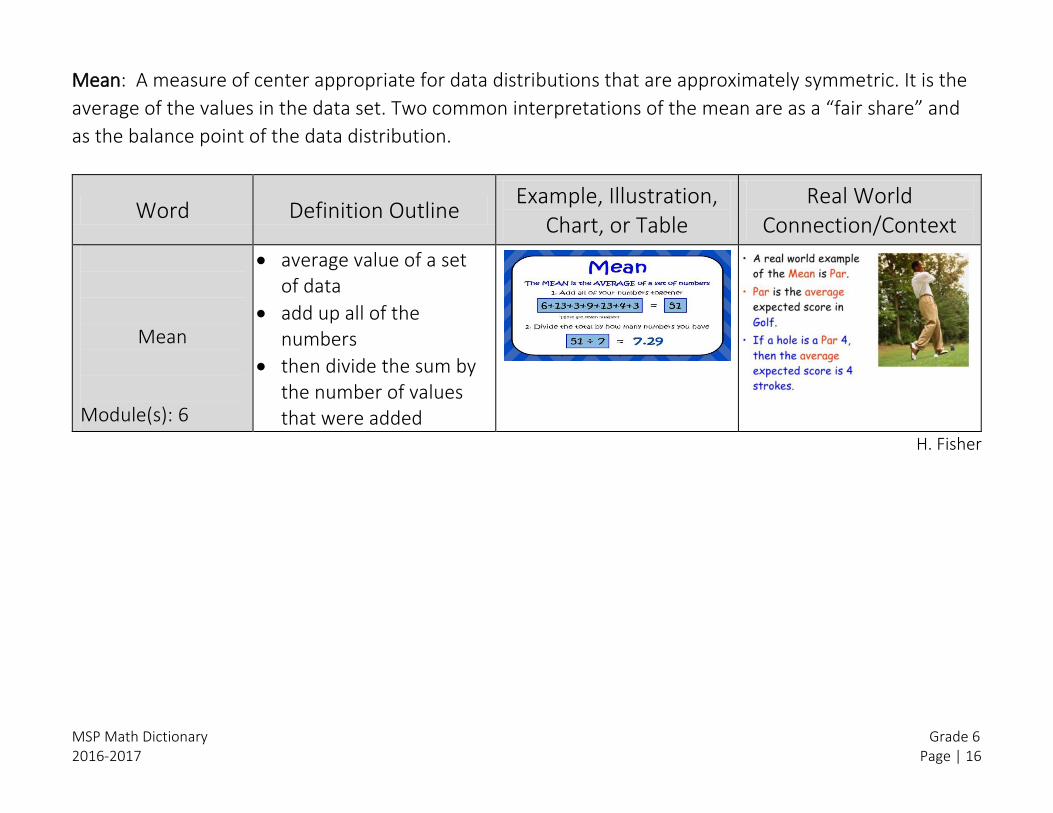
Mean: A measure of center appropriate for data distributions that are approximately symmetric. It is the
average of the values in the data set. Two common interpretations of the mean are as a “fair share” and
as the balance point of the data distribution.
Word Definition Outline Example, Illustration,
Chart, or Table Real World
Connection/Context
Mean Module(s): 6
average value of a set of data
add up all of the numbers
then divide the sum by the number of values that were added
H. Fisher

MSP Math Dictionary Grade 6 2016-2017 Page | 17
Mean Absolute Deviation (MAD): A measure of variability appropriate for data distributions that are
approximately symmetric. It is the average of the absolute value of the deviations from the mean.
Word Definition Outline Example, Illustration,
Chart, or Table Real World
Connection/Context
Mean Absolute Deviation
(MAD) Module(s): 6
average distance of deviations from the mean
add up all absolute deviations
divide the sum by the number of deviations that were added
lower MAD means less variability (not spread out much)
higher MAD means more variability (spread out more)
H. Fisher

MSP Math Dictionary Grade 6 2016-2017 Page | 18
Median: A measure of center appropriate for skewed data distributions. It is the middle value when the
data are ordered from smallest to largest if there are an odd number of observations, and halfway
between the middle two observations if the number of observations is even.
Word Definition Outline Example, Illustration,
Chart, or Table Real World
Connection/Context
Median Module(s): 6
the middle value of a set of data
that has been put in order from least to greatest
for an odd number of values, it is the middle value
for an even number of values, add the two middle values and divide by 2
Odd number of values Even number of values
H. Fisher

MSP Math Dictionary Grade 6 2016-2017 Page | 19
Mode: the value which appears most often in a set of data.
Word Definition Outline Example, Illustration,
Chart, or Table Real World
Connection/Context
Mode Module(s): 6
value in a set of data
appears more often than other values
sometimes there is more than one mode
sometimes there is no mode
Mode is 3.
H. Fisher
Multiplicative Inverses: two numbers whose product is 1 are multiplicative inverses of one another.
Word Definition Outline Example, Illustration,
Chart, or Table Real World
Connection/Context
Multiplicative Inverses
Module(s): 2
two numbers
product equals 1
do not have to be reciprocals
1
3×3
1=3
3= 1
2
4×16
8=32
32= 1
M. Farrell
MSP Math Dictionary Grade 6 2016-2017 Page | 20
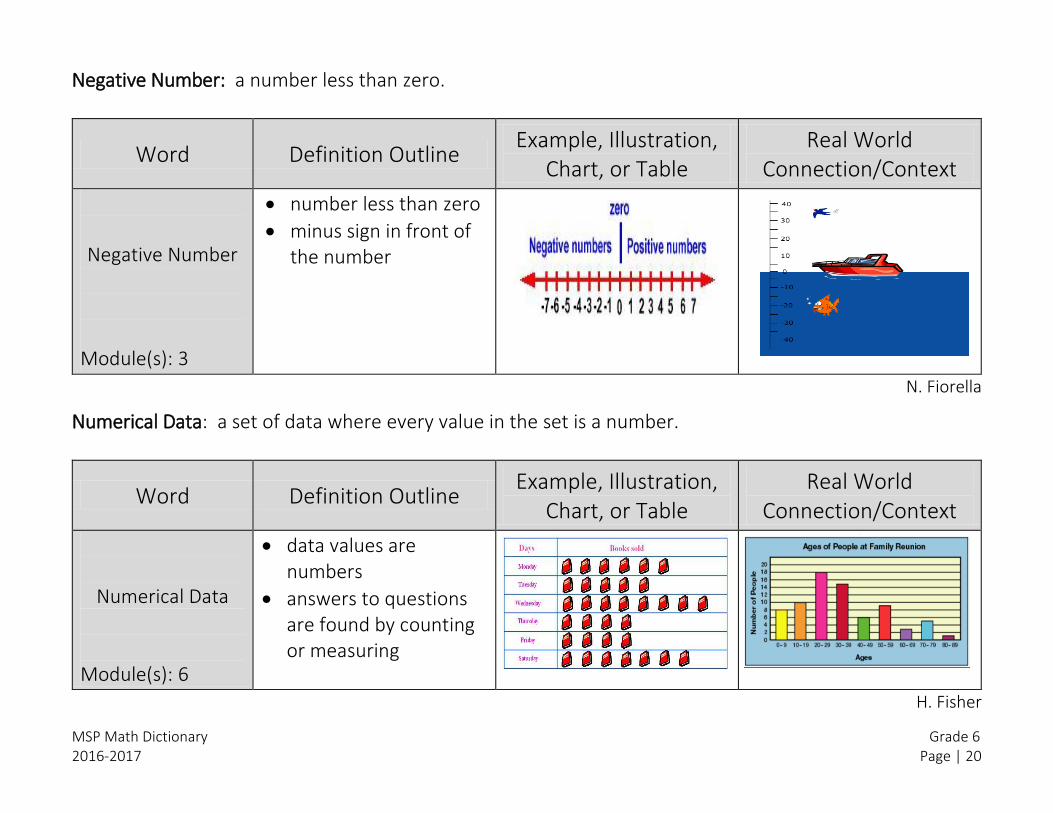
Negative Number: a number less than zero.
Word Definition Outline Example, Illustration,
Chart, or Table Real World
Connection/Context
Negative Number
Module(s): 3
number less than zero
minus sign in front of the number
N. Fiorella
Numerical Data: a set of data where every value in the set is a number.
Word Definition Outline Example, Illustration,
Chart, or Table Real World
Connection/Context
Numerical Data Module(s): 6
data values are numbers
answers to questions are found by counting or measuring
H. Fisher

MSP Math Dictionary Grade 6 2016-2017 Page | 21
Opposite: In a position on the other side; for example, negative numbers are the opposite direction from
zero as positive numbers.
Word Definition Outline Example, Illustration,
Chart, or Table Real World
Connection/Context
Opposite
Module(s): 3
other side of something
N. Fiorella
Parallel Planes- two planes are parallel if they do not intersect. In Euclidean geometry, a useful test for checking whether two planes are parallel is if the planes are different and if there is a line that is perpendicular to both planes.
Word Definition Outline Example, Illustration,
Chart, or Table Real World
Connection/Context
Parallel Planes Module(s): 5
two planes
do not intersect
S. Crangle
MSP Math Dictionary Grade 6 2016-2017 Page | 22
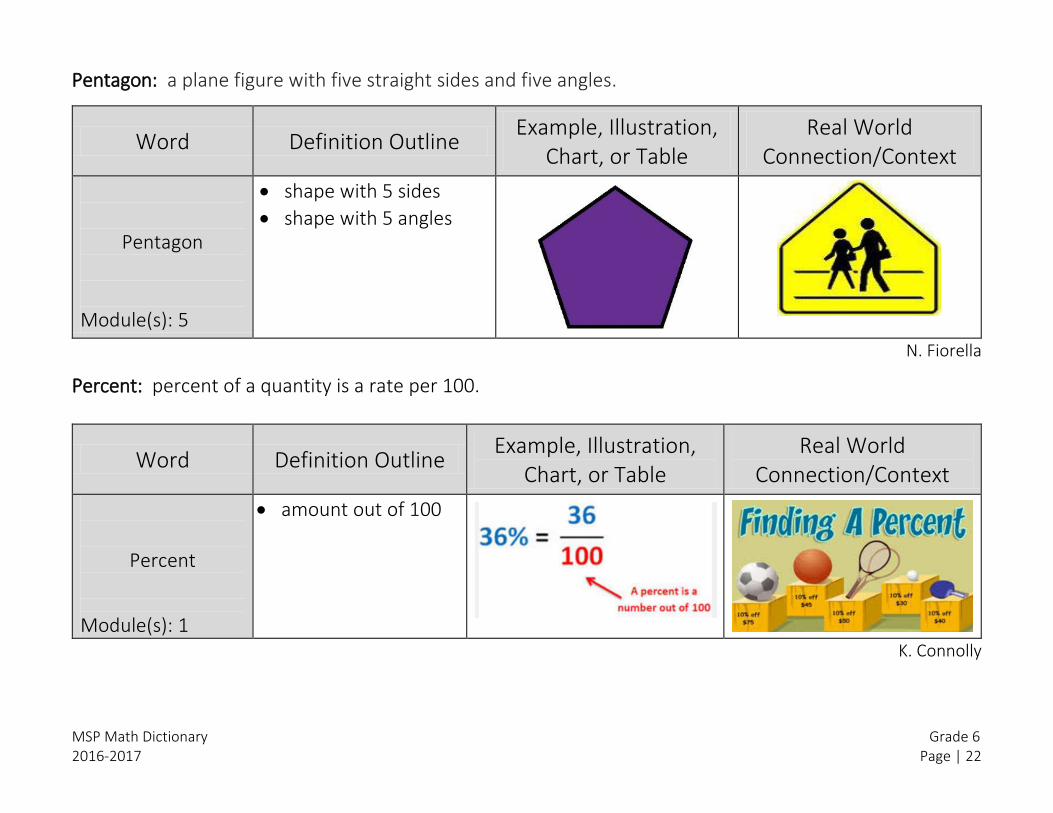
Pentagon: a plane figure with five straight sides and five angles.
Word Definition Outline Example, Illustration,
Chart, or Table Real World
Connection/Context
Pentagon Module(s): 5
shape with 5 sides
shape with 5 angles
N. Fiorella
Percent: percent of a quantity is a rate per 100.
Word Definition Outline Example, Illustration,
Chart, or Table Real World
Connection/Context
Percent
Module(s): 1
amount out of 100
K. Connolly
MSP Math Dictionary Grade 6 2016-2017 Page | 23
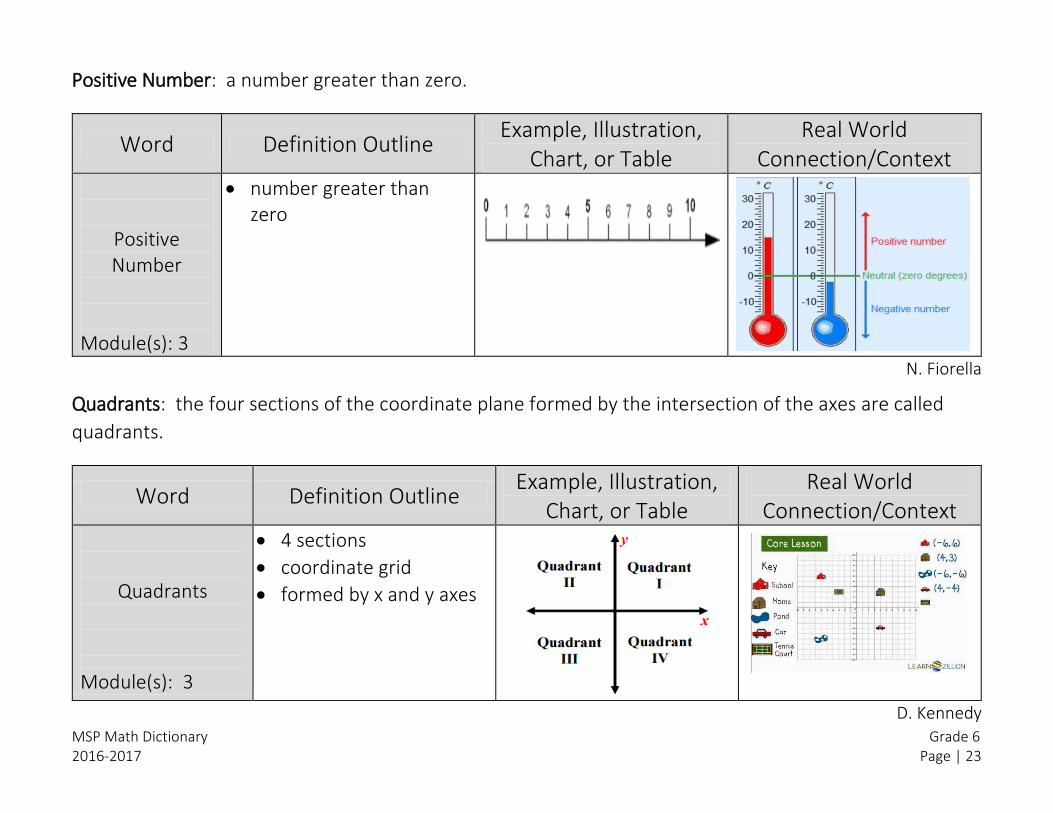
Positive Number: a number greater than zero.
Word Definition Outline Example, Illustration,
Chart, or Table Real World
Connection/Context
Positive Number
Module(s): 3
number greater than zero
N. Fiorella
Quadrants: the four sections of the coordinate plane formed by the intersection of the axes are called
quadrants.
Word Definition Outline Example, Illustration,
Chart, or Table Real World
Connection/Context
Quadrants
Module(s): 3
4 sections
coordinate grid
formed by x and y axes
D. Kennedy

MSP Math Dictionary Grade 6 2016-2017 Page | 24
Range: the difference between the highest and lowest values in a data set.
Word Definition Outline Example, Illustration,
Chart, or Table Real World
Connection/Context
Range Module(s): 6
difference between highest and lowest values
range = highest - lowest
H. Fisher
Rate: indicates, for a proportional relationship between two quantities, how many units of one quantity
there are for every 1 unit of the second quantity
Word Definition Outline Example, Illustration,
Chart, or Table Real World
Connection/Context
Rate Module(s): 1
comparison
two quantities
different units
S. Hill

MSP Math Dictionary Grade 6 2016-2017 Page | 25
Ratio: a pair of non-negative numbers, A:B, where both are not zero, and that are used to indicate that
there is a relationship between two quantities such that when there are A units of one quantity, there are
B units of the second quantity.
Word Definition Outline Example, Illustration,
Chart, or Table Real World
Connection/Context
Ratio Module(s): 1
comparison or relationship
between two items
S. Hill
Ratio Table: a table listing pairs of numbers that form equivalent ratios.
Word Definition Outline Example, Illustration,
Chart, or Table Real World
Connection/Context
Ratio Table Module(s): 1
table
pairs of numbers
equivalent ratios
Kyra is participating in a fundraiser walkathon. She walks 2 miles in 30 minutes. If she continues to walk at the same rate, determine how many minutes it will take her to walk 7 miles.
M. Farrell
MSP Math Dictionary Grade 6 2016-2017 Page | 26
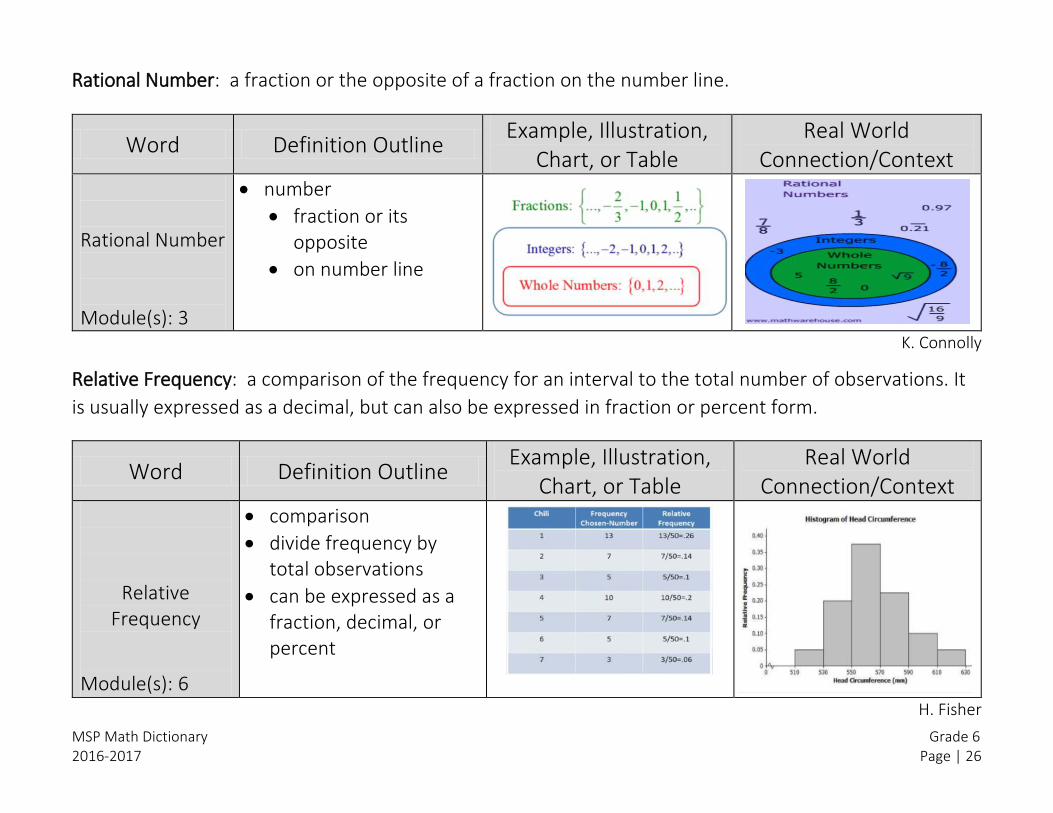
Rational Number: a fraction or the opposite of a fraction on the number line.
Word Definition Outline Example, Illustration,
Chart, or Table Real World
Connection/Context
Rational Number Module(s): 3
number
fraction or its opposite
on number line
K. Connolly
Relative Frequency: a comparison of the frequency for an interval to the total number of observations. It
is usually expressed as a decimal, but can also be expressed in fraction or percent form.
Word Definition Outline Example, Illustration,
Chart, or Table Real World
Connection/Context
Relative Frequency
Module(s): 6
comparison
divide frequency by total observations
can be expressed as a fraction, decimal, or percent
H. Fisher
MSP Math Dictionary Grade 6 2016-2017 Page | 27
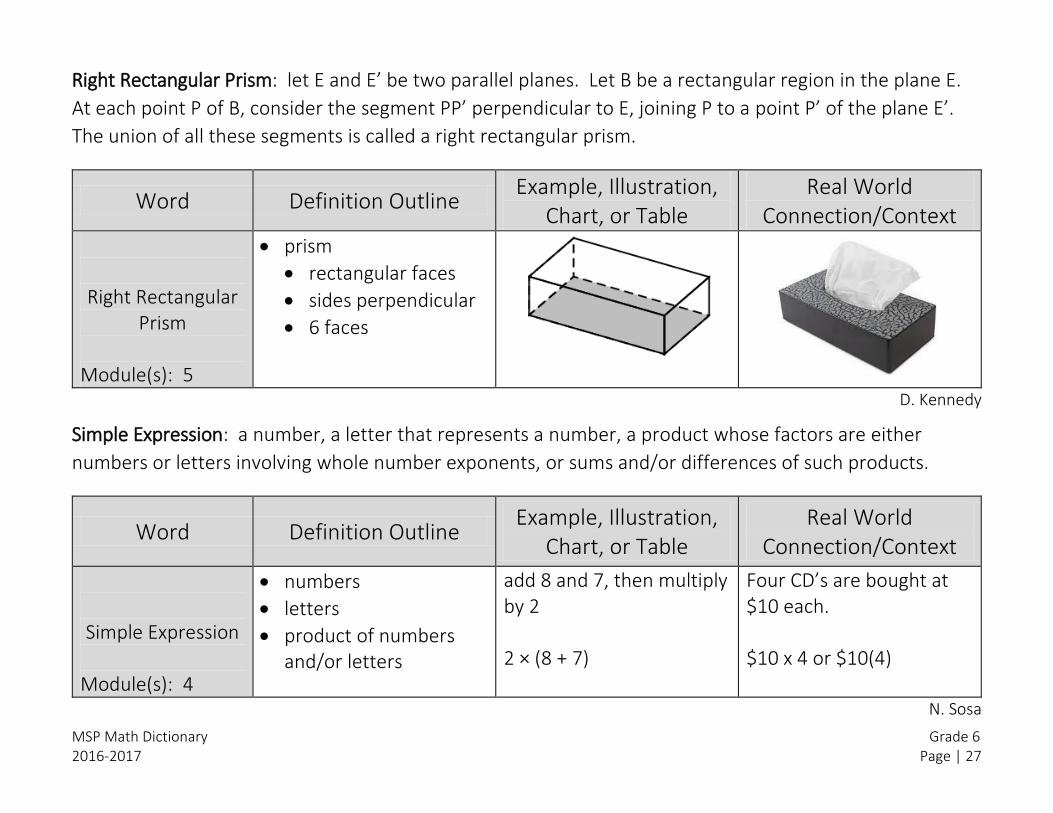
Right Rectangular Prism: let E and E’ be two parallel planes. Let B be a rectangular region in the plane E.
At each point P of B, consider the segment PP’ perpendicular to E, joining P to a point P’ of the plane E’.
The union of all these segments is called a right rectangular prism.
Word Definition Outline Example, Illustration,
Chart, or Table Real World
Connection/Context Right Rectangular
Prism Module(s): 5
prism
rectangular faces
sides perpendicular
6 faces
D. Kennedy
Simple Expression: a number, a letter that represents a number, a product whose factors are either
numbers or letters involving whole number exponents, or sums and/or differences of such products.
Word Definition Outline Example, Illustration,
Chart, or Table Real World
Connection/Context
Simple Expression
Module(s): 4
numbers
letters
product of numbers and/or letters
add 8 and 7, then multiply by 2 2 × (8 + 7)
Four CD’s are bought at $10 each. $10 x 4 or $10(4)
N. Sosa

MSP Math Dictionary Grade 6 2016-2017 Page | 28
Skewed: a description of the shape of a data distribution. Most of the data values are grouped or
‘clustered’ on one side of the distribution.
Word Definition Outline Example, Illustration,
Chart, or Table Real World
Connection/Context
Skewed Module(s): 6
describes the shape of a data distribution
most values are grouped or ‘clustered’ on a side
skewed left (negative)
skewed right (positive)
H. Fisher
Statistical Question: a question that anticipates variability in the data that would be collected in order to
answer the question.
Word Definition Outline Example, Illustration,
Chart, or Table Real World
Connection/Context
Statistical Question
Module(s): 6
a question
more than one possible answer
used to collect data
H. Fisher

MSP Math Dictionary Grade 6 2016-2017 Page | 29
Surface of a Prism: is the union of all of its faces- the base faces and lateral faces.
Word Definition Outline Example, Illustration,
Chart, or Table Real World
Connection/Context
Surface of a Prism
Module(s): 5
combination of
all of the faces/sides
Katy is painting the walls of her bedroom, shown below. Katy will not paint the floor, the ceiling, or the door. Katy’s door is 3 feet x 8 feet. If one quart of paint covers 100 square feet, how many quarts will Katy need to purchase?
S. Hill
Triangular Region: the union of the triangle and its interior.
Word Definition Outline Example, Illustration,
Chart, or Table Real World
Connection/Context
Triangular Region Module(s): 5
area
triangular portion of an object
K. Connolly

MSP Math Dictionary Grade 6 2016-2017 Page | 30
Truth Value of a Number Sentence: A number sentence is said to be true if both numerical expressions are
equivalent; it is said to be false otherwise. True and false are called truth values.
Word Definition Outline Example, Illustration,
Chart, or Table Real World
Connection/Context Truth Value of a
Number Sentence
Module(s): 4
true
expressions are the same
false
expressions are not the same
Write true or false if the number substituted for g results in a true or false number sentence.
Earth orbits the sun. True
George Washington was the first president of the United States. True
There are 25 hours in a day. False
K. Connolly
Unit Rate: the numeric value of the rate.
Word Definition Outline Example, Illustration,
Chart, or Table Real World
Connection/Context
Unit Rate
Module(s): 1
number
representing a rate
Traveling along Route 33, the sign reads 50 miles per hour. The unit rate is 50.
P. Williams

MSP Math Dictionary Grade 6 2016-2017 Page | 31
Upper Quartile: the median of the upper half of the ordered data (does not include the median of the
complete set). It is also called Quartile 3 or “Q3.”
Word Definition Outline Example, Illustration,
Chart, or Table Real World
Connection/Context
Upper Quartile
Module(s): 6
lower half of data
median of
also called quartile 3 or Q3
H. Fisher
Value of a Ratio: A relationship between two quantities, normally expressed as the quotient of one
divided by the other; for example, the ratio of 7 to 4 can be written 7:4 or 7/4.
Word Definition Outline Example, Illustration,
Chart, or Table Real World
Connection/Context
Value of a Ratio
Module(s): 1
ratio A:B
represented as
quotient A/B
K. Connolly

MSP Math Dictionary Grade 6 2016-2017 Page | 32
Variability: variability in a data set occurs when the observations in the data set are not all the same.
Word Definition Outline Example, Illustration,
Chart, or Table Real World
Connection/Context
Variability Module(s): 6
differences in a data set
higher variability = values spread out more
lower variability = values closer together
High Variability Low Variability
H. Fisher

MSP Math Dictionary Grade 6 2016-2017 Page | 33
Withdraw: to withdraw is to take away; for example, to take money out of a bank account.
Word Definition Outline Example, Illustration,
Chart, or Table Real World
Connection/Context
Withdraw Module(s): 3
to take away
Niya Sosa
Withdrawal: the act of taking money out of a bank account.
Word Definition Outline Example, Illustration,
Chart, or Table Real World
Connection/Context
Withdrawal Module(s): 3
take money out Write an integer to represent the following situation: A withdrawl of $225 -225
P. Williams