Embed Size (px)
Citation preview
1
TTAABBLLEE OOFF CCOONNTTEENNTTSS
City of Cambridge Profile 2 Police Department Profile 3 Police Department Organizational Chart4 Message from Commissioner Watson5 Message from Commissioner Haas 6 Crime Analysis Forward6 2006 Crime Index 7 UCR Crime Statistics 8 25 Year Statistical Trends 9 Executive Summary 10 National amp Regional Comparison 12 Crime Clock 15 Crime Factors 16 Chronological Highlights 18 SECTION I PART I CRIMES Murder 22 Rape27 Robbery 29 Assault 34 Burglary39 Larceny44 Auto Theft 52 SECTION II PART II CRIMES Narcotics58 Malicious Destruction 62 Fraud amp Forgery 63 Sex Offenses64 Other Part II Crimes 65 SECTION III Neighborhood Reports 68 Section IV Business District Profiles 111 SECTION V SPECIAL REPORTS Domestic Crimes 124 Hate Crimes 127 Homelessness 128 Juvenile Crime 131 School Crimes 133 CHA Property 134 ldquoHotrdquo Theft Targets 135 Learn to Protect Yourself 138 Cambridge Police Phone Directory 143
CAMBRIDGE POLICE DEPARTMENT 2006 ANNUAL CRIME REPORT INCLUDING NEIGHBORHOOD
AND BUSINESS DISTRICT PROFILES
Produced by the
Cambridge Police Crime Analysis Unit
Susan DeAmato Meghan McKenney Christopher Vetter Melanie Seymore
Crime Analysis Interns
Rebecca Burbank Crime Analyst
Richard E Sevieri
Strategic Analysis Coordinator
Stephen Maywalt Information Systems Manager
Michael DeSantis
Information Systems Specialist
Sergeant Daniel Wagner Special Projects
Sergeant Frederic Riley
Crime Analysis Unit Supervisor
Deputy Michael Walsh Deputy Superintendent of Training
Technical and Administration
Superintendent Michael Giacoppo Superintendent of Support Services
2
Predominant Occupations of Cambridge Residents Education Training Library hellip15 Office and Administrative Support hellip116 Managementhellip86
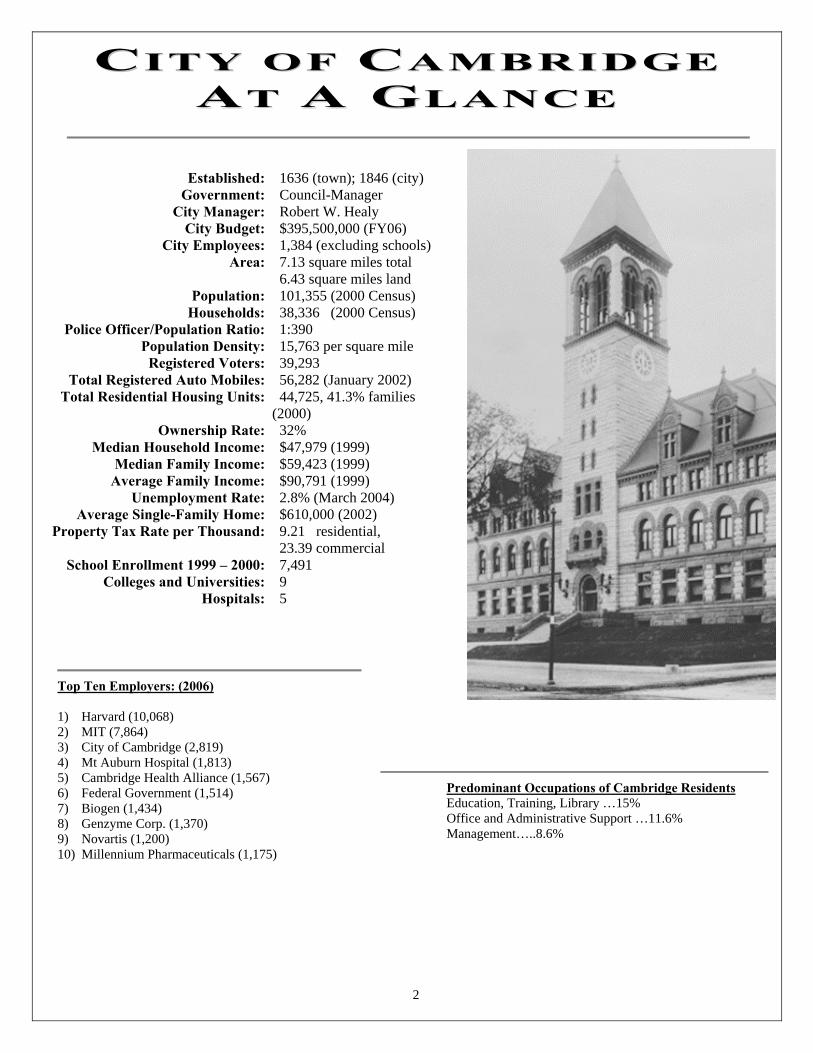
Established
1636 (town) 1846 (city)
Government Council-Manager City Manager Robert W Healy
City Budget $395500000 (FY06) City Employees 1384 (excluding schools)
Area 713 square miles total 643 square miles land
Population Households
101355 (2000 Census) 38336 (2000 Census)
Police OfficerPopulation Ratio 1390 Population Density 15763 per square mile
Registered Voters Total Registered Auto Mobiles
39293 56282 (January 2002)
Total Residential Housing Units 44725 413 families (2000)
Ownership Rate 32 Median Household Income
Median Family Income Average Family Income
$47979 (1999) $59423 (1999) $90791 (1999)
Unemployment Rate 28 (March 2004) Average Single-Family Home $610000 (2002)
Property Tax Rate per Thousand
School Enrollment 1999 ndash 2000
921 residential 2339 commercial 7491
Colleges and Universities 9 Hospitals 5
CCIITTYY OOFF CCAAMMBBRRIIDDGGEE AATT AA GGLLAANNCCEE
Top Ten Employers (2006) 1) Harvard (10068) 2) MIT (7864) 3) City of Cambridge (2819) 4) Mt Auburn Hospital (1813) 5) Cambridge Health Alliance (1567) 6) Federal Government (1514) 7) Biogen (1434) 8) Genzyme Corp (1370) 9) Novartis (1200) 10) Millennium Pharmaceuticals (1175)
3
CAMBRIDGE POLICE DEPARTMENT AT A GLANCE
Organized 1859
Sworn Officers 275 Civilian Personnel 37
Commissioner Ronnie Watson (retired March 2007)
Headquarters 5 Western Avenue Cambridge MA 02139
Budget (FY 05) $34188000 Rank Structure Commissioner
Superintendent Deputy Superintendent Captain Lieutenant Sergeant Patrol Officer
Marked Patrol Vehicles 31 Unmarked Patrol Vehicles 31
Motorcycles 14 Bicycles 12
Special Vehicles 9 2006 Total Calls for Service 93800
2006 Total Index Crimes 3753
CC RR II MM EE AA NN AA LL YY SS II SS II NN CC AA MM BB RR II DD GG EE
Cambridge Age Structure Age 2000 Population Percentage
0-4 4125 41 5-17 9322 92 18- 24 21472 211 25-34 25202 249 35-44 13942 138 45-64 18010 178 65+ 9282 91
Population by race 1980 1990 2000
White 795 716 68 Black 106 127 12 Asian 38 84 12 Hispanic 48 68 7 Native American 2 3 - Other 12 4 1
Crime Analysis is the process of turning crime data into information and then turning that information intoknowledge about crime and safety in a particular community While it is a growing field across this country andinternationally Cambridge has had a Crime Analysis Unit in operation for over 27 years The function of the Crime Analysis Unit (CAU) is to support the daily operations of the Police Department bycollecting managing and analyzing crime calls for service and other data The CAU also works together withanalysts from neighboring departments to address cross-jurisdictional patterns By making timely observations of emerging crime patterns hot spots and other crime problems the Cambridge CrimeAnalysis Unit ultimately aims to assist the Department in its criminal apprehension and crime reduction strategies
4
Traffic
FirstPlatoon
Day Patrol
FourthPlatoon
ThirdPlatoon
SecondPlatoon
Night Patrol
School Resourse Officer
Auxiliary
Bicycle Patrol
CrimePrevention
CommunityRelations
Operations
Legal PlanningBudget
amp Personnel
Quality Control Media Relations
Office of the Commissioner
WarrantApprehension
amp Dignitary Protection
Sexual Assault
Domestic Violence
SpecialInvestigations
Major Crime
GeneralAssignment
Investigations
Accreditation
Certifications
Tactical
In-Service
Training
Crime Analysis
Grants
RMS
Information Services
TechnicalServices
Identification
Propertyamp Evidence
FleetMaintenance
Facilities Maintenance
Off-DutyEmployment
Records
CourtProsecutor
Administration
TrainingTechnical
amp Administration
Support Services
Commissioner
CCAA MMBB RR IIDD GG EE PPOOLL IICC EE DDEEPP AA RR TTMM EENN TT
OORRGGAANNIIZZAATTIIOONNAALL CCHHAARRTT
5
AA FF AA RR EE WW EE LL LL MM EE SS SS AA GG EE FF RR OO MM TT HH EE CC OO MM MM II SS SS II OO NN EE RR
It is my pleasure to present the Cambridge Police Departmentrsquos Annual Crime Report 2006 the eleventh Annual
Report produced during my tenure as Commissioner This will also be the final Annual Report produced under my leadership in Cambridge as I will be retiring in March of 2007 The objective of this report is to give Cambridge residents a realistic view of their risk of victimization and to provide detailed information on criminal activity in our City The 3753 serious crimes recorded in Cambridge in 2006 represent the Cityrsquos lowest Uniform Crime Reporting Index number reported to the FBI in over 40 years This number represents a decline of 2 from the previous low of 3814 crimes reported in 2005 This is only the third time since 1960 that the City of Cambridge has recorded fewer than 4000 serious crimes Further analysis of the 2006 figures indicates that property crime remained relatively unchanged in Cambridge this year with only a 1 reduction translating to 19 fewer incidents than in 2005 A 10 increase in burglary over the year was counteracted by drops in both auto thefts and larcenies to produce this overall decline Violent crime on the other hand experienced decreases in all categories resulting in an 8 drop when compared with the 2005 figures
Despite the recent reductions in crime the Cambridge Police Department continues to work as hard as ever to improve the conditions in which people live and work everyday in this great city One way the City of Cambridge has strived to do this is through an increased focus on social services throughout the city with an emphasis on providing safer after-school environments for children Programs offered through Tutoring Plus the Margaret Fuller Neighborhood House the North Cambridge Crime Task Force and other neighborhood organizations are all part of the citywide effort to keep our children safe In addition the Police Department is now taking a more proactive approach to reducing violent crime Investigations of crime in the city have revealed that a small number of individuals are often responsible for a large number of violent crimes Therefore one of the focuses this year has been to increase targeted surveillance of those particular individuals in an attempt to stop more crime from occurring or at least to improve the chances of successfully apprehending suspects when crimes do occur This initiative has also included an increased uniformed presence in area parks and other locations reporting increased violence Even as overall violent crime figures decline in Cambridge fighting violence must remain a top priority
As my time in this Department grows short I look back at my years here in Cambridge and I am proud of the work that
has been done and the positive changes that have been made The move towards community policing and citizen involvement over the years through such initiatives as the Neighborhood Sergeants Program has proved to be beneficial for both the Department and the community as a whole By improving the Police Departmentrsquos ability to communicate and foster partnerships with the citizens of Cambridge we have enhanced our image in the community and our ability to prevent and investigate crime There has also been a significant improvement in the association between the Police Department and the Police Review amp Advisory Board transitioning from a relationship of contention to one of professionalism and cooperation This cooperation in turn has led to an advancement in police performance and a reduction in complaints brought against the Department
In the future it is imperative that this Department remain constantly alert to the effect that the violence in other
communities has on Cambridge We must continue to monitor the activity of surrounding communities to ensure that the spillover from those communities does not adversely affect this city We must be vigilant to the quality of life issues that affect those who live and work here I am confident that the Cambridge Police Department will accomplish this mission as it transitions to new leadership
That being said the 2006 Annual Crime Report is one of the many resources the Cambridge Police Department provides to the citizens of Cambridge This Department is committed to providing timely and relevant information to the community and I urge you to visit our website at httpwwwcambridgepoliceorg for current information on crime and for important community alerts Armed with this knowledge the community and the Police Department can work together to develop effective strategies to ensure a high quality of life and to reduce crime and fear in the City of Cambridge
Ronnie Watson Police Commissioner
6
AA MM EE SS SS AA GG EE FF RR OO MM PP OO LL II CC EE CC OO MM MM II SS SS II OO NN EE RR RR OO BB EE RR TT CC HH AA AA SS
It is my pleasure to be a part of the Cambridge Police Departmentrsquos Annual Crime Report 2006 the first Annual Report produced since my appointment by Robert W Healy as Police Commissioner on April 9 2007
I would like to take this opportunity to thank members of the department for their hard work and support over the past few weeks I realize that this continues to be an important project for the department and is valuable to personnel city officials and the community The thoughtful planning of the 2006 Annual Report has presented the police department with an exciting opportunity with the departure of Commissioner Ronnie Watson and my appointment The Department will remain committed to providing timely and relevant information to the community I urge you to visit our website at httpwwwcambridgepoliceorg for current information on crime and community alerts I look forward to working with the community to develop strategies to ensure a high quality of life and to reduce crime and the elements that impact crime Sincerely
Robert C Haas Police Commissioner
FF OO RR EE WW OO RR DD
The Cambridge Police Departmentrsquos 2006 Annual Crime Report is an attempt to provide detailed information
so that citizens can make informed decisions about crime and safety in their neighborhoods The more information made available to the public the better the input will be in aiding the Police response to crime
The Annual Report offers a comprehensive analysis of the crimes reported by the Cambridge Police Department to the Federal Bureau of Investigationrsquos Uniform Crime Reporting (UCR) Program The UCR Program has been collecting national crime statistics from local police departments since 1930 Based on seriousness and frequency police departments are required to report their statistics on seven crimes which comprise the UCR Crime Index murder forcible rape aggravated assault robbery burglary larceny and auto theft The problem for the public as well as for the police is that UCR statistics alone are of little use to patrol deployment and offer little to citizens interested in reducing their risks The true picture of crime and disorder in a city is seldom conveyed to the public through simple statistics Crimes are complex events and these complexities encompass many dimensions It is our endeavor in this report to unravel the web of factors that comprise the crime rate The publication of detailed neighborhood crime statistics patterns and trends gives Cantabridgians a realistic view of their risks of victimization The Neighborhood and Business District sections within the Annual Crime Report are designed to help residents business owners and visitors have a fuller understanding of crime problems in their areas This report outlines three distinctions that make up criminal incidents (1) whether offenses are committed against strangers or against relatives and acquaintances (2) the motivation of the criminalsmdashdrugs revenge or intimidation are but a few of the factors that motivate both novice and career criminals and (3) when and where crimes occur focusing on where the hotspots are and the best time frames for the majority of the incidents Outlining these factors is imperative to understanding the anatomy of crime in Cambridge and to developing appropriate responses
The rise and fall of the crime rate will always be with us To hold that tide in check it will take a partnership comprised of not just the Police and citizens but also every city agency the business community public service providers and church leaders The goal of the Annual Report is to provide this partnership with the knowledge to ensure the desired quality of life in all the neighborhoods of the City
Cambridge Police Department Crime Analysis Unit
7
22000066 CCRRIIMMEE IINNDDEEXX
The Crime Index is composed of selected offenses used to gauge fluctuations in the overall volume and rate of crime reported to police The offenses included are the violent crimes of murder rape robbery and aggravated assault and the property crimes of burglary larceny and auto theft The Crime Index was developed by the Federal Bureau of Investigationrsquos Uniform Crime Reporting program to standardize the way in which law enforcement agencies report crime statistics Crime 2003 2004 2005 2006 2005-2006
Change
Murder 3 0 3 2 Inc
Rape 7 10 14 11 Inc
Stranger 1 0 3 2 Inc
Non-Stranger 6 10 11 9 Inc
Robbery 229 245 239 208 -13
Commercial 41 60 73 38 -48
Street 188 185 166 170 +2
Aggravated Assault 271 248 244 237 -3
Total Violent Crime 510 503 500 458 -8
Burglary 651 724 623 685 +10
Commercial 134 139 133 189 +42
Residential 517 585 490 496 +1
Larceny 2389 2654 2396 2377 -1
from Building 518 572 539 386 -28
from Motor Vehicle 657 734 615 754 +23
from Person 331 381 343 337 -2
of Bicycle 212 229 241 204 -15
Shoplifting 358 383 403 342 -15
from Residence 183 226 175 246 +41
of License Plate 75 67 42 30 -29
of Services 24 30 19 21 +11
Miscellaneous 31 32 19 57 +200
Auto Theft 419 438 295 233 -21
Total Property Crime 3459 3816 3314 3295 -1
Crime Index Total 3969 4319 3814 3753 -2 Note Inc = percentages are not calculated for numbers so small so as to prevent a statistically misleading percentage
8
Please Note Due to reclassification year to year final numbers are subject to change
CC AA MM BB RR II DD GG EE UU NN II FF OO RR MM CC RR II MM EE RR EE PP OO RR TT SS TT AA TT II SS TT II CC SS 11 99 88 77 -- 22 00 00 66
1987
1988
1989
1990
1991
1992
1993
1994
1995
1996
1997
1998
1999
2000
2001
2002
2003
2004
2005
2006
Crime
Avg
198
7-19
96
Avg
199
7-20
06
Avg
198
7-20
06
C
hang
e 20
05-2
006
Cha
nge
1997
-200
6
Murder 2 7 7 3 5 2 2 1 3 1 2 2 2 1 1 6 3 0 3 2 3 2 3 Inc No change
Rape 36 30 25 29 38 33 30 28 35 34 24 25 15 11 15 10 7 10 14 11 32 14 23 -21 -54 Robbery 417 402 460 431 399 286 253 276 295 227 176 208 165 186 181 195 229 245 239 208 345 203 274 -13 +18 Aggravated Assault 340 371 365 614 567 551 643 473 463 381 370 369 348 322 272 284 271 248 244 237 477 297 387 -3 -36
Burglary 1477 1337 1621 1470 1098 866 929 774 953 791 596 695 567 552 688 720 651 724 623 685 1132 650 891 +10 +15 Larceny Theft 3229 3127 3692 3136 3363 3326 3563 3351 3313 2973 2779 2753 2819 2820 2740 2764 2389 2654 2396 2377 3307 2649 2978 -1 -14
Auto Theft 1152 1175 1170 1353 1012 887 964 761 558 544 483 397 431 498 523 425 419 438 295 233 958 414 686 -21 -52 Total Violent 795 810 857 1077 1009 872 928 778 796 643 572 604 530 520 469 495 510 503 500 458 857 516 686 -8 -20
Total Property 5858 5639 6483 5959 5473 5079 5456 5086 4824 4308 3858 3845 3817 3870 3951 3909 3459 3816 3314 3295 5417 3713 4565 -1 -15
Total 6653 6449 7340 7036 6482 5951 6384 5664 5620 4951 4430 4449 4347 4390 4420 4404 3969 4319 3814 3753 6253 4230 5241 -2 -15 Note Inc = percentages are not calculated for numbers so small so as to prevent a statistically misleading percentage The Cambridge Police Department voluntarily submits Uniform Crime Report statistics to the FBI for national comparison See httpwwwfbigovucrucrhtm for more information Percent changes are rounded to the nearest whole number A 0 change means that there was less than a 5 increase or decrease
9
2255--YY EE AA RR SS TT AA TT II SS TT II CC AA LL TT RR EE NN DD SS
0
1000
2000
3000
4000
5000
6000
7000
8000
9000
1982
1984
1986
1988
1990
1992
1994
1996
1998
2000
2002
2004
2006
0
200
400
600
800
1000
1200
1982
1984
1986
1988
1990
1992
1994
1996
1998
2000
2002
2004
2006
Cambridge reported its lowest amountof crime in over 40 years in 2006 Thetotal crime index has fallen 56 since1982 Serious crime numbers havebeen on a steady decline since the late1970s with the exception of spikes atthe turn of two decades These spikeswere caused by a sharp increase inproperty crimes in 1980 and a sharpincrease in violent crimes in 1990After 1997 the crime rate leveled offfor approximately six years until itdropped by 10 in 2003 A smallincrease in 2004 was countered by twosubsequent decreases in 2005 and2006 Overall crime in Cambridgehas dropped approximately 15 in thepast five years
Total Part I (Index) Crime
Violent crime totals include the crimes ofmurder rape robbery and assault Totalswere fairly unsteady in the 1980s The lateyears of the decade were marked by a greatincrease in incidentsmdashreflective of thenationrsquos epidemic of gang and drugviolence combined with greater reportingof domestic assaults Since 1990 violentcrime totals have been steadily decliningbut have been marked by small spikesevery other year or so This year reportedviolent crimes decreased by 42 incidents(8) from 2005 indicating the lowestnumber in the past 25 years
Total Part I Violent Crime
0
1000
2000
3000
4000
5000
6000
7000
8000
9000
1982
1984
1986
1988
1990
1992
1994
1996
1998
2000
2002
2004
2006
Total Part I Property Crime Property crime totals include burglarylarceny and auto theft Property crimeusually accounts for 80-90 of thePart I total which explains why thegraph to the left mirrors the graph atthe top so closely Totals have fallen57 since 1982 and 15 since 1997Burglary and auto theft haveexperienced significant decreases overthe past two decades but larceny(common theft) has remained fairlysteady Auto theft is at its lowest ratein 50 years After 1997 crime ratesleveled off for approximately sixyears until they dropped by 12 in2003 An increase in 2004 wasfollowed by a decrease of 14 overthe next two years consequently thisyearrsquos totals are lowest in over 40years
10
22000066 EE XX EE CC UU TT II VV EE SS UU MM MM AA RR YY
IMPORTANT FACTS ABOUT THE 2006 INDEX TOTAL The Crime Index is composed of selected offenses used to gauge fluctuations in the overall volume and rate of crime reported to police The offenses included are the violent crimes of murder rape robbery and aggravated assault and the property crimes of burglary larceny and auto theft The Crime Index was developed by the Federal Bureau of Investigationrsquos Uniform Crime Reporting program to standardize the way in which law enforcement agencies report crime statistics The 3753 serious crimes recorded in Cambridge in 2006 represent the Cityrsquos lowest Uniform Crime Reporting Index number reported to the FBI in over 40 years The City of Cambridge has recorded fewer than 4000 serious crimes only three times since 1960 The 2006 decline of 2 with 61 fewer incidents than in 2005 represents the cityrsquos lowest recorded crime index total since the mid ndash1960s Further analysis indicates that violent crime decreased by 8 in 2006 with 42 fewer incidents and property crime declined by 1 with 19 fewer incidents The three biggest declines for 2006 were in commercial robbery (-48) larceny of license plate (-29) and larceny from building (-28) when compared with the 2005 figures MURDER
bull Murders in Cambridge most often fall into three distinct scenarios domestic situations drug or gang related altercations and homeless against homeless street fights Two people died in Cambridge in 2006 as a result of handgun violence among young males in the city
bull Nationally cities of 100000 people average 10 murders per year bull In the first incident Corey Davis 19 was walking down the street when he was shot in a drive by Davis
was shot three times in the back and was pronounced dead later that night A month later US Marshals in Virginia arrested James Miller 23 of Dorchester for Davisrsquo murder In June of 2006 Remele Ahart 21 of Chelsea and Ahmad Bright 17 of Dorchester were also arrested in connection with this murder
bull The second shooting occurred just ten days after Davis was killed Doowensky Nazaire 22 of Somerville died from two gunshot wounds he sustained while standing in front of a club in Cambridge Officers apprehended Elysee Bresilla 28 of Roslindale as he fled from the scene and charged him with murder when Nazaire succumbed to his injuries a short time after the shooting
bull Since 1990 Cambridge has averaged two murders per year which is a decrease from the 30-year period between 1960 and 1989 when the average was slightly less than five per year
RAPE bull Cambridge reported 11 rapes in 2006 a total that remains below the 10-year average of 14 rapes per year bull Nine of the eleven rapes in 2006 were completed acts and two were categorized as attempts bull Five of the nine completed rapes in 2006 were acquaintance rapes where the victim knew the perpetrator bull Since 1980 there has only been one stranger-to-stranger ldquostreetrdquo rape pattern in Cambridge the ldquoRainy
Day Rapistrdquo who preyed on victims in the Fresh Pond area on rainy days in 1981
ROBBERY bull The steady increase in robberies that began in 2002 has reversed over the past two years with an overall
decrease of 15 since 2004 2006rsquos decline of 13 dropped the total to 208 incidents bull Commercial robberies fell by 35 incidents from 2005rsquos total translating to a 48 decrease This is the
lowest number of commercial robberies in nearly three years bull Convenience stores continued to be the common target of commercial robberies in 2006 Approximately
29 of the robberies in 2006 were of convenience stores with the majority of these incidents occurring late at night between 800 pm and midnight
bull Robberies of gas stations declined by 69 helping to contribute to the overall decline in commercial robbery
bull The number of street robberies reported in 2006 increased slightly by four incidents translating to a 2 increase over the previous year Nearly 83 of all street robberies occurred on the street or sidewalk
11
bull The majority of the street robberies throughout the city occurred between 700 pm and 100 am These are common times for street robberies to be reported because people can become targets when they are walking alone late at night distracted or intoxicated
BURGLARY bull Cambridge saw a 10 increase in burglaries between 2005 and 2006 which can be wholly attributed to the
42 increase in commercial burglary bull Construction site breaks alone increased by 24 incidents in 2006 This translates to a 343 increase (7 in
2005 vs 31 in 2006) bull Housebreaks were up 1 in Cambridge in 2006 compared to 2005 increasing from 490 incidents to 496
This total includes 80 housebreaks that were attempted but not completed bull In a number of the summer breaks entry was gained through cut window screens and the perpetrators stole
electronics and money left in plain sight
LARCENY bull There was an overall decrease in larceny incidents in 2006 with the most significant drop coming from the
categories of larceny from building and larceny of license plates down 28 and 29 respectively bull There were 386 larcenies from buildings reported this year representing a 28 decrease from the previous
year This number is considerably below the five-year average of 535 incidents bull The three major hot spots of larcenies from buildings in 2006 were the Cambridgeside Galleria Mall the
Cambridge Rindge and Latin School and Ballyrsquos Health Club bull Larcenies from motor vehicles reached a significant high in 2006 at 754 incidents translating to a 23
increase from the previous year This yearrsquos high is also the decadersquos high bull There were two recurrent larceny from motor vehicle patterns throughout the City in 2006 thefts of GPS
navigation systems and thefts of stereo systems bull The most common method of entry into motor vehicles in 2006 was by breaking one or more windows of
the vehicle This method was reported in half of the incidents bull A two-year increase of larcenies of bicycles in 2004 and 2005 came to a halt in 2006 when only 204
incidents were reported representing a 15 decrease from 2005
AUTO THEFT bull In 2006 Cambridge reported its lowest number of stolen cars in over 20 years with only 233 incidents bull Hondas continue to be the most commonly stolen automobiles constituting 32 of all reports Toyotas
and Fords involved in approximately 25-30 incidents each came in second and third place respectively This information is consistent with historical and national trends
bull The most targeted model in 2006 was the Honda Civic followed by the Toyota Camry and the Honda Accord
bull Approximately 40 of the cars reported stolen in 2006 have been recovered to date The majority of the recovered cars were located throughout Cambridge and Boston
CITYWIDE SHOOTING VICTIMS IN 2006
bull There were 12 shootings in 2006 producing 13 victims with gunshot wounds five victims from four incidents in Area 4 three incidents in Cambridgeport two in InmanHarrington and one each in North Cambridge Riverside and Mid-Cambridge
bull Four of the incidents were during a threendashweek period from late February to mid-March that produced the two homicides recorded in 2006 Arrests were made in both homicide cases
bull Twelve of the gunshot victims were male and one was female bull Ten of the victims were Cambridge residents The other three victims were from Everett Somerville and
Dorchester bull The youngest of the victims was 14 years old the oldest 27 Nine of the thirteen victims were between 19
and 25 years of age bull There were 11 known offenders all males with an average age of 23 Two were Cambridge residents and
nine were non-residents There were also six cases where the offender was not substantiated bull There were arrests made in 6 of the 12 incidents In four of the open cases solid suspects were established
but victims and witnesses were uncooperative In the six incidents involving the arrest of a suspect three cases involved multiple arrestsoffenders
12
NNAATTIIOONNAALLRREEGGIIOONNAALL CCRRIIMMEE CCOOMMPPAARRIISSOONN
Note that the following tables are based on information from the FBIrsquos Uniform Crime Reports and the latest available data available for comparison was from 2005
2005 CRIMES IN CITIES OF 94000-106000 RESIDENTS NATIONWIDE
City Murder Rape Robbery Assault Burglary Larceny Auto Theft Total
Albany NY 8 68 439 760 1328 3186 369 6158 Allentown PA 21 45 512 285 1393 3905 473 6634 Arvada CO 2 23 52 119 524 2772 581 4073 Athens-Clarke County GA 5 41 135 176 1047 4185 361 5950 Berkeley CA 3 18 354 195 1229 5503 1244 8546 Brockton MA1 10 47 211 NA 687 2282 738 3975 Burbank CA 3 13 67 163 586 1690 495 3017 Cambridge MA 3 14 239 244 623 2396 295 3814 Cary NC 0 13 50 70 432 1428 103 2096 Charleston SC 10 49 290 654 810 3464 482 5759 Compton CA 65 40 474 1152 638 971 1006 4346 Daly City CA 2 20 122 142 251 39 468 1044 Davenport IA 7 54 272 990 1451 5213 416 8403 Dearborn MI 3 30 223 315 651 3191 1082 5495 Denton TX 5 72 76 225 684 3180 246 4488 Erie PA 6 75 200 191 632 2129 106 3339 Everett WA 3 48 173 313 1272 4243 2085 8137 Fairfield CA 9 38 218 320 748 2876 836 5045 Gary IN 58 70 306 284 1593 2556 1161 6028 Gresham OR 3 69 148 280 882 3216 1249 5847 Livonia MI 3 13 62 92 444 1574 383 2571 Lowell MA 2 41 213 753 644 1942 689 4284 Macon GA 20 58 332 406 2028 6124 1065 10033 Miami Gardens FL 11 57 540 1305 1395 4235 968 8511 Miramar FL 3 35 152 296 939 1831 442 3698 Mission Viejo CA 2 3 36 69 225 953 81 1369 Odessa TX 3 12 72 503 756 2785 179 4310 Portsmouth VA 22 41 366 472 1049 3708 407 6065 Pueblo CO 13 22 162 489 1525 4978 478 7667 Richardson TX 2 12 98 149 764 2437 277 3739 Richmond CA 40 35 526 573 1062 2350 2396 6982 Santa Clara CA 5 18 49 118 553 2470 397 3610 South Gate CA 6 19 305 197 444 1164 1289 3424 Vacaville CA 2 23 69 168 353 1899 266 2780 Ventura CA 1 19 107 170 815 2695 401 4208 Wichita Falls TX 6 43 239 445 1703 5386 552 8374 Woodbridge Township NJ 2 17 81 203 347 2168 294 3112 Average 10 36 215 359 879 2895 658 5052 Cambridge MA 3 14 239 244 623 2396 295 3814
13
Among similarly sized cities in 2005 Cambridge ranked below the nationwide average for all but one of the index crimes (robbery) Overall the total number of serious crimes in Cambridge ranked 25 below than the national average of similarly sized cities Again statistics for 2005 are the latest available from cities of similar size to Cambridge for comparative analysis
How Cambridge Compares Nationally in 2005
Murder 70 lower than the national average per 100000 inhabitants Rape 61 lower than the national average per 100000 inhabitants continuing the downward trend which began in 1998
Robbery 11 higher than the national average per 100000 inhabitants likely resulting from the close proximity of Cambridge to other large cities
Assault 32 below the national average per 100000 inhabitants
Burglary 29 below the national average per 100000 inhabitants continuing the downward trend which began in the early 1980s
Larceny 17 below the national average Larceny typically accounts for the highest percentage of index crimes in Cambridge but traditionally reports lower numbers than the national average
Auto Theft 55 below the national average per 100000 inhabitants
2005 TOTAL NUMBER AND RATE OF CRIMES IN SELECT MASSACHUSETTS CITIES AND TOWNS
Total City Population Murder Rape Robbery Assault Burglary Larceny Auto Theft Total Rate Medford 54047 1 8 47 15 327 944 189 1531 2833
Brockton1 94746 10 47 211 NA 687 2282 738 3975 4195 Lynn 89234 5 12 270 783 816 1527 582 3995 4477 Chicopee 54686 2 27 46 268 479 1048 223 2093 3827 Lawrence 71659 0 17 159 408 601 577 533 2295 3203 Cambridge 101355 3 14 239 244 623 2396 295 3814 3763 Lowell 103370 2 41 213 753 664 1942 689 4304 4164 New Bedford 93720 8 52 257 707 877 1924 315 4140 4417 Haverhill 60315 0 13 52 231 593 708 116 1713 2840 Somerville 75412 1 7 139 115 521 833 319 1935 2566 Framingham 65416 0 12 48 124 312 1025 219 1740 2660 Quincy 89661 2 26 92 219 387 883 152 1761 1964
Brookline1 56032 0 7 59 NA 219 749 45 1079 1926 Waltham 32513 0 1 15 46 116 518 518 1214 3734 Newton 83570 1 6 15 92 269 783 46 1212 1450 Average 75049 2 19 124 308 499 1209 332 2453 3201 Cambridge 101355 3 14 239 244 623 2396 295 3814 3763
Rate is calculated per 100000 residents Statistics for 2005 for select Massachusetts cities are the latest available for comparative analysis with Cambridge 1 Note that assault statistics for the City of Brockton and Brookline were unavailable There were approximately 3762 crimes per 100000 residents in Cambridge Note that this number does not reflect the increased daytime population which exceeds 250000 people on any given day
14
15
Please note the Crime Clock should be viewed with care Being the most aggregate representation of Cambridgecrime data it is designed to convey the annual reported crime experience by showing the relative frequency ofoccurrence of the index offenses This mode of display should not be taken to imply regularity in the commission ofcrimes rather it represents the annual ratio of crime to fixed time intervals
CCIITTYY OOFF CCAAMMBBRRIIDDGGEE CCRRIIMMEE CCLLOOCCKK
22000066
1
Index Crime Offense Every 2 hours
Violent Crime Every 19 hours
1 Murder Every 183 days
1 Rape Every 33 days
1 Robbery Every 42 hours
Aggravated Assault Every 37 hours
Property CrimeEvery 3 hours1
1
1 Burglary Every 13 hours
1 Larceny Every 4 Hours
1 Auto Theft Every 38 Days
1
16
FFAACCTTOORRSS CCOONNTTRRIIBBUUTTIINNGG TTOO CCRRIIMMEE
Throughout the 2006 Annual Report the Department tries to place statistics in contextmdashto explain why crime occurs in a particular area instead of just where and how often It is impossible however to analyze every crime factor within the pages of this report As a general rule readers should consider the following factors when gauging the relative safety of any city neighborhood or business district The FBI in its Uniform Crime Reports provides most of these factors Factor General Effect Status in Cambridge Effects in Cambridge Residential Population amp Population Density
High population leads to higher residential crime rate (residential burglaries larcenies from motor vehicles domestic assaults auto theft) High population density also leads to a higher residential crime rate
Population of about 101000 Very high density (about 15000 per square mile)
Higher residential crime rate than cities of fewer than 100000 Higher residential crime rate in densely populated neighborhoods
of Mid-Cambridge North Cambridge Cambridgeport Low residential crime rate in sparsely populated areas of
Cambridge Highlands Strawberry Hill Agassiz
Commerical amp Educational Population number amp type of commercial establishments and educational institutions
High commercial population leads to more ldquobusinessrdquo crimes (commercial burglaries shoplifting larcenies from buildings forgery) and to more crimes against the person often committed in commercial areas (larcenies from the person larcenies from motor vehicles larcenies of bicycles street robbery auto theft)
Very high commercial population (many large businesses shopping areas in Cambridge) and very high educational population (MIT and Harvard)
High overall larceny rate High larceny rate in highly-populated commercial areas of East
Cambridge Harvard Square Central Square Porter Square Fresh Pond Mall
High auto theft rate in East Cambridge MIT Area Low larceny auto theft rate in Agassiz Strawberry Hill West
Cambridge
Age composition of population
A higher population in the ldquoat riskrdquo age of 15ndash24 leads to a higher crime rate
22 percent of the citizens of Cambridge are in the ldquoat riskrdquo populationThis number is influenced by the high student population
Agassiz MIT and Riverside have the largest percentage of people in the ldquoat riskrdquo ages but most of them are college students which somewhat decreases their chances of involvement in criminal activity Consequently Agassiz MIT and Riverside do not have higher than average crime rates
However neighborhoods with the lowest numbers of ldquoat riskrdquo agesmdashWest Cambridge Cambridge Highlands and Strawberry Hillmdashdo experience smaller amounts of crime
Stability of Population Stable close-knit populations have a lower overall crime rate than transient populations Neighborhoods with more houses and condominiums (generally signifiying a more stable population) have a lower crime rate than neighborhoods with mostly apartments (generally a more transient population)
Historically stabler population west of Harvard Square more transient population east of Harvard Square This is changing rapidly with gentrification taking place in neighborhoods adjacent to Central Square
Lower comparative crime rate in neighborhoods of West Cambridge Highlands Peabody Agassiz Strawberry Hill
Higher comparative crime rate in Mid-Cambridge Area 4 Cambridgeport This however is changing with the stabilization and gentrification of housing in these areas
17
Street Layout Areas with major streets offering fast getaways and mass transportation show more crime clusters than neighborhoods with primarily residential streets
A mix of major and minor streets Higher auto theft rates in MIT East Cambridge Cambridgeport where thieves can make a quick jump over the bridge to Boston
Higher commercial burglary rate in North Cambridge with multiple avenues of escape into nearby towns
Proximity to Public Transportation
Criminals are often indigent and cannot afford cars or other expensive forms of transportation Areas near public transportation and particularly subways witness a higher crime ratemdashparticularly robbery and larcenymdashthan more inaccessable areas
Major public transportation system offering high-speed rapid transit throughout most of the city
Contributes to clusters of crime around Central Square Harvard Square Porter Square and Alewife though not much around Lechmere and Kendall Square
Neighborhoods distant from rapid transitmdashWest Cambridge Highlands and Strawberry Hillmdashshow lower crime rate with few clusters
Economic conditions including poverty level and unemployment rate
Again criminals are often indigent Areas afflicted by poverty show higher burglary robbery and larceny rates than middle-class or wealthy neighborhoods
Little abject poverty in Cambridge This factor probably contributes little to the picture of crime in Cambridge
Possibly some effect on Area 4mdashthe neighborhood with the lowest mean incomemdashthough Strawberry Hill which has the second lowest mean income also has one of the lowest crime rates in the city Other factors on this list probably have a much greater role than economic conditions
Family conditions with respect to divorce and family cohesiveness
Larry J Siegel author of Criminology says ldquoFamily relationships have for some time been considered a major determinant of behavior Youths who grow up in a household characterized by conflict and tension where parents are absent or separated or where there is a lack of familial love and support will be susceptible to the crime-promoting forces in the environmentrdquo
According to census data about one third of the families in Cambridge with children are single-parent families In the Commonwealth of Massachusetts as a whole this percentage is slightly lessmdashabout one quarter
The neighborhoods with the highest percentage of single-parent families are Area 4 Cambridgeport Riverside and North Cambridge With the exception of Riverside these neighborhoods also have a higher than mean crime rate However there are a far greater number of factors influencing ldquoconflict and tensionrdquo and ldquofamilial love and supportrdquo than just the number of parents in the household In the end no conclusions can be drawn without more data
Climate Warmer climates and seasons tend to report a higher rate of larceny auto theft and juvenile-related crime while cold seasons and climates report more robberies and murder
A varied climate warm and moist summers cool autums long cold winters
High overall larceny auto theft rate in the summer Higher overall robbery rate in the winter Burglary rate less tied to climate than to specific weather
conditions rain and snow produce fewer burglaries
Operational and investigative emphasis of the police department
Problem-oriented informed police departments have more success controlling certain aspects of crime than other departments
A problem-oriented department with an emphasis on directed patrol and investigation and on crime analysis including quick identification of crime patterns and rapid intervention to curtail them
Lower overall crime rate across the city than would be expected for a city of our size and characteristics
Attitude of the citizenry toward crime including its reporting practices
Populations that have ldquogiven uprdquo on crime and the police experience an exacerbation of the crime problem
A population that works closely with the police creates numerous neighborhood crime watches and is likely to report crimes
Lower overall crime rate across the city than would be expected for a city of our size and characteristics
18
0
5
10
15
20
25
Jan Feb Mar Apr May Jun Jul Aug Sep Oct Nov Dec
CCHHRROONNOOLLOOGGIICCAALL HHIIGGHHLLIIGGHHTTSS
0
10
20
30
40
50
60
70
Jan Feb Mar Apr May Jun Jul Aug Sep Oct Nov Dec
STREET ROBBERY
HOUSEBREAKS
There was a series of housebreaks along the CambridgeSomerville border which ended in the Somerville arrest of two individuals in early April They were believed to be responsible for over a dozen breaks along the boarder
Two patterns developed in the third quarter One took place during the daytime in InmanHarrington on the border of Sectors 1 amp 2 Entry was gained through unlocked windows and electronics were targeted The other took place in the early morning hours of the weekend in Sector 3 Arrests were made in both locations
A pattern developed in Area 4 at the end of February in which all victims were threatened with a gun and demanded to hand over their wallets Most victims were male and walking alone late at night
In mid to late April there was a pattern of pack robberies (mostly in InmanHarrington) in which juveniles targeted male victims Money and Ipods were the only items stolen Force was used or a weapon shown in four incidents
Mid-Cambridge had a pattern of housebreaks during the second quarter in which over 30 burglaries were reported Laptops digital cameras and Ipods were the common targets during the breaks
There were no identifiable patterns in the third quarter Area 4 and Peabody had the highest number of robberies through these months Six street robbery arrests took place throughout the city during this quarter
Sectors 1 and 2 saw an increase in street robberies with a weekend pattern in October that carried over into November This pattern significantly decreased with the arrest of three juveniles from Chelsea in late November
Sector 3 daytime housebreaks took place throughout the fourth quarter Entry was gained by prying open front doors Over 23 laptops were stolen in this pattern
19
020406080
100120140160
Jan Feb Mar Apr May Jun Jul Aug Sep Oct Nov Dec
0
1
2
3
4
5
6
7
Jan Feb Mar Apr May Jun Jul Aug Sep Oct Nov Dec
05
101520253035
Jan Feb Mar Apr May Jun Jul Aug Sep Oct Nov Dec
COMMERCIAL ROBBERY
COMMERCIAL BREAKS
LARCENY FROM MOTOR VEHICLE LARCENY FROM PERSON LARCENY FROM BUILDING
One convenience store was targeted three times throughout JanuaryFebruary There were three gas station robberies down from seven in last yearrsquos first quarter
The same convenience store was robbed again but an arrest was made this time In addition there were two retail robberies and one bank robbery
In July there were two gas station robberies and robberies at a restaurant and a market All other incidents resulted in arrests one was at a convenience store and the other two were banks
There were five bank robberies throughout the fourth quarter resulting in three arrests A Cambridge motel was robbed twice by two unknown suspects Four conveniencefast food stores were also targeted one arrest was made
There was a sporadic trend of breaks into convenience and drug stores targeting lottery tickets
These two quarters saw a dramatic increase in commercial breaks due to a number of construction site breaks for copper and equipment Toward the end of the third quarter thieves switched to stealing copper from residential homes which accounted for the decline in September Nine people were arrested in six of the breaks from April to September
December saw a pattern of breaks in InmanHarrington and Area 4 in which 17 businesses were broken into Cash registers and safes were usually targeted However in ten of the incidents nothing was reported stolen
Larcenies from persons significantly increased through September and October in Harvard amp Central Squares Thieves targeted items left unattended or hanging on the backs of chairs September - December also reported the highest number of larcenies from buildings with an increase in health club and school thefts
June - August experienced a pattern of car breaks in Peabody and Agassiz The most commonly stolen items were stereos Ten arrests were made in five of the incidents with the pattern cooling after the arrest of three juveniles at the end of August
The theft of GPS systems in January and March accounted for the spikes in crime during the first quarter Six people were arrested in connection with three of the incidents during this time
2
Predominant Occupations of Cambridge Residents Education Training Library hellip15 Office and Administrative Support hellip116 Managementhellip86
Established
1636 (town) 1846 (city)
Government Council-Manager City Manager Robert W Healy
City Budget $395500000 (FY06) City Employees 1384 (excluding schools)
Area 713 square miles total 643 square miles land
Population Households
101355 (2000 Census) 38336 (2000 Census)
Police OfficerPopulation Ratio 1390 Population Density 15763 per square mile
Registered Voters Total Registered Auto Mobiles
39293 56282 (January 2002)
Total Residential Housing Units 44725 413 families (2000)
Ownership Rate 32 Median Household Income
Median Family Income Average Family Income
$47979 (1999) $59423 (1999) $90791 (1999)
Unemployment Rate 28 (March 2004) Average Single-Family Home $610000 (2002)
Property Tax Rate per Thousand
School Enrollment 1999 ndash 2000
921 residential 2339 commercial 7491
Colleges and Universities 9 Hospitals 5
CCIITTYY OOFF CCAAMMBBRRIIDDGGEE AATT AA GGLLAANNCCEE
Top Ten Employers (2006) 1) Harvard (10068) 2) MIT (7864) 3) City of Cambridge (2819) 4) Mt Auburn Hospital (1813) 5) Cambridge Health Alliance (1567) 6) Federal Government (1514) 7) Biogen (1434) 8) Genzyme Corp (1370) 9) Novartis (1200) 10) Millennium Pharmaceuticals (1175)
3
CAMBRIDGE POLICE DEPARTMENT AT A GLANCE
Organized 1859
Sworn Officers 275 Civilian Personnel 37
Commissioner Ronnie Watson (retired March 2007)
Headquarters 5 Western Avenue Cambridge MA 02139
Budget (FY 05) $34188000 Rank Structure Commissioner
Superintendent Deputy Superintendent Captain Lieutenant Sergeant Patrol Officer
Marked Patrol Vehicles 31 Unmarked Patrol Vehicles 31
Motorcycles 14 Bicycles 12
Special Vehicles 9 2006 Total Calls for Service 93800
2006 Total Index Crimes 3753
CC RR II MM EE AA NN AA LL YY SS II SS II NN CC AA MM BB RR II DD GG EE
Cambridge Age Structure Age 2000 Population Percentage
0-4 4125 41 5-17 9322 92 18- 24 21472 211 25-34 25202 249 35-44 13942 138 45-64 18010 178 65+ 9282 91
Population by race 1980 1990 2000
White 795 716 68 Black 106 127 12 Asian 38 84 12 Hispanic 48 68 7 Native American 2 3 - Other 12 4 1
Crime Analysis is the process of turning crime data into information and then turning that information intoknowledge about crime and safety in a particular community While it is a growing field across this country andinternationally Cambridge has had a Crime Analysis Unit in operation for over 27 years The function of the Crime Analysis Unit (CAU) is to support the daily operations of the Police Department bycollecting managing and analyzing crime calls for service and other data The CAU also works together withanalysts from neighboring departments to address cross-jurisdictional patterns By making timely observations of emerging crime patterns hot spots and other crime problems the Cambridge CrimeAnalysis Unit ultimately aims to assist the Department in its criminal apprehension and crime reduction strategies
4
Traffic
FirstPlatoon
Day Patrol
FourthPlatoon
ThirdPlatoon
SecondPlatoon
Night Patrol
School Resourse Officer
Auxiliary
Bicycle Patrol
CrimePrevention
CommunityRelations
Operations
Legal PlanningBudget
amp Personnel
Quality Control Media Relations
Office of the Commissioner
WarrantApprehension
amp Dignitary Protection
Sexual Assault
Domestic Violence
SpecialInvestigations
Major Crime
GeneralAssignment
Investigations
Accreditation
Certifications
Tactical
In-Service
Training
Crime Analysis
Grants
RMS
Information Services
TechnicalServices
Identification
Propertyamp Evidence
FleetMaintenance
Facilities Maintenance
Off-DutyEmployment
Records
CourtProsecutor
Administration
TrainingTechnical
amp Administration
Support Services
Commissioner
CCAA MMBB RR IIDD GG EE PPOOLL IICC EE DDEEPP AA RR TTMM EENN TT
OORRGGAANNIIZZAATTIIOONNAALL CCHHAARRTT
5
AA FF AA RR EE WW EE LL LL MM EE SS SS AA GG EE FF RR OO MM TT HH EE CC OO MM MM II SS SS II OO NN EE RR
It is my pleasure to present the Cambridge Police Departmentrsquos Annual Crime Report 2006 the eleventh Annual
Report produced during my tenure as Commissioner This will also be the final Annual Report produced under my leadership in Cambridge as I will be retiring in March of 2007 The objective of this report is to give Cambridge residents a realistic view of their risk of victimization and to provide detailed information on criminal activity in our City The 3753 serious crimes recorded in Cambridge in 2006 represent the Cityrsquos lowest Uniform Crime Reporting Index number reported to the FBI in over 40 years This number represents a decline of 2 from the previous low of 3814 crimes reported in 2005 This is only the third time since 1960 that the City of Cambridge has recorded fewer than 4000 serious crimes Further analysis of the 2006 figures indicates that property crime remained relatively unchanged in Cambridge this year with only a 1 reduction translating to 19 fewer incidents than in 2005 A 10 increase in burglary over the year was counteracted by drops in both auto thefts and larcenies to produce this overall decline Violent crime on the other hand experienced decreases in all categories resulting in an 8 drop when compared with the 2005 figures
Despite the recent reductions in crime the Cambridge Police Department continues to work as hard as ever to improve the conditions in which people live and work everyday in this great city One way the City of Cambridge has strived to do this is through an increased focus on social services throughout the city with an emphasis on providing safer after-school environments for children Programs offered through Tutoring Plus the Margaret Fuller Neighborhood House the North Cambridge Crime Task Force and other neighborhood organizations are all part of the citywide effort to keep our children safe In addition the Police Department is now taking a more proactive approach to reducing violent crime Investigations of crime in the city have revealed that a small number of individuals are often responsible for a large number of violent crimes Therefore one of the focuses this year has been to increase targeted surveillance of those particular individuals in an attempt to stop more crime from occurring or at least to improve the chances of successfully apprehending suspects when crimes do occur This initiative has also included an increased uniformed presence in area parks and other locations reporting increased violence Even as overall violent crime figures decline in Cambridge fighting violence must remain a top priority
As my time in this Department grows short I look back at my years here in Cambridge and I am proud of the work that
has been done and the positive changes that have been made The move towards community policing and citizen involvement over the years through such initiatives as the Neighborhood Sergeants Program has proved to be beneficial for both the Department and the community as a whole By improving the Police Departmentrsquos ability to communicate and foster partnerships with the citizens of Cambridge we have enhanced our image in the community and our ability to prevent and investigate crime There has also been a significant improvement in the association between the Police Department and the Police Review amp Advisory Board transitioning from a relationship of contention to one of professionalism and cooperation This cooperation in turn has led to an advancement in police performance and a reduction in complaints brought against the Department
In the future it is imperative that this Department remain constantly alert to the effect that the violence in other
communities has on Cambridge We must continue to monitor the activity of surrounding communities to ensure that the spillover from those communities does not adversely affect this city We must be vigilant to the quality of life issues that affect those who live and work here I am confident that the Cambridge Police Department will accomplish this mission as it transitions to new leadership
That being said the 2006 Annual Crime Report is one of the many resources the Cambridge Police Department provides to the citizens of Cambridge This Department is committed to providing timely and relevant information to the community and I urge you to visit our website at httpwwwcambridgepoliceorg for current information on crime and for important community alerts Armed with this knowledge the community and the Police Department can work together to develop effective strategies to ensure a high quality of life and to reduce crime and fear in the City of Cambridge
Ronnie Watson Police Commissioner
6
AA MM EE SS SS AA GG EE FF RR OO MM PP OO LL II CC EE CC OO MM MM II SS SS II OO NN EE RR RR OO BB EE RR TT CC HH AA AA SS
It is my pleasure to be a part of the Cambridge Police Departmentrsquos Annual Crime Report 2006 the first Annual Report produced since my appointment by Robert W Healy as Police Commissioner on April 9 2007
I would like to take this opportunity to thank members of the department for their hard work and support over the past few weeks I realize that this continues to be an important project for the department and is valuable to personnel city officials and the community The thoughtful planning of the 2006 Annual Report has presented the police department with an exciting opportunity with the departure of Commissioner Ronnie Watson and my appointment The Department will remain committed to providing timely and relevant information to the community I urge you to visit our website at httpwwwcambridgepoliceorg for current information on crime and community alerts I look forward to working with the community to develop strategies to ensure a high quality of life and to reduce crime and the elements that impact crime Sincerely
Robert C Haas Police Commissioner
FF OO RR EE WW OO RR DD
The Cambridge Police Departmentrsquos 2006 Annual Crime Report is an attempt to provide detailed information
so that citizens can make informed decisions about crime and safety in their neighborhoods The more information made available to the public the better the input will be in aiding the Police response to crime
The Annual Report offers a comprehensive analysis of the crimes reported by the Cambridge Police Department to the Federal Bureau of Investigationrsquos Uniform Crime Reporting (UCR) Program The UCR Program has been collecting national crime statistics from local police departments since 1930 Based on seriousness and frequency police departments are required to report their statistics on seven crimes which comprise the UCR Crime Index murder forcible rape aggravated assault robbery burglary larceny and auto theft The problem for the public as well as for the police is that UCR statistics alone are of little use to patrol deployment and offer little to citizens interested in reducing their risks The true picture of crime and disorder in a city is seldom conveyed to the public through simple statistics Crimes are complex events and these complexities encompass many dimensions It is our endeavor in this report to unravel the web of factors that comprise the crime rate The publication of detailed neighborhood crime statistics patterns and trends gives Cantabridgians a realistic view of their risks of victimization The Neighborhood and Business District sections within the Annual Crime Report are designed to help residents business owners and visitors have a fuller understanding of crime problems in their areas This report outlines three distinctions that make up criminal incidents (1) whether offenses are committed against strangers or against relatives and acquaintances (2) the motivation of the criminalsmdashdrugs revenge or intimidation are but a few of the factors that motivate both novice and career criminals and (3) when and where crimes occur focusing on where the hotspots are and the best time frames for the majority of the incidents Outlining these factors is imperative to understanding the anatomy of crime in Cambridge and to developing appropriate responses
The rise and fall of the crime rate will always be with us To hold that tide in check it will take a partnership comprised of not just the Police and citizens but also every city agency the business community public service providers and church leaders The goal of the Annual Report is to provide this partnership with the knowledge to ensure the desired quality of life in all the neighborhoods of the City
Cambridge Police Department Crime Analysis Unit
7
22000066 CCRRIIMMEE IINNDDEEXX
The Crime Index is composed of selected offenses used to gauge fluctuations in the overall volume and rate of crime reported to police The offenses included are the violent crimes of murder rape robbery and aggravated assault and the property crimes of burglary larceny and auto theft The Crime Index was developed by the Federal Bureau of Investigationrsquos Uniform Crime Reporting program to standardize the way in which law enforcement agencies report crime statistics Crime 2003 2004 2005 2006 2005-2006
Change
Murder 3 0 3 2 Inc
Rape 7 10 14 11 Inc
Stranger 1 0 3 2 Inc
Non-Stranger 6 10 11 9 Inc
Robbery 229 245 239 208 -13
Commercial 41 60 73 38 -48
Street 188 185 166 170 +2
Aggravated Assault 271 248 244 237 -3
Total Violent Crime 510 503 500 458 -8
Burglary 651 724 623 685 +10
Commercial 134 139 133 189 +42
Residential 517 585 490 496 +1
Larceny 2389 2654 2396 2377 -1
from Building 518 572 539 386 -28
from Motor Vehicle 657 734 615 754 +23
from Person 331 381 343 337 -2
of Bicycle 212 229 241 204 -15
Shoplifting 358 383 403 342 -15
from Residence 183 226 175 246 +41
of License Plate 75 67 42 30 -29
of Services 24 30 19 21 +11
Miscellaneous 31 32 19 57 +200
Auto Theft 419 438 295 233 -21
Total Property Crime 3459 3816 3314 3295 -1
Crime Index Total 3969 4319 3814 3753 -2 Note Inc = percentages are not calculated for numbers so small so as to prevent a statistically misleading percentage
8
Please Note Due to reclassification year to year final numbers are subject to change
CC AA MM BB RR II DD GG EE UU NN II FF OO RR MM CC RR II MM EE RR EE PP OO RR TT SS TT AA TT II SS TT II CC SS 11 99 88 77 -- 22 00 00 66
1987
1988
1989
1990
1991
1992
1993
1994
1995
1996
1997
1998
1999
2000
2001
2002
2003
2004
2005
2006
Crime
Avg
198
7-19
96
Avg
199
7-20
06
Avg
198
7-20
06
C
hang
e 20
05-2
006
Cha
nge
1997
-200
6
Murder 2 7 7 3 5 2 2 1 3 1 2 2 2 1 1 6 3 0 3 2 3 2 3 Inc No change
Rape 36 30 25 29 38 33 30 28 35 34 24 25 15 11 15 10 7 10 14 11 32 14 23 -21 -54 Robbery 417 402 460 431 399 286 253 276 295 227 176 208 165 186 181 195 229 245 239 208 345 203 274 -13 +18 Aggravated Assault 340 371 365 614 567 551 643 473 463 381 370 369 348 322 272 284 271 248 244 237 477 297 387 -3 -36
Burglary 1477 1337 1621 1470 1098 866 929 774 953 791 596 695 567 552 688 720 651 724 623 685 1132 650 891 +10 +15 Larceny Theft 3229 3127 3692 3136 3363 3326 3563 3351 3313 2973 2779 2753 2819 2820 2740 2764 2389 2654 2396 2377 3307 2649 2978 -1 -14
Auto Theft 1152 1175 1170 1353 1012 887 964 761 558 544 483 397 431 498 523 425 419 438 295 233 958 414 686 -21 -52 Total Violent 795 810 857 1077 1009 872 928 778 796 643 572 604 530 520 469 495 510 503 500 458 857 516 686 -8 -20
Total Property 5858 5639 6483 5959 5473 5079 5456 5086 4824 4308 3858 3845 3817 3870 3951 3909 3459 3816 3314 3295 5417 3713 4565 -1 -15
Total 6653 6449 7340 7036 6482 5951 6384 5664 5620 4951 4430 4449 4347 4390 4420 4404 3969 4319 3814 3753 6253 4230 5241 -2 -15 Note Inc = percentages are not calculated for numbers so small so as to prevent a statistically misleading percentage The Cambridge Police Department voluntarily submits Uniform Crime Report statistics to the FBI for national comparison See httpwwwfbigovucrucrhtm for more information Percent changes are rounded to the nearest whole number A 0 change means that there was less than a 5 increase or decrease
9
2255--YY EE AA RR SS TT AA TT II SS TT II CC AA LL TT RR EE NN DD SS
0
1000
2000
3000
4000
5000
6000
7000
8000
9000
1982
1984
1986
1988
1990
1992
1994
1996
1998
2000
2002
2004
2006
0
200
400
600
800
1000
1200
1982
1984
1986
1988
1990
1992
1994
1996
1998
2000
2002
2004
2006
Cambridge reported its lowest amountof crime in over 40 years in 2006 Thetotal crime index has fallen 56 since1982 Serious crime numbers havebeen on a steady decline since the late1970s with the exception of spikes atthe turn of two decades These spikeswere caused by a sharp increase inproperty crimes in 1980 and a sharpincrease in violent crimes in 1990After 1997 the crime rate leveled offfor approximately six years until itdropped by 10 in 2003 A smallincrease in 2004 was countered by twosubsequent decreases in 2005 and2006 Overall crime in Cambridgehas dropped approximately 15 in thepast five years
Total Part I (Index) Crime
Violent crime totals include the crimes ofmurder rape robbery and assault Totalswere fairly unsteady in the 1980s The lateyears of the decade were marked by a greatincrease in incidentsmdashreflective of thenationrsquos epidemic of gang and drugviolence combined with greater reportingof domestic assaults Since 1990 violentcrime totals have been steadily decliningbut have been marked by small spikesevery other year or so This year reportedviolent crimes decreased by 42 incidents(8) from 2005 indicating the lowestnumber in the past 25 years
Total Part I Violent Crime
0
1000
2000
3000
4000
5000
6000
7000
8000
9000
1982
1984
1986
1988
1990
1992
1994
1996
1998
2000
2002
2004
2006
Total Part I Property Crime Property crime totals include burglarylarceny and auto theft Property crimeusually accounts for 80-90 of thePart I total which explains why thegraph to the left mirrors the graph atthe top so closely Totals have fallen57 since 1982 and 15 since 1997Burglary and auto theft haveexperienced significant decreases overthe past two decades but larceny(common theft) has remained fairlysteady Auto theft is at its lowest ratein 50 years After 1997 crime ratesleveled off for approximately sixyears until they dropped by 12 in2003 An increase in 2004 wasfollowed by a decrease of 14 overthe next two years consequently thisyearrsquos totals are lowest in over 40years
10
22000066 EE XX EE CC UU TT II VV EE SS UU MM MM AA RR YY
IMPORTANT FACTS ABOUT THE 2006 INDEX TOTAL The Crime Index is composed of selected offenses used to gauge fluctuations in the overall volume and rate of crime reported to police The offenses included are the violent crimes of murder rape robbery and aggravated assault and the property crimes of burglary larceny and auto theft The Crime Index was developed by the Federal Bureau of Investigationrsquos Uniform Crime Reporting program to standardize the way in which law enforcement agencies report crime statistics The 3753 serious crimes recorded in Cambridge in 2006 represent the Cityrsquos lowest Uniform Crime Reporting Index number reported to the FBI in over 40 years The City of Cambridge has recorded fewer than 4000 serious crimes only three times since 1960 The 2006 decline of 2 with 61 fewer incidents than in 2005 represents the cityrsquos lowest recorded crime index total since the mid ndash1960s Further analysis indicates that violent crime decreased by 8 in 2006 with 42 fewer incidents and property crime declined by 1 with 19 fewer incidents The three biggest declines for 2006 were in commercial robbery (-48) larceny of license plate (-29) and larceny from building (-28) when compared with the 2005 figures MURDER
bull Murders in Cambridge most often fall into three distinct scenarios domestic situations drug or gang related altercations and homeless against homeless street fights Two people died in Cambridge in 2006 as a result of handgun violence among young males in the city
bull Nationally cities of 100000 people average 10 murders per year bull In the first incident Corey Davis 19 was walking down the street when he was shot in a drive by Davis
was shot three times in the back and was pronounced dead later that night A month later US Marshals in Virginia arrested James Miller 23 of Dorchester for Davisrsquo murder In June of 2006 Remele Ahart 21 of Chelsea and Ahmad Bright 17 of Dorchester were also arrested in connection with this murder
bull The second shooting occurred just ten days after Davis was killed Doowensky Nazaire 22 of Somerville died from two gunshot wounds he sustained while standing in front of a club in Cambridge Officers apprehended Elysee Bresilla 28 of Roslindale as he fled from the scene and charged him with murder when Nazaire succumbed to his injuries a short time after the shooting
bull Since 1990 Cambridge has averaged two murders per year which is a decrease from the 30-year period between 1960 and 1989 when the average was slightly less than five per year
RAPE bull Cambridge reported 11 rapes in 2006 a total that remains below the 10-year average of 14 rapes per year bull Nine of the eleven rapes in 2006 were completed acts and two were categorized as attempts bull Five of the nine completed rapes in 2006 were acquaintance rapes where the victim knew the perpetrator bull Since 1980 there has only been one stranger-to-stranger ldquostreetrdquo rape pattern in Cambridge the ldquoRainy
Day Rapistrdquo who preyed on victims in the Fresh Pond area on rainy days in 1981
ROBBERY bull The steady increase in robberies that began in 2002 has reversed over the past two years with an overall
decrease of 15 since 2004 2006rsquos decline of 13 dropped the total to 208 incidents bull Commercial robberies fell by 35 incidents from 2005rsquos total translating to a 48 decrease This is the
lowest number of commercial robberies in nearly three years bull Convenience stores continued to be the common target of commercial robberies in 2006 Approximately
29 of the robberies in 2006 were of convenience stores with the majority of these incidents occurring late at night between 800 pm and midnight
bull Robberies of gas stations declined by 69 helping to contribute to the overall decline in commercial robbery
bull The number of street robberies reported in 2006 increased slightly by four incidents translating to a 2 increase over the previous year Nearly 83 of all street robberies occurred on the street or sidewalk
11
bull The majority of the street robberies throughout the city occurred between 700 pm and 100 am These are common times for street robberies to be reported because people can become targets when they are walking alone late at night distracted or intoxicated
BURGLARY bull Cambridge saw a 10 increase in burglaries between 2005 and 2006 which can be wholly attributed to the
42 increase in commercial burglary bull Construction site breaks alone increased by 24 incidents in 2006 This translates to a 343 increase (7 in
2005 vs 31 in 2006) bull Housebreaks were up 1 in Cambridge in 2006 compared to 2005 increasing from 490 incidents to 496
This total includes 80 housebreaks that were attempted but not completed bull In a number of the summer breaks entry was gained through cut window screens and the perpetrators stole
electronics and money left in plain sight
LARCENY bull There was an overall decrease in larceny incidents in 2006 with the most significant drop coming from the
categories of larceny from building and larceny of license plates down 28 and 29 respectively bull There were 386 larcenies from buildings reported this year representing a 28 decrease from the previous
year This number is considerably below the five-year average of 535 incidents bull The three major hot spots of larcenies from buildings in 2006 were the Cambridgeside Galleria Mall the
Cambridge Rindge and Latin School and Ballyrsquos Health Club bull Larcenies from motor vehicles reached a significant high in 2006 at 754 incidents translating to a 23
increase from the previous year This yearrsquos high is also the decadersquos high bull There were two recurrent larceny from motor vehicle patterns throughout the City in 2006 thefts of GPS
navigation systems and thefts of stereo systems bull The most common method of entry into motor vehicles in 2006 was by breaking one or more windows of
the vehicle This method was reported in half of the incidents bull A two-year increase of larcenies of bicycles in 2004 and 2005 came to a halt in 2006 when only 204
incidents were reported representing a 15 decrease from 2005
AUTO THEFT bull In 2006 Cambridge reported its lowest number of stolen cars in over 20 years with only 233 incidents bull Hondas continue to be the most commonly stolen automobiles constituting 32 of all reports Toyotas
and Fords involved in approximately 25-30 incidents each came in second and third place respectively This information is consistent with historical and national trends
bull The most targeted model in 2006 was the Honda Civic followed by the Toyota Camry and the Honda Accord
bull Approximately 40 of the cars reported stolen in 2006 have been recovered to date The majority of the recovered cars were located throughout Cambridge and Boston
CITYWIDE SHOOTING VICTIMS IN 2006
bull There were 12 shootings in 2006 producing 13 victims with gunshot wounds five victims from four incidents in Area 4 three incidents in Cambridgeport two in InmanHarrington and one each in North Cambridge Riverside and Mid-Cambridge
bull Four of the incidents were during a threendashweek period from late February to mid-March that produced the two homicides recorded in 2006 Arrests were made in both homicide cases
bull Twelve of the gunshot victims were male and one was female bull Ten of the victims were Cambridge residents The other three victims were from Everett Somerville and
Dorchester bull The youngest of the victims was 14 years old the oldest 27 Nine of the thirteen victims were between 19
and 25 years of age bull There were 11 known offenders all males with an average age of 23 Two were Cambridge residents and
nine were non-residents There were also six cases where the offender was not substantiated bull There were arrests made in 6 of the 12 incidents In four of the open cases solid suspects were established
but victims and witnesses were uncooperative In the six incidents involving the arrest of a suspect three cases involved multiple arrestsoffenders
12
NNAATTIIOONNAALLRREEGGIIOONNAALL CCRRIIMMEE CCOOMMPPAARRIISSOONN
Note that the following tables are based on information from the FBIrsquos Uniform Crime Reports and the latest available data available for comparison was from 2005
2005 CRIMES IN CITIES OF 94000-106000 RESIDENTS NATIONWIDE
City Murder Rape Robbery Assault Burglary Larceny Auto Theft Total
Albany NY 8 68 439 760 1328 3186 369 6158 Allentown PA 21 45 512 285 1393 3905 473 6634 Arvada CO 2 23 52 119 524 2772 581 4073 Athens-Clarke County GA 5 41 135 176 1047 4185 361 5950 Berkeley CA 3 18 354 195 1229 5503 1244 8546 Brockton MA1 10 47 211 NA 687 2282 738 3975 Burbank CA 3 13 67 163 586 1690 495 3017 Cambridge MA 3 14 239 244 623 2396 295 3814 Cary NC 0 13 50 70 432 1428 103 2096 Charleston SC 10 49 290 654 810 3464 482 5759 Compton CA 65 40 474 1152 638 971 1006 4346 Daly City CA 2 20 122 142 251 39 468 1044 Davenport IA 7 54 272 990 1451 5213 416 8403 Dearborn MI 3 30 223 315 651 3191 1082 5495 Denton TX 5 72 76 225 684 3180 246 4488 Erie PA 6 75 200 191 632 2129 106 3339 Everett WA 3 48 173 313 1272 4243 2085 8137 Fairfield CA 9 38 218 320 748 2876 836 5045 Gary IN 58 70 306 284 1593 2556 1161 6028 Gresham OR 3 69 148 280 882 3216 1249 5847 Livonia MI 3 13 62 92 444 1574 383 2571 Lowell MA 2 41 213 753 644 1942 689 4284 Macon GA 20 58 332 406 2028 6124 1065 10033 Miami Gardens FL 11 57 540 1305 1395 4235 968 8511 Miramar FL 3 35 152 296 939 1831 442 3698 Mission Viejo CA 2 3 36 69 225 953 81 1369 Odessa TX 3 12 72 503 756 2785 179 4310 Portsmouth VA 22 41 366 472 1049 3708 407 6065 Pueblo CO 13 22 162 489 1525 4978 478 7667 Richardson TX 2 12 98 149 764 2437 277 3739 Richmond CA 40 35 526 573 1062 2350 2396 6982 Santa Clara CA 5 18 49 118 553 2470 397 3610 South Gate CA 6 19 305 197 444 1164 1289 3424 Vacaville CA 2 23 69 168 353 1899 266 2780 Ventura CA 1 19 107 170 815 2695 401 4208 Wichita Falls TX 6 43 239 445 1703 5386 552 8374 Woodbridge Township NJ 2 17 81 203 347 2168 294 3112 Average 10 36 215 359 879 2895 658 5052 Cambridge MA 3 14 239 244 623 2396 295 3814
13
Among similarly sized cities in 2005 Cambridge ranked below the nationwide average for all but one of the index crimes (robbery) Overall the total number of serious crimes in Cambridge ranked 25 below than the national average of similarly sized cities Again statistics for 2005 are the latest available from cities of similar size to Cambridge for comparative analysis
How Cambridge Compares Nationally in 2005
Murder 70 lower than the national average per 100000 inhabitants Rape 61 lower than the national average per 100000 inhabitants continuing the downward trend which began in 1998
Robbery 11 higher than the national average per 100000 inhabitants likely resulting from the close proximity of Cambridge to other large cities
Assault 32 below the national average per 100000 inhabitants
Burglary 29 below the national average per 100000 inhabitants continuing the downward trend which began in the early 1980s
Larceny 17 below the national average Larceny typically accounts for the highest percentage of index crimes in Cambridge but traditionally reports lower numbers than the national average
Auto Theft 55 below the national average per 100000 inhabitants
2005 TOTAL NUMBER AND RATE OF CRIMES IN SELECT MASSACHUSETTS CITIES AND TOWNS
Total City Population Murder Rape Robbery Assault Burglary Larceny Auto Theft Total Rate Medford 54047 1 8 47 15 327 944 189 1531 2833
Brockton1 94746 10 47 211 NA 687 2282 738 3975 4195 Lynn 89234 5 12 270 783 816 1527 582 3995 4477 Chicopee 54686 2 27 46 268 479 1048 223 2093 3827 Lawrence 71659 0 17 159 408 601 577 533 2295 3203 Cambridge 101355 3 14 239 244 623 2396 295 3814 3763 Lowell 103370 2 41 213 753 664 1942 689 4304 4164 New Bedford 93720 8 52 257 707 877 1924 315 4140 4417 Haverhill 60315 0 13 52 231 593 708 116 1713 2840 Somerville 75412 1 7 139 115 521 833 319 1935 2566 Framingham 65416 0 12 48 124 312 1025 219 1740 2660 Quincy 89661 2 26 92 219 387 883 152 1761 1964
Brookline1 56032 0 7 59 NA 219 749 45 1079 1926 Waltham 32513 0 1 15 46 116 518 518 1214 3734 Newton 83570 1 6 15 92 269 783 46 1212 1450 Average 75049 2 19 124 308 499 1209 332 2453 3201 Cambridge 101355 3 14 239 244 623 2396 295 3814 3763
Rate is calculated per 100000 residents Statistics for 2005 for select Massachusetts cities are the latest available for comparative analysis with Cambridge 1 Note that assault statistics for the City of Brockton and Brookline were unavailable There were approximately 3762 crimes per 100000 residents in Cambridge Note that this number does not reflect the increased daytime population which exceeds 250000 people on any given day
14
15
Please note the Crime Clock should be viewed with care Being the most aggregate representation of Cambridgecrime data it is designed to convey the annual reported crime experience by showing the relative frequency ofoccurrence of the index offenses This mode of display should not be taken to imply regularity in the commission ofcrimes rather it represents the annual ratio of crime to fixed time intervals
CCIITTYY OOFF CCAAMMBBRRIIDDGGEE CCRRIIMMEE CCLLOOCCKK
22000066
1
Index Crime Offense Every 2 hours
Violent Crime Every 19 hours
1 Murder Every 183 days
1 Rape Every 33 days
1 Robbery Every 42 hours
Aggravated Assault Every 37 hours
Property CrimeEvery 3 hours1
1
1 Burglary Every 13 hours
1 Larceny Every 4 Hours
1 Auto Theft Every 38 Days
1
16
FFAACCTTOORRSS CCOONNTTRRIIBBUUTTIINNGG TTOO CCRRIIMMEE
Throughout the 2006 Annual Report the Department tries to place statistics in contextmdashto explain why crime occurs in a particular area instead of just where and how often It is impossible however to analyze every crime factor within the pages of this report As a general rule readers should consider the following factors when gauging the relative safety of any city neighborhood or business district The FBI in its Uniform Crime Reports provides most of these factors Factor General Effect Status in Cambridge Effects in Cambridge Residential Population amp Population Density
High population leads to higher residential crime rate (residential burglaries larcenies from motor vehicles domestic assaults auto theft) High population density also leads to a higher residential crime rate
Population of about 101000 Very high density (about 15000 per square mile)
Higher residential crime rate than cities of fewer than 100000 Higher residential crime rate in densely populated neighborhoods
of Mid-Cambridge North Cambridge Cambridgeport Low residential crime rate in sparsely populated areas of
Cambridge Highlands Strawberry Hill Agassiz
Commerical amp Educational Population number amp type of commercial establishments and educational institutions
High commercial population leads to more ldquobusinessrdquo crimes (commercial burglaries shoplifting larcenies from buildings forgery) and to more crimes against the person often committed in commercial areas (larcenies from the person larcenies from motor vehicles larcenies of bicycles street robbery auto theft)
Very high commercial population (many large businesses shopping areas in Cambridge) and very high educational population (MIT and Harvard)
High overall larceny rate High larceny rate in highly-populated commercial areas of East
Cambridge Harvard Square Central Square Porter Square Fresh Pond Mall
High auto theft rate in East Cambridge MIT Area Low larceny auto theft rate in Agassiz Strawberry Hill West
Cambridge
Age composition of population
A higher population in the ldquoat riskrdquo age of 15ndash24 leads to a higher crime rate
22 percent of the citizens of Cambridge are in the ldquoat riskrdquo populationThis number is influenced by the high student population
Agassiz MIT and Riverside have the largest percentage of people in the ldquoat riskrdquo ages but most of them are college students which somewhat decreases their chances of involvement in criminal activity Consequently Agassiz MIT and Riverside do not have higher than average crime rates
However neighborhoods with the lowest numbers of ldquoat riskrdquo agesmdashWest Cambridge Cambridge Highlands and Strawberry Hillmdashdo experience smaller amounts of crime
Stability of Population Stable close-knit populations have a lower overall crime rate than transient populations Neighborhoods with more houses and condominiums (generally signifiying a more stable population) have a lower crime rate than neighborhoods with mostly apartments (generally a more transient population)
Historically stabler population west of Harvard Square more transient population east of Harvard Square This is changing rapidly with gentrification taking place in neighborhoods adjacent to Central Square
Lower comparative crime rate in neighborhoods of West Cambridge Highlands Peabody Agassiz Strawberry Hill
Higher comparative crime rate in Mid-Cambridge Area 4 Cambridgeport This however is changing with the stabilization and gentrification of housing in these areas
17
Street Layout Areas with major streets offering fast getaways and mass transportation show more crime clusters than neighborhoods with primarily residential streets
A mix of major and minor streets Higher auto theft rates in MIT East Cambridge Cambridgeport where thieves can make a quick jump over the bridge to Boston
Higher commercial burglary rate in North Cambridge with multiple avenues of escape into nearby towns
Proximity to Public Transportation
Criminals are often indigent and cannot afford cars or other expensive forms of transportation Areas near public transportation and particularly subways witness a higher crime ratemdashparticularly robbery and larcenymdashthan more inaccessable areas
Major public transportation system offering high-speed rapid transit throughout most of the city
Contributes to clusters of crime around Central Square Harvard Square Porter Square and Alewife though not much around Lechmere and Kendall Square
Neighborhoods distant from rapid transitmdashWest Cambridge Highlands and Strawberry Hillmdashshow lower crime rate with few clusters
Economic conditions including poverty level and unemployment rate
Again criminals are often indigent Areas afflicted by poverty show higher burglary robbery and larceny rates than middle-class or wealthy neighborhoods
Little abject poverty in Cambridge This factor probably contributes little to the picture of crime in Cambridge
Possibly some effect on Area 4mdashthe neighborhood with the lowest mean incomemdashthough Strawberry Hill which has the second lowest mean income also has one of the lowest crime rates in the city Other factors on this list probably have a much greater role than economic conditions
Family conditions with respect to divorce and family cohesiveness
Larry J Siegel author of Criminology says ldquoFamily relationships have for some time been considered a major determinant of behavior Youths who grow up in a household characterized by conflict and tension where parents are absent or separated or where there is a lack of familial love and support will be susceptible to the crime-promoting forces in the environmentrdquo
According to census data about one third of the families in Cambridge with children are single-parent families In the Commonwealth of Massachusetts as a whole this percentage is slightly lessmdashabout one quarter
The neighborhoods with the highest percentage of single-parent families are Area 4 Cambridgeport Riverside and North Cambridge With the exception of Riverside these neighborhoods also have a higher than mean crime rate However there are a far greater number of factors influencing ldquoconflict and tensionrdquo and ldquofamilial love and supportrdquo than just the number of parents in the household In the end no conclusions can be drawn without more data
Climate Warmer climates and seasons tend to report a higher rate of larceny auto theft and juvenile-related crime while cold seasons and climates report more robberies and murder
A varied climate warm and moist summers cool autums long cold winters
High overall larceny auto theft rate in the summer Higher overall robbery rate in the winter Burglary rate less tied to climate than to specific weather
conditions rain and snow produce fewer burglaries
Operational and investigative emphasis of the police department
Problem-oriented informed police departments have more success controlling certain aspects of crime than other departments
A problem-oriented department with an emphasis on directed patrol and investigation and on crime analysis including quick identification of crime patterns and rapid intervention to curtail them
Lower overall crime rate across the city than would be expected for a city of our size and characteristics
Attitude of the citizenry toward crime including its reporting practices
Populations that have ldquogiven uprdquo on crime and the police experience an exacerbation of the crime problem
A population that works closely with the police creates numerous neighborhood crime watches and is likely to report crimes
Lower overall crime rate across the city than would be expected for a city of our size and characteristics
18
0
5
10
15
20
25
Jan Feb Mar Apr May Jun Jul Aug Sep Oct Nov Dec
CCHHRROONNOOLLOOGGIICCAALL HHIIGGHHLLIIGGHHTTSS
0
10
20
30
40
50
60
70
Jan Feb Mar Apr May Jun Jul Aug Sep Oct Nov Dec
STREET ROBBERY
HOUSEBREAKS
There was a series of housebreaks along the CambridgeSomerville border which ended in the Somerville arrest of two individuals in early April They were believed to be responsible for over a dozen breaks along the boarder
Two patterns developed in the third quarter One took place during the daytime in InmanHarrington on the border of Sectors 1 amp 2 Entry was gained through unlocked windows and electronics were targeted The other took place in the early morning hours of the weekend in Sector 3 Arrests were made in both locations
A pattern developed in Area 4 at the end of February in which all victims were threatened with a gun and demanded to hand over their wallets Most victims were male and walking alone late at night
In mid to late April there was a pattern of pack robberies (mostly in InmanHarrington) in which juveniles targeted male victims Money and Ipods were the only items stolen Force was used or a weapon shown in four incidents
Mid-Cambridge had a pattern of housebreaks during the second quarter in which over 30 burglaries were reported Laptops digital cameras and Ipods were the common targets during the breaks
There were no identifiable patterns in the third quarter Area 4 and Peabody had the highest number of robberies through these months Six street robbery arrests took place throughout the city during this quarter
Sectors 1 and 2 saw an increase in street robberies with a weekend pattern in October that carried over into November This pattern significantly decreased with the arrest of three juveniles from Chelsea in late November
Sector 3 daytime housebreaks took place throughout the fourth quarter Entry was gained by prying open front doors Over 23 laptops were stolen in this pattern
19
020406080
100120140160
Jan Feb Mar Apr May Jun Jul Aug Sep Oct Nov Dec
0
1
2
3
4
5
6
7
Jan Feb Mar Apr May Jun Jul Aug Sep Oct Nov Dec
05
101520253035
Jan Feb Mar Apr May Jun Jul Aug Sep Oct Nov Dec
COMMERCIAL ROBBERY
COMMERCIAL BREAKS
LARCENY FROM MOTOR VEHICLE LARCENY FROM PERSON LARCENY FROM BUILDING
One convenience store was targeted three times throughout JanuaryFebruary There were three gas station robberies down from seven in last yearrsquos first quarter
The same convenience store was robbed again but an arrest was made this time In addition there were two retail robberies and one bank robbery
In July there were two gas station robberies and robberies at a restaurant and a market All other incidents resulted in arrests one was at a convenience store and the other two were banks
There were five bank robberies throughout the fourth quarter resulting in three arrests A Cambridge motel was robbed twice by two unknown suspects Four conveniencefast food stores were also targeted one arrest was made
There was a sporadic trend of breaks into convenience and drug stores targeting lottery tickets
These two quarters saw a dramatic increase in commercial breaks due to a number of construction site breaks for copper and equipment Toward the end of the third quarter thieves switched to stealing copper from residential homes which accounted for the decline in September Nine people were arrested in six of the breaks from April to September
December saw a pattern of breaks in InmanHarrington and Area 4 in which 17 businesses were broken into Cash registers and safes were usually targeted However in ten of the incidents nothing was reported stolen
Larcenies from persons significantly increased through September and October in Harvard amp Central Squares Thieves targeted items left unattended or hanging on the backs of chairs September - December also reported the highest number of larcenies from buildings with an increase in health club and school thefts
June - August experienced a pattern of car breaks in Peabody and Agassiz The most commonly stolen items were stereos Ten arrests were made in five of the incidents with the pattern cooling after the arrest of three juveniles at the end of August
The theft of GPS systems in January and March accounted for the spikes in crime during the first quarter Six people were arrested in connection with three of the incidents during this time
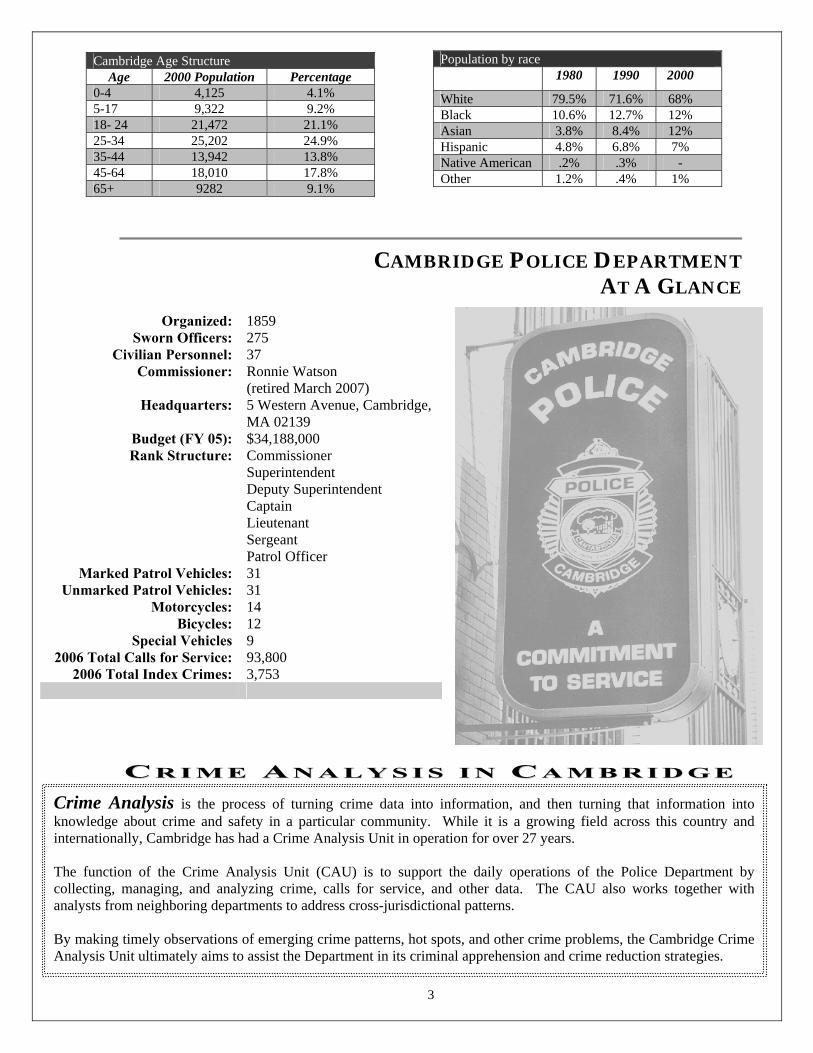
3
CAMBRIDGE POLICE DEPARTMENT AT A GLANCE
Organized 1859
Sworn Officers 275 Civilian Personnel 37
Commissioner Ronnie Watson (retired March 2007)
Headquarters 5 Western Avenue Cambridge MA 02139
Budget (FY 05) $34188000 Rank Structure Commissioner
Superintendent Deputy Superintendent Captain Lieutenant Sergeant Patrol Officer
Marked Patrol Vehicles 31 Unmarked Patrol Vehicles 31
Motorcycles 14 Bicycles 12
Special Vehicles 9 2006 Total Calls for Service 93800
2006 Total Index Crimes 3753
CC RR II MM EE AA NN AA LL YY SS II SS II NN CC AA MM BB RR II DD GG EE
Cambridge Age Structure Age 2000 Population Percentage
0-4 4125 41 5-17 9322 92 18- 24 21472 211 25-34 25202 249 35-44 13942 138 45-64 18010 178 65+ 9282 91
Population by race 1980 1990 2000
White 795 716 68 Black 106 127 12 Asian 38 84 12 Hispanic 48 68 7 Native American 2 3 - Other 12 4 1
Crime Analysis is the process of turning crime data into information and then turning that information intoknowledge about crime and safety in a particular community While it is a growing field across this country andinternationally Cambridge has had a Crime Analysis Unit in operation for over 27 years The function of the Crime Analysis Unit (CAU) is to support the daily operations of the Police Department bycollecting managing and analyzing crime calls for service and other data The CAU also works together withanalysts from neighboring departments to address cross-jurisdictional patterns By making timely observations of emerging crime patterns hot spots and other crime problems the Cambridge CrimeAnalysis Unit ultimately aims to assist the Department in its criminal apprehension and crime reduction strategies
4
Traffic
FirstPlatoon
Day Patrol
FourthPlatoon
ThirdPlatoon
SecondPlatoon
Night Patrol
School Resourse Officer
Auxiliary
Bicycle Patrol
CrimePrevention
CommunityRelations
Operations
Legal PlanningBudget
amp Personnel
Quality Control Media Relations
Office of the Commissioner
WarrantApprehension
amp Dignitary Protection
Sexual Assault
Domestic Violence
SpecialInvestigations
Major Crime
GeneralAssignment
Investigations
Accreditation
Certifications
Tactical
In-Service
Training
Crime Analysis
Grants
RMS
Information Services
TechnicalServices
Identification
Propertyamp Evidence
FleetMaintenance
Facilities Maintenance
Off-DutyEmployment
Records
CourtProsecutor
Administration
TrainingTechnical
amp Administration
Support Services
Commissioner
CCAA MMBB RR IIDD GG EE PPOOLL IICC EE DDEEPP AA RR TTMM EENN TT
OORRGGAANNIIZZAATTIIOONNAALL CCHHAARRTT
5
AA FF AA RR EE WW EE LL LL MM EE SS SS AA GG EE FF RR OO MM TT HH EE CC OO MM MM II SS SS II OO NN EE RR
It is my pleasure to present the Cambridge Police Departmentrsquos Annual Crime Report 2006 the eleventh Annual
Report produced during my tenure as Commissioner This will also be the final Annual Report produced under my leadership in Cambridge as I will be retiring in March of 2007 The objective of this report is to give Cambridge residents a realistic view of their risk of victimization and to provide detailed information on criminal activity in our City The 3753 serious crimes recorded in Cambridge in 2006 represent the Cityrsquos lowest Uniform Crime Reporting Index number reported to the FBI in over 40 years This number represents a decline of 2 from the previous low of 3814 crimes reported in 2005 This is only the third time since 1960 that the City of Cambridge has recorded fewer than 4000 serious crimes Further analysis of the 2006 figures indicates that property crime remained relatively unchanged in Cambridge this year with only a 1 reduction translating to 19 fewer incidents than in 2005 A 10 increase in burglary over the year was counteracted by drops in both auto thefts and larcenies to produce this overall decline Violent crime on the other hand experienced decreases in all categories resulting in an 8 drop when compared with the 2005 figures
Despite the recent reductions in crime the Cambridge Police Department continues to work as hard as ever to improve the conditions in which people live and work everyday in this great city One way the City of Cambridge has strived to do this is through an increased focus on social services throughout the city with an emphasis on providing safer after-school environments for children Programs offered through Tutoring Plus the Margaret Fuller Neighborhood House the North Cambridge Crime Task Force and other neighborhood organizations are all part of the citywide effort to keep our children safe In addition the Police Department is now taking a more proactive approach to reducing violent crime Investigations of crime in the city have revealed that a small number of individuals are often responsible for a large number of violent crimes Therefore one of the focuses this year has been to increase targeted surveillance of those particular individuals in an attempt to stop more crime from occurring or at least to improve the chances of successfully apprehending suspects when crimes do occur This initiative has also included an increased uniformed presence in area parks and other locations reporting increased violence Even as overall violent crime figures decline in Cambridge fighting violence must remain a top priority
As my time in this Department grows short I look back at my years here in Cambridge and I am proud of the work that
has been done and the positive changes that have been made The move towards community policing and citizen involvement over the years through such initiatives as the Neighborhood Sergeants Program has proved to be beneficial for both the Department and the community as a whole By improving the Police Departmentrsquos ability to communicate and foster partnerships with the citizens of Cambridge we have enhanced our image in the community and our ability to prevent and investigate crime There has also been a significant improvement in the association between the Police Department and the Police Review amp Advisory Board transitioning from a relationship of contention to one of professionalism and cooperation This cooperation in turn has led to an advancement in police performance and a reduction in complaints brought against the Department
In the future it is imperative that this Department remain constantly alert to the effect that the violence in other
communities has on Cambridge We must continue to monitor the activity of surrounding communities to ensure that the spillover from those communities does not adversely affect this city We must be vigilant to the quality of life issues that affect those who live and work here I am confident that the Cambridge Police Department will accomplish this mission as it transitions to new leadership
That being said the 2006 Annual Crime Report is one of the many resources the Cambridge Police Department provides to the citizens of Cambridge This Department is committed to providing timely and relevant information to the community and I urge you to visit our website at httpwwwcambridgepoliceorg for current information on crime and for important community alerts Armed with this knowledge the community and the Police Department can work together to develop effective strategies to ensure a high quality of life and to reduce crime and fear in the City of Cambridge
Ronnie Watson Police Commissioner
6
AA MM EE SS SS AA GG EE FF RR OO MM PP OO LL II CC EE CC OO MM MM II SS SS II OO NN EE RR RR OO BB EE RR TT CC HH AA AA SS
It is my pleasure to be a part of the Cambridge Police Departmentrsquos Annual Crime Report 2006 the first Annual Report produced since my appointment by Robert W Healy as Police Commissioner on April 9 2007
I would like to take this opportunity to thank members of the department for their hard work and support over the past few weeks I realize that this continues to be an important project for the department and is valuable to personnel city officials and the community The thoughtful planning of the 2006 Annual Report has presented the police department with an exciting opportunity with the departure of Commissioner Ronnie Watson and my appointment The Department will remain committed to providing timely and relevant information to the community I urge you to visit our website at httpwwwcambridgepoliceorg for current information on crime and community alerts I look forward to working with the community to develop strategies to ensure a high quality of life and to reduce crime and the elements that impact crime Sincerely
Robert C Haas Police Commissioner
FF OO RR EE WW OO RR DD
The Cambridge Police Departmentrsquos 2006 Annual Crime Report is an attempt to provide detailed information
so that citizens can make informed decisions about crime and safety in their neighborhoods The more information made available to the public the better the input will be in aiding the Police response to crime
The Annual Report offers a comprehensive analysis of the crimes reported by the Cambridge Police Department to the Federal Bureau of Investigationrsquos Uniform Crime Reporting (UCR) Program The UCR Program has been collecting national crime statistics from local police departments since 1930 Based on seriousness and frequency police departments are required to report their statistics on seven crimes which comprise the UCR Crime Index murder forcible rape aggravated assault robbery burglary larceny and auto theft The problem for the public as well as for the police is that UCR statistics alone are of little use to patrol deployment and offer little to citizens interested in reducing their risks The true picture of crime and disorder in a city is seldom conveyed to the public through simple statistics Crimes are complex events and these complexities encompass many dimensions It is our endeavor in this report to unravel the web of factors that comprise the crime rate The publication of detailed neighborhood crime statistics patterns and trends gives Cantabridgians a realistic view of their risks of victimization The Neighborhood and Business District sections within the Annual Crime Report are designed to help residents business owners and visitors have a fuller understanding of crime problems in their areas This report outlines three distinctions that make up criminal incidents (1) whether offenses are committed against strangers or against relatives and acquaintances (2) the motivation of the criminalsmdashdrugs revenge or intimidation are but a few of the factors that motivate both novice and career criminals and (3) when and where crimes occur focusing on where the hotspots are and the best time frames for the majority of the incidents Outlining these factors is imperative to understanding the anatomy of crime in Cambridge and to developing appropriate responses
The rise and fall of the crime rate will always be with us To hold that tide in check it will take a partnership comprised of not just the Police and citizens but also every city agency the business community public service providers and church leaders The goal of the Annual Report is to provide this partnership with the knowledge to ensure the desired quality of life in all the neighborhoods of the City
Cambridge Police Department Crime Analysis Unit
7
22000066 CCRRIIMMEE IINNDDEEXX
The Crime Index is composed of selected offenses used to gauge fluctuations in the overall volume and rate of crime reported to police The offenses included are the violent crimes of murder rape robbery and aggravated assault and the property crimes of burglary larceny and auto theft The Crime Index was developed by the Federal Bureau of Investigationrsquos Uniform Crime Reporting program to standardize the way in which law enforcement agencies report crime statistics Crime 2003 2004 2005 2006 2005-2006
Change
Murder 3 0 3 2 Inc
Rape 7 10 14 11 Inc
Stranger 1 0 3 2 Inc
Non-Stranger 6 10 11 9 Inc
Robbery 229 245 239 208 -13
Commercial 41 60 73 38 -48
Street 188 185 166 170 +2
Aggravated Assault 271 248 244 237 -3
Total Violent Crime 510 503 500 458 -8
Burglary 651 724 623 685 +10
Commercial 134 139 133 189 +42
Residential 517 585 490 496 +1
Larceny 2389 2654 2396 2377 -1
from Building 518 572 539 386 -28
from Motor Vehicle 657 734 615 754 +23
from Person 331 381 343 337 -2
of Bicycle 212 229 241 204 -15
Shoplifting 358 383 403 342 -15
from Residence 183 226 175 246 +41
of License Plate 75 67 42 30 -29
of Services 24 30 19 21 +11
Miscellaneous 31 32 19 57 +200
Auto Theft 419 438 295 233 -21
Total Property Crime 3459 3816 3314 3295 -1
Crime Index Total 3969 4319 3814 3753 -2 Note Inc = percentages are not calculated for numbers so small so as to prevent a statistically misleading percentage
8
Please Note Due to reclassification year to year final numbers are subject to change
CC AA MM BB RR II DD GG EE UU NN II FF OO RR MM CC RR II MM EE RR EE PP OO RR TT SS TT AA TT II SS TT II CC SS 11 99 88 77 -- 22 00 00 66
1987
1988
1989
1990
1991
1992
1993
1994
1995
1996
1997
1998
1999
2000
2001
2002
2003
2004
2005
2006
Crime
Avg
198
7-19
96
Avg
199
7-20
06
Avg
198
7-20
06
C
hang
e 20
05-2
006
Cha
nge
1997
-200
6
Murder 2 7 7 3 5 2 2 1 3 1 2 2 2 1 1 6 3 0 3 2 3 2 3 Inc No change
Rape 36 30 25 29 38 33 30 28 35 34 24 25 15 11 15 10 7 10 14 11 32 14 23 -21 -54 Robbery 417 402 460 431 399 286 253 276 295 227 176 208 165 186 181 195 229 245 239 208 345 203 274 -13 +18 Aggravated Assault 340 371 365 614 567 551 643 473 463 381 370 369 348 322 272 284 271 248 244 237 477 297 387 -3 -36
Burglary 1477 1337 1621 1470 1098 866 929 774 953 791 596 695 567 552 688 720 651 724 623 685 1132 650 891 +10 +15 Larceny Theft 3229 3127 3692 3136 3363 3326 3563 3351 3313 2973 2779 2753 2819 2820 2740 2764 2389 2654 2396 2377 3307 2649 2978 -1 -14
Auto Theft 1152 1175 1170 1353 1012 887 964 761 558 544 483 397 431 498 523 425 419 438 295 233 958 414 686 -21 -52 Total Violent 795 810 857 1077 1009 872 928 778 796 643 572 604 530 520 469 495 510 503 500 458 857 516 686 -8 -20
Total Property 5858 5639 6483 5959 5473 5079 5456 5086 4824 4308 3858 3845 3817 3870 3951 3909 3459 3816 3314 3295 5417 3713 4565 -1 -15
Total 6653 6449 7340 7036 6482 5951 6384 5664 5620 4951 4430 4449 4347 4390 4420 4404 3969 4319 3814 3753 6253 4230 5241 -2 -15 Note Inc = percentages are not calculated for numbers so small so as to prevent a statistically misleading percentage The Cambridge Police Department voluntarily submits Uniform Crime Report statistics to the FBI for national comparison See httpwwwfbigovucrucrhtm for more information Percent changes are rounded to the nearest whole number A 0 change means that there was less than a 5 increase or decrease
9
2255--YY EE AA RR SS TT AA TT II SS TT II CC AA LL TT RR EE NN DD SS
0
1000
2000
3000
4000
5000
6000
7000
8000
9000
1982
1984
1986
1988
1990
1992
1994
1996
1998
2000
2002
2004
2006
0
200
400
600
800
1000
1200
1982
1984
1986
1988
1990
1992
1994
1996
1998
2000
2002
2004
2006
Cambridge reported its lowest amountof crime in over 40 years in 2006 Thetotal crime index has fallen 56 since1982 Serious crime numbers havebeen on a steady decline since the late1970s with the exception of spikes atthe turn of two decades These spikeswere caused by a sharp increase inproperty crimes in 1980 and a sharpincrease in violent crimes in 1990After 1997 the crime rate leveled offfor approximately six years until itdropped by 10 in 2003 A smallincrease in 2004 was countered by twosubsequent decreases in 2005 and2006 Overall crime in Cambridgehas dropped approximately 15 in thepast five years
Total Part I (Index) Crime
Violent crime totals include the crimes ofmurder rape robbery and assault Totalswere fairly unsteady in the 1980s The lateyears of the decade were marked by a greatincrease in incidentsmdashreflective of thenationrsquos epidemic of gang and drugviolence combined with greater reportingof domestic assaults Since 1990 violentcrime totals have been steadily decliningbut have been marked by small spikesevery other year or so This year reportedviolent crimes decreased by 42 incidents(8) from 2005 indicating the lowestnumber in the past 25 years
Total Part I Violent Crime
0
1000
2000
3000
4000
5000
6000
7000
8000
9000
1982
1984
1986
1988
1990
1992
1994
1996
1998
2000
2002
2004
2006
Total Part I Property Crime Property crime totals include burglarylarceny and auto theft Property crimeusually accounts for 80-90 of thePart I total which explains why thegraph to the left mirrors the graph atthe top so closely Totals have fallen57 since 1982 and 15 since 1997Burglary and auto theft haveexperienced significant decreases overthe past two decades but larceny(common theft) has remained fairlysteady Auto theft is at its lowest ratein 50 years After 1997 crime ratesleveled off for approximately sixyears until they dropped by 12 in2003 An increase in 2004 wasfollowed by a decrease of 14 overthe next two years consequently thisyearrsquos totals are lowest in over 40years
10
22000066 EE XX EE CC UU TT II VV EE SS UU MM MM AA RR YY
IMPORTANT FACTS ABOUT THE 2006 INDEX TOTAL The Crime Index is composed of selected offenses used to gauge fluctuations in the overall volume and rate of crime reported to police The offenses included are the violent crimes of murder rape robbery and aggravated assault and the property crimes of burglary larceny and auto theft The Crime Index was developed by the Federal Bureau of Investigationrsquos Uniform Crime Reporting program to standardize the way in which law enforcement agencies report crime statistics The 3753 serious crimes recorded in Cambridge in 2006 represent the Cityrsquos lowest Uniform Crime Reporting Index number reported to the FBI in over 40 years The City of Cambridge has recorded fewer than 4000 serious crimes only three times since 1960 The 2006 decline of 2 with 61 fewer incidents than in 2005 represents the cityrsquos lowest recorded crime index total since the mid ndash1960s Further analysis indicates that violent crime decreased by 8 in 2006 with 42 fewer incidents and property crime declined by 1 with 19 fewer incidents The three biggest declines for 2006 were in commercial robbery (-48) larceny of license plate (-29) and larceny from building (-28) when compared with the 2005 figures MURDER
bull Murders in Cambridge most often fall into three distinct scenarios domestic situations drug or gang related altercations and homeless against homeless street fights Two people died in Cambridge in 2006 as a result of handgun violence among young males in the city
bull Nationally cities of 100000 people average 10 murders per year bull In the first incident Corey Davis 19 was walking down the street when he was shot in a drive by Davis
was shot three times in the back and was pronounced dead later that night A month later US Marshals in Virginia arrested James Miller 23 of Dorchester for Davisrsquo murder In June of 2006 Remele Ahart 21 of Chelsea and Ahmad Bright 17 of Dorchester were also arrested in connection with this murder
bull The second shooting occurred just ten days after Davis was killed Doowensky Nazaire 22 of Somerville died from two gunshot wounds he sustained while standing in front of a club in Cambridge Officers apprehended Elysee Bresilla 28 of Roslindale as he fled from the scene and charged him with murder when Nazaire succumbed to his injuries a short time after the shooting
bull Since 1990 Cambridge has averaged two murders per year which is a decrease from the 30-year period between 1960 and 1989 when the average was slightly less than five per year
RAPE bull Cambridge reported 11 rapes in 2006 a total that remains below the 10-year average of 14 rapes per year bull Nine of the eleven rapes in 2006 were completed acts and two were categorized as attempts bull Five of the nine completed rapes in 2006 were acquaintance rapes where the victim knew the perpetrator bull Since 1980 there has only been one stranger-to-stranger ldquostreetrdquo rape pattern in Cambridge the ldquoRainy
Day Rapistrdquo who preyed on victims in the Fresh Pond area on rainy days in 1981
ROBBERY bull The steady increase in robberies that began in 2002 has reversed over the past two years with an overall
decrease of 15 since 2004 2006rsquos decline of 13 dropped the total to 208 incidents bull Commercial robberies fell by 35 incidents from 2005rsquos total translating to a 48 decrease This is the
lowest number of commercial robberies in nearly three years bull Convenience stores continued to be the common target of commercial robberies in 2006 Approximately
29 of the robberies in 2006 were of convenience stores with the majority of these incidents occurring late at night between 800 pm and midnight
bull Robberies of gas stations declined by 69 helping to contribute to the overall decline in commercial robbery
bull The number of street robberies reported in 2006 increased slightly by four incidents translating to a 2 increase over the previous year Nearly 83 of all street robberies occurred on the street or sidewalk
11
bull The majority of the street robberies throughout the city occurred between 700 pm and 100 am These are common times for street robberies to be reported because people can become targets when they are walking alone late at night distracted or intoxicated
BURGLARY bull Cambridge saw a 10 increase in burglaries between 2005 and 2006 which can be wholly attributed to the
42 increase in commercial burglary bull Construction site breaks alone increased by 24 incidents in 2006 This translates to a 343 increase (7 in
2005 vs 31 in 2006) bull Housebreaks were up 1 in Cambridge in 2006 compared to 2005 increasing from 490 incidents to 496
This total includes 80 housebreaks that were attempted but not completed bull In a number of the summer breaks entry was gained through cut window screens and the perpetrators stole
electronics and money left in plain sight
LARCENY bull There was an overall decrease in larceny incidents in 2006 with the most significant drop coming from the
categories of larceny from building and larceny of license plates down 28 and 29 respectively bull There were 386 larcenies from buildings reported this year representing a 28 decrease from the previous
year This number is considerably below the five-year average of 535 incidents bull The three major hot spots of larcenies from buildings in 2006 were the Cambridgeside Galleria Mall the
Cambridge Rindge and Latin School and Ballyrsquos Health Club bull Larcenies from motor vehicles reached a significant high in 2006 at 754 incidents translating to a 23
increase from the previous year This yearrsquos high is also the decadersquos high bull There were two recurrent larceny from motor vehicle patterns throughout the City in 2006 thefts of GPS
navigation systems and thefts of stereo systems bull The most common method of entry into motor vehicles in 2006 was by breaking one or more windows of
the vehicle This method was reported in half of the incidents bull A two-year increase of larcenies of bicycles in 2004 and 2005 came to a halt in 2006 when only 204
incidents were reported representing a 15 decrease from 2005
AUTO THEFT bull In 2006 Cambridge reported its lowest number of stolen cars in over 20 years with only 233 incidents bull Hondas continue to be the most commonly stolen automobiles constituting 32 of all reports Toyotas
and Fords involved in approximately 25-30 incidents each came in second and third place respectively This information is consistent with historical and national trends
bull The most targeted model in 2006 was the Honda Civic followed by the Toyota Camry and the Honda Accord
bull Approximately 40 of the cars reported stolen in 2006 have been recovered to date The majority of the recovered cars were located throughout Cambridge and Boston
CITYWIDE SHOOTING VICTIMS IN 2006
bull There were 12 shootings in 2006 producing 13 victims with gunshot wounds five victims from four incidents in Area 4 three incidents in Cambridgeport two in InmanHarrington and one each in North Cambridge Riverside and Mid-Cambridge
bull Four of the incidents were during a threendashweek period from late February to mid-March that produced the two homicides recorded in 2006 Arrests were made in both homicide cases
bull Twelve of the gunshot victims were male and one was female bull Ten of the victims were Cambridge residents The other three victims were from Everett Somerville and
Dorchester bull The youngest of the victims was 14 years old the oldest 27 Nine of the thirteen victims were between 19
and 25 years of age bull There were 11 known offenders all males with an average age of 23 Two were Cambridge residents and
nine were non-residents There were also six cases where the offender was not substantiated bull There were arrests made in 6 of the 12 incidents In four of the open cases solid suspects were established
but victims and witnesses were uncooperative In the six incidents involving the arrest of a suspect three cases involved multiple arrestsoffenders
12
NNAATTIIOONNAALLRREEGGIIOONNAALL CCRRIIMMEE CCOOMMPPAARRIISSOONN
Note that the following tables are based on information from the FBIrsquos Uniform Crime Reports and the latest available data available for comparison was from 2005
2005 CRIMES IN CITIES OF 94000-106000 RESIDENTS NATIONWIDE
City Murder Rape Robbery Assault Burglary Larceny Auto Theft Total
Albany NY 8 68 439 760 1328 3186 369 6158 Allentown PA 21 45 512 285 1393 3905 473 6634 Arvada CO 2 23 52 119 524 2772 581 4073 Athens-Clarke County GA 5 41 135 176 1047 4185 361 5950 Berkeley CA 3 18 354 195 1229 5503 1244 8546 Brockton MA1 10 47 211 NA 687 2282 738 3975 Burbank CA 3 13 67 163 586 1690 495 3017 Cambridge MA 3 14 239 244 623 2396 295 3814 Cary NC 0 13 50 70 432 1428 103 2096 Charleston SC 10 49 290 654 810 3464 482 5759 Compton CA 65 40 474 1152 638 971 1006 4346 Daly City CA 2 20 122 142 251 39 468 1044 Davenport IA 7 54 272 990 1451 5213 416 8403 Dearborn MI 3 30 223 315 651 3191 1082 5495 Denton TX 5 72 76 225 684 3180 246 4488 Erie PA 6 75 200 191 632 2129 106 3339 Everett WA 3 48 173 313 1272 4243 2085 8137 Fairfield CA 9 38 218 320 748 2876 836 5045 Gary IN 58 70 306 284 1593 2556 1161 6028 Gresham OR 3 69 148 280 882 3216 1249 5847 Livonia MI 3 13 62 92 444 1574 383 2571 Lowell MA 2 41 213 753 644 1942 689 4284 Macon GA 20 58 332 406 2028 6124 1065 10033 Miami Gardens FL 11 57 540 1305 1395 4235 968 8511 Miramar FL 3 35 152 296 939 1831 442 3698 Mission Viejo CA 2 3 36 69 225 953 81 1369 Odessa TX 3 12 72 503 756 2785 179 4310 Portsmouth VA 22 41 366 472 1049 3708 407 6065 Pueblo CO 13 22 162 489 1525 4978 478 7667 Richardson TX 2 12 98 149 764 2437 277 3739 Richmond CA 40 35 526 573 1062 2350 2396 6982 Santa Clara CA 5 18 49 118 553 2470 397 3610 South Gate CA 6 19 305 197 444 1164 1289 3424 Vacaville CA 2 23 69 168 353 1899 266 2780 Ventura CA 1 19 107 170 815 2695 401 4208 Wichita Falls TX 6 43 239 445 1703 5386 552 8374 Woodbridge Township NJ 2 17 81 203 347 2168 294 3112 Average 10 36 215 359 879 2895 658 5052 Cambridge MA 3 14 239 244 623 2396 295 3814
13
Among similarly sized cities in 2005 Cambridge ranked below the nationwide average for all but one of the index crimes (robbery) Overall the total number of serious crimes in Cambridge ranked 25 below than the national average of similarly sized cities Again statistics for 2005 are the latest available from cities of similar size to Cambridge for comparative analysis
How Cambridge Compares Nationally in 2005
Murder 70 lower than the national average per 100000 inhabitants Rape 61 lower than the national average per 100000 inhabitants continuing the downward trend which began in 1998
Robbery 11 higher than the national average per 100000 inhabitants likely resulting from the close proximity of Cambridge to other large cities
Assault 32 below the national average per 100000 inhabitants
Burglary 29 below the national average per 100000 inhabitants continuing the downward trend which began in the early 1980s
Larceny 17 below the national average Larceny typically accounts for the highest percentage of index crimes in Cambridge but traditionally reports lower numbers than the national average
Auto Theft 55 below the national average per 100000 inhabitants
2005 TOTAL NUMBER AND RATE OF CRIMES IN SELECT MASSACHUSETTS CITIES AND TOWNS
Total City Population Murder Rape Robbery Assault Burglary Larceny Auto Theft Total Rate Medford 54047 1 8 47 15 327 944 189 1531 2833
Brockton1 94746 10 47 211 NA 687 2282 738 3975 4195 Lynn 89234 5 12 270 783 816 1527 582 3995 4477 Chicopee 54686 2 27 46 268 479 1048 223 2093 3827 Lawrence 71659 0 17 159 408 601 577 533 2295 3203 Cambridge 101355 3 14 239 244 623 2396 295 3814 3763 Lowell 103370 2 41 213 753 664 1942 689 4304 4164 New Bedford 93720 8 52 257 707 877 1924 315 4140 4417 Haverhill 60315 0 13 52 231 593 708 116 1713 2840 Somerville 75412 1 7 139 115 521 833 319 1935 2566 Framingham 65416 0 12 48 124 312 1025 219 1740 2660 Quincy 89661 2 26 92 219 387 883 152 1761 1964
Brookline1 56032 0 7 59 NA 219 749 45 1079 1926 Waltham 32513 0 1 15 46 116 518 518 1214 3734 Newton 83570 1 6 15 92 269 783 46 1212 1450 Average 75049 2 19 124 308 499 1209 332 2453 3201 Cambridge 101355 3 14 239 244 623 2396 295 3814 3763
Rate is calculated per 100000 residents Statistics for 2005 for select Massachusetts cities are the latest available for comparative analysis with Cambridge 1 Note that assault statistics for the City of Brockton and Brookline were unavailable There were approximately 3762 crimes per 100000 residents in Cambridge Note that this number does not reflect the increased daytime population which exceeds 250000 people on any given day
14
15
Please note the Crime Clock should be viewed with care Being the most aggregate representation of Cambridgecrime data it is designed to convey the annual reported crime experience by showing the relative frequency ofoccurrence of the index offenses This mode of display should not be taken to imply regularity in the commission ofcrimes rather it represents the annual ratio of crime to fixed time intervals
CCIITTYY OOFF CCAAMMBBRRIIDDGGEE CCRRIIMMEE CCLLOOCCKK
22000066
1
Index Crime Offense Every 2 hours
Violent Crime Every 19 hours
1 Murder Every 183 days
1 Rape Every 33 days
1 Robbery Every 42 hours
Aggravated Assault Every 37 hours
Property CrimeEvery 3 hours1
1
1 Burglary Every 13 hours
1 Larceny Every 4 Hours
1 Auto Theft Every 38 Days
1
16
FFAACCTTOORRSS CCOONNTTRRIIBBUUTTIINNGG TTOO CCRRIIMMEE
Throughout the 2006 Annual Report the Department tries to place statistics in contextmdashto explain why crime occurs in a particular area instead of just where and how often It is impossible however to analyze every crime factor within the pages of this report As a general rule readers should consider the following factors when gauging the relative safety of any city neighborhood or business district The FBI in its Uniform Crime Reports provides most of these factors Factor General Effect Status in Cambridge Effects in Cambridge Residential Population amp Population Density
High population leads to higher residential crime rate (residential burglaries larcenies from motor vehicles domestic assaults auto theft) High population density also leads to a higher residential crime rate
Population of about 101000 Very high density (about 15000 per square mile)
Higher residential crime rate than cities of fewer than 100000 Higher residential crime rate in densely populated neighborhoods
of Mid-Cambridge North Cambridge Cambridgeport Low residential crime rate in sparsely populated areas of
Cambridge Highlands Strawberry Hill Agassiz
Commerical amp Educational Population number amp type of commercial establishments and educational institutions
High commercial population leads to more ldquobusinessrdquo crimes (commercial burglaries shoplifting larcenies from buildings forgery) and to more crimes against the person often committed in commercial areas (larcenies from the person larcenies from motor vehicles larcenies of bicycles street robbery auto theft)
Very high commercial population (many large businesses shopping areas in Cambridge) and very high educational population (MIT and Harvard)
High overall larceny rate High larceny rate in highly-populated commercial areas of East
Cambridge Harvard Square Central Square Porter Square Fresh Pond Mall
High auto theft rate in East Cambridge MIT Area Low larceny auto theft rate in Agassiz Strawberry Hill West
Cambridge
Age composition of population
A higher population in the ldquoat riskrdquo age of 15ndash24 leads to a higher crime rate
22 percent of the citizens of Cambridge are in the ldquoat riskrdquo populationThis number is influenced by the high student population
Agassiz MIT and Riverside have the largest percentage of people in the ldquoat riskrdquo ages but most of them are college students which somewhat decreases their chances of involvement in criminal activity Consequently Agassiz MIT and Riverside do not have higher than average crime rates
However neighborhoods with the lowest numbers of ldquoat riskrdquo agesmdashWest Cambridge Cambridge Highlands and Strawberry Hillmdashdo experience smaller amounts of crime
Stability of Population Stable close-knit populations have a lower overall crime rate than transient populations Neighborhoods with more houses and condominiums (generally signifiying a more stable population) have a lower crime rate than neighborhoods with mostly apartments (generally a more transient population)
Historically stabler population west of Harvard Square more transient population east of Harvard Square This is changing rapidly with gentrification taking place in neighborhoods adjacent to Central Square
Lower comparative crime rate in neighborhoods of West Cambridge Highlands Peabody Agassiz Strawberry Hill
Higher comparative crime rate in Mid-Cambridge Area 4 Cambridgeport This however is changing with the stabilization and gentrification of housing in these areas
17
Street Layout Areas with major streets offering fast getaways and mass transportation show more crime clusters than neighborhoods with primarily residential streets
A mix of major and minor streets Higher auto theft rates in MIT East Cambridge Cambridgeport where thieves can make a quick jump over the bridge to Boston
Higher commercial burglary rate in North Cambridge with multiple avenues of escape into nearby towns
Proximity to Public Transportation
Criminals are often indigent and cannot afford cars or other expensive forms of transportation Areas near public transportation and particularly subways witness a higher crime ratemdashparticularly robbery and larcenymdashthan more inaccessable areas
Major public transportation system offering high-speed rapid transit throughout most of the city
Contributes to clusters of crime around Central Square Harvard Square Porter Square and Alewife though not much around Lechmere and Kendall Square
Neighborhoods distant from rapid transitmdashWest Cambridge Highlands and Strawberry Hillmdashshow lower crime rate with few clusters
Economic conditions including poverty level and unemployment rate
Again criminals are often indigent Areas afflicted by poverty show higher burglary robbery and larceny rates than middle-class or wealthy neighborhoods
Little abject poverty in Cambridge This factor probably contributes little to the picture of crime in Cambridge
Possibly some effect on Area 4mdashthe neighborhood with the lowest mean incomemdashthough Strawberry Hill which has the second lowest mean income also has one of the lowest crime rates in the city Other factors on this list probably have a much greater role than economic conditions
Family conditions with respect to divorce and family cohesiveness
Larry J Siegel author of Criminology says ldquoFamily relationships have for some time been considered a major determinant of behavior Youths who grow up in a household characterized by conflict and tension where parents are absent or separated or where there is a lack of familial love and support will be susceptible to the crime-promoting forces in the environmentrdquo
According to census data about one third of the families in Cambridge with children are single-parent families In the Commonwealth of Massachusetts as a whole this percentage is slightly lessmdashabout one quarter
The neighborhoods with the highest percentage of single-parent families are Area 4 Cambridgeport Riverside and North Cambridge With the exception of Riverside these neighborhoods also have a higher than mean crime rate However there are a far greater number of factors influencing ldquoconflict and tensionrdquo and ldquofamilial love and supportrdquo than just the number of parents in the household In the end no conclusions can be drawn without more data
Climate Warmer climates and seasons tend to report a higher rate of larceny auto theft and juvenile-related crime while cold seasons and climates report more robberies and murder
A varied climate warm and moist summers cool autums long cold winters
High overall larceny auto theft rate in the summer Higher overall robbery rate in the winter Burglary rate less tied to climate than to specific weather
conditions rain and snow produce fewer burglaries
Operational and investigative emphasis of the police department
Problem-oriented informed police departments have more success controlling certain aspects of crime than other departments
A problem-oriented department with an emphasis on directed patrol and investigation and on crime analysis including quick identification of crime patterns and rapid intervention to curtail them
Lower overall crime rate across the city than would be expected for a city of our size and characteristics
Attitude of the citizenry toward crime including its reporting practices
Populations that have ldquogiven uprdquo on crime and the police experience an exacerbation of the crime problem
A population that works closely with the police creates numerous neighborhood crime watches and is likely to report crimes
Lower overall crime rate across the city than would be expected for a city of our size and characteristics
18
0
5
10
15
20
25
Jan Feb Mar Apr May Jun Jul Aug Sep Oct Nov Dec
CCHHRROONNOOLLOOGGIICCAALL HHIIGGHHLLIIGGHHTTSS
0
10
20
30
40
50
60
70
Jan Feb Mar Apr May Jun Jul Aug Sep Oct Nov Dec
STREET ROBBERY
HOUSEBREAKS
There was a series of housebreaks along the CambridgeSomerville border which ended in the Somerville arrest of two individuals in early April They were believed to be responsible for over a dozen breaks along the boarder
Two patterns developed in the third quarter One took place during the daytime in InmanHarrington on the border of Sectors 1 amp 2 Entry was gained through unlocked windows and electronics were targeted The other took place in the early morning hours of the weekend in Sector 3 Arrests were made in both locations
A pattern developed in Area 4 at the end of February in which all victims were threatened with a gun and demanded to hand over their wallets Most victims were male and walking alone late at night
In mid to late April there was a pattern of pack robberies (mostly in InmanHarrington) in which juveniles targeted male victims Money and Ipods were the only items stolen Force was used or a weapon shown in four incidents
Mid-Cambridge had a pattern of housebreaks during the second quarter in which over 30 burglaries were reported Laptops digital cameras and Ipods were the common targets during the breaks
There were no identifiable patterns in the third quarter Area 4 and Peabody had the highest number of robberies through these months Six street robbery arrests took place throughout the city during this quarter
Sectors 1 and 2 saw an increase in street robberies with a weekend pattern in October that carried over into November This pattern significantly decreased with the arrest of three juveniles from Chelsea in late November
Sector 3 daytime housebreaks took place throughout the fourth quarter Entry was gained by prying open front doors Over 23 laptops were stolen in this pattern
19
020406080
100120140160
Jan Feb Mar Apr May Jun Jul Aug Sep Oct Nov Dec
0
1
2
3
4
5
6
7
Jan Feb Mar Apr May Jun Jul Aug Sep Oct Nov Dec
05
101520253035
Jan Feb Mar Apr May Jun Jul Aug Sep Oct Nov Dec
COMMERCIAL ROBBERY
COMMERCIAL BREAKS
LARCENY FROM MOTOR VEHICLE LARCENY FROM PERSON LARCENY FROM BUILDING
One convenience store was targeted three times throughout JanuaryFebruary There were three gas station robberies down from seven in last yearrsquos first quarter
The same convenience store was robbed again but an arrest was made this time In addition there were two retail robberies and one bank robbery
In July there were two gas station robberies and robberies at a restaurant and a market All other incidents resulted in arrests one was at a convenience store and the other two were banks
There were five bank robberies throughout the fourth quarter resulting in three arrests A Cambridge motel was robbed twice by two unknown suspects Four conveniencefast food stores were also targeted one arrest was made
There was a sporadic trend of breaks into convenience and drug stores targeting lottery tickets
These two quarters saw a dramatic increase in commercial breaks due to a number of construction site breaks for copper and equipment Toward the end of the third quarter thieves switched to stealing copper from residential homes which accounted for the decline in September Nine people were arrested in six of the breaks from April to September
December saw a pattern of breaks in InmanHarrington and Area 4 in which 17 businesses were broken into Cash registers and safes were usually targeted However in ten of the incidents nothing was reported stolen
Larcenies from persons significantly increased through September and October in Harvard amp Central Squares Thieves targeted items left unattended or hanging on the backs of chairs September - December also reported the highest number of larcenies from buildings with an increase in health club and school thefts
June - August experienced a pattern of car breaks in Peabody and Agassiz The most commonly stolen items were stereos Ten arrests were made in five of the incidents with the pattern cooling after the arrest of three juveniles at the end of August
The theft of GPS systems in January and March accounted for the spikes in crime during the first quarter Six people were arrested in connection with three of the incidents during this time
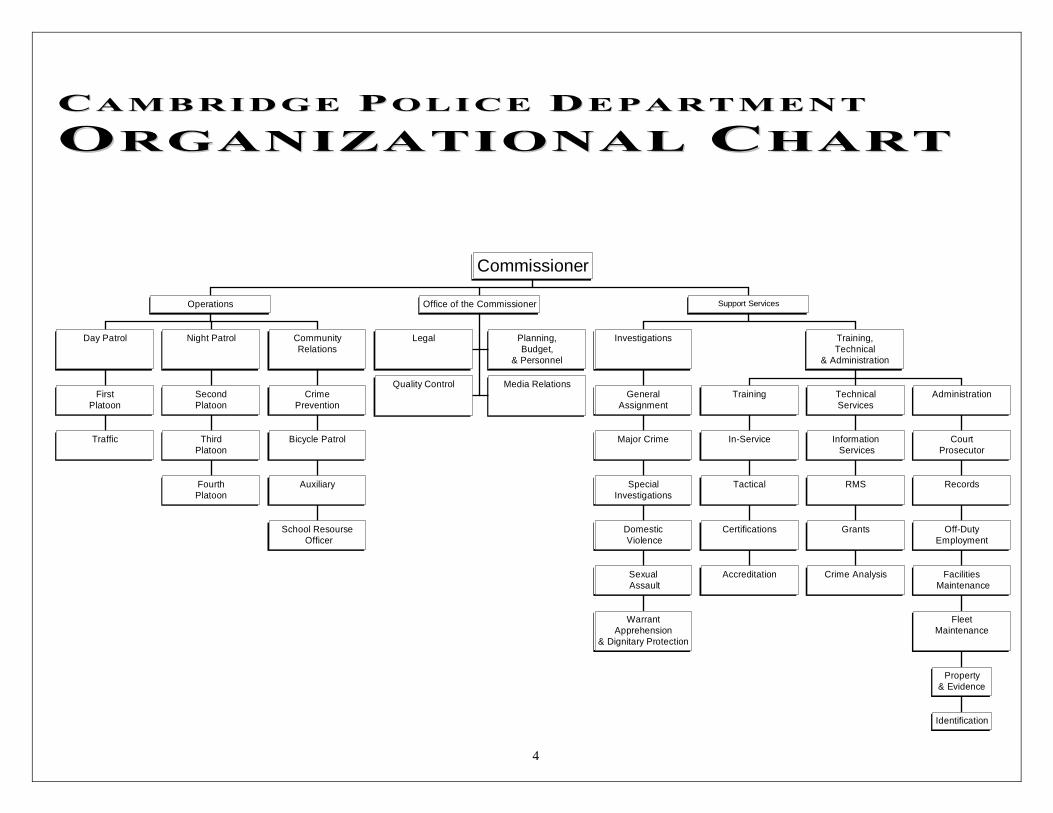
4
Traffic
FirstPlatoon
Day Patrol
FourthPlatoon
ThirdPlatoon
SecondPlatoon
Night Patrol
School Resourse Officer
Auxiliary
Bicycle Patrol
CrimePrevention
CommunityRelations
Operations
Legal PlanningBudget
amp Personnel
Quality Control Media Relations
Office of the Commissioner
WarrantApprehension
amp Dignitary Protection
Sexual Assault
Domestic Violence
SpecialInvestigations
Major Crime
GeneralAssignment
Investigations
Accreditation
Certifications
Tactical
In-Service
Training
Crime Analysis
Grants
RMS
Information Services
TechnicalServices
Identification
Propertyamp Evidence
FleetMaintenance
Facilities Maintenance
Off-DutyEmployment
Records
CourtProsecutor
Administration
TrainingTechnical
amp Administration
Support Services
Commissioner
CCAA MMBB RR IIDD GG EE PPOOLL IICC EE DDEEPP AA RR TTMM EENN TT
OORRGGAANNIIZZAATTIIOONNAALL CCHHAARRTT
5
AA FF AA RR EE WW EE LL LL MM EE SS SS AA GG EE FF RR OO MM TT HH EE CC OO MM MM II SS SS II OO NN EE RR
It is my pleasure to present the Cambridge Police Departmentrsquos Annual Crime Report 2006 the eleventh Annual
Report produced during my tenure as Commissioner This will also be the final Annual Report produced under my leadership in Cambridge as I will be retiring in March of 2007 The objective of this report is to give Cambridge residents a realistic view of their risk of victimization and to provide detailed information on criminal activity in our City The 3753 serious crimes recorded in Cambridge in 2006 represent the Cityrsquos lowest Uniform Crime Reporting Index number reported to the FBI in over 40 years This number represents a decline of 2 from the previous low of 3814 crimes reported in 2005 This is only the third time since 1960 that the City of Cambridge has recorded fewer than 4000 serious crimes Further analysis of the 2006 figures indicates that property crime remained relatively unchanged in Cambridge this year with only a 1 reduction translating to 19 fewer incidents than in 2005 A 10 increase in burglary over the year was counteracted by drops in both auto thefts and larcenies to produce this overall decline Violent crime on the other hand experienced decreases in all categories resulting in an 8 drop when compared with the 2005 figures
Despite the recent reductions in crime the Cambridge Police Department continues to work as hard as ever to improve the conditions in which people live and work everyday in this great city One way the City of Cambridge has strived to do this is through an increased focus on social services throughout the city with an emphasis on providing safer after-school environments for children Programs offered through Tutoring Plus the Margaret Fuller Neighborhood House the North Cambridge Crime Task Force and other neighborhood organizations are all part of the citywide effort to keep our children safe In addition the Police Department is now taking a more proactive approach to reducing violent crime Investigations of crime in the city have revealed that a small number of individuals are often responsible for a large number of violent crimes Therefore one of the focuses this year has been to increase targeted surveillance of those particular individuals in an attempt to stop more crime from occurring or at least to improve the chances of successfully apprehending suspects when crimes do occur This initiative has also included an increased uniformed presence in area parks and other locations reporting increased violence Even as overall violent crime figures decline in Cambridge fighting violence must remain a top priority
As my time in this Department grows short I look back at my years here in Cambridge and I am proud of the work that
has been done and the positive changes that have been made The move towards community policing and citizen involvement over the years through such initiatives as the Neighborhood Sergeants Program has proved to be beneficial for both the Department and the community as a whole By improving the Police Departmentrsquos ability to communicate and foster partnerships with the citizens of Cambridge we have enhanced our image in the community and our ability to prevent and investigate crime There has also been a significant improvement in the association between the Police Department and the Police Review amp Advisory Board transitioning from a relationship of contention to one of professionalism and cooperation This cooperation in turn has led to an advancement in police performance and a reduction in complaints brought against the Department
In the future it is imperative that this Department remain constantly alert to the effect that the violence in other
communities has on Cambridge We must continue to monitor the activity of surrounding communities to ensure that the spillover from those communities does not adversely affect this city We must be vigilant to the quality of life issues that affect those who live and work here I am confident that the Cambridge Police Department will accomplish this mission as it transitions to new leadership
That being said the 2006 Annual Crime Report is one of the many resources the Cambridge Police Department provides to the citizens of Cambridge This Department is committed to providing timely and relevant information to the community and I urge you to visit our website at httpwwwcambridgepoliceorg for current information on crime and for important community alerts Armed with this knowledge the community and the Police Department can work together to develop effective strategies to ensure a high quality of life and to reduce crime and fear in the City of Cambridge
Ronnie Watson Police Commissioner
6
AA MM EE SS SS AA GG EE FF RR OO MM PP OO LL II CC EE CC OO MM MM II SS SS II OO NN EE RR RR OO BB EE RR TT CC HH AA AA SS
It is my pleasure to be a part of the Cambridge Police Departmentrsquos Annual Crime Report 2006 the first Annual Report produced since my appointment by Robert W Healy as Police Commissioner on April 9 2007
I would like to take this opportunity to thank members of the department for their hard work and support over the past few weeks I realize that this continues to be an important project for the department and is valuable to personnel city officials and the community The thoughtful planning of the 2006 Annual Report has presented the police department with an exciting opportunity with the departure of Commissioner Ronnie Watson and my appointment The Department will remain committed to providing timely and relevant information to the community I urge you to visit our website at httpwwwcambridgepoliceorg for current information on crime and community alerts I look forward to working with the community to develop strategies to ensure a high quality of life and to reduce crime and the elements that impact crime Sincerely
Robert C Haas Police Commissioner
FF OO RR EE WW OO RR DD
The Cambridge Police Departmentrsquos 2006 Annual Crime Report is an attempt to provide detailed information
so that citizens can make informed decisions about crime and safety in their neighborhoods The more information made available to the public the better the input will be in aiding the Police response to crime
The Annual Report offers a comprehensive analysis of the crimes reported by the Cambridge Police Department to the Federal Bureau of Investigationrsquos Uniform Crime Reporting (UCR) Program The UCR Program has been collecting national crime statistics from local police departments since 1930 Based on seriousness and frequency police departments are required to report their statistics on seven crimes which comprise the UCR Crime Index murder forcible rape aggravated assault robbery burglary larceny and auto theft The problem for the public as well as for the police is that UCR statistics alone are of little use to patrol deployment and offer little to citizens interested in reducing their risks The true picture of crime and disorder in a city is seldom conveyed to the public through simple statistics Crimes are complex events and these complexities encompass many dimensions It is our endeavor in this report to unravel the web of factors that comprise the crime rate The publication of detailed neighborhood crime statistics patterns and trends gives Cantabridgians a realistic view of their risks of victimization The Neighborhood and Business District sections within the Annual Crime Report are designed to help residents business owners and visitors have a fuller understanding of crime problems in their areas This report outlines three distinctions that make up criminal incidents (1) whether offenses are committed against strangers or against relatives and acquaintances (2) the motivation of the criminalsmdashdrugs revenge or intimidation are but a few of the factors that motivate both novice and career criminals and (3) when and where crimes occur focusing on where the hotspots are and the best time frames for the majority of the incidents Outlining these factors is imperative to understanding the anatomy of crime in Cambridge and to developing appropriate responses
The rise and fall of the crime rate will always be with us To hold that tide in check it will take a partnership comprised of not just the Police and citizens but also every city agency the business community public service providers and church leaders The goal of the Annual Report is to provide this partnership with the knowledge to ensure the desired quality of life in all the neighborhoods of the City
Cambridge Police Department Crime Analysis Unit
7
22000066 CCRRIIMMEE IINNDDEEXX
The Crime Index is composed of selected offenses used to gauge fluctuations in the overall volume and rate of crime reported to police The offenses included are the violent crimes of murder rape robbery and aggravated assault and the property crimes of burglary larceny and auto theft The Crime Index was developed by the Federal Bureau of Investigationrsquos Uniform Crime Reporting program to standardize the way in which law enforcement agencies report crime statistics Crime 2003 2004 2005 2006 2005-2006
Change
Murder 3 0 3 2 Inc
Rape 7 10 14 11 Inc
Stranger 1 0 3 2 Inc
Non-Stranger 6 10 11 9 Inc
Robbery 229 245 239 208 -13
Commercial 41 60 73 38 -48
Street 188 185 166 170 +2
Aggravated Assault 271 248 244 237 -3
Total Violent Crime 510 503 500 458 -8
Burglary 651 724 623 685 +10
Commercial 134 139 133 189 +42
Residential 517 585 490 496 +1
Larceny 2389 2654 2396 2377 -1
from Building 518 572 539 386 -28
from Motor Vehicle 657 734 615 754 +23
from Person 331 381 343 337 -2
of Bicycle 212 229 241 204 -15
Shoplifting 358 383 403 342 -15
from Residence 183 226 175 246 +41
of License Plate 75 67 42 30 -29
of Services 24 30 19 21 +11
Miscellaneous 31 32 19 57 +200
Auto Theft 419 438 295 233 -21
Total Property Crime 3459 3816 3314 3295 -1
Crime Index Total 3969 4319 3814 3753 -2 Note Inc = percentages are not calculated for numbers so small so as to prevent a statistically misleading percentage
8
Please Note Due to reclassification year to year final numbers are subject to change
CC AA MM BB RR II DD GG EE UU NN II FF OO RR MM CC RR II MM EE RR EE PP OO RR TT SS TT AA TT II SS TT II CC SS 11 99 88 77 -- 22 00 00 66
1987
1988
1989
1990
1991
1992
1993
1994
1995
1996
1997
1998
1999
2000
2001
2002
2003
2004
2005
2006
Crime
Avg
198
7-19
96
Avg
199
7-20
06
Avg
198
7-20
06
C
hang
e 20
05-2
006
Cha
nge
1997
-200
6
Murder 2 7 7 3 5 2 2 1 3 1 2 2 2 1 1 6 3 0 3 2 3 2 3 Inc No change
Rape 36 30 25 29 38 33 30 28 35 34 24 25 15 11 15 10 7 10 14 11 32 14 23 -21 -54 Robbery 417 402 460 431 399 286 253 276 295 227 176 208 165 186 181 195 229 245 239 208 345 203 274 -13 +18 Aggravated Assault 340 371 365 614 567 551 643 473 463 381 370 369 348 322 272 284 271 248 244 237 477 297 387 -3 -36
Burglary 1477 1337 1621 1470 1098 866 929 774 953 791 596 695 567 552 688 720 651 724 623 685 1132 650 891 +10 +15 Larceny Theft 3229 3127 3692 3136 3363 3326 3563 3351 3313 2973 2779 2753 2819 2820 2740 2764 2389 2654 2396 2377 3307 2649 2978 -1 -14
Auto Theft 1152 1175 1170 1353 1012 887 964 761 558 544 483 397 431 498 523 425 419 438 295 233 958 414 686 -21 -52 Total Violent 795 810 857 1077 1009 872 928 778 796 643 572 604 530 520 469 495 510 503 500 458 857 516 686 -8 -20
Total Property 5858 5639 6483 5959 5473 5079 5456 5086 4824 4308 3858 3845 3817 3870 3951 3909 3459 3816 3314 3295 5417 3713 4565 -1 -15
Total 6653 6449 7340 7036 6482 5951 6384 5664 5620 4951 4430 4449 4347 4390 4420 4404 3969 4319 3814 3753 6253 4230 5241 -2 -15 Note Inc = percentages are not calculated for numbers so small so as to prevent a statistically misleading percentage The Cambridge Police Department voluntarily submits Uniform Crime Report statistics to the FBI for national comparison See httpwwwfbigovucrucrhtm for more information Percent changes are rounded to the nearest whole number A 0 change means that there was less than a 5 increase or decrease
9
2255--YY EE AA RR SS TT AA TT II SS TT II CC AA LL TT RR EE NN DD SS
0
1000
2000
3000
4000
5000
6000
7000
8000
9000
1982
1984
1986
1988
1990
1992
1994
1996
1998
2000
2002
2004
2006
0
200
400
600
800
1000
1200
1982
1984
1986
1988
1990
1992
1994
1996
1998
2000
2002
2004
2006
Cambridge reported its lowest amountof crime in over 40 years in 2006 Thetotal crime index has fallen 56 since1982 Serious crime numbers havebeen on a steady decline since the late1970s with the exception of spikes atthe turn of two decades These spikeswere caused by a sharp increase inproperty crimes in 1980 and a sharpincrease in violent crimes in 1990After 1997 the crime rate leveled offfor approximately six years until itdropped by 10 in 2003 A smallincrease in 2004 was countered by twosubsequent decreases in 2005 and2006 Overall crime in Cambridgehas dropped approximately 15 in thepast five years
Total Part I (Index) Crime
Violent crime totals include the crimes ofmurder rape robbery and assault Totalswere fairly unsteady in the 1980s The lateyears of the decade were marked by a greatincrease in incidentsmdashreflective of thenationrsquos epidemic of gang and drugviolence combined with greater reportingof domestic assaults Since 1990 violentcrime totals have been steadily decliningbut have been marked by small spikesevery other year or so This year reportedviolent crimes decreased by 42 incidents(8) from 2005 indicating the lowestnumber in the past 25 years
Total Part I Violent Crime
0
1000
2000
3000
4000
5000
6000
7000
8000
9000
1982
1984
1986
1988
1990
1992
1994
1996
1998
2000
2002
2004
2006
Total Part I Property Crime Property crime totals include burglarylarceny and auto theft Property crimeusually accounts for 80-90 of thePart I total which explains why thegraph to the left mirrors the graph atthe top so closely Totals have fallen57 since 1982 and 15 since 1997Burglary and auto theft haveexperienced significant decreases overthe past two decades but larceny(common theft) has remained fairlysteady Auto theft is at its lowest ratein 50 years After 1997 crime ratesleveled off for approximately sixyears until they dropped by 12 in2003 An increase in 2004 wasfollowed by a decrease of 14 overthe next two years consequently thisyearrsquos totals are lowest in over 40years
10
22000066 EE XX EE CC UU TT II VV EE SS UU MM MM AA RR YY
IMPORTANT FACTS ABOUT THE 2006 INDEX TOTAL The Crime Index is composed of selected offenses used to gauge fluctuations in the overall volume and rate of crime reported to police The offenses included are the violent crimes of murder rape robbery and aggravated assault and the property crimes of burglary larceny and auto theft The Crime Index was developed by the Federal Bureau of Investigationrsquos Uniform Crime Reporting program to standardize the way in which law enforcement agencies report crime statistics The 3753 serious crimes recorded in Cambridge in 2006 represent the Cityrsquos lowest Uniform Crime Reporting Index number reported to the FBI in over 40 years The City of Cambridge has recorded fewer than 4000 serious crimes only three times since 1960 The 2006 decline of 2 with 61 fewer incidents than in 2005 represents the cityrsquos lowest recorded crime index total since the mid ndash1960s Further analysis indicates that violent crime decreased by 8 in 2006 with 42 fewer incidents and property crime declined by 1 with 19 fewer incidents The three biggest declines for 2006 were in commercial robbery (-48) larceny of license plate (-29) and larceny from building (-28) when compared with the 2005 figures MURDER
bull Murders in Cambridge most often fall into three distinct scenarios domestic situations drug or gang related altercations and homeless against homeless street fights Two people died in Cambridge in 2006 as a result of handgun violence among young males in the city
bull Nationally cities of 100000 people average 10 murders per year bull In the first incident Corey Davis 19 was walking down the street when he was shot in a drive by Davis
was shot three times in the back and was pronounced dead later that night A month later US Marshals in Virginia arrested James Miller 23 of Dorchester for Davisrsquo murder In June of 2006 Remele Ahart 21 of Chelsea and Ahmad Bright 17 of Dorchester were also arrested in connection with this murder
bull The second shooting occurred just ten days after Davis was killed Doowensky Nazaire 22 of Somerville died from two gunshot wounds he sustained while standing in front of a club in Cambridge Officers apprehended Elysee Bresilla 28 of Roslindale as he fled from the scene and charged him with murder when Nazaire succumbed to his injuries a short time after the shooting
bull Since 1990 Cambridge has averaged two murders per year which is a decrease from the 30-year period between 1960 and 1989 when the average was slightly less than five per year
RAPE bull Cambridge reported 11 rapes in 2006 a total that remains below the 10-year average of 14 rapes per year bull Nine of the eleven rapes in 2006 were completed acts and two were categorized as attempts bull Five of the nine completed rapes in 2006 were acquaintance rapes where the victim knew the perpetrator bull Since 1980 there has only been one stranger-to-stranger ldquostreetrdquo rape pattern in Cambridge the ldquoRainy
Day Rapistrdquo who preyed on victims in the Fresh Pond area on rainy days in 1981
ROBBERY bull The steady increase in robberies that began in 2002 has reversed over the past two years with an overall
decrease of 15 since 2004 2006rsquos decline of 13 dropped the total to 208 incidents bull Commercial robberies fell by 35 incidents from 2005rsquos total translating to a 48 decrease This is the
lowest number of commercial robberies in nearly three years bull Convenience stores continued to be the common target of commercial robberies in 2006 Approximately
29 of the robberies in 2006 were of convenience stores with the majority of these incidents occurring late at night between 800 pm and midnight
bull Robberies of gas stations declined by 69 helping to contribute to the overall decline in commercial robbery
bull The number of street robberies reported in 2006 increased slightly by four incidents translating to a 2 increase over the previous year Nearly 83 of all street robberies occurred on the street or sidewalk
11
bull The majority of the street robberies throughout the city occurred between 700 pm and 100 am These are common times for street robberies to be reported because people can become targets when they are walking alone late at night distracted or intoxicated
BURGLARY bull Cambridge saw a 10 increase in burglaries between 2005 and 2006 which can be wholly attributed to the
42 increase in commercial burglary bull Construction site breaks alone increased by 24 incidents in 2006 This translates to a 343 increase (7 in
2005 vs 31 in 2006) bull Housebreaks were up 1 in Cambridge in 2006 compared to 2005 increasing from 490 incidents to 496
This total includes 80 housebreaks that were attempted but not completed bull In a number of the summer breaks entry was gained through cut window screens and the perpetrators stole
electronics and money left in plain sight
LARCENY bull There was an overall decrease in larceny incidents in 2006 with the most significant drop coming from the
categories of larceny from building and larceny of license plates down 28 and 29 respectively bull There were 386 larcenies from buildings reported this year representing a 28 decrease from the previous
year This number is considerably below the five-year average of 535 incidents bull The three major hot spots of larcenies from buildings in 2006 were the Cambridgeside Galleria Mall the
Cambridge Rindge and Latin School and Ballyrsquos Health Club bull Larcenies from motor vehicles reached a significant high in 2006 at 754 incidents translating to a 23
increase from the previous year This yearrsquos high is also the decadersquos high bull There were two recurrent larceny from motor vehicle patterns throughout the City in 2006 thefts of GPS
navigation systems and thefts of stereo systems bull The most common method of entry into motor vehicles in 2006 was by breaking one or more windows of
the vehicle This method was reported in half of the incidents bull A two-year increase of larcenies of bicycles in 2004 and 2005 came to a halt in 2006 when only 204
incidents were reported representing a 15 decrease from 2005
AUTO THEFT bull In 2006 Cambridge reported its lowest number of stolen cars in over 20 years with only 233 incidents bull Hondas continue to be the most commonly stolen automobiles constituting 32 of all reports Toyotas
and Fords involved in approximately 25-30 incidents each came in second and third place respectively This information is consistent with historical and national trends
bull The most targeted model in 2006 was the Honda Civic followed by the Toyota Camry and the Honda Accord
bull Approximately 40 of the cars reported stolen in 2006 have been recovered to date The majority of the recovered cars were located throughout Cambridge and Boston
CITYWIDE SHOOTING VICTIMS IN 2006
bull There were 12 shootings in 2006 producing 13 victims with gunshot wounds five victims from four incidents in Area 4 three incidents in Cambridgeport two in InmanHarrington and one each in North Cambridge Riverside and Mid-Cambridge
bull Four of the incidents were during a threendashweek period from late February to mid-March that produced the two homicides recorded in 2006 Arrests were made in both homicide cases
bull Twelve of the gunshot victims were male and one was female bull Ten of the victims were Cambridge residents The other three victims were from Everett Somerville and
Dorchester bull The youngest of the victims was 14 years old the oldest 27 Nine of the thirteen victims were between 19
and 25 years of age bull There were 11 known offenders all males with an average age of 23 Two were Cambridge residents and
nine were non-residents There were also six cases where the offender was not substantiated bull There were arrests made in 6 of the 12 incidents In four of the open cases solid suspects were established
but victims and witnesses were uncooperative In the six incidents involving the arrest of a suspect three cases involved multiple arrestsoffenders
12
NNAATTIIOONNAALLRREEGGIIOONNAALL CCRRIIMMEE CCOOMMPPAARRIISSOONN
Note that the following tables are based on information from the FBIrsquos Uniform Crime Reports and the latest available data available for comparison was from 2005
2005 CRIMES IN CITIES OF 94000-106000 RESIDENTS NATIONWIDE
City Murder Rape Robbery Assault Burglary Larceny Auto Theft Total
Albany NY 8 68 439 760 1328 3186 369 6158 Allentown PA 21 45 512 285 1393 3905 473 6634 Arvada CO 2 23 52 119 524 2772 581 4073 Athens-Clarke County GA 5 41 135 176 1047 4185 361 5950 Berkeley CA 3 18 354 195 1229 5503 1244 8546 Brockton MA1 10 47 211 NA 687 2282 738 3975 Burbank CA 3 13 67 163 586 1690 495 3017 Cambridge MA 3 14 239 244 623 2396 295 3814 Cary NC 0 13 50 70 432 1428 103 2096 Charleston SC 10 49 290 654 810 3464 482 5759 Compton CA 65 40 474 1152 638 971 1006 4346 Daly City CA 2 20 122 142 251 39 468 1044 Davenport IA 7 54 272 990 1451 5213 416 8403 Dearborn MI 3 30 223 315 651 3191 1082 5495 Denton TX 5 72 76 225 684 3180 246 4488 Erie PA 6 75 200 191 632 2129 106 3339 Everett WA 3 48 173 313 1272 4243 2085 8137 Fairfield CA 9 38 218 320 748 2876 836 5045 Gary IN 58 70 306 284 1593 2556 1161 6028 Gresham OR 3 69 148 280 882 3216 1249 5847 Livonia MI 3 13 62 92 444 1574 383 2571 Lowell MA 2 41 213 753 644 1942 689 4284 Macon GA 20 58 332 406 2028 6124 1065 10033 Miami Gardens FL 11 57 540 1305 1395 4235 968 8511 Miramar FL 3 35 152 296 939 1831 442 3698 Mission Viejo CA 2 3 36 69 225 953 81 1369 Odessa TX 3 12 72 503 756 2785 179 4310 Portsmouth VA 22 41 366 472 1049 3708 407 6065 Pueblo CO 13 22 162 489 1525 4978 478 7667 Richardson TX 2 12 98 149 764 2437 277 3739 Richmond CA 40 35 526 573 1062 2350 2396 6982 Santa Clara CA 5 18 49 118 553 2470 397 3610 South Gate CA 6 19 305 197 444 1164 1289 3424 Vacaville CA 2 23 69 168 353 1899 266 2780 Ventura CA 1 19 107 170 815 2695 401 4208 Wichita Falls TX 6 43 239 445 1703 5386 552 8374 Woodbridge Township NJ 2 17 81 203 347 2168 294 3112 Average 10 36 215 359 879 2895 658 5052 Cambridge MA 3 14 239 244 623 2396 295 3814
13
Among similarly sized cities in 2005 Cambridge ranked below the nationwide average for all but one of the index crimes (robbery) Overall the total number of serious crimes in Cambridge ranked 25 below than the national average of similarly sized cities Again statistics for 2005 are the latest available from cities of similar size to Cambridge for comparative analysis
How Cambridge Compares Nationally in 2005
Murder 70 lower than the national average per 100000 inhabitants Rape 61 lower than the national average per 100000 inhabitants continuing the downward trend which began in 1998
Robbery 11 higher than the national average per 100000 inhabitants likely resulting from the close proximity of Cambridge to other large cities
Assault 32 below the national average per 100000 inhabitants
Burglary 29 below the national average per 100000 inhabitants continuing the downward trend which began in the early 1980s
Larceny 17 below the national average Larceny typically accounts for the highest percentage of index crimes in Cambridge but traditionally reports lower numbers than the national average
Auto Theft 55 below the national average per 100000 inhabitants
2005 TOTAL NUMBER AND RATE OF CRIMES IN SELECT MASSACHUSETTS CITIES AND TOWNS
Total City Population Murder Rape Robbery Assault Burglary Larceny Auto Theft Total Rate Medford 54047 1 8 47 15 327 944 189 1531 2833
Brockton1 94746 10 47 211 NA 687 2282 738 3975 4195 Lynn 89234 5 12 270 783 816 1527 582 3995 4477 Chicopee 54686 2 27 46 268 479 1048 223 2093 3827 Lawrence 71659 0 17 159 408 601 577 533 2295 3203 Cambridge 101355 3 14 239 244 623 2396 295 3814 3763 Lowell 103370 2 41 213 753 664 1942 689 4304 4164 New Bedford 93720 8 52 257 707 877 1924 315 4140 4417 Haverhill 60315 0 13 52 231 593 708 116 1713 2840 Somerville 75412 1 7 139 115 521 833 319 1935 2566 Framingham 65416 0 12 48 124 312 1025 219 1740 2660 Quincy 89661 2 26 92 219 387 883 152 1761 1964
Brookline1 56032 0 7 59 NA 219 749 45 1079 1926 Waltham 32513 0 1 15 46 116 518 518 1214 3734 Newton 83570 1 6 15 92 269 783 46 1212 1450 Average 75049 2 19 124 308 499 1209 332 2453 3201 Cambridge 101355 3 14 239 244 623 2396 295 3814 3763
Rate is calculated per 100000 residents Statistics for 2005 for select Massachusetts cities are the latest available for comparative analysis with Cambridge 1 Note that assault statistics for the City of Brockton and Brookline were unavailable There were approximately 3762 crimes per 100000 residents in Cambridge Note that this number does not reflect the increased daytime population which exceeds 250000 people on any given day
14
15
Please note the Crime Clock should be viewed with care Being the most aggregate representation of Cambridgecrime data it is designed to convey the annual reported crime experience by showing the relative frequency ofoccurrence of the index offenses This mode of display should not be taken to imply regularity in the commission ofcrimes rather it represents the annual ratio of crime to fixed time intervals
CCIITTYY OOFF CCAAMMBBRRIIDDGGEE CCRRIIMMEE CCLLOOCCKK
22000066
1
Index Crime Offense Every 2 hours
Violent Crime Every 19 hours
1 Murder Every 183 days
1 Rape Every 33 days
1 Robbery Every 42 hours
Aggravated Assault Every 37 hours
Property CrimeEvery 3 hours1
1
1 Burglary Every 13 hours
1 Larceny Every 4 Hours
1 Auto Theft Every 38 Days
1
16
FFAACCTTOORRSS CCOONNTTRRIIBBUUTTIINNGG TTOO CCRRIIMMEE
Throughout the 2006 Annual Report the Department tries to place statistics in contextmdashto explain why crime occurs in a particular area instead of just where and how often It is impossible however to analyze every crime factor within the pages of this report As a general rule readers should consider the following factors when gauging the relative safety of any city neighborhood or business district The FBI in its Uniform Crime Reports provides most of these factors Factor General Effect Status in Cambridge Effects in Cambridge Residential Population amp Population Density
High population leads to higher residential crime rate (residential burglaries larcenies from motor vehicles domestic assaults auto theft) High population density also leads to a higher residential crime rate
Population of about 101000 Very high density (about 15000 per square mile)
Higher residential crime rate than cities of fewer than 100000 Higher residential crime rate in densely populated neighborhoods
of Mid-Cambridge North Cambridge Cambridgeport Low residential crime rate in sparsely populated areas of
Cambridge Highlands Strawberry Hill Agassiz
Commerical amp Educational Population number amp type of commercial establishments and educational institutions
High commercial population leads to more ldquobusinessrdquo crimes (commercial burglaries shoplifting larcenies from buildings forgery) and to more crimes against the person often committed in commercial areas (larcenies from the person larcenies from motor vehicles larcenies of bicycles street robbery auto theft)
Very high commercial population (many large businesses shopping areas in Cambridge) and very high educational population (MIT and Harvard)
High overall larceny rate High larceny rate in highly-populated commercial areas of East
Cambridge Harvard Square Central Square Porter Square Fresh Pond Mall
High auto theft rate in East Cambridge MIT Area Low larceny auto theft rate in Agassiz Strawberry Hill West
Cambridge
Age composition of population
A higher population in the ldquoat riskrdquo age of 15ndash24 leads to a higher crime rate
22 percent of the citizens of Cambridge are in the ldquoat riskrdquo populationThis number is influenced by the high student population
Agassiz MIT and Riverside have the largest percentage of people in the ldquoat riskrdquo ages but most of them are college students which somewhat decreases their chances of involvement in criminal activity Consequently Agassiz MIT and Riverside do not have higher than average crime rates
However neighborhoods with the lowest numbers of ldquoat riskrdquo agesmdashWest Cambridge Cambridge Highlands and Strawberry Hillmdashdo experience smaller amounts of crime
Stability of Population Stable close-knit populations have a lower overall crime rate than transient populations Neighborhoods with more houses and condominiums (generally signifiying a more stable population) have a lower crime rate than neighborhoods with mostly apartments (generally a more transient population)
Historically stabler population west of Harvard Square more transient population east of Harvard Square This is changing rapidly with gentrification taking place in neighborhoods adjacent to Central Square
Lower comparative crime rate in neighborhoods of West Cambridge Highlands Peabody Agassiz Strawberry Hill
Higher comparative crime rate in Mid-Cambridge Area 4 Cambridgeport This however is changing with the stabilization and gentrification of housing in these areas
17
Street Layout Areas with major streets offering fast getaways and mass transportation show more crime clusters than neighborhoods with primarily residential streets
A mix of major and minor streets Higher auto theft rates in MIT East Cambridge Cambridgeport where thieves can make a quick jump over the bridge to Boston
Higher commercial burglary rate in North Cambridge with multiple avenues of escape into nearby towns
Proximity to Public Transportation
Criminals are often indigent and cannot afford cars or other expensive forms of transportation Areas near public transportation and particularly subways witness a higher crime ratemdashparticularly robbery and larcenymdashthan more inaccessable areas
Major public transportation system offering high-speed rapid transit throughout most of the city
Contributes to clusters of crime around Central Square Harvard Square Porter Square and Alewife though not much around Lechmere and Kendall Square
Neighborhoods distant from rapid transitmdashWest Cambridge Highlands and Strawberry Hillmdashshow lower crime rate with few clusters
Economic conditions including poverty level and unemployment rate
Again criminals are often indigent Areas afflicted by poverty show higher burglary robbery and larceny rates than middle-class or wealthy neighborhoods
Little abject poverty in Cambridge This factor probably contributes little to the picture of crime in Cambridge
Possibly some effect on Area 4mdashthe neighborhood with the lowest mean incomemdashthough Strawberry Hill which has the second lowest mean income also has one of the lowest crime rates in the city Other factors on this list probably have a much greater role than economic conditions
Family conditions with respect to divorce and family cohesiveness
Larry J Siegel author of Criminology says ldquoFamily relationships have for some time been considered a major determinant of behavior Youths who grow up in a household characterized by conflict and tension where parents are absent or separated or where there is a lack of familial love and support will be susceptible to the crime-promoting forces in the environmentrdquo
According to census data about one third of the families in Cambridge with children are single-parent families In the Commonwealth of Massachusetts as a whole this percentage is slightly lessmdashabout one quarter
The neighborhoods with the highest percentage of single-parent families are Area 4 Cambridgeport Riverside and North Cambridge With the exception of Riverside these neighborhoods also have a higher than mean crime rate However there are a far greater number of factors influencing ldquoconflict and tensionrdquo and ldquofamilial love and supportrdquo than just the number of parents in the household In the end no conclusions can be drawn without more data
Climate Warmer climates and seasons tend to report a higher rate of larceny auto theft and juvenile-related crime while cold seasons and climates report more robberies and murder
A varied climate warm and moist summers cool autums long cold winters
High overall larceny auto theft rate in the summer Higher overall robbery rate in the winter Burglary rate less tied to climate than to specific weather
conditions rain and snow produce fewer burglaries
Operational and investigative emphasis of the police department
Problem-oriented informed police departments have more success controlling certain aspects of crime than other departments
A problem-oriented department with an emphasis on directed patrol and investigation and on crime analysis including quick identification of crime patterns and rapid intervention to curtail them
Lower overall crime rate across the city than would be expected for a city of our size and characteristics
Attitude of the citizenry toward crime including its reporting practices
Populations that have ldquogiven uprdquo on crime and the police experience an exacerbation of the crime problem
A population that works closely with the police creates numerous neighborhood crime watches and is likely to report crimes
Lower overall crime rate across the city than would be expected for a city of our size and characteristics
18
0
5
10
15
20
25
Jan Feb Mar Apr May Jun Jul Aug Sep Oct Nov Dec
CCHHRROONNOOLLOOGGIICCAALL HHIIGGHHLLIIGGHHTTSS
0
10
20
30
40
50
60
70
Jan Feb Mar Apr May Jun Jul Aug Sep Oct Nov Dec
STREET ROBBERY
HOUSEBREAKS
There was a series of housebreaks along the CambridgeSomerville border which ended in the Somerville arrest of two individuals in early April They were believed to be responsible for over a dozen breaks along the boarder
Two patterns developed in the third quarter One took place during the daytime in InmanHarrington on the border of Sectors 1 amp 2 Entry was gained through unlocked windows and electronics were targeted The other took place in the early morning hours of the weekend in Sector 3 Arrests were made in both locations
A pattern developed in Area 4 at the end of February in which all victims were threatened with a gun and demanded to hand over their wallets Most victims were male and walking alone late at night
In mid to late April there was a pattern of pack robberies (mostly in InmanHarrington) in which juveniles targeted male victims Money and Ipods were the only items stolen Force was used or a weapon shown in four incidents
Mid-Cambridge had a pattern of housebreaks during the second quarter in which over 30 burglaries were reported Laptops digital cameras and Ipods were the common targets during the breaks
There were no identifiable patterns in the third quarter Area 4 and Peabody had the highest number of robberies through these months Six street robbery arrests took place throughout the city during this quarter
Sectors 1 and 2 saw an increase in street robberies with a weekend pattern in October that carried over into November This pattern significantly decreased with the arrest of three juveniles from Chelsea in late November
Sector 3 daytime housebreaks took place throughout the fourth quarter Entry was gained by prying open front doors Over 23 laptops were stolen in this pattern
19
020406080
100120140160
Jan Feb Mar Apr May Jun Jul Aug Sep Oct Nov Dec
0
1
2
3
4
5
6
7
Jan Feb Mar Apr May Jun Jul Aug Sep Oct Nov Dec
05
101520253035
Jan Feb Mar Apr May Jun Jul Aug Sep Oct Nov Dec
COMMERCIAL ROBBERY
COMMERCIAL BREAKS
LARCENY FROM MOTOR VEHICLE LARCENY FROM PERSON LARCENY FROM BUILDING
One convenience store was targeted three times throughout JanuaryFebruary There were three gas station robberies down from seven in last yearrsquos first quarter
The same convenience store was robbed again but an arrest was made this time In addition there were two retail robberies and one bank robbery
In July there were two gas station robberies and robberies at a restaurant and a market All other incidents resulted in arrests one was at a convenience store and the other two were banks
There were five bank robberies throughout the fourth quarter resulting in three arrests A Cambridge motel was robbed twice by two unknown suspects Four conveniencefast food stores were also targeted one arrest was made
There was a sporadic trend of breaks into convenience and drug stores targeting lottery tickets
These two quarters saw a dramatic increase in commercial breaks due to a number of construction site breaks for copper and equipment Toward the end of the third quarter thieves switched to stealing copper from residential homes which accounted for the decline in September Nine people were arrested in six of the breaks from April to September
December saw a pattern of breaks in InmanHarrington and Area 4 in which 17 businesses were broken into Cash registers and safes were usually targeted However in ten of the incidents nothing was reported stolen
Larcenies from persons significantly increased through September and October in Harvard amp Central Squares Thieves targeted items left unattended or hanging on the backs of chairs September - December also reported the highest number of larcenies from buildings with an increase in health club and school thefts
June - August experienced a pattern of car breaks in Peabody and Agassiz The most commonly stolen items were stereos Ten arrests were made in five of the incidents with the pattern cooling after the arrest of three juveniles at the end of August
The theft of GPS systems in January and March accounted for the spikes in crime during the first quarter Six people were arrested in connection with three of the incidents during this time
5
AA FF AA RR EE WW EE LL LL MM EE SS SS AA GG EE FF RR OO MM TT HH EE CC OO MM MM II SS SS II OO NN EE RR
It is my pleasure to present the Cambridge Police Departmentrsquos Annual Crime Report 2006 the eleventh Annual
Report produced during my tenure as Commissioner This will also be the final Annual Report produced under my leadership in Cambridge as I will be retiring in March of 2007 The objective of this report is to give Cambridge residents a realistic view of their risk of victimization and to provide detailed information on criminal activity in our City The 3753 serious crimes recorded in Cambridge in 2006 represent the Cityrsquos lowest Uniform Crime Reporting Index number reported to the FBI in over 40 years This number represents a decline of 2 from the previous low of 3814 crimes reported in 2005 This is only the third time since 1960 that the City of Cambridge has recorded fewer than 4000 serious crimes Further analysis of the 2006 figures indicates that property crime remained relatively unchanged in Cambridge this year with only a 1 reduction translating to 19 fewer incidents than in 2005 A 10 increase in burglary over the year was counteracted by drops in both auto thefts and larcenies to produce this overall decline Violent crime on the other hand experienced decreases in all categories resulting in an 8 drop when compared with the 2005 figures
Despite the recent reductions in crime the Cambridge Police Department continues to work as hard as ever to improve the conditions in which people live and work everyday in this great city One way the City of Cambridge has strived to do this is through an increased focus on social services throughout the city with an emphasis on providing safer after-school environments for children Programs offered through Tutoring Plus the Margaret Fuller Neighborhood House the North Cambridge Crime Task Force and other neighborhood organizations are all part of the citywide effort to keep our children safe In addition the Police Department is now taking a more proactive approach to reducing violent crime Investigations of crime in the city have revealed that a small number of individuals are often responsible for a large number of violent crimes Therefore one of the focuses this year has been to increase targeted surveillance of those particular individuals in an attempt to stop more crime from occurring or at least to improve the chances of successfully apprehending suspects when crimes do occur This initiative has also included an increased uniformed presence in area parks and other locations reporting increased violence Even as overall violent crime figures decline in Cambridge fighting violence must remain a top priority
As my time in this Department grows short I look back at my years here in Cambridge and I am proud of the work that
has been done and the positive changes that have been made The move towards community policing and citizen involvement over the years through such initiatives as the Neighborhood Sergeants Program has proved to be beneficial for both the Department and the community as a whole By improving the Police Departmentrsquos ability to communicate and foster partnerships with the citizens of Cambridge we have enhanced our image in the community and our ability to prevent and investigate crime There has also been a significant improvement in the association between the Police Department and the Police Review amp Advisory Board transitioning from a relationship of contention to one of professionalism and cooperation This cooperation in turn has led to an advancement in police performance and a reduction in complaints brought against the Department
In the future it is imperative that this Department remain constantly alert to the effect that the violence in other
communities has on Cambridge We must continue to monitor the activity of surrounding communities to ensure that the spillover from those communities does not adversely affect this city We must be vigilant to the quality of life issues that affect those who live and work here I am confident that the Cambridge Police Department will accomplish this mission as it transitions to new leadership
That being said the 2006 Annual Crime Report is one of the many resources the Cambridge Police Department provides to the citizens of Cambridge This Department is committed to providing timely and relevant information to the community and I urge you to visit our website at httpwwwcambridgepoliceorg for current information on crime and for important community alerts Armed with this knowledge the community and the Police Department can work together to develop effective strategies to ensure a high quality of life and to reduce crime and fear in the City of Cambridge
Ronnie Watson Police Commissioner
6
AA MM EE SS SS AA GG EE FF RR OO MM PP OO LL II CC EE CC OO MM MM II SS SS II OO NN EE RR RR OO BB EE RR TT CC HH AA AA SS
It is my pleasure to be a part of the Cambridge Police Departmentrsquos Annual Crime Report 2006 the first Annual Report produced since my appointment by Robert W Healy as Police Commissioner on April 9 2007
I would like to take this opportunity to thank members of the department for their hard work and support over the past few weeks I realize that this continues to be an important project for the department and is valuable to personnel city officials and the community The thoughtful planning of the 2006 Annual Report has presented the police department with an exciting opportunity with the departure of Commissioner Ronnie Watson and my appointment The Department will remain committed to providing timely and relevant information to the community I urge you to visit our website at httpwwwcambridgepoliceorg for current information on crime and community alerts I look forward to working with the community to develop strategies to ensure a high quality of life and to reduce crime and the elements that impact crime Sincerely
Robert C Haas Police Commissioner
FF OO RR EE WW OO RR DD
The Cambridge Police Departmentrsquos 2006 Annual Crime Report is an attempt to provide detailed information
so that citizens can make informed decisions about crime and safety in their neighborhoods The more information made available to the public the better the input will be in aiding the Police response to crime
The Annual Report offers a comprehensive analysis of the crimes reported by the Cambridge Police Department to the Federal Bureau of Investigationrsquos Uniform Crime Reporting (UCR) Program The UCR Program has been collecting national crime statistics from local police departments since 1930 Based on seriousness and frequency police departments are required to report their statistics on seven crimes which comprise the UCR Crime Index murder forcible rape aggravated assault robbery burglary larceny and auto theft The problem for the public as well as for the police is that UCR statistics alone are of little use to patrol deployment and offer little to citizens interested in reducing their risks The true picture of crime and disorder in a city is seldom conveyed to the public through simple statistics Crimes are complex events and these complexities encompass many dimensions It is our endeavor in this report to unravel the web of factors that comprise the crime rate The publication of detailed neighborhood crime statistics patterns and trends gives Cantabridgians a realistic view of their risks of victimization The Neighborhood and Business District sections within the Annual Crime Report are designed to help residents business owners and visitors have a fuller understanding of crime problems in their areas This report outlines three distinctions that make up criminal incidents (1) whether offenses are committed against strangers or against relatives and acquaintances (2) the motivation of the criminalsmdashdrugs revenge or intimidation are but a few of the factors that motivate both novice and career criminals and (3) when and where crimes occur focusing on where the hotspots are and the best time frames for the majority of the incidents Outlining these factors is imperative to understanding the anatomy of crime in Cambridge and to developing appropriate responses
The rise and fall of the crime rate will always be with us To hold that tide in check it will take a partnership comprised of not just the Police and citizens but also every city agency the business community public service providers and church leaders The goal of the Annual Report is to provide this partnership with the knowledge to ensure the desired quality of life in all the neighborhoods of the City
Cambridge Police Department Crime Analysis Unit
7
22000066 CCRRIIMMEE IINNDDEEXX
The Crime Index is composed of selected offenses used to gauge fluctuations in the overall volume and rate of crime reported to police The offenses included are the violent crimes of murder rape robbery and aggravated assault and the property crimes of burglary larceny and auto theft The Crime Index was developed by the Federal Bureau of Investigationrsquos Uniform Crime Reporting program to standardize the way in which law enforcement agencies report crime statistics Crime 2003 2004 2005 2006 2005-2006
Change
Murder 3 0 3 2 Inc
Rape 7 10 14 11 Inc
Stranger 1 0 3 2 Inc
Non-Stranger 6 10 11 9 Inc
Robbery 229 245 239 208 -13
Commercial 41 60 73 38 -48
Street 188 185 166 170 +2
Aggravated Assault 271 248 244 237 -3
Total Violent Crime 510 503 500 458 -8
Burglary 651 724 623 685 +10
Commercial 134 139 133 189 +42
Residential 517 585 490 496 +1
Larceny 2389 2654 2396 2377 -1
from Building 518 572 539 386 -28
from Motor Vehicle 657 734 615 754 +23
from Person 331 381 343 337 -2
of Bicycle 212 229 241 204 -15
Shoplifting 358 383 403 342 -15
from Residence 183 226 175 246 +41
of License Plate 75 67 42 30 -29
of Services 24 30 19 21 +11
Miscellaneous 31 32 19 57 +200
Auto Theft 419 438 295 233 -21
Total Property Crime 3459 3816 3314 3295 -1
Crime Index Total 3969 4319 3814 3753 -2 Note Inc = percentages are not calculated for numbers so small so as to prevent a statistically misleading percentage
8
Please Note Due to reclassification year to year final numbers are subject to change
CC AA MM BB RR II DD GG EE UU NN II FF OO RR MM CC RR II MM EE RR EE PP OO RR TT SS TT AA TT II SS TT II CC SS 11 99 88 77 -- 22 00 00 66
1987
1988
1989
1990
1991
1992
1993
1994
1995
1996
1997
1998
1999
2000
2001
2002
2003
2004
2005
2006
Crime
Avg
198
7-19
96
Avg
199
7-20
06
Avg
198
7-20
06
C
hang
e 20
05-2
006
Cha
nge
1997
-200
6
Murder 2 7 7 3 5 2 2 1 3 1 2 2 2 1 1 6 3 0 3 2 3 2 3 Inc No change
Rape 36 30 25 29 38 33 30 28 35 34 24 25 15 11 15 10 7 10 14 11 32 14 23 -21 -54 Robbery 417 402 460 431 399 286 253 276 295 227 176 208 165 186 181 195 229 245 239 208 345 203 274 -13 +18 Aggravated Assault 340 371 365 614 567 551 643 473 463 381 370 369 348 322 272 284 271 248 244 237 477 297 387 -3 -36
Burglary 1477 1337 1621 1470 1098 866 929 774 953 791 596 695 567 552 688 720 651 724 623 685 1132 650 891 +10 +15 Larceny Theft 3229 3127 3692 3136 3363 3326 3563 3351 3313 2973 2779 2753 2819 2820 2740 2764 2389 2654 2396 2377 3307 2649 2978 -1 -14
Auto Theft 1152 1175 1170 1353 1012 887 964 761 558 544 483 397 431 498 523 425 419 438 295 233 958 414 686 -21 -52 Total Violent 795 810 857 1077 1009 872 928 778 796 643 572 604 530 520 469 495 510 503 500 458 857 516 686 -8 -20
Total Property 5858 5639 6483 5959 5473 5079 5456 5086 4824 4308 3858 3845 3817 3870 3951 3909 3459 3816 3314 3295 5417 3713 4565 -1 -15
Total 6653 6449 7340 7036 6482 5951 6384 5664 5620 4951 4430 4449 4347 4390 4420 4404 3969 4319 3814 3753 6253 4230 5241 -2 -15 Note Inc = percentages are not calculated for numbers so small so as to prevent a statistically misleading percentage The Cambridge Police Department voluntarily submits Uniform Crime Report statistics to the FBI for national comparison See httpwwwfbigovucrucrhtm for more information Percent changes are rounded to the nearest whole number A 0 change means that there was less than a 5 increase or decrease
9
2255--YY EE AA RR SS TT AA TT II SS TT II CC AA LL TT RR EE NN DD SS
0
1000
2000
3000
4000
5000
6000
7000
8000
9000
1982
1984
1986
1988
1990
1992
1994
1996
1998
2000
2002
2004
2006
0
200
400
600
800
1000
1200
1982
1984
1986
1988
1990
1992
1994
1996
1998
2000
2002
2004
2006
Cambridge reported its lowest amountof crime in over 40 years in 2006 Thetotal crime index has fallen 56 since1982 Serious crime numbers havebeen on a steady decline since the late1970s with the exception of spikes atthe turn of two decades These spikeswere caused by a sharp increase inproperty crimes in 1980 and a sharpincrease in violent crimes in 1990After 1997 the crime rate leveled offfor approximately six years until itdropped by 10 in 2003 A smallincrease in 2004 was countered by twosubsequent decreases in 2005 and2006 Overall crime in Cambridgehas dropped approximately 15 in thepast five years
Total Part I (Index) Crime
Violent crime totals include the crimes ofmurder rape robbery and assault Totalswere fairly unsteady in the 1980s The lateyears of the decade were marked by a greatincrease in incidentsmdashreflective of thenationrsquos epidemic of gang and drugviolence combined with greater reportingof domestic assaults Since 1990 violentcrime totals have been steadily decliningbut have been marked by small spikesevery other year or so This year reportedviolent crimes decreased by 42 incidents(8) from 2005 indicating the lowestnumber in the past 25 years
Total Part I Violent Crime
0
1000
2000
3000
4000
5000
6000
7000
8000
9000
1982
1984
1986
1988
1990
1992
1994
1996
1998
2000
2002
2004
2006
Total Part I Property Crime Property crime totals include burglarylarceny and auto theft Property crimeusually accounts for 80-90 of thePart I total which explains why thegraph to the left mirrors the graph atthe top so closely Totals have fallen57 since 1982 and 15 since 1997Burglary and auto theft haveexperienced significant decreases overthe past two decades but larceny(common theft) has remained fairlysteady Auto theft is at its lowest ratein 50 years After 1997 crime ratesleveled off for approximately sixyears until they dropped by 12 in2003 An increase in 2004 wasfollowed by a decrease of 14 overthe next two years consequently thisyearrsquos totals are lowest in over 40years
10
22000066 EE XX EE CC UU TT II VV EE SS UU MM MM AA RR YY
IMPORTANT FACTS ABOUT THE 2006 INDEX TOTAL The Crime Index is composed of selected offenses used to gauge fluctuations in the overall volume and rate of crime reported to police The offenses included are the violent crimes of murder rape robbery and aggravated assault and the property crimes of burglary larceny and auto theft The Crime Index was developed by the Federal Bureau of Investigationrsquos Uniform Crime Reporting program to standardize the way in which law enforcement agencies report crime statistics The 3753 serious crimes recorded in Cambridge in 2006 represent the Cityrsquos lowest Uniform Crime Reporting Index number reported to the FBI in over 40 years The City of Cambridge has recorded fewer than 4000 serious crimes only three times since 1960 The 2006 decline of 2 with 61 fewer incidents than in 2005 represents the cityrsquos lowest recorded crime index total since the mid ndash1960s Further analysis indicates that violent crime decreased by 8 in 2006 with 42 fewer incidents and property crime declined by 1 with 19 fewer incidents The three biggest declines for 2006 were in commercial robbery (-48) larceny of license plate (-29) and larceny from building (-28) when compared with the 2005 figures MURDER
bull Murders in Cambridge most often fall into three distinct scenarios domestic situations drug or gang related altercations and homeless against homeless street fights Two people died in Cambridge in 2006 as a result of handgun violence among young males in the city
bull Nationally cities of 100000 people average 10 murders per year bull In the first incident Corey Davis 19 was walking down the street when he was shot in a drive by Davis
was shot three times in the back and was pronounced dead later that night A month later US Marshals in Virginia arrested James Miller 23 of Dorchester for Davisrsquo murder In June of 2006 Remele Ahart 21 of Chelsea and Ahmad Bright 17 of Dorchester were also arrested in connection with this murder
bull The second shooting occurred just ten days after Davis was killed Doowensky Nazaire 22 of Somerville died from two gunshot wounds he sustained while standing in front of a club in Cambridge Officers apprehended Elysee Bresilla 28 of Roslindale as he fled from the scene and charged him with murder when Nazaire succumbed to his injuries a short time after the shooting
bull Since 1990 Cambridge has averaged two murders per year which is a decrease from the 30-year period between 1960 and 1989 when the average was slightly less than five per year
RAPE bull Cambridge reported 11 rapes in 2006 a total that remains below the 10-year average of 14 rapes per year bull Nine of the eleven rapes in 2006 were completed acts and two were categorized as attempts bull Five of the nine completed rapes in 2006 were acquaintance rapes where the victim knew the perpetrator bull Since 1980 there has only been one stranger-to-stranger ldquostreetrdquo rape pattern in Cambridge the ldquoRainy
Day Rapistrdquo who preyed on victims in the Fresh Pond area on rainy days in 1981
ROBBERY bull The steady increase in robberies that began in 2002 has reversed over the past two years with an overall
decrease of 15 since 2004 2006rsquos decline of 13 dropped the total to 208 incidents bull Commercial robberies fell by 35 incidents from 2005rsquos total translating to a 48 decrease This is the
lowest number of commercial robberies in nearly three years bull Convenience stores continued to be the common target of commercial robberies in 2006 Approximately
29 of the robberies in 2006 were of convenience stores with the majority of these incidents occurring late at night between 800 pm and midnight
bull Robberies of gas stations declined by 69 helping to contribute to the overall decline in commercial robbery
bull The number of street robberies reported in 2006 increased slightly by four incidents translating to a 2 increase over the previous year Nearly 83 of all street robberies occurred on the street or sidewalk
11
bull The majority of the street robberies throughout the city occurred between 700 pm and 100 am These are common times for street robberies to be reported because people can become targets when they are walking alone late at night distracted or intoxicated
BURGLARY bull Cambridge saw a 10 increase in burglaries between 2005 and 2006 which can be wholly attributed to the
42 increase in commercial burglary bull Construction site breaks alone increased by 24 incidents in 2006 This translates to a 343 increase (7 in
2005 vs 31 in 2006) bull Housebreaks were up 1 in Cambridge in 2006 compared to 2005 increasing from 490 incidents to 496
This total includes 80 housebreaks that were attempted but not completed bull In a number of the summer breaks entry was gained through cut window screens and the perpetrators stole
electronics and money left in plain sight
LARCENY bull There was an overall decrease in larceny incidents in 2006 with the most significant drop coming from the
categories of larceny from building and larceny of license plates down 28 and 29 respectively bull There were 386 larcenies from buildings reported this year representing a 28 decrease from the previous
year This number is considerably below the five-year average of 535 incidents bull The three major hot spots of larcenies from buildings in 2006 were the Cambridgeside Galleria Mall the
Cambridge Rindge and Latin School and Ballyrsquos Health Club bull Larcenies from motor vehicles reached a significant high in 2006 at 754 incidents translating to a 23
increase from the previous year This yearrsquos high is also the decadersquos high bull There were two recurrent larceny from motor vehicle patterns throughout the City in 2006 thefts of GPS
navigation systems and thefts of stereo systems bull The most common method of entry into motor vehicles in 2006 was by breaking one or more windows of
the vehicle This method was reported in half of the incidents bull A two-year increase of larcenies of bicycles in 2004 and 2005 came to a halt in 2006 when only 204
incidents were reported representing a 15 decrease from 2005
AUTO THEFT bull In 2006 Cambridge reported its lowest number of stolen cars in over 20 years with only 233 incidents bull Hondas continue to be the most commonly stolen automobiles constituting 32 of all reports Toyotas
and Fords involved in approximately 25-30 incidents each came in second and third place respectively This information is consistent with historical and national trends
bull The most targeted model in 2006 was the Honda Civic followed by the Toyota Camry and the Honda Accord
bull Approximately 40 of the cars reported stolen in 2006 have been recovered to date The majority of the recovered cars were located throughout Cambridge and Boston
CITYWIDE SHOOTING VICTIMS IN 2006
bull There were 12 shootings in 2006 producing 13 victims with gunshot wounds five victims from four incidents in Area 4 three incidents in Cambridgeport two in InmanHarrington and one each in North Cambridge Riverside and Mid-Cambridge
bull Four of the incidents were during a threendashweek period from late February to mid-March that produced the two homicides recorded in 2006 Arrests were made in both homicide cases
bull Twelve of the gunshot victims were male and one was female bull Ten of the victims were Cambridge residents The other three victims were from Everett Somerville and
Dorchester bull The youngest of the victims was 14 years old the oldest 27 Nine of the thirteen victims were between 19
and 25 years of age bull There were 11 known offenders all males with an average age of 23 Two were Cambridge residents and
nine were non-residents There were also six cases where the offender was not substantiated bull There were arrests made in 6 of the 12 incidents In four of the open cases solid suspects were established
but victims and witnesses were uncooperative In the six incidents involving the arrest of a suspect three cases involved multiple arrestsoffenders
12
NNAATTIIOONNAALLRREEGGIIOONNAALL CCRRIIMMEE CCOOMMPPAARRIISSOONN
Note that the following tables are based on information from the FBIrsquos Uniform Crime Reports and the latest available data available for comparison was from 2005
2005 CRIMES IN CITIES OF 94000-106000 RESIDENTS NATIONWIDE
City Murder Rape Robbery Assault Burglary Larceny Auto Theft Total
Albany NY 8 68 439 760 1328 3186 369 6158 Allentown PA 21 45 512 285 1393 3905 473 6634 Arvada CO 2 23 52 119 524 2772 581 4073 Athens-Clarke County GA 5 41 135 176 1047 4185 361 5950 Berkeley CA 3 18 354 195 1229 5503 1244 8546 Brockton MA1 10 47 211 NA 687 2282 738 3975 Burbank CA 3 13 67 163 586 1690 495 3017 Cambridge MA 3 14 239 244 623 2396 295 3814 Cary NC 0 13 50 70 432 1428 103 2096 Charleston SC 10 49 290 654 810 3464 482 5759 Compton CA 65 40 474 1152 638 971 1006 4346 Daly City CA 2 20 122 142 251 39 468 1044 Davenport IA 7 54 272 990 1451 5213 416 8403 Dearborn MI 3 30 223 315 651 3191 1082 5495 Denton TX 5 72 76 225 684 3180 246 4488 Erie PA 6 75 200 191 632 2129 106 3339 Everett WA 3 48 173 313 1272 4243 2085 8137 Fairfield CA 9 38 218 320 748 2876 836 5045 Gary IN 58 70 306 284 1593 2556 1161 6028 Gresham OR 3 69 148 280 882 3216 1249 5847 Livonia MI 3 13 62 92 444 1574 383 2571 Lowell MA 2 41 213 753 644 1942 689 4284 Macon GA 20 58 332 406 2028 6124 1065 10033 Miami Gardens FL 11 57 540 1305 1395 4235 968 8511 Miramar FL 3 35 152 296 939 1831 442 3698 Mission Viejo CA 2 3 36 69 225 953 81 1369 Odessa TX 3 12 72 503 756 2785 179 4310 Portsmouth VA 22 41 366 472 1049 3708 407 6065 Pueblo CO 13 22 162 489 1525 4978 478 7667 Richardson TX 2 12 98 149 764 2437 277 3739 Richmond CA 40 35 526 573 1062 2350 2396 6982 Santa Clara CA 5 18 49 118 553 2470 397 3610 South Gate CA 6 19 305 197 444 1164 1289 3424 Vacaville CA 2 23 69 168 353 1899 266 2780 Ventura CA 1 19 107 170 815 2695 401 4208 Wichita Falls TX 6 43 239 445 1703 5386 552 8374 Woodbridge Township NJ 2 17 81 203 347 2168 294 3112 Average 10 36 215 359 879 2895 658 5052 Cambridge MA 3 14 239 244 623 2396 295 3814
13
Among similarly sized cities in 2005 Cambridge ranked below the nationwide average for all but one of the index crimes (robbery) Overall the total number of serious crimes in Cambridge ranked 25 below than the national average of similarly sized cities Again statistics for 2005 are the latest available from cities of similar size to Cambridge for comparative analysis
How Cambridge Compares Nationally in 2005
Murder 70 lower than the national average per 100000 inhabitants Rape 61 lower than the national average per 100000 inhabitants continuing the downward trend which began in 1998
Robbery 11 higher than the national average per 100000 inhabitants likely resulting from the close proximity of Cambridge to other large cities
Assault 32 below the national average per 100000 inhabitants
Burglary 29 below the national average per 100000 inhabitants continuing the downward trend which began in the early 1980s
Larceny 17 below the national average Larceny typically accounts for the highest percentage of index crimes in Cambridge but traditionally reports lower numbers than the national average
Auto Theft 55 below the national average per 100000 inhabitants
2005 TOTAL NUMBER AND RATE OF CRIMES IN SELECT MASSACHUSETTS CITIES AND TOWNS
Total City Population Murder Rape Robbery Assault Burglary Larceny Auto Theft Total Rate Medford 54047 1 8 47 15 327 944 189 1531 2833
Brockton1 94746 10 47 211 NA 687 2282 738 3975 4195 Lynn 89234 5 12 270 783 816 1527 582 3995 4477 Chicopee 54686 2 27 46 268 479 1048 223 2093 3827 Lawrence 71659 0 17 159 408 601 577 533 2295 3203 Cambridge 101355 3 14 239 244 623 2396 295 3814 3763 Lowell 103370 2 41 213 753 664 1942 689 4304 4164 New Bedford 93720 8 52 257 707 877 1924 315 4140 4417 Haverhill 60315 0 13 52 231 593 708 116 1713 2840 Somerville 75412 1 7 139 115 521 833 319 1935 2566 Framingham 65416 0 12 48 124 312 1025 219 1740 2660 Quincy 89661 2 26 92 219 387 883 152 1761 1964
Brookline1 56032 0 7 59 NA 219 749 45 1079 1926 Waltham 32513 0 1 15 46 116 518 518 1214 3734 Newton 83570 1 6 15 92 269 783 46 1212 1450 Average 75049 2 19 124 308 499 1209 332 2453 3201 Cambridge 101355 3 14 239 244 623 2396 295 3814 3763
Rate is calculated per 100000 residents Statistics for 2005 for select Massachusetts cities are the latest available for comparative analysis with Cambridge 1 Note that assault statistics for the City of Brockton and Brookline were unavailable There were approximately 3762 crimes per 100000 residents in Cambridge Note that this number does not reflect the increased daytime population which exceeds 250000 people on any given day
14
15
Please note the Crime Clock should be viewed with care Being the most aggregate representation of Cambridgecrime data it is designed to convey the annual reported crime experience by showing the relative frequency ofoccurrence of the index offenses This mode of display should not be taken to imply regularity in the commission ofcrimes rather it represents the annual ratio of crime to fixed time intervals
CCIITTYY OOFF CCAAMMBBRRIIDDGGEE CCRRIIMMEE CCLLOOCCKK
22000066
1
Index Crime Offense Every 2 hours
Violent Crime Every 19 hours
1 Murder Every 183 days
1 Rape Every 33 days
1 Robbery Every 42 hours
Aggravated Assault Every 37 hours
Property CrimeEvery 3 hours1
1
1 Burglary Every 13 hours
1 Larceny Every 4 Hours
1 Auto Theft Every 38 Days
1
16
FFAACCTTOORRSS CCOONNTTRRIIBBUUTTIINNGG TTOO CCRRIIMMEE
Throughout the 2006 Annual Report the Department tries to place statistics in contextmdashto explain why crime occurs in a particular area instead of just where and how often It is impossible however to analyze every crime factor within the pages of this report As a general rule readers should consider the following factors when gauging the relative safety of any city neighborhood or business district The FBI in its Uniform Crime Reports provides most of these factors Factor General Effect Status in Cambridge Effects in Cambridge Residential Population amp Population Density
High population leads to higher residential crime rate (residential burglaries larcenies from motor vehicles domestic assaults auto theft) High population density also leads to a higher residential crime rate
Population of about 101000 Very high density (about 15000 per square mile)
Higher residential crime rate than cities of fewer than 100000 Higher residential crime rate in densely populated neighborhoods
of Mid-Cambridge North Cambridge Cambridgeport Low residential crime rate in sparsely populated areas of
Cambridge Highlands Strawberry Hill Agassiz
Commerical amp Educational Population number amp type of commercial establishments and educational institutions
High commercial population leads to more ldquobusinessrdquo crimes (commercial burglaries shoplifting larcenies from buildings forgery) and to more crimes against the person often committed in commercial areas (larcenies from the person larcenies from motor vehicles larcenies of bicycles street robbery auto theft)
Very high commercial population (many large businesses shopping areas in Cambridge) and very high educational population (MIT and Harvard)
High overall larceny rate High larceny rate in highly-populated commercial areas of East
Cambridge Harvard Square Central Square Porter Square Fresh Pond Mall
High auto theft rate in East Cambridge MIT Area Low larceny auto theft rate in Agassiz Strawberry Hill West
Cambridge
Age composition of population
A higher population in the ldquoat riskrdquo age of 15ndash24 leads to a higher crime rate
22 percent of the citizens of Cambridge are in the ldquoat riskrdquo populationThis number is influenced by the high student population
Agassiz MIT and Riverside have the largest percentage of people in the ldquoat riskrdquo ages but most of them are college students which somewhat decreases their chances of involvement in criminal activity Consequently Agassiz MIT and Riverside do not have higher than average crime rates
However neighborhoods with the lowest numbers of ldquoat riskrdquo agesmdashWest Cambridge Cambridge Highlands and Strawberry Hillmdashdo experience smaller amounts of crime
Stability of Population Stable close-knit populations have a lower overall crime rate than transient populations Neighborhoods with more houses and condominiums (generally signifiying a more stable population) have a lower crime rate than neighborhoods with mostly apartments (generally a more transient population)
Historically stabler population west of Harvard Square more transient population east of Harvard Square This is changing rapidly with gentrification taking place in neighborhoods adjacent to Central Square
Lower comparative crime rate in neighborhoods of West Cambridge Highlands Peabody Agassiz Strawberry Hill
Higher comparative crime rate in Mid-Cambridge Area 4 Cambridgeport This however is changing with the stabilization and gentrification of housing in these areas
17
Street Layout Areas with major streets offering fast getaways and mass transportation show more crime clusters than neighborhoods with primarily residential streets
A mix of major and minor streets Higher auto theft rates in MIT East Cambridge Cambridgeport where thieves can make a quick jump over the bridge to Boston
Higher commercial burglary rate in North Cambridge with multiple avenues of escape into nearby towns
Proximity to Public Transportation
Criminals are often indigent and cannot afford cars or other expensive forms of transportation Areas near public transportation and particularly subways witness a higher crime ratemdashparticularly robbery and larcenymdashthan more inaccessable areas
Major public transportation system offering high-speed rapid transit throughout most of the city
Contributes to clusters of crime around Central Square Harvard Square Porter Square and Alewife though not much around Lechmere and Kendall Square
Neighborhoods distant from rapid transitmdashWest Cambridge Highlands and Strawberry Hillmdashshow lower crime rate with few clusters
Economic conditions including poverty level and unemployment rate
Again criminals are often indigent Areas afflicted by poverty show higher burglary robbery and larceny rates than middle-class or wealthy neighborhoods
Little abject poverty in Cambridge This factor probably contributes little to the picture of crime in Cambridge
Possibly some effect on Area 4mdashthe neighborhood with the lowest mean incomemdashthough Strawberry Hill which has the second lowest mean income also has one of the lowest crime rates in the city Other factors on this list probably have a much greater role than economic conditions
Family conditions with respect to divorce and family cohesiveness
Larry J Siegel author of Criminology says ldquoFamily relationships have for some time been considered a major determinant of behavior Youths who grow up in a household characterized by conflict and tension where parents are absent or separated or where there is a lack of familial love and support will be susceptible to the crime-promoting forces in the environmentrdquo
According to census data about one third of the families in Cambridge with children are single-parent families In the Commonwealth of Massachusetts as a whole this percentage is slightly lessmdashabout one quarter
The neighborhoods with the highest percentage of single-parent families are Area 4 Cambridgeport Riverside and North Cambridge With the exception of Riverside these neighborhoods also have a higher than mean crime rate However there are a far greater number of factors influencing ldquoconflict and tensionrdquo and ldquofamilial love and supportrdquo than just the number of parents in the household In the end no conclusions can be drawn without more data
Climate Warmer climates and seasons tend to report a higher rate of larceny auto theft and juvenile-related crime while cold seasons and climates report more robberies and murder
A varied climate warm and moist summers cool autums long cold winters
High overall larceny auto theft rate in the summer Higher overall robbery rate in the winter Burglary rate less tied to climate than to specific weather
conditions rain and snow produce fewer burglaries
Operational and investigative emphasis of the police department
Problem-oriented informed police departments have more success controlling certain aspects of crime than other departments
A problem-oriented department with an emphasis on directed patrol and investigation and on crime analysis including quick identification of crime patterns and rapid intervention to curtail them
Lower overall crime rate across the city than would be expected for a city of our size and characteristics
Attitude of the citizenry toward crime including its reporting practices
Populations that have ldquogiven uprdquo on crime and the police experience an exacerbation of the crime problem
A population that works closely with the police creates numerous neighborhood crime watches and is likely to report crimes
Lower overall crime rate across the city than would be expected for a city of our size and characteristics
18
0
5
10
15
20
25
Jan Feb Mar Apr May Jun Jul Aug Sep Oct Nov Dec
CCHHRROONNOOLLOOGGIICCAALL HHIIGGHHLLIIGGHHTTSS
0
10
20
30
40
50
60
70
Jan Feb Mar Apr May Jun Jul Aug Sep Oct Nov Dec
STREET ROBBERY
HOUSEBREAKS
There was a series of housebreaks along the CambridgeSomerville border which ended in the Somerville arrest of two individuals in early April They were believed to be responsible for over a dozen breaks along the boarder
Two patterns developed in the third quarter One took place during the daytime in InmanHarrington on the border of Sectors 1 amp 2 Entry was gained through unlocked windows and electronics were targeted The other took place in the early morning hours of the weekend in Sector 3 Arrests were made in both locations
A pattern developed in Area 4 at the end of February in which all victims were threatened with a gun and demanded to hand over their wallets Most victims were male and walking alone late at night
In mid to late April there was a pattern of pack robberies (mostly in InmanHarrington) in which juveniles targeted male victims Money and Ipods were the only items stolen Force was used or a weapon shown in four incidents
Mid-Cambridge had a pattern of housebreaks during the second quarter in which over 30 burglaries were reported Laptops digital cameras and Ipods were the common targets during the breaks
There were no identifiable patterns in the third quarter Area 4 and Peabody had the highest number of robberies through these months Six street robbery arrests took place throughout the city during this quarter
Sectors 1 and 2 saw an increase in street robberies with a weekend pattern in October that carried over into November This pattern significantly decreased with the arrest of three juveniles from Chelsea in late November
Sector 3 daytime housebreaks took place throughout the fourth quarter Entry was gained by prying open front doors Over 23 laptops were stolen in this pattern
19
020406080
100120140160
Jan Feb Mar Apr May Jun Jul Aug Sep Oct Nov Dec
0
1
2
3
4
5
6
7
Jan Feb Mar Apr May Jun Jul Aug Sep Oct Nov Dec
05
101520253035
Jan Feb Mar Apr May Jun Jul Aug Sep Oct Nov Dec
COMMERCIAL ROBBERY
COMMERCIAL BREAKS
LARCENY FROM MOTOR VEHICLE LARCENY FROM PERSON LARCENY FROM BUILDING
One convenience store was targeted three times throughout JanuaryFebruary There were three gas station robberies down from seven in last yearrsquos first quarter
The same convenience store was robbed again but an arrest was made this time In addition there were two retail robberies and one bank robbery
In July there were two gas station robberies and robberies at a restaurant and a market All other incidents resulted in arrests one was at a convenience store and the other two were banks
There were five bank robberies throughout the fourth quarter resulting in three arrests A Cambridge motel was robbed twice by two unknown suspects Four conveniencefast food stores were also targeted one arrest was made
There was a sporadic trend of breaks into convenience and drug stores targeting lottery tickets
These two quarters saw a dramatic increase in commercial breaks due to a number of construction site breaks for copper and equipment Toward the end of the third quarter thieves switched to stealing copper from residential homes which accounted for the decline in September Nine people were arrested in six of the breaks from April to September
December saw a pattern of breaks in InmanHarrington and Area 4 in which 17 businesses were broken into Cash registers and safes were usually targeted However in ten of the incidents nothing was reported stolen
Larcenies from persons significantly increased through September and October in Harvard amp Central Squares Thieves targeted items left unattended or hanging on the backs of chairs September - December also reported the highest number of larcenies from buildings with an increase in health club and school thefts
June - August experienced a pattern of car breaks in Peabody and Agassiz The most commonly stolen items were stereos Ten arrests were made in five of the incidents with the pattern cooling after the arrest of three juveniles at the end of August
The theft of GPS systems in January and March accounted for the spikes in crime during the first quarter Six people were arrested in connection with three of the incidents during this time
6
AA MM EE SS SS AA GG EE FF RR OO MM PP OO LL II CC EE CC OO MM MM II SS SS II OO NN EE RR RR OO BB EE RR TT CC HH AA AA SS
It is my pleasure to be a part of the Cambridge Police Departmentrsquos Annual Crime Report 2006 the first Annual Report produced since my appointment by Robert W Healy as Police Commissioner on April 9 2007
I would like to take this opportunity to thank members of the department for their hard work and support over the past few weeks I realize that this continues to be an important project for the department and is valuable to personnel city officials and the community The thoughtful planning of the 2006 Annual Report has presented the police department with an exciting opportunity with the departure of Commissioner Ronnie Watson and my appointment The Department will remain committed to providing timely and relevant information to the community I urge you to visit our website at httpwwwcambridgepoliceorg for current information on crime and community alerts I look forward to working with the community to develop strategies to ensure a high quality of life and to reduce crime and the elements that impact crime Sincerely
Robert C Haas Police Commissioner
FF OO RR EE WW OO RR DD
The Cambridge Police Departmentrsquos 2006 Annual Crime Report is an attempt to provide detailed information
so that citizens can make informed decisions about crime and safety in their neighborhoods The more information made available to the public the better the input will be in aiding the Police response to crime
The Annual Report offers a comprehensive analysis of the crimes reported by the Cambridge Police Department to the Federal Bureau of Investigationrsquos Uniform Crime Reporting (UCR) Program The UCR Program has been collecting national crime statistics from local police departments since 1930 Based on seriousness and frequency police departments are required to report their statistics on seven crimes which comprise the UCR Crime Index murder forcible rape aggravated assault robbery burglary larceny and auto theft The problem for the public as well as for the police is that UCR statistics alone are of little use to patrol deployment and offer little to citizens interested in reducing their risks The true picture of crime and disorder in a city is seldom conveyed to the public through simple statistics Crimes are complex events and these complexities encompass many dimensions It is our endeavor in this report to unravel the web of factors that comprise the crime rate The publication of detailed neighborhood crime statistics patterns and trends gives Cantabridgians a realistic view of their risks of victimization The Neighborhood and Business District sections within the Annual Crime Report are designed to help residents business owners and visitors have a fuller understanding of crime problems in their areas This report outlines three distinctions that make up criminal incidents (1) whether offenses are committed against strangers or against relatives and acquaintances (2) the motivation of the criminalsmdashdrugs revenge or intimidation are but a few of the factors that motivate both novice and career criminals and (3) when and where crimes occur focusing on where the hotspots are and the best time frames for the majority of the incidents Outlining these factors is imperative to understanding the anatomy of crime in Cambridge and to developing appropriate responses
The rise and fall of the crime rate will always be with us To hold that tide in check it will take a partnership comprised of not just the Police and citizens but also every city agency the business community public service providers and church leaders The goal of the Annual Report is to provide this partnership with the knowledge to ensure the desired quality of life in all the neighborhoods of the City
Cambridge Police Department Crime Analysis Unit
7
22000066 CCRRIIMMEE IINNDDEEXX
The Crime Index is composed of selected offenses used to gauge fluctuations in the overall volume and rate of crime reported to police The offenses included are the violent crimes of murder rape robbery and aggravated assault and the property crimes of burglary larceny and auto theft The Crime Index was developed by the Federal Bureau of Investigationrsquos Uniform Crime Reporting program to standardize the way in which law enforcement agencies report crime statistics Crime 2003 2004 2005 2006 2005-2006
Change
Murder 3 0 3 2 Inc
Rape 7 10 14 11 Inc
Stranger 1 0 3 2 Inc
Non-Stranger 6 10 11 9 Inc
Robbery 229 245 239 208 -13
Commercial 41 60 73 38 -48
Street 188 185 166 170 +2
Aggravated Assault 271 248 244 237 -3
Total Violent Crime 510 503 500 458 -8
Burglary 651 724 623 685 +10
Commercial 134 139 133 189 +42
Residential 517 585 490 496 +1
Larceny 2389 2654 2396 2377 -1
from Building 518 572 539 386 -28
from Motor Vehicle 657 734 615 754 +23
from Person 331 381 343 337 -2
of Bicycle 212 229 241 204 -15
Shoplifting 358 383 403 342 -15
from Residence 183 226 175 246 +41
of License Plate 75 67 42 30 -29
of Services 24 30 19 21 +11
Miscellaneous 31 32 19 57 +200
Auto Theft 419 438 295 233 -21
Total Property Crime 3459 3816 3314 3295 -1
Crime Index Total 3969 4319 3814 3753 -2 Note Inc = percentages are not calculated for numbers so small so as to prevent a statistically misleading percentage
8
Please Note Due to reclassification year to year final numbers are subject to change
CC AA MM BB RR II DD GG EE UU NN II FF OO RR MM CC RR II MM EE RR EE PP OO RR TT SS TT AA TT II SS TT II CC SS 11 99 88 77 -- 22 00 00 66
1987
1988
1989
1990
1991
1992
1993
1994
1995
1996
1997
1998
1999
2000
2001
2002
2003
2004
2005
2006
Crime
Avg
198
7-19
96
Avg
199
7-20
06
Avg
198
7-20
06
C
hang
e 20
05-2
006
Cha
nge
1997
-200
6
Murder 2 7 7 3 5 2 2 1 3 1 2 2 2 1 1 6 3 0 3 2 3 2 3 Inc No change
Rape 36 30 25 29 38 33 30 28 35 34 24 25 15 11 15 10 7 10 14 11 32 14 23 -21 -54 Robbery 417 402 460 431 399 286 253 276 295 227 176 208 165 186 181 195 229 245 239 208 345 203 274 -13 +18 Aggravated Assault 340 371 365 614 567 551 643 473 463 381 370 369 348 322 272 284 271 248 244 237 477 297 387 -3 -36
Burglary 1477 1337 1621 1470 1098 866 929 774 953 791 596 695 567 552 688 720 651 724 623 685 1132 650 891 +10 +15 Larceny Theft 3229 3127 3692 3136 3363 3326 3563 3351 3313 2973 2779 2753 2819 2820 2740 2764 2389 2654 2396 2377 3307 2649 2978 -1 -14
Auto Theft 1152 1175 1170 1353 1012 887 964 761 558 544 483 397 431 498 523 425 419 438 295 233 958 414 686 -21 -52 Total Violent 795 810 857 1077 1009 872 928 778 796 643 572 604 530 520 469 495 510 503 500 458 857 516 686 -8 -20
Total Property 5858 5639 6483 5959 5473 5079 5456 5086 4824 4308 3858 3845 3817 3870 3951 3909 3459 3816 3314 3295 5417 3713 4565 -1 -15
Total 6653 6449 7340 7036 6482 5951 6384 5664 5620 4951 4430 4449 4347 4390 4420 4404 3969 4319 3814 3753 6253 4230 5241 -2 -15 Note Inc = percentages are not calculated for numbers so small so as to prevent a statistically misleading percentage The Cambridge Police Department voluntarily submits Uniform Crime Report statistics to the FBI for national comparison See httpwwwfbigovucrucrhtm for more information Percent changes are rounded to the nearest whole number A 0 change means that there was less than a 5 increase or decrease
9
2255--YY EE AA RR SS TT AA TT II SS TT II CC AA LL TT RR EE NN DD SS
0
1000
2000
3000
4000
5000
6000
7000
8000
9000
1982
1984
1986
1988
1990
1992
1994
1996
1998
2000
2002
2004
2006
0
200
400
600
800
1000
1200
1982
1984
1986
1988
1990
1992
1994
1996
1998
2000
2002
2004
2006
Cambridge reported its lowest amountof crime in over 40 years in 2006 Thetotal crime index has fallen 56 since1982 Serious crime numbers havebeen on a steady decline since the late1970s with the exception of spikes atthe turn of two decades These spikeswere caused by a sharp increase inproperty crimes in 1980 and a sharpincrease in violent crimes in 1990After 1997 the crime rate leveled offfor approximately six years until itdropped by 10 in 2003 A smallincrease in 2004 was countered by twosubsequent decreases in 2005 and2006 Overall crime in Cambridgehas dropped approximately 15 in thepast five years
Total Part I (Index) Crime
Violent crime totals include the crimes ofmurder rape robbery and assault Totalswere fairly unsteady in the 1980s The lateyears of the decade were marked by a greatincrease in incidentsmdashreflective of thenationrsquos epidemic of gang and drugviolence combined with greater reportingof domestic assaults Since 1990 violentcrime totals have been steadily decliningbut have been marked by small spikesevery other year or so This year reportedviolent crimes decreased by 42 incidents(8) from 2005 indicating the lowestnumber in the past 25 years
Total Part I Violent Crime
0
1000
2000
3000
4000
5000
6000
7000
8000
9000
1982
1984
1986
1988
1990
1992
1994
1996
1998
2000
2002
2004
2006
Total Part I Property Crime Property crime totals include burglarylarceny and auto theft Property crimeusually accounts for 80-90 of thePart I total which explains why thegraph to the left mirrors the graph atthe top so closely Totals have fallen57 since 1982 and 15 since 1997Burglary and auto theft haveexperienced significant decreases overthe past two decades but larceny(common theft) has remained fairlysteady Auto theft is at its lowest ratein 50 years After 1997 crime ratesleveled off for approximately sixyears until they dropped by 12 in2003 An increase in 2004 wasfollowed by a decrease of 14 overthe next two years consequently thisyearrsquos totals are lowest in over 40years
10
22000066 EE XX EE CC UU TT II VV EE SS UU MM MM AA RR YY
IMPORTANT FACTS ABOUT THE 2006 INDEX TOTAL The Crime Index is composed of selected offenses used to gauge fluctuations in the overall volume and rate of crime reported to police The offenses included are the violent crimes of murder rape robbery and aggravated assault and the property crimes of burglary larceny and auto theft The Crime Index was developed by the Federal Bureau of Investigationrsquos Uniform Crime Reporting program to standardize the way in which law enforcement agencies report crime statistics The 3753 serious crimes recorded in Cambridge in 2006 represent the Cityrsquos lowest Uniform Crime Reporting Index number reported to the FBI in over 40 years The City of Cambridge has recorded fewer than 4000 serious crimes only three times since 1960 The 2006 decline of 2 with 61 fewer incidents than in 2005 represents the cityrsquos lowest recorded crime index total since the mid ndash1960s Further analysis indicates that violent crime decreased by 8 in 2006 with 42 fewer incidents and property crime declined by 1 with 19 fewer incidents The three biggest declines for 2006 were in commercial robbery (-48) larceny of license plate (-29) and larceny from building (-28) when compared with the 2005 figures MURDER
bull Murders in Cambridge most often fall into three distinct scenarios domestic situations drug or gang related altercations and homeless against homeless street fights Two people died in Cambridge in 2006 as a result of handgun violence among young males in the city
bull Nationally cities of 100000 people average 10 murders per year bull In the first incident Corey Davis 19 was walking down the street when he was shot in a drive by Davis
was shot three times in the back and was pronounced dead later that night A month later US Marshals in Virginia arrested James Miller 23 of Dorchester for Davisrsquo murder In June of 2006 Remele Ahart 21 of Chelsea and Ahmad Bright 17 of Dorchester were also arrested in connection with this murder
bull The second shooting occurred just ten days after Davis was killed Doowensky Nazaire 22 of Somerville died from two gunshot wounds he sustained while standing in front of a club in Cambridge Officers apprehended Elysee Bresilla 28 of Roslindale as he fled from the scene and charged him with murder when Nazaire succumbed to his injuries a short time after the shooting
bull Since 1990 Cambridge has averaged two murders per year which is a decrease from the 30-year period between 1960 and 1989 when the average was slightly less than five per year
RAPE bull Cambridge reported 11 rapes in 2006 a total that remains below the 10-year average of 14 rapes per year bull Nine of the eleven rapes in 2006 were completed acts and two were categorized as attempts bull Five of the nine completed rapes in 2006 were acquaintance rapes where the victim knew the perpetrator bull Since 1980 there has only been one stranger-to-stranger ldquostreetrdquo rape pattern in Cambridge the ldquoRainy
Day Rapistrdquo who preyed on victims in the Fresh Pond area on rainy days in 1981
ROBBERY bull The steady increase in robberies that began in 2002 has reversed over the past two years with an overall
decrease of 15 since 2004 2006rsquos decline of 13 dropped the total to 208 incidents bull Commercial robberies fell by 35 incidents from 2005rsquos total translating to a 48 decrease This is the
lowest number of commercial robberies in nearly three years bull Convenience stores continued to be the common target of commercial robberies in 2006 Approximately
29 of the robberies in 2006 were of convenience stores with the majority of these incidents occurring late at night between 800 pm and midnight
bull Robberies of gas stations declined by 69 helping to contribute to the overall decline in commercial robbery
bull The number of street robberies reported in 2006 increased slightly by four incidents translating to a 2 increase over the previous year Nearly 83 of all street robberies occurred on the street or sidewalk
11
bull The majority of the street robberies throughout the city occurred between 700 pm and 100 am These are common times for street robberies to be reported because people can become targets when they are walking alone late at night distracted or intoxicated
BURGLARY bull Cambridge saw a 10 increase in burglaries between 2005 and 2006 which can be wholly attributed to the
42 increase in commercial burglary bull Construction site breaks alone increased by 24 incidents in 2006 This translates to a 343 increase (7 in
2005 vs 31 in 2006) bull Housebreaks were up 1 in Cambridge in 2006 compared to 2005 increasing from 490 incidents to 496
This total includes 80 housebreaks that were attempted but not completed bull In a number of the summer breaks entry was gained through cut window screens and the perpetrators stole
electronics and money left in plain sight
LARCENY bull There was an overall decrease in larceny incidents in 2006 with the most significant drop coming from the
categories of larceny from building and larceny of license plates down 28 and 29 respectively bull There were 386 larcenies from buildings reported this year representing a 28 decrease from the previous
year This number is considerably below the five-year average of 535 incidents bull The three major hot spots of larcenies from buildings in 2006 were the Cambridgeside Galleria Mall the
Cambridge Rindge and Latin School and Ballyrsquos Health Club bull Larcenies from motor vehicles reached a significant high in 2006 at 754 incidents translating to a 23
increase from the previous year This yearrsquos high is also the decadersquos high bull There were two recurrent larceny from motor vehicle patterns throughout the City in 2006 thefts of GPS
navigation systems and thefts of stereo systems bull The most common method of entry into motor vehicles in 2006 was by breaking one or more windows of
the vehicle This method was reported in half of the incidents bull A two-year increase of larcenies of bicycles in 2004 and 2005 came to a halt in 2006 when only 204
incidents were reported representing a 15 decrease from 2005
AUTO THEFT bull In 2006 Cambridge reported its lowest number of stolen cars in over 20 years with only 233 incidents bull Hondas continue to be the most commonly stolen automobiles constituting 32 of all reports Toyotas
and Fords involved in approximately 25-30 incidents each came in second and third place respectively This information is consistent with historical and national trends
bull The most targeted model in 2006 was the Honda Civic followed by the Toyota Camry and the Honda Accord
bull Approximately 40 of the cars reported stolen in 2006 have been recovered to date The majority of the recovered cars were located throughout Cambridge and Boston
CITYWIDE SHOOTING VICTIMS IN 2006
bull There were 12 shootings in 2006 producing 13 victims with gunshot wounds five victims from four incidents in Area 4 three incidents in Cambridgeport two in InmanHarrington and one each in North Cambridge Riverside and Mid-Cambridge
bull Four of the incidents were during a threendashweek period from late February to mid-March that produced the two homicides recorded in 2006 Arrests were made in both homicide cases
bull Twelve of the gunshot victims were male and one was female bull Ten of the victims were Cambridge residents The other three victims were from Everett Somerville and
Dorchester bull The youngest of the victims was 14 years old the oldest 27 Nine of the thirteen victims were between 19
and 25 years of age bull There were 11 known offenders all males with an average age of 23 Two were Cambridge residents and
nine were non-residents There were also six cases where the offender was not substantiated bull There were arrests made in 6 of the 12 incidents In four of the open cases solid suspects were established
but victims and witnesses were uncooperative In the six incidents involving the arrest of a suspect three cases involved multiple arrestsoffenders
12
NNAATTIIOONNAALLRREEGGIIOONNAALL CCRRIIMMEE CCOOMMPPAARRIISSOONN
Note that the following tables are based on information from the FBIrsquos Uniform Crime Reports and the latest available data available for comparison was from 2005
2005 CRIMES IN CITIES OF 94000-106000 RESIDENTS NATIONWIDE
City Murder Rape Robbery Assault Burglary Larceny Auto Theft Total
Albany NY 8 68 439 760 1328 3186 369 6158 Allentown PA 21 45 512 285 1393 3905 473 6634 Arvada CO 2 23 52 119 524 2772 581 4073 Athens-Clarke County GA 5 41 135 176 1047 4185 361 5950 Berkeley CA 3 18 354 195 1229 5503 1244 8546 Brockton MA1 10 47 211 NA 687 2282 738 3975 Burbank CA 3 13 67 163 586 1690 495 3017 Cambridge MA 3 14 239 244 623 2396 295 3814 Cary NC 0 13 50 70 432 1428 103 2096 Charleston SC 10 49 290 654 810 3464 482 5759 Compton CA 65 40 474 1152 638 971 1006 4346 Daly City CA 2 20 122 142 251 39 468 1044 Davenport IA 7 54 272 990 1451 5213 416 8403 Dearborn MI 3 30 223 315 651 3191 1082 5495 Denton TX 5 72 76 225 684 3180 246 4488 Erie PA 6 75 200 191 632 2129 106 3339 Everett WA 3 48 173 313 1272 4243 2085 8137 Fairfield CA 9 38 218 320 748 2876 836 5045 Gary IN 58 70 306 284 1593 2556 1161 6028 Gresham OR 3 69 148 280 882 3216 1249 5847 Livonia MI 3 13 62 92 444 1574 383 2571 Lowell MA 2 41 213 753 644 1942 689 4284 Macon GA 20 58 332 406 2028 6124 1065 10033 Miami Gardens FL 11 57 540 1305 1395 4235 968 8511 Miramar FL 3 35 152 296 939 1831 442 3698 Mission Viejo CA 2 3 36 69 225 953 81 1369 Odessa TX 3 12 72 503 756 2785 179 4310 Portsmouth VA 22 41 366 472 1049 3708 407 6065 Pueblo CO 13 22 162 489 1525 4978 478 7667 Richardson TX 2 12 98 149 764 2437 277 3739 Richmond CA 40 35 526 573 1062 2350 2396 6982 Santa Clara CA 5 18 49 118 553 2470 397 3610 South Gate CA 6 19 305 197 444 1164 1289 3424 Vacaville CA 2 23 69 168 353 1899 266 2780 Ventura CA 1 19 107 170 815 2695 401 4208 Wichita Falls TX 6 43 239 445 1703 5386 552 8374 Woodbridge Township NJ 2 17 81 203 347 2168 294 3112 Average 10 36 215 359 879 2895 658 5052 Cambridge MA 3 14 239 244 623 2396 295 3814
13
Among similarly sized cities in 2005 Cambridge ranked below the nationwide average for all but one of the index crimes (robbery) Overall the total number of serious crimes in Cambridge ranked 25 below than the national average of similarly sized cities Again statistics for 2005 are the latest available from cities of similar size to Cambridge for comparative analysis
How Cambridge Compares Nationally in 2005
Murder 70 lower than the national average per 100000 inhabitants Rape 61 lower than the national average per 100000 inhabitants continuing the downward trend which began in 1998
Robbery 11 higher than the national average per 100000 inhabitants likely resulting from the close proximity of Cambridge to other large cities
Assault 32 below the national average per 100000 inhabitants
Burglary 29 below the national average per 100000 inhabitants continuing the downward trend which began in the early 1980s
Larceny 17 below the national average Larceny typically accounts for the highest percentage of index crimes in Cambridge but traditionally reports lower numbers than the national average
Auto Theft 55 below the national average per 100000 inhabitants
2005 TOTAL NUMBER AND RATE OF CRIMES IN SELECT MASSACHUSETTS CITIES AND TOWNS
Total City Population Murder Rape Robbery Assault Burglary Larceny Auto Theft Total Rate Medford 54047 1 8 47 15 327 944 189 1531 2833
Brockton1 94746 10 47 211 NA 687 2282 738 3975 4195 Lynn 89234 5 12 270 783 816 1527 582 3995 4477 Chicopee 54686 2 27 46 268 479 1048 223 2093 3827 Lawrence 71659 0 17 159 408 601 577 533 2295 3203 Cambridge 101355 3 14 239 244 623 2396 295 3814 3763 Lowell 103370 2 41 213 753 664 1942 689 4304 4164 New Bedford 93720 8 52 257 707 877 1924 315 4140 4417 Haverhill 60315 0 13 52 231 593 708 116 1713 2840 Somerville 75412 1 7 139 115 521 833 319 1935 2566 Framingham 65416 0 12 48 124 312 1025 219 1740 2660 Quincy 89661 2 26 92 219 387 883 152 1761 1964
Brookline1 56032 0 7 59 NA 219 749 45 1079 1926 Waltham 32513 0 1 15 46 116 518 518 1214 3734 Newton 83570 1 6 15 92 269 783 46 1212 1450 Average 75049 2 19 124 308 499 1209 332 2453 3201 Cambridge 101355 3 14 239 244 623 2396 295 3814 3763
Rate is calculated per 100000 residents Statistics for 2005 for select Massachusetts cities are the latest available for comparative analysis with Cambridge 1 Note that assault statistics for the City of Brockton and Brookline were unavailable There were approximately 3762 crimes per 100000 residents in Cambridge Note that this number does not reflect the increased daytime population which exceeds 250000 people on any given day
14
15
Please note the Crime Clock should be viewed with care Being the most aggregate representation of Cambridgecrime data it is designed to convey the annual reported crime experience by showing the relative frequency ofoccurrence of the index offenses This mode of display should not be taken to imply regularity in the commission ofcrimes rather it represents the annual ratio of crime to fixed time intervals
CCIITTYY OOFF CCAAMMBBRRIIDDGGEE CCRRIIMMEE CCLLOOCCKK
22000066
1
Index Crime Offense Every 2 hours
Violent Crime Every 19 hours
1 Murder Every 183 days
1 Rape Every 33 days
1 Robbery Every 42 hours
Aggravated Assault Every 37 hours
Property CrimeEvery 3 hours1
1
1 Burglary Every 13 hours
1 Larceny Every 4 Hours
1 Auto Theft Every 38 Days
1
16
FFAACCTTOORRSS CCOONNTTRRIIBBUUTTIINNGG TTOO CCRRIIMMEE
Throughout the 2006 Annual Report the Department tries to place statistics in contextmdashto explain why crime occurs in a particular area instead of just where and how often It is impossible however to analyze every crime factor within the pages of this report As a general rule readers should consider the following factors when gauging the relative safety of any city neighborhood or business district The FBI in its Uniform Crime Reports provides most of these factors Factor General Effect Status in Cambridge Effects in Cambridge Residential Population amp Population Density
High population leads to higher residential crime rate (residential burglaries larcenies from motor vehicles domestic assaults auto theft) High population density also leads to a higher residential crime rate
Population of about 101000 Very high density (about 15000 per square mile)
Higher residential crime rate than cities of fewer than 100000 Higher residential crime rate in densely populated neighborhoods
of Mid-Cambridge North Cambridge Cambridgeport Low residential crime rate in sparsely populated areas of
Cambridge Highlands Strawberry Hill Agassiz
Commerical amp Educational Population number amp type of commercial establishments and educational institutions
High commercial population leads to more ldquobusinessrdquo crimes (commercial burglaries shoplifting larcenies from buildings forgery) and to more crimes against the person often committed in commercial areas (larcenies from the person larcenies from motor vehicles larcenies of bicycles street robbery auto theft)
Very high commercial population (many large businesses shopping areas in Cambridge) and very high educational population (MIT and Harvard)
High overall larceny rate High larceny rate in highly-populated commercial areas of East
Cambridge Harvard Square Central Square Porter Square Fresh Pond Mall
High auto theft rate in East Cambridge MIT Area Low larceny auto theft rate in Agassiz Strawberry Hill West
Cambridge
Age composition of population
A higher population in the ldquoat riskrdquo age of 15ndash24 leads to a higher crime rate
22 percent of the citizens of Cambridge are in the ldquoat riskrdquo populationThis number is influenced by the high student population
Agassiz MIT and Riverside have the largest percentage of people in the ldquoat riskrdquo ages but most of them are college students which somewhat decreases their chances of involvement in criminal activity Consequently Agassiz MIT and Riverside do not have higher than average crime rates
However neighborhoods with the lowest numbers of ldquoat riskrdquo agesmdashWest Cambridge Cambridge Highlands and Strawberry Hillmdashdo experience smaller amounts of crime
Stability of Population Stable close-knit populations have a lower overall crime rate than transient populations Neighborhoods with more houses and condominiums (generally signifiying a more stable population) have a lower crime rate than neighborhoods with mostly apartments (generally a more transient population)
Historically stabler population west of Harvard Square more transient population east of Harvard Square This is changing rapidly with gentrification taking place in neighborhoods adjacent to Central Square
Lower comparative crime rate in neighborhoods of West Cambridge Highlands Peabody Agassiz Strawberry Hill
Higher comparative crime rate in Mid-Cambridge Area 4 Cambridgeport This however is changing with the stabilization and gentrification of housing in these areas
17
Street Layout Areas with major streets offering fast getaways and mass transportation show more crime clusters than neighborhoods with primarily residential streets
A mix of major and minor streets Higher auto theft rates in MIT East Cambridge Cambridgeport where thieves can make a quick jump over the bridge to Boston
Higher commercial burglary rate in North Cambridge with multiple avenues of escape into nearby towns
Proximity to Public Transportation
Criminals are often indigent and cannot afford cars or other expensive forms of transportation Areas near public transportation and particularly subways witness a higher crime ratemdashparticularly robbery and larcenymdashthan more inaccessable areas
Major public transportation system offering high-speed rapid transit throughout most of the city
Contributes to clusters of crime around Central Square Harvard Square Porter Square and Alewife though not much around Lechmere and Kendall Square
Neighborhoods distant from rapid transitmdashWest Cambridge Highlands and Strawberry Hillmdashshow lower crime rate with few clusters
Economic conditions including poverty level and unemployment rate
Again criminals are often indigent Areas afflicted by poverty show higher burglary robbery and larceny rates than middle-class or wealthy neighborhoods
Little abject poverty in Cambridge This factor probably contributes little to the picture of crime in Cambridge
Possibly some effect on Area 4mdashthe neighborhood with the lowest mean incomemdashthough Strawberry Hill which has the second lowest mean income also has one of the lowest crime rates in the city Other factors on this list probably have a much greater role than economic conditions
Family conditions with respect to divorce and family cohesiveness
Larry J Siegel author of Criminology says ldquoFamily relationships have for some time been considered a major determinant of behavior Youths who grow up in a household characterized by conflict and tension where parents are absent or separated or where there is a lack of familial love and support will be susceptible to the crime-promoting forces in the environmentrdquo
According to census data about one third of the families in Cambridge with children are single-parent families In the Commonwealth of Massachusetts as a whole this percentage is slightly lessmdashabout one quarter
The neighborhoods with the highest percentage of single-parent families are Area 4 Cambridgeport Riverside and North Cambridge With the exception of Riverside these neighborhoods also have a higher than mean crime rate However there are a far greater number of factors influencing ldquoconflict and tensionrdquo and ldquofamilial love and supportrdquo than just the number of parents in the household In the end no conclusions can be drawn without more data
Climate Warmer climates and seasons tend to report a higher rate of larceny auto theft and juvenile-related crime while cold seasons and climates report more robberies and murder
A varied climate warm and moist summers cool autums long cold winters
High overall larceny auto theft rate in the summer Higher overall robbery rate in the winter Burglary rate less tied to climate than to specific weather
conditions rain and snow produce fewer burglaries
Operational and investigative emphasis of the police department
Problem-oriented informed police departments have more success controlling certain aspects of crime than other departments
A problem-oriented department with an emphasis on directed patrol and investigation and on crime analysis including quick identification of crime patterns and rapid intervention to curtail them
Lower overall crime rate across the city than would be expected for a city of our size and characteristics
Attitude of the citizenry toward crime including its reporting practices
Populations that have ldquogiven uprdquo on crime and the police experience an exacerbation of the crime problem
A population that works closely with the police creates numerous neighborhood crime watches and is likely to report crimes
Lower overall crime rate across the city than would be expected for a city of our size and characteristics
18
0
5
10
15
20
25
Jan Feb Mar Apr May Jun Jul Aug Sep Oct Nov Dec
CCHHRROONNOOLLOOGGIICCAALL HHIIGGHHLLIIGGHHTTSS
0
10
20
30
40
50
60
70
Jan Feb Mar Apr May Jun Jul Aug Sep Oct Nov Dec
STREET ROBBERY
HOUSEBREAKS
There was a series of housebreaks along the CambridgeSomerville border which ended in the Somerville arrest of two individuals in early April They were believed to be responsible for over a dozen breaks along the boarder
Two patterns developed in the third quarter One took place during the daytime in InmanHarrington on the border of Sectors 1 amp 2 Entry was gained through unlocked windows and electronics were targeted The other took place in the early morning hours of the weekend in Sector 3 Arrests were made in both locations
A pattern developed in Area 4 at the end of February in which all victims were threatened with a gun and demanded to hand over their wallets Most victims were male and walking alone late at night
In mid to late April there was a pattern of pack robberies (mostly in InmanHarrington) in which juveniles targeted male victims Money and Ipods were the only items stolen Force was used or a weapon shown in four incidents
Mid-Cambridge had a pattern of housebreaks during the second quarter in which over 30 burglaries were reported Laptops digital cameras and Ipods were the common targets during the breaks
There were no identifiable patterns in the third quarter Area 4 and Peabody had the highest number of robberies through these months Six street robbery arrests took place throughout the city during this quarter
Sectors 1 and 2 saw an increase in street robberies with a weekend pattern in October that carried over into November This pattern significantly decreased with the arrest of three juveniles from Chelsea in late November
Sector 3 daytime housebreaks took place throughout the fourth quarter Entry was gained by prying open front doors Over 23 laptops were stolen in this pattern
19
020406080
100120140160
Jan Feb Mar Apr May Jun Jul Aug Sep Oct Nov Dec
0
1
2
3
4
5
6
7
Jan Feb Mar Apr May Jun Jul Aug Sep Oct Nov Dec
05
101520253035
Jan Feb Mar Apr May Jun Jul Aug Sep Oct Nov Dec
COMMERCIAL ROBBERY
COMMERCIAL BREAKS
LARCENY FROM MOTOR VEHICLE LARCENY FROM PERSON LARCENY FROM BUILDING
One convenience store was targeted three times throughout JanuaryFebruary There were three gas station robberies down from seven in last yearrsquos first quarter
The same convenience store was robbed again but an arrest was made this time In addition there were two retail robberies and one bank robbery
In July there were two gas station robberies and robberies at a restaurant and a market All other incidents resulted in arrests one was at a convenience store and the other two were banks
There were five bank robberies throughout the fourth quarter resulting in three arrests A Cambridge motel was robbed twice by two unknown suspects Four conveniencefast food stores were also targeted one arrest was made
There was a sporadic trend of breaks into convenience and drug stores targeting lottery tickets
These two quarters saw a dramatic increase in commercial breaks due to a number of construction site breaks for copper and equipment Toward the end of the third quarter thieves switched to stealing copper from residential homes which accounted for the decline in September Nine people were arrested in six of the breaks from April to September
December saw a pattern of breaks in InmanHarrington and Area 4 in which 17 businesses were broken into Cash registers and safes were usually targeted However in ten of the incidents nothing was reported stolen
Larcenies from persons significantly increased through September and October in Harvard amp Central Squares Thieves targeted items left unattended or hanging on the backs of chairs September - December also reported the highest number of larcenies from buildings with an increase in health club and school thefts
June - August experienced a pattern of car breaks in Peabody and Agassiz The most commonly stolen items were stereos Ten arrests were made in five of the incidents with the pattern cooling after the arrest of three juveniles at the end of August
The theft of GPS systems in January and March accounted for the spikes in crime during the first quarter Six people were arrested in connection with three of the incidents during this time
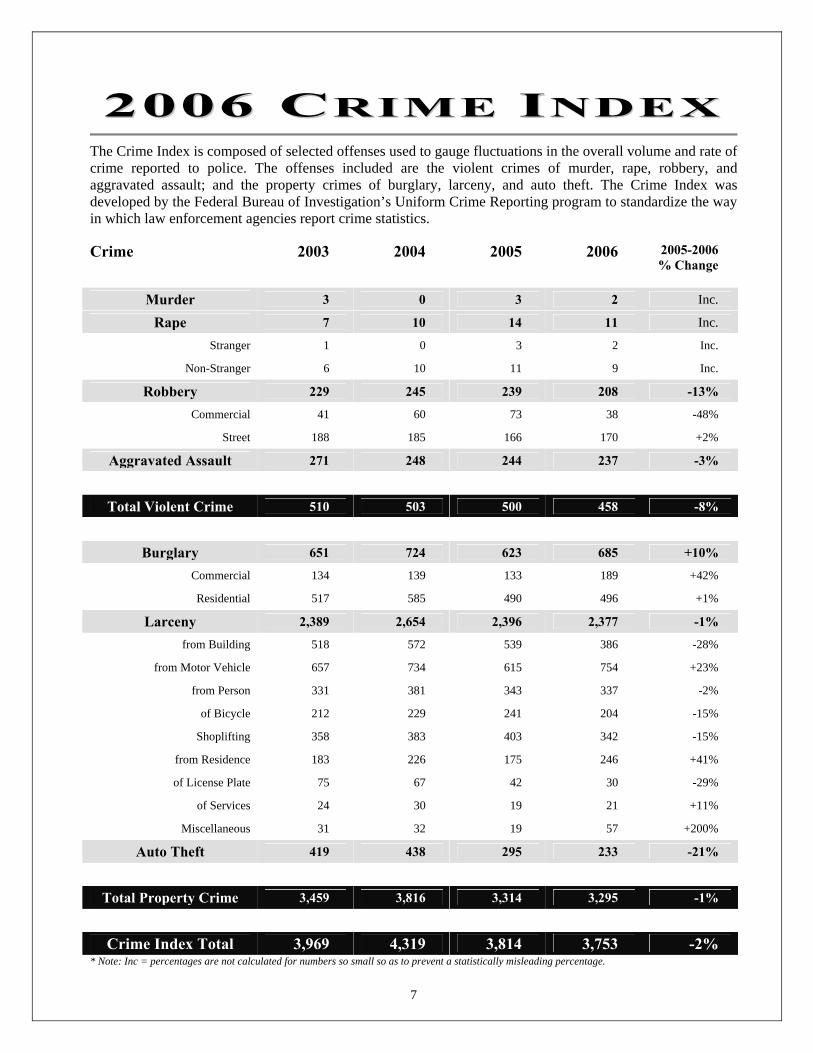
7
22000066 CCRRIIMMEE IINNDDEEXX
The Crime Index is composed of selected offenses used to gauge fluctuations in the overall volume and rate of crime reported to police The offenses included are the violent crimes of murder rape robbery and aggravated assault and the property crimes of burglary larceny and auto theft The Crime Index was developed by the Federal Bureau of Investigationrsquos Uniform Crime Reporting program to standardize the way in which law enforcement agencies report crime statistics Crime 2003 2004 2005 2006 2005-2006
Change
Murder 3 0 3 2 Inc
Rape 7 10 14 11 Inc
Stranger 1 0 3 2 Inc
Non-Stranger 6 10 11 9 Inc
Robbery 229 245 239 208 -13
Commercial 41 60 73 38 -48
Street 188 185 166 170 +2
Aggravated Assault 271 248 244 237 -3
Total Violent Crime 510 503 500 458 -8
Burglary 651 724 623 685 +10
Commercial 134 139 133 189 +42
Residential 517 585 490 496 +1
Larceny 2389 2654 2396 2377 -1
from Building 518 572 539 386 -28
from Motor Vehicle 657 734 615 754 +23
from Person 331 381 343 337 -2
of Bicycle 212 229 241 204 -15
Shoplifting 358 383 403 342 -15
from Residence 183 226 175 246 +41
of License Plate 75 67 42 30 -29
of Services 24 30 19 21 +11
Miscellaneous 31 32 19 57 +200
Auto Theft 419 438 295 233 -21
Total Property Crime 3459 3816 3314 3295 -1
Crime Index Total 3969 4319 3814 3753 -2 Note Inc = percentages are not calculated for numbers so small so as to prevent a statistically misleading percentage
8
Please Note Due to reclassification year to year final numbers are subject to change
CC AA MM BB RR II DD GG EE UU NN II FF OO RR MM CC RR II MM EE RR EE PP OO RR TT SS TT AA TT II SS TT II CC SS 11 99 88 77 -- 22 00 00 66
1987
1988
1989
1990
1991
1992
1993
1994
1995
1996
1997
1998
1999
2000
2001
2002
2003
2004
2005
2006
Crime
Avg
198
7-19
96
Avg
199
7-20
06
Avg
198
7-20
06
C
hang
e 20
05-2
006
Cha
nge
1997
-200
6
Murder 2 7 7 3 5 2 2 1 3 1 2 2 2 1 1 6 3 0 3 2 3 2 3 Inc No change
Rape 36 30 25 29 38 33 30 28 35 34 24 25 15 11 15 10 7 10 14 11 32 14 23 -21 -54 Robbery 417 402 460 431 399 286 253 276 295 227 176 208 165 186 181 195 229 245 239 208 345 203 274 -13 +18 Aggravated Assault 340 371 365 614 567 551 643 473 463 381 370 369 348 322 272 284 271 248 244 237 477 297 387 -3 -36
Burglary 1477 1337 1621 1470 1098 866 929 774 953 791 596 695 567 552 688 720 651 724 623 685 1132 650 891 +10 +15 Larceny Theft 3229 3127 3692 3136 3363 3326 3563 3351 3313 2973 2779 2753 2819 2820 2740 2764 2389 2654 2396 2377 3307 2649 2978 -1 -14
Auto Theft 1152 1175 1170 1353 1012 887 964 761 558 544 483 397 431 498 523 425 419 438 295 233 958 414 686 -21 -52 Total Violent 795 810 857 1077 1009 872 928 778 796 643 572 604 530 520 469 495 510 503 500 458 857 516 686 -8 -20
Total Property 5858 5639 6483 5959 5473 5079 5456 5086 4824 4308 3858 3845 3817 3870 3951 3909 3459 3816 3314 3295 5417 3713 4565 -1 -15
Total 6653 6449 7340 7036 6482 5951 6384 5664 5620 4951 4430 4449 4347 4390 4420 4404 3969 4319 3814 3753 6253 4230 5241 -2 -15 Note Inc = percentages are not calculated for numbers so small so as to prevent a statistically misleading percentage The Cambridge Police Department voluntarily submits Uniform Crime Report statistics to the FBI for national comparison See httpwwwfbigovucrucrhtm for more information Percent changes are rounded to the nearest whole number A 0 change means that there was less than a 5 increase or decrease
9
2255--YY EE AA RR SS TT AA TT II SS TT II CC AA LL TT RR EE NN DD SS
0
1000
2000
3000
4000
5000
6000
7000
8000
9000
1982
1984
1986
1988
1990
1992
1994
1996
1998
2000
2002
2004
2006
0
200
400
600
800
1000
1200
1982
1984
1986
1988
1990
1992
1994
1996
1998
2000
2002
2004
2006
Cambridge reported its lowest amountof crime in over 40 years in 2006 Thetotal crime index has fallen 56 since1982 Serious crime numbers havebeen on a steady decline since the late1970s with the exception of spikes atthe turn of two decades These spikeswere caused by a sharp increase inproperty crimes in 1980 and a sharpincrease in violent crimes in 1990After 1997 the crime rate leveled offfor approximately six years until itdropped by 10 in 2003 A smallincrease in 2004 was countered by twosubsequent decreases in 2005 and2006 Overall crime in Cambridgehas dropped approximately 15 in thepast five years
Total Part I (Index) Crime
Violent crime totals include the crimes ofmurder rape robbery and assault Totalswere fairly unsteady in the 1980s The lateyears of the decade were marked by a greatincrease in incidentsmdashreflective of thenationrsquos epidemic of gang and drugviolence combined with greater reportingof domestic assaults Since 1990 violentcrime totals have been steadily decliningbut have been marked by small spikesevery other year or so This year reportedviolent crimes decreased by 42 incidents(8) from 2005 indicating the lowestnumber in the past 25 years
Total Part I Violent Crime
0
1000
2000
3000
4000
5000
6000
7000
8000
9000
1982
1984
1986
1988
1990
1992
1994
1996
1998
2000
2002
2004
2006
Total Part I Property Crime Property crime totals include burglarylarceny and auto theft Property crimeusually accounts for 80-90 of thePart I total which explains why thegraph to the left mirrors the graph atthe top so closely Totals have fallen57 since 1982 and 15 since 1997Burglary and auto theft haveexperienced significant decreases overthe past two decades but larceny(common theft) has remained fairlysteady Auto theft is at its lowest ratein 50 years After 1997 crime ratesleveled off for approximately sixyears until they dropped by 12 in2003 An increase in 2004 wasfollowed by a decrease of 14 overthe next two years consequently thisyearrsquos totals are lowest in over 40years
10
22000066 EE XX EE CC UU TT II VV EE SS UU MM MM AA RR YY
IMPORTANT FACTS ABOUT THE 2006 INDEX TOTAL The Crime Index is composed of selected offenses used to gauge fluctuations in the overall volume and rate of crime reported to police The offenses included are the violent crimes of murder rape robbery and aggravated assault and the property crimes of burglary larceny and auto theft The Crime Index was developed by the Federal Bureau of Investigationrsquos Uniform Crime Reporting program to standardize the way in which law enforcement agencies report crime statistics The 3753 serious crimes recorded in Cambridge in 2006 represent the Cityrsquos lowest Uniform Crime Reporting Index number reported to the FBI in over 40 years The City of Cambridge has recorded fewer than 4000 serious crimes only three times since 1960 The 2006 decline of 2 with 61 fewer incidents than in 2005 represents the cityrsquos lowest recorded crime index total since the mid ndash1960s Further analysis indicates that violent crime decreased by 8 in 2006 with 42 fewer incidents and property crime declined by 1 with 19 fewer incidents The three biggest declines for 2006 were in commercial robbery (-48) larceny of license plate (-29) and larceny from building (-28) when compared with the 2005 figures MURDER
bull Murders in Cambridge most often fall into three distinct scenarios domestic situations drug or gang related altercations and homeless against homeless street fights Two people died in Cambridge in 2006 as a result of handgun violence among young males in the city
bull Nationally cities of 100000 people average 10 murders per year bull In the first incident Corey Davis 19 was walking down the street when he was shot in a drive by Davis
was shot three times in the back and was pronounced dead later that night A month later US Marshals in Virginia arrested James Miller 23 of Dorchester for Davisrsquo murder In June of 2006 Remele Ahart 21 of Chelsea and Ahmad Bright 17 of Dorchester were also arrested in connection with this murder
bull The second shooting occurred just ten days after Davis was killed Doowensky Nazaire 22 of Somerville died from two gunshot wounds he sustained while standing in front of a club in Cambridge Officers apprehended Elysee Bresilla 28 of Roslindale as he fled from the scene and charged him with murder when Nazaire succumbed to his injuries a short time after the shooting
bull Since 1990 Cambridge has averaged two murders per year which is a decrease from the 30-year period between 1960 and 1989 when the average was slightly less than five per year
RAPE bull Cambridge reported 11 rapes in 2006 a total that remains below the 10-year average of 14 rapes per year bull Nine of the eleven rapes in 2006 were completed acts and two were categorized as attempts bull Five of the nine completed rapes in 2006 were acquaintance rapes where the victim knew the perpetrator bull Since 1980 there has only been one stranger-to-stranger ldquostreetrdquo rape pattern in Cambridge the ldquoRainy
Day Rapistrdquo who preyed on victims in the Fresh Pond area on rainy days in 1981
ROBBERY bull The steady increase in robberies that began in 2002 has reversed over the past two years with an overall
decrease of 15 since 2004 2006rsquos decline of 13 dropped the total to 208 incidents bull Commercial robberies fell by 35 incidents from 2005rsquos total translating to a 48 decrease This is the
lowest number of commercial robberies in nearly three years bull Convenience stores continued to be the common target of commercial robberies in 2006 Approximately
29 of the robberies in 2006 were of convenience stores with the majority of these incidents occurring late at night between 800 pm and midnight
bull Robberies of gas stations declined by 69 helping to contribute to the overall decline in commercial robbery
bull The number of street robberies reported in 2006 increased slightly by four incidents translating to a 2 increase over the previous year Nearly 83 of all street robberies occurred on the street or sidewalk
11
bull The majority of the street robberies throughout the city occurred between 700 pm and 100 am These are common times for street robberies to be reported because people can become targets when they are walking alone late at night distracted or intoxicated
BURGLARY bull Cambridge saw a 10 increase in burglaries between 2005 and 2006 which can be wholly attributed to the
42 increase in commercial burglary bull Construction site breaks alone increased by 24 incidents in 2006 This translates to a 343 increase (7 in
2005 vs 31 in 2006) bull Housebreaks were up 1 in Cambridge in 2006 compared to 2005 increasing from 490 incidents to 496
This total includes 80 housebreaks that were attempted but not completed bull In a number of the summer breaks entry was gained through cut window screens and the perpetrators stole
electronics and money left in plain sight
LARCENY bull There was an overall decrease in larceny incidents in 2006 with the most significant drop coming from the
categories of larceny from building and larceny of license plates down 28 and 29 respectively bull There were 386 larcenies from buildings reported this year representing a 28 decrease from the previous
year This number is considerably below the five-year average of 535 incidents bull The three major hot spots of larcenies from buildings in 2006 were the Cambridgeside Galleria Mall the
Cambridge Rindge and Latin School and Ballyrsquos Health Club bull Larcenies from motor vehicles reached a significant high in 2006 at 754 incidents translating to a 23
increase from the previous year This yearrsquos high is also the decadersquos high bull There were two recurrent larceny from motor vehicle patterns throughout the City in 2006 thefts of GPS
navigation systems and thefts of stereo systems bull The most common method of entry into motor vehicles in 2006 was by breaking one or more windows of
the vehicle This method was reported in half of the incidents bull A two-year increase of larcenies of bicycles in 2004 and 2005 came to a halt in 2006 when only 204
incidents were reported representing a 15 decrease from 2005
AUTO THEFT bull In 2006 Cambridge reported its lowest number of stolen cars in over 20 years with only 233 incidents bull Hondas continue to be the most commonly stolen automobiles constituting 32 of all reports Toyotas
and Fords involved in approximately 25-30 incidents each came in second and third place respectively This information is consistent with historical and national trends
bull The most targeted model in 2006 was the Honda Civic followed by the Toyota Camry and the Honda Accord
bull Approximately 40 of the cars reported stolen in 2006 have been recovered to date The majority of the recovered cars were located throughout Cambridge and Boston
CITYWIDE SHOOTING VICTIMS IN 2006
bull There were 12 shootings in 2006 producing 13 victims with gunshot wounds five victims from four incidents in Area 4 three incidents in Cambridgeport two in InmanHarrington and one each in North Cambridge Riverside and Mid-Cambridge
bull Four of the incidents were during a threendashweek period from late February to mid-March that produced the two homicides recorded in 2006 Arrests were made in both homicide cases
bull Twelve of the gunshot victims were male and one was female bull Ten of the victims were Cambridge residents The other three victims were from Everett Somerville and
Dorchester bull The youngest of the victims was 14 years old the oldest 27 Nine of the thirteen victims were between 19
and 25 years of age bull There were 11 known offenders all males with an average age of 23 Two were Cambridge residents and
nine were non-residents There were also six cases where the offender was not substantiated bull There were arrests made in 6 of the 12 incidents In four of the open cases solid suspects were established
but victims and witnesses were uncooperative In the six incidents involving the arrest of a suspect three cases involved multiple arrestsoffenders
12
NNAATTIIOONNAALLRREEGGIIOONNAALL CCRRIIMMEE CCOOMMPPAARRIISSOONN
Note that the following tables are based on information from the FBIrsquos Uniform Crime Reports and the latest available data available for comparison was from 2005
2005 CRIMES IN CITIES OF 94000-106000 RESIDENTS NATIONWIDE
City Murder Rape Robbery Assault Burglary Larceny Auto Theft Total
Albany NY 8 68 439 760 1328 3186 369 6158 Allentown PA 21 45 512 285 1393 3905 473 6634 Arvada CO 2 23 52 119 524 2772 581 4073 Athens-Clarke County GA 5 41 135 176 1047 4185 361 5950 Berkeley CA 3 18 354 195 1229 5503 1244 8546 Brockton MA1 10 47 211 NA 687 2282 738 3975 Burbank CA 3 13 67 163 586 1690 495 3017 Cambridge MA 3 14 239 244 623 2396 295 3814 Cary NC 0 13 50 70 432 1428 103 2096 Charleston SC 10 49 290 654 810 3464 482 5759 Compton CA 65 40 474 1152 638 971 1006 4346 Daly City CA 2 20 122 142 251 39 468 1044 Davenport IA 7 54 272 990 1451 5213 416 8403 Dearborn MI 3 30 223 315 651 3191 1082 5495 Denton TX 5 72 76 225 684 3180 246 4488 Erie PA 6 75 200 191 632 2129 106 3339 Everett WA 3 48 173 313 1272 4243 2085 8137 Fairfield CA 9 38 218 320 748 2876 836 5045 Gary IN 58 70 306 284 1593 2556 1161 6028 Gresham OR 3 69 148 280 882 3216 1249 5847 Livonia MI 3 13 62 92 444 1574 383 2571 Lowell MA 2 41 213 753 644 1942 689 4284 Macon GA 20 58 332 406 2028 6124 1065 10033 Miami Gardens FL 11 57 540 1305 1395 4235 968 8511 Miramar FL 3 35 152 296 939 1831 442 3698 Mission Viejo CA 2 3 36 69 225 953 81 1369 Odessa TX 3 12 72 503 756 2785 179 4310 Portsmouth VA 22 41 366 472 1049 3708 407 6065 Pueblo CO 13 22 162 489 1525 4978 478 7667 Richardson TX 2 12 98 149 764 2437 277 3739 Richmond CA 40 35 526 573 1062 2350 2396 6982 Santa Clara CA 5 18 49 118 553 2470 397 3610 South Gate CA 6 19 305 197 444 1164 1289 3424 Vacaville CA 2 23 69 168 353 1899 266 2780 Ventura CA 1 19 107 170 815 2695 401 4208 Wichita Falls TX 6 43 239 445 1703 5386 552 8374 Woodbridge Township NJ 2 17 81 203 347 2168 294 3112 Average 10 36 215 359 879 2895 658 5052 Cambridge MA 3 14 239 244 623 2396 295 3814
13
Among similarly sized cities in 2005 Cambridge ranked below the nationwide average for all but one of the index crimes (robbery) Overall the total number of serious crimes in Cambridge ranked 25 below than the national average of similarly sized cities Again statistics for 2005 are the latest available from cities of similar size to Cambridge for comparative analysis
How Cambridge Compares Nationally in 2005
Murder 70 lower than the national average per 100000 inhabitants Rape 61 lower than the national average per 100000 inhabitants continuing the downward trend which began in 1998
Robbery 11 higher than the national average per 100000 inhabitants likely resulting from the close proximity of Cambridge to other large cities
Assault 32 below the national average per 100000 inhabitants
Burglary 29 below the national average per 100000 inhabitants continuing the downward trend which began in the early 1980s
Larceny 17 below the national average Larceny typically accounts for the highest percentage of index crimes in Cambridge but traditionally reports lower numbers than the national average
Auto Theft 55 below the national average per 100000 inhabitants
2005 TOTAL NUMBER AND RATE OF CRIMES IN SELECT MASSACHUSETTS CITIES AND TOWNS
Total City Population Murder Rape Robbery Assault Burglary Larceny Auto Theft Total Rate Medford 54047 1 8 47 15 327 944 189 1531 2833
Brockton1 94746 10 47 211 NA 687 2282 738 3975 4195 Lynn 89234 5 12 270 783 816 1527 582 3995 4477 Chicopee 54686 2 27 46 268 479 1048 223 2093 3827 Lawrence 71659 0 17 159 408 601 577 533 2295 3203 Cambridge 101355 3 14 239 244 623 2396 295 3814 3763 Lowell 103370 2 41 213 753 664 1942 689 4304 4164 New Bedford 93720 8 52 257 707 877 1924 315 4140 4417 Haverhill 60315 0 13 52 231 593 708 116 1713 2840 Somerville 75412 1 7 139 115 521 833 319 1935 2566 Framingham 65416 0 12 48 124 312 1025 219 1740 2660 Quincy 89661 2 26 92 219 387 883 152 1761 1964
Brookline1 56032 0 7 59 NA 219 749 45 1079 1926 Waltham 32513 0 1 15 46 116 518 518 1214 3734 Newton 83570 1 6 15 92 269 783 46 1212 1450 Average 75049 2 19 124 308 499 1209 332 2453 3201 Cambridge 101355 3 14 239 244 623 2396 295 3814 3763
Rate is calculated per 100000 residents Statistics for 2005 for select Massachusetts cities are the latest available for comparative analysis with Cambridge 1 Note that assault statistics for the City of Brockton and Brookline were unavailable There were approximately 3762 crimes per 100000 residents in Cambridge Note that this number does not reflect the increased daytime population which exceeds 250000 people on any given day
14
15
Please note the Crime Clock should be viewed with care Being the most aggregate representation of Cambridgecrime data it is designed to convey the annual reported crime experience by showing the relative frequency ofoccurrence of the index offenses This mode of display should not be taken to imply regularity in the commission ofcrimes rather it represents the annual ratio of crime to fixed time intervals
CCIITTYY OOFF CCAAMMBBRRIIDDGGEE CCRRIIMMEE CCLLOOCCKK
22000066
1
Index Crime Offense Every 2 hours
Violent Crime Every 19 hours
1 Murder Every 183 days
1 Rape Every 33 days
1 Robbery Every 42 hours
Aggravated Assault Every 37 hours
Property CrimeEvery 3 hours1
1
1 Burglary Every 13 hours
1 Larceny Every 4 Hours
1 Auto Theft Every 38 Days
1
16
FFAACCTTOORRSS CCOONNTTRRIIBBUUTTIINNGG TTOO CCRRIIMMEE
Throughout the 2006 Annual Report the Department tries to place statistics in contextmdashto explain why crime occurs in a particular area instead of just where and how often It is impossible however to analyze every crime factor within the pages of this report As a general rule readers should consider the following factors when gauging the relative safety of any city neighborhood or business district The FBI in its Uniform Crime Reports provides most of these factors Factor General Effect Status in Cambridge Effects in Cambridge Residential Population amp Population Density
High population leads to higher residential crime rate (residential burglaries larcenies from motor vehicles domestic assaults auto theft) High population density also leads to a higher residential crime rate
Population of about 101000 Very high density (about 15000 per square mile)
Higher residential crime rate than cities of fewer than 100000 Higher residential crime rate in densely populated neighborhoods
of Mid-Cambridge North Cambridge Cambridgeport Low residential crime rate in sparsely populated areas of
Cambridge Highlands Strawberry Hill Agassiz
Commerical amp Educational Population number amp type of commercial establishments and educational institutions
High commercial population leads to more ldquobusinessrdquo crimes (commercial burglaries shoplifting larcenies from buildings forgery) and to more crimes against the person often committed in commercial areas (larcenies from the person larcenies from motor vehicles larcenies of bicycles street robbery auto theft)
Very high commercial population (many large businesses shopping areas in Cambridge) and very high educational population (MIT and Harvard)
High overall larceny rate High larceny rate in highly-populated commercial areas of East
Cambridge Harvard Square Central Square Porter Square Fresh Pond Mall
High auto theft rate in East Cambridge MIT Area Low larceny auto theft rate in Agassiz Strawberry Hill West
Cambridge
Age composition of population
A higher population in the ldquoat riskrdquo age of 15ndash24 leads to a higher crime rate
22 percent of the citizens of Cambridge are in the ldquoat riskrdquo populationThis number is influenced by the high student population
Agassiz MIT and Riverside have the largest percentage of people in the ldquoat riskrdquo ages but most of them are college students which somewhat decreases their chances of involvement in criminal activity Consequently Agassiz MIT and Riverside do not have higher than average crime rates
However neighborhoods with the lowest numbers of ldquoat riskrdquo agesmdashWest Cambridge Cambridge Highlands and Strawberry Hillmdashdo experience smaller amounts of crime
Stability of Population Stable close-knit populations have a lower overall crime rate than transient populations Neighborhoods with more houses and condominiums (generally signifiying a more stable population) have a lower crime rate than neighborhoods with mostly apartments (generally a more transient population)
Historically stabler population west of Harvard Square more transient population east of Harvard Square This is changing rapidly with gentrification taking place in neighborhoods adjacent to Central Square
Lower comparative crime rate in neighborhoods of West Cambridge Highlands Peabody Agassiz Strawberry Hill
Higher comparative crime rate in Mid-Cambridge Area 4 Cambridgeport This however is changing with the stabilization and gentrification of housing in these areas
17
Street Layout Areas with major streets offering fast getaways and mass transportation show more crime clusters than neighborhoods with primarily residential streets
A mix of major and minor streets Higher auto theft rates in MIT East Cambridge Cambridgeport where thieves can make a quick jump over the bridge to Boston
Higher commercial burglary rate in North Cambridge with multiple avenues of escape into nearby towns
Proximity to Public Transportation
Criminals are often indigent and cannot afford cars or other expensive forms of transportation Areas near public transportation and particularly subways witness a higher crime ratemdashparticularly robbery and larcenymdashthan more inaccessable areas
Major public transportation system offering high-speed rapid transit throughout most of the city
Contributes to clusters of crime around Central Square Harvard Square Porter Square and Alewife though not much around Lechmere and Kendall Square
Neighborhoods distant from rapid transitmdashWest Cambridge Highlands and Strawberry Hillmdashshow lower crime rate with few clusters
Economic conditions including poverty level and unemployment rate
Again criminals are often indigent Areas afflicted by poverty show higher burglary robbery and larceny rates than middle-class or wealthy neighborhoods
Little abject poverty in Cambridge This factor probably contributes little to the picture of crime in Cambridge
Possibly some effect on Area 4mdashthe neighborhood with the lowest mean incomemdashthough Strawberry Hill which has the second lowest mean income also has one of the lowest crime rates in the city Other factors on this list probably have a much greater role than economic conditions
Family conditions with respect to divorce and family cohesiveness
Larry J Siegel author of Criminology says ldquoFamily relationships have for some time been considered a major determinant of behavior Youths who grow up in a household characterized by conflict and tension where parents are absent or separated or where there is a lack of familial love and support will be susceptible to the crime-promoting forces in the environmentrdquo
According to census data about one third of the families in Cambridge with children are single-parent families In the Commonwealth of Massachusetts as a whole this percentage is slightly lessmdashabout one quarter
The neighborhoods with the highest percentage of single-parent families are Area 4 Cambridgeport Riverside and North Cambridge With the exception of Riverside these neighborhoods also have a higher than mean crime rate However there are a far greater number of factors influencing ldquoconflict and tensionrdquo and ldquofamilial love and supportrdquo than just the number of parents in the household In the end no conclusions can be drawn without more data
Climate Warmer climates and seasons tend to report a higher rate of larceny auto theft and juvenile-related crime while cold seasons and climates report more robberies and murder
A varied climate warm and moist summers cool autums long cold winters
High overall larceny auto theft rate in the summer Higher overall robbery rate in the winter Burglary rate less tied to climate than to specific weather
conditions rain and snow produce fewer burglaries
Operational and investigative emphasis of the police department
Problem-oriented informed police departments have more success controlling certain aspects of crime than other departments
A problem-oriented department with an emphasis on directed patrol and investigation and on crime analysis including quick identification of crime patterns and rapid intervention to curtail them
Lower overall crime rate across the city than would be expected for a city of our size and characteristics
Attitude of the citizenry toward crime including its reporting practices
Populations that have ldquogiven uprdquo on crime and the police experience an exacerbation of the crime problem
A population that works closely with the police creates numerous neighborhood crime watches and is likely to report crimes
Lower overall crime rate across the city than would be expected for a city of our size and characteristics
18
0
5
10
15
20
25
Jan Feb Mar Apr May Jun Jul Aug Sep Oct Nov Dec
CCHHRROONNOOLLOOGGIICCAALL HHIIGGHHLLIIGGHHTTSS
0
10
20
30
40
50
60
70
Jan Feb Mar Apr May Jun Jul Aug Sep Oct Nov Dec
STREET ROBBERY
HOUSEBREAKS
There was a series of housebreaks along the CambridgeSomerville border which ended in the Somerville arrest of two individuals in early April They were believed to be responsible for over a dozen breaks along the boarder
Two patterns developed in the third quarter One took place during the daytime in InmanHarrington on the border of Sectors 1 amp 2 Entry was gained through unlocked windows and electronics were targeted The other took place in the early morning hours of the weekend in Sector 3 Arrests were made in both locations
A pattern developed in Area 4 at the end of February in which all victims were threatened with a gun and demanded to hand over their wallets Most victims were male and walking alone late at night
In mid to late April there was a pattern of pack robberies (mostly in InmanHarrington) in which juveniles targeted male victims Money and Ipods were the only items stolen Force was used or a weapon shown in four incidents
Mid-Cambridge had a pattern of housebreaks during the second quarter in which over 30 burglaries were reported Laptops digital cameras and Ipods were the common targets during the breaks
There were no identifiable patterns in the third quarter Area 4 and Peabody had the highest number of robberies through these months Six street robbery arrests took place throughout the city during this quarter
Sectors 1 and 2 saw an increase in street robberies with a weekend pattern in October that carried over into November This pattern significantly decreased with the arrest of three juveniles from Chelsea in late November
Sector 3 daytime housebreaks took place throughout the fourth quarter Entry was gained by prying open front doors Over 23 laptops were stolen in this pattern
19
020406080
100120140160
Jan Feb Mar Apr May Jun Jul Aug Sep Oct Nov Dec
0
1
2
3
4
5
6
7
Jan Feb Mar Apr May Jun Jul Aug Sep Oct Nov Dec
05
101520253035
Jan Feb Mar Apr May Jun Jul Aug Sep Oct Nov Dec
COMMERCIAL ROBBERY
COMMERCIAL BREAKS
LARCENY FROM MOTOR VEHICLE LARCENY FROM PERSON LARCENY FROM BUILDING
One convenience store was targeted three times throughout JanuaryFebruary There were three gas station robberies down from seven in last yearrsquos first quarter
The same convenience store was robbed again but an arrest was made this time In addition there were two retail robberies and one bank robbery
In July there were two gas station robberies and robberies at a restaurant and a market All other incidents resulted in arrests one was at a convenience store and the other two were banks
There were five bank robberies throughout the fourth quarter resulting in three arrests A Cambridge motel was robbed twice by two unknown suspects Four conveniencefast food stores were also targeted one arrest was made
There was a sporadic trend of breaks into convenience and drug stores targeting lottery tickets
These two quarters saw a dramatic increase in commercial breaks due to a number of construction site breaks for copper and equipment Toward the end of the third quarter thieves switched to stealing copper from residential homes which accounted for the decline in September Nine people were arrested in six of the breaks from April to September
December saw a pattern of breaks in InmanHarrington and Area 4 in which 17 businesses were broken into Cash registers and safes were usually targeted However in ten of the incidents nothing was reported stolen
Larcenies from persons significantly increased through September and October in Harvard amp Central Squares Thieves targeted items left unattended or hanging on the backs of chairs September - December also reported the highest number of larcenies from buildings with an increase in health club and school thefts
June - August experienced a pattern of car breaks in Peabody and Agassiz The most commonly stolen items were stereos Ten arrests were made in five of the incidents with the pattern cooling after the arrest of three juveniles at the end of August
The theft of GPS systems in January and March accounted for the spikes in crime during the first quarter Six people were arrested in connection with three of the incidents during this time
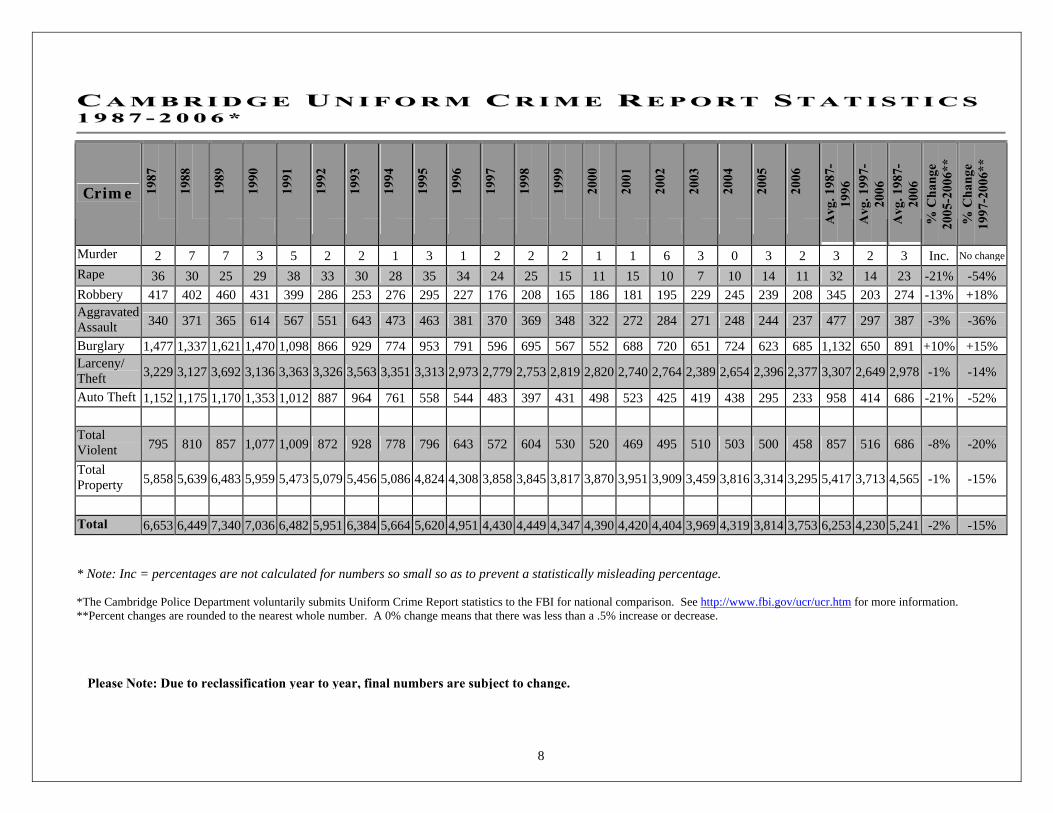
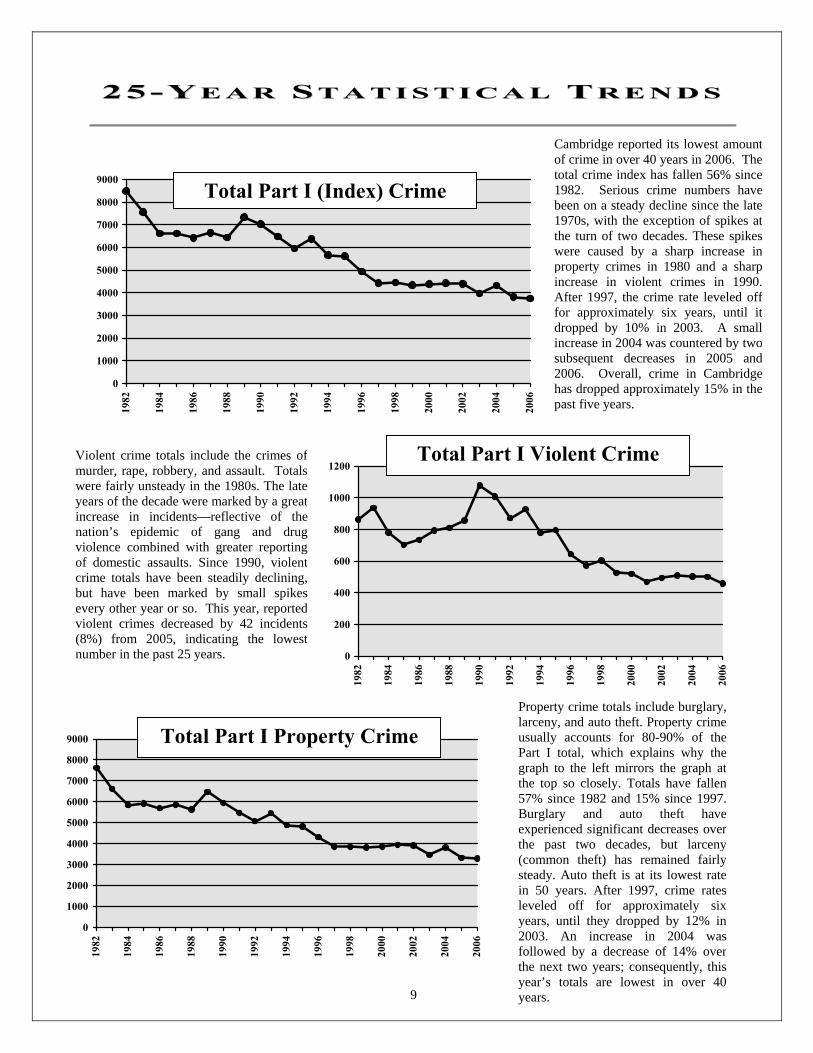
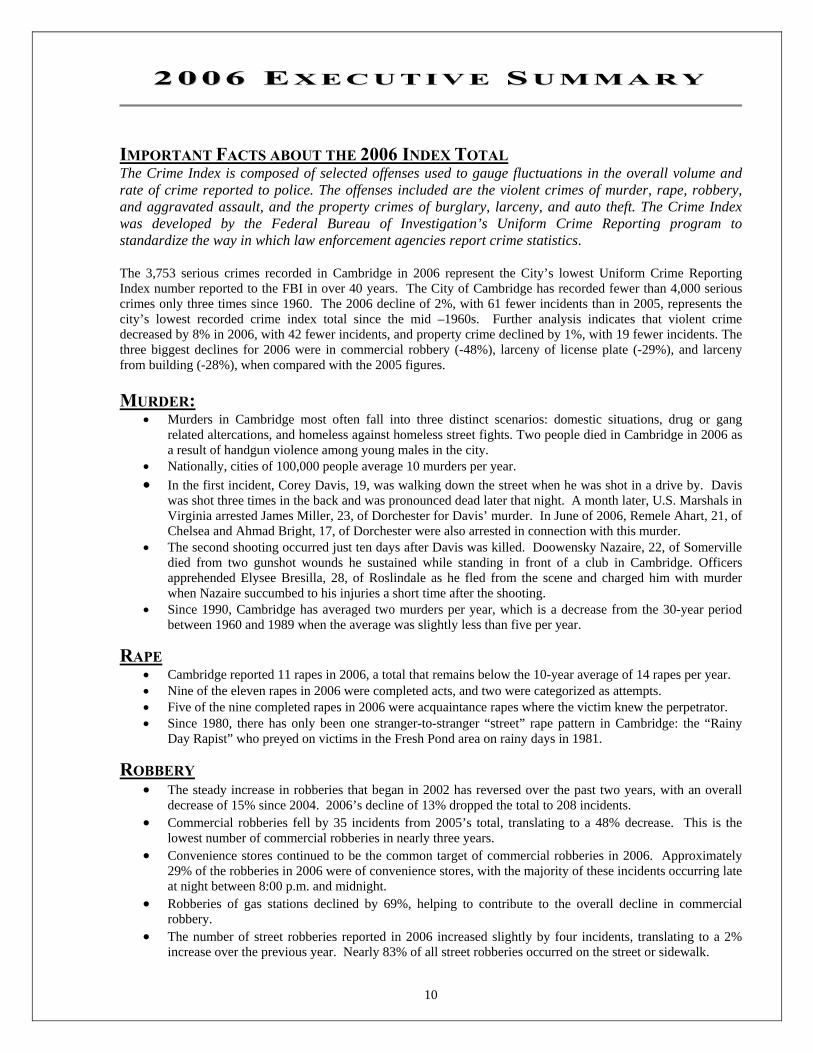
10
22000066 EE XX EE CC UU TT II VV EE SS UU MM MM AA RR YY
IMPORTANT FACTS ABOUT THE 2006 INDEX TOTAL The Crime Index is composed of selected offenses used to gauge fluctuations in the overall volume and rate of crime reported to police The offenses included are the violent crimes of murder rape robbery and aggravated assault and the property crimes of burglary larceny and auto theft The Crime Index was developed by the Federal Bureau of Investigationrsquos Uniform Crime Reporting program to standardize the way in which law enforcement agencies report crime statistics The 3753 serious crimes recorded in Cambridge in 2006 represent the Cityrsquos lowest Uniform Crime Reporting Index number reported to the FBI in over 40 years The City of Cambridge has recorded fewer than 4000 serious crimes only three times since 1960 The 2006 decline of 2 with 61 fewer incidents than in 2005 represents the cityrsquos lowest recorded crime index total since the mid ndash1960s Further analysis indicates that violent crime decreased by 8 in 2006 with 42 fewer incidents and property crime declined by 1 with 19 fewer incidents The three biggest declines for 2006 were in commercial robbery (-48) larceny of license plate (-29) and larceny from building (-28) when compared with the 2005 figures MURDER
bull Murders in Cambridge most often fall into three distinct scenarios domestic situations drug or gang related altercations and homeless against homeless street fights Two people died in Cambridge in 2006 as a result of handgun violence among young males in the city
bull Nationally cities of 100000 people average 10 murders per year bull In the first incident Corey Davis 19 was walking down the street when he was shot in a drive by Davis
was shot three times in the back and was pronounced dead later that night A month later US Marshals in Virginia arrested James Miller 23 of Dorchester for Davisrsquo murder In June of 2006 Remele Ahart 21 of Chelsea and Ahmad Bright 17 of Dorchester were also arrested in connection with this murder
bull The second shooting occurred just ten days after Davis was killed Doowensky Nazaire 22 of Somerville died from two gunshot wounds he sustained while standing in front of a club in Cambridge Officers apprehended Elysee Bresilla 28 of Roslindale as he fled from the scene and charged him with murder when Nazaire succumbed to his injuries a short time after the shooting
bull Since 1990 Cambridge has averaged two murders per year which is a decrease from the 30-year period between 1960 and 1989 when the average was slightly less than five per year
RAPE bull Cambridge reported 11 rapes in 2006 a total that remains below the 10-year average of 14 rapes per year bull Nine of the eleven rapes in 2006 were completed acts and two were categorized as attempts bull Five of the nine completed rapes in 2006 were acquaintance rapes where the victim knew the perpetrator bull Since 1980 there has only been one stranger-to-stranger ldquostreetrdquo rape pattern in Cambridge the ldquoRainy
Day Rapistrdquo who preyed on victims in the Fresh Pond area on rainy days in 1981
ROBBERY bull The steady increase in robberies that began in 2002 has reversed over the past two years with an overall
decrease of 15 since 2004 2006rsquos decline of 13 dropped the total to 208 incidents bull Commercial robberies fell by 35 incidents from 2005rsquos total translating to a 48 decrease This is the
lowest number of commercial robberies in nearly three years bull Convenience stores continued to be the common target of commercial robberies in 2006 Approximately
29 of the robberies in 2006 were of convenience stores with the majority of these incidents occurring late at night between 800 pm and midnight
bull Robberies of gas stations declined by 69 helping to contribute to the overall decline in commercial robbery
bull The number of street robberies reported in 2006 increased slightly by four incidents translating to a 2 increase over the previous year Nearly 83 of all street robberies occurred on the street or sidewalk
11
bull The majority of the street robberies throughout the city occurred between 700 pm and 100 am These are common times for street robberies to be reported because people can become targets when they are walking alone late at night distracted or intoxicated
BURGLARY bull Cambridge saw a 10 increase in burglaries between 2005 and 2006 which can be wholly attributed to the
42 increase in commercial burglary bull Construction site breaks alone increased by 24 incidents in 2006 This translates to a 343 increase (7 in
2005 vs 31 in 2006) bull Housebreaks were up 1 in Cambridge in 2006 compared to 2005 increasing from 490 incidents to 496
This total includes 80 housebreaks that were attempted but not completed bull In a number of the summer breaks entry was gained through cut window screens and the perpetrators stole
electronics and money left in plain sight
LARCENY bull There was an overall decrease in larceny incidents in 2006 with the most significant drop coming from the
categories of larceny from building and larceny of license plates down 28 and 29 respectively bull There were 386 larcenies from buildings reported this year representing a 28 decrease from the previous
year This number is considerably below the five-year average of 535 incidents bull The three major hot spots of larcenies from buildings in 2006 were the Cambridgeside Galleria Mall the
Cambridge Rindge and Latin School and Ballyrsquos Health Club bull Larcenies from motor vehicles reached a significant high in 2006 at 754 incidents translating to a 23
increase from the previous year This yearrsquos high is also the decadersquos high bull There were two recurrent larceny from motor vehicle patterns throughout the City in 2006 thefts of GPS
navigation systems and thefts of stereo systems bull The most common method of entry into motor vehicles in 2006 was by breaking one or more windows of
the vehicle This method was reported in half of the incidents bull A two-year increase of larcenies of bicycles in 2004 and 2005 came to a halt in 2006 when only 204
incidents were reported representing a 15 decrease from 2005
AUTO THEFT bull In 2006 Cambridge reported its lowest number of stolen cars in over 20 years with only 233 incidents bull Hondas continue to be the most commonly stolen automobiles constituting 32 of all reports Toyotas
and Fords involved in approximately 25-30 incidents each came in second and third place respectively This information is consistent with historical and national trends
bull The most targeted model in 2006 was the Honda Civic followed by the Toyota Camry and the Honda Accord
bull Approximately 40 of the cars reported stolen in 2006 have been recovered to date The majority of the recovered cars were located throughout Cambridge and Boston
CITYWIDE SHOOTING VICTIMS IN 2006
bull There were 12 shootings in 2006 producing 13 victims with gunshot wounds five victims from four incidents in Area 4 three incidents in Cambridgeport two in InmanHarrington and one each in North Cambridge Riverside and Mid-Cambridge
bull Four of the incidents were during a threendashweek period from late February to mid-March that produced the two homicides recorded in 2006 Arrests were made in both homicide cases
bull Twelve of the gunshot victims were male and one was female bull Ten of the victims were Cambridge residents The other three victims were from Everett Somerville and
Dorchester bull The youngest of the victims was 14 years old the oldest 27 Nine of the thirteen victims were between 19
and 25 years of age bull There were 11 known offenders all males with an average age of 23 Two were Cambridge residents and
nine were non-residents There were also six cases where the offender was not substantiated bull There were arrests made in 6 of the 12 incidents In four of the open cases solid suspects were established
but victims and witnesses were uncooperative In the six incidents involving the arrest of a suspect three cases involved multiple arrestsoffenders
12
NNAATTIIOONNAALLRREEGGIIOONNAALL CCRRIIMMEE CCOOMMPPAARRIISSOONN
Note that the following tables are based on information from the FBIrsquos Uniform Crime Reports and the latest available data available for comparison was from 2005
2005 CRIMES IN CITIES OF 94000-106000 RESIDENTS NATIONWIDE
City Murder Rape Robbery Assault Burglary Larceny Auto Theft Total
Albany NY 8 68 439 760 1328 3186 369 6158 Allentown PA 21 45 512 285 1393 3905 473 6634 Arvada CO 2 23 52 119 524 2772 581 4073 Athens-Clarke County GA 5 41 135 176 1047 4185 361 5950 Berkeley CA 3 18 354 195 1229 5503 1244 8546 Brockton MA1 10 47 211 NA 687 2282 738 3975 Burbank CA 3 13 67 163 586 1690 495 3017 Cambridge MA 3 14 239 244 623 2396 295 3814 Cary NC 0 13 50 70 432 1428 103 2096 Charleston SC 10 49 290 654 810 3464 482 5759 Compton CA 65 40 474 1152 638 971 1006 4346 Daly City CA 2 20 122 142 251 39 468 1044 Davenport IA 7 54 272 990 1451 5213 416 8403 Dearborn MI 3 30 223 315 651 3191 1082 5495 Denton TX 5 72 76 225 684 3180 246 4488 Erie PA 6 75 200 191 632 2129 106 3339 Everett WA 3 48 173 313 1272 4243 2085 8137 Fairfield CA 9 38 218 320 748 2876 836 5045 Gary IN 58 70 306 284 1593 2556 1161 6028 Gresham OR 3 69 148 280 882 3216 1249 5847 Livonia MI 3 13 62 92 444 1574 383 2571 Lowell MA 2 41 213 753 644 1942 689 4284 Macon GA 20 58 332 406 2028 6124 1065 10033 Miami Gardens FL 11 57 540 1305 1395 4235 968 8511 Miramar FL 3 35 152 296 939 1831 442 3698 Mission Viejo CA 2 3 36 69 225 953 81 1369 Odessa TX 3 12 72 503 756 2785 179 4310 Portsmouth VA 22 41 366 472 1049 3708 407 6065 Pueblo CO 13 22 162 489 1525 4978 478 7667 Richardson TX 2 12 98 149 764 2437 277 3739 Richmond CA 40 35 526 573 1062 2350 2396 6982 Santa Clara CA 5 18 49 118 553 2470 397 3610 South Gate CA 6 19 305 197 444 1164 1289 3424 Vacaville CA 2 23 69 168 353 1899 266 2780 Ventura CA 1 19 107 170 815 2695 401 4208 Wichita Falls TX 6 43 239 445 1703 5386 552 8374 Woodbridge Township NJ 2 17 81 203 347 2168 294 3112 Average 10 36 215 359 879 2895 658 5052 Cambridge MA 3 14 239 244 623 2396 295 3814
13
Among similarly sized cities in 2005 Cambridge ranked below the nationwide average for all but one of the index crimes (robbery) Overall the total number of serious crimes in Cambridge ranked 25 below than the national average of similarly sized cities Again statistics for 2005 are the latest available from cities of similar size to Cambridge for comparative analysis
How Cambridge Compares Nationally in 2005
Murder 70 lower than the national average per 100000 inhabitants Rape 61 lower than the national average per 100000 inhabitants continuing the downward trend which began in 1998
Robbery 11 higher than the national average per 100000 inhabitants likely resulting from the close proximity of Cambridge to other large cities
Assault 32 below the national average per 100000 inhabitants
Burglary 29 below the national average per 100000 inhabitants continuing the downward trend which began in the early 1980s
Larceny 17 below the national average Larceny typically accounts for the highest percentage of index crimes in Cambridge but traditionally reports lower numbers than the national average
Auto Theft 55 below the national average per 100000 inhabitants
2005 TOTAL NUMBER AND RATE OF CRIMES IN SELECT MASSACHUSETTS CITIES AND TOWNS
Total City Population Murder Rape Robbery Assault Burglary Larceny Auto Theft Total Rate Medford 54047 1 8 47 15 327 944 189 1531 2833
Brockton1 94746 10 47 211 NA 687 2282 738 3975 4195 Lynn 89234 5 12 270 783 816 1527 582 3995 4477 Chicopee 54686 2 27 46 268 479 1048 223 2093 3827 Lawrence 71659 0 17 159 408 601 577 533 2295 3203 Cambridge 101355 3 14 239 244 623 2396 295 3814 3763 Lowell 103370 2 41 213 753 664 1942 689 4304 4164 New Bedford 93720 8 52 257 707 877 1924 315 4140 4417 Haverhill 60315 0 13 52 231 593 708 116 1713 2840 Somerville 75412 1 7 139 115 521 833 319 1935 2566 Framingham 65416 0 12 48 124 312 1025 219 1740 2660 Quincy 89661 2 26 92 219 387 883 152 1761 1964
Brookline1 56032 0 7 59 NA 219 749 45 1079 1926 Waltham 32513 0 1 15 46 116 518 518 1214 3734 Newton 83570 1 6 15 92 269 783 46 1212 1450 Average 75049 2 19 124 308 499 1209 332 2453 3201 Cambridge 101355 3 14 239 244 623 2396 295 3814 3763
Rate is calculated per 100000 residents Statistics for 2005 for select Massachusetts cities are the latest available for comparative analysis with Cambridge 1 Note that assault statistics for the City of Brockton and Brookline were unavailable There were approximately 3762 crimes per 100000 residents in Cambridge Note that this number does not reflect the increased daytime population which exceeds 250000 people on any given day
14
15
Please note the Crime Clock should be viewed with care Being the most aggregate representation of Cambridgecrime data it is designed to convey the annual reported crime experience by showing the relative frequency ofoccurrence of the index offenses This mode of display should not be taken to imply regularity in the commission ofcrimes rather it represents the annual ratio of crime to fixed time intervals
CCIITTYY OOFF CCAAMMBBRRIIDDGGEE CCRRIIMMEE CCLLOOCCKK
22000066
1
Index Crime Offense Every 2 hours
Violent Crime Every 19 hours
1 Murder Every 183 days
1 Rape Every 33 days
1 Robbery Every 42 hours
Aggravated Assault Every 37 hours
Property CrimeEvery 3 hours1
1
1 Burglary Every 13 hours
1 Larceny Every 4 Hours
1 Auto Theft Every 38 Days
1
16
FFAACCTTOORRSS CCOONNTTRRIIBBUUTTIINNGG TTOO CCRRIIMMEE
Throughout the 2006 Annual Report the Department tries to place statistics in contextmdashto explain why crime occurs in a particular area instead of just where and how often It is impossible however to analyze every crime factor within the pages of this report As a general rule readers should consider the following factors when gauging the relative safety of any city neighborhood or business district The FBI in its Uniform Crime Reports provides most of these factors Factor General Effect Status in Cambridge Effects in Cambridge Residential Population amp Population Density
High population leads to higher residential crime rate (residential burglaries larcenies from motor vehicles domestic assaults auto theft) High population density also leads to a higher residential crime rate
Population of about 101000 Very high density (about 15000 per square mile)
Higher residential crime rate than cities of fewer than 100000 Higher residential crime rate in densely populated neighborhoods
of Mid-Cambridge North Cambridge Cambridgeport Low residential crime rate in sparsely populated areas of
Cambridge Highlands Strawberry Hill Agassiz
Commerical amp Educational Population number amp type of commercial establishments and educational institutions
High commercial population leads to more ldquobusinessrdquo crimes (commercial burglaries shoplifting larcenies from buildings forgery) and to more crimes against the person often committed in commercial areas (larcenies from the person larcenies from motor vehicles larcenies of bicycles street robbery auto theft)
Very high commercial population (many large businesses shopping areas in Cambridge) and very high educational population (MIT and Harvard)
High overall larceny rate High larceny rate in highly-populated commercial areas of East
Cambridge Harvard Square Central Square Porter Square Fresh Pond Mall
High auto theft rate in East Cambridge MIT Area Low larceny auto theft rate in Agassiz Strawberry Hill West
Cambridge
Age composition of population
A higher population in the ldquoat riskrdquo age of 15ndash24 leads to a higher crime rate
22 percent of the citizens of Cambridge are in the ldquoat riskrdquo populationThis number is influenced by the high student population
Agassiz MIT and Riverside have the largest percentage of people in the ldquoat riskrdquo ages but most of them are college students which somewhat decreases their chances of involvement in criminal activity Consequently Agassiz MIT and Riverside do not have higher than average crime rates
However neighborhoods with the lowest numbers of ldquoat riskrdquo agesmdashWest Cambridge Cambridge Highlands and Strawberry Hillmdashdo experience smaller amounts of crime
Stability of Population Stable close-knit populations have a lower overall crime rate than transient populations Neighborhoods with more houses and condominiums (generally signifiying a more stable population) have a lower crime rate than neighborhoods with mostly apartments (generally a more transient population)
Historically stabler population west of Harvard Square more transient population east of Harvard Square This is changing rapidly with gentrification taking place in neighborhoods adjacent to Central Square
Lower comparative crime rate in neighborhoods of West Cambridge Highlands Peabody Agassiz Strawberry Hill
Higher comparative crime rate in Mid-Cambridge Area 4 Cambridgeport This however is changing with the stabilization and gentrification of housing in these areas
17
Street Layout Areas with major streets offering fast getaways and mass transportation show more crime clusters than neighborhoods with primarily residential streets
A mix of major and minor streets Higher auto theft rates in MIT East Cambridge Cambridgeport where thieves can make a quick jump over the bridge to Boston
Higher commercial burglary rate in North Cambridge with multiple avenues of escape into nearby towns
Proximity to Public Transportation
Criminals are often indigent and cannot afford cars or other expensive forms of transportation Areas near public transportation and particularly subways witness a higher crime ratemdashparticularly robbery and larcenymdashthan more inaccessable areas
Major public transportation system offering high-speed rapid transit throughout most of the city
Contributes to clusters of crime around Central Square Harvard Square Porter Square and Alewife though not much around Lechmere and Kendall Square
Neighborhoods distant from rapid transitmdashWest Cambridge Highlands and Strawberry Hillmdashshow lower crime rate with few clusters
Economic conditions including poverty level and unemployment rate
Again criminals are often indigent Areas afflicted by poverty show higher burglary robbery and larceny rates than middle-class or wealthy neighborhoods
Little abject poverty in Cambridge This factor probably contributes little to the picture of crime in Cambridge
Possibly some effect on Area 4mdashthe neighborhood with the lowest mean incomemdashthough Strawberry Hill which has the second lowest mean income also has one of the lowest crime rates in the city Other factors on this list probably have a much greater role than economic conditions
Family conditions with respect to divorce and family cohesiveness
Larry J Siegel author of Criminology says ldquoFamily relationships have for some time been considered a major determinant of behavior Youths who grow up in a household characterized by conflict and tension where parents are absent or separated or where there is a lack of familial love and support will be susceptible to the crime-promoting forces in the environmentrdquo
According to census data about one third of the families in Cambridge with children are single-parent families In the Commonwealth of Massachusetts as a whole this percentage is slightly lessmdashabout one quarter
The neighborhoods with the highest percentage of single-parent families are Area 4 Cambridgeport Riverside and North Cambridge With the exception of Riverside these neighborhoods also have a higher than mean crime rate However there are a far greater number of factors influencing ldquoconflict and tensionrdquo and ldquofamilial love and supportrdquo than just the number of parents in the household In the end no conclusions can be drawn without more data
Climate Warmer climates and seasons tend to report a higher rate of larceny auto theft and juvenile-related crime while cold seasons and climates report more robberies and murder
A varied climate warm and moist summers cool autums long cold winters
High overall larceny auto theft rate in the summer Higher overall robbery rate in the winter Burglary rate less tied to climate than to specific weather
conditions rain and snow produce fewer burglaries
Operational and investigative emphasis of the police department
Problem-oriented informed police departments have more success controlling certain aspects of crime than other departments
A problem-oriented department with an emphasis on directed patrol and investigation and on crime analysis including quick identification of crime patterns and rapid intervention to curtail them
Lower overall crime rate across the city than would be expected for a city of our size and characteristics
Attitude of the citizenry toward crime including its reporting practices
Populations that have ldquogiven uprdquo on crime and the police experience an exacerbation of the crime problem
A population that works closely with the police creates numerous neighborhood crime watches and is likely to report crimes
Lower overall crime rate across the city than would be expected for a city of our size and characteristics
18
0
5
10
15
20
25
Jan Feb Mar Apr May Jun Jul Aug Sep Oct Nov Dec
CCHHRROONNOOLLOOGGIICCAALL HHIIGGHHLLIIGGHHTTSS
0
10
20
30
40
50
60
70
Jan Feb Mar Apr May Jun Jul Aug Sep Oct Nov Dec
STREET ROBBERY
HOUSEBREAKS
There was a series of housebreaks along the CambridgeSomerville border which ended in the Somerville arrest of two individuals in early April They were believed to be responsible for over a dozen breaks along the boarder
Two patterns developed in the third quarter One took place during the daytime in InmanHarrington on the border of Sectors 1 amp 2 Entry was gained through unlocked windows and electronics were targeted The other took place in the early morning hours of the weekend in Sector 3 Arrests were made in both locations
A pattern developed in Area 4 at the end of February in which all victims were threatened with a gun and demanded to hand over their wallets Most victims were male and walking alone late at night
In mid to late April there was a pattern of pack robberies (mostly in InmanHarrington) in which juveniles targeted male victims Money and Ipods were the only items stolen Force was used or a weapon shown in four incidents
Mid-Cambridge had a pattern of housebreaks during the second quarter in which over 30 burglaries were reported Laptops digital cameras and Ipods were the common targets during the breaks
There were no identifiable patterns in the third quarter Area 4 and Peabody had the highest number of robberies through these months Six street robbery arrests took place throughout the city during this quarter
Sectors 1 and 2 saw an increase in street robberies with a weekend pattern in October that carried over into November This pattern significantly decreased with the arrest of three juveniles from Chelsea in late November
Sector 3 daytime housebreaks took place throughout the fourth quarter Entry was gained by prying open front doors Over 23 laptops were stolen in this pattern
19
020406080
100120140160
Jan Feb Mar Apr May Jun Jul Aug Sep Oct Nov Dec
0
1
2
3
4
5
6
7
Jan Feb Mar Apr May Jun Jul Aug Sep Oct Nov Dec
05
101520253035
Jan Feb Mar Apr May Jun Jul Aug Sep Oct Nov Dec
COMMERCIAL ROBBERY
COMMERCIAL BREAKS
LARCENY FROM MOTOR VEHICLE LARCENY FROM PERSON LARCENY FROM BUILDING
One convenience store was targeted three times throughout JanuaryFebruary There were three gas station robberies down from seven in last yearrsquos first quarter
The same convenience store was robbed again but an arrest was made this time In addition there were two retail robberies and one bank robbery
In July there were two gas station robberies and robberies at a restaurant and a market All other incidents resulted in arrests one was at a convenience store and the other two were banks
There were five bank robberies throughout the fourth quarter resulting in three arrests A Cambridge motel was robbed twice by two unknown suspects Four conveniencefast food stores were also targeted one arrest was made
There was a sporadic trend of breaks into convenience and drug stores targeting lottery tickets
These two quarters saw a dramatic increase in commercial breaks due to a number of construction site breaks for copper and equipment Toward the end of the third quarter thieves switched to stealing copper from residential homes which accounted for the decline in September Nine people were arrested in six of the breaks from April to September
December saw a pattern of breaks in InmanHarrington and Area 4 in which 17 businesses were broken into Cash registers and safes were usually targeted However in ten of the incidents nothing was reported stolen
Larcenies from persons significantly increased through September and October in Harvard amp Central Squares Thieves targeted items left unattended or hanging on the backs of chairs September - December also reported the highest number of larcenies from buildings with an increase in health club and school thefts
June - August experienced a pattern of car breaks in Peabody and Agassiz The most commonly stolen items were stereos Ten arrests were made in five of the incidents with the pattern cooling after the arrest of three juveniles at the end of August
The theft of GPS systems in January and March accounted for the spikes in crime during the first quarter Six people were arrested in connection with three of the incidents during this time
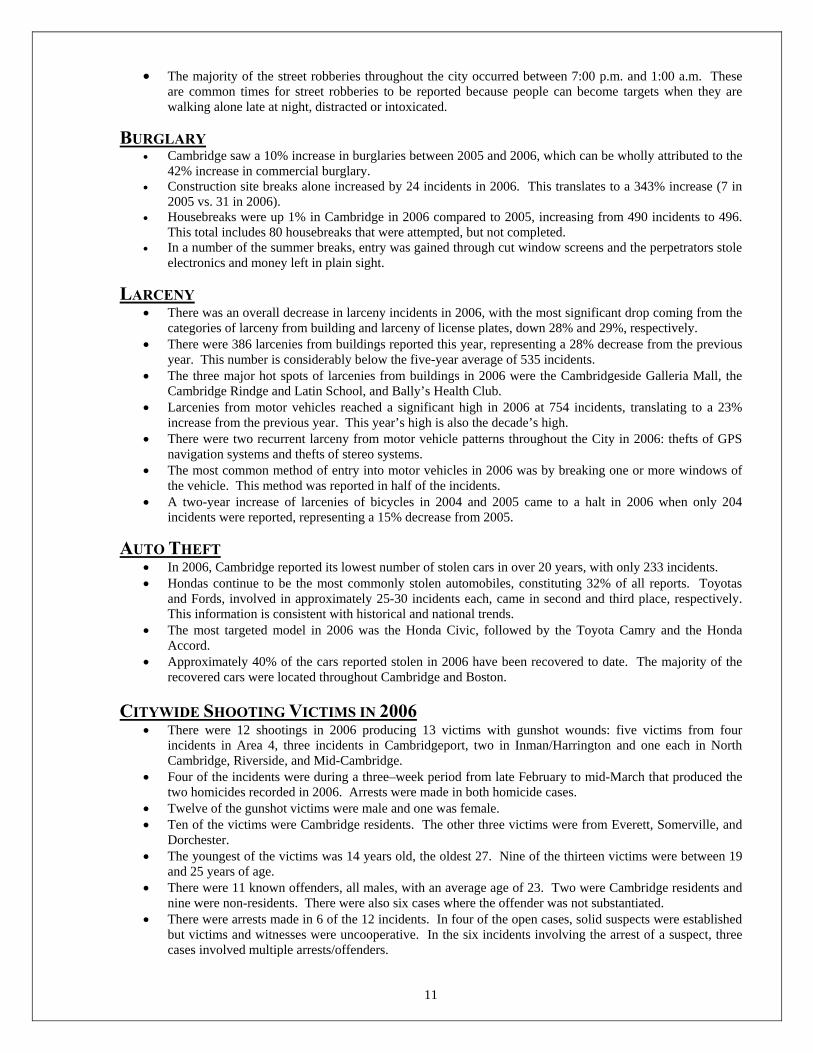
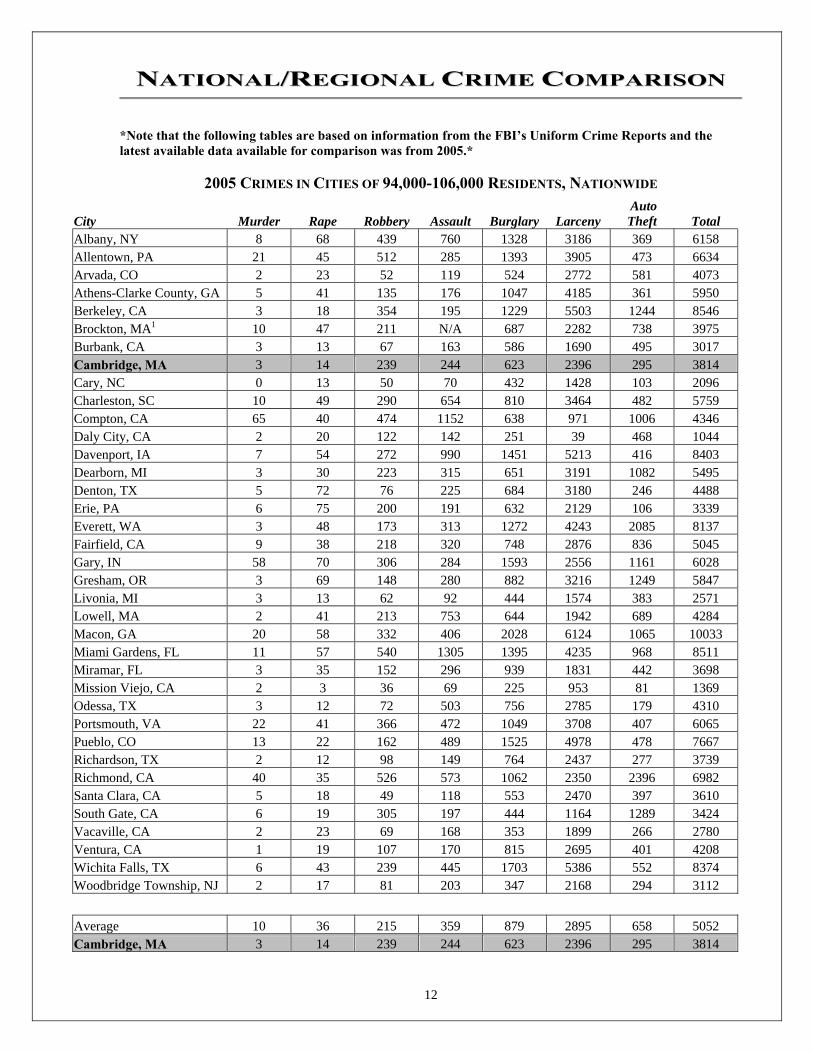
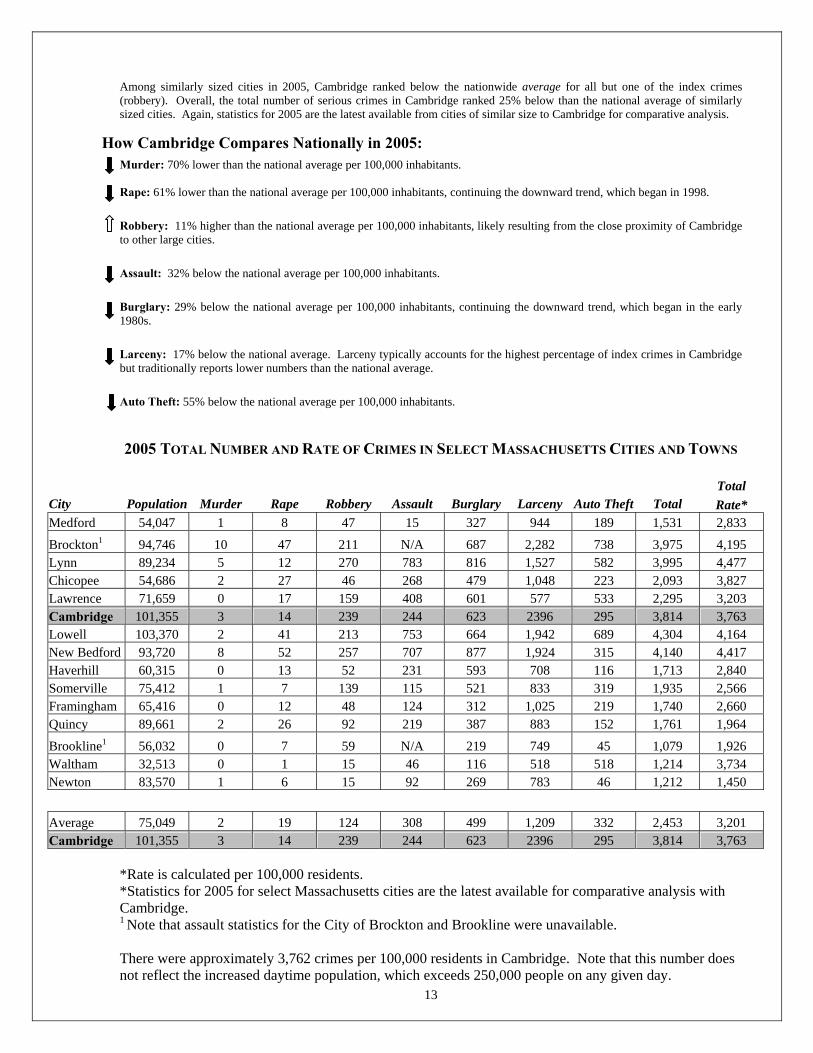
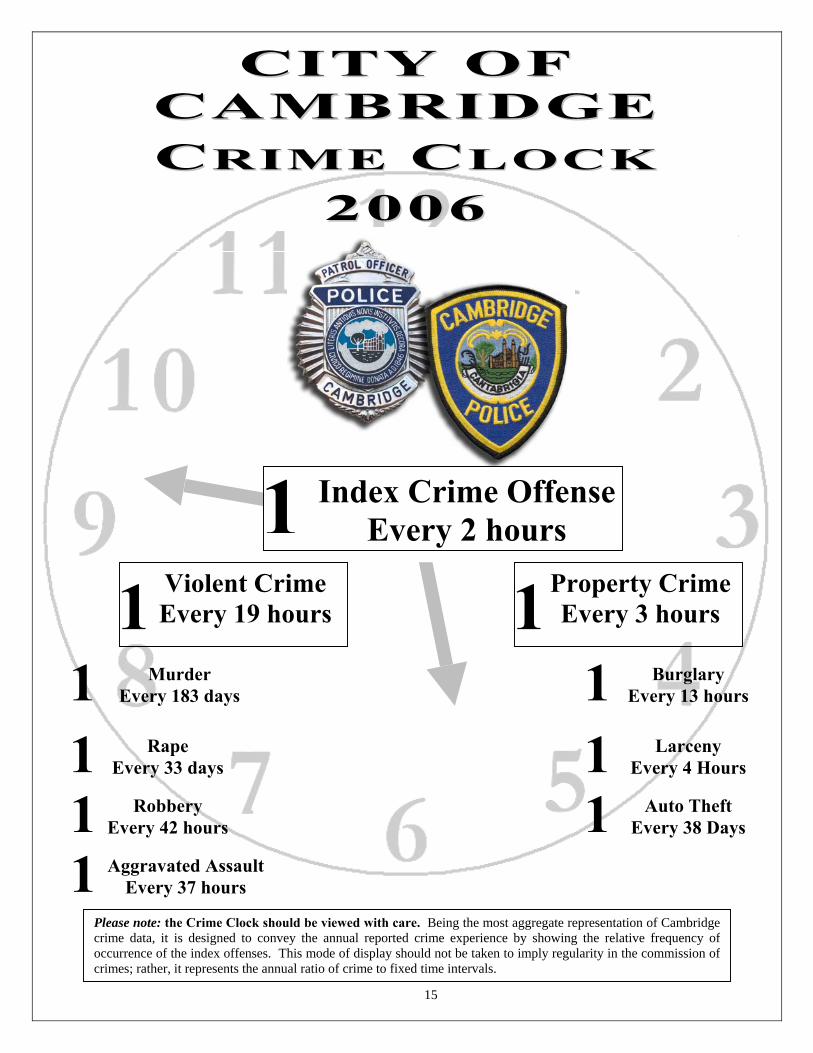
15
Please note the Crime Clock should be viewed with care Being the most aggregate representation of Cambridgecrime data it is designed to convey the annual reported crime experience by showing the relative frequency ofoccurrence of the index offenses This mode of display should not be taken to imply regularity in the commission ofcrimes rather it represents the annual ratio of crime to fixed time intervals
CCIITTYY OOFF CCAAMMBBRRIIDDGGEE CCRRIIMMEE CCLLOOCCKK
22000066
1
Index Crime Offense Every 2 hours
Violent Crime Every 19 hours
1 Murder Every 183 days
1 Rape Every 33 days
1 Robbery Every 42 hours
Aggravated Assault Every 37 hours
Property CrimeEvery 3 hours1
1
1 Burglary Every 13 hours
1 Larceny Every 4 Hours
1 Auto Theft Every 38 Days
1
16
FFAACCTTOORRSS CCOONNTTRRIIBBUUTTIINNGG TTOO CCRRIIMMEE
Throughout the 2006 Annual Report the Department tries to place statistics in contextmdashto explain why crime occurs in a particular area instead of just where and how often It is impossible however to analyze every crime factor within the pages of this report As a general rule readers should consider the following factors when gauging the relative safety of any city neighborhood or business district The FBI in its Uniform Crime Reports provides most of these factors Factor General Effect Status in Cambridge Effects in Cambridge Residential Population amp Population Density
High population leads to higher residential crime rate (residential burglaries larcenies from motor vehicles domestic assaults auto theft) High population density also leads to a higher residential crime rate
Population of about 101000 Very high density (about 15000 per square mile)
Higher residential crime rate than cities of fewer than 100000 Higher residential crime rate in densely populated neighborhoods
of Mid-Cambridge North Cambridge Cambridgeport Low residential crime rate in sparsely populated areas of
Cambridge Highlands Strawberry Hill Agassiz
Commerical amp Educational Population number amp type of commercial establishments and educational institutions
High commercial population leads to more ldquobusinessrdquo crimes (commercial burglaries shoplifting larcenies from buildings forgery) and to more crimes against the person often committed in commercial areas (larcenies from the person larcenies from motor vehicles larcenies of bicycles street robbery auto theft)
Very high commercial population (many large businesses shopping areas in Cambridge) and very high educational population (MIT and Harvard)
High overall larceny rate High larceny rate in highly-populated commercial areas of East
Cambridge Harvard Square Central Square Porter Square Fresh Pond Mall
High auto theft rate in East Cambridge MIT Area Low larceny auto theft rate in Agassiz Strawberry Hill West
Cambridge
Age composition of population
A higher population in the ldquoat riskrdquo age of 15ndash24 leads to a higher crime rate
22 percent of the citizens of Cambridge are in the ldquoat riskrdquo populationThis number is influenced by the high student population
Agassiz MIT and Riverside have the largest percentage of people in the ldquoat riskrdquo ages but most of them are college students which somewhat decreases their chances of involvement in criminal activity Consequently Agassiz MIT and Riverside do not have higher than average crime rates
However neighborhoods with the lowest numbers of ldquoat riskrdquo agesmdashWest Cambridge Cambridge Highlands and Strawberry Hillmdashdo experience smaller amounts of crime
Stability of Population Stable close-knit populations have a lower overall crime rate than transient populations Neighborhoods with more houses and condominiums (generally signifiying a more stable population) have a lower crime rate than neighborhoods with mostly apartments (generally a more transient population)
Historically stabler population west of Harvard Square more transient population east of Harvard Square This is changing rapidly with gentrification taking place in neighborhoods adjacent to Central Square
Lower comparative crime rate in neighborhoods of West Cambridge Highlands Peabody Agassiz Strawberry Hill
Higher comparative crime rate in Mid-Cambridge Area 4 Cambridgeport This however is changing with the stabilization and gentrification of housing in these areas
17
Street Layout Areas with major streets offering fast getaways and mass transportation show more crime clusters than neighborhoods with primarily residential streets
A mix of major and minor streets Higher auto theft rates in MIT East Cambridge Cambridgeport where thieves can make a quick jump over the bridge to Boston
Higher commercial burglary rate in North Cambridge with multiple avenues of escape into nearby towns
Proximity to Public Transportation
Criminals are often indigent and cannot afford cars or other expensive forms of transportation Areas near public transportation and particularly subways witness a higher crime ratemdashparticularly robbery and larcenymdashthan more inaccessable areas
Major public transportation system offering high-speed rapid transit throughout most of the city
Contributes to clusters of crime around Central Square Harvard Square Porter Square and Alewife though not much around Lechmere and Kendall Square
Neighborhoods distant from rapid transitmdashWest Cambridge Highlands and Strawberry Hillmdashshow lower crime rate with few clusters
Economic conditions including poverty level and unemployment rate
Again criminals are often indigent Areas afflicted by poverty show higher burglary robbery and larceny rates than middle-class or wealthy neighborhoods
Little abject poverty in Cambridge This factor probably contributes little to the picture of crime in Cambridge
Possibly some effect on Area 4mdashthe neighborhood with the lowest mean incomemdashthough Strawberry Hill which has the second lowest mean income also has one of the lowest crime rates in the city Other factors on this list probably have a much greater role than economic conditions
Family conditions with respect to divorce and family cohesiveness
Larry J Siegel author of Criminology says ldquoFamily relationships have for some time been considered a major determinant of behavior Youths who grow up in a household characterized by conflict and tension where parents are absent or separated or where there is a lack of familial love and support will be susceptible to the crime-promoting forces in the environmentrdquo
According to census data about one third of the families in Cambridge with children are single-parent families In the Commonwealth of Massachusetts as a whole this percentage is slightly lessmdashabout one quarter
The neighborhoods with the highest percentage of single-parent families are Area 4 Cambridgeport Riverside and North Cambridge With the exception of Riverside these neighborhoods also have a higher than mean crime rate However there are a far greater number of factors influencing ldquoconflict and tensionrdquo and ldquofamilial love and supportrdquo than just the number of parents in the household In the end no conclusions can be drawn without more data
Climate Warmer climates and seasons tend to report a higher rate of larceny auto theft and juvenile-related crime while cold seasons and climates report more robberies and murder
A varied climate warm and moist summers cool autums long cold winters
High overall larceny auto theft rate in the summer Higher overall robbery rate in the winter Burglary rate less tied to climate than to specific weather
conditions rain and snow produce fewer burglaries
Operational and investigative emphasis of the police department
Problem-oriented informed police departments have more success controlling certain aspects of crime than other departments
A problem-oriented department with an emphasis on directed patrol and investigation and on crime analysis including quick identification of crime patterns and rapid intervention to curtail them
Lower overall crime rate across the city than would be expected for a city of our size and characteristics
Attitude of the citizenry toward crime including its reporting practices
Populations that have ldquogiven uprdquo on crime and the police experience an exacerbation of the crime problem
A population that works closely with the police creates numerous neighborhood crime watches and is likely to report crimes
Lower overall crime rate across the city than would be expected for a city of our size and characteristics
18
0
5
10
15
20
25
Jan Feb Mar Apr May Jun Jul Aug Sep Oct Nov Dec
CCHHRROONNOOLLOOGGIICCAALL HHIIGGHHLLIIGGHHTTSS
0
10
20
30
40
50
60
70
Jan Feb Mar Apr May Jun Jul Aug Sep Oct Nov Dec
STREET ROBBERY
HOUSEBREAKS
There was a series of housebreaks along the CambridgeSomerville border which ended in the Somerville arrest of two individuals in early April They were believed to be responsible for over a dozen breaks along the boarder
Two patterns developed in the third quarter One took place during the daytime in InmanHarrington on the border of Sectors 1 amp 2 Entry was gained through unlocked windows and electronics were targeted The other took place in the early morning hours of the weekend in Sector 3 Arrests were made in both locations
A pattern developed in Area 4 at the end of February in which all victims were threatened with a gun and demanded to hand over their wallets Most victims were male and walking alone late at night
In mid to late April there was a pattern of pack robberies (mostly in InmanHarrington) in which juveniles targeted male victims Money and Ipods were the only items stolen Force was used or a weapon shown in four incidents
Mid-Cambridge had a pattern of housebreaks during the second quarter in which over 30 burglaries were reported Laptops digital cameras and Ipods were the common targets during the breaks
There were no identifiable patterns in the third quarter Area 4 and Peabody had the highest number of robberies through these months Six street robbery arrests took place throughout the city during this quarter
Sectors 1 and 2 saw an increase in street robberies with a weekend pattern in October that carried over into November This pattern significantly decreased with the arrest of three juveniles from Chelsea in late November
Sector 3 daytime housebreaks took place throughout the fourth quarter Entry was gained by prying open front doors Over 23 laptops were stolen in this pattern
19
020406080
100120140160
Jan Feb Mar Apr May Jun Jul Aug Sep Oct Nov Dec
0
1
2
3
4
5
6
7
Jan Feb Mar Apr May Jun Jul Aug Sep Oct Nov Dec
05
101520253035
Jan Feb Mar Apr May Jun Jul Aug Sep Oct Nov Dec
COMMERCIAL ROBBERY
COMMERCIAL BREAKS
LARCENY FROM MOTOR VEHICLE LARCENY FROM PERSON LARCENY FROM BUILDING
One convenience store was targeted three times throughout JanuaryFebruary There were three gas station robberies down from seven in last yearrsquos first quarter
The same convenience store was robbed again but an arrest was made this time In addition there were two retail robberies and one bank robbery
In July there were two gas station robberies and robberies at a restaurant and a market All other incidents resulted in arrests one was at a convenience store and the other two were banks
There were five bank robberies throughout the fourth quarter resulting in three arrests A Cambridge motel was robbed twice by two unknown suspects Four conveniencefast food stores were also targeted one arrest was made
There was a sporadic trend of breaks into convenience and drug stores targeting lottery tickets
These two quarters saw a dramatic increase in commercial breaks due to a number of construction site breaks for copper and equipment Toward the end of the third quarter thieves switched to stealing copper from residential homes which accounted for the decline in September Nine people were arrested in six of the breaks from April to September
December saw a pattern of breaks in InmanHarrington and Area 4 in which 17 businesses were broken into Cash registers and safes were usually targeted However in ten of the incidents nothing was reported stolen
Larcenies from persons significantly increased through September and October in Harvard amp Central Squares Thieves targeted items left unattended or hanging on the backs of chairs September - December also reported the highest number of larcenies from buildings with an increase in health club and school thefts
June - August experienced a pattern of car breaks in Peabody and Agassiz The most commonly stolen items were stereos Ten arrests were made in five of the incidents with the pattern cooling after the arrest of three juveniles at the end of August
The theft of GPS systems in January and March accounted for the spikes in crime during the first quarter Six people were arrested in connection with three of the incidents during this time
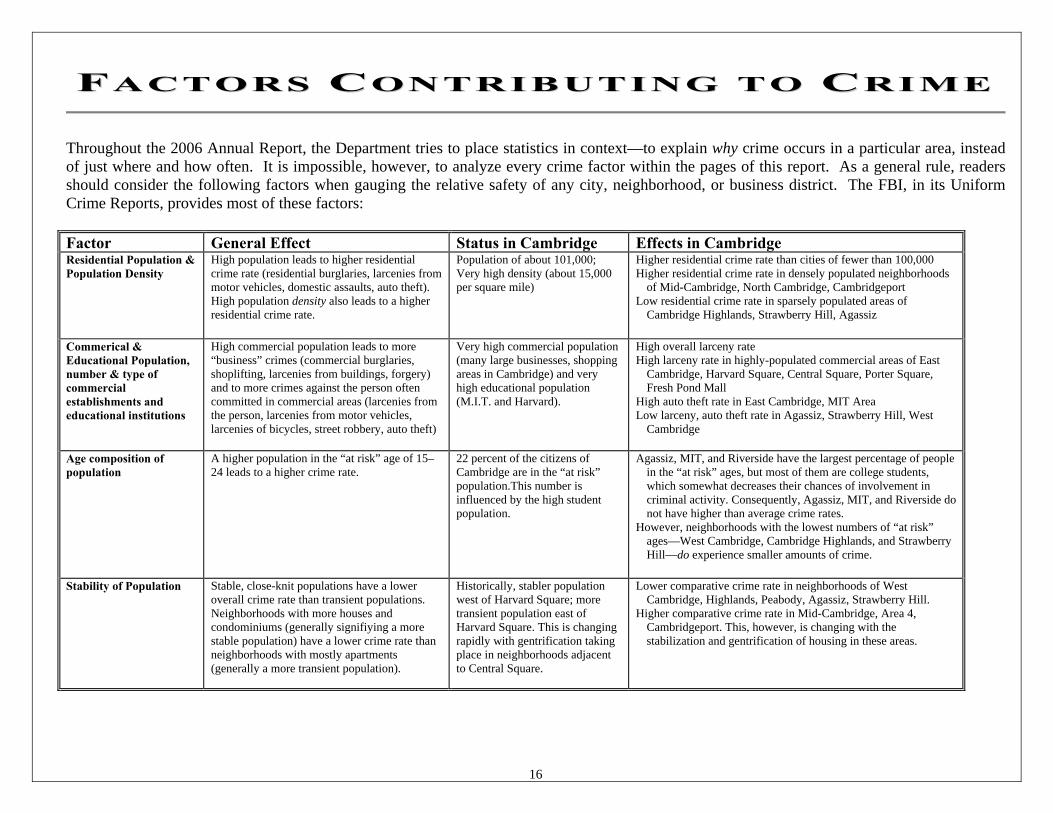
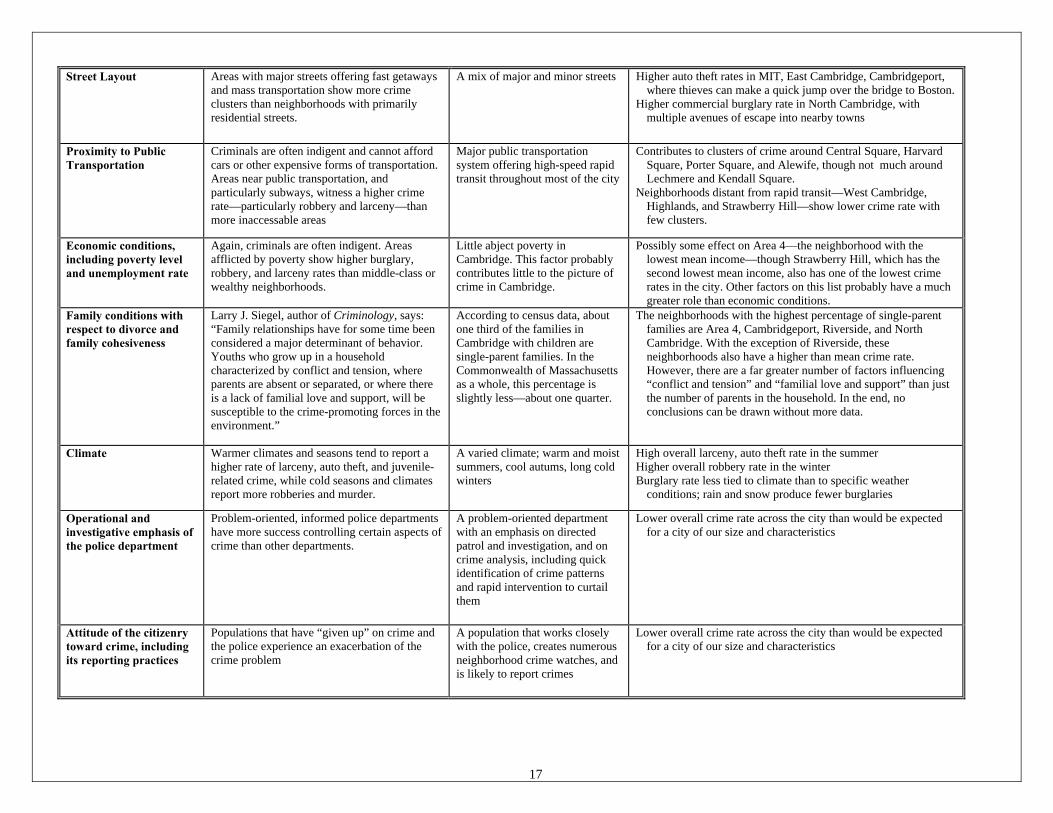
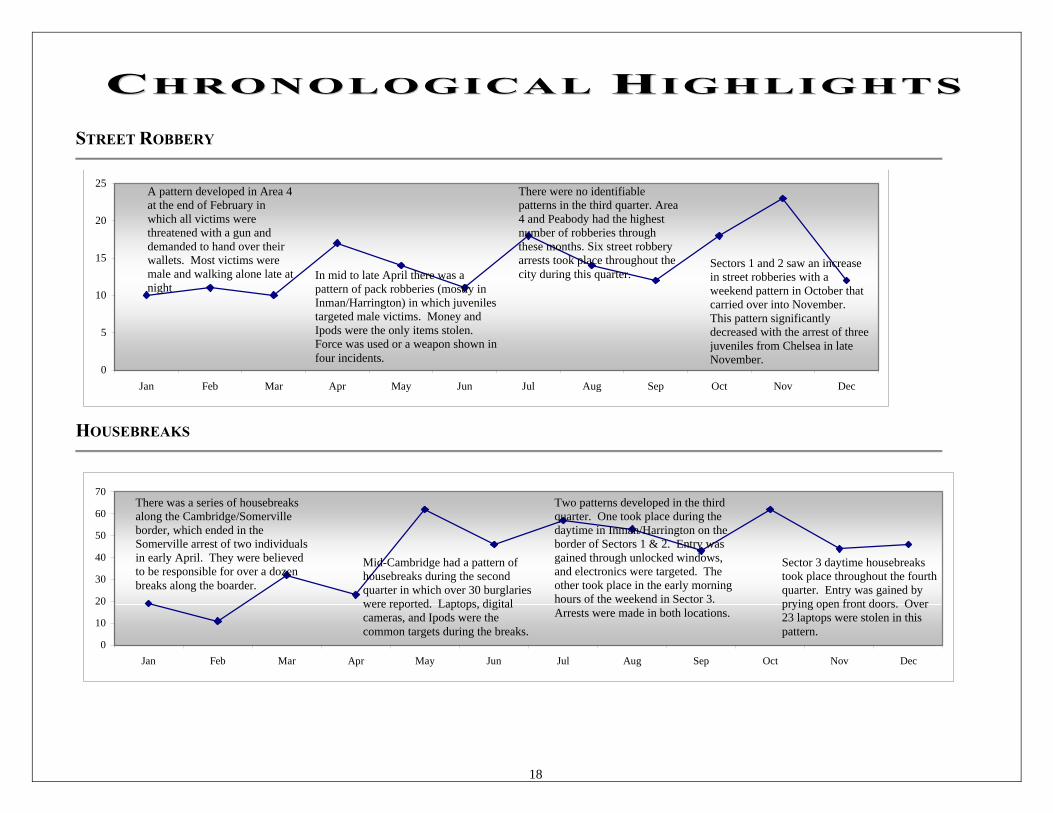
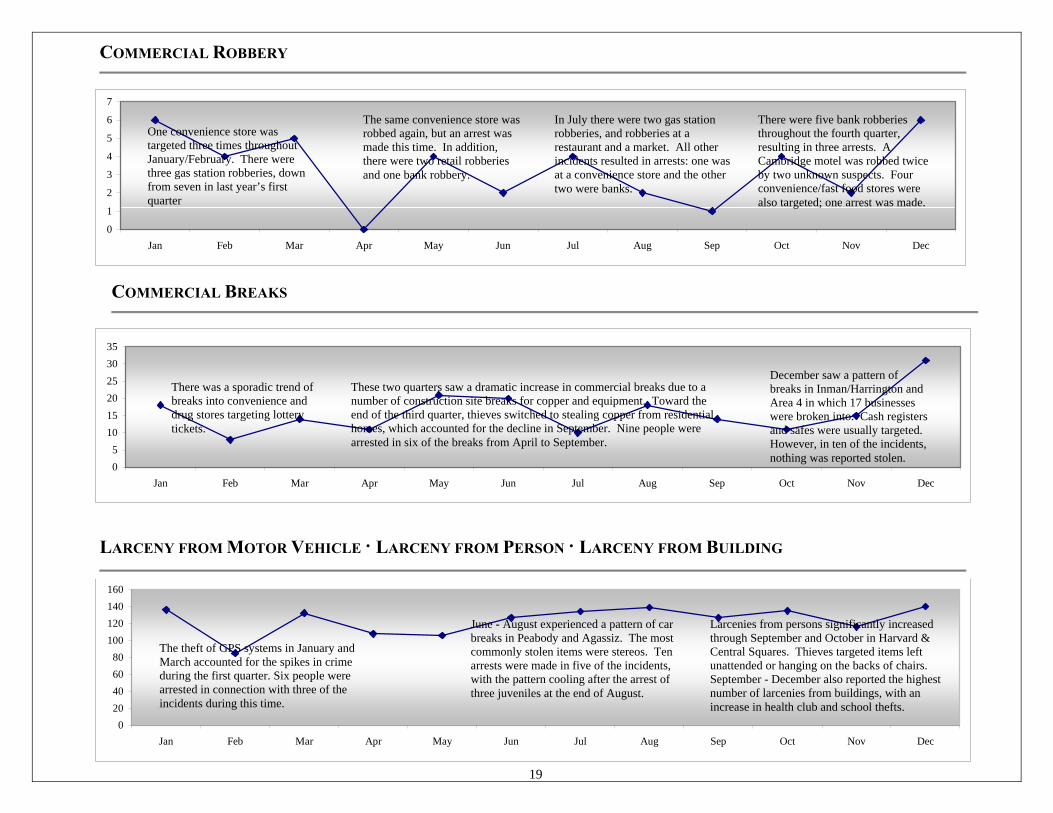


![Cambridge Profile v1.0 [14.10.10] 3 LEA C… · Cambridge Profile Overall employment rate High and increasing (73%) green Average earnings of employees High and rising (£524p/w)](https://img.pdfslide.us/doc/110x75/5f3068cb38ddbb080e4843df/cambridge-profile-v10-141010-3-lea-c-cambridge-profile-overall-employment.jpg)


![CAMBRIDGE MEMORIAL HOSPITAL BY-LAW NO. 1...CAMBRIDGE MEMORIAL HOSPITAL BY-LAW NO. 1 [Approved June 25, 2014] TOR_A2G:4652060.12 – ii – TABLE OF CONTENTS Table of Contents 29T TABLE](https://img.pdfslide.us/doc/110x75/61351aa5dfd10f4dd73c2852/cambridge-memorial-hospital-by-law-no-1-cambridge-memorial-hospital-by-law.jpg)


![Cambridge Profile v1.0 [14.10.10]democracy.cambridge.gov.uk/documents/s3082/APP 3 LEA Cambridg… · DRAFT 1 Cambridge Profile Overall employment rate High and increasing (73%) green](https://img.pdfslide.us/doc/110x75/5af0c4157f8b9ac57a8f08d8/cambridge-profile-v10-141010-3-lea-cambridgdraft-1-cambridge-profile-overall.jpg)