Embed Size (px)
Citation preview


Introduction. . . . . . . . . . . . . . . . . . . . . . . . . . . . . . . . . . . . . . . . . . . . . . . . . . . . . . . . . . . . . . . . . . . . . . . . . . viiStandards.Correlations. . . . . . . . . . . . . . . . . . . . . . . . . . . . . . . . . . . . . . . . . . . . . . . . . . . . . . . . . . . . . . . . .viii
Number and Quantity
QuantitiesPhone Card Fine Print . . . . . . . . . . . . . . . . . . . . . . . . . . . . . . . . . . . . . . . . . . . . . . . . . . . . . . . . . . . . . 1Investing Money . . . . . . . . . . . . . . . . . . . . . . . . . . . . . . . . . . . . . . . . . . . . . . . . . . . . . . . . . . . . . . . . . . 5Rafting and Hiking Trip . . . . . . . . . . . . . . . . . . . . . . . . . . . . . . . . . . . . . . . . . . . . . . . . . . . . . . . . . . . 10
Algebra
Seeing Structure in ExpressionsIdentifying Parts of an Expression in Context . . . . . . . . . . . . . . . . . . . . . . . . . . . . . . . . . . . . . . . . 14Searching for a Greater Savings . . . . . . . . . . . . . . . . . . . . . . . . . . . . . . . . . . . . . . . . . . . . . . . . . . . . 17
Creating EquationsFree Checking Accounts . . . . . . . . . . . . . . . . . . . . . . . . . . . . . . . . . . . . . . . . . . . . . . . . . . . . . . . . . . . 22Population Change . . . . . . . . . . . . . . . . . . . . . . . . . . . . . . . . . . . . . . . . . . . . . . . . . . . . . . . . . . . . . . . 25Skate Constraints . . . . . . . . . . . . . . . . . . . . . . . . . . . . . . . . . . . . . . . . . . . . . . . . . . . . . . . . . . . . . . . . 29Bricklayers . . . . . . . . . . . . . . . . . . . . . . . . . . . . . . . . . . . . . . . . . . . . . . . . . . . . . . . . . . . . . . . . . . . . . . 35
Reasoning with Equations and InequalitiesMagic Number . . . . . . . . . . . . . . . . . . . . . . . . . . . . . . . . . . . . . . . . . . . . . . . . . . . . . . . . . . . . . . . . . . 39Guess My Number . . . . . . . . . . . . . . . . . . . . . . . . . . . . . . . . . . . . . . . . . . . . . . . . . . . . . . . . . . . . . . . 43Landlines Versus Cell Phones . . . . . . . . . . . . . . . . . . . . . . . . . . . . . . . . . . . . . . . . . . . . . . . . . . . . . . 46Singing Celebration . . . . . . . . . . . . . . . . . . . . . . . . . . . . . . . . . . . . . . . . . . . . . . . . . . . . . . . . . . . . . . 49Ticket Sales . . . . . . . . . . . . . . . . . . . . . . . . . . . . . . . . . . . . . . . . . . . . . . . . . . . . . . . . . . . . . . . . . . . . . 53Salary Scales . . . . . . . . . . . . . . . . . . . . . . . . . . . . . . . . . . . . . . . . . . . . . . . . . . . . . . . . . . . . . . . . . . . . . 59Saving for College . . . . . . . . . . . . . . . . . . . . . . . . . . . . . . . . . . . . . . . . . . . . . . . . . . . . . . . . . . . . . . . . 63Senior Trip . . . . . . . . . . . . . . . . . . . . . . . . . . . . . . . . . . . . . . . . . . . . . . . . . . . . . . . . . . . . . . . . . . . . . . 67Cupcakes. . . . . . . . . . . . . . . . . . . . . . . . . . . . . . . . . . . . . . . . . . . . . . . . . . . . . . . . . . . . . . . . . . . . . . . . 71Skate Constraints Revisited . . . . . . . . . . . . . . . . . . . . . . . . . . . . . . . . . . . . . . . . . . . . . . . . . . . . . . . . 77
Functions
Interpreting FunctionsThe Private Library . . . . . . . . . . . . . . . . . . . . . . . . . . . . . . . . . . . . . . . . . . . . . . . . . . . . . . . . . . . . . . . 82Party Time . . . . . . . . . . . . . . . . . . . . . . . . . . . . . . . . . . . . . . . . . . . . . . . . . . . . . . . . . . . . . . . . . . . . . . 86Which Tree Will It Be? . . . . . . . . . . . . . . . . . . . . . . . . . . . . . . . . . . . . . . . . . . . . . . . . . . . . . . . . . . . . 91Careful Calculations . . . . . . . . . . . . . . . . . . . . . . . . . . . . . . . . . . . . . . . . . . . . . . . . . . . . . . . . . . . . . . 95
Table of Contents
© Walch Educationiii
CCSS Problem-Based Tasks for Mathematics I
Costing Up a Storm. . . . . . . . . . . . . . . . . . . . . . . . . . . . . . . . . . . . . . . . . . . . . . . . . . . . . . . . . . . . . . . 99Dwindling Concentrations . . . . . . . . . . . . . . . . . . . . . . . . . . . . . . . . . . . . . . . . . . . . . . . . . . . . . . . 104Fund-raising Concert . . . . . . . . . . . . . . . . . . . . . . . . . . . . . . . . . . . . . . . . . . . . . . . . . . . . . . . . . . . . 109Trout Pond . . . . . . . . . . . . . . . . . . . . . . . . . . . . . . . . . . . . . . . . . . . . . . . . . . . . . . . . . . . . . . . . . . . . . 114Supply and Demand . . . . . . . . . . . . . . . . . . . . . . . . . . . . . . . . . . . . . . . . . . . . . . . . . . . . . . . . . . . . . 118Analyzing Kidney Function . . . . . . . . . . . . . . . . . . . . . . . . . . . . . . . . . . . . . . . . . . . . . . . . . . . . . . . 123
Building FunctionsTexting for the Win . . . . . . . . . . . . . . . . . . . . . . . . . . . . . . . . . . . . . . . . . . . . . . . . . . . . . . . . . . . . . 127Jai’s Jeans . . . . . . . . . . . . . . . . . . . . . . . . . . . . . . . . . . . . . . . . . . . . . . . . . . . . . . . . . . . . . . . . . . . . . . 132New Tablet . . . . . . . . . . . . . . . . . . . . . . . . . . . . . . . . . . . . . . . . . . . . . . . . . . . . . . . . . . . . . . . . . . . . . 135Glass Recycling . . . . . . . . . . . . . . . . . . . . . . . . . . . . . . . . . . . . . . . . . . . . . . . . . . . . . . . . . . . . . . . . . 139Gym Fees . . . . . . . . . . . . . . . . . . . . . . . . . . . . . . . . . . . . . . . . . . . . . . . . . . . . . . . . . . . . . . . . . . . . . . 143
Linear, Quadratic, and Exponential ModelsInterior Angles in Polygons . . . . . . . . . . . . . . . . . . . . . . . . . . . . . . . . . . . . . . . . . . . . . . . . . . . . . . . 146Future Finances . . . . . . . . . . . . . . . . . . . . . . . . . . . . . . . . . . . . . . . . . . . . . . . . . . . . . . . . . . . . . . . . . 150Cell Phone Plans . . . . . . . . . . . . . . . . . . . . . . . . . . . . . . . . . . . . . . . . . . . . . . . . . . . . . . . . . . . . . . . . 155
Geometry
CongruenceA Mathematical Look . . . . . . . . . . . . . . . . . . . . . . . . . . . . . . . . . . . . . . . . . . . . . . . . . . . . . . . . . . . . 159In the Mail Room . . . . . . . . . . . . . . . . . . . . . . . . . . . . . . . . . . . . . . . . . . . . . . . . . . . . . . . . . . . . . . . 162Lining the Plaza . . . . . . . . . . . . . . . . . . . . . . . . . . . . . . . . . . . . . . . . . . . . . . . . . . . . . . . . . . . . . . . . . 168Painting Surfboards . . . . . . . . . . . . . . . . . . . . . . . . . . . . . . . . . . . . . . . . . . . . . . . . . . . . . . . . . . . . . 173Animating a Logo . . . . . . . . . . . . . . . . . . . . . . . . . . . . . . . . . . . . . . . . . . . . . . . . . . . . . . . . . . . . . . . 176Artifacts Recovered and Restored . . . . . . . . . . . . . . . . . . . . . . . . . . . . . . . . . . . . . . . . . . . . . . . . . 179Architectural Planning . . . . . . . . . . . . . . . . . . . . . . . . . . . . . . . . . . . . . . . . . . . . . . . . . . . . . . . . . . . 183Stained Glass Pattern, Part I . . . . . . . . . . . . . . . . . . . . . . . . . . . . . . . . . . . . . . . . . . . . . . . . . . . . . . 188Stained Glass Pattern, Part II . . . . . . . . . . . . . . . . . . . . . . . . . . . . . . . . . . . . . . . . . . . . . . . . . . . . . 194How Many Triangles? . . . . . . . . . . . . . . . . . . . . . . . . . . . . . . . . . . . . . . . . . . . . . . . . . . . . . . . . . . . 199Triangle Medians . . . . . . . . . . . . . . . . . . . . . . . . . . . . . . . . . . . . . . . . . . . . . . . . . . . . . . . . . . . . . . . 205Triangle Altitudes . . . . . . . . . . . . . . . . . . . . . . . . . . . . . . . . . . . . . . . . . . . . . . . . . . . . . . . . . . . . . . . 209Vending Machine Placement . . . . . . . . . . . . . . . . . . . . . . . . . . . . . . . . . . . . . . . . . . . . . . . . . . . . . 213Constructing a Regular Octagon . . . . . . . . . . . . . . . . . . . . . . . . . . . . . . . . . . . . . . . . . . . . . . . . . . . 218Constructing a Regular Dodecagon . . . . . . . . . . . . . . . . . . . . . . . . . . . . . . . . . . . . . . . . . . . . . . . . 223
Expressing Geometric Properties with EquationsField of Dreams . . . . . . . . . . . . . . . . . . . . . . . . . . . . . . . . . . . . . . . . . . . . . . . . . . . . . . . . . . . . . . . . . 228Pave the Way . . . . . . . . . . . . . . . . . . . . . . . . . . . . . . . . . . . . . . . . . . . . . . . . . . . . . . . . . . . . . . . . . . . 237Building Fences . . . . . . . . . . . . . . . . . . . . . . . . . . . . . . . . . . . . . . . . . . . . . . . . . . . . . . . . . . . . . . . . . 242
Table of Contents
iv© Walch EducationCCSS Problem-Based Tasks for Mathematics I

Statistics and Probability
Interpreting Categorical and Quantitative DataRepresenting Data Sets . . . . . . . . . . . . . . . . . . . . . . . . . . . . . . . . . . . . . . . . . . . . . . . . . . . . . . . . . . 247Comparing Data Sets . . . . . . . . . . . . . . . . . . . . . . . . . . . . . . . . . . . . . . . . . . . . . . . . . . . . . . . . . . . . 254Family Car Trips . . . . . . . . . . . . . . . . . . . . . . . . . . . . . . . . . . . . . . . . . . . . . . . . . . . . . . . . . . . . . . . . 260FunZone America Survey . . . . . . . . . . . . . . . . . . . . . . . . . . . . . . . . . . . . . . . . . . . . . . . . . . . . . . . . . 264Movie Buzz . . . . . . . . . . . . . . . . . . . . . . . . . . . . . . . . . . . . . . . . . . . . . . . . . . . . . . . . . . . . . . . . . . . . . 271Estimating Salaries . . . . . . . . . . . . . . . . . . . . . . . . . . . . . . . . . . . . . . . . . . . . . . . . . . . . . . . . . . . . . . 276Lion Cub Births . . . . . . . . . . . . . . . . . . . . . . . . . . . . . . . . . . . . . . . . . . . . . . . . . . . . . . . . . . . . . . . . . 282Learning to Speak . . . . . . . . . . . . . . . . . . . . . . . . . . . . . . . . . . . . . . . . . . . . . . . . . . . . . . . . . . . . . . . 286Good and Bad Cholesterol . . . . . . . . . . . . . . . . . . . . . . . . . . . . . . . . . . . . . . . . . . . . . . . . . . . . . . . . 291Good Cholesterol and Exercise . . . . . . . . . . . . . . . . . . . . . . . . . . . . . . . . . . . . . . . . . . . . . . . . . . . . 295
Table of Contents
© Walch Educationv
CCSS Problem-Based Tasks for Mathematics I

Common.Core.State.Standards.Problem-Based.Tasks.for.Mathematics.I is correlated to the Common Core State Standards for high school mathematics. The table that follows lists each task’s targeted Common Core State Standard(s), focus, title, and starting page number. The materials are organized in the order in which the standards are listed in the mathematics CCSS, and are grouped by high school conceptual category. Stars (★) indicate modeling standards. To access the full text of the Common Core State Standards for high school mathematics, view the PDF found at http://www.walch.com/CCSS/00001.
CCSS addressed Task focus Task titlePage
number
Number and Quantity
N–Q.1★
A–CED.2★
Creating and Graphing Linear Equations in Two Variables
Phone Card Fine Print 1
N–Q.1★
A–CED.2★
Creating and Graphing Exponential Equations
Investing Money 5
N–Q.2★
N–Q.3★
A–CED.1★
Creating Linear Equations in One Variable
Rafting and Hiking Trip 10
Algebra
A–SSE.1a★Identifying Terms, Factors, and Coefficients
Identifying Parts of an Expression in Context
14
A–SSE.1b★Interpreting Complicated Expressions
Searching for a Greater Savings 17
A–CED.1★Creating Linear Equalities in One Variable
Free Checking Accounts 22
A–CED.1★ Creating Exponential Equations Population Change 25
A–CED.3★ Representing Constraints Skate Constraints 29
A–CED.4★ Rearranging Formulas Bricklayers 35
A–REI.1 Properties of Equality Magic Number 39
A–REI.3 Solving Linear Equations Guess My Number 43
A–REI.3 Solving Linear Inequalities Landlines Versus Cell Phones 46
Standards Correlations
viii© Walch EducationCCSS Problem-Based Tasks for Mathematics I
(continued)

CCSS addressed Task focus Task titlePage
number
A–REI.3 Solving Exponential Equations Singing Celebration 49
A–REI.5 Proving Equivalencies Ticket Sales 53
A–REI.6Solving Systems of Linear Equations
Salary Scales 59
A–REI.10Graphing the Set of All Solutions
Saving for College 63
A–REI.11★ Intersecting Graphs Senior Trip 67
A–REI.12Solving Linear Inequalities in Two Variables
Cupcakes 71
A–REI.12Solving Systems of Linear Inequalities
Skate Constraints Revisited 77
Functions
F–IF.1 Domain and Range The Private Library 82
F–IF.2Function Notation and Evaluating Functions
Party Time 86
F–IF.3 Sequences As Functions Which Tree Will It Be? 91
F–IF.4★
F–IF.5★
Identifying Key Features of Linear and Exponential Graphs
Careful Calculations 95
F–IF.6★
F–LE.1a★
Proving Average Rate of Change
Costing Up a Storm 99
F–IF.6★
F–LE.1b★
F–LE.1c★
Recognizing Average Rate of Change
Dwindling Concentrations 104
F–IF.7a★ Graphing Linear Functions Fund-raising Concert 109
F–IF.7e★Graphing Exponential Functions
Trout Pond 114
F–IF.9 Comparing Linear Functions Supply and Demand 118
F–IF.9Comparing Exponential Functions
Analyzing Kidney Function 123
Standards Correlations
© Walch Educationix
CCSS Problem-Based Tasks for Mathematics I
(continued)

CCSS addressed Task focus Task titlePage
number
F–BF.1a★Building Functions from Context
Texting for the Win 127
F–BF.1b★ Operating on Functions Jai’s Jeans 132
F–BF.2★ Arithmetic Sequences New Tablet 135
F–BF.2★ Geometric Sequences Glass Recycling 139
F–BF.3Transformations of Linear and Exponential Functions
Gym Fees 143
F–LE.2★Constructing Functions from Graphs and Tables
Interior Angles in Polygons 146
F–LE.3★Comparing Linear to Exponential Functions
Future Finances 150
F–LE.5★ Interpreting Parameters Cell Phone Plans 155
Geometry
G–CO.1 Defining Terms A Mathematical Look 159
G–CO.2 Transformations As Functions In the Mail Room 162
G–CO.3 Applying Lines of Symmetry Lining the Plaza 168
G–CO.4Defining Rotations, Reflections, and Translations
Painting Surfboards 173
G–CO.5Applying Rotations, Reflections, and Translations
Animating a Logo 176
G–CO.6Describing Rigid Motions and Predicting the Effects
Artifacts Recovered and Restored
179
G–CO.6Defining Congruence in Terms of Rigid Motions
Architectural Planning 183
G–CO.7 Triangle Congruency Stained Glass Pattern, Part I 188
G–CO.8 Explaining ASA, SAS, and SSS Stained Glass Pattern, Part II 194
G–CO.12 Copying Segments and Angles How Many Triangles? 199
G–CO.12 Bisecting Segments and Angles Triangle Medians 205
Standards Correlations
x© Walch EducationCCSS Problem-Based Tasks for Mathematics I
(continued)

CCSS addressed Task focus Task titlePage
number
G–CO.12Constructing Perpendicular and Parallel Lines
Triangle Altitudes 209
G–CO.13Constructing Equilateral Triangles Inscribed in Circles
Vending Machine Placement 213
G–CO.13Constructing Squares Inscribed in Circles
Constructing a Regular Octagon
218
G–CO.13Constructing Regular Hexagons Inscribed in Circles
Constructing a Regular Dodecagon
223
G–GPE.4
G–GPE.5
Using Coordinates to Prove Geometric Theorems with Slope and Distance
Field of Dreams 228
G–GPE.5Working with Parallel and Perpendicular Lines
Pave the Way 237
G–GPE.7★ Calculating Perimeter and Area Building Fences 242
Statistics and Probability
S–ID.1★ Representing Data Sets Representing Data Sets 247
S–ID.2★ Comparing Data Sets Comparing Data Sets 254
S–ID.3★ Interpreting Data Sets Family Car Trips 260
S–ID.5★Summarizing Data Using Two-Way Frequency Tables
FunZone America Survey 264
S–ID.6a★Solving Problems Given Functions Fitted to Data
Movie Buzz 271
S–ID.6b★ Analyzing Residuals Estimating Salaries 276
S–ID.6c★Fitting Linear Functions to Data
Lion Cub Births 282
S–ID.7★Interpreting Slope and y-intercept
Learning to Speak 286
S–ID.8★Calculating and Interpreting the Correlation Coefficient
Good and Bad Cholesterol 291
S–ID.9★Distinguishing Between Correlation and Causation
Good Cholesterol and Exercise 295
Standards Correlations
© Walch Educationxi
CCSS Problem-Based Tasks for Mathematics I

N–Q.1★; A–CED.2★ • Number and QuantityCreating and Graphing Linear Equations in Two Variables
NAME:
CCSS Problem-Based Tasks for Mathematics I© Walch Education1
Common Core State Standards
N–Q.1
Use units as a way to understand problems and to guide the solution of multi-step problems; choose and interpret units consistently in formulas; choose and interpret the scale and the origin in graphs and data displays.★
A–CED.2
Create equations in two or more variables to represent relationships between quantities; graph equations on coordinate axes with labels and scales.★
Problem-Based Task: Phone Card Fine PrintWrite and graph the equation that models the following scenario.
You can buy a 6-hour phone card for $5, but the fine print says that each minute you talk actually costs you 1.5 minutes of time. What is the equation that models the number of minutes left on the card compared with the number of minutes you actually talked? What is the graph of this equation?

N–Q.1★; A–CED.2★ • Number and QuantityCreating and Graphing Linear Equations in Two Variables
NAME:
CCSS Problem-Based Tasks for Mathematics I2
© Walch Education
Problem-Based Task: Phone Card Fine Print
Coachinga. What are the slope and the y-intercept?
b. What is the equation of the line?
c. What are the labels of the x- and y-axes?
d. What are the scales of the x- and y-axes?
e. Which point do you plot first?
f. How can you use the equation to plot the second point?

N–Q.1★; A–CED.2★ • Number and QuantityCreating and Graphing Linear Equations in Two Variables
Instruction
© Walch Education3
CCSS Problem-Based Tasks for Mathematics I
Problem-Based Task: Phone Card Fine Print
Coaching Sample Responsesa. What are the slope and the y-intercept?
The slope is the rate. Notice the word “each” in the phrase “each minute you talk actually costs you 1.5 minutes of time.” Therefore, the rate at which the time on the card is decreasing is 1.5 minutes. The slope = –1.5 minutes.
m = –1.5
The y-intercept is 6 hours. That’s the amount of time you started with, but the rate at which the card is decreasing is given in minutes. You need to convert hours into minutes.
1 hour = 60 minutes
6 hours •60minutes
1 hour= 360minutes
b = 360
b. What is the equation of the line?
y = –1.5x + 360
c. What are the labels of the x- and y-axes?
The x-axis label is “Minutes used” and the y-axis label is “Minutes left.”
d. What are the scales of the x- and y-axes?
Since the minutes on the card are in the hundreds and the slope’s rise and run are in the single digits, the best way to choose the units for both axes is to keep the division of units the same so that you can use the slope to plot the points. Choose the scale on the y-axis first. The y-intercept occurs at 360. Choose a scale that starts at 0 and continues to 400 in increments of 20. This way, the y-intercept will be easy to plot.
For the x-axis, since the rate of decreasing minutes is faster than 1, the scale doesn’t need to be as long. Start at 0 and continue to 300, again in increments of 20. This will let you count the rise over the run using the grid marks for the slope to plot the second point.
e. Which point do you plot first?
Plot the y-intercept first. (0, 360)

N–Q.1★; A–CED.2★ • Number and QuantityCreating and Graphing Linear Equations in Two Variables
Instruction
4© Walch EducationCCSS Problem-Based Tasks for Mathematics I
f. How can you use the equation to plot the second point?
Rewrite the slope as a fraction.
1.53
2
rise
run− =
−=
Since the units are the same for the x- and y-axes, you can count the number of tick marks for the slope. From the y-intercept, count down by 3 units and to the right by 2 units, then plot the second point. Then connect the points. Extend the line to the edges of the coordinate plane.

N–Q.1★; A–CED.2★ • Number and QuantityCreating and Graphing Exponential Equations
NAME:
CCSS Problem-Based Tasks for Mathematics I© Walch Education5
Common Core State Standards
N–Q.1
Use units as a way to understand problems and to guide the solution of multi-step problems; choose and interpret units consistently in formulas; choose and interpret the scale and the origin in graphs and data displays.★
A–CED.2
Create equations in two or more variables to represent relationships between quantities; graph equations on coordinate axes with labels and scales.★
Problem-Based Task: Investing MoneyYou want to invest some money in a savings account. One bank offers an account that compounds the money annually at a rate of 3%. You have $2,000 to invest. As you are about to sign the papers, your friend texts you that a different bank offers a rate of 3.2% and this bank will compound the interest monthly. You decide to check out the second bank, but on your way there you spend $100. You end up choosing the second bank with the higher interest rate, but you want to know how spending $100 along the way affected your investment.
Create a graph showing how much interest you would have earned on $2,000 at the first bank, then create another graph showing how much interest you will earn on the money you invested in the second bank. Use the graphs to help you determine about how long it will take to earn back the $100 you spent. How long will it take before the two graphs are equal? How would your investment have changed if you hadn’t spent the $100? What can you conclude about investing?

N–Q.1★; A–CED.2★ • Number and QuantityCreating and Graphing Exponential Equations
NAME:
CCSS Problem-Based Tasks for Mathematics I6
© Walch Education
Problem-Based Task: Investing Money
Coachinga. What is the equation for the investment at the first bank?
b. What is the equation for the investment at the second bank? Keep in mind that you spent $100 of the money you initially planned to invest.
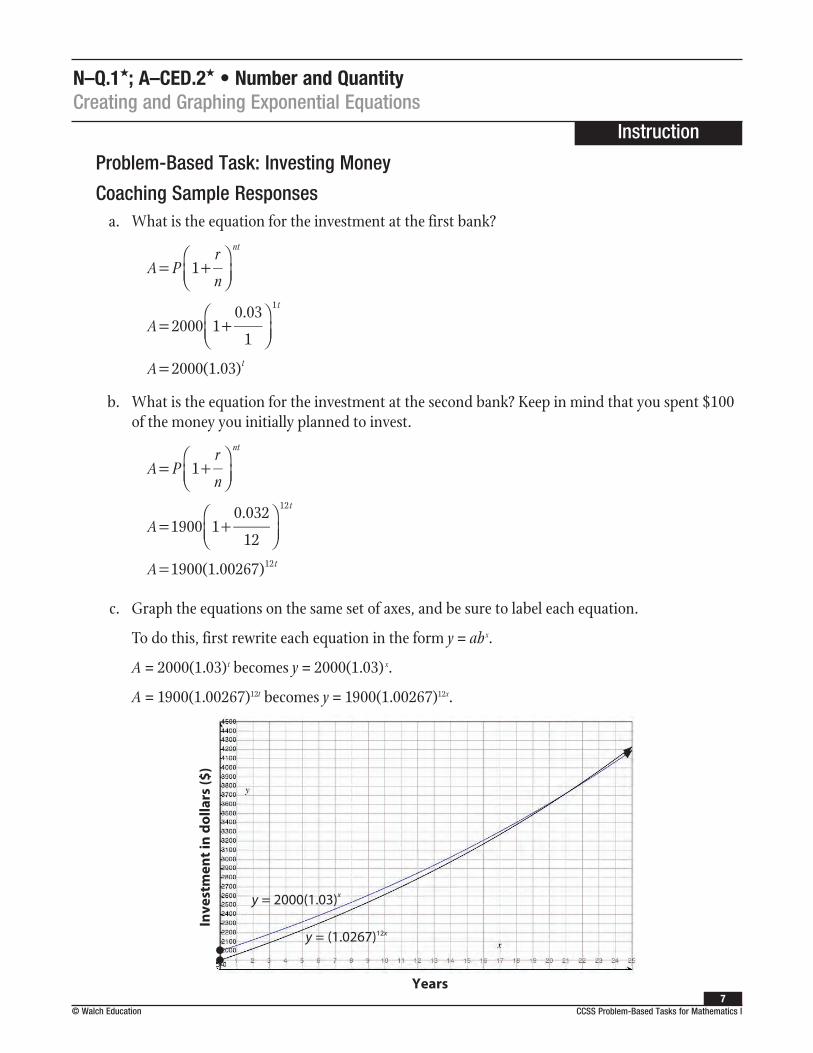
c. Graph the equations on the same set of axes, and be sure to label each equation.
d. Looking at the graph of the investment you actually made, how many years does it take to earn back the $100 you spent?
e. How many years does it take before the investment you made is equal to the investment you almost made?
f. What would be the equation of the investment at the second bank if you had not spent the $100?
g. Graph the equation from part f on the same set of axes as the equation from part b.
h. Look at various points along the graph and use the equations. What is the difference in investments after 10 years? 20 years?
i. Compare the investments of all 3 graphs and make observations. What conclusions can you draw about the amount you invest initially or the principal amount? What can you conclude about the number of times the interest is compounded in a year? What effect does this have on the investment?
N–Q.1★; A–CED.2★ • Number and QuantityCreating and Graphing Exponential Equations
Instruction
© Walch Education7
CCSS Problem-Based Tasks for Mathematics I
Problem-Based Task: Investing Money
Coaching Sample Responsesa. What is the equation for the investment at the first bank?
A Pr
n
A
A
nt
t
t
1
2000 10.03
1
2000(1.03)
1
= +
= +
=
b. What is the equation for the investment at the second bank? Keep in mind that you spent $100 of the money you initially planned to invest.
A Pr
n
A
A
nt
t
t
1
1900 10.032
12
1900(1.00267)
12
12
= +
= +
=
c. Graph the equations on the same set of axes, and be sure to label each equation.
To do this, first rewrite each equation in the form y = ab.x.
A = 2000(1.03) t becomes y = 2000(1.03) x.
A = 1900(1.00267)12t becomes y = 1900(1.00267)12x.
Years
In
vest
men
t in
dolla
rs ($
)
y = 2000(1.03)x
y = (1.0267)12x

N–Q.1★; A–CED.2★ • Number and QuantityCreating and Graphing Exponential Equations
Instruction
8© Walch EducationCCSS Problem-Based Tasks for Mathematics I
d. Looking at the graph of the investment you actually made, how many years does it take to earn back the $100 you spent?
It looks like the investment earns back $100 and reaches $2,000 after a little more than a year and a half, or about 19 months.
e. How many years does it take before the investment you made is equal to the investment you almost made?
The graphs intersect at about 21 years, so the investments will be equal in about 21 years.
f. What would be the equation of the investment at the second bank if you had not spent the $100?
A Pr
n
A
A
nt
t
t
1
2000 10.032
12
2000(1.00267)
12
12
= +
= +
=
g. Graph the equation from part f on the same set of axes as the equation from part b.
Before graphing, rewrite the equation in the form y = abx.
A = 2000(1.00267)12t becomes y = 2000(1.00267)12x.
Years
Inv
estm
ent i
n do
llars
($)
y = 2000(1.00267)12x
y = 1900(1.00267)12x

N–Q.1★; A–CED.2★ • Number and QuantityCreating and Graphing Exponential Equations
Instruction
© Walch Education9
CCSS Problem-Based Tasks for Mathematics I
h. Look at various points along the graph and use the equations. What is the difference in investments after 10 years? 20 years?
The investment of the principal amount of $2,000 will always be greater than the investment with the principal amount of $1,900. After 10 years, the investment of $2,000 grows to $2,754.18, and the investment of $1,900 grows to $2,616.47, a difference of $137.71.
After 20 years, the investment of $2,000 grows to $3,792.76, and the investment of $1,900 grows to $3,603.12. The difference is $189.64. The gap between the larger and smaller investments is slowly widening.
i. Compare the investments of all 3 graphs and make observations. What conclusions can you draw about the amount you invest initially or the principal amount? What can you conclude about the number of times the interest is compounded in a year? What effect does this have on the investment?
The more you invest to begin with, the more your investment will grow. The more times the interest is compounded in a year, the faster the investment will grow. If two banks are offering the same rate but one bank is compounding the interest more frequently, invest in the bank that compounds more often. If the rates are different, draw graphs to compare the investments.
Years
Inve
stm
ent i
n do
llars
($)
y = 2000(1.03)x
y = 1900(1.00267)12x
y = 2000(1.00267)12x

N–Q.2★; N–Q.3★; A–CED.1★ • Number and QuantityCreating Linear Equations in One Variable
NAME:
10© Walch EducationCCSS Problem-Based Tasks for Mathematics I
Common Core State Standards
N–Q.2
Define appropriate quantities for the purpose of descriptive modeling.★
N–Q.3
Choose a level of accuracy appropriate to limitations on measurement when reporting quantities.★
A–CED.1
Create equations and inequalities in one variable and use them to solve problems. Include.equations.arising.from.linear.and.quadratic.functions,.and.simple.rational.and.exponential.functions .★
Problem-Based Task: Rafting and Hiking TripTo celebrate graduation, you and 4 of your closest friends have decided to take a 5-day white-water rafting and hiking trip. During your 5-day trip, 2 days are spent rafting. If the rafting trip covers a distance of 60 miles and you are expected to raft 8 hours each day, how many miles must you raft each hour?
For the hiking portion of your trip, you and your friends carry the same amount of equipment, which works out to 35 pounds of equipment each. For extra money, you can hire an assistant, who will carry 50 pounds of equipment. Each assistant charges a flat fee of $50 and an additional $22 for each mile. The total amount you would have to pay the assistant is $512. How many miles will your group be hiking? Is it worth hiring two assistants to help you and your friends carry the equipment? Justify your answers.

N–Q.2★; N–Q.3★; A–CED.1★ • Number and QuantityCreating Linear Equations in One Variable
NAME:
11© Walch Education CCSS Problem-Based Tasks for Mathematics I
Problem-Based Task: Rafting and Hiking Trip
Coaching a. If the rafting trip covers a distance of 60 miles and you are expected to raft 8 hours each day,
how many miles must you raft each hour?
What is the ratio of miles to days?
What is the ratio you are looking for?
What is the ratio of days to hours?
How do you convert the original ratio of miles to days into miles per hour?
b. How many miles will your group be hiking?
What is the equation of the cost of hiring an assistant?
What is the solution to this equation?
c. Is it worth hiring two assistants to help you and your friends carry the equipment?
How much weight will each of you carry without assistants?
How much weight will each of you carry with two assistants?
What is the difference in the cost per day?
Are you willing to pay more money to have someone carry your equipment?

N–Q.2★; N–Q.3★; A–CED.1★ • Number and QuantityCreating Linear Equations in One Variable
Instruction
12© Walch EducationCCSS Problem-Based Tasks for Mathematics I
Problem-Based Task: Rafting and Hiking Trip
Coaching Sample Responsesa. If the rafting trip covers a distance of 60 miles and you are expected to raft 8 hours each day,
how many miles must you raft each hour?
What is the ratio of miles to days?60miles
2 days
What is the ratio you are looking for?miles
hour
What is the ratio of days to hours?1 day
8 hours
How do you convert the original ratio of miles to days into miles per hour?
Multiply the two numeric ratios together.
60miles
2 days•1 day
8 hours=60miles
16 hours= 3.75miles/hour
b. How many miles will your group be hiking?
What is the equation of the cost of hiring an assistant?
22x + 50 = 512, where x = miles
What is the solution to this equation?
x = 21 miles
c. Is it worth hiring two assistants to help you and your friends carry the equipment?
How much weight will each of you carry without assistants?
Each person will carry 35 pounds. There are 5 people.
35 × 5 = 175 pounds
How much weight will each of you carry with two assistants?

N–Q.2★; N–Q.3★; A–CED.1★ • Number and QuantityCreating Linear Equations in One Variable
Instruction
13© Walch Education CCSS Problem-Based Tasks for Mathematics I
First, determine how much less there would be to carry among the 5 of you with two assistants who each carry 50 pounds.
175 – 2(50) = 175 – 100 = 75 pounds
Now, divide 75 pounds by 5 people.
75
515 pounds=
35 – 15 = 20
If you hire assistants, each of you will carry 15 pounds, which is 20 pounds less than the original amount.
What is the difference in the cost per day?
First, determine the cost for 2 assistants if each will be paid $512.
2(512) = 1024
The cost is $1,024 for 2 assistants.
Next, determine the cost per person.
$1024
5 people$204.80/ person=
The difference is $204.80 per person or almost $205 per person.
Are you willing to pay more money to have someone carry your equipment?
Answers will vary, but should reflect and be justified by students’ calculations. Sample answer: I am willing to pay about an extra $205 to be free of 20 pounds of equipment during my 21-mile hike, so that I can enjoy my experience without being weighed down.