Embed Size (px)
Citation preview


Table of Contents I. Report to Shareholders ............................................................................................................... 01 II. Company profiles ....................................................................................................................... 04 1. Date of incorporation ............................................................................................................ 04 2. Company history ................................................................................................................... 04 III. Corporate governance report .................................................................................................. 10 1. Organization .......................................................................................................................... 10 2. Information regarding directors, supervisors, management team, and branch
Managers ............................................................................................................................. 13 3. Corporate governance practices and status of compliance .................................................... 26 4. Independent auditor fee ......................................................................................................... 51 5. Change in status of independent auditors .............................................................................. 51 6. Disclosure of any instance of a company chairman, president, and finance or
accounting manager having held a position in the independent auditing firm or its affiliates over the past year ............................................................................................... 51
7. Change in shares held and pledged by directors, supervisors, managers, and major shareholders holding over 10% of outstanding shares in the most recent year and up to the publication of the annual report ..................................................................................... 52
8. Information regarding related parties as defined by SFA No. 6 among top 10 shareholders,their spouses, and second degree or closer blood relatives .......................... 53
9. The shares of the transfer-invested company held by the Company, the directors, supervisors, managers, and the directly or indirectly controlled invested companies, and the aggregated shareholding ................................................................................................ 54
IV. Financing Status ........................................................................................................................ 56 1. Capital and shareholding ....................................................................................................... 56 2. Status of corporate bonds ...................................................................................................... 62 3. Preferred shares ..................................................................................................................... 62 4. Global depository receipts (GDRs) ....................................................................................... 62 5. Employee stock options ........................................................................................................ 63 6. Restricted Employee Shares .................................................................................................. 64
7. Shares issuance for mergers and acquisitions (M&A) .......................................................... 64 8. Implementation of capital expenditure plans ........................................................................ 64 V. Operational Highlights ............................................................................................................... 65 1. Business Activities ................................................................................................................ 65 2.Market,production,and sales overview ................................................................................... 74 3. Employee demographics ....................................................................................................... 86 4. Environmental protection expenditures ................................................................................ 86 5. Labor relations ....................................................................................................................... 91 6. Major contracts ...................................................................................................................... 97

VI. Financial Information............................................................................................................... 98 1. Five–year condensed balance sheet and income statement ................................................... 98 2. Five-year financial analysis ................................................................................................. 103 3. Supervisor’s Audit Report in the most recent year ............................................................. 108 4. Financial Statements in the most recent year ...................................................................... 111 5.Audited consolidated financial statements in the most recent year ..................................... 187 6. Advantech and the affiliated companies must have the impact of financial difficulties on
the financial status detailed, if there is any, in the most recent year and up to the publication of the annual report ................................................................................................................ 282
VII. Financial Status, Operating Results, and Risk Management............................................ 283 1. Financial status .................................................................................................................... 283 2.Unconsolidated ..................................................................................................................... 284 3. Cash flow ............................................................................................................................. 285 4. Impact of major capital expenditures on financial business in the most recent year .......... 286
5. Transfer-investment policy, root cause of profit or loss, improvement plans, and investmentplans in the coming year .................................................................................... 286
6. Analysis and assessment of risk-related issues ................................................................... 286 7. Other significant events ....................................................................................................... 289 VIII. Special Notes ......................................................................................................................... 290 1. Information on the Company’s affiliates ............................................................................. 290 2. Private placement of securities in the most recent year and up to the publication of the
annual report ........................................................................................................................ 297 3. Shares of the Company held or disposed of by subsidiaries in the most recent year and up
to the publication of the annual report ............................................................................ 297 4. Other supplementary information or explanations .............................................................. 297 IX. Significant issues in the most recent year and up to the publication of the annual
reportwhich might affect shareholders’ equity or price of shares pursuant to Item 2,Paragraph 3, Article 36 of the Securities Exchange Law ................................................ 297

1
Letter to Shareholders
Dear Shareholders,
2015 Summary of Results
In 2015, Advantech reported consolidated revenues of NT$ 38 billion, an increase of six percent
over the NT$35 billion of 2014. Net income was NT$5.13 billion and diluted earnings per share
were NT$8.08. Gross profit margin was 40.4 percent, compared with 40.3 percent in 2014, and
operating profit margin was 15.6 percent compared with 15.4 percent a year earlier. Net profit
margin was 13.49 percent, a decrease of 0.31 percentage points from the previous year’s 13.8
percent.
Our Vision for IoT
As the industrial PC and intelligent system leader, Advantech has experienced increasing demand
from the Internet of Things (IoT) industry over the past few years, and envisions that IoT may
drive the next 15 years growth for the industry. According to a report published by McKinsey
Global Institute in June 2015, IoT may create a US$ 4~11 trillion economic impact in 2025. In
addition, applications related to smart factories and smart cities may create a US$2~5 trillion
economic impact in 2025. Although IoT is still in the early stage, Advantech believe its
tremendous economic impact will change the direction of the Information Technology Industry
over the next 20 years. At the same time, both startup companies and existing technology
enterprises will invest and develop their business models and technology to catch up IoT
tremendous business opportunities. Advantech, as the leading intelligent system platform provider,
will play a major part in this ecosystem.
Opportunities always come with challenges. We aim to provide differentiated services to create
greater customer value. Given this standpoint, we are developing a new software platform,
WISE-PaaS, and we are cooperating with cross-sector partners to form a vertical market IoT
ecosystem. Internal incubation and external investment are critical in the process to build the SRP
(Solution Ready Platform) services and to strength our leadership in the IoT industry.
Advantech’s Key Strategies to Achieve 2020 Vision
SRP and Differentiated Value-added Services. Advantech designed the WISE-PaaS
platform to fulfill the needs of the IoT industry. Especially, PaaS (Platform as a Service) will
form the key element that accelerates the deployment of Smart City and IoT industry
solutions in Taiwan; this will be Advantech’s investment focus. We will employ a PaaS

2
“sharing economy” strategy to accelerate the development of the IoT industry, and we hope
to deploy value-added software as a PaaS building block provider. Furthermore, SRP, a
collection of IoT software API’s designed for system integrators, will be a key element for
Advantech to provide differentiated value-added services to our customers.
Cross-sector Alliance to Form Vertical Market IoT Ecosystem. Advantech has
positioned itself as the accelerator of the intelligent planet since 2010, and has consistently
created great value for its customers for the past three decades. IoT applications provide
tremendous business opportunities. At the same time, challenges also face system integrators.
A common difficulty is that system integrators cannot find the right partner to consolidate all
the intelligent systems into a total IoT solution. Given this, Advantech transformed its
business model from product-oriented to vertical market solution-oriented. We now focus on
selective vertical markets such as smart hospitals, smart retail, digital logistics & fleet
management, and smart buildings—where Advantech is in good position and has great
potential.
Internal Incubation and External Investment. Looking forward, incubation and
investment will play important roles to facilitate the IoT penetration and strengthen
Advantech’s leadership. Incubation combines internal technology development and external
collaboration. Investment includes IoT accelerator and M&A. In November 2015, we
announced the 100% acquisition stake of B+B SmartWorx, with a US$99.85mn transaction
price. The deal was successfully closed in January, 2016 and we will fully consolidate B+B
SmartWorx in 2016. Thanks to B+B SmartWorx, Advantech will have a stronger position in
the industrial communication sector. At the same time, B+B SmartWorx will also help us to
reach out to new customers, and thereby speed up global market expansion.
2016 Outlook
Advantech reported record high revenues and net income in 2015. However, the growth rate did
not reach our original goal due to the weakening global macro situation and increasing currency
risks in the second half of 2015. Looking forward in 2016, Advantech expects to achieve its
profitable revenues growth target on the back of the increasing penetration of IoT adoption, our
leadership in intelligent systems, and our differentiated value-added services, which should reduce
the uncertainty from macro-economic impacts.
Strengthening Corporate Governance and Business Leadership
Advantech expects to strengthen its execution of good corporate governance and actively
participate in corporate governance evaluation. Our goal is the pursuit of excellence and

3
sustainable operation and Advantech has established its altruistic spirit at the core of its business
culture, along with the pursuit of the best and balanced interests of society, shareholders,
customers, and employees. K.C. Liu Chairman and CEO of Advantech Co., Ltd.

4
II. Company Profile 1. Date of incorporation: September 7, 1981 2. Company history
Year Important Events 1981 Decided the official company name as “Advantech Co., Ltd.” and established
at Sec. 2, Chongqing S. Road, Taipei City to operate the business of Desktop computer module measurement automation system. Invested a capital stock of NT$2,000 thousand.
1985 Increased the authorized and paid-in capital to NT$5,000 thousand. Reorganized the Company as a company limited and relocated it to the address at 3F, No. 80, Ningbo W. Street, Taipei City. Launched various standardized PC-Based Automatic Test System products.
1987 Relocated to the address at 2F-1, No. 76, Sec 3, Roosevelt Rd., Taipei City. Developed and produced PC/XT/AT Plug-in Data Acquisition Card (known as “PC-Lab Card Series”) and launched domestically and internationally.
1989 Established Xindian factory at 4F, No. 10/12, Lane 130, Xindian City, Minquan Road, Taipei County. Implemented industrial computer (IPC) product line with smooth production and sales arranged successfully and became the second main product line other than PC-LabCard.
1990 Increased the authorized and paid-in capital to NT$25,000 thousand. Except for the factory, relocated all departments to the office at 4F, No. 108-3, Minquan Road, Taipei County.
1991 Increased the authorized and paid-in capital to NT$60,000 thousand. Integrated the in-house developed industrial-grade CPU Card and IPC Chassis into a complete industrial-grade PC. Offered a complete line of products to become a comprehensive PC system component supplier for industrial automation applications and formed an international recognition gradually.
1992 Introduced Industrial Workstation (industrial monitoring workstation) product series. Successful developed ADAM-4000 Series Remote Data Acquisition Module that became a breakthrough product of distal measurement signal processing and communication.
1993 Awarded with the 2nd National Award of Small & Medium Enterprise by National Association of Small & Medium Enterprise and received ISO-9001 Quality Management System Certification. Developed AWS-850/860-II Industrial PC Workstation.
1994 Increased the authorized and paid-in capital to NT$120,000 thousand. Founded Advantech Germany with 100% equity acquired. Developed overseas sales offices. Cooperated with ITRI MIRL to introduce PC and industrial controllers andMotionControl Card.
5
Developed the embedded computer modules series. 1995 Increased the authorized and paid-in capital to NT$190,000 thousand.
Established Global Branch Offices – Singapore with 100% equity acquired. Established Global Branch Offices - Budapest, Hungary with 30% equity acquired.
1996 Awarded with the 4th Award for Industrial Technology Advancement Outstanding Award, the MOEA, Taiwan, ROC Established the QA laboratory to significantly improve product quality. Symbol of Excellence Winner for ADAM-4000 Series, the MOEA, Taiwan, ROC
1997 Approved for public offering. Increased the authorized capital to NT$1,000,000 thousand and the paid-in capital to NT$475,000 thousand. Established an audit office and internal control and internal audit system. Established subsidiaries in Japan, UK, and France with 100% equity acquired.Merged the US subsidiary with 72.03% equity acquired. Awarded with the 5th Award for Industrial Technology Advancement Most Outstanding Award, the MOEA, Taiwan, ROC Symbol of Excellence Winner for PPC-102 series, the MOEA, Taiwan, ROC
1998 Increased the paid-in capital to NT$807,500 thousand. Established subsidiaries in the Netherlands, Germany, and the Virgin Islands with 100% equity acquired. Established a joint venture in Italy with 25% equity acquired. The equity of the US subsidiary was increased from 72.03% to 100%. Purchased 834-ping land in Neihu. PPC-102T Panel Computer received the 6th Gold National Award of Excellence, Taiwan, ROC The 7th Symbol of Excellence Winner for PPC-140T Multi-Function Panel PC, Taiwan, ROC PPC-140T Multi-Function Panel PC received the “Singapore Comdex Asia Best Hardware System Award.” Symbol of Excellence Winner for ADAM-5000 Series Distributed DA & C System, Taiwan, ROC Received ISO-14001 Environmental Management System Certification. Awarded with the Most Representative Outstanding Company by Industrial Development Bureau, MOEA, Taiwan, ROC
1999 ADAM Series received the 1st Outstanding Safety Instrument Award of Taiwan.Constructed Advantech Neihu Technology Building that was expected to be completed in the mid-2001. The paid-in capital was increased to NT$1,307,000 thousand. Purchased 2,147-ping land in Donghu and was stationed by the end of September. Completed IPO on Taiwan Stock Exchange on 12/13.
2000 Increased the paid-in capital to NT$1,745,000 thousand. Purchased additional 1,445-ping land at Donghu Plant. Merged PCS for an amount of US$1.77 million. Established the invested companies of Advantech Investment, Advantech (Guangzhou Bond Zone) Co., ABR, AAC (BVI), AACB, APN, and AKL. Awarded with the 2000 Outstanding Export & Import Performance Award by General Chamber of Commerce of the Republic of China

6
2001 Increased the paid-in capital to NT$2,334,294 thousand. Moved into Advantech Headquarters in Neihu District, Taipei in July 2001. Established AHK and AKMC and invested in AAU. Symbol of Excellence Winner for WEB-2143 Web Controller, Taiwan, ROC Symbol of Excellence Winner for EH-760 Home Terminal, Taiwan, ROC Symbol of Excellence Winner for ES-510 Multimedia Web Payphone, Taiwan, ROC Symbol of Excellence Winner for PPC-153T Panel Computer, Taiwan, ROC
2002 Increased the paid-in capital to NT$2,855,291 thousand. Established AASC and invested in ABB and Axiomtek Co., Ltd. Received the “2002 Headquarters Operation Certification” from the Industrial Development Bureau, MOEA. Implemented the “Innovation Center Operations Plan Embedded Systems R&D Center” with the approval of the Department of Industrial Technology, MOEA Accepted as the one and only Gold-Level Partner in Microsoft’s Windows Embedded Partner ODM Category. Symbol of Excellence Winner for EH-7102G/GH Home Appliance, Taiwan, ROC Symbol of Excellence Winner for WebLink2059-BAR/CE/SDA/SKT Web-enabled Device Connection with PC Card, Taiwan, ROC
2003 Increase the paid-in capital to NT$3,413,039 thousand. Established AEU and invested in Advantech Consulting Co., Ltd. Received the “2003 Headquarters Operation Certification” from the Industrial Development Bureau, MOEA. Symbol of Excellence Winner for ADAM-6000 Series of Intelligent data collection network control module, Taiwan, ROC
2004 Increased the paid-in capital to NT$3,742,962 thousand. Won the 2004 Control Design Reader’s Choice Award for “Single Board PC” First Prize. FPM-3170 17” Flat Panel Monitor received “2004 Editor’s Choice Award” First Prize under Human Machine Interface (HMI) category from Control Engineering Magazine (USA).
2005 Increased the paid-in capital to NT$4,489,003 thousand. Formed strategic alliance with AsusTek to acquire 1.36% equity of AsusTek and AsusTek acquired 15% equity of Advantech through stock swap. The 2005 Symbol of Excellence Winner for TPC-60S, UNO-3062, and AWS-8100G, Taiwan, ROC Received the 2005 Readers’ Choice Award for the 3rd prize of Industrial Computer from Control’s Buyer’s Guide, USA Embedded Control Europe (ECE) magazine readers nominated TREK-755 Sunlight Readable Model for Gold Award of the 13th MOEA “Industrial Technology Advancement Award of Excellence.”
2006 Increased the paid-in capital to NT$4,636,295 thousand. Received Readers’ Choice Award for Single Board Computer from Control Designer Magazine, USA Advantech received the 2nd “Corporate Social Responsibility Award” from Global Views Magazine, Taiwan, ROC

7
Advantech received Microsoft’s “The Most Growth Award in Asia Award.” Advantech awarded by Intel with the “Intel Associate Partner of the Year” and “Multi-Core Solution Contest Award.”
2007 Increased the paid-in capital to NT$4,915,770 thousand. Advantech received the 3rd “Corporate Social Responsibility Award, Top Honor” in 2006 from Global Views Magazine, Taiwan, ROC Advantech received the 1st “Corporate Social Responsibility Award from Commonwealth Magazine, Taiwan, ROC ARK-3381 received Computex Taipei Best Choice Award. The 15th Symbol of Excellence Winner for UibQ-230/ARK-4170/ADAM-5550KW, Taiwan, ROC with the right to use the Symbol of Excellence lawfully.
2008 2009 2010 2011
Increased the paid-in capital to NT$5,113,458 thousand. Advantech received the 4th prize of the 2nd “Corporate Social Responsibility Award” from Commonwealth Magazine, Taiwan, ROC The 16th Symbol of Excellence Winner for UbiQ350 / VITA350 / UNO-2182 / TPC-30T / TPC-32T / IPPC-7157A/IPPC-7158B, Taiwan, ROC with the right to use the Symbol of Excellence lawfully. Increased the paid-in capital to NT$5,161,337 thousand. Established Shanghai Advantech Intelligent Services Co., Ltd. (AiSC). Established Xi’An Advantech Software Co., Ltd. Acquired Advantech Yang-Kwong Building as office building in Neihu, Taipei City. Increased the paid-in capital to NT$5,161,337 thousand. Awarded by Chinagkong with the “Decade Industrial Contribution” and “Decade Leading Industry.” The 18th Symbol of Excellence Winner for IPPC-8151S/APAX-5000 series / UNO-1100 series / UTC-W101E/ NCP-7560/MIC-5322, Taiwan, ROC with the right to use the Symbol of Excellence lawfully. Advantech and the US subsidiary jointly acquired 60% equity of Advantech Brazil S/A (ABR). Advantech Co., Ltd. established Advantech Intelligent Co., Ltd. Decreased the paid-in capital to NT$5,016,337 thousand. Awarded with the “Taiwan Top 12 Global Brands” Award. Advantech paid EUR12.85 million to acquire 100% equity of DLoG GmbH Company of Augusta Technologies AG. Advantech paid 2,668 million Korean Won to acquire 100% equity of Advantech KR Co., Ltd. of SG Advantech Co., Ltd. Advantech paid £3.34 million to acquire 100% equity of Innocore Gaming Ltd. Increased the paid-in capital to NT$5,517,971 thousand.

8
2012 2013 2014
Advantech paid NT$93 million to acquire 99.36% equity of ACA. The 19th Symbol of Excellence Winner for ARK-VH200/ FWA-6500/ NCP-5260/ PC/104 / PCM 9562/PIT-1501W/ SOM-5788/ Advantech Touch Panel Computer / TREK-550, Taiwan, ROC with the right to use the Symbol of Excellence lawfully. Awarded with the “Taiwan Top 10 Global Brands Award.” Increased the paid-in capital to NT$5,639,971 thousand. Advantech paid NT$306 million to acquire 50% equity of Advansus Corp. The 20th Symbol of Excellence Winner for TREK-753/ FPM-8151H/ ADAM-6117/ ADAM-6118/ ADAM-6150/ADAM-6151/ ADAM-6156/ ADAM-6160/ SOM-7562/ MIO-5270/ MIO-2260/ PCM-3363/ AIMB-213/ UNO-4600 Series/ ITM-5115R-PA1E/ ARK-DS220/ ARK-DS520/ IPC-6025, Taiwan, ROC with the right to use the Symbol of Excellence lawfully. Ranked the 11th place among the Taiwan Top-20 Global Brand Award in 2012 with a brand value of US$260 million. Established India subsidiary (AIN). Increased the paid-in capital to NT$5,652,059 thousand. Awarded with the 11th place of the “2012 Corporate Citizen Award” by Commonwealth Magazine. Advantech Industrial Automation Group - Human Machine Interfaces (HMI) TPC and SPC series won Germany iF product design award in 2013. The 21st Symbol of Excellence Winner for FWA-6510/MIC-5332/ATCA-7310/MIO-5250/MIO-2261/ PCM-9389/ARK-1120/ARK-DS262/ARK-DS762/UBC-D31/ IDS-3115/IDK-2131/TREK-722/TPC-671/1071/1271/1571/ WebOP/BEMG-4110/4220/ADAM-2000/EKI-6340, Taiwan, ROC with the right to use the Symbol of Excellence lawfully. Advantech paid NT$319 million to acquire 70.2% equity of POS maker AdvanPOS. Advantech paid NT$730 million to acquire 100% equity of the professional controller manufacturer LNC. Advantech paid £5.85 million to acquire 100% equity of the wisdom embedded displays manufacturer GPEG in UK. Increased the paid-in capital to NT$5,714,511 thousand. Advantech established Advantech Plus Technology Center (A+TC), Kunshan, China. Grand Opening of Advantech Linkou IoT Campus. Advantech received the CSR Best Workplace Excellent Award from Global Views Monthly in 2014. The 22nd Symbol of Excellence Winner for 16 products, including CGS-6000/ ATCA-9112/ Advantech WebAccess/ APAX-5620/ IDK-2110/TPC-1840WP /
9
2015 2016
TPC-2140WP/SPC-1840WP/FPM-7181W/FPM-7211W/ADAM-6200 Series/EKI-3000 series /SOM-5894/ARK-1122F/UBC-200/ SOM-7567/ SOM-3565/ MIC-5333/ AMiS-50/POC-W181/IPS-M420, Taiwan, ROC with the right to use the Symbol of Excellence lawfully. Formally established “Advantech Investment” Department within the organization to actively deploy smart city and Internet of Things (IoT) market.Composed Advantech Global smart city case studies for the publication of “Smart City” in the versions of Simplified Chinese and Traditional Chinese. Composed Advantech Global smart city case studies for the publication of “Smart City” in English. Increased the paid-in capital to NT$6,318,531 thousand The 23rd Symbol of Excellence Winner for 19 products, including TREK-674& TREK-306/PWS-870/UTX-3115/DPX-435(with DPX-S1000 chassis)/SOM-5893/SOM-6896/UBC-220/PCIE-181X/ Mic-3100/ARK-2151V/DS-862/MIT-M101/ATCA-9223/EKI-9778/ UNO-2000 Series/IDS-3121W/WebAccess 8.0/Pocket Pad/ARK-5261, Taiwan, ROC with the right to use the Symbol of Excellence lawfully. MIT-M101 / MICA-071 were nominated for the 23rd “Symbol of Excellence” Award gold and silver medal prize. There are 23 products, including ASR-3100/ POC-W242/ TREK-733L/ TREK-973/ DPX-E135/ MIO-3260/ EKI 5 series/ SOM-7568/ TPC/ WISE4 series / WISE-3100/ ARS-2510/ UNO-3483G/TREK-773/ ITA-2230/ROM-7421/IDS-3118W/ AIMB-T1215/ DS-270/APAX-5580/ ARK-2230/ UNO 1 series / IPS-M420S awarded with the 24th “Taiwan Excellence Award” and are entitled to use the “Taiwan Excellence Award Symbol” legally, of which, REK-773 is nominated for the “Taiwan Excellence Award” Gold/Silver Medal. PWS-870 was awarded with the 2016 iF product design award in Germany. Advantech Co., Ltd. has a strategic alliance agreement signed with Inventec Corporation to establish the joint venture company “AIMobile Co., Ltd.” Advantech Linkou Industrial Park Stage II construction will be completed at the end of August officially. The ADVANTECH and its America subsidiary acquired 100% stock right of B+B SmartWorx, Inc. from Graham Partners with US$9.985 million. The ATC (HK) purchased 100% stock right of Yeh Chiang (Kunshan) Co., Ltd. from Yeh Chiang Technology (Cayman) Corp. with RMB$9.35 million.

- 10 -
III. Corporate Government Report I. Organization
(1)Structure
CEO/President
Internal Auditing
Infrastructure
Corporate Quality
Business Planning & Analysis
Human Resource
IT
Brand Development & Public Relations
CSR
Finance
Manufacturing Legal
Procurement
Board of Directors
Shareholders
Greater China North America Europe Pan Intercon North Asia
Global Service
CTO Office
Compensation Committee
Manufacturing Strategic Business Group
Regional Business Units
Intelligent Autom
ation Group
Netw
orks and Com
munications
Group
Intelligent System G
roup
iConnectivity G
roup
Embedded C
ore Group
Applied C
omputing G
roup
Service Autom
ation Group
iAutom
ation Systems &
Solutions G
roup
Corporate Investment
OMCC

- 11 -
(2)Responsibilities major functions
Main Department Main Responsibilities
Internal Auditing Review and evaluate the viability and effectiveness of internal control system and process; propose evaluation results and suggestions to ensure the soundness of corporate governance.
Legal 1. Review contracts and agreements 2. Handle company’s lawsuits and disputes 3. Provide internal legal trainings and legal opinions
Finance
1. Responsible for budgeting, accounting, financial report, variance analysis; planning, management and control of tax administration, finance, and stock affairs.
2. Domestic and oversea financial statement preparation and analysis. 3. Operating performance of oversea investment 4. Cash flow management
Business Planning & Analysis
1. Annual business planning, projects implementation and goals setting. 2. Investment and affiliated companies management.
Human Resource
1. Work with business leaders to develop and execute human resources strategies. 2. Enhance employee satisfaction and employer brand. 3. Setting human resources policies and compensation structure; develop and execute talent recruiting, training and empowerment. 4. Develop employees’ core competencies.
IT 1. Information technology execution and management. 2. Crucial technology implementation and professional technical services.
Brand Development & Public Relations
1. Global branding promotion and company identity system. 2. Global branding marketing campaigns coordination and related marketing collaterals production. 3. Company’s public relations.
CSR Focus on “Enterprise-academic Collaboration”, “Social care” and “employee care” to contribute to the society.
CTO Office Manage innovation platform, build shared software and hardware development system, and develop core modules; Manage IPDM process and provide industrial design services.
Global Service Provide one-stop global services and total solutions, including design, manufacture, quality management, procurement, logistics, assembly, repair and maintenance.
Corporate Quality
1. Coordinate with related department, including RD, manufacturing, sales and after services, to ensure and enhance product quality, monitor and prevent major quality deviation.
2. Develop and implement company quality assurance system, to meet and satisfy clientsand ISO requirements. 3. Control design process control and assure design quality in product development phase. 4. Ensure appliance of applied product regulations, and calibration process. 5. Monitor and enhance quality of products of factory and supply chains. 6. Plan and implement client services, and establish global services strategies to provide real-time service.
Procurement 1. Negotiate and purchase required components and equipment . 2. Develop new vendors of components and equipment in response to rapid changing
technology evolution.
- 12 -
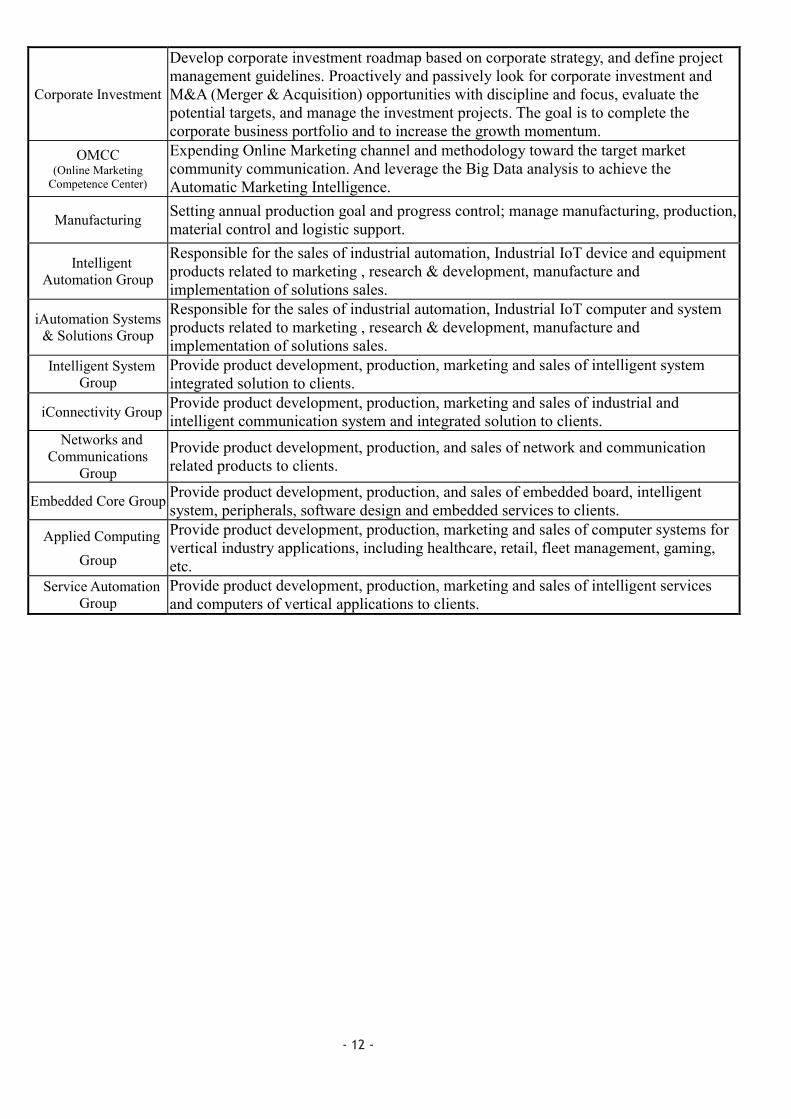
Corporate Investment
Develop corporate investment roadmap based on corporate strategy, and define project management guidelines. Proactively and passively look for corporate investment and M&A (Merger & Acquisition) opportunities with discipline and focus, evaluate the potential targets, and manage the investment projects. The goal is to complete the corporate business portfolio and to increase the growth momentum.
OMCC (Online Marketing
Competence Center)
Expending Online Marketing channel and methodology toward the target market community communication. And leverage the Big Data analysis to achieve the Automatic Marketing Intelligence.
Manufacturing Setting annual production goal and progress control; manage manufacturing, production, material control and logistic support.
Intelligent Automation Group
Responsible for the sales of industrial automation, Industrial IoT device and equipment products related to marketing , research & development, manufacture and implementation of solutions sales.
iAutomation Systems & Solutions Group
Responsible for the sales of industrial automation, Industrial IoT computer and system products related to marketing , research & development, manufacture and implementation of solutions sales.
Intelligent System Group
Provide product development, production, marketing and sales of intelligent system integrated solution to clients.
iConnectivity Group Provide product development, production, marketing and sales of industrial and intelligent communication system and integrated solution to clients.
Networks and Communications
Group
Provide product development, production, and sales of network and communication related products to clients.
Embedded Core Group Provide product development, production, and sales of embedded board, intelligent system, peripherals, software design and embedded services to clients.
Applied Computing Group
Provide product development, production, marketing and sales of computer systems for vertical industry applications, including healthcare, retail, fleet management, gaming, etc.
Service Automation Group
Provide product development, production, marketing and sales of intelligent services and computers of vertical applications to clients.

13
II、
Info
rmat
ion
rega
rdin
g di
rect
ors,
supe
rvis
ors,
man
agem
ent t
eam
and
bra
nch
man
ager
s (
1)In
form
atio
n re
gard
ing
dire
ctor
s and
supe
rvis
ors
Info
rmat
ion
rega
rdin
g di
rect
ors a
nd su
perv
isor
s M
arch
27,
201
6
Title
N
atio
nalit
y N
ame
Dat
e el
ecte
d
(take
n of
fice)
Term
of
offic
e
Firs
t ele
cted
Sh
areh
oldi
ng w
hen
elec
ted
Cur
rent
shar
ehol
ding
Sp
ouse
and
m
inor
ch
ildre
n’s c
urre
nt
shar
ehol
ding
s
Shar
ehol
ding
by
nom
inee
arr
ange
men
tEd
ucat
ion
and
sele
cted
pas
t pos
ition
s C
urre
nt
addi
tiona
l po
sitio
ns
Oth
er h
eads
, dire
ctor
s, or
su
perv
isors
as s
pous
e or
kin
w
ithin
the
seco
nd d
egre
e
Shar
es
%
Shar
es
%
Shar
es
%
Shar
es
%
Title
N
ame
Rel
atio
nshi
p
Cha
irman
R
OC
K
.C. L
iu
06.18
.2014
3 y
ears
11.11.
1985
21
,185,8
97
3.71
23,29
2,484
3.69
1,197
,672
0.19
00
Foun
der o
f Adv
ante
ch:
Form
er sa
lesm
an o
f Ins
trum
ents
Dep
t. of
H
ewle
tt-Pa
ckar
d; B
ache
lor o
f Dep
artm
ent o
f Te
leco
mm
unic
atio
ns E
ngin
eerin
g, J
iaot
ong
Uni
vers
ity
Exec
utiv
e &
Not
e 1
Non
e N
one
Non
e
Dire
ctor
R
OC
Adv
ante
ch F
ound
atio
n.
06.18
.2014
3 y
ears
06.18
.2014
16
,594,8
102.9
018
,244,8
892.8
9 0
00
0Pr
esid
ent o
f Gre
ater
Chi
na o
f 3M
N
one
Non
e N
one
Non
e
Rep
rese
ntat
ive
Don
ald
Cha
ng
0
00
0 0
00
0
Dire
ctor
R
OC
Ted
Hsu
06
.18.20
14
3 year
s 05
.25.20
11 0
00
0 0
00
0Pr
esid
ent o
f Asu
s Com
pute
r D
epar
tmen
t of E
lect
rical
Eng
inee
ring,
Nat
iona
l Ta
iwan
Uni
vers
ity
Not
e 2
Non
e N
one
Non
e
Inde
pend
ent
dire
ctor
RO
C
Jeff
Che
n 06
.18.20
14
3 year
s 06
.18.20
14
00
00
00
00
VP
of S
tanl
ey B
lack
& D
ecke
r and
Pre
siden
t of
Asi
a R
egio
n
Non
e N
one
Non
e N
one
Inde
pend
ent
dire
ctor
RO
C
Jose
ph Y
u 06
.18.20
14
3 year
s 05
.25.20
11 22
70
249
0 0
00
0Ph
D o
f Bus
ines
s Adm
inist
ratio
n, U
nive
rsity
of
Mic
higa
n Pr
ofes
sor,
Dep
artm
ent o
f Bus
ines
s A
dmin
istra
tion,
Nat
iona
l Che
ngch
i Uni
vers
ity
Not
e 3
Non
e N
one
Non
e
Supe
rviso
r R
OC
AID
C In
vest
men
t Coo
rp.
06.18
.2014
3 y
ears
06.18
.2014
67
,886,1
1311.
8874
,636,2
6611.
81
00
00
Form
er F
inan
ce O
ffice
r of T
SMC
; Fi
nanc
e O
ffice
r of F
oxco
nn E
lect
roni
cs
Uni
vers
ity o
f Mis
sour
i – C
olum
bia,
MB
A
Not
e 4
Non
e N
one
Non
e
Rep
rese
ntat
ive
Gar
y Ts
eng
00
172,3
260.0
3 0
00
0
Supe
rviso
r R
OC
Thom
as C
hen
06.18
.2014
3 y
ears
06.18
.2014
53
7,516
0.09
561,9
630.0
9 0
00
0Fo
rmer
Pre
siden
t of A
dvan
tech
, USA
; In
dian
a U
nive
rsity
MB
A
Not
e 5
Non
e N
one
Non
e
Supe
rviso
r R
OC
Jam
es W
u 06
.18.20
14
3 year
s 05
.24.20
05
00
00
00
00
Cha
irman
of K
PMG
B
ache
lor o
f Law
, Dep
artm
ent o
f Eco
nom
ics,
Nat
iona
l Chu
ng H
sing
Uni
vers
ity
Not
e 6
Non
e N
one
Non
e
Not
e 1:
Sim
ulta
neou
sly
act a
s the
cha
irm
an o
f the
follo
win
g co
mpa
nies
: A
dvan
tech
Fou
ndat
ion、
Bei
jing
Yan
Hua
Xin
g Ye
Ele
ctro
nic
Scie
nce
& T
echn
olog
y C
o., L
td. (
AC
N)、
Adv
ante
ch In
vest
men
t Fun
d-A
Co.
, Ltd
. Rep
rese
ntat
ive、
Adv
anix
s Cor
pora
tion.
Rep
rese
ntat
ive.、
Adv
ante
ch T
echn
olog
y (C
hina
) Com
pany
Ltd
. (A
KM
C)、
Shan
ghai
Adv
ante
ch In
telli
gent
Ser
vice
s Co.
, Ltd
. (A
iSC
)、X
i’an
Adv
ante
ch S
oftw
are
Ltd.
(AX
A)、
Adv
ante
ch In
telli
gent
Ser
vice
(AiS
T) R
epre
sent
ativ
e、A
CA
Dig
ital C
orpo
ratio
n (A
CA
) Rep
rese
ntat
ive、
K&
M
Imve
stm
ent C
o.,L
td.、
Adv
anPO
S Te
chno
logy
Co.
, Ltd
. (A
dvan
POS)
Rep
rese
ntat
ive、
Adv
ante
ch-L
NC
Tec
hnol
ogy
Co.
, Ltd
. (A
LTC
) Rep
rese
ntat
ive、
Adv
ante
ch Ja
pan
Co.
, Ltd
. (A
JP)。
Adv
ante
ch F
ound
atio
n, A
CN
, Leg
al re
pres
enta
tive
of A
dvan
tech
Inve
stm
ent C
o., L
td.,
Lega
l rep
rese
ntat
ive
of A
dvan
sus
Cor
p., A
KM
C, A
iSC
, Xi’A
n A
dvan
tech
Sof
twar
e C
o., L
td.,
Lega
l rep
rese
ntat
ive
of A
dvan
tech
Inte
llige
nt C
o., L
td.,
Lega
l rep
rese
ntat
ive
of A
CA
, CoC
hen
Inve
stm
ent C
o., L
td.,
Lega
l rep
rese
ntat
ive
of A
dvan
POS
Co.
, Ltd
., Le
gal r
epre
sent
ativ
e of
LN
C, a
nd A
dvan
tech
Japa
n C
o., L
td. (
AJP
)、B+B Smartworx Inc.
14
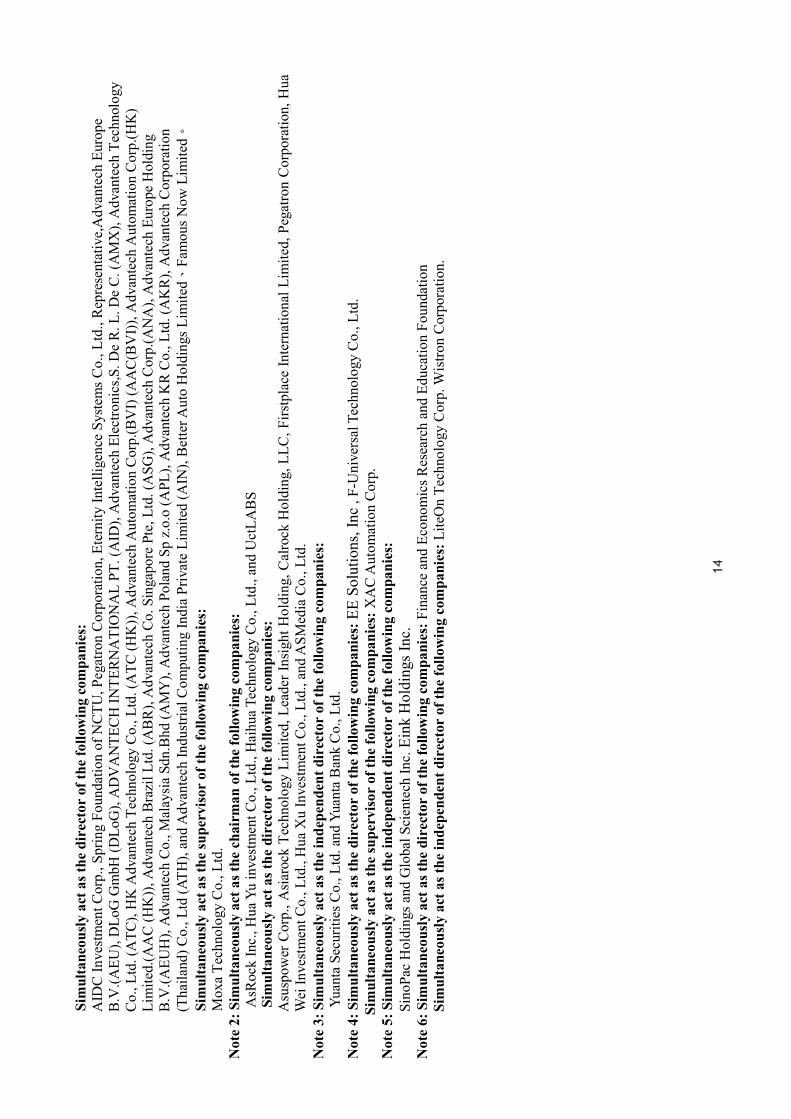
Sim
ulta
neou
sly
act a
s the
dir
ecto
r of
the
follo
win
g co
mpa
nies
: A
IDC
Inve
stm
ent C
orp.
, Spr
ing
Foun
datio
n of
NC
TU, P
egat
ron
Cor
pora
tion,
Ete
rnity
Inte
llige
nce
Syst
ems C
o., L
td.,
Rep
rese
ntat
ive,
Adv
ante
ch E
urop
e B
.V.(A
EU),
DLo
G G
mbH
(DLo
G),
AD
VA
NTE
CH
INTE
RN
ATI
ON
AL
PT. (
AID
), A
dvan
tech
Ele
ctro
nics
,S. D
e R
. L. D
e C
. (A
MX
), A
dvan
tech
Tec
hnol
ogy
Co.
, Ltd
. (A
TC),
HK
Adv
ante
ch T
echn
olog
y C
o., L
td. (
ATC
(HK
)), A
dvan
tech
Aut
omat
ion
Cor
p.(B
VI)
(AA
C(B
VI))
, Adv
ante
ch A
utom
atio
n C
orp.
(HK
) Li
mite
d.(A
AC
(HK
)), A
dvan
tech
Bra
zil L
td. (
AB
R),
Adv
ante
ch C
o. S
inga
pore
Pte
, Ltd
. (A
SG),
Adv
ante
ch C
orp.
(AN
A),
Adv
ante
ch E
urop
e H
oldi
ng
B.V
.(AEU
H),
Adv
ante
ch C
o., M
alay
sia
Sdn.
Bhd
(AM
Y),
Adv
ante
ch P
olan
d Sp
z.o
.o (A
PL),
Adv
ante
ch K
R C
o., L
td. (
AK
R), A
dvan
tech
Cor
pora
tion
(Tha
iland
) Co.
, Ltd
(ATH
), an
d A
dvan
tech
Indu
stria
l Com
putin
g In
dia
Priv
ate
Lim
ited
(AIN
), B
ette
r Aut
o H
oldi
ngs L
imite
d、Fa
mou
s Now
Lim
ited。
Si
mul
tane
ousl
y ac
t as t
he su
perv
isor
of t
he fo
llow
ing
com
pani
es:
Mox
a Te
chno
logy
Co.
, Ltd
. N
ote
2: S
imul
tane
ousl
y ac
t as t
he c
hair
man
of t
he fo
llow
ing
com
pani
es:
A
sRoc
k In
c., H
ua Y
u in
vest
men
t Co.
, Ltd
., H
aihu
a Te
chno
logy
Co.
, Ltd
., an
d U
ctLA
BS
S
imul
tane
ousl
y ac
t as t
he d
irec
tor
of th
e fo
llow
ing
com
pani
es:
Asu
spow
er C
orp.
, Asi
aroc
k Te
chno
logy
Lim
ited,
Lea
der I
nsig
ht H
oldi
ng, C
alro
ck H
oldi
ng, L
LC, F
irstp
lace
Inte
rnat
iona
l Lim
ited,
Peg
atro
n C
orpo
ratio
n, H
ua
Wei
Inve
stm
ent C
o., L
td.,
Hua
Xu
Inve
stm
ent C
o., L
td.,
and
ASM
edia
Co.
, Ltd
. N
ote
3: S
imul
tane
ousl
y ac
t as t
he in
depe
nden
t dir
ecto
r of
the
follo
win
g co
mpa
nies
:
Yua
nta
Secu
ritie
s Co.
, Ltd
. and
Yua
nta
Ban
k C
o., L
td.
Not
e 4:
Sim
ulta
neou
sly
act a
s the
dir
ecto
r of
the
follo
win
g co
mpa
nies
: EE
Solu
tions
, Inc
, F-
Uni
vers
al T
echn
olog
y C
o., L
td.
Sim
ulta
neou
sly
act a
s the
supe
rvis
or o
f the
follo
win
g co
mpa
nies
: XA
C A
utom
atio
n C
orp.
N
ote
5: S
imul
tane
ousl
y ac
t as t
he in
depe
nden
t dir
ecto
r of
the
follo
win
g co
mpa
nies
: Si
noPa
c H
oldi
ngs a
nd G
loba
l Sci
ente
ch In
c. E
ink
Hol
ding
s Inc
. N
ote
6: S
imul
tane
ousl
y ac
t as t
he d
irec
tor
of th
e fo
llow
ing
com
pani
es: F
inan
ce a
nd E
cono
mic
s Res
earc
h an
d Ed
ucat
ion
Foun
datio
n Si
mul
tane
ousl
y ac
t as t
he in
depe
nden
t dir
ecto
r of
the
follo
win
g co
mpa
nies
: Lite
On
Tech
nolo
gy C
orp.
Wis
tron
Cor
pora
tion.
15
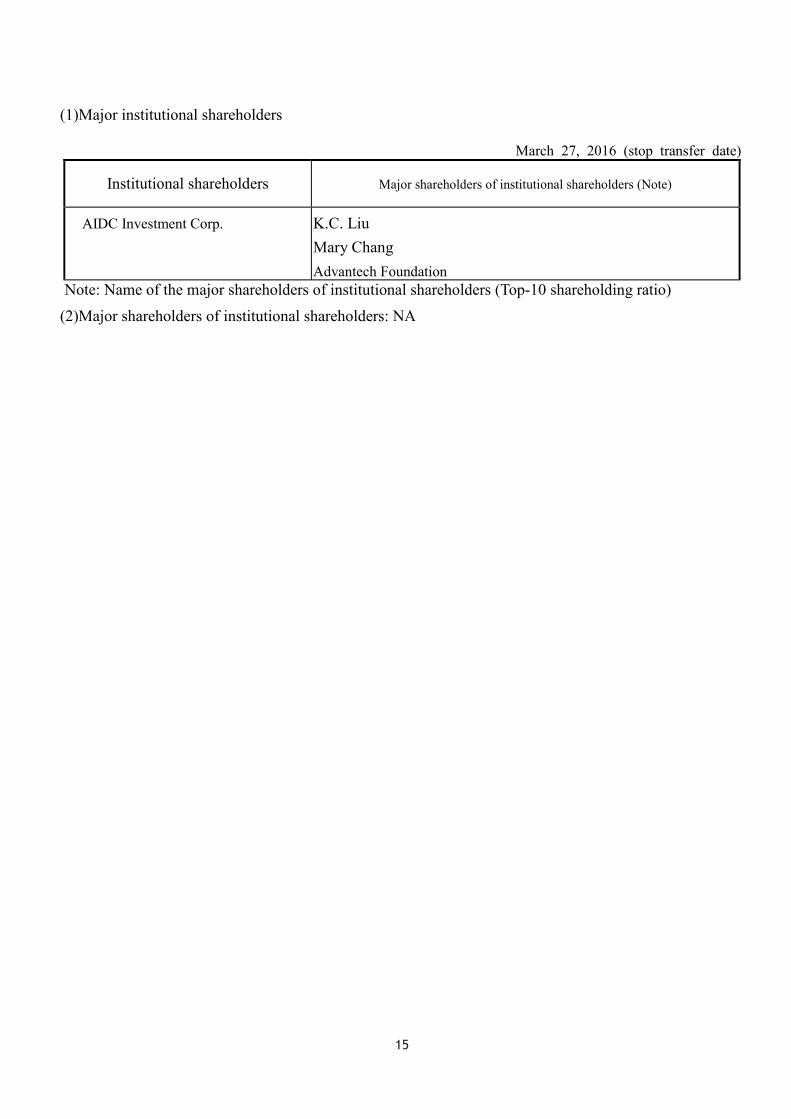
(1)Major institutional shareholders
March 27, 2016 (stop transfer date)
Institutional shareholders Major shareholders of institutional shareholders (Note)
AIDC Investment Corp. K.C. Liu Mary Chang Advantech Foundation
Note: Name of the major shareholders of institutional shareholders (Top-10 shareholding ratio)
(2)Major shareholders of institutional shareholders: NA

16
Information regarding directors and supervisor (II)
Requirem
ents
Name
Over five years of experience and
the following professional
qualifications
Independence criteria (Note)
Serving as an independent director of another listed company
University teaching in
areas of commerce, law, finance, accounting or related corporate business
Working as a judge, attorney, lawyer, accountant or other positions that require professional certification
Work experience in commerce, law, finance, accounting or related corporate experiences
1 2 3 4 5 6 7 8 9 10
K.C. Liu 0 Donald Chang
0
Ted Hsu 0 Jeff Chen 0 Joseph Yu 2 Thomas Chen
2
James Wu 2 Gary Tseng 1
Note: A “ “ is marked in the space beneath a condition number when a director or supervisor has met that condition during the two years prior to election and during his or her period of service; the conditions are as follows:
(1)Not employed by the company or an affiliated business. (2)Not a director or supervisor of an affiliated company (this restriction does not apply to independent directors of subsidiaries in
which the company or its parent company directly or indirectly holds over 50% of the shareholder voting rights). (3)Not holding over 1% of company shares or being a top 10 natural person shareholder in one’s own name, held by a spouse or
underage child, or held by nominee agreement. (4)Neither a spouse, second-degree relative, nor fifth degree direct relative of the persons listed under the previous three items. (5)Neither a director, supervisor or employee of an institutional shareholder directly owning more than 5% of the company’s
outstanding shares, nor one of the company’s top five institutional shareholders. (6)Neither a director, supervisor, manager or shareholder holding more than a 5% stake in certain companies or institutions that have
a financial or business relationship with the company. (7)Does not provide professional commercial, legal, financial, accounting services or consulting to the company or its affiliated
companies nor is an owner, partner, director, supervisor, manager in a proprietorship, partnership, company or institution that provides neither such services nor the spouse of such officeholders.
(8)Not a spouse or second-degree relative of any other director. (9)Standing does not match any of the scenarios described in Article 30 of the Company Law. (10)Was not elected as the shareholder representative for a government agency or legal person pursuant to Article 27 of the Company
Law.

17
(2)
Info
rmat
ion
rega
rdin
g th
e Pr
esid
ent,
Vic
e Pr
esid
ent,
Ass
ista
nt V
ice
Pres
iden
ts, a
nd d
epar
tmen
t and
bra
nch
Man
ager
s M
arch
27,
201
6
Ti
tle
N
atio
nalit
yN
ame
Dat
e el
ecte
d (ta
ken
offic
e)Sh
areh
oldi
ng
Shar
ehol
ding
s by
spou
se a
nd u
nder
age
child
ren
Shar
ehol
ding
by
nom
inee
ar
rang
emen
t Ed
ucat
ion
and
sele
cted
pas
t po
sitio
ns
Cur
rent
ad
ditio
nal
posi
tions
Spou
se o
r rel
ativ
es
with
in tw
o de
gree
s w
ho a
re m
anag
ers
Shar
es%
Sh
ares
%
Sh
ares
%
Title
Nam
e R
elat
ions
hip
Exec
utiv
e R
OC
K
.C. L
iu
06.01
.2003
23
,292,4
843.6
91,1
97,67
20.1
90
0Fo
unde
r of A
dvan
tech
Co.
, Lt
d.
Sale
sman
of I
nstru
men
ts D
ept.
of H
ewle
tt-Pa
ckar
d B
ache
lor o
f Dep
artm
ent o
f Te
leco
mm
unic
atio
ns
Engi
neer
ing,
Jiao
tong
U
nive
rsity
Not
e 1
Non
eN
one
Non
e
Pres
iden
t R
OC
C
hane
y H
o 05
.01.20
04
247,011
0.04
209,6
300.0
30
0Pr
esid
ent o
f Li-W
ei C
ompa
nyTa
tung
Inst
itute
of T
echn
olog
yN
ote
2 N
one
Non
e N
one
Vic
e Pr
esid
ent
RO
C
Dey
u Y
in
09.30
.2004
0
0579,828
0.09
0 0
Dire
ctor
of H
uman
Res
ourc
es,
Del
ta G
roup
B
ache
lor o
f Eco
nom
ics,
Nat
iona
l Tai
wan
Uni
vers
ity
Tula
ne U
nive
rsity
EM
BA
Non
e 5
Non
eN
one
Non
e
Vic
e Pr
esid
ent
RO
C
Alb
ert
Hua
ng
09.30
.2004
155,947
0.02
10,50
10
0 0
Proj
ect M
anag
er o
f Ju
Teng
Te
chno
logy
In
stitu
te o
f Man
agem
ent
Scie
nce,
Tam
kang
Uni
vers
ity
Not
e 3
Non
eN
one
Non
e
Vic
e Pr
esid
ent
RO
C
Eric
Che
n 11
.18.20
11
219,837
0.03
00
0 0
Elite
grou
p C
ompu
ter S
yste
ms
Co.
, Ltd
. Ta
i Sen
Ent
erpr
ise
Co.
, Ltd
. D
epar
tmen
t of C
ompu
ter
Scie
nce,
Tam
kang
Uni
vers
ity
Not
e 4
Non
eN
one
Non
e
Acc
ount
ing
Offi
cer
RO
C
Ror
ie K
ang
04.13
.2011
3,4
090
00
0 0
Aff
iliat
es o
f Adv
ante
ch G
roup
Seni
or A
ccou
ntan
t D
epar
tmen
t of A
ccou
ntin
g,
Chu
ng H
sing
Uni
vers
ity
Non
e N
one
Non
e N
one
Not
e 1:
Sim
ulta
neou
sly
act a
s the
cha
irm
an o
f the
follo
win
g co
mpa
nies
: A
dvan
tech
Fou
ndat
ion、
Beiji
ng Y
an H
ua X
ing
Ye E
lect
roni
c Sc
ienc
e &
Tec
hnol
ogy
Co.
, Ltd
. (A
CN
)、A
dvan
tech
Inve
stm
ent F
und-
A C
o., L
td. R
epre
sent
ativ
e、

18
Adv
anix
s Cor
pora
tion.
Rep
rese
ntat
ive.、
Adv
ante
ch T
echn
olog
y (C
hina
) Com
pany
Ltd
. (A
KM
C)、
Shan
ghai
Adv
ante
ch In
telli
gent
Ser
vice
s Co.
, Ltd
. (A
iSC
)、X
i’an
Adv
ante
ch S
oftw
are
Ltd.
(AX
A)、
Adv
ante
ch In
telli
gent
Ser
vice
(AiS
T) R
epre
sent
ativ
e、A
CA
Dig
ital C
orpo
ratio
n (A
CA
) Rep
rese
ntat
ive、
K&
M Im
vest
men
t C
o.,L
td.、
Adv
anPO
S Te
chno
logy
Co.
, Ltd
. (A
dvan
POS)
Rep
rese
ntat
ive、
Adv
ante
ch-L
NC
Tec
hnol
ogy
Co.
, Ltd
. (A
LTC
) Rep
rese
ntat
ive、
Adv
ante
ch Ja
pan
Co.
, Ltd
. (A
JP)。
Adv
ante
ch F
ound
atio
n, A
CN
, Leg
al re
pres
enta
tive
of A
dvan
tech
Inve
stm
ent C
o., L
td.,
Lega
l rep
rese
ntat
ive
of A
dvan
sus C
orp.
, AK
MC
, AiS
C, X
i’An
Adv
ante
ch S
oftw
are
Co.
, Ltd
., Le
gal r
epre
sent
ativ
e of
Adv
ante
ch In
telli
gent
Co.
, Ltd
., Le
gal r
epre
sent
ativ
e of
AC
A, C
oChe
n In
vest
men
t Co.
, Ltd
., Le
gal
repr
esen
tativ
e of
Adv
anPO
S C
o., L
td.,
Lega
l rep
rese
ntat
ive
of L
NC
, and
Adv
ante
ch Ja
pan
Co.
, Ltd
. (A
JP)、
B+B Smartworx Inc
. Si
mul
tane
ousl
y ac
t as t
he d
irec
tor
of th
e fo
llow
ing
com
pani
es:
Adv
ante
ch In
vest
men
t Co.
, Ltd
., Sp
ring
Foun
datio
n of
NC
TU, P
egat
ron
Cor
pora
tion,
Leg
al re
pres
enta
tive
of E
tern
ity In
telli
genc
e Sy
stem
s Co.
, Ltd
., A
dvan
tech
Eu
rope
B.V
. (A
EU),
DLo
G G
mbH
(DLo
G),
AD
VA
NTE
CH
INTE
RN
ATI
ON
AL
PT. (
AID
), A
dvan
tech
Ele
ctro
nics
,S. D
e R
. L. D
e C
. (A
MX
), A
dvan
tech
Te
chno
logy
Co.
, Ltd
. (A
TC),
HK
Adv
ante
ch T
echn
olog
y C
o., L
td. (
ATC
(HK
)), A
dvan
tech
Aut
omat
ion
Cor
p.(B
VI)(
AA
C(B
VI))
, Adv
ante
ch A
utom
atio
n C
orp.
(HK
) Lim
ited
(AA
C (H
K))
, Adv
ante
ch B
razi
l Ltd
. (A
BR
), A
dvan
tech
Co.
Sin
gapo
re P
te, L
td. (
ASG
), A
dvan
tech
Cor
p.(A
NA
), A
dvan
tech
Eur
ope
Hol
ding
B
.V.(A
EUH
), A
dvan
tech
Co.
, Mal
aysi
a Sd
n.B
hd (A
MY
), A
dvan
tech
Pol
and
Sp z
.o.o
(APL
), A
dvan
tech
KR
Co.
, Ltd
. (A
KR)
, Adv
ante
ch C
orpo
ratio
n (T
haila
nd)
Co.
, Ltd
. (AT
H),
and
Adv
ante
ch In
dust
rial C
ompu
ting
Indi
a Pr
ivat
e Li
mite
d (A
IN),
Bet
ter A
uto
Hol
ding
s Lim
ited、
Fam
ous N
ow L
imite
d。
Sim
ulta
neou
sly
act a
s the
supe
rvis
or o
f the
follo
win
g co
mpa
nies
: M
oxa
Tech
nolo
gy C
o., L
td.
Not
e 2:
Sim
ulta
neou
sly
act a
s the
cha
irm
an o
f the
follo
win
g co
mpa
nies
: A
dvan
tech
Inno
Co
Des
ign
Co.
, Ltd
. Si
mul
tane
ousl
y ac
t as t
he d
irec
tor
of th
e fo
llow
ing
com
pani
es:
Bei
jing
Yan
Hua
Xin
g Ye
Ele
ctro
nic
Scie
nce
& T
echn
olog
y C
o.,
Ltd.
(AC
N)、
Shan
ghai
Adv
ante
ch I
ntel
ligen
t Se
rvic
es C
o.,
Ltd.
(AiS
C) 、
Adv
ante
ch
Tech
nolo
gy (C
hina
) Com
pany
Ltd
.(AK
MC
)、A
dvan
tech
Co.
, Mal
aysi
a Sd
n.B
hd (A
MY
)、A
dvan
tech
KR
Co.
, Ltd
. (A
KR)。
N
ote
3: S
imul
tane
ousl
y ac
t as t
he d
irec
tor
of th
e fo
llow
ing
com
pani
es:
C
erm
ate
Tech
nolo
gies
Inc、
Adv
ante
ch-L
NC
Tec
hnol
ogy
Co.
, Ltd
.、A
dvan
tech
iFac
tory
Co.
Ltd
.
Not
e 4:
Sim
ulta
neou
sly
act a
s the
dir
ecto
r of
the
follo
win
g co
mpa
nies
: A
dvan
tech
Inve
stm
ent F
und-
A C
o., L
td.、
Adv
anix
s Cor
pora
tion.
、A
dvan
tech
Inno
Co
Des
ign
Co.
, Ltd
. Si
mul
tane
ousl
y ac
t as t
he su
perv
isor
of t
he fo
llow
ing
com
pani
es: A
dvan
tech
Inte
llige
nt S
ervi
ces C
o., L
td.(A
iSC
). N
ote
5: S
imul
tane
ousl
y ac
t as t
he d
irec
tor
of th
e fo
llow
ing
com
pani
es:
Adv
ante
ch In
telli
gent
Ser
vice、
Adv
ante
ch In
noC
o D
esig
n C
o., L
td.

19
(
3)R
emun
erat
ion
paid
to D
irect
ors,
Supe
rvis
ors,
Pres
iden
ts, a
nd V
ice
Pres
iden
ts in
the
mos
t rec
ent y
ear
(
1) R
emun
erat
ion
paid
to D
irect
ors (
incl
udin
g In
depe
nden
t Dire
ctor
s)
Uni
t: N
T$ T
hous
and
Title
N
ame
Dire
ctor
s’ re
mun
erat
ion
Com
bine
d A
, B,C
,
and
D to
tal
com
pens
atio
n as
% o
f
net i
ncom
e af
ter t
ax
(Not
e 11
)
Rem
uner
atio
n pa
id to
dire
ctor
s who
also
em
ploy
ees
Com
bine
d A
, B,
C, D
,E,F
, and
G
tota
l am
ount
as %
of n
et in
com
e
afte
r tax
(Not
e 11
)
Com
pens
atio
n fro
m
non-
subs
i
diar
y
com
pani
e
s (N
ote
2)
Com
pens
atio
n
(A)
(Not
e 2)
Pens
ion
upon
retir
emen
t (B
)
Com
pens
atio
n to
Dire
ctor
s(C
)
Bus
ines
s
expe
nses
(D)(
Not
e 4)
Sal
ary,
bon
us a
nd
spec
ial
disc
retio
nary
allo
wan
ce (E
)
(Not
e 5)
Pen
sion
upon
retir
emen
t (F)
Empl
oyee
pro
fit sh
arin
g (G
) (N
ote
6)
(pr
opos
ed)
Num
ber o
f
empl
oyee
stoc
k
optio
ns
gran
ted
(H)(
Not
e 7)
Num
ber
of
new
sha
res w
ith
limite
d rig
hts
acqu
ired
(I)
(Not
e 13
)
Advantech
Consolidated
subsidiaries
(Note 8*)
Advantech
Consolidated
subsidiaries
(Note 8)
本 Advantech
Consolidated
subsidiaries (Note 8)
Advantech
Consolidated
subsidiaries (note 8)
Advantech
Consolidated
subsidiaries (Note 8)
Advantech
Consolidated
subsidiaries (Note 8)
Advantech
Consolidated
subsidiaries (Note 8)
Adv
ante
ch
Con
solid
ated
subs
idia
ries (
Not
e 8)
Advantech
Consolidated
subsidiaries (Note 8)
Advantech
Consolidated
subsidiaries (Note 8)
Advantech
Consolidated
subsidiaries (Note 8)
Cas
h
Stoc
k
Cas
h
Stoc
k
Cha
irman
K
.C.L
iu
0 0
0 0
7,900
7,9
00
0 0
0.15%
0.1
5%
4,980
4,9
80
0 0
1,857
0
1,857
0
0 0
0 0
0.29%
0.2
9%
0
Inde
pend
ent
Dire
ctor
Adv
ante
ch
Foun
datio
n
Rep
rese
ntat
i
Don
ald
Cha
ng
Dire
ctor
Te
d H
su
Dire
ctor
Je
ff C
hen
Inde
pend
ent
Dire
ctor
Jo
seph
Yu
20
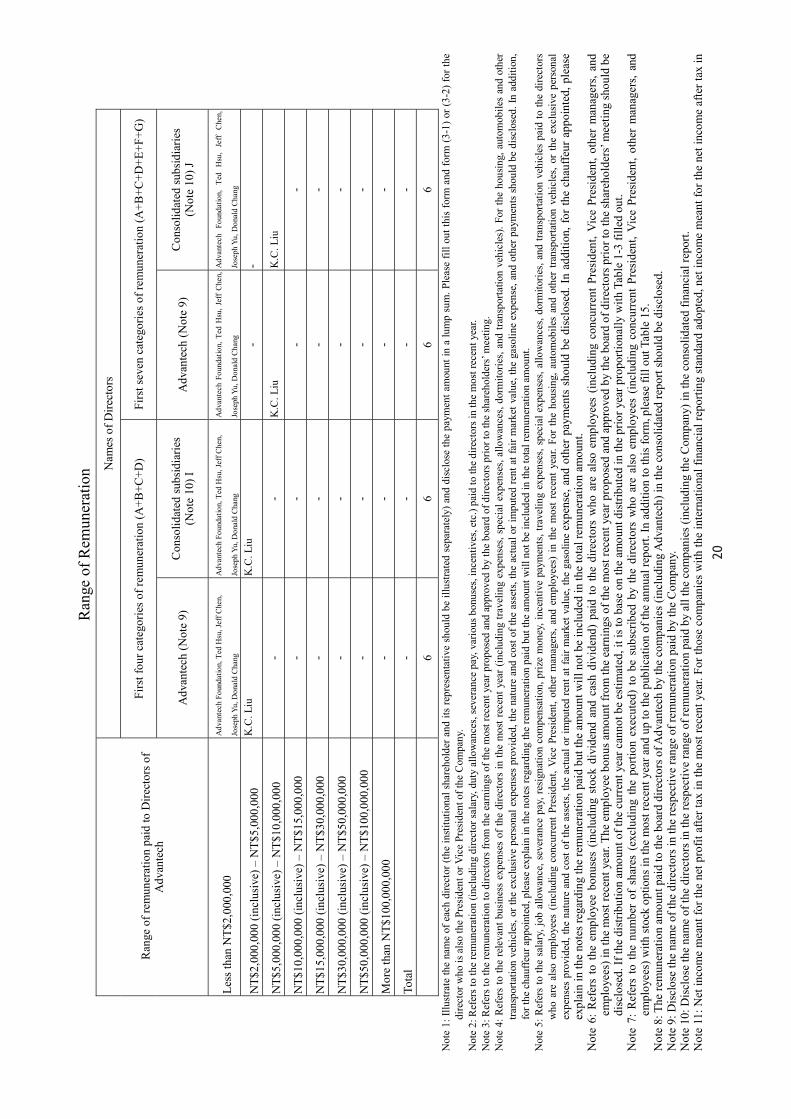
R
ange
of R
emun
erat
ion
Ran
ge o
f rem
uner
atio
n pa
id to
Dire
ctor
s of
Adv
ante
ch
Nam
es o
f Dire
ctor
s
Firs
t fou
r cat
egor
ies o
f rem
uner
atio
n (A
+B+C
+D)
Firs
t sev
en c
ateg
orie
s of r
emun
erat
ion
(A+B
+C+D
+E+F
+G)
Adv
ante
ch (N
ote
9)
Con
solid
ated
subs
idia
ries
(Not
e 10
) I
Adv
ante
ch (N
ote
9)
Con
solid
ated
subs
idia
ries
(N
ote
10) J
Less
than
NT$
2,00
0,00
0 A
dvan
tech
Fou
ndat
ion,
Ted
Hsu
, Jef
f Che
n,
Jose
ph Y
u, D
onal
d C
hang
A
dvan
tech
Fou
ndat
ion,
Ted
Hsu
, Jef
f Che
n,
Jose
ph Y
u, D
onal
d C
hang
A
dvan
tech
Fou
ndat
ion,
Ted
Hsu
, Jef
f C
hen,
Jose
ph Y
u, D
onal
d C
hang
Adv
ante
ch
Foun
datio
n,
Ted
Hsu
, Je
ff C
hen,
Jo
seph
Yu,
Don
ald
Cha
ng
NT$
2,00
0,00
0 (in
clus
ive)
– N
T$5,
000,
000
K.C
. Liu
K
.C. L
iu
- -
NT$
5,00
0,00
0 (in
clus
ive)
– N
T$10
,000
,000
-
- K
.C. L
iu
K.C
. Liu
NT$
10,0
00,0
00 (i
nclu
sive
) – N
T$15
,000
,000
-
- -
-
NT$
15,0
00,0
00 (i
nclu
sive
) – N
T$30
,000
,000
-
- -
-
NT$
30,0
00,0
00 (i
nclu
sive
) – N
T$50
,000
,000
-
- -
-
NT$
50,0
00,0
00 (i
nclu
sive
) – N
T$10
0,00
0,00
0 -
- -
-
Mor
e th
an N
T$10
0,00
0,00
0 -
- -
-
Tota
l -
- -
-
6
6 6
6 N
ote
1: Il
lust
rate
the
nam
e of
eac
h di
rect
or (t
he in
stitu
tiona
l sha
reho
lder
and
its
repr
esen
tativ
e sh
ould
be
illus
trate
d se
para
tely
) and
dis
clos
e th
e pa
ymen
t am
ount
in a
lum
p su
m. P
leas
e fil
l out
this
form
and
form
(3-1
) or (
3-2)
for t
he
dire
ctor
who
is a
lso
the
Pres
iden
t or V
ice
Pres
iden
t of t
he C
ompa
ny.
Not
e 2:
Ref
ers t
o th
e re
mun
erat
ion
(incl
udin
g di
rect
or sa
lary
, dut
y al
low
ance
s, se
vera
nce
pay,
var
ious
bon
uses
, inc
entiv
es, e
tc.)
paid
to th
e di
rect
ors i
n th
e m
ost r
ecen
t yea
r. N
ote
3: R
efer
s to
the
rem
uner
atio
n to
dire
ctor
s fro
m th
e ea
rnin
gs o
f the
mos
t rec
ent y
ear p
ropo
sed
and
appr
oved
by
the
boar
d of
dire
ctor
s prio
r to
the
shar
ehol
ders
’ mee
ting.
N
ote
4: R
efer
s to
the
rele
vant
bus
ines
s ex
pens
es o
f the
dire
ctor
s in
the
mos
t rec
ent y
ear (
incl
udin
g tra
velin
g ex
pens
es, s
peci
al e
xpen
ses,
allo
wan
ces,
dorm
itorie
s, an
d tra
nspo
rtatio
n ve
hicl
es).
For t
he h
ousin
g, a
utom
obile
s an
d ot
her
trans
porta
tion
vehi
cles
, or t
he e
xclu
sive
per
sona
l exp
ense
s pr
ovid
ed, t
he n
atur
e an
d co
st o
f the
ass
ets,
the
actu
al o
r im
pute
d re
nt a
t fai
r mar
ket v
alue
, the
gas
olin
e ex
pens
e, a
nd o
ther
pay
men
ts s
houl
d be
dis
clos
ed. I
n ad
ditio
n,
for t
he c
hauf
feur
app
oint
ed, p
leas
e ex
plai
n in
the
note
s reg
ardi
ng th
e re
mun
erat
ion
paid
but
the
amou
nt w
ill n
ot b
e in
clud
ed in
the
tota
l rem
uner
atio
n am
ount
. N
ote
5: R
efer
s to
the
sala
ry, j
ob a
llow
ance
, sev
eran
ce p
ay, r
esig
natio
n co
mpe
nsat
ion,
priz
e m
oney
, inc
entiv
e pa
ymen
ts, t
rave
ling
expe
nses
, spe
cial
exp
ense
s, al
low
ance
s, do
rmito
ries,
and
trans
porta
tion
vehi
cles
pai
d to
the
dire
ctor
s w
ho a
re a
lso
empl
oyee
s (in
clud
ing
conc
urre
nt P
resi
dent
, Vic
e Pr
esid
ent,
othe
r m
anag
ers,
and
empl
oyee
s) i
n th
e m
ost r
ecen
t yea
r. Fo
r th
e ho
usin
g, a
utom
obile
s an
d ot
her
trans
porta
tion
vehi
cles
, or
the
excl
usiv
e pe
rson
al
expe
nses
pro
vide
d, th
e na
ture
and
cos
t of t
he a
sset
s, th
e ac
tual
or i
mpu
ted
rent
at f
air m
arke
t val
ue, t
he g
asol
ine
expe
nse,
and
oth
er p
aym
ents
sho
uld
be d
iscl
osed
. In
addi
tion,
for
the
chau
ffeur
app
oint
ed, p
leas
e ex
plai
n in
the
note
s reg
ardi
ng th
e re
mun
erat
ion
paid
but
the
amou
nt w
ill n
ot b
e in
clud
ed in
the
tota
l rem
uner
atio
n am
ount
. N
ote
6: R
efer
s to
the
em
ploy
ee b
onus
es (
incl
udin
g st
ock
divi
dend
and
cas
h di
vide
nd)
paid
to th
e di
rect
ors
who
are
als
o em
ploy
ees
(incl
udin
g co
ncur
rent
Pre
side
nt, V
ice
Pres
iden
t, ot
her
man
ager
s, an
d em
ploy
ees)
in th
e m
ost r
ecen
t yea
r. Th
e em
ploy
ee b
onus
am
ount
from
the
earn
ings
of t
he m
ost r
ecen
t yea
r pro
pose
d an
d ap
prov
ed b
y th
e bo
ard
of d
irect
ors p
rior t
o th
e sh
areh
olde
rs’ m
eetin
g sh
ould
be
disc
lose
d. If
the
dist
ribut
ion
amou
nt o
f the
cur
rent
yea
r can
not b
e es
timat
ed, i
t is t
o ba
se o
n th
e am
ount
dis
tribu
ted
in th
e pr
ior y
ear p
ropo
rtion
ally
with
Tab
le 1
-3 fi
lled
out.
Not
e 7:
Ref
ers
to t
he n
umbe
r of
sha
res
(exc
ludi
ng th
e po
rtion
exe
cute
d) t
o be
sub
scrib
ed b
y th
e di
rect
ors
who
are
als
o em
ploy
ees
(incl
udin
g co
ncur
rent
Pre
side
nt, V
ice
Pres
iden
t, ot
her
man
ager
s, an
d em
ploy
ees)
with
stoc
k op
tions
in th
e m
ost r
ecen
t yea
r and
up
to th
e pu
blic
atio
n of
the
annu
al re
port.
In a
dditi
on to
this
form
, ple
ase
fill o
ut T
able
15.
N
ote
8: T
he re
mun
erat
ion
amou
nt p
aid
to th
e bo
ard
dire
ctor
s of A
dvan
tech
by
the
com
pani
es (i
nclu
ding
Adv
ante
ch) i
n th
e co
nsol
idat
ed re
port
shou
ld b
e di
sclo
sed.
N
ote
9: D
iscl
ose
the
nam
e of
the
dire
ctor
s in
the
resp
ectiv
e ra
nge
of re
mun
erat
ion
paid
by
the
Com
pany
. N
ote
10: D
iscl
ose
the
nam
e of
the
dire
ctor
s in
the
resp
ectiv
e ra
nge
of re
mun
erat
ion
paid
by
all t
he c
ompa
nies
(inc
ludi
ng th
e C
ompa
ny) i
n th
e co
nsol
idat
ed fi
nanc
ial r
epor
t. N
ote
11: N
et in
com
e m
eant
for t
he n
et p
rofit
afte
r tax
in th
e m
ost r
ecen
t yea
r. Fo
r tho
se c
ompa
nies
with
the
inte
rnat
iona
l fin
anci
al re
porti
ng s
tand
ard
adop
ted,
net
inco
me
mea
nt fo
r the
net
inco
me
afte
r tax
in

21
the
prop
rieta
ry o
r ind
ivid
ual f
inan
cial
repo
rt of
the
mos
t rec
ent y
ear.
Not
e 12
: a.T
he re
mun
erat
ion
amou
nt re
ceiv
ed b
y th
e bo
ard
dire
ctor
s fro
m th
e in
vest
ed c
ompa
nies
oth
er th
an th
e su
bsid
iarie
s sho
uld
be d
iscl
osed
in th
is c
olum
n.
b.Th
e re
mun
erat
ion
amou
nt, i
f any
, rec
eive
d by
the
boar
d di
rect
ors f
rom
the
inve
sted
com
pani
es o
ther
than
the
subs
idia
ries
shou
ld b
e di
sclo
sed
in c
olum
n J
of th
e Ra
nge
of R
emun
erat
ion;
als
o, th
e co
lum
n sh
ould
be
rena
med
as “
All
trans
fer-i
nves
tmen
t bus
ines
ses.”
c.
Rem
uner
atio
n m
eant
for t
he re
leva
nt re
war
d, in
com
e, e
mpl
oyee
bon
us, a
nd b
usin
ess e
xpen
se c
olle
cted
by
the
boar
d di
rect
ors o
f the
Com
pany
act
ed a
s a d
irect
or, s
uper
viso
r, or
man
ager
of t
he
inve
sted
com
pani
es o
ther
than
the
subs
idia
ries.
Not
e 13
: Ref
ers
to th
e nu
mbe
r of n
ews
shar
es w
ith li
mite
d rig
hts
rece
ived
by
the
dire
ctor
s w
ho a
re a
lso
empl
oyee
s (in
clud
ing
conc
urre
nt P
resi
dent
, Vic
e Pr
esid
ent,
othe
r man
ager
s, an
d em
ploy
ees)
up
to th
e pu
blic
atio
n of
the
annu
al re
port.
In a
dditi
on to
this
form
, ple
ase
fill o
ut T
able
15-
1.
*Th
e re
mun
erat
ion
disc
lose
d in
the
Ran
ge o
f Rem
uner
atio
n di
ffers
from
the
conc
ept o
f inc
ome
defin
ed a
ccor
ding
to In
com
e Ta
x La
w; t
here
fore
, the
tabl
e is
for t
he p
urpo
se o
f inf
orm
atio
n di
sclo
sure
inst
ead
of ta
x le
vy.
(2)R
emun
erat
ion
paid
to su
perv
isor
Uni
t: N
T$ T
hous
and
Title
N
ame
Com
pens
atio
n pa
id to
supe
rvis
or
Com
bine
d A
, B, a
nd C
tota
l am
ount
as
% o
f net
inco
me
afte
r tax
(Not
e 8)
Com
pens
atio
n fr
om
non-
subs
idia
ry
com
pani
es
(Not
e 9)
Rem
uner
atio
n (A
) (N
ote
2)
Prof
it di
strib
utio
n (B
) (N
ote
3)
Bus
ines
s exp
ense
s (C
)(Not
e 4)
Adv
ante
ch
Con
solid
ated
su
bsid
iarie
s (
Not
e5)
Adv
ante
ch C
onso
lidat
ed
subs
idia
ries (
Not
e 5)
A
dvan
tech
Con
solid
ated
subs
idia
ries
(Not
e 5)
A
dvan
tech
Con
solid
ated
su
bsid
iarie
s (N
ote
5)
Supe
rvis
or
AID
C In
vest
men
t
Cor
p.
0 0
3,40
0 3,
400
0 0
0.07
%
0.07
%
0
Rep
rese
ntat
ive:
G
ary
Tsen
g
Supe
rvis
or
Thom
as C
hen
Supe
rvis
or
Jam
es W
u

22
Ran
ge o
f rem
uner
atio
n
Ran
ge o
f rem
uner
atio
n pa
id to
supe
rvis
ors o
f Adv
ante
ch
Nam
e of
supe
rvis
ors
Firs
t thr
ee c
ateg
orie
s of r
emun
erat
ion
(A+B
+C)
Adv
ante
ch (N
ote
6)
Con
solid
ated
subs
idia
ries (
Not
e 7)
D
Less
than
NT$
2,00
0,00
0 A
IDC
Inve
stm
ent C
orp,
Tho
mas
Che
n,
Jam
es W
u, G
ary
Tsen
g A
IDC
Inve
stm
ent C
orp,
Tho
mas
Che
n , J
ames
Wu
, G
ary
Tsen
g
NT$
2,00
0,00
0 (in
clus
ive)
– N
T$5,
000,
000
- -
NT$
5,00
0,00
0 (in
clus
ive)
– N
T$10
,000
,000
-
-
NT$
10,0
00,0
00 (i
nclu
sive
) – N
T$15
,000
,000
-
-
NT$
15,0
00,0
00 (i
nclu
sive
) – N
T$30
,000
,000
-
-
NT$
30,0
00,0
00 (i
nclu
sive
) – N
T$50
,000
,000
-
-
NT$
50,0
00,0
00 (i
nclu
sive
) – N
T$10
0,00
0,00
0 -
-
Mor
e th
an N
T$10
0,00
0,00
0 -
-
Tota
l 4
4
Not
e 1:
Illu
stra
te th
e na
me
of e
ach
supe
rvis
or (t
he in
stitu
tiona
l sha
reho
lder
and
its r
epre
sent
ativ
e sh
ould
be
illus
trate
d se
para
tely
) and
dis
clos
e th
e pa
ymen
t am
ount
in a
lum
p su
m.
Not
e 2:
Ref
ers t
o th
e re
mun
erat
ion
(incl
udin
g su
perv
isor
sala
ry, d
uty
allo
wan
ces,
seve
ranc
e pa
y, v
ario
us b
onus
es, i
ncen
tives
, etc
.) pa
id to
the
supe
rvis
ors i
n th
e m
ost r
ecen
t yea
r. N
ote
3: R
efer
s to
the
rem
uner
atio
n to
supe
rvis
ors f
rom
the
earn
ings
of t
he m
ost r
ecen
t yea
r pro
pose
d an
d ap
prov
ed b
y th
e bo
ard
of d
irect
ors p
rior t
o th
e sh
areh
olde
rs’ m
eetin
g.
Not
e 4:
Ref
ers t
o th
e re
leva
nt b
usin
ess e
xpen
ses o
f the
supe
rvis
ors i
n th
e m
ost r
ecen
t yea
r (in
clud
ing
trave
ling
expe
nses
, spe
cial
exp
ense
s, al
low
ance
s, do
rmito
ries,
and
trans
porta
tion
vehi
cles
). Fo
r the
ho
usin
g, a
utom
obile
s and
oth
er tr
ansp
orta
tion
vehi
cles
, or t
he e
xclu
sive
per
sona
l exp
ense
s pro
vide
d, th
e na
ture
and
cos
t of t
he a
sset
s, th
e ac
tual
or i
mpu
ted
rent
at f
air m
arke
t val
ue, t
he g
asol
ine
ex
pens
e, a
nd o
ther
pay
men
ts sh
ould
be
disc
lose
d. In
add
ition
, for
the
chau
ffeur
app
oint
ed, p
leas
e ex
plai
n in
the
note
s reg
ardi
ng th
e re
mun
erat
ion
paid
but
the
amou
nt w
ill n
ot b
e in
clud
ed in
the
tota
l
rem
uner
atio
n am
ount
. N
ote
5: T
he re
mun
erat
ion
amou
nt p
aid
to th
e su
perv
isor
s of A
dvan
tech
by
the
com
pani
es (i
nclu
ding
Adv
ante
ch) i
n th
e co
nsol
idat
ed re
port
shou
ld b
e di
sclo
sed.
N
ote
6: D
iscl
ose
the
nam
e of
the
supe
rvis
ors i
n th
e re
spec
tive
rang
e of
rem
uner
atio
n pa
id b
y th
e C
ompa
ny.
Not
e 7:
Dis
clos
e th
e na
me
of th
e su
perv
isor
s in
the
resp
ectiv
e ra
nge
of re
mun
erat
ion
paid
by
all t
he c
ompa
nies
(inc
ludi
ng th
e Co
mpa
ny) i
n th
e co
nsol
idat
ed fi
nanc
ial r
epor
t. N
ote
8: N
et in
com
e m
eant
for t
he n
et p
rofit
afte
r tax
in th
e m
ost r
ecen
t yea
r. Fo
r tho
se c
ompa
nies
with
the
inte
rnat
iona
l fin
anci
al re
porti
ng st
anda
rd a
dopt
ed, n
et in
com
e m
eant
for t
he n
et in
com
e af
ter t
ax in
th
e pr
oprie
tary
or i
ndiv
idua
l fin
anci
al re
port
of th
e m
ost r
ecen
t yea
r. N
ote
9:a.
The
rem
uner
atio
n am
ount
rece
ived
by
the
supe
rvis
ors f
rom
the
inve
sted
com
pani
es o
ther
than
the
subs
idia
ries s
houl
d be
disc
lose
d in
this
col
umn.
b.
The
rem
uner
atio
n am
ount
, if a
ny, r
ecei
ved
by th
e su
perv
isor
s fro
m th
e in
vest
ed c
ompa
nies
oth
er th
an th
e su
bsid
iarie
s sho
uld
be d
iscl
osed
in c
olum
n D
of t
he R
ange
of R
emun
erat
ion;
als
o, th
e
colu
mns
houl
d be
rena
med
as “
All
trans
fer-i
nves
tmen
t bus
ines
ses.”
c.
Rem
uner
atio
n m
eant
for t
he re
leva
nt re
war
d, in
com
e, e
mpl
oyee
bon
us, a
nd b
usin
ess e
xpen
se c
olle
cted
by
the
supe
rvis
ors o
f the
Com
pany
act
ed a
s a d
irect
or, s
uper
viso
r, or
man
ager
of t
he in
vest
ed
com
pani
es o
ther
than
the
subs
idia
ries.
*Th
e re
mun
erat
ion
disc
lose
d in
the
Ran
ge o
f Rem
uner
atio
n di
ffers
from
the
conc
ept o
f inc
ome
defin
ed a
ccor
ding
to In
com
e Ta
x La
w; t
here
fore
, the
tabl
e is
for t
he p
urpo
se o
f inf
orm
atio
n di
sclo
sure
inst
ead
of
tax
levy
.

23
(3)R
emun
erat
ion
paid
to th
e pr
esid
ents
and
vic
e pr
esid
ents
U
nit:
NT$
Tho
usan
d / T
hous
and
units
Title
N
ame
Sala
ry (A
)
(Not
e 2)
Pens
ion
upon
retir
emen
t
(B
)
Cas
h in
cent
ives
and
spec
ial
disc
retio
nary
allo
wan
ce e
tc. (
C)
(Not
e 3)
Empl
oyee
s’ Pr
ofit
Shar
ing
(D
)
(N
ote
4)
Com
bine
d A
,
B, C
, and
D
tota
l
rem
uner
atio
n
in %
of n
et
inco
me
(N
ote
9)
Empl
oyee
stoc
k op
tions
gran
ted
(Not
e 5)
Num
ber
of n
ew
shar
es w
ith
limite
d
right
s
acqu
ired
(Not
e 11
)
Com
pens
a
tion
from
non-
subs
i
diar
y
com
pani
es
(Not
e 10
)
Advantech
Consolidated subsidiaries (Note 6)
Advantech
Consolidated subsidiaries (Note 6)
Advantech
Consolidated subsidiaries
(Note 6)
Adv
ante
ch
Con
solid
ated
subs
idia
ries (
Not
e 6)
Advantech
Consolidated subsidiaries
(Note 6)
Advantech
Consolidated subsidiaries
(Note 6)
Advantech
Consolidated subsidiaries
(Note 6)
Cas
h
Stoc
k C
ash
St
ock
Exec
utiv
e K
.C. L
iu
15,1
20
15,1
20
00
6,10
0 6,
100
10,5
78
0 10
,578
0
0.62
%0.
62%
50
0 50
0 0
0 0
Pres
iden
t C
hane
y H
oV
ice
Pres
iden
t D
eyu
Yin
Vic
e Pr
esid
ent
Alb
ert
Hua
ng
Vic
e Pr
esid
ent
Eric
Che
n

24
Ran
ge o
f Rem
uner
atio
n R
ange
of r
emun
erat
ion
paid
to th
e Pr
esid
ent a
nd V
ice
Pres
iden
ts o
f A
dvan
tech
N
ame
of th
e Pr
esid
ent a
nd V
ice
Pres
iden
t
Adv
ante
ch (N
ote
7)
Con
solid
ated
subs
idia
ries (
Not
e 8)
E
Less
than
NT$
2,00
0,00
0 -
-
NT$
2,00
0,00
0 (in
clus
ive)
– N
T$5,
000,
000
- -
NT$
5,00
0,00
0 (in
clus
ive)
– N
T$10
,000
,000
K
.C. L
iu, C
hane
y H
o, D
eyu
Yin
, Alb
ert H
uang
, Eric
Che
nK
.C. L
iu, C
hane
y H
o, D
eyu
Yin
, Alb
ert H
uang
, Eric
Che
n N
T$10
,000
,000
(inc
lusi
ve) –
NT$
15,0
00,0
00
- -
NT$
15,0
00,0
00 (i
nclu
sive
) – N
T$30
,000
,000
-
- N
T$30
,000
,000
(inc
lusi
ve) –
NT$
50,0
00,0
00
- -
NT$
50,0
00,0
00 (i
nclu
sive
) – N
T$10
0,00
0,00
0 -
-
Mor
e th
an N
T$10
0,00
0,00
0 -
-
Tota
l 5
5 N
ote
1: Il
lust
rate
the
nam
e of
the
Pres
iden
t and
Vic
e Pr
esid
ent a
nd d
iscl
ose
the
paym
ent a
mou
nt it
emiz
ed. P
leas
e fil
l out
this
form
and
form
(1-1
) or (
1-2)
for t
he d
irect
or w
ho is
als
o th
e Pr
esid
ent o
r Vic
e
Pres
iden
t of t
he C
ompa
ny.
Not
e 2:
Ref
ers t
o th
e sa
lary
, dut
y al
low
ance
s, an
d se
vera
nce
paid
to th
e Pr
esid
ent a
nd V
ice
Pres
iden
t in
the
mos
t rec
ent y
ear.
Not
e 3:
Ref
ers t
o th
e re
war
d, in
cent
ives
, tra
velin
g ex
pens
es, s
peci
al e
xpen
ses,
allo
wan
ces,
dorm
itorie
s, tra
nspo
rtatio
n ve
hicl
es, a
nd o
ther
com
pens
atio
ns p
aid
to th
e Pr
esid
ent a
nd V
ice
Pres
iden
t in
the
mos
t
rece
nt y
ear.
For t
he h
ousi
ng, a
utom
obile
s and
oth
er tr
ansp
orta
tion
vehi
cles
, or t
he e
xclu
sive
per
sona
l exp
ense
s pro
vide
d, th
e na
ture
and
cos
t of t
he a
sset
s, th
e ac
tual
or i
mpu
ted
rent
at f
air m
arke
t
valu
e, th
e ga
solin
e ex
pens
e, a
nd o
ther
pay
men
ts sh
ould
be
disc
lose
d. In
add
ition
, for
the
chau
ffeur
app
oint
ed, p
leas
e ex
plai
n in
the
note
s reg
ardi
ng th
e re
mun
erat
ion
paid
but
thea
mou
nt w
ill n
ot b
e
incl
uded
in th
e to
tal r
emun
erat
ion
amou
nt.
Not
e 4:
Ref
ers t
o th
e em
ploy
ee b
onus
(inc
ludi
ng st
ock
divi
dend
and
cas
h di
vide
nd) t
o th
e Pr
esid
ent a
nd V
ice
Pres
iden
t fro
m th
e ea
rnin
gs o
f the
mos
t rec
ent y
ear p
ropo
sed
and
appr
oved
by
the
boar
d of
di
rect
ors p
rior t
o th
e sh
areh
olde
rs’ m
eetin
g. If
the
dist
ribut
ion
amou
nt o
f the
cur
rent
yea
r can
not b
e es
timat
ed, i
t is t
o ba
se o
n th
e am
ount
dis
tribu
ted
in th
e pr
ior y
ear p
ropo
rtion
ally
with
Tab
le 1
-3
fille
d ou
t.
Net
inco
me
mea
nt fo
r the
net
pro
fit a
fter t
ax in
the
mos
t rec
ent y
ear.
For t
hose
com
pani
es w
ith th
e in
tern
atio
nal f
inan
cial
repo
rting
stan
dard
ado
pted
, net
inco
me
mea
nt fo
r the
net
inco
me
afte
r tax
in
thep
ropr
ieta
ry o
r ind
ivid
ual f
inan
cial
repo
rt of
the
mos
t rec
ent y
ear.
Not
e 5:
Ref
ers t
o th
e nu
mbe
r of s
hare
s (ex
clud
ing
the
porti
on e
xecu
ted)
to b
e su
bscr
ibed
by
the
Pres
iden
t and
Vic
e Pr
esid
ent w
ith st
ock
optio
ns in
the
mos
t rec
ent y
ear a
nd u
p to
the
publ
icat
ion
of th
e
annu
al re
port.
In a
dditi
on to
this
form
, ple
ase
fill o
ut T
able
15.
N
ote
6: D
iscl
ose
the
item
ized
am
ount
pai
d to
the
Pres
iden
t and
Vic
e Pr
esid
ent b
y al
l the
com
pani
es (i
nclu
ding
the
Com
pany
) in
the
cons
olid
ated
fina
ncia
l sta
tem
ents
. N
ote
7: D
iscl
ose
the
nam
e of
the
Pres
iden
t and
Vic
e Pr
esid
ent i
n th
e re
spec
tive
rang
e of
rem
uner
atio
n pa
id b
y th
e C
ompa
ny.
Not
e 8:
Dis
clos
e th
e na
me
of th
e Pr
esid
ent a
nd V
ice
Pres
iden
t in
the
resp
ectiv
e ra
nge
of re
mun
erat
ion
paid
by
all t
he c
ompa
nies
(inc
ludi
ng th
e C
ompa
ny) i
n th
e co
nsol
idat
ed fi
nanc
ial r
epor
t. N
ote
9: N
et in
com
e m
eant
for t
he n
et p
rofit
afte
r tax
in th
e m
ost r
ecen
t yea
r. Fo
r tho
se c
ompa
nies
with
the
inte
rnat
iona
l fin
anci
al re
porti
ng st
anda
rd a
dopt
ed, n
et in
com
e m
eant
for t
he n
et in
com
e af
ter t
ax
in th
e pr
oprie
tary
or i
ndiv
idua
l fin
anci
al re
port
of th
e m
ost r
ecen
t yea
r. N
ote
10: a
.The
rem
uner
atio
n am
ount
rece
ived
by
the
Pres
iden
t and
Vic
e Pr
esid
ent f
rom
the
inve
sted
com
pani
es o
ther
than
the
subs
idia
ries s
houl
d be
dis
clos
ed in
this
colu
mn.
b.
The
rem
uner
atio
n am
ount
, if a
ny, r
ecei
ved
by th
e Pr
esid
ent a
nd V
ice
Pres
iden
t fro
m th
e in
vest
ed c
ompa
nies
oth
er th
an th
e su
bsid
iarie
s sho
uld
be d
iscl
osed
in c
olum
n E
of th
e R
ange
of
R
emun
erat
ion
and
the
colu
mn
shou
ld b
e re
nam
ed a
s “A
ll tra
nsfe
r-inv
estm
ent b
usin
esse
s.”
c. R
emun
erat
ion
mea
nt fo
r the
rele
vant
rew
ard,
inco
me,
em
ploy
ee b
onus
, and
bus
ines
s exp
ense
col
lect
ed b
y th
e Pr
esid
ent a
nd V
ice
Pres
iden
t of t
he C
ompa
ny a
cted
as a
dire
ctor
, sup
ervi
sor,
or
man
ager
of t
he in
vest
ed c
ompa
nies
oth
er th
an th
e su
bsid
iarie
s. N
ote
11: R
efer
s to
the
num
ber o
f new
s sha
res w
ith li
mite
d rig
hts r
ecei
ved
by th
e di
rect
ors w
ho a
re a
lso
empl
oyee
s (in
clud
ing
conc
urre
nt P
resi
dent
, Vic
e Pr
esid
ent,
othe
r man
ager
s, an
d em
ploy
ees)
up
to th
e
publ
icat
ion
of th
e an
nual
repo
rt. In
add
ition
to th
is fo
rm, p
leas
e fil
l out
Tab
le 1
5-1.
*
he re
mun
erat
ion
disc
lose
d in
the
Ran
ge o
f Rem
uner
atio
n di
ffers
from
the
conc
ept o
f inc
ome
defin
ed a
ccor
ding
to In
com
e Ta
x La
w; t
here
fore
, the
tabl
e is
for t
he p
urpo
se o
f inf
orm
atio
n di
sclo
sure
in
stea
d of
tax
levy
.

25
Employee Compensation amount paid to managers March 27, 2016
Title (Note 1) Name
(Note 1)
Stock bonus amount
(proposed)
Cash bonus amount
(proposed) Total
Total as % of net
income after tax
Manager
Executive K.C. Liu
0 10,678 10,678 0.21%
President Chaney Ho Vice President Deyu Yin Vice President Albert Huang Vice President Eric Chen
Accounting Officer
Rorie Kang
*It refers to the employee Compensation (including stock dividend and cash dividend) to the managers from the earnings of the most recent year proposed and approved by the board of directors prior to the shareholders’ meeting. If the distribution amount of the current year cannot be estimated, it is to base on the amount distributed in the prior year proportionally. Net income meant for the net profit after tax in the most recent year.
Note 1: Illustrate the name and job title of each manager and disclose the distribution of earnings in a lump sum. Note 2: Scope of applicability to managers, according to the Tai.Chai.Chen III Tzi No. 0920001301 Letter dated March 27,
2003 by the Commission, is as follows: (1)President and the equals (2)Vice President and the equals (3)Junior VP and the equals (4)Finance Officer (5)Accounting Officer (6)Other authorized personnel for management and signature
Note 3: For the directors, President, and Vice President who have collected employee Compensation (including stock dividend and cash dividend), in addition to Table 1-2 enclosed, please fill out this form.

26
(4)Analyze the ratio of the total remuneration paid to the Company’s directors, supervisors, President, and Vice President in the last two years by the Company and all the consolidated subsidiaries to the net income in the proprietary or individual financial report. Explain the remuneration policy, standards, and combinations, remuneration determination procedures, and the relevance of operating performance and future risks. 1.Analysis of total compensation paid to directors, supervisors, presidents, and vice presidents as a
percentage of net income in the last two years: Job Title Ratio of 2015 total remuneration
to net income (%) Ratio of 2014 total remuneration to
net income (%) Directors, supervisor, President, and Vice
President
Advantech All consolidated subsidiaries
Advantech All consolidated subsidiaries
0.97% 0.97% 1.22% 1.22%
2.The Company’s remuneration policy, standards, and combinations, remuneration determination procedures, and the relevance of operating performance and future risks.
The Company has the remuneration to the directors, supervisors, and managers paid in accordance with the Company’s remuneration policy after the Remuneration Committee’s referring to the general standards of the industry, the corporate performance, individual performance, and the connection and reasonability of future risks; also, the Board of Directors’ considering the remuneration amount, payment method, the Company’s future risks, and presenting for resolutions in the shareholders’ meeting.
III. Corporate governance practices and status of compliance (一) Operations of the Board of Directors
The Board held 12 meetings (A) in 2015 with the attendance record of Board members as follows: Title Name (Note 1) Actual
attendance (B)Attendance by
proxy Actual attendance
rate (%) (B/A) Remarks
Chairman K.C. Liu 10 2 83% Reelected
Director Advantech Foundation: Representative: Donald Chang
12 0 100% Newly elected
Director Ted Hsu 11 1 91% Reelected
Independent director
Joseph Yu 12 0 100% Reelected
Independent director
Jeff Chen 12 1 91% Newly elected
Other required information: 1. Concerning items listed in Article 14-3 of the Securities Exchange Act as well as items in board resolutions regarding which
independent directors have voiced opposing or qualified opinions on the record or in writing, the board meeting date, period, content of the resolution, opinions of all independent directors, and the company’s handling of the opinions of the independent directors should be clearly stated in the minutes of meeting: None.
2. When a director recuses himself or herself from a resolution, the director’s name, content of the resolution, reason for recusal, and participation in voting should be clearly stated in the minutes of meeting: None
3. Assessment of the goals and implementation of strengthening the functions of the board of directors (such as, the establishment of an Audit Committee and increasing information transparency, etc.) during the current year and previous year:
In order to substantiate corporate governance and strengthen the role of the board of directors, the Company had two independent directors appointed in accordance with Article 14-2 of the Securities Exchange Act; also, an Audit Committee was formed in September 2011 to help the board of directors implement the remuneration management function.
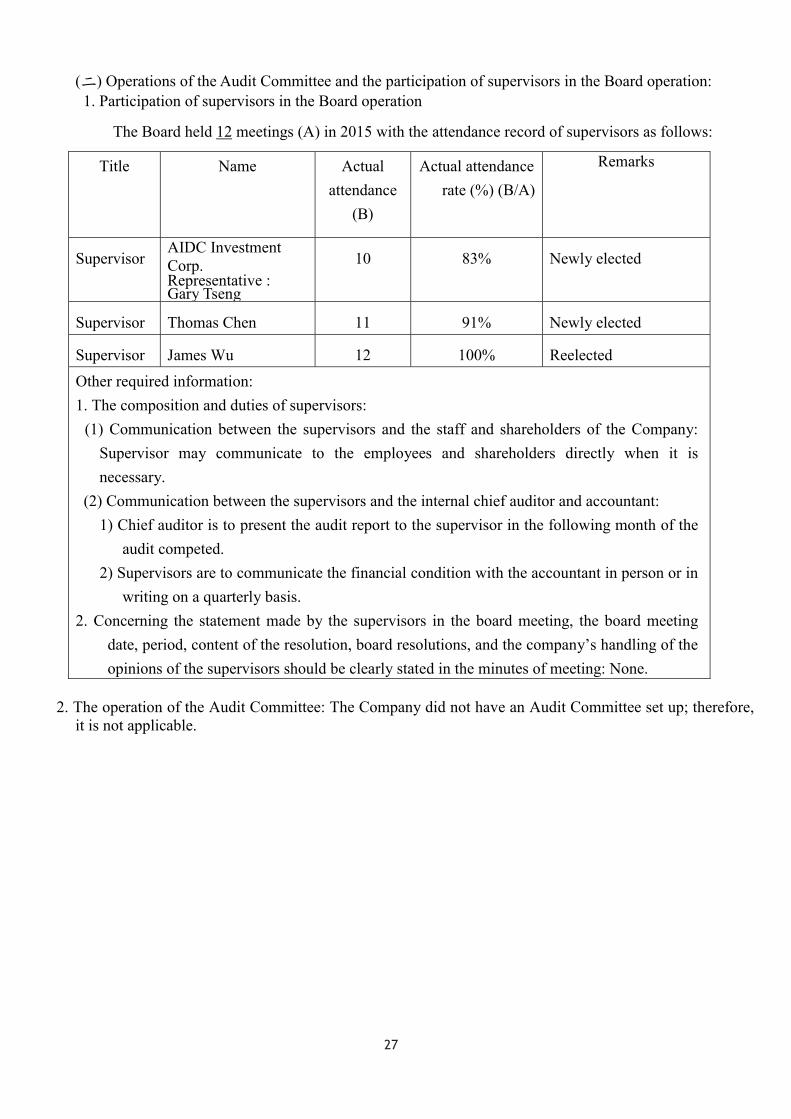
27
(二) Operations of the Audit Committee and the participation of supervisors in the Board operation: 1. Participation of supervisors in the Board operation
The Board held 12 meetings (A) in 2015 with the attendance record of supervisors as follows:
Title Name Actual attendance
(B)
Actual attendance rate (%) (B/A)
Remarks
Supervisor AIDC Investment Corp. Representative : Gary Tseng
10 83% Newly elected
Supervisor Thomas Chen 11 91% Newly elected
Supervisor James Wu 12 100% Reelected Other required information: 1. The composition and duties of supervisors:
(1) Communication between the supervisors and the staff and shareholders of the Company: Supervisor may communicate to the employees and shareholders directly when it is necessary.
(2) Communication between the supervisors and the internal chief auditor and accountant: 1) Chief auditor is to present the audit report to the supervisor in the following month of the
audit competed. 2) Supervisors are to communicate the financial condition with the accountant in person or in
writing on a quarterly basis. 2. Concerning the statement made by the supervisors in the board meeting, the board meeting
date, period, content of the resolution, board resolutions, and the company’s handling of the opinions of the supervisors should be clearly stated in the minutes of meeting: None.
2. The operation of the Audit Committee: The Company did not have an Audit Committee set up; therefore,
it is not applicable.

28
(三) T
he C
ompa
ny’s
impl
emen
tatio
n of
cor
pora
te g
over
nanc
e an
d its
dev
iatin
g fr
om th
e “C
orpo
rate
Gov
erna
nce
Bes
t-Pra
ctic
e Pr
inci
ples
for
TWSE
/GTS
M L
iste
d C
ompa
nies
” an
d th
e ro
ot c
ause
Ass
essm
ent I
tem
s
Ope
ratio
n
Dev
iatin
g fr
om th
e “C
orpo
rate
G
over
nanc
e B
est-P
ract
ice
Prin
cipl
es fo
r TW
SE/G
TSM
Li
sted
Com
pani
es”
and
the
root
ca
use
Yes
No
Sum
mar
y
一、
Doe
s th
e C
ompa
ny b
ase
on th
e “C
orpo
rate
Gov
erna
nce
Bes
t-Pra
ctic
e Pr
inci
ples
fo
r TW
SE/G
TSM
Li
sted
C
ompa
nies
” to
set
up
and
disc
lose
the
Com
pany
’s
corp
orat
e go
vern
ance
bes
t-pra
ctic
e pr
inci
ples
?
V
Th
e C
ompa
ny
has
base
d on
th
e “C
orpo
rate
G
over
nanc
e B
est-P
ract
ice
Prin
cipl
es f
or T
WSE
/GTS
M L
iste
d C
ompa
nies
” to
se
t up
an
d di
sclo
se
the
Com
pany
’s
corp
orat
e go
vern
ance
be
st-p
ract
ice
prin
cipl
es fo
r gui
delin
es o
n th
e M
OPS
.
Non
e
二、
The
Com
pany
’s e
quity
stru
ctur
e an
d sh
areh
olde
rs’
equi
ty
(一
)D
oes
the
Com
pany
hav
e th
e in
tern
al p
roce
dure
s re
gula
ted
to h
andl
e sh
areh
olde
rs’ p
ropo
sals
, dou
bts,
disp
utes
, an
d lit
igat
ion
mat
ters
; al
so,
have
th
e pr
oced
ures
impl
emen
ted
acco
rdin
gly?
(
二)
Doe
s the
Com
pany
pos
sess
the
list o
f the
Com
pany
’s
maj
or s
hare
hold
ers
and
the
list
of t
he u
ltim
ate
cont
rolle
rs o
f the
maj
or sh
areh
olde
rs?
(三)
Doe
s th
e C
ompa
ny e
stab
lish
and
impl
emen
t the
ris
k co
ntro
l an
d fir
ewal
l m
echa
nism
with
the
rel
ated
pa
rties
? (
四)
Doe
s th
e C
ompa
ny s
et u
p in
tern
al n
orm
s to
pro
hibi
t th
e in
side
rs
from
ut
ilizi
ng
the
undi
sclo
sed
info
rmat
ion
to tr
ade
secu
ritie
s?
V
V
V
V
(一
) The
Com
pany
has
a s
poke
sper
son,
sto
ck a
ffairs
sup
ervi
sor,
and
asso
ciat
ed
pers
on
assi
gned
to
ef
fect
ivel
y ha
ndle
sh
areh
olde
r’s s
ugge
stio
ns o
r di
sput
es. L
egal
issu
es, i
f an
y,
will
be
hand
led
with
the
ass
ista
nce
of t
he l
egal
affa
ir pe
rson
nel.
(二)
Reg
ular
ly d
iscl
ose
the
pled
ge,
incr
ease
or
decr
ease
of
shar
ehol
ding
, or
the
occu
rren
ce o
f ot
her
even
ts th
at m
ay
caus
e si
gnifi
cant
ch
ange
s in
th
e sh
ares
of
th
e sh
areh
olde
rs w
ith o
ver
10%
sha
reho
ldin
g; a
lso,
mai
ntai
n a
good
rel
atio
nshi
p w
ith t
he m
ajor
sha
reho
lder
at
any
time
for c
ontro
l. (三
)Th
e m
anag
emen
t re
spon
sibi
litie
s of
the
Com
pany
and
the
af
filia
ted
ente
rpris
es
are
clea
rly
defin
ed;
also
, bu
sine
ss
trans
actio
ns
are
cond
ucte
d in
co
mpl
ianc
e w
ith
the
Com
pany
’s
inte
rnal
co
ntro
l sy
stem
an
d th
e re
leva
nt
requ
irem
ents
. For
stre
ngth
enin
g th
e co
ntro
l mec
hani
sm, t
he
proc
edur
es f
or m
onito
ring
subs
idia
ries
are
regu
late
d w
ith
prop
er ri
sk c
ontro
l. (四
) The
AD
VAN
TEC
H w
orke
d ou
t the
“Pr
oced
ure
Prev
entin
g In
side
r Tra
ding
” fo
r all
empl
oyee
s, m
anag
ers a
nd b
oard
m
embe
rs, a
s wel
l as t
hose
who
kno
w th
e in
form
atio
n
base
d on
the
occu
patio
n or
con
trol r
elat
ion
to p
rohi
bit a
ny
beha
vior
s tha
t cou
ld b
e in
volv
ed in
the
insi
der t
radi
ng, s
o th
at c
an p
rote
ct th
e rig
hts a
nd in
tere
sts o
f the
inve
stor
s and
th
e AD
VAN
TEC
H.T
he re
late
d in
form
atio
n ab
ove
is
disc
lose
d on
our
web
site
.
Non
e

29
Ass
essm
ent I
tem
s
Ope
ratio
n
Dev
iatin
g fr
om th
e “C
orpo
rate
G
over
nanc
e B
est-P
ract
ice
Prin
cipl
es fo
r TW
SE/G
TSM
Li
sted
Com
pani
es”
and
the
root
ca
use
Yes
No
Sum
mar
y
三、
Com
posi
tion
and
Res
pons
ibili
ties o
f the
Boa
rd
of
Dire
ctor
s (
一)
Doe
s the
Boa
rd o
f Dire
ctor
s hav
e di
vers
ified
pol
icie
s re
gula
ted
and
impl
emen
ted
subs
tant
ivel
y ac
cord
ing
to th
e co
mpo
sitio
n of
the
mem
bers
? (
二)
Doe
s th
e C
ompa
ny,
in
addi
tion
to
setti
ng
the
Rem
uner
atio
n C
omm
ittee
an
d A
udit
Com
mitt
ee
law
fully
, ha
ve o
ther
fun
ctio
nal
com
mitt
ee s
et u
p vo
lunt
arily
? (
三)
Doe
s th
e C
ompa
ny h
ave
the
perf
orm
ance
eva
luat
ion
rule
s an
d m
etho
ds
for
the
Boa
rd
of
Dire
ctor
s re
gula
ted
and
have
th
e pe
rfor
man
ce
eval
uatio
n pe
rfor
med
regu
larly
eve
ry y
ear?
(
四)
Doe
s th
e C
ompa
ny h
ave
the
inde
pend
ence
of
the
publ
ic a
ccou
ntan
t eva
luat
ed re
gula
rly?
V
V
V
V
(一
)The
Com
pany
has
the
boar
d di
rect
ors d
iver
sific
atio
n po
licy
defin
ed in
the
“Cor
pora
te G
over
nanc
e B
est-P
ract
ice
Prin
cipl
es.”
The
Com
pany
’s b
oard
mem
bers
mus
t be
equi
pped
with
the
finan
ce a
nd e
cono
mic
s, ac
coun
ting,
re
gula
tory
and
lead
ersh
ip, d
ecis
ion-
mak
ing,
and
op
erat
iona
l man
agem
ent a
bilit
ies f
or p
erfo
rmin
g jo
b du
ties
that
is b
enef
icia
l to
the
deve
lopm
ent a
nd o
pera
tions
of t
he
Com
pany
. (二
)The
Com
pany
has
the
Rem
uner
atio
n C
omm
ittee
set
up
law
fully
. The
Com
pany
’s c
orpo
rate
gov
erna
nce
is o
pera
ted
by
each
de
partm
ent
acco
rdin
g to
its
sp
ecifi
c jo
b re
spon
sibi
litie
s. Th
e C
ompa
ny d
oes
not
have
the
Aud
it C
omm
ittee
and
oth
er fu
nctio
nal c
omm
ittee
s se
t up,
but
will
de
pend
on
the
need
s an
d as
sess
men
t in
the
futu
re to
furth
er
deci
de.
(三) T
he C
ompa
ny h
as th
e “R
ules
Gov
erni
ng th
e Pe
rfor
man
ce
Eval
uatio
n of
the
Boa
rd o
f D
irect
ors”
ena
cted
with
the
pe
rfor
man
ce e
valu
atio
n of
the
inte
rnal
com
mitt
ee p
erfo
rmed
on
ce a
yea
r. Th
e pe
rfor
man
ce e
valu
atio
n m
etho
ds i
nclu
de
the
inte
rnal
sel
f-as
sess
men
t of
the
Boa
rd o
f D
irect
ors
and
the
self-
asse
ssm
ent
of
boar
d m
embe
rs
with
th
e se
lf-as
sess
men
t re
port
and
sugg
estio
ns f
or i
mpr
ovem
ent
prop
osed
to th
e B
oard
of
Dire
ctor
s. Th
e 20
15 p
erfo
rman
ce
eval
uatio
n of
the
Boa
rd o
f D
irect
ors
was
com
plet
ed b
y th
e bo
ard
dire
ctor
s w
ith
a se
lf-as
sess
men
t co
mpl
eted
on
D
ecem
ber 1
1, 2
015.
(四
)The
AD
VAN
TEC
H w
ill p
erio
dica
lly e
valu
ate
the
inde
pend
ency
of
visa
acc
ount
ant
via
the
follo
win
g ite
ms,
and
repo
rt th
e re
sults
to th
e B
oard
:
i.
Inde
pend
ent d
ecla
ratio
n of
acc
ount
ant
ii.Th
e A
udit
Com
mitt
ee
will
an
nual
ly
eval
uate
th
e
Non
e

30
Ass
essm
ent I
tem
s
Ope
ratio
n
Dev
iatin
g fr
om th
e “C
orpo
rate
G
over
nanc
e B
est-P
ract
ice
Prin
cipl
es fo
r TW
SE/G
TSM
Li
sted
Com
pani
es”
and
the
root
ca
use
Yes
No
Sum
mar
y
acco
unta
nt q
ualif
icat
ions
, in
clud
ing
the
audi
t se
rvic
e an
d th
e pr
ofes
sion
al c
apab
ility
, to
ensu
re th
e no
n-au
ditin
g af
fairs
w
ill n
ot in
fluen
ce th
e au
ditin
g re
sults
.
iii.
The
sam
e ac
coun
tant
doe
sn’t
cont
inuo
usly
exe
cute
the
vi
sa se
rvic
e ov
er se
ven
year
s.
iv.
The
non
-aud
iting
ite
ms
in 2
015,
suc
h as
the
mer
ger
of
B+B
Sm
artW
orx,
In
c.
is
not
auth
oriz
ed
to
the
visa
ac
coun
tant
for
pro
ving
the
rea
sona
ble
pric
e op
inio
n, h
ave
conf
orm
ed to
the
inde
pend
ency
regu
latio
n.
四、
Doe
s th
e C
ompa
ny h
ave
esta
blis
hed
a co
mm
unic
atio
n ch
anne
l fo
r th
e st
akeh
olde
rs,
set
the
stak
ehol
der
colu
mn
on t
he C
ompa
ny’s
web
site
, and
res
pond
ed t
o th
e st
akeh
olde
rs
rega
rdin
g th
eir
conc
erns
ov
er
corp
orat
e so
cial
resp
onsi
bilit
ies?
V
(一)T
he C
ompa
ny h
as a
spo
kesp
erso
n, s
tock
affa
irs s
uper
viso
r, an
d as
soci
ated
per
son
assi
gned
to e
stab
lish
a co
mpr
ehen
sive
co
mm
unic
atio
n ch
anne
l, an
d re
gula
rly o
r irr
egul
arly
hel
d br
iefin
gs
to
offe
r a
face
-to-f
ace
and
com
preh
ensi
ve
com
mun
icat
ion
inte
rfac
e ta
rget
ing
on
vario
us
issu
es
and
inqu
iries
. (二
)The
Com
pany
set
s up
the
Adv
ante
ch C
SR w
ebsi
te in
Eng
lish
and
the
stak
ehol
der
sect
ion
on t
he C
ompa
ny’s
web
site
. Th
e C
ompa
ny a
lso
resp
onds
to
the
stak
ehol
der’s
con
cern
ove
r C
SR
issu
es
thro
ugh
stak
ehol
der
ques
tionn
aire
, no
tice
o f
colle
ctio
n, w
ebsi
te, a
nd C
SR re
ports
.
Non
e
五、
Doe
s th
e C
ompa
ny h
ave
com
mis
sion
ed a
pro
fess
iona
l st
ock
affa
irs
serv
ice
agen
t to
ha
ndle
sh
areh
olde
rs
affa
irs?
V
The
Com
pany
com
mis
sion
ed a
pro
fess
iona
l st
ock
affa
irs s
ervi
ce
agen
t - K
GI
Secu
ritie
s C
o., L
td. S
hare
hold
er S
ervi
ce D
epar
tmen
t to
han
dle
the
Com
pany
’s s
tock
ser
vice
mat
ters
, an
d w
ith t
he
“Gui
delin
es f
or H
andl
ing
of S
tock
Affa
irs”
stip
ulat
ed to
reg
ulat
e th
e re
leva
nt o
pera
tions
.
Non
e
六、
Info
rmat
ion
disc
losu
re
(一)
Doe
s th
e C
ompa
ny h
ave
a w
ebsi
te s
etup
and
the
fin
anci
al
busi
ness
an
d co
rpor
ate
gove
rnan
ce
info
rmat
ion
disc
lose
d?
(二)
Doe
s th
e C
ompa
ny h
ave
adop
ted
othe
r in
form
atio
n di
sclo
sure
met
hods
(suc
h as
, est
ablis
hing
an
Engl
ish
web
site
, de
sign
atin
g re
spon
sibl
e pe
rson
fo
r co
llect
ing
and
disc
losi
ng
info
rmat
ion
of
the
V
V
(一
)The
com
pany
pro
file
and
busi
ness
info
rmat
ion
is d
iscl
osed
in
the
Com
pany
’s w
ebsi
te w
ith th
e sh
areh
olde
r’s s
ectio
n se
tup
to d
iscl
ose
finan
cial
info
rmat
ion
and
corp
orat
e go
vern
ance
; al
so,
to
esta
blis
h a
com
mun
icat
ion
chan
nel
for
com
mun
icat
ing
to in
vest
ors.
(二)T
he C
ompa
ny h
as i
nfor
mat
ion
fully
dis
clos
ed t
hrou
gh t
he
Non
e

31
Ass
essm
ent I
tem
s
Ope
ratio
n
Dev
iatin
g fr
om th
e “C
orpo
rate
G
over
nanc
e B
est-P
ract
ice
Prin
cipl
es fo
r TW
SE/G
TSM
Li
sted
Com
pani
es”
and
the
root
ca
use
Yes
No
Sum
mar
y
Com
pany
, su
bsta
ntia
ting
the
spok
esm
an
syst
em,
plac
ing
the
juris
tic p
erso
n se
min
ar p
rogr
am o
n th
e C
ompa
ny’s
web
site
, etc
.)?
Engl
ish
web
site
, as
sign
ing
the
Inve
stor
R
elat
ions
C
omm
issi
oner
for
inf
orm
atio
n co
llect
ion
and
disc
losu
re,
a cl
ear
spok
espe
rson
sys
tem
, an
d th
e in
vest
or c
onfe
renc
e on
th
e C
ompa
ny’s
web
site
. 七、
Are
ther
e an
y ot
her i
mpo
rtant
info
rmat
ion
(incl
udin
g bu
t no
t lim
ited
to t
he i
nter
ests
of
empl
oyee
s, em
ploy
ee
care
, in
vest
or r
elat
ions
, su
pplie
r re
latio
ns,
the
right
s of
sta
keho
lder
s, th
e co
ntin
uing
edu
catio
n of
dire
ctor
s an
d su
perv
isor
s, th
e im
plem
enta
tion
of
risk
man
agem
ent p
olic
ies a
nd ri
sk m
easu
rem
ent s
tand
ards
, th
e ex
ecut
ion
of c
usto
mer
pol
icy,
the
pur
chas
e of
lia
bilit
y in
sura
nce
for
the
Com
pany
’s d
irect
ors
and
supe
rvis
ors)
tha
t ar
e he
lpfu
l in
und
erst
andi
ng t
he
corp
orat
e go
vern
ance
ope
ratio
n of
the
Com
pany
?
V
(一) (
Col
lect
ive
Bar
gain
ing
Agr
eem
ent)保
障。
The
inte
rest
s of
empl
oyee
s an
d em
ploy
ee c
are:
Offe
r st
aff
sala
ries
high
er
than
the
min
imum
wag
e de
fined
in
the
Labo
r St
anda
rds
Act
, be
tter
empl
oyee
ben
efits
tha
n th
e in
dust
ry s
tand
ard,
in
sura
nce
cove
rage
and
pen
sion
ben
efits
acc
ordi
ng t
o th
e la
w; a
lso,
gro
up in
sura
nce
and
over
seas
bus
ines
s tra
velin
g in
sura
nce
in o
rder
to
prot
ect
the
wor
k an
d lif
e sa
fety
of
colle
ague
s. R
egul
ate
labo
r saf
ety
and
heal
th c
ode,
exe
rcis
e Jo
b Eq
ualit
y A
ct,
prov
ide
safe
, he
alth
y,
and
hara
ssm
ent-f
ree
wor
king
env
ironm
ent
and
cultu
re,
and
achi
eve
ISO
-140
01
(Env
ironm
enta
l M
anag
emen
t In
tern
atio
nal
Stan
dard
) an
d O
HSA
S-18
001
(Occ
upat
iona
l H
ealth
an
d Sa
fety
M
anag
emen
t Sy
stem
) ce
rtific
atio
n.
Initi
ate
two
perf
orm
ance
eva
luat
ions
of
the
colle
ague
s du
ring
the
mid
dle
of th
e ye
ar a
nd a
t the
end
of t
he y
ear
in
orde
r to
ac
hiev
e th
e ov
eral
l bu
sine
ss
plan
an
d as
a
refe
renc
e fo
r st
aff
prom
otio
n,
empl
oyee
tra
inin
g an
d de
velo
pmen
t, an
d pa
ymen
t of
sa
larie
s. En
sure
al
l em
ploy
ees
are
prot
ecte
d by
th
e C
olle
ctiv
e B
arga
inin
g A
gree
men
t th
roug
h la
bor
mee
tings
, de
partm
ent
mee
tings
, se
min
ars,
Sugg
estio
n B
ox,
and
othe
r co
mm
unic
atio
n ch
anne
ls.
(二) S
uppl
ier
rela
tion:
O
n th
e su
pplie
r m
anag
emen
t, th
e A
DV
AN
TEC
H h
ad i
ntro
duce
d th
e “E
lect
roni
c In
dust
ry
Cod
e of
Con
duct
(EI
CC
)” s
ince
201
0, a
nd s
trict
ly b
roug
ht
the
prin
cipl
e of
the
env
ironm
enta
l pr
otec
tion
into
the
m
echa
nism
of s
uppl
ier
man
agem
ent t
o es
tabl
ish
the
Gre
en
Non
e
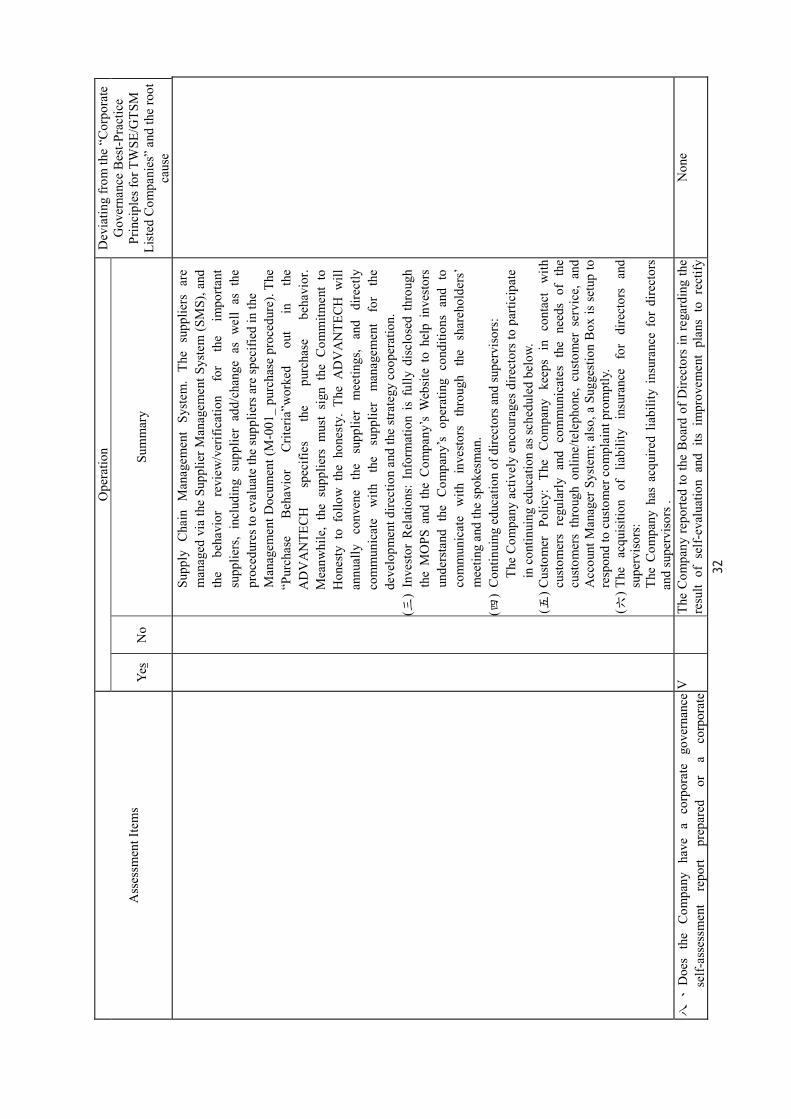
32
Ass
essm
ent I
tem
s
Ope
ratio
n
Dev
iatin
g fr
om th
e “C
orpo
rate
G
over
nanc
e B
est-P
ract
ice
Prin
cipl
es fo
r TW
SE/G
TSM
Li
sted
Com
pani
es”
and
the
root
ca
use
Yes
No
Sum
mar
y
Supp
ly
Cha
in M
anag
emen
t Sy
stem
. Th
e su
pplie
rs a
re
man
aged
via
the
Supp
lier M
anag
emen
t Sys
tem
(SM
S), a
nd
the
beha
vior
re
view
/ver
ifica
tion
for
the
impo
rtant
su
pplie
rs,
incl
udin
g su
pplie
r ad
d/ch
ange
as
wel
l as
the
pr
oced
ures
to e
valu
ate
the
supp
liers
are
spec
ified
in th
e M
anag
emen
t Doc
umen
t (M
-001
_ pu
rcha
se p
roce
dure
). Th
e “P
urch
ase
Beh
avio
r C
riter
ia”w
orke
d ou
t in
th
e A
DV
AN
TEC
H
spec
ifies
th
e pu
rcha
se
beha
vior
. M
eanw
hile
, th
e su
pplie
rs m
ust
sign
the
Com
mitm
ent
to
Hon
esty
to
follo
w t
he h
ones
ty.
The
AD
VA
NTE
CH
will
an
nual
ly
conv
ene
the
supp
lier
mee
tings
, an
d di
rect
ly
com
mun
icat
e w
ith
the
supp
lier
man
agem
ent
for
the
deve
lopm
ent d
irect
ion
and
the
stra
tegy
coo
pera
tion.
(三
) In
vest
or R
elat
ions
: In
form
atio
n is
ful
ly d
iscl
osed
thr
ough
th
e M
OPS
and
the
Com
pany
’s W
ebsi
te t
o he
lp i
nves
tors
un
ders
tand
the
Com
pany
’s o
pera
ting
cond
ition
s an
d to
co
mm
unic
ate
with
in
vest
ors
thro
ugh
the
shar
ehol
ders
’ m
eetin
g an
d th
e sp
okes
man
. (四
) C
ontin
uing
edu
catio
n of
dire
ctor
s and
supe
rvis
ors:
Th
e C
ompa
ny a
ctiv
ely
enco
urag
es d
irect
ors t
o pa
rtici
pate
in
con
tinui
ng e
duca
tion
as sc
hedu
led
belo
w.
(五) C
usto
mer
Po
licy:
Th
e C
ompa
ny
keep
s in
co
ntac
t w
ith
cust
omer
s re
gula
rly a
nd c
omm
unic
ates
the
nee
ds o
f th
e cu
stom
ers
thro
ugh
onlin
e/te
leph
one,
cus
tom
er s
ervi
ce,
and
Acc
ount
Man
ager
Sys
tem
; als
o, a
Sug
gest
ion
Box
is s
etup
to
resp
ond
to c
usto
mer
com
plai
nt p
rom
ptly
. (六
) The
ac
quis
ition
of
lia
bilit
y in
sura
nce
for
dire
ctor
s an
d su
perv
isor
s:
The
Com
pany
has
acq
uire
d lia
bilit
y in
sura
nce
for
dire
ctor
s an
d su
perv
isor
s .
八、
Doe
s th
e C
ompa
ny
have
a
corp
orat
e go
vern
ance
se
lf-as
sess
men
t re
port
prep
ared
or
a
corp
orat
e V
Th
e C
ompa
ny re
porte
d to
the
Boa
rd o
f Dire
ctor
s in
rega
rdin
g th
e re
sult
of s
elf-
eval
uatio
n an
d its
im
prov
emen
t pl
ans
to r
ectif
y N
one
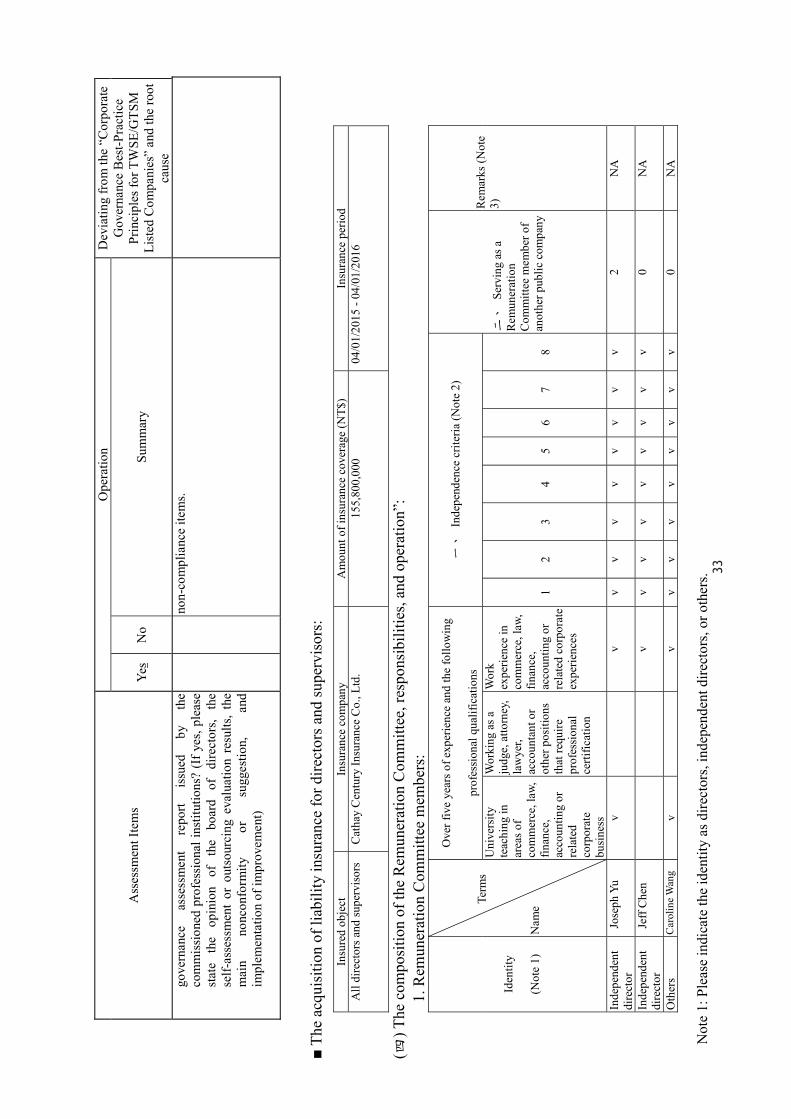
33
Ass
essm
ent I
tem
s
Ope
ratio
n
Dev
iatin
g fr
om th
e “C
orpo
rate
G
over
nanc
e B
est-P
ract
ice
Prin
cipl
es fo
r TW
SE/G
TSM
Li
sted
Com
pani
es”
and
the
root
ca
use
Yes
No
Sum
mar
y
gove
rnan
ce
asse
ssm
ent
repo
rt is
sued
by
th
e co
mm
issi
oned
pro
fess
iona
l ins
titut
ions
? (I
f yes
, ple
ase
stat
e th
e op
inio
n of
th
e bo
ard
of
dire
ctor
s, th
e se
lf-as
sess
men
t or
out
sour
cing
eva
luat
ion
resu
lts,
the
mai
n no
ncon
form
ity
or
sugg
estio
n,
and
impl
emen
tatio
n of
impr
ovem
ent)
non-
com
plia
nce
item
s.
■ Th
e ac
quis
ition
of l
iabi
lity
insu
ranc
e fo
r dire
ctor
s and
supe
rvis
ors:
In
sure
d ob
ject
In
sura
nce
com
pany
A
mou
nt o
f ins
uran
ce c
over
age
(NT$
) In
sura
nce
perio
d A
ll di
rect
ors a
nd su
perv
isor
s C
atha
y C
entu
ry In
sura
nce
Co.
, Ltd
. 15
5,80
0,00
0 04
/01/
2015
- 04
/01/
2016
(四) T
he c
ompo
sitio
n of
the
Rem
uner
atio
n C
omm
ittee
, res
pons
ibili
ties,
and
oper
atio
n”:
1. R
emun
erat
ion
Com
mitt
ee m
embe
rs:
Iden
tity
(Not
e 1)
T
erm
s
Nam
e
Ove
r fiv
e ye
ars o
f exp
erie
nce
and
the
follo
win
g
prof
essi
onal
qua
lific
atio
ns
一、
In
depe
nden
ce c
riter
ia (N
ote
2)
二、
Se
rvin
g as
a
Rem
uner
atio
n C
omm
ittee
mem
ber o
f an
othe
r pub
lic c
ompa
ny
Rem
arks
(Not
e 3)
Uni
vers
ity
teac
hing
in
area
s of
com
mer
ce, l
aw,
finan
ce,
acco
untin
g or
re
late
d co
rpor
ate
busi
ness
Wor
king
as a
ju
dge,
atto
rney
, la
wye
r, ac
coun
tant
or
othe
r pos
ition
s th
at re
quire
pr
ofes
sion
al
certi
ficat
ion
Wor
k ex
perie
nce
in
com
mer
ce, l
aw,
finan
ce,
acco
untin
g or
re
late
d co
rpor
ate
expe
rienc
es
12
3 4
56
7 8
Inde
pend
ent
dire
ctor
J
osep
h Yu
v
v
vv
v v
vv
v v
2 N
A
Inde
pend
ent
dire
ctor
J
eff C
hen
v
vv
v v
vv
v v
0 N
A
Oth
ers
Car
olin
e W
ang
v
v v
v v
v v
vv
v 0
NA
N
ote
1: P
leas
e in
dica
te th
e id
entit
y as
dire
ctor
s, in
depe
nden
t dire
ctor
s, or
oth
ers.

34
Not
e 2:
A “
“ is
mar
ked
in th
e sp
ace
bene
ath
the
resp
ectiv
e co
lum
n w
hen
a di
rect
or o
r sup
ervi
sor h
as m
et th
at c
ondi
tion
durin
g th
e tw
o-ye
ar p
rior t
o el
ectio
n an
d du
ring
his o
r her
per
iod
of se
rvic
e; th
e co
nditi
ons a
re a
s fol
low
s: (
1) N
ot e
mpl
oyed
by
the
Com
pany
or a
n af
filia
ted
busi
ness
. (
2) N
ot a
dire
ctor
or s
uper
viso
r of t
he C
ompa
ny o
r its
affi
liate
d co
mpa
ny. T
his
rest
rictio
n do
es n
ot a
pply
to in
depe
nden
t dire
ctor
s of
sub
sidi
arie
s in
whi
ch
the
com
pany
or i
ts p
aren
t com
pany
dire
ctly
or i
ndire
ctly
hol
ds o
ver 5
0% o
f the
shar
ehol
der v
otin
g rig
hts.
(3)
com
pany
shar
es o
r bei
ng a
top-
10 n
atur
al p
erso
n sh
areh
olde
r in
one’
s ow
n na
me,
hel
d by
a sp
ouse
or u
nder
age
child
, or h
eld
by n
omin
ee a
gree
men
t. (
4) N
eith
er a
spou
se, s
econ
d-de
gree
rela
tive,
nor
a fi
fth d
egre
e di
rect
rela
tive
of th
e pe
rson
s lis
ted
unde
r the
pre
viou
s thr
ee it
ems.
(5)
Nei
ther
a d
irect
or, s
uper
viso
r or e
mpl
oyee
of a
n in
stitu
tiona
l sha
reho
lder
dire
ctly
ow
ning
mor
e th
an 5
% o
f the
com
pany
’s o
utst
andi
ng s
hare
s, no
r one
of
the
com
pany
’s to
p-fiv
e in
stitu
tiona
l sha
reho
lder
. (
6) N
eith
er a
dire
ctor
, sup
ervi
sor,
man
ager
or
shar
ehol
der
hold
ing
mor
e th
an a
5%
sta
ke i
n ce
rtain
com
pani
es o
r in
stitu
tions
tha
t ha
ve a
fin
anci
al o
r bu
sine
ss re
latio
nshi
p w
ith th
e C
ompa
ny.
(7)
Not
a p
rofe
ssio
nal
who
pro
vide
s co
mm
erci
al,
lega
l, fin
anci
al,
and
acco
untin
g se
rvic
es o
r co
nsul
ting
to t
he C
ompa
ny o
r its
affi
liate
d co
mpa
nies
, pr
oprie
tor,
partn
er, o
wne
r of a
com
pany
or a
n in
stitu
tion,
par
tner
, dire
ctor
(exe
cutiv
e), s
uper
viso
r (ex
ecut
ive)
, man
ager
, and
thei
r spo
uses
. (
8) St
andi
ng d
oes n
ot m
atch
any
of t
he sc
enar
ios d
escr
ibed
in A
rticl
e 30
of t
he C
ompa
ny L
aw.
Not
e 3:
Ple
ase
indi
cate
whe
ther
the
mem
ber
who
is
a di
rect
or c
ompl
ies
with
the
req
uire
men
t of
Arti
cle
6 Pa
ragr
aph
5 of
the
“R
egul
atio
ns G
over
ning
the
A
ppoi
ntm
ent
and
Exer
cise
of
Pow
ers
by t
he R
emun
erat
ion
Com
mitt
ee o
f a
Com
pany
Who
se S
tock
is
List
ed o
n th
e St
ock
Exch
ange
or
Trad
ed o
ver
the
Cou
nter
.”
2. T
he o
pera
tion
of R
emun
erat
ion
Com
mitt
ee
一、
Ther
e ar
e th
ree
mem
bers
in R
emun
erat
ion
Com
mitt
ee o
f the
Com
pany
. 二、
Cur
rent
term
of o
ffice
: Jun
e 18
, 201
4 ~
June
17,
201
7; th
e m
ost r
ecen
t yea
r (20
15)
The
Boa
rd h
eld
2 m
eetin
gs (A
) with
the
atte
ndan
ce re
cord
and
qua
lific
atio
n of
Com
mitt
ee m
embe
rs a
s fol
low
s:
Title
N
ame
Act
ual
atte
ndan
ce (B
)A
ttend
ance
by
prox
y A
ctua
l atte
ndan
ce ra
te (%
) (B
/A)
(Not
e)
Rem
arks
Con
vene
r Jo
seph
Yu
2
0 10
0%
Ree
lect
ed
Inde
pend
ent
dire
ctor
Je
ff C
henn
2
0 10
0%
New
ly e
lect
ed
Com
mitt
ee
Mem
ber
Car
olin
e W
ang
2 0
100%
R
eele
cted
Oth
er re
quire
d in
form
atio
n:
一、
If
the
Boa
rd o
f Dire
ctor
s do
es n
ot a
ccep
t or a
men
d th
e su
gges
tions
of t
he R
emun
erat
ion
Com
mitt
ee, p
leas
e st
ate
the
Boa
rd m
eetin
g da
te, t
erm
, th
e m
otio
ns, c
onte
nt o
f the
reso
lutio
ns o
f the
Boa
rd, a
nd th
e C
ompa
ny’s
han
dlin
g th
e op
inio
ns p
ropo
sed
by th
e R
emun
erat
ion
Com
mitt
ee: N
one
二、
Fo
r res
olut
ions
reac
hed
by th
e R
emun
erat
ion
Com
mitt
ee re
gard
ing
whi
ch in
depe
nden
t dire
ctor
s ha
ve v
oice
d op
posi
ng o
r qua
lifie
d op
inio
ns o
n th
e re
cord
or i
n w
ritin
g, th
e R
emun
erat
ion
Com
mitt
ee m
eetin
g da
te, p
erio
d, c
onte
nt o
f the
reso
lutio
n, o
pini
ons
of a
ll m
embe
rs, a
nd th
e ha
ndlin
g of
the
opin
ions
of t
he m
embe
rs: N
one.

35
(五) F
ulfil
ling
soci
al re
spon
sibi
litie
s:
Ass
essm
ent i
tem
s
Ope
ratio
n (N
ote
1)
Dev
iatin
g fr
om th
e “C
orpo
rate
Soc
ial
Res
pons
ibili
ty B
est-P
ract
ice
Prin
cipl
es
for T
WSE
/GTS
M L
iste
d C
ompa
nies
” an
d th
e ro
ot c
ause
Ye
sN
oSu
mm
ary
(Not
e 2)
一、
Subs
tant
iatio
n of
cor
pora
te g
over
nanc
e (
一)
Doe
s th
e C
ompa
ny h
ave
the
CSR
pol
icie
s or
sys
tem
s es
tabl
ishe
d an
d th
e im
plem
enta
tion
effe
ct re
view
ed?
(二)
Doe
s th
e C
ompa
ny h
ave
the
CSR
edu
catio
n an
d tra
inin
g ar
rang
ed o
n a
regu
lar b
asis
? (
三)
Doe
s the
Com
pany
hav
e a
spec
ific
(or p
art-t
ime)
uni
t set
up
to
prom
ote
corp
orat
e so
cial
re
spon
sibi
lity,
ha
ve
the
man
agem
ent
auth
oriz
ed b
y th
e B
oard
of
Dire
ctor
s to
ha
ndle
mat
ters
and
rep
ort
the
proc
essi
ng r
esul
ts t
o th
e B
oard
of D
irect
ors?
(
四)
Doe
s th
e C
ompa
ny
have
a
reas
onab
le
sala
ry
and
rem
uner
atio
n po
licy
setu
p,
have
th
e em
ploy
ee
perf
orm
ance
eva
luat
ion
syst
em c
ombi
ned
with
cor
pora
te
soci
al
resp
onsi
bilit
y po
licie
s, an
d ha
ve
a cl
ear
and
effe
ctiv
e re
war
d an
d pu
nish
men
t sys
tem
est
ablis
hed?
V V V V
(一
) Th
e A
DVA
NTE
CH
est
ablis
hed
the
prac
tice
rule
s fo
r C
orpo
rate
So
cial
ity
Res
pons
ibili
ty
(CSR
), w
hich
is
is
sued
by
the
Boa
rd o
f the
Dire
ctor
s; th
e C
SR u
nit w
ill
colle
ct th
e pr
ojec
ts a
nd p
rogr
ess
rela
ted
to th
e C
SR a
nd
repo
rt to
the
Boa
rd C
hairm
an, w
ho p
erso
nally
gav
e th
e di
rect
ions
and
stra
tegi
c su
gges
tions
as
wel
l an
nual
ly
repo
rt th
e co
nten
ts to
the
Boa
rd o
f the
Dire
ctor
s fo
r the
an
nual
stra
tegy
and
revi
ew.
The
CSR
uni
t in
the
AD
VAN
TEC
H i
s su
bord
inat
e to
th
e C
orpo
rate
So
cial
ity
Res
pons
ibili
ty
Dire
ctin
g C
omm
ittee
(le
d by
th
e B
oard
C
hairm
an),
whi
ch
perio
dica
lly c
onve
nes
mee
tings
to
conf
irm a
nd r
evie
w
the
prom
otio
n an
d st
rate
gy o
f th
e C
SR a
s w
ell
as
appr
oves
the
annu
al s
usta
inab
ility
repo
rt. T
he D
irect
ing
Com
mitt
ee s
et u
p on
e of
fice
and
six
subc
omm
ittee
s, w
hich
are
“Pr
omot
ion
Offi
ce”,
”C
orpo
rate
Gov
erna
nce
Com
mitt
ee”,
“L
abor
-cap
ital
Rel
atio
n C
omm
ittee
”,
“Env
ironm
enta
l Pr
otec
tion
Com
mitt
ee”,
“E
xter
nal
Com
mun
icat
ion
Com
mitt
ee”,
“S
ocia
lity
Car
e C
omm
ittee
”,
and
“Ind
ustry
-aca
dem
ic
Coo
pera
tion
Com
mitt
ee”
to d
irect
the
eco
nom
y, e
nviro
nmen
t an
d so
cial
ity o
f th
e C
SR.
The
deta
iled
parts
to
fulfi
ll th
e C
SR st
rate
gy a
re re
cord
ed in
the
CSR
Rep
ort.
(二
) I.T
he C
ompa
ny h
as t
he C
SR e
duca
tion
and
train
ing
arra
nged
in
the
orie
ntat
ion
that
is
held
onc
e in
eve
ry
two-
mon
th.
II. N
ot o
nly
prov
ide
a co
py o
f th
e le
arni
ng m
anua
l for
ne
w e
mpl
oyee
s on
the
firs
t da
y w
hen
they
are
on
boar
d,
but
also
ex
plai
n ite
m
by
item
, w
hich
th
e co
nten
ts
com
pris
e an
ti-br
iber
y,
hum
an
right
, en
viro
nmen
t and
labo
r cod
es, a
s w
ell a
s up
load
on
the
web
site
for
the
enq
uiry
at
any
time;
the
y w
ill b
e em
phas
ized
an
d ex
plai
ned
agai
n in
th
e em
ploy
ee
Non
e

36
Ass
essm
ent i
tem
s
Ope
ratio
n (N
ote
1)
Dev
iatin
g fr
om th
e “C
orpo
rate
Soc
ial
Res
pons
ibili
ty B
est-P
ract
ice
Prin
cipl
es
for T
WSE
/GTS
M L
iste
d C
ompa
nies
” an
d th
e ro
ot c
ause
Ye
sN
oSu
mm
ary
(Not
e 2)
train
ing,
as
wel
l as
req
uire
d to
stri
ctly
exe
cute
and
ob
ey;
ther
e is
a u
nit
of “
mor
ality
and
eth
ics”
for
the
m
anag
ers
to
ensu
re
they
ca
n se
t an
ex
ampl
e by
pe
rson
ally
taki
ng p
art.
III.I
n or
der
to
guid
e th
e em
ploy
ee
beha
vior
in
co
mpl
ianc
e w
ith th
e m
orta
lity,
we
mak
e th
e in
tere
sted
pa
rties
un
ders
tand
an
d fo
llow
ou
r m
orta
litie
s, in
clud
ing:
the
pro
hibi
tion
agai
nst
the
impr
oper
gift
, br
iber
y or
ben
efit
from
oth
er p
eopl
e, i
nsid
er t
radi
ng,
no d
iffer
ence
tre
atm
ent
owin
g to
the
gen
der,
race
, re
ligio
n, p
arty
, ap
titud
e, j
ob p
ositi
on,
natio
nalit
y an
d ag
e, o
r di
scrim
inat
ion
in a
ny f
orm
as
wel
l as
the
ad
hesi
on
to
empl
oyee
la
bor
and
envi
ronm
enta
l re
gula
tions
. “E
mpl
oyee
B
ehav
ior
Crit
eria
” ar
e up
load
ed o
n th
e w
ebsi
te fo
r the
enq
uiry
and
read
ing.
IV
. The
pur
chas
e un
its a
nd th
e em
ploy
ees a
nd m
anag
ers
in c
harg
e of
pur
chas
e ar
e re
quire
d to
dea
l w
ith t
he
wor
ldw
ide
purc
hase
act
iviti
es b
ased
on
the
high
est
ethi
cs. T
he p
urpo
se is
to p
reve
nt th
e im
prop
er b
ehav
ior o
r brib
ery;
the
supp
liers
are
requ
ired
to s
ign
“Com
mitm
ent t
o H
ones
ty”,
and
the
mai
lbox
is
esta
blis
hed
for
com
plai
n to
elim
inat
e ou
r em
ploy
ees
from
brib
ery.
(三
) Th
e C
ompa
ny h
as a
“C
orpo
rate
Cul
ture
and
Soc
ial
Res
pons
ibili
ty”
Dep
artm
ent
setu
p;
also
, th
ere
are
spec
ific
indi
vidu
als
resp
onsi
ble
for
plan
ning
an
d pr
omot
ing
indu
stry
-aca
dem
ia c
olla
bora
tion,
Abl
e C
lub,
so
cial
wel
fare
, arts
and
cul
ture
s sp
onso
rshi
p, c
orpo
rate
so
cial
res
pons
ibili
ty w
ebsi
tes,
and
othe
r C
SR-r
elat
ed
proj
ects
. The
wor
k pr
ogre
ss a
nd p
roje
ct a
chie
vem
ent i
s re
porte
d to
the
Cha
irman
and
the
Boa
rd o
f D
irect
ors
perio
dica
lly.
Plea
se
refe
r to
th
e ill
ustra
tion
belo
w
rega
rdin
g th
e C
SR-r
elat
ed ta
sks:
C
SR W
ebsi
te:
http
://w
ww
.adv
ante
ch.tw
/csr
/ C
orpo
rate
Soc
ial R
espo
nsib
ility
Rep
ort (
CSR
Rep
ort):

37
Ass
essm
ent i
tem
s
Ope
ratio
n (N
ote
1)
Dev
iatin
g fr
om th
e “C
orpo
rate
Soc
ial
Res
pons
ibili
ty B
est-P
ract
ice
Prin
cipl
es
for T
WSE
/GTS
M L
iste
d C
ompa
nies
” an
d th
e ro
ot c
ause
Ye
sN
oSu
mm
ary
(Not
e 2)
http
://w
fcac
he.a
dvan
tech
.com
/ww
w/c
sr/p
df/c
sr_2
014_
repo
rt.pd
f A
dvan
tech
Co.
, Ltd
. Abl
e C
lub
web
site
: ht
tp://
able
club
.adv
ante
ch.c
om.tw
In
add
ition
, in
orde
r to
sub
stan
tiate
the
spiri
t of
corp
orat
e so
cial
res
pons
ibili
ty, e
xcep
t for
the
spec
ifica
lly d
esig
nate
d de
partm
ents
, in
res
pons
e to
the
diff
eren
t pr
ofes
sion
s an
d fo
cuse
s fo
r ea
ch C
SR p
roje
ct,
a tra
ns-d
epar
tmen
tal
wor
k te
am is
set
up to
be
resp
onsi
ble
for p
lann
ing
and
exec
utio
n.
Such
as,
for
Cor
pora
te S
ocia
l R
espo
nsib
ility
Rep
ort,
the
Cor
pora
te
Cul
ture
D
epar
tmen
t, B
rand
D
evel
opm
ent
Dep
artm
ent,
and
Publ
ic
Rel
atio
n D
epar
tmen
t sh
all
coop
erat
e to
or
gani
ze
a tra
ns-d
epar
tmen
tal
Prom
otio
n O
ffice
jo
intly
w
ith
all
the
acco
unta
ble
depa
rtmen
ts,
incl
udin
g “C
orpo
rate
G
over
nanc
e C
omm
ittee
,”
“Lab
or
Rel
atio
n C
omm
ittee
,”
“Env
ironm
enta
l Pr
otec
tion
Ener
gy-S
avin
g C
omm
ittee
,”
“Com
mun
icat
ion
Com
mitt
ee,”
“S
ocia
l C
are
Com
mitt
ee,”
“I
ndus
try-A
cade
mia
C
olla
bora
tion
Com
mitt
ee,”
et
c.
to
prom
ote
and
real
ize
corp
orat
e so
cial
resp
onsi
bilit
y.
(四
) Th
e C
ompa
ny h
as a
rea
sona
ble
rem
uner
atio
n po
licy
setu
p;
also
, re
quire
d em
ploy
ees
to
com
ply
with
A
dvan
tech
Cod
e of
Con
duct
and
Pra
ctic
ed th
e “I
nteg
rity
and
Prob
ity”
of c
orpo
rate
val
ue.
The
empl
oyee
s ar
e ev
alua
ted
with
the
Com
pass
ion
Awar
d is
sued
for
the
ir pa
rtici
patin
g in
the
char
ity a
ctiv
ities
, or
the
offe
nder
s of
th
e C
ode
of C
ondu
ct w
ill b
e di
scip
lined
acc
ordi
ngly
. 二
、D
evel
opm
ent o
f sus
tain
able
env
ironm
ent
(一
)Is
the
Com
pany
com
mitt
ed t
o en
hanc
e th
e ut
iliza
tion
effic
ienc
y of
res
ourc
es a
nd u
se r
enew
able
mat
eria
ls t
hat
are
with
low
impa
ct o
n th
e en
viro
nmen
t?
(二
)D
oes
the
Com
pany
hav
e an
app
ropr
iate
env
ironm
enta
l m
anag
emen
t sy
stem
est
ablis
hed
in a
ccor
danc
e w
ith i
ts
indu
stria
l cha
ract
er?
(三
)D
oes
the
Com
pany
pay
atte
ntio
n to
the
impa
ct o
f cl
imat
e
V
V
(一
) The
Com
pany
is
com
mitt
ed t
o en
hanc
e th
e ut
iliza
tion
effic
ienc
y of
res
ourc
es a
nd u
se r
enew
able
mat
eria
ls t
hat
are
with
low
impa
ct o
n th
e en
viro
nmen
t (二
) Th
e C
ompa
ny
has
esta
blis
hed
ESH
M
anag
emen
t C
omm
ittee
and
ISO
1400
1 en
viro
nmen
tal
man
agem
ent
syst
em, w
hich
incl
udes
the
follo
win
g ite
ms:
一
、C
olle
ct,
asse
ss,
and
iden
tify
the
impa
ct o
f th
e
Non
e

38
Ass
essm
ent i
tem
s
Ope
ratio
n (N
ote
1)
Dev
iatin
g fr
om th
e “C
orpo
rate
Soc
ial
Res
pons
ibili
ty B
est-P
ract
ice
Prin
cipl
es
for T
WSE
/GTS
M L
iste
d C
ompa
nies
” an
d th
e ro
ot c
ause
Ye
sN
oSu
mm
ary
(Not
e 2)
chan
ge
on
the
oper
atio
nal
activ
ities
, im
plem
ent
gree
nhou
se
gas
chec
k,
and
form
an
en
ergy
-sav
ing,
ca
rbon
-red
uctio
n, a
nd g
reen
hous
e em
issi
ons
redu
ctio
n st
rate
gy?
V
Com
pany
’s a
ctiv
ities
, pro
duct
s, an
d se
rvic
es o
n th
e na
tura
l env
ironm
ent.
二、
Esta
blis
h m
easu
rabl
e go
als
of
envi
ronm
enta
l su
stai
nabi
lity
and
regu
larly
rev
iew
the
con
tinui
ty
and
rele
vanc
e of
its d
evel
opm
ent.
三、。
Set s
peci
fic a
ctio
n pl
ans
and
regu
larly
revi
ew th
e ef
fect
iven
ess o
f the
ope
ratio
n.
(三)T
he
Com
pany
ad
opts
th
e gu
idel
ines
of
IS
O14
064
com
mon
ly u
sed
dom
estic
ally
and
int
erna
tiona
lly a
nd
CD
P C
arbo
n D
iscl
osur
e Pl
an t
o im
plem
ent
gree
nhou
se
gas i
nspe
ctio
n an
d di
sclo
sure
with
in th
e sc
ope
of:
一、
Dire
ct g
reen
hous
e ga
s em
issi
ons
二、
Indi
rect
gre
enho
use
gas e
mis
sion
s Th
e C
ompa
ny d
oes p
ay a
ttent
ion
to th
e im
pact
of c
limat
e ch
ange
on
the
oper
atio
nal
activ
ities
, fo
rm a
nd a
ctiv
ate
an
ener
gy-s
avin
g, c
arbo
n-re
duct
ion,
and
gre
enho
use
emis
sion
s re
duct
ion
stra
tegy
acc
ordi
ng t
o th
e bu
sine
ss o
pera
tion
and
gree
nhou
se g
as c
heck
res
ults
in o
rder
to r
educ
e th
e im
pact
of
the
Com
pany
’s b
usin
ess a
ctiv
ity o
n th
e cl
imat
e ch
ange
.
三、
Mai
nten
ance
of s
ocia
l wel
fare
(
一)
Doe
s th
e C
ompa
ny h
ave
the
rele
vant
man
agem
ent p
olic
ies
and
proc
edur
es s
tipul
ated
in a
ccor
danc
e w
ith th
e re
leva
nt
law
s an
d re
gula
tions
and
int
erna
tiona
l co
nven
tions
on
hum
an ri
ghts
? (
二)
Doe
s th
e C
ompa
ny h
ave
the
com
plai
nt m
echa
nism
and
ch
anne
l es
tabl
ishe
d fo
r em
ploy
ees
and
have
it
hand
led
prop
erly
? (
三)
Doe
s th
e C
ompa
ny p
rovi
de e
mpl
oyee
with
a s
afe
and
heal
thy
wor
king
env
ironm
ent,
and
prov
ide
safe
ty a
nd
heal
th e
duca
tion
to e
mpl
oyee
s reg
ular
ly?
(四
)D
oes
the
Com
pany
hav
e es
tabl
ishe
d a
mec
hani
sm o
f pe
riodi
cal
com
mun
icat
ion
with
em
ploy
ees
and
have
the
em
ploy
ee n
otifi
ed i
n a
reas
onab
le m
anne
r re
gard
ing
the
pote
ntia
l im
pact
of t
he o
pera
tion
chan
ges.
V V V V
(
一)
In
com
plia
nce
with
th
e re
leva
nt
law
s an
d la
bor
regu
latio
ns a
nd i
n ac
cord
ance
with
Int
erna
tiona
l La
bor
Con
vent
ion
and
Inte
rnat
iona
l B
ill o
f H
uman
Rig
hts,
Adv
ante
ch C
o. L
td.
form
ulat
ed B
usin
ess
Con
duct
and
th
e Em
ploy
ee H
andb
ook
and
had
them
pub
lishe
d on
the
Empl
oyee
Por
tal f
or th
e co
nven
ienc
e of
our
em
ploy
ees
and
man
ager
s. A
dvan
tech
res
pect
s fo
r em
ploy
ees’
equa
l ap
poin
tmen
t an
d ca
reer
dev
elop
men
t opp
ortu
nitie
s an
d w
ill h
ave
no
disp
arat
e tre
atm
ent
disc
rimin
atio
n,
or
any
form
of
di
scrim
inat
ion
in
term
s of
pe
rson
al
gend
er,
race
, re
ligio
n, p
oliti
cal
party
, se
xual
orie
ntat
ion,
ran
k, a
ge,
natio
nalit
y an
d ot
her i
ssue
s. W
e ar
e co
mm
itted
to
prov
idin
g em
ploy
ees
with
a s
afe
and
high
-qua
lity
wor
k en
viro
nmen
t, an
d w
ith re
spec
t to
our
polic
ies,
Adv
ante
ch f
aith
fully
abi
des
by a
ll ki
nds
Non
e

39
Ass
essm
ent i
tem
s
Ope
ratio
n (N
ote
1)
Dev
iatin
g fr
om th
e “C
orpo
rate
Soc
ial
Res
pons
ibili
ty B
est-P
ract
ice
Prin
cipl
es
for T
WSE
/GTS
M L
iste
d C
ompa
nies
” an
d th
e ro
ot c
ause
Ye
sN
oSu
mm
ary
(Not
e 2)
(五
)D
oes
the
Com
pany
hav
e an
effe
ctiv
e ca
reer
cap
acity
de
velo
pmen
t tra
inin
g pr
ogra
m
esta
blis
hed
for
the
empl
oyee
s?
(六)
Doe
s th
e C
ompa
ny h
ave
the
rele
vant
con
sum
er p
rote
ctio
n po
licie
s and
com
plai
nt p
roce
dure
s est
ablis
hed
in th
e se
nse
of R
&D
, pro
cure
men
t, pr
oduc
tion,
ope
ratio
ns, a
nd se
rvic
e pr
oces
ses?
(
七)
Doe
s th
e C
ompa
ny h
ave
prod
ucts
and
ser
vice
s m
arke
ted
and
labe
led
in a
ccor
danc
e w
ith t
he r
elev
ant
regu
latio
ns
and
inte
rnat
iona
l nor
ms?
(
八)
D
oes t
he C
ompa
ny h
ave
the
supp
liers
che
cked
in a
dvan
ce
for
any
reco
rds
of
impa
ctin
g th
e en
viro
nmen
t an
d so
ciet
y?
(九)
D
oes
the
cont
ract
sig
ned
by th
e C
ompa
ny w
ith th
e m
ajor
su
pplie
rs
entit
le
the
Com
pany
to
ha
ve
the
cont
ract
ca
ncel
led
or t
erm
inat
ed a
t an
y tim
e w
hen
the
supp
liers
vi
olat
e th
e C
SR p
olic
ies
that
hav
e a
sign
ifica
nt im
pact
on
the
envi
ronm
ent a
nd so
ciet
y?
V V V V
V
empl
oym
ent a
nd la
bor l
aws;
em
ploy
men
t of c
hild
labo
r or
ille
gal
wor
kers
is
proh
ibite
d; s
exua
l ha
rass
men
t is
pr
ohib
ited;
and
the
com
pany
is c
omm
itted
to p
rovi
ding
em
ploy
ees
with
a s
afe
and
heal
thy
wor
k en
viro
nmen
t co
mpl
ying
w
ith
vario
us
envi
ronm
enta
l la
ws
and
regu
latio
ns
and
avoi
ding
en
viro
nmen
tal
pollu
tion
thro
ugh
prop
er m
anag
emen
t and
tech
nica
l app
licat
ions
.(
二)
Adv
ante
ch c
reat
ed S
ugge
stio
n B
ox o
n th
e Em
ploy
ee
Porta
l en
cour
agin
g em
ploy
ees
to m
ake
com
men
ts i
n a
posi
tive
way
, in
clud
ing
wor
kflo
w
impr
ovem
ent,
envi
ronm
enta
l im
prov
emen
t, pr
oduc
t ad
vice
or
cr
oss-
depa
rtmen
tal o
pera
tions
, so
as to
bui
ld a
cul
ture
of
parti
cipa
tion
in t
he o
pera
tion
of t
he c
ompa
ny a
nd t
o en
cour
age
empl
oyee
s to
mak
e su
gges
tions
at
any
time.
A
fter
rece
ivin
g th
e pr
opos
al fr
om th
e em
ploy
ee, H
uman
R
esou
rces
Dep
artm
ent w
ill f
orw
ard
it to
the
head
of t
he
rele
vant
dep
artm
ent,
whi
ch
will
ass
ess
the
prop
osal
co
nten
t and
the
need
for i
mpr
ovem
ent.
Afte
r the
con
tent
is
ca
refu
lly
asse
ssed
an
d co
nclu
ded,
th
e co
lleag
ue
mak
ing
the
prop
osal
will
sim
ulta
neou
sly
rece
ive
the
rela
ted
info
rmat
ion
on th
e ca
se c
oncl
uded
. (
三)
The
Com
pany
offe
rs e
mpl
oyee
s sa
fe a
nd h
ealth
y w
orki
ng e
nviro
nmen
t and
pas
ses
the
occu
patio
nal s
afet
y an
d he
alth
man
agem
ent
syst
em c
ertif
icat
ion;
pro
vide
s em
ploy
ees
with
ann
ual h
ealth
che
cks
that
is b
ette
r th
an
the
requ
irem
ent o
f the
Lab
or S
tand
ards
Act
; als
o, h
as th
e sa
fety
and
hea
lth e
duca
tion
arra
nged
in
the
orie
ntat
ion
that
is h
eld
once
in e
very
two-
mon
th.
(四
)A
dvan
tech
re
leas
es
and
anno
unce
s th
e re
sults
of
o p
erat
ions
and
the
fut
ure
deve
lopm
ent
polic
y, a
nd t
he
maj
or o
pera
tiona
l ch
ange
s by
mea
ns o
f re
gula
r pl
enar
y m
eetin
gs, m
eetin
gs o
f hea
ds, d
epar
tmen
tal m
eetin
gs, a
nd
grou
p m
eetin
gs,
com
plem
ente
d by
th
e co
mpa
ny’s
pe
riodi
cals
, the
inte
rnal
em
ploy
ee w
ebsi
te, a
nd th
e vi
deo
plat
form
of
"Adv
ante
ch E
xecu
tive
Talk
s" t
o in
stan
tly

40
Ass
essm
ent i
tem
s
Ope
ratio
n (N
ote
1)
Dev
iatin
g fr
om th
e “C
orpo
rate
Soc
ial
Res
pons
ibili
ty B
est-P
ract
ice
Prin
cipl
es
for T
WSE
/GTS
M L
iste
d C
ompa
nies
” an
d th
e ro
ot c
ause
Ye
sN
oSu
mm
ary
(Not
e 2)
shar
e th
e co
mpa
ny's
busi
ness
ph
iloso
phy,
th
e la
test
bu
sine
ss in
form
atio
n an
d th
e ch
ange
s. (
五)
The
Com
pany
, th
roug
h “A
dvan
tech
Sc
hool
,”
has
dive
rsifi
ed
curr
icul
um
plan
ned,
es
tabl
ishe
d ef
fect
ive
care
er c
apac
ity d
evel
opm
ent
and
train
ing
prog
ram
for
em
ploy
ees;
al
so,
refle
cted
th
e C
ompa
ny’s
op
erat
ing
perf
orm
ance
and
res
ults
app
ropr
iate
ly i
n th
e em
ploy
ee
rem
uner
atio
n po
licie
s to
en
sure
th
e re
crui
tmen
t, re
tent
ion,
and
enc
oura
gem
ent
of h
uman
res
ourc
es i
n or
der t
o re
ach
the
goal
of s
usta
inab
le b
usin
ess o
pera
tion.
(六)
The
Com
pany
has
the
cons
umer
pro
tect
ion
polic
ies a
nd
com
plai
nt
proc
edur
es
esta
blis
hed;
al
so,
has
had
the
proc
edur
e do
cum
ent
of
qual
ity
feed
back
sy
stem
, cu
stom
er s
ervi
ce a
nd s
atis
fact
ion
man
agem
ent,
ATSC
R
MA
oper
atin
g in
stru
ctio
ns a
vaila
ble
to e
nsur
e pr
oper
ha
ndlin
g.
(七)
The
Com
pany
has
pro
duct
s an
d se
rvic
es m
arke
ted
and
labe
led
in a
ccor
danc
e w
ith t
he r
elev
ant
regu
latio
ns a
nd
inte
rnat
iona
l no
rms.
The
prod
ucts
are
ind
eed
100%
in
com
plia
nce
with
the
gre
en p
rodu
ct r
egul
atio
ns o
f th
e in
tern
atio
nal
Envi
ronm
enta
l Pr
otec
tion
Act
thr
ough
out
the
Life
Cyc
le A
sses
smen
t (LC
A) f
rom
the
effe
ctiv
e us
e of
na
tura
l re
sour
ces,
the
proh
ibiti
on
of
haza
rdou
s su
bsta
nces
, to
pro
per
was
te m
anag
emen
t. A
dvan
tech
ba
sed
on s
afet
y, e
nerg
y co
nser
vatio
n, a
nd e
nviro
nmen
tal
prot
ectio
n to
pro
mot
e gr
een
prod
ucts
and
to
have
the
pr
oduc
t in
form
atio
n an
d in
tern
atio
nal
stan
dard
s pu
blis
hed
on th
e C
ompa
ny’s
web
site
(h
ttp://
ww
w.ad
vant
ech.
tw/c
sr/s
ocia
l_co
ntrib
utio
n/ca
re_f
or_e
nviro
nmen
t_ov
er v
iew
) fo
r th
e un
ders
tand
ing
of
the
cust
omer
s and
con
sum
ers.
(八)
All
the
Com
pany
’s s
uppl
iers
/ co
ntra
ctor
s ar
e re
quire
d to
si
gn
the
corp
orat
e so
cial
re
spon
sibi
lity
(CSR
) ag
reem
ent
befo
re s
igni
ng t
he c
ontra
ct.
Try
to a
void
de
alin
g w
ith t
he s
uppl
iers
who
are
in
viol
atio
n of
the

41
Ass
essm
ent i
tem
s
Ope
ratio
n (N
ote
1)
Dev
iatin
g fr
om th
e “C
orpo
rate
Soc
ial
Res
pons
ibili
ty B
est-P
ract
ice
Prin
cipl
es
for T
WSE
/GTS
M L
iste
d C
ompa
nies
” an
d th
e ro
ot c
ause
Ye
sN
oSu
mm
ary
(Not
e 2)
Com
pany
’s c
orpo
rate
soc
ial
resp
onsi
bilit
y po
licie
s. Th
e C
SR a
gree
men
t re
quire
s th
e su
pplie
rs /
con
tract
ors
to
com
ply
with
SA
8000
so
cial
ac
coun
tabi
lity
stan
dard
, EI
CC
el
ectro
nics
in
dust
ry
beha
vior
gu
idel
ines
, IS
O
1400
1 en
viro
nmen
tal
man
agem
ent
stan
dard
, O
HSA
S 18
001
occu
patio
nal
safe
ty
and
heal
th
man
agem
ent
stan
dard
s, an
d th
e re
quire
men
ts o
f la
bor
right
s, he
alth
an
d sa
fety
, env
ironm
enta
l pro
tect
ion,
and
bus
ines
s et
hics
im
pose
d by
the
loca
l aut
horit
ies.
(九)
The
CSR
agr
eem
ent s
igne
d by
the
Com
pany
with
the
supp
liers
inc
lude
s th
e C
ompa
ny’s
ent
itlem
ent
to h
ave
the
agre
emen
t can
celle
d or
term
inat
ed a
t any
tim
e w
hen
the
supp
liers
vio
late
the
CSR
pol
icie
s th
at h
ave
a si
gnifi
cant
im
pact
on
the
envi
ronm
ent
and
soci
ety.
Si
gnin
g th
e SC
R a
gree
men
t by
all
the
supp
liers
/
cont
ract
ors
is t
he p
reco
nditi
on o
f de
alin
g w
ith t
he
Com
pany
. 四
、St
reng
then
ing
info
rmat
ion
disc
losu
re
(一)
Doe
s th
e C
ompa
ny h
ave
the
rele
vant
and
rel
iabl
e C
SR
info
rmat
ion
disc
lose
d on
th
e C
ompa
ny’s
w
ebsi
te
and
MO
PS?
V
Th
e C
ompa
ny h
as th
e C
SR w
ebsi
te s
etup
and
has
the
rele
vant
an
d re
liabl
e C
SR i
nfor
mat
ion
disc
lose
d on
the
Com
pany
’s
web
site
an
d M
OPS
. Th
e C
ompa
ny
has
corp
orat
e so
cial
re
spon
sibi
lity
info
rmat
ion
disc
lose
d as
follo
ws:
一
、Th
e C
SR p
olic
ies,
syst
ems,
or s
peci
fic p
rom
otio
n pl
an
reso
lved
in th
e B
oard
mee
ting.
二
、Th
e ris
k an
d im
pact
of
su
bsta
ntia
ting
corp
orat
e go
vern
ance
, de
velo
pmen
t of
sus
tain
able
env
ironm
ent,
and
mai
nten
ance
of
soci
al w
elfa
re o
n th
e C
ompa
ny’s
op
erat
ions
and
fina
ncia
l con
ditio
n 三
、Th
e go
al, m
easu
res,
and
perf
orm
ance
of t
he C
SR d
rafte
d up
by
the
Com
pany
四
、Th
e m
ain
stak
ehol
ders
and
the
issu
es o
f con
cern
五
、Th
e m
anag
emen
t and
per
form
ance
of
envi
ronm
enta
l and
so
cial
issu
es d
iscl
osed
by
the
maj
or su
pplie
rs
六、
Oth
er C
SR-r
elat
ed in
form
atio
n
Non
e
五、
If th
e C
ompa
ny h
as th
e “C
orpo
rate
Soc
ial R
espo
nsib
ility
Bes
t-Pra
ctic
e Pr
inci
ples
” st
ipul
ated
in a
ccor
danc
e w
ith th
e “C
orpo
rate
Soc
ial R
espo
nsib
ility
Bes
t-Pra
ctic
e Pr
inci
ples
for

42
Ass
essm
ent i
tem
s
Ope
ratio
n (N
ote
1)
Dev
iatin
g fr
om th
e “C
orpo
rate
Soc
ial
Res
pons
ibili
ty B
est-P
ract
ice
Prin
cipl
es
for T
WSE
/GTS
M L
iste
d C
ompa
nies
” an
d th
e ro
ot c
ause
Ye
sN
oSu
mm
ary
(Not
e 2)
TWSE
/GTS
M L
iste
d C
ompa
nies
,” p
leas
e st
ate
its d
evia
ting
from
the
“Cor
pora
te S
ocia
l Res
pons
ibili
ty B
est-P
ract
ice
Prin
cipl
es fo
r TW
SE/G
TSM
Lis
ted
Com
pani
es”
in o
pera
tion:
Th
e C
ompa
ny h
as th
e po
licie
s of
cor
pora
te s
ocia
l res
pons
ibili
ty c
omm
itmen
t, em
ploy
ee c
ode
of c
ondu
ct, e
nviro
nmen
t saf
ety
and
heal
th, a
nd th
e pr
ohib
ition
of h
azar
dous
sub
stan
ces
in
prod
ucts
stip
ulat
ed a
nd su
bsta
ntia
ted
in c
ompl
ianc
e w
ith th
e “C
orpo
rate
Soc
ial R
espo
nsib
ility
Bes
t-Pra
ctic
e Pr
inci
ples
for T
WSE
/GTS
M L
iste
d C
ompa
nies
.”
六、
Oth
er im
porta
nt in
form
atio
n he
lpfu
l in
unde
rsta
ndin
g th
e co
rpor
ate
soci
al re
spon
sibi
lity
oper
atio
n:
Adv
ante
ch a
lway
s be
lieve
s th
at c
orpo
rate
citi
zen
in th
e so
ciet
y m
ust f
ulfil
l its
civ
ic r
espo
nsib
ility
. We
have
bro
ught
this
bel
ief
into
our
dai
ly b
usin
ess
oper
atio
n m
echa
nism
. In
prac
tice,
Adv
ante
ch fu
lfills
its c
ivic
resp
onsi
bilit
ies t
hrou
gh th
e fo
llow
ing
four
asp
ects
of c
orpo
rate
com
mitm
ent,
soci
al c
are,
coo
pera
tion
of a
cade
my
and
indu
stry
, and
staf
f car
e:
C
orpo
rate
com
mitm
ent:
We
have
the
corp
orat
e go
vern
ance
per
fect
ed a
nd b
een
resp
onsi
ble
to th
e st
akeh
olde
rs th
roug
h th
e or
gani
zatio
nal o
pera
tion
and
audi
t sys
tem
of t
he
Boa
rd o
f D
irect
ors,
Aud
it C
omm
ittee
, Rem
uner
atio
n C
omm
ittee
, and
Ris
k M
anag
emen
t C
omm
ittee
; al
so, d
edic
ated
to t
he c
ontin
uing
inno
vatio
n of
des
ign,
pro
duct
ion
qual
ity, a
nd r
elia
bilit
y th
roug
h th
e qu
ality
man
agem
ent a
nd c
omm
itmen
t tha
t is
part
of th
e co
rpor
ate
cultu
re, b
een
resp
onsi
ble
to th
e cu
stom
ers
and
the
envi
ronm
ent,
and
rece
ived
a n
umbe
r of i
nter
natio
nal c
ertif
icat
ions
and
affi
rmat
ions
.
Soci
al C
are:
We
fulfi
ll ou
r cor
pora
te s
ocia
l res
pons
ibili
ty th
roug
h th
e ef
forts
of e
nviro
nmen
tal c
onsi
dera
tion,
love
and
wel
fare
, arts
and
cul
ture
s sp
onso
rshi
p, a
nd v
olun
teer
se
rvic
es.
In t
erm
s of
“En
viro
nmen
tal
Con
side
ratio
n,”
Adv
ante
ch a
s a
man
ufac
ture
r ai
ms
to p
rovi
de g
reen
des
ign,
gre
en p
rodu
ctio
n, a
nd g
reen
pro
duct
s, an
d bu
ild a
su
stai
nabl
e su
pply
cha
in. A
s fo
r the
em
ploy
ees,
Adv
ante
ch a
ctiv
ely
enco
urag
es th
em to
hel
p m
aint
ain
sust
aina
ble
ecol
ogy
and
to s
pont
aneo
usly
ado
pt a
nd s
etup
Adv
ante
ch
orga
nic
farm
s, fr
om c
onst
ruct
ing
sust
aina
ble
gree
n in
dust
ry to
em
brac
ing
ecol
ogic
al g
reen
wor
ld jo
intly
. Adv
ante
ch h
as a
dopt
ed o
rgan
ic fa
rms
sinc
e th
e ye
ar o
f 201
0 w
ith
over
NT$
1 m
illio
n do
nate
d an
nual
ly. A
dvan
tech
inve
sted
ove
r NT$
85 m
illio
n in
env
ironm
enta
l pro
tect
ion
in 2
014.
In te
rms
of “
love
and
wel
fare
,” A
dvan
tech
enc
oura
ges
empl
oyee
s as
soci
atio
ns to
exp
and
soci
al s
ervi
ces
and
spon
sor T
aish
in C
harit
y Fo
unda
tion
thro
ugh
Adv
ante
ch F
ound
atio
n to
hol
d th
e “y
our v
ote
is th
e po
wer
of l
ove”
soc
ial
char
ity p
ropo
sal p
latfo
rm, i
nvite
cha
rity
grou
ps to
pro
pose
edu
catio
n an
d cu
lture
pro
posa
ls, a
nd to
com
plet
ed th
e se
lect
ion
of s
pons
orsh
ip p
ropo
sals
thro
ugh
publ
ic v
otin
g m
echa
nism
. In
term
s of
“ar
ts a
nd c
ultu
res
spon
sors
hip,
” A
dvan
tech
has
spo
nsor
ed “
Col
orfu
l Life
– C
hen,
Yan
g C
hun,
” N
atio
nal T
aiw
an C
olle
ge o
f Pe
rfor
min
g A
rts a
nd
Guo
Gua
ng O
pera
Com
pany
per
form
ance
s, an
d A
dvan
tech
AC
T D
ram
a vo
lunt
eer
grou
ps f
or y
ears
; als
o, s
elec
t exc
elle
nt a
rts a
nd c
ultu
res
grou
ps f
or p
rivat
e sp
onso
rshi
p th
roug
h th
e “A
rts &
Cul
ture
s Sa
lon”
pro
ject
. Adv
ante
ch d
onat
e ov
er N
T$6
mill
ion
a ye
ar t
o sp
onso
r ar
ts a
nd c
ultu
ral
even
ts. A
dvan
tech
has
sta
rted
coop
erat
ing
with
N
atio
nal T
aiw
an C
olle
ge o
f Per
form
ing
Arts
on
proj
ect p
lann
ing
sinc
e th
e ye
ar o
f 201
5 w
ith N
T$3.
01 m
illio
n do
nate
d an
nual
ly fo
r thr
ee a
cade
mic
yea
rs in
ord
er to
sup
port
the
nurtu
ring
and
deve
lopm
ent o
f tra
ditio
nal a
rt an
d ta
lent
s. In
add
ition
, we
also
enc
oura
ge c
olle
ague
s to
turn
thei
r lov
e in
to a
ctio
n th
roug
h th
e “V
olun
teer
Ser
vice
” an
d to
ac
tivel
y pa
rtici
pate
in v
ario
us v
olun
teer
serv
ice
activ
ities
and
to p
ay fo
rwar
d.
In
dust
rial C
oope
ratio
n: A
dvan
tech
bel
ieve
s th
at o
nly
the
inte
grat
ion
of in
nova
tion
and
lear
ning
cha
ract
eris
tics
of “
indu
stry
-aca
dem
y co
oper
atio
n” is
the
driv
ing
forc
e to
ac
tivat
e so
cial
pro
gres
s in
the
futu
re. T
here
fore
, we
have
to b
ase
on th
e co
re o
f “in
nova
tive
lear
ning
,” th
e m
etho
d of
“in
dust
ry-a
cade
my
coop
erat
ion,
” an
d th
e pu
rpos
e of
“t
alen
ts g
athe
ring”
to
activ
ely
prom
ote
indu
stry
-aca
dem
y co
oper
atio
n ac
tiviti
es,
such
as,
TiC
100
Col
lege
stu
dent
inn
ovat
ive
busi
ness
mod
els
com
petit
ion,
TiC
-EA
CC
in
dust
ry-a
cade
my
coop
erat
ion
plan
, and
TiC
-Ear
ly D
esig
n C
ampa
ign
indu
stria
l pro
duct
for
war
d-lo
okin
g de
sign
com
petit
ions
. Adv
ante
ch h
as c
omm
itted
to in
vest
NT$
20
mill
ion
per y
ear f
or 5
yea
rs si
nce
the
year
of 2
014
to se
t up
Jiao
tong
Uni
vers
ity In
tern
et o
f Thi
ngs (
IoT)
Res
earc
h C
ente
r. A
dvan
tech
wor
ked
with
Nat
iona
l Chi
ao T
ung
Uni
vers
ity in
201
5 to
co-
advo
cate
the
IoT
A+
indu
stry
-aca
dem
ia e
lite
doct
oral
join
ing
the
IoT
tale
nts i
ncub
atio
n pr
ogra
m..
Em
ploy
ee c
are:
We
star
ting
out f
rom
“W
ork,
Lea
rn, a
nd L
ove”
are
det
erm
ined
to m
ade
Adv
ante
ch a
n op
en d
evel
opm
ent p
latfo
rm; a
lso,
to m
ake
Adv
ante
ch a
trus
twor
thy
ente
rpris
e th
at t
he c
olle
ague
s ca
n tru
st t
heir
happ
y lif
e w
ith t
he C
ompa
ny. I
n te
rms
of “
wor
k,”
we
prov
ide
cros
s-fie
ld, c
ross
- bor
der,
and
dive
rsifi
ed j
ob o
ppor
tuni
ties,
enco
urag
e em
ploy
ees
to e
xpan
d th
eir
inte
rnat
iona
l pe
rspe
ctiv
e an
d w
ork
expe
rienc
e th
roug
h jo
b ro
tatio
n, o
r co
mpe
te t
o se
cure
a c
ross
-fie
ld j
ob v
olun
taril
y in
ord
er t
o im
prov
e se
lf-co
mpe
titiv
enes
s at
wor
k pl
ace.
In
term
s of
“le
arni
ng,”
Adv
ante
ch p
rovi
des
staf
f w
ith a
var
iety
of
cont
inui
ng e
duca
tion
oppo
rtuni
ties
to e
nhan
ce c
apab
ility
; al
so, p
lans
onl
ine
e-le
arni
ng s
yste
m a
nd e
mpl
oyee
web
site
to p
rovi
de A
dvan
tech
bas
ic ta
lent
cul
tivat
ion
info
rmat
ion
and
the
conc
ept o
f bu
sine
ss d
irect
ion.
Mor
eove
r, a
serie
s of
cou
rses
are
pla
nned
for
the
elite
tale
nt to
stu
dy th
e bu
sine
ss o
pera
tion
of A
dvan
tech
, to
form
pra
ctic
al h
ands
-on
expe
rienc
e, a
nd to
pas
s on
the
uniq
ue b
usin
ess

43
Ass
essm
ent i
tem
s
Ope
ratio
n (N
ote
1)
Dev
iatin
g fr
om th
e “C
orpo
rate
Soc
ial
Res
pons
ibili
ty B
est-P
ract
ice
Prin
cipl
es
for T
WSE
/GTS
M L
iste
d C
ompa
nies
” an
d th
e ro
ot c
ause
Ye
sN
oSu
mm
ary
(Not
e 2)
philo
soph
y of
Adv
ante
ch. I
n te
rms
of “
love
,” w
e ar
e in
the
purs
uit o
f a
happ
y lif
e. A
dvan
tech
AB
LE C
lub
(Adv
ante
ch B
eaut
iful L
ife)
has
spor
ts, l
ove,
Loh
as, a
rts a
nd
cultu
ral a
ctiv
ities
pla
nned
. Em
ploy
ees
in th
eir
spar
e tim
e ar
e ex
pect
ed to
inno
vate
and
lear
n, to
exp
erie
nce
life,
to c
ontri
bute
to s
ocie
ty, t
o pr
actic
e al
truis
tic id
eas,
and
to
crea
te a
hap
py li
fe. T
he a
ctiv
ities
arr
ange
d by
Adv
ante
ch A
BLE
Clu
b in
201
5 w
ere
with
the
parti
cipa
tion
of o
ver 1
0,00
0 pe
rson
s. 七
、Pl
ease
det
ail t
he C
orpo
rate
Soc
ial R
espo
nsib
ility
Rep
ort t
hat h
as m
et th
e ve
rific
atio
n st
anda
rd o
f the
rele
vant
cer
tific
atio
n in
stitu
tions
, if a
ny:
Adv
ante
ch 2
014
Cor
pora
te S
ocia
l Res
pons
ibili
ty R
epor
t was
pre
pare
d by
the
Com
pany
in a
ccor
danc
e w
ith G
RI G
4 St
anda
rds
with
out h
avin
g be
en v
erifi
ed b
y a
third
par
ty. T
he 2
016
Cor
pora
te S
ocia
l Res
pons
ibili
ty R
epor
t wou
ld b
e ve
rifie
d by
the
com
mis
sion
ed c
ertif
icat
ion
inst
itutio
n.

44
(六
)he
Com
pany
’s e
thic
al m
anag
emen
t and
the
mea
sure
s ado
pted
Ass
essm
ent I
tem
s
Ope
ratio
n (N
ote
1)
Dev
iatin
g fr
om th
e “E
thic
al
Man
agem
ent B
est-P
ract
ice
Prin
cipl
es fo
r TW
SE/G
TSM
Li
sted
Com
pani
es”
and
the
root
ca
use
Yes
No
Sum
mar
y
一、
Form
atio
n of
eth
ical
man
agem
ent p
olic
ies a
nd m
etho
ds
(一)
Doe
s th
e C
ompa
ny h
ave
the
ethi
cal
man
agem
ent
polic
y an
d m
etho
d de
clar
ed e
xplic
itly
in th
e A
rticl
es o
f Inc
orpo
ratio
n an
d ex
tern
al d
ocum
ents
; al
so,
the
com
mitm
ent
of t
he b
oard
of
dire
ctor
s an
d th
e m
anag
emen
t to
ac
tivel
y im
plem
ent
the
oper
atin
g po
licie
s?
(二)
Doe
s th
e C
ompa
ny h
ave
the
prev
entio
n pr
ogra
m f
or a
ny f
raud
st
ipul
ated
; al
so,
have
the
res
pect
ive
oper
atin
g pr
oced
ures
, gu
idel
ines
for
con
duct
, di
scip
linar
y ac
tions
, an
d co
mpl
aint
s sy
stem
de
clar
ed
expl
icitl
y;
also
ha
ve
it im
plem
ente
d su
bsta
ntiv
ely?
(
三)
Doe
s th
e C
ompa
ny h
ave
prev
entiv
e m
easu
res
adop
ted
in
resp
onse
to th
e co
nduc
ts s
tate
d in
Arti
cle
7 Pa
ragr
aph
2 of
the
“Eth
ical
M
anag
emen
t B
est
Prac
tice
Prin
cipl
es
for
TWSE
/GTS
M L
iste
d C
ompa
nies
” or
oth
er b
usin
ess
activ
ities
su
bjec
t to
high
er ri
sk o
f fra
ud?
V V V
(一) T
he C
ompa
ny h
as th
e “E
thic
al M
anag
emen
t Bes
t Pra
ctic
e Pr
inci
ple”
st
ipul
ated
an
d pu
blis
hed
on
the
corp
orat
e w
ebsi
tes,
corp
orat
e so
cial
re
spon
sibi
lity
web
site
, an
dM
OPS
. A
udito
rs r
egul
arly
aud
it th
e co
mpl
ianc
e of
the
sy
stem
and
with
an
audi
t rep
ort p
rese
nted
to th
e bo
ard
o f
dire
ctor
s on
a qu
arte
rly b
asis
. (二
) The
Com
pany
set
s th
e “E
thic
al M
anag
emen
t Bes
t Pra
ctic
e Pr
inci
ple”
and
“A
dvan
tech
’s C
ode
of C
ondu
ct”
to c
lear
lysp
ecify
the
rel
evan
t op
erat
ing
proc
edur
es a
nd t
o ha
ve t
he
com
preh
ensi
ve s
yste
m im
plem
ente
d in
acc
orda
nce
with
the
“Reg
ulat
ions
Gov
erni
ng th
e R
epor
ting.
” (三
) The
Com
pany
has
est
ablis
hed
an e
ffect
ive
inte
rnal
con
trol
syst
em
to
ensu
re
the
subs
tant
iatio
n of
th
e et
hica
l m
anag
emen
t. Th
e in
tern
al a
udito
rs p
erio
dica
lly a
udit
the
com
plia
nce
of t
he e
stab
lishm
ent.
The
Com
pany
and
its
di
rect
ors,
supe
rvis
ors,
man
ager
s, em
ploy
ees,
appo
inte
d pe
rson
s, an
d th
e pe
rson
in c
ontro
l at t
he ti
me
of c
ondu
ctin
gbu
sine
ss s
hall
not
dire
ctly
or
indi
rect
ly o
ffer,
prom
ise,
re
ques
t, or
acc
ept i
mpr
oper
ben
efits
in a
ny fo
rm, i
nclu
ding
reba
tes,
com
mis
sion
s, an
d br
ibe
or p
rovi
ding
or
acce
ptin
gim
prop
er
bene
fits
to
and
from
cu
stom
ers,
agen
ts,
cont
ract
ors,
supp
liers
, pu
blic
of
ficia
ls,
or
othe
r st
akeh
olde
rs.
Non
e
二、
Subs
tant
iatio
n of
eth
ical
man
agem
ent
(一)
Doe
s th
e co
mpa
ny h
ave
the
inte
grity
of
the
trade
cou
nter
party
as
sess
ed a
nd w
ith t
he c
ode
of i
nteg
rity
expr
esse
d in
the
co
ntra
ct si
gned
? (
二)
Doe
s th
e C
ompa
ny h
ave
a sp
ecifi
c (p
art-t
ime)
uni
t set
up u
nder
th
e bo
ard
of d
irect
ors
to a
dvoc
ate
the
code
of
inte
grity
and
to
repo
rt on
its i
mpl
emen
tatio
n to
the
Boa
rd o
n a
regu
lar b
asis
? (
三)
Doe
s th
e C
ompa
ny h
ave
deve
lope
d po
licie
s to
pre
vent
con
flict
s of
inte
rest
, pro
vide
d ad
equa
te c
hann
el f
or c
omm
unic
atio
n, a
nd
V V V
(一
) Th
e C
ompa
ny h
as th
e “E
thic
al M
anag
emen
t Bes
t-Pra
ctic
e Pr
inci
ples
” st
ipul
ated
to c
lear
ly re
quire
the
coun
terp
artie
s to
com
ply
with
th
e ru
le
of
not
acce
ptin
g ki
ckba
cks,
com
mis
sion
s, an
d br
ibe
in
orde
r to
of
fer
the
mos
t re
ason
able
, the
bes
t qua
lity,
and
the
best
serv
ice.
(二
) Th
e AD
VAN
TEC
H e
stab
lishe
d th
e Aud
it C
omm
ittee
, the
R
emun
erat
ion
Com
mitt
ee a
nd th
e C
orpo
rate
Dev
elop
men
t C
omm
ittee
und
er th
e B
oard
, who
se fu
nctio
ns su
perv
ise
and
Non
e

45
Ass
essm
ent I
tem
s
Ope
ratio
n (N
ote
1)
Dev
iatin
g fr
om th
e “E
thic
al
Man
agem
ent B
est-P
ract
ice
Prin
cipl
es fo
r TW
SE/G
TSM
Li
sted
Com
pani
es”
and
the
root
ca
use
Yes
No
Sum
mar
y
subs
tant
iate
d th
e po
licie
s?
(四)
Doe
s the
Com
pany
hav
e es
tabl
ishe
d ef
fect
ive
acco
untin
g sy
stem
s an
d in
tern
al
cont
rol
syst
ems
to
subs
tant
iate
et
hica
l m
anag
emen
t; al
so, h
ave
audi
ts p
erfo
rmed
by
the
inte
rnal
aud
it un
it on
a re
gula
r bas
is o
r by
the
com
mis
sion
CPA
s?
(五)
Doe
s th
e C
ompa
ny h
ave
orga
nize
d et
hica
l man
agem
ent i
nter
nal
and
exte
rnal
edu
catio
n an
d tra
inin
g pr
ogra
ms
on a
reg
ular
ba
sis?
V V
revi
ew th
e co
rpor
ate
oper
atio
n, fi
nanc
e, re
mun
erat
ion,
in
tern
al c
ontro
l, m
anag
emen
t and
org
aniz
atio
n de
velo
pmen
t as
wel
l as p
erio
dica
lly re
port
the
exec
utio
ns to
the
Boa
rd o
f th
e D
irect
ors.
In th
e su
perv
isio
n of
the
Boa
rd, t
hey
can
guar
ante
e ea
ch o
pera
tion
conf
orm
s to
the
regu
latio
ns
with
out d
isho
nest
y be
havi
or a
nd e
nsur
e th
e in
vest
or ri
ghts
an
d in
tere
sts.
(三
) Th
e C
ompa
ny’s
“G
uide
lines
for t
he A
dopt
ion
of C
odes
of
Con
duct
” fo
r em
ploy
ees
and
the
“Gui
delin
es
for
the
Ado
ptio
n of
Cod
es o
f Et
hica
l C
ondu
ct”
for
the
dire
ctor
s, su
perv
isor
s, an
d m
anag
ers
incl
ude
the
clau
se o
f co
nflic
t of
inte
rest
pre
vent
ion;
als
o, r
epor
t an
y do
ubtfu
l co
nflic
t of
in
tere
st to
the
dire
ct su
perv
isor
. (四
) Th
e C
ompa
ny h
as th
e ac
coun
ting
syst
em e
stab
lishe
d; a
lso,
the
finan
cial
repo
rts a
re a
udite
d by
Del
oitte
& T
ouch
e. T
he
Com
pany
ha
s in
tern
al
cont
rol
syst
em
esta
blis
hed.
Th
e In
tern
al
Aud
iting
un
der
the
Boa
rd
of
Dire
ctor
s is
to
re
gula
rly a
udit
the
Com
pany
’s o
pera
ting
cycl
e an
d th
e re
late
d la
w a
nd r
egul
atio
ns i
n or
der
to a
ssis
t th
e bo
ard
o f
dire
ctor
s an
d m
anag
emen
t to
re
ason
ably
en
sure
th
e ac
hiev
emen
t of
ope
ratio
nal
effe
ctiv
enes
s an
d ef
ficie
ncy,
re
liabi
lity
of f
inan
cial
rep
orts
, an
d th
e co
mpl
ianc
e of
the
re
late
d la
w a
nd re
gula
tions
. (五
) In
tern
ally
:In a
dditi
on to
hav
ing
the
rele
vant
spe
cific
atio
nspu
blis
hed
on
eLea
rnin
g fo
r th
e ea
sy
acce
ss
of
the
empl
oyee
s at
any
tim
e, t
he C
ompa
ny h
as e
xpla
ined
it a
ndem
phas
ized
its
im
porta
nce
in t
he o
rient
atio
n an
d m
anua
lin
stru
ctio
n.
Exte
rnal
ly:
Arr
ange
Sup
plie
r C
onve
ntio
ns a
nd e
stab
lish
a re
gula
r co
mm
unic
atio
n m
echa
nism
an
d ad
voca
tes
the
rele
vant
nor
ms o
f eth
ical
man
agem
ent.
三、
The
oper
atio
n of
the
Com
pany
’s R
epor
t Sys
tem
(
一)
Doe
s th
e C
ompa
ny h
ave
a sp
ecifi
c re
port
and
rew
ard
syst
em
stip
ulat
ed,
a co
nven
ient
rep
ort
chan
nel
esta
blis
hed,
and
a
V
(一) T
he r
epor
ting
can
be s
ubm
itted
thr
ough
the
Com
pany
’s
e-m
ail o
r in
writ
ing.
The
Int
erna
l Aud
iting
is to
han
dle
all
repo
rting
and
then
repo
rts to
the
Cha
irman
, so
the
Cha
irman
N
one

46
Ass
essm
ent I
tem
s
Ope
ratio
n (N
ote
1)
Dev
iatin
g fr
om th
e “E
thic
al
Man
agem
ent B
est-P
ract
ice
Prin
cipl
es fo
r TW
SE/G
TSM
Li
sted
Com
pani
es”
and
the
root
ca
use
Yes
No
Sum
mar
y
resp
onsi
ble
staf
f de
sign
ated
to
hand
le t
he i
ndiv
idua
l be
ing
repo
rted?
(
二)
Doe
s th
e C
ompa
ny h
ave
the
stan
dard
inv
estig
atin
g pr
oced
ures
an
d re
late
d co
nfid
entia
lity
mec
hani
sm
esta
blis
hed
for
the
inci
dent
s bei
ng re
porte
d?
(三)
Doe
s th
e C
ompa
ny h
ave
take
n pr
oper
mea
sure
s to
pro
tect
the
w
hist
lebl
ower
s fro
m su
fferin
g an
y co
nseq
uenc
e of
repo
rting
an
inci
dent
?
V V
may
ap
poin
t in
vest
igat
ors
to
cond
uct
an
inde
pend
ent
inve
stig
atio
n.
(二) T
he
Com
pany
ha
s th
e “R
egul
atio
ns
Gov
erni
ng
the
Rep
ortin
g” a
nd re
late
d op
erat
ing
proc
edur
es s
tipul
ated
. The
id
entit
y of
th
e w
hist
lebl
ower
an
d th
e co
nten
t of
th
e re
porti
ng s
houl
d be
kep
t co
nfid
entia
l; al
so,
inve
stig
ator
ssh
all
have
th
e re
leva
nt
docu
men
ts
that
ar
e co
llect
ed
thro
ugho
ut
the
inve
stig
atio
n pr
oces
s re
serv
ed
prop
erly
. Ea
ch r
epor
ting
inci
dent
is
assi
gned
with
one
cod
e. T
he
inve
stig
ator
will
obt
ain
a un
ique
iden
tific
atio
n co
de fo
r th
e pr
otec
tion
of th
e w
hist
lebl
ower
. (三
) The
C
ompa
ny
has
the
“Reg
ulat
ions
G
over
ning
th
e R
epor
ting”
and
rela
ted
oper
atin
g pr
oced
ures
stip
ulat
ed. T
he
iden
tity
of
the
whi
stle
blow
er
and
the
cont
ent
of
the
repo
rting
sho
uld
be k
ept
conf
iden
tial
and
prot
ecte
d; a
lso,
th
e in
volv
ing
inve
stig
ator
s sh
ould
no
t di
sclo
se
any
info
rmat
ion
with
out
auth
oriz
atio
n so
to
pr
otec
t th
e w
hist
lebl
ower
fro
m a
ny u
nfai
r tre
atm
ent,
reta
liatio
n, o
rth
reat
. 四
、St
reng
then
ing
info
rmat
ion
disc
losu
re
(一)
Doe
s th
e C
ompa
ny h
ave
the
cont
ent o
f eth
ical
man
agem
ent a
nd
its im
plem
enta
tion
disc
lose
d on
the
web
site
and
MO
PS?
V
The
Com
pany
has
a w
ebsi
te in
Chi
nese
and
Eng
lish
and
a C
SR
web
site
es
tabl
ishe
d;
also
, th
e “E
thic
al
Man
agem
ent
Bes
t-Pra
ctic
e Pr
inci
ples
” is
pub
lishe
d on
the
MO
PS.
Non
e
五、
If th
e C
ompa
ny h
as th
e “E
thic
al M
anag
emen
t Bes
t-Pra
ctic
e Pr
inci
ples
” st
ipul
ated
in a
ccor
danc
e w
ith th
e “E
thic
al M
anag
emen
t Bes
t-Pra
ctic
e Pr
inci
ples
for T
WSE
/GTS
M L
iste
d C
ompa
nies
,” p
leas
e st
ate
its d
evia
ting
from
the
“Eth
ical
Man
agem
ent B
est-P
ract
ice
Prin
cipl
es fo
r TW
SE/G
TSM
Lis
ted
Com
pani
es”
in o
pera
tion:
A
dvan
tech
has
est
ablis
hed
the
Cod
e to
requ
ire th
at a
ll em
ploy
ees,
offic
ers a
nd b
oard
mem
bers
com
ply
with
the
Cod
e an
d th
e ot
her p
olic
ies a
nd p
roce
dure
s.
Ther
e is
no
disc
repa
ncy
betw
een
the
Cod
e, in
clud
ing
its a
ffilia
te p
olic
ies a
nd p
roce
dure
s, an
d its
impl
emen
tatio
n.
六、
Oth
er im
porta
nt in
form
atio
n he
lpfu
l in
unde
rsta
ndin
g th
e et
hica
l man
agem
ent o
pera
tion:
(Suc
h as
, the
Com
pany
has
its
Ethi
cal M
anag
emen
t Bes
t-Pra
ctic
e Pr
inci
ples
revi
ewed
and
am
ende
d, e
tc.)
Req
uest
the
supp
liers
and
con
tract
ors
(incl
udin
g se
curit
y co
mpa
ny) t
hrou
gh th
e Pr
ocur
emen
t Dep
artm
ent a
nd G
ener
al A
ffairs
Dep
artm
ent t
o si
gn th
e “C
orpo
rate
Soc
ial R
espo
nsib
ility
an
d En
viro
nmen
tal S
afet
y an
d H
ealth
Com
mitm
ent”
and
impl
emen
t the
rele
vant
edu
catio
n an
d tra
inin
g an
d ad
voca
cy th
roug
h th
e Su
pplie
r Con
vent
ion.
(
七)
The
Com
pany
has
the
corp
orat
e go
vern
ance
Bes
t-Pra
ctic
e Pr
inci
ple
and
the
rela
ted
inqu
iries
est
ablis
hed:
The
Com
pany
web
site
is w
ith th
e co
rpor
ate
gove
rnan
ce
sect
ion
desi
gnat
ed fo
r inv
esto
r’s in
quiri
ng a
nd d
ownl
oadi
ng c
orpo
rate
gov
erna
nce-
rela
ted
regu
latio
ns; a
lso,
it is
pub
lishe
d on
the
MO
PS.
(八)
Oth
er im
porta
nt in
form
atio
n he
lpfu
l in
unde
rsta
ndin
g th
e co
rpor
ate
gove
rnan
ce o
pera
tion:
Non
e
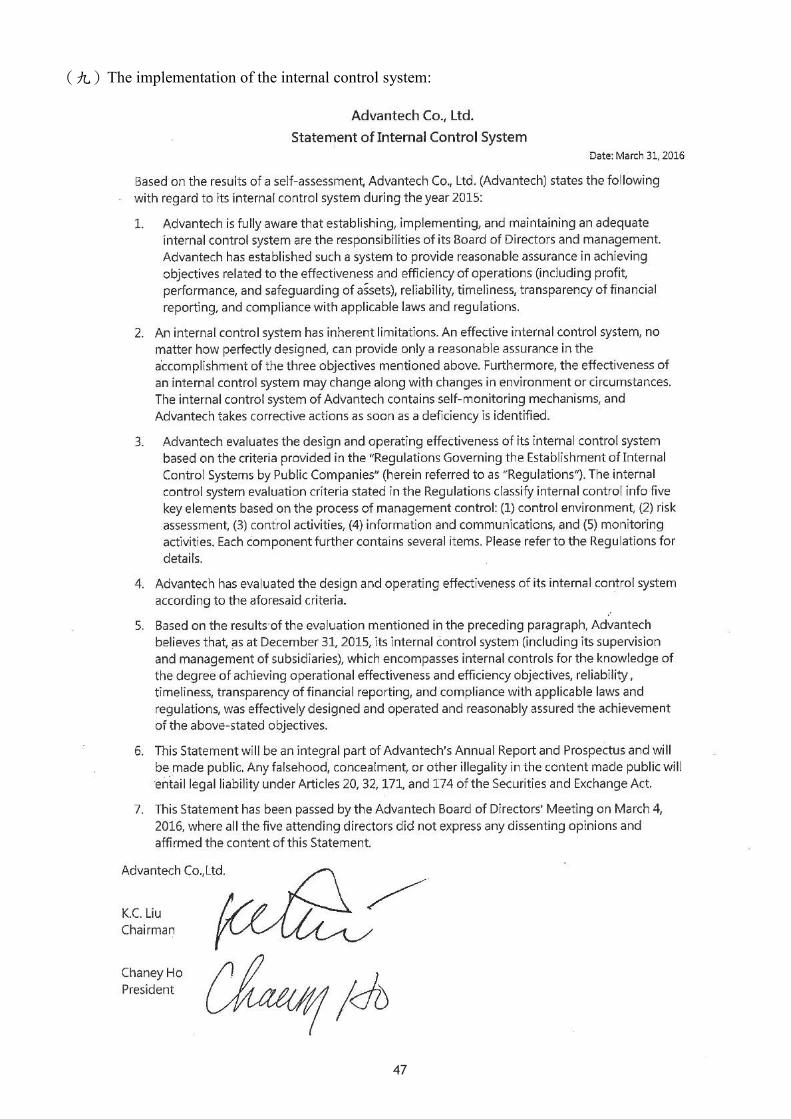
47
(九)The implementation of the internal control system:

48
2. If a CPA is commissioned to review internal control system specifically, the review report should be disclosed: None
(十)The Company and its internal staff being punished lawfully, the punishment given by the Company to the violators of internal control system, major nonconformity, and the improvement in the most recent year and up to the publication of the annual report: None
(十一)The material resolutions reached in the shareholders’ meeting and board meeting in the most recent year and up to the publication of the annual report:
Important resolution reached in the Shareholders’ meeting and its implementation Advantech had the 2015 general shareholders’ meeting held at the Neihu Headquarters on May 28, 2015. The resolutions reached in the shareholders’ meeting and their implementations are as follows: 1. The acknowledgement of the 2014 business report and financial statements
Implementation: Resolved and acknowledged. 2. The acknowledgement of the Company’s 2014 earnings distribution
Implementation: Scheduled the distribution date on June 29, 2015 and the payment date on July 10, 2015 (Cash dividend: NT$6 per share).
3. The acknowledgement of the Company’s “Articles of Association” amendment Implementation: The Ministry of Economic Affairs approved the change registration and the announcement on the Company’s website on June 16, 2015.
4. The acknowledgement of the Company’s “Procedures for Election of Directors and Supervisors” amendment Implementation: It has been handled in accordance with the amendment.
Important resolutions of the Board of Directors The important resolutions of the Board of Directors in 2015 and up to the printing date of the annual report are summarized as follows: 1. General board meeting on January 14, 2015:
Approved the Company’s issuing the 2009 employee stock warrant converted to common stock with new shares issued in Q4
Approved the Company’s issuing the 2010 employee stock warrant converted to common stock with new shares issued in Q4
2. General board meeting on March 6, 2015: Approved the Company’s “Articles of Association” amendment Approved the Company’s 2015 general shareholders’ meeting convening matters Approved the time period and place to accept shareholder’s proposals for the
Company’s 2015 general shareholders’ meeting Approved the Company’s “Corporate Governance Best-Practice Principles” Approved the Company’s “Ethical Corporate Management Best Practice
Principles”

49
Approved the Company’s “Corporate Social Responsibility Best Practice Principles”
Approved the Company’s “Regulations Governing Reporting” Approved the Company’s “Procedures for Preventing Insider’s Trade” Approved the Company’s “Procedures for Handling Material Inside Information” Approved the Company’s “Rules Governing the Performance Evaluation of the
Board of Directors” Approved the Company’s “Rules Governing the Scope of Powers of Independent
Directors” Approved the Company’s “Procedures for Election of Directors and Supervisors” Approved the 2014 CPA Independence Assessment Proposal Approved the Company’s additional investment in the subsidiary “Advantech
Investment Co., Ltd.” Approved the application filed for the Company’s 2015 bank credit line and
authorized the Chairman to apply to the bank for credit loan renewal project within the credit line depending on the business operation.
3. General board meeting on March 31, 2015: Approved the Company’s 2014 business report, proprietary financial statements
and consolidated financial statements Approved the Company’s 2015 statement of earnings distribution Approved the Company’s “Internal Control System” amendment Approved the Company’s 2015 and 2016 CPA fees Approved the issuance of 2010 employee warrant converted to common stock with
new shares issued in Q1 Approved the Company’s 2014 “Declaration of Internal Control” completed
4. General board meeting on May 28, 2015: Approved the Company’s 2014 statement of earnings distribution that was
resolved in the general shareholders’ meeting on May 28, 2015 and with the distribution base date scheduled
5. General board meeting on July 14, 2015: Approved the Company’s issuing 2010 employee warrant converted to common
stock with new shares issued 6. General board meeting on August 14, 2015:
Approved the 2010 employee warrant subscribing price adjustment Approved the 2014 employee warrant subscribing price adjustment Approved the Company’s 2014 remuneration to directors and supervisors and
bonus to managers and employees 7. General board meeting on November 12, 2015:
Approved the Company’s offering endorsement/guarantee to subsidiary for purchasing materials

50
Approved the Company’s “Articles of Association” amendment Approved “The preparation of financial reports ability assessment introduction” Approved the Company’s 2015 CPA independence assessment Approved the Company’s 2016 internal auditing plan Approved the Company’s applying for bank credit line
8. General board meeting on November 16, 2015: Approved the Company’s merging B+B SmartWorx, Inc.
9. General board meeting on March 4, 2016: Approved the Company’s 2016 business budget and operating plan Approved the Company’s 2015 business report, proprietary financial statements,
and consolidated financial statements Approved the Company’s 2015 distribution of remuneration to employees and
remuneration to directors and supervisors Approved the Company’s 2015 earnings distribution Approved the stock shares of YEH-CHIANG TECHNOLOGY KUN SHAN CO.,
LTD. acquired by HK Advantech Technology Co., Limited that is invested by the Company
Approved the Company’s issuing employee warrant at a price below market price Approved the Company’s “Articles of Association” amendment Approved the Company’s 2016 general shareholders’ meeting convening matters Approved the time period and place to accept shareholder’s proposals for the
Company’s 2015 general shareholders’ meeting Approved the Company’s offering endorsement/guarantee to the subsidiaries for
applying for bank credit line Approved the application filed for the Company’s 2016 bank credit line and
authorized the Chairman to apply to the bank for credit loan renewal project within the credit line depending on the business operation.
Approved the Company’s 2015 “Declaration of Internal Control” completed 10. General board meeting on March 22, 2016:
Approved the joint venture of Advantech Co., Ltd. and Inventec Corporation (十二)The contents of the board resolutions regarding which independent directors have
voiced opposing or qualified opinions on the record or in writing in the most recent year or up to the publication of the annual report: None
(十三)The resignation or dismissal of the Company’s Chairman, President, Accounting Officer, Finance Office, Internal Audit Director, and R&D Director in the most recent year or up to the publication of the annual report: None

51
IV、CAP fees:
CPA Firm Name of CPAs Audit Period Remark Deloitte & Touche Meng Chieh
Chiu Chin Hsiang Chen
01.01.2015 - 12.31.2015
Monetary unit: NT$ Thousand Fees
Amount range
Audit fees
Non-audit fees
Total
1 Less than $2,000 thousand 1,316 1,316
2 $2,000 thousand (inclusive)~$4,000 thousand 3 $4,000 thousand (inclusive)~$6,000 thousand 5,210 5,210 4 $6,000 thousand (inclusive)~$8,000 thousand 5 $8,000 thousand (inclusive)~$10,000 thousand 6 More than $10,000 thousand (inclusive)
(一) If the non-audit fees paid to the CPAs, CPA Firm, and its affiliated companies is over 25% of the audit fee, the amount of audit fee and non-audit fee and the contents of the non-audit service should be disclosed:
Monetary unit: NT$ Thousand
CPA Firm Name of
CPAs Audit Fees
Non-audit Fees
Audit Period
Remark
System design
Industrial and
commercial registration
Human resources Others Subtotal
Deloitte & Touche
Meng Chieh
Chiu
5,210
88
1,228
1,316 01.01.2015 - 12.31.2015
Other: Transfer
pricing service
fees
Chin Hsiang Chen
(二) If a new CPA Firm is commissioned to serve for an audit fee less than the year before, please disclose the audit fee amount before and after the CPA replacement arranged and the reason for doing so: None
(三) If the audit fee of current year is more than 15% less than the year before, please disclose the audit fee amount and ratio reduced and the root cause of the fee reduction: None
V、Replacement of CPAs: None VI、The Company’s Chairman, President, and Finance or Accounting Officer have held a
position in the independent auditing firm or its affiliates over the past year: None

52
VII、Changes in the shares held and pledged by directors, supervisors, managers, and major shareholders holding over 10% of outstanding shares in the most recent year and up to the publication of the annual report:
(一)Changes in equity:
Title Name
2015 As of March 31
Increase (decrease) of shareholding
Increase (decrease) of
shares pledged
Increase (decrease) of shareholding
Increase (decrease) of
shares pledgedDirector K.C. Liu 0 0 0 0
Director Advantech Foundation 0 0 0 0
Legal
Representative
Donald Chang 0 0 0 0
Director Ted Hsu 0 0 0 0
Director Jeff Chen 0 0 0 0
Director Joseph Yu 0 0 0 0
Supervisor Advantech Investment
Co., Ltd.
0 0 0 0
Legal
Representative
Gary Tseng 0 0 0 0
Supervisor Thomas Chen (13,000) 0 0 0
Supervisor James Wu 0 0 0 0
President Chaney Ho (207,000) 0 0 0
Vice President Deyu Yin 0 0 0 0
Vice President Albert Huang (250,000) 0 (164,000) 0
Vice President Eric Chen (243,000) 0 0 0
Accounting
Officer
Rorie Kang 0 0 0 0
Major shareholder Asus Computer Co.,
Ltd.
0 0 0 0
Major shareholder K and M Investment
Co., Ltd.
0 0 0 0
(二)The counterparty of the equity transfer is a related party: None (三)The counterparty of the equity pledge is a related party: None

53
VII、The Top-10 shareholders who are the spouses or relatives within second-degree to each other:
Unit: Shares; %
Name
Shareholding of the Principal Shareholdings by spouse and underage children
Shareholding by nominee
arrangement
The tile or name and relationshiof the Top-10 shareholders whare the spouse or relatives withitwo degrees to each other adefined in SFAS No. 6 (Note 3)
Remark
Shares Shareholding
ratio (%) Shares
Shareholdi
ng ratio
(%)
SharesShareholding
ratio (%)Title Relations
Asus Computer Co., Ltd. 91,483,812 14.48% 0 0 0 0 None None None
K and M Investment Co., Ltd.
75,337,181 11.92% 0 0 0 0
Advantech Investment Co.,
Ltd. Director
None Advantech Foundation Director
Advantech Investment Co.,
Ltd. 74,636,266 11.81% 0 0 0 0
K and M Investment Co.,
Ltd Director
None Advantech Foundation Director
K.C. Liu
23,292,484 3.69% 1,197,672 0.19% 0 0
K and M Investment Co., Ltd.
Director
None Advantech Investment Co., Ltd.
Director
Advantech Foundation
Director
HSBC commissioned to manage Yuan-Wang Partner Fund Limited Partnership account
22,054,216 3.49% 0 0 0 0 None None None
Advantech Foundation
18,244,889 2.89% 0 0 0 0
K and M Investment Co.,
Ltd. Director
None Advantech
Investment Co., Ltd.
Director
Tran-Fei Development Co.,
Ltd. 17,859,118 2.83% 0 0 0 0 None None None
Yong-Shun Zhuang 14,429,335 2.28% 0 0 0 0 None None None
Citigroup (Taiwan) commissioned to manage Singapore Government Investment account
12,113,303 1.92% 0 0 0 0 None None None
HSBC commissioned to manage First State Asia Securities Earnings fund Investment
8,834,784 1.37% 0 0 0 0 None None None
1: Illustrate the name of the Top-10 shareholders; also, illustrate separately the name of the institutional shareholder and its representative. 2: The shareholding ratio is calculated by referring to the shares held by the Principal, the Principal’s spouses and underage children, or by
nominee agreement. 3: Disclose the relationship among shareholders referred to above, including the juristic person and natural person.
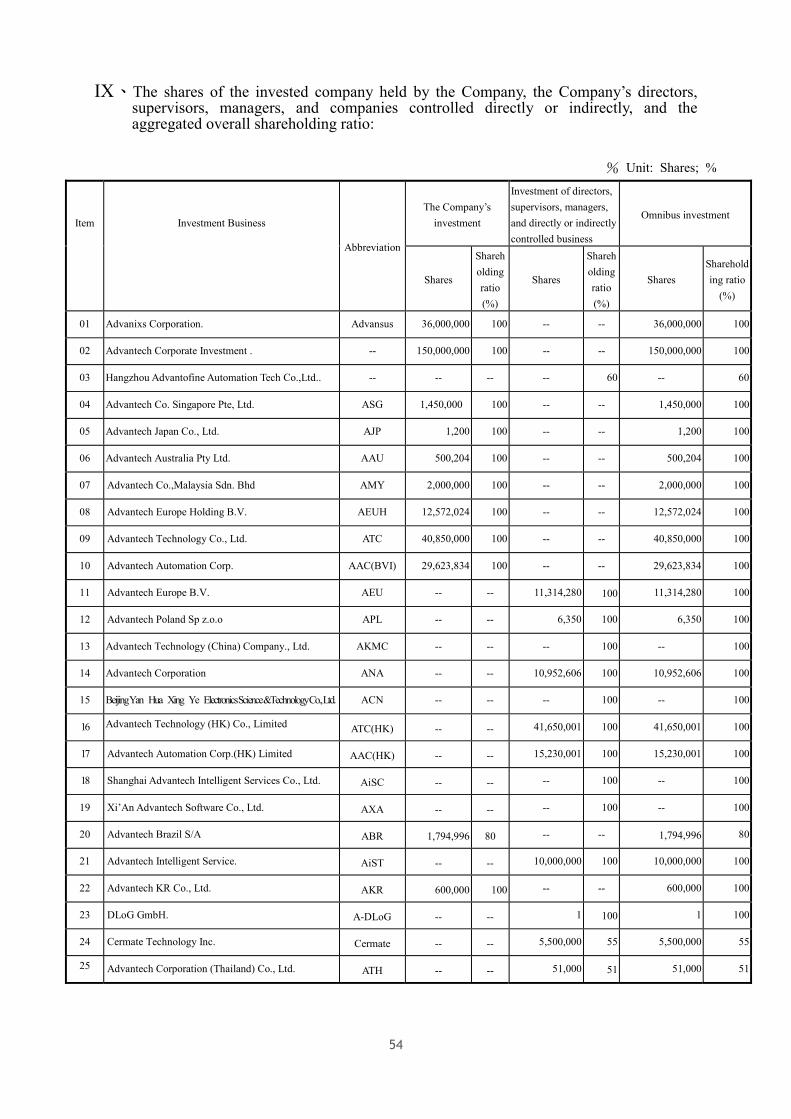
54
IX、The shares of the invested company held by the Company, the Company’s directors, supervisors, managers, and companies controlled directly or indirectly, and the aggregated overall shareholding ratio:
% Unit: Shares; %
Item
Investment Business
Abbreviation
The Company’s investment
Investment of directors, supervisors, managers, and directly or indirectly controlled business
Omnibus investment
Shares
Shareholding ratio (%)
Shares
Shareholding ratio (%)
Shares Shareholding ratio
(%)
01 Advanixs Corporation. Advansus 36,000,000 100 -- -- 36,000,000 100
02 Advantech Corporate Investment . -- 150,000,000 100 -- -- 150,000,000 100
03 Hangzhou Advantofine Automation Tech Co.,Ltd.. -- -- -- -- 60 -- 60
04 Advantech Co. Singapore Pte, Ltd. ASG 1,450,000 100 -- -- 1,450,000 100
05 Advantech Japan Co., Ltd. AJP 1,200 100 -- -- 1,200 100
06 Advantech Australia Pty Ltd. AAU 500,204 100 -- -- 500,204 100
07 Advantech Co.,Malaysia Sdn. Bhd AMY 2,000,000 100 -- -- 2,000,000 100
08 Advantech Europe Holding B.V. AEUH 12,572,024 100 -- -- 12,572,024 100
09 Advantech Technology Co., Ltd. ATC 40,850,000 100 -- -- 40,850,000 100
10 Advantech Automation Corp. AAC(BVI) 29,623,834 100 -- -- 29,623,834 100
11 Advantech Europe B.V. AEU -- -- 11,314,280 100 11,314,280 100
12 Advantech Poland Sp z.o.o APL -- -- 6,350 100 6,350 100
13 Advantech Technology (China) Company., Ltd. AKMC -- -- -- 100 -- 100
14 Advantech Corporation ANA -- -- 10,952,606 100 10,952,606 100
15 Beijing Yan Hua Xing Ye Electronics Science &Technology Co., Ltd. ACN -- -- -- 100 -- 100
16 Advantech Technology (HK) Co., Limited ATC(HK) -- -- 41,650,001 100 41,650,001 100
17 Advantech Automation Corp.(HK) Limited AAC(HK) -- -- 15,230,001 100 15,230,001 100
18 Shanghai Advantech Intelligent Services Co., Ltd. AiSC -- -- -- 100 -- 100
19 Xi’An Advantech Software Co., Ltd. AXA -- -- -- 100 -- 100
20 Advantech Brazil S/A ABR 1,794,996 80 -- -- 1,794,996 80
21 Advantech Intelligent Service. AiST -- -- 10,000,000 100 10,000,000 100
22 Advantech KR Co., Ltd. AKR 600,000 100 -- -- 600,000 100
23 DLoG GmbH. A-DLoG -- -- 1 100 1 100
24 Cermate Technology Inc. Cermate -- -- 5,500,000 55 5,500,000 55
25 Advantech Corporation (Thailand) Co., Ltd. ATH -- -- 51,000 51 51,000 51

55
Item
Investment Business
Abbreviation
The Company’s investment
Investment of directors,
supervisors, managers,
and directly or indirectly
controlled business
Omnibus investment
Shares Shareholding ratio
(%) Shares
Shareholding ratio (%)
Shares Shareholding ratio
(%)
26 LandMark Co., Ltd. LandMark -- -- 972,284 100 972,284 100
27 Cermate Technologies (Shanghai) Inc. Cermate Shanghai
-- -- -- 100 -- 100
28 Shenzhen Cermate Technologies Inc. Cermate Shenzhen
-- -- -- 90 -- 90
29 ACA Digital Corporation. ACA 8,000,000 100 -- -- 8,000,000 100
30 Advantech International PT. AID -- -- 300,000 100 300,000 100
31 Advantech Industrial Computing India Pvt. Ltd. AIN 999,999 99.99 -- -- 999,999 99.99
32 Advantech Electronics, S.De R.L.De C. AMX -- 100 -- -- -- 100
33 AdvanPOS Technology Co., Ltd. AdvanPOS 20,438,000 100 -- -- 20,438,000 100
34 Bright Mind Limited. -- -- -- 200 100 200 100
35 AdvanPOS Technology Shanghai Co.,Ltd. -- -- -- -- 100 -- 100
36 Advantech-LNC Technology Co.,Ltd. ALNC 26,980,000 89.93 -- -- 26,980,000 89.93
37 Better Auto Holdings Limited -- -- -- 8,556,096 100 8,556,096 100
38 Famous Now Limited -- -- -- 1 100 1 100
39 Dongguan Pou Yuen Digital Technology Co.,Ltd. -- -- -- -- 100 -- 100
40 Advantech iFactory Co. Ltd. Advantech iFactory 6,000,000 100 6,000,000 100
41 Advantech InnoCo Design Co., Ltd. Advantech InnoCo Design
1,000,000 100
1,000,000 100

56
IV.Financing Status
一、Capital and shares
(一)Sources of capital
Unit: Thousand shares; NT$ Thousand
Month /
year
Issuing price
Authorized capital Paid-in capital Remark
Shares Amount Shares Amount Source of capital
Pay for stock
shares with
property other
than cash
Others
07.1997 10 100,000 1,000,000 47,500 475,000Capitalization by cash 171,000
None Note 1Capitalization by earnings 114,000
06.1998 10 100,000 1,000,000 80,750 807,500Capitalization by cash 95,000 None
Note 2Capitalization by earnings 237,500
06.1999 10 200,000 2,000,000 130,700 1,307,000 Capitalization by earnings 499,500 None Note 3
05.2000 10 298,000 2,980,000 174,500 1,745,000 Capitalization by earnings 438,000 None Note 4
08.2001 10 298,000 2,980,000 233,200 2,332,000 Capitalization by earnings 587,000 None Note 5
12.2001 10 298,000 2,980,000 233,429 2,334,294 Conversion of convertible bond 2,294 None
02.2002 10 298,000 2,980,000 233,486 2,334,865 Conversion of convertible bond 571 None
06.2002 10 500,000 5,000,000 285,513 2,855,130Capitalization by earnings 520,135 None
Note 6Conversion of convertible bond 130
12.2002 10 500,000 5,000,000 285,529 2,855,292 Conversion of convertible bond 162 None
02.2003 10 500,000 5,000,000 286,242 2,862,423 Conversion of convertible bond 7,131 None
04.2003 10 500,000 5,000,000 292,846 2,928,462 Capitalization 66,039 Note 9 Note 7
06.2003 10 500,000 5,000,000 341,304 3,413,039 Capitalization by earnings 484,577 None Note 8
03.2004 10 500,000 5,000,000 337,728 3,377,279Cancellation of Treasury Stock (38,620) None
Conversion of convertible bond 2,860
06.2004 10 500,000 5,000,000 362,862 3,628,617Capitalization by earnings 223,864 None
Note 10Conversion of convertible bond 27,474
09.2004 10 500,000 5,000,000 369,230 3,692,299 Conversion of convertible bond 63,682 None
12.2004 10 500,000 5,000,000 374,296 3,742,812 Conversion of convertible bond 50,513 None
03.2005 10 500,000 5,000,000 374,767 3,747,672 Conversion of convertible bond 4,860 None
06.2005 10 500,000 5,000,000 401,683 4,016,833Capitalization by earnings 237,384 None
Note 11Conversion of convertible bond 31,777
09.2005 10 500,000 5,000,000 403,889 4,038,893 Conversion of convertible bond 22,060 None
12.2005 10 500,000 5,000,000 448,783 4,487,826 Exchange of shares 448,933 None Note 12

57
Month / Year
Issuing price
Authorized capital Paid-in capital Remark
Shares Amount Shares Amount Source of capital
Pay for stock shares with property other than cash
Others
01.2006 10 500,000 5,000,000 448,900 4,489,003 Conversion of convertible bond
477 None
Conversion of stock option 700 04.2006 10 500,000 5,000,000 448,960 4,489,603 Conversion of stock option 600 None
07.2006 10 500,000 5,000,000 463,180 4,631,795 Capitalization by earnings 139,792 None Note 13Conversion of convertible bond
2,100
Conversion of stock option 300 09.2006 10 500,000 5,000,000 463,365 4,633,645 Conversion of stock option 1,850 None 12.2006 10 500,000 5,000,000 463,630 4,636,295 Conversion of stock option 2,650 None 03.2007 10 500,000 5,000,000 463,665 4,636,645 Conversion of stock option 350 None 07.2007 10 600,000 6,000,000 490,847 4,908,470 Capitalization by earnings 271,825 None Note 1409.2007 10 600,000 6,000,000 491,227 4,912,270 Conversion of stock option 3,800 None 12.2007 10 600,000 6,000,000 491,577 4,915,770 Conversion of stock option 3,500 None 04.2008 10 600,000 6,000,000 491,877 4,918,770 Conversion of stock option 3,000 None 07.2008 10 600,000 6,000,000 481,877 4,818,770 Cancellation of Treasury
Stock (100,000) None Note 15
07.2008 10 600,000 6,000,000 481,962 4,819,620 Conversion of stock option 850 None 08.2008 10 600,000 6,000,000 511,330 5,113,308 Capitalization by earnings 293,688 None Note 1610.2008 10 600,000 6,000,000 511,346 5,113,458 Conversion of stock option 150 None 04.2009 10 600,000 6,000,000 511,366 5,113,658 Conversion of stock option 200 None 07.2009 10 600,000 6,000,000 511,386 5,113,858 Conversion of stock option 200 None 08.2009 10 600,000 6,000,000 516,009 5,160,087 Capitalization by earnings 46,229 None Note 1710.2009 10 600,000 6,000,000 516,134 5,161,337 Conversion of stock option 1,250 None 11.2010 10 600,000 6,000,000 501,634 5,016,337 Cancellation of Treasury
Stock (145,000) None Note 18
08.2011 10 600,000 6,000,000 551,797 5,517,971 Capitalization by paid-in capital
501,634 None Note 19
01.2012 10 600,000 6,000,000 552,996 5,529,961 Conversion of stock option 11,990 None Note 2004.2012 10 600,000 6,000,000 553,832 5,538,321 Conversion of stock option 8,360 None Note 2110.2012 10 600,000 6,000,000 560,893 5,608,937 Conversion of stock option 70,616 None Note 2201.2013 10 600,000 6,000,000 563,997 5,639,970 Conversion of stock option 31,033 None Note 2305.2013 10 600,000 6,000,000 565,205 5,652,050 Conversion of stock option 12,080 None Note 2408.2013 10 600,000 6,000,000 565,627 5,656,270 Conversion of stock option 4,220 None Note 2510.2013 10 600,000 6,000,000 566,924 5,669,248 Conversion of stock option 12,978 None Note 2602.2014 10 600,000 6,000,000 569,400 5,694,000 Conversion of stock option 24,752 None Not e2705.2014 10 600,000 6,000,000 571,451 5,714,511 Conversion of stock option 20,511 None Note 2807.2014 10 600,000 6,000,000 571,762 5,717,621 Conversion of stock option 3,110 None Note 2909.2014 10 800,000 8,000,000 628,702 6,287,021 Capitalization by earnings 569,400 None Note 3011.2014 10 800,000 8,000,000 630,103 6,301,031 Conversion of stock option 14,010 None Note 3102.2015 10 800,000 8,000,000 631,209 6,312,091 Conversion of stock option 11,060 None Note 3204.2015 10 800,000 8,000,000 631,518 6,315,186 Conversion of stock option 3,095 None Note 3306.2015 10 800,000 8,000,000 631,853 6,318,531 Conversion of stock option 3,345 None Note 34
Note 1: (86) Tai.Chai.Chen (I) No. 42710 Letter dated May 28, 1997 Note 2: (87) Tai.Chai.Chen (I) No. 47165 Letter dated May 29, 1998 Note 3: (88) Tai.Chai.Chen (I) No. 44698 Letter dated May 17, 1999 Note 4: (89) Tai.Chai.Chen (I)) No. 42068 Letter dated May 16, 2000 Note 5: (90) Tai.Chai.Chen (I) No. 131759 Letter dated May 22, 2001 Note 6: Tai.Chai.Chen.I.Tzi No. 0910131630 Letter dated June 11, 2002

58
Note 7: Tai.Chai.Chen.I.Tzi No. 0920111609 Letter dated April 16, 2003 Note 8: Tai.Chai.Chen.I.Tzi No. 0920128945 Letter dated June 30, 2003 Note 9: Issued new stock shares to exchange for the common stock shares of AXIOMTEK. Note 10: Tai.Chai.Chen.I.Tzi No. 0930126256 Letter dated June 14, 2004 Note 11: FSC.S.I.Tzi No. 0940124309 Letter dated June 17, 2005 Note 12: FSC.S.I.Tzi No. 0940006036 Letter dated December 22, 2005 Note 13: FSC.S.I.Tzi No. 0950130113 Letter dated July 12, 2006 Note 14: FSC.S.I.Tzi No. 0960035881 Letter dated July 13, 2007 Note 15: MOEA.So.Sun.Tzi No. 09701161800 Letter dated July 4, 2008 Note 16: FSC.S.I.Tzi No. 0970034562 Letter dated July 10, 2008 Note 17: FSC.S.Far.Tzi No. 0980027007 Letter dated June 3, 2009 Note 18: MOEA.So.Sun.Tzi No. 09901265490 Letter dated November 26, 2010 Note 19: MOEA.So.Sun.Tzi No. 10001174140 Letter dated August 1, 2011 Note 20: MOEA.So.Sun.Tzi No. 10101008150 Letter dated January 13, 2012 Note 21: MOEA.So.Sun.Tzi No. 10101074290 Letter dated April 27, 2012 Note 22: MOEA.So.Sun.Tzi No. 10101215000 Letter dated October 17, 2012 Note 23: MOEA.So.Sun.Tzi No. 10201009210 Letter dated January 15, 2013 Note 24: MOEA.So.Sun.Tzi No. 10201077320 Letter dated May 1, 2013 Note 25: MOEA.So.Sun.Tzi No. 10201153720 Letter dated August 1, 2013 Note 26: MOEA.So.Sun.Tzi No. 10201219700 Letter dated October 29, 2013 Note 27: MOEA.So.Sun.Tzi No. 10301021080 Letter dated February 11, 2014 Note 28: MOEA.So.Sun.Tzi No. 10301077560 Letter dated May 1, 2014 Note 29: MOEA.So.Sun.Tzi No. 10301150080 Letter dated July 28, 2014 Note 30: MOEA.So.Sun.Tzi No. 10301198730 Letter dated September 23, 2014 Note 31: MOEA.So.Sun.Tzi No. 10301225080 Letter dated November 3, 2014 Note 32: MOEA.So.Sun.Tzi No. 10401013670 Letter dated February 4, 2015 Note 33: MOEA.So.Sun.Tzi No. 10401076830 Letter dated April 27, 2015 Note 34: MOEA.So.Sun.Tzi No. 10401159550 Letter dated July 29, 2015
Type of shares Authorized capital stock
Remarks Shares in circulation (Note) Unissued shares Total
Order common
stock
631,853,100 168,146,900 800,000,000 Authorized capital stock, of which, 50,000thousand shares are reserved for exercising stock options.
Note: It is the number of shares of the listed stock as of March 27, 2016.
Information of shelf registration: NA
(II) Shareholder structure: March 27, 2016 (Ex-transfer date)
Structure of
Shareholder
QTY
Government
institutions
Financial
institutions
Other juristic
person Natural person
Foreign institution &
foreigners Total
Number of persons 1 17 122 9,215 689 10,044 Shareholding 8 13,450,965 297,214,676 74,797,943 246,389,508 631,853,100
Shareholding ratio 0 2.13% 47.03% 11.85% 38.99% 100%

59
(III) Status of Ownership Dispersion: NT$10 Par
March 27, 2016 (Ex-transfer date)
Shareholding class Number of
shareholders Shareholding Shareholding ratio
1 ~ 999 4,865 844,427 0.13% 1,000 ~ 5,000 3,640 7,006,833 1.11% 5,001 ~ 10,000 510 3,648,959 0.58% 10,001 ~ 15,000 165 2,014,707 0.32% 15,001 ~ 20,000 113 1,986,499 0.31% 20,001 ~ 30,000 125 3,054,670 0.48% 30,001 ~ 40,000 73 2,570,506 0.41% 40,001 ~ 50,000 43 1,924,896 0.30% 50,001 ~ 100,000 160 11,229,488 1.78% 100,001 ~ 200,000 122 17,555,170 2.78% 200,001 ~ 400,000 85 24,421,338 3.87% 400,001 ~ 600,000 45 22,326,905 3.53% 600,001 ~ 800,000 20 14,193,642 2.25% 800,001 ~ 1,000,000 9 8,031,508 1.27% Over 1,000,001 To be grouped discretionally 69 511,043,552 80.88%
Total 10,044 631,853,100 100%Note: The Company does not have preferred stock shares issued.
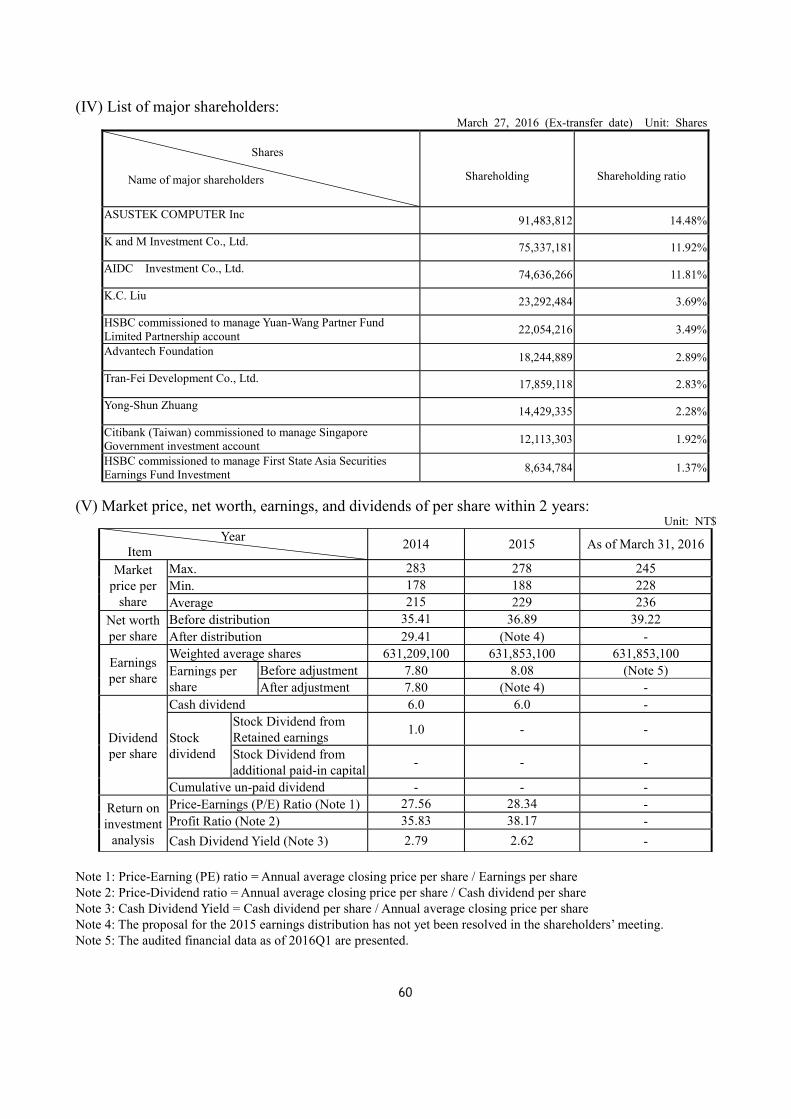
60
(IV) List of major shareholders: March 27, 2016 (Ex-transfer date) Unit: Shares
Shares
Name of major shareholders
Shareholding
Shareholding ratio
ASUSTEK COMPUTER Inc 91,483,812 14.48%
K and M Investment Co., Ltd. 75,337,181 11.92%
AIDC Investment Co., Ltd. 74,636,266 11.81%
K.C. Liu 23,292,484 3.69%
HSBC commissioned to manage Yuan-Wang Partner Fund Limited Partnership account 22,054,216 3.49%
Advantech Foundation 18,244,889 2.89%
Tran-Fei Development Co., Ltd. 17,859,118 2.83%
Yong-Shun Zhuang 14,429,335 2.28%
Citibank (Taiwan) commissioned to manage Singapore Government investment account 12,113,303 1.92%
HSBC commissioned to manage First State Asia Securities Earnings Fund Investment 8,634,784 1.37%
(V) Market price, net worth, earnings, and dividends of per share within 2 years:
Unit: NT$ Year Item 2014 2015 As of March 31, 2016
Market price per
share
Max. 283 278 245 Min. 178 188 228 Average 215 229 236
Net worth per share
Before distribution 35.41 36.89 39.22 After distribution 29.41 (Note 4) -
Earnings per share
Weighted average shares 631,209,100 631,853,100 631,853,100 Earnings per share
Before adjustment 7.80 8.08 (Note 5) After adjustment 7.80 (Note 4) -
Dividend per share
Cash dividend 6.0 6.0 -
Stock dividend
Stock Dividend from Retained earnings 1.0 - -
Stock Dividend from additional paid-in capital - - -
Cumulative un-paid dividend - - - Return on investment
analysis
Price-Earnings (P/E) Ratio (Note 1) 27.56 28.34 - Profit Ratio (Note 2) 35.83 38.17 - Cash Dividend Yield (Note 3) 2.79 2.62 -
Note 1: Price-Earning (PE) ratio = Annual average closing price per share / Earnings per share Note 2: Price-Dividend ratio = Annual average closing price per share / Cash dividend per share Note 3: Cash Dividend Yield = Cash dividend per share / Annual average closing price per share Note 4: The proposal for the 2015 earnings distribution has not yet been resolved in the shareholders’ meeting. Note 5: The audited financial data as of 2016Q1 are presented.

61
(VI) Dividend Policy and Execution Status: I. In assumption that Advantech makes annual profits, the company shall set aside one to
twenty percent (1-20%) of the profit for employees’ compensation, and the Board will decide whether to distribute it in the form of shares or cash while the receivers shall be the employees of subsidiaries of the company meeting certain specific requirements. Assuming that Advantech has the above-mentioned revenues, the Board will decide to set aside no more than one percent (1%) of the sum for directors’ and supervisors’ reward. The distribution of employees’ compensation and directors’ and supervisors’ reward shall be submitted to the shareholders' meeting. On March 4, 2016, the Board of Directors of Advantech made a proposal regarding the allotment of dividends (cash dividends) from surplus for the year 2015. It plans to allot NT$ 3,791,118,600, and the cash dividends to shareholders will be NT$ 6 per share (accounting the annual net income after tax is 74.27%). The decision will be made at the shareholders' meeting on May 25, 2016, and will be executed in accordance with relevant regulations.
II.The proposal for dividend distribution is to be resolved in this Shareholders’ Meeting: The dividend (cash dividend) to shareholder for an amount NT$3,797,118,600 is proposed to be appropriated from the 2015 earnings. Once the proposal is resolved in the shareholders’ meeting, the board of directors will be authorized to have the distribution base date scheduled. The dividend distribution is calculated in accordance with the shareholding of the respective shareholder booked in the Shareholder Registry on the scheduled base date. Dividend is distributed in accordance with the outstanding 631,853,100 shares of common stock on December 31, 2015. Dividend to shareholders is for NT$6 per share. Subsequently, for any changes in the distribution ratio due to the change of law and regulations, the change in the authorization of the competent authorities, or the change in the outstanding shares, the shareholders’ meeting is to have the board of directors authorized to have the dividend per share adjusted in accordance with the number of outstanding shares.
III.Any expected major changes in the dividend policy: None
(VII) The impact of the distribution of stock dividend as proposed in this Shareholders Meeting on the Company’s operation performance and earnings per share: The distribution of stock dividend was not proposed in the 2015 shareholders’ meeting; also, the Company is not required to publish the 2015 financial forecast in accordance with the provisions; therefore, no need to disclose the annual forecast information.
(VIII) Employee Compensation and Remuneration to Directors and Supervisors: 1. The amendment to Company Act in May 2015 deleted the relevant provisions regarding
employee bonus from the original provisions related to surplus allotment, and another Article was promulgated and provided that a fixed amount or ratio of profit of the current year distributable as employees' compensation shall be definitely specified in the Articles of Incorporation. Advantech plans to amend the Articles of the company in accordance with the foregoing regulations at the 2016 shareholders' meeting. According to the proposed Articles, Advantech shall set aside less than one percent (1%) of annual profits for the distribution of directors’ compensation and one to twenty percent (1-20%) for employees' compensation before allotting surplus. On March 4, 2016, the Board of Advantech approved that the payment of employees’ cash compensation for the year 2015 shall be made in compliance with a fixed ratio of annual profits, and that the payment of directors’ compensation shall calculated based on the expected the calculated amount with accounting records. and the current-year distributable

62
amount. In case of discrepancy between the preceding calculated amount and the actual amount distributed, it shall be corrected according to the accountant’s calculation and the accounting record shall be adjusted for the year of distribution.
2.The estimation base for the distribution of employee Compensation and remuneration to directors and supervisor, the calculation base of the outstanding shares for the distribution of stock dividend,and the accounting process for the differences between the actual amount distributed and the estimated amount: For the earnings distribution resolved in the shareholders’ meeting, if the amount of the employee Compensation and remuneration to directors and supervisors is changed, the amount of difference should be handled in accordance with changes in accounting estimates and booked in the profit and loss of the following year without affecting the financial report that had already been acknowledged.
3.Information about the proposed distribution of employee bonus as approved by the Board of
Director: (1) On March 4, 2016, according to the revised charter based on the resolution, the company
will disburse annual profit sharing: Employee bonuses: NT$200,000,000. Remuneration to directors and supervisors:NT$12,000,000. Payments will be made in cash. The above amounts accurately reflect 2015 expenses already accounted for.
(2) The ratio of the proposed distribution of employee stock dividend payments to the total amount of the net income and employee bonus on the proprietary or individual financial statements: NA
4. The distribution of the 2014 earnings as employee bonus and remuneration to directors and supervisors: (1)The distribution of the annual employee bonus and remuneration to directors and
supervisors is as follows: Employees Cash dividend: NT$126,000,000 Remuneration to directors and supervisors: NT$12,000,000
(2)If the amount referred to above differs from the employee bonus and remuneration to directors and supervisors recognized, please state the number of differences, causes of differences, and the treatment scenarios: None
(IX) Situations of the Company’s buy back stocks: None
II. Corporate bond:NA. III. Preferred Stock issued: NA IV. Global depositary receipts issued: NA

63
V. Employee Stock Options issued (I) The Company’s outstanding employee stock options and its impact on shareholders’ equity up to
the publication of the annual report:
Types of employee stock option certificate 2014
Employ stock opt ion
The effective date of declaration July 29, 2014
Issuing date August 12, 2014
The number of units issued 5,000 units
Ratio of the number of shares available for subscription to the total number of shares issued 0.79%
Duration of subscription 8/12/2016 ~ 8/11/2020
Method of performance Issuance of new shares
Restrictive subscription period and ratio (%)
40% of the granted stock option certificate is exercisable after 2 years, 60% after 3 years, 80% after 4 years, and100% after 5 years
Number of shares subscribed 0
Amount of shares subscribed 0
Number of shares yet to be subscribed 5,000,000 shares
Subscription price per share for the unsubscribed shares $100
Ratio of the unsubscribed shares to the total number of shares issued (%) 0.79%
Impact on shareholders’ equity
The granted employee stock option certificates after 2 years shall be exercised in accordance with the conditioned subscription period and ratio; also, the number of shares to be subscribed is 0.79% of the number of shares issued, which will not have significant impact on shareholders’ equity.

64
(II)
Nam
e of
the
man
ager
s w
ith
empl
oyee
sto
ck o
ptio
n ce
rtifi
cate
s ob
tain
ed, t
he to
p-10
em
ploy
ees
with
sto
ck o
ptio
n ce
rtifi
cate
s ob
tain
ed,
the
resp
ectiv
e ac
quis
ition
and
subs
crip
tion:
M
arch
27,
201
6 U
nits
: Ex
cept
for
sto
ck s
ubsc
riptio
n pr
ice
in N
TD,
NT$
Tho
usan
d
Title
N
ame
Num
ber
of
shar
es
acqu
ired
Rat
io o
f su
bscr
ibed
sh
ares
to
tota
l nu
mbe
r of
sha
res
issu
ed
Subs
crib
ed
Uns
ubsc
ribe
d
Num
ber
of
shar
es
subs
crib
ed
Pri
ce o
f sh
ares
su
bscr
ibed
Am
ount
of
shar
es
subs
crib
ed
Rat
io
of
subs
crib
ed
shar
es
to
tota
l nu
mbe
r of
sh
ares
iss
ued
Num
ber
of
shar
es
subs
crib
ed
Pri
ce o
f sh
ares
su
bscr
ibed
Am
ount
of
shar
es
subs
crib
ed
Rat
io
of
subs
crib
ed
shar
es t
o to
tal
num
ber
of
shar
es i
ssue
d
M a n a g e m e n t
Pres
iden
t C
hane
y H
o20
14
empl
oyee
st
ock
optio
n ce
rtific
ate
500,
000
0.08
%
00
00
500,
000
100
0 0.
08
Vic
e Pr
esid
ent
Dey
u Y
in
Vic
e Pr
esid
ent
Alb
ert
Hua
ng
Vic
e Pr
esid
ent
Eric
Che
n
E m p l o y e e s
Ttop
-10
empl
oyee
20
14
empl
oyee
st
ock
optio
n ce
rtific
ate
325,
000
0.05
%
00
00
325,
000
100
0 0.
05
VI.R
estri
cted
Em
ploy
ee S
hare
s: N
A
VII
. Iss
uanc
e of
new
shar
es fo
r the
shar
es a
cqui
red
or tr
ansf
erre
d fr
om o
ther
com
pani
es: N
A
VII
I. Im
plem
enta
tion
of fu
nd p
lan:
NA

65
Five. HIGHTLIGHTS OF OPERATIONS I. Business Content (I) Business Scope
1. Major business operation of the Company: (1) The design, assembly, combination, production, and trade of computer testing equipment and
automated test systems; (2) The processing, manufacturing, and importing/exporting (except for the restricted items) of
computers, electronics, and electrical components and devices; (3) The design, contracting, installation, and maintenance of computers and electronic control
automation systems; (4) Computer software design; (5) Handling the agency, quotes, bidding, and sales of the products referred to above on behalf of
the domestic and foreign manufacturers; (6)The assembly, manufacturing, trade, and importing/exporting business of the wired and
wireless communications equipment;
2. Major products and business ratio of the Company: Unit: NT$ Thousand
Ratio Major product
2015 Sales Amount %
Industrial Control 5,619,222 15 Industrial computer 8,762,095 23 Embedded board and case 15,474,001 41 Industrial applied computer 3,696,050 10 After-sale service and other 4,449,214 11
Total 38,000,582 100
3.The Company’s currently offered products: Embedded board and case, industrial applied computer, industrial control, industrial computer, and after-sale service and others.
4. New product development plan of the Company: (1) M2.COM as open stardard IoT sensor patform and M2M applications (2) Wireless IoT Gateway with the capabilities of Wi-Fi, Sub-1G, Cellular connections (3) WISE-PaaS (Platform as a Service) for IoT cloud services (4) Total solutions for Industry 4.0 and factory automation (5) Platforms for Intelligent robot, machine vision and motion control (6) Total solutions for intelligent retail (7) Platforms for intelligent transportation and digital logistics (8) Energy management system for intelligent building (9) Platforms for digital healthcare and intelligent hospital (10)Industrial network appliances and management system
(II) Industry Summary
2.1 Industry status and development Industrial Computer (IPC) was first used in factories manufacturing processes, instruments and equipment control, and monitoring and testing. In a narrow sense, it is limited to the industrial automation board system and mainly for the use of automation equipment. Due to the

66
integrated application of communications, networks, software, and photoelectric few years ago, IPC is gradually applied to all aspects of life with a stress on its applications, including MRT reader, vending machine, ATM, POS, game, network storage (NAS), Digital Signage, smart building automation monitoring systems and environmental monitoring systems, and lottery ticket computers. The entire IPC industry is flourishing and it is expanded from the original “industry” scope and with an application filed with the Ministry of economic Affairs to have IPC renamed as “smart industry” in recent years. According to the laws of the IT industry “A revolution in every fifteen-year,” an innovative key technology will be developed in average of fifteen years. According to recent trends observed, the industrial environment is facing changes and several of the industrial phenomena are the key factors impacting such changes. The world has officially entered the global Internet of Things (IoT) smart generation after years of transition and preparation. Therefore, the manufacturers of the industry will meet the needs of various industries in the smart generation by providing cloud infrastructure, cloud smart services, and IoT and smart city industry-related services. 2.2 Correlation of the upper-, mid-, and downstream industry
Internet of Things (IoT) is composed as a three-stage structure, including full perception, reliable convey, and smart computation (see the Figure below). The fist-tier “full perception” is with the infrastructure provided by the automation industry to have information integrated and converted, including the existing well-known industries, such as, Advantech, Delta, ABB, GE, etc. The telecommunications industry, such as, AT&T, Cisco, Nokia, and Alctel are to have the converted information uploaded to the cloud, forming a reliable convey in the second-tier. Last but not the least, the computer industries, such as, IBM, Microsoft, Amazon, and Google, are to have software integrated for analyzing data and constructing smart computation in the third-tier, and to have the results integrated with the service providers in order to have the information communicated to the end-users so that the originally unrelated three industries can realize the concept of Internet of Things (IoT) through mutual interpenetration (see the Figure below).
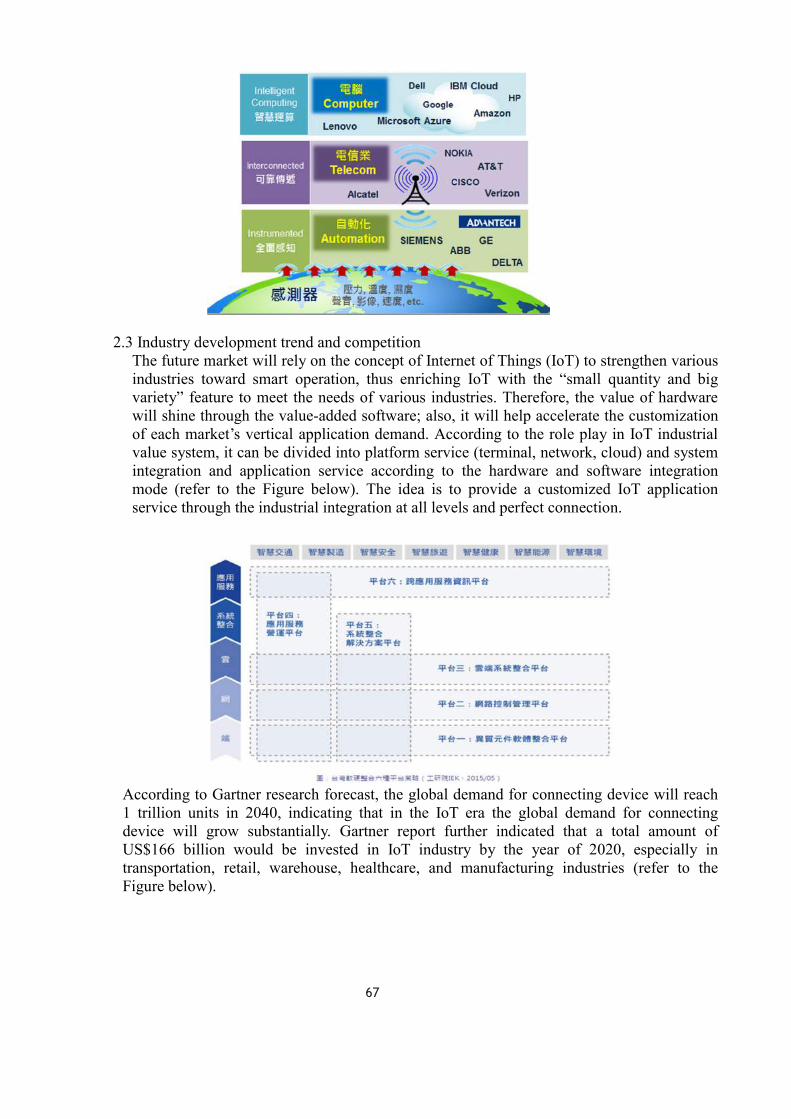
67
2.3 Industry development trend and competition The future market will rely on the concept of Internet of Things (IoT) to strengthen various industries toward smart operation, thus enriching IoT with the “small quantity and big variety” feature to meet the needs of various industries. Therefore, the value of hardware will shine through the value-added software; also, it will help accelerate the customization of each market’s vertical application demand. According to the role play in IoT industrial value system, it can be divided into platform service (terminal, network, cloud) and system integration and application service according to the hardware and software integration mode (refer to the Figure below). The idea is to provide a customized IoT application service through the industrial integration at all levels and perfect connection.
According to Gartner research forecast, the global demand for connecting device will reach 1 trillion units in 2040, indicating that in the IoT era the global demand for connecting device will grow substantially. Gartner report further indicated that a total amount of US$166 billion would be invested in IoT industry by the year of 2020, especially in transportation, retail, warehouse, healthcare, and manufacturing industries (refer to the Figure below).

68
According to McKinsey’s latest report “The Internet of Things: Mapping the Value beyond the Hype,” the potential impact of global IoT on global economy will reach US$11.1 trillion before the year of 2025, of which, the demand of smart factory for IoT will be the highest and its impact on the economy will reach US$3.7 trillion in 2025. The demand of smart city comes in second and it will reach US$1.7 trillion in 2025. In addition, different vendors will also be able to show their contribution in bringing values to the market gradually through the three-stage reformation process. For the Internet generation in Stage I of IoT, the infrastructure and hardware vendor value is the highest. In Stage II, the core services, such as, big data analysis and search engine service, constructed on the top of the infrastructure are relatively valuable. In Stage III, a new business model for different industries will surface, such as, online retailing business provided by Amazon or the sharing economy of network lease platform by Airbnb. The IoT industry will start from IoT Devices before the year of 2020 (see the Figure below); in 2020-2030, IoT SRP (Services Ready Platform) will be gradually matured; in 2030-2040, the IoT Application service era will arrive. By then, there will be a wide range of IoT Cloud Services focusing on Domain Focus professional cloud service available with significant output value generated. Taiwan’s IoT manufacturers have a great business opportunity in IoT Devices and Advantech values the development of IoT SRP. As for IoT Cloud Services providers, European and American manufacturers are obviously with competitive advantage and Taiwanese manufacturers are with less chance to triumph in this field (see the Figure below).
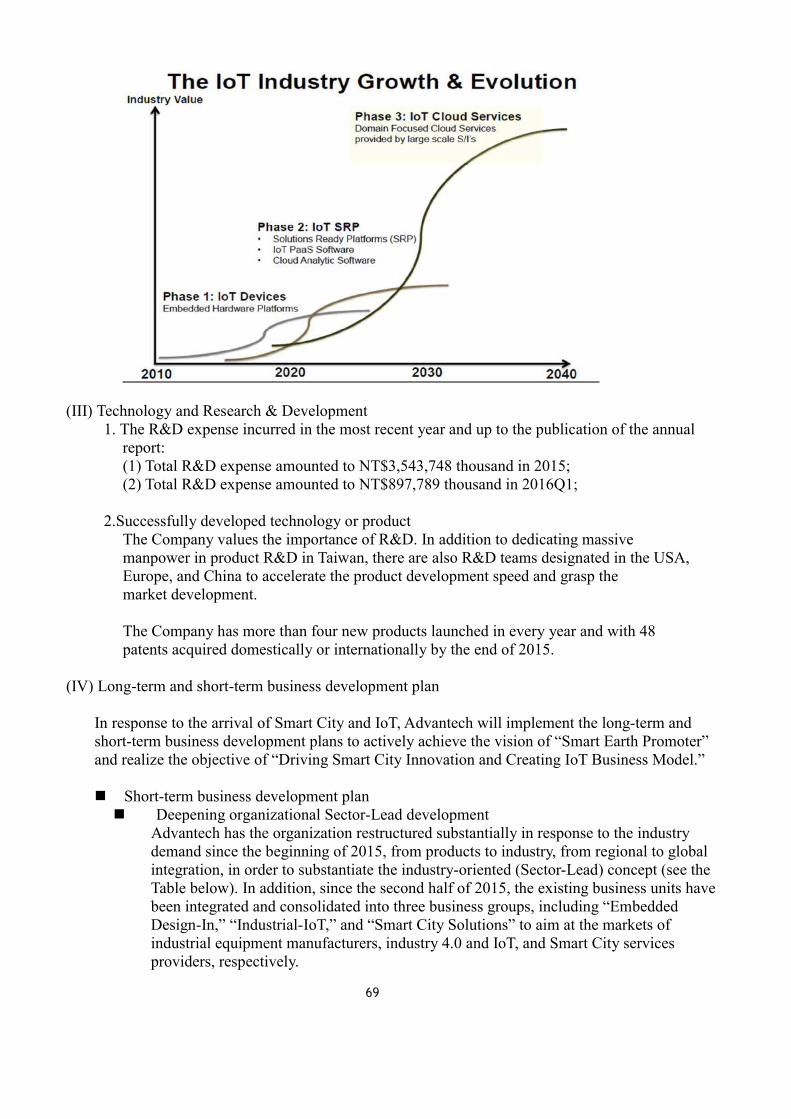
69
(III) Technology and Research & Development 1. The R&D expense incurred in the most recent year and up to the publication of the annual
report: (1) Total R&D expense amounted to NT$3,543,748 thousand in 2015; (2) Total R&D expense amounted to NT$897,789 thousand in 2016Q1;
2.Successfully developed technology or product
The Company values the importance of R&D. In addition to dedicating massive manpower in product R&D in Taiwan, there are also R&D teams designated in the USA, Europe, and China to accelerate the product development speed and grasp the market development.
The Company has more than four new products launched in every year and with 48 patents acquired domestically or internationally by the end of 2015.
(IV) Long-term and short-term business development plan
In response to the arrival of Smart City and IoT, Advantech will implement the long-term and short-term business development plans to actively achieve the vision of “Smart Earth Promoter” and realize the objective of “Driving Smart City Innovation and Creating IoT Business Model.”
Short-term business development plan Deepening organizational Sector-Lead development
Advantech has the organization restructured substantially in response to the industry demand since the beginning of 2015, from products to industry, from regional to global integration, in order to substantiate the industry-oriented (Sector-Lead) concept (see the Table below). In addition, since the second half of 2015, the existing business units have been integrated and consolidated into three business groups, including “Embedded Design-In,” “Industrial-IoT,” and “Smart City Solutions” to aim at the markets of industrial equipment manufacturers, industry 4.0 and IoT, and Smart City services providers, respectively.

70
7 Business Group 3 Business Group Target Market Business Model Sales Force
Embedded Core Computing Group Embedded
Design-In 嵌入式設計
Industrial
Equipment Manafacturer產業設備
製造商
Design-in 嵌入式設計
Branded 品牌
80%
DTOS
製造設計
20%
Key Account 大客戶
Networks & Communications Group
Channel 通路商
Applied Computing Group
AOnline 線上銷售
Industrial Automation Group
Industrial-IoT 工業物聯網
Industry 4.0, IoT
工業 4.0
物聯網
Application Solution
應用解決方案
Key Account 大客戶
Intelligent Systems Group
Channel 通路商
iConnectivity Group AOnline 線上銷售
Service Automation Group
Smart City Solutions
智慧城市解決方案
Smart City Solution Provider 智慧城市
服務提供
者
Application Solution
應用解決方案
Key Account 大客戶 Channel 通路商
AOnline 線上銷售
Constructing WISE-PaaS and Wireless Sensor Technology In response to the need of the IoT generation for prompt and accurate data retrieving, Advantech grasps the advantages of Taiwan industry and leverages the existing core competencies to continue constructing a comprehensive IoT smart cloud platform in last year. This platform will have the six software packages of Advantech integrated - Remote device management, security and protection, industrial control SCADA, image analysis, electronic billboard management, and communication device management; also, cooperate with the strategic alliances, such as, Microsoft and IBM Bluemix, to provide big data analysis services and machine learning modules.

71
Deepen regional development and incubation and linked to local SI North America: Promote brand and embedded design-in business synchronously to
become the well-known IoT brand in North America. Europe: Develop the three business models in the major countries and establish local
technical services to reconstruct the leading position in European market. Greater China: Become the Homeland for the development and innovation of each
business unit and be the test bed of new business and new business model.
North Asia (Japan and Korea): Incubate local talents and develop and invest in each business unit for its growth and development.
Emerging regions (Russia, India, the Middle East, Southeast Asia, Australia, and Latin America): Establish professional and internationalized business units the
same scale as the headquarters, became the founding base of the new region and new industry, and be the cradle of Advantech Global Relocation Talents.
Construct customer experience center and Industry 4.0 reality show. Advantech Linkou IoT Park Stage-II will be opened officially in 2016Q3 with the industry 4.0 concept deployed and the industry 4.0 war room displayed actually.
Organic and M&A parallel growth strategy Advantech’s growth sources will be from the organic growth of the organization and M&A in parallel. Execute Advantech’s strategy comprehensively with the organic growth of the organization and realize product and management innovation. The M&A strategy is executed in a disciplined manner to make up the insufficient key vertical area of Advantech and to refine Advantech’s M&A ability through a complete methodology, such as, acquired 100% shareholding of B+B SmartWorx Inc. for NT$$99.85 million at the end of 2015 is the full execution of such concept.
Long-term business development plan: Advantech proposed corresponding policy in the IoT three-stage change:
Advantech has based on the core concept of “Connecting the Dots” to form strategies and deployment; also, proposed the three strategic policies and its contents for the next five years:

72
Advantech has enhanced its role of as the key element to IoT with the strategies of
investment, incubation, and alliances. Advantech, in addition to mastering the core strengths in IPC industry, will actively work with the sensor partners at the bottom section of IoT to form an alliance; also, work with the cloud computation and analysis industry, such as, Microsoft, IBM, and Amzaon, at the upper section of IoT industry, to form an alliance. For the system integration and cloud service that is the closest to market service, work with large-scale system integration suppliers by investment and incubation to form an alliance, such as, AIS and AIF (see the Figure below).
Focus on the development of Smart City and Smart Factory Advantech will focus on the development of Smart City, including the five areas of smart transportation, smart retail, smart healthcare, smart construction, and digital logistics and fleet management. The development of Smart Factory under the industry 4.0 concept will be aiming at the five areas of Manufacturing Execution System (MES) and production resume, production test equipment, machine monitoring and preventive maintenance, labor-saving and automation, and factory environment monitoring.

73
Deepening IoT industrial technology and cultivating talents through industry-academia collaboration
For the purpose of developing IoT smart system advanced application technology and strengthening the competitiveness of Taiwan’s IoT industry, Advantech actively exercises industry-academia collaboration, utilizes academic theories, accelerates all kinds of IoT technologies development, and fosters market-oriented talents synchronously. Advantech had worked with National Chiao Tung University in 2015 to construct Taiwan’s first industry-academia platform for the development of IoT – IoT Smart System Research Center. This Center is not only the platform for integrating Taiwan’s existing IoT R&D manpower and resources, but also for integrating the R&D and innovation energy of ITRI, MediaTek, ARM, IBM Taiwan, and other industry-academia-research partners to accelerate and propel the development of IoT industry. The Center aims for the development of IoT industry and the independent development of the three laboratories, including Intelligent Video Analytics Lab, Robotics Lab, and IoT Embedded PaaS Lab. Currently, 12 professors from National Chiao Tung University are involved in the development, including three active commissioners and one Director of the Center, as well as 8 professors who direct the three laboratories. Advantech believes that National Chiao Tung University is the starting point for the realization of this concept; also, an amount of NT$20 million and resources will be invested annually for five years continuously with the hope of reaching out to those benchmark industries for this good cause.

74
II. Market, Production, and Sales Review (I) Market Analysis
1. Main product and main market: Unit: NT$ Thousand
Area 2015 America 10,973,966
Asia (including Taiwan) 20,571,623 Europe 6,454,993 Total 38,000,582
2. Market share and future supply and demand, and its growth According to the report from HIS, the compound annual growth rate for the global market
of industrial computer from 2014 to 2019 is about 6.0%; although the rate tends to the slow growth in 2015, it will recover in 2016 and steadily grow from 2017 to 2019. For the products, the industrial displays will be the most shinning products for the industrial computer, which the compound annual growth rate will reach 7.5% from 2017 to 2019. For the global regions, the USA presents the highest growth rate, followed by the Asian regions; for the countries, the USA takes the highest market share, followed by Germany and Mainland China, where three countries took up to 52.7% of market share of the industrial computers in 2014; for the vertical integration field, it is forecasted the infrastructure and traffic applications in each industry will be the most potential markets in the future, where the compound annual growth rate will reach up to 9.6%, followed by the medical applications near to 12% of global market share.
The ADVANTECH took the first place for the entire field of industrial computer and 29%
of market share in 2014, more growing 0.5% than in 2013, where took the highest market share in USA and Asian regions. Siemens took the first place in EMEA; the top four suppliers for the industrial computer have taken the revenues of the global industrial computer about 54%. The top ten suppliers took the revenues of the global industrial computer about 65% (see the following table).

75
3.Competitive advantages, favorable and unfavorable factors for the development prospect, and the countermeasures:
. For the scope of the industry covered by Internet of Things, the structure development of Internet of Things industry can be classified as the device phase based on ICs and components; from the embedding phase, it is developed to the phase of hardware platform for each kind of Internet of Things; the hardware platform in combination of the software application are transferred to the Solution Ready Platform (SRP), so-called as the semi-finished product phase; and finally the system integration is emphasized to provide the application phase based on the Solution Service Integration (SSI). In the cooperation with the suppliers in four phases of the industrial structure, it will have opportunity to promote the environment that objects are connected together, and further create more. For the industrial development in the foregoing three phases, regardless of inherently or environmentally, the ADVANTECH and the suppliers in Taiwan own the certain advantages. For the device phase, there are no products designed for Internet of Things in the IC or component industries. However, on the practical applications, Internet of Things has the demands of its device. Therefore, MediaTek Inc. or intermediate and small IC design companies in Taiwan have opportunity to compete with the international companies on the Internet of Things applications; intermediate and small IC design companies in Taiwan don’t concern the market and the quantity. On the industrial development of Internet of Things, they have more opportunity to develop.industrial profits.
Besides, in the hardware platform and the semi-finished product phase, the industrial development and dynamics in Taiwan are better than suppliers in the other regions because Taiwan possesses the advantages of developing industrial computers (IPC) in long term, in comparison of suppliers in North America, Germany and Japan. Meanwhile, the suppliers in Taiwan also have been a link of supply chain in the world by the different ways. As for the service integration and SSI phases, not only Taiwan but also on the global market are still lack. Because the system integration providers must integrate on site, they possess very powerful domain knowledge with the solid site execution and service as well as had better succeed the project experience. This phase can become the maximum advantage of developing Internet of Things industry for Taiwan in the future, whereas it is assumed that we incubate these suppliers on the Taiwan market.
Owing to the global condition and the niche market in Taiwan, the ADVANTECH not only will adopt a strategy of the investment, incubation and alliance to strengthen our role in the

76
key element of Internet of Things, but also make best efforts to focus on WISE-PaaS service. From our observation on the current trend of Internet of Things, the Platform as a Service (PaaS) will be a key to developing Internet of Things in each industry. Therefore, the WISE-PaaS service will be aggressively developed; this platform is integrated with six software sets from the ADVANTECH – remote device management, security protection, SCADA for industrial control, image analysis, electronic billboard and communication device management; in addition, the third-party partners like MS Azure, IBM BlueMix are more cooperated to provide big data analysis service and machine learning module. With one-stop service, the Solution Ready Platform (SRP) will be proposed for the different industries, which can lower the threshold to enter the Internet of Things industry for our customers – system integration providers, and further assist them in quickly establishing the Internet of Things service.

77
The Company’s other products awarded in recent
Year Awards
2016 TREK-773 rewarded the 24th Taiwan Excellence Gold and Silver Awards from Ministry of Economic Affairs, R.O.C. to enjoy the official
authorization from the symbol of Taiwan Excellence. PWS-870 rewarded 2016 iF Product Design Award. 1U High-efficiency Server rewarded the 24th Taiwan Excellence Gold and Silver Awards from Ministry of Economic Affairs, R.O.C. to
enjoy the official authorization from the symbol of Taiwan Excellence. 24” Medical Computer rewarded the 24th Taiwan Excellence Gold and Silver Awards from Ministry of Economic Affairs, R.O.C. to enjoy
the official authorization from the symbol of Taiwan Excellence. 7” High-efficiency Integrated Vehicle-mount Terminal – Light Vehicle Management rewarded the 24th Taiwan Excellence Gold and Silver
Awards from Ministry of Economic Affairs, R.O.C. to enjoy the official authorization from the symbol of Taiwan Excellence. 7” Ultra-slim Vehicle-mount Tablet Computer rewarded the 24th Taiwan Excellence Gold and Silver Awards from Ministry of Economic
Affairs, R.O.C. to enjoy the official authorization from the symbol of Taiwan Excellence. DPX-E135 Embedded Gambling System rewarded the 24th Taiwan Excellence Gold and Silver Awards from Ministry of Economic Affairs,
R.O.C. to enjoy the official authorization from the symbol of Taiwan Excellence. Pico-ITX 2.5” Micro Embedded Computer rewarded the 24th Taiwan Excellence Gold and Silver Awards from Ministry of Economic
Affairs, R.O.C. to enjoy the official authorization from the symbol of Taiwan Excellence. ProView Ethernet Exchange rewarded the 24th Taiwan Excellence Gold and Silver Awards from Ministry of Economic Affairs, R.O.C. to
enjoy the official authorization from the symbol of Taiwan Excellence. SOM-7568 Fan-free Embedded Micro COM Expres Computer rewarded the 24th Taiwan Excellence Gold and Silver Awards from Ministry of
Full-flat Compact Industrial Touch Computer rewarded the 24th Taiwan Excellence Gold and Silver Awards from Ministry of Economic Affairs, R.O.C. to enjoy the official authorization from the symbol of Taiwan Excellence.
Economic Affairs, R.O.C. to enjoy the official authorization from the symbol of Taiwan Excellence. Internet of Things Wireless Data Retrieval Module rewarded the 24th Taiwan Excellence Gold and Silver Awards from Ministry of Economic
Affairs, R.O.C. to enjoy the official authorization from the symbol of Taiwan Excellence. Wireless Internet of Things Gateway rewarded the 24th Taiwan Excellence Gold and Silver Awards from Ministry of Economic Affairs,
R.O.C. to enjoy the official authorization from the symbol of Taiwan Excellence. High-efficiency Computer Control System for Train Car rewarded the 24th Taiwan Excellence Gold and Silver Awards from Ministry of
Economic Affairs, R.O.C. to enjoy the official authorization from the symbol of Taiwan Excellence. Fan-free Industrial Computer for Control Cabinet rewarded the 24th Taiwan Excellence Gold and Silver Awards from Ministry of Economic
Affairs, R.O.C. to enjoy the official authorization from the symbol of Taiwan Excellence. Third-generation 7” Aluminum Vehicle-mount Terminal – Heavy Vehicle Management rewarded the 24th Taiwan Excellence Gold and Silver
Awards from Ministry of Economic Affairs, R.O.C. to enjoy the official authorization from the symbol of Taiwan Excellence. Fan-free Wayside Control Platform rewarded the 24th Taiwan Excellence Gold and Silver Awards from Ministry of Economic Affairs,
R.O.C. to enjoy the official authorization from the symbol of Taiwan Excellence. Mobile Multimedia Computing Module rewarded the 24th Taiwan Excellence Gold and Silver Awards from Ministry of Economic Affairs,
R.O.C. to enjoy the official authorization from the symbol of Taiwan Excellence. Ultra-slim Open-framed LED Touch Display rewarded the 24th Taiwan Excellence Gold and Silver Awards from Ministry of Economic
Affairs, R.O.C. to enjoy the official authorization from the symbol of Taiwan Excellence. Ultra-slim Mini-ITX rewarded the 24th Taiwan Excellence Gold and Silver Awards from Ministry of Economic Affairs, R.O.C. to enjoy the
official authorization from the symbol of Taiwan Excellence. Ultra-HD OPS Multimedia Player rewarded the 24th Taiwan Excellence Gold and Silver Awards from Ministry of Economic Affairs, R.O.C.
to enjoy the official authorization from the symbol of Taiwan Excellence Modular Industrial Control Platform rewarded the 24th Taiwan Excellence Gold and Silver Awards from Ministry of Economic Affairs,
R.O.C. to enjoy the official authorization from the symbol of Taiwan Excellence. Modular Embedded Intelligent System rewarded the 24th Taiwan Excellence Gold and Silver Awards from Ministry of Economic Affairs,
R.O.C. to enjoy the official authorization from the symbol of Taiwan Excellence. Aluminum Rail Industrial Computer rewarded the 24th Taiwan Excellence Gold and Silver Awards from Ministry of Economic Affairs,
R.O.C. to enjoy the official authorization from the symbol of Taiwan Excellence. Medical Intelligent Battery System rewarded the 24th Taiwan Excellence Gold and Silver Awards from Ministry of Economic Affairs, R.O.C.
to enjoy the official authorization from the symbol of Taiwan Excellence

78
2015 The 23rd Symbol of Excellence Gold Medal and Silver Medal Winner for 7” medical and industrial-grade handheld tablet computer, the
MOEA, Taiwan, ROC with the right to use the Symbol of Excellence lawfully. The 23rd Symbol of Excellence Winner for ATCA 100GbE advanced communications server, the MOEA, Taiwan, ROC with the right to use
the Symbol of Excellence lawfully. The 23rd Symbol of Excellence Winner for EKI Spec. Ethernet network switches, the MOEA, Taiwan, ROC with the right to use the Symbol
of Excellence lawfully. The 23rd Symbol of Excellence Winner for Open-type network structure HMI/SCADA software, the MOEA, Taiwan, ROC with the right to
use the Symbol of Excellence lawfully. The 23rd Symbol of Excellence Winner for Ultra-low-power consumption simple embedded IoT system, the MOEA, Taiwan, ROC with the
right to use the Symbol of Excellence lawfully. The 23rd Symbol of Excellence Winner for industrial-grade tablet computer, the MOEA, Taiwan, ROC with the right to use the Symbol of
Excellence lawfully. The 23rd Symbol of Excellence Winner for Fanless & Wide-range temperature Embedded System, the MOEA, Taiwan, ROC with the right to
use the Symbol of Excellence lawfully. The 23rd Symbol of Excellence Winner for Embedded Gambling System, the MOEA, Taiwan, ROC with the right to use the Symbol of
Excellence lawfully. The 23rd Symbol of Excellence Winner for High-performance smart embedded computer module, the MOEA, Taiwan, ROC with the right to
use the Symbol of Excellence lawfully. The 23rd Symbol of Excellence Winner for SoC wide-range temperature embedded applied computer modules, the MOEA, Taiwan, ROC
with the right to use the Symbol of Excellence lawfully. The 23rd Symbol of Excellence Winner for 4K2K four-display high-performance smart digital signage player, the MOEA, Taiwan, ROC with
the right to use the Symbol of Excellence lawfully. The 23rd Symbol of Excellence Winner for 21.5” Thin open-type frame LED backlit touch screen, the MOEA, Taiwan, ROC with the right to
use the Symbol of Excellence lawfully. The 23rd Symbol of Excellence Winner for Integrated on-board computer, the MOEA, Taiwan, ROC with the right to use the Symbol of
Excellence lawfully. The 23rd Symbol of Excellence Winner for high-performance broad application robust Tablet PC, the MOEA, Taiwan, ROC with the right to
use the Symbol of Excellence lawfully. The 23rd Symbol of Excellence Winner for multi-function data collection card series, the MOEA, Taiwan, ROC with the right to use the
Symbol of Excellence lawfully. The 23rd Symbol of Excellence Winner for robust Industrial Computers, the MOEA, Taiwan, ROC with the right to use the Symbol of
Excellence lawfully. The 23rd Symbol of Excellence Winner for 7” medical handheld tablet computer, the MOEA, Taiwan, ROC with the right to use the Symbol
of Excellence lawfully. The 23rd Symbol of Excellence Winner for on-board monitoring Embedded fanless smart system, the MOEA, Taiwan, ROC with the right to
use the Symbol of Excellence lawfully.
2014 Awarded with the “2014 Taiwan Top 10 Global Brands” Award. Advantech received the CSR Best Workplace Excellent Award from Global Views Monthly in 2014. The 22nd Symbol of Excellence Winner for High-performance network security equipment, the MOEA, Taiwan, ROC with the right to use
the Symbol of Excellence lawfully. The 22nd Symbol of Excellence Winner for ATCA 40GbE advanced communications motherboard, the MOEA, Taiwan, ROC with the right
to use the Symbol of Excellence lawfully. The 22nd Symbol of Excellence Winner for Advantech WebAccess-open network structure HMI / SCADA software, the MOEA, Taiwan,
ROC with the right to use the Symbol of Excellence lawfully. The 22nd Symbol of Excellence Winner for Programmable Automation Controllers, the MOEA, Taiwan, ROC with the right to use the
Symbol of Excellence lawfully. The 22nd Symbol of Excellence Winner for Superthin and bright industrial LCD panel, the MOEA, Taiwan, ROC with the right to use the
Symbol of Excellence lawfully. The 22nd Symbol of Excellence Winner for Industrial-grade multi-touch points man-machine interface, the MOEA, Taiwan, ROC with the
right to use the Symbol of Excellence lawfully. The 22nd Symbol of Excellence Winner for Industrial-grade wide-screen tablet displays, the MOEA, Taiwan, ROC with the right to use the
Symbol of Excellence lawfully. The 22nd Symbol of Excellence Winner for Smart remote Ethernet network data collection modules, the MOEA, Taiwan, ROC with the right
to use the Symbol of Excellence lawfully. The 22nd Symbol of Excellence Winner for PoE (Power over Ethernet) industrial Ethernet Switch, the MOEA, Taiwan, ROC with the right
to use the Symbol of Excellence lawfully. The 22nd Symbol of Excellence Winner for High-performance smart embedded computer modules, the MOEA, Taiwan, ROC with the right
to use the Symbol of Excellence lawfully.
79
The 22nd Symbol of Excellence Winner for lightweighted smart micro-fanless embedded systems, the MOEA, Taiwan, ROC with the right
to use the Symbol of Excellence lawfully. The 22nd Symbol of Excellence Winner for Low-power consumption simple smart connected device, the MOEA, Taiwan, ROC with the
right to use the Symbol of Excellence lawfully. The 22nd Symbol of Excellence Winner for Low-power consumption ultra-compact embedded computer modules, the MOEA, Taiwan, ROC
with the right to use the Symbol of Excellence lawfully. The 22nd Symbol of Excellence Winner for Low-power consumption miniature embedded computer modules, the MOEA, Taiwan, ROC
with the right to use the Symbol of Excellence lawfully. The 22nd Symbol of Excellence Winner for ATCA dual processor advanced communications motherboard, the MOEA, Taiwan, ROC with
the right to use the Symbol of Excellence lawfully. The 22nd Symbol of Excellence Winner for Mobile Industrial Computers, the MOEA, Taiwan, ROC with the right to use the Symbol of
Excellence lawfully.
2013 Awarded with the “2013 Taiwan Top 12 Global Brands” Award. Advantech Industrial Automation Group - Human Machine Interfaces (HMI) TPC and SPC series won Germany iF product design award in
2013. The 21st Symbol of Excellence Winner for High-performance network security equipment, the MOEA, Taiwan, ROC with the right to use
the Symbol of Excellence lawfully. The 21st Symbol of Excellence Winner for ATCA 40GbE advanced communications motherboard, the MOEA, Taiwan, ROC with the right
to use the Symbol of Excellence lawfully. The 21st Symbol of Excellence Winner for Industrial-grade wireless data collection module, the MOEA, Taiwan, ROC with the right to use
the Symbol of Excellence lawfully. The 21st Symbol of Excellence Winner for IEEE 802.11a / b / g / n Industrial Wireless Outdoor Mesh, the MOEA, Taiwan, ROC with the
right to use the Symbol of Excellence lawfully. The 21st Symbol of Excellence Winner for Low-power consumption ultra-compact embedded computer module, the MOEA, Taiwan, ROC
with the right to use the Symbol of Excellence lawfully. The 21st Symbol of Excellence Winner for Green low-power consumption smart industrial-grade server, the MOEA, Taiwan, ROC with the
right to use the Symbol of Excellence lawfully. The 21st Symbol of Excellence Winner for Innovative high elastic expansion single-board computer, the MOEA, Taiwan, ROC with the right
to use the Symbol of Excellence lawfully. The 21st Symbol of Excellence Winner for Smart wide-range temperature miniature motherboard MI/O Ultra Series, the MOEA, Taiwan,
ROC with the right to use the Symbol of Excellence lawfully. The 21st Symbol of Excellence Winner for Robust design, high elastic expansion single-board computer, the MOEA, Taiwan, ROC with the
right to use the Symbol of Excellence lawfully. The 21st Symbol of Excellence Winner for Super bright smart industrial-grade display panel, the MOEA, Taiwan, ROC with the right to use
the Symbol of Excellence lawfully. The 21st Symbol of Excellence Winner for Industrial-grade ultra-thin open-frame display, the MOEA, Taiwan, ROC with the right to use the
Symbol of Excellence lawfully. The 21st Symbol of Excellence Winner for Dual processors ATCA advanced communications server, the MOEA, Taiwan, ROC with the right
to use the Symbol of Excellence lawfully. The 21st Symbol of Excellence Winner for Smart miniature fanless embedded systems, the MOEA, Taiwan, ROC with the right to use the
Symbol of Excellence lawfully. The 21st Symbol of Excellence Winner for Open-style Easy handling digital electronic multimedia player, the MOEA, Taiwan, ROC with the
right to use the Symbol of Excellence lawfully. The 21st Symbol of Excellence Winner for High-Performance Multi-Display Digital Electronic Multimedia Player, the MOEA, Taiwan,
ROC with the right to use the Symbol of Excellence lawfully. The 21st Symbol of Excellence Winner for Streamline energy-saving digital signage, the MOEA, Taiwan, ROC with the right to use the
Symbol of Excellence lawfully. The 21st Symbol of Excellence Winner for Energy data centralized computation, the MOEA, Taiwan, ROC with the right to use the Symbol
of Excellence lawfully.
2012 Awarded with the 11th place of the “2012 Corporate Citizen Award” by Commonwealth Magazine. Awarded with the “2012 Taiwan Top 11 Global Brands” Award. The 20th Symbol of Excellence Winner for TREK-753 full-featured integrated on-board computer, the MOEA, Taiwan, ROC with the right
to use the Symbol of Excellence lawfully. The 20th Symbol of Excellence Winner for Industrial tablet touch panel display, the MOEA, Taiwan, ROC with the right to use the Symbol
of Excellence lawfully. The 20th Symbol of Excellence Winner for Cascaded-type real-time Ethernet remote data collection module, the MOEA, Taiwan, ROC with
the right to use the Symbol of Excellence lawfully. The 20th Symbol of Excellence Winner for Low-power consumption ultra-compact embedded computer modules, the MOEA, Taiwan, ROC
with the right to use the Symbol of Excellence lawfully. The 20th Symbol of Excellence Winner for Innovative interface single-board computers MI/O Extension, the MOEA, Taiwan, ROC with the
right to use the Symbol of Excellence lawfully. The 20th Symbol of Excellence Winner for Smart miniature motherboard MI/OUltra Series, the MOEA, Taiwan, ROC with the right to use
the Symbol of Excellence lawfully.
80
The 20th Symbol of Excellence Winner for High seismic wide-range temperature PCI-104 CPU board, the MOEA, Taiwan, ROC with the right
to use the Symbol of Excellence lawfully. The 20th Symbol of Excellence Winner for Green energy-saving industrial-grade motherboard, the MOEA, Taiwan, ROC with the right to use
the Symbol of Excellence lawfully. The 20th Symbol of Excellence Winner for Electricity market exclusive fanless embedded industrial computer, the MOEA, Taiwan, ROC with
the right to use the Symbol of Excellence lawfully. The 20th Symbol of Excellence Winner for Industrial-grade flat touch panel LED display, the MOEA, Taiwan, ROC with the right to use the
Symbol of Excellence lawfully. The 20th Symbol of Excellence Winner for Open-style Easy handling digital multimedia player, the MOEA, Taiwan, ROC with the right to use
the Symbol of Excellence lawfully. The 20th Symbol of Excellence Winner for Low-power consumption high display digital multimedia player, the MOEA, Taiwan, ROC with the
right to use the Symbol of Excellence lawfully. The 20th Symbol of Excellence Winner for Expandable blade-type 5-slot Industrial PC, the MOEA, Taiwan, ROC with the right to use the
Symbol of Excellence lawfully.
2011 Awarded with the “2011Taiwan Top 10 Global Brands” Award. The 19th Symbol of Excellence Winner for ARK-VH200 fanless on-board DVR embedded systems, the MOEA, Taiwan, ROC with the right to
use the Symbol of Excellence lawfully. The 19th Symbol of Excellence Winner for FWA-6500 network applied platform, the MOEA, Taiwan, ROC with the right to use the Symbol of
Excellence lawfully. The 19th Symbol of Excellence Winner for NCP-5260, the MOEA, Taiwan, ROC with the right to use the Symbol of Excellence lawfully. The 19th Symbol of Excellence Winner for PC/104, the MOEA, Taiwan, ROC with the right to use the Symbol of Excellence lawfully. The 19th Symbol of Excellence Winner for PCM 9562, the MOEA, Taiwan, ROC with the right to use the Symbol of Excellence lawfully. The 19th Symbol of Excellence Winner for PEC-3240 fanless industrial-grade embedded motion controller, the MOEA, Taiwan, ROC with the
right to use the Symbol of Excellence lawfully. The 19th Symbol of Excellence Winner for PIT-1501W healthcare and infotainment entertainment systems, the MOEA, Taiwan, ROC with the
right to use the Symbol of Excellence lawfully. The 19th Symbol of Excellence Winner for SOM-5788 Intelligent smart embedded computer modules, the MOEA, Taiwan, ROC with the right
to use the Symbol of Excellence lawfully. The 19th Symbol of Excellence Winner for Low-power consumption and wide-range temperature industrial touch control PC, the MOEA,
Taiwan, ROC with the right to use the Symbol of Excellence lawfully. The 19th Symbol of Excellence Winner for TREK-550, the MOEA, Taiwan, ROC with the right to use the Symbol of Excellence lawfully.
2010 Awarded with the “2010 Taiwan Top 12 Global Brands” Award. Awarded by Chinagkong with the “Decade Industrial Contribution” and “Decade Leading Industry.” The 18th Symbol of Excellence Winner for IPPC- 8151S, the MOEA, Taiwan, ROC with the right to use the Symbol of Excellence lawfully. The 18th Symbol of Excellence Winner for APAX- 5000 series, the MOEA, Taiwan, ROC with the right to use the Symbol of Excellence
lawfully. The 18th Symbol of Excellence Winner for Uno- 1100 series, the MOEA, Taiwan, ROC with the right to use the Symbol of Excellence
lawfully. The 18th Symbol of Excellence Winner for UTC-W101E, the MOEA, Taiwan, ROC with the right to use the Symbol of Excellence lawfully. The 18th Symbol of Excellence Winner for NCP-7560, the MOEA, Taiwan, ROC with the right to use the Symbol of Excellence lawfully. The 18th Symbol of Excellence Winner for MIC-5322, the MOEA, Taiwan, ROC with the right to use the Symbol of Excellence lawfully.
2009 The 17th Symbol of Excellence Winner for IPPC 7517, the MOEA, Taiwan, ROC with the right to use the Symbol of Excellence lawfully. The 17th Symbol of Excellence Winner for EKI 5000 series, the MOEA, Taiwan, ROC with the right to use the Symbol of Excellence lawfully. Awarded with the “Electron d'Or Award for Industrial and Network Computing Architecture (INCA)” Awarded with the “2009 Taiwan Top 12 Global Brands” Award. Awarded with the “2009 China Outstanding Innovation Enterprise” award by CIO IT Magazine.
2008 Advantech received the 4th prize of the 2nd “Corporate Social Responsibility Award” from Commonwealth Magazine, Taiwan, ROC The 16th Symbol of Excellence Winner for UbiQ 350, the MOEA, Taiwan, ROC with the right to use the Symbol of Excellence lawfully. The 16th Symbol of Excellence Winner for VITA 350, the MOEA, Taiwan, ROC with the right to use the Symbol of Excellence lawfully. The 16th Symbol of Excellence Winner for UNO-2182, the MOEA, Taiwan, ROC with the right to use the Symbol of Excellence lawfully. The 16th Symbol of Excellence Winner for TPC-30T/TPC-32T, the MOEA, Taiwan, ROC with the right to use the Symbol of Excellence
lawfully. The 16th Symbol of Excellence Winner for IPPC-7157A/IPPC-7158B, the MOEA, Taiwan, ROC with the right to use the Symbol of
Excellence lawfully.
2007 Advantech received the 3rd “Corporate Social Responsibility Award, Top Honor” in 2006 from Global Views Magazine, Taiwan, ROC Advantech received the 1st “Corporate Social Responsibility Award from Commonwealth Magazine, Taiwan, ROC ARK-3381 received Computex Taipei Best Choice Award. The 15th Symbol of Excellence Winner for UibQ-230, the MOEA, Taiwan, ROC with the right to use the Symbol of Excellence lawfully. The 15th Symbol of Excellence Winner for ARK-4170, the MOEA, Taiwan, ROC with the right to use the Symbol of Excellence lawfully. The 15th Symbol of Excellence Winner for ADAM-5550KW, the MOEA, Taiwan, ROC with the right to use the Symbol of Excellence
lawfully.
2006 Advantech received the 2nd “2006 Corporate Social Responsibility Award” from Global Views Magazine, Taiwan, ROC Received the Supplier of the Year for the Embedded Single-Board Computer from “Control Design” Magazine Advantech awarded by Intel with the “Intel Associate Partner of the Year” and “Multi-Core Solution Contest Award.” Advantech received Microsoft’s “The Most Growth Award in Asia Award.”
2005 Awarded with the 13th MOEA “Industrial Technology Advancement Award of Excellence.” Gold Award Embedded Control Europe (ECE) magazine readers awarded TREK-755 Sunlight Readable Model with Gold Award

81
2004 Awarded with the “2004Taiwan Top 10 Global Brands” Award by the Bureau of Foreign Trade, MOEA. The 10th Symbol of Excellence Winner for Small-size industrial-grade touch controlled computer TPC-60S, the MOEA, Taiwan, ROC with the
right to use the Symbol of Excellence lawfully. The 10th Symbol of Excellence Winner for Industrial-grade front-wired fanless computer UNO-3062, the MOEA, Taiwan, ROC with the right
to use the Symbol of Excellence lawfully. The 10th Symbol of Excellence Winner for Industrial computer work station AWS-8100G, the MOEA, Taiwan, ROC with the right to use the
Symbol of Excellence lawfully. Won the Control Design Reader’s Choice Award for “Single Board PC” First Prize. FPM-3170 17” Flat Panel Monitor received the “2004 Editor’s Choice Award” HMI First Prize from Control Engineering Magazine (USA).
2002 Accepted as the one and only Gold-Level Partner in Microsoft’s Windows Embedded Partner ODM Category. The 10th Symbol of Excellence Winner for Smart home network terminal EH-7102G / GH, the MOEA, Taiwan, ROC with the right to use the
Symbol of Excellence lawfully. The 10th Symbol of Excellence Winner for 586-grade Internet accessible equipment remote monitoring system WebLink2059-BAR / CE / SDA
/ SKT, the MOEA, Taiwan, ROC with the right to use the Symbol of Excellence lawfully.
2001 Completed the “MOEA Industry Technology Development Industrial Plan (ITDP)” of the Technology Division MOEA Multimedia network telephone ES-510 received the 9th Silver National Award of Excellence, the MOEA, Taiwan, ROC Full-function LCD touch computer PPC-153T received the 9th Silver National Award of Excellence, the MOEA, Taiwan, ROC The 9th Symbol of Excellence Winner for Multimedia network telephone ES-510, the MOEA, Taiwan, ROC. The 9th Symbol of Excellence Winner for Full-function LCD touch computer PPC-153T, the MOEA, Taiwan, ROC with the right to use the
Symbol of Excellence lawfully. The 9th Symbol of Excellence Winner for Family Vestibule Internet terminal EH-760, the MOEA, Taiwan, ROC with the right to use the
Symbol of Excellence lawfully. The 9th Symbol of Excellence Winner for multifunction firewall WEB-2143, the MOEA, Taiwan, ROC with the right to use the Symbol of
Excellence lawfully.
2000 Full-function LCD touch-type computer PPC-153T awarded with the “Best Innovative Product Award” by KIOSK Magazine (USA). IPC-601 awarded with the “Most Valuable Product” Award at the Telecom Network Exhibition. MIC-3032 awarded with the “Most Valuable Product” at the telephone computer voice integration exhibition. 2A-100 awarded with the “Most valuable Telecom Network Telecom Product” by the US telecom network magazine
1999 ADAM Series received the 1st Outstanding Safety Instrument Award of Taiwan ADAM Series received the 1st Outstanding Safety Instrument Award of Taiwan. The 7th Symbol of Excellence Winner for card-type computer CPC-2245, Taiwan, ROC with the right to use the Symbol of Excellence
lawfully. The 7th Symbol of Excellence Winner for Touch control server PPC-A100T-R50, Taiwan, ROC with the right to use the Symbol of Excellence
lawfully.
1998 Awarded with the Most Representative Outstanding Company by Industrial Development Bureau, MOEA, Taiwan, ROC PPC-102T Panel Computer received the 6th Gold National Award of Excellence, Taiwan, ROC The 6th Symbol of Excellence Winner for PC-based remote monitoring system ADAM-5000 series, Taiwan, ROC with the right to use the
Symbol of Excellence lawfully. The 6th Symbol of Excellence Winner for PPC-102T Panel Computer, Taiwan, ROC with the right to use the Symbol of Excellence lawfully. The 6th Symbol of Excellence Winner for Multi-function LCD panel computers PPC-140T, Taiwan, ROC with the right to use the Symbol of
Excellence lawfully. PPC-140T Multi-Function Panel PC received the Comdex Asia 98 “Best Hardware System Award.” Multi-function LCD panel computers PPC-140T awarded with the “KIOSK Best Solution Product” by CRN Magazine (USA). IPC-6908 awarded with the “Most Valuable Product of the Year” by CTI Magazine (USA) Advantech received the 4th place of the “Most Worthy of Investment Companies” Award from Commonwealth Magazine, Taiwan, ROC Advantech received the 6th place of “The Best Performing Companies” Award from Commonwealth Magazine, Taiwan, ROC
1997 Received ISO-14001 Environmental Management System Certification. Awarded with the 5th Award for Industrial Technology Advancement Most Outstanding Award, the MOEA, Taiwan, ROC IPC-622 awarded with the “Most Valuable Product of the Year” Award by the US Computer Telephony Magazine.
1996 Awarded with the 4th Award for Industrial Technology Advancement and Outstanding Award, the MOEA, Taiwan, ROC The 4th Symbol of Excellence Winner for ADAM-4000 Series, the MOEA, Taiwan, ROC with the right to use the Symbol of Excellence
lawfully.
1995 The in-house developed industrial control software -GENIE awarded with the “Outstanding Information
Application Award.”
1993 Awarded with the 2nd National Award of Small & Medium Enterprise by National Association of Small & Medium Enterprise Received ISO-9001 Quality Management System Certification.
1992 Awarded with the “Outstanding Export & Import Performance Award” by General Chamber of Commerce of New Taipei City ROC Blue Chip Corporate Training Unit “Gold Merchant Award”
1991 Awarded with the “Outstanding Export & Import Performance Award” by General Chamber of Commerce of New
Taipei City
1990 Awarded with the “Outstanding Export & Import Performance Award” by General Chamber of Commerce of New
Taipei City
1989 Awarded with the “Innovative Product Award” at the 3rd Instrument Exhibition, Taipei City, ROC

82
(II) Main Applications of major products and their manufacturing processes 1. Main applications of major products:
(1) Embedded Computing Including Embedded Computing Module, Industrial Motherboards, Industrial Display Systems, Fanless Embedded Box PCs, and Embedded Single Board Computers. The main function is based on PC core control module, providing high performance, small size, all-in-one device, applied in industrial automatic control environment, with high temperature, humidity, vibration resistance abilities.
(2) Industry Application Computer Advantech pioneered the all-in-one integrated computer in 1997, combined with LCD display, computer and keyboard. With market evolution and development, Advantech continuously developed industry application computers across the vertical sectors application niche market. Such as Industrial Portable Terminals used in intelligent logistics and retailing, Industrial Handheld Computers, Integrated Tablets, POS System, and Self-Service Touch Computer. For digital medical field, Advantech launched AMiS Computerized Nursing Cart, Medical Information Terminals, Interactive Digital Signage, and Mobile Clinical Assistant…etc. Other industrial solutions such as Industrial Transportations, and eHome Application Platform are also applied.
(3) Industrial Communication and Automation Controllers Including Network Computing Platform, WebAccess+ Solutions, Automation Controllers & I/Os, Machine Automation, Remote Data Acquisition, and Power & Energy Management, are mainly applied in remote measurement and control, and field data acquisition and control.
(4) Industry Application Computing Platform and Intelligent System Apart from existing hardware product, Advantech are committed to providing intelligent solutions for each field. Including Handheld Computing Device, Industrial Servers & Storage, Advanced Video Solutions, Intelligent RFID Platform, Intelligent Transportation Systems, and Modular IPC…etc., are applied in each field of data computing, acquisition and control solutions.
2.The production process of main products:
Advantech Process Control Chart
83
(1) Board Level Production Flow After warehouse receiving material from vendors, well-trained IQC personal will sampling
inspect the incoming material, only accepted material will be stored and follow FIFO mechanism for preparing materials for work order request. Advantech adopted RoHS standard to perform lead-free solder printing for SMT process, followed by 100% AOI plus visual inspection for double check and manual insertion for DIP process. Through long time high temperature burn-in to filter out the early defect parts and followed by full function test to ensure the product quality is accord with industrial standard. After packing, FQC inspection will be performed before shipping worldwide.
(2) System Level Production Flow
Similar to board product, only accepted material will be stored and follow FIFO mechanism for preparing materials for work order request. The well-trained operators will follow SOP to assembly the system product and perform full function test to ensure the assembly quality. Long time high temperature burn-in test is adopted to simulate the user working environment, followed by the full function test and customized settings. The Production Shop Floor Information System will monitor each unit should pass all the rigid tests above, before move to packing process. FQC inspection will be performed before shipping worldwide.

84
(II
I) T
he S
uppl
y of
Maj
or M
ater
ials
R
aw m
ater
ial
Supp
lier
Inte
grat
ed c
ircui
t <in
clud
ing
chip
> SE
RTEK、
WPI、
WTM
EC、
Wei
keng
LC
D
PRO
MAT
E、SE
RTEK
To
uch
scre
en se
nsor
<G
lass
> SA
LT
PCB
IR
CUIT
ECH、
ALLI
ED、
APCB
、HI
PER、
Cany
on
Not
e: T
he r
aw m
ater
ial s
uppl
iers
ref
erre
d to
abo
ve a
re r
eput
able
dom
estic
and
for
eign
man
ufac
ture
rs a
nd h
ave
been
doi
ng b
usin
ess
with
the
Com
pany
for
yea
rs w
ith a
sta
ble
coop
erat
ive
rela
tions
hip
held
. (
IV) T
he n
ame,
pur
chas
e (s
ale)
am
ount
, and
ratio
of t
he su
pplie
rs (c
usto
mer
s) a
ccou
nted
for o
ver 1
0% o
f the
tota
l pur
chas
e (s
ale)
in o
ne o
f the
last
two
year
s, an
d th
e re
ason
for t
he c
hang
es in
pur
chas
e (s
ales
): 1.
Li
st o
f M
ajor
Sup
plie
rs w
ith o
ver
10%
of
the
tota
l pu
rcha
se i
n on
e of
the
las
t tw
o ye
ars:
U
nit:
NT$
Tho
usan
d
2014
20
15
As o
f 201
6Q1
Item
N
ame
Am
ount
Perc
enta
ge o
f the
ann
ual
net p
urch
ase
(%)
Rel
atio
nshi
p w
ith th
e is
suer
N
ame
Am
ount
Pe
rcen
tage
of
the
annu
al n
et
purc
hase
(%)
Rel
atio
nshi
p w
ith th
e is
suer
N
ame
A
mou
nt
Perc
enta
ge o
f the
la
st q
uarte
r of t
he
year
(%)
Rel
atio
nshi
p w
ith th
e is
suer
1 SE
RTEK
IN
C.
2,16
1,85
5 11
.82
Non
e SE
RTEK
IN
C.
3,29
3,52
916
.82
Non
e SE
RTEK
IN
C.
1,140,508
22.6
1N
one
2 O
ther
s 16
,122
,993
88
.18
O
ther
s 16
,286
,637
83.1
8
Oth
ers
3,903,793
77.3
9
3 To
tal
18
,284
,848
10
0
Tota
l
19,5
80,1
6610
0
Tota
l
5,044,301
100
2. L
ist o
f Maj
or C
usto
mer
s with
ove
r 10%
of t
he to
tal s
ales
in o
ne o
f the
last
two
year
s:
U
nit:
NT$
Tho
usan
d
2014
20
15
As o
f 201
6Q1
Item
N
ame
A
mou
ntPe
rcen
tage
of t
he a
nnua
l ne
t pur
chas
e (%
) R
elat
ions
hip
with
the
issu
er
Nam
e
Am
ount
Pe
rcen
tage
of
the
annu
al n
et
purc
hase
(%)
Rel
atio
nshi
p w
ith th
e is
suer
N
ame
A
mou
nt
〔%〕
Perc
enta
ge o
f th
e la
st q
uarte
r of t
he
year
(%)
Rel
atio
nshi
p w
ith th
e is
suer
1 O
ther
s
(Not
e)
35,7
31,6
99
100.
00N
one
Oth
ers (
Not
e)38
,000
,582
100.
00
Non
e O
ther
s (N
ote)
10,0
73,4
0010
0.00
Non
e
N
et sa
les
amou
nt
35,7
31,6
99
100.
00
Net
sale
s am
ount
38
,000
,582
100.
00
Net
sale
s am
ount
10
,073
,400
100.
00
Not
e: N
o si
ngle
cus
tom
er a
ccou
nted
for m
ore
than
10%
of t
otal
sale
s am
ount
.

85
(V) Production, Volume, and Value of the last two years
Unit: Unit/PC; NT$ Thousand
Year
Production
Capacity
Main Products
2014 2015
Production
capacity
Production
quantity
Production
Value
Production
capacity
Production
quantity
Production
Value
Industrial control 924,026 885,232 2,830,799 930,070 812,785 2,701,224
Industrial computer 417,358 408,191 5,479,154 451,019 457,726 5,419,905
Embedded board and case 1,441,724 1,576,130 6,277,733 1,708 ,302 1,690,385 7,010,720
Industrial applied computer 83,021 78,006 1,141,286 138,581 127,539 1,475,105
After-sale service and others 185,314 174,595 623,930 146,290 136,563 322,770
Total 3,051,443 3,122,154 16,352,902 3,374,262 3,224,998 16,929,724
(VI) Sales Volume and Value of the last two years
Unit: Unit/PC; NT$ Thousand Year
Sales quantity and amount
Main Products
2014 2015
Domestic Sales Export Sales Domestic sales Export Sales
Vo l u m e V a l u e Vo l u m e V a l u e Vo l u m e V a l u e Vo l u m e V a l u e
Industrial control 77,966 462,035 656,987 4,861,584 83,596 520,203 632,206 4,924,868
Industrial computer 39,808 348,070 426,428 8,575,885 26,551 385,986 384,214 7,763,226
Embedded board and case 282,198 1,661,341 1,992,862 13,331,174 227,607 1,548,486 1,341,128 13,739,879
Industrial applied computer 2,058 49,126 161,276 2,295,772 19,294 219,100 242,378 4,355,954
After-sale service and others 28,816 704,846 133,615 3,441,866 21,947 720,047 125,634 3,822,833
Total 430,846 3,225,418 3,371,168 32,506,281 378,995 3,393,822 2,725,560 34,606,760
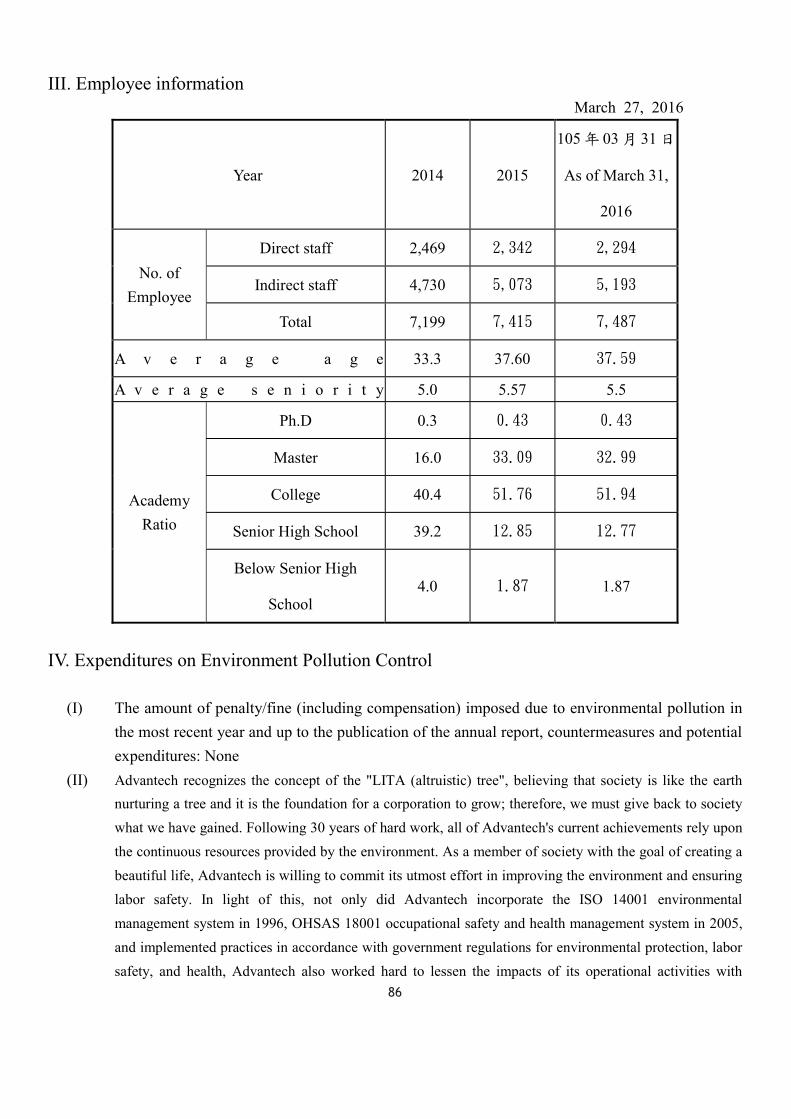
86
III. Employee information March 27, 2016
Year 2014 2015
105 年 03 月 31 日
As of March 31,
2016
No. of Employee
Direct staff 2,469 2,342 2,294
Indirect staff 4,730 5,073 5,193
Total 7,199 7,415 7,487
A v e r a g e a g e 33.3 37.60 37.59
A v e r a g e s e n i o r i t y 5.0 5.57 5.5
Academy Ratio
Ph.D 0.3 0.43 0.43
Master 16.0 33.09 32.99
College 40.4 51.76 51.94
Senior High School 39.2 12.85 12.77
Below Senior High
School 4.0 1.87 1.87
IV. Expenditures on Environment Pollution Control
(I) The amount of penalty/fine (including compensation) imposed due to environmental pollution in the most recent year and up to the publication of the annual report, countermeasures and potential expenditures: None
(II) Advantech recognizes the concept of the "LITA (altruistic) tree", believing that society is like the earth nurturing a tree and it is the foundation for a corporation to grow; therefore, we must give back to society what we have gained. Following 30 years of hard work, all of Advantech's current achievements rely upon the continuous resources provided by the environment. As a member of society with the goal of creating a beautiful life, Advantech is willing to commit its utmost effort in improving the environment and ensuring labor safety. In light of this, not only did Advantech incorporate the ISO 14001 environmental management system in 1996, OHSAS 18001 occupational safety and health management system in 2005, and implemented practices in accordance with government regulations for environmental protection, labor safety, and health, Advantech also worked hard to lessen the impacts of its operational activities with

87
respect to GHG management, product design and use, and waste disposal to improve the safety and health of the environment. It is through these efforts, in conjunction with employee participation and commitment, Advantech has achieved the goal of environmental protection and corporate sustainable development.
Eco-friendly product design
Advantech believes in protecting the environment by preventing pollution, using less energy and raw materials, reducing the generation of waste, and using clean production technologies; it focuses on modifying the production process to reduce pollution rather than using end-of-pipe treatments to resolve pollution problems. When promoting waste reduction, the Company recycles waste packaging materials for reuse. In addition, when designing products and selecting production technologies, we try to minimize the use of raw materials and energy. Through energy conservation designs, the goal of cyclic use can be achieved. Advantech adopts the ISO 14000 environmental management system to facilitate pollution prevention and life cycle assessment, thereby enabling the Company to raise its environmental performance while increasing its profitability.
In recent years, climate change, environmentally hazardous substances in products, labor safety and health, and human rights have become key CSR issues. Advantech has also incorporated these issues into the focus of green supply chain management (Please refer to section 3.3 for details). For example, regarding the management of environment-related substances, Advantech has amended its internal management standards according to various environmental protection policies .
In addition to the aforementioned green design regulations, the Company requires all product designs and development to be verified for safety, thereby ensuring their compliance with CE/ FCC/CCC safety requirements. Advantech follows international environmental protection laws and regulations; from natural resource use, hazardous substance restrictions, to the life cycle assessment (LCA) with respect to waste management. All of these procedures conform 100% to international declarations for green products. The Company's products are promoted as green products based on three dimensions: safety, energy-saving, and environmental protection.
Environmental protection management To sustain human lives and Earth's green environment, Advantech has endeavored to lessen the impacts
of product design and application, as well as waste disposal for the overall safety and health of the environment. In addition to complying with relevant regulations, the Company has mobilized all of its employees to participate in the protection of the environment and achieve corporate sustainable development.
Water resource usage and management The amount of precipitation in Taiwan during the dry and wet seasons are significantly different. Storing water
resource is a challenging task. When bad weather occurs, various industries may face severe water shortage. Advantech has attempted measures such as using water-saving faucets and toilets in order to reduce the average water consumption per capita. Advantech's plants are located in developed industrial zones or parks in urban areas. All of
88
these plants use tap water as their water supply 100% of the time; they are not involved in extracting underground or well water and their water consumption activities exert no negative influence on the surrounding water resources. • Monitoring and management of cooling water tower • Monitoring and management of cooling water towers' conductivity
• Installation of water-saving faucets
• Smart irrigation water-saving system
• Monitoring and management of cooling water and chiller systems with smart air-conditioning systems
Waste management and resource recycling Having zero waste is Advantech's ultimate goal in waste management. More specifically, by reducing the amount
of total waste produced, recycling waste into resources, and implementing source management measures (e.g., reduce raw material use), Advantech attempts to output less waste, replace the end-of-pipe treatment model with the recycling-and-reuse model, convert trash into useful resources, realize resource recycling, and reduce the energy and costs consumed during waste treatment.
Regarding the use of raw materials, the use of electronic materials accounts for approximately 90% of the total usage, whereas the remaining 10% includes mechanical, packaging, plastics, and other non-metal mechanical materials. metric tons which can be divided into four major categories: PCB wastes, tin slag, chemical waste, and others. In the future, Advantech will continue to increase its process yield, reduce the output of electronic waste and tailings, and achieve efficient industrial waste reduction.
Greenhouse gas management By promoting a series of activities related to "energy conservation, carbon reduction, and loving our planet,"
Advantech strengthens its employees' awareness on conserving energy. Concurrently, the Environmental Safety and Health Committee is established to construct Advantech's conceptual framework that promotes environmental safety and health, advocates energy conservation, and helps increase energy efficiency. Moreover, the Company includes energy cost reduction as one of its crucial auditing items.
Since 2009, Advantech has cooperated in the Carbon Disclosure Project (CDP), which is currently the world's largest database related to global climate change. Each year, questionnaires are distributed to determine how businesses are responding to climate change and reducing their GHG emissions. The survey results are then used to evaluate the potential business risks and opportunities caused by climate change. Through annual CDP information disclosure, Advantech carefully reviews climate-related issues such as climate regulations and hazards caused by climate change. To mitigate potential risks in business management, the Company adopts effective reduction and elimination measures and thereby adheres to the GHG management requirements requested by international clients.
Advantech Taiwan includes our Neihu headquarters, as well as factories in Donghu and Xindian. The Linkou Smart Technology Park officially started its operation in 2014; its construction divided into three phases, and the total area spans 34,470 m2. Currently, the completed first-phase covers an area of 9,983 m2, and its main buildings include an R&D center, production center, and offices. In the future, the second and third phases will contain more office space, a production center, and a living area, which will be integrated with the original Linkou Plant to form Advantech’s second headquarters where R&D, production, warehousing, and product distribution will take place. Advantech has developed the Linkou Park into an innovative experimental site for smart-buildings, where two major
89
smart-building solutions, smart-building energy management, and smart contextual space management are implemented. By cooperating with partners from the smart-building industry, Advantech has established a close-knit smart-building collaboration system, where consulting teams are available to provide sales services. For our partners from the building industry, Linkou Park is an experimental site where collaborative R&D can be performed. To clients, Linkou Park is a place where they can experience smart building solutions. When customers walk into Advantech’s Linkou Park, they can experience various smart building solutions developed by the collaboration system, including the smart central control room, smart parking, smart reception, and smart conference rooms. Several smart sites have already been developed inside Linkou Park, all of which have incorporated the concept of smart energy conservation. Furthermore, Linkou Park continuously engages in innovative development to increase the smart-capabilities of the smart green buildings. Relevant designs are described as follows:
I. Smart parking: Smart parking is a smart service system that combines various functions such as reserving a parking space, identifying license plates, eTag, welcoming guest messages, guiding a vehicle to its parking space, parking area control and management, and finding a vehicle. The smart parking system is equipped with an automated system that uses lights to guide vehicles forward, as well as an air conditioner system for air quality control to provide excellent smart parking services and parking environment, as well as conserve energy.
II. Smart reception: When visitors arrive, the big monitor in the lobby will display a welcome message. As soon as visitors touch the automated visitor registration system, relevant personnel are notified of their arrival via mobile phone messages. Visitors are then issued with an electronic identification card that enables them to interact with the multimedia facilities within the building. With interactive multimedia signboards featuring centralized control management and regional connectivity, park-related information, weather, and traffic data can be viewed. Thus, businesses with branches in other regions can easily announce their management information. Furthermore, through an interactive e-Catalog system, visitors can browse product catalogs and advertisement videos, use their emails online and share information with others; they can also read QR codes with their mobile phones. At night, these signboards automatically enter sleep mode and automatically turns on the next day, thereby achieving the effects of energy conservation.
III. Smart conference room: The multimedia signboard in the lobby displays the booking information for the conference room. Similarly, at the entrance of the conference room, a signboard is also installed to display meeting information. Users will be given the rights to use each conference facility, and they can automatically switch the situational configurations within the conference room with a single touch of a button depending on their needs. Concurrently, air quality sensors and automatic regulating fans are also installed to enhance the indoor air quality. If no one is detected to be present in the room for 15 minutes, the system automatically issues a command to switch off all power and the air-conditioning system in the room to conserve energy.
IV. Smart office:In addition to the air conditioning system automatically detecting and regulating the air quality, the people sensing energy conservation system will also divide the office area into several regions and generate a schedule based on work hours and lunch breaks. During off hours, smart office connects with the access control system and the entry card reader automatically activates the lights in the room. Furthermore,

90
the system can be operated via a webpage and a touch screen panel. Based on the behavioral characteristics of users, lights and air conditioners in that area switch off automatically when the room is empty.
In addition to introducing smart solutions for reducing energy consumption, Advantech is also constantly involved with the promotion of energy. • The Linkou Smart Technology Park contains building energy management and people sensing energy conservation, with the latter aimed at making the buildings smarter including smart air-conditioning and parking, as well as all-in-one access cards. After following the steps for comprehensive detection, reliable transmission, and smart processing, combined with cloud systems to facilitate convenient living, smart buildings are realized; through the use of smart management, achieve effective energy conservation and prevent wasting resources. • Smart power management is handled by a single button operation to control the lightings and projectors in the conference room; different settings such as presentation mode or discussion mode are also provided. This prevents the unnecessary waste of resources when employees forget to switch off other power supplies. • Replacing high-performance lighting equipment; currently, the Linkou Smart Technology Park and the
Sunshine Building both use energy-saving light bulbs, whereas Xindian and Donghu plants are still in the
process of replacing their energy-consuming lights. New Advantech buildings all use energy-saving bulbs.
• Use video conferencing instead of on-site meetings whenever possible
• Prioritize the purchase of green-label office equipment and information electronic products
• Maintain the indoor temperature at 25°C
• Encourage employees to develop the habit of switching off the lights as soon as they leave a room
Advantech and caring for nature Environmental protection is a crucial topic for mankind; therefore, Advantech not only values its relationships
with local communities, but also actively assumes its environmental protection responsibilities in creating a sustainable green industry.
Advantech will transform Linkou into smart parks and IoT demonstration centers, cooperate with its partners in the innovation and execution of IoT solutions, reform both Linkou into smart building demonstrations and indicators, promote smart energy saving and carbon reduction concepts, alter conventional thinking through actual experiences, and promote the implementation of smart cities.
More specifically, Linkou Park followed the optimal energy saving design formulated based on user needs. The design enhances the comfort level for employees inside the building as well as their working efficiency. While lowering the amount of unnecessary energy consumption, it also improved the quality of the overall work environment. The Park's energy management system is optimized continuously with the hope that the Park will become a benchmark for Taiwan's green enterprises.
Organic Farm Encourage all Advantech employees to step outside, accept the baptism and the nurturing of mother nature,
participate in various sustainable conservation activities organized by Advantech to allow them to get closer to nature without damaging its ecological systems, and adopt the organic farms with their families. Through each seeding and

91
harvesting, Advantech employees could truly appreciate and understand mother nature; enjoy the beauty of this planet as well as the joys of a rich harvest.
"Organic & natural, eco-friendly and earth loving" have always been our goals, and being close to and feeling nature's vitality are the energy source for Advantech employees. In 2009, Director KC Liu happened to come across an organic farm in Yilan County, where he had first-hand experience with natural, chemical-free agriculture; he was inspired by the idea of providing all employees with an opportunity to get close to nature and enjoy organic fruits and vegetables, this idea planted the seeds for Advantech's organic farms.
After careful investigation and planning, the "Advantech Organic Farm - Work Holiday" was launched in 2010 in Shenkeng. Each month, Advantech employees can participate in an ecological trip at the organic farm. In order to allow more Advantech employees with the chance to enjoy organic farming experience, Advantech's organic farm plots have been open for employee adoption since 2011. In addition to providing organic fertilizer, seeds, and seedlings for the eager gardeners, we also provided organic produce and environmentally friendly daily living necessities as special awards for those employees who take a serious interest in organic horticulture. The annual organic farm adoption events and harvesting activities are the happiest times experienced by Advantech employees and their families.
The aim of Advantech Taiwan's organic farms is to provide employees, their families, and other individuals with the opportunity to experience organic farming and a healthy diet. The farms also allow employees to take better care of themselves, their families, and our planet; helping to achieve sustainable agriculture. "Come admiringly, come willingly, come frequently, come together" is the motto of Advantech's organic farms, in the hope that employees can feel the vitality of nature and experience an inner green happiness.
V. Labor-Employer Relation (I) The Company’s employee welfare measures, education, training, retirement system and its
implementation, as well as the agreement between the employers and the employees, and the implementation of the employee’s rights protection: 1.Employee welfare measures: Uphold the “Perfectionism” business philosophy. The Company values the employee benefits policy. A dedicated unit (Human Resources Department) is setup within the organization to plan a series of welfare measures in order to provide the staff with a stable lifestyle, to protect the interests of employees, and thus promote employer-employee harmony. The Company believes that the employee will be able devote to work wholeheartedly and exercise their job strengths to create high quality products and promote the progress and prosperity of the whole enterprise only when their welfares and life security are protected.
(1) The welfare measures directly handled by the Company: A、Employee bonus; B、Labor insurance; C、National health insurance D、Group insurance

92
E、Annual health check F、Marriage, funeral, joy, celebration grants G、Dragon Boat Festival and Mid-Autumn Festival gifts H、Yearend banquet dinner I、Domestic tour J、Overseas tour K、Magazine subscriptions subsidies L、Community ac M、Birthday celebration N、Departmental function fund O、Movies P、Arts and cultural appreciation Q、Emergency rescue gold
2. Education, training system, and its implementation With a view to cultivating talents and expanding the horizons, Advantech College has designed a series of talent cultivation programs: starting from On-Job Training, the trainee will be assigned with a work-related task, hoping to develop his/her expertise honed through the task, and with Ten Main Core Curricula, Case Study, Reading Club, E-Learning and LEAP Camp, TCAP, and Champion Program, Advantech College provides a global growth platform targeting on learning, creating an environment for continuous learning and development so as to accelerate growth and improvement for all Advantech talents. Each talent cultivation program is outlined as follows:
Advantech 10-Core Program Advantech's executives have elaborated the most basic knowledge and skills of Advantech and compiled the Advantech Ten Main Core Curricula, the five categories of which include quality commitment, marketing and sales, talent asset, research and development, and finance and value creation, so as to impart Advantech’s systems and regulations. Through the Ten Main Core Curricula, Advantech’s core values and systems can be learned.

93
Case Study Advantech management and decision-making levels will select the themes relevant to Advantech future development and invite experts from all fields and scholars from academic circles to discuss on Advantech business cases and offer academic theories and proposals to compose our “Business Case Study,” and the discussions and interactions between our colleagues and experts in various fields will jointly help develop the guidelines and strategies for the company’s future development and accomplish the tasks of cases, such as ”M&A as the Assessment and Management for Advantech Development Strategy”, “Under Greater China Homeland strategic approach, Advantech strategic action and managing change in Mainland China”, and "Advantech’s Operation in Inter-Continental Sales Region”:”Action Plan Design on the evolution from Export Business Model to the Operation Model of Market Segmentation”, “Advantech Business Leadership Management Process Improvement Study”, “The Study on the Pricing Model of Advantech GIE 2.0”, "Focus on Excellence, Innovation and the Humanities and be a good corporate citizen- Advantech CSR Case Study”, “Advantech's Talent Cultivation and Inheritance", and「”The study on Advantech transnational MD role.” Case Study not only stimulates the trainees’ creative thinking and reflections and refines the company's business model and strategies, but it also effectively imparts Advantech’s business philosophy and strategic direction. On the other hand, business cases from domestic enterprises are limited in number, and the ones developed by Advantech in cooperation with academic circles are available not only for teaching purposes, but also for students to integrate theory and practice through Case Study;at the same time, it also allows the industry to observe each other and exchange experience to serve as a heritage.
e-Learning The Advantech e-Learning platform, created for imparting Advantech wisdom, core values and culture, delivering the company’s important news and events, and instructing professional knowledge and skills, allows employees around the world to find out Advantech's business philosophy and its corporate culture through online learning. Meanwhile, they are enabled to

94
obtain the latest information according their own needs to learn, making learning free of geographical and time constraints, and they can learn simultaneously and communicate with colleagues all over the world; accessing information from all over the world in the exclusive field of knowledge effectively broadens Advantechers’ global perspective and knowledge profile and makes the most of the learning resources to reach the efficiency collaboration, integration & leverage. Listed below are the website contents:
Advantech Philosophy: Impart Advantech wisdom, core values and culture to enable our employees around the world to enhance the corporate cultural identification and consensus.
Business Leadership Model: Set forth the spirit, the knowledge profile, and the actual practices of Advantech Business Leadership Management Process.
Professional courses: Offer various types of professional knowledge and skills training, expecting our employees will be more proficient at work.
New employee Orientation: Provide a variety of policies and guidelines for the newcomers so that they will know well their work quickly.
Advantech Scholar: It provides the information Advantechers must know, such as the interview articles of Advantech senior level managers, business cases in cooperation with professors, Advantech quarterly and Advantech abbreviation dictionary.
Advantech Important Events: It provides videos and contents of the company’s important activities, allowing employees around the world to know about the spirit and the meaning of Advantech important events.
Management LEAP Camp In order to accelerate the cultivation of mid-level managers, Advantech has developed “Management LEAP Camp” through the design of branding to impart the culture and business philosophy unique to Advantech. This program allows the excellent mid-level managers to be involved in the company’s decision-making on major issues, and executives and the elite will have more interactions so that the future leaders can be discovered.

95
Champion Program’s two-stage course design has its strategic meaning from its content planning to the venue of course. In terms of the venue, in order to give the attendees a whole picture of the company’s management, the stage-one course took place at the headquarters in Taipei, enabling the elite trainees to grasp the core values and culture of the headquarters in Taipei and improving the interaction between the trainees and senior-level managers;the stage-two course was held in Kunshan, China (Manufacturing and R&D Center). It aimed to make the trainees have a profound understanding and experience on the operations of value chain from product planning, development, sampling, to manufacturing. The course planning adopted the approach of multi-faceted cultivation - Case Study, Study Group, Pre-Assignment, and Essay, and the contents are described as follows:
Case Study- Studying the cases of Advantech major issues, the trainees discuss on the enhancement or the improvement of the issues with senior level managers and offer their suggestions to the company, enabling the trainees to take part in the operation.
Study Group- (such as From A to A+, Kazuo Inamori's "Amoeba operating” concept)- By previewing the book, the trainees will understand the operator's business philosophy, and they will do the presentations in class to share their own views and interact with and learn from managers and other trainees.
Pre-assignment- Through the Assignment, the trainees will learn about leadership and teamwork, expecting to enhance the trainees’ team spirit by ways of Assignment and to make them understand all aspects of the company.
Essay -At the end of stage-one course, Advantech’s major issues will be presented in top-down and bottom-up manner, and during the development of their dissertations, the trainees are able to continuously discuss with senior level managers, the units related to the issues, and other trainees, offer the practicable action plan in response to the issues, and make the presentation in stage-two course. Through Essay, the trainees can participate in the company’s decision-making, learn about how senior managers integrate and coordinate major issues, and establish practical experience;after the paper is published, the action plan in the Essay will be delivered to the responsible unit and have it executed faithfully and kept for record and control.
Global Elite LEAP Camp LEAP means Jump, signifying the hope that every trainee will make huge progress, and its symbolic connotation refers to” Learn,” ” Experience, “Alignment” & “Partnership”. LEAP Camp will invite new employees from all over the world to Advantech headquarters every year, and the training of a five-day global camp aims to enhance the employees’ professional knowledge and skills and make them experience Advantech's culture and core values, allowing them to interact and get into contact with the partners from the world so as to achieve global collaboration. The course design of LEAP Camp is divided into Sales Track, Marketing Track, and AE Track

96
in accordance of the duties of the trainees, and each Track’s content focuses on the field of expertise in each Track, enabling the trainees to grow by way of LEAP Camp while experiencing Advantech's culture.
Study Group Our CEO is convinced that "all supervisors can build the team consensus by reading a book together." Advantech Reading Club holds reading parties on a regular basis. Outside experts and scholars in the fields of business management, operational planning and others, or mid-to-senior level managers from the affiliated companies are invited to develop concepts and introduce innovative management concepts, which continually refines Advantech’s management model and thus leads to the formation of key business strategy. As the prime directive of Advantech towards talent says,” Right People on Bus- finding right people before deciding what to do,” and this policy is quoted from the book, “Good to Great” written by Jim Collins.
Temporary Coverage Assignment Program , TCAP In order to expand the Advantech elite’s global perspective and experience, the company offers short-term and task-based overseas dispatch opportunities (dispatch rotation period ranging from 3 to 6 months) for the major, top-down, emerging markets, emerging opportunities. It gives employees the chance to face different challenges and grow. Through the variance of working environment and position, the talents will develop diverse international perspectives and acquire valuable experience by achieving the goal of the short-term task. The internal rotation and station assignment is also the best way to help build up the international perspective of the elites. Plan short-term TCAP program so that the personnel can develop a diversified international perspective through the change of working environment and job rotations in order to achieve the short-term assignment and gather valuable experience. For example, in 2015, the total amount invested in the education and training of staff was NT$215.91 million with an average of 54.31 hours training for each employee. The colleagues continue to grow as a person and career planning through the training program of the Company.
3. Retirement system and the status of its implementation, including the old system and the new system: (1)Old system: The employees who had reported to duty before June 30, 2005 may choose
discretionally between the new system and old system. The Company in accordance with the provisions of the Labor Standards Law provides a retirement plan for all formal employees. According to the retirement plan, pension payment is paid in accordance with the average years of service and the average salary six months prior to the retirement. The Company has pension reserve appropriated monthly and has it handled by the Labor Pension Reserve Committee and then deposited in the name of the Committee with the Bank of Taiwan.

97
(2) New system: The employees who have reported to duty since July 1, 2005 are subject to the new system, as well as the employees who had reported to duty before July 1, 2005 but chose to apply the new system. The Company has an amount equivalent to 6% of the monthly wages and salaries appropriated to the pension account of each employee. Employees may also set aside an amount equivalent to 0%-6% of the monthly wages and salaries discretionally to the pension account and the appropriated amount will be deducted from the monthly paycheck of the respective employee.
4. Agreement between employer and employees: The Company upholds the concepts of “Unified employer and employee” and “Coexistence” and applies reasonable and humane management with an “Openness” method to establish a smooth communication channel, to maintain a good labor relation, to work together for higher productivity, to share profits, and to establish a stable and harmonious labor relation. The Company has always upheld the principle of “fairness and impartiality” and “reasonableness and lawfulness” within the consideration of sentiment and legality to communicate and coordinate with the employees in recent years. Explain the difficulties and problems faced by the Company adequately and express the position and assertion of the Company. Respect each other and agree with each other so that both parties will be able to resolve disputes and improve labor relation with both parties treated fairly and justly. Therefore, the Company has never suffered any loss due to labor disputes; moreover, both parties are able to work together for professional development and labor welfare.
5. The protection measures for employee’s benefits: The Company has Labor Welfare Committee and Labor Pension Reserve Committee established lawfully to plan, appropriate, reserve, and apply the benefit funds and pension reserves, and the matters regulated by the relevant law and regulations; also, has the employee’s benefits and welfare system implemented in accordance with the specifications.
(II) Labor/employer dispute loss incurred in the most recent year and up to the publication of the annual report; also, disclosing estimated current and future loss and its countermeasure: None
VI. Important Contracts March 31, 2016
Contract Counter party Contract Period Highlights of Provisions Restrictive
Clauses
OEM Microsoft Licesung, GP
103.07.01~105.06.30 Direct License Agreement None
Distribution Microsoft Licesung, GP
103.07.01~105.06.30 TW Distribution Agreement None
Note: The important contracts referred to above are valid and will be due in the most recent year up to the publication of the
annual report.

98
Six. FINANCIAL INFORMATION I. Condensed Balance Sheet, Income Statement, Name of the Auditors and Audit opinions with the last five years (I) Condensed Balance Sheet and comprehensive Income Statement
Condensed Balance Sheets Year
Item Financial Data within the last 5 years (Note 1)
Financial data up to March 31, 2016 (Note 2)
2015 2014 2013 2012
Current Assets 18,085,746 17,990,032 15,411,630 13,727,313 18,882,253
Property, plant, and equipment 9,576,879 8,876,606 7,941,679 6,391,636 9,652,479
Intangible assets 227,686 286,312 326,617 349,185 488,447
Other assets 6,088,822 4,390,870 3,856,158 3,640,611 6,249,664
Total assets 33,979,133 31,543,820 27,536,084 24,108,745 35,272,843
Current Liabilities
Before distribution 9,242,530 7,779,820 7,205,324 5,490,343 9,099,550
After distribution (Note 3) 11,567,075 10,223,144 8,253,929 -
Noncurrent liabilities 1,282,826 1,230,981 910,570 891,133 1,248,838
Total liabilities Before distribution 10,525,356 9,010,801 8,115,894 6,381,476 10,348,388
After distribution (Note 3) 12,798,056 11,133,714 9,145,062 -
Shareholder’s equity attributable to parent company 23,307,501 22,346,019 19,258,299 17,619,378 24,782,087
Capital stock 6,318,531 6,312,091 5,694,000 5,639,971 6,318,531
Additional paid-in capital 5,587,555 5,306,958 4,995,635 4,701,785 5,654,091
Retained
earnings
Before distribution 11,061,291 9,825,337 8,514,157 7,213,023 12,369,515
After distribution (Note 3) 6,038,082 5,496,337 4,449,437 -
Other equity 340,124 901,633 54,507 64,599 439,950
Treasury stock - - - - -
Non-controlling equity 146,276 187,000 161,891 107,891 142,368
Total equity Before distribution 23,453,777 22,533,019 19,420,190 17,727,269 24,924,455
After distribution (Note 3) 18,745,764 16,402,370 14,963,683 -
Note 1: For the financial data with the IFRS adopted for less than five years, the financial data in Table (II) should be prepared in accordance with the Financial Accounting Standards of the R.O.C. The 2012~2015 financial data were audited by the CPA.
Note 2: The 2016Q1 financial data were reviewed by the CPA.
Note 3: The proposal for the distribution of the 2015 earnings is yet to be resolved in the shareholders’ meeting.

99
Condensed Balance Sheet - Proprietary Year
Item
Financial Data within the last 5 years (Note 1) Financial data up to
March 31, 2016 2015 2014 2013 2012
Current assets 7,853,529 9,411,709 7,914,096 6,998,833
Property, plant, and equipment 6,278,109 5,354,959 4,608,115 3,967,902
Intangible assets 74,049 86,240 90,729 83,028
Other assets 17,059,718 14,626,214 12,697,938 11,167,912
Total assets 31,265,405 29,479,122 25,310,878 22,217,675
Current
liabilities
Before
distribution 6,816,368 6,038,793 5,252,614 3,723,161
After
distribution (Note 2) 9,826,048 8,270,434 6,486,747
Noncurrent liabilities 1,141,536 1,094,310 799,965 875,136
Total liabilities
Before
distribution 7,957,904 7,133,103 6,052,579 4,598,297
After
distribution (Note 2) 10,920,358 9,070,399 7,361,883
Capital stock 6,318,531 6,312,091 5,694,000 5,639,971
Additional paid-in capital 5,587,555 5,306,958 4,995,635 4,701,785
Retained
earnings
Before
distribution 11,061,291 9,825,337 8,514,157 7,213,023
After
distribution (Note 2) 6,038,082 5,496,337 4,449,437
Other equity 340,124 901,633 54,507 64,599
Total equity Before
distribution 23,307,501 22,346,019 19,258,299 17,619,378
After
distribution (Note 2) 18,558,764 16,240,479 14,855,792
Note 1: The 2012~2015 financial data were audited by the CPA. Note 2: The proposal for the distribution of the 2015 earnings is yet to be resolved in the shareholders’ meeting.
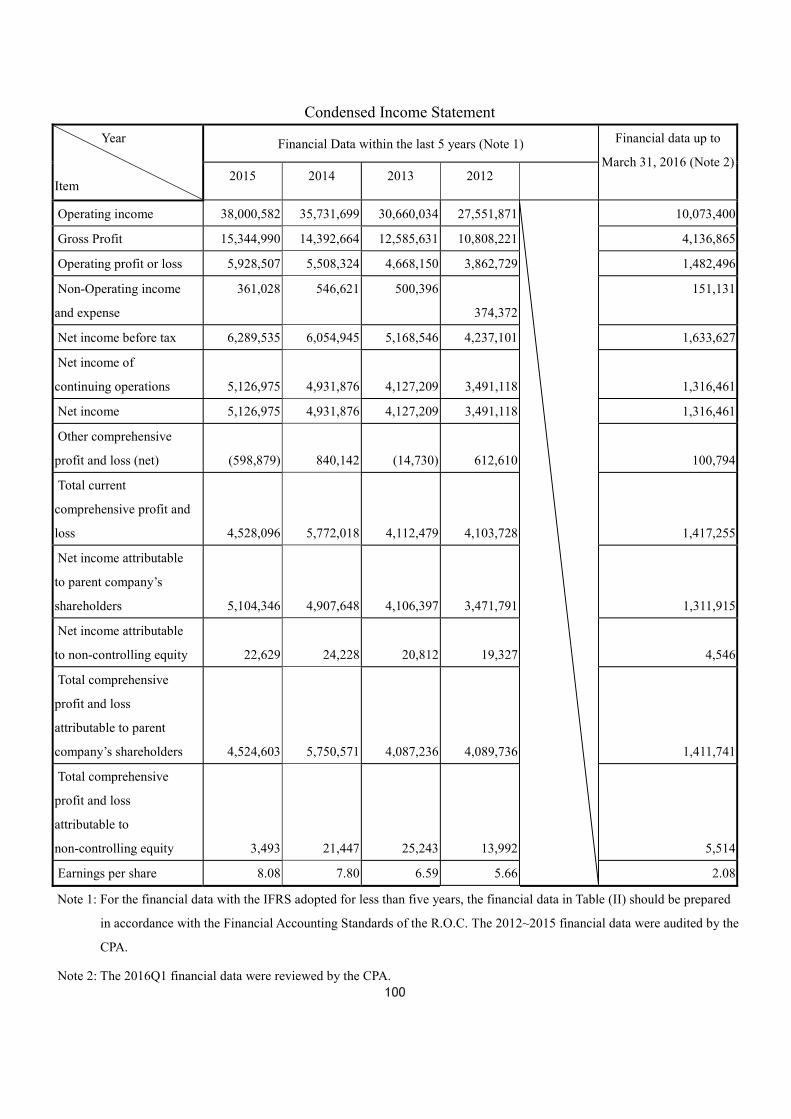
100
Condensed Income Statement
Year
Item
Financial Data within the last 5 years (Note 1) Financial data up to
March 31, 2016 (Note 2)2015 2014 2013 2012
Operating income 38,000,582 35,731,699 30,660,034 27,551,871
10,073,400
Gross Profit 15,344,990 14,392,664 12,585,631 10,808,221 4,136,865
Operating profit or loss 5,928,507 5,508,324 4,668,150 3,862,729 1,482,496
Non-Operating income
and expense
361,028 546,621 500,396
374,372
151,131
Net income before tax 6,289,535 6,054,945 5,168,546 4,237,101 1,633,627
Net income of
continuing operations 5,126,975 4,931,876 4,127,209 3,491,118 1,316,461
Net income 5,126,975 4,931,876 4,127,209 3,491,118 1,316,461
Other comprehensive
profit and loss (net) (598,879) 840,142 (14,730) 612,610 100,794
Total current
comprehensive profit and
loss 4,528,096 5,772,018 4,112,479 4,103,728 1,417,255
Net income attributable
to parent company’s
shareholders 5,104,346 4,907,648 4,106,397 3,471,791 1,311,915
Net income attributable
to non-controlling equity 22,629 24,228 20,812 19,327 4,546
Total comprehensive
profit and loss
attributable to parent
company’s shareholders 4,524,603 5,750,571 4,087,236 4,089,736 1,411,741
Total comprehensive
profit and loss
attributable to
non-controlling equity 3,493 21,447 25,243 13,992 5,514
Earnings per share 8.08 7.80 6.59 5.66 2.08
Note 1: For the financial data with the IFRS adopted for less than five years, the financial data in Table (II) should be prepared
in accordance with the Financial Accounting Standards of the R.O.C. The 2012~2015 financial data were audited by the
CPA.
Note 2: The 2016Q1 financial data were reviewed by the CPA.
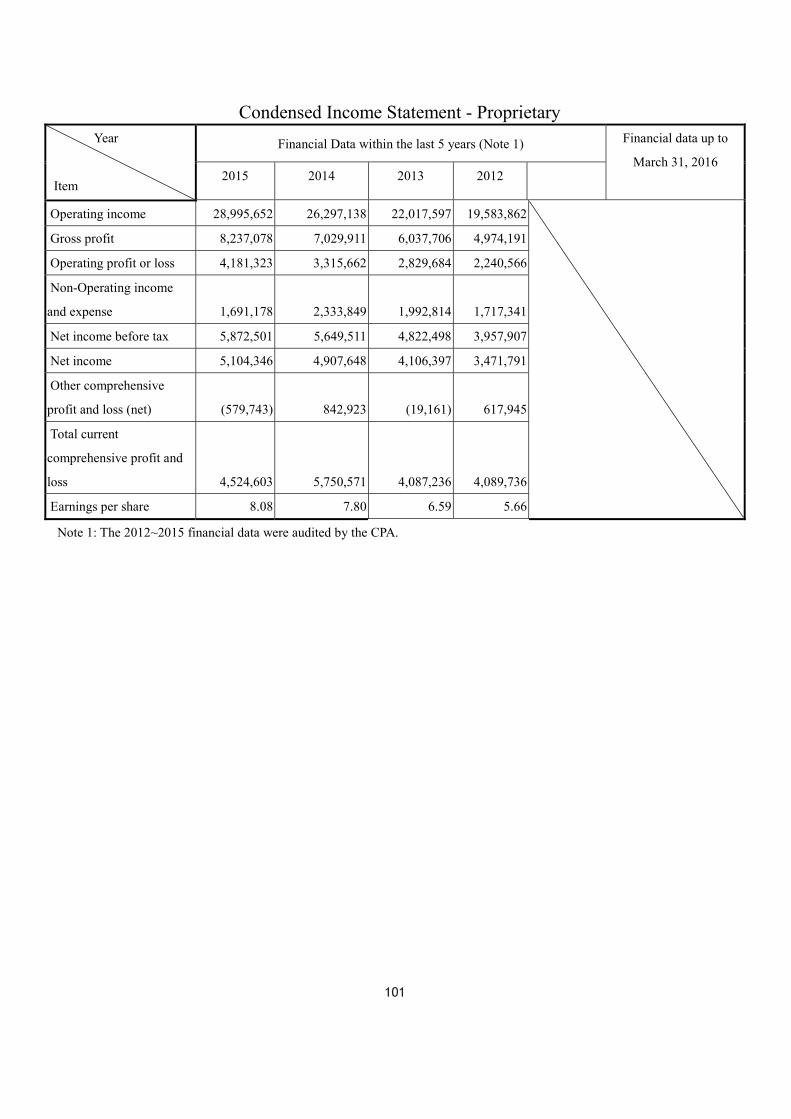
101
Condensed Income Statement - Proprietary
Year
Item
Financial Data within the last 5 years (Note 1) Financial data up to
March 31, 2016 2015 2014 2013 2012
Operating income 28,995,652 26,297,138 22,017,597 19,583,862
Gross profit 8,237,078 7,029,911 6,037,706 4,974,191
Operating profit or loss 4,181,323 3,315,662 2,829,684 2,240,566
Non-Operating income
and expense 1,691,178 2,333,849 1,992,814 1,717,341
Net income before tax 5,872,501 5,649,511 4,822,498 3,957,907
Net income 5,104,346 4,907,648 4,106,397 3,471,791
Other comprehensive
profit and loss (net) (579,743) 842,923 (19,161) 617,945
Total current
comprehensive profit and
loss 4,524,603 5,750,571 4,087,236 4,089,736
Earnings per share 8.08 7.80 6.59 5.66
Note 1: The 2012~2015 financial data were audited by the CPA.

102
( II) Condensed Balance Sheet and Income Statement – the R.O.C. Financial Accounting Standards
Condensed Balance Sheet – the R.O.C. Financial Accounting Standards Unit: NT$ Thousand
Year
Item
Financial Data within the last 5 years (Note 1)
Financial date up to
2009 2010 2011 2012
Current assets 4,955,770 6,160,810 7,021,442
Fund and investment 9,904,688 10,577,926 11,379,305
Fixed assets 2,376,408 3,930,102 3,977,661
Other assets 104,652 80,084 95,630
Total assets 17,341,518 20,748,922 22,474,038
Current liabilities
Before
distribution
3,085,747 3,570,764 3,706,183
After distribution 4,841,465 6,335,745 6,469,769
Long-term liabilities - 760,331 184,660
Other liabilities 722,332 823,367 881,220
Total liabilities
Before
distribution
3,808,079 5,154,462 4,772,063
After distribution 5,563,797 7,919,443 7,535,649
Capital stock 5,016,337 5,579,132 5,639,971
Additional paid-in capital 4,392,850 4,017,699 4,758,762
Retained earnings
Before
distribution
4,817,166 6,542,934 7,240,340
After distribution 3,061,448 3,777,953 4,476,754
Unrealized gains/losses on financial
instruments
(403,782) (648,592) 168,944
Cumulative Translation Adjustment (215,759) 105,408 (104,345)
Net loss not recognized as pension
cost
(2,121) (2,121) (1,697)
Total
shareholder’s
equity
Before
distribution
13,533,439 15,594,460 17,701,975
After distribution 11,777,721 12,829,479 14,938,389
Note 1: Financial data referred to above have been audited by the CPA.

103
Condensed Income Statement – the R.O.C. Financial Accounting Standards
Unit: NT$ Thousand,
Except for Earnings per Share in NT$
Year
Item
Financial Data within the last 5 years (Note 1) Financial date up to
2009 2010 2011 2012
Operating income - net 16,377,929 18,619,755 19,583,862
Gross profit 4,148,436 5,094,132 5,008,677
Operating profit or loss 2,026,480 2,589,316 2,238,959
Non-Operating Income
and profit
1,535,094 1,647,393 1,817,353
Non-Operating Expense
and loss
217,736 191,306 107,809
Net income before tax 3,343,838 4,045,403 3,948,503
Net income 3,039,431 3,552,738 3,462,387
Earnings per share 6.06 6.44 6.22
Diluted earnings per
share
6.03 6.43 6.15
Diluted earnings per share
after the retroactive
adjustment
5.01 5.85 5.66
Note 1: Financial data referred to above have been audited by the CPA.
(III) The name and opinion of the independent auditor within the last 5 year Year Name of CPA Firm Name of CPAs
(Certified Public Accountant)
Auditor’s opinions
2015 Deloitte & Touche CPA Meng Chieh Chiu / CPA Chin Hsiang Chen Modified Unqualified opinion
2014 Deloitte & Touche CPA Meng Chieh Chiu / CPA Chin Hsiang Chen Modified Unqualified opinion
2013 Deloitte & Touche CPA Jr Shian Ke / CPA Chin Hsiang Chen Modified Unqualified opinion
2012 Deloitte & Touche CPA Jr Shian Ke / CPA Chin Hsiang Chen Modified Unqualified opinion
2011 Deloitte & Touche CPA Jr Shian Ke / CAP Anhui Lin Modified Unqualified opinion

104
II. Financial Analysis within the last 5 years ( I) Financial Analysis - consolidated
Year (Note 1)
Analysis item
(Note 3)
Financial analysis within the last 5 years As of March 31, 2016 (Note 2)
2015 2014 2013 2012
Finance
structure (%)
Debt to assets ratio 30.98 28.55 29.47 26.47
29.34
Long term funds to property,
plant, and equipment ratio 258.3 266.88 254.37 291.29 271.16
Solvency(%)
Current ratio (%) 195.68 229.06 210.11 250.03 207.51
Quick ratio (%) 138.06 161.64 150.66 173.58 144.67
Interest coverage ratio 62,738.53 42,091.03 45,430.17 20,921.14 78.564.31
Operating ability
Receivables turnover (times) 6.16 6.34 6.31 6.87 6.34
Accounts receivable collecting
days 59.25 57.57 57.84 53.13 57.53
Inventory turnover (times) 4.70 4.39 4.56 4.30 4.70
Payables turnover (times) 7.09 6.67 6.78 8.29 7.05
Average inventory turnover on
sales 77.65 83.14 80.04 84.88 77.63
Property, plant, and property
turnover (times) 4.12 4.25 4.28 4.36 4.19
Total asset turnover (times) 1.16 1.21 1.19 1.20 1.16
Profitability
Return on assets (%) 15.67 20.54 16.02 15.34 15.23
Return on equity (%) 22.30 23.51 22.22 20.95 21.77
Ratio of net income before tax
to paid-in capital (%) (Note 7) 93.83 87.27 91.17 75.13 103.42
Profit margin (%) 13.49 13.80 13.46 12.67 13.07
Earnings Per Share (NT$) 8.08 7.80 6.59 5.66 2.08
Cash flow
Cash flow ratio (%) 63.88 62.53 68.98 79.93 19.44
Cash Flow Adequacy Ratio (%) 93.25 89.33 95.40 95.50 93.25
Cash Flow Re-investment Ratio
(%) 9.36 8.31 11.93 9.33 7.39
Levera
ge
Operating leverage 1.34 3.70 3.58 3.95 3.35
Financial leverage 1.00 1.00 1.00 1.01 1.00

105
1. Capital Structure Analysis
(1) Debt Ratio = Total Liabilities / Total Assets
(2) Long-term Fund to Property, Plant and Equipment Ratio = (Shareholders’ Equity +
Noncurrent Liabilities) / Net Property, Plant and Equipment
2. Liquidity Analysis
(1) Current Ratio = Current Assets / Current Liabilities
(2) Quick Ratio = (Current Assets - Inventories - Prepaid Expenses) / Current Liabilities
(3) Times Interest Earned = Earnings before Interest and Taxes / Interest Expenses
3. Operating Performance Analysis
(1) Average Collection Turnover = Net Sales / Average Trade Receivables
(2) Days Sales Outstanding = 365 / Average Collection Turnover
(3) Average Inventory Turnover = Cost of Sales / Average Inventory
(4) Average Inventory Turnover Days = 365 / Average Inventory Turnover
(5) Average Payment Turnover = Cost of Sales / Average Trade Payables
(6) Property, Plant and Equipment Turnover = Net Sales / Average Net Property, Plant and
Equipment
(7) Total Assets Turnover = Net Sales / Average Total Assets
4. Profitability Analysis
(1) Return on Total Assets = (Net Income + Interest Expenses * (1 - Effective Tax Rate)) /
Average Total Assets
(2) Return on Equity Attributable to Shareholders of the Parent = Net Income Attributable to
Shareholders of the Parent / Average Equity Attributable to Shareholders of the Parent
(3) Operating Income to Paid-in Capital Ratio= Operating Income / Paid-in Capital
(4) Pre-tax Income to Paid-in Capital Ratio = Income before Tax / Paid-in Capital
(5) Net Margin = Net Income / Net Sales
(6) Earnings Per Share = (Net Income Attributable to Shareholders of the Parent - Preferred
Stock Dividend) / Weighted Average Number of Shares Outstanding
5. Cash Flow
(1) Cash Flow Ratio = Net Cash Provided by Operating Activities / Current Liabilities
(2) Cash Flow Adequacy Ratio = Five-year Sum of Cash from Operations / Five-year Sum of
Capital Expenditures, Inventory Additions, and Cash Dividend
(3) Cash Flow Reinvestment Ratio = (Cash Provided by Operating Activities - Cash Dividends) /
(Gross Property, Plant and Equipment + Long-term Investments + Other Noncurrent Assets + Working Capital)
6. Leverage
(1) Operating Leverage = (Net Sales - Variable Cost) / Income from Operations
(2) Financial Leverage = Income from Operations / (Income from Operations – Interest Expenses)

106
(I) Financial Analysis - Proprietary Year
Analysis item
Financial analysis within the last 5 years As of March 31,
2016
2015 2014 2013 2012
Finance structure
(%)
Debt to assets ratio 25.45 24.18 23.91 16.76
Long term funds to property, plant,
and equipment ratio 389.43 437.73 434.69 466.10
Solvency (%)
Current ratio (%) 115.22 155.85 149.89 187.98
Quick ratio (%) 89.78 131.44 123.13 146.65
Interest coverage ratio - 1,342,064.85 174,323.19 33,488.79
Operating ability
Receivables turnover (times) 5.67 5.82 5.76 5.66
Accounts receivable collecting days 64.37 62.7 63.37 64.49
Inventory turnover (times) 13.49 13.42 11.89 9.64
Payables turnover (times) 6.11 6.57 6.97 7.43
Average inventory turnover on sales 27.05 27.2 30.7 37.86
Property, plant, and property turnover
(times) 4.99 5.28 5.13 4.97
Total asset turnover (times) 0.95 0.96 0.93 0.92
Profitability
Return on assets (%) 16.81 17.92 17.29 16.30
Return on equity (%) 22.36 23.59 22.27 20.96
Ratio of net income before tax to
paid-in capital (%) (Note 7) 92.94 89.51 85.06 70.18
Profit margin (%) 17.6 18.66 18.65 17.73
Earnings Per Share (NT$) 8.08 7.80 6.59 5.66 C
ash flow
Cash flow ratio (%) 67.97 61.81 82.13 70.46
Cash Flow Adequacy Ratio (%) 76.46 79.82 82.67 82.02
Cash Flow Re-investment Ratio (%) 3.84 3.22 8.18 -
Leverag
e
Operating leverage 2.29 5.31 5.10 5.92
Financial leverage 1.00 1.00 1.00 1.01

107
( II) Financial analysis with the last five years – the R.O.C. Financial Accounting Standards
Year \ Analysis item Financial analysis within the last 5 years (Note 2) Financial data up to
2009 2010 2011 2012
Finance
structure (%)
Debt to assets ratio 21.96 24.84 21.23
Long term funds to property, plant,
and equipment ratio 569.49 416.14 449.68
Solvency (%)
Current ratio 160.60 172.53 189.45
Quick ratio 117.53 127.19 150.95
Interest coverage ratio 1,633.73 28,277.22 -
Operating
ability
Receivables turnover (times) 6.82 6.25 5.66
Average accounts receivable
turnover days 53.51 58.40 64.48
Inventory turnover (times) 11.35 9.24 9.62
Payables turnover (times) 7.50 7.33 7.41
Average inventory turnover on sale 32.15 39.50 37.94
Property, plant, and property
turnover (times) 6.89 4.74 4.95
Total asset turnover (times) 0.94 0.90 0.87
Profitability
Return on assets (%) 18.22 18.72 16.02
Return on shareholder’s equity (%) 22.93 24.39 20.80
Percentage to
paid-in
capital (%)
Operating
Income
(losses)
40.24 46.41 39.70
Net income
before tax
(losses)
66.66 72.51 70.01
Profit margin (%) 18.56 19.08 17.68
Earnings per share (NT$) (Note 1) 5.01 5.85 5.66
Diluted earnings per share (NT$) 6.03 6.43 6.15
Cash flow
(%)
Cash flow ratio (%) 72.60 83.77 79.73
Cash Flow Adequacy Ratio (%) 91.05 89.40 84.06
Cash Flow Re-investment Ratio (%) 1.90 7.84 1.08
Leverage Operating leverage 5.36 4.97 5.92
Financial leverage 1.00 1.01 1.01
Note 1: Calculated in accordance with the annual weighted average shares.
Note 2: Financial data referred to above have been audited the CPA.
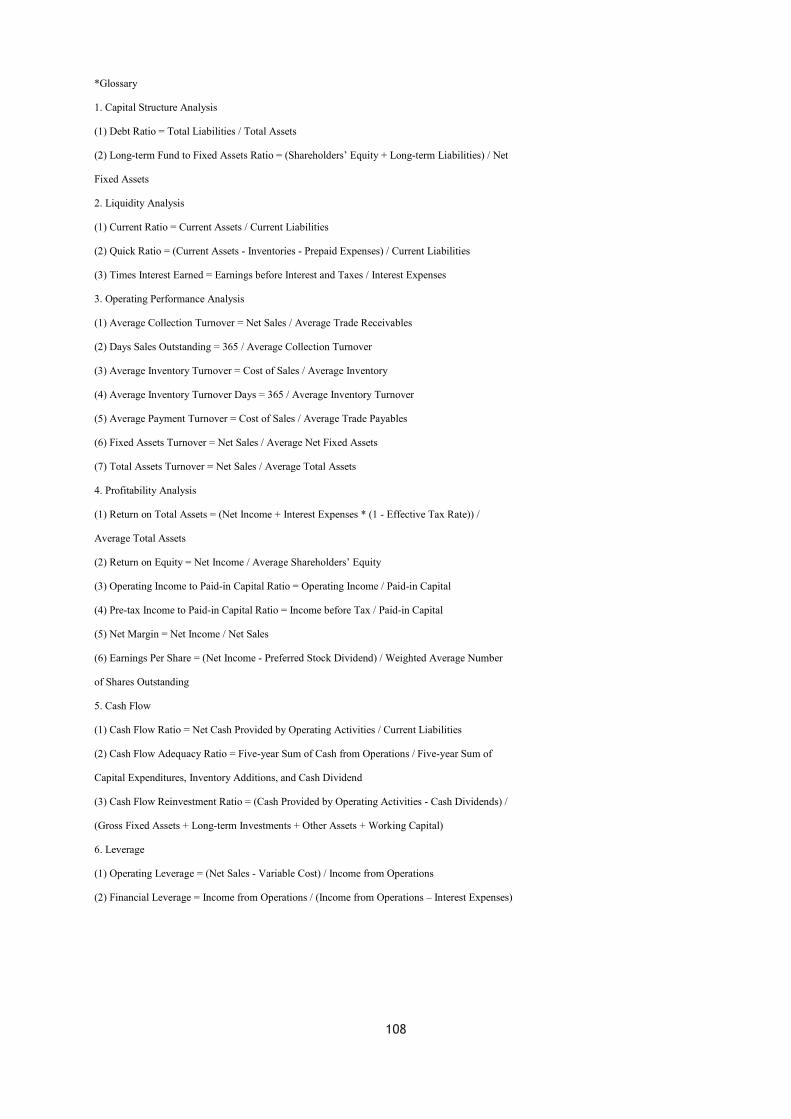
108
*Glossary
1. Capital Structure Analysis
(1) Debt Ratio = Total Liabilities / Total Assets
(2) Long-term Fund to Fixed Assets Ratio = (Shareholders’ Equity + Long-term Liabilities) / Net
Fixed Assets
2. Liquidity Analysis
(1) Current Ratio = Current Assets / Current Liabilities
(2) Quick Ratio = (Current Assets - Inventories - Prepaid Expenses) / Current Liabilities
(3) Times Interest Earned = Earnings before Interest and Taxes / Interest Expenses
3. Operating Performance Analysis
(1) Average Collection Turnover = Net Sales / Average Trade Receivables
(2) Days Sales Outstanding = 365 / Average Collection Turnover
(3) Average Inventory Turnover = Cost of Sales / Average Inventory
(4) Average Inventory Turnover Days = 365 / Average Inventory Turnover
(5) Average Payment Turnover = Cost of Sales / Average Trade Payables
(6) Fixed Assets Turnover = Net Sales / Average Net Fixed Assets
(7) Total Assets Turnover = Net Sales / Average Total Assets
4. Profitability Analysis
(1) Return on Total Assets = (Net Income + Interest Expenses * (1 - Effective Tax Rate)) /
Average Total Assets
(2) Return on Equity = Net Income / Average Shareholders’ Equity
(3) Operating Income to Paid-in Capital Ratio = Operating Income / Paid-in Capital
(4) Pre-tax Income to Paid-in Capital Ratio = Income before Tax / Paid-in Capital
(5) Net Margin = Net Income / Net Sales
(6) Earnings Per Share = (Net Income - Preferred Stock Dividend) / Weighted Average Number
of Shares Outstanding
5. Cash Flow
(1) Cash Flow Ratio = Net Cash Provided by Operating Activities / Current Liabilities
(2) Cash Flow Adequacy Ratio = Five-year Sum of Cash from Operations / Five-year Sum of
Capital Expenditures, Inventory Additions, and Cash Dividend
(3) Cash Flow Reinvestment Ratio = (Cash Provided by Operating Activities - Cash Dividends) /
(Gross Fixed Assets + Long-term Investments + Other Assets + Working Capital)
6. Leverage
(1) Operating Leverage = (Net Sales - Variable Cost) / Income from Operations
(2) Financial Leverage = Income from Operations / (Income from Operations – Interest Expenses)
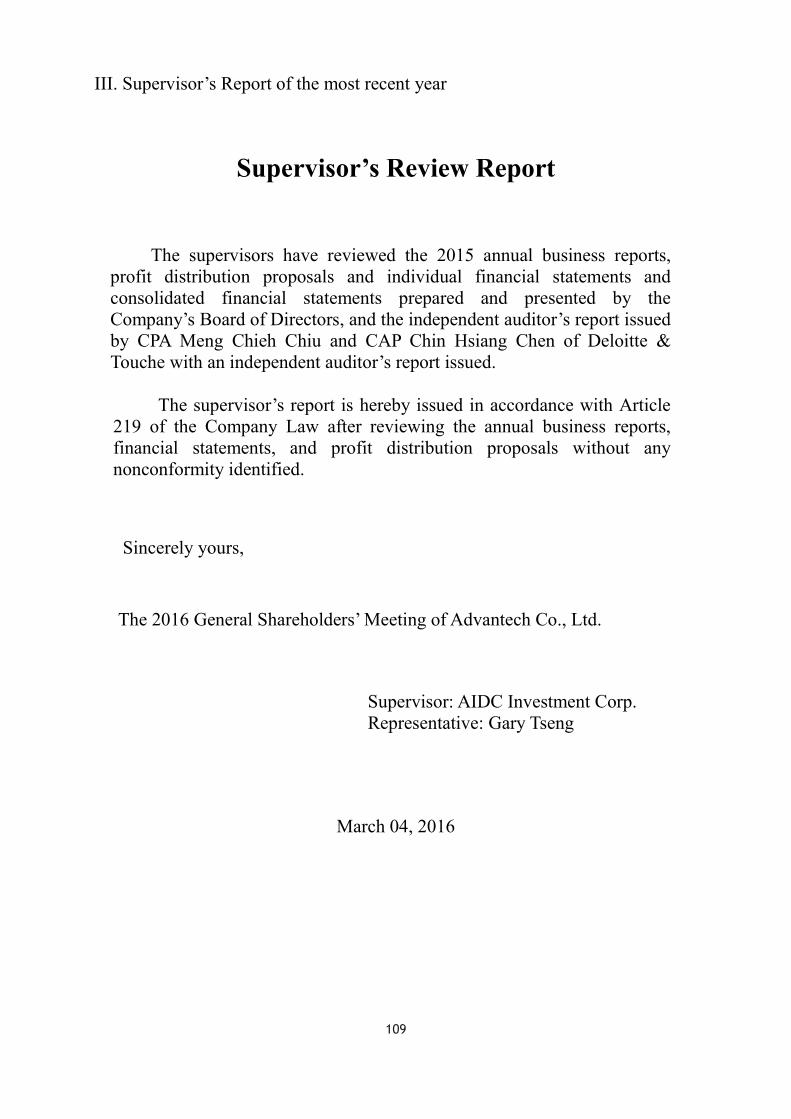
109
III. Supervisor’s Report of the most recent year
Supervisor’s Review Report
The supervisors have reviewed the 2015 annual business reports,
profit distribution proposals and individual financial statements and consolidated financial statements prepared and presented by the Company’s Board of Directors, and the independent auditor’s report issued by CPA Meng Chieh Chiu and CAP Chin Hsiang Chen of Deloitte & Touche with an independent auditor’s report issued.
The supervisor’s report is hereby issued in accordance with Article
219 of the Company Law after reviewing the annual business reports, financial statements, and profit distribution proposals without any nonconformity identified.
Sincerely yours,
The 2016 General Shareholders’ Meeting of Advantech Co., Ltd.
Supervisor: AIDC Investment Corp. Representative: Gary Tseng
March 04, 2016

110
Supervisor’s Review Report
The supervisors have reviewed the 2015 annual business reports, profit distribution proposals and individual financial statements and consolidated financial statements prepared and presented by the Company’s Board of Directors, and the independent auditor’s report issued by CPA Meng Chieh Chiu and CAP Chin Hsiang Chen of Deloitte & Touche with an independent auditor’s report issued.
The supervisor’s report is hereby issued in accordance with Article 219
of the Company Law after reviewing the annual business reports, financial statements, and profit distribution proposals without any nonconformity identified.
Sincerely yours,
The 2016 General Shareholders’ Meeting of Advantech Co., Ltd.
Supervisor: Thomas Chen
March 04, 2016
111
Supervisor’s Review Report
The supervisors have reviewed the 2015 annual business reports,
profit distribution proposals and individual financial statements and consolidated financial statements prepared and presented by the Company’s Board of Directors, and the independent auditor’s report issued by CPA Meng Chieh Chiu and CAP Chin Hsiang Chen of Deloitte & Touche with an independent auditor’s report issued.
The supervisor’s report is hereby issued in accordance with Article 219
of the Company Law after reviewing the annual business reports, financial statements, and profit distribution proposals without any nonconformity identified.
Sincerely yours,
The 2016 General Shareholders’ Meeting of Advantech Co., Ltd.
Supervisor: James Wu
March 04, 2016
INDEPENDENT AUDITORS’ REPORT
The Board of Directors and the Shareholders Advantech Co., Ltd.
We have audited the accompanying balance sheets of Advantech Co., Ltd. (the “Company”) as of December 31, 2015 and 2014, and the related statements of comprehensive income, changes in shareholders’ equity and cash flows for the years then ended. These financial statements are the responsibility of the Company’s management. Our responsibility is to express an opinion on these financial statements based on our audits. However, as stated in Note 11 to the financial statements, we did not audit the financial statements as of and for the years ended December 31, 2015 and 2014 of some companies in which the Company had investments accounted for by the equity method. The financial statements of these investees were audited by other auditors, whose reports have been furnished to us, and our opinion, insofar as it relates to the investees’ amounts included herein, is based solely on the reports of the other auditors. The carrying amounts of these investments were 4.60% (NT$1,439,156 thousand) and 4.95% (NT$1,460,624 thousand) of the Company’s total assets as of December 31, 2015 and 2014, respectively. Also, the shares of profit and loss of subsidiaries and associates accounted for using the equity method were 3.17% (NT$186,253 thousand) and 3.13% (NT$176,571 thousand) of the Company’s profit before income tax in 2015 and 2014, respectively.
We conducted our audits in accordance with the Rules Governing the Audit of Financial Statements by Certified Public Accountants and auditing standards generally accepted in the Republic of China. Those rules and standards require that we plan and perform the audit to obtain reasonable assurance about whether the financial statements are free of material misstatement. An audit includes examining, on a test basis, evidence supporting the amounts and disclosures in the financial statements. An audit also includes assessing the accounting principles used and significant estimates made by management, as well as evaluating the overall financial statement presentation. We believe that our audits and the reports of the other auditors provide a reasonable basis for our opinion.
In our opinion, based on our audits and the reports of the other auditors, the financial statements referred to above present fairly, in all material respects, the financial position of Advantech Co., Ltd. as of December 31, 2015 and 2014, and its financial performance and cash flows for the years ended December 31, 2015 and 2014, in conformity with the Regulations Governing the Preparation of Financial Reports by Securities Issuers, IFRS, IAS, IFRIC and SIC (collectively, the “IFRSs”) endorsed by the FSC.
-112-
IV. Financial Statements of the most recent year

The accompanying schedules of major accounting items of Advantech Co., Ltd. as of and for the year ended December 31, 2015 are presented for the purpose of additional analysis. Such schedules have been subjected to the auditing procedures described in the second paragraph. In our opinion, such schedules are consistent, in all material respects, with the financial statements referred to in the first paragraph.
March 4, 2016
Notice to Readers
The accompanying financial statements are intended only to present the financial position, financial performance and cash flows in accordance with accounting principles and practices generally accepted in the Republic of China and not those of any other jurisdictions. The standards, procedures and practices to audit such financial statements are those generally accepted and applied in the Republic of China.
For the convenience of readers, the auditors’ report and the accompanying financial statements have been translated into English from the original Chinese version prepared and used in the Republic of China. If there is any conflict between the English version and the original Chinese version or any difference in the interpretation of the two versions, the Chinese-language auditors’ report and financial statements shall prevail.
-113-

ADVANTECH CO., LTD.
BALANCE SHEETSDECEMBER 31, 2015 AND 2014(In Thousands of New Taiwan Dollars)
20152014
(Restated)ASSETS Amount % Amount %
CURRENT ASSETSCash and cash equivalents (Notes 4 and 6) $ 815,293 3 $ 1,049,397 4Financial assets at fair value through profit or loss - current (Notes 4, 7 and 24) 7,391 - 14,879 -Available-for-sale financial assets - current (Notes 4, 8 and 24) - - 1,717,756 6Notes receivable (Notes 4, 9 and 25) 55,480 - 45,319 -Trade receivables (Notes 4 and 9) 1,135,240 4 993,742 3Trade receivables to related parties (Notes 4 and 25) 3,977,999 13 4,014,411 14Other receivables 113,056 - 86,064 -Other receivables from related parties (Note 25) 15,596 - 15,641 -Inventories (Notes 4 and 10) 1,673,156 5 1,404,202 5Other current financial assets (Note 26) - - 18,650 -Other current assets 60,318 - 51,648 -
Total current assets 7,853,529 25 9,411,709 32
NONCURRENT ASSETSAvailable-for-sale financial assets - noncurrent (Notes 4, 8 and 24) 1,700,814 6 2,385,937 8Investments accounted for using the equity method (Notes 4 and 11) 13,138,225 42 12,020,741 41Property, plant and equipment (Notes 4 and 12) 6,278,109 20 5,354,959 18Goodwill (Notes 4 and 13) 111,599 - 111,599 1Other intangible assets (Note 4) 74,049 - 86,240 -Deferred tax assets (Notes 4 and 18) 114,710 1 81,941 -Prepayments for business facilities 15,489 - 14,972 -Prepayment for investments (Note 28) 1,968,044 6 - -Other noncurrent assets 10,837 - 11,024 -
Total noncurrent assets 23,411,876 75 20,067,413 68
TOTAL $ 31,265,405 100 $ 29,479,122 100
LIABILITIES AND EQUITY
CURRENT LIABILITIESFinancial liabilities at fair value through profit or loss - current (Notes 4, 7 and 24) $ 6,352 - $ 8,698 -Trade payables 899,480 3 777,932 3Trade payables to related parties (Note 25) 2,687,130 9 2,433,936 8Other payables (Notes 14 and 17) 2,255,915 7 2,070,485 7Current tax liabilities (Notes 4 and 18) 853,769 3 650,399 2Short-term warranty provision (Note 4) 41,410 - 36,119 -Other current liabilities 72,312 - 61,224 -
Total current liabilities 6,816,368 22 6,038,793 20
NONCURRENT LIABILITIESDeferred tax liabilities (Notes 4 and 18) 927,732 3 889,049 3Net defined benefit liabilities (Notes 4, 15 and 17) 182,172 - 164,249 1Credit balance of investments accounted for using the equity method (Notes 4 and 11) - - 7,286 -Other noncurrent liabilities 31,632 - 33,726 -
Total noncurrent liabilities 1,141,536 3 1,094,310 4
Total liabilities 7,957,904 25 7,133,103 24
EQUITY ATTRIBUTABLE TO OWNERS OF THE EQUITYShare capital
Ordinary shares 6,318,531 20 6,301,031 22Advance receipts for share capital - - 11,060 -
Total share capital 6,318,531 20 6,312,091 22Capital surplus 5,587,555 18 5,306,958 18Retained earnings
Legal reserve 3,962,842 13 3,472,064 12Unappropriated earnings 7,098,449 23 6,353,273 21
Total retained earnings 11,061,291 36 9,825,337 33Other equity
Exchange differences on translating foreign operations 271,859 1 338,356 1Unrealized gains (losses) on available-for-sale financial assets 68,265 - 563,277 2
Total other equity 340,124 1 901,633 3
Total equity 23,307,501 75 22,346,019 76
TOTAL $ 31,265,405 100 $ 29,479,122 100
The accompanying notes are an integral part of the financial statements.
(With Deloitte & Touche audit report dated March 4, 2016)
-114-

ADVANTECH CO., LTD.
STATEMENTS OF COMPREHENSIVE INCOMEFOR THE YEARS ENDED DECEMBER 31, 2015 AND 2014(In Thousands of New Taiwan Dollars, Except Earnings Per Share)
2015 2014 (Restated)Amount % Amount %
OPERATING REVENUE (Notes 4 and 25)Sales $ 28,673,906 99 $ 25,839,025 98Other operating revenue 321,746 1 458,113 2
Total operating revenue 28,995,652 100 26,297,138 100
OPERATING COSTS (Notes 10, 17 and 25) 20,758,574 72 19,267,227 73
GROSS PROFIT 8,237,078 28 7,029,911 27
UNREALIZED GAIN ON TRANSACTIONS WITH SUBSIDIARIES AND ASSOCIATES (Note 4) (330,254) (1) (240,811) (1)
REALIZED GAIN ON TRANSACTIONS WITH SUBSIDIARIES AND ASSOCIATES (Note 4) 240,811 1 246,869 1
REALIZED GROSS PROFIT 8,147,635 28 7,035,969 27
OPERATING EXPENSES (Notes 17 and 25)Selling and marketing expenses 704,299 3 634,611 2General and administrative expenses 693,290 2 709,880 3Research and development expenses 2,568,723 9 2,375,816 9
Total operating expenses 3,966,312 14 3,720,307 14
OPERATING PROFIT 4,181,323 14 3,315,662 13
NONOPERATING INCOMEShare of the profit of subsidiaries and associates
accounted for using the equity method (Notes 4 and 11) 1,344,991 5 1,493,406 6
Interest income (Note 4 ) 1,665 - 20,510 -Gains (losses) on disposal of property, plant and
equipment (Note 4) (161) - 59,702 -Gains on disposal of investments (Notes 4 and 16) 198,848 1 43,163 -Foreign exchange gains (losses), net (Notes 4 , 17
and 29) (88,859) - 53,744 -Gains on financial instruments at fair value through
profit or loss (Note 4) 83,798 - 60,072 -Dividend income (Note 4) 105,445 - 124,466 1Other income (Notes 8 and 25) 112,567 - 528,395 2Finance costs (Note 17) - - (421) -
(Continued)
-115-

ADVANTECH CO., LTD.
STATEMENTS OF COMPREHENSIVE INCOMEFOR THE YEARS ENDED DECEMBER 31, 2015 AND 2014(In Thousands of New Taiwan Dollars, Except Earnings Per Share)
2015 2014 (Restated)Amount % Amount %
Losses on financial instruments at fair value through profit or loss (Note 4) $ (67,063) - $ (49,171) -
Other losses (53) - (17) -
Total nonoperating income 1,691,178 6 2,333,849 9
PROFIT BEFORE INCOME TAX 5,872,501 20 5,649,511 22
INCOME TAX EXPENSE (Notes 4 and 18) 768,155 2 741,863 3
NET PROFIT FOR THE YEAR 5,104,346 18 4,907,648 19
OTHER COMPREHENSIVE INCOMEItems that will not be reclassified subsequently to
profit or loss:Remeasurement of defined benefit plans (Notes 3
and 15) (18,736) - (4,989) -Share of the other comprehensive loss of
subsidiaries and associates accounted for using the equity method (Notes 3 and 11) (2,683) - (62) -
Income tax relating to items that will not be reclassified subsequently to profit or loss (Notes 3 and 18) 3,185 - 848 -
(18,234) - (4,203) -Items that may be reclassified subsequently to profit
or loss:Exchange differences on translating foreign
operations (Notes 4 and 16) (82,566) - 246,470 1Unrealized gains (losses) on available-for-sale
financial assets (Notes 4 and 16) (557,594) (2) 659,064 2Share of other comprehensive income (loss) of
subsidiaries and associates accounted for using the equity method (Notes 4, 11 and 16) 65,031 - (15,741) -
Income tax relating to item that may be reclassified subsequently to profit or loss (Notes 4, 16 and 18) 13,620 - (42,667) -
(561,509) (2) 847,126 3
Other comprehensive income (loss) for the year, net of income tax (579,743) (2) 842,923 3
TOTAL COMPREHENSIVE INCOME FOR THE YEAR $ 4,524,603 16 $ 5,750,571 22
(Continued)
-116-

ADVANTECH CO., LTD.
STATEMENTS OF COMPREHENSIVE INCOMEFOR THE YEARS ENDED DECEMBER 31, 2015 AND 2014(In Thousands of New Taiwan Dollars, Except Earnings Per Share)
2015 2014 (Restated)Amount % Amount %
EARNINGS PER SHARE (Note 19)Basic $8.08 $7.80Diluted $8.05 $7.77
The accompanying notes are an integral part of the financial statements.
(With Deloitte & Touche audit report dated March 4, 2016) (Concluded)
-117-

AD
VA
NT
EC
H C
O.,
LT
D.
STA
TE
ME
NT
S O
F C
HA
NG
ES
IN E
QU
ITY
FOR
TH
E Y
EA
RS
EN
DE
D D
EC
EMB
ER
31, 2
015
AN
D 2
014
(In
Tho
usan
ds o
f New
Tai
wan
Dol
lars
)
Oth
er E
quity
(Not
es 4
and
16)
Exc
hang
e U
nrea
lized
Gai
n Is
sued
Cap
ital (
Not
es 1
6 an
d 20
)R
etai
ned
Earn
ings
(Not
es 4
, 16
and
21)
Diff
eren
ces o
n (L
oss)
on
Adv
ance
Rec
eipt
s C
apita
l Sur
plus
U
napp
ropr
iate
d T
rans
latin
g A
vaila
ble-
for-
sale
Sh
are
Cap
ital
for
Shar
eC
apita
lT
otal
(Not
es 4
, 16
and
20)
Leg
al R
eser
veE
arni
ngs
Tot
alFo
reig
n O
pera
tions
Fina
ncia
l Ass
ets
Tot
al E
quity
BA
LAN
CE
AT
JAN
UA
RY
1, 2
014
$5,
669,
249
$24
,751
$5,
694,
000
$4,
995,
635
$3,
061,
424
$5,
452,
733
$8,
514,
157
$13
0,04
1$
(75,
534)
$19
,258
,299
Effe
ct o
f ret
rosp
ectiv
e ap
plic
atio
n an
d re
trosp
ectiv
e re
stat
emen
t-
--
--
(5,0
45)
(5,0
45)
--
(5,0
45)
BA
LAN
CE
AT
JAN
UA
RY
1, 2
014
AS
RES
TATE
D5,
669,
249
24,7
515,
694,
000
4,99
5,63
53,
061,
424
5,44
7,68
88,
509,
112
130,
041
(75,
534)
19,2
53,2
54
App
ropr
iatio
n of
the
2013
ear
rings
Lega
l res
erve
--
--
410,
640
(410
,640
)-
--
-C
ash
divi
dend
s dist
ribut
ed b
y th
e C
ompa
ny-
--
--
(3,0
17,8
20)
(3,0
17,8
20)
--
(3,0
17,8
20)
Shar
e di
vide
nds d
istri
bute
d by
the
Com
pany
569,
400
-56
9,40
0-
-(5
69,4
00)
(569
,400
)-
--
Issu
e of
ord
inar
y sh
ares
und
er e
mpl
oyee
shar
e op
tions
51,4
10(4
,850
)46
,560
167,
525
--
--
-21
4,08
5
Com
pens
atio
n co
st re
cogn
ized
for e
mpl
oyee
shar
e op
tions
--
-11
1,39
3-
--
--
111,
393
Cha
nge
in c
apita
l sur
plus
from
inve
stm
ents
in a
ssoc
iate
s-
--
8,96
6-
--
--
8,96
6
Con
verti
ble
bond
s con
verte
d to
ord
inar
y sh
ares
10,9
72(8
,841
)2,
131
13,8
55-
--
--
15,9
86
Diff
eren
ce b
etw
een
cons
ider
atio
ns a
nd c
arry
ing
amou
nts o
f sub
sidia
ries a
cqui
red
or
disp
osed
of
--
-11
,457
--
--
-11
,457
Cha
nges
in p
erce
ntag
e of
ow
ners
hip
inte
rest
in su
bsid
iarie
s-
--
(1,8
73)
--
--
-(1
,873
)
Net
pro
fit fo
r the
yea
r end
ed D
ecem
ber 3
1, 2
014
--
--
-4,
907,
648
4,90
7,64
8-
-4,
907,
648
Oth
er c
ompr
ehen
sive
inco
me
for t
he y
ear e
nded
Dec
embe
r 31,
201
4, n
et o
f inc
ome
tax
--
--
-(4
,203
)(4
,203
)20
8,31
563
8,81
184
2,92
3
Tota
l com
preh
ensi
ve in
com
e fo
r the
yea
r end
ed D
ecem
ber 3
1, 2
014
--
--
-4,
903,
445
4,90
3,44
520
8,31
563
8,81
15,
750,
571
BA
LAN
CE
AT
DEC
EMB
ER 3
1, 2
014
6,30
1,03
111
,060
6,31
2,09
15,
306,
958
3,47
2,06
46,
353,
273
9,82
5,33
733
8,35
656
3,27
722
,346
,019
App
ropr
iatio
n of
the
2014
ear
rings
Lega
l res
erve
--
--
490,
778
(490
,778
)-
--
-C
ash
divi
dend
s dist
ribut
ed b
y th
e C
ompa
ny-
--
--
(3,7
87,2
55)
(3,7
87,2
55)
--
(3,7
87,2
55)
Issu
e of
ord
inar
y sh
ares
und
er e
mpl
oyee
shar
e op
tions
17,5
00(1
1,06
0)6,
440
24,4
38-
--
--
30,8
78
Com
pens
atio
n co
st re
cogn
ized
for e
mpl
oyee
shar
e op
tions
--
-26
1,87
7-
--
--
261,
877
Cha
nge
in c
apita
l sur
plus
from
inve
stm
ents
in a
ssoc
iate
s-
--
2,17
2-
--
--
2,17
2
Diff
eren
ce b
etw
een
cons
ider
atio
ns a
nd c
arry
ing
amou
nts o
f sub
sidia
ries a
cqui
red
or
disp
osed
of
--
-(1
1,45
7)-
(62,
903)
(62,
903)
--
(74,
360)
Cha
nges
in p
erce
ntag
e of
ow
ners
hip
inte
rest
in su
bsid
iarie
s-
--
3,56
7-
--
--
3,56
7
Net
pro
fit fo
r the
yea
r end
ed D
ecem
ber 3
1, 2
015
--
--
-5,
104,
346
5,10
4,34
6-
-5,
104,
346
Oth
er c
ompr
ehen
sive
inco
me
for t
he y
ear e
nded
Dec
embe
r 31,
201
5, n
et o
f inc
ome
tax
--
--
-(1
8,23
4)(1
8,23
4)(6
6,49
7)(4
95,0
12)
(579
,743
)
Tota
l com
preh
ensi
ve in
com
e fo
r the
yea
r end
ed D
ecem
ber 3
1, 2
015
--
--
-5,
086,
112
5,08
6,11
2(6
6,49
7)(4
95,0
12)
4,52
4,60
3
BA
LAN
CE
AT
DEC
EMB
ER 3
1, 2
015
$6,
318,
531
$-
$6,
318,
531
$5,
587,
555
$3,
962,
842
$7,
098,
449
$11
,061
,291
$27
1,85
9$
68,2
65$
23,3
07,5
01
The
acco
mpa
nyin
g no
tes a
re a
n in
tegr
al p
art o
f the
fina
ncia
l sta
tem
ents.
(With
Del
oitte
& T
ouch
e au
dit r
epor
t dat
ed M
arch
4, 2
016)
-118-
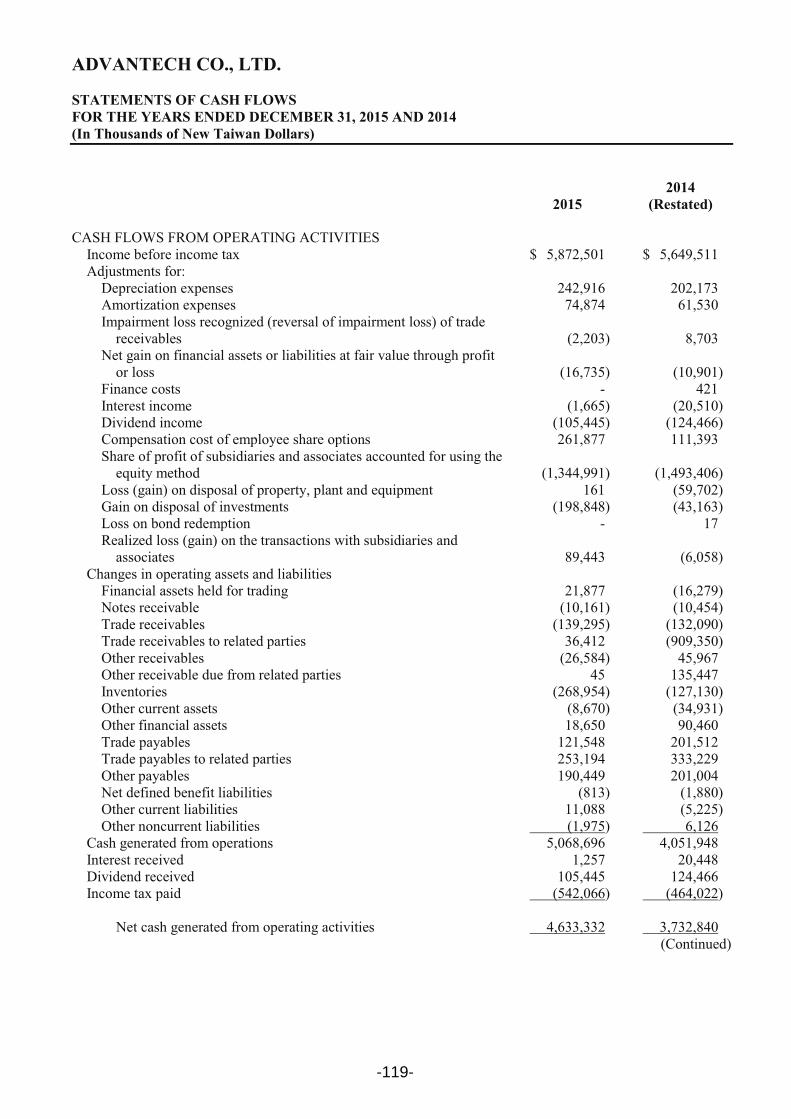
ADVANTECH CO., LTD.
STATEMENTS OF CASH FLOWSFOR THE YEARS ENDED DECEMBER 31, 2015 AND 2014(In Thousands of New Taiwan Dollars)
20152014
(Restated)
CASH FLOWS FROM OPERATING ACTIVITIESIncome before income tax $ 5,872,501 $ 5,649,511Adjustments for:
Depreciation expenses 242,916 202,173Amortization expenses 74,874 61,530Impairment loss recognized (reversal of impairment loss) of trade
receivables (2,203) 8,703Net gain on financial assets or liabilities at fair value through profit
or loss (16,735) (10,901)Finance costs - 421Interest income (1,665) (20,510)Dividend income (105,445) (124,466)Compensation cost of employee share options 261,877 111,393Share of profit of subsidiaries and associates accounted for using the
equity method (1,344,991) (1,493,406)Loss (gain) on disposal of property, plant and equipment 161 (59,702)Gain on disposal of investments (198,848) (43,163)Loss on bond redemption - 17Realized loss (gain) on the transactions with subsidiaries and
associates 89,443 (6,058)Changes in operating assets and liabilities
Financial assets held for trading 21,877 (16,279)Notes receivable (10,161) (10,454)Trade receivables (139,295) (132,090)Trade receivables to related parties 36,412 (909,350)Other receivables (26,584) 45,967Other receivable due from related parties 45 135,447Inventories (268,954) (127,130)Other current assets (8,670) (34,931)Other financial assets 18,650 90,460Trade payables 121,548 201,512Trade payables to related parties 253,194 333,229Other payables 190,449 201,004Net defined benefit liabilities (813) (1,880)Other current liabilities 11,088 (5,225)Other noncurrent liabilities (1,975) 6,126
Cash generated from operations 5,068,696 4,051,948Interest received 1,257 20,448Dividend received 105,445 124,466Income tax paid (542,066) (464,022)
Net cash generated from operating activities 4,633,332 3,732,840(Continued)
-119-

ADVANTECH CO., LTD.
STATEMENTS OF CASH FLOWSFOR THE YEARS ENDED DECEMBER 31, 2015 AND 2014(In Thousands of New Taiwan Dollars)
20152014
(Restated)
CASH FLOWS FROM INVESTING ACTIVITIESPurchase of available-for-sale financial assets $ (3,710,080) $ (3,423,628)Proceeds on sale of available-for-sale financial assets 5,754,213 3,284,544Acquisition of investments accounted for using equity method (688,577) (149,643)Proceeds from disposal of investments accounted for using the equity
method - 51,175Prepayment for investments (1,968,044) -Proceeds of the capital reduction of investments accounted for using
the equity method 42,927 -Payments for property, plant and equipment (1,181,375) (875,370)Proceeds from disposal of property, plant and equipment 294 127,362Decrease in refundable deposits 187 15,009Payments for intangible assets (62,714) (47,706)Proceeds from disposal of intangible assets 31 -Net cash outflows from business combination - (296,297)Decrease (increase) in prepayments for equipment 14,609 (87,760)Dividends received from subsidiaries and associates 687,589 489,682
Net cash used in investing activities (1,110,940) (912,632)
CASH FLOWS FROM FINANCING ACTIVITIESRepayment of bond payables - (2,400)Decrease (increase) in guarantee deposits received (119) 119Cash dividends paid (3,787,255) (3,017,820)Exercise of employee share options 30,878 214,085
Net cash used in financing activities (3,756,496) (2,806,016)
NET INCREASE (DECREASE) IN CASH AND CASH EQUIVALENTS (234,104) 14,192
CASH AND CASH EQUIVALENTS AT THE BEGINNING OF THE YEAR 1,049,397 1,035,205
CASH AND CASH EQUIVALENTS AT THE END OF THE YEAR $ 815,293 $ 1,049,397
The accompanying notes are an integral part of the financial statements.
(With Deloitte & Touche audit report dated March 4, 2016) (Concluded)
-120-

ADVANTECH CO., LTD.
NOTES TO FINANCIAL STATEMENTSFOR THE YEARS ENDED DECEMBER 31, 2015 AND 2014(In Thousands of New Taiwan Dollars, Unless Stated Otherwise)
1. GENERAL INFORMATION
Advantech Co., Ltd. (the “Company”) is a listed company established in September 1981. It manufactures and sells embedded computing boards, industrial automation products, applied computers and industrial computers.
The Company’s shares have been listed on the Taiwan Stock Exchange since December 1999.
To improve the entire operating efficiency of Advantech Co., Ltd. (the “Company”) and its subsidiaries, the Company’s board of directors resolved on June 30, 2009 to have a short-form merger with Advantech Investment and Management Service (AIMS). The effective merger date was July 30, 2009. As the survivor entity, the Company assumed all assets and liabilities of AIMS.
On June 26, 2014, the Company’s board of directors resolved to have a whale-minnow merger with Netstar Technology Co., Ltd. (“Netstar”) an indirect 95.51%-owned subsidiary through a wholly-owned subsidiary, Advantech Corporate Investment. The effective merger date was July 27, 2014. As the survivor entity, the Company assumed all assets and liabilities of Netstar.
The functional currency of the Company is the New Taiwan dollar.
2. APPROVAL OF FINANCIAL STATEMENTS
The financial statements were approved by the board of directors on March 4, 2016.
3. APPLICATION OF NEW AND REVISED STANDARDS AND INTERPRETATIONS
a. Initial applications of the amendments to the Regulations Governing the Preparation of Financial Reports by Securities Issuers and the 2013 version of the International Financial Reporting Standards (IFRS), International Accounting Standards (IAS), Interpretations of IFRS (IFRIC), and Interpretations of IAS (SIC) endorsed by the FSC
Rule No. 1030029342 and Rule No. 1030010325 issued by the FSC on April 3, 2014, stipulated that the Company should apply the 2013 version of IFRS, IAS, IFRIC and SIC (collectively, the “IFRSs”) endorsed by the FSC and the related amendments to the Regulations Governing the Preparation of Financial Reports by Securities Issuers starting January 1, 2015.
Except for the following, applied, the initial application of the amendments to the Regulations Governing the Preparation of Financial Reports by Securities Issuers and the 2013 IFRSs version would not have any material impact on the Company’s accounting policies:
1) IFRS 12 “Disclosure of Interests in Other Entities”
IFRS 12 is a new disclosure standard and is applicable to entities that have interests in subsidiaries, associates and unconsolidated structured entities. In general, the disclosure requirements in IFRS 12 are more extensive, please refer to Note 11 for related disclosures.
-121-
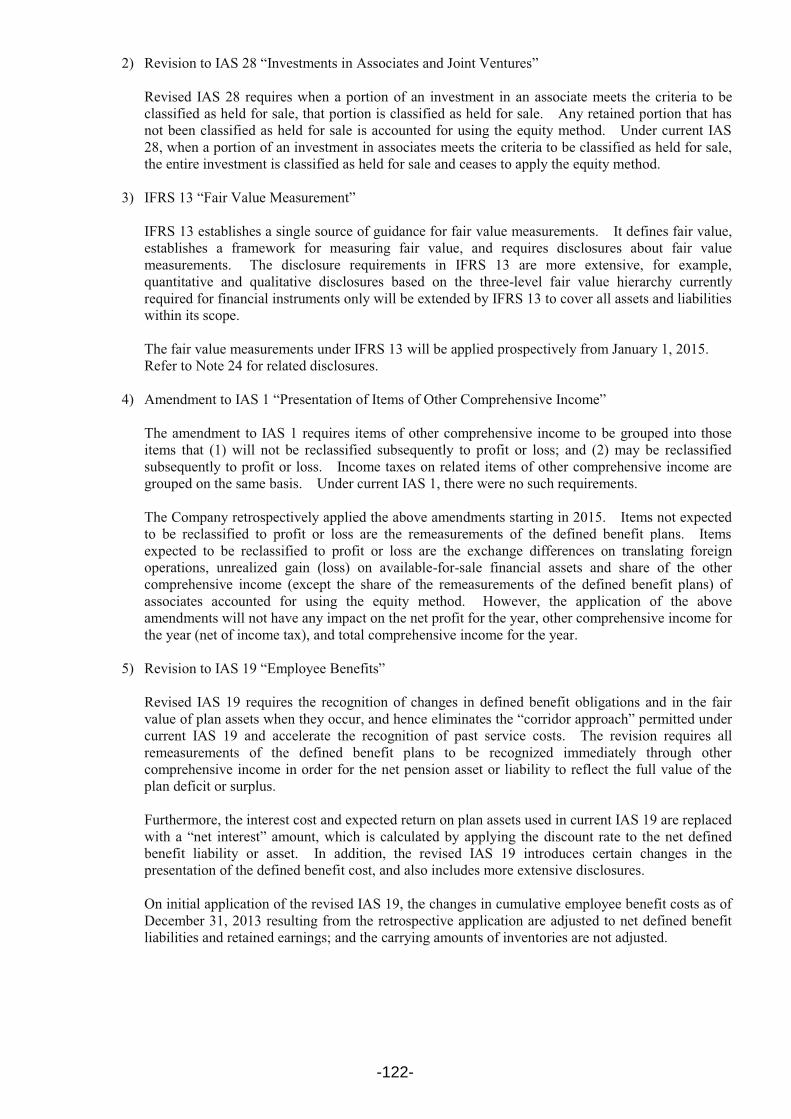
2) Revision to IAS 28 “Investments in Associates and Joint Ventures”
Revised IAS 28 requires when a portion of an investment in an associate meets the criteria to be classified as held for sale, that portion is classified as held for sale. Any retained portion that has not been classified as held for sale is accounted for using the equity method. Under current IAS 28, when a portion of an investment in associates meets the criteria to be classified as held for sale, the entire investment is classified as held for sale and ceases to apply the equity method.
3) IFRS 13 “Fair Value Measurement”
IFRS 13 establishes a single source of guidance for fair value measurements. It defines fair value, establishes a framework for measuring fair value, and requires disclosures about fair value measurements. The disclosure requirements in IFRS 13 are more extensive, for example, quantitative and qualitative disclosures based on the three-level fair value hierarchy currently required for financial instruments only will be extended by IFRS 13 to cover all assets and liabilities within its scope.
The fair value measurements under IFRS 13 will be applied prospectively from January 1, 2015.Refer to Note 24 for related disclosures.
4) Amendment to IAS 1 “Presentation of Items of Other Comprehensive Income”
The amendment to IAS 1 requires items of other comprehensive income to be grouped into those items that (1) will not be reclassified subsequently to profit or loss; and (2) may be reclassified subsequently to profit or loss. Income taxes on related items of other comprehensive income are grouped on the same basis. Under current IAS 1, there were no such requirements.
The Company retrospectively applied the above amendments starting in 2015. Items not expected to be reclassified to profit or loss are the remeasurements of the defined benefit plans. Items expected to be reclassified to profit or loss are the exchange differences on translating foreign operations, unrealized gain (loss) on available-for-sale financial assets and share of the other comprehensive income (except the share of the remeasurements of the defined benefit plans) of associates accounted for using the equity method. However, the application of the above amendments will not have any impact on the net profit for the year, other comprehensive income for the year (net of income tax), and total comprehensive income for the year.
5) Revision to IAS 19 “Employee Benefits”
Revised IAS 19 requires the recognition of changes in defined benefit obligations and in the fair value of plan assets when they occur, and hence eliminates the “corridor approach” permitted under current IAS 19 and accelerate the recognition of past service costs. The revision requires all remeasurements of the defined benefit plans to be recognized immediately through other comprehensive income in order for the net pension asset or liability to reflect the full value of the plan deficit or surplus.
Furthermore, the interest cost and expected return on plan assets used in current IAS 19 are replaced with a “net interest” amount, which is calculated by applying the discount rate to the net defined benefit liability or asset. In addition, the revised IAS 19 introduces certain changes in the presentation of the defined benefit cost, and also includes more extensive disclosures.
On initial application of the revised IAS 19, the changes in cumulative employee benefit costs as of December 31, 2013 resulting from the retrospective application are adjusted to net defined benefit liabilities and retained earnings; and the carrying amounts of inventories are not adjusted.
-122-

The impact on the current period is set out below:
Impact on Assets, Liabilities and EquityDecember 31,
2015
Decrease in net defined benefit liabilities $ (376)Increase in retained earnings $ 376
Decrease in operating expense $ (376)Increase in income tax expense 64
Decrease in net profit for the year $ (312)
Decrease in total comprehensive income for the year $ (312)
Impact on earnings per share:Increase in basic earnings per share $ -Increase in diluted earnings per share $ -
The impact in the prior year is set out below:
Impact on Assets, Liabilities and Equity
As Originally Stated
Adjustments Arising from
Initial Application Restated
December 31, 2014
Net defined benefit liabilities $ 159,204 $ 5,045 $ 164,249Retained earnings $ 6,358,318 $ (5,045) $ 6,353,273
January 1, 2014
Net defined benefit liabilities $ 154,184 $ 5,045 $ 159,229Retained earnings $ 5,452,733 $ (5,045) $ 5,447,688
Impact on Total Comprehensive Income
As Originally Stated
Adjustments Arising from
Initial Application Restated
For the year ended December 31, 2014
Operating expense $ (3,720,146) $ (161) $ (3,720,307)Income tax expense (741,890) 27 (714,863)Total effect on net profit for the year 4,907,782 (134) 4,907,648
(Continued)
-123-

Impact on Total Comprehensive Income
As Originally Stated
Adjustments Arising from
Initial Application Restated
Items that will not be reclassified to profit or loss:Remeasurements of defined benefit
plan $ (5,150) $ 161 $ (4,989)Income tax relating to items that will
not be reclassified 875 (27) 848Total effect on other comprehensive
income for the year, net of income tax 842,789 134 842,923
Total effect on total comprehensive income for the year $ 5,750,571 $ - $ 5,750,571
Impact on earnings per share:For the year ended December 31, 2015
Basic $ 7.80 $ - $ 7.80Diluted $ 7.77 $ - $ 7.77
(Concluded)
6) Amendments to IFRS 7 “Disclosure - Offsetting Financial Assets and Financial Liabilities”
The amendments to IFRS 7 require disclosure of information about rights of offset and related arrangements (such as collateral posting requirements) for financial instruments under enforceable master netting arrangements and similar arrangements.
Annual Improvements to IFRSs: 2009-2011 Cycle on IAS 1 “Presentation of Financial Statements”.
The amendments to IAS 1 clarify that an entity is required to present a balance sheet as at the beginning of the preceding period when a) it applies an accounting policy retrospectively, or makes a retrospective restatement or reclassifies items in its financial statements, and b) the retrospective application, restatement or reclassification has a material effect on the information in the balance sheet at the beginning of the preceding period. The amendments also clarify that related notes are not required to accompany the balance sheet at the beginning of the preceding period.
b. New IFRSs in issue but not yet endorsed by FSC
The Company has not applied the following New IFRSs issued by the IASB but not yet endorsed by the FSC. As of the date the financial statements were authorized for issue, the FSC has not announced their effective dates.
New IFRSsEffective Date
Announced by IASB (Note 1)
Annual Improvements to IFRSs 2010-2012 Cycle July 1, 2014 (Note 2)Annual Improvements to IFRSs 2011-2013 Cycle July 1, 2014Annual Improvements to IFRSs 2012-2014 Cycle January 1, 2016 (Note 3)IFRS 9 “Financial Instruments” January 1, 2018
(Continued)
-124-

New IFRSsEffective Date
Announced by IASB (Note 1)
Amendments to IFRS 9 and IFRS 7 “Mandatory Effective Date of IFRS 9 and Transition Disclosures”
January 1, 2018
Amendments to IFRS 10 and IAS 28 “Sale or Contribution of Assets between an Investor and its Associate or Joint Venture”
To be determined by IASB
Amendments to IFRS 10, IFRS 12 and IAS 28 “Investment Entities: Applying the Consolidation Exception”
January 1, 2016
Amendment to IFRS 11 “Accounting for Acquisitions of Interests in Joint Operations”
January 1, 2016
IFRS 14 “Regulatory Deferral Accounts” January 1, 2016IFRS 15 “Revenue from Contracts with Customers” January 1, 2018IFRS 16 “Leases” January 1, 2019Amendment to IAS 1 “Disclosure Initiative” January 1, 2016Amendment to IAS 7 “Disclosure Initiative” January 1, 2017Amendments to IAS 12 “Recognition of Deferred Tax Asset
for Unrealized Losses”January 1, 2017
Amendments to IAS 16 and IAS 38 “Clarification of Acceptable Methods of Depreciation and Amortization”
January 1, 2016
Amendments to IAS 16 and IAS 41 “Agriculture: Bearer Plants”
January 1, 2016
Amendment to IAS 19 “Defined Benefit Plans: Employee Contributions”
July 1, 2014
Amendment to IAS 27 “Equity Method in Separate Financial Statements”
January 1, 2016
Amendment to IAS 36 “Impairment of Assets: Recoverable Amount Disclosures for Non-financial Assets”
January 1, 2014
Amendment to IAS 39 “Novation of Derivatives and Continuation of Hedge Accounting”
January 1, 2014
IFRIC 21 “Levies” January 1, 2014(Concluded)
Note 1: Unless stated otherwise, the above New IFRSs are effective for annual periods beginning on or after their respective effective dates.
Note 2: The amendment to IFRS 2 applies to share-based payment transactions with grant date on or after July 1, 2014; the amendment to IFRS 3 applies to business combinations with acquisition date on or after July 1, 2014; the amendment to IFRS 13 is effective immediately; the remaining amendments are effective for annual periods beginning on or after July 1, 2014.
Note 3: The amendment to IFRS 5 is applied prospectively to changes in a method of disposal that occur in annual periods beginning on or after January 1, 2016; the remaining amendments are effective for annual periods beginning on or after January 1, 2016.
-125-

The initial application of the above New IFRSs, whenever applied, would not have any material impact on the Company’s accounting policies, except for the following:
1) IFRS 9 “Financial Instruments”
Recognition and measurement of financial assets
With regards to financial assets, all recognized financial assets that are within the scope of IAS 39 “Financial Instruments: Recognition and Measurement” are subsequently measured at amortized cost or fair value. Under IFRS 9, the requirement for the classification of financial assets is stated below.
For the Company’s debt instruments that have contractual cash flows that are solely payments of principal and interest on the principal amount outstanding, their classification and measurement are as follows:
a) For debt instruments, if they are held within a business model whose objective is to collect the contractual cash flows, the financial assets are measured at amortized cost and are assessed for impairment continuously with impairment loss recognized in profit or loss, if any. Interest revenue is recognized in profit or loss by using the effective interest method;
b) For debt instruments, if they are held within a business model whose objective is achieved by both the collecting of contractual cash flows and the selling of financial assets, the financial assets are measured at fair value through other comprehensive income (FVTOCI) and are assessed for impairment. Interest revenue is recognized in profit or loss by using the effective interest method, and other gain or loss shall be recognized in other comprehensive income, except for impairment gains or losses and foreign exchange gains and losses. When the debt instruments are derecognized or reclassified the cumulative gain or loss previously recognized in other comprehensive income is reclassified from equity to profit or loss.
Except for above, all other financial assets are measured at fair value through in profit or loss. However, the Company may make an irrevocable election to present subsequent changes in the fairvalue of an equity investment (that is not held for trading) in other comprehensive income, with only dividend income generally recognized in profit or loss. No subsequent impairment assessment is required, and the cumulative gain or loss previously recognized in other comprehensive income cannot be reclassified from equity to profit or loss.
The impairment of financial assets
IFRS 9 requires that impairment loss on financial assets is recognized by using the “Expected Credit Losses Model”. The credit loss allowance is required for financial assets measured at amortized cost, financial assets mandatorily measured at FVTOCI, lease receivables, contract assets arising from IFRS 15 “Revenue from Contracts with Customers”, certain written loan commitments and financial guarantee contracts. A loss allowance for the 12-month expected credit losses is required for a financial asset if its credit risk has not increased significantly since initial recognition. A loss allowance for full lifetime expected credit losses is required for a financial asset if its credit risk has increased significantly since initial recognition and is not low. However, a loss allowance for full lifetime expected credit losses is required for trade receivables that do not constitute a financing transaction.
For purchased or originated credit-impaired financial assets, the Company takes into account the expected credit losses on initial recognition in calculating the credit-adjusted effective interest rate. Subsequently, any changes in expected losses are recognized as a loss allowance with a corresponding gain or loss recognized in profit or loss.
-126-
2) Amendment to IAS 36 “Recoverable Amount Disclosures for Non-financial Assets”
In issuing IFRS 13 “Fair Value Measurement”, the IASB made consequential amendment to the disclosure requirements in IAS 36 “Impairment of Assets”, introducing a requirement to disclose in every reporting period the recoverable amount of an asset or each cash-generating unit. The amendment clarifies that such disclosure of recoverable amounts is required only when an impairment loss has been recognized or reversed during the period. Furthermore, the Company is required to disclose the discount rate used in measurements of the recoverable amount based on fair value less costs of disposal measured using a present value technique.
3) IFRIC 21 “Levies”
IFRIC 21 provides guidance on when to recognize a liability for a levy imposed by a government. It addresses the accounting for a liability whose timing and amount is certain and the accounting for a provision whose timing or amount is not certain. The Company accrues related liability when the transaction or activity that triggers the payment of the levy occurs. Therefore, if the obligating event occurs over a period of time (such as generation of revenue over a period of time), the liability is recognized progressively. If an obligation to pay a levy is triggered upon reaching a minimum threshold (such as a minimum amount of revenue or sales generated), the liability is recognized when that minimum threshold is reached.
4) Annual Improvements to IFRSs: 2010-2012 Cycle
Several standards including IFRS 2 “Share-based Payment”, IFRS 3 “Business Combinations” and IFRS 8 “Operating Segments” were amended in this annual improvement.
The amended IFRS 2 changes the definitions of “vesting condition” and “market condition” and adds definitions for “performance condition” and “service condition”. The amendment clarifies that a performance target can be based on the operations (i.e. a non-market condition) of the Company or another entity in the same group or the market price of the equity instruments of the Company or another entity in the same group (i.e. a market condition); that a performance target can relate either to the performance of the Company as a whole or to some part of it (e.g. a division); and that the period for achieving a performance condition must not extend beyond the end of the related service period. In addition, a share market index target is not a performance condition because it not only reflects the performance of the Company, but also of other entities outside the Company.
IFRS 3 was amended to clarify that contingent consideration should be measured at fair value, irrespective of whether the contingent consideration is a financial instrument within the scope of IFRS 9 or IAS 39. Changes in fair value should be recognized in profit or loss.
IFRS 13 was amended to clarify that the issuance of IFRS 13 did not remove the ability to measure short-term receivables and payables with no stated interest rate at their invoice amounts without discounting, if the effect of not discounting is immaterial.
IAS 24 was amended to clarify that a management entity providing key management personnel services to the Company is a related party of the Company. Consequently, the Company is required to disclose as related party transactions the amounts incurred for the service paid or payable to the management entity for the provision of key management personnel services. However, disclosure of the components of such compensation is not required.
5) Annual Improvements to IFRSs: 2011-2013 Cycle
Several standards including IFRS 3 and IFRS 13 were amended in this annual improvement.
-127-
IFRS 3 was amended to clarify that IFRS 3 does not apply to the accounting for the formation of all types of joint arrangements in the financial statements of the joint arrangement itself.
The scope in IFRS 13 of the portfolio exception for measuring the fair value of a group of financial assets and financial liabilities on a net basis was amended to clarify that it includes all contracts that are within the scope of, and accounted for in accordance with, IAS 39 or IFRS 9, even if those contracts do not meet the definitions of financial assets or financial liabilities within IAS 32.
6) Amendments to IAS 16 and IAS 38 “Clarification of Acceptable Methods of Depreciation and Amortization”
The entity should use appropriate depreciation and amortization method to reflect the pattern in which the future economic benefits of the property, plant and equipment and intangible asset are expected to be consumed by the entity.
The amended IAS 16 “Property, Plant and Equipment” requires that a depreciation method that is based on revenue that is generated by an activity that includes the use of an asset is not appropriate. The amended standard does not provide any exception from this requirement.
The amended IAS 38 “Intangible Assets” requires that there is a rebuttable presumption that an amortization method that is based on revenue that is generated by an activity that includes the use of an intangible asset is not appropriate. This presumption can be overcome only in the following limited circumstances:
a) In which the intangible asset is expressed as a measure of revenue (for example, the contract that specifies the entity’s use of the intangible asset will expire upon achievement of a revenue threshold); or
b) When it can be demonstrated that revenue and the consumption of the economic benefits of the intangible asset are highly correlated.
An entity should apply the aforementioned amendments prospectively for annual periods beginning on or after the effective date.
7) IFRS 15 “Revenue from Contracts with Customers”
IFRS 15 establishes principles for recognizing revenue that apply to all contracts with customers, and will supersedes IAS 18 “Revenue”, IAS 11 “Construction Contracts” and a number of revenue-related interpretations from January 1, 2017.
When applying IFRS 15, an entity shall recognize revenue by applying the following steps:
� Identify the contract with the customer;� Identify the performance obligations in the contract;� Determine the transaction price;� Allocate the transaction price to the performance obligations in the contracts; and� Recognize revenue when the entity satisfies a performance obligation.
When IFRS 15 is effective, an entity may elect to apply this Standard either retrospectively to each prior reporting period presented or retrospectively with the cumulative effect of initially applying this Standard recognized at the date of initial application.
-128-
8) Amendments to IFRS 10 and IAS 28 “Sale or Contribution of Assets between an Investor and its Associate or Joint Venture”
The amendments stipulated that, when an entity sells or contributes assets that constitute a business (as defined in IFRS 3) to an associate, the gain or loss resulting from the transaction is recognized in full. Also, when an entity loses control of a subsidiary that contains a business but retains significant influence or joint control, the gain or loss resulting from the transaction is recognized in full.
Conversely, when an entity sells or contributes assets that do not constitute a business to an associate, the gain or loss resulting from the transaction is recognized only to the extent of the unrelated investors’ interest in the associate, i.e. the entity’s share of the gain or loss is eliminated. Also, when an entity loses control of a subsidiary that does not contain a business but retains significant influence in an associate, the gain or loss resulting from the transaction is recognized only to the extent of the unrelated investors’ interest in the associate, i.e. the entity’s share of the gain or loss is eliminated.
9) IFRS 16 “Leases”
IFRS 16 sets out the accounting standards for leases that will supersede IAS 17 and a number of related interpretations.
Under IFRS 16, if the Company is a lessee, it shall recognize right-of-use assets and lease liabilities for all leases on the balance sheets except for low-value and short-term lease. The Company may elect to apply the accounting method similar to the accounting for operating lease under IAS 17 to the low-value and short-term leases. On the statements of comprehensive income, the Company should present the depreciation expense charged on the right-of-use asset separately from interest expense accrued on the lease liability; interest is computed by using effective interest method. On the statements of cash flows, cash payments for the principal portion of the lease liability are classified within financing activities; cash payments for interest portion are classified within operating activities.
The application of IFRS 16 is not expected to have a material impact on the accounting of the Company as lessor.
When IFRS 16 becomes effective, the Company may elect to apply this Standard either retrospectively to each prior reporting period presented or retrospectively with the cumulative effect of the initial application of this Standard recognized at the date of initial application.
10) Amendments to IAS 12 “Recognition of Deferred Tax Assets for Unrealized Losses”
In determining whether to recognize a deferred tax asset, the Company should assess a deductible temporary difference in combination with all of its other deductible temporary differences, unless the tax law restricts the utilization of losses to deduction against income of a specific type, in which case, a deductible temporary difference is assessed in combination only with other deductible temporary differences of the appropriate type. The amendment also stipulates that, when determining whether to recognize a deferred tax asset, the estimate of probable future taxable profit may include some of the Company’s assets for more than their carrying amount if there is sufficient evidence that it is probable that the Company will achieve this, and that the estimate for future taxable profit should exclude tax deductions resulting from the reversal of deductible temporary differences.
Except for the above impact, as of the date the financial statements were authorized for issue, the Company is continuously assessing the possible impact that the application of other standards and interpretations will have on the Company’s financial position and financial performance, and will disclose the relevant impact when the assessment is completed.
-129-

4. SUMMARY OF SIGNIFICANT ACCOUNTING POLICIES
a. Statement of compliance
The parent company only financial statements have been prepared in accordance with the Regulations Governing the Preparation of Financial Reports by Securities Issuers.
b. Basis of preparation
The financial statements have been prepared on the historical cost basis except for financial instruments that are measured at fair values.
The fair value measurements are grouped into Levels 1 to 3 based on the degree to which the fair value measurement inputs are observable and the significance of the inputs to the fair value measurement in its entirety, which are described as follows:
1) Level 1 inputs are quoted prices (unadjusted) in active markets for identical assets or liabilities;
2) Level 2 inputs are inputs other than quoted prices included within Level 1 that are observable for the asset or liability, either directly (i.e. as prices) or indirectly (i.e. derived from prices); and
3) Level 3 inputs are unobservable inputs for the asset or liability.
When preparing its parent company only financial statements, the Company used equity method to account for its investment in subsidiaries and associates. In order for the amounts of the net profit for the year, other comprehensive income for the year and total equity in the parent company only financial statements to be the same with the amounts attributable to the owner of the Company in its consolidated financial statements, adjustments arising from the differences in accounting treatment between parent company only basis and consolidated basis were made to investments accounted for by equity method, share of profit or loss of subsidiaries and associates, share of other comprehensive income of subsidiaries and associates and related equity items, as appropriate, in the parent company only financial statements.
c. Classification of current and non-current assets and liabilities
Current assets include:
1) Assets held primarily for the purpose of trading;
2) Assets expected to be realized within twelve months after the reporting period; and
3) Cash and cash equivalents unless the asset is restricted from being exchanged or used to settle a liability for at least twelve months after the reporting period.
Current liabilities include:
1) Liabilities held primarily for the purpose of trading;
2) Liabilities due to be settled within twelve months after the reporting period, even if an agreement to refinance, or to reschedule payments, on a long-term basis is completed after the reporting period and before the financial statements are authorized for issue; and
3) Liabilities for which the Company does not have an unconditional right to defer settlement for at least twelve months after the reporting period. Terms of a liability that could, at the option of the counterparty, result in its settlement by the issue of equity instruments do not affect its classification.
-130-

Assets and liabilities that are not classified as current are classified as non-current.
d. Business combinations
Acquisitions of businesses are accounted for using the acquisition method. Acquisition-related costs are generally recognized in profit or loss as incurred.
Goodwill is measured as the excess of the sum of the consideration transferred, the amount of any non-controlling interests in the acquiree, and the fair value of the acquirer’s previously held equity interest in the acquiree over the net of the acquisition-date amounts of the identifiable assets acquired and the liabilities assumed.
e. Foreign currencies
In preparing the financial statements of each individual group entity, transactions in currencies other than the Company’s functional currency (foreign currencies) are recognized at the rates of exchange prevailing at the dates of the transactions.
At the end of each reporting period, monetary items denominated in foreign currencies are retranslated at the rates prevailing at that date. Exchange differences on monetary items arising from settlement or translation are recognized in profit or loss in the period in which they arise.
Non-monetary items measured at fair value that are denominated in foreign currencies are retranslated at the rates prevailing at the date when the fair value was determined. Exchange differences arising on the retranslation of non-monetary items are included in profit or loss for the period except for exchange differences arising from the retranslation of non-monetary items in respect of which gains and losses are recognized directly in other comprehensive income, in which case, the exchange differences are also recognized directly in other comprehensive income.
Non-monetary items that are measured at historical cost in a foreign currency are not retranslated.
For the purpose of presenting financial statements, the assets and liabilities of the Company’s foreign operations (including of the subsidiaries and associates in other countries or currencies used different with the Company) are translated into New Taiwan dollars using exchange rates prevailing at the end of each reporting period. Income and expense items are translated at the average exchange rates for the period. Exchange differences arising are recognized in other comprehensive income.
f. Inventories
Inventories consist of raw materials, supplies, finished goods and work-in-process and are stated at the lower of cost or net realizable value. Inventory write-downs are made by item, except where it may be appropriate to group similar or related items. Net realizable value is the estimated selling price of inventories less all estimated costs of completion and costs necessary to make the sale. Inventories are recorded at weighted-average cost on the balance sheet date.
g. Investment in subsidiaries
The Company uses the equity method to account for its investments in subsidiaries.
Subsidiaries are the entities (including structured entities) controlled by the Company.
Under the equity method, investment in a subsidiary is initially recognized at cost and adjusted thereafter to recognize the Company’s share of the profit or loss and other comprehensive income of the subsidiary. The Company also recognizes the changes in the Company’s share of other equity of the subsidiaries.
-131-
Changes in the Company’s ownership interests in subsidiaries that do not result in the Company losing control of the subsidiaries are equity transactions. The Company recognizes directly in equity any difference between the carrying amount of the investment and the fair value of the consideration paid or received.
When the Company’s share of losses of a subsidiary equals or exceeds its interest in that subsidiary (which includes any carrying amount of the investment accounted for by the equity method and long-term interests that, in substance, form part of the Company’s net investment in the subsidiary), the Company continues recognizing its share of further losses.
Any excess of the cost of acquisition over the Company’s share of the net fair value of the identifiable assets and liabilities of a subsidiary at the date of acquisition is recognized as goodwill, which is included within the carrying amount of the investment and is not amortized. Any excess of the Company’s share of the net fair value of the identifiable assets and liabilities over the cost of acquisition is recognized immediately in profit or loss.
The Company assesses its investment for any impairment by comparing the carrying amount with theestimated recoverable amount as assessed based on the entire financial statements of the invested company. Impairment loss is recognized when the carrying amount exceeds the recoverable amount. If the recoverable amount of the investment subsequently increases, the Company recognizes reversal of the impairment loss; the adjusted post-reversal carrying amount should not exceed the carrying amount that would have been recognized (net of amortization or depreciation) had no impairment loss been recognized in prior years. An impairment loss recognized on goodwill cannot be reversed in a subsequent period.
When the Company loses control of a subsidiary, it recognizes the investment retained in the former subsidiary at its fair value at the date when control is lost. The difference between the fair value of the retained investment plus any consideration received and the carrying amount of previous investment at the date when control is lost is recognized as a gain or loss in profit or loss. Besides, the Company accounts for all amounts previously recognized in other comprehensive income in relation to that subsidiary on the same basis as would be required if the Company had directly disposed of the related assets or liabilities.
Profits and losses resulting from downstream transactions with a subsidiary are eliminated in full. Profits and losses resulting from upstream with a subsidiary and sidestream transactions between subsidiaries are recognized in the financial statements only to the extent of interests in the subsidiary that are not related to the Company.
h. Investment in associates
An associate is an entity over which the Company has significant influence and that is not a subsidiary.
The Company uses the equity method to account for its investment in associates.
Under the equity method, an investment in an associate is initially recognized at cost and adjusted thereafter to recognize the Company’s share of the profit or loss and other comprehensive income of the associate. The Company also recognizes the changes in the Company’s share of equity of associates attributable to the Company.
Any excess of the cost of acquisition over the Company’s share of the net fair value of the identifiable assets and liabilities of an associate at the date of acquisition is recognized as goodwill, which is included within the carrying amount of the investment and is not amortized. Any excess of the Company’s share of the net fair value of the identifiable assets and liabilities over the cost of acquisition, after reassessment, is recognized immediately in profit or loss.
-132-

When the Company subscribes for additional new shares of the associate at a percentage different from its existing ownership percentage, the resulting carrying amount of the investment differs from the amount of the Company’s proportionate interest in the associate. The Company records such a difference as an adjustment to investments with the corresponding amount charged or credited to capital surplus. If the Company’s ownership interest is reduced due to the additional subscription of the new shares of associate, the proportionate amount of the gains or losses previously recognized in other comprehensive income in relation to that associate is reclassified to profit or loss on the same basis as would be required if the investee had directly disposed of the related assets or liabilities. When the adjustment should be debited to capital surplus, but the capital surplus recognized from investments accounted for by the equity method is insufficient, the shortage is debited to retained earnings.
When the Company’s share of losses of an associate equals or exceeds its interest in that associate (which includes any carrying amount of the investment accounted for by the equity method and long-term interests that, in substance, form part of the Company’s net investment in the associate), the Company discontinues recognizing its share of further losses. Additional losses and liabilities are recognized only to the extent that the Company has incurred legal obligations, or constructive obligations, or made payments on behalf of that associate.
The entire carrying amount of the investment (including goodwill) is tested for impairment as a single asset by comparing its recoverable amount with its carrying amount. Any impairment loss recognized forms part of the carrying amount of the investment. Any reversal of that impairment loss is recognized to the extent that the recoverable amount of the investment subsequently increases.
The Company discontinues the use of the equity method from the date on which its investment ceases to be an associate. Any retained investment is measured at fair value at that date and the fair value is regarded as its fair value on initial recognition as a financial asset. The difference between the previous carrying amount of the associate attributable to the retained interest and its fair value is included in the determination of the gain or loss on disposal of the associate. The Company accounts for all amounts previously recognized in other comprehensive income in relation to that associate on the same basis as would be required if that associate had directly disposed of the related assets or liabilities.
When the group-entity transacts with its associate, profits and losses resulting from the transactions with the associate are recognized in the financial statements only to the extent of interests in the associate that are not related to the Company.
i. Property, plant and equipment
Property, plant and equipment are stated at cost, less subsequent accumulated depreciation and subsequent accumulated impairment loss.
Property, plant and equipment in the course of construction are carried at cost, less any recognized impairment loss. Cost includes professional fees and borrowing costs eligible for capitalization. Such assets are depreciated and classified to the appropriate categories of property, plant and equipment when completed and ready for intended use.
Freehold land is not depreciated.
Depreciation on properties, plant and equipment is recognized using the straight-line method. Each significant part is depreciated separately. The estimated useful lives, residual values and depreciation method are reviewed at the end of each reporting period, with the effect of any changes in estimate accounted for on a prospective basis.
On derecognition of an item of property, plant and equipment, the difference between the sales proceeds and the carrying amount of the asset and is recognized in profit or loss.
-133-

j. Goodwill
Goodwill arising from the acquisition of a business is carried at cost as established at the date of acquisition of the business less accumulated impairment loss.
For the purposes of impairment testing, goodwill is allocated to each of the Company’s cash-generating units or groups of cash-generating units (referred to as cash-generating units) that is expected to benefit from the synergies of the combination.
A cash-generating unit to which goodwill has been allocated is tested for impairment annually, or more frequently when there is an indication that the unit may be impaired, by comparing its carrying amount, including the attributed goodwill, with its recoverable amount. However, if the goodwill allocated to a cash-generating unit was acquired in a business combination during the current annual period, that unit shall be tested for impairment before the end of the current annual period. If the recoverable amount of the cash-generating unit is less than its carrying amount, the impairment loss is allocated first to reduce the carrying amount of any goodwill allocated to the unit and then to the other assets of the unit pro rata based on the carrying amount of each asset in the unit. Any impairment loss is recognized directly in profit or loss. An impairment loss recognized for goodwill is not reversed in subsequent periods.
If goodwill has been allocated to a cash-generating unit and the Company disposes of an operation within that unit, the goodwill associated with the operation disposed of is included in the carrying amount of the operation when determining the gain or loss on disposal
k. Intangible assets
1) Intangible assets acquired separately
Intangible assets with finite useful lives that are acquired separately are initially measured at cost and subsequently measured at cost less accumulated amortization and accumulated impairment loss. Amortization is recognized on a straight-line basis. The estimated useful life, residual value, and amortization method are reviewed at the end of each reporting period, with the effect of any changes in estimate accounted for on a prospective basis.
2) Derecognition of intangible assets
On derecognition of an intangible asset, the difference between the net disposal proceeds and the carrying amount of the asset are recognized in profit or loss.
l. Impairment of tangible and intangible assets other than goodwill
At the end of each reporting period, the Company reviews the carrying amounts of its tangible and intangible assets, excluding goodwill, to determine whether there is any indication that those assets have suffered an impairment loss. If any such indication exists, the recoverable amount of the asset is estimated in order to determine the extent of the impairment loss. When it is not possible to estimate the recoverable amount of an individual asset, the Company estimates the recoverable amount of the cash-generating unit to which the asset belongs. Corporate assets are allocated to the individual cash-generating units on a reasonable and consistent basis of allocation.
Recoverable amount is the higher of fair value less costs to sell and value in use. If the recoverable amount of an asset or cash-generating unit is estimated to be less than its carrying amount, the carrying amount of the asset or cash-generating unit is reduced to its recoverable amount, with the resulting impairment loss recognized in profit or loss.
-134-

When an impairment loss is subsequently reversed, the carrying amount of the asset or cash-generating unit is increased to the revised estimate of its recoverable amount, but only to the extent of the carrying amount that would have been determined had no impairment loss been recognized for the asset or cash-generating unit in prior years. A reversal of an impairment loss is recognized in profit or loss.
m. Financial instruments
Financial assets and financial liabilities are recognized when the Company becomes a party to the contractual provisions of the instruments.
Financial assets and financial liabilities are initially measured at fair value. Transaction costs that are directly attributable to the acquisition or issue of financial assets and financial liabilities (other than financial assets and financial liabilities at fair value through profit or loss) are added to or deducted from the fair value of the financial assets or financial liabilities, as appropriate, on initial recognition. Transaction costs directly attributable to the acquisition of financial assets or financial liabilities at fair value through profit or loss are recognized immediately in profit or loss.
1) Financial assets
All regular way purchases or sales of financial assets are recognized and derecognized on a trade date basis.
a) Measurement category
Financial assets are classified into the following categories: Financial assets at fair value through profit or loss, available-for-sale financial assets, and loans and receivables.
i. Financial assets at fair value through profit or loss
Financial assets are classified as at fair value through profit or loss when the financial asset is either held for trading or it is designated as at fair value through profit or loss.
Financial assets at fair value through profit or loss are stated at fair value, with any gains or losses arising on remeasurement recognized in profit or loss. The net gain or loss recognized in profit or loss incorporates any dividend or interest earned on the financial asset. Fair value is determined in the manner described in Note 24.
ii. Available-for-sale financial assets
Available-for-sale financial assets are non-derivatives that are either designated as available-for-sale or are not classified as loans and receivables, held-to-maturity investments or financial assets at fair value through profit or loss.
Available-for-sale financial assets are measured at fair value. Changes in the carrying amount of available-for-sale monetary financial assets relating to changes in foreign currency exchange rates, interest income calculated using the effective interest method and dividends on available-for-sale equity investments are recognized in profit or loss. Other changes in the carrying amount of available-for-sale financial assets are recognized in other comprehensive income and will be reclassified to profit or loss when the investment is disposed of or is determined to be impaired.
Dividends on available-for-sale equity instruments are recognized in profit or loss when the Company’s right to receive the dividends is established.
-135-
iii. Loans and receivables
Loans and receivables (including trade receivables and cash and cash equivalent) are measured at amortized cost using the effective interest method, less any impairment, except for short-term receivables when the effect of discounting is immaterial.
Cash equivalent includes time deposits with original maturities within three months from the date of acquisition, highly liquid, readily convertible to a known amount of cash and be subject to an insignificant risk of changes in value. These cash equivalents are held for the purpose of meeting short-term cash commitments.
b) Impairment of financial assets
Financial assets, other than those at fair value through profit or loss, are assessed for indicators of impairment at the end of each reporting period. Financial assets are considered to be impaired when there is objective evidence that, as a result of one or more events that occurred after the initial recognition of the financial asset, the estimated future cash flows of the investment have been affected.
For financial assets carried at amortized cost, such as trade receivables, assets are assessed for impairment on a collective basis even if they were assessed not to be impaired individually. Objective evidence of impairment for a portfolio of receivables could include the Company’s past experience of collecting payments, an increase in the number of delayed payments in the portfolio past the average credit period of 90 days, as well as observable changes in national or local economic conditions that correlate with default on receivables.
For financial assets carried at amortized cost, the amount of the impairment loss recognized is the difference between the asset’s carrying amount and the present value of estimated future cash flows, discounted at the financial asset’s original effective interest rate.
For financial assets measured at amortized cost, if, in a subsequent period, the amount of the impairment loss decreases and the decrease can be related objectively to an event occurring after the impairment was recognized, the previously recognized impairment loss is reversed through profit or loss to the extent that the carrying amount of the investment at the date the impairment is reversed does not exceed what the amortized cost would have been had the impairment not been recognized.
For available-for-sale equity investments, a significant or prolonged decline in the fair value of the security below its cost is considered to be objective evidence of impairment.
For all other financial assets, objective evidence of impairment could include significant financial difficulty of the issuer or counterparty, breach of contract, such as a default or delinquency in interest or principal payments, it becoming probable that the borrower will enter bankruptcy or financial re-organization, or the disappearance of an active market for that financial asset because of financial difficulties.
When an available-for-sale financial asset is considered to be impaired, cumulative gains or losses previously recognized in other comprehensive income are reclassified to profit or loss in the period.
In respect of available-for-sale equity securities, impairment loss previously recognized in profit or loss are not reversed through profit or loss. Any increase in fair value subsequent to an impairment loss is recognized in other comprehensive income. In respect of available-for-sale debt securities, the impairment loss is subsequently reversed through profit or loss if an increase in the fair value of the investment can be objectively related to an event occurring after the recognition of the impairment loss.
-136-

The carrying amount of the financial asset is reduced by the impairment loss directly for all financial assets with the exception of trade receivables, where the carrying amount is reduced through the use of an allowance account. When a trade receivable is considered uncollectible, it is written off against the allowance account. Subsequent recoveries of amounts previously written off are credited against the allowance account. Changes in the carrying amount of the allowance account are recognized in profit or loss except for uncollectible trade receivables that are written off against the allowance account.
c) Derecognition of financial assets
The Company derecognizes a financial asset only when the contractual rights to the cash flows from the asset expire, or when it transfers the financial asset and substantially all the risks and rewards of ownership of the asset to another party.
On derecognition of a financial asset in its entirety, the difference between the asset’s carrying amount and the sum of the consideration received and receivable and the cumulative gain or loss that had been recognized in other comprehensive income is recognized in profit or loss.
2) Equity instruments
Debt and equity instruments issued by a group entity are classified as either financial liabilities or as equity in accordance with the substance of the contractual arrangements and the definitions of a financial liability and an equity instrument.
Equity instruments issued by the Company are recognized at the proceeds received, net of direct issue costs.
Repurchase of the Company’s own equity instruments is recognized in and deducted directly from equity. No gain or loss is recognized in profit or loss on the purchase, sale, issue or cancellation of the Company’s own equity instruments.
3) Financial liabilities
a) Subsequent measurement
Except the following situation, all the financial liabilities are measured at amortized cost using the effective interest method:
Financial liabilities at fair value through profit or loss
Financial liabilities are classified as at fair value through profit or loss when the financial liability is either held for trading or it is designated as at fair value through profit or loss. Fair value is determined in the manner described in Note 24.
b) Derecognition of financial liabilities
The difference between the carrying amount of the financial liability derecognized and the consideration paid, including any non-cash assets transferred or liabilities assumed, is recognized in profit or loss.
4) Derivative financial instruments
The Company enters into forward contracts to manage its exposure to foreign exchange rate risks.
-137-

Derivatives are initially recognized at fair value at the date the derivative contracts are entered into and are subsequently remeasured to their fair value at the end of each reporting period. The resulting gain or loss is recognized in profit or loss immediately unless the derivative is designated and effective as a hedging instrument, in which event the timing of the recognition in profit or loss depends on the nature of the hedge relationship. When the fair value of derivative financial instruments is positive, the derivative is recognized as a financial asset; when the fair value of derivative financial instruments is negative, the derivative is recognized as a financial liability.
n. Provisions
Provisions are measured at the best estimate of the discounted cash flows of the consideration required to settle the present obligation at the end of the reporting period, taking into account the risks and uncertainties surrounding the obligation. When a provision is measured using the cash flows estimated to settle the present obligation, its carrying amount is the present value of those cash flows.
Provisions for the expected cost of warranty obligations are recognized at the date of sale of the relevant products, at the best estimate of the expenditure required to settle the Company’s obligation by the management of the Company.
o. Revenue recognition
Revenue is measured at the fair value of the consideration received or receivable. Revenue is reduced for estimated customer returns, rebates and other similar allowances. Allowance for sales returns and liability for returns are recognized at the time of sale based on the seller’s reliable estimate of future returns and based on past experience and other relevant factors.
1) Sale of goods
Revenue from the sale of goods is recognized when all the following conditions are satisfied:
a) The Company has transferred to the buyer the significant risks and rewards of ownership of the goods;
b) The Company retains neither continuing managerial involvement to the degree usually associated with ownership nor effective control over the goods sold;
c) The amount of revenue can be measured reliably;
d) It is probable that the economic benefits associated with the transaction will flow to the Company; and
e) The costs incurred or to be incurred in respect of the transaction can be measured reliably.
The Company does not recognize sales revenue on materials delivered to subcontractors because this delivery does not involve a transfer of risks and rewards of materials ownership.
2) Rendering of services
Service income is recognized when services are provided.
Revenue from a contract to provide services is recognized by reference to the stage of completion of the contract.
-138-
3) Royalties
Royalty revenue is recognized on an accrual basis in accordance with the substance of the relevant agreement provided that it is probable that the economic benefits will flow to the Company and the amount of revenue can be measured reliably. Royalties determined on a time basis are recognized on a straight-line basis over the period of the agreement. Royalty arrangements that are based on production, sales and other measures are recognized by reference to the underlying arrangement.
4) Dividend and interest income
Dividend income from investments is recognized when the shareholder’s right to receive payment has been established provided that it is probable that the economic benefits will flow to the Company and the amount of income can be measured reliably.
Interest income from a financial asset is recognized when it is probable that the economic benefits will flow to the Company and the amount of income can be measured reliably. Interest income is accrued on a time basis, by reference to the principal outstanding and at the effective interest rate applicable.
p. Leasing
Leases are classified as finance leases whenever the terms of the lease transfer substantially all the risks and rewards of ownership to the lessee. All other leases are classified as operating leases.
1) The Company as lessor
Rental income from operating leases is recognized on a straight-line basis over the term of the relevant lease. Initial direct costs incurred in negotiating and arranging an operating lease are added to the carrying amount of the leased asset and amortized on a straight-line basis over the lease term.
2) The Company as lessee
Operating lease payments are recognized as an expense on a straight-line basis over the lease term.
q. Employee benefits
1) Short-term employee benefits
Liabilities recognized in respect of short-term employee benefits are measured at the undiscounted amount of the benefits expected to be paid in exchange for the related service.
2) Retirement benefits
Payments to defined contribution retirement benefit plans are recognized as an expense when employees have rendered service entitling them to the contributions.
Defined benefit costs (including service cost, net interest and remeasurement) under the defined benefit retirement benefit plans are determined using the projected unit credit method. Service cost (including current service cost, and past service cost) are recognized as employee benefits expense in the period they occur, or when the plan amendment or curtailment occurs. Remeasurement, comprising actuarial gains and losses, (the effect of the changes to the asset ceiling) and the return on plan assets (excluding interest), is recognized in other comprehensive income in the period in which they occur. Remeasurement recognized in other comprehensive income is reflected immediately in retained earnings and will not be reclassified to profit or loss.
-139-

Net defined benefit liability (asset) represents the actual deficit (surplus) in the Company’s defined benefit plan. Any surplus resulting from this calculation is limited to the present value of any refunds from the plans or reductions in future contributions to the plans.
r. Employee share options
Employee share options granted to employee and others providing similar services.
The fair value at the grant date of the employee share options is expensed on a straight-line basis over, based on the Company’s best estimate of the number of shares or options that are expected to ultimately vest, with a corresponding increase in capital surplus - employee share options. It is recognized as an expense in full at the grate date if vesting immediately.
At the end of each reporting period, the Company revises its estimate of the number of employee share options expected to vest. The impact of the revision of the original estimates is recognized in profit or loss such that the cumulative expense reflects the revised estimate, with a corresponding adjustment to the capital surplus - employee share options.
s. Taxation
Income tax expense represents the sum of the tax currently payable and deferred tax.
1) Current tax
According to the Income Tax Law, an additional tax at 10% of unappropriated earnings is provided for as income tax in the year the shareholders approve to retain the earnings.
Adjustments of prior years’ tax liabilities are added to or deducted from the current year’s tax provision.
2) Deferred tax
Deferred tax is recognized on temporary differences between the carrying amounts of assets and liabilities and the corresponding tax bases used in the computation of taxable profit.
Deferred tax liabilities are generally recognized for all taxable temporary differences. Deferred tax assets are generally recognized for all deductible temporary differences, unused loss carry forward and unused tax credits for purchases of machinery, equipment and technology, research and development expenditures, and personnel training expenditures to the extent that it is probable that taxable profits will be available against which those deductible temporary differences can be utilized.
Deferred tax liabilities are recognized for taxable temporary differences associated with investments in subsidiaries and associates, except where the Company is able to control the reversal of the temporary difference and it is probable that the temporary difference will not reverse in the foreseeable future. Deferred tax assets arising from deductible temporary differences associated with such investments and interests are only recognized to the extent that it is probable that there will be sufficient taxable profits against which to utilize the benefits of the temporary differences and they are expected to reverse in the foreseeable future.
The carrying amount of deferred tax assets is reviewed at the end of each reporting period and reduced to the extent that it is no longer probable that sufficient taxable profits will be available to allow all or part of the asset to be recovered. A previously unrecognized deferred tax asset is also reviewed at the end of each reporting period and recognized to the to the extent that it has become probable that future taxable profit will allow the deferred tax asset to be recovered.
-140-

Deferred tax liabilities and assets are measured at the tax rates that are expected to apply in the period in which the liability is settled or the asset realized, based on tax rates (and tax laws) that have been enacted or substantively enacted by the end of the reporting period. The measurement of deferred tax liabilities and assets reflects the tax consequences that would follow from the manner in which the Company expects, at the end of the reporting period, to recover or settle the carrying amount of its assets and liabilities.
3) Current and deferred tax for the year
Current and deferred tax are recognized in profit or loss, except when they relate to items that are recognized in other comprehensive income or directly in equity, in which case, the current and deferred tax are also recognized in other comprehensive income or directly in equity respectively.
5. CRITICAL ACCOUNTING JUDGMENTS AND KEY SOURCES OF ESTIMATION UNCERTAINTY
In the application of the Company’s accounting policies, management is required to make judgments, estimates and assumptions about the carrying amounts of assets and liabilities that are not readily apparent from other sources. The estimates and associated assumptions are based on historical experience and other factors that are considered relevant. Actual results may differ from these estimates.
The estimates and underlying assumptions are reviewed on an ongoing basis. Revisions to accounting estimates are recognized in the period in which the estimate is revised if the revision affects only that period or in the period of the revision and future periods if the revision affects both current and future periods.
a. Impairment of goodwill
Determining whether goodwill is impaired requires an estimation of the value in use of the cash-generating units to which goodwill has been allocated. The value in use calculation requires management to estimate the future cash flows expected to arise from the cash-generating unit and a suitable discount rate in order to calculate present value. Where the actual future cash flows are less than expected, a material impairment loss may arise.
b. Estimated impairment of trade receivables
When there is objective evidence of impairment loss, the Company takes into consideration the estimation of future cash flows. The amount of the impairment loss is measured as the difference between the asset’s carrying amount and the present value of estimated future cash flows (excluding future credit losses that have not been incurred) discounted at the financial asset’s original effective interest rate. Where the actual future cash flows are less than expected, a material impairment loss may arise.
c. Fair value measurements and valuation processes
If some of the Company’s assets and liabilities measured at fair value have no quoted prices in active markets, the Company determines whether it will (a) engage third party qualified valuers, (b) determine the appropriate valuation techniques for fair value measurements in accordance with relevant laws and regulations, or (c) use judgment.
Where Level 1 inputs are not available, the Company or engaged valuers would determine appropriate inputs by referring to agreed-upon rewards stated in the investment contracts of financial products, quoted prices of similar instruments in active markets, valuation multiples of comparable entities/market prices or rates, and specific features of derivatives. However, since projected inputs are subject to changes in the future and could thus result in significant changes in fair value, the Company updates inputs every quarter to assess the appropriateness of fair value measurement.
-141-

Information about the valuation techniques and inputs used in determining the fair value of various assets and liabilities is disclosed in Note 24
d. Write-down of inventory
Net realizable value of inventory is the estimated selling price in the ordinary course of business less the estimated costs of completion and the estimated costs necessary to make the sale. The estimation of net realizable value was based on current market conditions and the historical experience of selling products of a similar nature. Changes in market conditions may have a material impact on the estimation of net realizable value.
e. Impairment of investment in the associate
The Company immediately recognizes impairment loss on its net investment in the associate when there is any indication that the investment may be impaired and the carrying amount may not be recoverable. The Company’s management evaluates the impairment based on the estimated future cash flow expected to be generated by the associate, including growth rate of sale and capacity of production facilities estimated by the associate’s management. The Company also takes into consideration the market conditions and industry development to evaluate the appropriateness of assumptions.
f. Recognition and measurement of defined benefit plans
Net defined benefit liabilities (assets) and the resulting defined benefit costs under defined benefit pension plans are calculated using the projected unit credit method. Actuarial assumptions comprise the discount rate, rate of employee turnover, and future salary increase, etc. Changes in economic circumstances and market conditions will affect these assumptions and may have a material impact on the amount of the expense and the liability.
6. CASH AND CASH EQUIVALENTS
December 312015 2014
Cash on hand $ 325 $ 2,671Checking accounts and demand deposits 814,968 863,414Time deposits with original maturities less than three months - 183,312
$ 815,293 $ 1,049,397
The market rate intervals of cash in bank at the end of the reporting period were as follows:
December 312015 2014
Demand deposits 0.001%-0.300% 0.010%-0.300%Time deposits with original maturities of less than three months - 5.500%-5.600%
-142-

7. FINANCIAL INSTRUMENTS AT FAIR VALUE THROUGH PROFIT OR LOSS
December 312015 2014
Financial assets at held for trading - current
Forward exchange contracts $ 7,391 $ 14,879
Financial liabilities held for trading - current
Forward exchange contracts $ 6,352 $ 8,698
At the end of the reporting period, outstanding forward exchange contracts not under hedge accounting were as follows:
Currency Maturity DateNotional Amount(In Thousands)
December 31, 2015
Sell EUR/NTD 2016.01-2016.04 EUR5,000/NTD179,073EUR/USD 2016.01-2016.04 EUR6,500/USD7,102USD/NTD 2016.01-2016.02 USD1,499/NTD49,190JPY/NTD 2016.01-2016.05 JPY200,000/NTD53,236JPY/USD 2016.01-2016.05 JPY70,000/USD582RMB/NTD 2016.01-2016.03 RMB64,000/NTD321,201RMB/USD 2016.01-2016.02 RMB15,000/USD2,323
December 31, 2014
Sell EUR/NTD 2015.01-2015.04 EUR10,500/NTD415,900EUR/USD 2015.01-2015.04 EUR1,000/USD1,263USD/NTD 2015.01-2015.04 USD1,263/NTD38,634JPY/NTD 2015.01-2015.03 JPY70,000/NTD20,011RMB/NTD 2015.01-2015.05 RMB65,000/NTD322,421
The Company entered into forward exchange contracts during the years ended December 31, 2015 and 2014 to manage exposures due to exchange rate fluctuations of foreign-currency denominated assets and liabilities. The Company’s financial hedging strategy is to minimize risks due to market price fluctuations and cash flows; however, because these contracts did not meet the criteria for hedge effectiveness, they were not subject to hedge accounting.
8. AVAILABLE-FOR-SALE FINANCIAL ASSETS
December 312015 2014
Current
Domestic investmentsMutual funds $ - $ 1,717,756
Noncurrent
Domestic investmentsQuoted shares $ 1,700,814 $ 2,385,937
-143-

For its securities borrowing and lending transactions, the Company placed some of its quoted domestic stocks, recorded under available-for-sale assets - noncurrent, in a trust at Chinatrust Commercial Bank. As of December 31, 2015 and 2014, the stocks held in trust amounted to $1,276,400 thousand and $1,792,025 thousand, respectively. Refer to Table 3 for more information. On the transactions, the Company recognized gains of $235 thousand and $144 thousand during the years ended December 31, 2015 and 2014, respectively. These gains were recorded under other nonoperating income.
9. NOTES AND ACCOUNTS RECEIVABLES
December 312015 2014
Notes receivable (include related parties) $ 55,480 $ 45,319
Accounts receivable $ 1,156,139 $ 1,016,874Less: Allowance for impairment loss (20,899) (23,132)
$ 1,135,240 $ 993,742
a. Trade receivables
The average credit period on sales of goods was from 30 to 90 days. In determining the recoverability of a trade receivable, the Company considered any change in the credit quality of the trade receivable since the date credit was initially granted to the end of the reporting period. The Company recognized an allowance for impairment loss of 100% against all receivables over 1 year because historical experience had been that receivables that are past due beyond 1 year were not recoverable. Allowance for impairment loss were recognized against trade receivables between 90 days and 1 year based on estimated irrecoverable amounts determined by reference to past default experience of the counterparties and an analysis of their current financial position.
For the trade receivables balances that were past due at the end of the reporting period, the Company did not recognize an allowance for impairment loss, because there was not a significant change in credit quality and the amounts were still considered recoverable. The Company did not hold any collateral or other credit enhancements for these balances.The aging of receivables was as follows:
December 312015 2014
Not overdue $ 968,470 $ 907,403Overdue
1 to 90 days 177,970 80,66591 to 360 days 2,060 25,722Over 360 days 7,639 3,084
$ 1,156,139 $ 1,016,874
The above aging schedule was based on the past due date.
-144-

The aging of receivables that were past due date but not impaired were as follows:
December 312015 2014
1 to 30 days $ 141,583 $ 74,13531 to 60 days 12,722 4,34261 to 90 days 11,681 2,188
$ 165,986 $ 80,665
The above aging schedule was based on the past due dates.
The movements in the allowance for impairment loss recognized on trade receivables was as follows:
Individually Assessed for Impairment
Collectively Assessed for Impairment Total
Balance at January 1, 2014 $ 3,150 $ 10,533 $ 13,683Add (deduct): Impairment losses recognized
(reversed) on receivables 16,652 (7,949) 8,703Business combination - 746 746
Balance at December 31, 2014 $ 19,802 $ 3,330 $ 23,132
Balance at January 1, 2015 $ 19,802 $ 3,330 $ 23,132Add (deduct): Impairment losses recognized
on receivables (2,203) - (2,203)Less: Amounts written off during the year
as uncollectible (30) - (30)
Balance at December 31, 2015 $ 17,569 $ 3,330 $ 20,899
The Company recognized impairment losses of $1,432 thousand both on trade receivables as of December 31, 2015 and 2014.
These amounts mainly related to customers that were in liquidation or in severe financial difficulties. The Company had no collaterals for these impaired trade receivables.
10. INVENTORIES
December 312015 2014
Finished goods $ 673,949 $ 539,378Work in process 351,292 321,035Raw materials 637,327 518,427Inventories in transit 10,588 25,362
$ 1,673,156 $ 1,404,202
The cost of inventories recognized as cost of goods sold for the years ended December 31, 2015 and 2014 was $20,682,645 thousand and $19,198,089 thousand, respectively.
-145-

The costs of inventories were decreased by $107,604 thousand and $92,772 thousand as of December 31, 2015 and 2014.
11. INVESTMENTS ACCOUNTED FOR USING THE EQUITY METHOD
December 312015 2014
Investments in subsidiaries $ 12,678,469 $ 11,590,836Investments in associates 459,756 429,905
$ 13,138,225 $ 12,020,741
a. Investments in subsidiaries
December 312015 2014
Unlisted companiesAdvantech Automation Corp. (BVI) (AAC (BVI)) $ 3,735,761 $ 3,445,935Advantech Technology Co., Ltd. (ATC) 3,626,645 3,513,745Advantech Corporate Investment 1,558,953 988,173Advansus Corp. 999,983 761,954Advantech Europe Holding B.V. (AEUH) 898,536 959,009Advantech-LNC Technology Co., Ltd. (ALTC) 516,626 511,128AdvanPOS Technology Co., Ltd. (AdvanPOS) 358,662 319,139ACA Digital Corp. (ACA) 319,859 474,164Advantech KR Co., Ltd. (AKR) 202,503 234,924Advantech Japan Co., Ltd. (AJP) 179,407 145,000Advantech Co. Singapore Pte, Ltd. (ASG) 82,906 96,662Advantech iFactory Co., Ltd. 60,088 -Advantech Brasil Ltda. (ABR) 48,320 60,238Advantech Co. Malaysia Sdn. Bhd. (AMY) 36,439 35,428Advantech Australia Pty Ltd. (AAU) 30,171 44,556Advantech Industrial Computing India Private Limited (AIN) 13,479 (7,286)Advantech Innovative Design Co., Ltd. 8,569 -Advantech Electronics, S. De R. L. Dec. V. (AMX) 1,562 781
12,678,469 11,583,550Add: Credit balances of investments accounted for using the
equity method - 7,286
$ 12,678,469 $ 11,590,836
As the end of the reporting period, the Company’s percentage of ownership and voting rights in its investees were as follows:
December 312015 2014
AAC (BVI) 100.00% 100.00%ATC 100.00% 100.00%Advantech Corporate Investment 100.00% 100.00%Advansus Corp. 100.00% 100.00%
(Continued)
-146-

December 312015 2014
AEUH 100.00% 100.00%ALTC (Note 21) 89.93% 89.93%AdvanPOS (Note 21) 100.00% 69.47%ACA 100.00% 100.00%AKR 100.00% 100.00%AJP 100.00% 100.00%ASG 100.00% 100.00%Advantech iFactory Co., Ltd. 100.00% -ABR 80.00% 80.00%AMY 100.00% 100.00%AAU 100.00% 100.00%AIN 99.99% 99.99%Advantech Innovative Design Co., Ltd. 100.00% -AMX 100.00% 100.00%
(Concluded)
The financial statements used as basis for calculating investments accounted for by the equity method and the share of profit or loss and other comprehensive income of those investments have been audited, except those of AIN, AMX, Advantech Innovative Design Co., Ltd. and Advantech iFactory Co., Ltd. Management believes there would have been no material impact on the equity method accounting or the calculation of the share of profit or loss and other comprehensive income had the financial statements of the above subsidiaries been audited.
The financial statements of the following subsidiaries had been audited by other independent CPAs: AEUH and its subsidiaries except for AEU; Deneng Scientific Research Co Ltd., held by Advantech Corporate Investment; AJP; AAU; ASG; AMY; and ABR.
b. Investments in associates
December 312015 2014
Listed companiesAxiomtek Co., Ltd. $ 450,246 $ 420,063
Unlisted companiesJan Hsiang Electronics Co., Ltd. (Jan Hsiang) 9,510 9,842
$ 459,756 $ 429,905
For the Year Ended December 312015 2014
The Company’s share of:Profit from continuing operations $ 110,142 $ 98,984Other comprehensive income 25 4,711
Total comprehensive income for the year $ 110,167 $ 103,695
The investments accounted for by the equity method and the share of profit or loss and other comprehensive income of those investments for the years ended December 31, 2015 and 2014 was based on the associates’ financial statements audited by the other CPAs for the same years.
-147-

12. PROPERTY, PLANT, AND EQUIPMENT
Freehold Land Buildings EquipmentOffice
Equipment Other FacilitiesConstruction in
Progress Total
Cost
Balance at January 1, 2014 $ 2,596,325 $ 1,210,305 $ 647,912 $ 170,686 $ 347,522 $ 833,423 $ 5,806,173Additions 165,222 70,174 30,759 54,931 117,920 436,364 875,370Disposals (35,506) (28,745) (5,349 ) (8,332 ) (4,608 ) - (82,540)Acquisitions through business
combinations 35,506 28,745 28,016 3,744 2,847 - 98,858Reclassifications 13,248 1,107,872 133,829 29,389 25,378 (1,237,791 ) 71,925
Balance at December 31, 2014 $ 2,774,795 $ 2,388,351 $ 835,167 $ 250,418 $ 489,059 $ 31,996 $ 6,769,786
Accumulated depreciation and impairment
Balance at January 1, 2014 $ - $ 283,937 $ 526,751 $ 124,858 $ 262,512 $ - $ 1,198,058Disposals - (9,690 ) (5,287 ) (8,219 ) (3,029 ) - (26,225)Depreciation expense - 40,048 73,406 30,842 57,877 - 202,173Acquisitions through business
combinations - 9,504 26,926 3,047 1,344 - 40,821
Balance at December 31, 2014 $ - $ 323,799 $ 621,796 $ 150,528 $ 318,704 $ - $ 1,414,827
Carrying amounts at December 31, 2014 $ 2,774,795 $ 2,064,552 $ 213,371 $ 99,890 $ 170,355 $ 31,996 $ 5,354,959
Cost
Balance at January 1, 2015 $ 2,774,795 $ 2,388,351 $ 835,167 $ 250,418 $ 489,059 $ 31,996 $ 6,769,786Additions - 82,015 61,640 23,935 85,436 928,621 1,181,647Disposals - - (67,681) (6,705) (5,392 ) - (79,778)Reclassifications - - 26,655 - 4,542 (46,323) (15,126)
Balance at December 31, 2015 $ 2,774,795 $ 2,470,366 $ 855,781 $ 267,648 $ 573,645 $ 914,294 $ 7,856,529
Accumulated depreciation and impairment
Balance at January 1, 2015 $ - $ 323,799 $ 621,796 $ 150,528 $ 318,704 $ - $ 1,414,827Disposals - - (67,681) (6,331) (5,311 ) - (79,323)Depreciation expense - 47,874 82,301 37,257 75,484 - 242,916
Balance at December 31, 2015 $ - $ 371,673 $ 636,416 $ 181,454 $ 388,877 $ - $ 1,578,420
Carrying amounts at December 31, 2015 $ 2,774,795 $ 2,098,693 $ 219,365 $ 86,194 $ 184,768 $ 914,294 $ 6,278,109
The above items of property, plant and equipment were depreciated on a straight-line basis over the estimated useful life of the asset:
BuildingsMain buildings 45-60 yearsElectronic equipment 5 yearsEngineering systems 50 years
Equipment 2-8 yearsOffice equipment 2-5 yearsOther facilities 2-5 years
13. GOODWILL
December 312015 2014
Cost
Balance at January 1 $ 111,599 $ -Additional amounts recognized during the year - 111,599
Balance at December 31 $ 111,599 $ 111,599
The Company merged with Netstar Technology Co., Ltd. in July 2014, with the Company as the survivor entity. The goodwill acquired through the merger is periodically tested for impairment loss.
-148-

14. OTHER LIABILITIES
December 312015 2014
Other payables Salaries or bonuses $ 1,753,360 $ 1,682,704Payable for royalties 105,186 47,230Payable for annual leave 25,650 20,905Others 371,719 319,646
$ 2,255,915 $ 2,070,485
15. RETIREMENT BENEFIT PLANS
a. Defined contribution plans
The Company adopted a pension plan under the Labor Pension Act (“LPA”), which is a state-managed defined contribution plan. Under the LPA, an entity makes monthly contributions to employees’ individual pension accounts at 6% of monthly salaries and wages.
b. Defined benefit plans
The defined benefit plan adopted by the Company in accordance with the Labor Standards Law is operated by the government. Pension benefits are calculated on the basis of the length of service and average monthly salaries of the six months before retirement. The Company contribute amounts equal to 2% of total monthly salaries and wages to a pension fund administered by the pension fund monitoring committee. Pension contributions are deposited in the Bank of Taiwan in the committee’s name. Before the end of each year, the Company assesses the balance in the pension fund. If the amount of the balance in the pension fund is inadequate to pay retirement benefits for employees who conform to retirement requirements in the next year, the Company is required to fund the difference in one appropriation that should be made before the end of March of the next year. The pension fund is managed by the Bureau of Labor Funds, Ministry of Labor (“the Bureau”); the Company has no right to influence the investment policy and strategy.
The amounts included in the balance sheets in respect of the Company’s defined benefit plans were as follows:
December 312015 2014
Present value of defined benefit obligation $ 327,854 $ 308,456Fair value of plan assets (145,682) (144,207)Deficit (surplus) 182,172 164,249
Net defined benefit liability (asset) $ 182,172 $ 164,249
-149-

Movements in net defined benefit liability (asset) were as follows:
Present Value of the Defined
Benefit Obligation
Fair Value of the Plan Assets
Net Defined Benefit
Liability (Asset)
Balance at January 1, 2014 $ 284,160 $ (124,931) $ 159,229Service cost
Current service cost 2,832 - 2,832Net interest expense (income) 5,233 (2,411) 2,832
Recognized in profit or loss 8,065 (2,411) 5,654Remeasurement
Return on plan assets (excluding amounts included in net interest) - (1,824) (1,824)
Actuarial (gain) loss - changes in demographic assumptions 6,527 - 6,527
Actuarial (gain) loss - experience adjustments 286 - 286
Recognized in other comprehensive income 6,813 (1,824) 4,989Contributions from the employer - (7,448) (7,448)Benefits paid (1,092) 1,092 -Business combinations 10,510 (8,685) 1,825Balance at December 31, 2014 308,456 (144,207) 164,249Service cost
Current service cost 2,344 - 2,344Past service cost 1,340 - 1,340Net interest expense (income) 5,784 (2,774) 3,010
Recognized in profit or loss 9,468 (2,774) 6,694Remeasurement
Return on plan assets (excluding amounts included in net interest) - (1,019) (1,019)
Actuarial (gain) loss - changes in demographic assumptions 12,031 - 12,031
Actuarial (gain) loss - changes in financial assumptions 9,903 - 9,903
Actuarial (gain) loss - experience adjustments (2,179) - (2,179)
Recognized in other comprehensive income 19,755 (1,019) 18,736Contributions from the employer - (7,507) (7,507)Benefits paid (9,825) 9,825 -
Balance at December 31, 2015 $ 327,854 $ (145,682) $ 182,172
An analysis by function of the amounts recognized in profit or loss in respect of the defined benefit plans is as follows:
For the Year Ended December 312015 2014
Operating costs $ 1,075 $ 1,082Selling and marketing expenses 838 776General and administrative expenses 2,368 1,370Research and development expenses 1,963 2,003
$ 6,244 $ 5,231
-150-

Through the defined benefit plans under the Labor Standards Law, the Company is exposed to the following risks:
1) Investment risk: The plan assets are invested in domestic/and foreign/equity and debt securities, bank deposits, etc. The investment is conducted at the discretion of the Bureau or under the mandated management. However, in accordance with relevant regulations, the return generated by plan assets should not be below the interest rate for a 2-year time deposit with local banks.
2) Interest risk: A decrease in the bond interest rate will increase the present value of the defined benefit obligation; however, this will be partially offset by an increase in the return on the plan’s debt investments.
3) Salary risk: The present value of the defined benefit obligation is calculated by reference to the future salaries of plan participants. As such, an increase in the salary of the plan participants will increase the present value of the defined benefit obligation.
The actuarial valuations of the present value of the defined benefit obligation were carried out by qualified actuaries. The significant assumptions used for the purposes of the actuarial valuations were as follows:
December 312015 2014
Discount rate(s) 1.625% 1.875%Expected rate(s) of salary increase 3.250% 3.250%
If possible reasonable change in each of the significant actuarial assumptions will occur and all other assumptions will remain constant, the present value of the defined benefit obligation would decrease/increase as follows:
December 312015 2014
Discount rate(s)0.25% increase $ (10,254) $ (9,786)0.25% decrease $ 10,705 $ 10,216
Expected rate(s) of salary increase0.25% increase $ 10,360 $ 9,9080.25% decrease $ (9,980) $ (9,543)
The sensitivity analysis presented above may not be representative of the actual change in the present value of the defined benefit obligation as it is unlikely that the change in assumptions would occur in isolation of one another as some of the assumptions may be correlated.
December 312015 2014
The expected contributions to the plan for the next year $ 7,563 $ 7,428
The average duration of the defined benefit obligation 12.8 years 13.0 years
-151-

16. EQUITY
a. Share capital
Ordinary shares
December 312015 2014
Number of shares authorized (in thousands) 800,000 800,000Amount of shares authorized $ 8,000,000 $ 8,000,000Number of shares issued and fully paid (in thousands) 631,853 631,209Amount of shares issued and fully paid $ 6,318,531 $ 6,312,091
Fully paid ordinary shares, which have a par value of NT$10, carry one vote per share and carry a right to dividends.
For the year ended December 31, 2015, the changes in shares are due to employees’ exercise of their employee share options.
b. Capital surplus
December 312015 2014
May be used to offset a deficit, distributed as cash dividends, or transferred to share capital (1)
Arising from issuance of common shares $ 3,396,888 $ 3,396,888Arising from conversion of bonds 931,849 931,849Arising from the difference between consideration received or
paid and the carrying amount of the subsidiaries’ net assets during actual disposal or acquisition - 11,457
May be used to offset a deficit only
Arising from changes in percentage of ownership interest in subsidiaries (2) 4,246 679
Arising from employee share options 792,341 736,092Arising from distribution of stock dividends 78,614 78,614
May not be used for any purpose
Arising from share of changes in capital surplus of associates 12,698 10,526Arising from employee share options 370,919 140,853
$ 5,587,555 $ 5,306,958
1) Such capital surplus may be used to offset a deficit; in addition, when the Company has no deficit, such capital surplus may be distributed as cash dividends or transferred to share capital (limited to a certain percentage of the Company’s capital surplus and once a year).
2) Such capital surplus arises from the effect of changes in ownership interest in a subsidiary resulted from equity transactions other than actual disposal or acquisition, or from changes in capital surplus of subsidiaries accounted for by using equity method.
-152-

c. Retained earnings and dividend policy
Under the Company’s Articles of Incorporation, if the Company has earnings for the year, it should primarily make taxation payments, offset any past years’ deficits and then make appropriations for its legal reserve at 10% of annual net income. In addition, a special reserve should be appropriated or reversed as needed, adding cumulative retained earnings from previous periods and retaining partially, retained earnings for corporate growth. The remainder of the income should be appropriated in the following order:
1) 1% to 20% as bonus to employees;2) 1% or less as remuneration to directors and supervisors; and3) Dividends, as proposed by the board of directors.
Recipients of stock bonuses may include subsidiaries’ employees who meet the criteria set by the Company’s board of directors.
The Company operates in an industry related to computers, and its business related to network servers is new but with significant potential for growth. Thus, in formulating its dividend policy, the Company takes into account the overall business and industry conditions and trends, its objective of enhancing the shareholders’ long-term interests, and the sustainability of the Company’s growth. The policy also requires that stock dividends be less than 75% of total dividends to retain internally generated cash within the Company to finance future capital expenditures and working capital requirements.
Any appropriations from earnings should be recorded in the year of shareholders’ approval, following the year the earnings were generated.
In accordance with the amendments to the Company Act in May 2015, the recipients of dividends and bonuses are limited to shareholders and do not include employees. The consequential amendments to the Company’s Articles of Incorporation had been proposed by the Company’s board of directors on November 12, 2015 and are subject to the resolution of the shareholders in their meeting to be held on May 25, 2016. For information about the accrual basis of the employees’ compensation and remuneration to directors and supervisors and the actual appropriations, please refer to c. Employee benefits expense in Note 17.
Under Rule No. 1010012865 and Rule No. 1010047490 issued by the FSC and the directive titled “Questions and Answers for Special Reserves Appropriated Following Adoption of IFRSs”, the Company should appropriate or reverse to a special reserve.
Appropriation of earnings to legal reserve should be made until the legal reserve equals the Company’s paid-in capital. Legal reserve may be used to offset deficit. If the Company has no deficit and Legal reserve has exceeded 25% of the Company’s paid-in capital, the excess may be transferred to capital or distributed in cash.
Except for non-ROC resident shareholders, all shareholders receiving the dividends are allowed a tax credit equal to their proportionate share of the income tax paid by the Company.
-153-

The appropriation of earnings for 2014 and 2013 have been approved in the shareholders’ meetings on May 28, 2015 and June 18, 2014, respectively, were as follows:
Appropriation of EarningsDividends Per Share
(NT$)For the Year Ended
December 31For the Year Ended
December 312014 2013 2014 2013
Legal reserve $ 490,778 $ 410,640 $ - $ -Cash dividends 3,787,255 3,017,820 6.0 5.3Stock dividends - 569,400 - 1.0
The appropriations of earnings for 2015 had been proposed by the Company’s board of directors on March 4, 2016. The appropriations and dividends per share were as follows:
Appropriation of Earnings
Dividends Per Share (NT$)
Legal reserve $ 510,434 $ -Cash dividends 3,791,118 6.0
The appropriations of earnings for 2015 are subject to the resolution of the shareholders’ meeting to be held on May 25, 2016.
d. Other equity items
1) Exchange differences on translating the financial statements of foreign operations
For the Year Ended December 312015 2014
Balance at January 1 $ 338,356 $ 130,041Exchange differences on translating the net assets of foreign
operations (82,566) 246,470Related income tax 13,620 (42,667)Share of exchange difference of associates accounted for
using the equity method 2,449 4,512
Balance at December 31 $ 271,859 $ 338,356
2) Unrealized gain or loss from available-for-sale financial assets
For the Year Ended December 312015 2014
Balance at January 1 $ 563,277 $ (75,534)Unrealized gain (loss) on revaluation of available-for-sale
financial assets (358,746) 702,227Cumulative gain reclassified to profit or loss on disposal of
available-for-sale financial assets (198,848) (43,163)Share of unrealized gain (loss) on revaluation of
available-for-sale financial assets of subsidiaries accounted for using the equity method 62,582 (20,253)
Balance at December 31 $ 68,265 $ 563,277
-154-

17. NET PROFIT AND OTHER COMPREHENSIVE INCOME FROM CONTINUING OPERATIONS
a. Finance costs
For the Year Ended December 312015 2014
Interest on short-term bank loans $ - $ 400Interest on convertible bonds - 21
$ - $ 421
b. Depreciation and amortization
For the Year Ended December 312015 2014
Property, plant and equipment $ 242,916 $ 202,173Intangible assets 74,874 61,530
$ 317,790 $ 263,703
An analysis of depreciation by functionOperating costs $ 51,653 $ 34,007Operating expenses 191,263 168,166
$ 242,916 $ 202,173
An analysis of amortization by functionOperating costs $ 210 $ 90Selling and marketing expenses 52,752 39,579General and administrative expenses 145 259Research and development expenses 21,767 21,602
$ 74,874 $ 61,530
c. Employee benefits expense
For the Year Ended December 312015 2014
Short-term benefits $ 2,792,674 $ 2,842,017Post-employment benefits
Defined contribution plans 115,737 100,542Defined benefit plans (Note 15) 6,244 5,231
121,981 105,773Share-based payments-Equity-settled 261,877 111,393Other employee benefits 141,631 92,979
Total employee benefits expense $ 3,318,163 $ 3,152,162
An analysis of employee benefits expense by functionOperating costs $ 685,258 $ 552,361Operating expenses 2,632,905 2,599,801
$ 3,318,163 $ 3,152,162
-155-

The existing Articles of Incorporation of the Company stipulates the distribution of bonus to employees at rates no less than 1% and no higher than 20%, and remuneration to directors and supervisors at a rate no higher than 1%, of net income (net of the bonus and remuneration). For the year ended December 31, 2014, the bonus to employees and the remuneration to directors and supervisors were $126,000 thousand and $12,000 thousand, respectively (recognized as other payables).
To be in compliance with the Company Act as amended in May 2015, the proposed amendments to the Company’s Articles of Incorporation stipulate the distribution of employees’ compensation at rates no less than 1% and no higher than 20%, and remuneration to directors and supervisors at a rate no higher than 1%, of net profit before income tax, employees’ compensation, and remuneration to directors and supervisors. For the year ended December 31, 2015, the employees’ compensation and the remuneration to directors and supervisors were $200,000 thousand and $12,000 thousand, respectively. The bonus to employees and remuneration to directors and supervisors in the form of cash for the year ended December 31, 2015 were proposed by the Company’s board of directors on March 4, 2016 and are subject to the resolution of the amendments to the Company’s Articles of Incorporation for adoption by the shareholders in their meeting to be held on May 25, 2016, and in addition thereto a report of such distribution shall be submitted to the shareholders’ meeting.
Material differences between such estimated amounts and the amounts proposed by the board of directors on or before the date the annual financial statements are authorized for issue are adjusted in the year the bonus and remuneration were recognized. If there is a change in the proposed amounts after the annual financial statements were authorized for issue, the differences are recorded as a change in accounting estimate.
The appropriations of bonuses to employees and remuneration to directors and supervisors for 2014 and 2013 approved in the shareholders’ meetings on May 28, 2015 and June 18, 2014, respectively, were as follows:
Cash DividendsFor the Year Ended December 31
2014 2013
Bonus to employees $ 126,000 $ 70,000Remuneration to directors and supervisors 12,000 12,000
There was no significant difference between the amounts of the bonus to employees and the remuneration to directors and supervisors approved in the shareholders’ meetings on May 28, 2015 and June 18, 2014 and the amounts recognized in the financial statements for the years ended December 31, 2014 and 2013, respectively.
Information on employees’ compensation and remuneration to directors and supervisors resolved by the Company’s board of directors in 2016 and bonuses to employees and supervisors resolved by the shareholders’ meetings in 2015 and 2014 is available on the Market Observation Post System website of the Taiwan Stock Exchange.
d. Gain or loss on foreign currency exchange
For the Year Ended December 312015 2014
Foreign exchange gains $ 603,588 $ 511,481Foreign exchange losses (692,447) (457,737)
$ (88,859) $ 53,744
-156-

18. INCOME TAXES RELATING TO CONTINUING OPERATIONS
a. Major components of tax expense recognized in profit or loss
For the Year Ended December 312015 2014
Current taxIn respect of the current year $ 682,972 $ 500,117Income tax on unappropriated earnings 62,541 10,854Adjustments for prior years (77) 1,498
745,436 512,469Deferred tax
In respect of the current year 23,860 229,394Adjustments for prior years (1,141) -
22,719 229,394
Income tax expense recognized in profit or loss $ 768,155 $ 741,863
A reconciliation of accounting profit and income tax expenses is as follows:
For the Year Ended December 312015 2014
Profit before tax from continuing operations $ 5,872,501 $ 5,649,511
Income tax expense calculated at the statutory rate $ 998,325 $ 960,417Nondeductible expenses in determining taxable income - 114Tax-exempt income (214,892) (219,331)Unrecognized deductible temporary differences (20,742) (11,689)Unrecognized investment credits (57,000) -Income tax on unappropriated earnings 62,541 10,854Adjustments for prior years’ tax (77) 1,498
Income tax expense recognized in profit or loss $ 768,155 $ 741,863
The applicable tax rate used above is the corporate tax rate of 17% payable by the Company.
As the status of 2016 appropriations of earnings is uncertain, the potential income tax consequences of 10% income tax rate of 2015 unappropriated earnings are not reliably determinable.
b. Income tax recognized in other comprehensive income
For the Year Ended December 312015 2014
Deferred tax
In respect of the current yearTranslation of foreign operations $ 13,620 $ (42,667)Remeasurement on defined benefit plan 3,185 848
$ 16,805 $ (41,819)
-157-

c. Current tax assets and liabilities
December 312015 2014
Current tax liabilitiesIncome tax payable $ 853,769 $ 650,399
d. Deferred tax assets and liabilities
The movements of deferred tax assets and deferred tax liabilities were as follows:
For the year ended December 31, 2015
Opening Balance
Recognized in Profit or Loss
Recognized in Other
Comprehensive Income Closing Balance
Deferred tax assets
Temporary differencesUnrealized gross profit $ 40,938 $ 15,205 $ - $ 56,143Unrealized loss on inventory
write-down 15,771 2,522 - 18,293Defined benefit obligation 16,141 (138) - 16,003Unrealized exchange losses - 8,545 - 8,545Donation expense - 2,550 - 2,550Unrealized warranty liabilities 6,140 900 - 7,040Remeasurement on defined
benefit plans 2,951 - 3,185 6,136
$ 81,941 $ 29,584 $ 3,185 $ 114,710
Deferred tax liabilities
Temporary differencesUnappropriated earnings of
subsidiaries $ 807,836 $ 60,823 $ - $ 868,659Exchange difference on foreign
operations 69,302 - (13,620) 55,682Remeasurement on defined
benefit plan 3,391 - - 3,391Unrealized exchange gain 8,520 (8,520) - -
$ 889,049 $ 52,303 $ (13,620) $ 927,732
-158-

For the year ended December 31, 2014
Opening Balance
Recognized in Profit or Loss
Recognized in Other
Comprehensive Income
Acquisitions Through Business
CombinationsClosing Balance
Deferred tax assets
Temporary differencesUnrealized gross profit $ 41,968 $ (1,030) $ - $ - $ 40,938Unrealized loss on inventory
write-down 16,700 (929) - - 15,771Defined benefit obligation 16,488 (347) - - 16,141Unrealized warranty liabilities 5,680 460 - - 6,140Remeasurement on defined
benefit plans 1,949 27 848 127 2,951
$ 82,785 $ (1,819) $ 848 $ 127 $ 81,941
Deferred tax liabilities
Temporary differencesUnappropriated earnings of
subsidiaries $ 588,210 $ 219,626 $ - $ - $ 807,836Exchange difference on
foreign operations 26,635 - 42,667 - 69,302Remeasurement on defined
benefit plans 2,081 - - 1,310 3,391Unrealized exchange gain 571 7,949 - - 8,520
$ 617,497 $ 227,575 $ 42,667 $ 1,310 $ 889,049
e. Items for which no deferred tax assets have been recognized
December 312015 2014
Deductible temporary differencesCumulative losses of subsidiaries $ - $ 20,742
f. As of December 31, 2015, profits attributable to the following expansion projects were exempted from income tax for a five-year period:
Expansion Project Tax-exemption Period
Investments in production of intelligent integrated commodities 2011-2015
g. Integrated income tax
December 312015 2014
Unappropriated earningsGenerated on and after January 1, 1998 $ 7,098,449 $ 6,353,273
Imputation credits accounts $ 608,917 $ 271,571
For the Year Ended December 312015 2014
Creditable ratio for distribution of earning 15.07% 13.14%
-159-

h. Income tax assessments
The Company’s tax returns through 2010 have been assessed by the tax authorities. The Company disagreed with the tax authorities’ assessment of its 2008 and 2009 tax returns and applied for reexamination. Nevertheless, to be conservative, the Company provided for the income tax assessed by the tax authorities.
19. EARNINGS PER SHARE
Unit: NT$ Per Share
For the Year Ended December 312015 2014
Basic earnings per share $ 8.08 $ 7.80Diluted earnings per share $ 8.05 $ 7.77
The earnings and weighted average number of ordinary shares outstanding in the computation of earnings per share were as follows:
Net Profit for the Year
For the Year Ended December 312015 2014
Earnings used in the computation of basic earnings per share $ 5,104,346 $ 4,907,648Effect of dilutive potential ordinary shares:
Convertible bonds - 21
Earnings used in the computation of diluted earnings per share $ 5,104,346 $ 4,907,669
Weighted Average Number of Ordinary Shares Outstanding (In Thousand Shares)
For the Year Ended December 312015 2014
Weighted average number of ordinary shares in computation of basic earnings per share 631,633 628,853
Effect of dilutive potential ordinary shares:Convertible bonds - 18Employee share options 1,372 2,367Employees’ compensation or bonus issue to employees 1,202 336
Weighted average number of ordinary shares used in the computation of diluted earnings per share 634,207 631,574
If the Company offered to settle bonuses paid to employees in cash or shares, the Company assumed the entire amount of the compensation or bonus would be settled in shares, and the resulting potential shares will be included in the weighted average number of shares outstanding used in the computation of diluted earnings per share, if the effect is dilutive. Such dilutive effect of the potential shares was included in the computation of diluted earnings per share until the number of shares to be distributed to employees is resolved in the following year.
-160-

20. SHARE-BASED PAYMENT ARRANGEMENTS
Qualified employees of the Company and its subsidiaries were granted 5,000 options in August 2014, 3,000 options in July 2010, and 10,000 options in December 2009. Each option entitles the holder to subscribe for one thousand common shares of the Company. The holders of these shares include employees whom meet certain criteria net by the Company, from both domestic and overseas subsidiaries in which the Company directly or indirectly invests over 50%. Options issued in August 2014, July 2010, and December 2009 are valid for six, five and five years, respectively. All are exercisable at certain percentages after the second anniversary year from the grant date. Options granted in 2009 and 2010 had at an exercise price equal to the closing price of the Company’s common shares listed on the grant date and the exercise price of those granted in 2014 was NT$100 per share. For any subsequent changes in the Company’s paid-in capital, the exercise price and the number of options will be adjusted accordingly.
Information on employee share options as of December 31, 2015 and 2014 was as follows:
2015 2014
Employee Share Options
Number of Options (In Thousands)
Weighted-averageExercise
Price (NT$)
Number of Options (In Thousands)
Weighted-averageExercise
Price (NT$)
Balance at January 1 5,644 $ 94.10 5,300 $ 48.80Options granted - - 5,000 100.00Options exercised (644) 47.95 (4,656) 45.98
Balance at December 31 5,000 100.00 5,644 94.10
Options exercisable, end of the year - - 644 48.30
Weighted-average fair value of options granted (NT$) $ - $145.77-$150.16
The weighted-average share price at the date of execise of share options for the years ended December 31, 2015 and 2014 were from NT$198 to NT$278 and from NT$189 to NT$280.5, respectively.
Information about outstanding options as of December 31, 2015 and 2014 was as follows:
For the Year Ended December 312015 2014
Employee Share OptionsExercise Price
(NT$)
Weighted-average
RemainingContractual Life (Years)
Exercise Price (NT$)
Weighted-average
RemainingContractual Life (Years)
Issuance in 2014 $100.00 4.63 $100.00 5.63Issuance in 2010 - - 48.30 0.53
-161-

Options granted in 2014 were priced using the Black-Scholes model, and the inputs to the model were as follows:
2014 2010 2009
Grant-date share price (NT$) $239.5 $67.4 $61.9Exercise price (NT$) $100 $67.4 $61.9Expected volatility 28.28%-29.19% 34.11%-35.15% 37.78%-35.22%Expected life (years) 4-5.5 years 3.5-4.5 years 3.5-4.5 yearsExpected dividend yield 0% 0% 0%Risk-free interest rate 1.07%-1.30% 0.92%-1.10% 0.58-0.79%
Expected volatility was based on the historical share price volatility over the past five years.
Compensation cost recognized was $261,877 thousand and $111,393 thousand for the years ended December 31, 2015 and 2014, respectively.
21. EQUITY TRANSACTIONS WITH NONCONTROLLING INTERESTS
a. In November 2013, the Company acquired an additional 0.03% equity in ALTC, increasing its interest to 100%. In the first quarter of 2014, the Company sold 10.27% of its holding of ALTC shares to ALTC’s employees; in the second and third quarters of 2014, the Company bought 0.14% and 0.06%, respectively, of ALTC’s outstanding shares. These share transactions reduced its continuing interest from 100% to 89.93%.
b. AdvanPOS issued ordinary shares for the exercise of employee share options, decreasing the Company’s holding interest by 8.08% since 2014. In the fourth quarter of 2015 and 2014, the Company subscribed for an additional 6,533 thousand shares and 1,127 thousand shares of AdvanPOS, increasing its continuing interest by 37.89%. These transactions increased its continuing from 70.19% to 100.00%.
c. The Company merged with Netstar at the end of the third quarter of 2014 as a result of investment restructuring.
The above transactions were accounted for as equity transactions, since the Company did not cease to have control over these subsidiaries. For more detailed information, refer to Note 25 to consolidated financial report for 2015.
22. OPERATING LEASE ARRANGEMENTS
The Company as Lessee
Operating leases are mainly leases of warehouses with lease term of 1 year. The future minimum lease payments of non-cancellable operating lease commitments were as follows:
December 312015 2014
Not later than 1 year $ 5,352 $ 5,942
-162-
The lease payments recognized in profit or loss for the current year were as follows:
For the Year Ended December 312015 2014
Minimum lease payment $ 15,455 $ 21,200
23. CAPITAL MANAGEMENT
The Company manages its capital to ensure it will be able to continue as going concerns while maximizing the return to stakeholders through the optimization of the debt and equity balance. The Company’s overall strategy remains unchanged from 2014 through 2015.
The capital structure of the Company consists of net debt (borrowings offset by cash and cash equivalents) and equity of the Company (comprising issued capital, reserves, retained earnings and other equity.
The Company is not subject to any externally imposed capital requirements.
Key management personnel of the Company review the capital structure on a quarterly basis. As part of this review, the key management personnel consider the cost of capital and the risks associated with each class of capital. Based on recommendations of the key management personnel, in order to balance the overall capital structure, the Company may adjust the amount of dividends paid to shareholders, the number of new shares issued, and the amount of new debt issued.
24. FINANCIAL INSTRUMENTS
a. Fair value of financial instruments that are measured at fair value on a recurring basis
1) Fair value hierarchy
December 31, 2015
Level 1 Level 2 Level 3 Total
Financial assets at FVTPLDerivative financial assets $ - $ 7,391 $ - $ 7,391
Available-for-sale financial assetsSecurities listed in ROC
Equity securities $ 1,700,814 $ - $ - $ 1,700,814
Financial liabilities at FVTPLDerivative financial liabilities $ - $ 6,352 $ - $ 6,352
-163-

December 31, 2014
Level 1 Level 2 Level 3 Total
Financial assets at FVTPLDerivative financial assets $ - $ 14,879 $ - $ 14,879
Available-for-sale financial assetsSecurities listed in ROC
Equity securities $ 2,385,937 $ - $ - $ 2,385,937Mutual funds 1,717,756 - - 1,717,756
$ 4,103,693 $ - $ - $ 4,103,693
Financial liabilities at FVTPLDerivative financial liabilities $ - $ 8,698 $ - $ 8,698
There were no transfers between Level 1 and 2 in the current and prior periods.
2) Valuation techniques and inputs applied for the purpose of measuring Level 2 fair value measurement
Derivatives held by the Company were foreign currency forward contracts, whose fair values were calculated using discounted cash flow. Future cash flows are estimated based on observable forward exchange rates at the end of the reporting period and contract forward rates, discounted at a rate that reflects the credit risk of various counterparties.
b. Categories of financial instruments
December 312015 2014
Financial assets
Fair value through profit or loss (FVTPL)Held for trading $ 7,391 $ 14,879
Loans and receivables (Note 1) 6,112,664 6,204,574Available-for-sale financial assets 1,700,814 4,103,693
Financial liabilities
Fair value through profit or loss (FVTPL)Held for trading 6,352 8,698
Measured at amortized cost (Note 2) 5,842,525 5,282,353
Note 1: The balances included loans and receivables measured at amortized cost, which comprise cash and cash equivalents, note receivables, trade receivables and other receivables (including those due from related parties).
Note 2: The balances included financial liabilities measured at amortized cost, which comprise trade and other payables (including those to related parties).
-164-

c. Financial risk management objectives and policies
The Company’s major financial instruments include equity investments, trade receivables and trade payables. The Company’s Corporate Treasury function provides services to the business, coordinates access to domestic and international financial markets, monitors and manages the financial risks relating to the operations of the Company through internal risk reports which analyze exposures by degree and magnitude of risks. These risks include market risk (including currency risk, interest rate risk and other price risk), credit risk and liquidity risk.
The Company sought to minimize the effects of these risks by using derivative financial instruments to hedge risk exposures. The use of financial derivatives was governed by the Company’s policies approved by the board of directors, which provided written principles on foreign exchange risk, interest rate risk, credit risk, the use of financial derivatives and non-derivative financial instruments, and the investment of excess liquidity. Compliance with policies and exposure limits was reviewed by the internal auditors on a continuous basis. The Company did not enter into trade financial instrument including derivative financial instruments for speculative purposes.
The Corporate Treasury function reported quarterly to the board of directors on the Company’s current derivative instrument management.
1) Market risk
The Company’s activities expose it primarily to financial risks of changes in foreign currency exchange rates (see (a) below) and interest rates (see (b) below). The Company entered into a variety of derivative financial instruments to manage its exposure to foreign currency risk and interest rate risk.
There had been no change to the Company’s exposure to market risks or the manner in which these risks were managed and measured.
a) Foreign currency risk
Several subsidiaries of the Company had foreign currency sales and purchases, which exposed the Company to foreign currency risk. The Company’s forward exchange contracts are used to minimize risks of market price and fluctuations in cash flows; however, because these contracts did not meet the criteria for hedge effectiveness, they were not subject to hedge accounting.
The maturities of the Company’s forward contracts were less than six months, and these contracts did not meet the criteria for hedge accounting.
The carrying amounts of the Company’s foreign currency denominated monetary assets and monetary liabilities (including those eliminated on consolidation) and of the derivatives exposing to foreign currency risk at the end of the reporting period are set out in Notes 29 and 7, respectively.
Sensitivity analysis
The Company was mainly exposed to U.S. dollar, Euro and Chinese Yuan currencies.
The following table details the Company’s sensitivity to a 5% increase in New Taiwan dollars (the functional currency) against the relevant foreign currencies. The 5% sensitivity rate isused when reporting foreign currency risk internally to key management personnel and represents management’s assessment of the reasonably possible change in foreign exchange rates. The sensitivity analysis included only outstanding foreign currency denominated monetary items and foreign currency forward contracts designated as cash flow hedges, and adjusts their translation at the end of the reporting period is adjusted for a 5% change in
-165-

exchange rates. A positive number below indicates an increase in pre-tax profit associated with New Taiwan dollar strengthen 5% against the relevant currency. For a 5% weakening of New Taiwan dollar against the relevant currency, there would be an equal and opposite impact on pre-tax profit and the balances below would be negative.
U.S. Dollar Impact Euro Impact Chinese Yuan Impact2015 2014 2015 2014 2015 2014
Profit or loss $ 33,883(Note 1)
$ 45,210(Note 1)
$ 41,827(Note 2)
$ 55,691(Note 2)
$ 41,897(Note 3)
$ 41,358(Note 3)
Note 1: This was mainly attributable to the exposure outstanding on U.S. dollars denominated cash, trade receivables and trade payables, which were not hedged at the end of the reporting period.
Note 2: This was mainly attributable to the exposure outstanding on Euro denominated cash, trade receivables and trade payables, which were not hedged at the end of the reporting period.
Note 3: This was mainly attributable to the exposure outstanding on Renminbi denominated cash, trade receivables and trade payables.
b) Interest rate risk
The Company’s floating-rate bank savings are exposed to risk of changes in interest rates. The Company’s management monitors fluctuations in market interest rates regularly to ensure that interest rate risks are minimized.
The Company’s fixed-term bank deposits are exposed to fair value interest rate risk; however, this expected risk is insignificant.
The carrying amount of the Company’s financial assets and financial liabilities with exposure to interest rates at the end of the reporting period were as follows:
December 312015 2014
Fair value interest rate riskFinancial assets $ - $ 201,962
Cash flow interest rate riskFinancial assets 813,331 862,306
Sensitivity analysis
The sensitivity analyses below were determined based on the Company’s exposure to interest rates for non-derivative instruments at the end of the reporting period. For floating rate liabilities, the analysis was prepared assuming the amount of the liability outstanding at the end of the reporting period was outstanding for the whole year. A 50 basis point increase ordecrease was used when reporting interest rate risk internally to key management personnel and represents management assessment of the reasonably possible change in interest rates.
If interest rates had been 50 basis points higher and all other variables were held constant, the Company’s pre-tax profit for the years ended December 31, 2015 and 2014 would increase by $4,067 thousand and $4,312 thousand, respectively. Had interest rates been 50 basis points lower, the effects on the Company’s pre-tax profit would have been of the same amounts but negative. The source of the negative effects would have been mainly the floating-interest rates on bank savings.
-166-

c) Other price risk
The Company was exposed to equity price risk through its investments in listed equity securities and open-end mutual funds. The Company manages this exposure by maintaining a portfolio of investments with different risks. The Company’s equity price risks was mainly concentrated on open-end mutual funds and equity instruments trading in the Taiwan stock exchange.
Sensitivity analysis
The sensitivity analyses below were determined based on the exposure to equity price risks at the end of the reporting period.
If equity prices had been 1% higher, pretax other comprehensive income for the years ended December 31, 2015 and 2014 would have increased by $17,008 thousand and $41,037 thousand, respectively, as a result of changes in fair value of available-for-sale investments. Had equity prices been 1% lower, the effects on pre-tax other comprehensive gains would have been of the same amounts but negative.
2) Credit risk
Credit risk refers to the risk that counterparty will default on its contractual obligations resulting in financial loss to the Company. As at the end of the reporting period, the Company’s maximum exposure to credit risk which will cause a financial loss to the Company due to failure to discharge an obligation by the counterparties arises from the carrying amount of the respective recognized financial assets as stated in the balance sheets.
In order to minimize credit risk, the management of the Company has delegated a team responsible for determining of credit limits, credit approvals and other monitoring procedures to ensure that follow-up action is taken to recover overdue debts. In addition, the Company reviews the recoverable amount of each individual trade debt at the end of the reporting period to ensure that adequate allowance are made for irrecoverable amounts. In this regard, management believes the Company’s credit risk as significantly reduced.
Trade receivables consisted of a large number of customers, spread across diverse industries and geographical areas. The Company did transactions with a large number of unrelated customers and, thus, no concentration of credit risk was observed.
3) Liquidity risk
The Company manages liquidity risk by monitoring and maintaining a level of cash and cash equivalents deemed adequate to finance the Company’s operations and mitigate the effects of fluctuations in cash flows. In addition, management monitors the utilization of bank borrowings and ensures compliance with loan covenants.
Bank borrowings are a significant source of the Company’s liquidly. As of December 31, 2015 and 2014, the Company had available unutilized short-term bank loan facilities set out in (c) below.
Ultimate responsibility for liquidity risk management rests with the board of directors, which has built an appropriate liquidity risk management framework for the Company’s short, medium and long-term funding and liquidity management requirements. The Company manages liquidity risk by maintaining adequate reserves and continuously monitoring forecast and actual cash flows as well as matching the maturity profiles of financial assets and liabilities.
-167-
a) Liquidity and interest risk rate tables for nonderivative financial liabilities
The following table details the Company’s remaining contractual maturity for its non-derivative financial liabilities with agreed-upon repayment periods. The tables had been drawn up based on the undiscounted cash flows of financial liabilities from the earliest date on which the Company can be required to pay.
Specifically, bank loans with a repayment on demand clause were included in the earliest time band regardless of the probability of the banks choosing to exercise their rights. The maturity dates for other non-derivative financial liabilities were based on the agreed repayment dates.
For the liabilities with floating interests, the undiscounted amount was derived from the interest rate curve at the end of the reporting period.
December 31, 2015
On Demand or Less than
1 Month 1-3 Months
Over3 Months to
1 YearOver 1 Year -
5 Years
Nonderivative financial liabilities
Noninterest bearing $ 3,017,559 $ 1,790,626 $ 1,034,340 $ -
December 31, 2014
On Demand or Less than
1 Month 1-3 Months
Over3 Months to
1 YearOver 1 Year -
5 Years
Nonderivative financial liabilities
Noninterest bearing $ 2,319,821 $ 2,076,529 $ 886,003 $ -
The amounts included above for variable interest rate instruments for non-derivative financial liabilities were subject to change if variable interest rates at the end of the reporting period differed from estimates of interest rates.
-168-

b) Liquidity and interest risk rate tables for derivative financial liabilities
The following tables show the Company’s liquidity analysis of its derivative financial instruments. The tables were based on the undiscounted gross contractual net cash inflows and outflows on these derivative instruments that settle on a net basis, and the undiscounted gross inflows and outflows on those derivatives that require gross settlement. When the amount payable or receivable is not fixed, the amount disclosed has been determined by reference to the projected interest rates as illustrated by the yield curves at the end of the reporting period.
December 31, 2015
On Demand or Less than
1 Month 1-3 Months
Over3 Months to
1 Year Total
Gross settled
Foreign exchange forward contractsInflows $ 314,246 $ 523,146 $ 93,795 $ 931,187Outflows 310,013 526,535 93,600 930,148
$ 4,233 $ (3,389) $ 195 $ 1,039
December 31, 2014
On Demand or Less than
1 Month 1-3 Months
Over3 Months to
1 Year Total
Gross settled
Foreign exchange forward contractsInflows $ 229,050 $ 602,341 $ 5,024 $ 836,415Outflows 225,029 600,162 5,043 830,234
$ 4,021 $ 2,179 $ (19) $ 6,181
c) Financing facilities
December 312015 2014
Unsecured bank loan facilitiesAmount used $ - $ -Amount unused 3,148,900 3,091,350
$ 3,148,900 $ 3,091,350
-169-

25. TRANSACTIONS WITH RELATED PARTIES
Details of transactions between the Company and its related parties are disclosed below.
a. Sales of goods
For the Year Ended December 31Related Party Categories 2015 2014
Subsidiaries $ 21,850,199 $ 19,470,162Associates 29,337 80,889Other related parties - 221
$ 21,879,536 $ 19,551,272
b. Purchases of goods
For the Year Ended December 31Related Party Categories 2015 2014
Subsidiaries $ 15,254,030 $ 14,201,284Associates 22,241 24,357
$ 15,276,271 $ 14,225,641
c. Receivables from related parties (excluding loans to related parties)
December 31Line Item Related Party Categories 2015 2014
Account receivables - related parties Subsidiaries $ 3,961,514 $ 4,009,011Associates 16,485 5,400
$ 3,977,999 $ 4,014,411
Note receivable Associates $ 183 $ 370
The outstanding trade receivables from related parties are unsecured. For the years ended December 31, 2015 and 2014 no impairment loss was recognized for trade receivables from related parties.
d. Payables to related parties (excluding loans from related parties)
December 31Related Party Categories 2015 2014
Subsidiaries $ 2,685,959 $ 2,432,390Associates 1,171 1,546
$ 2,687,130 $ 2,433,936
The outstanding trade payables from related parties are unsecured.
-170-

e. Other receivables from related parties (excluding loans to related parties)
December 31Related Party Categories 2015 2014
Subsidiaries $ 15,596 $ 15,641
f. Property, plant and equipment acquired
PriceFor the Year Ended December 31
Related Party Categories 2015 2014
Subsidiaries $ 42,912 $ -Other related parties - 193,240
$ 42,912 $ 193,240
g. Loans to related parties (under other receivables from related parties)
December 31Related Party Categories 2015 2014
Interest income
Subsidiaries $ - $ 1,954
The Company provided unsecured short-term loans to AEU, at rates comparable to market interests.
h. Other transactions with related parties
Operating ExpensesFor the Year Ended December 31
2015 2014
Administration expensesSubsidiaries $ 13,244 $ 12,229
Rent expensesSubsidiaries $ 1,518 $ 552Other related parties - 4,405
$ 1,518 $ 4,957
OthersSubsidiaries $ 2,391 $ -
Other IncomeFor the Year Ended December 31
2015 2014
RoyaltiesSubsidiaries $ - $ 439,706
-171-
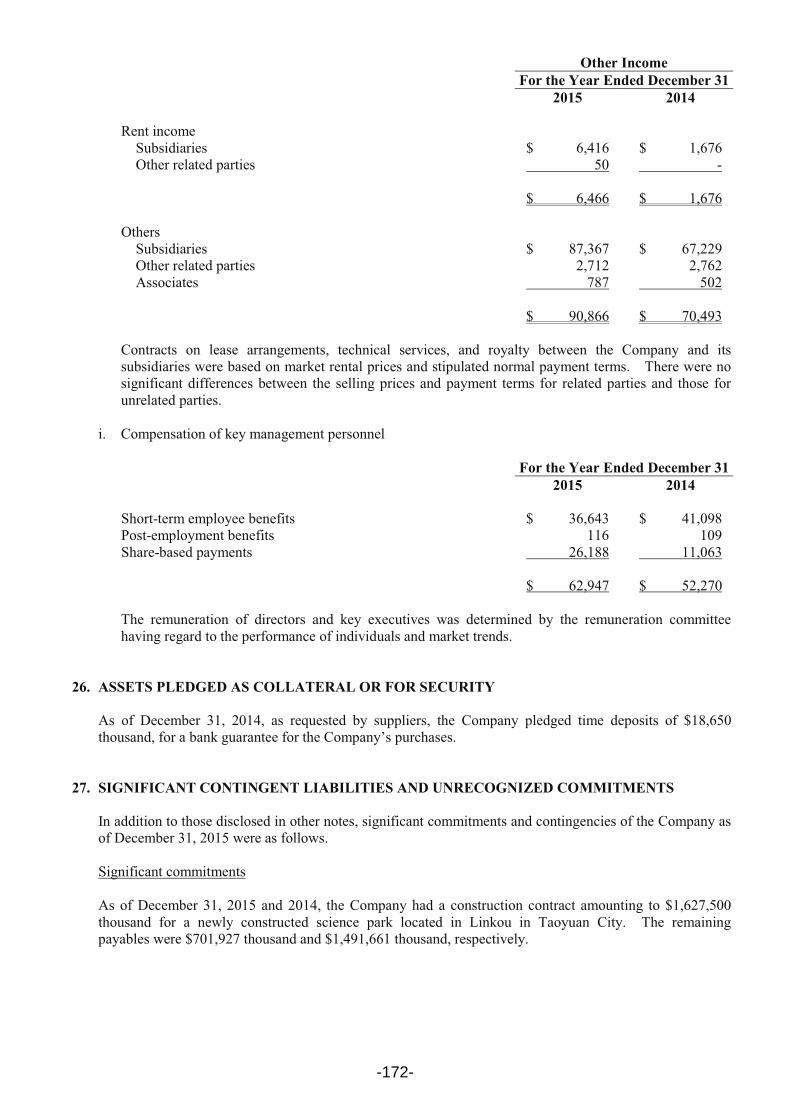
Other IncomeFor the Year Ended December 31
2015 2014
Rent incomeSubsidiaries $ 6,416 $ 1,676Other related parties 50 -
$ 6,466 $ 1,676
OthersSubsidiaries $ 87,367 $ 67,229Other related parties 2,712 2,762Associates 787 502
$ 90,866 $ 70,493
Contracts on lease arrangements, technical services, and royalty between the Company and its subsidiaries were based on market rental prices and stipulated normal payment terms. There were no significant differences between the selling prices and payment terms for related parties and those for unrelated parties.
i. Compensation of key management personnel
For the Year Ended December 312015 2014
Short-term employee benefits $ 36,643 $ 41,098Post-employment benefits 116 109Share-based payments 26,188 11,063
$ 62,947 $ 52,270
The remuneration of directors and key executives was determined by the remuneration committee having regard to the performance of individuals and market trends.
26. ASSETS PLEDGED AS COLLATERAL OR FOR SECURITY
As of December 31, 2014, as requested by suppliers, the Company pledged time deposits of $18,650 thousand, for a bank guarantee for the Company’s purchases.
27. SIGNIFICANT CONTINGENT LIABILITIES AND UNRECOGNIZED COMMITMENTS
In addition to those disclosed in other notes, significant commitments and contingencies of the Company as of December 31, 2015 were as follows.
Significant commitments
As of December 31, 2015 and 2014, the Company had a construction contract amounting to $1,627,500 thousand for a newly constructed science park located in Linkou in Taoyuan City. The remaining payables were $701,927 thousand and $1,491,661 thousand, respectively.
-172-

28. SIGNIFICANT EVENTS AFTER THE REPORTING PERIOD
To expand global brand marketing in industrial network communications, the Company made arrangements to acquire 100% equity in B+B SmartWorx Inc. from Graham Partners, for $3,300,000 thousand (US$99,850 thousand) in November 2015. The Company and its subsidiary ANA will invest jointly to obtain all interest in B+B SmartWorx, Inc. As of December 31, 2015, the Company had paid $2,279,881 thousand, which was recognized as prepayments for investment. The transaction was scheduled for completion by January 2016.
On March 4, 2016 the Company’s board of directors approved ATC (HK) to complete an arrangement with Yeh-Chiang Technology (Cayman) to acquire Yeh-Chiang Technology Kun Shan Co., Ltd. at an acquisition cost of RMB93,000 thousand (around $480,000 thousand). The purpose of this acquisition was to arrange future product line, establish a machinery plant, and expand operations in China.
Please refer to Note 32-“Significant Events after the Reporting Period” for more information on the acquisition in B+B SmartWorx, Inc. and Yeh-Chiang Technology Co. Ltd.
29. SIGNIFICANT ASSETS AND LIABILITIES DENOMINATED IN FOREIGN CURRENCIES
The following information was aggregated by the foreign currencies other than functional currencies of the group entities and the exchange rates between foreign currencies and respective functional currencies were disclosed. The significant assets and liabilities denominated in foreign currencies were as follows:
December 31, 2015
Foreign Currencies Exchange Rate
Carrying Amount
Financial assets
Monetary itemsUSD $ 84,470 32.825 (USD:NTD) $ 2,772,728RMB 328,421 4.9950 (RMB:NTD) 1,640,463EUR 24,408 35.880 (EUR:NTD) 875,759
$ 5,288,950
Non-monetary itemsSubsidiaries and associates accounted
for using the equity methodUSD 230,225 32.825 (USD:NTD) $ 7,557,136EUR 29,132 35.880 (EUR:NTD) 1,045,256KRW 8,311,195 0.0280 (KRW:NTD) 232,713JPY 678,922 0.2730 (JPY:NTD) 185,346
$ 9,020,451
Financial liabilities
Monetary itemsUSD 63,419 32.825 (USD:NTD) $ 2,081,729RMB 207,665 4.9950 (RMB:NTD) 1,037,287
$ 3,119,016
-173-

December 31, 2014
Foreign Currencies Exchange Rate
Carrying Amount
Financial assets
Monetary itemsRMB $ 489,568 5.092 (RMB:NTD) $ 2,492,880USD 76,271 31.65 (USD:NTD) 2,413,977EUR 17,712 38.47 (EUR:NTD) 681,381
$ 5,588,238
Non-monetary itemsSubsidiaries and associates accounted
for using the equity methodUSD 224,549 31.65 (USD:NTD) $ 7,106,976EUR 28,377 38.47 (EUR:NTD) 1,091,663KRW 8,813,163 0.029 (KRW:NTD) 255,582JPY 559,607 0.265 (JPY:NTD) 148,296SGD 4,278 23.94 (JPY:NTD) 102,415
$ 8,704,932
Financial liabilities
Monetary itemsUSD 46,439 31.65 (USD:NTD) $ 1,469,794RMB 262,127 5.092 (RMB:NTD) 1,334,751
$ 2,804,545
For the years ended December 2015 and 2014, realized and unrealized net foreign exchange gains (losses) were $(88,859) thousand and $53,744 thousand, respectively. It is impractical to disclose net foreign exchange gains (losses) by each significant foreign currency due to the variety of the foreign currency transactions.
30. SEPARATELY DISCLOSED ITEMS
a. Information on significant transactions and b. information on investees:
1) Financing provided to others. (Table 1)
2) Endorsement/guarantee provided. (Table 2)
3) Marketable securities held (excluding investment in subsidiaries and associates). (Table 3)
4) Marketable securities acquired and disposed at costs or prices at least NT$300 million or 20% of the paid-in capital. (Table 4)
5) Acquisition of individual real estate at costs of at least NT$300 million or 20% of the paid-in capital. (None)
-174-

6) Disposal of individual real estate at prices of at least NT$300 million or 20% of the paid-in capital. (None)
7) Total purchases from or sales to related parties amounting to at least NT$100 million or 20% of the paid-in capital. (Table 5)
8) Receivables from related parties amounting to at least NT$100 million or 20% of the paid-in capital. (Table 6)
9) Transactions of financial instruments. (Notes 7 and 24)
10) Name, locations, and other information of investees. (Table 7)
c. Information on investments in mainland China
1) Information on any investee company in mainland China, showing the name, principal business activities, paid-in capital, method of investment, inward and outward remittance of funds, shareholding ratio, investment gains or losses, carrying amount of the investment at the end of the period, repatriated investment gains, and limit on the amount of investment in the mainland China area. (Table 8)
2) Any of the following significant transactions with investee companies in mainland China, either directly or indirectly through a third area, their prices, and payment terms, and unrealized gains or losses. Refer to Table 5.
-175-

TA
BLE
1
AD
VA
NT
EC
H C
O.,
LT
D. A
ND
INV
EST
EE
S
FIN
AN
CIN
G P
RO
VID
ED
TO
OTH
ER
SFO
R T
HE
YE
AR
EN
DE
D D
EC
EM
BE
R 3
1, 2
015
(In
Tho
usan
ds o
f New
Tai
wan
Dol
lars
, Unl
ess S
tate
d O
ther
wis
e)
No.
(Not
e A
)L
ende
rB
orro
wer
Fina
ncia
l Sta
tem
ent
Acc
ount
Rel
ated
Pa
rtie
s
Cre
dit L
ine
(Not
e D
)A
ctua
l Bor
row
ing
Inte
rest
R
ate
(%)
Nat
ure
of
Fina
ncin
g
Bus
ines
s T
rans
actio
n A
mou
nts
Rea
sons
for
Shor
t-ter
mFi
nanc
ing
Allo
wan
ce fo
r Im
pair
men
t Los
s
Col
late
ral
Fina
ncin
g L
imit
for
Eac
h Bo
rrow
er
Agg
rega
te
Fina
ncin
g L
imits
Hig
hest
Bal
ance
for
the
Peri
odE
ndin
g Ba
lanc
e E
ndin
g Ba
lanc
eIt
emV
alue
1A
EUH
AEU
Acc
ount
s rec
eiva
ble
-rel
ated
pa
rties
Yes
$26
,910
(EU
R75
0th
ousa
nd)
$26
,910
(EU
R75
0th
ousa
nd)
$-
4Sh
ort-t
erm
fin
anci
ng$
-Fi
nanc
ing
need
$-
Non
eN
one
$2,
330,
750
(Not
e C
)$
4,66
1,50
0(N
ote
C)
2A
NA
AK
MC
Acc
ount
s rec
eiva
ble
-rel
ated
pa
rties
Yes
134,
583
(US$
4,10
0th
ousa
nd)
134,
583
(US$
4,10
0th
ousa
nd)
-2
Shor
t-ter
m
finan
cing
-Fi
nanc
ing
need
-N
one
Non
e2,
330,
750
(Not
e C
)4,
661,
500
(Not
e C
)
3B
ette
r Aut
o H
oldi
ngs L
imite
d(B
ette
r Aut
o)D
ongg
uan
Pou
Yue
n D
igita
l Te
chno
logy
Co.
, Ltd
.A
ccou
nts r
ecei
vabl
e -r
elat
ed
parti
esY
es22
,577
(RM
B4,
520
thou
sand
)
22,5
77(R
MB
4,52
0th
ousa
nd)
22,5
77(R
MB
4,52
0th
ousa
nd)
-Sh
ort-t
erm
fin
anci
ng-
Fina
ncin
g ne
ed-
Non
eN
one
2,33
0,75
0(N
ote
C)
4,66
1,50
0(N
ote
C)
Don
ggua
n Po
u Y
uen
Dig
ital
Tech
nolo
gy C
o., L
td.
Acc
ount
s rec
eiva
ble
-rel
ated
pa
rties
Yes
16,4
13(U
S$50
0th
ousa
nd)
16,4
13(U
S$50
0th
ousa
nd)
16,4
13(U
S$50
0th
ousa
nd)
-Sh
ort-t
erm
fin
anci
ng-
Fina
ncin
g ne
ed-
Non
eN
one
2,33
0,75
0(N
ote
C)
4,66
1,50
0(N
ote
C)
4A
dvan
tech
Cor
pora
te
Inve
stm
ent
Adv
anPO
SA
ccou
nts r
ecei
vabl
e -r
elat
ed
parti
esY
es10
0,00
0-
-1.
15Sh
ort-t
erm
fin
anci
ng-
Fina
ncin
g ne
ed-
Non
eN
one
2,33
0,75
0(N
ote
C)
4,66
1,50
0(N
ote
C)
The
Com
pany
A
ccou
nts r
ecei
vabl
e -r
elat
ed
parti
esY
es50
0,00
050
0,00
0-
1Sh
ort-t
erm
fin
anci
ng-
Fina
ncin
g ne
ed-
Non
eN
one
2,33
0,75
0(N
ote
C)
4,66
1,50
0(N
ote
C)
5C
erm
ate
Tech
nolo
gies
(S
hang
hai)
Inc.
Shen
zhen
Cer
mat
e Te
chno
logi
es In
c.Pr
epay
men
ts o
f inv
ento
ries
Yes
14,9
85(R
MB
3,00
0th
ousa
nd)
14,9
85(R
MB
3,00
0th
ousa
nd)
--
Shor
t-ter
m
finan
cing
-Fi
nanc
ing
need
-N
one
Non
e2,
330,
750
(Not
e C
)4,
661,
500
(Not
e C
)
6A
CA
The
Com
pany
A
ccou
nts r
ecei
vabl
e -r
elat
ed
parti
esY
es10
0,00
010
0,00
0-
1Sh
ort-t
erm
fin
anci
ng-
Fina
ncin
g ne
ed-
Non
eN
one
2,33
0,75
0(N
ote
C)
4,66
1,50
0(N
ote
C)
Not
e A
:In
vest
ee c
ompa
nies
are
num
bere
d se
quen
tially
from
1.
Not
e B
:Th
e ex
chan
ge ra
tes a
s of D
ecem
ber 3
1, 2
015
wer
e EU
R1=
NT$
35.8
8, U
S$1=
NT$
32.8
25 a
nd R
MB
1=N
T$4.
995.
Not
e C
:Th
e fin
anci
ng li
mit
for e
ach
borro
wer
and
for t
he a
ggre
gate
fina
ncin
g w
ere
10%
and
20%
, res
pect
ivel
y, o
f the
Com
pany
’s n
et a
sset
val
ues.
Not
e D
:Th
e m
axim
um b
alan
ce fo
r the
yea
r and
end
ing
bala
nce
are
appr
oved
by
the
boar
d of
dire
ctor
s of f
inan
cier
s.
-176-

TAB
LE 2
AD
VA
NT
EC
H C
O.,
LT
D. A
ND
INV
EST
EE
S
EN
DO
RSE
ME
NT
/GU
AR
AN
TE
E P
RO
VID
ED
FOR
TH
E Y
EA
R E
ND
ED
DE
CE
MB
ER
31,
201
5(I
n T
hous
ands
of N
ew T
aiw
an D
olla
rs, U
nles
s Sta
ted
Oth
erw
ise)
No.
End
orse
r/G
uara
ntor
End
orse
e/G
uara
ntee
Lim
its o
n E
ndor
sem
ent/
Gua
rant
ee G
iven
on
Beh
alf o
f E
ach
Part
y(N
ote
A)
Max
imum
A
mou
nt
End
orse
d/G
uara
ntee
d D
urin
g th
e Pe
riod
Out
stan
ding
E
ndor
sem
ent/
Gua
rant
ee a
t the
En
d of
the
Peri
od
Act
ual
Bor
row
ing
Am
ount
Am
ount
E
ndor
sed/
Gua
rant
eed
by
Col
late
rals
Rat
io o
f A
ccum
ulat
ed
End
orse
men
t/G
uara
ntee
to N
et
Equi
ty in
Late
st
Fina
ncia
l St
atem
ents
(%)
Max
imum
C
olla
tera
l/G
uara
ntee
A
mou
nts
Allo
wab
le(N
ote
B)
End
orse
men
t/G
uara
ntee
G
iven
by
Pare
nt o
n B
ehal
f of
Subs
idia
ries
End
orse
men
t/G
uara
ntee
G
iven
by
Subs
idia
ries
on
Beh
alf o
f Pa
rent
End
orse
men
t/G
uara
ntee
G
iven
on
Beh
alf o
f C
ompa
nies
inM
ainl
and
Chi
na
Nam
eR
elat
ions
hip
0Th
e C
ompa
nyA
CA
Subs
idia
ry$
2,33
0,75
0$
126,
000
$-
$-
$-
-$
6,99
2,25
0Y
NN
Adv
ansu
s Cor
p.Su
bsid
iary
2,33
0,75
013
1,30
0(U
S$4,
000
thou
sand
)
131,
300
(US$
4,00
0th
ousa
nd)
--
0.6
6,99
2,25
0Y
NN
Not
e A
:10
% o
f the
Com
pany
’s n
et a
sset
val
ue.
Not
e B
:30
% o
f the
Com
pany
’s n
et a
sset
val
ue.
Not
e C
:Th
e ex
chan
ge ra
tes a
s of D
ecem
ber 3
1, 2
015
was
US$
1=N
T$32
.825
.
-177-

TAB
LE
3
AD
VA
NT
EC
H C
O.,
LT
D. A
ND
INV
EST
EE
S
MA
RK
ET
AB
LE
SEC
UR
ITIE
S H
EL
DFO
R T
HE
YE
AR
EN
DE
D D
EC
EM
BE
R 3
1, 2
015
(In
Tho
usan
ds o
f New
Tai
wan
Dol
lars
, Unl
ess S
tate
d O
ther
wise
)
Hol
ding
Com
pany
Nam
eT
ype
and
Nam
e of
Mar
keta
ble
Secu
ritie
s R
elat
ions
hip
with
the
Hol
ding
Com
pany
Fina
ncia
l Sta
tem
ent A
ccou
ntD
ecem
ber
31, 2
015
Not
eSh
ares
Car
ryin
g A
mou
ntPe
rcen
tage
of
Ow
ners
hip
Fair
Val
ue
The
Com
pany
Stoc
kA
SUST
ek C
ompu
ter I
nc.
-A
vaila
ble
for s
ale
finan
cial
as
sets
-no
ncur
rent
5,23
9,46
1$
1,42
5,13
30.
71$
1,42
5,13
3N
otes
A a
nd C
Pega
tron
Cor
p.-
3,54
0,57
025
4,92
10.
1425
4,92
1N
otes
A a
nd D
Alli
ed C
ircui
t Co.
, Ltd
.-
1,20
0,00
020
,760
2.41
20,7
60N
ote
A
Adv
ante
ch C
orpo
rate
Inve
stm
ent
Stoc
kA
llied
Circ
uitC
o., L
td.
-Fi
nanc
ial a
sset
s at f
air v
alue
th
roug
h pr
ofit
or lo
ss -
curr
ent
2,80
0,00
048
,440
5.63
48,4
40N
ote
A
Wis
tron
NeW
eb C
orp.
-
129,
900
11,3
920.
0411
,392
Not
e A
Sena
o N
etw
orks
, Inc
. -
36,0
007,
722
0.07
7,72
2N
ote
AN
XP
Sem
icon
duct
ors N
.V.
-5,
350
14,7
95-
14,7
95N
ote
AH
oney
wel
l Int
erna
tiona
l Inc
.-
3,36
511
,440
-11
,440
Not
e A
Goo
gle
Inc.
-C
lass
A-
733
18,7
20-
18,7
20N
ote
ALi
near
Tec
hnol
ogy
Cor
pora
tion
-9,
704
13,5
28-
13,5
28N
ote
ASk
ywor
ks S
olut
ions
Inc.
-
3,26
78,
239
-8,
239
Not
e A
Am
bare
lla, I
nc.
-3,
653
6,68
40.
016,
684
Not
e A
Arm
Hol
ding
s Plc
-6,
056
8,99
3-
8,99
3N
ote
AM
urat
a M
anuf
actu
ring
Co.
, Ltd
. -
2,00
09,
593
-9,
593
Not
e A
Ava
go T
echn
olog
ies L
td.
-1,
034
4,92
7-
4,92
7N
ote
ASo
ftban
k C
orp.
-
2,70
04,
525
-4,
525
Not
e A
CO
BA
N R
esea
rch
and
Tech
nolo
gies
, Inc
.-
Ava
ilabl
e fo
r sal
e fin
anci
al
asse
ts -
nonc
urre
nt60
0,00
033
,257
6.85
33,2
57-
Bro
adTe
c Sy
stem
Inc.
-15
0,00
01,
500
7.50
1,50
0-
Bio
sens
eTek
Cor
p.-
37,5
0037
51.
7937
5-
Jagu
ar T
echn
olog
y-
500,
000
7,50
016
.67
7,50
0-
Alli
ed C
ircui
t Co.
, Ltd
.-
240,
000
4,15
20.
484,
152
Not
e A
Phis
on E
lect
roni
cs C
orpo
ratio
n-
Ava
ilabl
e fo
r sal
e fin
anci
al
asse
ts -
curr
ent
1,50
0,00
034
8,75
00.
7634
8,75
0N
ote
A
Van
guar
d In
tern
atio
nal S
emic
ondu
ctor
Cor
p.
-42
7,00
018
,276
0.03
18,2
76N
ote
AR
adia
nt O
pto-
Elec
troni
cs C
orpo
ratio
n -
500,
000
37,7
000.
1137
,700
Not
e A
Lelo
n El
ectro
nics
Cor
pora
tion
-2,
550,
000
79,8
151.
9479
,815
Not
e A (C
ontin
ued)
-178-

Hol
ding
Com
pany
Nam
eT
ype
and
Nam
e of
Mar
keta
ble
Secu
ritie
s R
elat
ions
hip
with
the
Hol
ding
Com
pany
Fina
ncia
l Sta
tem
ent A
ccou
ntD
ecem
ber
31, 2
015
Not
eSh
ares
Car
ryin
g A
mou
ntPe
rcen
tage
of
Ow
ners
hip
Fair
Val
ue
Fund
Tais
hin
1699
Mon
ey M
arke
t-
Ava
ilabl
e fo
r sal
e fin
anci
al
asse
ts -
curr
ent
1,94
4,66
1$
25,9
74-
$25
,974
Not
e B
Meg
a D
iam
ond
Mon
ey M
arke
t-
20,3
43,3
5225
6,29
2-
256,
292
Not
e B
Fran
klin
Tem
plet
on S
inoA
m F
irst F
und
-20
,453
,638
208,
586
-20
8,58
6N
ote
B
Adv
ansu
s Cor
p.Fu
ndJi
h Su
n M
oney
Mar
ket
-19
,537
,275
285,
664
-28
5,66
4N
ote
BM
ega
Dia
mon
d M
oney
Mar
ket
-1,
375,
894
17,0
29-
17,0
29N
ote
B
Cer
mat
eFu
ndM
ega
Dia
mon
d M
oney
Mar
ket
-3,
565,
982
44,1
36-
44,1
36N
ote
B
AiS
TFu
ndFr
ankl
in T
empl
eton
Sin
oAm
Firs
t Fun
d-
1,38
8,71
214
,162
-14
,162
Not
e B
Jill
Sun
Mon
ey M
arke
t-
2,05
2,11
030
,005
-30
,005
Not
e B
AC
AFu
ndM
ega
Dia
mon
d M
oney
Mar
ket
-18
,860
,525
233,
435
-23
3,43
5N
ote
B
ALT
CFu
ndM
ega
Dia
mon
d M
oney
Mar
ket
-5,
996,
318
74,2
16-
74,2
16N
ote
BC
apita
l Mon
ey M
arke
t -
816,
016
13,0
02-
13,0
02N
ote
B
Adv
anPO
SFu
ndM
ega
Dia
mon
d M
oney
Mar
ket
-24
2,41
13,
000
-3,
000
Not
e B
Adv
ante
ch In
nova
tive
Des
ign
Co.
, Ltd
.Fu
ndC
apita
l Mon
ey M
arke
t -
420,
935
6,70
7-
6,70
7N
ote
B
Adv
ante
ch iF
acto
ry C
o., L
td.
Fund
Cap
ital M
oney
Mar
ket
-3,
708,
709
59,0
94-
59,0
94N
ote
B
Not
e A
:M
arke
t val
ue w
as b
ased
on
the
clos
ing
pric
e on
Dec
embe
r 31,
201
5.
Not
e B
:M
arke
t val
ue w
as b
ased
on
the
net a
sset
val
ues o
f the
ope
n-en
ded
mut
ual f
unds
on
Dec
embe
r 31,
201
5.
Not
e C
:Th
e am
ount
incl
uded
$1,
128,
800
thou
sand
, the
car
ryin
g va
lue
of 4
,150
,000
shar
es h
eld
in tr
ust w
ith C
TBC
Ban
k.
Plea
se re
fer t
o N
ote
8 of
the
finan
cial
stat
emen
ts fo
r mor
e in
form
atio
n.
Not
e D
:Th
e am
ount
incl
uded
$14
7,60
0 th
ousa
nd, t
he c
arry
ing
valu
e of
2,0
50,0
00 sh
ares
hel
d in
trus
t with
CTB
C B
ank.
Pl
ease
refe
r to
Not
e 8
of th
e fin
anci
al st
atem
ents
for m
ore
info
rmat
ion.
(Con
clud
ed)
-179-

TA
BL
E 4
AD
VA
NT
EC
H C
O.,
LT
D. A
ND
INV
EST
EE
S
MA
RK
ET
AB
LE
SE
CU
RIT
IES
AC
QU
IRE
D A
ND
DIS
POSE
D A
T C
OST
S O
R P
RIC
ES
OF
AT
LE
AST
$30
0 M
ILL
ION
OR
20%
OF
TH
E P
AID
-IN
CA
PIT
AL
FOR
TH
E Y
EA
R E
ND
ED
DE
CE
MB
ER
31,
201
5(I
n T
hous
ands
of N
ew T
aiw
an D
olla
rs, U
nles
s Sta
ted
Oth
erw
ise)
Com
pany
Nam
eT
ype
and
Nam
e of
M
arke
tabl
e Se
curi
ties
Fina
ncia
l Sta
tem
ent
Acc
ount
Cou
nter
part
yR
elat
ions
hip
Beg
inni
ng B
alan
ceA
cqui
sitio
n (N
ote)
Dis
posa
lE
ndin
g B
alan
ce (N
ote)
Shar
esA
mou
nt (C
ost)
Shar
esA
mou
ntSh
ares
Am
ount
Car
ryin
g A
mou
ntG
ain
(Los
s) o
nD
ispo
sal
Shar
esA
mou
nt (C
ost)
The
Com
pany
Fund
Cap
ital M
oney
Mar
ketA
vaila
ble
for s
ale
finan
cial
ass
ets -
curr
ent
--
35,3
57,8
51$
560,
000
86,3
31,6
08$
1,37
3,00
012
1,68
9,45
9$
1,93
5,97
8$
1,93
3,00
0$
2,97
8-
$-
Meg
a D
iam
ond
Mon
ey M
arke
tA
vaila
ble
for s
ale
finan
cial
ass
ets -
curr
ent
--
76,8
53,6
5794
5,00
053
,339
,232
658,
000
130,
192,
889
1,60
8,38
51,
603,
000
5,38
5-
-
CTB
C H
wa-
Win
M
oney
Mar
ket
Fund
Ava
ilabl
e fo
r sal
e fin
anci
al a
sset
s -cu
rren
t
--
--
57,1
41,0
7361
9,00
057
,141
,073
620,
085
619,
000
1,08
5-
-
Tais
hin
1699
Mon
ey
Mar
ket
Ava
ilabl
e fo
r sal
e fin
anci
al a
sset
s -cu
rren
t
--
--
26,8
40,0
1335
7,00
026
,840
,013
357,
630
357,
000
630
--
Fran
klin
Tem
plet
on
Sino
Am
Firs
t Fun
dA
vaila
ble
for s
ale
finan
cial
ass
ets -
curr
ent
--
--
66,7
25,1
1867
8,00
066
,725
,118
678,
870
678,
000
870
--
Stoc
kPe
gatro
n C
orp.
Ava
ilabl
e fo
r sal
e fin
anci
al a
sset
s -no
ncur
rent
--
7,81
4,57
028
1,32
5-
-4,
274,
000
341,
504
153,
864
187,
640
3,54
0,57
012
7,46
1
Adv
ansu
s Cor
p.Fu
ndJi
h Su
n M
oney
M
arke
tA
vaila
ble
for s
ale
finan
cial
ass
ets -
curr
ent
--
7,65
6,35
111
1,15
135
,655
,276
520,
000
23,7
74,3
5234
6,44
434
6,09
634
819
,537
,275
285,
055
Inve
stm
ent p
rodu
ctA
CN
90 d
ays
guar
ante
ed-y
ield
in
vest
men
t pro
duct
de
nom
inat
ed in
R
MB
Ava
ilabl
e fo
r sal
e fin
anci
al a
sset
s -cu
rren
t
--
-54
9,45
0(R
MB
110,
000)
-44
9,55
0(R
MB
90,0
00)
-1,
012,
816
(RM
B20
2,74
5)99
9,00
0(R
MB
200,
000)
13,8
16(R
MB
2,74
5)-
-
AiS
C33
day
s gu
aran
teed
-yie
ld
inve
stm
ent p
rodu
ct
deno
min
ated
in
RM
B
Ava
ilabl
e fo
r sal
e fin
anci
al a
sset
s -cu
rren
t
--
--
-45
4,54
5(R
MB
91,0
00)
-45
7,45
9(R
MB
91,5
79)
454,
545
(RM
B91
,000
)2,
914
(RM
B57
9)-
-
Not
e:
The
exch
ange
rate
as o
f Dec
embe
r 31,
201
5 w
as R
MB
1=N
T$4.
995.
-180-

TAB
LE 5
AD
VA
NT
EC
H C
O.,
LT
D. A
ND
INV
EST
EE
S
TO
TA
L P
UR
CH
ASE
S FR
OM
OR
SA
LE
S T
O R
ELA
TE
D P
AR
TIE
S A
MO
UN
TIN
G T
O A
T L
EA
ST $
100
MIL
LIO
N O
R 2
0% O
F T
HE
PA
ID-I
N C
API
TA
LFO
R T
HE
YE
AR
EN
DE
D D
EC
EM
BE
R 3
1, 2
015
(In
Tho
usan
ds o
f New
Tai
wan
Dol
lars
, Unl
ess S
tate
d O
ther
wise
)
Buy
erR
elat
ed P
arty
Rel
atio
nshi
pT
rans
actio
n D
etai
lsA
bnor
mal
Tra
nsac
tion
Not
es/A
ccou
nts
Rec
eiva
ble
(Pay
able
)N
ote
Purc
hase
/Sa
leA
mou
nt%
to
Tot
alPa
ymen
t Ter
ms
Uni
t Pri
cePa
ymen
t Ter
ms
End
ing
Bal
ance
% to
T
otal
The
Com
pany
AA
USu
bsid
iary
Sale
$(2
11,3
56)
0.73
60-9
0 da
ysC
ontra
ct p
rice
No
sign
ifica
nt d
iffer
ence
in
term
s for
rela
ted
parti
es$
64,9
891.
25
AB
RSu
bsid
iary
Sale
(105
,031
)0.
3690
day
s afte
r mon
th-e
ndC
ontra
ct p
rice
No
sign
ifica
nt d
iffer
ence
in
term
s for
rela
ted
parti
es1,
504
0.03
AC
NSu
bsid
iary
Sale
(5,2
53,5
05)
18.1
245
day
s afte
r mon
th-e
ndC
ontra
ct p
rice
No
sign
ifica
nt d
iffer
ence
in
term
s for
rela
ted
parti
es1,
223,
356
23.6
2N
ote
A
A-D
LoG
Subs
idia
rySa
le(1
35,7
19)
0.47
30 d
ays a
fter i
nvoi
ce d
ate
Con
tract
pric
eN
o si
gnifi
cant
diff
eren
cein
te
rms f
or re
late
d pa
rties
46,1
110.
89
AEU
Subs
idia
rySa
le(3
,532
,528
)12
.18
30 d
ays a
fter m
onth
-end
Con
tract
pric
eN
o si
gnifi
cant
diff
eren
ce in
te
rms f
or re
late
d pa
rties
982,
086
18.9
6
Shan
ghai
Adv
ante
ch In
telli
gent
Se
rvic
es C
o., L
td. (
AiS
C)Su
bsid
iary
Sale
(618
,949
)2.
1345
day
s afte
r mon
th-e
ndC
ontra
ct p
rice
No
sign
ifica
nt d
iffer
ence
in
term
s for
rela
ted
parti
es98
,466
1.90
Not
e B
AJP
Subs
idia
rySa
le(5
08,0
49)
1.75
60-9
0 da
ysC
ontra
ct p
rice
No
sign
ifica
nt d
iffer
ence
in
term
s for
rela
ted
parti
es96
,045
1.85
AK
MC
Subs
idia
rySa
le(1
,396
,273
)4.
8245
day
s afte
r mon
th-e
ndC
ontra
ct p
rice
No
sign
ifica
nt d
iffer
ence
in
term
s for
rela
ted
parti
es16
8,14
23.
25N
ote
C
AK
RSu
bsid
iary
Sale
(801
,727
)2.
7660
day
s afte
r inv
oice
dat
eC
ontra
ct p
rice
No
sign
ifica
nt d
iffer
ence
in
term
s for
rela
ted
parti
es36
,464
0.70
AN
ASu
bsid
iary
Sale
(8,2
55,6
07)
28.7
745
day
s afte
r mon
th-e
ndC
ontra
ct p
rice
No
sign
ifica
nt d
iffer
ence
in
term
s for
rela
ted
parti
es1,
066,
498
20.5
9
ASG
Subs
idia
rySa
le(1
68,2
20)
0.58
60-9
0 da
ysC
ontra
ct p
rice
No
sign
ifica
nt d
iffer
ence
in
term
s for
rela
ted
parti
es26
,056
0.50
Adv
ansu
s Cor
p.Su
bsid
iary
Sale
(499
,193
)1.
7260
-90
days
Con
tract
pric
eN
o si
gnifi
cant
diff
eren
ce in
te
rms f
or re
late
d pa
rties
55,9
441.
08
ATC
Subs
idia
ryPu
rcha
se9,
629,
246
46.3
9U
sual
trad
e te
rms
Con
tract
pric
eN
o si
gnifi
cant
diff
eren
ce in
te
rms f
or re
late
d pa
rties
(1,4
03,4
04)
39.1
3
Adv
ansu
s Cor
p.Su
bsid
iary
Purc
hase
3,63
6,57
717
.52
Usu
al tr
ade
term
sC
ontra
ct p
rice
No
sign
ifica
nt d
iffer
ence
in
term
s for
rela
ted
parti
es(1
,053
,185
)29
.36
AC
ASu
bsid
iary
Purc
hase
1,86
0,63
98.
96U
sual
trad
e te
rms
Con
tract
pric
eN
o si
gnifi
cant
diff
eren
ce in
te
rms f
or re
late
d pa
rties
(195
,485
)5.
45
ATC
The
Com
pany
Pare
nt c
ompa
nySa
le(9
,629
,246
)99
.15
Usu
al tr
ade
term
sC
ontra
ct p
rice
No
sign
ifica
nt d
iffer
ence
in
term
s for
rela
ted
parti
es1,
403,
404
98.0
0
Adv
ansu
s Cor
p.Th
e C
ompa
nyPa
rent
com
pany
Sale
(3,6
36,5
77)
49.7
0U
sual
trad
e te
rms
Con
tract
pric
eN
o si
gnifi
cant
diff
eren
ce in
te
rms f
or re
late
d pa
rties
1,05
3,18
564
.56
(Con
tinue
d)
-181-

Buy
erR
elat
ed P
arty
Rel
atio
nshi
pT
rans
actio
n D
etai
lsA
bnor
mal
Tra
nsac
tion
Not
es/A
ccou
nts
Rec
eiva
ble
(Pay
able
)N
ote
Purc
hase
/Sa
leA
mou
nt%
to
Tot
alPa
ymen
t Ter
ms
Uni
t Pri
cePa
ymen
t Ter
ms
End
ing
Bal
ance
% to
T
otal
AC
ATh
e C
ompa
nyPa
rent
com
pany
Sale
$(1
,860
,639
)81
.31
Usu
al tr
ade
term
sC
ontra
ct p
rice
No
sign
ifica
nt d
iffer
ence
in
term
s for
rela
ted
parti
es$
195,
485
98.0
9
AA
UTh
e C
ompa
nyPa
rent
com
pany
Purc
hase
211,
356
83.1
060
-90
days
Con
tract
pric
eN
o si
gnifi
cant
diff
eren
ce in
te
rms f
or re
late
d pa
rties
(64,
989)
88.1
7
AB
RTh
e C
ompa
nyPa
rent
com
pany
Purc
hase
105,
031
62.5
690
day
s afte
r mon
th-e
ndC
ontra
ct p
rice
No
sign
ifica
nt d
iffer
ence
in
term
s for
rela
ted
parti
es(1
,504
)27
.50
AC
NTh
e C
ompa
nyPa
rent
com
pany
Purc
hase
5,25
3,50
576
.85
45 d
ays a
fter m
onth
-end
Con
tract
pric
eN
o si
gnifi
cant
diff
eren
ce in
te
rms f
or re
late
d pa
rties
(1,2
23,3
56)
80.5
5
A-D
LoG
The
Com
pany
Pare
nt c
ompa
nyPu
rcha
se13
5,71
917
.65
30 d
ays a
fter i
nvoi
ce d
ate
Con
tract
pric
eN
o si
gnifi
cant
diff
eren
ce in
te
rms f
or re
late
d pa
rties
(46,
111)
54.4
7
AEU
The
Com
pany
Pare
nt c
ompa
nyPu
rcha
se3,
532,
528
80.9
730
day
s afte
r mon
th-e
ndC
ontra
ct p
rice
No
sign
ifica
nt d
iffer
ence
in
term
s for
rela
ted
parti
es(9
82,0
86)
100.
00
AiS
CTh
e C
ompa
nyPa
rent
com
pany
Purc
hase
618,
949
54.6
545
day
s afte
r mon
th-e
ndC
ontra
ct p
rice
No
sign
ifica
nt d
iffer
ence
in
term
s for
rela
ted
parti
es(9
8,46
6)63
.63
AJP
The
Com
pany
Pare
nt c
ompa
nyPu
rcha
se50
8,04
991
.95
60-9
0 da
ysC
ontra
ct p
rice
No
sign
ifica
nt d
iffer
ence
in
term
s for
rela
ted
parti
es(9
6,04
5)99
.58
AK
MC
The
Com
pany
Pare
nt c
ompa
nyPu
rcha
se1,
396,
273
15.4
745
day
s afte
r mon
th-e
ndC
ontra
ct p
rice
No
sign
ifica
nt d
iffer
ence
in
term
s for
rela
ted
parti
es(1
68,1
42)
10.7
6
AK
RTh
e C
ompa
nyPa
rent
com
pany
Purc
hase
801,
727
73.0
160
day
s afte
r inv
oice
dat
eC
ontra
ct p
rice
No
sign
ifica
nt d
iffer
ence
in
term
s for
rela
ted
parti
es(3
6,46
4)49
.91
AN
ATh
e C
ompa
nyPa
rent
com
pany
Purc
hase
8,25
5,60
790
.30
45 d
ays a
fter m
onth
-end
Con
tract
pric
eN
o si
gnifi
cant
diff
eren
ce in
te
rms f
or re
late
d pa
rties
(1,0
66,4
98)
94.5
7
ASG
The
Com
pany
Pare
nt c
ompa
nyPu
rcha
se16
8,22
070
.56
60-9
0 da
ysC
ontra
ct p
rice
No
sign
ifica
nt d
iffer
ence
in
term
s for
rela
ted
parti
es(2
6,05
6)66
.74
Adv
ansu
s Cor
p.Th
e C
ompa
nyPa
rent
com
pany
Purc
hase
499,
193
7.55
60-9
0 da
ysC
ontra
ct p
rice
No
sign
ifica
nt d
iffer
ence
in
term
s for
rela
ted
parti
es(5
5,94
4)5.
48
AC
AA
dvan
sus C
orp.
Rel
ated
ent
erpr
ise
Sale
(319
,742
)13
.97
Usu
al tr
ade
term
sC
ontra
ct p
rice
No
sign
ifica
nt d
iffer
ence
in
term
s for
rela
ted
parti
es22
70.
11
ALN
CD
ongg
uan
Pou
Yue
n D
igita
l Te
chno
logy
Co.
, Ltd
.Su
bsid
iary
Sale
(173
,704
)7.
59U
sual
trad
e te
rms
Con
tract
pric
eN
o si
gnifi
cant
diff
eren
ce in
te
rms f
or re
late
d pa
rties
39,6
5445
.14
(Con
tinue
d)
-182-

Buy
erR
elat
ed P
arty
Rel
atio
nshi
pT
rans
actio
n D
etai
lsA
bnor
mal
Tra
nsac
tion
Not
es/A
ccou
nts
Rec
eiva
ble
(Pay
able
)N
ote
Purc
hase
/Sa
leA
mou
nt%
to
Tot
alPa
ymen
t Ter
ms
Uni
t Pri
cePa
ymen
t Ter
ms
End
ing
Bal
ance
% to
T
otal
AK
MC
AC
NR
elat
ed e
nter
pris
eSa
le$
(282
,163
)2.
83U
sual
trad
e te
rms
Con
tract
pric
eN
o si
gnifi
cant
diff
eren
ce in
te
rms f
or re
late
d pa
rties
$75
,626
13.5
0
AiS
CR
elat
ed e
nter
pris
eSa
le(2
26,7
45)
2.28
Usu
al tr
ade
term
sC
ontra
ct p
rice
No
sign
ifica
nt d
iffer
ence
in
term
s for
rela
ted
parti
es20
,640
3.69
ATC
Pare
nt c
ompa
nySa
le(9
,390
,156
)94
.32
Usu
al tr
ade
term
sC
ontra
ct p
rice
No
sign
ifica
nt d
iffer
ence
in
term
s for
rela
ted
parti
es45
7,03
881
.60
Adv
ansu
s Cor
p.A
KM
CR
elat
ed e
nter
pris
eSa
le(2
,634
,209
)36
.00
Usu
al tr
ade
term
sC
ontra
ct p
rice
No
sign
ifica
nt d
iffer
ence
in
term
s for
rela
ted
parti
es44
7,52
227
.43
AiS
CA
KM
CR
elat
ed e
nter
pris
eSa
le(1
01,5
54)
1.39
Usu
al tr
ade
term
sC
ontra
ct p
rice
No
sign
ifica
nt d
iffer
ence
in
term
s for
rela
ted
parti
es19
,019
6.16
AC
NA
iSC
Rel
ated
ent
erpr
ise
Sale
(100
,010
)1.
37U
sual
trad
e te
rms
Con
tract
pric
eN
o si
gnifi
cant
diff
eren
ce in
te
rms f
or re
late
d pa
rties
1,68
10.
10
Adv
ansu
s Cor
p.A
CA
Rel
ated
ent
erpr
ise
Purc
hase
319,
742
4.83
Usu
al tr
ade
term
sC
ontra
ct p
rice
No
sign
ifica
nt d
iffer
ence
in
term
s for
rela
ted
parti
es(2
27)
0.02
Don
ggua
n Po
u Y
uen
Dig
ital
Tech
nolo
gy C
o., L
td.
ALN
CPa
rent
com
pany
Purc
hase
173,
704
83.5
6U
sual
trad
e te
rms
Con
tract
pric
eN
o si
gnifi
cant
diff
eren
ce in
te
rms f
or re
late
d pa
rties
(39,
654)
47.2
9
AC
NA
KM
CR
elat
ed e
nter
pris
ePu
rcha
se28
2,16
34.
13U
sual
trad
e te
rms
Con
tract
pric
eN
o si
gnifi
cant
diff
eren
ce in
te
rms f
or re
late
d pa
rties
(75,
626)
4.98
AiS
CA
KM
CR
elat
ed e
nter
pris
ePu
rcha
se22
6,74
520
.02
Usu
al tr
ade
term
sC
ontra
ct p
rice
No
sign
ifica
nt d
iffer
ence
in
term
s for
rela
ted
parti
es(2
0,64
0)13
.34
ATC
AK
MC
Pare
nt c
ompa
nyPu
rcha
se9,
390,
156
98.3
6U
sual
trad
e te
rms
Con
tract
pric
eN
o si
gnifi
cant
diff
eren
ce in
te
rms f
or re
late
d pa
rties
(457
,038
)97
.06
AK
MC
Adv
ansu
s Cor
p.R
elat
ed e
nter
pris
ePu
rcha
se2,
634,
209
29.1
9U
sual
trad
e te
rms
Con
tract
pric
eN
o si
gnifi
cant
diff
eren
ce in
te
rms f
or re
late
d pa
rties
(447
,522
)28
.65
AiS
CR
elat
ed e
nter
pris
ePu
rcha
se10
1,55
41.
13U
sual
trad
e te
rms
Con
tract
pric
eN
o si
gnifi
cant
diff
eren
ce in
te
rms f
or re
late
d pa
rties
(19,
019)
1.22
AiS
CA
CN
Rel
ated
ent
erpr
ise
Purc
hase
100,
010
1.46
Usu
al tr
ade
term
sC
ontra
ct p
rice
No
sign
ifica
nt d
iffer
ence
in
term
s for
rela
ted
parti
es(1
,681
)1.
09
Not
e A
: U
nrea
lized
gai
n fo
r the
yea
r was
$6,
076
thou
sand
.
Not
e B
: R
ealiz
ed g
ain
for t
he y
ear w
as $
3,56
3 th
ousa
nd.
Not
e C
: R
ealiz
ed g
ain
for t
he y
ear w
as $
1,46
9 th
ousa
nd.
(Con
clud
ed)
-183-
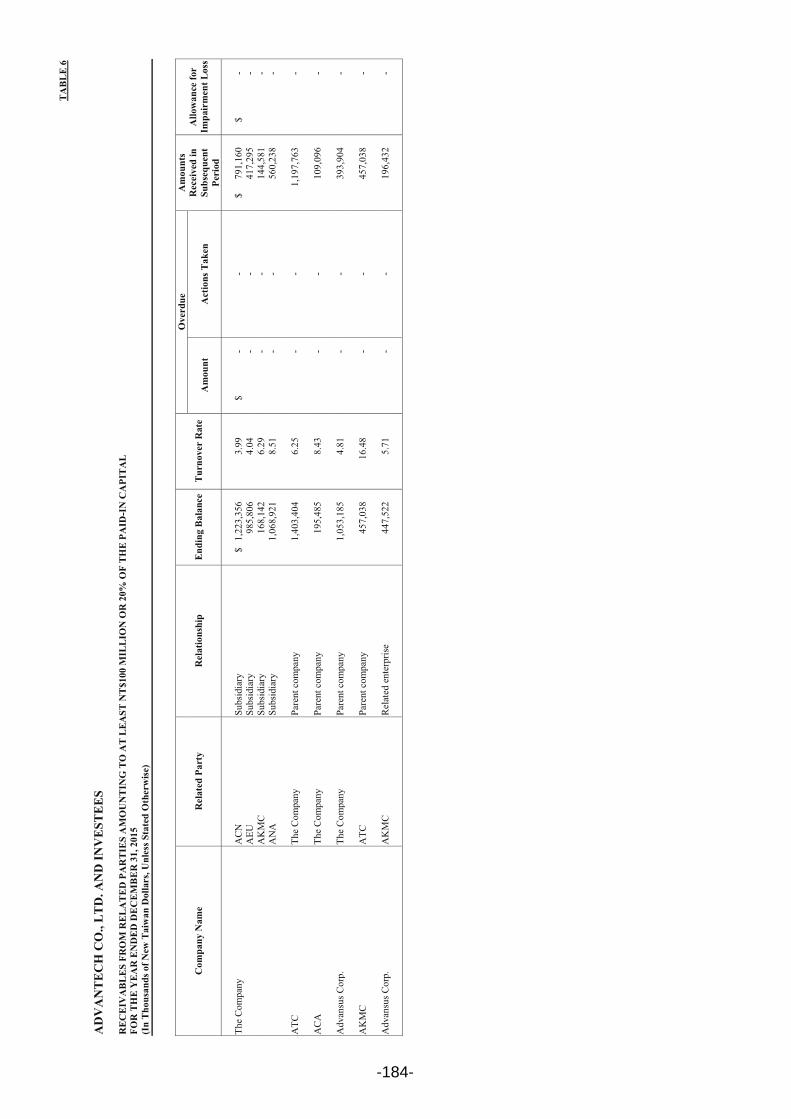
TAB
LE 6
AD
VA
NT
EC
H C
O.,
LT
D. A
ND
INV
EST
EE
S
RE
CE
IVA
BL
ES
FRO
M R
EL
AT
ED
PA
RT
IES
AM
OU
NT
ING
TO
AT
LEA
ST N
T$1
00 M
ILL
ION
OR
20%
OF
THE
PA
ID-I
N C
API
TA
LFO
R T
HE
YE
AR
EN
DE
D D
EC
EM
BE
R 3
1, 2
015
(In
Tho
usan
ds o
f New
Tai
wan
Dol
lars
, Unl
ess S
tate
d O
ther
wise
)
Com
pany
Nam
eR
elat
ed P
arty
Rel
atio
nshi
pE
ndin
g B
alan
ceT
urno
ver
Rat
e
Ove
rdue
Am
ount
s R
ecei
ved
in
Subs
eque
nt
Peri
od
Allo
wan
ce fo
r Im
pair
men
t Los
sA
mou
ntA
ctio
ns T
aken
The
Com
pany
AC
NSu
bsid
iary
$1,
223,
356
3.99
$-
-$
791,
160
$-
AEU
Subs
idia
ry98
5,80
64.
04-
-41
7,29
5-
AK
MC
Subs
idia
ry16
8,14
26.
29-
-14
4,58
1-
AN
ASu
bsid
iary
1,06
8,92
18.
51-
-56
0,23
8-
ATC
The
Com
pany
Pare
nt c
ompa
ny1,
403,
404
6.25
--
1,19
7,76
3-
AC
ATh
e C
ompa
nyPa
rent
com
pany
195,
485
8.43
--
109,
096
-
Adv
ansu
s Cor
p.Th
e C
ompa
nyPa
rent
com
pany
1,05
3,18
54.
81-
-39
3,90
4-
AK
MC
ATC
Pare
nt c
ompa
ny45
7,03
816
.48
--
457,
038
-
Adv
ansu
s Cor
p.A
KM
CR
elat
ed e
nter
pris
e44
7,52
25.
71-
-19
6,43
2-
-184-

TA
BL
E 7
AD
VA
NT
EC
H C
O.,
LT
D. A
ND
INV
EST
EE
S
NA
ME
S, L
OC
AT
ION
S, A
ND
OT
HE
R IN
FOR
MA
TIO
N O
F IN
VE
STE
ES
FOR
TH
E Y
EA
R E
ND
ED
DE
CE
MB
ER
31,
201
5(I
n T
hous
ands
of N
ew T
aiw
an D
olla
rs/F
orei
gn C
urre
ncy,
Unl
ess S
tate
d O
ther
wis
e)
Inve
stor
Com
pany
Inve
stee
Com
pany
Loc
atio
nM
ain
Bus
ines
ses a
nd P
rodu
cts
Inve
stm
ent A
mou
ntB
alan
ce a
s of D
ecem
ber
31, 2
015
Net
Inco
me
(Los
s) o
f the
In
vest
ee
Inve
stm
ent
Gai
n (L
oss)
(Not
e A
)N
ote
Dec
embe
r 31
, 20
15D
ecem
ber
31,
2014
Shar
esPe
rcen
tage
of
Ow
ners
hip
Car
ryin
g V
alue
The
Com
pany
AA
C (B
VI)
BV
IIn
vest
men
t and
man
agem
ent s
ervi
ce$
1,00
0,20
7$
1,00
0,20
729
,623
,834
100.
00$
3,73
5,76
1$
303,
287
$30
6,88
9Su
bsid
iary
ATC
BV
ISa
le o
f ind
ustri
al a
utom
atio
n pr
oduc
ts1,
231,
118
1,23
1,11
840
,850
,000
100.
003,
626,
645
128,
416
134,
333
Subs
idia
ryA
dvan
sus C
orp.
Taip
ei, T
aiw
anPr
oduc
tion
and
sale
of i
ndus
trial
aut
omat
ion
prod
ucts
486,
000
486,
000
36,0
00,0
0010
0.00
999,
983
536,
439
521,
190
Subs
idia
ryA
dvan
tech
Cor
pora
te In
vest
men
tTa
ipei
, Tai
wan
Inve
stm
ent h
oldi
ng c
ompa
ny1,
400,
000
900,
000
150,
000,
000
100.
001,
558,
953
10,3
6210
,472
Subs
idia
ryA
xiom
tek
Taip
ei, T
aiw
anPr
oduc
tion
and
sale
of i
ndus
trial
aut
omat
ion
prod
ucts
249,
059
249,
059
20,5
37,9
8425
.99
450,
246
424,
099
110,
474
Equi
ty-m
etho
d in
vest
eeA
dvan
POS
Taip
ei, T
aiw
anPr
oduc
tion
and
sale
of P
OS
syst
em46
0,57
234
1,99
520
,438
,000
100.
0035
8,66
2(9
,938
)(8
,252
)Su
bsid
iary
ALT
CTa
ichu
ng, T
aiw
anPr
oduc
tion
and
sale
of m
achi
ne c
ontro
l sol
utio
n47
8,82
547
8,82
526
,980
,000
89.9
351
6,62
66,
131
5,73
0Su
bsid
iary
Jan
Hsi
ang
Taip
ei, T
aiw
anEl
ectro
nic
parts
and
com
pone
nts m
anuf
actu
ring
3,71
93,
719
655,
500
28.5
09,
510
(1,1
61)
(332
)Eq
uity
-met
hod
inve
stee
A
MX
Mex
ico
Sale
of i
ndus
trial
aut
omat
ion
prod
ucts
4,92
24,
922
-10
0.00
1,56
292
492
4Su
bsid
iary
A
EUH
Hel
mon
d, T
he N
ethe
rland
sIn
vest
men
t and
man
agem
ent s
ervi
ce1,
219,
124
1,26
2,05
112
,572
,024
100.
0089
8,53
667
,967
68,7
58Su
bsid
iary
ASG
Tech
plac
e, S
inga
pore
Sale
of i
ndus
trial
aut
omat
ion
prod
ucts
27,1
3427
,134
1,45
0,00
010
0.00
82,9
0613
,065
13,0
65Su
bsid
iary
AA
USy
dney
, Aus
tralia
Sale
of i
ndus
trial
aut
omat
ion
prod
ucts
40,6
0040
,600
500,
204
100.
0030
,171
(6,6
48)
(6,6
48)
Subs
idia
ryA
JPTo
kyo,
Japa
nSa
le o
f ind
ustri
al a
utom
atio
n pr
oduc
ts15
,472
15,4
721,
200
100.
0017
9,40
731
,380
31,3
80Su
bsid
iary
AM
YM
alay
sia
Sale
of i
ndus
trial
aut
omat
ion
prod
ucts
35,1
4035
,140
2,00
0,00
010
0.00
36,4
397,
277
7,27
7Su
bsid
iary
AK
RSe
oul,
Kor
eaSa
le o
f ind
ustri
al a
utom
atio
n pr
oduc
ts73
,355
73,3
5560
0,00
010
0.00
202,
503
17,4
6217
,462
Subs
idia
ryA
BR
Sao
Paul
o, B
razi
lSa
le o
f ind
ustri
al a
utom
atio
n pr
oduc
ts43
,216
43,2
161,
794,
996
80.0
048
,320
10,1
268,
101
Subs
idia
ryA
CA
Taip
ei, T
aiw
anPr
oduc
tion
and
sale
of i
ndus
trial
aut
omat
ion
prod
ucts
146,
440
146,
440
8,00
0,00
010
0.00
319,
859
100,
220
105,
075
Subs
idia
ryA
dvan
tech
Inno
vativ
e D
esig
n C
o., L
td.
Taip
ei, T
aiw
anPr
oduc
t des
ign
10,0
00-
1,00
0,00
010
0.00
8,56
9(1
,441
)(1
,441
)Su
bsid
iary
Adv
ante
ch iF
acto
ry C
o., L
td.
Taip
ei, T
aiw
anC
yber
natio
n eq
uipm
ent c
onst
ruct
ion
60,0
00-
6,00
0,00
010
0.00
60,0
88(6
)(6
)Su
bsid
iary
AIN
Indi
aSa
le o
f ind
ustri
al a
utom
atio
n pr
oduc
ts5,
567
5,56
799
9,99
999
.99
13,4
7920
,540
20,5
40Su
bsid
iary
Adv
ante
ch C
orpo
rate
Inve
stm
ent
AiS
TTa
ipei
, Tai
wan
Des
ign,
dev
elop
and
sale
of i
ntel
ligen
t ser
vice
s14
2,06
314
2,06
310
,000
,000
100.
0019
6,15
224
,092
24,0
92Su
bsid
iary
Cer
mat
e Te
chno
logi
es In
c.Ta
ipei
, Tai
wan
Man
ufac
turin
g of
ele
ctro
nic
parts
, com
pute
r, an
d pe
riphe
ral d
evic
es71
,500
71,5
005,
500,
000
55.0
012
1,04
235
,311
19,5
31Su
bsid
iary
Den
eng
Scie
ntifi
c R
esea
rch
Co.
, Ltd
.Ta
ichu
ng, T
aiw
anIn
stal
lmen
t and
sale
of e
lect
roni
c co
mpo
nent
s and
so
ftwar
e18
,095
18,0
9565
8,00
039
.69
18,2
2821
284
Equi
ty-m
etho
d in
vest
ee
ATC
ATC
(HK
)H
ong
Kon
gIn
vest
men
t and
man
agem
ent s
ervi
ce1,
212,
730
1,21
2,73
041
,650
,001
100.
002,
683,
857
203,
353
209,
271
Subs
idia
ry
AA
C (B
VI)
AN
ASu
nnyv
ale,
USA
Sale
and
fabr
icat
ion
of in
dust
rial a
utom
atio
n pr
oduc
ts50
4,17
950
4,17
910
,952
,606
100.
002,
101,
666
147,
648
148,
385
Subs
idia
ryA
AC
(HK
)H
ong
Kon
gIn
vest
men
t and
man
agem
ent s
ervi
ce53
9,14
653
9,14
615
,230
,001
100.
001,
826,
597
155,
698
158,
562
Subs
idia
ry
AEU
HA
EUEi
ndho
ven,
The
Net
herla
nds
Sale
of i
ndus
trial
aut
omat
ion
prod
ucts
431,
963
431,
963
11,3
14,2
8010
0.00
913,
908
67,2
5668
,048
Subs
idia
ryA
PLW
arsa
w, P
olan
dSa
le o
f ind
ustri
al a
utom
atio
n pr
oduc
ts14
,176
14,1
766,
350
100.
0023
,403
1,07
81,
078
Subs
idia
ry
AEU
A-D
LoG
Mun
ich,
Ger
man
yD
esig
n, R
&D
and
sale
of i
ndus
trial
aut
omat
ion
vehi
cles
and
rela
ted
prod
ucts
553,
536
553,
536
110
0.00
560,
527
32,5
5121
,774
Subs
idia
ry
ASG
ATH
Thai
land
Prod
uctio
n of
com
pute
rs7,
537
7,53
751
,000
51.0
015
,968
9,35
84,
773
Subs
idia
ryA
IDIn
done
sia
Sale
of i
ndus
trial
aut
omat
ion
prod
ucts
4,79
74,
797
300,
000
100.
004,
356
2,52
42,
524
Subs
idia
ry
Cer
mat
eLa
ndM
ark
BV
IG
ener
al in
vest
men
t28
,200
28,2
0097
2,28
410
0.00
74,9
2315
,152
15,2
62Su
bsid
iary
ALT
CB
ette
r Aut
oB
VI
Gen
eral
inve
stm
ent
264,
445
264,
445
8,55
6,09
610
0.00
106,
456
(49,
267)
(48,
722)
Subs
idia
ry
Bet
ter A
uto
Fam
ous N
owB
VI
Gen
eral
inve
stm
ent
US$
4,00
0U
S$4,
000
110
0.00
68,0
34(4
2,58
9)(4
2,58
9)Su
bsid
iary
Adv
anPO
SB
right
Min
d Li
mite
dSa
moa
Gen
eral
inve
stm
ent
US$
200
US$
200
200
100.
00(5
71)
(496
)(1
,096
)Su
bsid
iary
Not
e A
:Th
e fin
anci
al st
atem
ents
use
d as
bas
is o
f net
ass
et v
alue
s had
bee
n au
dite
d by
inde
pend
ent C
PAs,
exce
pt th
ose
of A
IN, A
MX
, Adv
ante
ch In
nova
tive
Des
ign
Co.
, Ltd
. and
Adv
ante
ch iF
acto
ry C
o., L
td.
Not
e B
:R
efer
to T
able
8 fo
r inv
estm
ents
in m
ainl
and
Chi
na.
-185-

TAB
LE 8
AD
VA
NT
EC
H C
O.,
LT
D. A
ND
INV
EST
EE
S
INV
EST
ME
NT
S IN
MA
INL
AN
D C
HIN
AFO
R T
HE
YE
AR
EN
DE
D D
EC
EM
BE
R 3
1, 2
015
(In
Tho
usan
ds o
f New
Tai
wan
Dol
lars
, Unl
ess S
tate
d O
ther
wise
)
Inve
stee
Com
pany
Nam
eM
ain
Bus
ines
ses a
nd
Prod
ucts
Tota
l Am
ount
of
Pai
d-in
C
apita
l
Inve
stm
ent
Typ
e (e
.g.,
Dir
ect o
r In
dire
ct)
Acc
umul
ated
O
utflo
w o
f In
vest
men
t fr
om T
aiw
an a
s of
Janu
ary
1, 2
015
Inve
stm
ent F
low
sA
ccum
ulat
ed
Out
flow
of
Inve
stm
ent
from
T
aiw
an a
s of
Dec
embe
r 31
, 20
15
Net
Inco
me
(Los
s) o
f the
In
vest
ee
%
Ow
ners
hip
of
Dir
ect o
r In
dire
ct
Inve
stm
ent
Inve
stm
ent
Gai
n (L
oss)
(Not
e A
)
Car
ryin
g V
alue
as
of
Dec
embe
r 31
, 20
15
Acc
umul
ated
In
war
d R
emitt
ance
of
Ear
ning
s as o
fD
ecem
ber
31,
2015
Out
flow
Inflo
w
Adv
ante
ch T
echn
olog
y (C
hina
) Com
pany
Ltd
. (A
KM
C)
Prod
uctio
n an
d sa
le o
f co
mpo
nent
s of
indu
stria
l aut
omat
ion
prod
ucts
US$
43,7
50th
ousa
nd(N
ote
F)
Indi
rect
$1,
224,
373
(US$
37,3
00th
ousa
nd)
$-
$-
$1,
224,
373
(US$
37,3
00th
ousa
nd)
$20
3,35
310
0$
203,
458
$2,
678,
044
$-
Bei
jing
Yan
Hua
Xin
g Y
e El
ectro
nic
Scie
nce
&
Tech
nolo
gy C
o., L
td.
(AC
N)
Sale
of i
ndus
trial
au
tom
atio
n pr
oduc
tsU
S$4,
230
Thou
sand
Indi
rect
175,
023
(US$
5,33
2th
ousa
nd)
--
175,
023
(US$
5,33
2th
ousa
nd)
132,
777
100
133,
216
1,00
8,34
736
8,69
0(U
S$11
,232
thou
sand
)
Shan
ghai
Adv
ante
ch
Inte
llige
nt S
ervi
ces C
o.,
Ltd.
(AiS
C)
Sale
of i
ndus
trial
au
tom
atio
n pr
oduc
tsU
S$8,
000
Thou
sand
Indi
rect
262,
600
(US$
8,00
0th
ousa
nd)
--
262,
600
(US$
8,00
0th
ousa
nd)
23,6
5910
026
,085
773,
904
-
Xi’a
n A
dvan
tech
Sof
twar
e Lt
d. (A
XA
)D
evel
opm
ent a
nd
prod
uctio
n of
softw
are
prod
ucts
US$
1,00
0Th
ousa
ndIn
dire
ct(N
ote
C)-
-(N
ote
C)87
110
087
142
,783
-
Han
gzho
u A
dvan
tofin
e A
utom
atio
n Te
ch. C
o.,
Ltd.
Proc
essi
ng a
nd sa
le o
f in
dust
rial a
utom
atio
n pr
oduc
ts
RM
B3,
000
Thou
sand
Indi
rect
(Not
e D
)-
-(N
ote
D)
524
6031
413
,711
-
Acc
umul
ated
Inve
stm
ent i
n M
ainl
and
Chi
na a
s of
Dec
embe
r 31
, 201
5
Inve
stm
ent A
mou
nts A
utho
rize
d by
Inve
stm
ent C
omm
issio
n,
MO
EA
Allo
wab
le L
imit
on In
vest
men
t
$1,6
68,5
60 (U
S$50
,832
thou
sand
)(N
ote
E)$2
,333
,858
(US$
71,1
00 th
ousa
nd)
$14,
072,
266
(Not
e H
)
Not
e A
:Th
e fin
anci
al st
atem
ents
use
d as
bas
is o
f ass
et v
alue
s had
bee
n au
dite
d.
Not
e B
:Th
e si
gnifi
cant
eve
nts,
pric
es, p
aym
ent t
erm
s and
unr
ealiz
ed g
ains
or l
osse
s gen
erat
ed o
n tra
ding
bet
wee
n th
e C
ompa
ny a
nd it
sin
vest
ees i
n M
ainl
and
Chi
na a
re d
escr
ibed
in T
able
s 5.
Not
e C
:R
emitt
ance
by
AA
C (H
.K.)
Lim
ited.
(C
ontin
ued)
-186-

Not
e D
:R
emitt
ance
by
AC
N.
Not
e E:
Incl
uded
is th
e ou
tflow
of U
S$20
0 th
ousa
nd o
n th
e in
vest
men
t in
Yan
Hua
(Gua
ng Z
hou
Bao
Shu
i Qu)
Co.
, Ltd
. loc
ated
in a
free
trad
e zo
ne in
Gua
ng Z
hou.
W
hen
this
inve
stee
was
liqu
idat
ed in
Sep
tem
ber 2
005,
the
outw
ard
inve
stm
ent
rem
ittan
ce c
ease
d up
on th
e ap
prov
al o
f th
e M
inis
try o
f Ec
onom
ic A
ffai
rs (
MO
EA).
For
eac
h fu
ture
cap
ital r
etur
n, th
e C
ompa
ny w
ill a
pply
to th
e M
OEA
for
the
appr
oval
of
the
retu
rn a
s w
ell a
s re
duce
the
accu
mul
ated
inve
stm
ent
amou
nt b
y th
e re
turn
am
ount
Not
e F:
For A
KM
C, t
here
was
a c
apita
l inc
reas
e of
US$
6,45
0 th
ousa
nd o
ut o
f ear
ning
s.
Not
e G
:Th
e ex
chan
ge ra
te w
as U
S$1.
00=N
T$32
.825
.
Not
e H
:Th
e m
axim
um a
llow
able
lim
it on
inve
stm
ent w
as a
t 60%
of t
he c
onso
lidat
ed n
et a
sset
val
ue o
f the
Com
pany
.
(Con
clud
ed)
-187-

DECLARATION OF CONSOLIDATION OF FINANCIAL STATEMENTS OF AFFILIATES
The companies required to be inc luded in the consolidated financial statements of affiliates in accordance
with the “Criteria Governing Preparation of Affiliation Reports, Consolidated Business Reports and
Consolidated Financial Statements of Affiliated Enterprises” for the year ended December 31, 2015 are
all the same as the companies required to be included in the consolidated financial statements of parent
and subsidiary companies as provided in International Financial Reporting Standard 10. Relevant
information that should be disclosed in the consolidated financial statements of affiliates has all been
disclosed in the consolidated financial statements of parent and subsidiary companies. Hence, we have
not prepared a separate set of consolidated financial statements of affiliates.
Very truly yours,
ADVANTECH CO., LTD.
By:
K. C. LIUChairman
March 4, 2016
-188-
V.The consolidated financial statements of the parent and subsidiary audited by
the CPA in the most recent year

INDEPENDENT AUDITORS’ REPORT
The Board of Directors and ShareholdersAdvantech Co., Ltd.
We have audited the accompanying consolidated balance sheets of Advantech Co., Ltd. (the “Company”) and its subsidiaries (collectively referred to as the “Group”) as of December 31, 2015 and 2014, and the related consolidated statements of comprehensive income, changes in equity and cash flows for the years ended December 31, 2015 and 2014. These consolidated financial statements are the responsibility of the Company’s management. Our responsibility is to express an opinion on these consolidated financial statements based on our audits. However, as stated in Note 12 to the consolidated financial statements, we did not audit the consolidated financial statements as of and for the years ended December 31, 2015 and 2014 of some subsidiaries. The consolidated financial statements of these subsidiaries were audited by other auditors, whose reports have been furnished to us, and our opinion, insofar as it relates to the subsidiaries’ amounts included herein, is based solely on the reports of other auditors. The total assets of these subsidiaries were 4.17% (NT$1,418,592 thousand) and 4.77% (NT$1,505,128 thousand) of the consolidated assets as of December 31, 2015 and 2014, respectively. The operating revenues of these subsidiaries were 7.76% (NT$2,947,500 thousand) and 8.67% (NT$3,099,173 thousand) of the consolidated operating revenues for 2015 and 2014, respectively. Also, as stated in Note 13 to the consolidated financial statements, we did not audit the financial statements as of and for the years ended December 31, 2015 and 2014 of some companies in which the Company had investments accounted for using the equity method. The consolidated financial statements of these investees were audited by other auditors, whose reports have been furnished to us, and our opinion, in so far as it relates to the investees’ amounts included herein, is based solely on the reports of the other auditors. Investments accounted for using the equity method were 1.41% (NT$477,984 thousand) and 1.42% (NT$447,663 thousand) of the consolidated assets as of and for the years ended December 31, 2015 and 2014. Also, the equity in the investees’ net gains was 1.75% (NT$110,226 thousand) and 1.66% (NT$100,264 thousand) of the consolidated pretax profits in 2015 and 2014, respectively.
We conducted our audits in accordance with the Regulations Governing the Audit ing and Attestation of Financial Statements by Certified Public Accountants and auditing standards generally accepted in the Republic of China. Those rules and standards require that we plan and perform the audit to obtain reasonable assurance about whether the consolidated financial statements are free of material misstatement. An audit includes examining, on a test basis, evidence supporting the amounts and disclosures in the consolidated financial statements. An audit also includes assessing the accounting principles used and significant estimates made by management, as well as evaluating the overall consolidated financial statement presentation. We believe that our audits and the reports of the other auditors provide a reasonable basis for our opinion.
-189-

In our opinion, based on our audits and the reports of the other auditors, the consolidated financial statements referred to above present fairly, in all material respects, the consolidated financial position of the Group as of December 31, 2015 and 2014, and the results of its financial performance and its consolidated cash flows for the years then ended, in conformity with the Regulations Governing the Preparation of Financial Reports by Securities Issuers, International Financial Reporting Standards (IFRS), International Accounting Standards (IAS), IFRIC Interpretations (IFRIC), and SIC Interpretations (SIC) endorsed by the Financial Supervisory Commission (FSC) of the Republic of China.
We have also audited the financial statements of the parent company, Advantech Co., Ltd., as of and for the years ended December 31, 2015 and 2014 and have expressed a modified unqualified opinion on those financial statements.
March 4, 2016
Notice to Readers
The accompanying consolidated financial statements are intended only to present the consolidated financial position, financial performance and cash flows in accordance with accounting principles and practices generally accepted in the Republic of China and not those of any other jurisd ictions. The standards, procedures and practices to audit such consolidated financial statements are those generally applied in the Republic of China.
For the convenience of readers, the independent auditors’ report and the accompanying consolidated financial statements have been translated into English from the original Chinese version prepared and used in the Republic of China. If there is any conflict between the English version and the original Chinese version or any difference in the interpretation of the two versions, the Chinese-language independent auditors’ report and consolidated financial statements shall prevail.
-190-

ADVANTECH CO., LTD. AND SUBSIDIARIES
CONSOLIDATED BALANCE SHEETSDECEMBER 31, 2015 AND 2014(In Thousands of New Taiwan Dollars)
2015 2014 (Restated)ASSETS Amount % Amount %
CURRENT ASSETSCash and cash equivalents (Notes 4 and 6) $ 4,358,259 13 $ 3,122,007 10Financial assets at fair value through profit or loss - current (Notes 4, 5, 7 and 28) 176,389 1 165,402 -Available-for-sale financial assets - current (Notes 4, 8 and 28) 1,755,843 5 3,431,359 11Debt investments with no active market - current (Notes 4 and 9) 3,171 - 5,487 -Notes receivable (Notes 4, 5, 10 and 29) 970,722 3 949,861 3Accounts receivable (Notes 4, 5 and 10) 5,428,574 16 4,960,373 16Accounts receivable from related parties (Note 29) 26,775 - 5,400 -Other receivables 40,811 - 36,550 -Inventories (Notes 4, 5 and 11) 4,868,860 14 4,781,550 15Other current financial assets (Note 30) - - 18,650 -Other current assets (Note 16) 456,342 1 513,393 2
Total current assets 18,085,746 53 17,990,032 57
NONCURRENT ASSETSAvailable-for-sale financial assets - noncurrent, net of current portion (Notes 4, 8 and 28) 1,747,598 5 2,428,569 8Investments accounted for using the equity method (Notes 4 and 13) 477,984 2 447,663 1Property, plant and equipment (Notes 4 and 14) 9,576,879 28 8,876,606 28Goodwill (Notes 4, 5 and 15) 1,139,559 3 1,168,727 4Other intangible assets 227,686 1 286,312 1Deferred tax assets (Notes 4 and 22) 217,989 1 161,268 1Prepayments for business facilities 65,753 - 45,511 -Prepayments for investments (Note 32) 2,279,881 7 - -Long-term prepayments for lease (Note 16) 100,875 - 96,516 -Other noncurrent assets (Note 26) 59,183 - 42,616 -
Total noncurrent assets 15,893,387 47 13,553,788 43
TOTAL $ 33,979,133 100 $ 31,543,820 100
LIABILITIES AND EQUITY
CURRENT LIABILITIESShort-term borrowings (Notes 17 and 28) $ 880,625 3 $ 3,080 -Financial liabilities at fair value through profit or loss - current (Notes 4, 5, 7 and 28) 6,352 - 8,698 -Trade payables (Note 29) 3,226,069 9 3,166,195 10Other payables (Notes 18 and 21) 3,380,317 10 3,174,189 10Current tax liabilities (Notes 4 and 22) 1,057,226 3 787,404 3Short-term warranty provision (Note 4) 145,646 - 141,354 -Other current liabilities 546,295 2 498,900 2
Total current liabilities 9,242,530 27 7,779,820 25
NONCURRENT LIABILITIESDeferred tax liabilities (Notes 4 and 22) 938,491 3 897,940 3Long-term accounts payable - - 43,028 -Net defined benefit liabilities (Notes 4, 5 and 19) 183,540 1 165,428 1Other noncurrent liabilities 160,795 - 124,585 -
Total noncurrent liabilities 1,282,826 4 1,230,981 4
Total liabilities 10,525,356 31 9,010,801 29
EQUITY ATTRIBUTABLE TO OWNERS OF THE COMPANYShare capital
Ordinary shares 6,318,531 19 6,301,031 20Advance receipts for share capital - - 11,060 -
Total share capital 6,318,531 19 6,312,091 20Capital surplus 5,587,555 16 5,306,958 17Retained earnings
Legal reserve 3,962,842 12 3,472,064 11Unappropriated earnings 7,098,449 21 6,353,273 20
Total retained earnings 11,061,291 33 9,825,337 31Other equity
Exchange differences on translation of foreign financial statements 271,859 1 338,356 1Unrealized gains on available-for-sale financial assets 68,265 - 563,277 2
Total other equity 340,124 1 901,633 3
Total equity attributable to owners of the Company 23,307,501 69 22,346,019 71
NON-CONTROLLING INTERESTS 146,276 - 187,000 -
Total equity 23,453,777 69 22,533,019 71
TOTAL $ 33,979,133 100 $ 31,543,820 100
The accompanying notes are an integral part of the consolidated financial statements.
(With Deloitte & Touche audit report dated March 4, 2016)
-191-

ADVANTECH CO., LTD. AND SUBSIDIARIES
CONSOLIDATED STATEMENTS OF COMPREHENSIVE INCOMEFOR THE YEARS ENDED DECEMBER 31, 2015 AND 2014(In Thousands of New Taiwan Dollars, Except Earnings Per Share)
2015 2014 (Restated)Amount % Amount %
OPERATING REVENUE (Note 29)Sales $ 36,978,961 97 $ 34,662,269 97Other operating revenue 1,021,621 3 1,069,430 3
Total operating revenue 38,000,582 100 35,731,699 100
OPERATING COSTS (Notes 11, 21 and 29) 22,655,592 59 21,339,035 60
GROSS PROFIT 15,344,990 41 14,392,664 40
OPERATING EXPENSES (Notes 21 and 29)Selling and marketing expenses 3,889,856 10 3,533,354 10General and administrative expenses 1,982,879 5 2,115,760 6Research and development expenses 3,543,748 10 3,235,226 9
Total operating expenses 9,416,483 25 8,884,340 25
OPERATING PROFIT 5,928,507 16 5,508,324 15
NONOPERATING INCOMEShare of the profit of associates accounted for using
the equity method (Notes 4 and 13) 110,226 - 100,264 1Interest income 40,613 - 54,355 -Gains (losses) on disposal of property, plant and
equipment (Note 4) (5,410) - 56,473 -Gains on disposal of investments (Note 4) 202,458 1 27,143 -Foreign exchange gains (losses), net (Notes 4, 21
and 33) (186,889) - 78,206 -Gains on financial instruments at fair value through
profit or loss (Note 4) 83,798 - 85,664 -Dividend income 139,725 - 130,737 1Other income (Note 8) 121,329 - 91,185 -Finance costs (Note 21) (10,041) - (14,420) -Losses on financial instruments at fair value through
profit or loss (Note 4) (130,409) - (49,171) -Other losses (4,372) - (13,815) -
Total nonoperating income 361,028 1 546,621 2
PROFIT BEFORE INCOME TAX 6,289,535 17 6,054,945 17
INCOME TAX EXPENSE (Notes 4 and 22) 1,162,560 3 1,123,069 3
NET PROFIT FOR THE YEAR 5,126,975 14 4,931,876 14(Continued)
-192-

ADVANTECH CO., LTD. AND SUBSIDIARIES
CONSOLIDATED STATEMENTS OF COMPREHENSIVE INCOMEFOR THE YEARS ENDED DECEMBER 31, 2015 AND 2014(In Thousands of New Taiwan Dollars, Except Earnings Per Share)
2015 2014 (Restated)Amount % Amount %
OTHER COMPREHENSIVE INCOME (LOSS)Items that will not be reclassified subsequently to
profit or loss:Remeasurement of defined benefit plans (Notes 3,
19 and 20) $ (19,303) - $ (5,562) -Share of the other comprehensive income (loss) of
associates accounted for using the equity method (Note 13) (2,424) - 199 -
Income tax relating to items that will not be reclassified (Notes 3 and 22) 3,281 - 945 -
Items that may be reclassified subsequently to profit or loss:Exchange differences on translating foreign
operations (Notes 4 and 20) (101,490) - 243,904 -Unrealized gains (losses) on available-for-sale
financial assets (Notes 4 and 20) (495,012) (2) 638,811 2Share of the other comprehensive income of
associates (Notes 4, 13 and 20) 2,449 - 4,512 -Income tax relating to items that may be
reclassified subsequently to profit or loss(Notes 4, 20 and 22) 13,620 - (42,667) -
Other comprehensive income (loss) for the year, net of income tax (598,879) (2) 840,142 2
TOTAL COMPREHENSIVE INCOME FOR THE YEAR $ 4,528,096 12 $ 5,772,018 16
NET PROFIT ATTRIBUTABLE TO:Owners of the Company $ 5,104,346 13 $ 4,907,648 14Non-controlling interests 22,629 - 24,228 -
$ 5,126,975 13 $ 4,931,876 14
TOTAL COMPREHENSIVE INCOME ATTRIBUTABLE TO:Owners of the Company $ 4,524,603 12 $ 5,750,571 16Non-controlling interests 3,493 - 21,447 -
$ 4,528,096 12 $ 5,772,018 16(Continued)
-193-

ADVANTECH CO., LTD. AND SUBSIDIARIES
CONSOLIDATED STATEMENTS OF COMPREHENSIVE INCOMEFOR THE YEARS ENDED DECEMBER 31, 2015 AND 2014(In Thousands of New Taiwan Dollars, Except Earnings Per Share)
2015 2014 (Restated)Amount % Amount %
EARNINGS PER SHARE (NEW TAIWAN DOLLARS; Note 23)Basic $ 8.08 $ 7.80Diluted $ 8.05 $ 7.77
The accompanying notes are an integral part of the consolidated financial statements.
(With Deloitte & Touche audit report dated March 4, 2016) (Concluded)
-194-

AD
VA
NT
ECH
CO
., LT
D.
AN
D S
UBSI
DIA
RIE
S
CO
NSO
LID
AT
ED
ST
AT
EM
EN
TS
OF
CH
AN
GE
S IN
EQ
UIT
YFO
R T
HE
YE
AR
S E
ND
ED
DE
CE
MB
ER
31,
201
5 A
ND
201
4(I
n T
hous
ands
of
New
Tai
wan
Dol
lars
)
Equ
ity
Att
ribu
tabl
e to
Ow
ners
of
the
Com
pany
Oth
er E
quit
y (N
ote
20)
Issu
ed C
apit
al (N
otes
20
and
24)
Exc
hang
eU
nrea
lize
d G
ain
Adv
ance
Rec
eipt
sC
apit
al S
urpl
usR
etai
ned
Ear
ning
s (N
otes
20
and
25)
Dif
fere
nces
on
(Los
s) o
nN
on-c
ontr
olli
ngfo
r O
rdin
ary
(Not
es 2
0, 2
4U
napp
ropr
iate
dT
rans
lati
ngA
vail
able
-for
-sal
eIn
tere
sts
Shar
e C
apit
alSh
ares
Tot
alan
d 25
)L
egal
Res
erve
Ear
ning
sT
otal
Fore
ign
Ope
rati
ons
Fina
ncia
l Ass
ets
Tot
al(N
otes
20
and
25)
Tot
al E
quit
y
BA
LA
NC
E A
T JA
NU
AR
Y 1
, 201
4$
5,66
9,24
9$
24,7
51$
5,69
4,00
0$
4,99
5,63
5$
3,06
1,42
4$
5,45
2,73
3$
8,51
4,15
7$
130,
041
$(7
5,53
4)$
19,2
58,2
99$
161,
891
$19
,420
,190
Effe
ct o
f res
pect
ive
appl
icat
ion
and
resp
ectiv
e re
stat
emen
t-
--
--
(5,0
45)
(5,0
45)
--
(5,0
45)
-(5
,045
)
BA
LA
NC
E A
T JA
NU
AR
Y 1
, 201
4 A
S R
EST
ATE
D5,
669,
249
24,7
515,
694,
000
4,99
5,63
53,
061,
424
5,44
7,68
88,
509,
112
130,
041
(75,
534)
19,2
53,2
5416
1,89
119
,415
,145
App
ropr
iati
on o
f the
201
3 ea
rrin
gsL
egal
rese
rve
--
--
410,
640
(410
,640
)-
--
--
-C
ash
divi
dend
s on
ord
inar
y sh
ares
--
--
-(3
,017
,820
)(3
,017
,820
)-
-(3
,017
,820
)-
(3,0
17,8
20)
Stoc
k di
vide
nds
on o
rdin
ary
shar
es56
9,40
0-
569,
400
--
(569
,400
)(5
69,4
00)
--
--
-
Rec
ogni
tion
of e
mpl
oyee
sha
re o
ptio
ns b
y th
e C
ompa
ny51
,410
(4,8
50)
46,5
6016
7,52
5-
--
--
214,
085
-21
4,08
5
Com
pens
atio
n co
st re
cogn
ized
for e
mpl
oyee
sha
re o
ptio
ns-
--
111,
393
--
--
-11
1,39
3-
111,
393
Cha
nge
in c
apit
al s
urpl
us fr
om in
vest
men
ts in
ass
ocia
tes a
ccou
nted
for u
sing
equ
ity
met
hod
--
-8,
966
--
--
-8,
966
-8,
966
Diff
eren
ce b
etw
een
cons
ider
atio
n pa
id a
nd c
arry
ing
amou
nt o
f sub
sidi
arie
s ac
quire
d-
--
11,4
57-
--
--
11,4
573,
662
15,1
19
Cha
nges
in p
erce
ntag
e of
ow
ners
hip
inte
rest
in s
ubsi
diar
ies
--
-(1
,873
)-
--
--
(1,8
73)
-(1
,873
)
Con
vert
ible
bon
ds c
onve
rted
to o
rdin
ary
shar
es10
,972
(8,8
41)
2,13
113
,855
--
--
-15
,986
-15
,986
Net
pro
fit fo
r th
e ye
ar e
nded
Dec
embe
r 31
, 201
4-
--
--
4,90
7,64
84,
907,
648
--
4,90
7,64
824
,228
4,93
1,87
6
Oth
er c
ompr
ehen
sive
inco
me
for
year
end
ed D
ecem
ber
31, 2
014,
net
of i
ncom
e ta
x-
--
--
(4,2
03)
(4,2
03)
208,
315
638,
811
842,
923
(2,7
81)
840,
142
Tota
l com
preh
ensi
ve in
com
e fo
r th
e ye
ar e
nded
Dec
embe
r 31
, 201
4-
--
--
4,90
3,44
54,
903,
445
208,
315
638,
811
5,75
0,57
121
,447
5,77
2,01
8
BA
LA
NC
E A
T D
EC
EM
BE
R 3
1, 2
014
AS
RE
STA
TED
6,30
1,03
111
,060
6,31
2,09
15,
306,
958
3,47
2,06
46,
353,
273
9,82
5,33
733
8,35
656
3,27
722
,346
,019
187,
000
22,5
33,0
19
App
ropr
iati
on o
f the
201
4 ea
rrin
gsL
egal
rese
rve
--
--
490,
778
(490
,778
)-
--
--
-C
ash
divi
dend
s on
ord
inar
y sh
ares
--
--
-(3
,787
,255
)(3
,787
,255
)-
-(3
,787
,255
)-
(3,7
87,2
55)
Rec
ogni
tion
of e
mpl
oyee
sha
re o
ptio
ns b
y th
e C
ompa
ny17
,500
(11,
060)
6,44
024
,438
--
--
-30
,878
-30
,878
Com
pens
atio
n co
st re
cogn
ized
for e
mpl
oyee
sha
re o
ptio
ns-
--
261,
877
--
--
-26
1,87
7-
261,
877
Cha
nge
in c
apit
al s
urpl
us fr
om in
vest
men
ts in
ass
ocia
tes a
ccou
nted
for u
sing
equ
ity
met
hod
--
-2,
172
--
--
-2,
172
-2,
172
Diff
eren
ce b
etw
een
cons
ider
atio
n pa
id a
nd c
arry
ing
amou
nt o
f sub
sidi
arie
s ac
quire
d-
--
(11,
457)
-(6
2,90
3)(6
2,90
3)-
-(7
4,36
0)(4
4,21
7)(1
18,5
77)
Cha
nges
in p
erce
ntag
e of
ow
ners
hip
inte
rest
in s
ubsi
diar
ies
--
-3,
567
--
--
-3,
567
-3,
567
Net
pro
fit fo
r th
e ye
ar e
nded
Dec
embe
r 31
, 201
5-
--
--
5,10
4,34
65,
104,
346
--
5,10
4,34
622
,629
5,12
6,97
5
Oth
er c
ompr
ehen
sive
loss
for t
he y
ear e
nded
Dec
embe
r 31
, 201
5, n
et o
f inc
ome
tax
--
--
-(1
8,23
4)(1
8,23
4)(6
6,49
7)(4
95,0
12)
(579
,743
)(1
9,13
6)(5
98,8
79)
Tota
l com
preh
ensi
ve in
com
e fo
r th
e ye
ar e
nded
Dec
embe
r 31
, 201
5-
--
--
5,08
6,11
25,
086,
112
(66,
497)
(495
,012
)4,
524,
603
3,49
34,
528,
096
BA
LA
NC
E A
T D
EC
EM
BE
R 3
1, 2
015
$6,
318,
531
$-
$6,
318,
531
$5,
587,
555
$3,
962,
842
$7,
098,
449
$11
,061
,291
$27
1,85
9$
68,2
65$
23,3
07,5
01$
146,
276
$23
,453
,777
The
acco
mpa
nyin
g no
tes
are
an in
tegr
al p
art o
f the
con
soli
date
d fin
anci
al s
tate
men
ts.
(Wit
h D
eloi
tte
& T
ouch
e au
ditr
epor
t dat
ed M
arch
4, 2
016)
-195-

ADVANTECH CO., LTD. AND SUBSIDIARIES
CONSOLIDATED STATEMENTS OF CASH FLOWSFOR THE YEARS ENDED DECEMBER 31, 2015 AND 2014(In Thousands of New Taiwan Dollars)
2015 2014 (Restated)
CASH FLOWS FROM OPERATING ACTIVITIESIncome before income tax $ 6,289,535 $ 6,054,945Adjustments for:
Depreciation expenses 568,241 504,211Amortization expenses 97,953 90,709Amortization expenses for prepayments of lease obligation 2,577 2,519Impairment loss recognized on trade receivables 23,360 9,991Net loss (gain) on financial assets or liabilities at fair value through
profit or loss 46,611 (36,493)Compensation cost of employee share options 261,877 111,393Finance costs 10,041 14,420Interest income (40,613) (54,355)Dividend income (139,725) (130,737)Share of profit of associates (110,226) (100,264)Loss (gain) on disposal of property, plant and equipment 5,410 (56,473)Gain on disposal of investments (202,458) (27,143)Loss on bond redemption - 17
Changes in operating assets and liabilitiesFinancial assets held for trading (59,944) (141,210)Notes receivable (20,861) (200,332)Accounts receivable (495,148) (366,727)Account receivables from related parties (21,375) 1,179Other receivables (1,724) (383)Inventories (87,310) (750,893)Other current assets 57,051 (141,365)Other financial assets 18,650 90,660Trade payables 59,874 393,344Net defined benefit liabilities (1,191) (1,785)Other payables 151,859 243,045Other current liabilities 47,395 (40,587)Other noncurrent liabilities 36,812 95,481
Cash generated from operations 6,496,671 5,563,167Interest received 38,076 31,578Dividend received 221,642 130,737Interest paid (1,467) (5,233)Income tax paid (850,763) (809,008)
Net cash generated from operating activities 5,904,159 4,911,241
CASH FLOWS FROM INVESTING ACTIVITIESAcquisition of available-for-sale financial assets (9,713,717) (5,847,515)Proceeds on sale of available-for-sale financial assets 11,766,699 5,213,858Acquisition of investments with no active market 1,805 (643)Acquisition of investments accounted for using the equity method - (18,095)
(Continued)
-196-
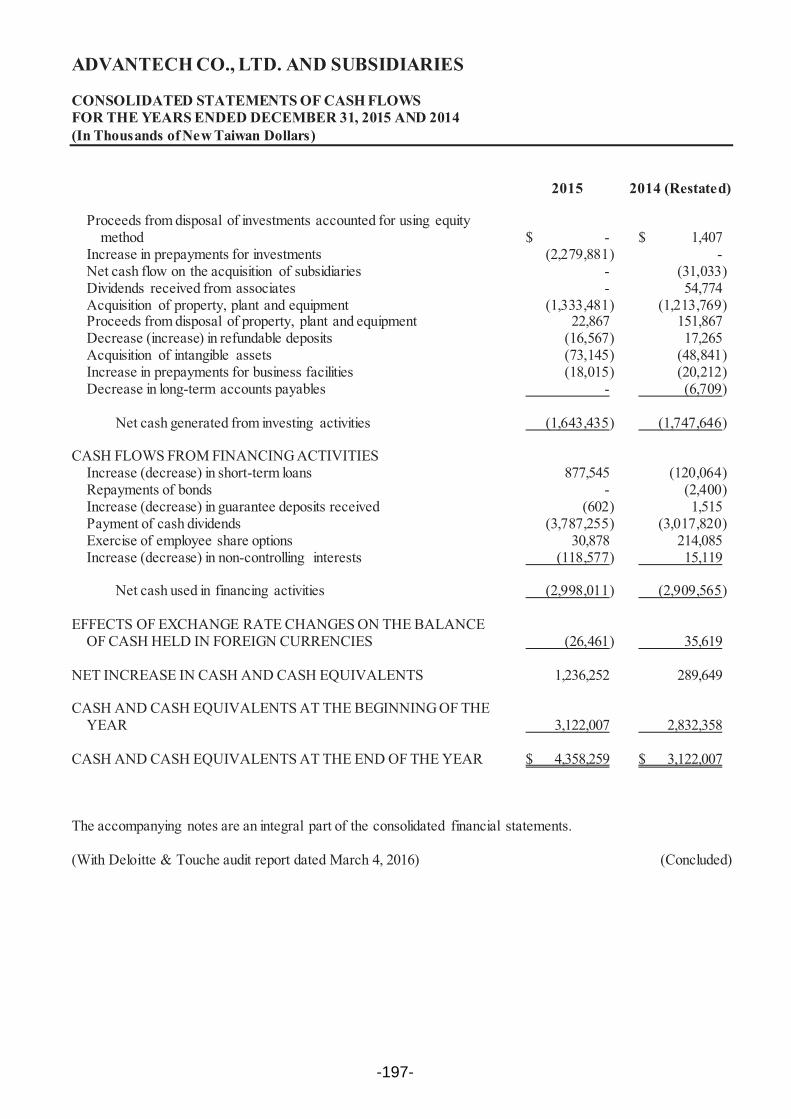
ADVANTECH CO., LTD. AND SUBSIDIARIES
CONSOLIDATED STATEMENTS OF CASH FLOWSFOR THE YEARS ENDED DECEMBER 31, 2015 AND 2014(In Thousands of New Taiwan Dollars)
2015 2014 (Restated)
Proceeds from disposal of investments accounted for using equity method $ - $ 1,407
Increase in prepayments for investments (2,279,881) -Net cash flow on the acquisition of subsidiaries - (31,033)Dividends received from associates - 54,774Acquisition of property, plant and equipment (1,333,481) (1,213,769)Proceeds from disposal of property, plant and equipment 22,867 151,867Decrease (increase) in refundable deposits (16,567) 17,265Acquisition of intangible assets (73,145) (48,841)Increase in prepayments for business facilities (18,015) (20,212)Decrease in long-term accounts payables - (6,709)
Net cash generated from investing activities (1,643,435) (1,747,646)
CASH FLOWS FROM FINANCING ACTIVITIESIncrease (decrease) in short-term loans 877,545 (120,064)Repayments of bonds - (2,400)Increase (decrease) in guarantee deposits received (602) 1,515Payment of cash dividends (3,787,255) (3,017,820)Exercise of employee share options 30,878 214,085Increase (decrease) in non-controlling interests (118,577) 15,119
Net cash used in financing activities (2,998,011) (2,909,565)
EFFECTS OF EXCHANGE RATE CHANGES ON THE BALANCE OF CASH HELD IN FOREIGN CURRENCIES (26,461) 35,619
NET INCREASE IN CASH AND CASH EQUIVALENTS 1,236,252 289,649
CASH AND CASH EQUIVALENTS AT THE BEGINNING OF THE YEAR 3,122,007 2,832,358
CASH AND CASH EQUIVALENTS AT THE END OF THE YEAR $ 4,358,259 $ 3,122,007
The accompanying notes are an integral part of the consolidated financial statements.
(With Deloitte & Touche audit report dated March 4, 2016) (Concluded)
-197-

ADVANTECH CO., LTD. AND SUBSIDIARIES
NOTES TO CONSOLIDATED FINANCIAL STATEMENTSFOR THE YEARS ENDED DECEMBER 31, 2015 AND 2014(In Thousands of New Taiwan Dollars, Unless Stated Otherwise)
1. GENERAL INFORMATION
Advantech Co., Ltd. (the “Company”) is a listed company established in September 1981. It manufactures and sells embedded computing boards, industrial automation products, applied computers and industrial computers.
The Company’s shares have been listed on the Taiwan Stock Exchange since December 1999.
To improve the entire operating efficiency of Advantech Co., Ltd. (the “Company”) and its subsidiaries (collectively referred to as the “Group”), the Company’s board of directors resolved on June 30, 2009 to have a short-form merger with Advantech Investment and Management Service (AIMS). The effective merger date was July 30, 2009. As the survivor entity, the Company assumed all assets and liabilities of AIMS. On June 26, 2014, the Company’s board of directors resolved to have a whale-minnow merger with Netstar Technology Co., Ltd. (Netstar), an indirect 95.51%-owned subsidiary through a wholly-owned subsidiary, Advantech Corporate Investment. The effective merger date was July 27, 2014. As the survivor entity, the Company assumed all assets and liabilities of Netstar.
The functional currency of the Company is the New Taiwan dollar.
2. APPROVAL OF FINANCIAL STATEMENTS
The consolidated financial statements were approved by the board of directors on March 4, 2016.
3. APPLICATION OF NEW, AMENDED AND REVISED STANDARDS AND INTERPRETATIONS
a. Initial application of the amendments to the Regulations Governing the Preparation of Financial Reports by Securities Issuers and the 2013 version of the International Financial Reporting Standards (IFRS), International Accounting Standards (IAS), Interpretations of IFRS (IFRIC), and Interpretations of IAS (SIC) endorsed by the FSC
Rule No. 1030029342 and Rule No. 1030010325 issued by the FSC on April 3, 2014, stipulated that the Group should apply the 2013 version of IFRS, IAS, IFRIC and SIC (collectively, the “IFRSs”) endorsed by the FSC and the related amendments to the Regulations Governing the Preparation of Financial Reports by Securities Issuers starting January 1, 2015.
Except for the following, applied the initial application of the amendments to the Regulations Governing the Preparation of Financial Reports by Securities Issuers and the 2013 IFRSs version would not have any material impact on the Group’s accounting policies:
1) IFRS 12 “Disclosure of Interests in Other Entities”
IFRS 12 is a new disclosure standard and is applicable to entities that have interests in subsidiaries, associates and unconsolidated structured entities. In general, the disclosure requirements in IFRS 12 are more extensive, please refer to Notes 12 and 13 for related disclosures.
-198-
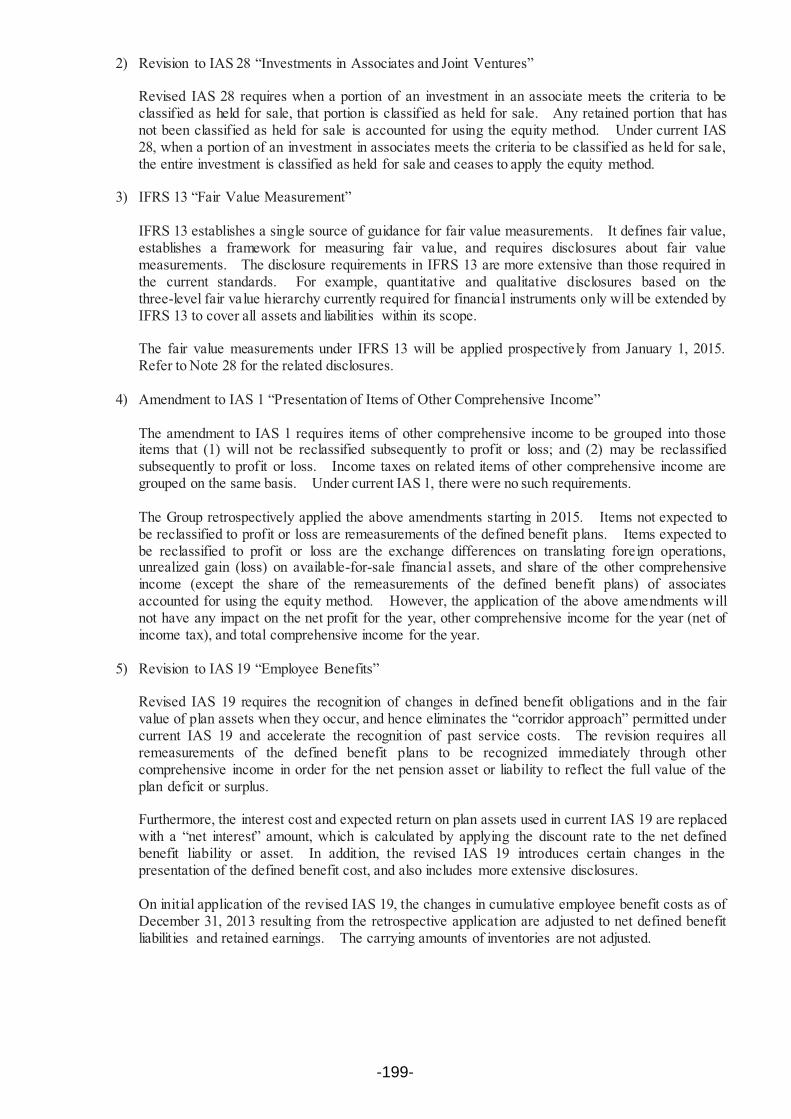
2) Revision to IAS 28 “Investments in Associates and Joint Ventures”
Revised IAS 28 requires when a portion of an investment in an associate meets the criteria to be classified as held for sale, that portion is classified as held for sale. Any retained portion that has not been classified as held for sale is accounted for using the equity method. Under current IAS 28, when a portion of an investment in associates meets the criteria to be classified as held for sale, the entire investment is classified as held for sale and ceases to apply the equity method.
3) IFRS 13 “Fair Value Measurement”
IFRS 13 establishes a single source of guidance for fair value measurements. It defines fair value, establishes a framework for measuring fair value, and requires disclosures about fair value measurements. The disclosure requirements in IFRS 13 are more extensive than those required in the current standards. For example, quantitative and qualitative disclosures based on the three-level fair value hierarchy currently required for financial instruments only will be extended by IFRS 13 to cover all assets and liabilities within its scope.
The fair value measurements under IFRS 13 will be applied prospectively from January 1, 2015. Refer to Note 28 for the related disclosures.
4) Amendment to IAS 1 “Presentation of Items of Other Comprehensive Income”
The amendment to IAS 1 requires items of other comprehensive income to be grouped into those items that (1) will not be reclassified subsequently to profit or loss; and (2) may be reclassified subsequently to profit or loss. Income taxes on related items of other comprehensive income are grouped on the same basis. Under current IAS 1, there were no such requirements.
The Group retrospectively applied the above amendments starting in 2015. Items not expected to be reclassified to profit or loss are remeasurements of the defined benefit plans. Items expected to be reclassified to profit or loss are the exchange differences on translating foreign operations, unrealized gain (loss) on available-for-sale financial assets, and share of the other comprehensive income (except the share of the remeasurements of the defined benefit plans) of associates accounted for using the equity method. However, the application of the above amendments will not have any impact on the net profit for the year, other comprehensive income for the year (net of income tax), and total comprehensive income for the year.
5) Revision to IAS 19 “Employee Benefits”
Revised IAS 19 requires the recognition of changes in defined benefit obligations and in the fair value of plan assets when they occur, and hence eliminates the “corridor approach” permitted under current IAS 19 and accelerate the recognition of past service costs. The revision requires all remeasurements of the defined benefit plans to be recognized immediately through other comprehensive income in order for the net pension asset or liability to reflect the full value of the plan deficit or surplus.
Furthermore, the interest cost and expected return on plan assets used in current IAS 19 are replaced with a “net interest” amount, which is calculated by applying the discount rate to the net defined benefit liability or asset. In addition, the revised IAS 19 introduces certain changes in the presentation of the defined benefit cost, and also includes more extensive disclosures.
On initial application of the revised IAS 19, the changes in cumulative employee benefit costs as of December 31, 2013 resulting from the retrospective application are adjusted to net defined benefit liabilities and retained earnings. The carrying amounts of inventories are not adjusted.
-199-

The impact on the current year is set out below:
Impact on Assets, Liabilities and EquityDecember 31,
2015
Decrease in net defined benefit liabilities $ (376)Increase in retained earnings $ 376
Decrease in operating expense $ (376)Increase in income tax expense 64
Decrease in net profit for the year $ (312)
Decrease in total comprehensive income for the year $ (312)
Decrease in net profit attributable to:Owners of the Company $ (312)
Decrease in total comprehensive income attributable to:Owners of the Company $ (312)
Impact on earnings per share:Increase in basic earnings per share $ -Increase in diluted earnings per share $ -
The impact on the prior year is set out below:
Impact on Assets, Liabilities and Equity
As Originally Stated
Adjustments Arising from
Initial Application Restated
December 31, 2014
Net defined benefit liabilities $ 160,383 $ 5,045 $ 165,428Retained earnings $ 6,358,318 $ (5,045) $ 6,353,273
January 1, 2014
Net defined benefit liabilities $ 156,864 $ 5,045 $ 161,909Retained earnings $ 5,452,733 $ (5,045) $ 5,447,688
Impact on Total Comprehensive Income
As Originally Stated
Adjustments Arising from
Initial Application Restated
For the year ended December 31, 2014
Operating expense $ (8,884,179) $ (161) $ (8,884,340)Income tax expense (1,123,096) 27 (1,123,069)Total effect on net profit for the year 4,932,010 (134) 4,931,876
(Continued)
-200-
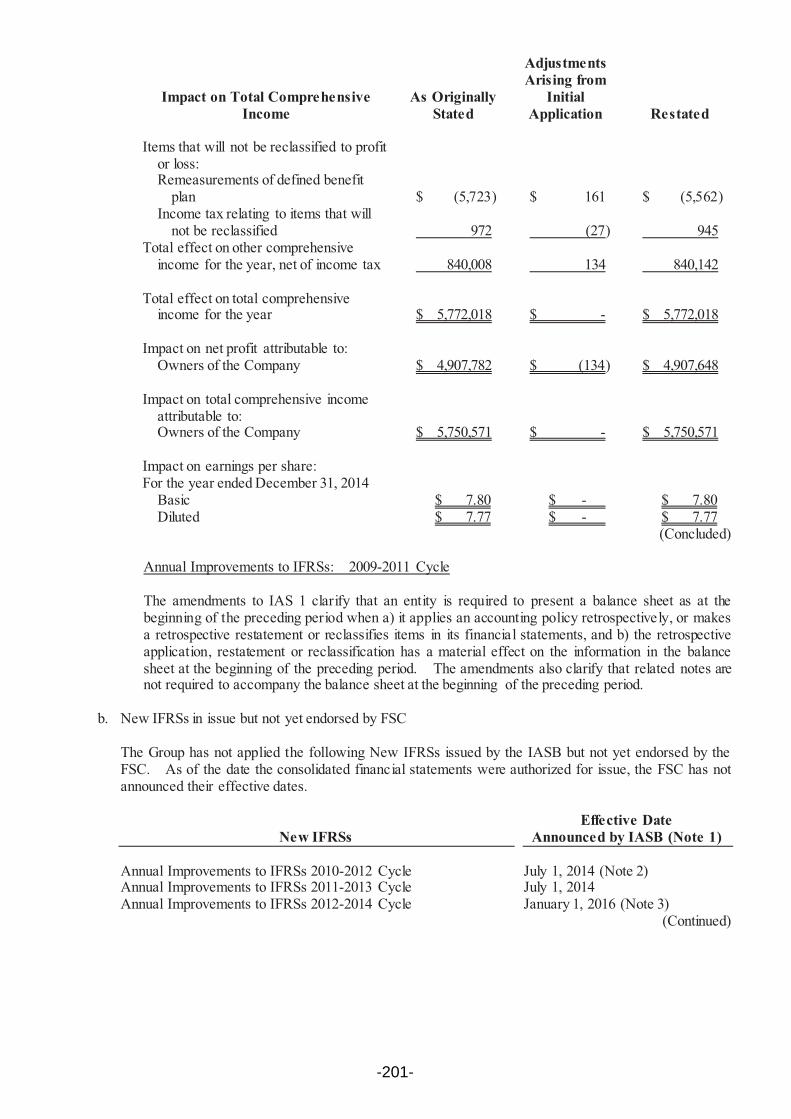
Impact on Total Comprehensive Income
As Originally Stated
Adjustments Arising from
Initial Application Restated
Items that will not be reclassified to profit or loss:Remeasurements of defined benefit
plan $ (5,723) $ 161 $ (5,562)Income tax relating to items that will
not be reclassified 972 (27) 945Total effect on other comprehensive
income for the year, net of income tax 840,008 134 840,142
Total effect on total comprehensive income for the year $ 5,772,018 $ - $ 5,772,018
Impact on net profit attributable to:Owners of the Company $ 4,907,782 $ (134) $ 4,907,648
Impact on total comprehensive income attributable to:Owners of the Company $ 5,750,571 $ - $ 5,750,571
Impact on earnings per share:For the year ended December 31, 2014
Basic $ 7.80 $ - $ 7.80Diluted $ 7.77 $ - $ 7.77
(Concluded)
Annual Improvements to IFRSs: 2009-2011 Cycle
The amendments to IAS 1 clarify that an entity is required to present a balance sheet as at the beginning of the preceding period when a) it applies an accounting policy retrospectively, or makes a retrospective restatement or reclassifies items in its financial statements, and b) the retrospective application, restatement or reclassification has a material effect on the information in the balance sheet at the beginning of the preceding period. The amendments also clarify that related notes are not required to accompany the balance sheet at the beginning of the preceding period.
b. New IFRSs in issue but not yet endorsed by FSC
The Group has not applied the following New IFRSs issued by the IASB but not yet endorsed by the FSC. As of the date the consolidated financial statements were authorized for issue, the FSC has not announced their effective dates.
New IFRSsEffective Date
Announced by IASB (Note 1)
Annual Improvements to IFRSs 2010-2012 Cycle July 1, 2014 (Note 2)Annual Improvements to IFRSs 2011-2013 Cycle July 1, 2014Annual Improvements to IFRSs 2012-2014 Cycle January 1, 2016 (Note 3)
(Continued)
-201-

New IFRSsEffective Date
Announced by IASB (Note 1)
IFRS 9 “Financial Instruments” January 1, 2018Amendments to IFRS 9 and IFRS 7 “Mandatory Effective Date of
IFRS 9 and Transition Disclosures”January 1, 2018
Amendments to IFRS 10 and IAS 28 “Sale or Contribution of Assets between an Investor and its Associate or Joint Venture”
To be determined by IASB
Amendments to IFRS 10, IFRS 12 and IAS 28 “Investment Entities: Applying the Consolidation Exception”
January 1, 2016
Amendment to IFRS 11 “Accounting for Acquisitions of Interests in Joint Operations”
January 1, 2016
IFRS 14 “Regulatory Deferral Accounts” January 1, 2016IFRS 15 “Revenue from Contracts with Customers” January 1, 2018IFRS 16 “Leases” January 1, 2019Amendment to IAS 1 “Disclosure Initiative” January 1, 2016Amendment to IAS 7 “Disclosure Initiative” January 1, 2017Amendments to IAS 12 “Recognition of Deferred Tax Assets for
Unrealized Losses”January 1, 2017
Amendments to IAS 16 and IAS 38 “Clarification of Acceptable Methods of Depreciation and Amortization”
January 1, 2016
Amendments to IAS 16 and IAS 41 “Agriculture: Bearer Plants” January 1, 2016Amendment to IAS 19 “Defined Benefit Plans: Employee
Contributions”July 1, 2014
Amendment to IAS 27 “Equity Method in Separate Financial Statements”
January 1, 2016
Amendment to IAS 36 “Impairment of Assets: Recoverable Amount Disclosures for Non-financial Assets”
January 1, 2014
Amendment to IAS 39 “Novation of Derivatives and Continuation of Hedge Accounting”
January 1, 2014
IFRIC 21 “Levies” January 1, 2014(Concluded)
Note 1: Unless stated otherwise, the above New IFRSs are effective for annual periods beginning on or after their respective effective dates.
Note 2: The amendment to IFRS 2 applies to share-based payment transactions with grant date on or after July 1, 2014; the amendment to IFRS 3 applies to business combinations with acquisition date on or after July 1, 2014; the amendment to IFRS 13 is effective immediately; the remaining amendments are effective for annual periods beginning on or after July 1, 2014.
Note 3: The amendment to IFRS 5 is applied prospectively to changes in a method of disposal that occur in annual periods beginning on or after January 1, 2016; the remaining amendments are effective for annual periods beginning on or after January 1, 2016.
-202-

The initial application of the above New IFRSs, whenever applied, would not have any material impact on the Group’s accounting policies, except for the following:
1) IFRS 9 “Financial Instruments”
Recognition and measurement of financial assets
With regards to financial assets, all recognized financial assets that are within the scope of IAS 39 “Financial Instruments: Recognition and Measurement” are subsequently measured at amortized cost or fair value. Under IFRS 9, the requirement for the classification of financial assets is stated below.
For the Group’s debt instruments that have contractual cash flows that are solely payments of principal and interest on the principal amount outstanding, their classification and measurement are as follows:
a) For debt instruments, if they are held within a business model whose objective is to collect the contractual cash flows, the financial assets are measured at amortized cost and are assessed for impairment continuously with impairment loss recognized in profit or loss, if any. Interest revenue is recognized in profit or loss by using the effective interest method;
b) For debt instruments, if they are held within a business model whose objective is achieved by both the collecting of contractual cash flows and the selling of financial assets, the financial assets are measured at fair value through other comprehensive income (FVTOCI) and are assessed for impairment. Interest revenue is recognized in profit or loss by using the effective interest method, and other gain or loss shall be recognized in other comprehensive income, except for impairment gains or losses and foreign exchange gains and losses. When the debt instruments are derecognized or reclassified the cumulative gain or loss previously recognized in other comprehensive income is reclassified from equity to profit or loss.
Except for above, all other financial assets are measured at fair value through profit or loss. However, the Group may make an irrevocable election to present subsequent changes in the fair value of an equity investment (that is not held for trading) in other comprehensive income, with only dividend income generally recognized in profit or loss. No subsequent impairment assessment is required, and the cumulative gain or loss previously recognized in other comprehensive income cannot be reclassified from equity to profit or loss.
The impairment of financial assets
IFRS 9 requires that impairment loss on financial assets is recognized by using the “Expected Credit Losses Model”. The credit loss allowance is required for financial assets measured at amortized cost, financial assets mandatorily measured at FVTOCI, lease receivables, contract assets arising from IFRS 15 “Revenue from Contracts with Customers”, certain written loan commitments and financial guarantee contracts. A loss allowance for the 12-month expected credit losses is required for a financial asset if its credit risk has not increased significantly since initial recognition. A loss allowance for full lifetime expected credit losses is required for a financial asset if its credit risk has increased significantly since initial recognition and is not low. However, a loss allowance for full lifetime expected credit losses is required for trade receivables that do not constitute a financing transaction.
For purchased or originated credit-impaired financial assets, the Group takes into account the expected credit losses on initial recognition in calculating the credit-adjusted effective interest rate. Subsequently, any changes in expected losses are recognized as a loss allowance with a corresponding gain or loss recognized in profit or loss.
-203-

2) Amendment to IAS 36 “Recoverable Amount Disclosures for Non-financial Assets”
In issuing IFRS 13 “Fair Value Measurement”, the IASB made consequential amendment to the disclosure requirements in IAS 36 “Impairment of Assets”, introducing a requirement to disclose in every reporting period the recoverable amount of an asset or each cash-generating unit. The amendment clarifies that such disclosure of recoverable amounts is required only when an impairment loss has been recognized or reversed during the period. Furthermore, the Group is required to disclose the discount rate used in measurements of the recoverable amount based on fair value less costs of disposal measured using a present value technique.
3) IFRIC 21 “Levies”
IFRIC 21 provides guidance on when to recognize a liability for a levy imposed by a government. It addresses the accounting for a liability whose timing and amount is certain and the accounting for a provision whose timing or amount is not certain. The Group accrues related liability when the transaction or activity that triggers the payment of the levy occurs. Therefore, if the obligating event occurs over a period of time (such as generation of revenue over a period of time), the liability is recognized progressively. If an obligation to pay a levy is triggered upon reaching a minimum threshold (such as a minimum amount of revenue or sales generated), the liability is recognized when that minimum threshold is reached.
4) Annual Improvements to IFRSs: 2010-2012 Cycle
Several standards including IFRS 2 “Share-based Payment”, IFRS 3 “Business Combinations” and IFRS 8 “Operating Segments” were amended in this annual improvement.
The amended IFRS 2 changes the definitions of “vesting condition” and “market condition” and adds definitions for “performance condition” and “service condition”. The amendment clarifies that a performance target can be based on the operations (i.e. a non-market condition) of the Group or another entity in the same group or the market price of the equity instruments of the Group or another entity in the same group (i.e. a market condition); that a performance target can relate either to the performance of the Group as a whole or to some part of it (e.g. a division); and that the period for achieving a performance condition must not extend beyond the end of the related service period. In addition, a share market index target is not a performance condition because it not only reflects the performance of the Group, but also of other entities outside the Group.
IFRS 3 was amended to clarify that contingent consideration should be measured at fair value, irrespective of whether the contingent consideration is a financial instrument within the scope of IFRS 9 or IAS 39. Changes in fair value should be recognized in profit or loss.
The amended IFRS 8 requires an entity to disclose the judgments made by management in applying the aggregation criteria to operating segments, including a description of the operating segments aggregated and the economic indicators assessed in determining whether the operating segments have “similar economic characteristics”. The amendment also clarifies that a reconciliation of the total of the reportable segments’ assets to the entity’s assets should only be provided if the segments’ assets are regularly provided to the chief operating decision-maker.
IFRS 13 was amended to clarify that the issuance of IFRS 13 did not remove the ability to measure short-term receivables and payables with no stated interest rate at their invoice amounts without discounting, if the effect of not discounting is immaterial.
IAS 24 was amended to clarify that a management entity providing key management personnel services to the Group is a related party of the Group. Consequently, the Group is required to disclose as related party transactions the amounts incurred for the service paid or payable to the management entity for the provision of key management personnel services. However, disclosure of the components of such compensation is not required.
-204-
5) Annual Improvements to IFRSs: 2011-2013 Cycle
Several standards including IFRS 3 and IFRS 13 were amended in this annual improvement.
IFRS 3 was amended to clarify that IFRS 3 does not apply to the accounting for the formation of all types of joint arrangements in the financial statements of the joint arrangement itself.
The scope in IFRS 13 of the portfolio exception for measuring the fair value of a group of financial assets and financial liabilities on a net basis was amended to clarify that it includes all contracts that are within the scope of, and accounted for in accordance with, IAS 39 or IFRS 9, even if those contracts do not meet the definitions of financial assets or financial liabilities within IAS 32.
6) Amendments to IAS 16 and IAS 38 “Clarification of Acceptable Methods of Depreciation and Amortization”
The entity should use appropriate depreciation and amortization method to reflect the pattern in which the future economic benefits of the property, plant and equipment and intangible asset are expected to be consumed by the entity.
The amended IAS 16 “Property, Plant and Equipment” requires that a depreciation method that is based on revenue that is generated by an activity that includes the use of an asset is not appropriate. The amended standard does not provide any exception from this requirement.
The amended IAS 38 “Intangible Assets” requires that there is a rebuttable presumption that an amortization method that is based on revenue that is generated by an activity that includes the use of an intangible asset is not appropriate. This presumption can be overcome only in the following limited circumstances:
a) In which the intangible asset is expressed as a measure of revenue (for example, the contract that specifies the entity’s use of the intangible asset will expire upon achievement of a revenue threshold); or
b) When it can be demonstrated that revenue and the consumption of the economic benefits of the intangible asset are highly correlated.
An entity should apply the aforementioned amendments prospectively for annual periods beginning on or after the effective date.
7) IFRS 15 “Revenue from Contracts with Customers”
IFRS 15 establishes principles for recognizing revenue that apply to all contracts with customers, and will supersedes IAS 18 “Revenue”, IAS 11 “Construction Contracts” and a number of revenue-related interpretations from January 1, 2017.
When applying IFRS 15, an entity shall recognize revenue by applying the following steps:
� Identify the contract with the customer;� Identify the performance obligations in the contract;� Determine the transaction price;� Allocate the transaction price to the performance obligations in the contracts; and� Recognize revenue when the entity satisfies a performance obligation.
When IFRS 15 is effective, an entity may elect to apply this Standard either retrospectively to each prior reporting period presented or retrospectively with the cumulative effect of initially applying this Standard recognized at the date of initial application.
-205-

8) Amendments to IFRS 10 and IAS 28 “Sale or Contribution of Assets between an Investor and its Associate or Joint Venture”
The amendments stipulated that, when an entity sells or contributes assets that constitute a business (as defined in IFRS 3) to an associate, the gain or loss resulting from the transaction is recognized in full. Also, when an entity loses control of a subsidiary that contains a business but retains significant influence, the gain or loss resulting from the transaction is recognized in full.
Conversely, when an entity sells or contributes assets that do not constitute a business to an associate, the gain or loss resulting from the transaction is recognized only to the extent of the unrelated investors’ interest in the associate, i.e. the entity’s share of the gain or loss is eliminated. Also, when an entity loses control of a subsidiary that does not contain a business but retains significant influence in an associate, the gain or loss resulting from the transaction is recognized only to the extent of the unrelated investors’ interest in the associate, i.e. the entity’s share of the gain or loss is eliminated.
9) IFRS 16 “Leases”
IFRS 16 sets out the accounting standards for leases that will supersede IAS 17 and a number of related interpretations.
Under IFRS 16, if the Group is a lessee, it shall recognize right-of-use assets and lease liabilities for all leases on the consolidated balance sheets except for low-value and short-term leases. The Group may elect to apply the accounting method similar to the accounting for operating lease under IAS 17 to the low-value and short-term lease. On the consolidated statements of comprehensive income, the Group should present the depreciation expense charged on the right-of-use asset separately from interest expense accrued on the lease liability; interest is computed by using effective interest method. On the consolidated statements of cash flows, cash payments for the principal portion of the lease liability are classified within financing activities; cash payments for interest portion are classified within operating activities.
The application of IFRS 16 is not expected to have a material impact on the accounting of the Group as lessor.
When IFRS 16 becomes effective, the Group may elect to apply this Standard either retrospectively to each prior reporting period presented or retrospectively with the cumulative effect of the initial application of this Standard recognized at the date of initial application.
10) Amendments to IAS 12 “Recognition of Deferred Tax Assets for Unrealized Losses”
In determining whether to recognize a deferred tax asset, the Group should assess a deductible temporary difference in combination with all of its other deductible temporary differences, unless the tax law restricts the utilization of losses to deduction against income of a specific type, in which case, a deductible temporary difference is assessed in combination only with other deductible temporary differences of the appropriate type. The amendment also stipulates that, when determining whether to recognize a deferred tax asset, the estimate of probable future taxable profit may include some of the Group’s assets for more than their carrying amount if there is sufficient evidence that it is probable that the Group will achieve this, and that the estimate for future taxable profit should exclude tax deductions resulting from the reversal of deductible temporary differences.
Except for the above impact, as of the date the consolidated financial statements were authorized for issue, the Group is continuously assessing the possible impact that the application of other standards and interpretations will have on the Group’s financial position and financial performance, and will disclose the relevant impact when the assessment is completed.
-206-

4. SUMMARY OF SIGNIFICANT ACCOUNTING POLICIES
a. Statement of compliance
The consolidated financial statements have been prepared in accordance with the Regulations Governing the Preparation of Financial Reports by Securities Issuers and IFRSs as endorsed by the FSC.
b. Basis of preparation
The consolidated financial statements have been prepared on the historical cost basis except for financial instruments which are measured at fair value.
The fair value measurements are grouped into Levels 1 to 3 based on the degree to which the fair value measurement inputs are observable and the significance of the inputs to the fair value measurement in its entirety, which are described as follows:
1) Level 1 inputs are quoted prices (unadjusted) in active markets for identical assets or liabilities;
2) Level 2 inputs are inputs other than quoted prices included within Level 1 that are observable for the asset or liability, either directly (i.e. as prices) or indirectly (i.e. derived from prices); and
3) Level 3 inputs are unobservable inputs for the asset or liability.
c. Classification of current and non-current assets and liabilities
Current assets include:
1) Assets held primarily for the purpose of trading;
2) Assets expected to be realized within twelve months after the reporting period; and
3) Cash and cash equivalents unless the asset is restricted from being exchanged or used to settle a liability for at least twelve months after the reporting period.
Current liabilities include:
1) Liabilities held primarily for the purpose of trading;
2) Liabilities due to be settled within twelve months after the reporting period, even if an agreement to refinance, or to reschedule payments, on a long-term basis is completed after the reporting period and before the consolidated financial statements are authorized for issue; and
3) Liabilities for which the Group does not have an unconditional right to defer settlement for at least twelve months after the reporting period.
Assets and liabilities that are not classified as current are classified as non-current.
d. Basis of consolidation
The consolidated financial statements incorporate the financial statements of the Company and the entities controlled by the Company (i.e. its subsidiaries, including structured entities). Income and expenses of subsidiaries acquired or disposed of during the period are included in the consolidated statement of profit or loss and other comprehensive income from the effective date of acquisition up to the effective date of disposal, as appropriate. When necessary, adjustments are made to the financial
-207-
statements of subsidiaries to bring their accounting policies into line with those used by the Company. All intra-group transactions, balances, income and expenses are eliminated in full upon consolidation. Total comprehensive income of subsidiaries is attributed to the owners of the Company and to the non-controlling interests even if this results in the non-controlling interests having a deficit balance.
Changes in the Group’s ownership interests in subsidiaries that do not result in the Group losing control over the subsidiaries are accounted for as equity transactions. The carrying amounts of the Group’s interests and the non-controlling interests are adjusted to reflect the changes in their relative interests in the subsidiaries. Any difference between the amount by which the non-controlling interests are adjusted and the fair value of the consideration paid or received is recognized directly in equity and attributed to the owners of the Company.
See Note 12 and Table 7 for the detailed information of subsidiaries (including the percentage of ownership and main business).
e. Business combinations
Acquisitions of businesses are accounted for using the acquisition method. Acquisition-related costs are generally recognized in profit or loss as incurred.
Goodwill is measured as the excess of the sum of the consideration transferred, the amount of any non-controlling interests in the acquiree, and the fair value of the acquirer’s previously held equity interest in the acquiree over the net of the acquisition-date amounts of the identifiable assets acquired and the liabilities assumed.
Non-controlling interests that are present ownership interests and entitle their holders to a proportionate share of the entity’s net assets in the event of liquidation may be initially measured either at fair value or at the non-controlling interests’ proportionate share of the recognized amounts of the acquiree’s identifiable net assets. The choice of measurement basis is made on a transaction-by-transaction basis. Other types of non-controlling interests are measured at fair value.
If the initial accounting for a business combination is incomplete by the end of the reporting period in which the combination occurs, the Group reports provisional amounts for the items for which the accounting is incomplete. Those provisional amounts are adjusted retrospectively during the measurement period, or additional assets or liabilities are recognized, to reflect new information obtained about facts and circumstances that existed as of the acquisit ion date that, if known, would have affected the amounts recognized as of that date.
f. Foreign currencies
In preparing the financial statements of each individual group entity, transactions in currencies other than the entity’s functional currency (foreign currencies) are recognized at the rates of exchange prevailing at the dates of the transactions.
At the end of each reporting period, monetary items denominated in foreign currencies are retranslated at the rates prevailing at that date. Exchange differences on monetary items arising from settlement or translation are recognized in profit or loss in the period in which they arise.
Nonmonetary items measured at fair value that are denominated in foreign currencies are retranslated at the rates prevailing at the date when the fair value was determined. Exchange differences arising on the retranslation of non-monetary items are included in profit or loss for the period except for exchange differences arising from the retranslation of non-monetary items in respect of which gains and losses are recognized directly in other comprehensive income, in which case, the exchange differences are also recognized directly in other comprehensive income.
Non-monetary items that are measured at historical cost in a foreign currency are not retranslated.
-208-

For the purpose of presenting consolidated financial statements, the functional currencies of the Company and the Group entities (including subsidiaries and associates in other countries that use currency different from the currency of the Company) are translated into the presentation currency -New Taiwan dollars as follows: Assets and liabilities are translated at the exchange rates prevailing at the end of the reporting period; income and expense items are translated at the average exchange rates for the period. The resulting currency translation differences are recognized in other comprehensive income (attributed to the owners of the Company and non-controlling interests as appropriate).
Goodwill and fair value adjustments on identifiable assets and liabilities acquired arising on the acquisition of a foreign operation are treated as assets and liabilities of the foreign operation and translated at the rate of exchange prevailing at the end of each reporting period. Exchange differences arising are recognized in other comprehensive income.
g. Inventories
Inventories consist of raw materials, supplies, finished goods and work-in-process and are stated at the lower of cost or net realizable value. Inventory write-downs are made by item, except where it may be appropriate to group similar or related items. Net realizable value is the estimated selling price of inventories less all estimated costs of completion and costs necessary to make the sale. Inventories are recorded at weighted-average cost.
h. Investments in associates
An associate is an entity over which the Group has significant influence and that is neither a subsidiary nor an interest in a joint venture.
The Group uses the equity method to account for its investments in associates.
Under the equity method, investments in an associate are initially recognized at cost and adjusted thereafter to recognize the Group’s share of the profit or loss and other comprehensive income of the associate. The Group also recognizes the changes in the Group’s share of equity of associates attributable to the Group.
Any excess of the cost of acquisition over the Group’s share of the net fair value of the identifiable assets and liabilities of an associate at the date of acquisition is recognized as goodwill, which is included within the carrying amount of the investment and is not amortized. Any excess of the Group’s share of the net fair value of the identifiable assets and liabilities over the cost of acquisition, after reassessment, is recognized immediately in profit or loss.
When the Group subscribes for additional new shares of the associate at a percentage different from its existing ownership percentage, the resulting carrying amount of the investment differs from the amount of the Group’s proportionate interest in the associate. The Group records such a difference as an adjustment to investments with the corresponding amount charged or credited to capital surplus -changes in the Group’s share of equity of associates. If the Group’s ownership interest is reduced due to the additional subscription of the new shares of associate, the proportionate amount of the gains or losses previously recognized in other comprehensive income in relation to that associate is reclassified to profit or loss on the same basis as would be required if the investee had directly disposed of the related assets or liabilities. When the adjustment should be debited to capital surplus, but the capital surplus recognized from investments accounted for by the equity method is insufficient, the shortage is debited to retained earnings.
-209-

When the Group’s share of losses of an associate equals or exceeds its interest in that associate (which includes any carrying amount of the investment accounted for by the equity method and long-term interests that, in substance, form part of the Group’s net investment in the associate), the Group discontinues recognizing its share of further losses. Additional losses and liabilities are recognized only to the extent that the Group has incurred legal obligations, or constructive obligations, or made payments on behalf of that associate.
The entire carrying amount of the investment (including goodwill) is tested for impairment as a single asset by comparing its recoverable amount with its carrying amount. Any impairment loss recognized forms part of the carrying amount of the investment. Any reversal of that impairment loss is recognized to the extent that the recoverable amount of the investment subsequently increases.
The Group discontinues the use of the equity method from the date on which its investment ceases to be an associate. Any retained investment is measured at fair value at that date and the fair value is regarded as its fair value on initia l recognition as a financial asset. The difference between the previous carrying amount of the associate attributable to the retained interest and its fair value is included in the determination of the gain or loss on disposal of the associate. The Group accounts for all amounts previously recognized in other comprehensive income in relation to that associate on the same basis as would be required if that associate had directly disposed of the related assets or liabilities.
When a group entity transacts with its associate, profits and losses resulting from the transactions with the associate are recognized in the Group’ consolidated financial statements only to the extent of interests in the associate that are not related to the Group.
i. Property, plant and equipment
Property, plant and equipment are stated at cost, less subsequent accumulated depreciation and subsequent accumulated impairment loss.
Property, plant and equipment in the course of construction are carried at cost, less any recognized impairment loss. Cost includes professional fees and borrowing costs eligible for capitalization. Such assets are depreciated and classified to the appropriate categories of property, plant and equipment when completed and ready for intended use.
Freehold land is not depreciated.
Depreciation on property, plant and equipment is recognized using the straight-line method. Each significant part is depreciated separately. The estimated useful lives, residual values and depreciation method are reviewed at the end of each reporting period, with the effect of any changes in estimate accounted for on a prospective basis.
On derecognition of an item of property, plant and equipment, the difference between the sales proceeds and the carrying amount of the asset is recognized in profit or loss.
j. Goodwill
Goodwill arising from the acquisition of a business is carried at cost as established at the date of acquisition of the business less accumulated impairment loss.
For the purposes of impairment testing, goodwill is allocated to each of the Group’s cash-generating units or groups of cash-generating units (referred to as cash-generating units) that is expected to benefit from the synergies of the combination.
-210-

A cash-generating unit to which goodwill has been allocated is tested for impairment annually, or more frequently when there is an indication that the unit may be impaired, by comparing its carrying amount, including the attributed goodwill, with its recoverable amount. However, if the goodwill allocated to a cash-generating unit was acquired in a business combination during the current annual period, that unit shall be tested for impairment before the end of the current annual period. If the recoverable amount of the cash-generating unit is less than its carrying amount, the impairment loss is allocated first to reduce the carrying amount of any goodwill allocated to the unit and then to the other assets of the unit pro rata based on the carrying amount of each asset in the unit. Any impairment loss is recognized directly in profit or loss. An impairment loss recognized for goodwill is not reversed in subsequent periods.
If goodwill has been allocated to a cash-generating unit and the entity disposes of an operation within that unit, the goodwill associated with the operation disposed of is included in the carrying amount of the operation when determining the gain or loss on disposal.
k. Intangible assets
1) Intangible assets acquired separately
Intangible assets with finite useful lives that are acquired separately are initially measured at cost and subsequently measured at cost less accumulated amortization and accumulated impairment loss. Amortization is recognized on a straight-line basis. The estimated useful life, residual value, and amortization method are reviewed at the end of each reporting period, with the effect of any changes in estimate accounted for on a prospective basis. Intangible assets with indefinite useful lives that are acquired separately are measured at cost less accumulated impairment loss.
2) Intangible assets acquired in a business combination
Intangible assets acquired in a business combination and recognized separately from goodwill are initially recognized at their fair value at the acquisition date. Subsequent to initial recognition, they are measured on the same basis as intangible assets that are acquired separately.
3) Derecognition of intangible assets
On derecognition of an intangible asset, the difference between the net disposal proceeds and the carrying amount of the asset are recognized in profit or loss.
l. Impairment of tangible and intangible assets other than goodwill
At the end of each reporting period, the Group reviews the carrying amounts of its tangible and intangible assets, excluding goodwill, to determine whether there is any indication that those assets have suffered an impairment loss. If any such indication exists, the recoverable amount of the asset is estimated in order to determine the extent of the impairment loss. When it is not possible to estimate the recoverable amount of an individual asset, the Group estimates the recoverable amount of the cash-generating unit to which the asset belongs. Corporate assets are allocated to the individual cash-generating units on a reasonable and consistent basis of allocation.
Recoverable amount is the higher of fair value less costs to sell and value in use. If the recoverable amount of an asset or cash-generating unit is estimated to be less than its carrying amount, the carrying amount of the asset or cash-generating unit is reduced to its recoverable amount, with the resulting impairment loss recognized in profit or loss.
When an impairment loss is subsequently reversed, the carrying amount of the asset or cash-generating unit is increased to the revised estimate of its recoverable amount, but only to the extent of the carrying amount that would have been determined had no impairment loss been recognized for the asset or cash-generating unit in prior years. A reversal of an impairment loss is recognized in profit or loss.
-211-

m. Financial instruments
Financial assets and financial liabilities are recognized when a group entity becomes a party to the contractual provisions of the instruments.
Financial assets and financial liabilities are initially measured at fair value. Transaction costs that are directly attributable to the acquisition or issue of financial assets and financial liabilities (other than financial assets and financial liabilities at fair value through profit or loss) are added to or deducted from the fair value of the financial assets or financial liabilities, as appropriate, on initial recognition. Transaction costs directly attributable to the acquisition of financial assets or financial liabilities at fair value through profit or loss are recognized immediately in profit or loss.
1) Financial assets
All regular way purchases or sales of financial assets are recognized and derecognized on a trade date basis.
a) Measurement category
Financial assets are classified into the following categories: Financial assets at fair value through profit or loss, available-for-sale financial assets, and loans and receivables.
i. Financial assets at fair value through profit or loss
Financial assets are classified as at fair value through profit or loss when the financial asset is either held for trading or it is designated as at fair value through profit or loss.
Financial assets at fair value through profit or loss are stated at fair value, with any gains or losses arising on remeasurement recognized in profit or loss. The net gain or loss recognized in profit or loss incorporates any dividend or interest earned on the financial asset. Fair value is determined in the manner described in Note 28.
ii. Available-for-sale financial assets
Available-for-sale financial assets are non-derivatives that are either designated as available-for-sale or are not classified as loans and receivables, held-to-maturity investments or financial assets at fair value through profit or loss.
Available-for-sale financial assets are measured at fair value. Changes in the carrying amount of available-for-sale monetary financial assets relating to changes in foreign currency exchange rates, interest income calculated using the effective interest method anddividends on available-for-sale equity investments are recognized in profit or loss. Other changes in the carrying amount of available-for-sale financial assets are recognized in other comprehensive income and will be reclassified to profit or loss when the investment is disposed of or is determined to be impaired.
Dividends on available-for-sale equity instruments are recognized in profit or loss when the Group’s right to receive the dividends is established.
Available-for-sale equity investments that do not have a quoted market price in an active market and whose fair value cannot be reliably measured and derivatives that are linked to and must be settled by delivery of such unquoted equity investments are measured at cost less any identified impairment loss at the end of each reporting period and are presented in a separate line item as financial assets carried at cost. If, in a subsequent period, the fair value of the financial assets can be reliably measured, the financial assets are remeasured at
-212-

fair value. The difference between carrying amount and fair value is recognized in other comprehensive income on financial assets. Any impairment losses are recognized in profit and loss.
iii. Loans and receivables
Loans and receivables (including trade receivables, cash and cash equivalent, and debt investments with no active market), are measured at amortized cost using the effective interest method, less any impairment, except for short-term receivables when the effect of discounting is immaterial.
Cash equivalent includes time deposits with original maturities within three months from the date of acquisition, highly liquid, readily convertible to a known amount of cash and be subject to an insignificant risk of changes in value. These cash equivalents are held for the purpose of meeting short-term cash commitments.
b) Impairment of financial assets
Financial assets, other than those at fair value through profit or loss, are assessed for indicators of impairment at the end of each reporting period. Financial assets are considered to be impaired when there is objective evidence that, as a result of one or more events that occurred after the initial recognition of the financial asset, the estimated future cash flows of the investment have been affected.
For financial assets carried at amortized cost, such as trade receivables, are assessed for impairment on a collective basis even if they were assessed not to be impaired individually. Objective evidence of impairment for a portfolio of receivables could include the Group’s past experience of collecting payments, an increase in the number of delayed payments in the portfolio past the average credit period of 90 days, as well as observable changes in national or local economic conditions that correlate with default on receivables.
For financial assets carried at amortized cost, the amount of the impairment loss recognized is the difference between the asset’s carrying amount and the present value of estimated future cash flows, discounted at the financial asset’s original effective interest rate.
For financial assets measured at amortized cost, if, in a subsequent period, the amount of the impairment loss decreases and the decrease can be related objectively to an event occurring after the impairment was recognized, the previously recognized impairment loss is reversed through profit or loss to the extent that the carrying amount of the investment at the date the impairment is reversed does not exceed what the amortized cost would have been had the impairment not been recognized.
For available-for-sale equity investments, a significant or prolonged decline in the fair value of the security below its cost is considered to be objective evidence of impairment.
For all other financial assets, objective evidence of impairment could include significant financial difficulty of the issuer or counterparty, breach of contract, such as a default or delinquency in interest or principal payments, it becoming probable that the borrower will enter bankruptcy or financial re-organization, or the disappearance of an active market for that financial asset because of financial difficulties.
When an available-for-sale financial asset is considered to be impaired, cumulative gains or losses previously recognized in other comprehensive income are reclassified to profit or loss in the period.
-213-

In respect of available-for-sale equity securities, impairment loss previously recognized in profit or loss are not reversed through profit or loss. Any increase in fair value subsequent to an impairment loss is recognized in other comprehensive income. In respect of available-for-sale debt securities, the impairment loss is subsequently reversed through profit or loss if an increase in the fair value of the investment can be objectively related to an event occurring after the recognition of the impairment loss.
For financial assets that are carried at cost, the amount of the impairment loss is measured as the difference between the asset’s carrying amount and the present value of the estimated future cash flows discounted at the current market rate of return for a similar financial asset. Such impairment loss will not be reversed in subsequent periods.
The carrying amount of the financial asset is reduced by the impairment loss directly for all financial assets with the exception of trade receivables where the carrying amount is reduced through the use of an allowance account. When a trade receivable is considered uncollectible, it is written off against the allowance account. Subsequent recoveries of amounts previously written off are credited against the allowance account. Changes in the carrying amount of the allowance account are recognized in profit or loss except for uncollectible trade receivables that are written off against the allowance account.
c) Derecognition of financial assets
The Group derecognizes a financial asset only when the contractual rights to the cash flows from the asset expire, or when it transfers the financial asset and substantially all the risks and rewards of ownership of the asset to another party.
On derecognition of a financial asset in its entirety, the difference between the asset’s carrying amount and the sum of the consideration received and receivable and the cumulative gain or loss that had been recognized in other comprehensive income is recognized in profit or loss.
2) Equity instruments
Debt and equity instruments issued by a group entity are classified as either financial liabilities or as equity in accordance with the substance of the contractual arrangements and the definitions of a financial liability and an equity instrument.
Equity instruments issued by a group entity are recognized at the proceeds received, net of direct issue costs.
Repurchase of the Company’s own equity instruments is recognized in and deducted directly from equity. No gain or loss is recognized in profit or loss on the purchase, sale, issue or cancellation of the Company’s own equity instruments.
3) Financial liabilities
a) Subsequent measurement
Except the following situation, all the financial liabilities are measured at amortized cost using the effective interest method:
Financial liabilities at fair value through profit or loss
Financial liabilities are classified as at fair value through profit or loss when the financial liability is either held for trading or it is designated as at fair value through profit or loss. Fair value is determined in the manner described in Note 28.
-214-

b) Derecognition of financial liabilities
The difference between the carrying amount of the financial liability derecognized and the consideration paid, including any non-cash assets transferred or liabilities assumed, is recognized in profit or loss.
4) Derivative financial instruments
The Group enters into a variety of derivative financial instruments to manage its exposure to interest rate and foreign exchange rate risks, including foreign exchange forward contracts.
Derivatives are initially recognized at fair value at the date the derivative contracts are entered into and are subsequently remeasured to their fair value at the end of each reporting period. The resulting gain or loss is recognized in profit or loss immediately unless the derivative is designated and effective as a hedging instrument, in which event the timing of the recognition in profit or loss depends on the nature of the hedge relationship. When the fair value of derivative financial instruments is positive, the derivative is recognized as a financial asset; when the fair value of derivative financial instruments is negative, the derivative is recognized as a financial liability.
n. Provisions
Provisions are measured at the best estimate of the discounted cash flows of the consideration required to settle the present obligation at the end of the reporting period, taking into account the risks and uncertainties surrounding the obligation.
Provisions for the expected cost of warranty obligations are recognized at the date of sale of the relevant products, at the best estimate of the expenditure required to settle the Group’s obligation by the management of the Group.
o. Revenue recognition
Revenue is measured at the fair value of the consideration received or receivable. Revenue is reduced for estimated customer returns, rebates and other similar allowances. Allowance for sales returns and liability for returns are recognized at the time of sale based on the seller’s reliable estimate of future returns and based on past experience and other relevant factors.
1) Sale of goods
Revenue from the sale of goods is recognized when all the following conditions are satisfied:
a) The Group has transferred to the buyer the significant risks and rewards of ownership of the goods;
b) The Group retains neither continuing managerial involvement to the degree usually associated with ownership nor effective control over the goods sold;
c) The amount of revenue can be measured reliably;
d) It is probable that the economic benefits associated with the transaction will flow to the Group; and
e) The costs incurred or to be incurred in respect of the transaction can be measured reliably.
The Group does not recognize sales revenue on materials delivered to subcontractors because this delivery does not involve a transfer of risks and rewards of materials ownership.
-215-
2) Rendering of services
Service income is recognized when services are provided.
Revenue from a contract to provide services is recognized by reference to the stage of completion of the contract.
3) Dividend and interest income
Dividend income from investments is recognized when the shareholder’s right to receive payment has been established provided that it is probable that the economic benefits will flow to the Group and the amount of income can be measured reliably.
Interest income from a financial asset is recognized when it is probable that the economic benefits will flow to the Group and the amount of income can be measured reliably. Interest income is accrued on a time basis, by reference to the principal outstanding and at the effective interest rate applicable.
p. Leasing
Leases are classified as finance leases whenever the terms of the lease transfer substantially all the risks and rewards of ownership to the lessee. All other leases are classified as operating leases.
1) The Group as lessor
Rental income from operating leases is recognized on a straight-line basis over the term of the relevant lease.
2) The Group as lessee
Operating lease payments are recognized as an expense on a straight-line basis over the lease term.
q. Employee benefits
1) Short-term employee benefits
Liabilities recognized in respect of short-term employee benefits are measured at the undiscounted amount of the benefits expected to be paid in exchange for the related service.
2) Retirement benefits
Payments to defined contribution retirement benefit plans are recognized as an expense when employees have rendered service entitling them to the contributions.
Defined benefit costs (including service cost, net interest and remeasurement) under the defined benefit retirement benefit plans are determined using the projected unit credit method. Service cost (including current and past service cost) and net interest on the net defined benefit liability are recognized as employee benefits expense in the period they occur. Remeasurement, comprising actuarial gains and losses, the effect of the changes to the asset ceiling, and the return on plan assets (excluding interest), is recognized in other comprehensive income in the period in which they occur. Remeasurement recognized in other comprehensive income is reflected immediately in retained earnings and will not be reclassified to profit or loss.
Net defined benefit liability (asset) represents the actual deficit (surplus) in the Group’s defined benefit plan. Any surplus resulting from this calculation is limited to the present value of any refunds from the plans or reductions in future contributions to the plans.
-216-
r. Employee share options
Employee share options granted to employee and others providing similar services.
The fair value at the grant date of the employee share options is expensed on a straight-line basis over the vesting period, based on the Group’s best estimates of the number of shares or options that are expected to ultimately vest, with a corresponding increase in capital surplus - employee share options. It is recognized as an expense in full at the grant date if vesting immediately.
At the end of each reporting period, the Group revises its estimate of the number of employee share options expected to vest. The impact of the revision of the original estimates is recognized in profit or loss such that the cumulative expense reflects the revised estimate, with a corresponding adjustment to the capital surplus - employee share options.
s. Taxation
Income tax expense represents the sum of the tax currently payable and deferred tax.
1) Current tax
According to the Income Tax Law, an additional tax at 10% of unappropriated earnings is provided for as income tax in the year the shareholders approve to retain the earnings.
Adjustments of prior years’ tax liabilities are added to or deducted from the current year’s tax provision.
2) Deferred tax
Deferred tax is recognized on temporary differences between the carrying amounts of assets and liabilities and the corresponding tax bases used in the computation of taxable profit.
Deferred tax liabilities are generally recognized for all taxable temporary differences. Deferred tax assets are generally recognized for all deductible temporary differences, unused loss carry forward and unused tax credits for purchases of machinery, equipment and technology, research and development expenditures, and personnel training expenditures to the extent that it is probable that taxable profits will be available against which those deductible temporary differences can be utilized.
Deferred tax liabilities are recognized for taxable temporary differences associated with investments in subsidiaries and associates, except where the Group is able to control the reversal of the temporary difference and it is probable that the temporary difference will not reverse in the foreseeable future. Deferred tax assets arising from deductible temporary differences associated with such investments and interests are only recognized to the extent that it is probable that there will be sufficient taxable profits against which to utilize the benefits of the temporary differences and they are expected to reverse in the foreseeable future.
The carrying amount of deferred tax assets is reviewed at the end of each reporting period and reduced to the extent that it is no longer probable that sufficient taxable profits will be available to allow all or part of the asset to be recovered. A previously unrecognized deferred tax asset is also reviewed at the end of each reporting period and recognized to the to the extent that it has become probable that future taxable profit will allow the deferred tax asset to be recovered.
-217-
Deferred tax liabilities and assets are measured at the tax rates that are expected to apply in the period in which the liability is settled or the asset realized, based on tax rates (and tax laws) that have been enacted or substantively enacted by the end of the reporting period. The measurement of deferred tax liabilities and assets reflects the tax consequences that would follow from the manner in which the Group expects, at the end of the reporting period, to recover or settle the carrying amount of its assets and liabilities.
3) Current and deferred tax for the year
Current and deferred tax are recognized in profit or loss, except when they relate to items that are recognized in other comprehensive income or directly in equity, in which case, the current and deferred tax are also recognized in other comprehensive income or directly in equity respectively.
5. CRITICAL ACCOUNTING JUDGMENTS AND KEY SOURCES OF ESTIMATION UNCERTAINTY
In the application of the Group's accounting policies, management is required to make judgments, estimates and assumptions about the carrying amounts of assets and liabilities that are not readily apparent from other sources. The estimates and associated assumptions are based on historical experience and other factors that are considered relevant. Actual results may differ from these estimates.
The estimates and underlying assumptions are reviewed on an ongoing basis. Revisions to accounting estimates are recognized in the period in which the estimate is revised if the revision affects only that period or in the period of the revision and future periods if the revision affects both current and future periods.
a. Impairment of goodwill
Determining whether goodwill is impaired requires an estimation of the value in use of the cash-generating units to which goodwill has been allocated. The value in use calculation requires management to estimate the future cash flows expected to arise from the cash-generating unit and a suitable discount rate in order to calculate present value. Where the actual future cash flows are less than expected, a material impairment loss may arise.
b. Estimated impairment of trade receivables
When there is objective evidence of impairment loss, the Group takes into consideration the estimation of future cash flows. The amount of the impairment loss is measured as the difference between the asset’s carrying amount and the present value of estimated future cash flows (excluding future credit losses that have not been incurred) discounted at the financial asset’s original effective interest rate. Where the actual future cash flows are less than expected, a material impairment loss may arise.
c. Write-down of inventory
Net realizable value of inventory is the estimated selling price in the ordinary course of business less the estimated costs of completion and the estimated costs necessary to make the sale. The estimation of net realizable value was based on current market conditions and the historical experience of selling products of a similar nature. Changes in market conditions may have a material impact on the estimation of net realizable value.
d. Fair value measurements and valuation processes
If some of the Group's assets and liabilities measured at fair value have no quoted prices in active markets, the Group determines whether to engage third party qualified valuers and to determine the appropriate valuation techniques for fair value measurements in accordance with relevant laws and regulations or by judgment.
-218-

Where Level 1 inputs are not available, the Group or engaged valuers would determine appropriate inputs by referring to the analyses of the financial position and the operation results of investees, quoted prices of similar instruments in active markets, valuation multiples of comparable entities/market prices or rates and specific features of derivatives. If the actual changes of inputs in the future differ from expectation, fair value might vary accordingly. The Group updates inputs every quarter to confirm the appropriateness of fair value measurement.
Information about the valuation techniques and inputs used in determining the fair value of various assets and liabilities is disclosed in Note 28.
e. Recognition and measurement of defined benefit plans
Net defined benefit liabilities (assets) and the resulting defined benefit costs under defined benefit pension plans are calculated using the projected unit credit method. Actuarial assumptions comprise the discount rate, rate of employee turnover, and future salary increase, etc. Changes in economic circumstances and market conditions will affect these assumptions and may have a material impact on the amount of the expense and the liability
6. CASH AND CASH EQUIVALENTS
December 312015 2014
Cash on hand $ 65,144 $ 4,852Checking accounts and demand deposits 4,144,007 2,925,186Time deposits with original maturities less than three months 149,108 191,969
$ 4,358,259 $ 3,122,007
The market rate intervals of cash in bank, at the end of the reporting period were as follows:
December 312015 2014
Demand deposits 0.001%-13.26% 0.001%-10.00%Time deposits with original maturities of less than three months 1.6%-5.0% 2.6%-5.6%
7. FINANCIAL INSTRUMENTS AT FAIR VALUE THROUGH PROFIT OR LOSS
December 312015 2014
Financial assets held for trading - current
Derivative financial assetsForward exchange contracts $ 7,391 $ 14,879
Nonderivative financial assets Domestic quoted shares 67,554 119,525Foreign quoted shares 101,444 30,998
$ 176,389 $ 165,402(Continued)
-219-

December 312015 2014
Financial liabilities held for trading - current
Derivative financial liabilities Forward exchange contracts $ 6,352 $ 8,698
(Concluded)
At the end of the reporting period, outstanding forward exchange contracts not under hedge accounting were as follows:
Currency Maturity DateNotional Amount(In Thousands)
December 31, 2015
Sell EUR/NTD 2016.01-2016.04 EUR5,000/NTD179,073EUR/USD 2016.01-2016.04 EUR6,500/USD7,102USD/NTD 2016.01-2016.02 USD1,499/NTD49,190JPY/NTD 2016.01-2016.05 JPY200,000/NTD53,236JPY/USD 2016.01-2016.05 JPY70,000/USD582RMB/NTD 2016.01-2016.03 RMB64,000/NTD321,201RMB/USD 2016.01-2016.02 RMB15,000/USD2,323
December 31, 2014
Sell USD/NTD 2015.01-2015.04 USD1,263/NTD38,634EUR/USD 2015.01-2015.04 EUR1,000/USD1,263EUR/NTD 2015.01-2015.04 EUR10,500/NTD415,900JPY/NTD 2015.01-2015.03 JPY70,000/NTD20,011RMB/NTD 2015.01-2015.05 RMB65,000/NTD322,421
The Company entered into forward exchange contracts during the years ended December 31, 2015 and 2014 to manage exposures due to exchange rate fluctuations of foreign-currency denominated assets and liabilities. The Company’s financial hedging strategy is to minimize risks due to market price fluctuations and cash flows; however, because these contracts did not meet the criteria for hedge effectiveness, they were not subject to hedge accounting.
8. AVAILABLE-FOR-SALE FINANCIAL ASSETS
December 312015 2014
Current
Domestic investmentsMutual funds $ 1,271,302 $ 2,351,160Quoted shares 484,541 133,083
Foreign investmentsInvestment products denominated in RMB - 947,116
$ 1,755,843 $ 3,431,359(Continued)
-220-

December 312015 2014
Noncurrent
Domestic investmentsQuoted shares $ 1,704,966 $ 2,385,937Unlisted shares 9,375 9,375
Foreign investmentsUnlisted foreign shares 33,257 33,257
$ 1,747,598 $ 2,428,569(Concluded)
For its securities borrowing and lending transactions, the Group placed some of its quoted domestic stocks, recorded under available-for-sale assets - noncurrent, in a trust at Chinatrust Commercial Bank. As of December 31, 2015 and 2014, the stocks held in trust amounted to $1,276,400 thousand and $1,792,025 thousand, respectively. Refer to Table 3 for more information. On the transactions, the Group recognized gains of $235 thousand and $144 thousand in the years ended December 31, 2015 and 2014, respectively. These gains were recorded under other nonoperating income.
9. DEBT INVESTMENTS WITH NO ACTIVE MARKET
December 312015 2014
Time deposits with original maturities more than three months $ 3,171 $ 5,487
The market interest rates of the time deposits with original maturity more than three months were 1.00%-2.55% and 1.00%-2.50% per annum respectively as of December 31, 2015 and 2014.
10. NOTES AND ACCOUNTS RECEIVABLE
December 312015 2014
Notes receivable (include related parties) $ 970,722 $ 949,861
Accounts receivable $ 5,577,733 $ 5,110,375Less: Allowance for impairment loss (149,159) (150,002)
$ 5,428,574 $ 4,960,373
Accounts Receivable
The average credit period on sales of goods was from 30 to 90 days. In determining the recoverability of a trade receivable, the Group considered any change in the credit quality of the accounts receivable since the date credit was initially granted to the end of the reporting period. The Group recognized an allowance for impairment loss of 100% against all receivables over 1 year because historical experience had been that receivables that are past due beyond 1 year were not recoverable. Allowance for impairment loss were recognized against trade receivables between 90 days and 1 year based on estimated irrecoverable amounts determined by reference to past default experience of the counterparties and an analysis of their current financial position.
-221-

For the trade receivables balances that were past due at the end of the reporting period, the Group did not recognize an allowance for impairment loss, because there was not a significant change in credit quality and the amounts were still considered recoverable. The Group did not hold any collateral or other credit enhancements for these balances.
The aging of receivables was as follows:
December 312015 2014
Not overdue $ 4,457,975 $ 4,165,906Overdue
1 to 90 days 909,380 747,27091 to 360 days 131,727 117,746Over 360 days 78,651 79,453
$ 5,577,733 $ 5,110,375
The above aging schedule was based on the past due date.
The aging of receivables that were past due date but not impaired were as follows:
December 312015 2014
1 to 30 days $ 714,634 $ 607,79531 to 60 days 139,362 99,74661 to 90 days 55,384 39,729
$ 909,380 $ 747,270
The above aging schedule was based on the past due dates.
The movement of the allowance of doubtful trade receivables were as follows:
Individually Assessed for Impairment
Collectively Assessed for Impairment Total
Balance at January 1, 2014 $ 3,150 $ 137,652 $ 140,802Add (less): Impairment losses recognized
(reversed) on receivables 16,652 (6,661) 9,991Less: Amounts written off during the period as
uncollectible - (2,467) (2,467)Foreign exchange translation gains - 1,676 1,676
Balance at December 31, 2014 $ 19,802 $ 130,200 $ 150,002
Balance at January 1, 2015 $ 19,802 $ 130,200 $ 150,002Add (less): Impairment losses recognized
(reversed) on receivables (2,203) 25,563 23,360Less: Amounts written off during the period as
uncollectible (30) (20,586) (20,616)Foreign exchange translation losses - (3,587) (3,587)
Balance at December 31, 2015 $ 17,569 $ 131,590 $ 149,159
-222-

The Group recognized impairment losses of $1,432 thousand both on trade receivables as of December 31, 2015 and 2014. These amounts mainly related to customers that were in liquidation or in severe financial difficulties. The Group had no collaterals for these impaired trade receivables.
11. INVENTORIES
December 312015 2014
Raw materials $ 1,489,432 $ 1,578,803Work in process 974,373 894,068Finished goods 1,875,649 1,740,456Inventories in transit 529,406 568,223
$ 4,868,860 $ 4,781,550
The costs of inventories recognized as costs of goods sold for the years ended December 31, 2015 and 2014 were $22,221,007 thousand and $20,933,791 thousand, respectively.
The costs of inventories were decreased by $443,926 thousand and $446,653 thousand as of December 31, 2015 and 2014, respectively when stated at the lower of cost or net realizable values.
12. SUBSIDIARIES
Subsidiaries included in the consolidated financial statements.
The entities included in the consolidated statements are listed below.
% of OwnershipDecember 31
Investor Investee Main Business 2015 2014 Remark
The Company AAC (BVI) Investment and management service 100.00 100.00ATC Sale of industrial automation products 100.00 100.00Advansus Corp. Production and sale of industrial automation
products100.00 100.00
Advantech Corporate Investment Investment holding company 100.00 100.00AEUH Investment and management service 100.00 100.00ASG Sale of industrial automation products 100.00 100.00 eAAU Sale of industrial automation products 100.00 100.00 eAJP Sale of industrial automation products 100.00 100.00 eAMY Sale of industrial automation products 100.00 100.00 eAKR Sale of industrial automation products 100.00 100.00ABR Sale of industrial automation products 80.00 80.00 eACA Production and sale of portable industrial
automation products100.00 100.00
AIN Sale of industrial automation products 99.99 99.99 aAdvanPOS Production and sale of POS system 100.00 69.47 bALNC Production and sale of machine control solution 89.93 89.93 cAMX Sale of industrial automation products 100.00 100.00 aAdvantech Innovative Design Co., Ltd. Product design 100.00 - a, dAdvantech iFactory Co., Ltd. Cybernation equipments construction 100.00 - a, d
Advantech Corporate Investment
AiST Design, develop and sale of intelligent service 100.00 100.00
Cermate Manufacturing of electronic parts, computer, and peripheral devices
55.00 55.00
ATC ATC (HK) Investment and management service 100.00 100.00ATC (HK) AKMC Production and sale of components of industrial
automation products100.00 100.00
AAC (BVI) ANA Sale and fabrication of industrial automation products
100.00 100.00
AAC (HK) Investment and management service 100.00 100.00(Continued)
-223-

% of OwnershipDecember 31
Investor Investee Main Business 2015 2014 Remark
AAC (HK) ACN Sale of industrial automation products 100.00 100.00AiSC Sale of industrial automation products 100.00 100.00AXA Development and production of software
products100.00 100.00
ACN Hangzhou Advantofine Automation Co., Ltd.
Processing and sale of industrial automation products
60.00 60.00
AEUH AEU Sale of industrial automation products 100.00 100.00APL Sale of industrial automation products 100.00 100.00 e
AEU A-DLoG Design, R&D and sale of industrial automation vehicles and related products
100.00 100.00 e
ASG ATH Production of computers 51.00 51.00 eAID Sale of industrial automation products 100.00 100.00 e
Cermate Land Mark General investment 100.00 100.00Land Mark Cermate (Shanghai) Sale of industrial electronic equipments 100.00 100.00
Cermate (Shenzhen) Production of LCD touch panel, USB cable, and industrial computer
90.00 90.00
AdvanPOS Bright Mind Ltd. General investment 100.00 100.00Bright Mind Ltd. AdvanPOS Shanghai Production and sale of POS system 100.00 100.00 fALNC Better Auto General investment 100.00 100.00Better Auto Famous Now Limited General investment 100.00 100.00Famous Now Limited Dongguan Pou Yuen Digital
Technology Co., Ltd.Production and sale of industrial automation
products100.00 100.00
(Concluded)
Remark a: Not significant subsidiaries and their financial statements had not been audited. The management of the Company believe that there would not be material impacts had the financial statements of these subsidiaries been audited.
Remark b: In 2013, the Company acquired 70.19% equity in AdvanPOS, which was recognized as a consolidated entity as of December 31, 2013. AdvanPOS issued ordinary shares for the exercise of employee share options, decreasing the Company’s holding interest by 8.08% in 2014. In the first three quarters of 2015 and fourth quarter of 2014, the Company subscribed for an additional 6,533 thousand shares and 1,127 thousand shares of AdvanPOS, respectively, increasing its holding interest by 37.89%. These transactions increased its interest from 70.19% to 100%.
Remark c: In 2013, the Company acquired 99.97% equity of ALNC and later bought the rest of this subsidiary’s shares, resulting in the subsidiary’s becoming wholly owned by the Company. Thus, ALNC was recognized as a consolidated entity as of December 31, 2013. In the first quarter of 2014, the Company sold 10.27% of its holding of ALNC shares to ALNC’s employees; in the second and third quarters of 2014, the Company bought 0.14% and 0.06%, respectively, of ALNC’s outstanding shares. These transactions reduced its continuing interest from 100% to 89.93%.
Remark d: In the second quarter of 2015, the Company founded Advantech Innovative Design Co., Ltd. and Advantech iFactory Co., Ltd. and acquired 100% equity in each of these subsidiaries. These two subsidiaries had been recognized as consolidated entities as of December 31, 2015.
Remark e: The financial statements of these subsidiaries as of and for the years ended December 31, 2014 and 2013 had not been audited by the Company’s independent auditors but by other auditors.
Remark f: AdvanPOS Shanghai underwent its liquidation in December 31, 2015 and plans to complete the process by the end of 2016, with AdvanPOS as the eliminating entity after the merger.
-224-

13. INVESTMENTS ACCOUNTED FOR USING THE EQUITY METHOD
Investments in Associates
December 31 Immaterial Associates 2015 2014
Listed companies
Axiomtek Co., Ltd. (Axiomtek) $ 450,246 $ 420,063
Unlisted companies
Deneng Scientific Research Co., Ltd. (Deneng) 18,228 17,758Jan Hsiang Electronics Co., Ltd. (Jan Hsiang) 9,510 9,842
$ 477,984 $ 447,663
In January 2014, the Group subscribed for 658 thousand ordinary shares of Deneng for $18,095 thousand in cash and acquired 39.69% interest in the investee; thus, the Group could exercise significant influence over the investee.
When the Group disposed of all of its interest in GPEG K&M Ltd. in June 2014, which resulted in proceeds of $1,407 thousand (GBP28 thousand) and a loss of $19,313 thousand, it ceased to have significant influence on this investee.
The associates listed above were accounted for by the equity method.
Aggregate information on the associates
December 312015 2014
The Group’s share of Profit from continuing operations $ 110,226 $ 100,264Other comprehensive income 25 4,711
Total comprehensive income for the year $ 110,251 $ 104,975
The investments accounted for by the equity method and the share of profit or loss and other comprehensive income of those investments for the years ended December 31, 2015 and 2014 was based on the associates’ financial statements audited by the auditors for the same years.
14. PROPERTY, PLANT AND EQUIPMENT
Freehold Land Buildings EquipmentOffice
Equipment Other FacilitiesConstruction in
Progress Total
Cost
Balance at January 1, 2014 $ 2,916,539 $ 3,068,828 $ 1,300,425 $ 641,145 $ 940,524 $ 1,821,226 $ 10,688,687Additions 165,222 45,671 101,324 100,244 223,028 591,081 1,226,570Disposals (35,506 ) (28,745 ) (35,608 ) (23,643 ) (38,407 ) (14,965 ) (176,874 )Reclassifications 13,248 2,140,187 169,220 37,882 209,443 (2,359,874 ) 210,106Effect of exchange differences 5,812 94,245 19,248 2,021 29,844 3,418 154,588
Balance at December 31, 2014 $ 3,065,315 $ 5,320,186 $ 1,554,609 $ 757,649 $ 1,364,432 $ 40,886 $ 12,103,077
(Continued)
-225-
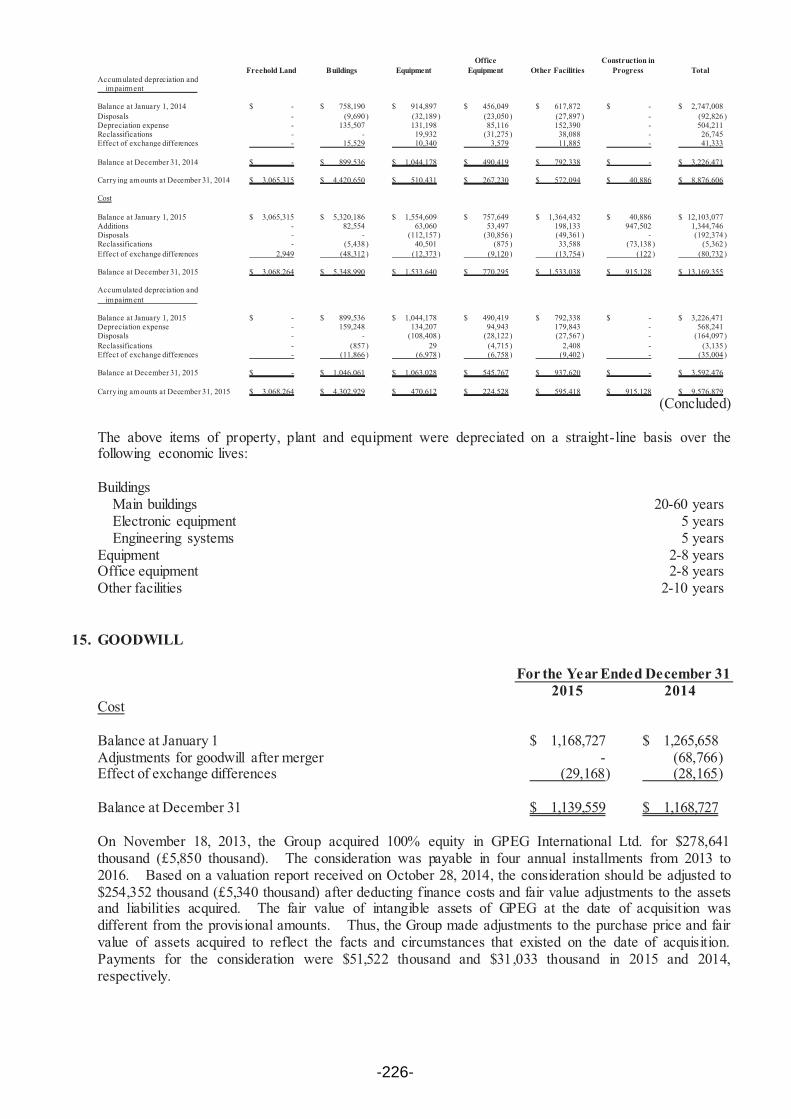
Freehold Land Buildings EquipmentOffice
Equipment Other FacilitiesConstruction in
Progress TotalAccumulated depreciation and impairment
Balance at January 1, 2014 $ - $ 758,190 $ 914,897 $ 456,049 $ 617,872 $ - $ 2,747,008Disposals - (9,690 ) (32,189 ) (23,050 ) (27,897 ) - (92,826 )Depreciation expense - 135,507 131,198 85,116 152,390 - 504,211Reclassifications - - 19,932 (31,275 ) 38,088 - 26,745Effect of exchange differences - 15,529 10,340 3,579 11,885 - 41,333
Balance at December 31, 2014 $ - $ 899,536 $ 1,044,178 $ 490,419 $ 792,338 $ - $ 3,226,471
Carry ing amounts at December 31, 2014 $ 3,065,315 $ 4,420,650 $ 510,431 $ 267,230 $ 572,094 $ 40,886 $ 8,876,606
Cost
Balance at January 1, 2015 $ 3,065,315 $ 5,320,186 $ 1,554,609 $ 757,649 $ 1,364,432 $ 40,886 $ 12,103,077Additions - 82,554 63,060 53,497 198,133 947,502 1,344,746Disposals - - (112,157 ) (30,856 ) (49,361 ) - (192,374 )Reclassifications - (5,438 ) 40,501 (875 ) 33,588 (73,138 ) (5,362 )Effect of exchange differences 2,949 (48,312 ) (12,373 ) (9,120 ) (13,754 ) (122 ) (80,732 )
Balance at December 31, 2015 $ 3,068,264 $ 5,348,990 $ 1,533,640 $ 770,295 $ 1,533,038 $ 915,128 $ 13,169,355
Accumulated depreciation and impairment
Balance at January 1, 2015 $ - $ 899,536 $ 1,044,178 $ 490,419 $ 792,338 $ - $ 3,226,471Depreciation expense - 159,248 134,207 94,943 179,843 - 568,241Disposals - - (108,408 ) (28,122 ) (27,567 ) - (164,097 )Reclassifications - (857 ) 29 (4,715 ) 2,408 - (3,135 )Effect of exchange differences - (11,866 ) (6,978 ) (6,758 ) (9,402 ) - (35,004 )
Balance at December 31, 2015 $ - $ 1,046,061 $ 1,063,028 $ 545,767 $ 937,620 $ - $ 3,592,476
Carry ing amounts at December 31, 2015 $ 3,068,264 $ 4,302,929 $ 470,612 $ 224,528 $ 595,418 $ 915,128 $ 9,576,879
(Concluded)
The above items of property, plant and equipment were depreciated on a straight-line basis over the following economic lives:
BuildingsMain buildings 20-60 yearsElectronic equipment 5 yearsEngineering systems 5 years
Equipment 2-8 yearsOffice equipment 2-8 yearsOther facilities 2-10 years
15. GOODWILL
For the Year Ended December 312015 2014
Cost
Balance at January 1 $ 1,168,727 $ 1,265,658Adjustments for goodwill after merger - (68,766)Effect of exchange differences (29,168) (28,165)
Balance at December 31 $ 1,139,559 $ 1,168,727
On November 18, 2013, the Group acquired 100% equity in GPEG International Ltd. for $278,641 thousand (£5,850 thousand). The consideration was payable in four annual installments from 2013 to 2016. Based on a valuation report received on October 28, 2014, the consideration should be adjusted to $254,352 thousand (£5,340 thousand) after deducting finance costs and fair value adjustments to the assets and liabilities acquired. The fair value of intangible assets of GPEG at the date of acquisition was different from the provisional amounts. Thus, the Group made adjustments to the purchase price and fair value of assets acquired to reflect the facts and circumstances that existed on the date of acquisition.Payments for the consideration were $51,522 thousand and $31,033 thousand in 2015 and 2014, respectively.
-226-

Items in the consolidated balance sheet increased or decreased by the following amounts:
December 31, 2013
Acquisition Date
Goodwill adjustment $ 162,244 $ 93,478Intangible assets $ - $ 44,477
16. PREPAYMENTS FOR LEASE OBLIGATION
December 312015 2014
Current assets (included in other current assets) $ 2,557 $ 2,606Noncurrent assets 100,875 96,516
$ 103,432 $ 99,122
Lease prepayments are for the Group’s land-use right in Mainland China.
17. BORROWINGS
Short-term Borrowings
December 312015 2014
Unsecured borrowingsLine of credit borrowings $ 880,625 $ 3,080
The weighted average effective interest rates on bank loans were 1.28%-1.84% and 0.80%-1.30% per annum as of December 31, 2015 and 2014, respectively.
18. OTHER LIABILITIES
December 312015 2014
Other payables Payable for salaries or bonuses $ 2,167,475 $ 2,132,546Payable for royalties 138,206 122,618Payable for employee benefits 105,186 48,622Others (Note) 969,450 870,403
$ 3,380,317 $ 3,174,189
Note: Including accruals of litigation, marketing expenses, and freight expenses.
-227-
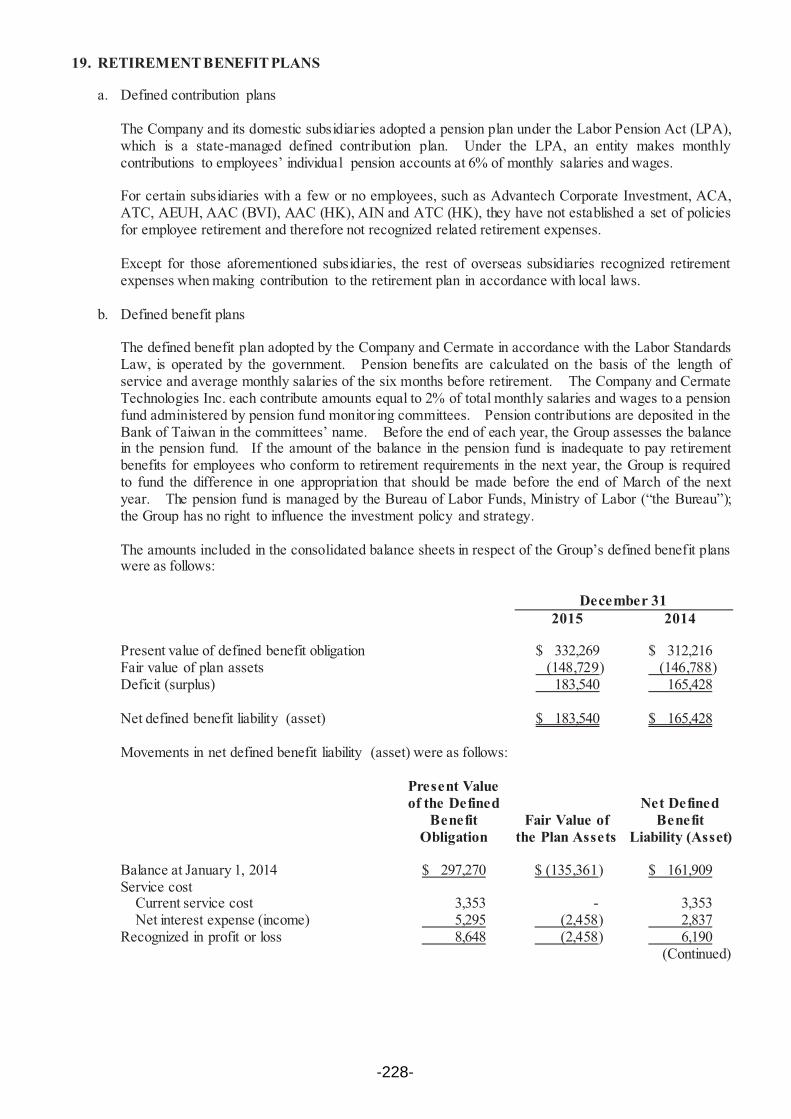
19. RETIREMENT BENEFIT PLANS
a. Defined contribution plans
The Company and its domestic subsidiaries adopted a pension plan under the Labor Pension Act (LPA), which is a state-managed defined contribution plan. Under the LPA, an entity makes monthly contributions to employees’ individual pension accounts at 6% of monthly salaries and wages.
For certain subsidiaries with a few or no employees, such as Advantech Corporate Investment, ACA, ATC, AEUH, AAC (BVI), AAC (HK), AIN and ATC (HK), they have not established a set of policies for employee retirement and therefore not recognized related retirement expenses.
Except for those aforementioned subsidiaries, the rest of overseas subsidiaries recognized retirement expenses when making contribution to the retirement plan in accordance with local laws.
b. Defined benefit plans
The defined benefit plan adopted by the Company and Cermate in accordance with the Labor Standards Law, is operated by the government. Pension benefits are calculated on the basis of the length of service and average monthly salaries of the six months before retirement. The Company and Cermate Technologies Inc. each contribute amounts equal to 2% of total monthly salaries and wages to a pension fund administered by pension fund monitor ing committees. Pension contributions are deposited in the Bank of Taiwan in the committees’ name. Before the end of each year, the Group assesses the balance in the pension fund. If the amount of the balance in the pension fund is inadequate to pay retirement benefits for employees who conform to retirement requirements in the next year, the Group is required to fund the difference in one appropriation that should be made before the end of March of the next year. The pension fund is managed by the Bureau of Labor Funds, Ministry of Labor (“the Bureau”); the Group has no right to influence the investment policy and strategy.
The amounts included in the consolidated balance sheets in respect of the Group’s defined benefit plans were as follows:
December 312015 2014
Present value of defined benefit obligation $ 332,269 $ 312,216Fair value of plan assets (148,729) (146,788)Deficit (surplus) 183,540 165,428
Net defined benefit liability (asset) $ 183,540 $ 165,428
Movements in net defined benefit liability (asset) were as follows:
Present Value of the Defined
Benefit Obligation
Fair Value of the Plan Assets
Net Defined Benefit
Liability (Asset)
Balance at January 1, 2014 $ 297,270 $ (135,361) $ 161,909Service cost
Current service cost 3,353 - 3,353Net interest expense (income) 5,295 (2,458) 2,837
Recognized in profit or loss 8,648 (2,458) 6,190(Continued)
-228-

Present Value of the Defined
Benefit Obligation
Fair Value of the Plan Assets
Net Defined Benefit
Liability (Asset)
RemeasurementReturn on plan assets (excluding amounts
included in net interest) $ - $ (1,828) $ (1,828)Actuarial (gain) loss - changes in
demographic assumptions 6,690 - 6,690Actuarial (gain) loss - experience
adjustments 700 - 700Recognized in other comprehensive income 7,390 (1,828) 5,562Contributions from the employer - (8,233) (8,233)Benefits paid (1,092) 1,092 -Balance at December 31, 2014 312,216 (146,788) 165,428Service cost
Current service cost 2,344 - 2,344Past service cost 1,340 - 1,340Net interest expense (income) 5,859 (2,830) 3,029
Recognized in profit or loss 9,543 (2,830) 6,713Remeasurement
Return on plan assets (excluding amounts included in net interest) - (1,032) (1,032)
Actuarial (gain) loss - changes in demographic assumptions 12,407 - 12,407
Actuarial (gain) loss - changes in financial assumptions 10,070 - 10,070
Actuarial (gain) loss - experience adjustments (2,142) - (2,142)
Recognized in other comprehensive income 20,335 (1,032) 19,303Contributions from the employer - (7,904) (7,904)Benefits paid (9,825) 9,825 -
Balance at December 31, 2015 $ 332,269 (148,729) $ 183,540(Concluded)
An analysis by function of the amounts recognized in profit or loss in respect of the defined benefit plans is as follows:
For the Year Ended December 312015 2014
Operating costs $ 1,083 $ 1,108Selling and marketing expenses 838 776General and administrative expenses 2,823 2,319Research and development expenses 1,969 1,987
$ 6,713 $ 6,190
-229-
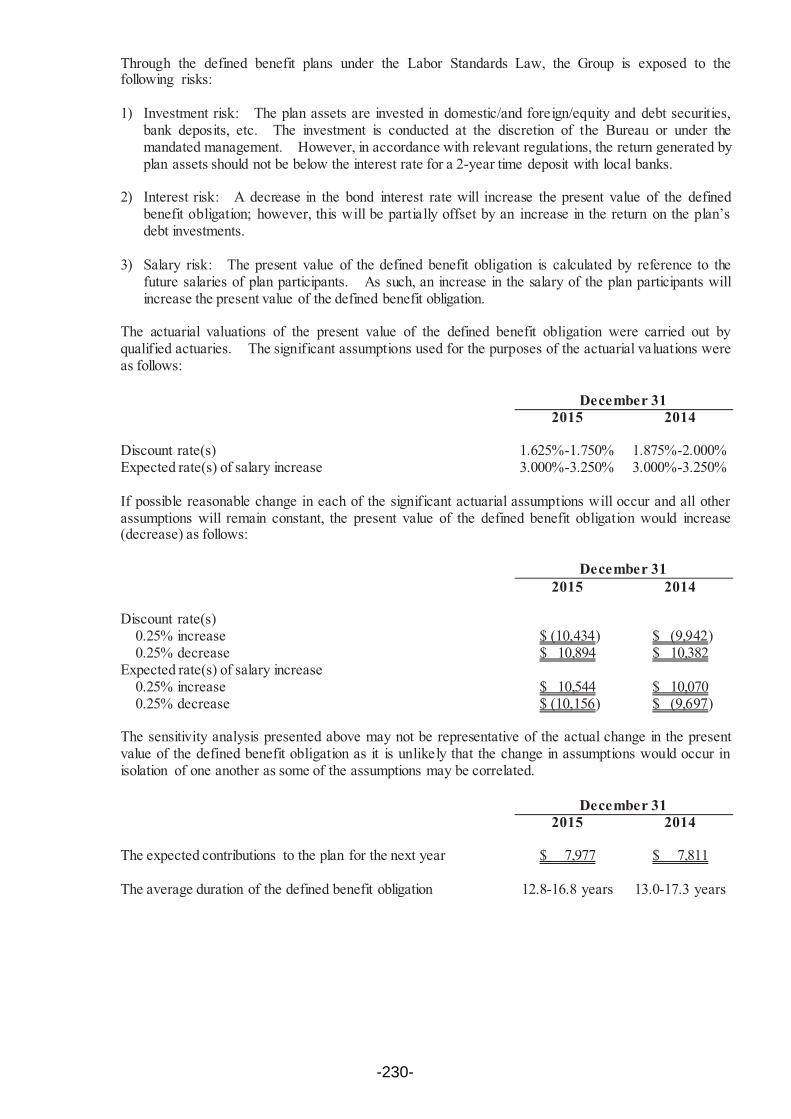
Through the defined benefit plans under the Labor Standards Law, the Group is exposed to the following risks:
1) Investment risk: The plan assets are invested in domestic/and foreign/equity and debt securities, bank deposits, etc. The investment is conducted at the discretion of the Bureau or under the mandated management. However, in accordance with relevant regulations, the return generated by plan assets should not be below the interest rate for a 2-year time deposit with local banks.
2) Interest risk: A decrease in the bond interest rate will increase the present value of the defined benefit obligation; however, this will be partially offset by an increase in the return on the plan’s debt investments.
3) Salary risk: The present value of the defined benefit obligation is calculated by reference to the future salaries of plan participants. As such, an increase in the salary of the plan participants will increase the present value of the defined benefit obligation.
The actuarial valuations of the present value of the defined benefit obligation were carried out by qualified actuaries. The significant assumptions used for the purposes of the actuarial valuations were as follows:
December 312015 2014
Discount rate(s) 1.625%-1.750% 1.875%-2.000%Expected rate(s) of salary increase 3.000%-3.250% 3.000%-3.250%
If possible reasonable change in each of the significant actuarial assumptions will occur and all other assumptions will remain constant, the present value of the defined benefit obligation would increase (decrease) as follows:
December 312015 2014
Discount rate(s)0.25% increase $ (10,434) $ (9,942)0.25% decrease $ 10,894 $ 10,382
Expected rate(s) of salary increase0.25% increase $ 10,544 $ 10,0700.25% decrease $ (10,156) $ (9,697)
The sensitivity analysis presented above may not be representative of the actual change in the present value of the defined benefit obligation as it is unlikely that the change in assumptions would occur in isolation of one another as some of the assumptions may be correlated.
December 312015 2014
The expected contributions to the plan for the next year $ 7,977 $ 7,811
The average duration of the defined benefit obligation 12.8-16.8 years 13.0-17.3 years
-230-

20. EQUITY
a. Share capital
Ordinary shares
December 312015 2014
Number of shares authorized (in thousands) 800,000 800,000Amount of shares authorized $ 8,000,000 $ 8,000,000Number of shares issued and fully paid (in thousands) 631,853 631,209Amount of shares issued and fully paid $ 6,318,531 $ 6,312,091
Fully paid ordinary shares, which have a par value of NT$10, carry one vote per share and carry a right to dividends.
For the year ended December 31, 2015, the changes in shares are due to employees’ exercise of their employee share options.
b. Capital surplus
December 312015 2014
May be used to offset a deficit, distributed as cash dividends, or transferred to share capital (1)
Arising from issuance of common shares $ 3,396,888 $ 3,396,888Arising from conversion of bonds 931,849 931,849Arising from the difference between consideration received or
paid and the carrying amount of the subsidiaries’ net assets during actual disposal or acquisition - 11,457
May be used to offset a deficit only
Arising from changes in percentage of ownership interest in subsidiaries (2) 4,246 679
Arising from employee share options 792,341 736,092Arising from distribution of stock dividends 78,614 78,614
May not be used for any purpose
Arising from share of changes in capital surplus of associates 12,698 10,526Arising from employee share options 370,919 140,853
$ 5,587,555 $ 5,306,958
1) Such capital surplus may be used to offset a deficit; in addition, when the Company has no deficit, such capital surplus may be distributed as cash dividends or transferred to share capital (limited to a certain percentage of the Company’s capital surplus and once a year).
-231-

2) Such capital surplus arises from the effect of changes in ownership interest in a subsidiary resulted from equity transactions other than actual disposal or acquisition, or from changes in capital surplus of subsidiaries accounted for by using equity method.
c. Retained earnings and dividend policy
Under the Company’s Articles of Incorporation, if the Company has earnings for the year, it should primarily make taxation payments, offset any past years’ deficits and then make appropriations for its legal reserve at 10% of annual net income. In addition, a special reserve should be appropriated or reversed as needed, adding cumulative retained earnings from previous periods and retaining partially, retained earnings for corporate growth. The remainder of the income should be appropriated in the following order:
1) 1% to 20% as bonus to employees;2) 1% or less as remuneration to directors and supervisors; and3) Dividends, as proposed by the board of directors.
Recipients of stock bonuses may include subsidiaries’ employees who meet the criteria set by the Company’s board of directors.
The Company operates in an industry related to computers, and its business related to network servers is new but with significant potential for growth. Thus, in formulating its dividend policy, the Company takes into account the overall business and industry conditions and trends, its objective of enhancing the shareholders’ long-term interests, and the sustainability of the Company’s growth. The policy also requires that stock dividends be less than 75% of total dividends to retain internally generated cash within the Company to finance future capital expenditures and working capital requirements.
Any appropriations from earnings should be recorded in the year of shareholders’ approval, following the year the earnings were generated.
In accordance with the amendments to the Company Act in May 2015, the recipients of dividends and bonuses are limited to shareholders and do not include employees. The consequential amendments to the Company’s Articles of Incorporation had been proposed by the Company’s board of directors on November 12, 2015 and are subject to the resolution of the shareholders in their meeting to be held on May 25, 2016. For information about the accrual basis of the employees’ compensation and remuneration to directors and supervisors and the actual appropriations, please refer to c. Employee benefits expense in Note 21.
Appropriation of earnings to legal reserve should be made until the legal reserve equals the Company’s paid-in capital. Legal reserve may be used to offset deficit. If the Company has no deficit and Legal reserve has exceeded 25% of the Company’s paid-in capital, the excess may be transferred to capital or distributed in cash.
Under Rule No. 1010012865 and Rule No. 1010047490 issued by the FSC and the directive titled “Questions and Answers for Special Reserves Appropriated Following Adoption of IFRSs”, the Company should appropriate or reverse to a special reserve.
Except for non-ROC resident shareholders, all shareholders receiving the dividends are allowed a tax credit equal to their proportionate share of the income tax paid by the Company.
-232-

The appropriation of earnings for 2014 and 2013 have been approved in the shareholders’ meetings on May 28, 2015 and June 18, 2014, respectively, were as follows:
Appropriation of EarningsDividends Per Share
(NT$)For the Year Ended
December 31For the Year Ended
December 312014 2013 2014 2013
Legal reserve $ 490,778 $ 410,640 $ - $ -Cash dividends 3,787,255 3,017,820 6.0 5.3Stock dividends - 569,400 - 1.0
The appropriations of earnings for 2015 had been proposed by the Company’s board of directors on March 4, 2016. The appropriations and dividends per share were as follows:
Appropriation of Earnings
Dividends Per Share (NT$)
Legal reserve $ 510,434 $ -Cash dividends 3,791,118 6.00
The appropriations of earnings for 2015 are subject to the resolution of the shareholders’ meeting to be held on May 25, 2016.
d. Other equity items
1) Exchange differences on translating the financial statements of foreign operations
For the Year Ended December 312015 2014
Balance at January 1 $ 338,356 $ 130,041Exchange differences on translating the net assets of foreign
operations (82,566) 246,470Related income tax 13,620 (42,667)Share of exchange difference of associates accounted for
using the equity method 2,449 4,512
Balance at December 31 $ 271,859 $ 338,356
2) Unrealized gain or loss from available-for-sale financial assets
For the Year Ended December 312015 2014
Balance at January 1 $ 563,277 $ (75,534)Unrealized gain (loss) on revaluation of available-for-sale
financial assets (292,554) 681,974Cumulative gain reclassified to profit or loss on disposal of
available-for-sale financial assets (202,458) (43,163)
Balance at December 31 $ 68,265 $ 563,277
-233-

e. Non-controlling interests
For the Year Ended December 312015 2014
Balance at January 1 $ 187,000 $ 161,891Attributable to non-controlling interests:
Share of profit for the year 22,629 24,228Exchange difference arising on translation of foreign entities (18,924) (2,566)
Remeasurement on defined benefit plans (255) (258)Related income tax 43 43Non-controlling interests arising from acquisition of subsidiaries
(Note 25) (44,217) (24,659)Partial disposal of subsidiaries (Note 25) - 28,321
Balance at December 31 $ 146,276 $ 187,000
21. NET PROFIT FROM CONTINUING OPERATIONS
a. Finance costs
For the Year Ended December 312015 2014
Interest on bank loans $ 1,285 $ 6,031Interest on convertible bonds - 21Others 8,756 8,368
$ 10,041 $ 14,420
b. Depreciation and amortization
For the Year Ended December 312015 2014
Property, plant and equipment $ 568,241 $ 504,211Intangible assets 97,953 90,709
$ 666,194 $ 594,920
An analysis of depreciation by functionOperating costs $ 130,104 $ 125,109Operating expenses 438,137 379,102
$ 568,241 $ 504,211
An analysis of amortization by functionOperating costs $ 7,748 $ 3,004Selling and marketing expense 298 2,254General and administrative expense 63,661 47,368Research and development expense 26,246 38,083
$ 97,953 $ 90,709
-234-

c. Employee benefit expense
For the Year Ended December 312015 2014
Short-term benefits $ 6,906,701 $ 6,840,620Post-employment benefits
Defined contribution plans 270,504 244,045Defined benefit plans (Note 19) 6,713 6,190
277,217 250,235Share-based payments
Equity-settled 261,877 111,393Other employee benefits 492,356 464,611
Total employee benefit expense $ 7,938,151 $ 7,666,859
An analysis of employee benefits expense by functionOperating costs $ 1,783,857 $ 1,700,981Operating expenses 6,154,294 5,965,878
$ 7,938,151 $ 7,666,859
The existing Articles of Incorporation of the Company stipulates the distribution of bonus to employees at rates no less than 1% and no higher than 20%, and remuneration to directors and supervisors at a rate no higher than 1%, of net income (net of the bonus and remuneration). For the year ended December 31, 2014, the bonus to employees and the remuneration to directors and supervisors were $126,000 thousand and $12,000 thousand, respectively (recognized as Other payables).
To be in compliance with the Company Act as amended in May 2015, the proposed amendments to the Company’s Articles of Incorporation stipulate the distribution of employees’ compensation at rates no less than 1% and no higher than 20%, and remuneration to directors and supervisors at a rate no higher than 1%, of net profit before income tax, employees’ compensation, and remuneration to directors and supervisors. For the year ended December 31, 2015, the employees’ compensation and the remuneration to directors and supervisors were $200,000 thousand and $12,000 thousand, respectively. The bonus to employees and remuneration to directors and supervisors in the form of cash for the year ended December 31, 2015 were proposed by the Company’s board of directors on March 4, 2016 and are subject to the resolution of the amendments to the Company’s Articles of Incorporation for adoption by the shareholders in their meeting to be held on May 25, 2016, and in addition thereto a report of such distribution shall be submitted to the shareholders' meeting.
Material differences between such estimated amounts and the amounts proposed by the board of directors on or before the date the annual consolidated financial statements are authorized for issue are adjusted in the year the bonus and remuneration were recognized. If there is a change in the proposed amounts after the annual consolidated financial statements were authorized for issue, the differences are recorded as a change in accounting estimate.
The appropriations of bonuses to employees and remuneration to directors and supervisors for 2014 and 2013 approved in the shareholders’ meetings on May 28, 2015 and June 18, 2014, respectively, were as follows:
Cash DividendsFor the Year Ended December 31
2014 2013
Bonus to employees $ 126,000 $ 70,000Remuneration to directors and supervisors 12,000 12,000
-235-

There was no significant difference between the amounts of the bonus to employees and the remuneration to directors and supervisors approved in the shareholders’ meetings on May 28, 2015 and June 18, 2014 and the amounts recognized in the financial statements for the years ended December 31, 2014 and 2013, respectively.
Information on employees’ compensation and remuneration to directors and supervisors resolved by the Company’s board of directors in 2016 and bonuses to employees and supervisors resolved by the shareholders’ meetings in 2015 and 2014 is available on the Market Observation Post System website of the Taiwan Stock Exchange.
d. Gain or loss on foreign currency exchange
For the Year Ended December 312015 2014
Foreign exchange gains $ 1,113,263 $ 747,219Foreign exchange losses (1,300,152) (669,013)
Net (loss) gain $ (186,889) $ 78,206
22. INCOME TAX RELATING
a. Major components of tax expense recognized in profit or loss
For the Year Ended December 312015 2014
Current taxIn respect of current year $ 1,098,440 $ 834,700Income tax expense for unappropriated earnings 62,909 11,219Adjustments for prior year 480 62,934
1,161,829 908,853Deferred tax
In respect of current year 1,872 214,216Adjustments for prior year (1,141) -
731 214,216
Income tax expense recognized in profit or loss $ 1,162,560 $ 1,123,069
A reconciliation of accounting profit and income tax expenses is as follows:
For the Year Ended December 312015 2014
Profit before tax from continuing operations $ 6,289,535 $ 6,054,945
Income tax expense calculated at the statutory rate $ 1,393,286 $ 1,317,713Nondeductible expenses in determining taxable income 3,755 3,119Tax-exempt income (219,899) (220,305)Income tax on unappropriated earnings 62,909 11,219Investment credits in the current year (57,000) (218)Loss carryforwards in the current year (229) (40,641)
(Continued)
-236-

For the Year Ended December 312015 2014
Unrecognized unappropriated earnings of subsidiaries $ (20,742) $ (11,692)Adjustments for prior years’ tax 480 62,934Others - 940
Income tax expense recognized in profit or loss $ 1,162,560 $ 1,123,069(Concluded)
The applicable tax rate used above is the corporate tax rate of 17% payable by the Group in ROC, while the applicable tax rate used by subsidiaries in China is 25%, except for subsidiaries qualified for 15% preferential tax rate for Hi-Tech Industries. Tax rates used by other group entities operating in other jurisdictions are based on the tax laws in those jurisdictions.
As the status of 2016 appropriations of earnings is uncertain, the potential income tax consequences of 10% income tax rate of 2015 unappropriated earnings are not reliably determinable.
b. Income tax recognized in other comprehensive income
For the Year Ended December 312015 2014
Deferred tax
In respect of current yearTranslation of foreign operations $ 13,620 $ (42,667)Remeasurement on defined benefit plan 3,281 945
$ 16,901 $ (41,722)
c. Current tax liabilities
December 312015 2014
Current tax liabilitiesIncome tax payable $ 1,057,226 $ 787,404
d. Deferred tax assets and liabilities
The movements of deferred tax assets and deferred tax liabilities were as follows:
For the year ended December 31, 2015
Opening Balance
Recognized in Profit or Loss
Recognized in Other
ComprehensiveIncome
Closing Balance
Deferred tax assets
Temporary differencesUnrealized gross profit $ 40,938 $ 15,205 $ - $ 56,143Unrealized loss on inventory
write-down 46,167 3,319 - 49,486(Continued)
-237-
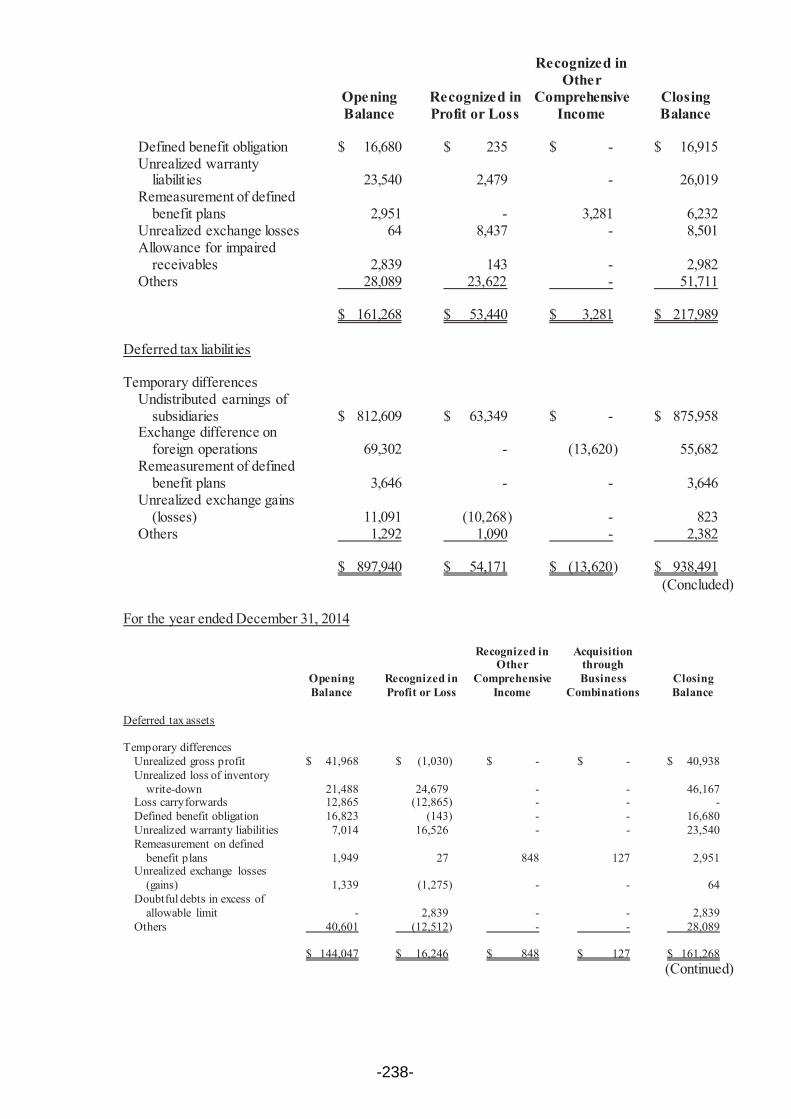
Opening Balance
Recognized in Profit or Loss
Recognized in Other
ComprehensiveIncome
Closing Balance
Defined benefit obligation $ 16,680 $ 235 $ - $ 16,915Unrealized warranty
liabilities 23,540 2,479 - 26,019Remeasurement of defined
benefit plans 2,951 - 3,281 6,232Unrealized exchange losses 64 8,437 - 8,501Allowance for impaired
receivables 2,839 143 - 2,982Others 28,089 23,622 - 51,711
$ 161,268 $ 53,440 $ 3,281 $ 217,989
Deferred tax liabilities
Temporary differencesUndistributed earnings of
subsidiaries $ 812,609 $ 63,349 $ - $ 875,958Exchange difference on
foreign operations 69,302 - (13,620) 55,682Remeasurement of defined
benefit plans 3,646 - - 3,646Unrealized exchange gains
(losses) 11,091 (10,268) - 823Others 1,292 1,090 - 2,382
$ 897,940 $ 54,171 $ (13,620) $ 938,491(Concluded)
For the year ended December 31, 2014
Opening Balance
Recognized in Profit or Loss
Recognized in Other
ComprehensiveIncome
Acquisition through Business
CombinationsClosing Balance
Deferred tax assets
Temporary differencesUnrealized gross profit $ 41,968 $ (1,030) $ - $ - $ 40,938Unrealized loss of inventory
write-down 21,488 24,679 - - 46,167Loss carryforwards 12,865 (12,865) - - -Defined benefit obligation 16,823 (143) - - 16,680Unrealized warranty liabilities 7,014 16,526 - - 23,540Remeasurement on defined
benefit plans 1,949 27 848 127 2,951Unrealized exchange losses
(gains) 1,339 (1,275) - - 64Doubtful debts in excess of
allowable limit - 2,839 - - 2,839Others 40,601 (12,512) - - 28,089
$ 144,047 $ 16,246 $ 848 $ 127 $ 161,268(Continued)
-238-
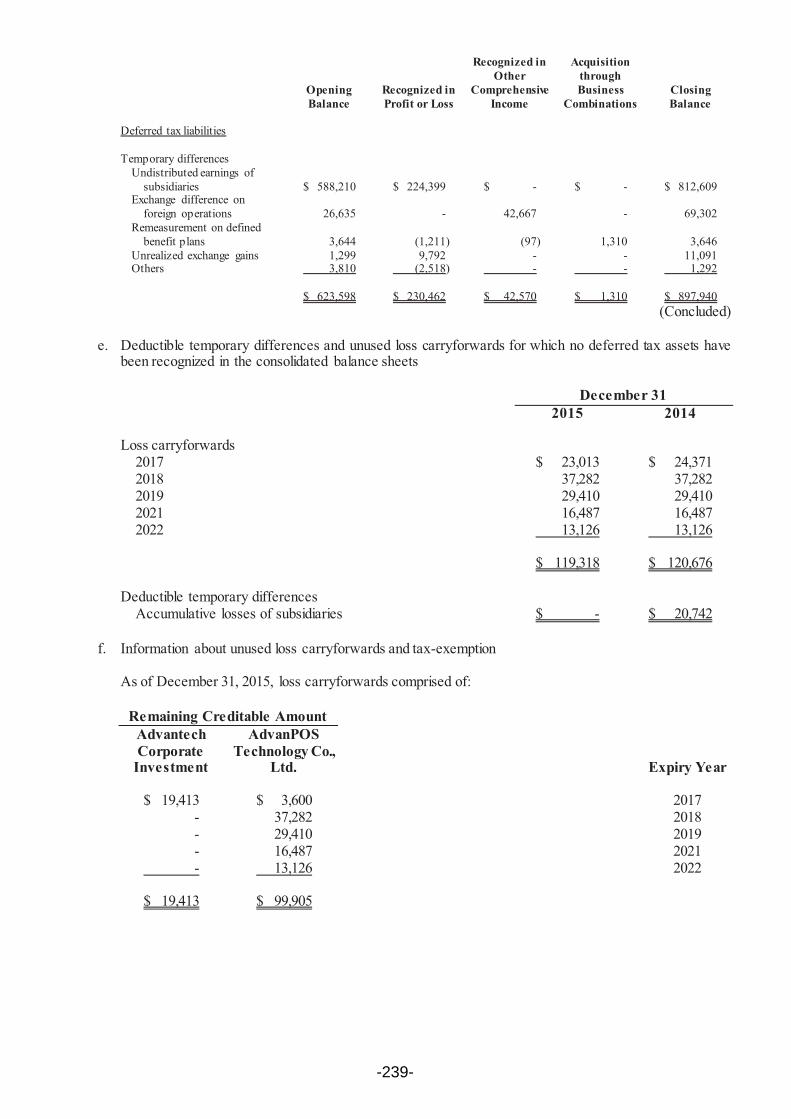
Opening Balance
Recognized in Profit or Loss
Recognized in Other
ComprehensiveIncome
Acquisition through Business
CombinationsClosing Balance
Deferred tax liabilities
Temporary differencesUndistributed earnings of
subsidiaries $ 588,210 $ 224,399 $ - $ - $ 812,609Exchange difference on
foreign operations 26,635 - 42,667 - 69,302Remeasurement on defined
benefit plans 3,644 (1,211) (97) 1,310 3,646Unrealized exchange gains 1,299 9,792 - - 11,091Others 3,810 (2,518) - - 1,292
$ 623,598 $ 230,462 $ 42,570 $ 1,310 $ 897,940(Concluded)
e. Deductible temporary differences and unused loss carryforwards for which no deferred tax assets have been recognized in the consolidated balance sheets
December 312015 2014
Loss carryforwards 2017 $ 23,013 $ 24,3712018 37,282 37,2822019 29,410 29,4102021 16,487 16,4872022 13,126 13,126
$ 119,318 $ 120,676
Deductible temporary differences Accumulative losses of subsidiaries $ - $ 20,742
f. Information about unused loss carryforwards and tax-exemption
As of December 31, 2015, loss carryforwards comprised of:
Remaining Creditable AmountAdvantech Corporate
Investment
AdvanPOS Technology Co.,
Ltd. Expiry Year
$ 19,413 $ 3,600 2017- 37,282 2018- 29,410 2019- 16,487 2021- 13,126 2022
$ 19,413 $ 99,905
-239-

As of December 31, 2015, profits attributable to the following expansion projects were exempted from income tax for a five-year period:
Company Name Expansion Project
Tax-Exemption Period
The Company Investments in production of intelligent-integrated commodities 2011-2015
g. Integrated income tax
December 312015 2014
Unappropriated earningsUnappropriated earnings generated on and after January 1,
1998 $ 7,098,449 $ 6,353,273Imputation credits accounts $ 608,917 $ 271,571
For the Year Ended December 312015 2014
Creditable ratio for distribution of earning 15.07% 13.14%
h. Income tax assessments
The Company’s tax returns through 2010 have been assessed by the tax authorities. The Company disagreed with the tax authorities’ assessment of its 2008 and 2009 tax returns and applied for reexamination. Nevertheless, to be conservative, the Company made provided for the income tax assessed by the tax authorities.
23. EARNINGS PER SHARE
Unit: NT$ Per Share
For the Year Ended December 312015 2014
Basic earnings per share $ 8.08 $ 7.80Diluted earnings per share $ 8.05 $ 7.77
The earnings and weighted average number of ordinary shares outstanding in the computation of earnings per share were as follows:
Net Profit for the Period
For the Year Ended December 312015 2014
Earnings used in the computation of basic earnings per share $ 5,104,346 $ 4,907,648Effect of dilutive potential ordinary shares:
Convertible bonds - 21
Earnings used in the computation of diluted earnings per share $ 5,104,346 $ 4,907,669
-240-

Weighted Average Number of Ordinary Shares Outstanding (In Thousand Shares)
For the Year Ended December 312015 2014
Weighted average number of ordinary shares in computation of basic earnings per share 631,633 628,853
Effect of dilutive potential ordinary shares:Convertible bonds - 18Employee share options 1,372 2,367Employees’ compensation or bonus issue to employees 1,202 336
Weighted average number of ordinary shares used in the computation of diluted earnings per share 634,207 631,574
If the Company offered to settle bonuses paid to employees in cash or shares, the Company assumed the entire amount of the compensation or bonus would be settled in shares, and the resulting potential shares will be included in the weighted average number of shares outstanding used in the computation of diluted earnings per share, if the effect is dilutive. Such dilutive effect of the potential shares was included in t he computation of diluted earnings per share until the number of shares to be distributed to employees is resolved in the following year.
24. SHARE-BASED PAYMENT ARRANGEMENTS
Qualified employees of the Company and its subsidiaries were granted 5,000 opt ions in August 2014, 3,000 options in July 2010, and 10,000 options in December 2009. Each option entitles the holder to subscribe for one thousand common shares of the Company. The holders of these shares include employees whom meet certain criteria set by the Company, from both domestic and overseas subsidiaries in which the Company directly or indirectly invests over 50%. Options issued in August 2014, July 2010, and December 2009 are valid for six, five and five years, respectively. All are exercisable at certain percentages after the second anniversary year from the grant date. Options granted in 2009 and 2010 had an exercise price equal to the closing price of the Company’s common shares listed on the grant date, and the exercise price of those granted in 2014 was NT$100 per share. For any subsequent changes in the Company’s paid-in capital, the exercise price and the number of options will be adjusted accordingly.
Information on employee share options was as follows:
For the Year Ended December 312015 2014
Employee Share Options
Number of Options (In Thousands)
Weighted-averageExercise
Price (NT$)
Number of Options (In Thousands)
Weighted-averageExercise
Price (NT$)
Balance at January 1 5,644 $ 94.10 5,300 $ 48.80Options granted - - 5,000 100.00Options exercised (644) 47.95 (4,656) 45.98
Balance at December 31 5,000 100.00 5,644 94.10
Options exercisable, end of the year - - 644 48.30
Weighted-average fair value of options granted (NT$) $ - $145.77-150.16
-241-

The weighted-average share price at the date of exercise of share options for the years ended December 31, 2015 and 2014 were from NT$198 to NT$278 and from NT$189 to NT$280.5, respectively.
Information about outstanding options as of December 31, 2015 and 2014 was as follows:
For the Year Ended December 312015 2014
Employee Share OptionsExercise Price
(NT$)
Weighted-average
RemainingContractual Life (Years)
Exercise Price (NT$)
Weighted-average
RemainingContractual Life (Years)
Issuance in 2014 $100.00 4.63 $100.00 5.63Issuance in 2010 - - 48.30 0.53
Options granted were priced using the Black-Scholes model, and the inputs to the model were as follows:
2014 2010 2009
Grant-date share price (NT$) $239.5 $67.4 $61.9Exercise price (NT$) $100 $67.4 $61.9Expected volatility 28.28%-29.19% 34.11%-35.15% 37.78%-35.22%Expected life (years) 4-5.5 years 3.5-4.5 years 3.5-4.5 yearsExpected dividend yield 0% 0% 0%Risk-free interest rate 1.07%-1.30% 0.92%-1.10% 0.58%-0.79%
Expected volatility was based on the historical share price volatility over the past five years.
Compensation cost recognized was $261,877 thousand and $111,393 thousand for the years ended December 31, 2015 and 2014.
Qualified employees of AdvanPOS, a subsidiary of the Company, were granted 800 options in December 2010. Each option entitles the holder to subscribe for one thousand common shares of AdvanPOS. These option were valid for two years. All were exercisable at certain percentages after the first anniversary year from the grant date. For the exercise of options, AdvanPOS issued new shares to theemployees at NT$10 per share.
Information on employee share options was as follows:
For the Year Ended December 312015 2014
Employee Share Options
Number of Options
(In Thousands)
Weighted-averageExercise
Price (NT$)
Number of Options
(In Thousands)
Weighted-averageExercise
Price (NT$)
Balance at January 1 446 $10.00 800 $10.00Options exercised (423) 10.00 (194) 10.00Options expired (23) - (55) -Options forfeited - - (105) -
Balance at December 31 - - 446 10.00
Options exercisable, end of the year - - 268 10.00
-242-

Information about outstanding options as of December 31, 2015 and 2014 was as follows:
For the Year Ended December 312015 2014
Employee Share OptionsExercise Price
(NT$)
Weighted-average
RemainingContractual Life (Years)
Exercise Price (NT$)
Weighted-average
RemainingContractual Life (Years)
Issuance in 2010 $ 10.00 - $ 10.00 1.17
Options granted by AdvanPOS in 2014 were priced using the Black-Scholes model, and the inputs to the model were as follows:
2010
Grant-date share price (NT$) $12.39Exercise price (NT$) $10Expected volatility 30.43%Expected life (years) 2 yearsExpected dividend yield 0%Risk-free interest rate 1.345%
25. EQUITY TRANSACTIONS WITH NON-CONTROLLING INTERESTS
a. AdvanPOS issued ordinary shares for the exercise of employee share options, decreasing the Company’s holding interest by 8.08% since 2014. In the first three quarters of 2015 and fourth quarter of 2014, the Company subscribed for an additional 6,533 thousand shares and 1,127 thousand shares of AdvanPOS, increasing its continuing interest by 37.89%. These transactions increased its continuing from 70.19% to 100.00%.
b. In the first quarter of 2014, the Group acquired an additional 0.02% holding interests in Netstar, increasing its interest to 95.49% and 95.51%. The Company merged with Netstar at the end of the third quarter of 2014 as a result of investment restructuring.
c. The Group acquired an additional 0.03% holding interest in ALNC in November 2013. In the first quarter of 2014, the Group sold 10.27% of its holding of shares of ALNC to ALNC’s employees; in the second and third quarters of 2014, the Company bought 0.14% and 0.06%, respectively, of ALNC’s outstanding shares. These transactions reduced its continuing interest from 100% to 89.93%.
The above transactions were accounted for as equity transactions, since the Group did not cease to have control over these subsidiaries.
For the Year Ended
December 31, 2015
AdvanPOS
Cash consideration paid $ (118,577)The proportionate share of the carrying amount of the net assets of the subsidiary
transferred to non-controlling interests 44,217
Differences arising from equity transaction $ (74,360)(Continued)
-243-

For the Year Ended
December 31, 2015
AdvanPOSLine items adjusted for equity transaction
Capital surplus - difference between consideration received or paid and carrying amounts of the subsidiaries’ net assets during actual disposal or acquisition $ (11,457)
Retained earnings (62,903)
$ (74,360)
Capital surplus - changes in percentage of ownership interest in subsidiaries $ 3,567(Concluded)
For the Year Ended December 31, 2014Netstar ALNC AdvanPOS Total
Cash consideration received (paid) $ (13,520) $ 51,174 $ (22,535) $ 15,119The proportionate share of the
carrying amount of the net assets of the subsidiary transferred to (from) non-controlling interests 13,167 (28,321) 11,492 (3,662)
Differences arising from equity transaction $ (353) $ 22,853 $ (11,043) $ 11,457
Line items adjusted for equity transaction
Capital surplus - difference between consideration received or paid and carrying amounts of the subsidiaries’ net assets during actual disposal or acquisition $ (353) $ 22,853 $ (11,043) $ 11,457
Unappropriated retained earnings - - (1,873) (1,873)
$ (353) $ 22,853 $ (12,916) $ 9,584
26. OPERATING LEASE ARRANGEMENTS
The Group as Lessee
Lease arrangements
The Group leased offices in the U.S.A., Europe and Japan from third parties; the lease contracts, which will end between 2012 and 2017, are renewable upon expiry.
As of December 31, 2015 and 2014, refundable deposits (recognized as other noncurrent assets) for theoperating leases were $23,612 thousand and $25,086 thousand, respectively.
-244-

Recognized as expenses
For the Year Ended December 312015 2014
Rental expenses $ 192,248 $ 171,528
27. CAPITAL MANAGEMENT
The Group manages its capital to ensure that entities in the Group will be able to continue as going concerns while maximizing the return to stakeholders through the optimization of the debt and equity balance. The Group’s overall strategy remains unchanged from 2014 through 2015.
The capital structure of the Group consists of net debt (borrowings offset by cash and cash equivalents) and equity of the Group (comprising issued capital, reserves, retained earnings, and other equity).
The Group is not subject to any externally imposed capital requirements.
Key management personnel of the Group review the capital structure on a quarterly basis. As part of this review, the key management personnel consider the cost of capital and the risks associated with each class of capital. Based on recommendations of the key management personnel, in order to balance the overall capital structure, the Group may adjust the amount of dividends paid to shareholders, the number of new shares issued, and the amount of new debt issued.
28. FINANCIAL INSTRUMENTS
a. Fair value of financial instruments that are measured at fair value on a recurring basis
1) Fair value hierarchy
December 31, 2015
Level 1 Level 2 Level 3 Total
Financial assets at FVTPLDerivative financial assets $ - $ 7,391 $ - $ 7,391Non-derivative financial asset
held for trading 168,998 - - 168,998
$ 168,998 $ 7,391 $ - $ 176,389
Available-for-sale financial assetsSecurities listed in ROC
Equity securities $ 2,189,507 $ - $ - $ 2,189,507Unlisted securities - ROC
Equity securities - - 9,375 9,375Unlisted securities - other
countriesEquity securities - - 33,257 33,257
Mutual funds 1,271,302 - - 1,271,302
$ 3,460,809 $ - $ 42,632 $ 3,503,441(Continued)
-245-

Level 1 Level 2 Level 3 Total
Financial liabilities at FVTPLDerivative financial liabilities $ - $ 6,352 $ - $ 6,352
(Concluded)
December 31, 2014
Level 1 Level 2 Level 3 Total
Financial assets at FVTPLDerivative financial assets $ - $ 14,879 $ - $ 14,879Non-derivative financial asset
held for trading 150,523 - - 150,523
$ 150,523 $ 14,879 $ - $ 165,402
Available-for-sale financial assetsSecurities listed in ROC
Equity securities $ 2,519,020 $ - $ - $ 2,519,020Unlisted securities - ROC
Equity securities - - 9,375 9,375Unlisted securities - other
countriesEquity securities - - 33,257 33,257
Mutual funds 2,351,160 - - 2,351,160Investment products
denominated in RMB - - 947,116 947,116
$ 4,870,180 $ - $ 989,748 $ 5,859,928
Financial liabilities at FVTPLDerivative financial liabilities $ - $ 8,698 $ - $ 8,698
As of December 31, 2015 and 2014, there were no transfers between Levels 1 and 2.
2) Reconciliation of Level 3 fair value measurements of financial instruments
For the year ended December 31, 2015
Available-for-sale Financial Assets
Equity Instruments
Investment Products Total
Financial assets
Balance at January 1, 2015 $ 42,632 $ 947,116 $ 989,748Purchases - 3,629,130 3,629,130Disposal - (4,565,265) (4,565,265)Effect of foreign exchange - (10,981) (10,981)
Balance at December 31, 2015 $ 42,632 $ - $ 42,632
-246-

For the year ended December 31, 2014
Available-for-sale Financial Assets
Equity Instruments
Investment Products Total
Financial assets
Balance at January 1, 2014 $ 35,132 $ - $ 35,132Purchases 7,500 947,116 954,616
Balance at December 31, 2014 $ 42,632 $ 947,116 $ 989,748
3) Valuation techniques and inputs applied for the purpose of measuring Level 2 fair value measurement
Derivatives held by the Group were foreign currency forward contracts, whose fair values were calculated using discounted cash flow. Future cash flows are estimated based on observable forward exchange rates at the end of the reporting period and contract forward rates, discounted at a rate that reflects the credit risk of various counterparties.
4) Valuation techniques and inputs applied for the purpose of measuring Level 3 fair value measurement
The fair values of investment products denominated in RMB were using income approach. In this approach, the discounted cash flow method was used to capture the present value of the expected future economic benefits to be derived from the ownership of these investees. Had the inputs to the valuation model been changed to reflect reasonably possible alternative assumptions and had all the other variables been held constant, the fair value of the shares would have increased/decreased.
b. Categories of financial instruments
December 312015 2014
Financial assets
Fair value through profit or loss (FVTPL)Held for trading (Note 1) $ 176,389 $ 165,402
Loans and receivables (Note 2) 10,828,312 9,098,328Available-for-sale financial assets 3,503,441 5,859,928
Financial liabilities
Fair value through profit or loss (FVTPL)Held for trading 6,352 8,698
Measured at amortized cost (Note 3) 7,487,011 6,386,492
Note 1: The balance included the carrying amount of held-for-trading financial assets measured at cost.
Note 2: The balances included loans and receivables measured at amortized cost, which comprise cash and cash equivalents, debt investments with no active market - current, notes receivable, accounts receivable, other receivables (including those from related parties) and other current financial assets.
-247-

Note 3: The balances included financial liabilities measured at amortized cost, which comprise short-term borrowings, trade and other payables, and long-term payables.
c. Financial risk management objectives and policies
The Group’s major financial instruments included equity investments, trade receivables, trade payables, and borrowings. The Group’s Corporate Treasury function provides services to the business, coordinates access to domestic and international financial markets, monitors and manages the financial risks relating to the operations of the Group through internal risk reports which analyze exposures by degree and magnitude of risks. These risks include market risk (including currency risk, interest rate risk and other price risk), credit risk, and liquidity risk.
The Group sought to minimize the effects of these risks by using derivative financial instruments to hedge risk exposures. The use of financial derivatives was governed by the Group’s policies approved by the board of directors, which provided written principles on foreign exchange risk, interest rate risk, credit risk, the use of financial derivatives and non-derivative financial instruments, and the investment of excess liquidity. Compliance with policies and exposure limits was reviewed by the internal auditors on a continuous basis. The Group did not enter into trade financial instrument including derivative financial instruments for speculative purposes.
The Corporate Treasury function reported quarterly to the board of directors on the Group’s current derivative instrument management.
1) Market risk
The Group’s activities expose it primarily to financ ial risks of changes in foreign currency exchange rates (see (a) below) and interest rates (see (b) below). The Group entered into a variety of derivative financial instruments to manage its exposure to foreign currency risk and interest rate risk.
There had been no change to the Group’s exposure to market risks or the manner in which these risks were managed and measured.
a) Foreign currency risk
The Group had foreign currency sales and purchases, which exposed it to foreign currency risk. The Group manages the risk that fluctuations in foreign currency could have on foreign-currency denominated assets and future cash flow by entering into a variety of derivative financial instruments, which allow the Group to mitigate but not fully eliminate the effect.
The maturities of the Company’s forward contracts were less than six months. These forward exchange contracts did not meet the criteria for hedge accounting.
The carrying amounts of the Group’s foreign currency denominated monetary assets and monetary liabilities (including those eliminated on consolidation) are set out in Note 33. As for the carrying amounts of derivatives exposing to foreign currency risk at the end of the reporting period, refer to Note 7.
Sensitivity analysis
The Group was mainly exposed to the U.S. dollar, Euro and Renminbi.
-248-

The following table details the Group’s sensitivity to a 5% increase in New Taiwan dollars (the functional currency) against the relevant foreign currencies. The 5% sensitivity rate is used when reporting foreign currency risk internally to key management personnel and represents management’s assessment of the reasonably possible change in foreign exchange rates. The sensitivity analysis included only outstanding foreign currency denominated monetary items and foreign currency forward contracts designated as cash flow hedges, and adjusts their translation at the end of the reporting period is adjusted for a 5% change in exchange rates. A positive number below indicates an increase in pre-tax profit and associated with New Taiwan dollar strengthen 5% against the relevant currency. For a 5% weakening of the New Taiwan dollar against the relevant currency, there would be an equal and opposite impact on pre-tax profit, and the balances below would be negative.
U.S. Dollar Impact Euro Impact Renminbi ImpactFor the Year Ended
December 31For the Year Ended
December 31For the Year Ended
December 312015 2014 2015 2014 2015 2014
Profit or loss $ 40,853(Note 1)
$ 27,648(Note 1)
$ 41,829(Note 2)
$ 56,189(Note 2)
$ 5,894(Note 3)
$ 3,875(Note 3)
Note 1: This was mainly attributable to the exposure outstanding on U.S. dollars denominated cash, trade receivables, and trade payables, which were not hedged at the end of the reporting period.
Note 2: This was mainly attributable to the exposure outstanding on Euro denominated cash, trade receivables, and trade payables, which were not hedged at the end of the reporting period.
Note 3: This was mainly attributable to the exposure outstanding on Renminbi denominated cash, trade receivables and trade payables, which were not hedged at the end of the reporting period.
b) Interest rate risk
The Group’s floating-rate bank savings are exposed to risk of changes in interest rates. The Group’s management monitors fluctuations in market interest rates regularly to ensure that interest rate risks are minimized.
The Group’s fixed-term bank deposits are exposed to fair value interest rate risk; however, this expected risk is insignificant.
The carrying amount of the Groups financial assets and financial liabilities with exposure to interest rates at the end of the reporting period were as follows:
December 312015 2014
Fair value interest rate riskFinancial assets $ 152,279 $ 1,163,222Financial liabilities 60,000 3,080
Cash flow interest rate riskFinancial assets 2,817,236 2,586,731Financial liabilities 820,625 -
-249-
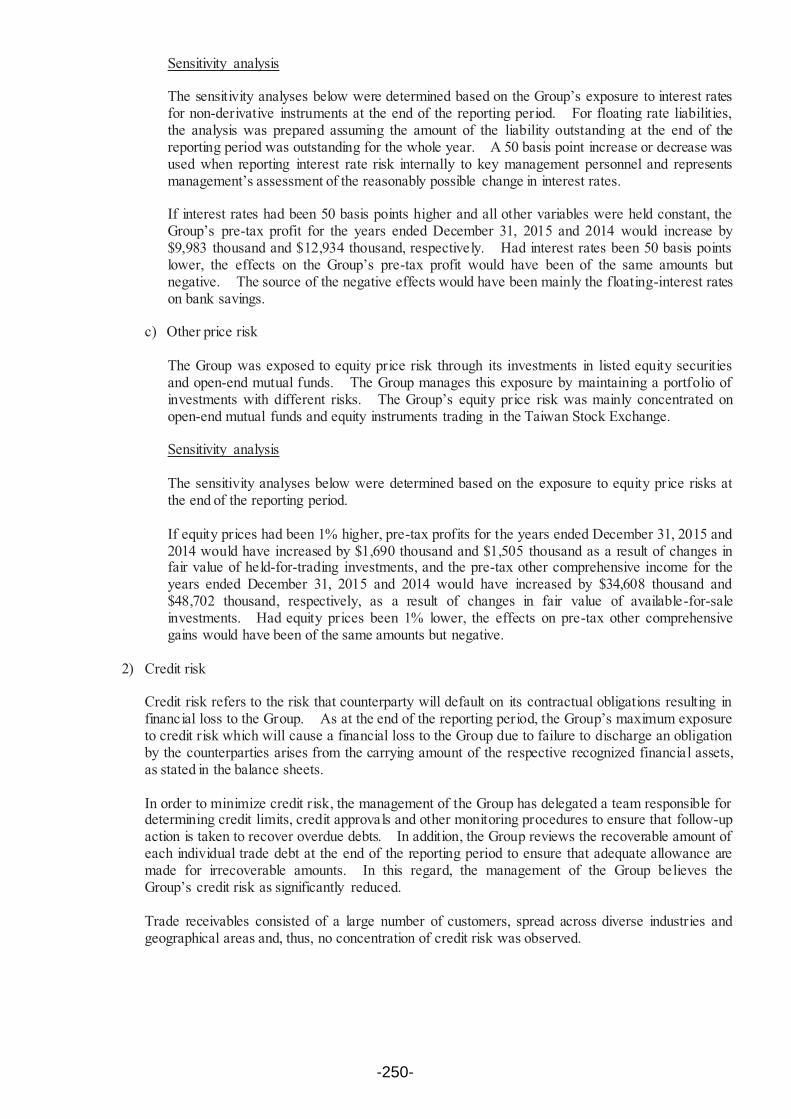
Sensitivity analysis
The sensitivity analyses below were determined based on the Group’s exposure to interest rates for non-derivative instruments at the end of the reporting period. For floating rate liabilities, the analysis was prepared assuming the amount of the liability outstanding at the end of the reporting period was outstanding for the whole year. A 50 basis point increase or decrease was used when reporting interest rate risk internally to key management personnel and represents management’s assessment of the reasonably possible change in interest rates.
If interest rates had been 50 basis points higher and all other variables were held constant, the Group’s pre-tax profit for the years ended December 31, 2015 and 2014 would increase by $9,983 thousand and $12,934 thousand, respectively. Had interest rates been 50 basis points lower, the effects on the Group’s pre-tax profit would have been of the same amounts but negative. The source of the negative effects would have been mainly the floating-interest rates on bank savings.
c) Other price risk
The Group was exposed to equity price risk through its investments in listed equity securities and open-end mutual funds. The Group manages this exposure by maintaining a portfolio of investments with different risks. The Group’s equity price risk was mainly concentrated on open-end mutual funds and equity instruments trading in the Taiwan Stock Exchange.
Sensitivity analysis
The sensitivity analyses below were determined based on the exposure to equity price risks at the end of the reporting period.
If equity prices had been 1% higher, pre-tax profits for the years ended December 31, 2015 and 2014 would have increased by $1,690 thousand and $1,505 thousand as a result of changes in fair value of held-for-trading investments, and the pre-tax other comprehensive income for the years ended December 31, 2015 and 2014 would have increased by $34,608 thousand and $48,702 thousand, respectively, as a result of changes in fair value of available-for-sale investments. Had equity prices been 1% lower, the effects on pre-tax other comprehensive gains would have been of the same amounts but negative.
2) Credit risk
Credit risk refers to the risk that counterparty will default on its contractual obligations resulting in financial loss to the Group. As at the end of the reporting period, the Group’s maximum exposure to credit risk which will cause a financial loss to the Group due to failure to discharge an obligation by the counterparties arises from the carrying amount of the respective recognized financial assets, as stated in the balance sheets.
In order to minimize credit risk, the management of the Group has delegated a team responsible for determining credit limits, credit approvals and other monitoring procedures to ensure that follow-up action is taken to recover overdue debts. In addition, the Group reviews the recoverable amount of each individual trade debt at the end of the reporting period to ensure that adequate allowance are made for irrecoverable amounts. In this regard, the management of the Group believes the Group’s credit risk as significantly reduced.
Trade receivables consisted of a large number of customers, spread across diverse industries and geographical areas and, thus, no concentration of credit risk was observed.
-250-

3) Liquidity risk
The Group manages liquidity risk by monitoring and maintaining a level of cash and cash equivalents deemed adequate to finance the Group’s operations and mitigate the effects of fluctuations in cash flows. In addition, management monitors the utilization of bank borrowings and ensures compliance with loan covenants.
Bank borrowings are a significant source of the Group’s liquidity. As of December 31, 2015 and 2014, the Group had available unutilized short-term bank loan facilities set out in (c) below.
Ultimate responsibility for liquidity risk management rests with the board of directors, which has built an appropriate liquidity risk management framework for the Company’s short, medium and long-term funding and liquidity management requirements. The Company manages liquidity risk by maintaining adequate reserves and continuously monitoring forecast and actual cash flows as well as matching the maturity profiles of financial assets and liabilities.
a) Liquidity and interest risk rate tables for non-derivative financial liabilities
The following table details the Group’s remaining contractual maturity for its non-derivative financial liabilities with agreed repayment periods. The tables had been drawn up based on the undiscounted cash flows of financial liabilities from the earliest date on which the Group can be required to pay. The tables included both interest and principal cash flows. Specifically bank loans with a repayment on demand clause were included in the earliest time band regardless of the probability of the banks choosing to exercise their rights. The maturity dates for other non-derivative financial liabilities were based on agreed repayment dates.
For the liabilities with floating interests, the undiscounted amounts were derived from the interest rate curve at the end of the reporting period.
December 31, 2015
On Demand or Less than 1 Month 1-3 Months
Over 3 Months to
1 YearOver 1 Year-
5 Years
Non-derivative financial liabilities
Non-interest bearing $ 3,891,231 $ 1,687,755 $ 1,027,400 $ -Variable interest rate
liabilities 1,258 2,516 831,583 -Fixed interest rate
liabilities 64 60,070 - -
$ 3,892,553 $ 1,750,341 $ 1,858,983 $ -
-251-

December 31, 2014
On Demand or Less than 1 Month 1-3 Months
Over 3 Months to
1 YearOver 1 Year-
5 Years
Non-derivative financial liabilities
Non-interest bearing $ 3,845,592 $ 1,722,512 $ 772,280 $ 43,028Fixed interest rate
liabilities 10 20 3,069 -
$ 3,845,602 $ 1,722,532 $ 775,349 $ 43,028
The amounts included above for variable interest rate instruments for non-derivative financial liabilities was subject to change if changes in variable interest rates differ from those estimates of interest rates determined at the end of the reporting period.
b) The following tables show the Group’s liquidity analysis of its derivative financial instruments. The tables were based on the undiscounted gross cash inflows and outflows on those derivative instruments that require gross settlement.
December 31, 2015
On Demand or Less than1 Month 1-3 Months
Over 3 Months to 1 Year Total
Gross settled
Foreign exchange forward contractsInflows $ 314,246 $ 523,146 $ 93,795 $ 931,187Outflows 310,013 526,535 93,600 930,148
$ 4,233 $ (3,389) $ 195 $ 1,039
December 31, 2014
On Demand or Less than1 Month 1-3 Months
Over 3 Months to 1 Year Total
Gross settled
Foreign exchange forward contractsInflows $ 229,050 $ 602,341 $ 5,024 $ 836,415Outflows 225,029 600,162 5,043 830,234
$ 4,021 $ 2,179 $ (19) $ 6,181
-252-

c) Financing facilities
December 312015 2014
Unsecured overdraft loan facility, reviewed annually and payable at callAmount used $ 880,625 $ 3,000Amount unused 3,603,268 3,426,056
$ 4,483,893 $ 3,429,056
29. TRANSACTIONS WITH RELATED PARTIES
Balances and transactions between the Company and its subsidiaries, which are related parties of the Company, have been eliminated on consolidation and are not disclosed in this note. Details of transactions between the Group and other related parties are disclosed below.
a. Sales of goods
For the Year Ended December 31Related Party Categories 2015 2014
Associates $ 69,760 $ 80,889Other related parties - 221
$ 69,760 $ 81,110
b. Purchases of goods
For the Year Ended December 31Related Party Categories 2015 2014
Associates $ 22,241 $ 24,357
c. Receivables from related parties (excluding loans to related parties)
Related Party December 31Line Items Categories 2015 2014
Accounts receivable from related parties Associates $ 26,775 $ 5,400Notes receivable Associates $ 183 $ 370
The outstanding trade receivables from related parties are unsecured. For the years ended December 31, 2015 and 2014, no impairment loss was recognized for trade receivables from related parties.
d. Payables to related parties (excluding loans from related parties)
Related Party December 31 Line Items Categories 2015 2014
Accounts payable Associates $ 1,171 $ 1,546
The outstanding accounts payable from related parties are unsecured.
-253-

e. Acquire property, plant and equipment
Acquisition PricesFor the Year Ended December 31
2015 2014
Other related parties $ - $ 193,240
f. Other transactions with related parties
Operating ExpensesFor the Year Ended December 31
2015 2014
Rental expensesOther related parties $ - $ 4,405
Other IncomeFor the Year Ended December 31
2015 2014
Rental incomeOther related parties $ 50 $ -
OtherAssociates $ 2,712 $ 2,762Other related parties 787 502
$ 3,499 $ 3,264
Lease contracts formed between the Company and its associates were based on market rental prices and had normal payment terms. There were no significant differences in the selling price and payment terms for related parties and those for unrelated parties. When normal payment terms with related parties were not stipulated, the payment terms were based on mutual agreement.
g. Compensation of key management personnel
For the Year Ended December 312015 2014
Short-term employee benefits $ 36,643 $ 41,098Post-employment benefits 116 109Share-based payments 26,188 11,063
$ 62,947 $ 52,270
The remuneration of directors and key executives was determined by the remuneration committee having regarded to the performance of individuals and market trends.
30. ASSETS PLEDGED AS COLLATERAL OR FOR SECURITY
As of December 31, 2014, as requested by suppliers, the Company pledged time deposits of $18,650 thousand for bank guarantees for the Company’s purchases.
-254-

31. SIGNIFICANT COMMITMENTS
In addition to those disclosed in other notes, significant commitments and contingencies of the Company as of December 31, 2015 were as follows.
Significant Commitments
As of December 31, 2015 and 2014, the Company had a construction contract amounting to $1,627,500 thousand for a newly constructed science park located in Linkou in Taoyuan City. The remaining payables were $701,927 thousand and $1,491,661 thousand, respectively.
32. SIGNIFICANT EVENTS AFTER REPORTING PERIOD
To expand global brand marketing in industrial network communications, the Company made arrangements to acquire 100% equity in B+B SmartWorx Inc. from Graham Partners, for $3,300,000 thousand (US$99,850 thousand) in November 2015. The Company and its subsidiary ANA will invest jointly to obtain all interest in B+B SmartWorx, Inc. As of December 31, 2015, the Company had paid $2,279,881 thousand, which was recognized as prepayments for investment. The transaction was scheduled for completion by January 2016.
On March 4, 2016 the Company’s board of directors approved ATC (HK) to complete an arrangement with Yeh-Chiang Technology (Cayman) to acquire Yeh-Chiang Technology Kun Shan Co., Ltd. at an acquisition cost of RMB93,000 thousand (around $480,000 thousand). The purpose of this acquisition was to arrange future product line, establish a machinery plant, and expand operations in China.
33. SIGNIFICANT ASSETS AND LIABILITIES DENOMINATED IN FOREIGN CURRENCIES
The following information was aggregated by the foreign currencies other than functional currencies of the group entities and the exchange rates between foreign currencies and respective functional currencies were disclosed. The significant assets and liabilities denominated in foreign currencies were as follows:
December 31, 2015
Unit: In Thousands of New Taiwan Dollars and Foreign Currencies, Except for Exchange Rate
Foreign Currencies Exchange Rate
Carrying Amount
Financial assets
Monetary itemsUSD $ 146,799 32.825 (USD:NTD) $ 4,818,677RMB 328,441 4.9950 (RMB:NTD) 1,640,563RMB 213,731 0.1522 (RMB:USD) 1,067,567EUR 24,409 35.880 (EUR:NTD) 875,795USD 5,064 6.5716 (USD:RMB) 166,224
$ 8,568,826
Nonmonetary itemsUSD 3,763 32.825 (USD:NTD) $ 123,296
(Continued)
-255-

Foreign Currencies Exchange Rate
Carrying Amount
Financial liabilities
Monetary itemsUSD $ 100,579 32.825 (USD:NTD) $ 3,301,506RMB 207,665 4.9950 (RMB:NTD) 1,037,287USD 25,988 6.5716 (USD:RMB) 853,056RMB 62,341 0.1522 (RMB:USD) 311,378
$ 5,503,227(Concluded)
December 31, 2014
Unit: In Thousands of New Taiwan Dollars and Foreign Currencies, Except for Exchange Rate
Foreign Currencies Exchange Rate
Carrying Amount
Financial assets
Monetary itemsUSD $ 134,791 31.650 (USD:NTD) $ 4,266,135RMB 490,578 5.0920 (RMB:NTD) 2,498,023RMB 270,388 0.1609 (RMB:USD) 1,376,807EUR 17,712 38.470 (EUR:NTD) 681,381
$ 8,822,346Nonmonetary items
USD 2,012 31.650 (USD:NTD) 64,654
Financial liabilities
Monetary itemsUSD 80,059 31.650 (USD:NTD) $ 2,533,867RMB 262,127 5.0920 (RMB:NTD) 1,334,751USD 35,997 6.2156 (USD:RMB) 1,139,304RMB 114,709 0.1609 (RMB:USD) 584,098
$ 5,592,020
For the years ended December 31, 2015 and 2014, realized and unrealized net foreign exchange gains (losses) were $(186,889) thousand and $78,206 thousand, respectively. It is impractical to disclose net foreign exchange gains (losses) by each significant foreign currency due to the variety of the foreign currency transactions and functional currencies of the group entities.
-256-

34. SEPARATELY DISCLOSED ITEMS
a. Information on significant transactions and b. information on investees:
1) Financing provided to others. (Table 1)
2) Endorsement/guarantee provided. (Table 2)
3) Marketable securities held. (Table 3)
4) Marketable securities acquired and disposed at costs or prices at least NT$300 million or 20% of the paid-in capital. (Table 4)
5) Acquisition of individual real estate at costs of at least NT$300 million or 20% of the paid-in capital. (None)
6) Disposal of individual real estate at prices of at least NT$300 million or 20% of the paid-in capital. (None)
7) Total purchases from or sales to related parties amounting to at least NT$100 million or 20% of the paid-in capital. (Table 5)
8) Receivables from related parties amounting to at least NT$100 million or 20% of the paid-in capital. (Table 6)
9) Transactions of financial instruments. (Notes 7 and 28)
10) Significant transactions between the Company and subsidiaries. (Table 10)
11) Name, locations, and other information of investees. (Table 7)
12) Organization chart. (Table 9)
c. Information on investments in mainland China
1) Information on any investee company in mainland China, showing the name, principal business activities, paid-in capital, method of investment, inward and outward remittance of funds, shareholding ratio, investment gains or losses, carrying amount of the investment at the end of the period, repatriated investment gains, and limit on the amount of investment in the mainland China area. (Table 8)
2) Any of the following significant transactions with investee companies in mainland China, either directly or indirectly through a third area, their prices, and payment terms, and unrealized gains or losses. (Table 5)
35. SEGMENT INFORMATION
Segment information is provided to the Group’s chief operating decis ion maker for allocating resources to the segments and assessing their performance. The information focuses on every type of products sold or services provided. The Groups segment information disclosed is as follows:
� Industrial internet of thing services: Focus on industry-driven services;
� Embedded board and design-in services: Services involving embedded boards, systems and peripheral hardware and software;
-257-

� Smart city solution services: Referring to integrated intelligent applications that can be used in various areas;
� Global customer services: Global repair, technical support and warranty services.
a. Segment revenues and results
The following was an analysis of the Group’s revenues and results by reportable segment:
Industrial Internet of
Thing Services
Embedded Boards and Design-in Services
Smart City Solution Services
Global Customer Services Total
For the year endedDecember 31, 2015
Revenues from external customers $ 11,338,475 $ 15,202,919 $ 6,903,032 $ 4,556,156 $ 38,000,582
Inter-segment revenues - 5,689 - - 5,689Segment revenues $ 11,338,475 $ 15,208,608 $ 6,903,032 $ 4,556,156 38,006,271Eliminations (5,689)Consolidated revenues 38,000,582Segment income $ 2,579,111 $ 2,547,943 $ 765,703 $ 1,095,218 6,987,975Other revenues 121,329Central administration costs and
directors’ salaries (1,059,468)Other income 139,514Finance costs (10,041)Share of profits of associates 110,226
Profit before tax $ 6,289,535
For the year endedDecember 31, 2014
Revenues from external customers $ 10,622,477 $ 14,591,647 $ 6,476,566 $ 4,041,009 $ 35,731,699
Inter-segment revenues - (97,621) - - (97,621)Segment revenues $ 10,622,477 $ 14,494,026 $ 6,476,566 $ 4,041,009 35,634,078Eliminations 97,621Consolidated revenues 35,731,699Segment income $ 2,608,983 $ 2,392,477 $ 783,319 $ 902,725 6,687,504Other revenues 91,185Central administration costs and
directors’ salaries (1,179,180)Other income and expense 369,592Finance costs (14,420)Share of profits of associates 100,264
Profit before tax $ 6,054,945
Segment profit represented the profit before tax earned by each segment without allocation of central administration costs and directors’ salaries, share of profits of associates, gain recognized on the disposal of interest in former associates, rental revenue, interest income, gain or loss on d isposal of property, plant and equipment, gain or loss on disposal of financial instruments, exchange gain or loss, valuation gain or loss on financial instruments, finance costs and income tax expense. This was the measure reported to the chief operating decision maker for the purpose of resource allocation and assessment of segment performance.
-258-

b. Revenue from major products and services
The following is an analysis of the Group’s revenue from continuing operations from its major products and services.
For the Year Ended December 312015 2014
Embedded boards and Chassis $ 15,474,001 $ 14,244,476Industrial computer 8,762,095 8,636,097Industrial control 5,619,222 5,387,036Industry-applied computer 3,696,050 3,422,835After-sales service and others 4,449,214 4,041,225
$ 38,000,582 $ 35,731,699
c. Geographical information
The Group’s revenues from external customers by location of operations and information about its non-current assets by location of assets are detailed below.
Revenue from External Customers Non-current Assets
For the Year Ended December 31 For the Year Ended December 312015 2014 2015 2014
Taiwan $ 3,394,536 $ 3,225,417 $ 7,462,380 $ 6,582,733Asia 15,143,076 14,549,817 2,702,187 2,879,254USA 10,973,966 10,446,732 419,584 407,996Europe 6,454,993 5,698,779 584,908 645,096Others 2,034,011 1,810,954 876 1,209
$ 38,000,582 $ 35,731,699 $ 11,169,935 $ 10,516,288
Non-current assets exclude financial instruments and deferred tax assets.
d. Information about major customers
No customers contributed 10% or more to the Group’s revenue for both 2015 and 2014.
-259-
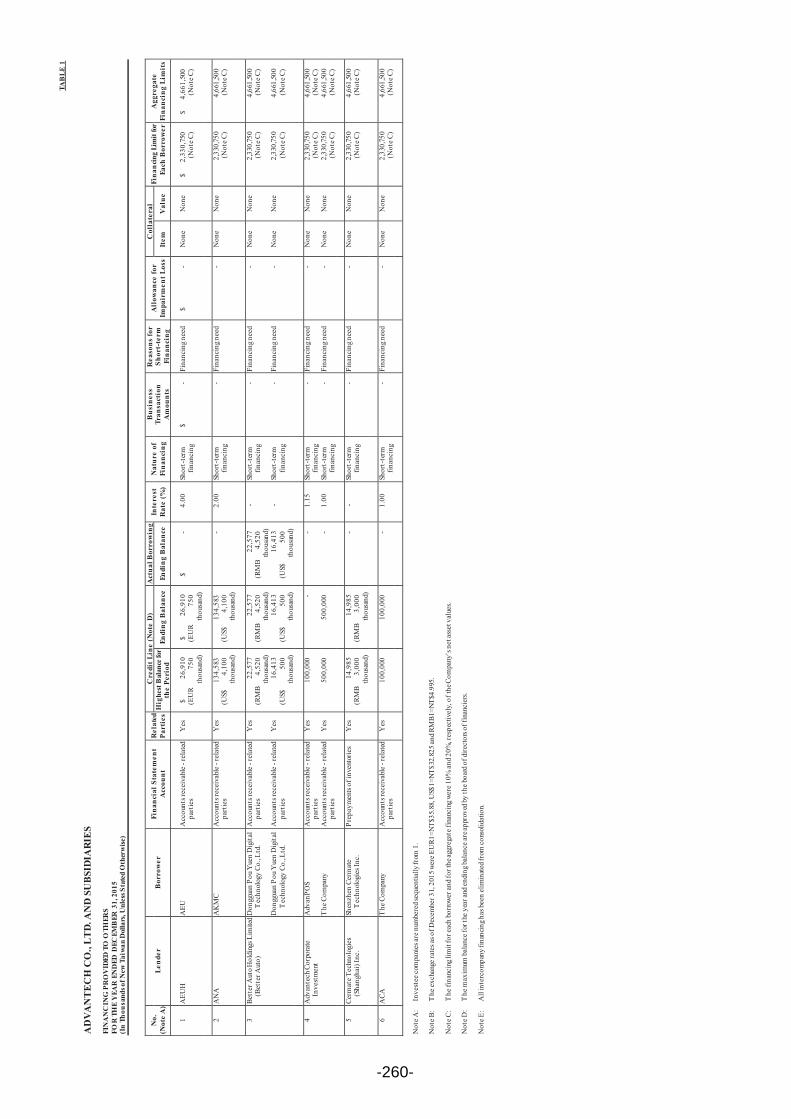
TAB
LE 1
AD
VA
NT
EC
H C
O.,
LT
D. A
ND
SU
BSI
DIA
RIE
S
FIN
AN
CIN
G P
RO
VID
ED T
O O
THER
SFO
R T
HE
YEA
R E
ND
ED D
ECEM
BER
31,
201
5(I
n Th
ousa
nds o
f New
Tai
wan
Dol
lars
, Unl
ess S
tate
d O
ther
wise
)
No.
(Not
e A
)Le
nder
Bor
row
erFi
nanc
ial S
tate
men
t A
ccou
ntR
elat
ed
Part
ies
Cre
dit L
ine
(Not
e D
)A
ctua
l Bor
row
ing
Inte
rest
R
ate
(%)
Nat
ure
of
Fina
ncin
g
Bus
ines
s Tr
ansa
ctio
n A
mou
nts
Rea
sons
for
Shor
t-te
rm
Fina
ncin
g
All
owan
ce fo
r Im
pair
men
t Los
s
Col
late
ral
Fina
ncin
g Li
mit
for
Each
Bor
row
er
Agg
rega
te
Fina
ncin
g Li
mit
sH
ighe
st B
alan
ce fo
r th
e Pe
riod
Endi
ng B
alan
ce
Endi
ng B
alan
ceIt
emV
alue
1A
EUH
AEU
Acc
ount
s rec
eiva
ble -
rela
ted
part
ies
Yes
$26
,910
(EU
R75
0th
ousa
nd)
$26
,910
(EU
R75
0th
ousa
nd)
$-
4.00
Shor
t-te
rm
finan
cing
$-
Fina
ncin
g nee
d$
-N
one
Non
e$
2,33
0,75
0(N
ote C
)$
4,66
1,50
0(N
ote C
)
2A
NA
AK
MC
Acc
ount
s rec
eiva
ble -
rela
ted
part
ies
Yes
134,
583
(US$
4,10
0th
ousa
nd)
134,
583
(US$
4,10
0th
ousa
nd)
-2.
00Sh
ort-
term
fin
anci
ng-
Fina
ncin
g nee
d-
Non
eN
one
2,33
0,75
0(N
ote C
)4,
661,
500
(Not
e C)
3Be
tter
Aut
o Hol
ding
s Lim
ited
(Bet
ter A
uto)
Don
ggua
n Po
u Yue
n D
igita
l T
echn
olog
y Co
., Ltd
.A
ccou
nts r
ecei
vabl
e -re
lated
pa
rtie
sY
es22
,577
(RM
B4,
520
thou
sand
)
22,5
77(R
MB
4,52
0th
ousa
nd)
22,5
77(R
MB
4,52
0th
ousa
nd)
-Sh
ort-
term
fin
anci
ng-
Fina
ncin
g nee
d-
Non
eN
one
2,33
0,75
0(N
ote C
)4,
661,
500
(Not
e C)
Don
ggua
n Po
u Yue
n D
igita
l T
echn
olog
y Co
., Ltd
.A
ccou
nts r
ecei
vabl
e -re
lated
pa
rtie
sY
es16
,413
(US$
500
thou
sand
)
16,4
13(U
S$50
0th
ousa
nd)
16,4
13(U
S$50
0th
ousa
nd)
-Sh
ort-
term
fin
anci
ng-
Fina
ncin
g nee
d-
Non
eN
one
2,33
0,75
0(N
ote C
)4,
661,
500
(Not
e C)
4A
dvan
tech
Cor
pora
te
Inve
stm
ent
Adv
anPO
SA
ccou
nts r
ecei
vabl
e -re
lated
pa
rtie
sY
es10
0,00
0-
-1.
15Sh
ort-
term
fin
anci
ng-
Fina
ncin
g nee
d-
Non
eN
one
2,33
0,75
0(N
ote C
)4,
661,
500
(Not
e C)
The
Com
pany
A
ccou
nts r
ecei
vabl
e -re
lated
pa
rtie
sY
es50
0,00
050
0,00
0-
1.00
Shor
t-te
rm
finan
cing
-Fi
nanc
ing n
eed
-N
one
Non
e2,
330,
750
(Not
e C)
4,66
1,50
0(N
ote C
)
5Ce
rmat
e Tec
hnol
ogie
s (S
hang
hai)
Inc.
Shen
zhen
Cer
mat
e T
echn
olog
ies I
nc.
Prep
aym
ents
ofin
vent
orie
sY
es14
,985
(RM
B3,
000
thou
sand
)
14,9
85(R
MB
3,00
0th
ousa
nd)
--
Shor
t-te
rm
finan
cing
-Fi
nanc
ing n
eed
-N
one
Non
e2,
330,
750
(Not
e C)
4,66
1,50
0(N
ote C
)
6A
CAT
he C
ompa
ny
Acc
ount
s rec
eiva
ble -
rela
ted
part
ies
Yes
100,
000
100,
000
-1.
00Sh
ort-
term
fin
anci
ng-
Fina
ncin
g nee
d-
Non
eN
one
2,33
0,75
0(N
ote C
)4,
661,
500
(Not
e C)
Not
e A:
Inve
stee
com
pani
es ar
e num
bere
d seq
uent
ially
from
1.
Not
e B:
The
exch
ange
rate
s as o
f Dec
embe
r 31,
201
5 wer
e EU
R1=N
T$35
.88,
US$
1=NT
$32.
825a
nd R
MB1
=NT$
4.99
5.
Not
e C:
The
fina
ncin
g lim
it fo
r eac
h bo
rrowe
r and
for t
he ag
greg
ate f
inan
cing
wer
e 10%
and 2
0%, r
espe
ctiv
ely,
of t
he C
ompa
ny’s
net
asse
t val
ues.
Not
e D:
The
max
imum
bala
nce f
or th
e yea
rand
endi
ng ba
lanc
e are
appr
oved
by th
e boa
rd o
f dire
ctor
s of f
inan
cier
s.
Not
e E:
All
inte
rcom
pany
fina
ncin
g has
been
elim
inate
d fro
m co
nsol
idat
ion.
-260-

TA
BL
E 2
AD
VA
NT
EC
H C
O.,
LTD
. AN
D S
UB
SID
IAR
IES
EN
DO
RSE
ME
NT
/GU
AR
AN
TE
E P
RO
VID
ED
FOR
TH
E Y
EA
R E
ND
ED
DE
CE
MB
ER
31,
201
5(I
n T
hous
ands
of N
ew T
aiw
an D
olla
rs, U
nles
s Sta
ted
Oth
erw
ise)
No.
End
orse
r/G
uara
ntor
End
orse
e/G
uara
ntee
Lim
its o
n E
ndor
sem
ent/
Gua
rant
ee G
iven
on
Beh
alf o
f E
ach
Part
y(N
ote
A)
Max
imum
A
mou
nt
End
orse
d/G
uara
ntee
d D
urin
g th
e Pe
riod
Out
stan
ding
E
ndor
sem
ent/
Gua
rant
ee a
t the
E
nd o
f the
Pe
riod
Act
ual
Bor
row
ing
Am
ount
Am
ount
E
ndor
sed/
Gua
rant
eed
by
Col
late
rals
Rat
io o
f A
ccum
ulat
ed
End
orse
men
t/G
uara
ntee
to N
et
Equ
ity I
n L
ates
tFi
nanc
ial
Stat
emen
ts
(%)
Max
imum
C
olla
tera
l/G
uara
ntee
A
mou
nts
Allo
wab
le(N
ote
B)
End
orse
men
t/G
uara
ntee
G
iven
by
Pare
nt o
n B
ehal
f of
Subs
idia
ries
End
orse
men
t/G
uara
ntee
G
iven
by
Subs
idia
ries
on
Beh
alf o
f Pa
rent
End
orse
men
t/G
uara
ntee
G
iven
on
Beh
alf o
f C
ompa
nies
inM
ainl
and
Chi
na
Nam
eR
elat
ions
hip
0Th
e C
ompa
nyA
CA
Subs
idia
ry$
2,33
0,75
0$
126,
000
$-
$-
$-
-$
6,99
2,25
0Y
NN
Adv
ansu
s C
orp.
Subs
idia
ry2,
330,
750
131,
300
(US$
4,00
0th
ousa
nd)
131,
300
(US$
4,00
0th
ousa
nd)
--
0.6
6,99
2,25
0Y
NN
Not
e A
:10
% o
f the
Com
pany
’s n
et a
sset
val
ue.
Not
e B
:30
% o
f the
Com
pany
’s n
et a
sset
val
ue.
Not
e C
:Th
e ex
chan
ge ra
tes a
s of D
ecem
ber 3
1, 2
015
was
US$
1=N
T$32
.825
.
-261-

TA
BL
E 3
AD
VA
NT
EC
H C
O.,
LTD
. AN
D S
UB
SID
IAR
IES
MA
RK
ET
AB
LE
SE
CU
RIT
IES
HE
LD
FOR
TH
E Y
EA
R E
ND
ED
DE
CE
MB
ER
31,
201
5(I
n T
hous
ands
of N
ew T
aiw
an D
olla
rs, U
nles
s Sta
ted
Oth
erw
ise)
Hol
ding
Com
pany
Nam
eT
ype
and
Nam
e of
Mar
keta
ble
Secu
ritie
s R
elat
ions
hip
with
the
Hol
ding
Com
pany
Fina
ncia
l Sta
tem
ent A
ccou
ntD
ecem
ber
31, 2
015
Not
eSh
ares
Car
ryin
g A
mou
ntPe
rcen
tage
of
Ow
ners
hip
Fair
Val
ue
The
Com
pany
Stoc
kA
SUST
ek C
ompu
ter I
nc.
-A
vaila
ble
for s
ale
finan
cial
as
sets
-no
ncur
rent
5,23
9,46
1$
1,42
5,13
30.
71$
1,42
5,13
3N
otes
A a
nd C
Pega
tron
Cor
p.-
3,54
0,57
025
4,92
10.
1425
4,92
1N
otes
A a
nd D
Allie
d C
ircui
t C
o., L
td.
-1,
200,
000
20,7
602.
4120
,760
Not
e A
Adv
ante
ch C
orpo
rate
Inve
stm
ent
Stoc
kA
llied
Circ
uit
Co.
, Ltd
.-
Fina
ncia
l ass
ets a
t fai
r val
ue
thro
ugh
prof
it or
loss
-cu
rren
t
2,80
0,00
048
,440
5.63
48,4
40N
ote
A
Wist
ron
NeW
eb C
orp.
-
129,
900
11,3
920.
0411
,392
Not
e A
Sena
o N
etw
orks
, Inc
. -
36,0
007,
722
0.07
7,72
2N
ote
AN
XP
Sem
icon
duct
ors
N.V
.-
5,35
014
,795
-14
,795
Not
e A
Hon
eyw
ell I
nter
natio
nal I
nc.
-3,
365
11,4
40-
11,4
40N
ote
AG
oogl
e In
c. -
Cla
ss A
-73
318
,720
-18
,720
Not
e A
Line
ar T
echn
olog
y C
orpo
ratio
n -
9,70
413
,528
-13
,528
Not
e A
Skyw
orks
Sol
utio
ns I
nc.
-3,
267
8,23
9-
8,23
9N
ote
AA
mba
rella
, Inc
.-
3,65
36,
684
0.01
6,68
4N
ote
AA
rm H
oldi
ngs
Plc
-6,
056
8,99
3-
8,99
3N
ote
AM
urat
a M
anuf
actu
ring
Co.
, Ltd
. -
2,00
09,
593
-9,
593
Not
e A
Ava
go T
echn
olog
ies
Ltd.
-
1,03
44,
927
-4,
927
Not
e A
Softb
ank
Cor
p.
-2,
700
4,52
5-
4,52
5N
ote
AC
OB
AN
Res
earc
h an
d Te
chno
logi
es, I
nc.
-A
vaila
ble
for s
ale
finan
cial
as
sets
-no
ncur
rent
600,
000
33,2
576.
8533
,257
-
Bro
adTe
c Sy
stem
Inc.
-15
0,00
01,
500
7.50
1,50
0-
Bio
sens
eTek
Cor
p.-
37,5
0037
51.
7937
5-
Jagu
ar T
echn
olog
y-
500,
000
7,50
016
.67
7,50
0-
Allie
d C
ircui
t C
o., L
td.
-24
0,00
04,
152
0.48
4,15
2N
ote
APh
ison
Elec
troni
cs C
orpo
ratio
n-
Ava
ilabl
e fo
r sal
e fin
anci
al
asse
ts -
curr
ent
1,50
0,00
034
8,75
00.
7634
8,75
0N
ote
A
Van
guar
d In
tern
atio
nal S
emic
ondu
ctor
Cor
p.
-42
7,00
018
,276
0.03
18,2
76N
ote
AR
adia
nt O
pto-
Elec
troni
cs C
orpo
ratio
n -
500,
000
37,7
000.
1137
,700
Not
e A
Lelo
n El
ectro
nics
Cor
pora
tion
-2,
550,
000
79,8
151.
9479
,815
Not
e A (C
ontin
ued)
-262-
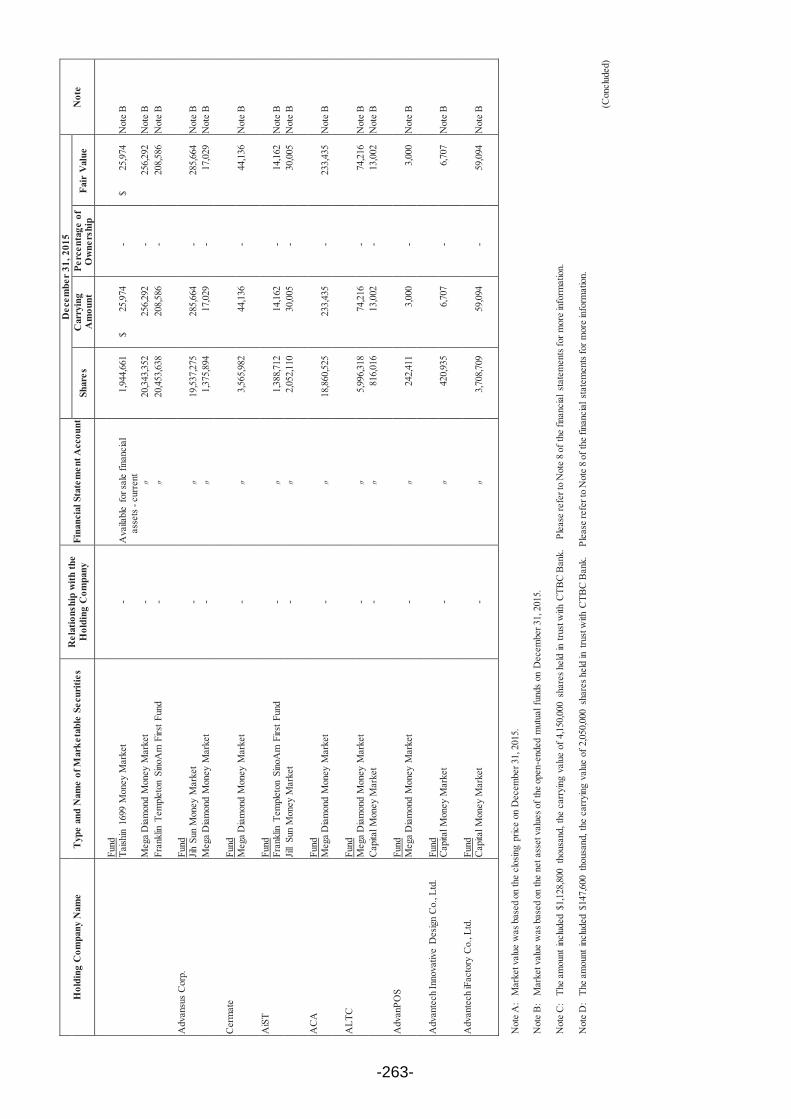
Hol
ding
Com
pany
Nam
eT
ype
and
Nam
e of
Mar
keta
ble
Secu
ritie
s R
elat
ions
hip
with
the
Hol
ding
Com
pany
Fina
ncia
l Sta
tem
ent A
ccou
ntD
ecem
ber
31, 2
015
Not
eSh
ares
Car
ryin
g A
mou
ntPe
rcen
tage
of
Ow
ners
hip
Fair
Val
ue
Fund
Taish
in16
99 M
oney
Mar
ket
-A
vaila
ble
for s
ale
finan
cial
as
sets
-cu
rren
t1,
944,
661
$25
,974
-$
25,9
74N
ote
B
Meg
a D
iam
ond
Mon
ey M
arke
t-
20,3
43,3
5225
6,29
2-
256,
292
Not
e B
Fran
klin
Tem
plet
on S
inoA
m F
irst F
und
-20
,453
,638
208,
586
-20
8,58
6N
ote
B
Adv
ansu
s C
orp.
Fund
Jih S
un M
oney
Mar
ket
-19
,537
,275
285,
664
-28
5,66
4N
ote
BM
ega
Dia
mon
d M
oney
Mar
ket
-1,
375,
894
17,0
29-
17,0
29N
ote
B
Cer
mat
eFu
ndM
ega
Dia
mon
d M
oney
Mar
ket
-3,
565,
982
44,1
36-
44,1
36N
ote
B
AiS
TFu
ndFr
ankl
in T
empl
eton
Sin
oAm
Firs
t Fun
d-
1,38
8,71
214
,162
-14
,162
Not
e B
Jill
Sun
Mon
ey M
arke
t-
2,05
2,11
030
,005
-30
,005
Not
e B
AC
AFu
ndM
ega
Dia
mon
d M
oney
Mar
ket
-18
,860
,525
233,
435
-23
3,43
5N
ote
B
ALT
CFu
ndM
ega
Dia
mon
d M
oney
Mar
ket
-5,
996,
318
74,2
16-
74,2
16N
ote
BC
apita
l Mon
ey M
arke
t -
816,
016
13,0
02-
13,0
02N
ote
B
Adv
anPO
SFu
ndM
ega
Dia
mon
d M
oney
Mar
ket
-24
2,41
13,
000
-3,
000
Not
e B
Adv
ante
ch In
nova
tive
Des
ign
Co.
, Ltd
.Fu
ndC
apita
l Mon
ey M
arke
t -
420,
935
6,70
7-
6,70
7N
ote
B
Adv
ante
ch iF
acto
ry C
o., L
td.
Fund
Cap
ital M
oney
Mar
ket
-3,
708,
709
59,0
94-
59,0
94N
ote
B
Not
e A
:M
arke
t val
ue w
as b
ased
on
the
clos
ing
pric
e on
Dec
embe
r 31,
201
5.
Not
e B
:M
arke
t val
ue w
as b
ased
on
the
net a
sset
val
ues o
f the
ope
n-en
ded
mut
ual f
unds
on
Dec
embe
r 31,
201
5.
Not
e C
:Th
e am
ount
incl
uded
$1,
128,
800
thou
sand
, the
car
ryin
g va
lue
of 4
,150
,000
sha
res h
eld
in tr
ust w
ith C
TBC
Ban
k.
Plea
se re
fer t
o N
ote
8 of
the
finan
cial
sta
tem
ents
for m
ore
info
rmat
ion.
Not
e D
:Th
e am
ount
incl
uded
$14
7,60
0th
ousa
nd, t
he c
arry
ing
valu
e of
2,0
50,0
00 s
hare
s hel
d in
tru
st w
ith C
TBC
Ban
k.
Plea
se re
fer t
o N
ote
8 of
the
finan
cial
sta
tem
ents
for m
ore
info
rmat
ion.
(Con
clud
ed)
-263-

TAB
LE 4
AD
VA
NT
EC
H C
O.,
LT
D. A
ND
SU
BSI
DIA
RIE
S
MA
RK
ETA
BLE
SEC
UR
ITIE
S A
CQ
UIR
ED A
ND
DIS
POSE
D A
T C
OST
S O
R P
RIC
ES O
F A
T LE
AST
$30
0 M
ILLI
ON
OR
20%
OF
THE
PAID
-IN
CA
PITA
LFO
R T
HE
YEA
R E
ND
ED D
ECEM
BER
31,
201
5(I
n Th
ousa
nds o
f New
Tai
wan
Dol
lars
, Unl
ess S
tate
d O
ther
wise
)
Com
pany
Nam
eT
ype
and
Nam
e of
M
arke
tabl
e S
ecur
itie
s
Fina
ncia
l Sta
tem
ent
Acc
ount
Cou
nter
part
yR
elat
ions
hip
Beg
inni
ng B
alan
ceA
cqui
siti
on(N
ote)
Dis
posa
lEn
ding
Bal
ance
(Not
e)
Sha
res
Am
ount
(Cos
t)S
hare
sA
mou
ntS
hare
sA
mou
ntC
arry
ing
Am
ount
Gai
n (L
oss)
on
Dis
posa
lS
hare
sA
mou
nt(C
ost)
The
Com
pany
Fund
Cap
ital M
oney
Mar
ketA
vaila
ble
for s
ale
finan
cial
ass
ets -
curr
ent
--
35,3
57,8
51$
560,
000
86,3
31,6
08$
1,37
3,00
012
1,68
9,45
9$
1,93
5,97
8$
1,93
3,00
0$
2,97
8-
$-
Meg
a D
iam
ond
Mon
ey M
arke
tA
vaila
ble
for s
ale
finan
cial
ass
ets -
curr
ent
--
76,8
53,6
5794
5,00
053
,339
,232
658,
000
130,
192,
889
1,60
8,38
51,
603,
000
5,38
5-
-
CT
BC
Hw
a-W
in
Mon
ey M
arke
t Fu
nd
Ava
ilabl
e fo
r sal
e fin
anci
al a
sset
s-cu
rren
t
--
--
57,1
41,0
7361
9,00
057
,141
,073
620,
085
619,
000
1,08
5-
-
Tai
shin
169
9 M
oney
M
arke
tA
vaila
ble
for s
ale
finan
cial
ass
ets -
curr
ent
--
--
26,8
40,0
1335
7,00
026
,840
,013
357,
630
357,
000
630
--
Fran
klin
Tem
plet
on
Sino
Am
Firs
t Fun
dA
vaila
ble
for s
ale
finan
cial
ass
ets -
curr
ent
--
--
66,7
25,1
1867
8,00
066
,725
,118
678,
870
678,
000
870
--
Stoc
kPe
gatr
on C
orp.
Ava
ilabl
e fo
r sal
e fin
anci
al a
sset
s -no
ncur
rent
--
7,81
4,57
028
1,32
5-
-4,
274,
000
341,
504
153,
864
187,
640
3,54
0,57
012
7,46
1
Adv
ansu
s Cor
p.Fu
ndJi
h Su
n M
oney
M
arke
tA
vaila
ble
for s
ale
finan
cial
ass
ets -
curr
ent
--
7,65
6,35
111
1,15
135
,655
,276
520,
000
23,7
74,3
5234
6,44
434
6,09
634
819
,537
,275
285,
055
Inve
stm
ent p
rodu
ctA
CN
90 d
ays
guar
ante
ed-y
ield
in
vest
men
t pro
duct
de
nom
inat
ed in
R
MB
Ava
ilabl
e fo
r sal
e fin
anci
al a
sset
s -cu
rren
t
--
-54
9,45
0(R
MB
110,
000)
-44
9,55
0(R
MB
90,0
00)
-1,
012,
816
(RM
B20
2,74
5)99
9,00
0(R
MB
200,
000)
13,8
16(R
MB
2,74
5)-
-
AiS
C33
day
s gu
aran
teed
-yie
ld
inve
stm
ent p
rodu
ct
deno
min
ated
in
RM
B
Ava
ilabl
e fo
r sal
e fin
anci
al a
sset
s -cu
rren
t
--
--
-45
4,54
5(R
MB
91,0
00)
-45
7,45
9(R
MB
91,5
79)
454,
545
(RM
B91
,000
)2,
914
(RM
B57
9)-
-
Not
e:
The
exch
ange
rat
e as
of D
ecem
ber
31, 2
015
was
RM
B1=
NT
$4.9
95.
-264-

TA
BL
E 5
AD
VA
NT
EC
H C
O.,
LTD
. AN
D S
UB
SID
IAR
IES
TO
TA
L P
UR
CH
ASE
S FR
OM
OR
SA
LE
S T
O R
EL
ATE
D P
AR
TIE
S A
MO
UN
TIN
G T
O A
T L
EA
ST $
100
MIL
LIO
N O
R 2
0% O
F T
HE
PAID
-IN
CA
PITA
LFO
R T
HE
YE
AR
EN
DE
D D
EC
EM
BE
R 3
1, 2
015
(In
Tho
usan
ds o
f New
Tai
wan
Dol
lars
, Unl
ess S
tate
d O
ther
wis
e)
Buy
erR
elat
ed P
arty
Rel
atio
nshi
pT
rans
actio
n D
etai
lsA
bnor
mal
Tra
nsac
tion
Not
es/A
ccou
nts
Rec
eiva
ble
(Pay
able
)N
ote
Purc
hase
/Sa
leA
mou
nt%
to
Tot
alPa
ymen
t Ter
ms
Uni
t Pri
cePa
ymen
t Ter
ms
End
ing
Bal
ance
% to
T
otal
The
Com
pany
AA
USu
bsid
iary
Sale
$(2
11,3
56)
0.73
60-9
0 da
ysC
ontra
ct p
rice
No
signi
fican
t di
ffer
ence
in
term
s for
rela
ted
parti
es$
64,9
891.
25
AB
RSu
bsid
iary
Sale
(105
,031
)0.
3690
day
s af
ter m
onth
-end
Con
tract
pric
eN
o sig
nific
ant
diff
eren
ce in
te
rms f
or re
late
d pa
rties
1,50
40.
03
AC
NSu
bsid
iary
Sale
(5,2
53,5
05)
18.1
245
day
s af
ter m
onth
-end
Con
tract
pric
eN
o sig
nific
ant
diff
eren
ce in
te
rms f
or re
late
d pa
rties
1,22
3,35
623
.62
Not
e A
A-D
LoG
Subs
idia
rySa
le(1
35,7
19)
0.47
30 d
ays
afte
r inv
oice
dat
eC
ontra
ct p
rice
No
signi
fican
t di
ffer
ence
in
term
s for
rela
ted
parti
es46
,111
0.89
AEU
Subs
idia
rySa
le(3
,532
,528
)12
.18
30 d
ays
afte
r mon
th-e
ndC
ontra
ct p
rice
No
signi
fican
t di
ffer
ence
in
term
s for
rela
ted
parti
es98
2,08
618
.96
Shan
ghai
Adv
ante
ch
Inte
lligen
t Se
rvic
es C
o.,
Ltd.
(AiS
C)
Subs
idia
rySa
le(6
18,9
49)
2.13
45 d
ays
afte
r mon
th-e
ndC
ontra
ct p
rice
No
signi
fican
t di
ffer
ence
in
term
s for
rela
ted
parti
es98
,466
1.90
Not
e B
AJP
Subs
idia
rySa
le(5
08,0
49)
1.75
60-9
0 da
ysC
ontra
ct p
rice
No
signi
fican
t di
ffer
ence
in
term
s for
rela
ted
parti
es96
,045
1.85
AK
MC
Subs
idia
rySa
le(1
,396
,273
)4.
8245
day
s af
ter m
onth
-end
Con
tract
pric
eN
o sig
nific
ant
diff
eren
ce in
te
rms f
or re
late
d pa
rties
168,
142
3.25
Not
e C
AK
RSu
bsid
iary
Sale
(801
,727
)2.
7660
day
s af
ter i
nvoi
ce d
ate
Con
tract
pric
eN
o sig
nific
ant
diff
eren
ce in
te
rms f
or re
late
d pa
rties
36,4
640.
70
AN
ASu
bsid
iary
Sale
(8,2
55,6
07)
28.7
745
day
s af
ter m
onth
-end
Con
tract
pric
eN
o sig
nific
ant
diff
eren
ce in
te
rms f
or re
late
d pa
rties
1,06
6,49
820
.59
ASG
Subs
idia
rySa
le(1
68,2
20)
0.58
60-9
0 da
ysC
ontra
ct p
rice
No
signi
fican
t di
ffer
ence
in
term
s for
rela
ted
parti
es26
,056
0.50
Adv
ansu
s C
orp.
Subs
idia
rySa
le(4
99,1
93)
1.72
60-9
0 da
ysC
ontra
ct p
rice
No
signi
fican
t di
ffer
ence
in
term
s for
rela
ted
parti
es55
,944
1.08
ATC
Subs
idia
ryPu
rcha
se9,
629,
246
46.3
9U
sual
trad
e te
rms
Con
tract
pric
eN
o sig
nific
ant
diff
eren
ce in
te
rms f
or re
late
d pa
rties
(1,4
03,4
04)
39.1
3
Adv
ansu
s C
orp.
Subs
idia
ryPu
rcha
se3,
636,
577
17.5
2U
sual
trad
e te
rms
Con
tract
pric
eN
o sig
nific
ant
diff
eren
ce in
te
rms f
or re
late
d pa
rties
(1,0
53,1
85)
29.3
6
AC
ASu
bsid
iary
Purc
hase
1,86
0,63
98.
96U
sual
trad
e te
rms
Con
tract
pric
eN
o sig
nific
ant
diff
eren
ce in
te
rms f
or re
late
d pa
rties
(195
,485
)5.
45
ATC
The
Com
pany
Pare
nt c
ompa
nySa
le(9
,629
,246
)99
.15
Usu
al tr
ade
term
sC
ontra
ct p
rice
No
signi
fican
t di
ffer
ence
in
term
s for
rela
ted
parti
es1,
403,
404
98.0
0
Adv
ansu
s C
orp.
The
Com
pany
Pare
nt c
ompa
nySa
le(3
,636
,577
)49
.70
Usu
al tr
ade
term
sC
ontra
ct p
rice
No
signi
fican
t di
ffer
ence
in
term
s for
rela
ted
parti
es1,
053,
185
64.5
6
(Con
tinue
d)
-265-
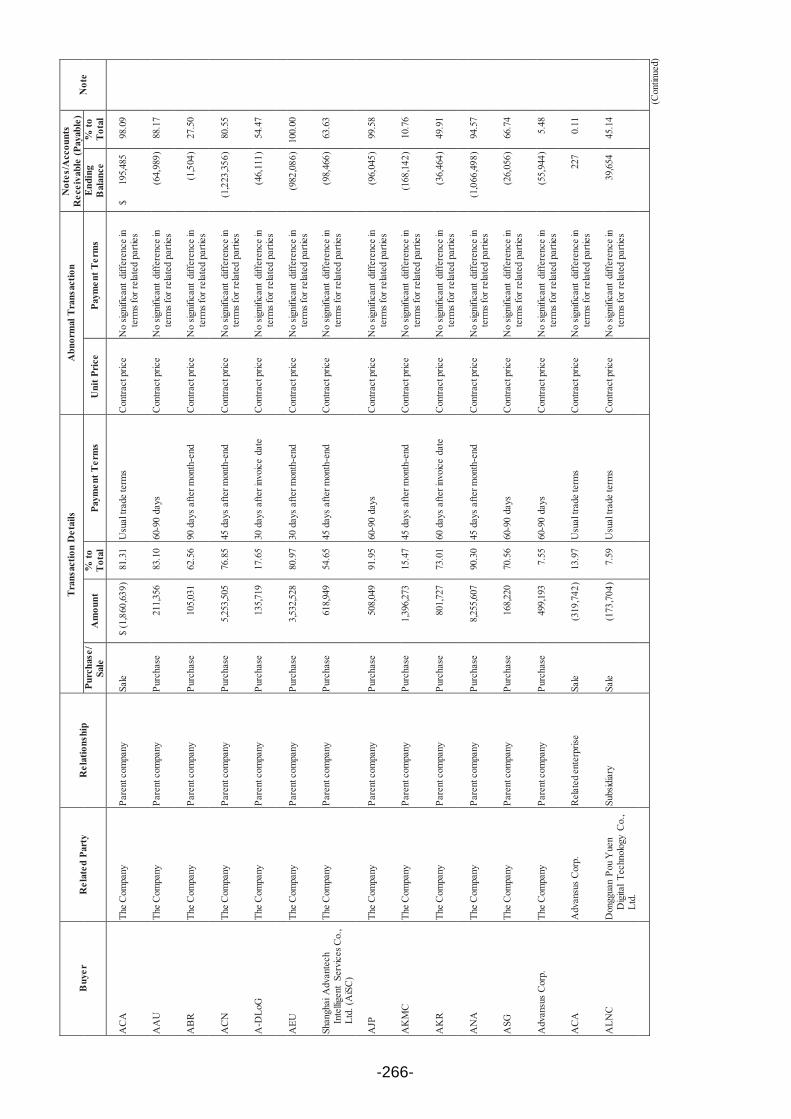
Buy
erR
elat
ed P
arty
Rel
atio
nshi
pT
rans
actio
n D
etai
lsA
bnor
mal
Tra
nsac
tion
Not
es/A
ccou
nts
Rec
eiva
ble
(Pay
able
)N
ote
Purc
hase
/Sa
leA
mou
nt%
to
Tot
alPa
ymen
t Ter
ms
Uni
t Pri
cePa
ymen
t Ter
ms
End
ing
Bal
ance
% to
T
otal
AC
ATh
e C
ompa
nyPa
rent
com
pany
Sale
$(1
,860
,639
)81
.31
Usu
al tr
ade
term
sC
ontra
ct p
rice
No
signi
fican
t di
ffer
ence
in
term
s for
rela
ted
parti
es$
195,
485
98.0
9
AA
UTh
e C
ompa
nyPa
rent
com
pany
Purc
hase
211,
356
83.1
060
-90
days
Con
tract
pric
eN
o sig
nific
ant
diff
eren
ce in
te
rms f
or re
late
d pa
rties
(64,
989)
88.1
7
AB
RTh
e C
ompa
nyPa
rent
com
pany
Purc
hase
105,
031
62.5
690
day
s af
ter m
onth
-end
Con
tract
pric
eN
o sig
nific
ant
diff
eren
ce in
te
rms f
or re
late
d pa
rties
(1,5
04)
27.5
0
AC
NTh
e C
ompa
nyPa
rent
com
pany
Purc
hase
5,25
3,50
576
.85
45 d
ays
afte
r mon
th-e
ndC
ontra
ct p
rice
No
signi
fican
t di
ffer
ence
in
term
s for
rela
ted
parti
es(1
,223
,356
)80
.55
A-D
LoG
The
Com
pany
Pare
nt c
ompa
nyPu
rcha
se13
5,71
917
.65
30 d
ays
afte
r inv
oice
dat
eC
ontra
ct p
rice
No
signi
fican
t di
ffer
ence
in
term
s for
rela
ted
parti
es(4
6,11
1)54
.47
AEU
The
Com
pany
Pare
nt c
ompa
nyPu
rcha
se3,
532,
528
80.9
730
day
s af
ter m
onth
-end
Con
tract
pric
eN
o sig
nific
ant
diff
eren
ce in
te
rms f
or re
late
d pa
rties
(982
,086
)10
0.00
Shan
ghai
Adv
ante
ch
Inte
lligen
t Se
rvic
es C
o.,
Ltd.
(AiS
C)
The
Com
pany
Pare
ntco
mpa
nyPu
rcha
se61
8,94
954
.65
45 d
ays
afte
r mon
th-e
ndC
ontra
ct p
rice
No
signi
fican
t di
ffer
ence
in
term
s for
rela
ted
parti
es(9
8,46
6)63
.63
AJP
The
Com
pany
Pare
nt c
ompa
nyPu
rcha
se50
8,04
991
.95
60-9
0 da
ysC
ontra
ct p
rice
No
signi
fican
t di
ffer
ence
in
term
s for
rela
ted
parti
es(9
6,04
5)99
.58
AK
MC
The
Com
pany
Pare
nt c
ompa
nyPu
rcha
se1,
396,
273
15.4
745
day
s af
ter m
onth
-end
Con
tract
pric
eN
o sig
nific
ant
diff
eren
ce in
te
rms f
or re
late
d pa
rties
(168
,142
)10
.76
AK
RTh
e C
ompa
nyPa
rent
com
pany
Purc
hase
801,
727
73.0
160
day
s af
ter i
nvoi
ce d
ate
Con
tract
pric
eN
o sig
nific
ant
diff
eren
ce in
te
rms f
or re
late
d pa
rties
(36,
464)
49.9
1
AN
ATh
e C
ompa
nyPa
rent
com
pany
Purc
hase
8,25
5,60
790
.30
45 d
ays
afte
r mon
th-e
ndC
ontra
ct p
rice
No
signi
fican
t di
ffer
ence
in
term
s for
rela
ted
parti
es(1
,066
,498
)94
.57
ASG
The
Com
pany
Pare
nt c
ompa
nyPu
rcha
se16
8,22
070
.56
60-9
0 da
ysC
ontra
ct p
rice
No
signi
fican
t di
ffer
ence
in
term
s for
rela
ted
parti
es(2
6,05
6)66
.74
Adv
ansu
s C
orp.
The
Com
pany
Pare
nt c
ompa
nyPu
rcha
se49
9,19
37.
5560
-90
days
Con
tract
pric
eN
o sig
nific
ant
diff
eren
ce in
te
rms f
or re
late
d pa
rties
(55,
944)
5.48
AC
AA
dvan
sus
Cor
p.R
elat
ed e
nter
prise
Sale
(319
,742
)13
.97
Usu
al tr
ade
term
sC
ontra
ct p
rice
No
signi
fican
t di
ffer
ence
in
term
s for
rela
ted
parti
es22
70.
11
ALN
CD
ongg
uan
Pou
Yue
n D
igita
l Tec
hnol
ogy
Co.
, Lt
d.
Subs
idia
rySa
le(1
73,7
04)
7.59
Usu
al tr
ade
term
sC
ontra
ct p
rice
No
signi
fican
t di
ffer
ence
in
term
s for
rela
ted
parti
es39
,654
45.1
4
(Con
tinue
d)
-266-

Buy
erR
elat
ed P
arty
Rel
atio
nshi
pT
rans
actio
n D
etai
lsA
bnor
mal
Tra
nsac
tion
Not
es/A
ccou
nts
Rec
eiva
ble
(Pay
able
)N
ote
Purc
hase
/Sa
leA
mou
nt%
to
Tot
alPa
ymen
t Ter
ms
Uni
t Pri
cePa
ymen
t Ter
ms
End
ing
Bal
ance
% to
T
otal
AK
MC
AC
NR
elat
ed e
nter
prise
Sale
$(2
82,1
63)
2.83
Usu
al tr
ade
term
sC
ontra
ct p
rice
No
signi
fican
t di
ffer
ence
in
term
s for
rela
ted
parti
es$
75,6
2613
.50
AiS
CR
elat
ed e
nter
prise
Sale
(226
,745
)2.
28U
sual
trad
e te
rms
Con
tract
pric
eN
o sig
nific
ant
diff
eren
ce in
te
rms f
or re
late
d pa
rties
20,6
403.
69
ATC
Pare
nt c
ompa
nySa
le(9
,390
,156
)94
.32
Usu
al tr
ade
term
sC
ontra
ct p
rice
No
signi
fican
t di
ffer
ence
in
term
s for
rela
ted
parti
es45
7,03
881
.60
Adv
ansu
s C
orp.
AK
MC
Rel
ated
ent
erpr
iseSa
le(2
,634
,209
)36
.00
Usu
al tr
ade
term
sC
ontra
ct p
rice
No
signi
fican
t di
ffer
ence
in
term
s for
rela
ted
parti
es44
7,52
227
.43
AiS
CA
KM
CR
elat
ed e
nter
prise
Sale
(101
,554
)1.
39U
sual
trad
e te
rms
Con
tract
pric
eN
o sig
nific
ant
diff
eren
ce in
te
rms f
or re
late
d pa
rties
19,0
196.
16
AC
NA
iSC
Rel
ated
ent
erpr
iseSa
le(1
00,0
10)
1.37
Usu
al tr
ade
term
sC
ontra
ct p
rice
No
signi
fican
t di
ffer
ence
in
term
s for
rela
ted
parti
es1,
681
0.10
Adv
ansu
s C
orp.
AC
AR
elat
ed e
nter
prise
Purc
hase
319,
742
4.83
Usu
al tr
ade
term
sC
ontra
ct p
rice
No
signi
fican
t di
ffer
ence
in
term
s for
rela
ted
parti
es(2
27)
0.02
Don
ggua
n Po
u Y
uen
Dig
ital T
echn
olog
y C
o.,
Ltd.
ALN
CPa
rent
com
pany
Purc
hase
173,
704
83.5
6U
sual
trad
e te
rms
Con
tract
pric
eN
o sig
nific
ant
diff
eren
ce in
te
rms f
or re
late
d pa
rties
(39,
654)
47.2
9
AC
NA
KM
CR
elat
ed e
nter
prise
Purc
hase
282,
163
4.13
Usu
al tr
ade
term
sC
ontra
ct p
rice
No
signi
fican
t di
ffer
ence
in
term
s for
rela
ted
parti
es(7
5,62
6)4.
98
AiS
CA
KM
CR
elat
ed e
nter
prise
Purc
hase
226,
745
20.0
2U
sual
trad
e te
rms
Con
tract
pric
eN
o sig
nific
ant
diff
eren
ce in
te
rmsf
or re
late
d pa
rties
(20,
640)
13.3
4
ATC
AK
MC
Pare
nt c
ompa
nyPu
rcha
se9,
390,
156
98.3
6U
sual
trad
e te
rms
Con
tract
pric
eN
o sig
nific
ant
diff
eren
ce in
te
rms f
or re
late
d pa
rties
(457
,038
)97
.06
AK
MC
Adv
ansu
s C
orp.
Rel
ated
ent
erpr
isePu
rcha
se2,
634,
209
29.1
9U
sual
trad
e te
rms
Con
tract
pric
eN
o sig
nific
ant
diff
eren
ce in
te
rms f
or re
late
d pa
rties
(447
,522
)28
.65
AiS
CR
elat
ed e
nter
prise
Purc
hase
101,
554
1.13
Usu
al tr
ade
term
sC
ontra
ct p
rice
No
signi
fican
t di
ffer
ence
in
term
s for
rela
ted
parti
es(1
9,01
9)1.
22
AiS
CA
CN
Rel
ated
ent
erpr
isePu
rcha
se10
0,01
01.
46U
sual
trad
e te
rms
Con
tract
pric
eN
o sig
nific
ant
diff
eren
ce in
te
rms f
or re
late
d pa
rties
(1,6
81)
1.09
Not
e A
:U
nrea
lized
gai
n fo
r the
yea
r was
$6,
076
thou
sand
.
Not
e B
:R
ealiz
ed g
ain
for t
he y
ear w
as $
3,56
3 th
ousa
nd.
Not
e C
:R
ealiz
ed g
ain
for t
he y
ear w
as $
1,46
9 th
ousa
nd.
Not
e D
:A
ll in
terc
ompa
ny g
ains
and
loss
es fr
om in
vest
men
t hav
e be
en e
limin
ated
fro
m c
onso
lidat
ion.
(Con
clud
ed)
-267-

TA
BL
E 6
AD
VA
NT
EC
H C
O.,
LTD
. AN
D S
UB
SID
IAR
IES
RE
CE
IVA
BL
ES
FRO
M R
EL
AT
ED
PA
RT
IES
AM
OU
NT
ING
TO
AT
LE
AST
NT
$100
MIL
LIO
N O
R 2
0% O
F T
HE
PAID
-IN
CA
PITA
LFO
R T
HE
YE
AR
EN
DE
D D
EC
EM
BE
R 3
1, 2
015
(In
Tho
usan
ds o
f New
Tai
wan
Dol
lars
, Unl
ess S
tate
d O
ther
wis
e)
Com
pany
Nam
eR
elat
ed P
arty
Rel
atio
nshi
pE
ndin
g B
alan
ce(N
ote)
Tur
nove
r R
ate
Ove
rdue
Am
ount
s R
ecei
ved
in
Subs
eque
nt
Peri
od
Allo
wan
ce fo
rIm
pair
men
t Los
sA
mou
ntA
ctio
ns T
aken
The
Com
pany
AC
NSu
bsid
iary
$1,
223,
356
3.99
$-
-$
791,
160
$-
AEU
Subs
idia
ry98
5,80
64.
04-
-41
7,29
5-
AK
MC
Subs
idia
ry16
8,14
26.
29-
-14
4,58
1-
AN
ASu
bsid
iary
1,06
8,92
18.
51-
-56
0,23
8-
ATC
The
Com
pany
Pare
nt c
ompa
ny1,
403,
404
6.25
--
1,19
7,76
3-
AC
ATh
e C
ompa
nyPa
rent
com
pany
195,
485
8.43
--
109,
096
-
Adv
ansu
s C
orp.
The
Com
pany
Pare
nt c
ompa
ny1,
053,
185
4.81
--
393,
904
-
AK
MC
ATC
Pare
nt c
ompa
ny45
7,03
816
.48
--
457,
038
-
Adv
ansu
s C
orp.
AK
MC
Rel
ated
ent
erpr
ise44
7,52
25.
71-
-19
6,43
2-
Not
e:
All
inte
rcom
pany
gai
ns a
nd lo
sses
from
inve
stm
ent
have
bee
n el
imin
ated
fro
m c
onso
lidat
ion.
-268-

TA
BLE
7
AD
VA
NTE
CH
CO
., LT
D. A
ND
SU
BSI
DIA
RIE
S
NA
MES
, LO
CA
TIO
NS
, AN
D O
TH
ER I
NFO
RM
AT
ION
OF
INV
EST
EES
FOR
TH
E Y
EAR
EN
DED
DEC
EMB
ER 3
1, 2
015
(In
Tho
usan
ds o
f New
Tai
wan
Dol
lars
/For
eign
Cur
renc
y, U
nles
s Sta
ted
Oth
erw
ise)
Inve
stor
Com
pany
Inve
stee
Com
pany
Loca
tion
Mai
n B
usin
esse
s an
d Pr
oduc
tsIn
vest
men
t Am
ount
Bal
ance
as
of D
ecem
ber
31, 2
015
Net
Inco
me
(Los
s) o
f the
In
vest
ee
Inve
stm
ent
Gai
n (L
oss)
(Not
eA
)N
ote
Dec
embe
r 31
, 20
15D
ecem
ber
31,
2014
Sha
res
Perc
enta
ge o
f O
wne
rshi
pC
arry
ing
Val
ue
The
Com
pany
AA
C (B
VI)
BV
IIn
vest
men
t and
man
agem
ent
serv
ice
$1,
000,
207
$1,
000,
207
29,6
23,8
3410
0.00
$3,
735,
761
$30
3,28
7$
306,
889
Subs
idia
ryA
TC
BV
ISa
le o
f ind
ustr
ial a
utom
atio
n pr
oduc
ts1,
231,
118
1,23
1,11
840
,850
,000
100.
003,
626,
645
128,
416
134,
333
Subs
idia
ryA
dvan
sus C
orp.
Tai
pei,
Tai
wan
Prod
uctio
n an
d sa
le o
f ind
ustr
ial a
utom
atio
n pr
oduc
ts48
6,00
048
6,00
036
,000
,000
100.
0099
9,98
353
6,43
952
1,19
0Su
bsid
iary
Adv
ante
ch C
orpo
rate
Inve
stm
ent
Tai
pei,
Tai
wan
Inve
stm
ent h
oldi
ng c
ompa
ny1,
400,
000
900,
000
150,
000,
000
100.
001,
558,
953
10,3
6210
,472
Subs
idia
ryA
xiom
tek
Tai
pei,
Tai
wan
Prod
uctio
n an
d sa
le o
f ind
ustr
ial a
utom
atio
n pr
oduc
ts24
9,05
924
9,05
920
,537
,984
25.9
945
0,24
642
4,09
911
0,47
4Eq
uity
-met
hod
inve
stee
Adv
anPO
ST
aipe
i, T
aiw
anPr
oduc
tion
and
sale
of P
OS
syst
em46
0,57
234
1,99
520
,438
,000
100.
0035
8,66
2(9
,938
)(8
,252
)Su
bsid
iary
ALT
CT
aich
ung,
Tai
wan
Prod
uctio
n an
d sa
le o
f mac
hine
con
trol
sol
utio
n47
8,82
547
8,82
526
,980
,000
89.9
351
6,62
66,
131
5,73
0Su
bsid
iary
Jan
Hsi
ang
Tai
pei,
Tai
wan
Elec
tron
ic p
arts
and
com
pone
nts m
anuf
actu
ring
3,71
93,
719
655,
500
28.5
09,
510
(1,1
61)
(332
)Eq
uity
-met
hod
inve
stee
A
MX
Mex
ico
Sale
of i
ndus
tria
l aut
omat
ion
prod
ucts
4,92
24,
922
-10
0.00
1,56
292
492
4Su
bsid
iary
A
EUH
Hel
mon
d, T
he N
ethe
rland
sIn
vest
men
t and
man
agem
ent
serv
ice
1,21
9,12
41,
262,
051
12,5
72,0
2410
0.00
898,
536
67,9
6768
,758
Subs
idia
ryA
SGT
echp
lace
, Sin
gapo
reSa
le o
f ind
ustr
ial a
utom
atio
n pr
oduc
ts27
,134
27,1
341,
450,
000
100.
0082
,906
13,0
6513
,065
Subs
idia
ryA
AU
Sydn
ey, A
ustr
alia
Sale
of i
ndus
tria
l aut
omat
ion
prod
ucts
40,6
0040
,600
500,
204
100.
0030
,171
(6,6
48)
(6,6
48)
Subs
idia
ryA
JPT
okyo
, Jap
anSa
le o
f ind
ustr
ial a
utom
atio
n pr
oduc
ts15
,472
15,4
721,
200
100.
0017
9,40
731
,380
31,3
80Su
bsid
iary
AM
YM
alay
sia
Sale
of i
ndus
tria
l aut
omat
ion
prod
ucts
35,1
4035
,140
2,00
0,00
010
0.00
36,4
397,
277
7,27
7Su
bsid
iary
AK
RSe
oul,
Kor
eaSa
le o
f ind
ustr
ial a
utom
atio
n pr
oduc
ts73
,355
73,3
5560
0,00
010
0.00
202,
503
17,4
6217
,462
Subs
idia
ryA
BR
Sao
Paul
o, B
razi
lSa
le o
f ind
ustr
ial a
utom
atio
n pr
oduc
ts43
,216
43,2
161,
794,
996
80.0
048
,320
10,1
268,
101
Subs
idia
ryA
CA
Tai
pei,
Tai
wan
Prod
uctio
n an
d sa
le o
f ind
ustr
ial a
utom
atio
n pr
oduc
ts14
6,44
014
6,44
08,
000,
000
100.
0031
9,85
910
0,22
010
5,07
5Su
bsid
iary
Adv
ante
ch In
nova
tive
Des
ign
Co.
, Ltd
.T
aipe
i, T
aiw
anPr
oduc
t des
ign
10,0
00-
1,00
0,00
010
0.00
8,56
9(1
,441
)(1
,441
)Su
bsid
iary
Adv
ante
ch iF
acto
ry C
o., L
td.
Tai
pei,
Tai
wan
Cyb
erna
tion
equi
pmen
t con
stru
ctio
n60
,000
-6,
000,
000
100.
0060
,088
(6)
(6)
Subs
idia
ryA
INIn
dia
Sale
of i
ndus
tria
l aut
omat
ion
prod
ucts
5,56
75,
567
999,
999
99.9
913
,479
20,5
4020
,540
Subs
idia
ry
Adv
ante
ch C
orpo
rate
Inve
stm
ent
AiS
TT
aipe
i, T
aiw
anD
esig
n, d
evel
op a
nd s
ale
of in
telli
gent
ser
vice
s14
2,06
314
2,06
310
,000
,000
100.
0019
6,15
224
,092
24,0
92Su
bsid
iary
Cer
mat
e T
echn
olog
ies
Inc.
Tai
pei,
Tai
wan
Man
ufac
turin
gof
ele
ctro
nic
part
s, co
mpu
ter,
and
perip
hera
l dev
ices
71,5
0071
,500
5,50
0,00
055
.00
121,
042
35,3
1119
,531
Subs
idia
ry
Den
eng
Scie
ntifi
c R
esea
rch
Co.
, Ltd
.T
aich
ung,
Tai
wan
Inst
allm
ent a
nd s
ale
of e
lect
roni
c co
mpo
nent
s and
so
ftw
are
18,0
9518
,095
658,
000
39.6
918
,228
212
84Eq
uity
-met
hod
inve
stee
AT
CA
TC
(HK
)H
ong
Kon
gIn
vest
men
t and
man
agem
ent
serv
ice
1,21
2,73
01,
212,
730
41,6
50,0
0110
0.00
2,68
3,85
720
3,35
320
9,27
1Su
bsid
iary
AA
C (B
VI)
AN
ASu
nnyv
ale,
USA
Sale
and
fabr
icat
ion
of in
dust
rial a
utom
atio
n pr
oduc
ts50
4,17
950
4,17
910
,952
,606
100.
002,
101,
666
147,
648
148,
385
Subs
idia
ryA
AC
(HK
)H
ong
Kon
gIn
vest
men
t and
man
agem
ent
serv
ice
539,
146
539,
146
15,2
30,0
0110
0.00
1,82
6,59
715
5,69
815
8,56
2Su
bsid
iary
AEU
HA
EUEi
ndho
ven,
The
Net
herla
nds
Sale
of i
ndus
tria
l aut
omat
ion
prod
ucts
431,
963
431,
963
11,3
14,2
8010
0.00
913,
908
67,2
5668
,048
Subs
idia
ryA
PLW
arsa
w, P
olan
dSa
le o
f ind
ustr
ial a
utom
atio
n pr
oduc
ts14
,176
14,1
766,
350
100.
0023
,403
1,07
81,
078
Subs
idia
ry
AEU
A-D
LoG
Mun
ich,
Ger
man
yD
esig
n, R
&D
and
sal
e of
indu
stria
l aut
omat
ion
vehi
cles
and
rel
ated
pro
duct
s55
3,53
655
3,53
61
100.
0056
0,52
732
,551
21,7
74Su
bsid
iary
ASG
AT
HT
haila
ndPr
oduc
tion
of c
ompu
ters
7,53
77,
537
51,0
0051
.00
15,9
689,
358
4,77
3Su
bsid
iary
AID
Indo
nesi
aSa
le o
f ind
ustr
ial a
utom
atio
n pr
oduc
ts4,
797
4,79
730
0,00
010
0.00
4,35
62,
524
2,52
4Su
bsid
iary
Cer
mat
eLa
ndM
ark
BV
IG
ener
al in
vest
men
t28
,200
28,2
0097
2,28
410
0.00
74,9
2315
,152
15,2
62Su
bsid
iary
ALT
CB
ette
r Aut
oB
VI
Gen
eral
inve
stm
ent
264,
445
264,
445
8,55
6,09
610
0.00
106,
456
(49,
267)
(48,
722)
Subs
idia
ry
Bet
ter A
uto
Fam
ous
Now
BV
IG
ener
al in
vest
men
tU
S$4,
000
US$
4,00
01
100.
0068
,034
(42,
589)
(42,
589)
Subs
idia
ry
Adv
anPO
SB
right
Min
d Li
mite
dSa
moa
Gen
eral
inve
stm
ent
US$
200
US$
200
200
100.
00(5
71)
(496
)(1
,096
)Su
bsid
iary
(Con
tinue
d)
-269-

Not
e A:
The
fina
ncia
l st
atem
ents
use
d as
bas
is o
f net
ass
et v
alue
s ha
d be
en a
udite
dby
inde
pend
ent C
PAs,
exce
pt th
ose
of A
IN, A
MX
, Adv
ante
ch In
nova
tive
Des
ign
Co.
, Ltd
. and
Adv
ante
chiF
acto
rty
Co.
, Ltd
.
Not
e B:
All
inte
rcom
pany
gain
s an
d lo
sses
from
inve
stm
ent h
ave
been
elim
inat
ed f
rom
con
solid
atio
n.
Not
e C:
Ref
er t
o T
able
8 fo
r inv
estm
ents
in m
ainl
and
Chi
na.
(Con
clud
ed)
-270-

TA
BL
E 8
AD
VA
NT
EC
H C
O.,
LTD
. AN
D S
UB
SID
IAR
IES
INV
EST
ME
NT
S IN
MA
INL
AN
D C
HIN
AFO
R T
HE
YE
AR
EN
DE
D D
EC
EM
BE
R 3
1, 2
015
(In
Tho
usan
dsof
New
Tai
wan
Dol
lars
, Unl
ess S
tate
d O
ther
wis
e)
Inve
stee
Com
pany
Nam
eM
ain
Bus
ines
ses
and
Prod
ucts
Tot
al A
mou
nt
of P
aid-
in
Cap
ital
Inve
stm
ent
Typ
e (e
.g.,
Dir
ect o
r In
dire
ct)
Acc
umul
ated
O
utflo
w o
f In
vest
men
t fr
om T
aiw
an a
s of
Janu
ary
1, 2
015
Inve
stm
ent F
low
sA
ccum
ulat
ed
Out
flow
of
Inve
stm
ent
from
T
aiw
an a
s of
Dec
embe
r 31
, 20
15
Net
Inc
ome
(Los
s) o
f the
In
vest
ee
%
Ow
ners
hip
of
Dir
ect o
r In
dire
ct
Inve
stm
ent
Inve
stm
ent
Gai
n (L
oss)
(Not
e A
)
Car
ryin
g V
alue
as
of
Dec
embe
r 31
, 20
15
Acc
umul
ated
In
war
d R
emitt
ance
of
Ear
ning
s as
of
Dec
embe
r 31
, 20
15
Out
flow
Inflo
w
Adv
ante
ch T
echn
olog
y (C
hina
) Com
pany
Ltd
. (A
KM
C)
Prod
uctio
n an
d sa
le o
f co
mpo
nent
s of
in
dust
rial
auto
mat
ion
prod
ucts
US$
43,7
50th
ousa
nd(N
ote
F)
Indi
rect
$1,
224,
373
(US$
37,3
00th
ousa
nd)
$-
$-
$1,
224,
373
(US$
37,3
00th
ousa
nd)
$20
3,35
310
0$
203,
458
$2,
678,
044
$-
Bei
jing
Yan
Hua
Xin
g Y
e El
ectro
nic
Scie
nce
&
Tech
nolo
gy C
o., L
td.
(AC
N)
Sale
of i
ndus
trial
au
tom
atio
n pr
oduc
tsU
S$4,
230
thou
sand
Indi
rect
175,
023
(US$
5,33
2th
ousa
nd)
--
175,
023
(US$
5,33
2th
ousa
nd)
132,
777
100
133,
216
1,00
8,34
736
8,69
0(U
S$11
,232
thou
sand
)
Shan
ghai
Adv
ante
ch
Inte
lligen
t Se
rvic
es C
o.,
Ltd.
(AiS
C)
Sale
of i
ndus
trial
au
tom
atio
n pr
oduc
tsU
S$8,
000
thou
sand
Indi
rect
262,
600
(US$
8,00
0th
ousa
nd)
--
262,
600
(US$
8,00
0th
ousa
nd)
23,6
5910
026
,085
773,
904
-
Xi’a
n A
dvan
tech
Sof
twar
e Lt
d. (A
XA
)D
evel
opm
ent a
nd
prod
uctio
n of
sof
twar
e pr
oduc
ts
US$
1,00
0th
ousa
ndIn
dire
ct(N
ote
C)
--
(Not
e C
)87
110
087
142
,783
-
Han
gzho
u A
dvan
tofin
e A
utom
atio
n Te
ch. C
o.,
Ltd.
Proc
essin
gan
d sa
le o
f in
dust
rial
auto
mat
ion
prod
ucts
RM
B3,
000
thou
sand
Indi
rect
(Not
e D
)-
-(N
ote
D)
524
6031
413
,711
-
Acc
umul
ated
Inv
estm
ent i
n M
ainl
and
Chi
na a
s of
D
ecem
ber
31, 2
015
Inve
stm
ent A
mou
nts
Aut
hori
zed
by I
nves
tmen
t Com
mis
sion
, M
OE
AA
llow
able
Lim
it on
Inv
estm
ent
$1,6
68,5
60 (
US$
50,8
32th
ousa
nd)
(Not
e E)
$2,3
33,8
58 (
US$
71,1
00th
ousa
nd)
$14,
072,
266
(Not
e H
)
Not
e A
:Th
e fin
anci
al s
tate
men
ts u
sed
as b
asis
of a
sset
val
ues
had
been
aud
ited.
Not
e B
:Th
e sig
nific
ant
even
ts, p
rices
, pay
men
t ter
ms
and
unre
alize
d ga
ins
or lo
sses
gen
erat
ed o
n tra
ding
bet
wee
n th
e C
ompa
ny a
nd it
s in
vest
ees i
n M
ainl
and
Chi
na a
re d
escr
ibed
in T
able
s 5.
Not
e C
:R
emitt
ance
by
AA
C (H
.K.)
Lim
ited.
(C
ontin
ued)
-271-

Not
e D
:R
emitt
ance
by
AC
N.
Not
e E:
Incl
uded
is th
e ou
tflo
w o
f US$
200
thou
sand
on
the
inve
stm
ent i
n Y
an H
ua (G
uang
Zho
u B
ao S
hui Q
u) C
o., L
td. l
ocat
ed in
a fr
ee tr
ade
zone
in G
uang
Zho
u.
Whe
n th
is in
vest
ee w
as li
quid
ated
in S
epte
mbe
r 200
5, th
e ou
twar
d in
vest
men
t re
mitt
ance
cea
sed
upon
the
appr
oval
of
the
Min
istry
of
Econ
omic
Aff
airs
(M
OEA
). F
or e
ach
futu
re c
apita
l ret
urn,
the
Com
pany
will
app
ly to
the
MO
EA f
or th
e ap
prov
al o
f th
e re
turn
as
wel
l as
redu
ce th
e ac
cum
ulat
ed in
vest
men
t am
ount
by
the
retu
rn a
mou
nt
Not
e F:
For A
KM
C, t
here
was
a c
apita
l inc
reas
e of
US$
6,45
0th
ousa
nd o
ut o
f ear
ning
s.
Not
e G
:Th
e ex
chan
ge ra
te w
as U
S$1=
NT$
32.8
25.
Not
e H
:Th
e m
axim
um a
llow
able
lim
it on
inve
stm
ent w
as a
t 60%
of t
he c
onso
lidat
ed n
et a
sset
val
ue o
f the
Com
pany
.
Not
e I:
All
inte
rcom
pany
gai
ns a
nd lo
sses
from
inve
stm
ent h
ave
been
elim
inat
ed f
rom
con
solid
atio
n.
(Con
clud
ed)
-272-

TABLE 9
ADVANTECH CO., LTD. AND SUBSIDIARIES
ORGANIZATION CHARTDECEMBER 31, 2015 AND 2014
Intercompany relationships and percentages of ownership as of December 31, 2015 are shown below:
(Continued)
100%
Advantech Electronics, S. De R.L. De C.V.(AMX)
100%
100%
100% 100% 100%Advantech Technology Co., Ltd. (ATC)
80% Advantech Brasil Ltda (ABR)
Advantech Automation Corp. (HK) Limited (AAC (HK))
100% 100%
100% 60%
100%
100%Advantech Europe Holding B.V. (AEUH)
100%Advantech KR Co., Ltd. (AKR)
100%Advantech Co., Singapore P te, Ltd. (ASG)
Advantech Co., Ltd.
(theCompany)
Hangzhou Advantofine Automation Tech. Co., Ltd.
Advantech Europe B.V. (AEU) DLOG Gesellschaft für elektronische Datentechnik mbH
(A-DLoG)Advantech Poland Sp z o.o. (APL)
100% 100%
100%
Advantech Automation Corp. (BVI)(AAC (BVI))
100%Advantech Corporate Investment
100%Advantech Japan Co., Ltd. (AJP)
100%Advantech Australia P ty Ltd. (AAU)
Advantech Technology Co., Ltd.ATC (HK)
Advantech Corp. (ANA)
Advantech Technology (China) Company Ltd. (AKMC)
Beijing Yan Hua Xing Ye Electronic Science & Technology Co., Ltd. (ACN)
Shanghai Advantech Intelligent Services Co., Ltd. (AiSC)
Xi’an Advantech Software Ltd. (AXA)
100%Advantech Intelligent Service (AiST)
55%Cermate Technologies Inc. (Cermate)
Landmark Co., Ltd. (Landmark) 100%
100%
100%100%89.93%
100%
100% Advansus Corp.
100%Advantech Co. Malaysia Sdn. Bhd (AMY)
Advantech-LNC Technology Co., Ltd. (ALNC)
AdvanPOS Technology Co., Ltd. (AdvanPOS)
Bright Mind Limited
Better Auto Holdings Limited(Better Auto)
AdvanPOS Technology Shanghai Co., Ltd. (AdvanPOS Shanghai)
100%100%
Famous Now Limited
Dongguan Pou Yuen Digital Technology Co., Ltd.
100% ACA Digital Corporation (ACA)
Advantech Industrial Computing India Private Limited (AIN)
99.99%
51% Advantech Corporation (Thailand) Co., Ltd. (ATH)
Advantech International, PT (AID)100%
Cermate Technologies (Shanghai) Inc.
(Cermate (Shanghai))
Shenzhen Cermate Technologies Inc.
(Cermate (Shenzhen))100%
90%
Advantech Innovative Design Co., Ltd.100%
100%Advantech iFactory Co., Ltd.
-273-

Intercompany relationships and percentages of ownership as of December 31, 2014 are shown below:
(Concluded)
100%
100%
100%100%
Bright Mind Limited
Better Auto Holdings Limited(Better Auto)
AdvanPOS Technology Shanghai Co., Ltd. (AdvanPOS Shanghai)
100%100%
Famous Now Limited
Dongguan Pou Yuen Digital Technology Co., Ltd.
100%
80%
100%
DLOG Gesellschaft für elektronische Datentechnik
mbH(A-DLoG)
Advantech Electronics, S. De R.L. De C.V.(AMX)
100%
100%
100% 100%
Advantech Automation Corp. (HK) Limited (AAC (HK))
100%
100% 60%
100%
100%Advantech Europe Holding B.V. (AEUH)
100%Advantech KR Co., Ltd. (AKR)
100%Advantech Co., Singapore P te, Ltd. (ASG)
Advantech Co., Ltd.
(theCompany)
Hangzhou Advantofine Automation Tech. Co., Ltd.
Advantech Europe B.V. (AEU)
Advantech Poland Sp z o.o. (APL)
100% 100%
100%
Advantech Automation Corp. (BVI)(AAC (BVI))
100%Advantech Corporate Investment
100%Advantech Japan Co., Ltd. (AJP)
100%Advantech Australia P ty Ltd. (AAU)
Advantech Technology Co., Ltd.ATC (HK)
Advantech Corp. (ANA)
Advantech Technology (China) Company Ltd. (AKMC)
Beijing Yan Hua Xing Ye Electronic Science & Technology Co., Ltd. (ACN)
Shanghai Advantech Intelligent Services Co., Ltd. (AiSC)
Xi’an Advantech Software Ltd. (AXA)
100%Advantech Intelligent Service (AiST)
55%Cermate Technologies Inc. (Cermate)
Landmark Co., Ltd. (Landmark) 100%
89.93%
69.47%
100% Advansus Corp.
100%Advantech Co. Malaysia Sdn. Bhd (AMY)
Advantech-LNC Technology Co., Ltd. (ALTC)
AdvanPOS Technology Co., Ltd. (AdvanPOS)
100% ACA Digital Corporation (ACA)
Advantech Industrial Computing India Private Limited (AIN)
99.99%
51% Advantech Corporation (Thailand) Co., Ltd. (ATH)
Advantech International, PT (AID)100%
Cermate Technologies (Shanghai) Inc.
(Cermate (Shanghai))
Shenzhen Cermate Technologies Inc.
(Cermate (Shenzhen))100%
90%
Advantech Technology Co., Ltd. (ATC)
Advantech Brasil Ltda (ABR)
-274-
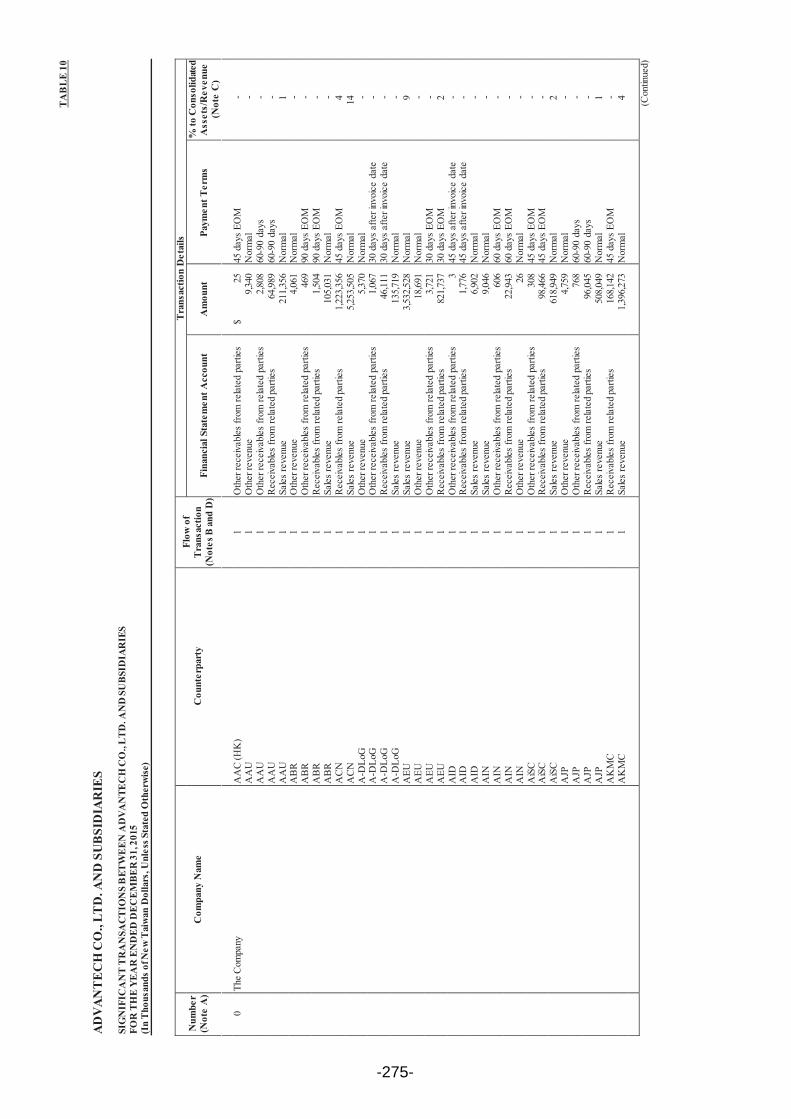
TA
BL
E 1
0
AD
VA
NT
EC
H C
O.,
LTD
. AN
D S
UB
SID
IAR
IES
SIG
NIF
ICA
NT
TR
AN
SAC
TIO
NS
BET
WE
EN
AD
VA
NTE
CH
CO
., L
TD
. AN
D S
UB
SID
IAR
IES
FOR
TH
E Y
EA
R E
ND
ED
DE
CE
MB
ER
31,
201
5(I
n T
hous
ands
of N
ew T
aiw
an D
olla
rs, U
nles
s Sta
ted
Oth
erw
ise)
Num
ber
(Not
e A
)C
ompa
ny N
ame
Cou
nter
part
yFl
ow o
f T
rans
actio
n(N
otes
B a
nd D
)
Tra
nsac
tion
Det
ails
Fina
ncia
l Sta
tem
ent A
ccou
ntA
mou
ntPa
ymen
t Ter
ms
% to
Con
solid
ated
A
sset
s/R
even
ue
(Not
e C
)
0Th
e C
ompa
nyA
AC
(HK
)1
Oth
er re
ceiv
able
s fr
om re
late
d pa
rties
$25
45 d
ays
EOM
-A
AU
1O
ther
reve
nue
9,34
0N
orm
al-
AA
U1
Oth
er re
ceiv
able
s fr
om re
late
d pa
rties
2,80
860
-90
days
-A
AU
1R
ecei
vabl
es fr
om re
late
d pa
rties
64,9
8960
-90
days
-A
AU
1Sa
les
reve
nue
211,
356
Nor
mal
1A
BR
1O
ther
reve
nue
4,06
1N
orm
al-
AB
R1
Oth
er re
ceiv
able
s fr
om re
late
d pa
rties
469
90 d
ays
EOM
-A
BR
1R
ecei
vabl
es fr
om re
late
d pa
rties
1,50
490
day
s EO
M-
AB
R1
Sale
s re
venu
e10
5,03
1N
orm
al-
AC
N1
Rec
eiva
bles
from
rela
ted
parti
es1,
223,
356
45 d
ays
EOM
4A
CN
1Sa
les
reve
nue
5,25
3,50
5N
orm
al14
A-D
LoG
1O
ther
reve
nue
5,37
0N
orm
al-
A-D
LoG
1O
ther
rece
ivab
les
from
rela
ted
parti
es1,
067
30 d
ays
afte
r inv
oice
dat
e-
A-D
LoG
1R
ecei
vabl
es fr
om re
late
dpa
rties
46,1
1130
day
s af
ter i
nvoi
ce d
ate
-A
-DLo
G1
Sale
s re
venu
e13
5,71
9N
orm
al-
AEU
1Sa
les
reve
nue
3,53
2,52
8N
orm
al9
AEU
1O
ther
reve
nue
18,6
91N
orm
al-
AEU
1O
ther
rece
ivab
les
from
rela
ted
parti
es3,
721
30 d
ays
EOM
-A
EU1
Rec
eiva
bles
from
rela
ted
parti
es82
1,73
730
day
s EO
M2
AID
1O
ther
rece
ivab
les
from
rela
ted
parti
es3
45 d
ays
afte
r inv
oice
dat
e-
AID
1R
ecei
vabl
es fr
om re
late
d pa
rties
1,77
645
day
s af
ter i
nvoi
ce d
ate
-A
ID1
Sale
s re
venu
e6,
902
Nor
mal
-A
IN1
Sale
s re
venu
e9,
046
Nor
mal
-A
IN1
Oth
er re
ceiv
able
s fr
om re
late
d pa
rties
606
60 d
ays
EOM
-A
IN1
Rec
eiva
bles
from
rela
ted
parti
es22
,943
60 d
ays
EOM
-A
IN1
Oth
er re
venu
e26
Nor
mal
-A
iSC
1O
ther
rece
ivab
les
from
rela
ted
parti
es30
845
day
s EO
M-
AiS
C1
Rec
eiva
bles
from
rela
ted
parti
es98
,466
45 d
ays
EOM
-A
iSC
1Sa
les
reve
nue
618,
949
Nor
mal
2A
JP1
Oth
er re
venu
e4,
759
Nor
mal
-A
JP1
Oth
er re
ceiv
able
s fr
om re
late
d pa
rties
768
60-9
0 da
ys-
AJP
1R
ecei
vabl
es fr
om re
late
d pa
rties
96,0
4560
-90
days
-A
JP1
Sale
s re
venu
e50
8,04
9N
orm
al1
AK
MC
1R
ecei
vabl
es fr
om re
late
d pa
rties
168,
142
45 d
ays
EOM
-A
KM
C1
Sale
s re
venu
e1,
396,
273
Nor
mal
4 (Con
tinue
d)
-275-
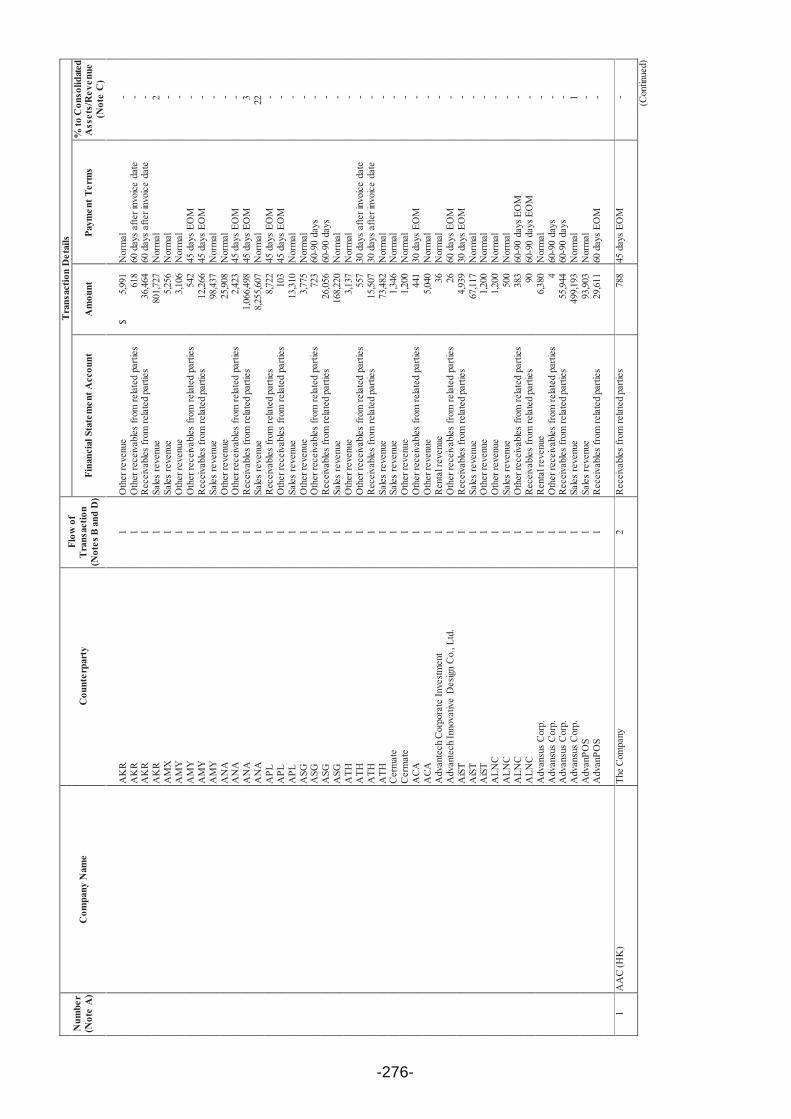
Num
ber
(Not
e A
)C
ompa
ny N
ame
Cou
nter
part
yFl
ow o
f T
rans
actio
n(N
otes
B a
nd D
)
Tra
nsac
tion
Det
ails
Fina
ncia
l Sta
tem
ent A
ccou
ntA
mou
ntPa
ymen
t Ter
ms
% to
Con
solid
ated
A
sset
s/R
even
ue
(Not
e C
)
AK
R1
Oth
er re
venu
e$
5,99
1N
orm
al-
AK
R1
Oth
er re
ceiv
able
s fr
om re
late
d pa
rties
618
60 d
ays
afte
r inv
oice
dat
e-
AK
R1
Rec
eiva
bles
from
rela
ted
parti
es36
,464
60 d
ays
afte
r inv
oice
dat
e-
AK
R1
Sale
s re
venu
e80
1,72
7N
orm
al2
AM
X1
Sale
s re
venu
e5,
256
Nor
mal
-A
MY
1O
ther
reve
nue
3,10
6N
orm
al-
AM
Y1
Oth
er re
ceiv
able
s fr
om re
late
d pa
rties
542
45 d
ays
EOM
-A
MY
1R
ecei
vabl
es fr
om re
late
d pa
rties
12,2
6645
day
s EO
M-
AM
Y1
Sale
s re
venu
e98
,437
Nor
mal
-A
NA
1O
ther
reve
nue
25,9
08N
orm
al-
AN
A1
Oth
er re
ceiv
able
s fr
om re
late
d pa
rties
2,42
345
day
s EO
M-
AN
A1
Rec
eiva
bles
from
rela
ted
parti
es1,
066,
498
45 d
ays
EOM
3A
NA
1Sa
les
reve
nue
8,25
5,60
7N
orm
al22
APL
1R
ecei
vabl
es fr
om re
late
d pa
rties
8,72
245
day
s EO
M-
APL
1O
ther
rece
ivab
les
from
rela
ted
parti
es10
345
day
s EO
M-
APL
1Sa
les
reve
nue
13,3
10N
orm
al-
ASG
1O
ther
reve
nue
3,77
5N
orm
al-
ASG
1O
ther
rece
ivab
les
from
rela
ted
parti
es72
360
-90
days
-A
SG1
Rec
eiva
bles
from
rela
ted
parti
es26
,056
60-9
0 da
ys-
ASG
1Sa
les
reve
nue
168,
220
Nor
mal
-A
TH1
Oth
er re
venu
e3,
137
Nor
mal
-A
TH1
Oth
er re
ceiv
able
s fr
om re
late
d pa
rties
557
30 d
ays
afte
r inv
oice
dat
e-
ATH
1R
ecei
vabl
es fr
om re
late
d pa
rties
15,5
0730
day
s af
ter i
nvoi
ce d
ate
-A
TH1
Sale
s re
venu
e73
,482
Nor
mal
-C
erm
ate
1Sa
les
reve
nue
1,34
6N
orm
al-
Cer
mat
e1
Oth
er re
venu
e1,
200
Nor
mal
-A
CA
1O
ther
rece
ivab
les
from
rela
ted
parti
es44
130
day
s EO
M-
AC
A1
Oth
er re
venu
e5,
040
Nor
mal
-A
dvan
tech
Cor
pora
te In
vest
men
t1
Ren
tal r
even
ue36
Nor
mal
-A
dvan
tech
Inno
vativ
e D
esig
n C
o., L
td.
1O
ther
rece
ivab
les
from
rela
ted
parti
es26
60 d
ays
EOM
-A
iST
1R
ecei
vabl
es fr
om re
late
d pa
rties
4,93
930
day
s EO
M-
AiS
T1
Sale
s re
venu
e67
,117
Nor
mal
-A
iST
1O
ther
reve
nue
1,20
0N
orm
al-
ALN
C1
Oth
er re
venu
e1,
200
Nor
mal
-A
LNC
1Sa
les
reve
nue
500
Nor
mal
-A
LNC
1O
ther
rece
ivab
les
from
rela
ted
parti
es38
360
-90
days
EO
M-
ALN
C1
Rec
eiva
bles
from
rela
ted
parti
es90
60-9
0 da
ys E
OM
-A
dvan
sus
Cor
p.1
Ren
tal r
even
ue6,
380
Nor
mal
-A
dvan
sus
Cor
p.1
Oth
er re
ceiv
able
s fr
om re
late
d pa
rties
460
-90
days
-A
dvan
sus
Cor
p.1
Rec
eiva
bles
from
rela
ted
parti
es55
,944
60-9
0 da
ys-
Adv
ansu
s C
orp.
1Sa
les
reve
nue
499,
193
Nor
mal
1A
dvan
POS
1Sa
les
reve
nue
93,9
03N
orm
al-
Adv
anPO
S1
Rec
eiva
bles
from
rela
ted
parti
es29
,611
60 d
ays
EOM
-
1A
AC
(HK
)Th
e C
ompa
ny2
Rec
eiva
bles
from
rela
ted
parti
es78
845
day
s EO
M-
(Con
tinue
d)
-276-

Num
ber
(Not
e A
)C
ompa
ny N
ame
Cou
nter
part
yFl
ow o
f T
rans
actio
n(N
otes
B a
nd D
)
Tra
nsac
tion
Det
ails
Fina
ncia
l Sta
tem
ent A
ccou
ntA
mou
ntPa
ymen
t Ter
ms
% to
Con
solid
ated
A
sset
s/R
even
ue
(Not
e C
)
2A
AU
AEU
3Sa
les
reve
nue
$23
Nor
mal
-A
KM
C3
Sale
s re
venu
e1,
006
Nor
mal
-A
NA
3Sa
les
reve
nue
2N
orm
al-
The
Com
pany
2R
ecei
vabl
es fr
om re
late
d pa
rties
641
60-9
0 da
ys-
The
Com
pany
2Sa
les
reve
nue
21N
orm
al-
3A
BR
The
Com
pany
2Sa
les
reve
nue
4N
orm
al-
4A
CA
AC
N3
Sale
s re
venu
e15
,250
Nor
mal
-A
CN
3R
ecei
vabl
es fr
om re
late
d pa
rties
2,49
260
-90
days
-A
KM
C3
Sale
s re
venu
e92
,907
Nor
mal
-A
KM
C3
Oth
er re
ceiv
able
s fr
om re
late
d pa
rties
445
day
s EO
M-
Adv
ansu
s C
orp.
3Sa
les
reve
nue
319,
742
Nor
mal
1A
dvan
sus
Cor
p.3
Rec
eiva
bles
from
rela
ted
parti
es22
745
day
s EO
M-
The
Com
pany
2R
ecei
vabl
es fr
om re
late
d pa
rties
195,
485
30 d
ays
EOM
1Th
e C
ompa
ny2
Sale
s re
venu
e1,
860,
639
Nor
mal
5
5A
CN
AC
A3
Sale
s re
venu
e1,
802
Nor
mal
-A
EU3
Sale
s re
venu
e49
7N
orm
al-
AEU
3R
ecei
vabl
es fr
om re
late
d pa
rties
316
30 d
ays
EOM
-A
iSC
3O
ther
rece
ivab
les
from
rela
ted
parti
es13
30 d
ays
EOM
-A
iSC
3Sa
les
reve
nue
100,
010
Nor
mal
-A
iSC
3R
ecei
vabl
es fr
om re
late
d pa
rties
24,6
59Im
med
iate
pay
men
t-
AK
MC
3Sa
les
reve
nue
16,7
78N
orm
al-
AK
MC
3R
ecei
vabl
es fr
om re
late
d pa
rties
3,66
660
-90
days
-A
KR
3Sa
les
reve
nue
17N
orm
al-
AK
R3
Rec
eiva
bles
from
rela
ted
parti
es1
45 d
ays
EOM
-A
NA
3Sa
les
reve
nue
432
Nor
mal
-A
NA
3R
ecei
vabl
es fr
om re
late
d pa
rties
242
30 d
ays
EOM
-A
SG3
Sale
s re
venu
e9
Nor
mal
-A
SG3
Rec
eiva
bles
from
rela
ted
parti
es11
Imm
edia
te p
aym
ent
-A
XA
3O
ther
rece
ivab
les
from
rela
ted
parti
es78
60 d
ays
EOM
-Th
e C
ompa
ny2
Rec
eiva
bles
from
rela
ted
parti
es30
130
day
s EO
M-
The
Com
pany
2Sa
les
reve
nue
868
Nor
mal
-H
angz
hou
Adv
anto
fine
Aut
omat
ion
Tech
. Co.
, Ltd
.3
Sale
s re
venu
e36
,063
Nor
mal
-H
angz
hou
Adv
anto
fine
Aut
omat
ion
Tech
. Co.
,Ltd
.3
Rec
eiva
bles
from
rela
ted
parti
es14
,250
60 d
ays
afte
r inv
oice
dat
e-
6A
-DLo
GA
AU
3Sa
les
reve
nue
1,11
8N
orm
al-
AEU
3Sa
les
reve
nue
1,49
5N
orm
al-
AEU
3R
ecei
vabl
es fr
om re
late
d pa
rties
130
day
s up
on d
eliv
ery
-A
KR
3R
ecei
vabl
es fr
om re
late
d pa
rties
184
60 d
ays
EOM
-A
KR
3Sa
les
reve
nue
204
Nor
mal
-A
NA
3Sa
les
reve
nue
23,5
19N
orm
al-
AN
A3
Rec
eiva
bles
from
rela
ted
parti
es23
,769
30 d
ays
EOM
-Th
e C
ompa
ny2
Rec
eiva
bles
from
rela
ted
parti
es5,
077
30 d
ays
afte
r inv
oice
dat
e-
The
Com
pany
2Sa
les
reve
nue
49,5
82N
orm
al-
(Con
tinue
d)
-277-

Num
ber
(Not
e A
)C
ompa
ny N
ame
Cou
nter
part
yFl
ow o
f T
rans
actio
n(N
otes
B a
nd D
)
Tra
nsac
tion
Det
ails
Fina
ncia
l Sta
tem
ent A
ccou
ntA
mou
ntPa
ymen
t Ter
ms
% to
Con
solid
ated
A
sset
s/R
even
ue
(Not
e C
)
7A
EUA
AU
3Sa
les
reve
nue
$14
5N
orm
al-
AC
N3
Rec
eiva
bles
from
rela
ted
parti
es37
030
day
s af
ter i
nvoi
ce d
ate
-A
-DLo
G3
Sale
s re
venu
e19
,965
Nor
mal
-A
-DLo
G3
Rec
eiva
bles
from
rela
ted
parti
es2,
967
30 d
ays
upon
del
iver
y-
AK
MC
3R
ecei
vabl
es fr
om re
late
d pa
rties
494
30 d
ays
EOM
-A
KR
3Sa
les
reve
nue
154
Nor
mal
-A
MY
3Sa
les
reve
nue
35N
orm
al-
AM
Y3
Rec
eiva
bles
from
rela
ted
parti
es4
30 d
ays
afte
r inv
oice
dat
e-
AN
A3
Sale
s re
venu
e37
,615
Nor
mal
-A
NA
3R
ecei
vabl
es fr
om re
late
d pa
rties
378
30 d
ays
afte
r inv
oice
dat
e-
APL
3C
omm
issio
n re
venu
e7,
259
Nor
mal
-A
PL3
Sale
s re
venu
e51
,757
Nor
mal
-A
TC3
Rec
eiva
bles
from
rela
ted
parti
es6,
181
30 d
ays
afte
r inv
oice
dat
e-
The
Com
pany
2R
ecei
vabl
es fr
om re
late
d pa
rties
3,37
330
day
s EO
M-
The
Com
pany
2Sa
les
reve
nue
7,83
8N
orm
al-
8A
IDA
MY
3O
ther
reve
nue
16N
orm
al-
ASG
3Sa
les
reve
nue
46N
orm
al-
ASG
3O
ther
reve
nue
71N
orm
al-
ATH
3O
ther
reve
nue
16N
orm
al-
The
Com
pany
2R
ecei
vabl
es fr
om re
late
d pa
rties
2460
day
s EO
M-
9A
INA
EU3
Sale
s re
venu
e1,
103
Nor
mal
-Th
e C
ompa
ny2
Rec
eiva
bles
from
rela
ted
parti
es53
60 d
ays
EOM
-
10A
iSC
AA
C (H
K)
3O
ther
rece
ivab
les
from
rela
ted
parti
es8,
984
90 d
ays
-A
CN
3O
ther
rece
ivab
les
from
rela
ted
parti
es26
,571
Imm
edia
te p
aym
ent
-A
CN
3R
ecei
vabl
es fr
om re
late
d pa
rties
1,68
1Im
med
iate
pay
men
t-
AC
N3
Sale
s re
venu
e17
,538
Nor
mal
-A
CN
3O
ther
reve
nue
6,26
2N
orm
al-
AEU
3Sa
les
reve
nue
4N
orm
al-
AK
MC
3R
ecei
vabl
es fr
om re
late
d pa
rties
19,0
1930
day
s EO
M-
AK
MC
3Sa
les
reve
nue
101,
554
Nor
mal
-A
KR
3Sa
les
reve
nue
22N
orm
al-
ASG
3Sa
les
reve
nue
110
Nor
mal
-Th
e C
ompa
ny2
Rec
eiva
bles
from
rela
ted
parti
es16
45 d
ays
EOM
-Th
e C
ompa
ny2
Sale
s re
venu
e70
0N
orm
al-
11A
JPA
KM
C3
Oth
er re
ceiv
able
s fr
om re
late
d pa
rties
318
45 d
ays
EOM
-A
NA
3Sa
les
reve
nue
243
Nor
mal
-A
CN
3Sa
les
reve
nue
63N
orm
al-
The
Com
pany
2R
ecei
vabl
es fr
om re
late
d pa
rties
1,53
060
-90
days
-Th
e C
ompa
ny2
Sale
s re
venu
e31
3N
orm
al-
12A
KM
CA
CA
3Sa
les
reve
nue
1,43
5N
orm
al-
AC
N3
Ren
tal r
even
ue4,
504
Nor
mal
-A
CN
3R
ecei
vabl
es fr
om re
late
d pa
rties
75,6
2660
-90
days
-
(Con
tinue
d)
-278-

Num
ber
(Not
e A
)C
ompa
ny N
ame
Cou
nter
part
yFl
ow o
f T
rans
actio
n(N
otes
B a
nd D
)
Tra
nsac
tion
Det
ails
Fina
ncia
l Sta
tem
ent A
ccou
ntA
mou
ntPa
ymen
t Ter
ms
% to
Con
solid
ated
A
sset
s/R
even
ue
(Not
e C
)
AC
N3
Oth
er re
ceiv
able
s fr
om re
late
d pa
rties
$88
960
-90
days
-A
CN
3Sa
les
reve
nue
282,
163
Nor
mal
1A
EU3
Rec
eiva
bles
from
rela
ted
parti
es33
030
day
s af
ter i
nvoi
ce d
ate
-A
EU3
Sale
s re
venu
e99
7N
orm
al-
AiS
C3
Sale
s re
venu
e22
6,74
5N
orm
al1
AiS
C3
Rec
eiva
bles
from
rela
ted
parti
es20
,640
Imm
edia
te p
aym
ent
-A
KR
3Sa
les
reve
nue
32N
orm
al-
AN
A3
Rec
eiva
bles
from
rela
ted
parti
es11
960
-90
days
-A
NA
3Sa
les
reve
nue
1,61
1N
orm
al-
ATC
3Sa
les
reve
nue
9,39
0,15
6N
orm
al28
ATC
3R
ecei
vabl
es fr
om re
late
d pa
rties
457,
038
60-9
0 da
ys1
Han
gzho
u A
dvan
tofin
e A
utom
atio
n Te
ch. C
o., L
td.
3Sa
les
reve
nue
1N
orm
al-
ALN
C3
Sale
s re
venu
e21
Nor
mal
-A
dvan
sus
Cor
p.3
Rec
eiva
bles
from
rela
ted
parti
es29
5Im
med
iate
pay
men
t-
Adv
ansu
s C
orp.
3Sa
les
reve
nue
6,15
2N
orm
al-
Adv
anPO
S3
Sale
s re
venu
e4,
705
Nor
mal
-
13A
KR
A-D
LoG
3Sa
les
reve
nue
484
Nor
mal
-A
NA
3Sa
les
reve
nue
9745
day
s af
ter i
nvoi
ce d
ate
-Th
e C
ompa
ny2
Rec
eiva
bles
from
rela
ted
parti
es4,
333
90 d
ays
EOM
-Th
e C
ompa
ny2
Sale
s re
venu
e9
Nor
mal
-
14A
MY
AID
3O
ther
reve
nue
11N
orm
al-
ASG
3O
ther
reve
nue
414
Nor
mal
-A
SG3
Sale
s re
venu
e12
Nor
mal
-A
TH3
Oth
er re
venu
e26
Nor
mal
-A
TH3
Sale
s re
venu
e33
9N
orm
al-
15A
NA
AA
U3
Sale
s re
venu
e42
4N
orm
al-
AC
N3
Sale
s re
venu
e96
Nor
mal
-A
EU3
Sale
s re
venu
e44
,243
Nor
mal
-A
EU3
Rec
eiva
bles
from
rela
ted
parti
es18
,275
60-9
0 da
ys-
AJP
3Sa
les
reve
nue
25N
orm
al-
AJP
3R
ecei
vabl
es fr
om re
late
d pa
rties
230
day
s af
ter i
nvoi
ce d
ate
-A
KM
C3
Rec
eiva
bles
from
rela
ted
parti
es1,
013
30 d
ays
EOM
-A
KM
C3
Inte
rest
reve
nue
1,19
6N
orm
al-
AK
MC
3Sa
les
reve
nue
15,0
62N
orm
al-
AK
R3
Sale
s re
venu
e15
7N
orm
al-
ATC
3Sa
les
reve
nue
16,1
59N
orm
al-
AU
K3
Roy
alty
rev
enue
2,47
0N
orm
al-
The
Com
pany
2R
ecei
vabl
es fr
om re
late
d pa
rties
3,93
845
day
s EO
M-
The
Com
pany
2Sa
les
reve
nue
27,2
03N
orm
al-
AC
A3
Sale
s re
venu
e74
,157
Nor
mal
-A
CA
3R
ecei
vabl
es fr
om re
late
d pa
rties
6,14
560
day
s EO
M-
Adv
ansu
s C
orp.
3Sa
les
reve
nue
41,6
11N
orm
al-
Adv
ansu
s C
orp.
3R
ecei
vabl
es fr
omre
late
d pa
rties
6,37
690
day
s af
ter i
nvoi
ce d
ate
-
(Con
tinue
d)
-279-
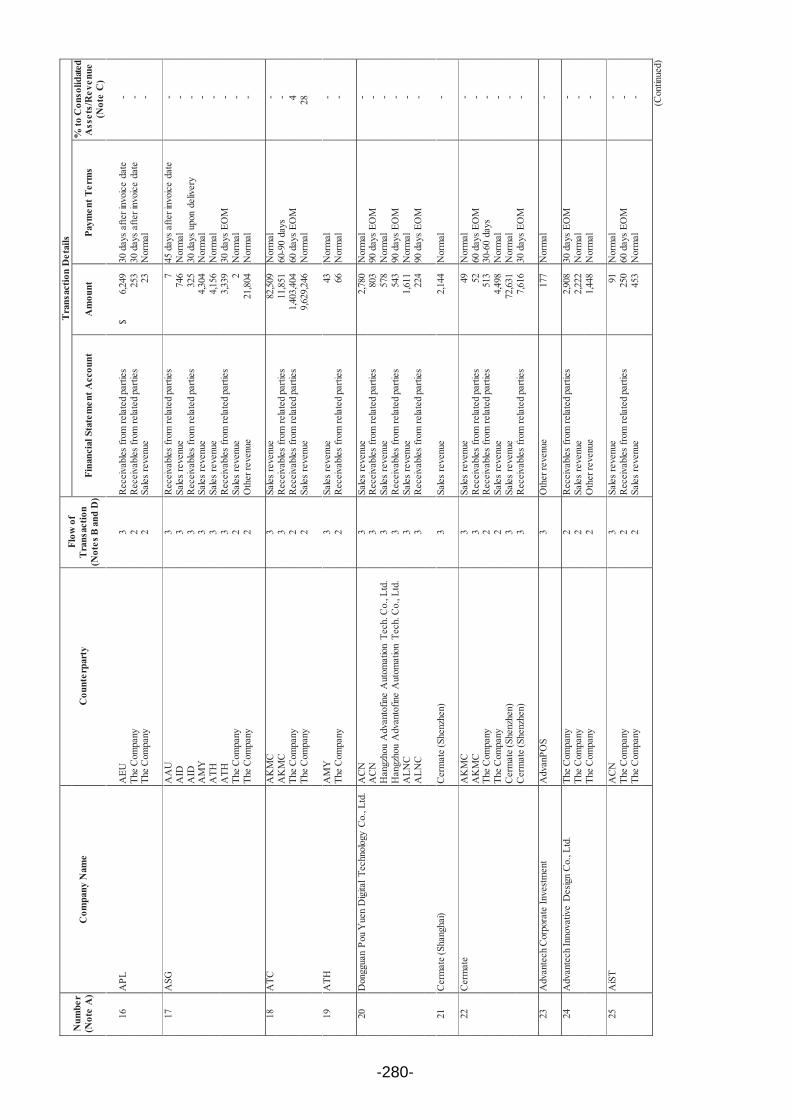
Num
ber
(Not
e A
)C
ompa
ny N
ame
Cou
nter
part
yFl
ow o
f T
rans
actio
n(N
otes
B a
nd D
)
Tra
nsac
tion
Det
ails
Fina
ncia
l Sta
tem
ent A
ccou
ntA
mou
ntPa
ymen
t Ter
ms
% to
Con
solid
ated
A
sset
s/R
even
ue
(Not
e C
)
16A
PLA
EU3
Rec
eiva
bles
from
rela
ted
parti
es$
6,24
930
day
s af
ter i
nvoi
ce d
ate
-Th
e C
ompa
ny2
Rec
eiva
bles
from
rela
ted
parti
es25
330
day
s af
ter i
nvoi
ce d
ate
-Th
e C
ompa
ny2
Sale
s re
venu
e23
Nor
mal
-
17A
SGA
AU
3R
ecei
vabl
es fr
om re
late
d pa
rties
745
day
s af
ter i
nvoi
ce d
ate
-A
ID3
Sale
s re
venu
e74
6N
orm
al-
AID
3R
ecei
vabl
es fr
om re
late
d pa
rties
325
30 d
ays
upon
del
iver
y-
AM
Y3
Sale
s re
venu
e4,
304
Nor
mal
-A
TH3
Sale
s re
venu
e4,
156
Nor
mal
-A
TH3
Rec
eiva
bles
from
rela
ted
parti
es3,
339
30 d
ays
EOM
-Th
e C
ompa
ny2
Sale
s re
venu
e2
Nor
mal
-Th
e C
ompa
ny2
Oth
er re
venu
e21
,804
Nor
mal
-
18A
TCA
KM
C3
Sale
s re
venu
e82
,509
Nor
mal
-A
KM
C3
Rec
eiva
bles
from
rela
ted
parti
es11
,851
60-9
0 da
ys-
The
Com
pany
2R
ecei
vabl
es fr
om re
late
d pa
rties
1,40
3,40
460
day
s EO
M4
The
Com
pany
2Sa
les
reve
nue
9,62
9,24
6N
orm
al28
19A
THA
MY
3Sa
les
reve
nue
43N
orm
al-
The
Com
pany
2R
ecei
vabl
es fr
om re
late
d pa
rties
66N
orm
al-
20D
ongg
uan
Pou
Yue
n D
igita
l Tec
hnol
ogy
Co.
, Ltd
.A
CN
3Sa
les
reve
nue
2,78
0N
orm
al-
AC
N3
Rec
eiva
bles
from
rela
ted
parti
es80
390
day
s EO
M-
Han
gzho
u A
dvan
tofin
e A
utom
atio
n Te
ch. C
o., L
td.
3Sa
les
reve
nue
578
Nor
mal
-H
angz
hou
Adv
anto
fine
Aut
omat
ion
Tech
. Co.
, Ltd
.3
Rec
eiva
bles
from
rela
ted
parti
es54
390
day
s EO
M-
ALN
C3
Sale
s re
venu
e1,
611
Nor
mal
-A
LNC
3R
ecei
vabl
es fr
om re
late
d pa
rties
224
90 d
ays
EOM
-
21C
erm
ate
(Sha
ngha
i)C
erm
ate
(She
nzhe
n)3
Sale
s re
venu
e2,
144
Nor
mal
-
22C
erm
ate
AK
MC
3Sa
les
reve
nue
49N
orm
al-
AK
MC
3R
ecei
vabl
es fr
om re
late
d pa
rties
5260
day
s EO
M-
The
Com
pany
2R
ecei
vabl
es fr
om re
late
d pa
rties
513
30-6
0 da
ys-
The
Com
pany
2Sa
les
reve
nue
4,49
8N
orm
al-
Cer
mat
e (S
henz
hen)
3Sa
les
reve
nue
72,6
31N
orm
al-
Cer
mat
e (S
henz
hen)
3R
ecei
vabl
es fr
om re
late
d pa
rties
7,61
630
day
s EO
M-
23A
dvan
tech
Cor
pora
te In
vest
men
tA
dvan
POS
3O
ther
reve
nue
177
Nor
mal
-
24A
dvan
tech
Inno
vativ
e D
esig
n C
o., L
td.
The
Com
pany
2R
ecei
vabl
es fr
om re
late
d pa
rties
2,90
830
day
s EO
M-
The
Com
pany
2Sa
les
reve
nue
2,22
2N
orm
al-
The
Com
pany
2O
ther
reve
nue
1,44
8N
orm
al-
25A
iST
AC
N3
Sale
s re
venu
e91
Nor
mal
-Th
e C
ompa
ny2
Rec
eiva
bles
from
rela
ted
parti
es25
060
day
s EO
M-
The
Com
pany
2Sa
les
reve
nue
453
Nor
mal
-
(Con
tinue
d)
-280-

Num
ber
(Not
e A
)C
ompa
ny N
ame
Cou
nter
part
yFl
ow o
f T
rans
actio
n(N
otes
B a
nd D
)
Tra
nsac
tion
Det
ails
Fina
ncia
l Sta
tem
ent A
ccou
ntA
mou
ntPa
ymen
t Ter
ms
% to
Con
solid
ated
A
sset
s/R
even
ue
(Not
e C
)
26A
LNC
The
Com
pany
2R
ecei
vabl
es fr
om re
late
d pa
rties
$26
560
day
s EO
M-
The
Com
pany
2R
enta
l rev
enue
1,51
8N
orm
al-
The
Com
pany
2Sa
les
reve
nue
6,51
9N
orm
al-
Don
ggua
n Po
u Y
uen
Dig
ital T
echn
olog
y C
o., L
td.
3Sa
les
reve
nue
173,
704
Nor
mal
1D
ongg
uan
Pou
Yue
n D
igita
l Tec
hnol
ogy
Co.
, Ltd
.3
Rec
eiva
bles
from
rela
ted
parti
es39
,654
90 d
ays
EOM
-D
ongg
uan
Pou
Yue
n D
igita
l Tec
hnol
ogy
Co.
, Ltd
.3
Adv
ance
d re
ceip
ts92
Nor
mal
-B
ette
r Aut
o3
Roy
alty
rev
enue
92N
orm
al-
27A
dvan
sus
Cor
p.A
CN
3Sa
les
reve
nue
6,64
4N
orm
al-
AK
MC
3Sa
les
reve
nue
2,63
4,20
9N
orm
al8
AK
MC
3R
ecei
vabl
es fr
om re
late
d pa
rties
447,
522
60-9
0 da
ys1
AK
R3
Sale
s re
venu
e23
,331
Nor
mal
-A
NA
3Sa
les
reve
nue
29N
orm
al-
The
Com
pany
2R
ecei
vabl
es fr
om re
late
d pa
rties
1,05
3,18
560
-90
days
3Th
e C
ompa
ny2
Sale
s re
venu
e3,
636,
577
Nor
mal
11Th
e C
ompa
ny2
Oth
er re
venu
e2,
391
Nor
mal
-C
erm
ate
3R
ecei
vabl
es fr
om re
late
d pa
rties
634
30 d
ays
EOM
-C
erm
ate
3Sa
les
reve
nue
1,35
4N
orm
al-
AC
A3
Sale
s re
venu
e54
,392
Nor
mal
-A
dvan
POS
3Sa
les
reve
nue
545
Nor
mal
-
28C
erm
ate
(She
nzhe
n)A
CN
3Sa
les
reve
nue
16N
orm
al-
AC
N3
Rec
eiva
bles
from
rela
ted
parti
es5
Imm
edia
te p
aym
ent
-A
KM
C3
Sale
s re
venu
e49
,141
Nor
mal
-A
KM
C3
Rec
eiva
bles
from
rela
ted
parti
es4,
810
40 d
ays
EOM
-C
erm
ate
(Sha
ngha
i)3
Sale
s re
venu
e27
,260
Nor
mal
-C
erm
ate
3Sa
les
reve
nue
16,2
19N
orm
al-
Cer
mat
e3
Rec
eiva
bles
from
rela
ted
parti
es2,
687
60 d
ays
EOM
-H
angz
hou
Adv
anto
fine
Aut
omat
ion
Tech
. Co.
, Ltd
.3
Sale
s re
venu
e25
Nor
mal
-
29A
dvan
POS
AEU
3Sa
les
reve
nue
22N
orm
al-
AiS
C3
Sale
s re
venu
e3,
658
Nor
mal
-A
KM
C3
Sale
s re
venu
e32
Nor
mal
-A
MY
3Sa
les
reve
nue
20N
orm
al-
ATH
3Sa
les
reve
nue
348
Nor
mal
-Th
e C
ompa
ny2
Rec
eiva
bles
from
rela
ted
parti
es2,
879
60 d
ays
EOM
-Th
e C
ompa
ny2
Sale
s re
venu
e31
,536
Nor
mal
-Th
e C
ompa
ny2
Oth
er re
venu
e90
2N
orm
al-
AiS
T3
Sale
s re
venu
e57
Nor
mal
-
30A
XA
AC
N3
Oth
er re
ceiv
able
s fr
om re
late
d pa
rties
803
30 d
ays
EOM
-A
CN
3Sa
les
reve
nue
88,5
65N
orm
al-
Not
e A
:Th
e pa
rent
com
pany
and
its
subs
idia
ries
are
num
bere
d as
follo
ws:
1.“0
” fo
r Adv
ante
ch C
o., L
td.
2.Su
bsid
iarie
s ar
e nu
mbe
red
from
“1”
.(C
ontin
ued)
-281-

Not
e B
:Th
e flo
w o
f rel
ated
-par
ty tr
ansa
ctio
ns is
as f
ollo
ws:
1.Fr
om th
e pa
rent
com
pany
to it
s su
bsid
iary
.2.
From
the
subs
idia
ry t
o its
par
ent c
ompa
ny.
3.B
etw
een
subs
idia
ries.
Not
e C
:Fo
r ass
ets a
nd li
abili
ties,
amou
nts
are
show
n as
a p
erce
ntag
e to
con
solid
ated
tota
l ass
ets a
s of
Dec
embe
r 31,
201
5, w
hile
reve
nues
, cos
ts a
nd e
xpen
ses
are
show
n as
a p
erce
ntag
e to
con
solid
ated
tota
l ope
ratin
g re
venu
es fo
r the
yea
r end
ed
Dec
embe
r 31,
201
5.
Not
e D
:A
ll in
terc
ompa
ny t
rans
actio
ns h
ave
been
elim
inat
ed f
rom
con
solid
atio
n.
(Con
clud
ed)
-282-

283
VI. Financial difficulties, if any, encountered by the Company and its affiliated
companies in the most recent year and up to the publication of the annual report, and its impact on the Company’s financial status: None

284
Seven. Review and Analysis of Financial Conditions and
Performance and Risk Management I. Financial Conditions:
Unit: NT$ Thousand Year
Item 2015 2014 Difference Amount %
Current assets 18,085,746 17,990,032 95,714 1Property, plant, and equipment
9,576,879 8,876,606700,273 8
Intangible assets 227,686 286,312 (58,626) (20)Other assets 6,088,822 4,390,870 1,697,952 39Total assets 33,979,133 31,543,820 2,435,313 8Current liabilities 9,242,530 7,779,820 1,462,710 19Noncurrent liabilities
1,282,826 1,230,98151,845 4
Total liabilities 10,525,356 9,010,801 1,514,555 17Capital stock 6,318,531 6,312,091 6,440 -Additional paid-in capital
5,587,555 5,306,958280,597 5
Retained earnings 11,061,291 9,825,337 1,235,954 13Other equity 340,124 901,633 (561,509) (62)Non-controlling equity 146,276 187,000 (40,724) (22)Total equity 23,453,777 22,533,019 920,758 4
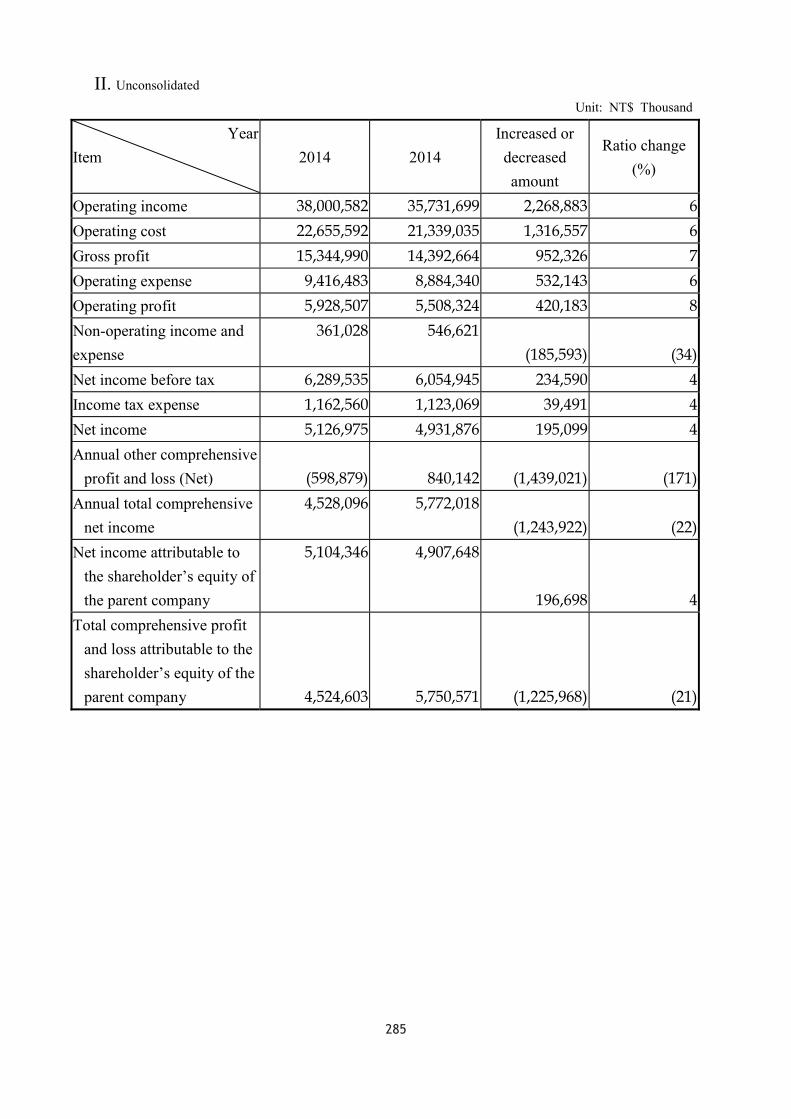
285
II. Unconsolidated
Unit: NT$ Thousand
Year Item 2014 2014
Increased or decreased amount
Ratio change (%)
Operating income 38,000,582 35,731,699 2,268,883 6Operating cost 22,655,592 21,339,035 1,316,557 6Gross profit 15,344,990 14,392,664 952,326 7Operating expense 9,416,483 8,884,340 532,143 6Operating profit 5,928,507 5,508,324 420,183 8Non-operating income and expense
361,028 546,621(185,593) (34)
Net income before tax 6,289,535 6,054,945 234,590 4Income tax expense 1,162,560 1,123,069 39,491 4Net income 5,126,975 4,931,876 195,099 4Annual other comprehensive
profit and loss (Net) (598,879) 840,142 (1,439,021) (171)Annual total comprehensive
net income 4,528,096 5,772,018
(1,243,922) (22)Net income attributable to
the shareholder’s equity of the parent company
5,104,346 4,907,648
196,698 4Total comprehensive profit
and loss attributable to the shareholder’s equity of the parent company 4,524,603 5,750,571 (1,225,968) (21)

286
III. Cash Flow (I) Liquidity Analysis within the last 2 years
Cash balance – beginning
Estimated annual net cash
flow from operating activities
Estimated annual cash
outflow
Cash balance
(deficit) -
Contingency plans for insufficient cash
Investment plan
Financial Plan
3,122,007 5,904,159 (4,641,446) 4,358,259 -- -- (II) Cash liquidity analysis for next year
Cash balance – beginning
Estimated annual net cash
flow from operating activities
Estimated annual cash
outflow
Cash balance
(deficit) -
Contingency plans for insufficient cash
Investment plan
Financial Plan
4,358,259 6,312,500 (5,500,000) 5,170,759 -- --

287
IV. The impact of material capital expenditure on financial business in the most recent year:
Project Actual or intended financing
Actual or intended
completiondate
Total funds needed
Actual or intended use of funds
103 104 105
Plant purchase (construction) –Linkou Campus Phase 1* Equity fund 103.03.31 1,232,963 408,550 - -
Plant purchase (construction) - Linkou Campus Phase 2 Equity fund 105.12.31 1,755,450 135,839 789,734 829,877
Overseas reinvestment -B+B Equity fund & Bank loan 105.01.31 3,296,048 - 2,279,881 1,016,167
Overseas reinvestment - Yeh-Chiang Technology Corp. Equity fund 105.Q2 480,000 - - 480,000
Domestic reinvestment - AI Mobile Co. Equity fund 105.12.31 450,000 - - 135,000
* Linkou Campus Phase 1 was a decision made by the Board of Directors in 2000, and the funds had been invested in the construction.
(I) Advantech Linkou Campus: In response to the global carbon reduction requirements and the development of networking technology, the Advantech Campus in Linkou was built into a pioneering experimental field of smarter buildings so as to realize the two iBuilding Solutions composed of intelligent energy management and intelligent space management.
(II) Overseas reinvestment (B+B): The company’s intention was to become the leading brand of Industrial Connectivity products and to expand the market of Industrial Connectivity to full scale. Overseas reinvestment (Yeh-Chiang Technology Corp.): The acquisition will be integrated into the planning for the future production line configuration, the establishment of the machinery plant, and Advantech Group’s development in China.
(III) Domestic reinvestment (AI Mobile Co.);On March 22, 2016, the Board of Directors made the decision to sign the strategic alliance agreement with Inventec Corp, therefore founded a joint venture, “AI Mobile Co.” Established with cash, the new company has paid-in capital of NT$1 billion. Inventec owns a 55 percent share of the firm and Advantech 45 percent. The company is to develop, produce, and sell industrial wireless handheld devices, the applications of which include retail, automotive, medical and other vertical markets.
V. Reinvestment policy in the most recent year, the reasons for profit or loss resulted, its improvement plan, and next year’s investment plan: Advantech adopts reinvestment of equity method with all focusing on long-term strategic purposes; in 2015, the profits of Advantech reinvestment of equity method reached NT$ 110,226, with an increase of NT$ 9,962 compared to the previous year, which resulted from the recognition of Axiomtek Co., Ltd.. In the future, Advantech will hold the principle of long-term strategic investment and continue assessing carefully reinvestment plans.
VI. Risk analysis and evaluation (I) Interest rates, exchange rates, and inflation, their impact on the Company’s profit or loss, and
future countermeasures: The Company has sufficient proprietary capital and sound financial structure; therefore, is from the risk of increasing capital cost. The capital planning is based on a conservative and sound principle with the focus on the security and mobility; also, regularly evaluate money market rates and financial information. In terms of exchange rate, the Company has a clear foreign exchange policy stipulated; also, a strict control of the procedures is for hedging risk instead of adopting active operation to gain

288
profits. In terms of inflation, the main sales markets of the Company are without any sign of inflation in recent years, which has not significant impact on the Company’s operations.
(II) Engage in the policies of high-risk, highly-leveraged investments, loaning of funds, endorsements and guarantees, and derivative transactions, the reasons for profit or loss resulted, and the future countermeasures: The Company has each investment project evaluated prudently and handled in accordance with the “Procedures for the Acquisition and Disposal of Assets” and the limits of authority without engaging in any high-risk and highly-leveraged investments. In terms of loaning of funds and making of endorsements/guarantees, it is mainly arranged for the subsidiaries and sub-subsidiaries of the Company; also, it is to be processed in accordance with the Company’s “Procedures for Loaning of Funds” and “Procedures for Making of Endorsements/Guarantees.” In terms of financial derivatives, the purpose is to hedge the exchange rate risks arising from business operation; also, it is to be processed in accordance with the Company’s “Procedures for the Trading of Financial Derivatives.”
(III) Future R&D plans and the projected R&D investment: 1. Future R&D plans:
Advantech will keep developing WISE-PaaS (Platform as a Service), which designed to fulfill the needs of the IoT industry. Advantech WISE-PaaS will provide complete development tools and technical services for the SI and be in alliance with Microsoft Azure, IBM Bluemix to form the big data analysis services. Data collection will be one of the main challenges for IoT. Sensors, wireless technology, and embedded computing will be the three major core abilities for data acquisition. Advantech worked closely with industrial partners to define the M2.COM open standard. With this standardization, we envision M2.COM will accelerate IoT sensor device deployment. Advantech will expand investment in RD resources to built SRPs(solution ready platforms) for vertical markets to assist the SI partners in deploying IoT applications quickly and smartly.
2. The projected R&D investment: 10% of the annual turnover (IV) The impact of significant changes in domestic and foreign policies and law on the Company’s
financial operations and the countermeasures: There had not any significant changes in domestic and foreign policies and law that had a significant impact on the Company in the most recent year. In addition to irregularly collect and assess the impact of significant changes in domestic and foreign policies and law on the Company’s finance and business operation, the Company will consult relevant professionals to take countermeasures in a timely manner.
(V) The impact of changes in technology and industry on the Company’s financial operations and the countermeasures: According to a McKinsey report titled “Mapping the Value Beyond the Hype”, the potential global economic impact of the Internet of Things (IoT) is expected to reach US$11.1 trillion by 2025. Moreover, the potential impact of IoT use is likely to be the greatest in factories, reaching an economic value of US$3.7 trillion by 2025. The second largest potential impact would be in smart cities, where the economic value of IoT applications could reach US$1.7 trillion by 2025. Regarding the development of smart cities, Advantech’s focus will be on the following five aspects: smart transportation, intelligent retail, smart healthcare, smart buildings, and digital

289
logistics and fleet management. For smart factories based on Industry 4.0, Advantech’s focus will be on the following five categories: manufacturing execution system (MES), maintenance and production records, production test equipment, machine monitoring and prevention, and automation and environmental monitoring. In order to cater to market trends, Advantech will undergo significant transformation from products to solutions, from regional to global consolidation, and also implement industry-oriented (sector-lead) concepts in an effort to optimize operations and enhance resource integration benefits. Advantech’s organizational characteristics will be adjusted as follows:
Three business units will serve three target markets, implement three major sales models, and adopt two business models. 1. The three business units/ target markets are embedded design-in, industrial IoT, and smart city
solutions. 2.The three sales models are key accounts, channel, and AOnline. 3. The two business models are branded (80%) and design-to-order services (20%).
The three business units will be formed from Advantech’s original seven business groups. The three business units are aligned with the three target markets. Advantech ’ s frontline sales-oriented company structure will be transformed into an industry-oriented structure through sector sales.
Resources for R&D, product management, quality control, and manufacturing functions will be integrated at the company headquarters.
(VI) The impact of changes in corporate image on the crisis management of the Company and the countermeasures:
The Company is with a good corporate image. In addition to irregularly receive domestic and international juristic persons, technical symposium and corporate seminars are held on a regular basis to help the investors and customers understand the Company.
(VII) The expect benefit of initiating acquisition, the possible risks, and the countermeasures: 1. On November 16, 2015, the Board of Directors made the decision to acquire B+B SmartWorx Inc. with Advantech’s subsidiary company, Advantech Corp., for US$99.85 million, possessing 100 % stake of B+B SmartWorx Inc. This acquisition aimed to make Advantech the leading brand of Industrial Connectivity, and Advantech will expand its Industrial Connectivity product portfolio and increase its global market share by leveraging B+B SmartWorx. The Industrial Connectivity products of B+B SmartWorx will complement those of Advantech since they enjoy brand awareness and sales channels in the US, Europe and the Middle East. In the future, advantages of both sides will be integrated to complement each other in the hope of making a full expansion in the Industrial Connectivity market. 2. On March 4, 2016, the Board of Directors made the decision to agree that HK Advantech Technology Co. Limited acquired Yeh-Chiang Kunshan Technology Corp. with less than 93.5 million yuan and its 100 % stake. The purpose of this acquisition is considering the production line of painting, the fact that Chinese government has tightened the control over environmental protection, fire protection, and security, the future establishment of Type C machinery plant, and the space reserved for the future development in China. 3. Advantech and Inventec Appliance Corp set up a joint venture, AI Mobile Co.. Inventec owns a 55 percent share of the firm, with Advantech holding the rest 45 percent, and it is a phase-wise investment. The purpose is to combine Advantech’s brand awareness, its industrial fields, and the global sales channels with Investec’s expertise in wireless handheld devices’ software and hardware design and its advantages in producing and material purchasing so as to share the global market share of industrial wireless handheld devices.

290
4. The above acquisitions were all carefully assessed by the Board, the possible risks of which may include the overall recession in the market and the demand falling short of expectations. In response to the risks, Advantech reduces costs by actively developing the innovative product technology and makes every effort to secure market share to maintain the stability of the company's revenue growth rate. 5. Lately and as of the date of printing the annual report, apart from the above matters, Advantech and its subsidiaries has had no other acquisition plans.
(VIII) The expected benefits of a plant expansion, the possible risks, and the countermeasures: Last year, Advantech installed a new SMT production equipment respectively in the plants of Kunshan and Taipei to meet the demand of our sales growth and to continue self-manufacturing our products. In terms of the future productivity and the manufacturing factory, a specific long-term planning has been made. The Campus Phase 2 in Advantech Linkou Intelligent Building Park will be completed by August 2016. The estimated floor area is 18,000 pings, and it will serve as Advantech Taiwan Manufacturing Integration Center. Advantech Kunshan Manufacturing Center newly purchased 100 acres of land adjacent to it for the chassis factory’s long-term development needs. The currently planned site / plant will, at least, meet the growing demand in the next ten years. The production equipment will be purchased gradually depending on the sales growth to ensure the balanced development of growth performance and stable capacity utilization.
(IX) Risks faced by the centralized purchase or sales and the countermeasures: The Company’s main source of raw materials is from the well-known domestic and international manufacturers that have a good reputation and product quality; also, have maintained a stable relation of cooperation with the Company and provide a stable supply of raw materials. In terms of sales, the Company is a market leader in brand with a smooth sales channel I service; therefore, the Company is free of any risk from the centralized purchase and sale.
(X) The impact of the massive equity transfer or exchange by the directors, supervisors, or shareholders holding more than 10% shareholding on the Company, the risk, and the countermeasures: None
(XI) The impact of the changes in the ownership on the Company, the risk, and the countermeasures: None
(XII) For litigation or non-litigation events, the closed or in-pending material litigation, non-litigation, or administrative contentious events, which may have a significant impact on the shareholder’s equity or security price, of the Company, the Company’s directors, supervisors, President, responsible person, shareholders holding more than 10% shareholding, and the subsidiaries should be illustrated: None
(XIII) Other important risks and countermeasures: None VII. Other Important matters: None
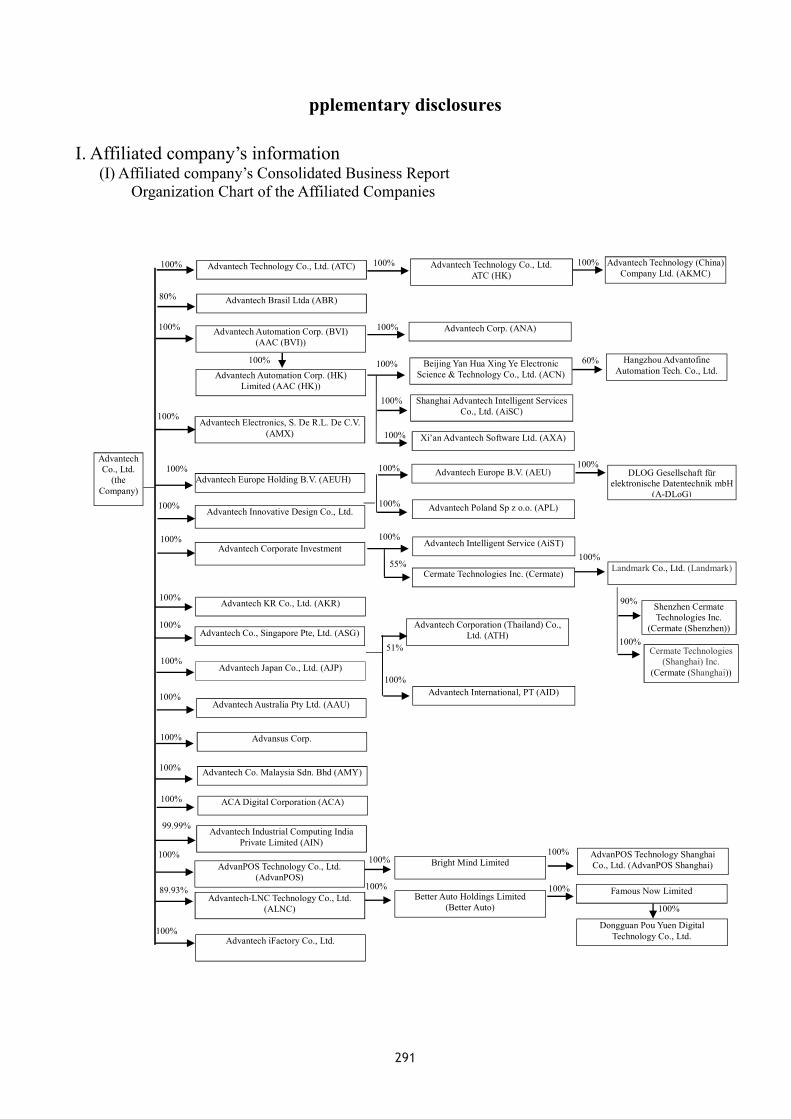
291
pplementary disclosures
I. Affiliated company’s information (I) Affiliated company’s Consolidated Business Report Organization Chart of the Affiliated Companies
100%
Advantech Electronics, S. De R.L. De C.V.(AMX)
100%
100%
100% 100% 100% Advantech Technology Co., Ltd. (ATC)
80% Advantech Brasil Ltda (ABR)
Advantech Automation Corp. (HK) Limited (AAC (HK))
100% 100%
100% 60%
100%
100% Advantech Europe Holding B.V. (AEUH)
100% Advantech KR Co., Ltd. (AKR)
100% Advantech Co., Singapore Pte, Ltd. (ASG)
Advantech Co., Ltd.
(the Company)
Hangzhou Advantofine Automation Tech. Co., Ltd.
Advantech Europe B.V. (AEU) DLOG Gesellschaft für elektronische Datentechnik mbH
(A-DLoG)Advantech Poland Sp z o.o. (APL)
100% 100%
100%
Advantech Automation Corp. (BVI) (AAC (BVI))
100% Advantech Corporate Investment
100% Advantech Japan Co., Ltd. (AJP)
100% Advantech Australia Pty Ltd. (AAU)
Advantech Technology Co., Ltd. ATC (HK)
Advantech Corp. (ANA)
Advantech Technology (China) Company Ltd. (AKMC)
Beijing Yan Hua Xing Ye Electronic Science & Technology Co., Ltd. (ACN)
Shanghai Advantech Intelligent Services Co., Ltd. (AiSC)
Xi’an Advantech Software Ltd. (AXA)
100% Advantech Intelligent Service (AiST)
55% Cermate Technologies Inc. (Cermate) Landmark Co., Ltd. (Landmark)
100%
100%
100% 100% 89.93%
100%
100% Advansus Corp.
100% Advantech Co. Malaysia Sdn. Bhd (AMY)
Advantech-LNC Technology Co., Ltd. (ALNC)
AdvanPOS Technology Co., Ltd. (AdvanPOS)
Bright Mind Limited
Better Auto Holdings Limited (Better Auto)
AdvanPOS Technology Shanghai Co., Ltd. (AdvanPOS Shanghai)
100% 100%
Famous Now Limited
Dongguan Pou Yuen Digital Technology Co., Ltd.
100% ACA Digital Corporation (ACA)
Advantech Industrial Computing India Private Limited (AIN)
99.99%
51%
Advantech Corporation (Thailand) Co., Ltd. (ATH)
Advantech International, PT (AID) 100%
Cermate Technologies (Shanghai) Inc.
(Cermate (Shanghai))
Shenzhen Cermate Technologies Inc.
(Cermate (Shenzhen))100%
90%
Advantech Innovative Design Co., Ltd. 100%
100% Advantech iFactory Co., Ltd.

292
2. Basic information of affiliated companies Unit: NT$ Thousand
No. Name Establishing Date
Address Paid-in capital Main Business or Production Items
01 Advanixs Corporation. Jan. 2006 Taipei NTD360,000 Manufacturing, marketing, and trade of industrial use PC
02 Advantech Corporate Investment
Feb. 2000 Taipei NTD1,500,000 Investment in marketable securities
03 Hangzhou Advantofine Automation Tech Co.,Ltd.
Sep. 2007 Hangzhou RMB3,000 Processing and sale of computer peripheral components
04 Advantech Co. Singapore Pte, Ltd. (ASG)
Dec. 1995 Techplace, Singapore
SGD1,450 Marketing and trade of industrial use PC
05 Advantech Japan Co.,Ltd. (AJP)
Sep. 1997 Tokyo, Japan JPY60,000 Marketing and trade of industrial use PC
06 Advantech Australia Pty Ltd. (AAU)
Dec. 1994 Sydney, Australia
AUD500 Marketing and trade of industrial use PC
07 Advantech Co. Malaysia Sdn. Bhd (AMY)
Mar. 2006 Malaysia MYR2,000 Marketing and trade of industrial use PC
08 Advantech Europe Holding B.V. (AEUH)
Dec. 1995 Helmond, TheNetherlands
EUR12,572 Overseas investment of manufacturing and service industry
09 Advantech Technology Co., Ltd. (ATC)
Sep. 1998 British VirginIslands
USD38,750 Marketing and trade of industrial use PC
10 Advantech Automation Corp.(AAC(BVI))
Mar. 2000 British VirginIslands
USD29,623 Overseas investment of manufacturing and service industry
11 Advantech Europe B.V.(AEU) Jun. 1998 Helmond, The Netherlands
EUR11,314 Marketing and trade of industrial use PC
12 Advantech Poland Sp. z.o.o(APL)
Jan. 2006 Warsaw, Poland
PLZ3,350 Marketing and trade of industrial use PC
13 Advantech Technology (China) Company., Ltd.(AKMC)
Jan. 2006 Jiangsu Province
USD41,650 Marketing and trade of industrial use PC
14 Advantech Corporation (ANA)
Aug. 1987 Sunnyvale, USA
USD11,139 Assembly, marketing, and trade of industrial use PC
15 Beijing Yan Hua Xing Ye Electronics Science &Technology Co., Ltd. (ACN)
Apr. 1994 Beijing City USD4,230 Marketing and trade of industrial use PC
16 Advantech Technology (HK) Co., Limited(ATC HK)
Apr. 2008 Hong Kong USD41,650 Overseas investment of manufacturing and service industry
17 Advantech Automation Corp.(HK) Limited (AAC HK)
Dec. 2007 Hong Kong USD15,230 Overseas investment of manufacturing and service industry
18 Shanghai Advantech Intelligent Services Co., Ltd. (AiSC)
Sep. 2008 Shanghai City USD8,000 Marketing and trade of industrial use PC
19 Xi’An Advantech Software Co., Ltd. (AXA)
Sep. 2008 Xi’an USD1,000 Marketing and trade of industrial use PC
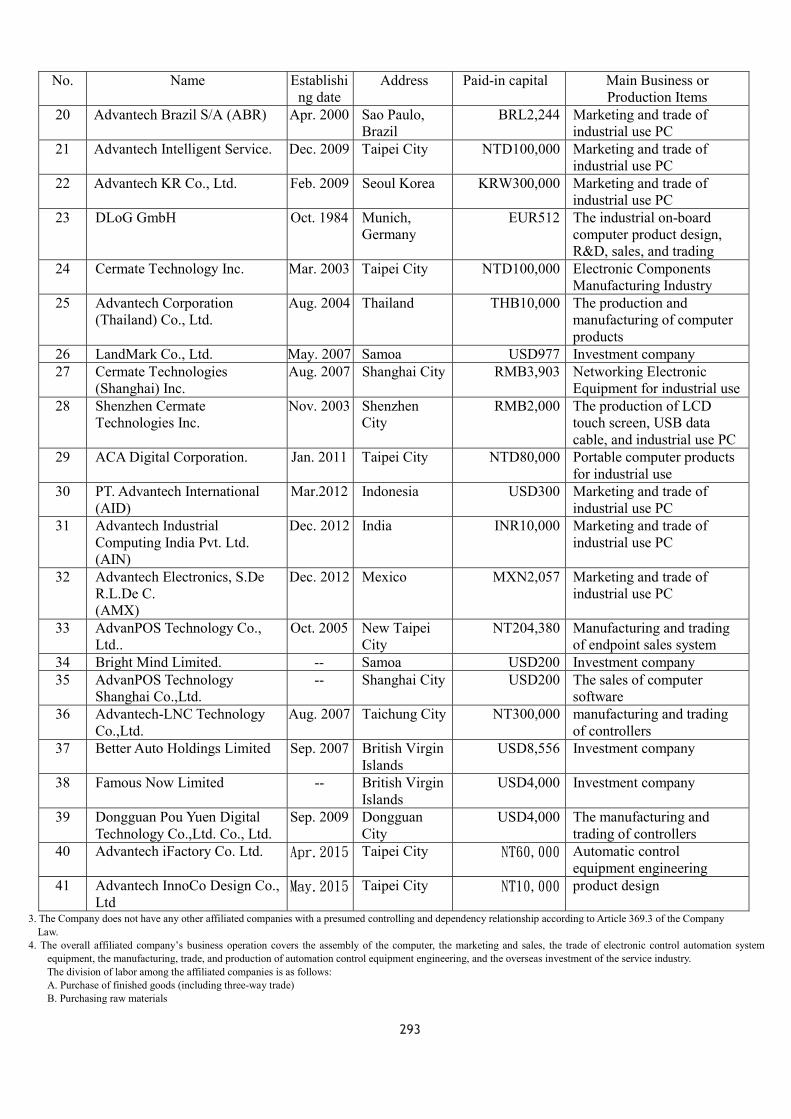
293
No. Name Establishing date
Address Paid-in capital Main Business or Production Items
20 Advantech Brazil S/A (ABR) Apr. 2000 Sao Paulo, Brazil
BRL2,244 Marketing and trade of industrial use PC
21 Advantech Intelligent Service. Dec. 2009 Taipei City NTD100,000 Marketing and trade of industrial use PC
22 Advantech KR Co., Ltd. Feb. 2009 Seoul Korea KRW300,000 Marketing and trade of industrial use PC
23 DLoG GmbH Oct. 1984 Munich, Germany
EUR512 The industrial on-board computer product design, R&D, sales, and trading
24 Cermate Technology Inc. Mar. 2003 Taipei City NTD100,000 Electronic Components Manufacturing Industry
25 Advantech Corporation (Thailand) Co., Ltd.
Aug. 2004 Thailand THB10,000 The production and manufacturing of computer products
26 LandMark Co., Ltd. May. 2007 Samoa USD977 Investment company 27 Cermate Technologies
(Shanghai) Inc. Aug. 2007 Shanghai City RMB3,903 Networking Electronic
Equipment for industrial use28 Shenzhen Cermate
Technologies Inc. Nov. 2003 Shenzhen
City RMB2,000 The production of LCD
touch screen, USB data cable, and industrial use PC
29 ACA Digital Corporation. Jan. 2011 Taipei City NTD80,000 Portable computer products for industrial use
30 PT. Advantech International (AID)
Mar.2012 Indonesia USD300 Marketing and trade of industrial use PC
31 Advantech Industrial Computing India Pvt. Ltd. (AIN)
Dec. 2012 India INR10,000 Marketing and trade of industrial use PC
32 Advantech Electronics, S.De R.L.De C. (AMX)
Dec. 2012 Mexico MXN2,057 Marketing and trade of industrial use PC
33 AdvanPOS Technology Co., Ltd..
Oct. 2005 New Taipei City
NT204,380 Manufacturing and trading of endpoint sales system
34 Bright Mind Limited. -- Samoa USD200 Investment company 35 AdvanPOS Technology
Shanghai Co.,Ltd. -- Shanghai City USD200 The sales of computer
software 36 Advantech-LNC Technology
Co.,Ltd. Aug. 2007 Taichung City NT300,000 manufacturing and trading
of controllers 37 Better Auto Holdings Limited Sep. 2007 British Virgin
Islands USD8,556 Investment company
38 Famous Now Limited -- British VirginIslands
USD4,000 Investment company
39 Dongguan Pou Yuen Digital Technology Co.,Ltd. Co., Ltd.
Sep. 2009 Dongguan City
USD4,000 The manufacturing and trading of controllers
40 Advantech iFactory Co. Ltd. Apr.2015 Taipei City NT60,000 Automatic control equipment engineering
41 Advantech InnoCo Design Co., Ltd
May.2015 Taipei City NT10,000 product design
3. The Company does not have any other affiliated companies with a presumed controlling and dependency relationship according to Article 369.3 of the Company Law.
4. The overall affiliated company’s business operation covers the assembly of the computer, the marketing and sales, the trade of electronic control automation system equipment, the manufacturing, trade, and production of automation control equipment engineering, and the overseas investment of the service industry. The division of labor among the affiliated companies is as follows: A. Purchase of finished goods (including three-way trade) B. Purchasing raw materials

294
5. Each affiliated company’s Director, Supervisor, and President:
No.
Company Name
Title
Name or representative Shareholding
Shares or investment amount (NT$ housand)
Shareholding or investment ratio (%)
01 Advanixs Corporation. Director Representatives of Advantech: K.C. Liu , MingChin Wu, Eric Chen
36,000,000shares
100
Supervisor Representatives of Advantech:Jessica Tsai
02 Advantech Corporate Investment .
Director Representatives of Advantech: K.C. Liu, Mary Chang, Mary Chang
150,000,000 shares
100
Supervisor Representatives of Advantech: Jessica Tsai
03 Hangzhou Advantofine Automation Tech Co.,Ltd.
Director Chi Hsu (To-Feng), Jun Liu (To-Feng), Chaney Ho (Advantech), Nan Chi (Advantech)
RMB3,000 60
Supervisor Jun Shi (Advantech), Yen Pu (To-Feng)
04 Advantech Co. Singapore Pte, Ltd. (ASG)
Director Representatives of Advantech: K.C. Liu, David Soon
1,450,000 shares 100
05 Advantech Japan Co., Ltd. (AJP)
Director Representatives of Advantech: K.C. Liu,
A-Shih Ong
1,200 shares 100
Supervisor Representatives of Advantech: Mary Chang
President Chaney Ho
06 Advantech Australia Pty Ltd. (AAU)
Director Representatives of Advantech: David Soon, Santo Gazzo
500,204 shares
100
07 Advantech Co. Malaysia Sdn. Bhd (AMY)
Director Representatives of Advantech: K.C. Liu, David Soon, Chaney Ho, Ng Hock Chuan, Choong Beng Chou
2,000,000 shares
100
08 Advantech Europe Holding B.V. (AEUH )
Director Representatives of Advantech: K.C. Liu
12,572,024 shares
100
09 Advantech Technology Co., Ltd. (ATC)
Director Representatives of Advantech: K.C. Liu
38,750,000shares
100
10 Advantech Automation Corp.(AAC BVI)
Director Representatives of Advantech: K.C. Liu
29,623,834 shares
100
11 Advantech Europe B.V.(AEU)
Director Representatives of Advantech Europe Holding B.V.: K.C. Liu
11,314,280 shares
100
12 Advantech Poland Sp. z.o.o(APL)
Director Representative of Advantech Europe Holding B.V.: Jeff Shy
6,350 shares
100
13 Advantech Technology (China) Company., Ltd. (AKMC)
Director Representative of Advantech Europe Holding B.V.: K.C. Liu, Shun-Long Chen, Chaney Ho
USD37,300 100

295
No. Company Name Title Name or representative
Shareholding
Shares or investment amount (NT$ Thousand)
Shareholding or
investment ratio (%)
14 Advantech Corporation (ANA)
Director Representative of Advantech Automation Corp.: K.C. Liu
10,952,606 shares 100
President K.C. Liu 15 Beijing Yan Hua Xing Ye
Electronics Science &Technology Co., Ltd (CAN)
Director Representative of Advantech Automation Corp.: K.C. Liu, Chaney Ho, Shih-Yang Tsai
USD5,332 100
16 Advantech Technology( HK) Co., Limited (ATC HK)
Director K.C. Liu 41,650,001 shares 100
17 Advantech Automation Corp.(HK) Limited (AAC HK)
Director Representative of Advantech Automation Corp.: K.C. Liu
15,230,001 shares
100
18 Shanghai Advantech Intelligent Services Co., Ltd. AiSC
Director Representative of Advantech Automation Corp.(HK): K.C. Liu
USD8,000 100
Supervisor EricChen
President Chaney Ho
19 Xi’An Advantech Software Co., Ltd. AXA
Director Representative of Advantech Automation Corp.(HK): K.C. Liu
USD1,000 100
Supervisor Chaney Ho 20 Advantech Brazil S/A
(ABR) Director Advantech Co., Ltd.
Representative:Mario Franco Neto 1,794,996 shares 80
21 Advantech Intelligent Service. AiST
Director Representatives of Advantech: K.C. Liu, MingChin Wu,Deryu Yin
10,000,000 shares
100
Supervisor Jessica Tsai 22 Advantech KR Co., Ltd. Director Representatives of Advantech: K.C.
Liu, ChaneyHo, YJ Choi 600,000 shares 100
Supervisor Representatives of Advantech: Eric Chen
23 DLoG GmbH (A-DLoG) President K.C. Liu 1 share 100
24 Cermate Technology Inc.. Director Representatives of Advantech: Albert Huang, Allan Tsay Representative of Wen Xin International Investment Company: Chunsen Li, Shiqiang Jiang
5,500,000 shares 55
Supervisor Yuzhen Liu
25 Advantech Corporation (Thailand) Co., Ltd.
Director Representative of Advantech Co. Singapore Pte, Ltd.: KC. Liu, David Soon
51,000 shares 51
26 LandMark Co., Ltd. Director Yuling Liu 972,284 shares 100

296
No. Company Name Title Name or representative Shareholding Shares or
investment amount (NT$
Thousand)
Shareholding or
investment ratio (%)
27 Cermate Technologies (Shanghai) Inc.
Director Albert Huang USD572 100Supervisor Jun Shi
28 Shenzhen Cermate Technologies Inc.
Director Albert Huang USD308 90Supervisor Shiqiang Jiang
29 ACA Digital Corporation. Director Representatives of Advantech: K.C. Liu, Mary Chang, Eric
8,000,000 shares 100
Supervisor Representatives of Advantech:Jessica Tsai
30 PT. Advantech International (AID)
Director Representative of Advantech Co. Singapore Pte, Ltd. (ASG): K.C. Liu
300,000 shares 100
31 Advantech Industrial Computing India Pvt. Ltd. (AIN)
Director Representative of Advantech: K.C. Liu, Chaney Ho
999,999 shares 99.99
32 Advantech Electronics, S.De R.L.De C. (AMX)
Director Representative of Advantech Corporation.(ANA): K.C. Liu
MAX884 100
33 AdvanPOS Technology Co., Ltd.
Director Representative of Advantech: K.C. Liu, Mary Chang, Kenny Deng
20,438,000 shares
69.47
Supervisor Representatives of Advantech:Jessica Tsai
34 Bright Mind Limited. Director Moorris Hsu USD200 100
35 AdvanPOS Technology Shanghai Co.,Ltd.
Director Moorris Hsu USD200 100
36 Advantech LNC Technology Co., Ltd.
Director Representative of Advantech: K.C. Liu, Alber Huang, Michael Kuo
26,980,000 Shares
89.93
Supervisor Representatives of Advantech:Jessica Tsai
37 Better Auto Holdings Limited
Director Representative of Advantech LNC Technology Co., Ltd.: K.C. Liu
USD8,556 100
38 Famous Now Limited Director Representative of Better Auto Holdings Limited: K.C. Liu
USD4,000 100
39 Dongguan Pou Yuen Digital Technology Co.,Ltd.
Director Representative of Famous Now Limited: K.C. Liu, Chaney Ho, Albert Huang
USD4,000 100
40 Advantech iFactory Co. Ltd. Director Albert Huang,Paul Lo,Allan Tsay 6,000,000 Shares
100Supervisor Jessica Tsai
41 Advantech InnoCo Design Co., Ltd
Director Chaney Ho,Deryu Yin,EricChen 1,000,000 Shares
100Supervisor Jessica Tsai

297
6. Affiliated company’s Operating Results Unit: NT$ Thousand, Except Earnings per Share in NT$
No. Company Name Capital stock
Total assets Total liabilities
Net worth Operating income
Operating profit (loss)
Net Income (Loss)
EPS (Loss) / NT$ (after
tax) 01 Advanixs Corporation. 360,000 2,124,908 1,140,195 984,713 7,316,342 624,572 536,439 14.9
02 Advantech Corporate Investment . 1,500,000 1,560,829 443 1,560,386 44,947 (7,332) 10,362 0.07
03 Hangzhou Advantofine Automation Tech Co.,Ltd.
22,970 38,059 15,208 22,851 67,364 412 524 -
04 Advantech Co. Singapore Pte, Ltd. (ASG)
33,800 145,684 56,766 88,918 306,289 (3,261) 13,065 9.01
05 Advantech Japan Co., Ltd. (AJP)
21,480 333,638 148,293 185,345 767,452 40,282 31,380 26,150
06 Advantech Australia Pty Ltd. (AAU)
14,846 125,781 88,647 37,134 331,671 (18,199) (6,648) (13.3)
07 Advantech Co., Malaysia Sdn.Bhd (AMY)
18,138 49,447 18,315 31,132 156,842 12,119 7,277 3.64
08 Advantech Europe Holding B.V. (AEUH)
338,906 988,555 3,137 985,418 - (1,383) 67,967 5.41
09 Advantech Technology Co., Ltd. (ATC)
1,241,438 4,110,400 480,093 3,630,307 9,711,754 920 128,416 3.14
10 Advantech Automation Corp. (AAC(BVI))
896,862 3,926,827 - 3,926,827 - (58) 303,287 10.24
11 Advantech Europe B.V. (AEU)
312,019 2,110,756 1,283,722 827,034 4,887,003 46,905 34,926 3.09
12 Advantech Poland Sp z.o.o(APL)
10,145 33,293 10,770 22,523 62,254 3,212 1,078 169.76
13 Advantech Technology (China) Company., Ltd. AKMC
1,475,414 4,480,222 1,802,283 2,677,939 9,956,153 255,896 203,353 -
14 Advantech Corporation (ANA)
337,232 4,448,189 2,354,327 2,093,862 10,791,589 251,010 147,648 13.48
15 Beijing Yan Hua Xing Ye Electronics Science &Technology Co., Ltd.
164,856 2,869,427 1,861,863 1,007,564 7,901,187 109,762 132,777 -
16 Advantech Technology(HK) Co., Limited (ATC HK)
1,329,236 2,677,939 - 2,677,939 - - 203,353 4.88
17 Advantech Automation Corp.(HK) Limited (AAC HK)
461,088 1,838,711 14,978 1,823,733 19,516 (1,659) 155,698 10.22
18 Shanghai Advantech Intelligent Services Co., Ltd. AiSC
252,065 988,699 217,221 771,478 1,259,437 12,361 23,659 -
19 Xi’An Advantech Software Co., Ltd. AXA
31,589 59,426 16,644 42,782 78,343 3,791 871 -
20 Advantech Brazil S/A (ABR)
39,595 71,483 14,897 56,586 242,478 (1,629) 10,126 4.51
21 Advantech Intelligent Service. AiST
100,000 165,853 44,921 120,932 207,631 23,816 24,092 2.41
22 Advantech KR Co., Ltd.(AKR) 7,800 361,183 101,468 259,715 1,283,758 30,767 17,462 29.1
23 DLoG GmbH (DLoG) 20,060 491,824 152,112 339,712 1,177,876 27,427 32,551 -
24 Cermate Technology Inc. 100,000 214,200 53,873 160,327 209,142 25,535 35,311 3.53
25 Advantech Corporation(Thailand)Co., Ltd.(ATH)
9,557 48,500 16,415 32,085 120,996 11,900 9,358 93.58

298
No. Company name Capital stock
Total assets Total liabilities
Net worth Operating income
Operating profit (loss)
Income (Loss)
EPS (Loss) / NT$ (after
tax) 26 Land Mark 27,057 75,108 - 75,108 - - 15,152 15.58
27 Cermate Technologies (Shanghai) Inc.
18,760 24,700 1,723 22,977 35,384 999 871 -
28 Shenzhen Cermate Technologies Inc.
9,614 79,888 24,357 55,531 204,572 21,257 15,869 -
29 ACA Digital Corporation. 80,000 441,981 185,422 256,559 2,288,430 113,950 100,220 12.53
30 PT. ADVANTECH INTERNATIONAL (AID)
5,465 8,546 4,190 4,356 21,106 (3,640) 2,524 8.41
31 ADVANTECH INDUSTRIAL COMPUTING INDIA (AIN)
2,904 54,058 39,025 15,033 73,248 22,225 20,540 20.54
32 Advantech Electronics, S. De R. L. De C. (AMX)
2,047 1,635 72 1,563 5,534 924 924 -
33 AdvanPOS Technology Co., Ltd.
204,380 237,365 93,103 144,262 218,421 (8,342) (9,938) 0.49
34 Bright Mind Limited.
5,892 58 29 29 - - (496) -
35 AdvanPOS Technology Shanghai Co.,Ltd.
5,892 31 - 31 197 (725) (496) -
36 Advantech LNC Technology Co., Ltd.
300,000 392,433 70,720 321,713 335,537 38,940 6,131 0.20
37 Better Auto Holdings Limited
264,445 107,477 2,482 104,995 - (5,416) (49,267) -
38 Famous Now Limited 123,630 161,048 174 160,874 - - - -
39 Dongguan Pou Yuen Digital Technology Co.,Ltd.
123,630 151,023 92,664 58,359 245,600 (37,309) (42,589) -
40 Advantech iFactory Co. Ltd. 60,000 60,088 - 60,088 - (44) (6) -
41 Advantech InnoCo Design Co., Ltd
10,000 11,296 2,726 8,570 2,822 (2,896) (1,441) (1.44)
(II) The companies to be included in the affiliate’s consolidated financial statements are same as the companies to be included in
the parent company-subsidiary consolidated financial statements in accordance with Article 7 of the “Taiwan’s Financial Accounting Standards;” therefore, the affiliate’s consolidated financial statements will not be prepared separately.
(III) The Company is not a subsidiary of other companies; therefore, it is not necessary to have the relationship report prepared.
II. The status of issuing private placement securities in the most recent year and up to the publication of the
annual report: None III. Acquisition or disposal of the Company’s stock shares by subsidiaries in the most recent year and up to the
publication of the annual report: None IV. Other necessary supplementary notes: None
Nine. The occurrence of any events as stated in Section 3 Paragraph 2 in Article 36 of the
Securities Exchange Act that had significant impact on shareholders’ equity or securities prices in the most recent year and up to the publication of the annual report: None