Embed Size (px)
Citation preview
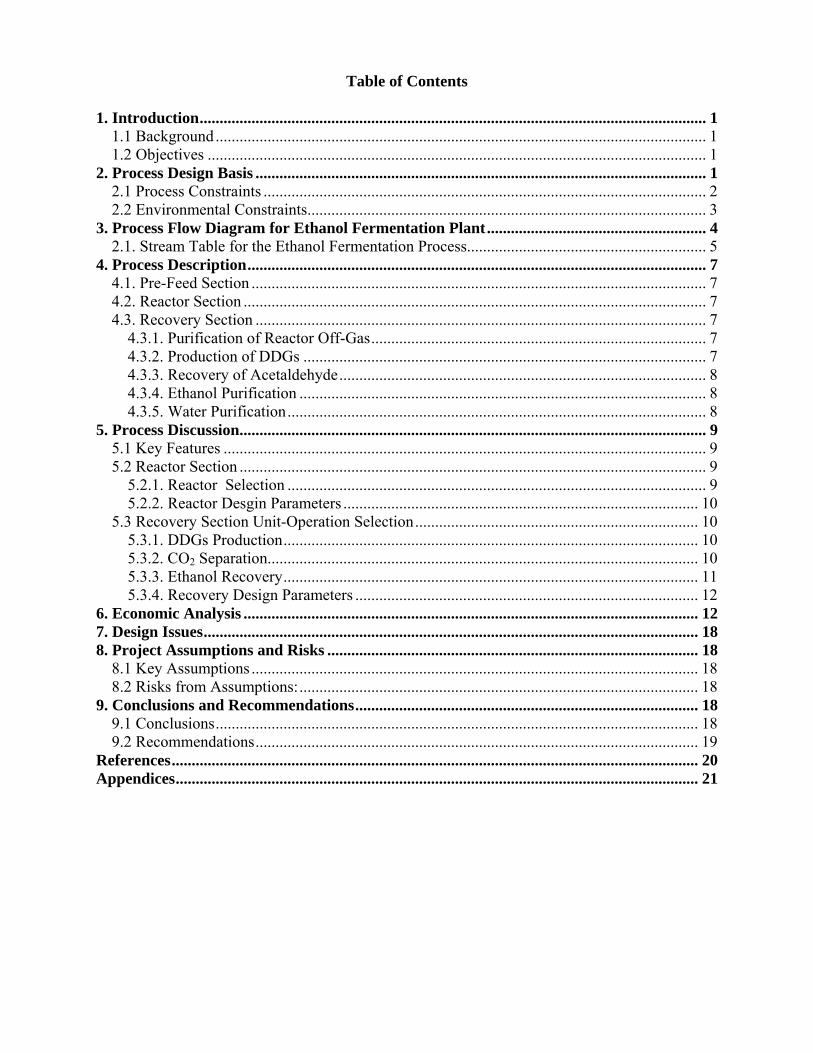
Table of Contents
1. Introduction............................................................................................................................... 1 1.1 Background........................................................................................................................... 1 1.2 Objectives ............................................................................................................................. 1
2. Process Design Basis ................................................................................................................. 1 2.1 Process Constraints ............................................................................................................... 2 2.2 Environmental Constraints.................................................................................................... 3
3. Process Flow Diagram for Ethanol Fermentation Plant....................................................... 4 2.1. Stream Table for the Ethanol Fermentation Process............................................................ 5
4. Process Description................................................................................................................... 7 4.1. Pre-Feed Section .................................................................................................................. 7 4.2. Reactor Section .................................................................................................................... 7 4.3. Recovery Section ................................................................................................................. 7
4.3.1. Purification of Reactor Off-Gas.................................................................................... 7 4.3.2. Production of DDGs ..................................................................................................... 7 4.3.3. Recovery of Acetaldehyde............................................................................................ 8 4.3.4. Ethanol Purification ...................................................................................................... 8 4.3.5. Water Purification......................................................................................................... 8
5. Process Discussion..................................................................................................................... 9 5.1 Key Features ......................................................................................................................... 9 5.2 Reactor Section ..................................................................................................................... 9
5.2.1. Reactor Selection ......................................................................................................... 9 5.2.2. Reactor Desgin Parameters ......................................................................................... 10
5.3 Recovery Section Unit-Operation Selection....................................................................... 10 5.3.1. DDGs Production........................................................................................................ 10 5.3.2. CO2 Separation............................................................................................................ 10 5.3.3. Ethanol Recovery........................................................................................................ 11 5.3.4. Recovery Design Parameters ...................................................................................... 12
6. Economic Analysis .................................................................................................................. 12 7. Design Issues............................................................................................................................ 18 8. Project Assumptions and Risks ............................................................................................. 18
8.1 Key Assumptions ................................................................................................................ 18 8.2 Risks from Assumptions:.................................................................................................... 18
9. Conclusions and Recommendations...................................................................................... 18 9.1 Conclusions......................................................................................................................... 18 9.2 Recommendations............................................................................................................... 19
References.................................................................................................................................... 20 Appendices................................................................................................................................... 21
1. Introduction The new Pharmaceutical Division recently received U.S. FDA approval to begin the production and marketing of the company’s new AMPUCILLENTM broad spectrum antibiotic. AMPUCILLEN is expected to have high demand once it is introduced to the pharmaceutical market because of its low incidence of side effects and long lasting effects [1]. Due to the high purity ethanol which is used as a solvent during the drug recrystallization process and the satisfaction of FDA requirements, the company must manufacture the ethanol internally. 1.1 Background The company needs indicate that 40 million gallons per year (mmgy) of ethanol must be produced to satisfy internal needs: 10 mmgy of pure anhydrous ethanol and 30 mmgy of 95% ethanol. Because several legislative initiatives are expected to limit the use of methyl tert-butyl ether (MTBE) [2], the demand for high purity ethanol, which is the primary alternative of MTBE as a fuel additive, is projected to increase. The market demand curves are presented in Appendix A. Thus, it will be profitable to sell additional ethanol beyond the internal requirements and the proposed ethanol plant will have a total capacity of producing100 mmgy where 60 mmgy of anhydrous ethanol will be sold on the fuel additive market. A preliminary feed preparation study indicated that approximately 663 million kg/yr of glucose is needed to produce 100 mmgy of ethanol (see Appendix B). 1.2 Objectives The objectives of this project are to design a profitable ethanol fermentation plant that will fulfill the internal needs of the company for AMPUCILLENTM production, recover the by-products of fermentation for sale, and satisfy environmental regulations. 2. Process Design Basis The process design of the ethanol production process is based upon the following reaction and yield data [3]: Glucose CO2 + Ethanol + Yeast + Sugars + Acetic Acid + Acetaldehyde 1.0g 0.415g 0.434g 0.108g 0.037g 0.003g 0.003g
The ethanol fermentation reaction follows the kinetics of the Monod equation:
( )⎟⎟⎠
⎞⎜⎜⎝
⎛+⎟
⎟⎠
⎞⎜⎜⎝
⎛−=
MA
CAn
*R
RC CC
CC
C
C1kr [1]
where rC is the reaction rate, CA is the glucose concentration, CC is the concentration of yeast, CR is the concentration of ethanol, k is the reaction rate constant, n is the toxic power, CM is the Monod or saturation constant, and CR* is the toxic ethanol concentration at which yeast activity decreases. Using the data obtained from Dr. Breakthrough [4], the constants for the Monod equation were graphically determined to give Equation 2. The derivation of the kinetic rate law is presented in Appendix C.
( )⎟⎟⎠
⎞⎜⎜⎝
⎛+
⎟⎠
⎞⎜⎝
⎛−=
0.2227CCC
85.5C
10.431rA
CA3678.0
RC [2]
The production of each by-product was estimated from a material balance, which is summarized in Appendix B. The calculations were based on the yield data and a desired production of 100
1
mmgy of ethanol. The desired purity of by-products was determined based on market specifications and environmental regulations. Table 2.1 presents a summary of the quantity and purity of each by-product produced.
Table 1.1. Desired products, amounts and purities.
Production Amount Purity Desired Product (kg/hr) (%)
95 wt% Ethanol 10,376.96 95 Anhydrous Ethanol 24,212.90 100 Carbon Dioxide 34,162.30 99 Acetaldehyde 178.24 99 Acetic Acid 244.26 0 Water (purged) 79,036.55 99 DDGs 8,889.74 95
The physical properties of the products that will be produced in the ethanol production process are listed in Table 2.2.
Table 2.2. Physical property data for fermentation products [5].
Physical Property Ethanol Acetic Acid Acetaldehyde Appearance Colorless Colorless Colorless Melting Point -130 ºC 16.6 ºC -123.5 ºC Boiling Point 78 ºC 117.9 ºC 20.1 ºC Vapour Pressure 1.59 11 755 Flash Point 56 ºF 40 ºC -27 ºC Explosion Limits 3.3% - 24.5% 5.4-16 4% - 57% Autoignition Temperature 683 ºF 465 185 C Water Solubility Miscible Miscible Miscible
2.1 Process Constraints The design of the ethanol manufacturing process must fulfill the project objectives and satisfy the specifications and constraints imposed on the process. · Mass and energy must be conserved for the entire process · The reactor must be sized to produce 100 mmgy of ethanol · The reactor must operate at the following specifications to maximize volume productivity
and yeast activity [4]: − The temperature in the reactor must not exceed 40°C − Acetic acid concentration must be less than 3.78 g/L
· The solids weight percent (wt %) must not exceed 10 wt. % in the process for pumping purposes [6]
· The yeast cream exiting the centrifuge must not exceed 22 wt% [6] · The process cost must be minimized by reducing energy usage with heat integration
networks and cost effective process units · The unit operations must be designed to obey chemical engineering heuristics · The discharge streams will satisfy environmental regulations
− The wastewater must be 99 wt % pure and organic components must be neutralized prior to waste treatment
− The temperature of product streams must be between 20ºC – 25ºC for environmental, safety, and product specifications
− The gas emissions must comply with EPA standards
2
3
2.2 Environmental Constraints Several safety and environmental considerations must be considered when manufacturing ethanol and its by-products. Although ethanol provides many environmental benefits over MTBE (methyl tert-butyl ether) in gasoline blends, including its reduction of carbon monoxide emissions by as much as 25%, the production of ethanol generates other safety concerns [5]. Ethanol and its co-products of acetic acid and acetaldehyde are hazardous substances, while other co-products, such as sugar, yeast, and carbon dioxide, are relatively harmless [5]. Please see Appendix D for a compilation of MSDSs for all of the components used in this project. The primary product of ethanol must be handled with care due to its reactivity. To avoid violent reactions, ethanol must be stored to avoid contact with reactive substances, such as oxidizing agents, strong bases, strong acids, aliphatic amines, oleum, isocyanates, ammonia, and alkali metals. Exposure to ethanol can cause severe acute and chronic health effects, including skin, eye, nose, mouth, and throat irritation, while higher exposure may result in unconsciousness. The permissible exposure limit is 1,000 ppm over an average 8 hour shift, while exposure to 3,300 ppm is immediately threatening to life. To reduce exposure, ethanol plants must have enclosed and isolated operations and use local exhaust ventilation at the site of chemical releases. Acetaldehyde, a colorless liquid with a strong fruity odor, is a highly flammable and reactive chemical which is a dangerous fire and explosion hazard. A carcinogen and teratogen to humans, acetaldehyde can irritate the nose, throat, and skin and cause severe eye burns and permanent damage in some cases. Acetaldehyde is also a volatile organic compound that has a recommended airborne exposure limit of 25 ppm. Thus, it can not be released to the environment in large quantities and exposure to the chemical must be limited. Acetic acid, also a colorless liquid with a strong vinegar-like odor, can cause irritation, burns and permanent damage to the eyes upon contact. High exposure to the liquid may cause fluid build-up in the lungs. Long term exposure may be related to bronchitis, and the legal air exposure limit is 10 ppm for 8 hour workdays. Exposure to 3,300 ppm of acetic acid is life threatening [8] [21]. Acetic acid is also considered a volatile organic compound, which means that the release of acetic acid to the environment must meet federal emissions standards. Besides the hazardous substances that are produced in the manufacturing and use of ethanol, volatile organic compounds (VOCs) such as formaldehyde, acetic acid, methanol, nitrogen oxides (NOx) and particulate matter (PM) are released by ethanol plants [9]. Emission control requirements must be considered for the disposal of these hazardous pollutants, some of which are released when fermented corn mash is dried into DDGS. The Clean Air Act (CAA), which was passed in 1970, controls the effects of air pollution [10]. This act gave the EPA the right to establish the National Ambient Air Quality Standard (NAAQS) to protect the public’s health and environment. The CAA, which applies to manufacturers, repairers, and consumers, requires major stationary sources to install pollution control equipment to satisfy emission requirements. Therefore, it is imperative to install air pollution control equipment and thermal oxidizers to reduce harmful emissions in an ethanol plant [11]. The NAAQS emission standards for all of the products are summarized in Appendix E.
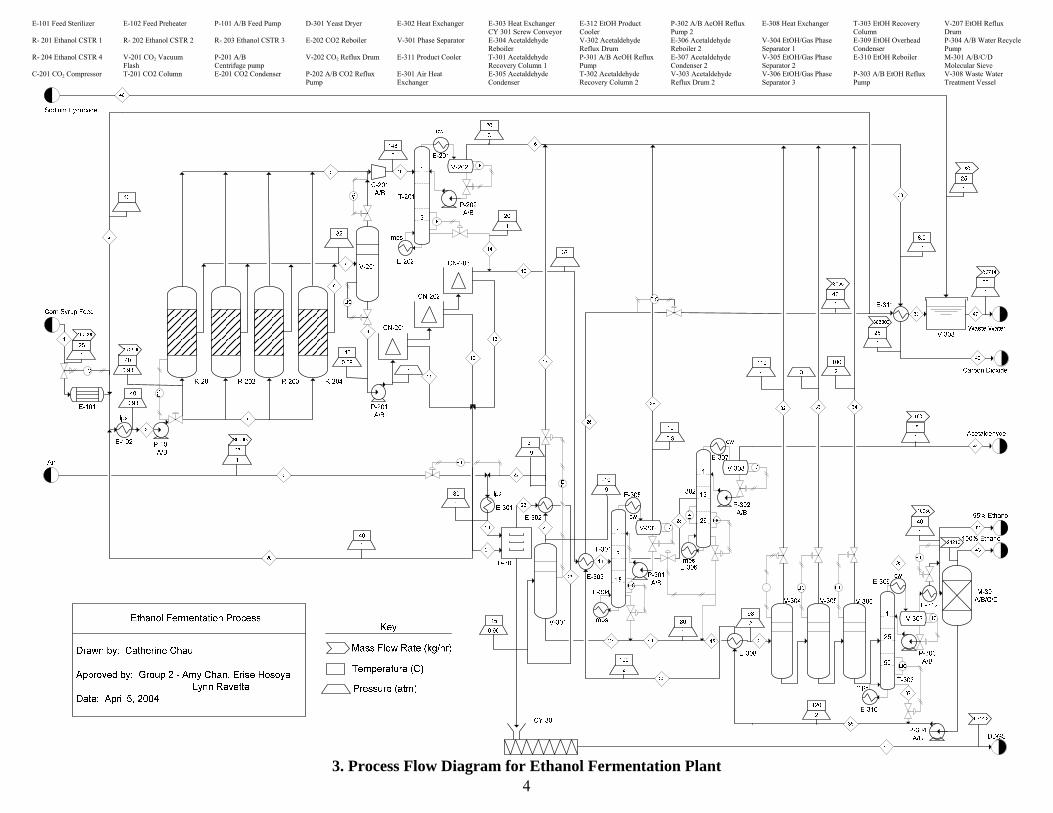
E-101 Feed Sterilizer E-102 Feed Preheater P-101 A/B Feed Pump D-301 Yeast Dryer E-302 Heat Exchanger E-303 Heat Exchanger CY 301 Screw Conveyor
E-312 EtOH Product Cooler
P-302 A/B AcOH Reflux Pump 2
E-308 Heat Exchanger T-303 EtOH Recovery Column
V-207 EtOH Reflux Drum
R- 201 Ethanol CSTR 1 R- 202 Ethanol CSTR 2 R- 203 Ethanol CSTR 3 E-202 CO2 Reboiler V-301 Phase Separator E-304 Acetaldehyde Reboiler
V-302 Acetaldehyde Reflux Drum
E-306 Acetaldehyde Reboiler 2
V-304 EtOH/Gas Phase Separator 1
E-309 EtOH Overhead Condenser
P-304 A/B Water Recycle Pump
R- 204 Ethanol CSTR 4 V-201 CO2 Vacuum Flash
P-201 A/B Centrifuge pump
V-202 CO2 Reflux Drum E-311 Product Cooler
T-301 Acetaldehyde Recovery Column 1
P-301 A/B AcOH Reflux Pump
E-307 Acetaldehyde Condenser 2
V-305 EtOH/Gas Phase Separator 2
E-310 EtOH Reboiler M-301 A/B/C/D Molecular Sieve
C-201 CO2 Compressor T-201 CO2 Column E-201 CO2 Condenser P-202 A/B CO2 Reflux Pump
E-301 Air Heat Exchanger
E-305 Acetaldehyde Condenser
T-302 Acetaldehyde Recovery Column 2
V-303 Acetaldehyde Reflux Drum 2
V-306 EtOH/Gas Phase Separator 3
P-303 A/B EtOH Reflux Pump
V-308 Waste Water Treatment Vessel
43. Process Flow Diagram for Ethanol Fermentation Plant
5
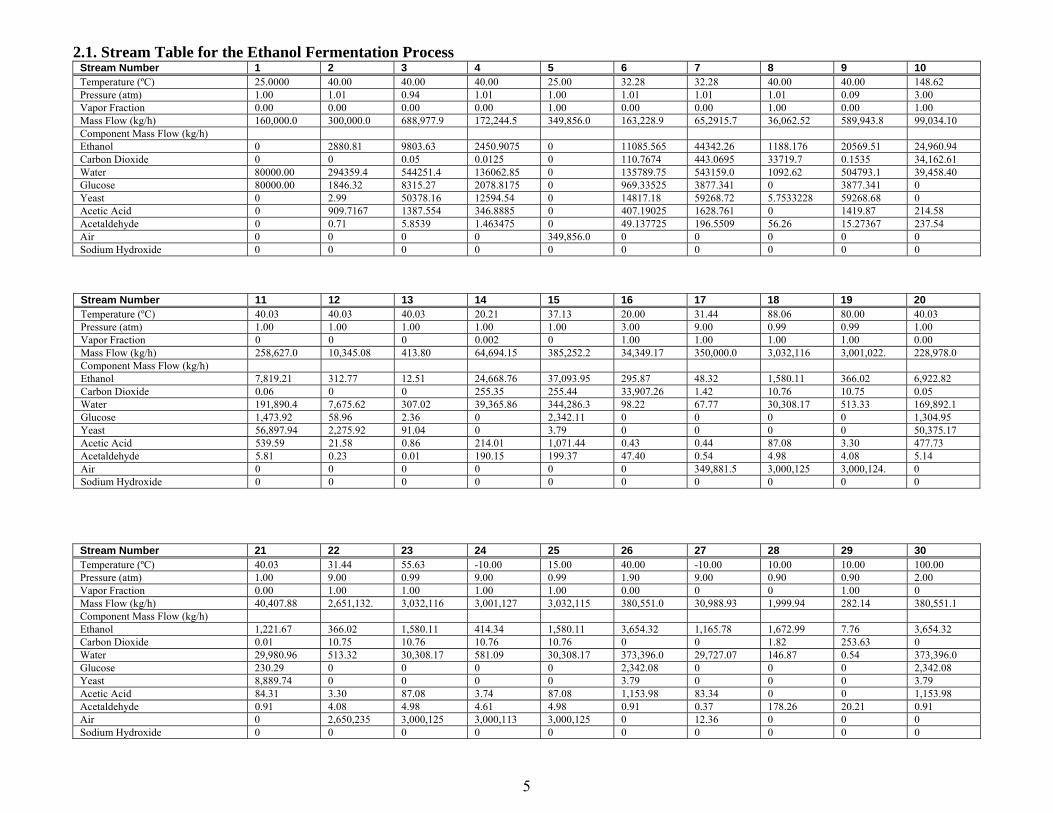
2.1. Stream Table for the Ethanol Fermentation Process Stream Number 1 2 3 4 5 6 7 8 9 10 Temperature (ºC) 25.0000 40.00 40.00 40.00 25.00 32.28 32.28 40.00 40.00 148.62 Pressure (atm) 1.00 1.01 0.94 1.01 1.00 1.01 1.01 1.01 0.09 3.00 Vapor Fraction 0.00 0.00 0.00 0.00 1.00 0.00 0.00 1.00 0.00 1.00 Mass Flow (kg/h) 160,000.0 300,000.0 688,977.9 172,244.5 349,856.0 163,228.9 65,2915.7 36,062.52 589,943.8 99,034.10 Component Mass Flow (kg/h) Ethanol 0 2880.81 9803.63 2450.9075 0 11085.565 44342.26 1188.176 20569.51 24,960.94 Carbon Dioxide 0 0 0.05 0.0125 0 110.7674 443.0695 33719.7 0.1535 34,162.61 Water 80000.00 294359.4 544251.4 136062.85 0 135789.75 543159.0 1092.62 504793.1 39,458.40 Glucose 80000.00 1846.32 8315.27 2078.8175 0 969.33525 3877.341 0 3877.341 0 Yeast 0 2.99 50378.16 12594.54 0 14817.18 59268.72 5.7533228 59268.68 0 Acetic Acid 0 909.7167 1387.554 346.8885 0 407.19025 1628.761 0 1419.87 214.58 Acetaldehyde 0 0.71 5.8539 1.463475 0 49.137725 196.5509 56.26 15.27367 237.54 Air 0 0 0 0 349,856.0 0 0 0 0 0 Sodium Hydroxide 0 0 0 0 0 0 0 0 0 0
Stream Number 11 12 13 14 15 16 17 18 19 20 Temperature (ºC) 40.03 40.03 40.03 20.21 37.13 20.00 31.44 88.06 80.00 40.03 Pressure (atm) 1.00 1.00 1.00 1.00 1.00 3.00 9.00 0.99 0.99 1.00 Vapor Fraction 0 0 0 0.002 0 1.00 1.00 1.00 1.00 0.00 Mass Flow (kg/h) 258,627.0 10,345.08 413.80 64,694.15 385,252.2 34,349.17 350,000.0 3,032,116 3,001,022. 228,978.0 Component Mass Flow (kg/h) Ethanol 7,819.21 312.77 12.51 24,668.76 37,093.95 295.87 48.32 1,580.11 366.02 6,922.82 Carbon Dioxide 0.06 0 0 255.35 255.44 33,907.26 1.42 10.76 10.75 0.05 Water 191,890.4 7,675.62 307.02 39,365.86 344,286.3 98.22 67.77 30,308.17 513.33 169,892.1 Glucose 1,473.92 58.96 2.36 0 2,342.11 0 0 0 0 1,304.95 Yeast 56,897.94 2,275.92 91.04 0 3.79 0 0 0 0 50,375.17 Acetic Acid 539.59 21.58 0.86 214.01 1,071.44 0.43 0.44 87.08 3.30 477.73 Acetaldehyde 5.81 0.23 0.01 190.15 199.37 47.40 0.54 4.98 4.08 5.14 Air 0 0 0 0 0 0 349,881.5 3,000,125 3,000,124. 0 Sodium Hydroxide 0 0 0 0 0 0 0 0 0 0
Stream Number 21 22 23 24 25 26 27 28 29 30 Temperature (ºC) 40.03 31.44 55.63 -10.00 15.00 40.00 -10.00 10.00 10.00 100.00 Pressure (atm) 1.00 9.00 0.99 9.00 0.99 1.90 9.00 0.90 0.90 2.00 Vapor Fraction 0.00 1.00 1.00 1.00 1.00 0.00 0 0 1.00 0 Mass Flow (kg/h) 40,407.88 2,651,132. 3,032,116 3,001,127 3,032,115 380,551.0 30,988.93 1,999.94 282.14 380,551.1 Component Mass Flow (kg/h) Ethanol 1,221.67 366.02 1,580.11 414.34 1,580.11 3,654.32 1,165.78 1,672.99 7.76 3,654.32 Carbon Dioxide 0.01 10.75 10.76 10.76 10.76 0 0 1.82 253.63 0 Water 29,980.96 513.32 30,308.17 581.09 30,308.17 373,396.0 29,727.07 146.87 0.54 373,396.0 Glucose 230.29 0 0 0 0 2,342.08 0 0 0 2,342.08 Yeast 8,889.74 0 0 0 0 3.79 0 0 0 3.79 Acetic Acid 84.31 3.30 87.08 3.74 87.08 1,153.98 83.34 0 0 1,153.98 Acetaldehyde 0.91 4.08 4.98 4.61 4.98 0.91 0.37 178.26 20.21 0.91 Air 0 2,650,235 3,000,125 3,000,113 3,000,125 0 12.36 0 0 0 Sodium Hydroxide 0 0 0 0 0 0 0 0 0 0
6
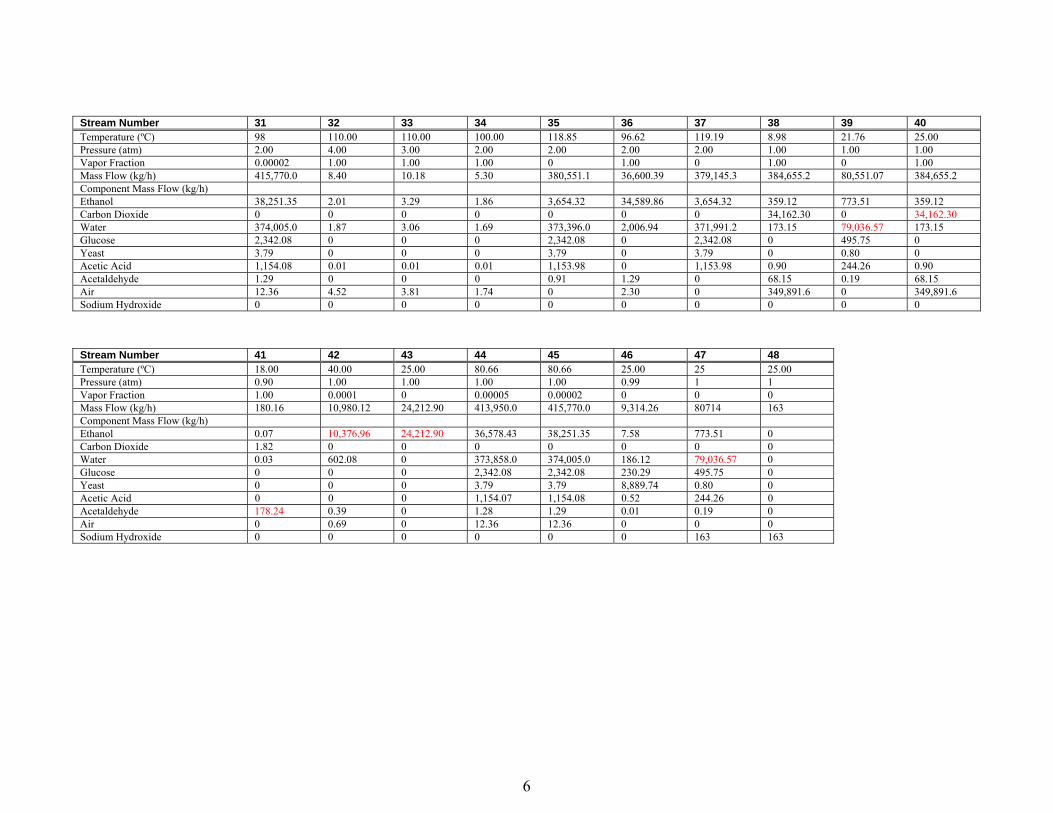
Stream Number 31 32 33 34 35 36 37 38 39 40 Temperature (ºC) 98 110.00 110.00 100.00 118.85 96.62 119.19 8.98 21.76 25.00 Pressure (atm) 2.00 4.00 3.00 2.00 2.00 2.00 2.00 1.00 1.00 1.00 Vapor Fraction 0.00002 1.00 1.00 1.00 0 1.00 0 1.00 0 1.00 Mass Flow (kg/h) 415,770.0 8.40 10.18 5.30 380,551.1 36,600.39 379,145.3 384,655.2 80,551.07 384,655.2 Component Mass Flow (kg/h) Ethanol 38,251.35 2.01 3.29 1.86 3,654.32 34,589.86 3,654.32 359.12 773.51 359.12 Carbon Dioxide 0 0 0 0 0 0 0 34,162.30 0 34,162.30 Water 374,005.0 1.87 3.06 1.69 373,396.0 2,006.94 371,991.2 173.15 79,036.57 173.15 Glucose 2,342.08 0 0 0 2,342.08 0 2,342.08 0 495.75 0 Yeast 3.79 0 0 0 3.79 0 3.79 0 0.80 0 Acetic Acid 1,154.08 0.01 0.01 0.01 1,153.98 0 1,153.98 0.90 244.26 0.90
68.15 Acetaldehyde 1.29 0 0 0 0.91 1.29 0 68.15 0.19 349,891.6 Air 12.36 4.52 3.81 1.74 0 2.30 0 349,891.6 0 0 Sodium Hydroxide 0 0 0 0 0 0 0 0 0
Stream Number 41 42 43 44 45 46 47 48 Temperature (ºC) 18.00 40.00 25.00 80.66 80.66 25.00 25 25.00 Pressure (atm) 0.90 1.00 1.00 1.00 1.00 0.99 1 1 Vapor Fraction 1.00 0.0001 0 0.00005 0.00002 0 0 0 Mass Flow (kg/h) 180.16 10,980.12 24,212.90 413,950.0 415,770.0 9,314.26 80714 163
Component Mass Flow (kg/h) Ethanol 0.07 10,376.96 24,212.90 36,578.43 38,251.35 7.58 773.51 0 Carbon Dioxide 1.82 0 0 0 0 0 0 0 Water 0.03 602.08 0 373,858.0 374,005.0 186.12 79,036.57 0 Glucose 0 0 0 2,342.08 2,342.08 230.29 495.75 0
Yeast 0 0 0 3.79 3.79 8,889.74 0.80 0 Acetic Acid 0 0 0 1,154.07 1,154.08 0.52 244.26 0 Acetaldehyde 178.24 0.39 0 1.28 1.29 0.01 0.19 0
Air 0 0.69 0 12.36 12.36 0 0 0 Sodium Hydroxide 0 0 0 0 0 0 163 163

4. Process Description 4.1. Pre-Feed Section Corn syrup feed consisting of 50 wt. % glucose and 50 wt. % water enters the ethanol production process through Stream 1 at a temperature of 25º C and 1 atm. Stream 1 is sterilized with the feed sterilizer, E-101, before it is combined with the water recycle stream from the recovery section, Stream 2, and the yeast cream recycle, Stream 20. The combined streams, Stream 3, are heated to 40º C using heat exchanger E-102 and pumped using P-101 A/B to 1 atm before entering the reactor section. 4.2. Reactor Section The water, corn syrup, and yeast enter the reactor section 200 through Stream 4 at 40 º C and 1 atm. Stream 4 is divided into four equal streams for fermentation in four equally-sized, parallel CSTRs, R-201, R-202, R-203, and R-204, operating at a conversion of 99%. The total volume for the 4 reactors is 426,800 L and the total reactor productivity is 80.92 g/L⋅hr. Carbon dioxide and small amounts of ethanol, water and acetaldehyde vapor is continuously removed from the reactors and combined in Stream 8. The reactor effluents from the four reactors are combined to form Stream 7, which consists of water, ethanol, glucose, acetaldehyde, yeast, acetic acid, and carbon dioxide. Stream 7 is directed to a vacuum flash, V-201, which operates at 0.09 atm and 40º C, to further remove the carbon dioxide from the effluent mixture. The vapor stream from V-201 combines with Stream 8 (vapor from the reactors) and is compressed using C-201 A/B. The resulting vapor stream, Stream 10, is at 148º C and 3 atm. The bottoms stream exits V-201 through Stream 9 and is pumped to 1 atm using pump P-201 A/B. Stream 9 is then sent through three centrifuges in series, CN-201, CN-202, and CN-203, to separate the yeast cream from the supernatant. 4.3. Recovery Section 4.3.1. Purification of Reactor Off-Gas The gaseous products from the reactors enter the first stage of the distillation column, T-201, as Stream 10 at 148ºC and 3 atm. The CO2 column, T-201, contains 5 sieve trays and operates at approximately 3 atm. Like all of the distillation towers in the process, T-201 is associated with a reboiler E-202, a condenser E-201 that uses cold water, a reflux drum V-201, and a pump P-202A/B. Furthermore, level indicator controls, LIC, are used for all towers and reflux drums to ensure the safe operation of the tower. The distillate exits the tower through Stream 16 at 20º C and 3 atm. Stream 16 combines with the gaseous products from other purification units before it is heated in E-311 to 25ºC and 1 atm as Stream 40. This discharge stream of 385,000 kg/h has trace impurities that are within EPA guidelines. The bottoms product exits T-201 at 20ºC and 1 atm as Stream 14, which combines with the supernatant from the centrifuges of the reactor section to form Stream 15, which enters the acetaldehyde recovery portion of the process. 4.3.2. Production of DDGs The DDGs was produced from the yeast cream recovered by the three centrifuges in the reactor section of the process. The 22 wt% yeast cream is combined and divided into Streams 20 and 21. Stream 20 is recycled, while Stream 21 is fed into the spray dryer, D-301, which operates using the air of Stream 19. Stream 19 combines fresh air, or Stream 5, which enters at 1 atm and 25ºC, with recycled air from the dryer process, or Stream 22, which is at 9 atm and 30ºC. Prior to entering the dryer, the combined stream is heated using heat exchanger, E-301. Stream 23 is the dryer exit gas that is used in a heat exchanger, E-302, to preheat the recycled air recovered by a
7
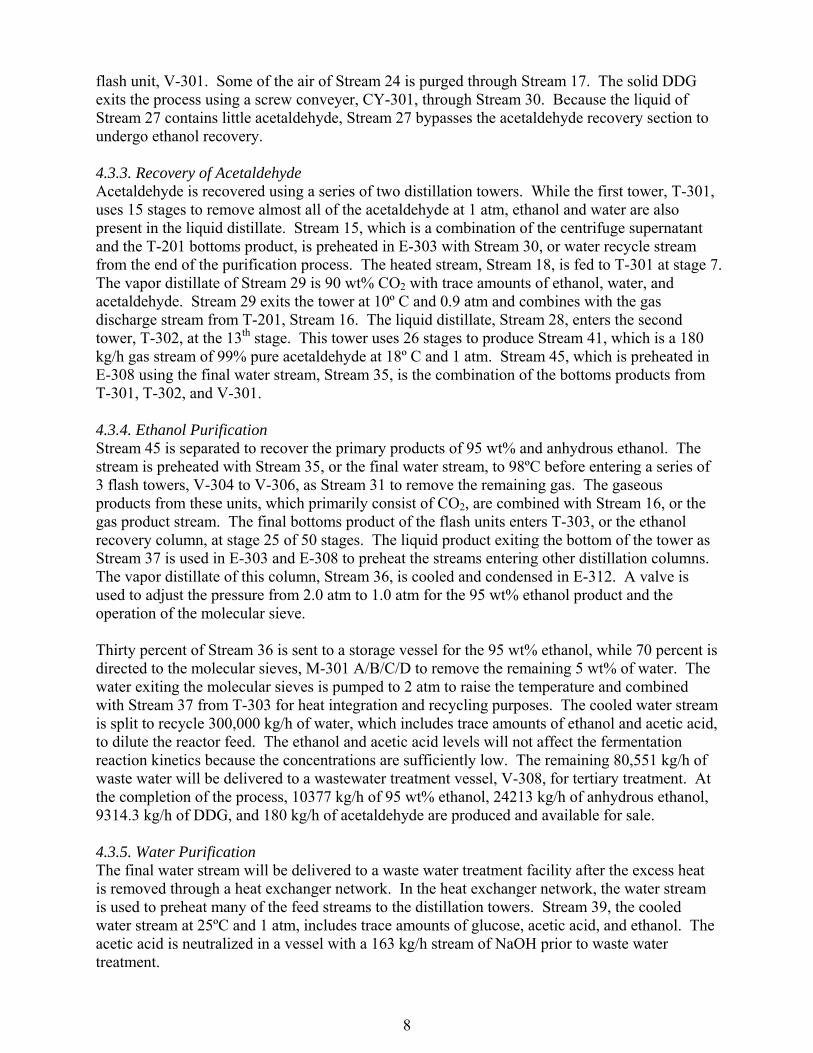
flash unit, V-301. Some of the air of Stream 24 is purged through Stream 17. The solid DDG exits the process using a screw conveyer, CY-301, through Stream 30. Because the liquid of Stream 27 contains little acetaldehyde, Stream 27 bypasses the acetaldehyde recovery section to undergo ethanol recovery. 4.3.3. Recovery of Acetaldehyde Acetaldehyde is recovered using a series of two distillation towers. While the first tower, T-301, uses 15 stages to remove almost all of the acetaldehyde at 1 atm, ethanol and water are also present in the liquid distillate. Stream 15, which is a combination of the centrifuge supernatant and the T-201 bottoms product, is preheated in E-303 with Stream 30, or water recycle stream from the end of the purification process. The heated stream, Stream 18, is fed to T-301 at stage 7. The vapor distillate of Stream 29 is 90 wt% CO2 with trace amounts of ethanol, water, and acetaldehyde. Stream 29 exits the tower at 10º C and 0.9 atm and combines with the gas discharge stream from T-201, Stream 16. The liquid distillate, Stream 28, enters the second tower, T-302, at the 13th stage. This tower uses 26 stages to produce Stream 41, which is a 180 kg/h gas stream of 99% pure acetaldehyde at 18º C and 1 atm. Stream 45, which is preheated in E-308 using the final water stream, Stream 35, is the combination of the bottoms products from T-301, T-302, and V-301. 4.3.4. Ethanol Purification Stream 45 is separated to recover the primary products of 95 wt% and anhydrous ethanol. The stream is preheated with Stream 35, or the final water stream, to 98ºC before entering a series of 3 flash towers, V-304 to V-306, as Stream 31 to remove the remaining gas. The gaseous products from these units, which primarily consist of CO2, are combined with Stream 16, or the gas product stream. The final bottoms product of the flash units enters T-303, or the ethanol recovery column, at stage 25 of 50 stages. The liquid product exiting the bottom of the tower as Stream 37 is used in E-303 and E-308 to preheat the streams entering other distillation columns. The vapor distillate of this column, Stream 36, is cooled and condensed in E-312. A valve is used to adjust the pressure from 2.0 atm to 1.0 atm for the 95 wt% ethanol product and the operation of the molecular sieve. Thirty percent of Stream 36 is sent to a storage vessel for the 95 wt% ethanol, while 70 percent is directed to the molecular sieves, M-301 A/B/C/D to remove the remaining 5 wt% of water. The water exiting the molecular sieves is pumped to 2 atm to raise the temperature and combined with Stream 37 from T-303 for heat integration and recycling purposes. The cooled water stream is split to recycle 300,000 kg/h of water, which includes trace amounts of ethanol and acetic acid, to dilute the reactor feed. The ethanol and acetic acid levels will not affect the fermentation reaction kinetics because the concentrations are sufficiently low. The remaining 80,551 kg/h of waste water will be delivered to a wastewater treatment vessel, V-308, for tertiary treatment. At the completion of the process, 10377 kg/h of 95 wt% ethanol, 24213 kg/h of anhydrous ethanol, 9314.3 kg/h of DDG, and 180 kg/h of acetaldehyde are produced and available for sale. 4.3.5. Water Purification The final water stream will be delivered to a waste water treatment facility after the excess heat is removed through a heat exchanger network. In the heat exchanger network, the water stream is used to preheat many of the feed streams to the distillation towers. Stream 39, the cooled water stream at 25ºC and 1 atm, includes trace amounts of glucose, acetic acid, and ethanol. The acetic acid is neutralized in a vessel with a 163 kg/h stream of NaOH prior to waste water treatment.
8
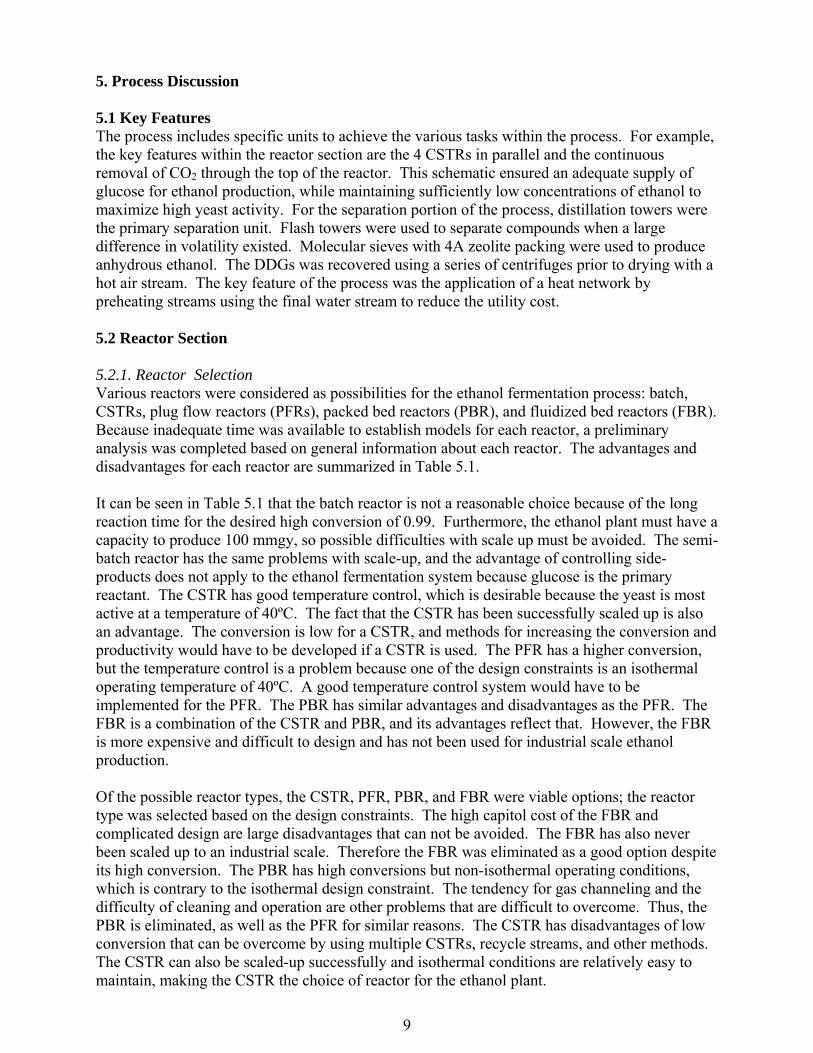
5. Process Discussion 5.1 Key Features The process includes specific units to achieve the various tasks within the process. For example, the key features within the reactor section are the 4 CSTRs in parallel and the continuous removal of CO2 through the top of the reactor. This schematic ensured an adequate supply of glucose for ethanol production, while maintaining sufficiently low concentrations of ethanol to maximize high yeast activity. For the separation portion of the process, distillation towers were the primary separation unit. Flash towers were used to separate compounds when a large difference in volatility existed. Molecular sieves with 4A zeolite packing were used to produce anhydrous ethanol. The DDGs was recovered using a series of centrifuges prior to drying with a hot air stream. The key feature of the process was the application of a heat network by preheating streams using the final water stream to reduce the utility cost. 5.2 Reactor Section 5.2.1. Reactor Selection Various reactors were considered as possibilities for the ethanol fermentation process: batch, CSTRs, plug flow reactors (PFRs), packed bed reactors (PBR), and fluidized bed reactors (FBR). Because inadequate time was available to establish models for each reactor, a preliminary analysis was completed based on general information about each reactor. The advantages and disadvantages for each reactor are summarized in Table 5.1. It can be seen in Table 5.1 that the batch reactor is not a reasonable choice because of the long reaction time for the desired high conversion of 0.99. Furthermore, the ethanol plant must have a capacity to produce 100 mmgy, so possible difficulties with scale up must be avoided. The semi-batch reactor has the same problems with scale-up, and the advantage of controlling side-products does not apply to the ethanol fermentation system because glucose is the primary reactant. The CSTR has good temperature control, which is desirable because the yeast is most active at a temperature of 40ºC. The fact that the CSTR has been successfully scaled up is also an advantage. The conversion is low for a CSTR, and methods for increasing the conversion and productivity would have to be developed if a CSTR is used. The PFR has a higher conversion, but the temperature control is a problem because one of the design constraints is an isothermal operating temperature of 40ºC. A good temperature control system would have to be implemented for the PFR. The PBR has similar advantages and disadvantages as the PFR. The FBR is a combination of the CSTR and PBR, and its advantages reflect that. However, the FBR is more expensive and difficult to design and has not been used for industrial scale ethanol production. Of the possible reactor types, the CSTR, PFR, PBR, and FBR were viable options; the reactor type was selected based on the design constraints. The high capitol cost of the FBR and complicated design are large disadvantages that can not be avoided. The FBR has also never been scaled up to an industrial scale. Therefore the FBR was eliminated as a good option despite its high conversion. The PBR has high conversions but non-isothermal operating conditions, which is contrary to the isothermal design constraint. The tendency for gas channeling and the difficulty of cleaning and operation are other problems that are difficult to overcome. Thus, the PBR is eliminated, as well as the PFR for similar reasons. The CSTR has disadvantages of low conversion that can be overcome by using multiple CSTRs, recycle streams, and other methods. The CSTR can also be scaled-up successfully and isothermal conditions are relatively easy to maintain, making the CSTR the choice of reactor for the ethanol plant.
9
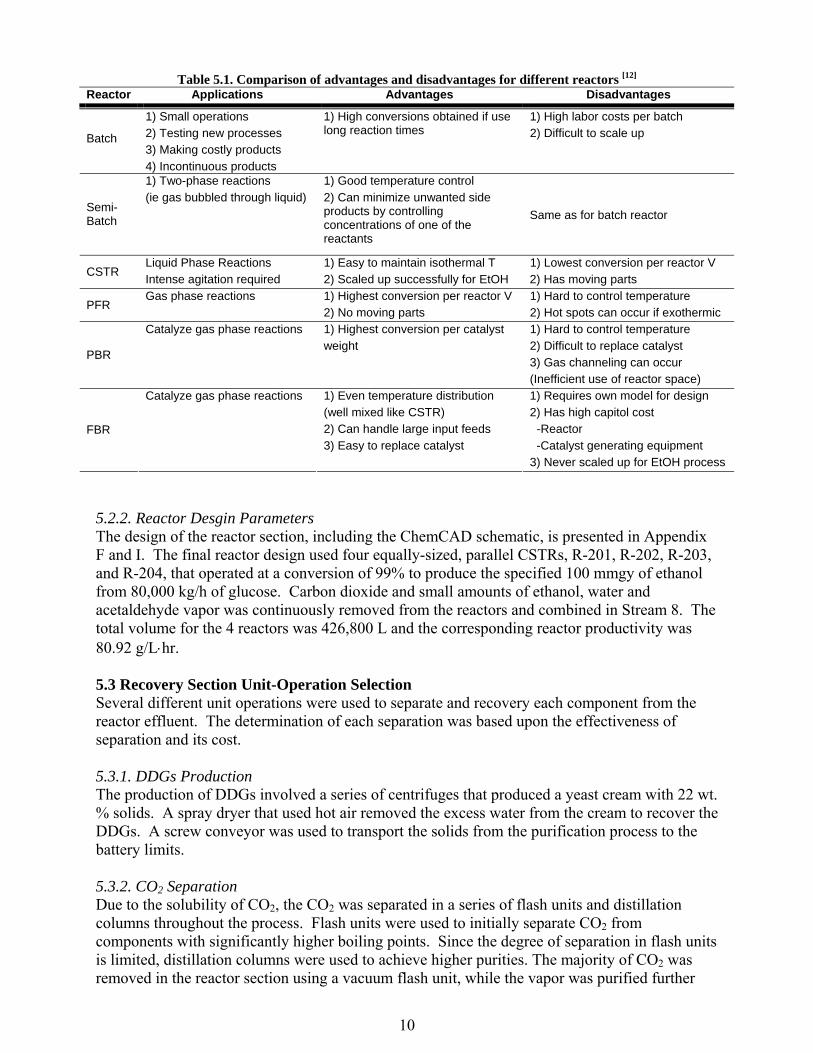
Table 5.1. Comparison of advantages and disadvantages for different reactors [12]
Reactor Applications Advantages Disadvantages
1) Small operations 1) High labor costs per batch 2) Testing new processes 2) Difficult to scale up 3) Making costly products
Batch
4) Incontinuous products
1) High conversions obtained if use long reaction times
1) Two-phase reactions 1) Good temperature control (ie gas bubbled through liquid) Same as for batch reactor
Semi-Batch
2) Can minimize unwanted side products by controlling concentrations of one of the reactants
Liquid Phase Reactions 1) Easy to maintain isothermal T 1) Lowest conversion per reactor V
CSTR Intense agitation required 2) Scaled up successfully for EtOH 2) Has moving parts Gas phase reactions 1) Highest conversion per reactor V 1) Hard to control temperature
PFR 2) No moving parts 2) Hot spots can occur if exothermic Catalyze gas phase reactions 1) Highest conversion per catalyst 1) Hard to control temperature weight 2) Difficult to replace catalyst PBR
3) Gas channeling can occur (Inefficient use of reactor space)
Catalyze gas phase reactions 1) Even temperature distribution 1) Requires own model for design (well mixed like CSTR) 2) Has high capitol cost 2) Can handle large input feeds -Reactor 3) Easy to replace catalyst
FBR
-Catalyst generating equipment 3) Never scaled up for EtOH process
5.2.2. Reactor Desgin Parameters The design of the reactor section, including the ChemCAD schematic, is presented in Appendix F and I. The final reactor design used four equally-sized, parallel CSTRs, R-201, R-202, R-203, and R-204, that operated at a conversion of 99% to produce the specified 100 mmgy of ethanol from 80,000 kg/h of glucose. Carbon dioxide and small amounts of ethanol, water and acetaldehyde vapor was continuously removed from the reactors and combined in Stream 8. The total volume for the 4 reactors was 426,800 L and the corresponding reactor productivity was 80.92 g/L⋅hr. 5.3 Recovery Section Unit-Operation Selection Several different unit operations were used to separate and recovery each component from the reactor effluent. The determination of each separation was based upon the effectiveness of separation and its cost. 5.3.1. DDGs Production The production of DDGs involved a series of centrifuges that produced a yeast cream with 22 wt. % solids. A spray dryer that used hot air removed the excess water from the cream to recover the DDGs. A screw conveyor was used to transport the solids from the purification process to the battery limits.
5.3.2. CO2 Separation Due to the solubility of CO2, the CO2 was separated in a series of flash units and distillation columns throughout the process. Flash units were used to initially separate CO2 from components with significantly higher boiling points. Since the degree of separation in flash units is limited, distillation columns were used to achieve higher purities. The majority of CO2 was removed in the reactor section using a vacuum flash unit, while the vapor was purified further
10
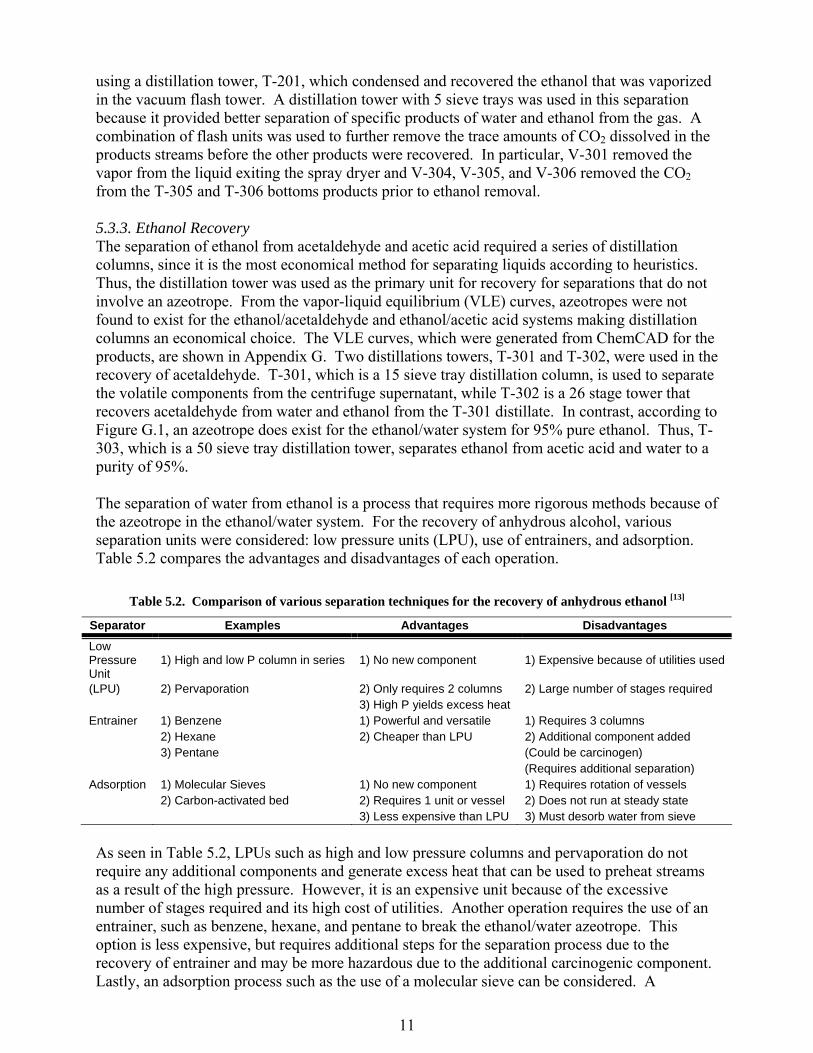
using a distillation tower, T-201, which condensed and recovered the ethanol that was vaporized in the vacuum flash tower. A distillation tower with 5 sieve trays was used in this separation because it provided better separation of specific products of water and ethanol from the gas. A combination of flash units was used to further remove the trace amounts of CO2 dissolved in the products streams before the other products were recovered. In particular, V-301 removed the vapor from the liquid exiting the spray dryer and V-304, V-305, and V-306 removed the CO2 from the T-305 and T-306 bottoms products prior to ethanol removal. 5.3.3. Ethanol Recovery The separation of ethanol from acetaldehyde and acetic acid required a series of distillation columns, since it is the most economical method for separating liquids according to heuristics. Thus, the distillation tower was used as the primary unit for recovery for separations that do not involve an azeotrope. From the vapor-liquid equilibrium (VLE) curves, azeotropes were not found to exist for the ethanol/acetaldehyde and ethanol/acetic acid systems making distillation columns an economical choice. The VLE curves, which were generated from ChemCAD for the products, are shown in Appendix G. Two distillations towers, T-301 and T-302, were used in the recovery of acetaldehyde. T-301, which is a 15 sieve tray distillation column, is used to separate the volatile components from the centrifuge supernatant, while T-302 is a 26 stage tower that recovers acetaldehyde from water and ethanol from the T-301 distillate. In contrast, according to Figure G.1, an azeotrope does exist for the ethanol/water system for 95% pure ethanol. Thus, T-303, which is a 50 sieve tray distillation tower, separates ethanol from acetic acid and water to a purity of 95%. The separation of water from ethanol is a process that requires more rigorous methods because of the azeotrope in the ethanol/water system. For the recovery of anhydrous alcohol, various separation units were considered: low pressure units (LPU), use of entrainers, and adsorption. Table 5.2 compares the advantages and disadvantages of each operation.
Table 5.2. Comparison of various separation techniques for the recovery of anhydrous ethanol [13]
Separator Examples Advantages Disadvantages
Low Pressure Unit
1) High and low P column in series 1) No new component 1) Expensive because of utilities used
(LPU) 2) Pervaporation 2) Only requires 2 columns 2) Large number of stages required 3) High P yields excess heat Entrainer 1) Benzene 1) Powerful and versatile 1) Requires 3 columns 2) Hexane 2) Cheaper than LPU 2) Additional component added 3) Pentane (Could be carcinogen) (Requires additional separation) Adsorption 1) Molecular Sieves 1) No new component 1) Requires rotation of vessels 2) Carbon-activated bed 2) Requires 1 unit or vessel 2) Does not run at steady state 3) Less expensive than LPU 3) Must desorb water from sieve As seen in Table 5.2, LPUs such as high and low pressure columns and pervaporation do not require any additional components and generate excess heat that can be used to preheat streams as a result of the high pressure. However, it is an expensive unit because of the excessive number of stages required and its high cost of utilities. Another operation requires the use of an entrainer, such as benzene, hexane, and pentane to break the ethanol/water azeotrope. This option is less expensive, but requires additional steps for the separation process due to the recovery of entrainer and may be more hazardous due to the additional carcinogenic component. Lastly, an adsorption process such as the use of a molecular sieve can be considered. A
11
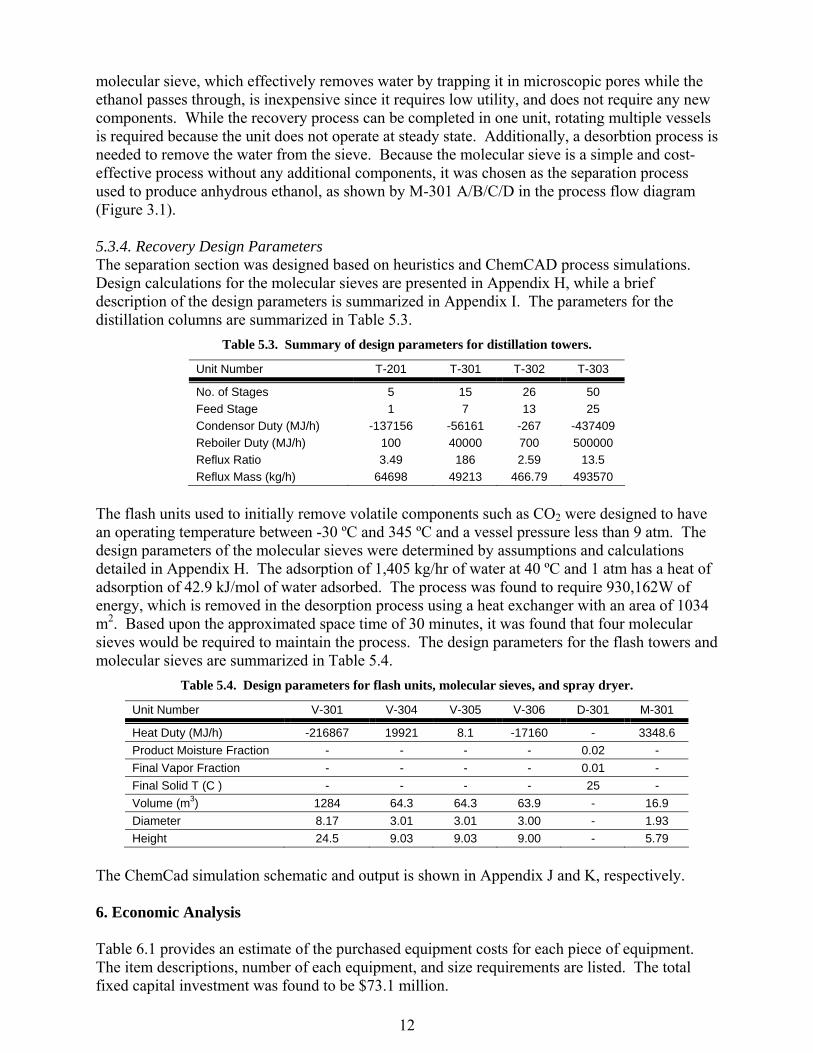
molecular sieve, which effectively removes water by trapping it in microscopic pores while the ethanol passes through, is inexpensive since it requires low utility, and does not require any new components. While the recovery process can be completed in one unit, rotating multiple vessels is required because the unit does not operate at steady state. Additionally, a desorbtion process is needed to remove the water from the sieve. Because the molecular sieve is a simple and cost-effective process without any additional components, it was chosen as the separation process used to produce anhydrous ethanol, as shown by M-301 A/B/C/D in the process flow diagram (Figure 3.1). 5.3.4. Recovery Design Parameters The separation section was designed based on heuristics and ChemCAD process simulations. Design calculations for the molecular sieves are presented in Appendix H, while a brief description of the design parameters is summarized in Appendix I. The parameters for the distillation columns are summarized in Table 5.3.
Table 5.3. Summary of design parameters for distillation towers.
Unit Number T-201 T-301 T-302 T-303
No. of Stages 5 15 26 50 Feed Stage 1 7 13 25 Condensor Duty (MJ/h) -137156 -56161 -267 -437409 Reboiler Duty (MJ/h) 100 40000 700 500000 Reflux Ratio 3.49 186 2.59 13.5 Reflux Mass (kg/h) 64698 49213 466.79 493570
The flash units used to initially remove volatile components such as CO2 were designed to have an operating temperature between -30 ºC and 345 ºC and a vessel pressure less than 9 atm. The design parameters of the molecular sieves were determined by assumptions and calculations detailed in Appendix H. The adsorption of 1,405 kg/hr of water at 40 ºC and 1 atm has a heat of adsorption of 42.9 kJ/mol of water adsorbed. The process was found to require 930,162W of energy, which is removed in the desorption process using a heat exchanger with an area of 1034 m2. Based upon the approximated space time of 30 minutes, it was found that four molecular sieves would be required to maintain the process. The design parameters for the flash towers and molecular sieves are summarized in Table 5.4.
Table 5.4. Design parameters for flash units, molecular sieves, and spray dryer.
Unit Number V-301 V-304 V-305 V-306 D-301 M-301
Heat Duty (MJ/h) -216867 19921 8.1 -17160 - 3348.6 Product Moisture Fraction - - - - 0.02 - Final Vapor Fraction - - - - 0.01 - Final Solid T (C ) - - - - 25 - Volume (m3) 1284 64.3 64.3 63.9 - 16.9 Diameter 8.17 3.01 3.01 3.00 - 1.93 Height 24.5 9.03 9.03 9.00 - 5.79
The ChemCad simulation schematic and output is shown in Appendix J and K, respectively. 6. Economic Analysis Table 6.1 provides an estimate of the purchased equipment costs for each piece of equipment. The item descriptions, number of each equipment, and size requirements are listed. The total fixed capital investment was found to be $73.1 million.
12
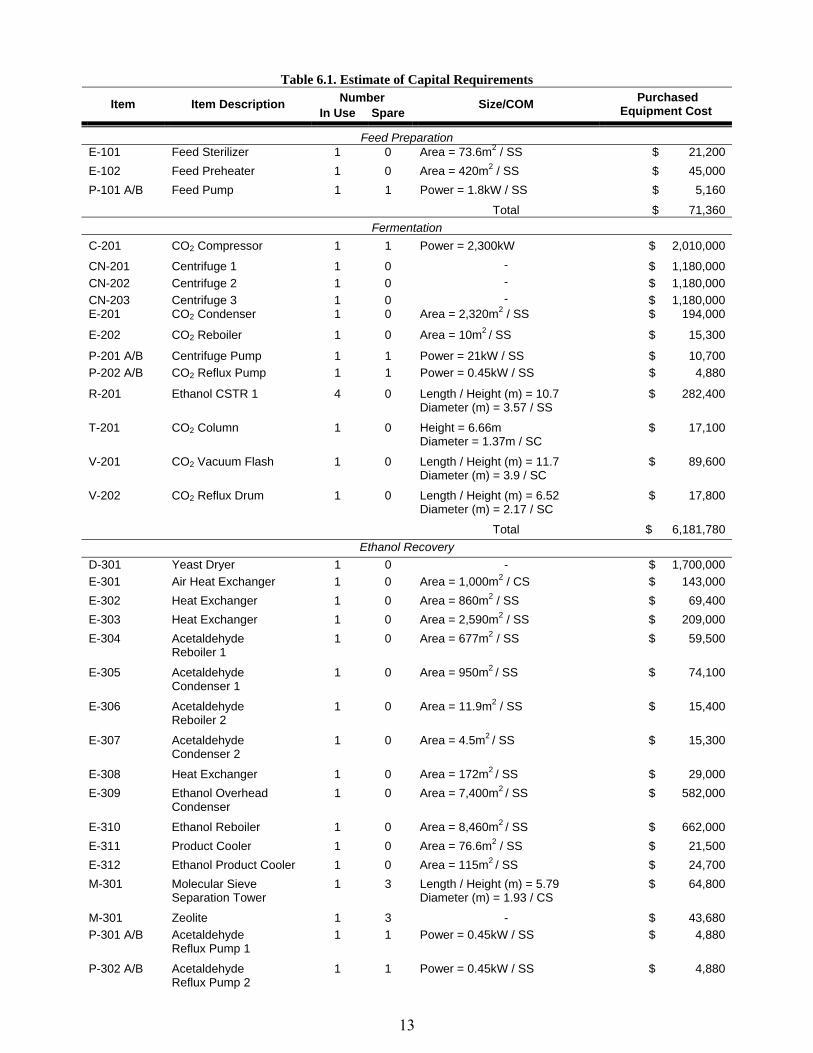
Table 6.1. Estimate of Capital Requirements Number Item Item Description
In Use Spare Size/COM Purchased
Equipment Cost
Feed Preparation E-101 Feed Sterilizer 1 0 Area = 73.6m2 / SS $ 21,200 E-102 Feed Preheater 1 0 Area = 420m2 / SS $ 45,000 P-101 A/B Feed Pump 1 1 Power = 1.8kW / SS $ 5,160
Total $ 71,360 Fermentation
C-201 CO2 Compressor 1 1 Power = 2,300kW $ 2,010,000
CN-201 Centrifuge 1 1 0 - $ 1,180,000 CN-202 Centrifuge 2 1 0 - $ 1,180,000 CN-203 Centrifuge 3 1 0 - $ 1,180,000 E-201 CO2 Condenser 1 0 Area = 2,320m2 / SS $ 194,000
E-202 CO2 Reboiler 1 0 Area = 10m2 / SS $ 15,300
P-201 A/B Centrifuge Pump 1 1 Power = 21kW / SS $ 10,700 P-202 A/B CO2 Reflux Pump 1 1 Power = 0.45kW / SS $ 4,880
R-201 Ethanol CSTR 1 4 0 Length / Height (m) = 10.7 Diameter (m) = 3.57 / SS
$ 282,400
T-201 CO2 Column 1 0 Height = 6.66m Diameter = 1.37m / SC
$ 17,100
V-201 CO2 Vacuum Flash 1 0 Length / Height (m) = 11.7 Diameter (m) = 3.9 / SC
$ 89,600
V-202 CO2 Reflux Drum 1 0 Length / Height (m) = 6.52 Diameter (m) = 2.17 / SC
$ 17,800
Total $ 6,181,780 Ethanol Recovery
D-301 Yeast Dryer 1 0 - $ 1,700,000 E-301 Air Heat Exchanger 1 0 Area = 1,000m2 / CS $ 143,000 E-302 Heat Exchanger 1 0 Area = 860m2 / SS $ 69,400 E-303 Heat Exchanger 1 0 Area = 2,590m2 / SS $ 209,000 E-304 Acetaldehyde
Reboiler 1 1 0 Area = 677m2 / SS $ 59,500
E-305 Acetaldehyde Condenser 1
1 0 Area = 950m2 / SS $ 74,100
E-306 Acetaldehyde Reboiler 2
1 0 Area = 11.9m2 / SS $ 15,400
E-307 Acetaldehyde Condenser 2
1 0 Area = 4.5m2 / SS $ 15,300
E-308 Heat Exchanger 1 0 Area = 172m2 / SS $ 29,000 E-309 Ethanol Overhead
Condenser 1 0 Area = 7,400m2 / SS $ 582,000
E-310 Ethanol Reboiler 1 0 Area = 8,460m2 / SS $ 662,000 E-311 Product Cooler 1 0 Area = 76.6m2 / SS $ 21,500 E-312 Ethanol Product Cooler 1 0 Area = 115m2 / SS $ 24,700 M-301 Molecular Sieve
Separation Tower 1 3 Length / Height (m) = 5.79
Diameter (m) = 1.93 / CS $ 64,800
M-301 Zeolite 1 3 - $ 43,680 P-301 A/B Acetaldehyde
Reflux Pump 1 1 1 Power = 0.45kW / SS $ 4,880
P-302 A/B Acetaldehyde Reflux Pump 2
1 1 Power = 0.45kW / SS $ 4,880
13
Purchased Equipment Cost
Number Item Item Description In Use Spare
Size/COM
P-303 A/B Ethanol Reflux Pump
1 1 Power = 0.45kW / SS $ 4,880
P-304 A/B Water Recycle Pump 1 1 Power = 0.047kW / SS $ 4,880 T-301 Acetaldehyde
Recovery Column 1 1 0 Height = 6.11m
Diameter = 1.37m / SC $ 28,500
T-302 Acetaldehyde Recovery Column 2
1 0 Height = 2.19m Diameter = 0.457m / SC
$ 22,100
T-303 Ethanol Recovery Column
1 0 Height = 13.6m Diameter = 2.9m / SC
$ 272,000
V-301 Phase Separator 1 0 Length / Height (m) = 24.5 Diameter (m) = 8.17 / SC
$ 793,000
V-302 Acetaldehyde Reflux Drum 1
1 0 Length / Height (m) = 9.58 Diameter (m) = 3.19 / SC
$ 38,700
V-303 Acetaldehyde Reflux Drum 2
1 0 Length / Height (m) = 1.04 Diameter (m) = 0.4 / SC
$ 1,960
V-304 Ethanol/Gas Phase Separator 1
1 0 Length / Height (m) = 9.03 Diameter (m) = 3.01 / SC
$ 45,500
V-305 Ethanol/Gas Phase Separator 2
1 0 Length / Height (m) = 9.03 Diameter (m) = 3.01 / SC
$ 45,500
V-306 Ethanol/Gas Phase Separator 3
1 0 Length / Height (m) = 9 Diameter (m) = 3 / SC
$ 45,100
V-307 Ethanol Reflux Drum 1 0 Length / Height (m) = 10.5 Diameter (m) = 3.51 / CS
$ 47,500
V-308 A/B Waste Water Treatment Vessel 1
2 0 Volume = 28,900m3 $ 1,794,000
Total $ 6,866,760 Storage
CY-301 Screw Conveyor for Yeast Delivery
1 0 Power = 0.40hp Length = 100ft
$ 8,000
V-401 A/B/C Glucose Storage Vessel 3 0 Volume = 22,600m3 $ 2,172,000 V402- A/B/C Acetaldehyde
Storage Vessel 1 3 0 Volume = 22,000m3 $ 2,118,000
V-403 95% Ethanol Storage Vessel
1 0 Volume = 9,820m3 $ 518,000
V-404 Anhydrous Ethanol Storage Vessel
1 0 Volume = 21,900m3 $ 908,000
V-405 DDG Storage Vessel 1 0 Volume = 4,970m3 $ 226,000
V-406 NaOH Storage Vessel 1 0 Volume = 90m3 $ 46,000 Total $ 5,996,000
Total Purchased Equipment Cost $ 19,115,900
Fixed Capital Investment (Purchase Cost X 4) $ 73,100,000
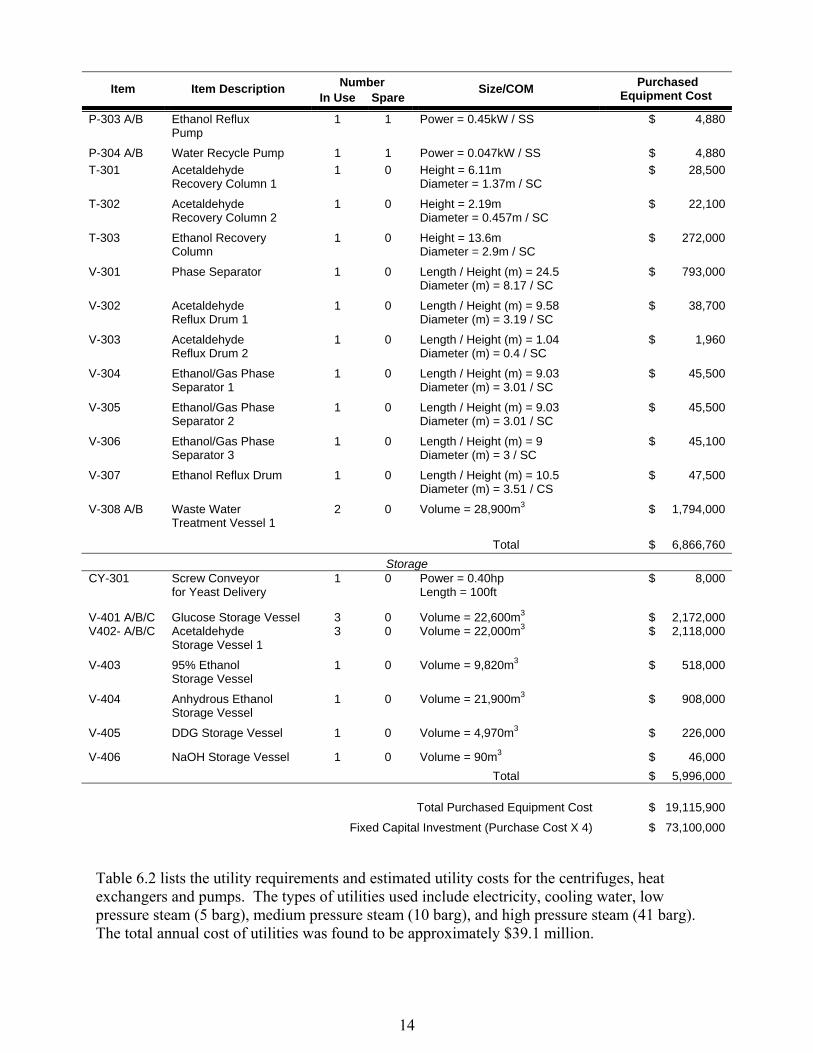
Table 6.2 lists the utility requirements and estimated utility costs for the centrifuges, heat exchangers and pumps. The types of utilities used include electricity, cooling water, low pressure steam (5 barg), medium pressure steam (10 barg), and high pressure steam (41 barg). The total annual cost of utilities was found to be approximately $39.1 million.
14
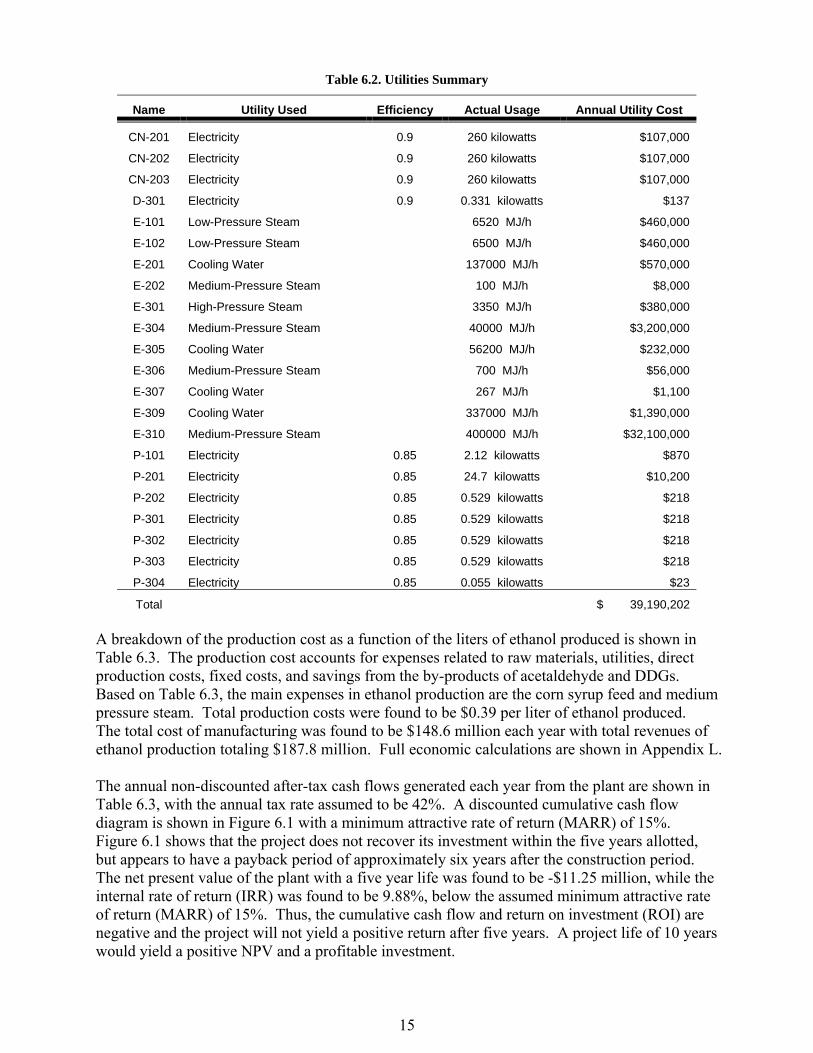
Table 6.2. Utilities Summary
Name Utility Used Efficiency Actual Usage Annual Utility Cost
CN-201 Electricity 0.9 260 kilowatts $107,000
CN-202 Electricity 0.9 260 kilowatts $107,000
CN-203 Electricity 0.9 260 kilowatts $107,000
D-301 Electricity 0.9 0.331 kilowatts $137
E-101 Low-Pressure Steam 6520 MJ/h $460,000
E-102 Low-Pressure Steam 6500 MJ/h $460,000
E-201 Cooling Water 137000 MJ/h $570,000
E-202 Medium-Pressure Steam 100 MJ/h $8,000
E-301 High-Pressure Steam 3350 MJ/h $380,000
E-304 Medium-Pressure Steam 40000 MJ/h $3,200,000
E-305 Cooling Water 56200 MJ/h $232,000
E-306 Medium-Pressure Steam 700 MJ/h $56,000
E-307 Cooling Water 267 MJ/h $1,100
E-309 Cooling Water 337000 MJ/h $1,390,000
E-310 Medium-Pressure Steam 400000 MJ/h $32,100,000
P-101 Electricity 0.85 2.12 kilowatts $870
P-201 Electricity 0.85 24.7 kilowatts $10,200
P-202 Electricity 0.85 0.529 kilowatts $218
P-301 Electricity 0.85 0.529 kilowatts $218
P-302 Electricity 0.85 0.529 kilowatts $218
P-303 Electricity 0.85 0.529 kilowatts $218
P-304 Electricity 0.85 0.055 kilowatts $23
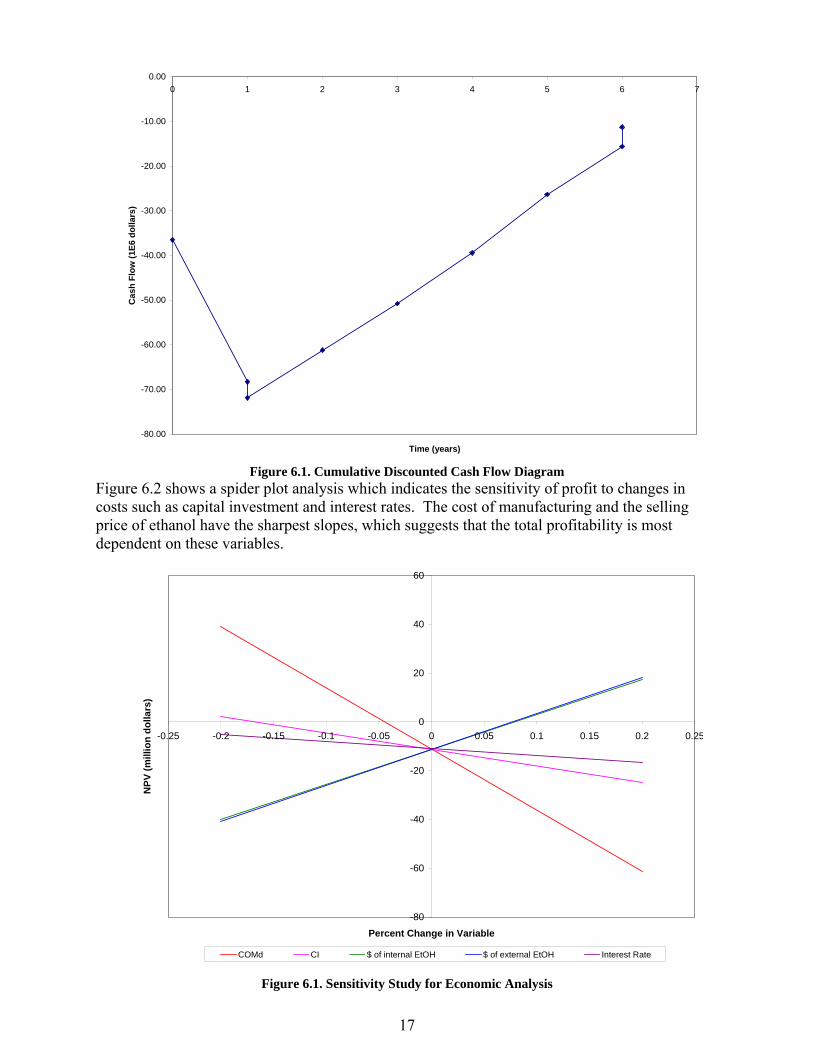
Total $ 39,190,202 A breakdown of the production cost as a function of the liters of ethanol produced is shown in Table 6.3. The production cost accounts for expenses related to raw materials, utilities, direct production costs, fixed costs, and savings from the by-products of acetaldehyde and DDGs. Based on Table 6.3, the main expenses in ethanol production are the corn syrup feed and medium pressure steam. Total production costs were found to be $0.39 per liter of ethanol produced. The total cost of manufacturing was found to be $148.6 million each year with total revenues of ethanol production totaling $187.8 million. Full economic calculations are shown in Appendix L. The annual non-discounted after-tax cash flows generated each year from the plant are shown in Table 6.3, with the annual tax rate assumed to be 42%. A discounted cumulative cash flow diagram is shown in Figure 6.1 with a minimum attractive rate of return (MARR) of 15%. Figure 6.1 shows that the project does not recover its investment within the five years allotted, but appears to have a payback period of approximately six years after the construction period. The net present value of the plant with a five year life was found to be -$11.25 million, while the internal rate of return (IRR) was found to be 9.88%, below the assumed minimum attractive rate of return (MARR) of 15%. Thus, the cumulative cash flow and return on investment (ROI) are negative and the project will not yield a positive return after five years. A project life of 10 years would yield a positive NPV and a profitable investment.
15
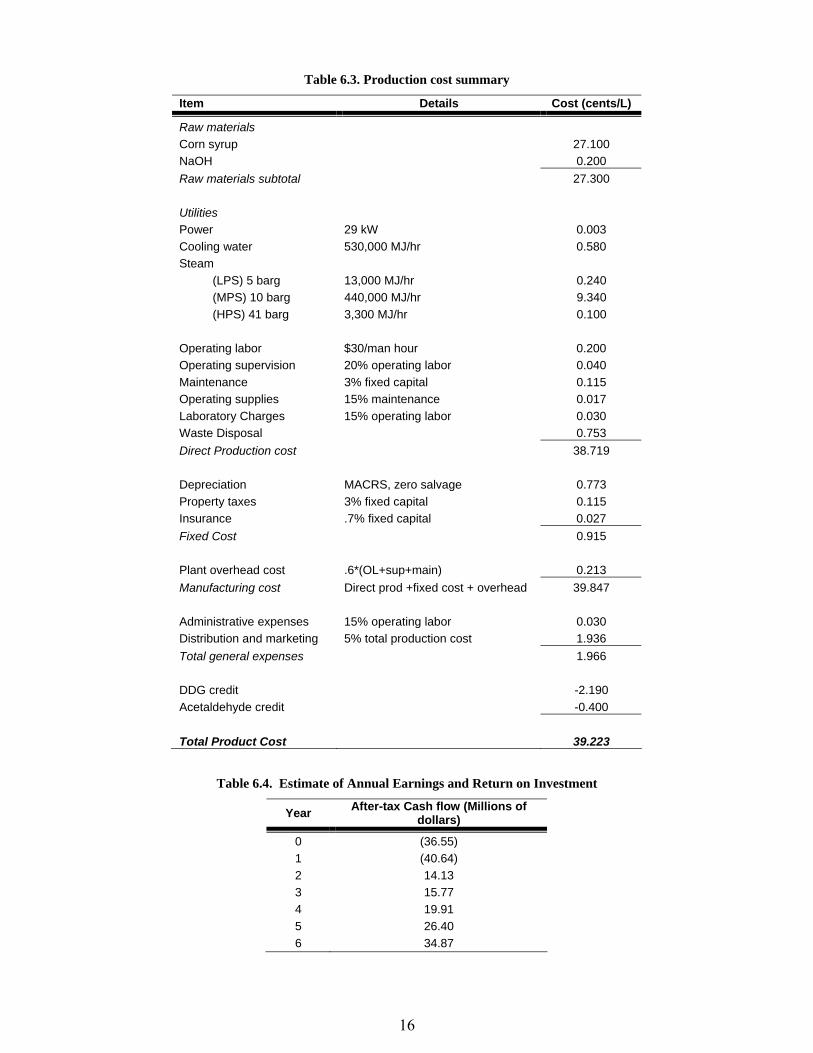
Table 6.3. Production cost summary
Item Details Cost (cents/L)
Raw materials Corn syrup 27.100 NaOH 0.200 Raw materials subtotal 27.300 Utilities Power 29 kW 0.003 Cooling water 530,000 MJ/hr 0.580 Steam (LPS) 5 barg 13,000 MJ/hr 0.240 (MPS) 10 barg 440,000 MJ/hr 9.340 (HPS) 41 barg 3,300 MJ/hr 0.100 Operating labor $30/man hour 0.200 Operating supervision 20% operating labor 0.040 Maintenance 3% fixed capital 0.115 Operating supplies 15% maintenance 0.017 Laboratory Charges 15% operating labor 0.030 Waste Disposal 0.753 Direct Production cost 38.719 Depreciation MACRS, zero salvage 0.773 Property taxes 3% fixed capital 0.115 Insurance .7% fixed capital 0.027 Fixed Cost 0.915 Plant overhead cost .6*(OL+sup+main) 0.213 Manufacturing cost Direct prod +fixed cost + overhead 39.847 Administrative expenses 15% operating labor 0.030 Distribution and marketing 5% total production cost 1.936 Total general expenses 1.966 DDG credit -2.190 Acetaldehyde credit -0.400 Total Product Cost 39.223
Table 6.4. Estimate of Annual Earnings and Return on Investment
Year After-tax Cash flow (Millions of dollars)
0 (36.55) 1 (40.64) 2 14.13 3 15.77 4 19.91 5 26.40 6 34.87
16
-80.00
-70.00
-60.00
-50.00
-40.00
-30.00
-20.00
-10.00
0.000 1 2 3 4 5 6 7
Time (years)
Cas
h Fl
ow (1
E6 d
olla
rs)
Figure 6.1. Cumulative Discounted Cash Flow Diagram
Figure 6.2 shows a spider plot analysis which indicates the sensitivity of profit to changes in costs such as capital investment and interest rates. The cost of manufacturing and the selling price of ethanol have the sharpest slopes, which suggests that the total profitability is most dependent on these variables.
-80
-60
-40
-20
0
20
40
60
-0.25 -0.2 -0.15 -0.1 -0.05 0 0.05 0.1 0.15 0.2 0.25
Percent Change in Variable
NPV
(mill
ion
dolla
rs)
COMd CI $ of internal EtOH $ of external EtOH Interest Rate Figure 6.1. Sensitivity Study for Economic Analysis
17
7. Design Issues The analysis of the ethanol fermentation process did not address some key design issues. For example, the design of the CSTR did not incorporate a temperature control mechanism. The fermentation reaction is exothermic, which will result in an increase in temperature that may harm the yeast. Thus, cooling coils must be incorporated into the design of the CSTR. In addition, the economic analysis indicates that the design of the process in not profitable. Based on the sensitivity study, the NPV is very sensitive to the cost of ethanol and the cost of manufacturing. The price of ethanol cannot be controlled, but the cost of manufacturing can be reduced by improving the process design. Furthermore, recovering acetic acid using an ion bed exchanger could increase the revenue to offset the high production costs. In conclusion, the primary design issues are related to the economic optimization of the process. 8. Project Assumptions and Risks 8.1 Key Assumptions The analysis and design of the reactor was conducted using the following assumptions: · The forecast for the ethanol price and demand is accurate · The Monod equation correctly represents the ethanol fermentation process for both
laboratory and industrial scaled-up process · The efficiencies of unit operations used in the process obey those listed in heuristics · Urea has the thermophysical properties of yeast, so it may be used as a substitute in the
ChemCAD modeling · The volume of carbon dioxide does not affect the space time (τ) · The temperature change of the CSTRs is negligible · Air and nutrients are added to the reactors in the appropriate amount to sustain yeast activity · UNIFAC accurately models the ethanol fermentation process in ChemCAD · Differences between the ChemCAD model simulation and the real world are insignificant 8.2 Risks from Assumptions: · Inaccurate ethanol price and demand forecasts will cause this investment to be unprofitable · Poorly controlled reactor temperatures will reduce the yeast activity and an insufficient
amount of ethanol will be produced · Non-ideal reactor conditions will reduce the production of ethanol · Scale-up of the molecular sieves may not be perfectly accurate, which may result in a more
costly process · Inaccurate assumptions from heuristics may result in decreased efficiency or higher costs · Discrepancies between the ChemCAD simulation and the real world will result in decreased
performance or higher costs because of inaccurate sizing 9. Conclusions and Recommendations 9.1 Conclusions · It is technically feasible to produce the specified amounts and purities of ethanol and its
byproducts using the following technology − Four parallel CSTRs with continuous removal of CO2 and ethanol − Molecular sieves to produce anhydrous ethanol − Three centrifuges in series to recover yeast for DDG production − Flash vessels and distillation to recover all other products
18
· The net present value (NPV) for this investment with a project life of five years was found to be -$11.25 million.
· The internal rate of return (IRR) was found to be 9.88 % and the return on investment (ROI) was found to be -15.39% for the project
· The profitability of the investment is most sensitive to changes in the cost of manufacturing and the selling price of ethanol
· The payback period is approximately six years after startup · The project will be a profitable investment if the project life were 10 years 9.2 Recommendations · Perform an economic optimization to:
− Establish pharmaceutical contracts to sell the ethanol at the higher price of $2.80 compared to the fuel grade price of $1.20 per gallon
− Improve the heat exchanger network for greater integration and reduction of utility costs − Investigate alternate methods to reduce the utility requirements for the distillation towers
· Implement temperature control mechanism for the reactor · Conduct experiments to confirm that molecular sieves have the capacity to remove all of the
water from industrial scale flows · Operate the plant for a longer period to make the investment profitable
19
References 1. Oldshue, C.H., “Proposed Ethanol Plant.” Internal memo. 1/5/04. 2. Ashworth, John. “Partnership Development Markets, Applied Research and Data
Sharing Networks.” National Renewable Energy Laboratory. May 2, 2003. http://www.ott.doe.gov/biofuels/pdfs/esp9_ja_partnership_development_esp_fy03reveiw.pdf Accessed 2/2/2004
3. Breakthrough, Dr. C.C., “Ethanol Fermentation Reaction Rate Studies.” Internal Memo. 1/29/04.
4. Breakthrough, Dr. C.C., “Ethanol Fermentation Reaction Rate Studies.”Internal Memo. 2/12/04.
5. “Hazardous Substance Fact Sheet.” New Jersey Department of Health and Senior Services. April, 2002. http://www.state.nj.us/health/eoh/rtkweb/0844.pdf
6. Private Communication, Dr. R. E. Harris, February 2004 7. “Ethanol and the Environment.” Renewable Fuels Association. © 2000
http://ethanolrfa.org/factfic_envir.html Accessed 1/21/2004 8. “Ethanol Industry Outlook 2003: Building a Secure Energy Future.” Renewable Fuels
Association. Feb. 2003. http://ethanolrfa.org/outlook2003.html. Accessed 1/21/2004 9. “Ethanol Pollution Surprise.” CBSNEWS.com May 3, 2002.
http://www.cbsnews.com/stories/2002/05/03/tech/main508006.html 10. “CAA Statute, Regulations, & Enforcement.” U.S. Environmental Protection
Agency. http://www.epa.gov/compliance/civil/programs/caa/caaenfstatreq.html11. “12 Ethanol Plants to Install Emissions Controls.” Mindfully.org Oct. 2002.
http://www.mindfully.org/Air/2002/Ethanol-Plants-Emissions- Controls3oct02.htm 12. Fogler, H. Scott. Elements of Chemical Reaction Engineering.
New Jersey: Prentice Hall PTR, 1999. Third edition. pp 16-22. 13. Seader, J. D. and Henley, Ernest J. Separation Process Principles.
New York: John Wiley & Sons, Inc, 1998. 14. “Ethanol Production around the World Booming.” Oxy Fuel News. Vol. 15,
Iss. 19; pg 1. May 12, 2003. http://gateway.proquest.com/. Accessed 1/17/2004 15. Duff, Brian. “Points to Consider when Building an Ethanol Plant.”
BBI International. Oklahoma Ethanol Workshop. Jan. 28, 2003. www.bbiethanol.com/files/DOE2002-NV/Yancey-NV-DOE.pdf Accessed 1/17/2004
16. “Ethanol Industry Outlook 2003: Building a Secure Energy Future.” Renewable Fuels Association. Feb. 2003. http://ethanolrfa.org/outlook2003.html. Accessed 1/21/2004
17. “Ethanol Information.” American Coalition of Ethanol. © 2003 http://ethanol.org/Information/ethanol_information.htm Accessed 2/1/2004
18. “Chemical Profile – Ethanol.” Chemical Market Reporter. New York: Jan 20, 2003. Accessed 1/24/2004 http://www.findarticles.com/cf_dls/m0FVP/3_263/96891068/p1/article.jhtml?term
19. “The National Ambient Air Quality Standards.” Texas Natural Resource Conservation Commission. November 21, 2003. http://www.tnrcc.state.tx.us/air/monops/naaqs.html
20. Private Communication, Dr. R. E. Harris, March 2004. 21. Turton, Richard, et. al. Analysis, Synthesis, and Design of Chemical Processes. New Jersey:
Prentice Hall PTR, 2003. Second Edition. Pp 333-352.
20

Appendices
21