Embed Size (px)
Citation preview

Table of Contents
UNITED STATES SECURITIES AND EXCHANGE COMMISSIONWashington, D.C. 20549
————————
Form 10-K(Mark One)
☑ Annual Report Pursuant to Section 13 or 15(d) of the Securities Exchange Act of 1934 for the fiscal year ended December 31, 2018.
☐ Transition Report pursuant to Section 13 or 15(d) of the Securities Exchange Act of 1934 for the transition period
from to .
Commission File Number: 001-37509
DASEKE, INC.(Exact name of registrant as specified in its charter)
Delaware 47-3913221(State or other jurisdiction of incorporation or organization) (I.R.S. Employer Identification No.)
15455 Dallas Parkway, Suite 550Addison, Texas
75001
(Address of principal executive offices) (Zip Code)
Registrant’s telephone number, including area code(972) 248-0412
Securities registered pursuant to Section 12(b) of the Act:
Title of each class Name of each exchange on which registeredCommon stock, $0.01 par value The NASDAQ Capital Market
Securities registered pursuant to Section 12(g) of the Act: None
————————Indicate by check mark if the registrant is a well-known seasoned issuer, as defined in Rule 405 of the Securities Act. Yes ☐ No ☑Indicate by check mark if the registrant is not required to file reports pursuant to Section 13 or Section 15(d) of the Exchange Act. Yes ☐ No ☑Indicate by check mark whether the registrant (1) has filed all reports required to be filed by Section 13 or 15(d) of the Securities Exchange Act of 1934 during the preceding12 months (or for such shorter period that the registrant was required to file such reports), and (2) has been subject to such filing requirements for the past90 days. Yes ☑ No ☐Indicate by check mark whether the registrant has submitted electronically every Interactive Data File required to be submitted pursuant to Rule 405 of Regulation S-T(§232.405 of this chapter) during the preceding 12 months (or for such shorter period that the registrant was required to submit such files). Yes ☑ No ☐Indicate by check mark if disclosure of delinquent filers pursuant to Item 405 of Regulation S-K (§232.405 of this chapter) is not contained herein, and will not be contained,to the best of the registrant’s knowledge, in definitive proxy or information statements incorporated by reference in Part III of this Form 10-K or any amendment to thisForm 10-K. ☐Indicate by check mark whether the registrant is a large accelerated filer, an accelerated filer, a non-accelerated filer, a smaller reporting company, or an emerging growthcompany. See the definitions of “large accelerated filer,” “accelerated filer,” “smaller reporting company,” and "emerging growth company" in Rule 12b-2 of the ExchangeAct. Large accelerated filer ☐ Accelerated filer ☑ Non-accelerated filer ☐
(Do not check if a smallerreporting company)
Smaller reporting company ☐ Emerging growth company ☐
If an emerging growth company, indicate by check mark if the registrant has elected not to use the extended transition period for complying with any new or revised financialaccounting standards provided pursuant to Section 13(a) of the Exchange Act. ☐Indicate by check mark whether the registrant is a shell company (as defined in Rule 12b-2 of the Exchange Act).Yes ☐ No ☑The aggregate market value of voting and non-voting common stock held by non-affiliates of the registrant, computed by reference to the last sales price as reported on theNASDAQ Capital Market as of June 30, 2018, the last business day of the registrant’s most recently completed second fiscal quarter, was $431,568,246.64,469,672 shares of common stock were outstanding as of March 6, 2019.
DOCUMENTS INCORPORATED BY REFERENCE
The registrant intends to file an amendment on Form 10-K/A not later than 120 days after the close of the fiscal year ended December 31, 2018. Portions of such amendmentwill be incorporated by reference into Part III, Items 10-14 of this Annual Report on Form 10-K.

Table of Contents
DASEKE, INC.2018 ANNUAL REPORT ON FORM 10-K
INDEX Page No.Part I. Item 1. Business 4 Overview 4 Acquisitions 5 Industry and Competition 5 Customers 6 Revenue Equipment 6 Employees and Independent Contractors 6 Safety and Risk Management 7 Fuel 7 Seasonality 7 Regulation 8Item 1A. Risk Factors 12Item 1B. Unresolved Staff Comments 31Item 2. Properties 31Item 3. Legal Proceedings 34Item 4. Mine Safety Disclosures 34 Part II.
Item 5. Market for Registrant’s Common Equity, Related Stockholder Matters and Issuer Purchases of EquitySecurities 34
Item 6. Selected Financial Data 36Item 7. Management’s Discussion and Analysis of Financial Condition and Results of Operations 39Item 7A. Quantitative and Qualitative Disclosures About Market Risk 73Item 8. Financial Statements and Supplementary Data 73Item 9. Changes in and Disagreements with Accountants on Accounting and Financial Disclosure 74Item 9A. Controls and Procedures 74Item 9B. Other Information 79 Part III. Item 10. Directors, Executive Officers and Corporate Governance 80Item 11. Executive Compensation 80Item 12. Security Ownership of Certain Beneficial Owners and Management and Related Stockholder Matters 80Item 13. Certain Relationships and Related Transactions, and Director Independence 80Item 14. Principal Accounting Fees and Services 80 Part IV. Item 15. Exhibits, Financial Statement Schedules 81Item 16. Form 10-K Summary 86Signatures 87
2

Table of Contents
CAUTIONARY NOTE REGARDING FORWARD-LOOKING STATEMENTS This Annual Report on Form 10-K (this Form 10-K) may contain forward-looking statements (within the meaning of the PrivateSecurities Litigation Reform Act of 1995) with respect to the financial condition, results of operations, plans, objectives, futureperformance and business of Daseke, Inc. (Daseke or the Company). Statements preceded by, followed by or that include words suchas “may,” “will,” “expect,” “anticipate,” “continue,” “estimate,” “project,” “believe,” “plan,” “should,” “could,” “would,” “goals” orsimilar expressions are intended to identify some of the forward-looking statements. All statements, other than statements ofhistorical fact, are forward-looking statements. Forward-looking statements may include statements about the Company’s goals; theCompany’s business strategy; the Company’s financial strategy, liquidity and capital required for its business strategy and plans; theCompany’s competition and government regulations; general economic conditions; and the Company’s future operating results. Forward-looking statements are based on the Company’s management’s current expectations and assumptions about future eventsand are based on currently available information as to the outcome and timing of future events. As such, forward-looking statementsinvolve risks and uncertainties, most of which are difficult to predict and many of which are beyond the Company’s control. Theserisks include, but are not limited to, general economic and business risks, driver shortages and increases in driver compensation orowner-operator contracted rates, loss of senior management or key operating personnel, the Company’s ability to recognize theanticipated benefits of recent acquisitions, the Company’s ability to identify and execute future acquisitions successfully, seasonalityand the impact of weather and other catastrophic events, fluctuations in the price or availability of diesel fuel, increased prices for, ordecreases in the availability of, new revenue equipment and decreases in the value of used revenue equipment, the Company’s abilityto generate sufficient cash to service all of its indebtedness, restrictions in the Company’s existing and future debt agreements,increases in interest rates, changes in existing laws or regulations, including environmental and worker health and safety laws andregulations and those relating to tax rates or taxes in general, the impact of governmental regulations and other governmental actionsrelated to the Company and its operations, litigation and governmental proceedings, and insurance and claims expenses. Other factorsdescribed herein, or factors that are unknown or unpredictable, could also have a material adverse effect on future results. See “Item1A. Risk Factors,” “Item 7. Management’s Discussion and Analysis of Financial Condition and Results of Operations” and “Item 7A.Quantitative and Qualitative Disclosures About Market Risk” for a description of various factors that could cause actual results todiffer materially from those contemplated by forward-looking statements. Forward-looking statements speak only as of the date on which such statements are made. The Company undertakes no obligation toupdate any forward-looking statements for any reason, whether as a result of new information, future events or otherwise, except asrequired by federal securities law. Accordingly, readers are cautioned not to place undue reliance on the forward-looking statements.
WHERE YOU CAN FIND MORE INFORMATION The Company files annual, quarterly and current reports, proxy statements and other information with the Securities and ExchangeCommission (the SEC). The Company’s SEC filings are available to the public through the Internet at the SEC's website athttp://www.sec.gov. The Company also makes available free of charge on its Internet website at http://investor.daseke.com all of the documents that theCompany files with the SEC as soon as reasonably practicable after it electronically files those documents with the SEC. Informationcontained on the Company’s website is not incorporated by reference into and does not otherwise form a part of this Form 10-K.
3
Table of Contents
PART I
Item 1. Business Overview Daseke, Inc. is a leading provider of transportation and logistics solutions focused exclusively on flatbed and specialized freight. TheCompany is the largest flatbed and specialized logistics carrier, and is among the top 10 truckload carriers, in North America. From2009 to 2018, the Company has grown revenue from $30 million to $1,613 million at a compound annual growth rate (CAGR) of56%. The Company’s predecessor was incorporated in Delaware in 2008. Daseke believes that it provides one of the most comprehensive transportation and logistics solutions offerings in the open-deckindustry. The Company delivers a diverse offering of transportation and logistics solutions to approximately 5,900 customers acrossthe continental United States, Canada and Mexico. In 2018, Daseke’s company and owner-operator drivers drove approximately 463million miles. The Company has two reportable segments: Flatbed Solutions and Specialized Solutions. The Flatbed Solutions segment focuses ondelivering transportation and logistics solutions that principally require the use of flatbed and retractable-sided transportationequipment, and the Specialized Solutions segment focuses on delivering transportation and logistics solutions that principally includesuper heavy haul, high-value customized, over-dimensional, commercial glass and high-security cargo solutions. The FlatbedSolutions segment generated approximately 41% of total revenue in 2018, and the Specialized Solutions segment generatedapproximately 59% of total revenue in 2018 . As of December 31, 2018, the Flatbed Solutions segment operated 2,963 tractors and5,141 trailers, and the Specialized Solutions segment operated 3,181 tractors and 8,683 trailers. Both of the Company’s reportable segments operate highly flexible business models comprised of company-owned tractors andasset-light operations (which consist of owner-operator transportation, freight brokerage and logistics). The Company’s asset-basedoperations have the benefit of providing shippers with certainty of delivery and continuity of operations. Alternatively, theCompany’s asset-light operations offer flexibility and scalability to meet customers’ dynamic needs and have lower capitalexpenditure requirements and fixed costs. In 2018, approximately 49% of the Company ’s freight, logistics and brokerage revenuewas derived from company-owned equipment and approximately 51% was derived from asset-light services. Business Combination On February 27, 2017, a wholly-owned subsidiary of Hennessy Capital Acquisition Corp. II, a special purpose acquisition companywith no operations (Hennessy), merged with and into Daseke, Inc., with Daseke, Inc. surviving as a direct wholly-owned subsidiaryof Hennessy (the Business Combination), in accordance with the Agreement and Plan of Merger, dated December 22, 2016 (theMerger Agreement), by and among Hennessy, HCAC Merger Sub, Inc., Daseke, Inc. and Don R. Daseke, solely in his capacity as theStockholder Representative (as defined therein). Subsequent to the closing of the Business Combination, Daseke, Inc. changed itsname to “Daseke Companies, Inc.” and Hennessy Capital changed its name to “Daseke, Inc.” Unless expressly stated otherwise,references to the Company or Daseke refers to Daseke, Inc. and its wholly-owned subsidiaries, Hennessy refers to the registrant priorto the closing of the Business Combination, and Private Daseke refers to Daseke, Inc. and its subsidiaries prior to the closing of theBusiness Combination. See Note 3 of Notes to Consolidated Financial Statements for more information regarding the BusinessCombination.
CCJ Top 250, 2018 Rank (Flatbed/Specialized/Heavy Haul).Logistics Management Magazine 2017
4
1 2
1.
2.

Table of Contents
Acquisitions Daseke is a leading consolidator of the flatbed and specialized freight market in North America, having successfully acquired morethan 20 companies since beginning operations in 2009. The Company maintains a pipeline of potential acquisition candidates anddiscussions with potential target companies as part of the Company’s day-to-day operations. In 2018, the Company’s acquisitions included the following:
· On June 6, 2018, the Company acquired all of the outstanding common shares of Aveda Transportation and Energy ServicesInc., a corporation existing under the laws of the Province of Alberta, Canada (Aveda), for total consideration of $118.7million, consisting of $27.3 million in cash, 1,612,979 shares of Daseke common stock valued at $15.4 million, the payoffof $54.8 million of outstanding debt, and contingent consideration of $21.2 million. Aveda transports equipment requiredfor the exploration, development and production of petroleum resources in the United States and Canada, expanding theSpecialized Segment.
· On August 1, 2018, the Company acquired all of the outstanding shares of Builders Transportation Co., LLC (Builders)based in Memphis, Tennessee for total consideration of $36.3 million, consisting of $30.0 million in cash, 399,530 shares ofDaseke common stock valued at $3.4 million and the assumption by the Company of $2.9 million of long-term debt.Builders transports metals and building materials, expanding the Flatbed Segment.
· On July 1 and August 1, 2018, the Company closed two acquisitions to acquire 100% of the outstanding shares of the targetentities for aggregate consideration of $31.6 million, consisting of $20.1 million in cash and 95,859 shares of Dasekecommon stock valued at $0.9 million. Additionally, the Company assumed approximately $10.6 million of debt and capitallease obligations. These two acquisitions expanded operations in the northwest United States and Canada, in the Flatbed andSpecialized Segments.
Industry and Competition The transportation and logistics market is one of the largest industries in the United States. The flatbed and specialized (open-deck)freight market currently represents approximately 10% of the more than 1.5 million population of trucks used in the broadertransportation and logistics market. Open-deck freight is defined as loads secured atop trailer decks without sides or a roof and isgenerally both complex and time-sensitive, which separates it from traditional dry-van freight. The open-deck industry is focused ondifferent customers with different freight requirements than traditional dry-van and requires highly trained drivers and specializedequipment with the ability to handle uniquely shaped and overweight cargo. Specialized loads often require specific expertise toaddress the additional administrative paperwork, proper licenses and hauling permits, extensive coordination with local officials andescort vehicles. Open-deck routes are frequently more irregular than dry-van routes due to the nature of the freight. Open-deck lanes stretch acrossthe country, with particular density around corridors of significant lumber, steel and machinery production, notably in the Southeast,Midwest, Texas and West Coast regions of the United States. The open-deck industry is highly competitive and fragmented. The Company competes primarily with other flatbed carriers and to alesser extent, logistics companies, as well as railroads. The Company competes with other motor carriers for the services of drivers,independent contractors and management employees and with logistics companies for the services of third-party capacity providersand management employees. The Company believes that the principal differentiating factors in its business, relative to competition,are scale, North American footprint of operations, service, efficiency, pricing, the availability and configuration of equipment thatsatisfies customers’ needs, and its ability to provide comprehensive transportation solutions to customers.
5

Table of Contents
Customers The Company’s customers, many of whom are Fortune 500 companies, rely on it to transport mission-critical loads, making it anintegral part of their supply chains. As of December 31, 2018, the Company has approximately 5,900 customers. The Company’sability to dependably transport high-value, complex and time-sensitive loads as well as provide the value-added logistics servicesrequired to plan, transport and deliver loads has resulted in longstanding and established customer relationships. In 2018 and 2017customer relationships with our top ten customers, based on revenue, span more than 20 years on average at the Company’s operatingdivisions. The Company’s customers represent a broad and attractive range of end markets. Examples of the freight the Company regularlytransports include aircraft parts, manufacturing equipment, structural steel, pressure vessels, wind turbine blades, heavy machinery(construction, mining and agricultural) , commercial glass, high security cargo, arms, ammunition and explosives (AA&E), lumberand building and construction materials. Because the Company’s customers are generally in the industrial and manufacturing sector,as is typical for open-deck services providers, the Company is not subject to the same consumer-driven demand as dry-van truckingcompanies, whose freight typically includes consumer goods and whose volume can peak during the holiday season . In 2018, the Company’s Flatbed Solutions segment provided transportation and logistics solutions to approximately 3,000 customers,and the Company’s Specialized Solutions segment provided unique, value-added transportation and logistics solutions toapproximately 2,900 customers. See Note 17 of the Company’s audited consolidated financial statements included elsewhere in thisForm 10-K for information on its two reportable segments. A material portion of the Company’s revenue is generated from its major customers, the loss of one or more of which could have amaterial adverse effect on its business. In 2018 and 2017, the Company’s top ten customers accounted for approximately 29% and31%, respectively, of its revenue; however, in 2018 and 2017, no single customer represented more than 5% and 6%, respectively, ofthe Company’s revenue. In 2018 and 2017, no customer of the Flatbed Solutions segment or the Specialized Solutions segmentaccounted for 10% or more of the Company’s consolidated total revenue. Revenue Equipment As of December 31, 2018, the Company operated 3,882 company-owned tractors. The Company also had under contract 2,262tractors owned and operated by independent contractors as of December 31, 2018. The Company also operated 13,824 trailers as ofDecember 31, 2018. Growth of its tractor and trailer fleet is determined by market conditions and its experience and expectationsregarding equipment utilization and driver recruitment and retention. In acquiring revenue equipment (tractors, trailers and traileraccessories), the Company considers a number of factors, including economy, price, rate, economic environment, technology,warranty terms, manufacturer support, driver comfort and resale value. The Company maintains strong relationships with itsequipment vendors and the financial flexibility to react as market conditions dictate. The Company’s acquisitions have provided asignificant increase in its tractor and trailer fleets. Employees and Independent Contractors As of December 31, 2018, there were approximately 5,829 full-time employees in the Company’s total employee headcount of 5,930,which includes approximately 3,669 drivers. The Company is not a party to any collective bargaining agreements. The Company also contracts with owner-operator drivers to provide and operate tractors, which provide additional revenueequipment capacity. Independent contractors own or lease their own tractors and are responsible for all associated expenses,including financing costs, fuel, maintenance, insurance and highway use taxes. As of December 31, 2018, the Company had 2,262independent contractors, who accounted for approximately 42% of total miles in 2018. The Company’s strategy for both company and owner-operator drivers is to (i) use safe and experienced drivers (the majority ofdriver positions hired require twelve months of over-the-road experience); (ii) promote retention with positive working conditionsand a competitive compensation package in the case of company drivers and contracted rates in the
6

Table of Contents
case of owner-operator drivers; and (iii) minimize safety problems through careful screening, mandatory drug testing, continuoustraining, electronic logging system and rewards for accident-free driving. The Company also seeks to minimize turnover of companydrivers by providing highly attractive tractors and focusing on providing upgraded nationwide facilities. As a result, at least one ofthe Company’s operating companies has been named to the Truckload Carriers Association’s 20 Best Fleets to Drive For® in NorthAmerica each year since 2010, and the Company has achieved driver retention rates that it believes are superior to the truckingindustry average. Safety and Risk Management The Company takes pride in its safety-focused culture and conducts mandatory intensive orientation for all of its drivers. The U.S.Department of Transportation (DOT) requires that the Company perform drug and alcohol testing that meets DOT regulations, andits safety program includes pre-employment, random and post-accident drug testing and all other testing required by the DOT. TheCompany also equips its company tractors with critical-event recorders to help continually train drivers and widely deploys truck-mounted cameras, so that the Company can prevent or reduce the severity of accidents and claims. The primary safety-related risks associated with the Company’s business include damage to cargo hauled, physical damage tocompany equipment, damage to buildings and personal property, third-party personal injury and property damage and workers’compensation. The Company regularly reviews insurance limits and retentions. The Company’s historic and current retention, in themajority of instances, is $0.5 million. In addition, the Company has secured excess liability coverage of up to $100.0 million peroccurrence. To the extent under dispatch and in furtherance of the Company’s business, its owner-operators are covered by the Company’sliability coverage. However, each such owner-operator is responsible for physical damage to his or her own equipment, occupationalaccident coverage, liability exposure while the truck is used for non-company purposes, and, in the case of fleet operators, anyapplicable workers’ compensation requirements for their employees. F uel The Company actively manages its fuel purchasing network in an effort to maintain adequate fuel supplies and reduce its fuel costs.The Company purchases its fuel through a network of retail truck stops with which it has negotiated volume purchasing discounts.The Company seeks to reduce its fuel costs by routing its drivers to truck stops with which the Company has negotiated volumepurchase discounts when fuel prices at such stops are lower than the bulk rate paid for fuel at the Company’s terminals. TheCompany stores fuel in aboveground and underground storage tanks at some of its facilities. To help offset increases in fuel prices, the Company utilizes a fuel surcharge program designed to compensate the Company for fuelcosts above a certain cost per gallon base. Generally, the Company receives fuel surcharges on the miles for which it is compensatedby customers. In addition to its fuel surcharge program, the Company believes the most effective protection against fuel costincreases is to maintain a fuel-efficient fleet by incorporating fuel efficiency measures. The Company has not used derivatives as ahedge against higher fuel costs in the past but continues to evaluate this possibility. Seasonality In the transportation industry, results of operations generally show a seasonal pattern. The Company’s productivity decreases duringthe winter season because inclement weather impedes operations , end-user activity and some shippers reduce their shipments duringwinter. At the same time, operating expenses increase and fuel efficiency declines because of engine idling and harsh weathercreating higher accident frequency, increased claims and higher equipment repair expenditures. The Company also may suffer fromweather-related or other events such as tornadoes, hurricanes, blizzards, ice storms, floods, fires, earthquakes and explosions.
7

Table of Contents
Regulation The Company’s operations are regulated and licensed by various federal, provincial, state, local and foreign government agencies inthe United States and Canada. In the United States, the Company and its drivers must comply with the safety and fitness regulationsof the DOT and the agencies within the states that regulate transportation, including those regulations relating to drug- and alcohol-testing and hours-of-service. Weight and equipment dimensions also are subject to government regulations. The Company also maybecome subject to new or more restrictive regulations relating to fuel emissions, environmental protection, drivers’ hours-of-service,driver eligibility requirements, on-board reporting of operations, collective bargaining, ergonomics and other matters affecting safety,insurance and operating methods. Other agencies, such as the U.S. Environmental Protection Agency (EPA), and the U.S.Department of Homeland Security (DHS), the U.S. Department of Defense (DOD) and the U.S. Department of Energy (DOE) alsoregulate the Company’s equipment, operations, drivers and the environment. The Company conducts operations outside of the UnitedStates, and is subject to analogous governmental safety, fitness, weight and equipment regulations and environmental protection andoperating standards, as well as the Foreign Corrupt Practices Act (FCPA), which generally prohibits United States companies andtheir intermediaries from making improper payments to foreign officials for the purpose of obtaining or retaining favorable treatment.For example, in Canada, Daseke must conduct its operations in various provinces pursuant to operating authority granted by theMinistries of Transportation and Communications in those provinces. The DOT, through the Federal Motor Carrier Safety Administration ( FMCSA), imposes safety and fitness regulations on theCompany and its drivers, including rules that restrict driver hours-of-service. In December 2011, the FMCSA published its 2011Hours-of-Service Final Rule (the 2011 Rule), requiring drivers to take 30-minute breaks after eight hours of consecutive driving andreducing the total number of hours a driver is permitted to work during each week from 82 to 70 hours. The 2011 Rule provided thata driver may restart calculation of the weekly time limits after taking 34 or more consecutive hours off duty, including two restperiods between 1:00 a.m. and 5:00 a.m.; these restrictions are referred to as the 2011 Restart Restrictions. These 2011 rule changes,including the 2011 Restart Restrictions, became effective on July 1, 2013. However, in December, 2014, Congress passed the 2015Omnibus Appropriations bill, which was signed into law on December 16, 2014. Among other things, the legislation provided relieffrom the 2011 Restart Restrictions, reverting requirements back to those in effect before the 2011 Rule became effective, includingthe more straight forward 34-hour restart period, without need for two rest periods between 1:00 a.m. and 5:00 a.m.. In December,2014, the FMCSA published a Notice of Suspension summarizing this suspension of enforcement of the 2011 Restart Restrictions. The FMCSA has adopted a data-driven Compliance, Safety and Accountability (the CSA) program as its safety enforcement andcompliance model. The CSA program holds motor carries and drivers accountable for their role in safety by evaluating and rankingfleets and individual drivers on certain safety-related standards. The CSA program affects drivers because their safety performanceand compliance impact their safety records and, while working for a carrier, will impact their carrier’s safety record. Themethodology for determining a carrier’s DOT safety rating relies upon implementation of Behavioral Analysis and SafetyImprovement Categories (BASIC) applicable to the on-road safety performance of the carrier’s drivers and certain of those ratingresults are provided on the FMCSA’s Carrier Safety Measurement System website. As a result, certain current and potential driversmay no longer be eligible to drive for the Company, the Company’s fleet could be ranked poorly as compared to its peer firms, andthe Company’s safety rating could be adversely impacted. The occurrence of future deficiencies could affect driver recruiting andretention by causing high-quality drivers to seek employment (in the case of company drivers) or contracts (in the case of owner-operator drivers) with other carriers, or could cause the Company’s customers to direct their business away from the Company and tocarriers with better fleet safety rankings, either of which would adversely affect the Company’s results of operations andproductivity. Additionally, the Company may incur greater than expected expenses in its attempts to improve its scores as a result ofsuch poor rankings. Those carriers and drivers identified under the CSA program as exhibiting poor BASIC scores are prioritized forinterventions, such as warning letters and roadside investigations , either of which may adversely affect the Company’s results ofoperations. To promote improvement in all CSA categories, including those both over and under the established scoring threshold,the Company has procedures in place to address areas where it has exceeded the thresholds and the Company continually reviews allsafety-related policies, programs and procedures for their effectiveness and revises them, as necessary, to establish positiveimprovement. However, the Company cannot assure you these measures will be effective.
8
Table of Contents
The methodology used to determine a carrier’s safety rating could be changed by the FMCSA and, as a result, the Company’sacceptable safety rating could be impaired. In particular, the FMCSA continues to utilize the three safety fitness rating scale—“satisfactory,” “conditional,” and “unsatisfactory”—to assess the safety fitness of motor carriers and the Company currently has a“satisfactory” FMCSA rating on 100% of its fleet. However, pursuant to a 2015 federal statutory mandate, the FMCSAcommissioned the National Academy of Sciences (NAS) to conduct a study and report upon the CSA program and its underlyingSafety Measurement System (SMS), which is the FMCSA’s process for identifying patterns of non-compliance and issuing safety-fitness determinations for motor carriers. In June 2017, the NAS published a report on the subject providing specificrecommendations and concluding, among other things, that the FMCSA should explore a more formal statistical model to replace thecurrent SMS process. In June 2018, the FMCSA posted its response to the NAS study in a report to Congress, concluding, amongother things, that it would develop and test a new model, the Item Response Theory (IRT), which would replace the SMS processcurrently used. The FMCSA was expected to commence small scale testing of the IRT model as early as September 2018, with fullscale testing expected to occur in April 2019 and possible program roll-out expected to occur in late 2019 but the testing schedule hasbeen delayed. The FMCSA’s June 2018 response is under audit by the DOT Inspector General to assess consistency with the NASrecommendations, and the audit findings will guide the agency’s actions and timing with respect to testing of the IRT model as apotential replacement for the SMS, in the event and to the extent that the FMCSA adopts the IRT model in replacement of the SMSor otherwise pursues rulemakings in the future that revise the methodology used to determine a carrier’s safety rating in a mannerthat incorporates more stringent standards, then it is possible that the Company and other motor carriers could be adversely affected,as compared to consideration of the current standards. If the Company were to receive an unsatisfactory CSA score, whether underthe current SMS process, the IRT model, should it be finalized, and adopted, or as a result of some other safety-fitness determination,it could adversely affect the Company’s business as some of its existing customer contracts require a satisfactory DOT safety rating,and an unsatisfactory rating could negatively impact or restrict the Company’s operations. In the aftermath of the September 11, 2001 terrorist attacks, federal, state and municipal authorities implemented and continue toimplement various security measures, including checkpoints and travel restrictions on large trucks. This could reduce the pool ofqualified drivers, which could require the Company to increase driver compensation or owner-operator contracted rates, limit fleetgrowth or allow trucks to be non-productive. Consequently, it is possible that the Company may fail to meet the needs of customersor may incur increased expenses. The FMCSA published a final rule in December 2015 mandating the use of Electronic Logging Devices (ELDs) for commercialmotor vehicle drivers to measure their compliance with hours-of-service requirements by December 18, 2017. The 2015 ELD finalrule generally applies to most motor carriers and drivers who are required to keep records of duty status, unless they qualify for anexception to the rule, and the rule also applies to drivers domiciled in Canada and Mexico. Under the 2015 final rule, motor carriersand drivers subject to the rule were required to use either an ELD or an automatic onboard recording device (AOBRD) compliantwith existing regulations by December 18, 2017. However, the AOBRDs may only be used until December 16, 2019, provided thosedevices were put into use before December 18, 2017. Starting December 16, 2019, all carriers and drivers subject to the 2015 finalrule must use ELDs. Commencing with the December 18, 2017 effective date, the Company and other motor carriers subject to the2015 rule are required to use ELDs or AOBRDs in their operations. The Company is subject to various environmental laws and regulations governing, among other matters, the operation of fuel storagetanks, release of emissions from its vehicles (including engine idling) and facilities, and adverse impacts to the environment,including to the soil, groundwater and surface water. The Company has implemented programs designed to monitor and addressidentified environmental risks. Historically, the Company’s environmental compliance costs have not had a material adverse effecton its results of operations; however, there can be no assurance that such costs will not be material in the future or that such futurecompliance will not have a material adverse effect on the Company’s business and operating results. Additionally, certain of theCompany’s operating companies are Charter Partners in the EPA’s SmartWay Transport Partnership, a voluntary program promotingenergy efficiency and air quality. If the Company fails to comply with applicable environmental laws or regulations, the Companycould be subject to costs and liabilities. Those costs and liabilities may include the assessment of sanctions, including administrative,civil and criminal penalties, the imposition of investigatory, remedial or corrective action obligations, the occurrence of delays inpermitting or
9

Table of Contents
performance of projects and the issuance of orders enjoining performance of some or all of its operations in a particular area. Theoccurrence of any one or more of such developments could have a material adverse effect on the Company’s business and operatingresults. The Company maintains bulk fuel storage and fuel islands at some of its terminals. The Company also has vehicle maintenanceoperations at certain of its facilities. The Company’s operations involve the risks of fuel spillage or seepage into the environment,discharge of contaminants, environmental and natural resource damage, and unauthorized hazardous material spills, releases ordisposal actions, among others. Some of the Company’s operations are at facilities where soil and groundwater contamination haveoccurred, and the Company or its predecessors have been responsible for remediating environmental contamination at somelocations. In the past, the Company has also been responsible for the costs of cleanup of cargo and diesel fuel spills caused during itstransportation operations, including as a result of traffic accidents or other events. If the Company is found to be responsible for suchcontamination or spills, the Company could be subject to costs and liabilities, including costs for remediation, environmental naturalresource damages and penalties. The EPA regulations limiting exhaust emissions became more restrictive in 2010. In 2010, a presidential executive memorandumwas signed directing the National Highway Traffic Safety Administration (NHTSA) and the EPA to develop new, stricter fuelefficiency standards for, among other vehicles, heavy-duty trucks. In 2011, the NHTSA and the EPA adopted final Phase 1 rules thatestablished the first-ever fuel economy and greenhouse gas standards for medium-and heavy-duty vehicles. These standards apply tocertain combination tractors’ model years 2014 to 2018 and require them to achieve an approximate 20 percent reduction in fuelconsumption by model year 2018, which equates to approximately four gallons of fuel for every 100 miles traveled. Additionally, inOctober 2016, the EPA and NHTSA jointly published final Phase 2 standards for improving fuel efficiency and reducing greenhousegas emissions from new on-road medium- and heavy-duty vehicles beginning for model year 2019 and extending through model year2027. The Phase 2 standards build upon the Phase 1 standards, encouraging wider application of currently available technologies andthe development of new and advanced cost-effective technologies through model year 2027. In addition, greenhouse gas emissionslimits and fuel efficiency standards will be imposed on new trailers. The Company expects that these Phase 2 standards, if unchangedto make less stringent, will result in its incurrence of increased costs for acquiring new tractors and for additional parts andmaintenance activities to retrofit its tractors with technology to achieve compliance with such standards. Such increased costs couldadversely affect the Company’s operating results and profitability, particularly if such costs are not offset by potential fuel savings.Additionally, in November 2018, the EPA announced the CTI, pursuant to which it plans to propose and finalize a rulemakingupdating standards for nitrogen oxide emissions from highway heavy-duty trucks and engines. The EPA is expected to issue aproposed rulemaking to implement the CTI program in early 2020. The Company cannot predict, however, the extent to which itsoperations and productivity will be adversely impacted , by these or any other new fuel or emission restrictions . Notwithstanding the federal standards, a number of states have mandated, and states may continue to individually mandate,additional emission-control requirements for equipment that could increase equipment or other costs for entire fleets. For instance,the California Air Resource Board also has adopted emission control regulations that will be applicable to all heavy-duty tractors thatpull 53-foot or longer box-type trailers within the state of California. The tractors and trailers subject to these regulations must beeither EPA Smart Way certified or equipped with low-rolling resistance tires and retrofitted with Smart Way-approved aerodynamictechnologies. The Company currently purchases Smart Way certified equipment in its new tractor and trailer acquisitions. In order toreduce exhaust emissions, some states and municipalities have also begun to restrict the locations and amount of time where diesel-powered tractors may idle. These restrictions could force the Company to alter its drivers’ behavior, purchase on-board power unitsthat do not require the engine to idle or face a decrease in productivity. Federal and state lawmakers also have implemented or proposed potential limits on greenhouse gas emissions under a variety ofother climate-change initiatives. Compliance with such regulations may increase the cost of new tractors and trailers or require theCompany to retrofit its equipment, and could impair equipment productivity and increase its operating expenses. These adverseeffects, combined with the uncertainty as to the reliability of the newly designed diesel engines and the residual value of thesevehicles, could materially increase the Company’s operating expenses or otherwise adversely affect its operations.
10

Table of Contents
Since 2013, any entity acting as a broker or a freight forwarder is required to obtain authority from the FMCSA, and is subject to aminimum $75,000 financial security requirement. Several of the Company’s subsidiaries are licensed by the FMCSA as a propertybroker and, therefore, they are obligated to satisfy this financial security requirement. This new requirement may limit entry of newbrokers into the market or cause current brokers to exit the market. Such persons may seek agent relationships with companies suchas the Company to avoid this increased cost. If they do not seek out agent relationships, the number of brokers in the industry coulddecrease.
11

Table of Contents
Item 1A. Risk Factors
RISK FACTORS The following risk factors apply to the business and operations of the Company. These risk factors are not exhaustive, and investorsare encouraged to perform their own investigation with respect to the business, financial condition and prospects of the Company.The Company may face additional risks and uncertainties that are not presently known to it, or that the Company currently deemsimmaterial, which may also impair its business. The following discussion should be read in conjunction with the financial statementsand notes to the financial statements included elsewhere in this Form 10-K. The Company’s industry is affected by general economic and business risks that are largely beyond its control. The Company’s industry is highly cyclical, and its business is dependent on a number of factors, many of which are beyond itscontrol. The Company believes that some of the most significant of these factors are economic changes that affect supply anddemand in transportation markets in general, such as: · downturns in customers’ business cycles; · recessionary economic cycles; · changes in customers’ inventory levels and in the availability of funding for their working capital; · commercial driver shortages and increases in driver compensation; · industry compliance with a constantly changing regulatory environment; · excess tractor capacity in comparison with shipping demand; and · changes in government policies, tariffs and taxes. The risks associated with these factors are heightened when the United States and/or global economy is weakened. Some of theprincipal risks during such times are as follows: · the Company may experience low overall freight levels, which may impair its asset utilization, because its customers’ demand
for its services generally correlate with the strength of the United States and, to a lesser extent, global economy; · certain of the Company’s customers may face credit issues and cash flow problems, particularly if they encounter increased
financing costs or decreased access to the capital markets, and such issues and problems may affect their ability to pay for theCompany’s services;
· freight patterns may change as supply chains are redesigned, resulting in an imbalance between the Company’s capacity and the
Company’s customers’ demands; and · customers may bid out freight or select competitors that offer lower rates from among existing choices in an attempt to lower
their costs, and the Company might be forced to lower its rates or lose freight. The Company also is subject to cost increases outside of its control that could materially reduce its profitability if it is unable toincrease its rates sufficiently. Such cost increases include, but are not limited to, increases in fuel prices, driver wages, owner-operator contracted rates, interest rates, taxes, tolls, license and registration fees, insurance, revenue equipment and healthcare for itsemployees. The Company’s suppliers’ business levels also may be negatively affected by adverse economic conditions or financial
12

Table of Contents
constraints, which could lead to disruptions in the supply and availability of equipment, parts and services critical to its operations. Asignificant interruption in the Company’s normal supply chain could disrupt its operations, increase its costs and negatively impactits ability to serve its customers. In addition, events outside the Company’s control, such as strikes or other work stoppages at its facilities or at customer, port, borderor other shipping locations, or actual or threatened armed conflicts or terrorist attacks, efforts to combat terrorism, military actionagainst a foreign state or group located in a foreign state, or heightened security requirements could lead to reduced economicdemand, reduced availability of credit or temporary closing of the shipping locations or United States borders. Such events orenhanced security measures in connection with such events could impair the Company’s operating efficiency and productivity andresult in higher operating costs. The Company’s industry is highly competitive and fragmented, and its business and results of operations may suffer if it is unableto adequately address downward pricing and other competitive pressures. The Company competes with many open-deck carriers of varying sizes, including some that may have greater access to equipment, awider range of services, greater capital resources, less indebtedness or other competitive advantages and including smaller, regionalservice providers that cover specific shipping lanes with specific customers or that offer niche services. The Company also competes,to a lesser extent, with some less-than-truckload carriers, railroads, and third-party logistics, brokerage, freight forwarding and othertransportation companies. Numerous competitive factors could impair the Company’s ability to maintain or improve its profitability.These factors include the following: · many of the Company’s competitors periodically reduce their freight rates to gain business, especially during times of reduced
growth or a downturn in the economy, which may limit the Company’s ability to maintain or increase freight rates, may requirethe Company to reduce its freight rates or may limit its ability to maintain or expand its business;
· some shippers have reduced or may reduce the number of carriers they use by selecting core carriers as approved service
providers and in some instances the Company may not be selected; · many customers periodically solicit bids from multiple carriers for their shipping needs, which may depress freight rates or result
in a loss of business to competitors; · the continuing trend toward consolidation in the trucking industry may result in more large carriers with greater financial
resources and other competitive advantages, and the Company may have difficulty competing with them; · advances in technology may require the Company to increase investments in order to remain competitive, and its customers may
not be willing to accept higher freight rates to cover the cost of these investments; · higher fuel prices and, in turn, higher fuel surcharges to the Company’s customers may cause some of its customers to consider
freight transportation alternatives, including rail transportation; · competition from freight logistics and brokerage companies may negatively impact the Company’s customer relationships and
freight rates; · the Company may have higher exposure to litigation risks as compared to smaller carriers; and · smaller carriers may build economies of scale with procurement aggregation providers, which may improve the smaller carriers’
abilities to compete with the Company.
Driver shortages and increases in driver compensation or owner-operator contracted rates could adversely affect the Company’sprofitability and ability to maintain or grow its business. Driver shortages in the industry have required, and could continue to require, the Company to spend more money to attract
13

Table of Contents
and retain company and owner-operator drivers. The Company’s challenge with attracting and retaining qualified drivers primarilystems from intense market competition, which may subject it to increased payments for driver compensation and owner-operatorcontracted rates. Also, because of the intense competition for drivers, the Company may face difficulty maintaining or increasing itsnumber of company and owner-operator drivers. Compliance and enforcement with initiatives included in the CSA programimplemented by the FMCSA and regulations adopted by the DOT relating to driver time and safety and fitness could also reduce theavailability of qualified drivers. In addition, like most in the Company’s industry, the Company suffers from a high turnover rate ofdrivers, especially, with respect to company drivers, in the first 180 days of employment. The high turnover rate requires theCompany to continually recruit a substantial number of drivers in order to operate existing revenue equipment. Further, with respectto owner-operator drivers, shortages can result from contractual terms or company policies that make contracting with the Companyless desirable to certain owner-operator drivers. Due to the absence of long-term personal services contracts, owner-operators canquickly terminate their business relationships with the Company. If the Company is unable to continue to attract and retain asufficient number of company and owner-operator drivers, it could be required to operate with fewer trucks and face difficultymeeting shipper demands or be forced to forego business that would otherwise be available to it, which developments couldadversely affect its profitability and ability to maintain or grow its business. The loss of senior management or key operating personnel could adversely affect operations. The Company’s success to date has depended, and will continue to depend, largely on the skills, efforts and motivation of Mr.Daseke, its Chairman and Chief Executive Officer, and on the other members of its senior management team, who generally havesignificant experience with the Company and within the transportation industry. Mr. Daseke, age 79, has been the Company’sChairman and Chief Executive Officer since its formation. The Company also depends on the continued service of key operatingpersonnel. If for any reason the services of its key personnel, particularly Mr. Daseke, were to become unavailable, there could be amaterial adverse effect on its business, financial condition, results of operations, cash flows and prospects. A key component of the Company’s strategy includes selectively pursuing strategic and complementary acquisitions; however, itmay not be able to execute future acquisitions successfully. Historically, a key component of the Company’s growth strategy has been to pursue acquisitions of strategic and complementarybusinesses. For example, from 2009 to the date hereof, the Company has acquired more than 20 businesses. While the Company’sshort-term strategy does not include any acquisitions, the Company expects to continue considering acquisitions in the future andexpects that acquisitions will continue to be a key component of its long-term business plan going forward. Recent or futureacquisitions may negatively impact its business, financial condition, results of operations, cash flows and prospects because: · the Company may assume liabilities, including environmental liabilities, or be subject to risks beyond its estimates or what was
disclosed to it; · the acquisition could divert management’s attention and other resources from the Company’s existing business; · to facilitate such acquisitions, the Company may incur or assume additional indebtedness or issue additional shares of stock; and · the acquired company may require increases in working capital and capital expenditure investments to fund its growth. Further, the companies that the Company acquires may not achieve anticipated revenue, earnings or cash flows, including as a resultof the loss of any major customers or key employees, and the Company may be unable to fully realize all of the anticipated benefitsand synergies from recent and future acquisitions. Although the Company has an identified pipeline of medium-term acquisition targets as of the date hereof, the consummation of anyacquisitions will be dependent on, among other things, the results of its due diligence and the
14

Table of Contents
Company may not complete any acquisitions in its pipeline. The Company may not be able to acquire any additional companies at allor on terms favorable to it. Certain of the Company’s larger, better capitalized competitors may seek to acquire some of thecompanies the Company may be interested in, and competition for acquisitions would likely increase acquisition prices and result init having fewer acquisition opportunities.
Seasonality and the impact of weather and other catastrophic events adversely affect the Company’s operations and profitability. The Company’s operations are affected by the winter season because inclement weather impedes operations and some shippersreduce their shipments during winter. At the same time, operating expenses increase due to, among other things, a decline in fuelefficiency because of engine idling and harsh weather that creates higher accident frequency, increased claims and higher equipmentrepair expenditures. The Company also may suffer from weather-related or other events, such as tornadoes, hurricanes, blizzards, icestorms, floods, fires, earthquakes and explosions, which may disrupt fuel supplies, increase fuel costs, disrupt freight shipments orroutes, affect regional economies, destroy its assets or the assets of its customers or otherwise adversely affect the business orfinancial condition of its customers, any of which developments could adversely affect its results or make its results more volatile. The Company may be adversely affected by fluctuations in the price or availability of diesel fuel. Fuel is one of the Company’s largest operating expenses. Diesel fuel prices fluctuate greatly due to factors beyond the Company’scontrol, such as political events, price and supply decisions by oil producing countries and cartels, terrorist activities, environmentallaws and regulations, armed conflicts, depreciation of the dollar against other currencies, world supply and demand imbalances orimposition of tariffs, and hurricanes and other natural or man-made disasters, each of which may lead to an increase in the cost offuel. Such events may lead not only to increases in fuel prices, but also to fuel shortages and disruptions in the fuel supply chain.Because the Company’s operations are dependent upon diesel fuel, significant diesel fuel cost increases, shortages or supplydisruptions could materially and adversely affect its results of operations and financial condition. The Company has not usedderivatives as a hedge against higher fuel costs in the past but continues to evaluate this possibility. Increases in fuel costs, to the extent not offset by rate per mile increases or fuel surcharges, have an adverse effect on the Company’soperations and profitability. The Company incurs certain fuel costs that cannot be recovered even with respect to customers withwhich it maintains fuel surcharge programs, such as those associated with empty miles or the time when its engines are idling.Because the Company’s fuel surcharge recovery lags behind changes in fuel prices, its fuel surcharge recovery may not capture inany particular period the increased costs it pays for fuel, especially when prices are rising. Further, during periods of low freightvolumes, shippers can use their negotiating leverage to impose less compensatory fuel surcharge policies. There can be no assurancethat the Company’s fuel surcharge program will be maintained indefinitely or will be sufficiently effective. Increased prices for, or decreases in the availability of, new revenue equipment and decreases in the value of used revenueequipment could adversely affect the Company’s results of operations and cash flows. Investment in new equipment is a significant part of the Company’s annual capital expenditures, and the Company requires anavailable supply of tractors and trailers from equipment manufacturers to operate and grow its business. In recent years,manufacturers have raised the prices of new revenue equipment significantly due to increased costs of materials and, in part, to offsettheir costs of compliance with new tractor engine and emission system design requirements mandated by the EPA and various stateagencies, which are intended to reduce emissions. For example, more restrictive EPA engine and emissions system designrequirements became effective for engines built on or after January 1, 2010. In 2011, the EPA and the NHTSA established Phase 1 ofa national program to reduce greenhouse gas emissions and establish new fuel efficiency standards for medium- and heavy-dutyvehicles beginning for model year 2014 and extending through model year 2018. In October 2016, the EPA and NHTSA jointlypublished final Phase 2 standards for improving fuel efficiency and reducing greenhouse gas emissions from new on-road medium-and heavy-duty vehicles beginning for model year 2019 and extending to model year 2027. The Phase 2 standards build upon thePhase 1 standards, encouraging wider application of currently available technologies and the development of new and advanced cost-effective technologies
15

Table of Contents
through model year 2027. In addition, greenhouse gas emissions limits and fuel efficiency standards will be imposed on new trailers.Greenhouse gas emissions regulations are likely to affect equipment design and cost. More recently, in November 2018, the EPAannounced the Cleaner Trucks Initiative (CTI), pursuant to which it plans to propose and finalize a rulemaking updating standards fornitrogen oxide emissions from highway heavy-duty trucks and engines. The EPA is expected to issue a proposed rulemaking toimplement the CTI program in early 2020. Notwithstanding the federal standards, a number of states have mandated, and states maycontinue to individually mandate, additional emission-control requirements for equipment that could increase equipment or othercosts for entire fleets. Further equipment price increases may result from these federal and state requirements. If new equipmentprices increase more than anticipated, the Company could incur higher depreciation and rental expenses than anticipated. If theCompany is unable to fully offset any such increases in expenses with freight rate increases and/or improved fuel economy, its resultsof operations and cash flows could be adversely affected. The Company may face difficulty in purchasing new equipment due to decreased supply. From time to time, some originalequipment manufacturers (OEM) of tractors and trailers may reduce their manufacturing output due to lower demand for theirproducts in economic downturns or a shortage of component parts. Uncertainty as to future federal emission standards or possiblefuture inconsistencies between federal and state emission standards may also serve to decrease such manufacturing output.Component suppliers may either reduce production or be unable to increase production to meet OEM demand, creating periodicdifficulty for OEMs to react in a timely manner to increased demand for new equipment and/or increased demand for replacementcomponents as economic conditions change. At times, market forces may create market situations in which demand outstrips supply.In those situations, the Company may face reduced supply levels and/or increased acquisition costs. An inability to continue to obtainan adequate supply of new tractors or trailers for its operations could have a material adverse effect on its business, results ofoperations and financial condition. During prolonged periods of decreased tonnage levels, the Company and other trucking companies may make strategic fleetreductions, which could result in an increase in the supply of used equipment. When the supply exceeds the demand for used revenueequipment, the general market value of used revenue equipment decreases. Used equipment prices are also subject to substantialfluctuations based on availability of financing and commodity prices for scrap metal. A depressed market for used equipment couldrequire the Company to trade its revenue equipment at depressed values or to record losses on disposal or an impairment of thecarrying values of its revenue equipment that is not protected by residual value arrangements. Trades at depressed values anddecreases in proceeds under equipment disposals and impairment of the carrying values of its revenue equipment could adverselyaffect its results of operations and financial condition. The Company may not be able to generate sufficient cash to service all of its indebtedness and may be forced to take other actionsto satisfy its obligations under applicable debt instruments, which may not be successful . As of December 31, 2018, the Company had $702.4 million of indebtedness outstanding. Its ability to make scheduled payments onor to refinance its indebtedness obligations depends on its financial condition and operating performance, which are subject toprevailing economic and competitive conditions and certain financial, business and other factors beyond its control. The Companymay not be able to maintain a level of cash flows from operating activities sufficient to permit it to pay the principal, premium, ifany, and interest on its indebtedness. If the Company’s cash flows and capital resources are insufficient to fund debt service obligations, the Company may be forced toreduce or delay investments and capital expenditures, sell assets, seek additional capital or restructure or refinance indebtedness. TheCompany’s ability to restructure or refinance indebtedness will depend on the condition of the capital markets and its financialcondition at such time. Any refinancing of indebtedness could be at higher interest rates and may require the Company to complywith more onerous covenants, which could further restrict business operations. The terms of existing or future debt instruments mayrestrict the Company from adopting some of these alternatives. In addition, any failure to make payments of interest and principal onoutstanding indebtedness on a timely basis would likely result in a reduction of the Company’s credit rating, which could harm itsability to incur additional indebtedness. In the absence of sufficient cash flows and capital resources, the Company could facesubstantial liquidity problems and might be required to dispose of material assets or operations to meet debt service and otherobligations. However, the proceeds of any such disposition may not be adequate to meet any debt service obligations then due.
16

Table of Contents
The Company’s credit facilities and the terms of the Series A Preferred Stock contain restrictive covenants that may impair theCompany’s ability to conduct business, and to maintain compliance with these covenants in the future, which could lead todefault and acceleration under the credit facilities. The Company’s credit facilities and terms of the Series A Preferred Stock contain operating covenants and financial covenants thatlimit management’s discretion with respect to certain business matters. Among other things, these covenants, subject to certainlimitations and exceptions, restrict the Company’s ability to: · incur additional indebtedness; · change the nature of the business; · merge or consolidate with, or acquire, another entity; and · sell or otherwise dispose of assets.
In addition, the Company’s credit facilities and certain of its other debt agreements require it to maintain certain financial ratios or toreduce its indebtedness if it is unable to comply with such ratios. These restrictions may also limit the Company’s ability to obtainfuture financings to withstand a future downturn in its business or the economy in general, or to otherwise conduct necessarycorporate activities. The Company may also be prevented from taking advantage of business opportunities that arise because of thelimitations that its debt agreements impose on it. A breach of any covenant in the Company’s credit facilities or certain of its other debt agreements would result in a defaultthereunder after any applicable grace periods expire and, if not waived, could result in acceleration of amounts borrowed thereunder.Further, the Company’s credit facilities and certain of its other debt agreements contain cross-default provisions, such that a defaultunder one agreement would create a default under the other agreements. In the event of acceleration, the Company may not be able tomake all of the required payments or borrow sufficient funds to refinance such indebtedness. Even if new financing were available atthat time, it may not be on terms that are acceptable to the Company. The Company’s leverage and debt service obligations may adversely affect its financial condition, results of operations, businessprospects and ability to make payments on its debt obligations. As of December 31, 2018, the Company had $702.4 million of indebtedness outstanding. The Company’s level of indebtedness couldadversely affect it in several ways, including the following: · require the Company to dedicate a substantial portion of its cash flow from operations to service its existing debt, thereby
reducing the cash available to finance its operations and other business activities; · limit management’s discretion in operating its business and its flexibility in planning for, or reacting to, changes in its business
and the industry in which it operates; · increase its vulnerability to downturns and adverse developments in its business and the economy generally; · limit its ability to access the capital markets to raise capital on favorable terms or to obtain additional financing for working
capital, capital expenditures or acquisitions or to refinance existing indebtedness; · place restrictions on its ability to obtain additional financing, make investments, lease equipment, sell assets and engage in
business combinations; · make it more likely that a reduction in its borrowing base following a periodic redetermination could require it to repay a portion
of its then-outstanding bank borrowings;
17
Table of Contents
· make it vulnerable to increases in interest rates as indebtedness under the Company’s credit facilities may vary with prevailing
interest rates; · place it at a competitive disadvantage relative to competitors with lower levels of indebtedness in relation to their overall size or
less restrictive terms governing their indebtedness; and · make it more difficult for it to satisfy its obligations under its debt instruments and increase the risk that it may default on its
debt obligations.
The Company may incur substantial additional indebtedness, which could increase the risks it faces. While the Company’s credit facilities contain restrictions on the Company’s ability to incur additional indebtedness, such restrictionsare subject to waiver and a number of significant qualifications and exceptions. Indebtedness incurred in compliance with theserestrictions could be substantial. Additional leverage increases the risks described above under “— The Company’s leverage and debtservice obligations may adversely affect its financial condition, results of operations, business prospects and ability to makepayments on its debt obligations.” Furthermore, any increase in the Company’s level of indebtedness will have several importanteffects on its future operations, including, without limitation: · it will have additional cash requirements in order to support the payment of interest on its outstanding indebtedness; · increases in its outstanding indebtedness and leverage will increase its vulnerability to adverse changes in general economic and
industry conditions, as well as to competitive pressure; and · depending on the levels of its outstanding indebtedness, its ability to obtain additional financing for working capital, capital
expenditures, general corporate and other purposes may be limited.
The Company has significant ongoing capital expenditure requirements. If the Company is unable to obtain such capital onfavorable terms or at all, it may not be able to execute on its business plans and its business, financial condition, results ofoperations, cash flows and prospects may be adversely affected. The Company’s business is capital intensive. Its capital expenditures focus primarily on revenue equipment replacement and, to alesser extent, facilities, revenue equipment growth and investments in information technology. The Company also expects to devotesubstantial financial resources to grow its operations and fund its organic growth or acquisition activities. As a result of theCompany’s funding requirements, it likely will need to sell additional equity or debt securities or seek additional financing throughother arrangements to increase its cash resources. Any sale of additional equity or debt securities may result in dilution to itsstockholders. Public or private financing may not be available in amounts or on terms acceptable to the Company, if at all. If the Company is unable to obtain additional financing, it may be required to delay, reduce the scope of, or eliminate futureacquisition activities or growth initiatives, which could adversely affect its business, financial condition and operating results. In suchcase, the Company may also operate its revenue equipment (including tractors and trailers) for longer periods, which would result inincreased maintenance costs, which would in turn reduce its operating income. Increases in interest rates could adversely affect the Company’s business. The Company’s business and operating results can be harmed by factors such as the availability, terms of and cost of capital,increases in interest rates or a reduction in credit rating. These changes could cause the Company’s cost of doing business to increaseand limit its ability to pursue organic growth or acquisition opportunities. For example, as of December 31, 2018, outstandingborrowings were approximately $702.4 million, and a 1.0% increase in interest rates would result in an increase in annual interestexpense of approximately $7.0 million, assuming the $702.4 million in debt was outstanding for the full year, before the effects ofincome taxes. Recent and continuing disruptions and volatility in the global financial markets may lead to a contraction in creditavailability impacting its ability to finance its operations. The
18
Table of Contents
Company requires continued access to capital. A significant reduction in cash flows from operations or the availability of credit couldmaterially and adversely affect its ability to achieve its planned growth and operating results. The Company operates in a highly-regulated industry, and changes in existing laws or regulations, or liability under existing orfuture laws or regulations, could have a material adverse effect on its results of operations and profitability. The Company operates in the United States pursuant to operating authority granted by the DOT and in various Canadian provincespursuant to operating authority granted by the Ministries of Transportation and Communications in such provinces. The Company, aswell as its company and owner-operator drivers, must also comply with governmental regulations regarding safety, equipment,environmental protection and operating methods. Examples include regulation of equipment weight, equipment dimensions, fuelemissions, driver hours-of-service, driver eligibility requirements, on-board reporting of operations and ergonomics. The Companymay become subject to new, or amendment of existing, laws and regulations, reinterpretation of legal requirements or increasedgovernmental enforcement that may impose more restrictive regulations relating to such matters that may require changes in itsoperating practices, influence the demand for transportation services or require it to incur significant additional costs. Possiblechanges to laws and regulations include: · increasingly stringent environmental laws and regulations, including changes intended to address NOx emissions as well as fuel
efficiency and greenhouse gas emissions that are attributed to climate change; · restrictions, taxes or other controls on emissions; · regulation specific to the energy market and logistics providers to the industry; · changes in the hours-of-service regulations, which govern the amount of time a driver may drive in any specific period; · driver and vehicle ELD requirements; · requirements leading to accelerated purchases of new trailers; · mandatory limits on vehicle weight and size; · driver hiring or retention restrictions; · increased bonding or insurance requirements; and · security requirements imposed by the DHS. From time to time, various legislative proposals are introduced, including proposals to increase federal, state or local taxes, includingtaxes on motor fuels and emissions, which may increase the Company’s or its independent affiliates’ operating costs, require capitalexpenditures or adversely impact the recruitment of drivers. Restrictions on greenhouse gas emissions or climate change laws or regulations could also affect the Company’s customers that usesignificant amounts of energy or burn fossil fuels in producing or delivering the products the Company carries, which, in turn, couldadversely impact the demand for the Company’s services as well as its operations. Additionally, recent activism directed at shiftingfunding away from companies with energy-related assets could result in limitations or restrictions on certain sources of funding forthe energy sector, which also could adversely impact the demand for the Company’s services and its operations. The Company alsocould lose revenue if its customers divert business from it because the Company has not complied with customer sustainabilityrequirements. See “Item 1. Business - Regulation” for information regarding several proposed, pending and final regulations thatcould significantly impact the Company’s business and operations.
19

Table of Contents
Safety-related evaluations and rankings under the CSA program could adversely impact the Company’s relationships with itscustomers and its ability to maintain or grow its fleet, each of which could have a material adverse effect on its results ofoperations and profitability. The CSA includes compliance and enforcement initiatives designed to monitor and improve commercial motor vehicle safety bymeasuring the safety record of both the motor carrier and the driver. These measurements are scored and used by the FMCSA toidentify potential safety risks and to direct enforcement action. Certain measurements and scores collected by the CSA fromtransportation companies are available to the general public on the FMCSA’s website. The Company’s CSA scores are dependent upon its safety and compliance experience, which could change at any time. In addition,the safety standards prescribed in the CSA program or the underlying methodology used by the FMCSA to determine a carrier’ssafety rating could change and, as a result, the Company’s ability to maintain an acceptable score could be adversely impacted. Forexample, pursuant to a 2015 federal statutory mandate, the FMCSA commissioned the National Academy of Sciences (NAS) toconduct a study and report upon the CSA program and its underlying Safety Measurement System (SMS), which is the FMCSA’sprocess for identifying patterns of non-compliance and issuing safety-fitness determinations for motor carriers. In June 2017, theNAS published a report on the subject providing specific recommendations and concluding, among other things, that the FMCSAshould explore a more formal statistical model to replace the current SMS process. In June 2018, the FMCSA posted its response tothe NAS study in a report to Congress, concluding, among other things, that it would develop and test a new model, the ItemResponse Theory (IRT), which would replace the SMS process currently used. The FMCSA was expected to commence small scaletesting of the IRT model as early as September 2018, with full-scale testing expected to occur in April 2019 and possible programroll-out expected to occur in late 2019 but the testing schedule has been delayed. The FMCSA’s June 2018 response is under audit bythe DOT Inspector General to assess consistency with the NAS recommendations, and the audit findings will guide the agency’sactions and timing with respect to testing of the IRT model as a potential replacement for the SMS. In the event and to the extent thatthe FMCSA adopts the IRT model in replacement of the SMS or otherwise pursues rulemakings in the future that revise themethodology used to determine a carrier’s safety rating in a manner that incorporates more stringent standards, then it is possible thatthe Company and other motor carriers could be adversely affected, as compared to consideration of the current standards. If theCompany receives an unacceptable CSA score, whether under the current SMS process, the IRT model, should it be finalized andadopted, or as a result of some other safety-fitness determination, its relationships with customers could be damaged, which couldresult in a loss of business. Additionally, the requirements of CSA could shrink the industry’s pool of drivers as those with unfavorable scores could leave theindustry. As a result, the costs to attract, train and retain qualified drivers could increase. In addition, a shortage of qualified driverscould increase driver turnover, decrease asset utilization, limit growth and adversely impact the Company’s results of operations andprofitability. The Company is subject to environmental and worker health and safety laws and regulations that may expose it to significantcosts and liabilities and have a material adverse effect on its results of operations, competitive position and financial condition. The Company is subject to stringent and comprehensive federal, state, provincial, local and foreign environmental and worker healthand safety laws and regulations governing, among other matters, the operation of fuel storage tanks, release of emissions from itsvehicles (including engine idling) and facilities, the health and safety of its workers in conducting operations, and adverse impacts tothe environment. Under certain environmental laws, the Company could be subject to strict joint and several liability, without regardto fault or legality of conduct, for costs relating to contamination at facilities the Company owns or operates or previously owned oroperated and at third-party sites where the Company disposed of waste, as well as costs associated with the clean-up of releasesarising from accidents involving the Company’s vehicles. The Company often operates in industrial areas, where truck terminals andother industrial activities are located, and where soil, groundwater or other forms of environmental contamination have occurredfrom historical or recent releases and for which the Company has incurred and may, in the future, incur remedial or otherenvironmental liabilities. The Company also maintains aboveground and underground bulk fuel storage tanks and fueling islands atsome of its facilities and vehicle maintenance operations at certain of its facilities. The Company’s operations involve the risks offuel spillage or seepage into the environment, environmental damage and unauthorized hazardous material spills, releases or disposalactions,
20
Table of Contents
among others. Increasing efforts to control air emissions, including greenhouse gases, may have an adverse effect on the Company. Federal andstate lawmakers have implemented, and are considering, a variety of new climate-change initiatives and greenhouse gas regulationsthat could increase the cost of new tractors, impair productivity and increase the Company’s operating expenses. For example, in2011, the NHTSA and the EPA adopted final Phase 1 rules that established the first-ever fuel economy and greenhouse gas standardsfor medium- and heavy-duty vehicles, including certain combination tractors’ model years 2014 to 2018 and, in October 2016, theEPA and NHTSA jointly published final Phase 2 standards for improving fuel efficiency and reducing greenhouse gas emissionsfrom new on-road medium- and heavy-duty vehicles beginning for model year 2019 through model year 2027. In addition,greenhouse gas emissions limits and fuel efficiency standards will be imposed on new trailers. More recently, in November 2018, theEPA announced the CTI, pursuant to which it plans to propose and finalize a rulemaking updating standards for nitrogen oxideemissions from highway heavy-duty trucks and engines. The EPA is expected to issue a proposed rulemaking to implement the CTIprogram in early 2020. Compliance with environmental laws and regulations may also increase the price of the Company’s equipment and otherwise affectthe economics of the Company’s industry by requiring changes in operating practices or by influencing the demand for, or the costsof providing, transportation services. For example, regulations issued by the EPA and various state agencies that require progressivereductions in exhaust emissions from diesel engines have resulted in higher prices for tractors and diesel engines and increasedoperating and maintenance costs. Also, in order to reduce exhaust emissions, some states and municipalities have begun to restrict thelocations and amount of time where diesel-powered tractors, such as the Company’s, may idle. These restrictions could force theCompany to alter its drivers’ behavior, purchase on-board power units that do not require the engine to idle or face a decrease inproductivity. The Company is also subject to potentially stringent rulemaking related to sustainability practices, includingconservation of resources by decreasing fuel consumption. This increased focus on sustainability practices may result in newregulations and/or customer requirements that could adversely impact the Company’s business. If the Company has operational spills or accidents or if it is found to be in violation of, or otherwise liable under, environmental orworker health or safety laws or regulations, the Company could incur significant costs and liabilities. Those costs and liabilities mayinclude the assessment of sanctions, including administrative, civil and criminal penalties, the imposition of investigatory, remedialor corrective action obligations, the occurrence of delays in permitting or performance of projects, and the issuance of ordersenjoining performance of some or all of the Company’s operations in a particular area. The occurrence of any one or more of thesedevelopments could have a material adverse effect on the Company’s results of operations, competitive position and financialcondition. Environmental and worker health and safety laws are becoming increasingly more stringent and there can be no assurancesthat compliance with, or liabilities under, existing or future environmental and worker health or safety laws or regulations will nothave a material adverse effect on the Company’s business, financial condition, results of operations, cash flows or prospects. See“Item 1. Business - Regulation” for information regarding several proposed, pending and final regulations that could significantlyaffect the Company’s business and operations. The Company is subject to the risks of litigation and governmental proceedings, which could adversely affect its business. The Company is, and in the future may be, subject to legal and governmental proceedings and claims. The parties in such legalactions may seek amounts from the Company that may not be covered in whole or in part by insurance. Defending itself against suchlegal actions could result in significant costs and could require a substantial amount of time and effort by the Company’smanagement team. The Company cannot predict the outcome of litigation or governmental proceedings to which it is a party orwhether it will be subject to future legal actions. As a result, the potential costs associated with legal actions against the Companycould adversely affect its business, financial condition, results of operations, cash flows or prospects. Insurance and claims expenses could significantly reduce the Company’s profitability. The Company is exposed to claims related to auto liability, general liability, directors and officers liability, liability related
21

Table of Contents
to cybersecurity attacks, cargo loss and damage, property damage, personal injury, workers’ compensation, group health and groupdental. The Company has insurance coverage with third-party insurance carriers, but it assumes a significant portion of the riskassociated with these claims due to its self-insured retention (SIR) and deductibles, which can make its insurance and claims expensehigher or more volatile. Additionally, the Company faces the risks of increasing premiums and collateral requirements and the risk ofcarriers or underwriters leaving the transportation sector, which may materially affect its insurance costs or make insurance moredifficult to find, as well as increase its collateral requirements. The Company could experience increases in its insurance premiums inthe future if it decides to increase its coverage or if its claims experience deteriorates. In addition, the Company is subject to changingconditions and pricing in the insurance marketplace and the Company cannot assure you that the cost or availability of various typesof insurance may not change dramatically in the future. If the Company’s insurance or claims expense increases, and the Company isunable to offset the increase with higher freight rates, its results of operations could be materially and adversely affected. TheCompany’s results of operations may also be materially and adversely affected if it experiences a claim in excess of its coveragelimits, a claim for which coverage is not provided or a claim that is covered but its insurance company fails to perform. The Company derives a material portion of its revenue from its major customers, the loss of one or more of which could have amaterial adverse effect on the Company’s business. A material portion of the Company’s revenue is generated from its major customers, the loss of one or more of which could have amaterial adverse effect on the Company’s business. In 2018, 2017 and 2016, the Company’s top ten customers, based on revenue,accounted for approximately 29%, 31% and 36%, respectively, of the Company’s revenue, and the Company’s largest customeraccounted for approximately 5%, 6% and 8%, respectively, of its revenue. A material portion of the Company’s freight is fromcustomers in the building materials industry, and as such, the Company’s results may be more susceptible to trends in constructioncycles, which are affected by numerous factors, including rates of infrastructure spending, real estate equity values, interest rates andgeneral economic conditions, than carriers that do not have this concentration. Economic conditions and capital markets may adversely affect the Company’s customers and their ability to remain solvent. TheCompany’s customers’ financial difficulties can negatively impact the Company’s results of operations and financial condition andthe Company’s ability to comply with the covenants in its debt agreements, especially if they were to delay or default on payments tous. Generally, the Company does not have contractual relationships that guarantee any minimum volumes with customers, and theCompany cannot assure you that customer relationships will continue as presently in effect. A reduction in, or termination of, theCompany’s services by one or more of its major customers could have a material adverse effect on the Company’s business andoperating results. Difficulty in obtaining goods and services from the Company’s vendors and suppliers could adversely affect the Company’sbusiness. The Company is dependent upon its vendors and suppliers, including equipment manufacturers, for tractors, trailers and otherproducts and materials. The Company believes that it has positive vendor and supplier relationships and are generally able to obtainfavorable pricing and other terms from such parties. If the Company fails to maintain amenable relationships with its vendors andsuppliers, or if its vendors and suppliers are unable to provide the products and materials the Company needs or undergo financialhardship, the Company could experience difficulty in obtaining needed goods and services, and subsequently, its business andoperations could be adversely affected. The Company is subject to certain risks arising from doing business in Canada and Mexico. The Company provides trucking services in Canada in addition to the United States, and the Company also transports freight into andout of Mexico by transferring the Company’s trailers to tractors operated by Mexican-based carriers with which the Company hascontractual and long-standing relationships. As a result, the Company is subject to risks of doing business internationally, includingfluctuations in foreign currencies, changes in the economic strength of Canada and Mexico, difficulties in enforcing contractualobligations and intellectual property rights through non-U.S. legal systems, burdens of complying with a wide variety of internationaland United States export and import laws, and social, political, and economic instability. In addition, if the Company is unable tomaintain its Customs-Trade Partnership Against
22

Table of Contents
Terrorism (C-TPAT) status, it may have significant border delays, which could cause its operations in Canada to be less efficient thanthose of competitor truckload carriers also operating in Canada that obtain or continue to maintain C-TPAT status, and the Companymay face a loss of certain business due to customer requirements to deal only with C-TPAT participating carriers. As a C-TPATparticipant, the Company’s security measures are subject to periodic review by the United States Customs and Border Protection(CBP), and the Company is required to perform an annual security threat assessment of its international operations. If CBPdetermines the Company has failed to comply with its minimum security criteria for highway carriers and other evolving securitystandards recommended by the agency, the Company may be unable to maintain its C-TPAT status. The Company also facesadditional risks associated with its foreign operations, including restrictive trade policies and imposition of duties, taxes orgovernment royalties imposed by the Canadian or Mexican government, to the extent not preempted by the terms of North AmericanFree Trade Agreement, or any other trade agreement between Mexico, Canada and the U.S. that may replace it. Further, to the extent that the Company conducts operations outside of the United States, it is subject to the Foreign Corrupt PracticesAct (FCPA), which generally prohibits United States companies and their intermediaries from making improper payments to foreignofficials for the purpose of obtaining or retaining favorable treatment. If the Company is not in compliance with the FCPA, otheranti-corruption laws or other laws governing the conduct of business with government entities (including local laws), it may besubject to criminal and civil penalties and other remedial measures, which could harm its reputation and have a material adverseimpact on the Company’s business, financial condition, results of operations, cash flows and prospects. Any investigation of anyactual or alleged violations of such laws could also harm the Company’s reputation or have a material adverse impact on its business,financial condition, results of operations, cash flows and prospects. The Company’s contractual agreements with its owner-operators expose it to risks that it does not face with its company drivers. The Company relies, in part, upon independent contractor owner-operators to perform the services for which it contracts withcustomers. Approximately 31% of the Company’s freight was carried by independent contractor owner-operators in 2018. TheCompany’s reliance on independent contractor owner-operators creates numerous risks for the Company’s business. For example, theCompany provides financing to certain of its independent contractor owner-operators purchasing tractors from the Company. Ifowner-operators operating the tractors the Company financed default under or otherwise terminate the financing arrangement and theCompany is unable to find a replacement owner-operator, the Company may incur losses on amounts owed to it with respect to thetractor in addition to any losses it may incur as a result of idling the tractor. Further, if the Company is unable to provide suchfinancing in the future, due to liquidity constraints or other restrictions, the Company may experience a shortage of owner-operatorsavailable to it. If the Company’s independent contractor owner-operators fail to meet the Company’s contractual obligations or otherwise fail toperform in a manner consistent with the Company’s requirements, the Company may be required to utilize alternative serviceproviders at potentially higher prices or with some degree of disruption of the services that the Company provides to customers. If theCompany fails to deliver on time, if its contractual obligations are not otherwise met, or if the costs of its services increase, then theCompany’s profitability and customer relationships could be harmed. The financial condition and operating costs of the Company’s independent contractor owner-operators are affected by conditions andevents that are beyond the Company’s control and may also be beyond their control. Adverse changes in the financial condition ofthe Company’s independent contractor owner-operators or increases in their equipment or operating costs could cause them to seekhigher revenues or to cease their business relationships with the Company. The prices the Company charges its customers could beimpacted by such issues, which may in turn limit pricing flexibility with customers, resulting in fewer customer contracts anddecreasing the Company’s revenues. Independent contractor owner-operators typically use tractors, trailers and other equipment bearing the Company’s trade names andtrademarks. If one of the Company’s independent contractor owner-operators is subject to negative publicity, it could reflect on theCompany and have a material adverse effect on the Company’s business, brand and financial performance. Under certain laws, theCompany could also be subject to allegations of liability for the activities of its independent contractor owner-operators.
23

Table of Contents
Owner-operators are third-party service providers, as compared to company drivers who are employed by the Company. Asindependent business owners, the Company’s owner-operators may make business or personal decisions that conflict with theCompany’s best interests. For example, if a load is unprofitable, route distance is too far from home or personal scheduling conflictsarise, an owner-operator may deny loads of freight from time to time. In these circumstances, the Company must be able to timelydeliver the freight in order to maintain relationships with customers. If the Company’s owner-operators are deemed by regulators or judicial process to be employees, the Company’s business andresults of operations could be adversely affected. Tax and other regulatory authorities have in the past sought to assert that owner-operators in the trucking industry are employeesrather than independent contractors. Taxing and other regulatory authorities and courts apply a variety of standards in theirdetermination of independent contractor status. If the Company’s owner-operators are determined to be its employees, it would incuradditional exposure under federal and state tax, workers’ compensation, unemployment benefits, labor, employment, and tort laws,including for prior periods, as well as potential liability for employee benefits and tax withholdings. The Company depends on third parties in its brokerage business, and service instability from these providers could increase theCompany’s operating costs or reduce its ability to offer brokerage services, which could adversely affect its revenue, results ofoperations and customer relationships. The Company’s brokerage business is dependent upon the services of third-party capacity providers, including other truckloadcarriers. These third-party providers may seek other freight opportunities and may require increased compensation during times ofimproved freight demand or tight trucking capacity. The Company’s inability to maintain positive relationships with, and secure theservices of, these third parties, or increases in the prices the Company must pay to secure such services, could have an adverse effecton its revenue, results of operations and customer relationships. The Company’s ability to secure the services of these third-partyproviders on competitive terms is subject to a number of risks, including the following, many of which are beyond the Company’scontrol: · equipment shortages in the transportation industry, particularly among contracted truckload carriers and railroads; · interruptions in service or stoppages in transportation as a result of labor disputes, seaport strikes, network congestion, weather-
related issues, acts of God or acts of terrorism; · changes in regulations impacting transportation; · increases in operating expenses for carriers, such as fuel costs, insurance premiums and licensing expenses, that result in a
reduction in available carriers; and · changes in transportation rates.
The Company is dependent on computer and communications systems, and a systems failure or data breach could cause asignificant disruption to its business. The Company’s business depends on the efficient and uninterrupted operation of its computer and communications hardware systemsand infrastructure, including operating and financial reporting systems. The Company’s computer and communications system iscritical in meeting customer expectations, effectively tracking, maintaining and operating the Company’s equipment, directing andcompensating the Company’s employees, and interfacing with the Company’s financial reporting system. The Company’s financialreporting system receives, processes, controls and reports information for operating its business and for tabulation into its financialstatements. The Company currently maintains its computer systems at multiple locations, including several of its offices andterminals and third-party data centers, along with computer equipment at each of its terminals. The Company’s operations and thoseof its technology and communications service providers are vulnerable to interruption by fire, earthquake, power loss,telecommunications failure, terrorist
24

Table of Contents
attacks, Internet failures, computer viruses, data breaches (including cyber-attacks or cyber intrusions over the Internet, malware andthe like) and other events generally beyond its control. Although the Company believes that it has robust information securityprocedures and other safeguards in place, as cyber threats continue to evolve, it may be required to expend additional resources tocontinue to enhance its information security measures and investigate and remediate any information security vulnerabilities. Asignificant natural disaster or cyber-attack incident, including system failure, security breach, disruption by malware or other damage,could interrupt or delay the Company’s operations, damage its reputation, cause a loss of customers, agents or third-party capacityproviders, expose the Company to a risk of loss or litigation, or cause the Company to incur significant time and expense to remedysuch an event, any of which could have a material adverse impact on its results of operations and financial position. The Company’s business may be harmed by terrorist attacks, future wars or anti-terrorism measures. In the aftermath of the terrorist attacks of September 11, 2001, federal, state and municipal authorities have implemented and areimplementing various security measures, including checkpoints and travel restrictions on large trucks and fingerprinting of drivers inconnection with new hazardous materials endorsements on their licenses. Such existing measures and future measures may havesignificant costs associated with them which a motor carrier is forced to bear. Moreover, large trucks carrying large freight arepotential terrorist targets, and the Company may be obligated to take measures, including possible capital expenditures intended toprotect its trucks. In addition, the insurance premiums charged for some or all of the coverage currently maintained by the Companycould continue to increase dramatically or such coverage could be unavailable in the future. If the Company’s employees were to unionize, the Company’s operating costs could increase and its ability to compete could beimpaired. None of the Company’s employees are currently represented under a collective bargaining agreement; however, the Company alwaysfaces the risk that its employees will try to unionize, and if its owner-operators were ever re-classified as employees, the magnitudeof this risk would increase. Further, Congress or one or more states could approve legislation and/or the National Labor RelationsBoard (the NLRB) could render decisions or implement rule changes that could significantly affect the Company’s business and itsrelationship with employees, including actions that could substantially liberalize the procedures for union organization. For example,in December 2014, the NLRB implemented a final rule amending the agency’s representation-case proceedings that govern theprocedures for union representation. Pursuant to this amendment, union elections can now be held within 10 to 21 days after theunion requests a vote, which makes it easier for unions to successfully organize all employers, in all industries. In addition, theCompany can offer no assurance that the Department of Labor will not adopt new regulations or interpret existing regulations in amanner that would favor the agenda of unions. Any attempt to organize by the Company’s employees could result in increased legal and other associated costs and divertmanagement attention, and if the Company entered into a collective bargaining agreement, the terms could negatively affect its costs,efficiency and ability to generate acceptable returns on the affected operations. In particular, the unionization of the Company’semployees could have a material adverse effect on its business, financial condition, results of operations, cash flows and prospectsbecause: · restrictive work rules could hamper the Company’s efforts to improve and sustain operating efficiency and could impair the
Company’s service reputation and limit the Company’s ability to provide next-day services; · a strike or work stoppage could negatively impact the Company’s profitability and could damage customer and employee
relationships, and some shippers may limit their use of unionized trucking companies because of the threat of strikes and otherwork stoppages; and
· an election and bargaining process could divert management’s time and attention from the Company’s overall objectives and
impose significant expenses.
25

Table of Contents
Higher health care costs and labor costs could adversely affect the Company’s financial condition and results of operations. With the passage in 2010 of the United States Patient Protection and Affordable Care Act (the PPACA), the Company is required toprovide health care benefits to all full-time employees that meet certain minimum requirements of coverage and affordability, orotherwise be subject to a payment per employee based on the affordability criteria set forth in the PPACA. Many of theserequirements have been phased in over a period of time, with the majority of the most impactful provisions affecting the Companyhaving begun in the second quarter of 2015. Additionally, some states and localities have passed state and local laws mandating theprovision of certain levels of health benefits by some employers. The PPACA also requires individuals to obtain coverage or faceindividual penalties, so employees who are currently eligible but have elected not to participate in the Company’s health care plansmay ultimately find it more advantageous to do so. It is also possible that by making changes or failing to make changes in the healthcare plans the Company offers it will have difficulty attracting and retaining employees, including drivers. Finally, implementing therequirements of health care reform is likely to impose additional administrative costs. The costs and other effects of these newhealthcare requirements may significantly increase the Company’s health care coverage costs and could materially adversely affectits financial condition and results of operations. Changes to trade regulation, quotas, duties or tariffs, caused by changing U.S. and geopolitical environments or otherwise, mayincrease the Company’s costs and materially adversely affect its business. Recent activity by the Trump administration has led to the imposition of tariffs on certain imported steel and aluminum as well as abroad range of other products imported into the United States. In response to the tariffs imposed by the United States, the EuropeanUnion, Canada, Mexico and China have announced tariffs on U.S. goods and services. The implementation of these tariffs, as well asthe imposition of additional tariffs or quotas or changes to certain trade agreements or retaliatory trade measures or tariffsimplemented by other countries, could, among other things, increase the costs of the materials used by the Company’s suppliers toproduce new revenue equipment or increase the price of fuel. Such cost increases for the Company’s revenue equipment suppliersmight be passed on to the Company, and to the extent fuel prices increase, the Company may not be able to fully recover suchincreases through rate increases or the Company’s fuel surcharge program, either of which could have a material adverse effect onthe Company’s business. Further, the continued threats of tariffs, trade restrictions, and trade barriers could have a generallydisruptive impact on the domestic economy, including the Company’s customers, and decrease demand for its services. The Company’s total assets include goodwill and indefinite-lived intangibles. If the Company determines that these items havebecome impaired in the future, net income could be materially and adversely affected. As of December 31, 2018, the Company had recorded goodwill of $258.4 million and indefinite-lived intangible assets of $90.6million. Goodwill represents the excess of cost over the fair market value of net assets acquired in business combinations. Inaccordance with Financial Accounting Standards Board Accounting Standards Codification, Topic 350, “Intangibles — Goodwilland Other,” the Company tests goodwill and indefinite-lived intangible assets for potential impairment annually and between annualtests if an event occurs or circumstances change that would more likely than not reduce the fair value below its carrying amount. Anyexcess in carrying value over the estimated fair value is charged to the Company’s results of operations. Further, the Company maynever realize the full value of its intangible assets. Any future determination requiring the write-off of a significant portion ofintangible assets could have an adverse effect on the Company’s financial condition and results of operations. If there are changes tothe methods used to allocate carrying values, if management’s estimates of future operating results change, if there are changes in theidentified reporting units or if there are changes to other significant assumptions, the estimated carrying values and the estimated fairvalue of the Company’s goodwill and long-lived assets could change significantly, and could result in future non-cash impairmentcharges, which could materially impact its results of operations and financial condition for any such future period. In the fourthquarter of 2018, the Company recorded goodwill impairment of $11.1 million related to one reporting unit. A sustained relatively lowstock price may result in additional goodwill tests and potential impairment charges.
26

Table of Contents
The requirements of being a public company, including compliance with the reporting requirements of the Exchange Act and therequirements of the Sarbanes-Oxley Act, may strain the Company’s resources, increase the Company’s costs and distractmanagement. As a public company, the Company must comply with new laws, regulations and requirements, certain corporate governanceprovisions of the Sarbanes-Oxley Act of 2002, related regulations of the SEC and the requirements of The NASDAQ Capital Market(NASDAQ), with which the Company was not required to comply as a private company. For example, the Company must: · maintain a comprehensive compliance function; · comply with rules promulgated by NASDAQ; · prepare and distribute periodic public reports in compliance with obligations under the federal securities laws; · establish new internal policies, such as those relating to insider trading; and · involve and retain to a greater degree outside counsel and accountants in the above activities. Complying with statutes, regulations and requirements relating to public companies occupies a significant amount of time ofmanagement and significantly increases the Company’s costs and expenses, which could have a material adverse effect on theCompany’s business, financial condition, results of operations and cash flows. Furthermore, the Company’s management may not beable to implement programs and policies to comply with such statutes, regulations and requirements in an effective and timelymanner. These costs and demands have become greater especially now that the Company is no longer an “emerging growth company” underthe Jumpstart Our Business Startups (JOBS) Act enacted in April 2012. Because the Company is no longer an emerging growthcompany as of January 1, 2019, the Company is required to include an attestation report on internal control over financial reportingissued by the Company’s independent registered public accounting firm. To achieve compliance with Section 404 of the Sarbanes-Oxley Act, the Company has been engaged in a process to document and evaluate its internal control over financial reporting, whichis both costly and challenging. In this regard, the Company continues to dedicate internal resources to assess and document theadequacy of internal control over financial reporting, to take steps to improve control processes as appropriate, to validate throughtesting that controls are functioning as documented and to implement a continuous reporting and improvement process for internalcontrol over financial reporting. The Company has identified material weaknesses in its internal control over financial reporting that, if not remediated, couldresult in material misstatements in the Company’s financial statements, cause the Company to fail to meet its periodic reportingobligations, or adversely affect investor confidence. The Company has identified three material weaknesses in internal control over financial reporting in the 2018 fiscal year. A materialweakness is a deficiency, or a combination of deficiencies, in internal control over financial reporting such that there is a reasonablepossibility that a material misstatement of the Company’s annual or interim financial statements will not be prevented or detected ona timely basis. As of December 31, 2018 three material weaknesses were identified relating to information technology generalcontrols, review and approval of manual journal entries and the review and approval of payroll and revenue transactions. TheCompany concluded that deficiencies in the design and operating effectiveness over information technology general computercontrols related to change management, user access and management’s review of the completeness and accuracy of certain system-generated reports resulted in a material weakness. The Company also determined that deficiencies in controls to ensure that journalentries were properly reviewed and approved by an appropriate individual separate from the preparer of the journal entry resulted in amaterial weakness. Additionally, the Company concluded that at two operating companies deficiencies in review and approval ofpayrolls and at one of those operating companies, deficiencies in review and approval of revenue transactions resulted in a materialweakness. The Company may not be able to complete its remediation, evaluation and testing in a timely fasion and its remediationefforts
27

Table of Contents
may not be successful once completed. If the remedial measures implemented are determined to be insufficient to address the Company’s current material weaknesses or ifadditional material weaknesses are discovered or occur in the future, the Company’s ability to record, process and report financialinformation accurately, and to prepare financial statements within the time periods specified by the rules and forms of the SEC, couldbe adversely affected, and could result in material misstatements to the Company’s annual or interim financial statements. Ineffectiveinternal controls could also cause investors to lose confidence in the Company’s reported financial information, which could have anegative effect on the trading price of the Company’s common stock. The Company ceased to be an “emerging growth company” under the federal securities laws as of December 31, 2018. Because ofthis, the Company’s registered public accounting firm is now required to express an opinion on the effectiveness of the Company’sinternal controls. Given the difficulties inherent in the design and operation of a system of internal controls over financial reporting,the Company can provide no assurance as to its, or its independent registered public accounting firms’, future conclusions about theeffectiveness of the Company’s system of internal controls over financial reporting, and the Company may incur significant costs inits efforts to comply with Section 404 of the Sarbanes-Oxley Act on an ongoing basis. If, in the future, the Company is unable toconfirm that its internal control over financial reporting is effective, or if the Company’s registered public accounting firm is unableto express an opinion on the effectiveness of the Company’s internal controls, the Company could be subject to additional regulatoryscrutiny and lose investor confidence in the accuracy and completeness of its financial reports, which could have an adverse effect onthe Company’s business and would likely have a negative effect on the trading price of the Company’s common stock. A small number of the Company’s stockholders hold a substantial portion of its outstanding common stock. Mr. Daseke and his affiliates beneficially own approximately 28% of the Company’s common stock as of December 31, 2018. Inaddition, Mr. Daseke serves as the Company’s Chief Executive Officer and Chairman of the Board of Directors. Consequently, Mr.Daseke and his affiliates are able to strongly influence all matters that require approval by the Company’s stockholders, including theelection and removal of directors, changes to the Company’s organizational documents and approval of acquisition offers and othersignificant corporate transactions. In addition, other members of the Company’s board of directors and key management at thecorporate level and at the Company’s operating companies own more than an additional 13% of the Company’s common stock as ofDecember 31, 2018. This concentration of ownership will limit other stockholders’ ability to influence corporate matters, and as aresult, actions may be taken that you may not view as beneficial and may have the effect of delaying or preventing a change incontrol and might adversely affect the market price of the Company’s common stock to the extent investors perceive a disadvantagein owning stock of a company with a controlling stockholder. The Company’s charter designates the Court of Chancery of the State of Delaware as the sole and exclusive forum for certaintypes of actions and proceedings that may be initiated by its stockholders, which could limit its stockholders’ ability to obtain afavorable judicial forum for disputes with the Company or its directors, officers, employees or agents. The Company’s charter provides that, unless it consents in writing to the selection of an alternative forum, the Court of Chancery ofthe State of Delaware will, to the fullest extent permitted by applicable law, be the sole and exclusive forum for (i) any derivativeaction or proceeding brought on the Company’s behalf, (ii) any action asserting a claim of breach of a fiduciary duty owed by any ofthe Company’s directors, officers, employees or agents to us or the Company’s stockholders, (iii) any action asserting a claim arisingpursuant to any provision of Delaware General Corporation Law (DGCL) or the Company’s charter or bylaws, or (iv) any actionasserting a claim against the Company that is governed by the internal affairs doctrine, in each such case subject to such Court ofChancery having personal jurisdiction over the indispensable parties named as defendants therein. Any person or entity purchasing orotherwise acquiring any interest in shares of the Company’s capital stock will be deemed to have notice of, and consented to, theprovisions of the Company’s charter described in the preceding sentence. This choice of forum provision may limit a stockholder’sability to bring a claim in a judicial forum that it finds favorable for disputes with the Company or its directors, officers, employeesor agents, which may discourage such lawsuits against the Company and such persons. Alternatively, if a court were to find theseprovisions of the Company’s charter inapplicable to, or unenforceable in respect of, one or more of the specified
28

Table of Contents
types of actions or proceedings, the Company may incur additional costs associated with resolving such matters in other jurisdictions,which could adversely affect its business, financial condition or results of operations. Some provisions of the Company’s governing documents and Delaware law may inhibit a takeover, which could limit the priceinvestors might be willing to pay in the future for its common stock. Some provisions in the Company’s charter and bylaws may have the effect of delaying, discouraging, or preventing an acquisition ofthe Company or a merger in which the Company is not the surviving company and may otherwise prevent or slow changes in theCompany’s board of directors and management. These provisions include: · no cumulative voting in the election of directors, which limits the ability of minority stockholders to elect director candidates; · the exclusive right of the Company’s board of directors to elect a director to fill a vacancy created by the expansion of the board
of directors or the resignation, death, or removal of a director with or without cause by stockholders, which preventsstockholders from being able to fill vacancies on the Company’s board of directors;
· the ability of the Company’s board of directors to determine whether to issue shares of the Company’s preferred stock and to
determine the price and other terms of those shares, including preferences and voting rights, without stockholder approval, whichcould be used to significantly dilute the ownership of a hostile acquirer;
· a prohibition on stockholder action by written consent, which forces stockholder action to be taken at an annual or special
meeting of the Company’s stockholders; · the requirement that a special meeting of stockholders may be called only by the chairman of the board of directors, the chief
executive officer, or the board of directors, which may delay the ability of the Company’s stockholders to force consideration ofa proposal or to take action, including the removal of directors;
· limiting the liability of, and providing indemnification to, the Company’s directors and officers; · controlling the procedures for the conduct and scheduling of stockholder meetings; · providing for a staggered board, in which the members of the board of directors are divided into three classes to serve for a
period of three years from the date of their respective appointment or election; and · advance notice procedures that stockholders must comply with in order to nominate candidates to the Company’s board of
directors or to propose matters to be acted upon at a stockholders’ meeting, which may discourage or deter a potential acquirerfrom conducting a solicitation of proxies to elect the acquirer’s own slate of directors or otherwise attempting to obtain controlof the Company.
These provisions, alone or together, could delay hostile takeovers and changes in control of the Company or changes in theCompany’s board of directors and management. As a Delaware corporation, the Company is also subject to provisions of Delaware law, including Section 203 of the DGCL, whichprohibits business combinations between us and one or more significant stockholders unless specified conditions are met. Theseprovisions could discourage an acquisition of the Company or other change in control transaction, whether or not it is desired orbeneficial to the Company’s stockholders, and thereby negatively affect the price that investors might be willing to pay in the futurefor the Company’s common stock. In addition, to the extent that these provisions discourage an acquisition of the Company or otherchange in control transaction, they could deprive stockholders of opportunities to realize takeover premiums for their shares of theCompany’s common stock.
29
Table of Contents
The Company does not currently pay dividends on its common stock. The Company does not currently intend to pay cash dividends on its common stock. Any future dividend payments are within theabsolute discretion of the Company’s board of directors and will depend on, among other things, its results of operations, workingcapital requirements, capital expenditure requirements, financial condition, level of indebtedness, contractual restrictions with respectto payment of dividends, business opportunities, anticipated cash needs, provisions of applicable law and other factors that theCompany’s board of directors may deem relevant. Additionally, legal and contractual restrictions in agreements governing theCompany’s Series A Preferred Stock and current indebtedness place certain restrictions on the Company’s ability to pay cashdividends. Consequently, a stockholder’s only opportunity to achieve a return on its investment in the Company will be if thestockholder sells its common stock at a price greater than the stockholder paid for it. An active trading market for the Company’s common stock may not be sustained. Although the Company’s common stock is listed on NASDAQ, there has been a limited public market for its common stock and amore active trading market for its common stock may not develop or be sustained. An absence of an active trading market couldadversely affect the Company’s stockholders’ ability to sell its common stock in short time periods. Also, as a result of the limitedpublic market for the Company’s common stock, the Company’s share price may experience significant volatility and may notnecessarily reflect the value of the Company’s expected performance. Furthermore, an inactive trading market may impair theCompany’s ability to raise capital by selling shares and may impair its ability to acquire other companies by using the Company’sshares as consideration, which, in turn, could harm its business. If securities or industry analysts do not publish or cease publishing research or reports about the Company, its business, or itsmarket, or if they change their recommendations regarding the Company’s securities adversely, the price and trading volume ofthe Company’s common stock could decline. The trading market for the Company’s common stock will be influenced by the research and reports that industry or securitiesanalysts may publish about the Company, its business, its market, or its competitors. If any of the analysts who cover the Companychange their recommendation regarding the Company’s common stock adversely, or provide more favorable relativerecommendations about the Company’s competitors, the price of the Company’s common stock would likely decline. If any of theanalysts who cover the Company were to cease coverage of the Company or fail to regularly publish reports on it, the Companycould lose visibility in the financial markets, which could cause the price or trading volume of the Company’s common stock todecline. Uncertainties in the interpretation and application of the Tax Cuts and Jobs Act of 2017 could materially affect the Company’stax obligations and effective tax rate. On December 22, 2017, the U.S. enacted comprehensive tax legislation, commonly referred to as the Tax Cuts and Jobs Act of 2017.The new law requires complex computations not previously required by U.S. tax law. As such, the application of accountingguidance for such items is currently uncertain. Further, compliance with the new law and the accounting for such provisions requirepreparation and analysis of information not previously required or regularly produced. In addition, the U.S. Department of Treasuryhas broad authority to issue regulations and interpretative guidance that may significantly impact how the Company will apply thelaw and impact its results of operations in future periods. Accordingly, while the Company has provided a provisional estimate on theeffect of the new law in its accompanying audited financial statements, further regulatory or GAAP accounting guidance for the law,or further analysis on the application of the law, and refinement of the Company’s initial estimates and calculations could materiallychange its current provisional estimates, which could in turn materially affect its tax obligations and effective tax rate. There are alsolikely to be significant future impacts that these tax reforms will have on the Company’s future financial results and its businessstrategies. In addition, there is a risk that states or foreign jurisdictions may amend their tax laws in response to these tax reforms,which could have a material impact on the Company’s future results.
30

Table of Contents
Item 1B: Unresolved Staff Comments There are no unresolved comments from the Commission staff required to be disclosed in this Annual Report on Form 10-K. Item 2. Properties Daseke’s headquarters office, which is leased, is located in a multi-tenant office building in Addison, Texas. The Company has 105locations in North America, 27 of which are owned and 78 of which are leased. Daseke’s terminals may include general andexecutive offices, customer service, sales/marketing, fuel and/or maintenance, parking and warehousing facilities. Daseke believesthat substantially all of its property and equipment is in good condition and its buildings and improvements have sufficient capacityto meet current needs. From time to time, Daseke invests in additional facilities to meet the needs of its business as it pursuesadditional growth. The following tables provide information regarding terminals and certain other locations owned or leased by Daseke:
FLATBED SOLUTIONS Description of Activities at Location Customer Sales/
Location Owned Leased Service Marketing Fuel Maintenance Admin WarehouseBirmingham, Alabama ✔✔ ✔✔ ✔✔ ✔✔ ✔✔ ✔✔ Chickasaw, Alabama ✔✔ ✔✔ Cincinnati, Ohio ✔✔ ✔✔ ✔✔ Clarksville, Tennessee ✔✔ ✔✔ Clayton, Alabama ✔✔ ✔✔ ✔✔ ✔✔ ✔✔ Cofield, North Carolina ✔✔ ✔✔ ✔✔ Des Moines, Iowa ✔✔ Dravosburg, Pennsylvania ✔✔ ✔✔ Effingham, Illinois ✔✔ ✔✔ Greenville, Mississippi ✔✔ ✔✔ Grenada, California ✔✔ ✔✔ Houston, Texas ✔✔ ✔✔ ✔✔ Kennesaw, Georgia ✔✔ ✔✔ Lanesville, Indiana ✔✔ ✔✔ ✔✔ Laredo, Texas ✔✔ ✔✔ ✔✔ ✔✔ Memphis, Tennessee ✔✔ ✔✔ ✔✔ ✔✔ ✔✔ Monroeville, Alabama ✔✔ ✔✔ ✔✔ ✔✔ Nashville, Tennessee ✔✔ ✔✔ ✔✔ ✔✔ ✔✔ Pawleys Island, South Carolina ✔✔ ✔✔ Redmond, Oregon ✔✔ ✔✔ ✔✔ ✔✔ ✔✔ ✔✔ Springfield, Oregon ✔✔ ✔✔ ✔✔ ✔✔ ✔✔ Tuscaloosa, Alabama ✔✔ ✔✔ ✔✔ ✔✔ ✔✔ ✔✔ Whites Creek, Tennessee ✔✔ ✔✔
31

Table of Contents
SPECIALIZED SOLUTIONS Description of Activities at Location Customer Sales/
Location Owned Leased Service Marketing Fuel Maintenance Admin WarehouseAbilene, Texas ✔✔ ✔✔ Angleton, Texas ✔✔ ✔✔ ✔✔ Arlington, Washington ✔✔ ✔✔ ✔✔ ✔✔ ✔✔ Berwick, Pennsylvania ✔✔ ✔✔ ✔✔Bloomfield, Indiana ✔✔ ✔✔ Bossier City, Louisiana ✔✔ ✔✔ ✔✔ Calgary, Alberta ✔✔ ✔✔ Carthage, Missouri ✔✔ ✔✔ Catlettsburg, Kentucky ✔✔ ✔✔ ✔✔ Church Hill, Tennessee ✔✔ ✔✔ ✔✔ ✔✔ ✔✔ Clairmont, Alberta ✔✔ ✔✔ ✔✔ ✔✔ ✔✔ Conyers, Georgia ✔✔ ✔✔ ✔✔ Corpus Christi, Texas ✔✔ ✔✔ ✔✔ Delphi, Indiana ✔✔ ✔✔ Denver, Colorado ✔✔ ✔✔ Duenweg, Missouri ✔✔ ✔✔ ✔✔ ✔✔ East Camden, Arkansas ✔✔ ✔✔ Evansville, Indiana ✔✔ ✔✔ ✔✔Fargo, North Dakota ✔✔ ✔✔ ✔✔ ✔✔ ✔✔ Fort Worth, Texas ✔✔ ✔✔ ✔✔ Gaffney, South Carolina ✔✔ ✔✔ ✔✔ ✔✔ Gainesville, Texas ✔✔ ✔✔ ✔✔ Garden City, Georgia ✔✔ ✔✔ ✔✔ Glendale, Arizona ✔✔ ✔✔ Greer, South Carolina ✔✔ ✔✔ ✔✔ ✔✔ ✔✔ Griffin, Georgia ✔✔ ✔✔ ✔✔Hamburg, Pennsylvania ✔✔ ✔✔ ✔✔Hampton, Georgia ✔✔ ✔✔ Hiram, Georgia ✔✔ ✔✔ Houston, Texas ✔✔ ✔✔ ✔✔ ✔✔ Humble, Texas ✔✔ ✔✔ ✔✔ ✔✔ Innisfil, Ontario ✔✔ ✔✔ ✔✔ Joplin, Missouri ✔✔ ✔✔ ✔✔ ✔✔ ✔✔ Kansas City, Missouri ✔✔ ✔✔ ✔✔ ✔✔ ✔✔Kiowa, Oklahoma ✔✔ ✔✔ Lafayette, Indiana ✔✔ ✔✔ ✔✔ ✔✔ ✔✔Laredo, Texas ✔✔ ✔✔ ✔✔ ✔✔ League City, Texas ✔✔ ✔✔ ✔✔ Leduc, Alberta ✔✔ ✔✔ ✔✔ ✔✔ Louden, Tennessee ✔✔ ✔✔ ✔✔ Marshall, Texas ✔✔ ✔✔ ✔✔ Maxton, North Carolina ✔✔ ✔✔ Mediapolis, Iowa ✔✔ ✔✔ Memphis, Tennessee ✔✔ ✔✔ ✔✔ Midland, Texas ✔✔ ✔✔ ✔✔ Milan, Tennessee ✔✔ ✔✔ ✔✔ Mineral Wells, Texas ✔✔ ✔✔ ✔✔ ✔✔ ✔✔ Mobile, Alabama ✔✔ ✔✔ Mount Vernon, Indiana ✔✔ ✔✔ Murray, Utah ✔✔ ✔✔ North Charleston, South Carolina ✔✔ ✔✔ ✔✔ ✔✔ ✔✔
32

Table of Contents
SPECIALIZED SOLUTIONS Description of Activities at Location Customer Sales/
Location Owned Leased Service Marketing Fuel Maintenance Admin WarehouseOden, Indiana ✔✔ ✔✔ ✔✔ Odessa, Texas ✔✔ ✔✔ ✔✔ Oklahoma City, Oklahoma ✔✔ ✔✔ ✔✔ ✔✔ ✔✔ Peoria, Arizona ✔✔ ✔✔ Pharr, Texas ✔✔ ✔✔ ✔✔ Plattsburg, New York ✔✔ ✔✔ Pleasanton, Texas ✔✔ ✔✔ ✔✔ ✔✔ ✔✔ Pomona, California ✔✔ ✔✔ Port Wentworth, Georgia ✔✔ ✔✔ ✔✔ ✔✔ Prichard, Alabama ✔✔ ✔✔ ✔✔ ✔✔ Remington, Indiana ✔✔ ✔✔ ✔✔ ✔✔ ✔✔ ✔✔ ✔✔ ✔✔Richmond, Kentucky ✔✔ ✔✔ ✔✔ Richmond, Virginia ✔✔ ✔✔ Saginaw, Texas ✔✔ ✔✔ ✔✔ ✔✔ ✔✔ Sanford, North Carolina ✔✔ ✔✔ ✔✔ ✔✔ Savannah, Georgia ✔✔ ✔✔ Seguin, Texas ✔✔ ✔✔ ✔✔ Shoals, Indiana ✔✔ ✔✔ South Bend, Indiana ✔✔ ✔✔ Springfield, Missouri ✔✔ ✔✔ ✔✔ ✔✔ ✔✔ Steinbach, Manitoba, Canada ✔✔ ✔✔ ✔✔ Sweetwater, Texas ✔✔ ✔✔ ✔✔ Temple, Texas ✔✔ ✔✔ Toledo, Ohio ✔✔ ✔✔ ✔✔Tulsa, Oklahoma ✔✔ ✔✔ ✔✔ ✔✔Tumwater, Washington ✔✔ ✔✔ Westlake Village, California ✔✔ ✔✔ West Melbourne, Florida ✔✔ ✔✔ ✔✔Wichita, Kansas ✔✔ ✔✔ ✔✔Willston, North Dakota ✔✔ ✔✔ ✔✔ ✔✔ ✔✔ Winnipeg, Manitoba, Canada ✔✔ ✔✔ ✔✔ ✔✔ In addition to the locations listed above, Daseke owns parcels of vacant land and leases or owns several non-operating facilities invarious locations around the United States. Daseke also maintains various drop yards throughout the United States and Canada.
33

Table of Contents
Item 3. Legal Proceedings The Company is involved in litigation and claims primarily arising in the normal course of business, which include claims forpersonal injury, employment-related, or property damage incurred in relation to the transportation of freight. The Company’sinsurance program for liability, physical damage, cargo damage and workers’ compensation involves self-insurance with varying riskretention levels. Claims in excess of these risk retention levels are covered by insurance in amounts that management considers to beadequate. Based on its knowledge of the facts and, in certain cases, advice of outside counsel, the Company believes the resolution ofclaims and pending litigation, will not have a material adverse effect on it, taking into account existing reserves. Item 4. Mine Safety Disclosures None.
Part II Item 5. Market for Registrant’s Common Equity, Related Stockholder Matters and Issuer Purchases of Equity Securities Daseke’s common stock and warrants trade on NASDAQ under the symbols “DKSE” and “DSKEW,” respectively. As of March 6,2019, there were 94 stockholders of record of its common stock. Dividends The Company has not paid any cash dividends on its common stock. It is the present intention of the Company to retain any earningsfor use in its business operations and, accordingly, the Company does not anticipate declaring any dividends in the foreseeable future. The payment of cash dividends on its common stock in the future will be dependent upon the Company’s revenues and earnings, ifany, capital requirements, debt covenants and general financial condition. The payment of any cash dividends will be within thediscretion of the Company’s board of directors at such time. In addition, the Company’s credit facilities (as described in Note 10 ofNotes to Consolidated Financial Statements) restricts the Company’s ability to pay dividends, subject to certain negotiatedexceptions. Stock Performance Graph The following is not “soliciting material,” shall not be deemed “filed” for purposes of Section 18 of the Exchange Act orincorporated by reference into any of our other filings under the Exchange Act or the Securities Act, except to the extent wespecifically incorporate it by reference into such filing.
The graph assumes that $100 was invested on February 27, 2017, in the Company’s common stock, in the S&P 500 Index – TotalReturn, the Dow Jones Transportation Index and the Russell 2000 Index, and that all dividends were reinvested. The stock priceperformance on the following graph are required by the SEC and are not necessarily intended to forecast or be indicative of futurestock price performance.
34

Table of Contents
The closing price of our common stock on December 31, 2018, the last day of our 2018 fiscal year, was $3.68 per share.
Company /Index 2/27/2017 12/31/2017 12/31/2018DSKE $ 100.00 $ 139.82 $ 36.10S&P 500 Index – Total Return $ 100.00 $ 114.70 $ 109.68Dow Jones Transportation Index $ 100.00 $ 113.33 $ 99.37Russell 2000 Index $ 100.00 $ 110.34 $ 98.19
35
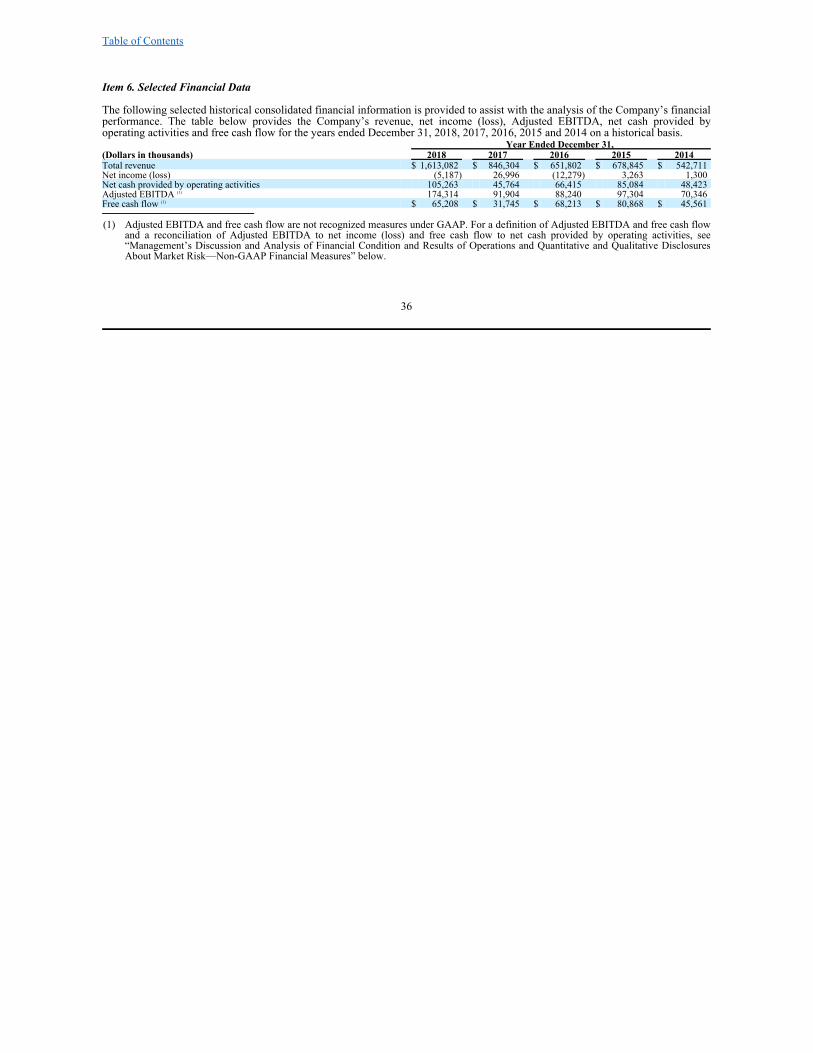
Table of Contents
Item 6. Selected Financial Data The following selected historical consolidated financial information is provided to assist with the analysis of the Company’s financialperformance. The table below provides the Company’s revenue, net income (loss), Adjusted EBITDA, net cash provided byoperating activities and free cash flow for the years ended December 31, 2018, 2017, 2016, 2015 and 2014 on a historical basis.
Year Ended December 31, (Dollars in thousands) 2018 2017 2016 2015 2014Total revenue $ 1,613,082 $ 846,304 $ 651,802 $ 678,845 $ 542,711Net income (loss) (5,187) 26,996 (12,279) 3,263 1,300Net cash provided by operating activities 105,263 45,764 66,415 85,084 48,423Adjusted EBITDA 174,314 91,904 88,240 97,304 70,346Free cash flow $ 65,208 $ 31,745 $ 68,213 $ 80,868 $ 45,561
(1) Adjusted EBITDA and free cash flow are not recognized measures under GAAP. For a definition of Adjusted EBITDA and free cash flowand a reconciliation of Adjusted EBITDA to net income (loss) and free cash flow to net cash provided by operating activities, see“Management’s Discussion and Analysis of Financial Condition and Results of Operations and Quantitative and Qualitative DisclosuresAbout Market Risk—Non-GAAP Financial Measures” below.
36
(1)
(1)

Table of Contents
The following table sets forth selected historical consolidated financial and other data as of and for the years ended December 31,2018, 2017, 2016, 2015 and 2014. The historical results presented below and above are not necessarily indicative of the results to beexpected for any future period and should be read in conjunction with “Management’s Discussion and Analysis of FinancialCondition and Results of Operations and Quantitative and Qualitative Disclosures About Market Risk” below and Daseke’s auditedconsolidated financial statements and the related notes appearing elsewhere in this Form 10-K.
Year Ended December 31, (Dollars in thousands, except share and per share data) 2018 2017 2016 2015 2014 Consolidated statement of operations data: Total revenue $ 1,613,082 $ 846,304 $ 651,802 $ 678,845 $ 542,711 Operating expenses: Salaries, wages and employee benefits 407,429 249,996 197,789 178,703 132,205 Fuel 141,097 93,749 66,865 70,296 88,031 Operations and maintenance 181,534 118,390 96,100 98,734 59,274 Purchased freight 588,603 225,254 154,054 181,985 150,654 Taxes and licenses 17,174 11,055 9,222 9,228 7,304 Insurance and claims 45,826 23,962 19,114 19,655 15,446 Depreciation and amortization 131,082 76,863 67,500 63,573 48,575 (Gain) loss on disposition of revenue property and equipment (3,236) (700) (116) (2,184) 934 Impairment 13,890 — 2,005 — 1,838 Other operating expenses 67,772 40,720 28,636 27,847 19,631 Total operating expenses 1,591,171 839,289 641,169 647,837 523,892
Income from operations 21,911 7,015 10,633 31,008 18,819 Interest expense 45,505 29,556 23,124 20,602 15,978 Other expense (income) (2,485) 2,745 (375) (320) (243) Total other expense 43,020 32,301 22,749 20,282 15,735
Income (loss) before provision for income taxes (21,109) (25,286) (12,116) 10,726 3,084 Provision (benefit) for income taxes (15,922) (52,282) 163 7,463 1,784 Net income (loss) $ (5,187) $ 26,996 $ (12,279) $ 3,263 $ 1,300 Dividends declared per Series A convertible preferred share $ 7.63 $ 6.40 $ — $ — $ — Dividends declared per Series B convertible preferred share $ — $ 12.50 $ 18.75 $ 75.00 $ 75.00 Net income (loss) available to common stockholders $ (10,143) $ 22,032 $ (17,049) $ (1,473) $ 272 Basic net income (loss) per common share $ (0.16) $ 0.59 $ (0.81) $ (0.07) $ 0.07 Diluted net income (loss) per common share $ (0.16) $ 0.56 $ (0.81) $ (0.07) $ 0.06 Basic weighted average common shares outstanding 61,654,820 37,592,549 20,980,961 20,980,961 19,407,162 Diluted weighted average common shares outstanding 61,654,820 39,593,701 20,980,961 20,980,961 20,228,937 Consolidated balance sheet data (at end of period): Cash $ 45,974 $ 90,679 $ 3,695 $ 4,886 $ 2,406 Property and equipment, net $ 572,719 $ 429,639 $ 318,747 $ 354,535 $ 303,515 Total assets $ 1,390,868 $ 1,125,668 $ 570,235 $ 627,607 $ 509,922 Current liabilities $ 193,859 $ 108,068 $ 92,398 $ 109,669 $ 89,224 Working capital $ 131,752 $ 111,020 $ 36,282 $ 42,538 $ 41,401 Long-term debt and other long-term liabilities $ 750,011 $ 666,367 $ 374,774 $ 397,888 $ 313,583 Total stockholders' equity $ 446,998 $ 351,233 $ 103,063 $ 120,050 $ 107,115 Other financial data (unaudited): Adjusted EBITDA $ 174,314 $ 91,904 $ 88,240 $ 97,304 $ 70,346 Adjusted EBITDAR $ 194,834 $ 108,769 $ 101,177 $ 106,261 $ 76,641 Adjusted EBITDA Margin 10.8 % 10.9 % 13.5 % 14.3 % 13.0 %Free cash flow $ 65,208 $ 31,745 $ 68,213 $ 80,868 $ 45,561 Operating ratio 98.6 % 99.2 % 98.4 % 95.4 % 96.5 %Adjusted operating ratio 95.7 % 97.3 % 95.6 % 93.0 % 93.4 %Operating statistics (unaudited): Total miles 462,511,830 290,749,395 246,989,374 230,923,639 192,226,156 Company-operated tractors, as of year-end 3,882 3,218 2,304 2,267 1,878 Owner-operated tractors, as of year-end 2,262 2,056 609 702 735 Number of trailers, as of year-end 13,824 11,237 6,347 5,977 5,515 Company-operated tractors, average for the year 3,485 2,644 2,279 2,054 997 Owner-operated tractors, average for the year 2,177 888 667 700 293 Total tractors, average for the year 5,662 3,532 2,946 2,754 1,290
37
(1)
(2)
(2)
(2)
(2)
(2)
Table of Contents
(1) Working capital is defined as current assets (excluding cash) less current liabilities (excluding the current portion of long-term debt).(2) Adjusted EBITDA, Adjusted EBITDAR, Adjusted EBITDA Margin, free cash flow and adjusted operating ratio are not recognized
measures under GAAP. For a definition of Adjusted EBITDA, Adjusted EBITDAR, Adjusted EBITDA Margin, free cash flow andadjusted operating ratio, a reconciliation of Adjusted EBITDA and Adjusted EBITDAR to net income (loss), a reconciliation of adjustedoperating ratio to operating ratio, and a reconciliation of free cash flow to net cash provided by operating activities, see “Management’sDiscussion and Analysis of Financial Condition and Results of Operations and Quantitative and Qualitative Disclosures About Market Risk—Non-GAAP Financial Measures” below .
38
Table of Contents
Item 7. Management’s Discussion and Analysis of Financial Condition and Results of Operations The following discussion and analysis should be read in conjunction with the Company’s audited consolidated financial statementsand the related notes appearing elsewhere in this Form 10-K. The following discussion contains forward-looking statements thatreflect future plans, estimates, beliefs and expected performance. The forward-looking statements are dependent upon events, risksand uncertainties that may be outside the Company’s control. The Company’s actual results could differ materially from thosediscussed in these forward-looking statements. See “Cautionary Note Regarding Forward-Looking Statements” above. Introduction The Company is a leading provider and consolidator of transportation and logistics solutions focused exclusively on flatbed andspecialized (open-deck) freight in North America. The transportation and logistics market is one of the largest industries in theUnited States. The flatbed and specialized freight market currently represents approximately 10% of the more than 1.5 millionpopulation of trucks used in the broader transportation and logistics market . The Company believes it provides one of the most comprehensive transportation and logistics solution offerings in the open-deckindustry. The Company delivers a diverse offering of transportation and logistics solutions to approximately 5,900 customers acrossthe continental United States, Canada and Mexico through two reportable segments: Flatbed Solutions and Specialized Solutions.The Flatbed Solutions segment focuses on delivering transportation and logistics solutions that principally require the use of flatbedand retractable-sided transportation equipment, and the Specialized Solutions segment focuses on delivering transportation andlogistics solutions that require the use of specialized trailering transportation equipment. The Flatbed Solutions segment andSpecialized Solutions segment generated approximately 41% and 59%, respectively, of revenue in 2018. Since beginning operations in 2009, the Company has established a track record of growing its business both organically and throughstrategic and complementary acquisitions, having successfully completed the acquisition of more than 20 operating companies duringsuch period. In 2018, the Company generated revenue of approximately $1.6 billion, compared to $30 million in 2009 (its first yearof operation), reflecting a CAGR of approximately 56%. Both of the Company’s reportable segments operate highly flexible business models comprised of company-owned tractors andtrailers and asset-light operations (which consist of owner-operator transportation, freight brokerage and logistics). The Company’sasset-based operations have the benefit of providing shippers with certainty of delivery and continuity of operations. Alternatively,the Company’s asset-light operations offer flexibility and scalability to meet customers’ dynamic needs and have lower capitalexpenditure requirements and fixed costs. Approximately 49% of 2018 freight, logistics and brokerage revenue was derived fromcompany-owned equipment and approximately 51% was derived from asset-light services. Business Combination and Other Recent Developments On February 27, 2017, Hennessy consummated the merger of Hennessy’s wholly-owned subsidiary with and into Private Daseke,with Private Daseke surviving as a direct wholly-owned subsidiary of Hennessy. The aggregate consideration received by PrivateDaseke stockholders upon closing was $266.7 million, consisting of newly issued shares of common stock at a value of $10.00 pershare. The Merger Agreement contains an earn-out provision through which Private Daseke stockholders could receive up to 15million additional shares of common stock (with up to 5 million shares payable annually with respect to 2017, 2018 and 2019performance). Daseke met the earn-out provision for the year ended December 31, 2017 and 5 million shares were issued to thePrivate Daseke stockholders in the second quarter of 2018. In 2018, Daseke did not meet the earn-out provision and no shares wereissued. See Note 3 of Notes to Consolidated Financial Statements for more information regarding the Business Combination. On June 6, 2018, the Company acquired all of the outstanding common shares of Aveda Transportation and Energy Services Inc., acorporation existing under the laws of the Province of Alberta, Canada (Aveda), for total consideration of $118.7 million, consistingof $27.3 million in cash, 1,612,979 shares of Daseke common stock valued at $15.4 million,
39

Table of Contents
the payoff of $54.8 million of outstanding debt, and contingent consideration of $21.2 million. Aveda transports equipment requiredfor the exploration, development and production of petroleum resources in the United States and Canada, expanding the SpecializedSegment. On August 1, 2018, the Company acquired all of the outstanding shares of Builders Transportation Co., LLC (Builders) based inMemphis, Tennessee for total consideration of $36.3 million, consisting of $30.0 million in cash, 399,530 shares of Daseke commonstock valued at $3.4 million and the assumption by the Company of $2.9 million of long-term debt. Builders transports metals andbuilding materials, expanding the Flatbed Segment. On July 1 and August 1, 2018, the Company closed two acquisitions to acquire 100% of the outstanding shares of the target entitiesfor aggregate consideration of $31.6 million, consisting of $20.1 million in cash and 95,859 shares of Daseke common stock valuedat $0.9 million. Additionally, the Company assumed approximately $10.6 million of debt and capital lease obligations. These twoacquisitions expanded operations in the northwest United States and Canada, in the Flatbed and Specialized Segments. How the Company Evaluates Its Operations The Company uses a number of primary indicators to monitor its revenue and expense performance and efficiency, includingAdjusted EBITDA, Adjusted EBITDAR, free cash flow and adjusted operating ratio, and its key drivers of revenue quality, growth,expense control and operating efficiency. Adjusted EBITDA, Adjusted EBITDAR, free cash flow and adjusted operating ratio are notrecognized measures under GAAP and should not be considered alternatives to, or more meaningful than, net income (loss), cashflows from operating activities, operating income, operating ratio, operating margin or any other measure derived in accordance withGAAP. See “Non-GAAP Financial Measures” for more information on the Company’s use of these non-GAAP measures, as well asa description of the computation and reconciliation of the Company’s Adjusted EBITDA and Adjusted EBITDAR to net income(loss), free cash flow to net cash provided by operating activities, and adjusted operating ratio to operating ratio. Revenue The Company records four types of revenue: freight, brokerage, logistics and fuel surcharge. Freight revenue is generated by haulingfreight for the Company’s customers using its trucks or its owner-operators’ equipment. Generally, the Company’s customers pay forits services based on the number of miles in the most direct route between pick-up and delivery locations and other ancillary servicesthe Company provides. Freight revenue is the product of the number of revenue-generating miles driven and the rate per mile theCompany receives from customers plus accessorial charges, such as loading and unloading freight for its customers, cargo protection,fees for detaining its equipment or fees for route planning and supervision. Freight revenue is affected by fluctuations in NorthAmerican economic activity as well as changes in specific customer demand, the level of capacity in the industry and driveravailability. The Company’s brokerage revenue is generated by its use of third-party carriers when it needs capacity to move its customers’ loads.The main factor that affects brokerage revenue is the availability of the Company’s drivers and owner-operators (and hence the needfor third-party carriers) and the rate for the load. Brokerage revenue is also affected by fluctuations in North American economicactivity as well as changes in the level of capacity in the industry and driver availability. Logistics revenue is generated from a range of services, including value-added warehousing, loading and unloading, vehiclemaintenance and repair, preparation and packaging, fuel management, and other fleet management solutions. Logistics revenue isprimarily driven by specific customer requirements for additional services and may fluctuate depending on customers’ utilization ofthese services due to changes in cargo specifications, delivery staging and fluctuations in North American economic activity. Fuel surcharges are designed to compensate the Company for fuel costs above a certain cost per gallon base. Generally, the Companyreceives fuel surcharges on the miles for which it is compensated by customers. However, the Company continues to have exposureto increasing fuel costs related to empty miles, fuel efficiency due to engine idle time and other
40

Table of Contents
factors and to the extent the surcharge paid by the customer is insufficient. The main factors that affect fuel surcharge revenue are theprice of diesel fuel and the number of loaded miles. In general, a declining energy and fuel price environment, such as in 2015 andmost of 2016, negatively affects the Company’s fuel surcharge revenues, and conversely, an environment with rising fuel and energyprices benefits its fuel surcharge revenues. Although the Company’s surcharge programs vary by customer, they typically involve acomputation based on the change in national or regional fuel prices. The Company’s fuel surcharges are billed on a lagging basis,meaning it typically bills customers in the current week based on a previous week’s applicable index. Therefore, in times ofincreasing fuel prices, the Company does not recover as much as it is currently paying for fuel. In periods of declining prices, theopposite is true. Also, its fuel surcharge programs typically require a specified minimum change in fuel cost to prompt a change infuel surcharge revenue. Therefore, many of these programs have a time lag between when fuel costs change and when the change isreflected in fuel surcharge revenue. Expenses The Company’s most significant expenses vary with miles traveled and include driver wages, services purchased from owner-operators and other transportation providers (which are recorded on the “Purchased freight” line of the Company’s consolidatedstatements of operations) and fuel. Although driver-related expenses vary with miles traveled, the Company currently expects that itsexpenses relating to driver wages will increase in the near-term, with or without changes in total miles, due to expected increases inaverage driver wages paid per mile in the general trucking industry. The expected increases in driver wages per mile are due tocurrent market conditions caused by a shortage of qualified drivers in the industry when compared to current demand. Maintenance and tire expenses and cost of insurance and claims generally vary with the miles the Company travels but also have acontrollable component based on safety improvements, fleet age, efficiency and other factors. The Company’s primary fixed costsare depreciation of long-term assets (such as tractors, trailers and terminals), interest expense, rent and non-driver compensation. The Company’s fuel surcharge programs help to offset increases in fuel prices but typically do not offset empty miles, idle time andout of route miles driven. As discussed above under “Revenue”, its fuel surcharge programs have a time lag between when fuel costschange and when the change is reflected in fuel surcharge revenue. Due to this time lag, the Company’s fuel expense, net of fuelsurcharge, negatively impacts its operating income during periods of sharply rising fuel costs and positively impacts its operatingincome during periods of falling fuel costs. In general, due to the fuel surcharge programs, its operating income is less negativelyaffected by an environment with higher, stable fuel prices than an environment with lower fuel prices. In addition to its fuelsurcharge programs, the Company believes the most effective protection against fuel cost increases is to maintain a fuel-efficientfleet by incorporating fuel efficiency measures. Also, the Company has arrangements with some of its significant fuel suppliers tobuy the majority of its fuel at contracted pricing schedules that fluctuate with the market price of diesel fuel. The Company has notused derivatives as a hedge against higher fuel costs in the past but continues to evaluate this possibility. Operating Income Differences in the mix of drivers and assets between the segments impact the proportion of operating income as a percentage ofrevenue. The Flatbed Solutions segment has proportionately higher operating income as a percentage of revenue when compared tothe Specialized Solutions segment because certain operating expenses in the Specialized Solutions segment are proportionatelygreater. For example, the Specialized Solutions segment drivers, who typically are required to have a higher level of training andexpertise, generally receive a higher driver pay per total mile than Flatbed Solutions segment drivers. In addition, the FlatbedSolutions segment utilizes a larger percentage of owner-operators as opposed to Company drivers, which results in purchased freightexpense being a more significant expense for this segment. The larger percentage of Company drivers in the Specialized Solutionssegment also results in a greater percentage of fuel expense and operations and maintenance expense relative to our Flatbed Solutionssegment, each of which is impacted by the miles per gallon realized with company equipment and the number of miles driven byCompany drivers. Similarly, the
41

Table of Contents
Specialized Solutions segment had higher depreciation and amortization expense primarily due to the increase in company-ownedvehicles. Factors Affecting the Comparability of the Company’s Financial Results Acquisitions The comparability of the Company’s results of operations among the periods presented is impacted by the acquisitions listed below.Also, as a result of the below acquisitions, the Company’s historical results of operations may not be comparable or indicative offuture results.
Flatbed Solutions Acquisitions
· Builders Acquisition – Effective August 1, 2018, the Company acquired 100% of the outstanding equity interests ofBuilders, to expand its presence in the steel and construction materials markets.
· Leavitt’s Acquisition – Effective August 1, 2018, a Company subsidiary acquired 100% of the outstanding equity interestsof Leavitt’s Freight Service (Leavitt’s), to strengthen its operations in Central Oregon and expand its capabilities to thelumber industry.
· Tennessee Steel Haulers Acquisition – Effective December 1, 2017, the Company acquired 100% of the outstanding equity
interests of TSH & Co. to expand its presence on the East Coast and in the Southeastern United States in both the steel andbuilding materials industries.
The Company refers to the 2018 and 2017 acquisitions described above collectively as the “Flatbed Solutions Acquisitions.”
Specialized Solutions Acquisitions
· Kelsey Trail Acquisition – Effective July 1, 2018, a Company subsidiary acquired 100% of the outstanding equity interestsof Kelsey Trail, to strengthen and grow its operations in Canada.
· Aveda Acquisition – Effective June 6, 2018, the Company acquired 100% of the outstanding equity interests of Aveda, to
expand its capabilities to include the specialized transportation of equipment required for the exploration, development andproduction of petroleum resources in the United States and Canada.
· Belmont Acquisition – Effective December 29, 2017, a Company subsidiary acquired 100% of the outstanding equity
interests of Belmont, as a dedicated glass hauler that will complement the Company’s existing glass hauling capabilities.
· Moore Freight Services Acquisition – Effective December 1, 2017, the Company acquired 100% of the outstanding equityinterests of Moore Freight Services to expand its capabilities as a commercial sheet glass carrier.
· Roadmaster Group Acquisition – Effective December 1, 2017, the Company acquired 100% of the outstanding equity
interests of Roadmaster Group to expand its capabilities as a market leader in high security cargo.
· R&R Acquisition – Effective September 1, 2017, the Company acquired 100% of the outstanding stock of R&R, to expandits capabilities to include government and commercial arms, ammunitions and explosives.
42

Table of Contents
· Steelman Acquisition – Effective July 1, 2017, the Company acquired 100% of the outstanding stock of Steelman, to expandits presence in the Midwestern United States and in flatbed, power sports and heavy haul industries.
· Schilli Acquisition – Effective May 1, 2017, the Company acquired 100% of the outstanding stock of Schilli, to expand its
industrial warehousing capabilities and its presence in the Midwestern United States.
· Big Freight Acquisition - Effective May 1, 2017, the Company acquired 100% of the outstanding stock of Big Freight, toexpand its presence into Canada and the power sports industry.
The Company refers to the 2018 and 2017 acquisitions described above collectively as the “Specialized Solutions Acquisitions.” The Company refers to the Flatbed Solutions Acquisitions and Specialized Solutions Acquisitions described above collectively as the“Recent Acquisitions.” The Business Combination The Company’s historical results of operations may not be comparable or indicative of results after the consummation of theBusiness Combination as a result of the following:
· Decreased Leverage. For the year ended December 31, 2016, the Company’s pro forma interest expense would have beenapproximately $3.4 million lower than its historical interest expense.
· Public Company Expenses. The Company incurred direct, incremental general and administrative expense as a result ofbeing a publicly traded company, including, but not limited to, costs associated with annual and quarterly reports tostockholders, tax return preparation, independent auditor fees, investor relations activities, registrar and transfer agent fees,incremental director and officer liability insurance costs and independent director compensation. These direct expensestotaled approximately $5.5 million.
· Transaction Costs. For the years ended December 31, 2017 and 2016, the Company expensed $2.0 million and $3.5 million,respectively, of transaction costs related to the Business Combination.
· Deferred Financing Fees. During the first quarter of 2017, the Company expensed $3.9 million of unamortized deferredfinancing fees associated with debt refinanced in conjunction with the Business Combination. There were no such expensesfor the years ended December 31, 2018 and 2016.
Daseke Fleet Services In May 2018, the Company launched Daseke Fleet Services (DFS) as a new department to support the Company’s growing scale byleveraging areas such as purchasing, equipment optimization and maintenance to improve cost efficiencies in ways that support boththe Company’s operating companies and overall organic growth. DFS focuses on lifecycle management of revenue equipment including maximization of national purchasing power, enhancedmaintenance programs, strategic disposition of assets, and high-level warranty management. The formation of DFS is expected toreduce operating expenses which will improve the Company’s operating income, operating ratio and margins.
43

Table of Contents
Results of Operations Year Ended December 31, 2018 Compared to Year Ended December 31, 2017 The following table sets forth items derived from the Company’s consolidated statements of operations for the years ended December31, 2018 and 2017 in dollars and as a percentage of total revenue and the increase or decrease in the dollar amounts of those items.
Year Ended December 31, 2018 2017 Increase (Decrease)(Dollars in thousands) $ % $ % $ % REVENUE: Freight $ 1,162,193 72.0 $ 632,764 74.8 $ 529,429 83.7Brokerage 266,437 16.5 120,943 14.3 145,494 120.3Logistics 42,764 2.7 22,074 2.6 20,690 93.7Fuel surcharge 141,688 8.8 70,523 8.3 71,165 100.9
Total revenue 1,613,082 100.0 846,304 100.0 766,778 90.6 OPERATING EXPENSES: Salaries, wages and employee benefits 407,429 25.3 249,996 29.5 157,433 63.0Fuel 141,097 8.7 93,749 11.1 47,348 50.5Operations and maintenance 181,534 11.3 118,390 14.0 63,144 53.3Communications 3,334 0.2 2,145 0.3 1,189 55.4Purchased freight 588,603 36.5 225,254 26.6 363,349 161.3Administrative expenses 58,385 3.6 33,233 3.9 25,152 75.7Sales and marketing 3,369 0.2 1,965 0.2 1,404 71.5Taxes and licenses 17,174 1.1 11,055 1.3 6,119 55.4Insurance and claims 45,826 2.8 23,962 2.8 21,864 91.2Acquisition-related transaction expenses 2,684 0.2 3,377 0.4 (693) (20.5)Depreciation and amortization 131,082 8.1 76,863 9.1 54,219 70.5Gain on disposition of revenue property and equipment (3,236) (0.2) (700) (0.1) (2,536) 362.3Impairment 13,890 0.9 — * 13,890 *
Total operating expenses 1,591,171 98.6 839,289 99.2 751,882 89.6Operating ratio 98.6% 99.2% Adjusted operating ratio 95.7% 97.3% INCOME FROM OPERATIONS 21,911 1.4 7,015 0.8 14,896 212.3 Other (income) expense: Interest income (1,323) (0.1) (398) (0.0) (925) 232.4Interest expense 45,505 2.8 29,556 3.5 15,949 54.0Write-off of unamortized deferred financing fees — * 3,883 0.5 (3,883) (100.0)Other (1,162) (0.1) (740) (0.1) (422) 57.0
Total other expense 43,020 2.7 32,301 3.8 10,719 33.2 Income (loss) before income taxes (21,109) (1.3) (25,286) (3.0) 4,177 (16.5)Provision (benefit) for income taxes (15,922) (1.0) (52,282) (6.2) 36,360 (69.5)
Net income (loss) $ (5,187) (0.3) $ 26,996 3.2 $ (32,183) (119.2)
OPERATING STATISTICS: Total miles 462,511,830 290,749,395 171,762,435 59.1Company-operated tractors, as of year-end 3,882 3,218 664 20.6Owner-operated tractors, as of year-end 2,262 2,056 206 10.0Number of trailers, as of year-end 13,824 11,237 2,587 23.0 Company-operated tractors, average for the year 3,485 2,644 841 31.8Owner-operated tractors, average for the year 2,177 888 1,289 145.2Total tractors, average for the year 5,662 3,532 2,130 60.3
* indicates not meaningful.(1) Adjusted operating ratio is not a recognized measure under GAAP. For a definition of adjusted operating ratio and reconciliation of
adjusted operating ratio to operating ratio, see “Non-GAAP Financial Measures” below.
44
(1)

Table of Contents
The following table sets forth the Company’s Flatbed Solutions segment’s revenue, operating expenses, operating ratio, adjustedoperating ratio and operating income for the years ended December 31, 2018 and 2017 in dollars and as a percentage of its FlatbedSolutions segment’s total revenue and the increase or decrease in the dollar amounts of those items. The following table also setsforth certain operating statistics for the Company’s Flatbed Solutions segment for the years ended December 31, 2018 and 2017.
FLATBED SOLUTIONS
Year Ended December 31, 2018 2017 Increase (Decrease)(Dollars in thousands) $ % $ % $ % REVENUE : Freight $ 477,722 72.2 $ 276,592 78.1 $ 201,130 72.7Brokerage 104,184 15.7 40,882 11.5 63,302 154.8Logistics 2,987 0.5 192 0.1 2,795 *Fuel surcharge 77,110 11.6 36,440 10.3 40,670 111.6
Total revenue 662,003 100.0 354,106 100.0 307,897 87.0 OPERATING EXPENSES : Salaries, wages and employee benefits 122,134 18.4 96,860 27.4 25,274 26.1Fuel 50,781 7.7 41,592 11.7 9,189 22.1Operations and maintenance 48,415 7.3 36,524 10.3 11,891 32.6Purchased freight 331,923 50.1 107,248 30.3 224,675 209.5Depreciation and amortization 36,099 5.5 29,183 8.2 6,916 23.7Other operating expenses 39,733 6.0 24,238 6.8 15,495 63.9
Total operating expenses 629,085 95.0 335,645 94.8 293,440 87.4Operating ratio 95.0% 94.8% Adjusted operating ratio 94.0% 93.8% INCOME FROM OPERATIONS $ 32,918 5.0 $ 18,461 5.2 $ 14,457 78.3 OPERATING STATISTICS: Total miles 243,794,226 152,956,123 90,838,103 59.4Company-operated tractors, as of year-end 1,371 1,155 216 18.7Owner-operated tractors, as of year-end 1,592 1,392 200 14.4Number of trailers, as of year-end 5,141 4,573 568 12.4 Company-operated tractors, average for the year 1,205 1,156 49 4.2Owner-operated tractors, average for the year 1,543 535 1,008 188.4Total tractors, average for the year 2,748 1,691 1,057 62.5
* indicates not meaningful.(1) Includes intersegment revenues and expenses, as applicable, which are eliminated in the Company’s consolidated results.(2) Adjusted operating ratio is not a recognized measure under GAAP. For a definition of adjusted operating ratio and reconciliation of
adjusted operating ratio to operating ratio, see “Non-GAAP Financial Measures” below.
45
(1)
(1)
(2)

Table of Contents
The following table sets forth the Company’s Specialized Solutions segment’s revenue, operating expenses, operating ratio, adjustedoperating ratio and operating income for the years ended December 31, 2018 and 2017 in dollars and as a percentage of itsSpecialized Solutions segment’s total revenue and the increase or decrease in the dollar amounts of those items. The following tablealso sets forth certain operating statistics for the Company’s Specialized Solutions segment for the years ended December 31, 2018and 2017.
SPECIALIZED SOLUTIONS
Year Ended December 31, 2018 2017 Increase (Decrease)(Dollars in thousands) $ % $ % $ % REVENUE : Freight $ 696,045 72.1 $ 362,277 72.6 $ 333,768 92.1Brokerage 163,092 16.9 80,225 16.1 82,867 103.3Logistics 39,927 4.1 21,940 4.4 17,987 82.0Fuel surcharge 66,000 6.8 34,690 7.0 31,310 90.3
Total revenue 965,064 100.0 499,132 100.0 465,932 93.3 OPERATING EXPENSES : Salaries, wages and employee benefits 277,591 28.8 145,004 29.1 132,587 91.4Fuel 90,316 9.4 52,157 10.4 38,159 73.2Operations and maintenance 132,487 13.7 80,728 16.2 51,759 64.1Purchased freight 270,639 28.0 124,905 25.0 145,734 116.7Depreciation and amortization 94,818 9.8 47,531 9.5 47,287 99.5Impairment 13,890 1.4 — * 13,890 *Other operating expenses 62,272 6.5 33,462 6.7 28,810 86.1
Total operating expenses 942,013 97.6 483,787 96.9 458,226 94.7Operating ratio 97.6% 96.9% Adjusted operating ratio 93.4% 95.1% INCOME FROM OPERATIONS $ 23,051 2.4 $ 15,345 3.1 $ 7,706 50.2 OPERATING STATISTICS: Total miles 218,717,604 137,793,272 80,924,332 58.7Company-operated tractors, as of year-end 2,511 2,063 448 21.7Owner-operated tractors, as of year-end 670 664 6 0.9Number of trailers, as of year-end 8,683 6,664 2,019 30.3 Company-operated tractors, average for the year 2,280 1,488 792 53.2Owner-operated tractors, average for the year 634 353 281 79.6Total tractors, average for the year 2,914 1,841 1,073 58.3
* indicates not meaningful.(1) Includes intersegment revenues and expenses, as applicable, which are eliminated in the Company’s consolidated results.(2) Adjusted operating ratio is not a recognized measure under GAAP. For a definition of adjusted operating ratio and reconciliation of
adjusted operating ratio to operating ratio, see “Non-GAAP Financial Measures” below. Revenue. Total revenue increased 90.6% to $1,613.1 million for the year ended December 31, 2018 from $846.3 million for theyear ended December 31, 2017, primarily as a result of the Recent Acquisitions. The change in total revenue, excluding the effect ofthe Recent Acquisitions, was an increase of $122.2 million, or 14.4%, due to increases in fuel surcharge, brokerage and freightrevenue. Freight revenue, excluding the effect of the Recent Acquisitions, increased $61.0 million, or 9.6%, from $632.8 million forthe year ended December 31, 2017 to $693.8 million for the year ended December 31, 2018. Brokerage revenue, excluding the effectof the Recent Acquisitions, increased $31.3 million, or 25.8%, from $120.9 million for the year ended December 31, 2017 to $152.2million for the year ended December 31, 2018. The increases in freight and brokerage revenue were primarily a result of increases inrates, while miles driven decreased 4.0% when compared to the same period in 2017, excluding the effect of the Recent Acquisitions.Fuel surcharges, excluding the effect of the Recent Acquisitions, increased $27.4 million, or 38.8%, from $70.5 million for the yearended December 31, 2017 to $97.9 million for the year ended December 31, 2018 .
46
(1)
(1)
(2)

Table of Contents
The Company’s Flatbed Solutions segment’s revenue was $662.0 million for the year ended December 31, 2018 as compared to$354.1 million for the year ended December 31, 2017, an increase of 87.0%, which was primarily the result of the Flatbed SolutionsAcquisitions. The increase in revenue, excluding the effect of the Flatbed Solutions Acquisitions was 13.8%, or $49.0 million, due toincreases in freight revenue, brokerage revenue and fuel surcharge. Freight revenue, excluding the effect of the Flatbed SolutionsAcquisitions, increased $29.0 million, or 10.5%, from $276.6 million for the year ended December 31, 2017 to $305.6 million for theyear ended December 31, 2018. Brokerage revenue, excluding the effect of the Recent Acquisitions, increased $5.0 million, or12.3%, from $40.9 million for the year ended December 31, 2017 to $45.9 million for the year ended December 31, 2018. Theincreases in freight and brokerage revenue were primarily a result of increases in rates, while miles driven decreased 5.3% whencompared to the same period in 2017, excluding the effect of the Flatbed Solutions Acquisitions. Fuel surcharges, excluding theeffect of the Flatbed Solutions Acquisitions, increased $14.9 million, or 40.9%, from $36.4 million for the year ended December 31,2017 to $51.3 million for the year ended December 31, 2018. The Company’s Specialized Solutions segment’s revenue was $965.1 million for the year ended December 31, 2018 as compared to$499.1 million for the year ended December 31, 2017, an increase of 93.3%, which was primarily due to the Specialized SolutionsAcquisitions. The increase in revenue, excluding the effect of the Specialized Solutions Acquisitions, was an increase of $80.8million, or 16.2%, due to increases in freight revenue, brokerage revenue and fuel surcharge. Freight revenue, excluding the effect ofthe Specialized Solutions Acquisitions, increased $37.8 million, or 10.4%, from $362.3 million for the year ended December 31,2017 to $400.1 million for the year ended December 31, 2018. Brokerage revenue, excluding the effect of the Specialized SolutionsAcquisitions, increased $27.0 million, or 33.7%, from $80.2 million for the year ended December 31, 2017 to $107.2 million. Theincreases in freight and brokerage revenue were primarily a result of increases in rates, while miles driven decreased 2.6% whencompared to the same period in 2017, excluding the effect of the Specialized Solutions Acquisitions. Fuel surcharges, excluding theeffect of the Specialized Solutions Acquisitions, increased $13.4 million, or 38.6%, from $34.7 million for the year ended December31, 2017 to $48.1 million for the year ended December 31, 2018. In both segments, the increase in fuel surcharge revenue was the result of increases in fuel prices, which increased by 19.6% for theyear ended December 31, 2018 when compared to the same period in 2017. Salaries, Wages and Employee Benefits. Salaries, wages and employee benefits expense, which consists of compensation for allemployees, is primarily affected by the number of miles driven by company drivers, the rate per mile paid to company drivers,employee benefits including, but not limited to, health care and workers’ compensation, and to a lesser extent, the number of, andcompensation and benefits paid to, non-driver employees. In general, the Specialized Solutions segment drivers receive a higherdriver pay per total mile than Flatbed Solutions segment drivers due to the former requiring a higher level of training and expertise. Salaries, wages and employee benefits expense increased 63.0% to $407.4 million for the year ended December 31, 2018 from$250.0 million for the year ended December 31, 2017, primarily due to the Recent Acquisitions. The increase in salaries, wages andemployee benefits expense, excluding the effect of the Recent Acquisitions, was 7.3%, or $18.4 million, and was primarily due toincreased employee compensation, due to increases in average driver wages in the
47

Table of Contents
trucking industry and general inflation. This increase was offset by a decrease in employee health insurance cost as a result of costsavings obtained by changing insurance providers. Excluding the effect of the Recent Acquisitions, salaries, wages and employeebenefits expense, as a percentage of consolidated revenue (excluding brokerage revenue), decreased 1.7% for the year endedDecember 31, 2018 as compared to the same period in 2017. This decrease is the result of higher utilization of owner-operators witha decrease in Company drivers for the year ended December 31, 2018 as compared to the same period in 2017. This change in themix of drivers reduced salaries, wages and employee benefits expense and increased purchased freight expense (see PurchasedFreight below). The Company’s Flatbed Solutions segment had a $25.3 million, or 26.1%, increase in salaries, wages and employee benefits expensefor the year ended December 31, 2018 compared to the year ended December 31, 2017, primarily as a result of the Flatbed SolutionsAcquisitions, which resulted in a $21.9 million increase. Excluding the effect of the Flatbed Solutions Acquisitions, salaries, wagesand employee benefit expense increased 3.5% for the year ended December 31, 2018 as compared to the year ended December 31,2017. The increase in employee compensation is primarily due to increases in average driver wages in the trucking industry andgeneral inflation, partially offset by a decrease due to a reduction in employee health insurance and workers’ compensation insurancecosts as a result of cost savings obtained by changing insurance providers. Excluding the effect of the Flatbed Solutions Acquisitions,wages and employee benefits expense, as a percentage of Flatbed Solutions revenue (excluding brokerage revenue), decreased 2.9%for the year ended December 31, 2018 as compared to the same period in 2017. This decrease is the result of higher utilization ofowner-operators with a decrease in Company drivers for the year ended December 31, 2018 as compared to the same period in 2017.This change in the mix of drivers reduced salaries, wages and employee benefits expense and increased purchased freight expense(see Purchased Freight below). The Company’s Specialized Solutions segment had a $132.6 million, or 91.4%, increase in salaries, wages and employee benefitsexpense for the year ended December 31, 2018 compared to the year ended December 31, 2017, primarily as a result of theSpecialized Solutions Acquisitions. This increase, excluding the effect of the Specialized Solutions Acquisitions, was 10.7%, or$15.5 million, and was primarily due to increased employee compensation, due to increases in average driver wages in the truckingindustry and general inflation. Excluding the effect of the Specialized Solutions Acquisitions, salaries, wages and employee benefitsexpense, as a percentage of Specialized Solutions revenue (excluding brokerage revenue), decreased less than 1% for the year endedDecember 31, 2018 as compared to the same period in 2017 . Fuel. Fuel expense consists primarily of diesel fuel expense for company-owned tractors and fuel taxes. The primary factorsaffecting fuel expense are the prices negotiated for diesel fuel, the miles per gallon realized with company equipment and the numberof miles driven by company drivers. Total fuel expense increased $47.3 million, or 50.5%, to $141.1 million for the year ended December 31, 2018 from $93.7 million forthe year ended December 31, 2017. This increase was primarily a result of higher fuel prices and the Recent Acquisitions. Excludingthe effect of the Recent Acquisitions, fuel expense increased 13.3%, or $12.5 million. The U.S. national average diesel fuel price, aspublished by the U.S. Department of Energy, was $3.178 for the year ended December 31, 2018, compared to $2.656 for the sameperiods in 2017, a 19.6% increase. Total miles driven, excluding the Recent Acquisitions, decreased 4.0% for the year endedDecember 31, 2018 as compared to the year ended December 31, 2017.
48

Table of Contents
The Company’s Flatbed Solutions segment’s fuel expense increased 22.1% to $50.8 million for the year ended December 31, 2018from $41.6 million for the year ended December 31, 2017, primarily as a result of higher fuel prices and the Flatbed SolutionsAcquisitions. Excluding the effect of the Flatbed Solutions Acquisitions, fuel expense in the Flatbed Solutions segment increased11.5% to $46.4 million as a result of higher fuel prices. Total miles driven for the Flatbed Solutions segment, excluding the FlatbedSolutions Acquisitions, decreased 5.3% for the year ended December 31, 2018 as compared to the year ended December 31, 2017. The Company’s Specialized Solutions segment’s fuel expense increased 73.2% to $90.3 million for the year ended December 31,2018 from $52.2 million for the year ended December 31, 2017, primarily as a result of higher fuel prices and the SpecializedSolutions Acquisitions. Excluding the effect of the Specialized Solutions Acquisitions, fuel expense in the Specialized Solutionssegment increased 14.7% to $59.8 million as a result of higher fuel prices. Total miles driven for the Specialized Solutions segment,excluding the Specialized Solutions Acquisitions, decreased 2.6% for the year ended December 31, 2018 as compared to the yearended December 31, 2017. Operations and Maintenance. Operations and maintenance expense consists primarily of ordinary vehicle repairs and maintenance,costs associated with preparing tractors and trailers for sale or trade-in, driver recruiting, training and safety costs, permitting andpilot car fees and other general operations expenses. Operations and maintenance expense is primarily affected by the age ofcompany-owned tractors and trailers, the number of miles driven in a period and driver turnover. Operations and maintenance expense increased 53.3% to $181.5 million for the year ended December 31, 2018 from $118.4 millionfor the year ended December 31, 2017, primarily as a result of the Recent Acquisitions. After adjusting for the effect of the RecentAcquisitions, operations and maintenance expense increased 11.8% for the year ended December 31, 2018 as compared to the yearended December 31, 2017. Excluding the effect of the Recent Acquisitions, operations and maintenance expense, as a percentage ofconsolidated revenue (excluding brokerage revenue), decreased less than 1% for the year ended December 31, 2018 as compared tothe same period in 2017. This decrease is the result of higher utilization of owner-operators with a decrease in Company drivers forthe year ended December 31, 2018 as compared to the same period in 2017. This change in the mix of drivers reduced operations andmaintenance expense and increased purchased freight expense (see Purchased Freight below). The Company’s Flatbed Solutions segment’s operations and maintenance expense increased $11.9 million, or 32.6%, for the yearended December 31, 2018 as compared to the year ended December 31, 2017, primarily as a result of the Flatbed SolutionsAcquisitions. Excluding the effect of the Flatbed Solutions Acquisitions, operations and maintenance expense increased $4.4 million,or 12.1%, for the year ended December 31, 2018 as compared to the year ended December 31, 2017, primarily as a result of anincrease in maintenance expense, due to normal replacement cycles of tractors and trailers, and increased tire replacement expense.These increases were partially offset by decreased tractor lease costs as the Flatbed Solutions segment’s utilization of operatingleases to finance tractor purchases decreased in 2018. Excluding the effect of the Flatbed Solutions Acquisitions, operations andmaintenance expense, as a percentage of Flatbed Solutions revenue (excluding brokerage revenue), was a decrease of less than 1%for the year ended December 31, 2018 as compared to the same period in 2017. The Company’s Specialized Solutions segment’s operations and maintenance expense increased $51.8 million, or 64.1%, for the yearended December 31, 2018 as compared to the year ended December 31, 2017, primarily as a result of the Specialized SolutionsAcquisitions. Excluding the effect of the Specialized Solutions Acquisitions, operations and maintenance expense increased $10.0million, or 12.4%, for the year ended December 31, 2018 as compared to the year ended December 31, 2017, primarily as a result ofincreased maintenance expense, due to normal replacement cycles of tractors and trailers and increased logistics activities. Excludingthe effect of the Specialized Solutions Acquisitions, operations and maintenance expense, as a percentage of Specialized Solutionsrevenue (excluding brokerage revenue), decreased less than 1% for the year ended December 31, 2018 as compared to the sameperiod in 2017. This decrease is the result of higher utilization of owner-operators with a decrease in Company drivers for the yearended December 31, 2018 as compared to the same period in 2017. This change in the mix of drivers reduced operations andmaintenance expense and increased purchased freight expense (see Purchased Freight below).
49

Table of Contents
Purchased Freight. Purchased freight expense consists of the payments to owner-operators, including fuel surchargereimbursements, and payments to third-party capacity providers that haul loads brokered to them. Purchased freight expensegenerally takes into account changes in diesel fuel prices, resulting in lower payments during periods of declining fuel prices. Total purchased freight expense increased 161.3% from $225.3 million for the year ended December 31, 2017 to $588.6 million forthe year ended December 31, 2018, primarily as a result of the Recent Acquisitions. Excluding the effect of the Recent Acquisitionson purchased freight expense, total purchased freight expense increased 21.8% to $274.3 million for the year ended December 31,2018. Purchased freight expense from owner-operators, excluding the Recent Acquisitions, increased 22.7% from $131.8 million forthe year ended December 31, 2017 to $161.7 million for the year ended December 31, 2018, primarily as a result of higher rates andincreases in fuel surcharge reimbursements made to owner-operators as a result of higher fuel prices. Purchased freight expense fromthird-party capacity providers, excluding the Recent Acquisitions, increased 23.7% from $87.8 million for the year ended December31, 2017 to $108.6 million for the year ended December 31, 2018, primarily as a result of increased utilization of third-party capacityproviders. Excluding the effect of the Recent Acquisitions, purchased freight expense, as a percentage of consolidated revenue,increased 1.7% for the year ended December 31, 2018 as compared to the same period in 2017 as a result of higher utilization ofowner-operators and third-party capacity providers. The Company’s Flatbed Solutions segment’s purchased freight expense increased 209.5% to $331.9 million for the year endedDecember 31, 2018 from $107.2 million for the year ended December 31, 2017, primarily as a result of the Flatbed SolutionsAcquisitions, which resulted in a $194.1 million increase to purchased freight expense. Excluding the effect of the Flatbed SolutionsAcquisitions, the Company’s Flatbed Solutions segment’s purchased freight expense increased 28.5% to $137.8 million for the yearended December 31, 2018 as compared to the year ended December 31, 2017, primarily due to increases in the utilization of owner-operators and third-party capacity providers in the Company’s Flatbed Solutions segment. Purchased freight expense from owner-operators, excluding the Flatbed Solutions Acquisitions, increased 35.4% to $102.0 million for the year ended December 31, 2018from $75.3 million for the year ended December 31, 2017, primarily as a result of higher rates and increases in fuel surchargereimbursements made to owner-operators as a result of higher fuel prices. Purchased freight expense from third-party capacityproviders, excluding the Flatbed Solutions Acquisitions, increased 11.5% to $31.6 million for the year ended December 31, 2018from $28.4 million for the year ended December 31, 2017, primarily as a result of increased utilization of third-party capacityproviders. Excluding the effect of the Flatbed Solutions Acquisitions, purchased freight expense, as a percentage of FlatbedSolutions revenue, increased 3.9% for the year ended December 31, 2018 as compared to the same period in 2017 from higherutilization of owner-operators and third-party capacity providers. The Company’s Specialized Solutions segment’s purchased freight expense increased 116.7% to $270.6 million for the year endedDecember 31, 2018 from $124.9 million for the year ended December 31, 2017, primarily as a result of the Specialized SolutionsAcquisitions. Excluding the effect of the Specialized Solutions Acquisitions on purchased freight expense, total purchased freightexpense increased 21.0% to $151.1 million for the year ended December 31, 2018. Purchased freight expense from owner-operators,excluding the Specialized Solutions Acquisitions, increased 5.8% from $56.5 million for the year ended December 31, 2017 to $59.7million for the year ended December 31, 2018, primarily as a result of higher rates and increases in fuel surcharge reimbursementsmade to owner-operators as a result of higher fuel prices. Purchased freight expense from third-party capacity providers, excludingthe Specialized Solutions Acquisitions, increased 29.6% from $59.3 million for the year ended December 31, 2017 to $76.9 millionfor the year ended December 31, 2018, primarily as a result of increased utilization of third-party capacity providers. Excluding theeffect of the Specialized Solutions Acquisitions, purchased freight expense, as a percentage of Specialized Solutions revenue,increased 1.0% for the year ended December 31, 2018 as compared to the same period in 2017 from higher utilization of owner-operators and third-party capacity providers. Depreciation and Amortization. Depreciation and amortization expense consists primarily of depreciation for company-ownedtractors and trailers or amortization of those financed with capital leases. The primary factors affecting these expense items includethe size and age of company-owned tractors and trailers and the cost of new equipment.
50
Table of Contents
Depreciation and amortization expense increased 70.5% to $131.1 million, including $16.6 million of intangible assets amortization,for the year ended December 31, 2018 from $76.9 million for the year ended December 31, 2017, as a result of the RecentAcquisitions. After adjusting for the effect of the Recent Acquisitions, depreciation and amortization expense was relatively flat forthe year ended December 31, 2018 as compared to the year ended December 31, 2017. The Company’s Flatbed Solutions segment’s depreciation and amortization expense increased 23.7% to $36.1 million, including $6.2million of intangible assets amortization, for the year ended December 31, 2018 as compared to the year ended December 31,2017. Excluding the Flatbed Solutions Acquisitions, depreciation and amortization expense for the year ended December 31, 2018decreased 2.9% primarily as a result of a 4.4% reduction in company-owned tractors and a 8.2% reduction in trailers, as compared tothe same periods in 2017. The Company’s Specialized Solutions segment’s depreciation and amortization expense increased 99.5% to $94.8 million, including$10.5 million of intangible assets amortization, for the year ended December 31, 2018 as compared to the year ended December 31,2017 as a result of the Specialized Solutions Acquisitions. After adjusting for the effect of the Specialized Solutions Acquisitions,depreciation and amortization expense decreased 1.2% for the year ended December 31, 2018 as compared to the year endedDecember 31, 2017, primarily as a result of a 1.8% decrease in company-owned tractors and a 0.8% decrease in trailers, as comparedto the same periods in 2017. Taxes and Licenses . Operating taxes and licenses expense primarily represents the costs of taxes and licenses associated with theCompany’s fleet of equipment and will vary according to the size of its equipment fleet. Taxes and license expense increased from$11.1 million for the year ended December 31, 2017 to $17.2 million for the year ended December 31, 2018. Excluding the effect ofthe Recent Acquisitions, operating taxes and license expense, as a percentage of revenue, was 1.3% and 1.3% for the year endedDecember 31, 2018 and 2017, respectively. Insurance and Claims. Insurance and claims expense consists of insurance premiums and the accruals the Company makes forestimated payments and expenses for claims for bodily injury, property damage, cargo damage and other casualty events. Theprimary factors affecting the Company’s insurance and claims expense are seasonality (the Company typically experiences higheraccident frequency in winter months), the frequency and severity of accidents, trends in the development factors used in its accrualsand developments in large, prior-year claims. The frequency of accidents tends to increase with the miles the Company travels.Insurance and claims expense increased 91.2% to $45.8 million for the year ended December 31, 2018 from $24.0 million for theyear ended December 31, 2017, primarily as a result of the Recent Acquisitions. Excluding the effect of the Recent Acquisitions,insurance and claims, as a percentage of revenue, increased from 2.8% for the year ended December 31, 2017 to 3.6% for the yearended December 31, 2018 primarily due to increases in claims accruals and liability premiums. Impairment. In June 2018, the Company recorded an impairment charge of $2.8 million related to the trade names category ofintangible assets. The trade name was impaired as a result of the reorganization and merger of two of the Company’s operatingcompanies. In December 2018, the Company recorded an impairment charge of $11.1 million as a result of the carrying value of oneoperating segment exceeding its estimated fair value. During 2017, the Company had no charges relating to impairment of intangibleassets or goodwill. Operating Income. Operating income increased 212.3% to $21.9 million, or 1.4% of revenue, for the year ended December 31, 2018from $7.0 million, or 0.8% of revenue, for the year ended December 31, 2017, primarily as a result of revenue growth resulting fromthe Recent Acquisitions, offset by operating expenses related to services purchased from owner-operators and third-party capacityproviders, salaries and wages, fuel expense, maintenance expense and depreciation and amortization. Excluding the impact of theRecent Acquisitions, operating income increased $2.3 million or 32.6%. Excluding the effect of the Recent Acquisitions, operatingincome as a percentage of revenue was 1.0%. The Company’s Flatbed Solutions segment’s operating income was $32.9 million, or 5.0% of revenue, for the year ended December31, 2018 and $18.5 million, or 5.2% of revenue, for the year ended December 31, 2017, an increase of 78.3%, primarily as a result ofrevenue growth resulting from the Flatbed Solutions Acquisitions, offset by operating expenses related to services purchased fromowner-operators and third-party capacity providers and salaries and wages. Excluding
51

Table of Contents
the Flatbed Solutions Acquisitions, the segment’s operating income increased $2.5 million or 13.8%. Excluding the impact of theFlatbed Solutions Acquisitions, operating income as a percentage of revenue was 5.2%. The Company’s Specialized Solutions segment’s operating income was $23.1 million, or 2.4% of revenue, for the year endedDecember 31, 2018 and $15.3 million, or 3.1% of revenue, for the year ended December 31, 2017, an increase of 50.2%, primarily asa result of an increase in the segment’s utilization of Company drivers and the resulting increase in salaries and wages, fuel expense,maintenance expense, services purchased from owner-operators and third-party capacity providers and depreciation and amortization,offset by revenue growth resulting from the Specialized Solutions Acquisitions. Excluding the Specialized Solutions Acquisitions,the segment’s operating income increased $7.0 million or 45.7%. Excluding the impact of the Specialized Solutions Acquisitions,operating income as a percentage of revenue was 3.9%. Interest Expense. Interest expense consists of cash interest, non-cash paid-in-kind interest, amortization of related issuance costsand fees and prepayment penalties. Interest expense increased 54.0% to $45.5 million for the year ended December 31, 2018 from$29.6 million for the year ended December 31, 2017. This increase was primarily attributable to an increase in amortization of debtissuance costs, debt balances and interest rates on the Term Loan facility. Income Tax . Benefit from income taxes decreased from $52.3 million for the year ended December 31, 2017 to $15.9 million forthe year ended December 31, 2018. The decrease is primarily the result of a one-time tax benefit due to the change in the Federal taxrate from 35% to 21% on net deferred tax liabilities as a result of the enactment of the TCJA as of December 31, 2017. For the yearended December 31, 2018, final valuations of intangible assets related to the 2017 acquisitions resulted in recognized deferred taxliabilities, which were then remeasured at the TCJA rates resulting in the recognition of an approximately $12.6 million deferred taxbenefit during the year ended December 31, 2018. The effective tax rate was 75.4% for the year ended December 31, 2018, comparedto 206.8% for the year ended December 31, 2017. The effective income tax rate varies from the federal statutory rate primarily due tothe impact of the TCJA, and to a lesser extent, state income taxes and the impact of nondeductible permanent differences, includingdriver per diems and transaction expenses .
52

Table of Contents
Year Ended December 31, 2017 Compared to Year Ended December 31, 2016 The following table sets forth items derived from the Company’s consolidated statements of operations for the years ended December31, 2017 and 2016 in dollars and as a percentage of total revenue and the increase or decrease in the dollar amounts of those items.
Year Ended December 31, 2017 2016 Increase (Decrease)(Dollars in thousands) $ % $ % $ % REVENUE: Freight $ 632,764 74.8 $ 517,861 79.5 $ 114,903 22.2Brokerage 120,943 14.3 87,410 13.4 33,533 38.4Logistics 22,074 2.6 — * 22,074 *Fuel surcharge 70,523 8.3 46,531 7.1 23,992 51.6
Total revenue 846,304 100.0 651,802 100.0 194,502 29.8 OPERATING EXPENSES: Salaries, wages and employee benefits 249,996 29.5 197,789 30.3 52,207 26.4Fuel 93,749 11.1 66,865 10.3 26,884 40.2Operations and maintenance 118,390 14.0 96,100 14.7 22,290 23.2Communications 2,145 0.3 1,618 0.2 527 32.6Purchased freight 225,254 26.6 154,054 23.6 71,200 46.2Administrative expenses 33,233 3.9 25,250 3.9 7,983 31.6Sales and marketing 1,965 0.2 1,743 0.3 222 12.7Taxes and licenses 11,055 1.3 9,222 1.4 1,833 19.9Insurance and claims 23,962 2.8 19,114 2.9 4,848 25.4Acquisition-related transaction expenses 3,377 0.4 25 * 3,352 *Depreciation and amortization 76,863 9.1 67,500 10.4 9,363 13.9Gain on disposition of revenue property and equipment (700) (0.1) (116) * (584) 503.4Impairment — * 2,005 0.3 (2,005) (100.0)
Total operating expenses 839,289 99.2 641,169 98.4 198,120 30.9Operating ratio 99.2% 98.4% Adjusted operating ratio 97.3% 95.6% INCOME FROM OPERATIONS 7,015 0.8 10,633 1.6 (3,618) (34.0) Other (income) expense: Interest income (398) * (44) * (354) *Interest expense 29,556 3.5 23,124 3.5 6,432 27.8Write-off of unamortized deferred financing fees 3,883 0.5 — * 3,883 *Other (740) * (331) (0.1) (409) 123.6
Total other expense, net 32,301 3.8 22,749 3.5 9,552 42.0 Income (loss) before income taxes (25,286) (3.0) (12,116) (1.9) (13,170) 108.7Provision for income taxes (52,282) (6.2) 163 * (52,445) (32,174.8)
Net income (loss) $ 26,996 3.2 $ (12,279) (1.9) $ 39,275 (319.9) OPERATING STATISTICS: Total miles 290,749,395 246,989,374 43,760,021 17.7Company-operated tractors, as of year-end 3,218 2,304 914 39.7Owner-operated tractors, as of year-end 2,056 609 1,447 237.6Number of trailers, as of year-end 11,237 6,347 4,890 77.0 Company-operated tractors, average for the year 2,644 2,279 365 16.0Owner-operated tractors, average for the year 888 667 221 33.1Total tractors, average for the year 3,532 2,946 586 19.9
* indicates not meaningful.(1) Adjusted operating ratio is not a recognized measure under GAAP. For a definition of adjusted operating ratio and reconciliation of
adjusted operating ratio to operating ratio, see “Non-GAAP Financial Measures” below.
53
(1)

Table of Contents
The following table sets forth the Company’s Flatbed Solutions segment’s revenue, operating expenses, operating ratio, adjustedoperating ratio and operating income for the years ended December 31, 2017 and 2016 in dollars and as a percentage of its FlatbedSolutions segment’s total revenue and the increase or decrease in the dollar amounts of those items. The following table also setsforth certain operating statistics for the Company’s Flatbed Solutions segment for the years ended December 31, 2017 and 2016.
FLATBED SOLUTIONS
Year Ended December 31, 2017 2016 Increase (Decrease)(Dollars in thousands) $ % $ % $ % REVENUE : Freight $ 276,592 78.1 $ 253,824 81.8 $ 22,768 9.0Brokerage 40,882 11.5 29,745 9.6 11,137 37.4Logistics 192 0.1 — * 192 *Fuel surcharge 36,440 10.3 26,871 8.7 9,569 35.6
Total revenue 354,106 100.0 310,440 100.0 43,666 14.1 OPERATING EXPENSES : Salaries, wages and employee benefits 96,860 27.4 93,818 30.2 3,042 3.2Fuel 41,592 11.7 36,503 11.8 5,089 13.9Operations and maintenance 36,524 10.3 32,845 10.6 3,679 11.2Purchased freight 107,248 30.3 77,563 25.0 29,685 38.3Depreciation and amortization 29,183 8.2 30,445 9.8 (1,262) (4.1)Other operating expenses 24,238 6.8 23,623 7.6 615 2.6
Total operating expenses 335,645 94.8 294,797 95.0 40,848 13.9Operating ratio 94.8% 95.0% Adjusted operating ratio 93.8% 93.4% INCOME FROM OPERATIONS $ 18,461 5.2 $ 15,643 5.0 $ 2,818 18.0 OPERATING STATISTICS: Total miles 152,956,123 149,284,755 3,671,368 2.5Company-operated tractors, as of year-end 1,155 1,203 (48) (4.0)Owner-operated tractors, as of year-end 1,392 390 1,002 256.9Number of trailers, as of year-end 4,573 2,943 1,630 55.4 Company-operated tractors, average for the year 1,156 1,182 (26) (2.2)Owner-operated tractors, average for the year 535 430 105 24.4Total tractors, average for the year 1,691 1,612 79 4.9
* indicates not meaningful.(1) Includes intersegment revenues and expenses, as applicable, which are eliminated in the Company’s consolidated results.(2) Adjusted operating ratio is not a recognized measure under GAAP. For a definition of adjusted operating ratio and reconciliation of
adjusted operating ratio to operating ratio, see “Non-GAAP Financial Measures” below.
54
(1)
(1)
(2)
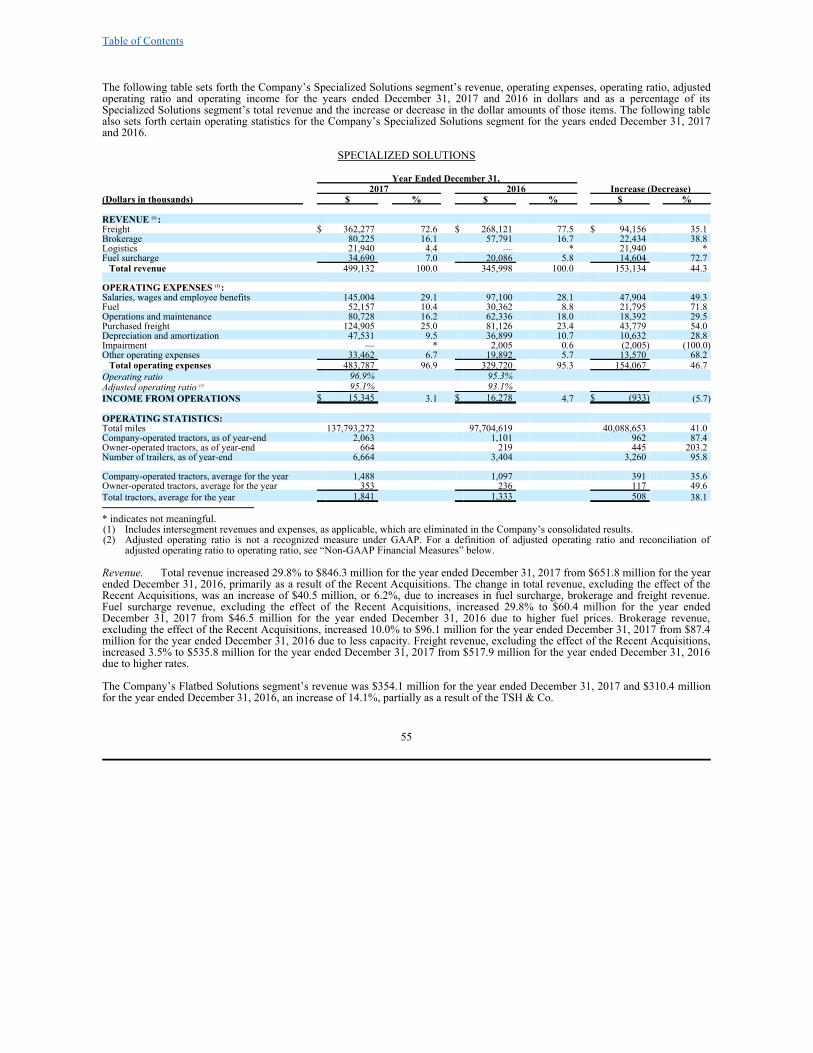
Table of Contents
The following table sets forth the Company’s Specialized Solutions segment’s revenue, operating expenses, operating ratio, adjustedoperating ratio and operating income for the years ended December 31, 2017 and 2016 in dollars and as a percentage of itsSpecialized Solutions segment’s total revenue and the increase or decrease in the dollar amounts of those items. The following tablealso sets forth certain operating statistics for the Company’s Specialized Solutions segment for the years ended December 31, 2017and 2016.
SPECIALIZED SOLUTIONS
Year Ended December 31, 2017 2016 Increase (Decrease)(Dollars in thousands) $ % $ % $ % REVENUE : Freight $ 362,277 72.6 $ 268,121 77.5 $ 94,156 35.1Brokerage 80,225 16.1 57,791 16.7 22,434 38.8Logistics 21,940 4.4 — * 21,940 *Fuel surcharge 34,690 7.0 20,086 5.8 14,604 72.7
Total revenue 499,132 100.0 345,998 100.0 153,134 44.3 OPERATING EXPENSES : Salaries, wages and employee benefits 145,004 29.1 97,100 28.1 47,904 49.3Fuel 52,157 10.4 30,362 8.8 21,795 71.8Operations and maintenance 80,728 16.2 62,336 18.0 18,392 29.5Purchased freight 124,905 25.0 81,126 23.4 43,779 54.0Depreciation and amortization 47,531 9.5 36,899 10.7 10,632 28.8Impairment — * 2,005 0.6 (2,005) (100.0)Other operating expenses 33,462 6.7 19,892 5.7 13,570 68.2
Total operating expenses 483,787 96.9 329,720 95.3 154,067 46.7Operating ratio 96.9% 95.3% Adjusted operating ratio 95.1% 93.1% INCOME FROM OPERATIONS $ 15,345 3.1 $ 16,278 4.7 $ (933) (5.7) OPERATING STATISTICS: Total miles 137,793,272 97,704,619 40,088,653 41.0Company-operated tractors, as of year-end 2,063 1,101 962 87.4Owner-operated tractors, as of year-end 664 219 445 203.2Number of trailers, as of year-end 6,664 3,404 3,260 95.8 Company-operated tractors, average for the year 1,488 1,097 391 35.6Owner-operated tractors, average for the year 353 236 117 49.6Total tractors, average for the year 1,841 1,333 508 38.1
* indicates not meaningful.(1) Includes intersegment revenues and expenses, as applicable, which are eliminated in the Company’s consolidated results.(2) Adjusted operating ratio is not a recognized measure under GAAP. For a definition of adjusted operating ratio and reconciliation of
adjusted operating ratio to operating ratio, see “Non-GAAP Financial Measures” below. Revenue. Total revenue increased 29.8% to $846.3 million for the year ended December 31, 2017 from $651.8 million for the yearended December 31, 2016, primarily as a result of the Recent Acquisitions. The change in total revenue, excluding the effect of theRecent Acquisitions, was an increase of $40.5 million, or 6.2%, due to increases in fuel surcharge, brokerage and freight revenue.Fuel surcharge revenue, excluding the effect of the Recent Acquisitions, increased 29.8% to $60.4 million for the year endedDecember 31, 2017 from $46.5 million for the year ended December 31, 2016 due to higher fuel prices. Brokerage revenue,excluding the effect of the Recent Acquisitions, increased 10.0% to $96.1 million for the year ended December 31, 2017 from $87.4million for the year ended December 31, 2016 due to less capacity. Freight revenue, excluding the effect of the Recent Acquisitions,increased 3.5% to $535.8 million for the year ended December 31, 2017 from $517.9 million for the year ended December 31, 2016due to higher rates. The Company’s Flatbed Solutions segment’s revenue was $354.1 million for the year ended December 31, 2017 and $310.4 millionfor the year ended December 31, 2016, an increase of 14.1%, partially as a result of the TSH & Co.
55
(1)
(1)
(2)

Table of Contents
Acquisition. The increase in revenue, excluding the effect of the TSH & Co. Acquisition, was 8.8%, or $27.4 million. This increasewas primarily the result of increases in rates and fuel surcharges, which produced increases of $12.4 million, or 4.9%, in freightrevenue, and $7.9 million, or 29.6%, in fuel surcharge revenue. Additionally, brokerage revenues increased $7.1 million, or 23.8%,for the year ended December 31, 2017 as compared to the year ended December 31, 2016 due to less capacity. The Company’s Specialized Solutions segment’s revenue was $499.1 million for the year ended December 31, 2017 and $346.0million for the year ended December 31, 2016, an increase of 44.3%, primarily as a result of the Specialized Solutions Acquisitions.The increase in revenue, excluding the effect of the Specialized Solutions Acquisitions, was $15.3 million, or 4.4%, primarily due toincreases in fuel surcharges and rates. Fuel surcharges, excluding the effect of the Specialized Solutions Acquisitions, increased30.3% to $26.2 million for the year ended December 31, 2017 from $20.1 million for the same period in 2016. Freight revenue,excluding the effect of the Specialized Solutions Acquisitions, increased 2.8% for the year ended December 31, 2017 compared tothe same period in 2016 and brokerage revenue, excluding the effect of the Specialized Solutions Acquisitions, increased by 2.9% forthe year ended December 31, 2017 compared to the same period in 2016. In both segments, excluding the effects of acquisitions, the increase in fuel surcharge revenue was the result of increases in fuelprices which commenced in the fourth quarter of 2016 and continued through the end of 2017, with only a less than 1% decrease infuel prices in the second quarter of 2017. Salaries, Wages and Employee Benefits. Salaries, wages and employee benefits expense, which consists of compensation for allemployees, is primarily affected by the number of miles driven by company drivers, the rate per mile paid to company drivers,employee benefits including, but not limited to, health care and workers’ compensation, and to a lesser extent, the number of, andcompensation and benefits paid to, non-driver employees. In general, the Specialized Solutions segment drivers receive a higherdriver pay per total mile than Flatbed Solutions segment drivers due to the former requiring a higher level of training and expertise. Salaries, wages and employee benefits expense increased 26.4% to $250.0 million for the year ended December 31, 2017 from$197.8 million for the year ended December 31, 2016, primarily as a result of the Recent Acquisitions. The increase in salaries,wages and employee benefits expense, excluding the effect of the Recent Acquisitions, was 5.4%, or $10.7 million, and wasprimarily due to increased employee compensation, workers’ compensation premiums, and stock-based compensation, partiallyoffset by a decrease in workers’ compensation claims. The Company’s Flatbed Solutions segment had a $3.0 million, or 3.2%, increase in salaries, wages and employee benefits expensefor the year ended December 31, 2017 compared to the year ended December 31, 2016, partially as a result of the TSH & Co.Acquisition, which resulted in a $1.3 million increase. Excluding the effect of the TSH & Co. Acquisition, salaries, wages andemployee benefit expense increased 1.8%, or $1.7 million, primarily due to increased employee compensation, workers’compensation premiums, and stock-based compensation, offset by decreases in workers’ compensation claims and employeebenefits. The Company’s Specialized Solutions segment had a $47.9 million, or 49.3%, increase in salaries, wages and employee benefitsexpense for the year ended December 31, 2017 compared to the year ended December 31, 2016, primarily as a result of theSpecialized Solutions Acquisitions. This increase, excluding the effect of the Specialized Solutions Acquisitions, was 7.9%, or $7.7million, and was primarily due to increased employee compensation, employee benefits, workers’ compensation premiums, andstock-based compensation. Fuel. Fuel expense consists primarily of diesel fuel expense for company-owned tractors and fuel taxes. The primary factorsaffecting fuel expense are the cost of diesel fuel, the miles per gallon realized with company equipment and the number of milesdriven by company drivers.
Total fuel expense increased $26.8 million, or 40.2%, to $93.7 million for the year ended December 31, 2017 from $66.9 million forthe year ended December 31, 2016. This increase was primarily a result of the Recent Acquisitions and higher fuel prices. Excludingthe effect of the Recent Acquisitions, fuel expense increased 15.9% or $10.7 million. The United
56

Table of Contents
States national average diesel fuel price, as published by the United States Department of Energy, was $2.656 for the year endedDecember 31, 2017, compared to $2.304 for the year ended December 31, 2016, a 15.3% increase. The Company’s Flatbed Solutions segment’s fuel expense increased 13.9% to $41.6 million for the year ended December 31, 2017from $36.5 million for the year ended December 31, 2016 primarily as a result of higher fuel prices. The TSH & Co. Acquisition didnot materially impact fuel expense for the year ended December 31, 2017. The Company’s Specialized Solutions segment’s fuel expense increased 71.8% to $52.2 million for the year ended December 31,2017 from $30.4 million for the year ended December 31, 2016, primarily as the result of the Specialized Solutions Acquisitions andhigher fuel prices. Excluding the effect of the Specialized Solutions Acquisitions, fuel expense in the Specialized Solutions segmentincreased 18.4% to $36.0 million as a result of higher fuel prices. Operations and Maintenance. Operations and maintenance expense consists primarily of ordinary vehicle repairs and maintenance,costs associated with preparing tractors and trailers for sale or trade-in, driver recruiting, training and safety costs, permitting andpilot car fees and other general operations expenses. Operations and maintenance expense is primarily affected by the age ofcompany-owned tractors and trailers, the number of miles driven in a period and driver turnover. Operations and maintenance expense increased 23.2% to $118.4 million for the year ended December 31, 2017 from $96.1 millionfor the year ended December 31, 2016, primarily as a result of the Recent Acquisitions. Excluding the effect of the RecentAcquisitions, operating and maintenance expense increased $6.8 million, or 7.1%, for the year ended December 31, 2017 ascompared to the year ended December 31, 2016, primarily as a result of higher pilot car expenses for alternative energy projects andother over-dimension loads, increased tractor lease costs as the Company’s utilization of operating leases to finance tractor purchasesincreased in 2017, increased tire replacements, offset by a decrease in in-house maintenance. The Company’s Flatbed Solutions segment’s operations and maintenance expense increased $3.7 million, or 11.2%, for the yearended December 31, 2017 as compared to the year ended December 31, 2016, primarily as a result of increased tire replacements,road maintenance, securements, tolls, training and tractor lease costs as the Company’s utilization of operating leases to financetractor purchases increased in 2017. The TSH & Co. Acquisition accounted for only $0.3 million of the increase in operations andmaintenance expense for the year ended December 31, 2017 as compared to the year ended December 31, 2016. The Company’s Specialized Solutions segment’s operations and maintenance expense increased $18.4 million, or 29.5%, for the yearended December 31, 2017 as compared to the year ended December 31, 2016, primarily as a result of the Specialized SolutionsAcquisitions. Excluding the effect of the Specialized Solutions Acquisitions, operations and maintenance expense increased $3.2million, or 5.1%, for the year ended December 31, 2017 as compared to the year ended December 31, 2016, primarily as a result ofincreased tractor lease costs as the Company’s utilization of operating leases to finance tractor purchases increased in 2017 andhigher pilot car expenses for alternative energy projects and other over-dimension loads, offset by decreases in in-house maintenance,road maintenance, and shop supplies costs. Purchased Freight. Purchased freight expense consists of the payments to owner-operators, including fuel surchargereimbursements, and payments to third-party capacity providers that haul loads brokered to them. Purchased freight expensegenerally takes into account changes in diesel fuel prices, resulting in lower payments during periods of declining fuel prices. Total purchased freight expense increased 46.2% from $154.1 million during the year ended December 31, 2016 to $225.3 millionduring the year ended December 31, 2017, primarily as a result of the Recent Acquisitions. Excluding the effect of the RecentAcquisitions on purchased freight expense, total purchased freight expense increased 11.3% to $171.5 million for the year endedDecember 31, 2017. Purchased freight expense from owner-operators, excluding the Recent Acquisitions, increased 11.0% from$89.0 million during the year ended December 31, 2016 to $98.8 million during the year ended December 31, 2017, primarily as aresult of increases in fuel surcharge reimbursements made to owner-operators as a result of higher fuel prices. Purchased freightexpense from third-party capacity providers, excluding the
57

Table of Contents
Recent Acquisitions, increased 13.6% from $62.0 million during the year ended December 31, 2016 to $70.5 million during the yearended December 31, 2017, primarily as a result of the increase in rates on brokered loads. The Company’s Flatbed Solutions segment’s purchased freight expense increased 38.3% to $107.2 million for the year endedDecember 31, 2017 from $77.6 million for the year ended December 31, 2016, partially as a result of the TSH & Co. Acquisition ,which resulted in a $13.3 million increase to purchased freight expense. Excluding the effect of the TSH & Co. Acquisition, theCompany’s Flatbed Solutions segment’s purchased freight expense increased 21.1% to $93.9 million for the year ended December31, 2017 as compared to the year ended December 31, 2016, primarily due to increases in total loads requiring higher utilization ofowner-operators and third-party capacity providers in the Company’s Flatbed Solutions segment. Purchased freight expense fromowner-operators, excluding the TSH & Co. Acquisition, increased 15.2% to $66.0 million for the year ended December 31, 2017from $57.3 million for the year ended December 31, 2016. Purchased freight expense from third-party capacity providers, excludingthe TSH & Co. Acquisition, increased 41.4% from $17.8 million during the year ended December 31, 2016 to $25.1 million duringthe year ended December 31, 2017, primarily as a result of the increase in brokered loads in the Company’s Flatbed Solutionssegment. The Company’s Specialized Solutions segment’s purchased freight expense increased 54.0% to $124.9 million during the year endedDecember 31, 2017 from $81.1 million during the year ended December 31, 2016, as a result of the Specialized SolutionsAcquisitions. Excluding the effect of the Specialized Solutions Acquisitions on purchased freight expense, total purchased freightexpense increased 4.1% to $84.4 million for the year ended December 31, 2017. Purchased freight expense from owner-operators,excluding the Specialized Solutions Acquisitions, increased 3.4% to $32.8 million for the year ended December 31, 2017 from $31.7million for the year ended December 31, 2016. Purchased freight expense from third-party capacity providers, excluding theSpecialized Solutions Acquisitions, increased 2.4% from $44.3 million during the year ended December 31, 2016 to $45.3 millionduring the year ended December 31, 2017, primarily as a result of increased in brokered loads in the Company’s SpecializedSolutions segment. Depreciation and Amortization. Depreciation and amortization expense consists primarily of depreciation for company-ownedtractors and trailers or amortization of those financed with capital leases. The primary factors affecting these expense items includethe size and age of company-owned tractors and trailers and the cost of new equipment. Depreciation and amortization expense increased 13.9% to $76.9 million, including $6.7 million of intangible assets amortization,during the year ended December 31, 2017 from $67.5 million during the year ended December 31, 2016, as a result of the RecentAcquisitions. After adjusting for the effect of the Recent Acquisitions, depreciation and amortization expense decreased 5.4%,primarily as a result of an increasing shift in utilization of operating leases to finance capital expenditures. The Company’s Flatbed Solutions segment had a 4.1% decrease to $29.2 million, including $1.7 million of intangible assetsamortization, in depreciation and amortization expense for the year ended December 31, 2017 as compared to the year endedDecember 31, 2016. Excluding the TSH & Co. Acquisition, depreciation and amortization expense during the year ended December31, 2017 decreased 4.4% primarily as a result of a 4.0% reduction in company-owned tractors and a 3.0% reduction in trailers,respectively, as compared to the year ended December 31, 2016. The Company’s Specialized Solutions segment had a 28.8% increase to $47.5 million, including $4.9 million of intangible assetsamortization, in depreciation and amortization expense for the year ended December 31, 2017 as compared to the year endedDecember 31, 2016 as a result of the Specialized Solutions Acquisitions. After adjusting for the effect of the Specialized SolutionsAcquisitions, depreciation and amortization expense decreased 6.1% for the year ended December 31, 2017 as compared to the yearended December 31, 2016, primarily as a result of an increasing shift in utilization of operating leases to finance capital expenditures. Taxes and Licenses. Operating taxes and licenses expense primarily represents the costs of taxes and licenses associated with theCompany’s fleet of equipment and will vary according to the size of its equipment fleet. Taxes and licenses expense increased from$9.2 million for the year ended December 31, 2016 to $11.1 million for the year ended December 31, 2017. Excluding the effect ofthe Recent Acquisitions, operating taxes and licenses expense, as a percentage of revenue, was 1.3% for the year ended December 31,2017 as compared to 1.4% for the year ended December 31, 2016.
58

Table of Contents
Insurance and Claims. Insurance and claims expense consists of insurance premiums and the accruals the Company makes forestimated payments and expenses for claims for bodily injury, property damage, cargo damage and other casualty events. Theprimary factors affecting the Company’s insurance and claims expense are seasonality (the Company typically experiences higheraccident frequency in winter months), the frequency and severity of accidents, trends in the development factors used in its accrualsand developments in large, prior-year claims. The frequency of accidents tends to increase with the miles the Company travels.Insurance and claims expense increased 25.4% to $24.0 million during the year ended December 31, 2017 from $19.1 million duringthe year ended December 31, 2016, primarily as a result of the Recent Acquisitions. Excluding the effect of the Recent Acquisitions,insurance and claims increased 2.8%, or $0.5 million. This increase can be primarily attributed to an increase in insurance premiumrates, partially offset by a marginal decrease in total miles of 0.6% excluding miles from the Recent Acquisitions. Impairment. During 2017, the Company had no charges relating to impairment of revenue equipment or goodwill. In 2016, certainlong-lived assets in the Specialized Solutions segment were written down with a charge of $1.6 million due to a decline in marketvalue on select tractors with defective diesel particulate filter systems. The charge was necessary to reduce the carrying value of thisrevenue equipment to the price expected to be received upon sale of the assets to a third party. Also in 2016, the carrying value ofone subsidiary exceeded its estimated fair value. Accordingly, a non-cash, non-tax deductible goodwill impairment charge of $0.4million was recognized during the fourth quarter of 2016. Operating Income. Operating income decreased 34.0% to $7.0 million, or 0.8% of revenue, for the year ended December 31, 2017from $10.6 million, or 1.6% of revenue, for the year ended December 31, 2016, primarily as a result of revenue growth resultingfrom the Recent Acquisitions, offset by operating expenses related to services purchased from owner-operators and third-partycapacity providers, salaries and wages, fuel expense, maintenance expense and depreciation and amortization. Excluding the effectof the Recent Acquisitions, operating income decreased $3.1 million or 29.1%. Excluding the effect of the Recent Acquisitions,operating income as a percentage of revenue was 1.1%. The Company’s Flatbed Solutions segment’s operating income was $18.5 million, or 5.2% of revenue, for the year ended December31, 2017 and $15.6 million, or 5.0% of revenue, for the year ended December 31, 2016, an increase of 18.0%, primarily as a result ofrevenue growth resulting from the Flatbed Solutions Acquisitions, offset by operating expenses related to services purchased fromowner-operators and third-party capacity providers and salaries and wages. Excluding the effect of the Flatbed SolutionsAcquisitions, the segment’s operating income increased $2.6 million or 16.4%. Excluding the effect of the Flatbed SolutionsAcquisitions, operating income as a percentage of revenue was 5.4%. The Company’s Specialized Solutions segment’s operating income was $15.3 million, or 3.1% of revenue, for the year endedDecember 31, 2017 and $16.3 million, or 4.7% of revenue, for the year ended December 31, 2016, a decrease of 5.7%, primarily as aresult of an increase in salaries and wages, fuel expense, maintenance expense, services purchased from owner-operators and third-party capacity providers and depreciation and amortization, offset by revenue growth resulting from the Specialized SolutionsAcquisitions. Excluding the effect of the Specialized Solutions Acquisitions, the segment’s operating income decreased $0.2 millionor 1.0%. Excluding the impact of the Specialized Solutions Acquisitions, operating income as a percentage of revenue was 4.5%. Interest Expense. Interest expense consists of cash interest, non-cash paid-in-kind interest, amortization of related issuance costsand fees and prepayment penalties. Interest expense increased 27.8% to $29.5 million during the year ended December 31, 2017 from$23.1 million during the year ended December 31, 2016. This increase was primarily attributable to an increase in amortization ofdebt issuance costs and higher interest rates on the Term Loan Facility as compared to debt outstanding in 2016 under the SeniorTerm Loan and Equipment Term Loans. Income Tax. Provision for income taxes decreased from $0.2 million for the year ended December 31, 2016 to a tax benefit of$52.3 million for the year ended December 31, 2017. The decrease is primarily the result of a one-time tax benefit due to the changein the Federal tax rate from 35% to 21% on net deferred tax liabilities as a result of the enactment of the TCJA. The effective tax ratewas 206.8% for the year ended December 31, 2017, compared to (1.3)% for the year ended December 31, 2016. The effective incometax rate varies from the federal statutory rate primarily due to the impact of the TCJA, and to a lesser extent, state income taxes andthe impact of nondeductible permanent differences, including
59
Table of Contents
driver per diems, transaction expenses and cumulative change in the state tax rate applied to the beginning net deferred tax liabilitiesbalance. Non-GAAP Financial Measures Adjusted EBITDA, Adjusted EBITDAR and Free Cash Flow Adjusted EBITDA, Adjusted EBITDAR and free cash flow are not recognized measures under GAAP. The Company uses these non-GAAP measures as supplements to its GAAP results in evaluating certain aspects of its business, as described below. The Company defines Adjusted EBITDA as net income (loss) plus (i) depreciation and amortization, (ii) interest expense, includingother fees and charges associated with indebtedness, net of interest income, (iii) income taxes, (iv) acquisition-related transactionexpenses (including due diligence costs, legal, accounting and other advisory fees and costs, retention and severance payments andfinancing fees and expenses), (v) non-cash impairment, (vi) losses (gains) on sales of defective revenue equipment out of the normalreplacement cycle, (vii) impairment related to defective revenue equipment sold out of the normal replacement cycle, (viii) initialpublic offering-related expenses (which offering Private Daseke withdrew at the end of 2015), (ix) expenses related to the BusinessCombination and related transactions, (x) non-cash stock and equity-compensation expense, and (xi) accounting charges resultingfrom accounting for the possible earn-out pursuant to the Business Combination. The Company defines Adjusted EBITDAR asAdjusted EBITDA plus tractor operating lease charges. The Company’s board of directors and executive management team use Adjusted EBITDA as a key measure of its performance andfor business planning. Adjusted EBITDA assists them in comparing its operating performance over various reporting periods on aconsistent basis because they remove from the Company’s operating results the impact of items that, in their opinion, do not reflectthe Company’s core operating performance. The Company’s method of computing Adjusted EBITDA is substantially consistent withthat used in its debt covenants and also is routinely reviewed by its management for that purpose. Adjusted EBITDAR is used as a means of understanding one aspect of earnings before the impact of certain financing transactions byallowing the Company to compare its results of operations against its peers without regard to its or its peers’ financing method orcapital structure. Specifically, Adjusted EBITDAR is used to view operating results before lease charges as these charges can varywidely among trucking companies due to differences in the way that trucking companies finance their fleet acquisitions. The Company believes its presentation of Adjusted EBITDA and Adjusted EBITDAR is useful because they provide investors andindustry analysts the same information that the Company uses internally for purposes of assessing its core operating performance.However, Adjusted EBITDA and Adjusted EBITDAR are not substitutes for, or more meaningful than, net income (loss), cash flowsfrom operating activities, operating income or any other measure prescribed by GAAP, and there are limitations to using non-GAAPmeasures such as Adjusted EBITDA and Adjusted EBITDAR. Certain items excluded from Adjusted EBITDA and AdjustedEBITDAR are significant components in understanding and assessing a company’s financial performance, such as a company’s costof capital, tax structure and the historic costs of depreciable assets. In particular, Adjusted EBITDAR is a valuation metric and shouldnot be viewed as a measure of overall performance because it excludes tractor operating lease charges, which is a normal, recurringcash operating expense that is necessary to operate our business. For the foregoing reason, Adjusted EBITDAR has significantlimitations which affect its use as an indicator of our profitability. Accordingly, you are cautioned not to place undue reliance on thisinformation. Additionally, other companies in its industry may define Adjusted EBITDA and Adjusted EBITDAR differently thanthe Company does, and as a result, it may be difficult to use Adjusted EBITDA, Adjusted EBITDAR or similarly named non-GAAPmeasures that other companies may use to compare the performance of those companies to its performance. Because of theselimitations, Adjusted EBITDA and Adjusted EBITDAR should not be considered measures of the income generated by theCompany’s business or discretionary cash available to it to invest in the growth of its business. The Company’s managementcompensates for these limitations by relying primarily on the Company’s GAAP results and using Adjusted EBITDA and AdjustedEBITDAR supplementally.
60

Table of Contents
The Company defines free cash flow as net cash provided by operating activities less purchases of property and equipment, plusproceeds from sale of property and equipment. The Company’s board of directors and executive management team use free cash flowto assess the Company’s liquidity and ability to repay maturing debt, fund operations and make additional investments. TheCompany believes free cash flow provides useful information to investors because it is an important indicator of the Company’sliquidity, including its ability to reduce net debt, make strategic investments, pay dividends to common shareholders and repurchasestock. The Company’s measure of free cash flow may not be directly comparable to similar measures reported by other companies.Furthermore, free cash flow is not a substitute for, or more meaningful than, net cash provided by operating activities nor any othermeasure prescribed by GAAP, and there are limitations to using non-GAAP measures such as free cash flow. Accordingly, free cashflow should not be considered a measure of the income generated by the Company’s business or discretionary cash available to it toinvest in the growth of its business. The Company’s management compensates for these limitations by relying primarily on theCompany’s GAAP results and using free cash flow supplementally. A reconciliation of Adjusted EBITDA and Adjusted EBITDAR to net income (loss) for the years ended December 31, 2018, 2017and 2016 is as follows:
Year Ended December 31, (Dollars in thousands) 2018 2017 2016 Net income (loss) $ (5,187) $ 26,996 $ (12,279)Depreciation and amortization 131,082 76,863 67,500Interest income (1,323) (398) (44)Interest expense 45,505 29,556 23,124Write-off of unamortized deferred financing fees — 3,883 —Income tax provision (benefit) (15,922) (52,282) 163Acquisition-related transaction expenses 2,684 3,377 296Impairment 13,890 — 2,005Stock-based compensation expense 3,585 1,875 —Withdrawn initial public offering-related expenses — — 3,051Net losses on sales of defective revenue equipment out of the normal replacement cycle — — 718Impairment on sales of defective revenue equipment out of the normal replacement cycle — — 190Expenses related to the Business Combination and related transactions — 2,034 3,516Tractor operating lease charges 20,520 16,865 12,937
Adjusted EBITDAR $ 194,834 $ 108,769 $ 101,177Less tractor operating lease charges (20,520) (16,865) (12,937)Adjusted EBITDA $ 174,314 $ 91,904 $ 88,240
A reconciliation of free cash flow to cash flows from operating activities for the years ended December 31, 2018, 2017 and 2016 is asfollows:
Year Ended December 31, (Dollars in thousands) 2018 2017 2016Net cash provided by operating activities $ 105,263 $ 45,764 $ 66,415Purchases of property and equipment (66,414) (19,792) (4,108)Proceeds from sale of property and equipment 26,359 5,773 5,906Free cash flow $ 65,208 $ 31,745 $ 68,213
Adjusted Operating Ratio
Adjusted operating ratio is not a recognized measure under GAAP. The Company uses adjusted operating ratio as a supplement to itsGAAP results in evaluating certain aspects of its business, as described below. The Company defines adjusted operating ratio as(a) total operating expenses (i) less fuel surcharges, acquisition-related transaction expenses, non-cash impairment charges and initialpublic offering-related expenses (which offering Private Daseke withdrew at the end of 2015) and (ii) further adjusted for the netimpact of the step-up in basis resulting from acquisitions (such as increased depreciation and amortization expense), as a percentageof (b) total revenue excluding fuel surcharge revenue.
61

Table of Contents
The Company’s board of directors and executive management team view adjusted operating ratio, and its key drivers of revenuequality, growth, expense control and operating efficiency, as a very important measure of the Company’s performance. TheCompany believes fuel surcharge is often volatile and eliminating the impact of this source of revenue (by eliminating fuel surchargefrom revenue and by netting fuel surcharge against fuel expense) affords a more consistent basis for comparing its results ofoperations between periods. The Company also believes excluding acquisition-related transaction expenses, additional depreciationand amortization expenses as a result of acquisitions, non-cash impairment and withdrawn initial public offering-related expensesenhances the comparability of its performance between periods. The Company believes its presentation of adjusted operating ratio is useful because it provides investors and industry analysts thesame information that it uses internally for purposes of assessing its core operating profitability. However, adjusted operating ratio isnot a substitute for, or more meaningful than, operating ratio, operating margin or any other measure derived solely from GAAPmeasures, and there are limitations to using non-GAAP measures such as adjusted operating ratio. Although the Company believesthat adjusted operating ratio can make an evaluation of its operating performance more consistent because it removes items that, in itsopinion, do not reflect its core operations, other companies in its industry may define adjusted operating ratio differently than it does.As a result, it may be difficult to use adjusted operating ratio or similarly named non-GAAP measures that other companies may useto compare the performance of those companies to the Company’s performance. The Company’s management compensates for theselimitations by relying primarily on its GAAP results and using adjusted operating ratio supplementally. A reconciliation of operating ratio to adjusted operating ratio for each of the years ended December 31, 2018, 2017 and 2016 is asfollows:
Year Ended December 31, (Dollars in thousands) 2018 2017 2016 Revenue (excluding fuel surcharge revenue) $ 1,471,394 $ 775,781 $ 605,271Fuel surcharge revenue 141,688 70,523 46,531
Revenue 1,613,082 846,304 651,802Salaries, wages and employee benefits 407,429 249,996 197,789Fuel 141,097 93,749 66,865Operations and maintenance 181,534 118,390 96,100Purchased freight 588,603 225,254 154,054Depreciation and amortization 131,082 76,863 67,500Impairment 13,890 — 2,005Other operating expenses 127,536 75,037 56,856
Operating expenses 1,591,171 839,289 641,169Operating ratio 98.6% 99.2% 98.4%
Fuel surcharge 141,688 70,523 46,531Acquisition-related transaction expenses 2,684 3,377 25Impairment 13,890 — 2,005Withdrawn initial public offering-related expenses — — 3,051Expenses related to the Business Combination and related transactions — 2,034 3,516Net impact of step-up in basis of acquired assets 24,095 8,356 7,389
Adjusted operating expenses $ 1,408,814 $ 754,999 $ 578,652Adjusted operating ratio 95.7% 97.3% 95.6%
(1) Operating ratio is defined as (a) total operating expenses as a percentage of (b) total revenue.(2) Adjusted operating ratio is defined as (a) total operating expenses (i) less fuel surcharges, acquisition-related transaction expenses, non-cash
impairment charges and expenses related to the Business Combination and related transactions and (ii) further adjusted for the net impact of the step-upin basis resulting from acquisitions (such as increased depreciation and amortization expense), as a percentage of (b) total revenue excluding fuelsurcharge revenue.
62
(1)
(2)

Table of Contents
A reconciliation of the Company’s Flatbed Solutions segment’s operating ratio to adjusted operating ratio for the years endedDecember 31, 2018, 2017 and 2016 is as follows:
FLATBED SOLUTIONS
Year Ended December 31, (Dollars in thousands) 2018 2017 2016 Revenue (excluding fuel surcharge revenue) $ 584,893 $ 317,666 $ 283,569Fuel surcharge revenue 77,110 36,440 26,871
Revenue 662,003 354,106 310,440Salaries, wages and employee benefits 122,134 96,860 93,818Fuel 50,781 41,592 36,503Operations and maintenance 48,415 36,524 32,845Purchased freight 331,923 107,248 77,563Depreciation and amortization 36,099 29,183 30,445Other operating expenses 39,733 24,238 23,623
Operating expenses 629,085 335,645 294,797Operating ratio 95.0% 94.8% 95.0%
Fuel surcharge 77,110 36,440 26,871Net impact of step-up in basis of acquired assets 1,994 1,091 3,169
Adjusted operating expenses $ 549,981 $ 298,114 $ 264,757Adjusted operating ratio 94.0% 93.8% 93.4%
(1) Includes intersegment revenues and expenses, as applicable, which are eliminated in the Company’s consolidated results. A reconciliation of the Company’s Specialized Solutions segment’s operating ratio to adjusted operating ratio for the years endedDecember 31, 2018, 2017 and 2016 is as follows:
SPECIALIZED SOLUTIONS
Year Ended December 31, (Dollars in thousands) 2018 2017 2016 Revenue (excluding fuel surcharge revenue) $ 899,064 $ 464,442 $ 325,912Fuel surcharge 66,000 34,690 20,086
Revenue 965,064 499,132 345,998Salaries, wages and employee benefits 277,591 145,004 97,100Fuel 90,316 52,157 30,362Operations and maintenance 132,487 80,728 62,336Purchased freight 270,639 124,905 81,126Depreciation and amortization 94,818 47,531 36,899Impairment 13,890 — 2,005Other operating expenses 62,272 33,462 19,892
Operating expenses 942,013 483,787 329,720Operating ratio 97.6% 96.9% 95.3%
Fuel surcharge 66,000 34,690 20,086Impairment 13,890 — 2,005Net impact of step-up in basis of acquired assets 22,101 7,265 4,220
Adjusted operating expenses $ 840,022 $ 441,832 $ 303,409Adjusted operating ratio 93.4% 95.1% 93.1%
(1) Includes intersegment revenues and expenses, as applicable, which are eliminated in the Company’s consolidated results .
63
(1)
(1)
(1)
(1)

Table of Contents
Liquidity and Capital Resources and Capital Requirements
Overview The Company’s business requires substantial amounts of cash to cover operating expenses as well as to fund items such as cashcapital expenditures on its fleet and other assets, working capital changes, principal and interest payments on debt obligations, lettersof credit to support insurance requirements and tax payments. The Company made net cash capital expenditures of approximately$40.1 million for 2018. The Company’s primary sources of liquidity have been provided by operations, issuances of capital stock and borrowings under itscredit facilities. In February 2018, the Company completed an underwritten public offering of 8,625,000 shares of the Company’scommon stock for its own account. After deducting underwriting discounts and commissions and offering expenses payable by theCompany, the Company received approximately $84.4 million of net proceeds from the offering, which the Company has been usingfor general corporate purposes, which may include, among other things, working capital, capital expenditures, debt repayment orrefinancing, and support the Company’s acquisition strategy.
The Company has from time to time considered the possibility of a private offering of debt securities, which may be secured orunsecured, which would not be registered under the Securities Act of 1933, as amended (the “Securities Act”), and which would beoffered only to qualified institutional buyers pursuant to Rule 144A under the Securities Act and to persons outside the United Statespursuant to Regulation S under the Securities Act. The proceeds of such an offering may be used for general corporate purposes,including the repayment of all or a portion of the Company’s term loan credit facility, repayment of outstanding balances on the ABLfacility and to support the Company’s acquisition strategy. Also, in connection with such offering, the Company’s credit facilitiesmay be amended or refinanced. There can be no assurance that the Company will conduct or complete such a debt offering. The Company had the following sources of liquidity available as of December 31, 2018 and December 31, 2017.
December 31, (Dollars in thousands) 2018 2017 Cash $ 45,974 $ 90,679Availability under revolving line of credit 87,768 55,500Total $ 133,742 $ 146,179
Cash decreased by $44.7 million during the year ended December 31, 2018 as compared to the year ended December 31, 2017. Thisdecrease primarily resulted from net debt repayments and cash paid in acquisitions, offset by proceeds from the sale of commonstock. For the year ended December 31, 2018, the Company completed acquisitions with cash of $131.7 million ($135.1 million cashpaid, less $3.4 million cash acquired). See Note 4 of Notes to the Consolidated Financial Statements for more information. OnFebruary 20, 2018, the Company raised $84.4 million from an offering of 8,625,000 shares of its common stock. See Note 13 ofNotes to the Consolidated Financial Statements for more information. As of December 31, 2018, the Company has (i) a $500.0 million senior secured term loan credit facility, consisting of a $250.0million term loan, a $150 million tack-on loan and $100.0 million of term loans funded under a delayed draw term loan facility, and(ii) an asset-based senior secured revolving credit facility with an aggregate maximum credit amount equal to $100.0 million (subjectto availability under a borrowing base). The delayed draw term loans were used to support the Company’s acquisition activities. SeeNote 10 of Notes to Consolidated Financial Statements for more information regarding the Term Loan Facility, the ABL Facility, theSenior Term Loan and the Line of Credit. The Company believes it can finance its expected cash needs, including debt repayment, in the short-term with cash flows fromoperations and borrowings available under the ABL Facility. The Company expects that the ABL Facility will provide sufficientcredit availability to support its ongoing operations, fund its new debt service requirements, capital expenditures, and working capitalneeds. Over the long-term, the Company will continue to have significant capital
64

Table of Contents
requirements, and expects to devote substantial financial resources to grow its operations and fund its acquisition activities. As aresult of these funding requirements, the Company likely will need to sell additional equity or debt securities or seek additionalfinancing through additional borrowings, lease financing or equity capital, though it is not likely that the Company will issue anyequity securities in the near term. The availability of financing or equity capital will depend upon the Company’s financial conditionand results of operations as well as prevailing market conditions. If such additional borrowings, lease financing or equity capital isnot available at the time it needs to incur such expenditures, the Company may be required to extend the maturity of then outstandingindebtedness, rely on alternative financing arrangements or engage in asset sales . Cash Flows The Company’s summary statements of cash flows information for the years ended December 31, 2018, 2017 and 2016 are set forthin the table below:
Year Ended December 31, (Dollars in thousands) 2018 2017 2016 Net cash provided by operating activities $ 105,263 $ 45,764 $ 66,415Net cash provided by (used in) investing activities $ (171,771) $ (293,853) $ 1,798Net cash provided by (used in) financing activities $ 20,911 $ 335,141 $ (69,404) Operating Activities. Cash provided by the Company’s operating activities consists of net income or loss adjusted for certain non-cash items, including depreciation and amortization, deferred interest, gain/loss on disposal of property and equipment, deferredincome taxes, deferred gain and interest recognized on sales-type leases, stock-based compensation, bad debt expense and the effectof changes in working capital and other activities . Cash provided by operating activities was $105.3 million during the year ended December 31, 2018 and consisted of $5.2 million ofnet loss plus $126.3 million of non-cash items, consisting primarily of depreciation, amortization, deferred taxes impairment ofgoodwill and intangible assets, and stock-based compensation, less $15.9 million of net cash used for working capital and otheractivities . Cash used for working capital and other activities during the year ended December 31, 2018 primarily reflect a $33.2million increase in accounts receivable and a $4.2 million increase in prepaid expenses and other current assets, offset by $14.7million in payments received on sales-type leases and a $6.8 million increase in accounts payable and accrued expenses. Cashprovided by operating activities was $45.8 million during the year ended December 31, 2017 and consisted of $27.0 million of netincome plus $29.3 million of non-cash items, consisting primarily of depreciation and amortization and the write-off of $3.9 millionof deferred financing fees, less $10.5 million of net cash used by working capital and other activities. Cash used for working capitaland other activities during the year ended December 31, 2017 primarily reflect a $15.3 million increase in accounts receivable and a$3.4 million increase in prepaid expenses and other current assets, offset by $5.8 million in payments received on sales-type leasesand a $1.9 million increase in accounts payable and accrued expenses. The $59.5 million increase in cash provided by operating activities during the year ended December 31, 2018 as compared withthe year ended December 31, 2017 was primarily the result of a $44.2 million increase in depreciation, a $9.9 million increase inamortization of intangible assets, a $33.6 million decrease in tax benefits primarily due to re-measurements of deferred tax liabilitiesusing the TCJA rates, and the recognition of a $13.9 million goodwill and intangible impairment. These amounts were offset by a$5.4 million increase in net cash used for working capital and other activities, and $3.9 million for the write-off of deferred financingfees during the year ended December 31, 2017 which did not occur during the year ended December 31, 2018. The $20.6 million decrease in cash provided by operating activities during the year ended December 31, 2017 as compared withthe year ended December 31, 2016 was the result of a $42.0 million decrease of non-cash items, primarily from a one-time taxbenefit due to the change in the Federal tax rate from 35% to 21% on net deferred tax liabilities as a result of the enactment of theTax Cuts and Jobs Act in December 2017. Other factors for the decrease in cash provided by operating activities include the $10.5million of net cash used by working capital and other activities during the year ended December
65

Table of Contents
31, 2017 as compared to $7.4 million of net cash provided by working capital and other activities during the year endedDecember 31, 2016, offset by a $39.3 million increase in net income. Investing Activities . Cash used by investing activities decreased $122.1 million during the year ended December 31, 2018 ascompared to the year ended December 31, 2017, primarily due to a decrease of $148.1 million paid for the Recent Acquisitions, netof cash acquired. Excluding the Recent Acquisitions, cash used in investing activities increased $26.0 million for the year endedDecember 31, 2018 as compared to the year ended December 31, 2017 due to increases in net purchases of revenue equipment. Cash used by investing activities increased $295.6 million during the year ended December 31, 2017 as compared to the year endedDecember 31, 2016, primarily due to $279.8 million paid for the Recent Acquisitions, net of cash acquired. Excluding the RecentAcquisitions, cash used in investing activities increased $15.8 million for the year ended December 31, 2017 as compared to the yearended December 31, 2016 due to increases in net purchases of revenue equipment. Total capital expenditures for the year ended December 31, 2018 and 2017 are shown below:
Year Ended December 31, (Dollars in thousands) 2018 2017 Revenue equipment (tractors, trailers and trailer accessories) $ 50,955 $ 16,884Buildings and building improvements 9,346 677Other 6,113 2,231Total cash capital expenditures 66,414 19,792Less: Proceeds from sales of property and equipment 26,359 5,773Net cash capital expenditures 40,055 14,019Revenue equipment (tractors, trailers and trailer accessories) 89,547 21,383Other 325 514Total financed capital expenditures 89,872 21,897Total capital expenditures, less proceeds $ 129,927 $ 35,916
66

Table of Contents
The following tables provide details on the cash and noncash components of gross capital expenditures for the Company’sreportable segments for the years ended December 31, 2018 and 2017 (in thousands):
Flatbed Specialized Solutions Solutions Corporate/ Consolidated(Dollars in thousands) Segment Segment Eliminations TotalYear Ended December 31, 2018
Cash flows from investing activities Purchases of property and equipment $ 6,721 $ 57,608 $ 2,085 $ 66,414Proceeds from sale of property and equipment (9,448) (16,911) — (26,359)
Noncash investing and financing activities
Property and equipment acquired with debt or capital leaseobligations 31,460 58,412 — 89,872
Total capital expenditures, less proceeds $ 28,733 $ 99,109 $ 2,085 $ 129,927 Year Ended December 31, 2017
Cash flows from investing activities Purchases of property and equipment $ 3,609 $ 15,583 $ 600 $ 19,792Proceeds from sale of property and equipment (725) (5,048) — (5,773)
Noncash investing and financing activities
Property and equipment acquired with debt or capital leaseobligations 4,795 17,102 — 21,897
Total capital expenditures, less proceeds $ 7,679 $ 27,637 $ 600 $ 35,916
Financing Activities . Cash flows from financing activities decreased from $335.1 million provided by financing activities for theyear ended December 31, 2017 to $20.9 million provided by financing activities for the year ended December 31, 2018, primarily asa result of the recapitalization and refinancing of outstanding long-term debt in conjunction with the Business Combination in 2017.Other decreases were primarily a result of net debt repayments and stock dividends. Cash flows from financing activities for the yearended December 31, 2018 included $4.6 million net repayments on the line of credit, net repayments of $52.5 million of long-termdebt and $5.0 million paid for Series A Preferred Stock dividends. These amounts were offset by $84.4 million of net proceeds fromthe February 2018 offering of common stock. Cash flows from financing activities increased from $69.4 million used in financing activities for the year ended December 31, 2016to $335.1 million provided by financing activities for the year ended December 31, 2017. This increase was primarily a result of arecapitalization and refinancing of outstanding long-term debt in conjunction with the Business Combination. The recapitalizationincluded $64.6 million of proceeds upon issuance of common stock and $65.0 million of proceeds upon issuance of Series APreferred Stock, partially offset by $36.2 million in repurchases of common stock. Cash inflows from the recapitalization andproceeds from a new $250.0 million term loan (discussed under Material Debt below) were utilized in part for repayments of $66.7million in subordinated debt, principal repayments of $239.5 million in long-term debt and $19.2 million in financing fees. Excludingcash flows from the Business Combination, cash flows from financing activities included $2.3 million net repayments on the line ofcredit, $12.3 million from advances on long term debt, $100.0 million advance on the delayed draw term loan facility, $150.0 millionfrom a tack-on loan to the term loan facility, $6.2 million Series A and Series B Preferred Stock dividends and proceeds of $63.6million for the September 2017 issuance of common stock.
67

Table of Contents
Material Debt Overview As of December 31, 2018, the Company had the following material debt:
· the Term Loan Facility and the ABL Facility;· secured equipment loans and capital lease agreements; and· bank mortgage secured by real estate
The amounts outstanding under such agreements and other debt instruments were as follows as of December 31, 2018 and 2017:
December 31, (Dollars in thousands) 2018 2017Revolving line of credit $ — $ 4,561Term loan facility 493,478 498,462Mortgages 3,900 3,669Equipment term loans and capital leases 205,036 128,315Total long-term debt and capital leases 702,414 635,007Less: current portion (63,535) (43,056)Long-term debt and capital leases, less current portion $ 638,879 $ 591,951
On February 27, 2017, in conjunction with the Closing, the Company entered into the New Credit Facilities, a portion of theborrowings of which were used to pay off the Old PNC Term Loan, the Old Revolving Credit Facility, the Main Street Loan, the PCPSubordinated Notes, the LST Subordinated Notes, the Davenport Subordinated Note and the Bulldog Subordinated Note. See Note 10 of Notes to Consolidated Financial Statements included herein for information regarding the Company’s material debt. Off-Balance Sheet Arrangements The Company’s financial condition, results of operations, liquidity, capital expenditures and capital resources are not materiallyaffected by off-balance sheet transactions. The Company had stand-by letters of credit in the amount of $14.2 million and $13.7million at December 31, 2018 and 2017, respectively. The letters of credit provide collateral primarily for liability insurance claims.Also, the Company leases certain revenue equipment, terminals and office building facilities under non-cancelable operating leases.The Company’s rent expense under these leases for the years ended December 31, 2018, 2017 and 2016 was approximately $35.3million, $23.8 million and $16.0 million , respectively. At December 31, 2018, there were 17,520,329 shares of common stock issuable upon exercise of outstanding warrants at a strikeprice of $11.50 per share.
68
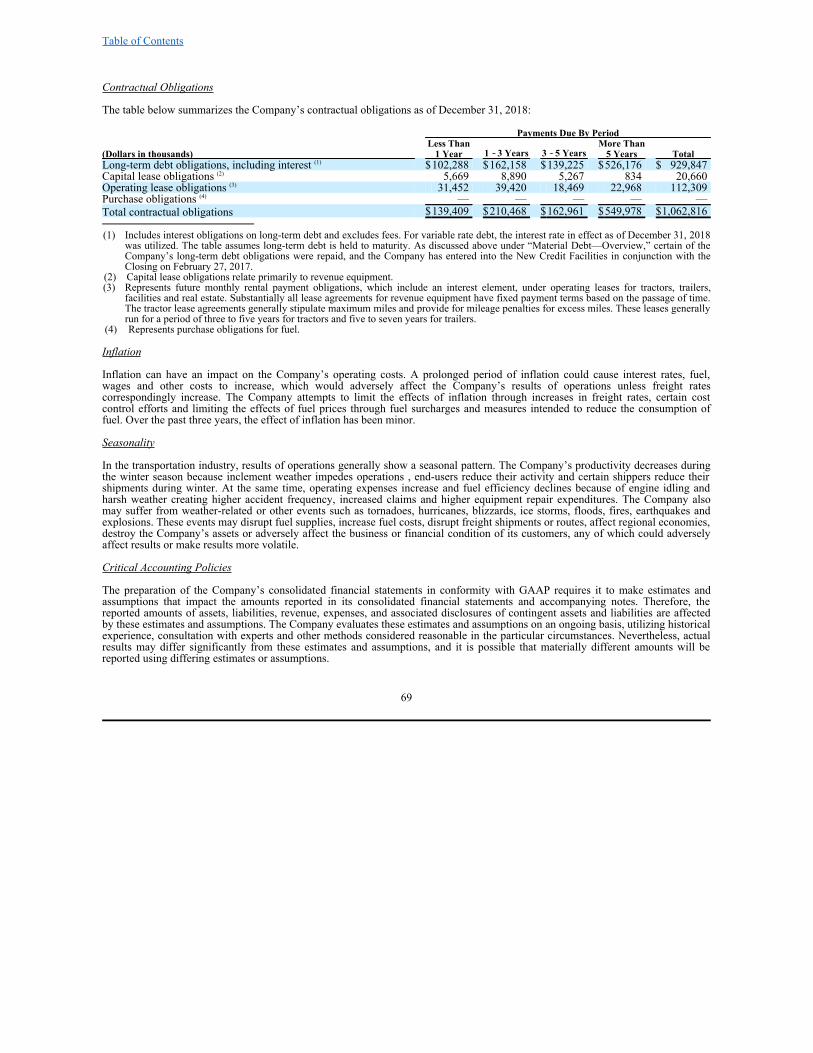
Table of Contents
Contractual Obligations The table below summarizes the Company’s contractual obligations as of December 31, 2018:
Payments Due By Period Less Than More Than (Dollars in thousands) 1 Year 1 ‑‑3 Years 3 ‑‑5 Years 5 Years TotalLong-term debt obligations, including interest $102,288 $162,158 $139,225 $526,176 $ 929,847Capital lease obligations 5,669 8,890 5,267 834 20,660Operating lease obligations 31,452 39,420 18,469 22,968 112,309Purchase obligations — — — — —Total contractual obligations $139,409 $210,468 $162,961 $549,978 $1,062,816
(1) Includes interest obligations on long-term debt and excludes fees. For variable rate debt, the interest rate in effect as of December 31, 2018was utilized. The table assumes long-term debt is held to maturity. As discussed above under “Material Debt—Overview,” certain of theCompany’s long-term debt obligations were repaid, and the Company has entered into the New Credit Facilities in conjunction with theClosing on February 27, 2017.
(2) Capital lease obligations relate primarily to revenue equipment.(3) Represents future monthly rental payment obligations, which include an interest element, under operating leases for tractors, trailers,
facilities and real estate. Substantially all lease agreements for revenue equipment have fixed payment terms based on the passage of time.The tractor lease agreements generally stipulate maximum miles and provide for mileage penalties for excess miles. These leases generallyrun for a period of three to five years for tractors and five to seven years for trailers.
(4) Represents purchase obligations for fuel.
Inflation Inflation can have an impact on the Company’s operating costs. A prolonged period of inflation could cause interest rates, fuel,wages and other costs to increase, which would adversely affect the Company’s results of operations unless freight ratescorrespondingly increase. The Company attempts to limit the effects of inflation through increases in freight rates, certain costcontrol efforts and limiting the effects of fuel prices through fuel surcharges and measures intended to reduce the consumption offuel. Over the past three years, the effect of inflation has been minor. Seasonality In the transportation industry, results of operations generally show a seasonal pattern. The Company’s productivity decreases duringthe winter season because inclement weather impedes operations , end-users reduce their activity and certain shippers reduce theirshipments during winter. At the same time, operating expenses increase and fuel efficiency declines because of engine idling andharsh weather creating higher accident frequency, increased claims and higher equipment repair expenditures. The Company alsomay suffer from weather-related or other events such as tornadoes, hurricanes, blizzards, ice storms, floods, fires, earthquakes andexplosions. These events may disrupt fuel supplies, increase fuel costs, disrupt freight shipments or routes, affect regional economies,destroy the Company’s assets or adversely affect the business or financial condition of its customers, any of which could adverselyaffect results or make results more volatile. Critical Accounting Policies The preparation of the Company’s consolidated financial statements in conformity with GAAP requires it to make estimates andassumptions that impact the amounts reported in its consolidated financial statements and accompanying notes. Therefore, thereported amounts of assets, liabilities, revenue, expenses, and associated disclosures of contingent assets and liabilities are affectedby these estimates and assumptions. The Company evaluates these estimates and assumptions on an ongoing basis, utilizing historicalexperience, consultation with experts and other methods considered reasonable in the particular circumstances. Nevertheless, actualresults may differ significantly from these estimates and assumptions, and it is possible that materially different amounts will bereported using differing estimates or assumptions.
69
(1)
(2)
(3)
(4)

Table of Contents
The Company considers critical accounting policies to be those that require it to make more significant judgments and estimateswhen preparing financial statements. The Company’s critical accounting policies include the following: Revenue Recognition The Company recognizes revenue and related costs over time when the Company satisfies its performance obligation(s) transferringgoods or services to the customer and the customer obtains control . With respect to freight, brokerage, logistics and fuel surchargerevenue, these conditions are met, and the Company recognizes freight, brokerage and fuel surcharge revenue, over time and logisticsrevenue, as the services are provided. The Company regularly engages third-party capacity providers to haul loads brokered to them when it needs additional capacity. TheCompany is primarily responsible for fulfilling the promise to provide load transportation services, and has discretion in settingprices, along with the risk to fulfill the contract to the customer. Based upon this evaluation, the Company has determined that it isthe principal and therefore, records gross revenues and expenses for brokerage services. Accordingly, all such revenue billed tocustomers is classified as brokerage revenue, and all corresponding payments to carriers for transportation services arranged by theCompany in connection with brokerage and intermodal activities and to independent contractor providers of revenue equipment areclassified as purchased freight. The Company’s revenue and related costs are recognized over time when the Company satisfies its performance obligation(s)transferring goods or services to the customer and the customer obtains control. While there may be master service agreements withCompany customers, a contract is not established until the customer specifically requests the Company’s services and the Companyaccepts. The Company evaluates each contract for distinct performance obligations. In the Company’s business, a typical performanceobligation is the transportation of a load including any highly interrelated ancillary services. The Company predominantly estimates the standalone selling price of its services based upon observable evidence, market conditionsand other relevant inputs. The Company allocates the total transaction price to each distinct performance obligation based upon therelative standalone selling prices. The Company’s customers simultaneously receive and consume the benefits of the Company’s contracts; therefore revenue isrecognized over time. This is a faithful depiction of the satisfaction of the performance obligation, as the customer does not need tore-perform the transportation services the Company has provided to date. Generally, the Company’s customers are billed upon delivery of the freight or monthly and remit payment according to the approvedpayment terms. Goodwill and Intangible Assets Goodwill and other intangible assets result from business acquisitions. The Company accounts for business acquisitions by assigningthe purchase price to tangible and intangible assets and liabilities. Assets acquired and liabilities assumed are recorded at their fairvalues and the excess of the purchase price over amounts assigned is recorded as goodwill. Goodwill is tested for impairment at least annually (or more frequently if impairment indicators arise) for each reporting unit byapplying either a qualitative or quantitative analysis in accordance with the authoritative accounting guidance on goodwill. TheCompany first assesses qualitative factors to evaluate whether it is more likely than not that the fair value of a reporting unit is lessthan its carrying amount as the basis for determining whether it is necessary to perform a quantitative goodwill impairment test. TheCompany may bypass the qualitative assessment for any reporting unit in any period and proceed directly with the quantitativeanalysis. The quantitative analysis compares the fair value of the reporting unit with its carrying amount. The Company estimates thefair value of a reporting unit using discounted expected future cash flows. The Company’s annual assessment is conducted as ofOctober 1 of each year. Prior to 2017, the annual assessment was conducted as of November 1, but was changed during 2017 tobetter align with the Company’s reporting periods. The change in testing date does not delay, accelerate or avoid an impairmentcharge. The Company determined
70

Table of Contents
that it is impractical to objectively determine projected cash flows and related valuation estimates that would have been used as ofOctober 1 for periods prior to October 1, 2017 without the use of hindsight. As such, the Company prospectively applied the changein the annual goodwill impairment assessment date beginning October 1, 2017. During the fourth quarter of 2018, managementperformed goodwill impairment testing on its reporting units, which resulted in goodwill impairment for one reporting unit of $11.1million. Management does not believe that any of the goodwill balances in its reporting units are currently at significant risk ofimpairment; however, of the $258.4 million of goodwill on the Company’s consolidated balance sheet as of December 31, 2018,approximately $154.6 million is recorded in reporting units for which the estimated fair value exceeded the carrying value by lessthan 20% in the most recent quantitative test. Other intangible assets recorded consist of indefinite lived trade names and definite lived non-competition agreements and customerrelationships. These intangible assets are stated at estimated fair value at the time of acquisition less accumulated amortization.Amortization is recorded using the straight-line method over the following estimated useful lives: (i) non-competition agreements:two to five years and (ii) customer relationships: 10 to 15 years. The Company evaluates its definite lived intangible assets forimpairment when current facts or circumstances indicate that the carrying value of the assets to be held and used may not berecoverable. Indefinite-lived intangible assets are tested for impairment annually by applying a fair value based analysis inaccordance with the authoritative accounting guidance for such assets. Income Taxes Income taxes are accounted for using an asset and liability approach that requires the recognition of deferred tax assets and liabilitiesfor the expected future tax consequences of temporary differences between the consolidated financial statement and tax basis ofassets and liabilities at the applicable enacted tax rates. The Company adheres to the provisions of Financial Accounting Standards Board (FASB) Accounting Standards Codification (ASC)740‑10, Income Taxes , relating to accounting for uncertain tax positions. The Company recognizes the tax benefit from uncertain taxpositions only if it is more likely than not that the tax positions will be sustained on examination by the tax authorities, based on thetechnical merits of the position. The tax benefit is measured based on the largest benefit that has a greater than 50% likelihood ofbeing realized upon ultimate settlement. Accrued Insurance and Claims The Company uses a combination of purchased insurance and self-insurance programs, and beginning in December 2017, with theacquisition of the Roadmaster Group (see Note 3 to the consolidated financial statements), a captive group insurance company. Theinsurance provides for the cost of vehicle liability, cargo loss, damage, general liability, property, workers’ compensation claims andemployee medical benefits. Self-insurance accruals relate primarily to vehicle liability, cargo damage, workers’ compensation andemployee medical claims. The measurement and classification of self-insured costs requires the consideration of historical cost experience, demographic andseverity factors, and judgments about the current and expected levels of cost per claim and retention levels. These methods provideestimates of the liability associated with claims incurred as of the balance sheet date, including claims not reported. The Companybelieves these methods are appropriate for measuring these highly judgmental self-insurance accruals. However, the use of anyestimation method is sensitive to the assumptions and factors described above, based on the magnitude of claims and the length oftime from the date the claim is incurred to ultimate settlement. Accordingly, changes in these assumptions and factors can materiallyaffect actual costs paid to settle the claims and those amounts may be different than estimates. Stock-Based Compensation Awards of equity instruments issued to employees and directors are accounted for under the fair value method of accounting andrecognized in the consolidated statements of operations and comprehensive income (loss). Compensation
71
Table of Contents
cost is measured for all stock-based awards at fair value on the date of grant and recognized using the straight-line method over theservice period over which the awards are expected to vest. Fair value of all time-vested options as of the date of grant is estimated using the Black-Scholes option valuation model, which wasdeveloped for use in estimating the fair value of traded options that have no vesting restrictions and are fully transferable. Optionvaluation models require the input of highly subjective assumptions, including the expected stock price volatility. Since the Companydoes not have a sufficient history of exercise behavior, expected term is calculated using the assumption that the options will beexercised ratably from the date of vesting to the end of the contractual term for each vesting tranche of awards. The risk-free interestrate is based on the United States Treasury yield curve for the period of the expected term of the stock option. Expected volatility iscalculated using an index of publicly traded peer companies. Fair values of nonvested stock awards (restricted stock units) are equal to the market value of the common stock on the date of theaward with compensation costs amortized over the vesting period of the award. Recently Issued Accounting Pronouncements In August 2018, the Financial Accounting Standards Board (FASB) issued Accounting Standards Updated (ASU) 2018-15,Intangibles – Goodwill and Other – Internal-Use Software (Subtopic 350-40). ASU 2018-15 aligns the requirements for capitalizingimplementation costs incurred in a hosting arrangement (Cloud-based) that is a service contract with the requirements for capitalizingimplementation costs incurred to develop or obtain internal-use software. ASU 2018-15 will become effective for annual periodsbeginning after December 15, 2019 and interim periods within those periods, with early adoption permitted. ASU 2018-15 can beapplied either retrospectively or prospectively to all implementation costs incurred after the date of adoption. The Company haselected to early adopt ASU 2018-15 on a prospective basis and has capitalized relevant software implementation costs ofapproximately $2.0 million as of December 31, 2018. In March 2018, the FASB issued ASU 2018-05, Income Taxes (Topic 740). ASU 2018-05 provides amendments to SEC paragraphspursuant to SEC Staff Accounting Bulletin (SAB) No. 118 related to the Tax Cuts and Jobs Act (TCJA) that became effectiveJanuary 2018. The Company adopted the disclosure requirements of SAB 118 as of December 31, 2017, which were included in theCompany’s Annual Report on Form 10-K filed March 16, 2018 and as described in SAB 118 carried forward through December 31,2018.
In July 2017, the FASB issued ASU 2017-11, Earnings per Share (Topic 260), Distinguishing Liabilities from Equity (Topic 480)and Topic 815. ASU 2017-11 provides guidance on accounting for financial instruments with down round features and clarifies thedeferral of certain provisions in Topic 480. ASU 2017-11 will become effective for annual periods beginning after December 15,2018 and interim periods within those periods. The Company is currently evaluating the impact of adopting this guidance. In May 2017, the FASB issued ASU 2017-09, Compensation – Stock Compensation (Topic 718). ASU 2017-09 provides guidanceabout which changes to the terms or conditions of a share-based payment award requires the application of modification accounting.Modification accounting will apply unless the fair value of the modified award is the same as the original award, the vestingconditions of the modified award are the same as the original award and the classification of the modified award as an equityinstrument or liability instrument is the same as the original award. ASU 2017-09 became effective for annual periods beginning afterDecember 15, 2017 and interim periods within those periods. The Company adopted this pronouncement on January 1, 2018 whichdid not have a material impact on its consolidated results of operations, financial condition, cash flows, or financial statementdisclosures as there were no changes to the terms or conditions of the Company’s share-based payment awards during the year endedDecember 31, 2018. In August 2016, the FASB issued ASU 2016-15, Statement of Cash Flows (Topic 230). ASU 2016-15 provides new guidanceintended to reduce diversity in practice in how certain cash receipts and payments are classified in the statement of cash flows,including debt prepayment or extinguishment costs, the settlement of contingent liabilities arising from a business combination,proceeds from insurance settlements, and distributions from certain equity method investees. ASU
72

Table of Contents
2016-15 became effective for fiscal years beginning after December 15, 2017 and interim periods within fiscal years. The Companyadopted this pronouncement on January 1, 2018 which did not impact its consolidated statement of cash flows.
In June 2016, the FASB issued ASU No. 2016-13, Accounting for Credit Losses (Topic 326). ASU 2016-13 requires the use of an“expected loss” model on certain types of financial instruments. ASU 2016-13 is effective for fiscal years, and interim periods withinthose years, beginning after December 15, 2019, with early adoption permitted. The Company is currently evaluating the impact ofadopting this guidance. In February 2016, the FASB issued ASU 2016-02, Leases, followed by additional accounting standards updates that providedadditional practical expedients and policy elections options (collectively, Accounting Standards Codification Topic 842, (ASC 842)).ASC 842 amends various aspects of existing guidance for leases and requires the recognition of assets and liabilities arising from alease for both financing and operating leases, along with additional qualitative and quantitative disclosures. The main differencebetween previous GAAP and the amended standard is the recognition of lease assets and lease liabilities of lessees on the balancesheet for those leases classified as operating leases under previous GAAP. ASC 842 is effective for annual periods beginning afterDecember 15, 2018, and interim periods within those annual periods. The Company will adopt ASC 842 using the modifiedretrospective method and elect the option to not apply ASC 842 to comparative periods. The Company also elected the followingpractical expedients:
· not to apply the recognition requirements to leases with terms of twelve months or less,
· carryforward previous conclusions related to current lease classification under the current lease accounting standard to leaseclassification for these existing leases under ASC 842,
· to combine lease and non-lease components for certain asset classes, and
· to apply the portfolio approach in determination of the incremental borrowing rate.The adoption of ASC 842 will result in increasing assets and liabilities with right-of-use assets and related liabilities on theCompany’s consolidated balance sheets. Right-of-use assets the Company expects to record on the balance sheet include primarilytrucking facilities and terminals and revenue equipment leases, all classified as operating leases. The impact to the Company’sconsolidated statements of operations and cash flows are not expected to be material. The Company has compiled and analyzed itscontracts and identified its full lease population and is still in the process of populating its leasing software and implementing newcontrols associated with the standard. Item 7A. Quantitative and Qualitative Disclosures About Market Risk The Company has interest rate exposure arising from the credit facilities and other financing agreements, which have variable interestrates. These variable interest rates are impacted by changes in short-term interest rates. In conjunction with the BusinessCombination, in February 2017, the Company’s interest rate swap was terminated. Assuming the current level of borrowings, ahypothetical one-percentage point increase in interest rates would increase the Company’s annual interest expense by $5.0 million.As of December 31, 2018 and December 31, 2017, the Company had outstanding approximately $497.3 million and $509.4 million,respectively, of variable rate borrowings that were not subject to interest rate swaps. The Company has commodity exposure with respect to fuel used in company-owned and leased tractors. Increases in fuel prices willraise the Company’s operating costs, even after applying fuel surcharge revenue. Historically, the Company has been able to recovera majority of fuel price increases from its customers in the form of fuel surcharges. The Company cannot predict the extent or speedof potential changes in fuel price levels in the future, the degree to which the lag effect of fuel surcharge programs will impact it as aresult of the timing and magnitude of such changes, or the extent to which effective fuel surcharges can be maintained and collectedto offset such increases. The Company generally has not used derivative financial instruments to hedge its fuel price exposure in thepast, but continues to evaluate this possibility. Item 8. Financial Statements and Supplementary Data The information called for by Item 8 is found in a separate section of this Form 10-K starting on pages F-1. See the “Index
73
Table of Contents
to Financial Statements” on page F-1.
Item 9. Changes in and Disagreements with Accountants on Accounting and Financial Disclosure None. Item 9A. Controls and Procedures Disclosure Controls and Procedures The Company maintains disclosure controls and procedures (as defined in Rules 13a-15(e) and 15d-15(e) under The SecuritiesExchange Act of 1934, as amended (the “Exchange Act”)), which are designed to ensure that information required to be disclosed bythe Company in reports that it files or submits under the Exchange Act, including this Report, are recorded, processed, summarizedand reported within the time periods specified in the SEC’s rules and forms. These disclosure controls and procedures includecontrols and procedures designed to ensure that information required to be disclosed by the Company under the Exchange Act isaccumulated and communicated to the Company’s management, including its principal executive officer (“CEO”) and principalfinancial officer (“CFO”), as appropriate to allow timely decisions regarding required disclosure. The Company’s management,including the Company’s CEO and CFO, conducted an evaluation of the effectiveness of the Company’s disclosure controls andprocedures as of the end of the period covered by this Report and, based on that evaluation, the CEO and CFO concluded that certainof the Company’s disclosure controls and procedures were not effective as of December 31, 2018 because of the material weaknessesin our internal control over financial reporting described below. Management’s Report on Internal Control over Financial Reporting
The Company’s management is responsible for establishing and maintaining adequate internal control over financial reporting(“ICFR”), as such term is defined in Exchange Act Rules 13a-15(f) and 15d-15(f) . Under the supervision and with the participationof our management, including our principal executive officer and principal financial officer, we conducted an evaluation of theeffectiveness of our internal control over financial reporting as of December 31, 2018, based on the criteria established in InternalControl – Integrated Framework (2013) issued by the Committee of Sponsoring Organizations of the Treadway Commission(COSO). Based on this evaluation, management has concluded that we did not maintain effective internal control over financialreporting as of December 31, 2018, due to the material weaknesses identified below. A material weakness is a deficiency, or combination of deficiencies, in internal control over financial reporting, such that there is areasonable possibility that a material misstatement of the Company’s annual or interim financial statements will not be prevented ordetected on a timely basis. We did not design and maintain effective information technology general computer controls related toprogram change management and user access and management’s review of the completeness and accuracy of certain system-generated reports. Additionally, we did not maintain effective controls at certain of our operating companies related to the review andapproval of manual journal entries, the review and approval of payroll and the review and approval of revenue transactions.Specifically, we did not maintain controls to ensure (i) that journal entries were properly reviewed and approved by an appropriateindividual separate from the preparer of such journal entry, (ii) that, at two of our operating companies payrolls were properlyreviewed and approved and at one of these operating companies, that revenue transactions were properly reviewed and approved.These material weaknesses did not result in any material misstatements of the Company’s financial statements or disclosures for thequarter or year ended December 31, 2018. Management has excluded from its assessment of the Company’s ICFR as of December 31, 2018, the ICFR of Aveda Transportationand Energy Services Inc., Builders Transportation Co., LLC, Kelsey-Trail Trucking Ltd., and Leavitts Freight Service, Inc., eachwholly-owned subsidiaries of the Company, because they were acquired by the Company in purchase business combinations during2018. The excluded operating companies represent approximately 16% of consolidated total assets and 10% of consolidated netrevenues as of and for the year ended December 31, 2018.
74

Table of Contents
Grant Thornton LLP, the independent registered public accounting firm that audited the consolidated financial statements of theCompany included in this Annual Report on Form 10-K, has issued an attestation report on the effectiveness of the Company’sinternal control over financial reporting as of December 31, 2018. The report is included in this Item under the heading Report ofIndependent Registered Public Accounting Firm. Management Remediation Initiatives as of December 31, 2018 Management of the Company and the Board take internal controls and integrity of the Company’s financial statements seriously andbelieve that the remediation steps described below are essential to maintaining a strong internal controls environment. Managementbelieves that progress has been made during the quarter ended December 31, 2018, and through the date of this report, to remediatethe underlying causes of the material weaknesses in internal control over financial reporting and is taking the following remediationsteps: Material weakness related to ineffective information technology general controls (ITGCs) The remediation actions include: (i) discussing the issues with the impacted personnel, including operating company leadership andIT personnel; (ii) developing a training program addressing ITGCs and policies, including educating control owners concerning theprinciples and requirements of each control, with a focus on those related to user access and change management over IT systemsimpacting financial reporting; (iii) developing and maintaining documentation underlying ITGCs to promote knowledge transferupon personnel and function changes; and (iv) implementing an IT management review and testing plan to monitor ITGCs with aspecific focus on systems supporting our financial reporting processes. Material weaknesses related to the review and approval of manual journal entries and payroll and revenue transactions The remediation actions include: (i) developing and implementing a training program and discussing the issues with the impactedpersonnel, including operating company leadership and business control owners; (ii) assessing the Company’s Evidence of InternalControl policies and procedures and revising policies and procedures as needed to provide necessary guidance to the operatingcompanies; (iii) evaluating whether further enhancements are needed to the design of corporate/operating company business processcontrols; and (iv) augmenting the existing in-house SOX Compliance department to help oversee the control development, controltesting and remediation process. Changes in Internal Control over Financial Reporting Remediation of Material Weakness as of June 30, 2018 As previously disclosed in the second quarter 10-Q, a material weakness related to identifying and recording deferred tax liabilitieson the final amounts allocated to intangible assets acquired in business combinations was identified during the quarter ended June 30,2018. We have determined that this material weakness has been fully remediated as of December 31, 2018. The remediation steps we have taken include:
· Reviewed our income tax processes and controls and enhanced the overall design and procedures performed upon thecompletion of final purchase accounting related to intangible assets in calculating the deferred tax liability for purchaseaccounting on an interim and annual basis.
· Re-designed our management review controls and enhanced the precision of review around the key income tax areasrelating to finalizing purchase accounting.
As of December 31, 2018, the remedial measures described above have been satisfactorily implemented and we have had sufficienttime to test the operating effectiveness of such remedial measures. We maintained internal control over financial reporting related toidentifying and recording deferred tax liabilities on the final amounts allocated to intangible assets acquired in businesscombinations, and as such, the material weakness identified in the Company’s internal control over
75

Table of Contents
financial reporting related to identifying and recording deferred tax liabilities on the final amounts allocated to intangible assetsacquired in business combinations has been remediated. Except as described above, there were no changes in our internal control over financial reporting (as defined in Rules 13a-15(f) and15d-15(f) under the Exchange Act) that occurred during the Company’s most recently completed quarter ended December 31, 2018that have materially affected, or are reasonably likely to materially affect, the Company’s internal control over financial reporting.
76
Table of Contents
REPORT OF INDEPENDENT REGISTERED PUBLIC ACCOUNTING FIRM
Board of Directors and StockholdersDaseke, Inc. Opinion on internal control over financial reportingWe have audited the internal control over financial reporting of Daseke, Inc. (a Delaware corporation) and subsidiaries (the“Company”) as of December 31, 2018, based on criteria established in the 2013 Internal Control—Integrated Framework issued bythe Committee of Sponsoring Organizations of the Treadway Commission (“COSO”). In our opinion, because of the effect of thematerial weaknesses described in the following paragraphs on the achievement of the objectives of the control criteria, the Companyhas not maintained effective internal control over financial reporting as of December 31, 2018, based on criteria established in the2013 Internal Control—Integrated Framework issued by COSO. A material weakness is a deficiency, or combination of control deficiencies, in internal control over financial reporting, such thatthere is a reasonable possibility that a material misstatement of the company’s annual or interim financial statements will not beprevented or detected on a timely basis. The following material weaknesses have been identified and included in management’sassessment:
· Deficiencies in the design and operating effectiveness of information technology controls related to user access and programchange management and management review controls related to the completeness and accuracy of certain system-generatedreports.
· Certain of the Company's operating companies did not maintain effective internal controls over the review and approval ofmanual journal entries.
· Deficiencies in business process controls were identified at two of the Company’s operating companies related to the reviewand approval of payroll, and in one of these operating companies also related to review and approval of revenuetransactions.
We also have audited, in accordance with the standards of the Public Company Accounting Oversight Board (United States)(“PCAOB”), the consolidated financial statements of the Company as of and for the year ended December 31, 2018. The materialweaknesses identified above were considered in determining the nature, timing, and extent of audit tests applied in our audit of the2018 consolidated financial statements, and this report does not affect our report dated March 8, 2019, which expressed anunqualified opinion on those financial statements. Basis for opinionThe Company’s management is responsible for maintaining effective internal control over financial reporting and for its assessmentof the effectiveness of internal control over financial reporting, included in the accompanying Management’s Report on InternalControl over Financial Reporting (“Management’s Report”). Our responsibility is to express an opinion on the Company’s internalcontrol over financial reporting based on our audit. We are a public accounting firm registered with the PCAOB and are required tobe independent with respect to the Company in accordance with the U.S. federal securities laws and the applicable rules andregulations of the Securities and Exchange Commission and the PCAOB. We conducted our audit in accordance with the standards of the PCAOB. Those standards require that we plan and perform the auditto obtain reasonable assurance about whether effective internal control over financial reporting was maintained in all materialrespects. Our audit included obtaining an understanding of internal control over financial reporting, assessing the risk that a materialweakness exists, testing and evaluating the design and operating effectiveness of internal control based on the assessed risk, andperforming such other procedures as we considered necessary in the circumstances. We believe that our audit provides a reasonablebasis for our opinion. Our audit of, and opinion on, the Company’s internal control over financial reporting does not include the internal control overfinancial reporting of Aveda Transportation and Energy Services, Inc., Builders Transportation Co., LLC, Leavitt’s Freight Service,Inc., and Kelsey-Trail Trucking Ltd., wholly-owned subsidiaries (collectively, the “Acquired Entities”),
77

Table of Contents
whose financial statements reflect total assets and revenues constituting 16 and 10 percent, respectively, of the related consolidatedfinancial statement amounts as of and for the year ended December 31, 2018. As indicated in Management’s Report, the AcquiredEntities were acquired during 2018. Management’s assertion on the effectiveness of the Company’s internal control over financialreporting excluded internal control over financial reporting of the Acquired Entities. Definition and limitations of internal control over financial reportingA company’s internal control over financial reporting is a process designed to provide reasonable assurance regarding the reliabilityof financial reporting and the preparation of financial statements for external purposes in accordance with generally acceptedaccounting principles. A company’s internal control over financial reporting includes those policies and procedures that (1) pertain tothe maintenance of records that, in reasonable detail, accurately and fairly reflect the transactions and dispositions of the assets of thecompany; (2) provide reasonable assurance that transactions are recorded as necessary to permit preparation of financial statementsin accordance with generally accepted accounting principles, and that receipts and expenditures of the company are being made onlyin accordance with authorizations of management and directors of the company; and (3) provide reasonable assurance regardingprevention or timely detection of unauthorized acquisition, use, or disposition of the company’s assets that could have a materialeffect on the financial statements. Because of its inherent limitations, internal control over financial reporting may not prevent or detect misstatements. Also,projections of any evaluation of effectiveness to future periods are subject to the risk that controls may become inadequate because ofchanges in conditions, or that the degree of compliance with the policies or procedures may deteriorate. Other informationWe do not express an opinion or any other form of assurance on management’s statements referring to the remediation actions andplans that were implemented subsequent to December 31, 2018./s/ GRANT THORNTON LLP
Dallas, TexasMarch 8, 2019
78

Table of Contents
Item 9B. Other Information None.
79

Table of Contents
Part III Item 10. Directors, Executive Officers and Corporate Governance The information called for by this Item will be contained in the Company ’s amendment on Form 10-K/A to be filed not later than120 days after the close of the fiscal year ended December 31, 2018. Item 11. Executive Compensation The information called for by this Item will be contained in the Company’s amendment on Form 10-K/A to be filed not later than120 days after the close of the fiscal year ended December 31, 2018. Item 12. Security Ownership of Certain Beneficial Owners and Management and Related Stockholder Matters The information called for by this Item will be contained in the Company’s amendment on Form 10-K/A to be filed not later than120 days after the close of the fiscal year ended December 31, 2018. Item 13. Certain Relationships and Related Party Transactions, and Director Independence The information called for by this Item will be contained in the Company’s amendment on Form 10-K/A to be filed not later than120 days after the close of the fiscal year ended December 31, 2018. Item 14. Principal Accountant Fees and Services The information called for by this Item will be contained in the Company’s amendment on Form 10-K/A to be filed not later than120 days after the close of the fiscal year ended December 31, 2018.
80

Table of Contents
Part IV Item 15. Exhibits and Consolidated Financial Statement Schedules (a)(1) Financial Statements The financial statements included in Item 8. Financial Statements and Supplementary Data above are filed as part of this Form 10-K. (2) Financial Statement Schedules There are no financial statement schedules filed as part of this Form 10-K, since the required information is included in theConsolidated Financial Statements, including the notes thereto, or the circumstances requiring inclusion of such schedules are notpresent. (3) Exhibits :
Exhibit No. Exhibit2.1§†
Merger Agreement, dated as of December 22, 2016, by and among Hennessy Capital Acquisition Corp. II, HCACMerger Sub, Inc., Daseke, Inc. and Don R. Daseke, solely in his capacity as the Stockholder Representative(incorporated by reference to Exhibit 2.1 to the Current Report on Form 8-K filed by the registrant on December 29,2016).
2.2§†
Purchase and Sale Agreement by and among Daseke, Inc., Daseke TRS LLC, and Thomas R. Schilli, dated May 1,2017 (incorporated by reference to Exhibit 2.1 to the Quarterly Report on Form 10-Q filed by the registrant onAugust 9, 2017).
2.3§†
Purchase and Sale Agreement, dated December 1, 2017, by and among Daseke, Inc., Daseke MFS LLC, Daniel R.Moore, Judith N. Moore, Randall K. Moore, Tiffani M. Swalley, John D. Moore and V. Jean Nichols (incorporatedby reference to Exhibit 2.3 to the Annual Report on Form 10-K for the fiscal year ended December 31, 2017) .
2.4§†
Purchase and Sale Agreement, dated December 1, 2017, by and among Daseke, Inc., Daseke RM LLC and LyonsCapital, LLC (incorporated by reference to Exhibit 2.4 to the Annual Report on Form 10-K for the fiscal year endedDecember 31, 2017) .
2.5§†
Purchase and Sale Agreement, dated December 1, 2017, by and among Daseke, Inc., Daseke Companies, Inc.,Daseke TSH LLC, Sidney T. Stanley 2007 Family Irrevocable Gift Trust, Sidney Stanley, Craig Stanley, GreggStanley, Sara Beth Sheehan, the Craig T. Stanley 2012 GST-Exempt Family Trust, Gregg F. Stanley 2012 GST-Exempt Family Trust and Sara Beth Sheehan 2012 GST-Exempt Family Trust (incorporated by reference to Exhibit2.5 to the Annual Report on Form 10-K for the fiscal year ended December 31, 2017) .
2.6
Arrangement Agreement, dated April 13, 2018, by and among the registrant, Daseke Companies, Inc., AvedaTransportation and Energy Services Inc., 1277119 Alberta Ltd., Rodan Transport (U.S.A.) Ltd. and 2111943Alberta Ltd (incorporated by reference to Exhibit 2.1 to the Current Report on Form 8-K filed by the registrant onApril 18, 2018).
3.1
Second Amended and Restated Certificate of Incorporation (incorporated by reference to Exhibit 3.1 to the CurrentReport on Form 8-K filed by the registrant on March 3, 2017).
81
Table of Contents
Exhibit No. Exhibit3.2
By-Laws of Daseke, Inc., as last amended and effective May 22, 2018 (incorporated by reference to Exhibit 3.1 tothe Current Report on Form 8-K filed by the registrant on May 25, 2018).
3.3
Certificate of Designations, Preferences, Rights and Limitations of 7.625% Series A Convertible CumulativePreferred Stock (incorporated by reference to Exhibit 3.2 to the registrant’s Current Report on Form 8-K filed bythe registrant on March 3, 2017).
4.1
Specimen stock certificate for the registrant’s common stock (incorporated by reference to Exhibit 4.1 to theregistrant’s Current Report on Form 8-K filed by the registrant on March 3, 2017).
4.2
Specimen stock certificate for the registrant’s 7.625% Series A Convertible Preferred Stock (incorporated byreference to Exhibit 4.2 to the registrant’s Current Report on Form 8-K filed by the registrant on March 3, 2017).
4.3
Specimen warrant certificate (incorporated by reference to Exhibit 4.3 to the registrant’s Current Report on Form 8-K filed by the registrant on March 3, 2017).
4.4
Warrant Agreement, dated July 22, 2015, between Continental Stock Transfer & Trust Company and the registrant(incorporated by reference to Exhibit 4.1 to the registrant’s Current Report on Form 8-K filed by the registrant onJuly 28, 2015).
4.5
Sponsor Warrants Purchase Agreement, dated May 11, 2015, among the registrant and Hennessy Capital Partners IILLC (incorporated by reference to Exhibit 10.6 to the Registration Statement on Form S-1 (No. 333-205152) filedby the registrant on June 22, 2015).
4.6
Form of Backstop and Subscription Agreement by and among the registrant, Hennessy Capital Partners II LLC andthe investor(s) party thereto (incorporated by reference to Exhibit 10.1 to the Current Report on Form 8-K filed bythe registrant on December 29, 2016).
4.7
Amended and Restated Registration Rights Agreement, dated as of February 27, 2017, by and among the registrant,Daseke Companies, Inc. (f/k/a Daseke, Inc.), Hennessy Capital Partners II LLC, and certain security holders of theregistrant party thereto (incorporated by reference to Exhibit 4.1 of the registrant’s Current Report on Form 8-Kfiled by the registrant on March 3, 2017).
4.8
Form of Lock-Up Agreement (incorporated by reference to Exhibit 10.7 to the registrant’s Current Report on Form8-K filed by the registrant on December 29, 2016).
4.9
Form of Subscription Agreement for 7.625% Series A Convertible Cumulative Preferred Stock by and among theregistrant and the investor(s) party thereto (incorporated by reference to Exhibit 10.2 to the Current Report on Form8-K filed by the registrant on December 29, 2016).
4.10
Securities Subscription Agreement by and among the registrant and the Hennessy Capital Partners II LLC(incorporated by reference to Exhibit 10.5 to the Registration Statement on Form S-1 filed by the registrant on June22, 2015).
4.11
Sponsor Share Forfeiture Agreement, dated December 22, 2016, by and among the registrant, HCAC Merger Sub,Inc., Daseke, Inc., and Don R. Daseke, solely in his capacity as the Stockholder Representative (incorporated byreference to Exhibit 10.5 to the Current Report on Form 8-K filed by the registrant on December 29, 2016).
82

Table of Contents
Exhibit No. Exhibit 10.1
Term Loan Agreement, dated as of February 27, 2017, among the registrant, HCAC Merger Sub, Inc. (whichmerged with and into Daseke, Inc., which changed its name to Daseke Companies, Inc.), as borrower, certainfinancial institutions from time to time party thereto, as lenders, Credit Suisse AG, Cayman Islands Branch, asadministrative agent, and Credit Suisse Securities (USA) LLC, UBS Securities LLC, and PNC Capital MarketsLLC, as joint lead arrangers and joint bookrunners (incorporated by reference to Exhibit 10.1 to the Current Reporton Form 8-K filed by the registrant on March 3, 2017).
10.2
Amendment No. 1 to Term Loan Agreement, dated as of August 16, 2017, among Daseke Companies, Inc., Daseke,Inc., Credit Suisse AG, Cayman Islands Branch, as administrative agent and collateral agent, and the lenders partythereto (incorporated by reference to Exhibit 10.1 to the Current Report filed by the registrant on Form 8-K onAugust 22, 2017).
10.3
Incremental and Refinancing Amendment (Amendment No. 2 to the Term Loan Agreement), dated as of November28, 2017, among the registrant, Daseke Companies, Inc. and certain of its subsidiaries, Credit Suisse AG, CaymanIslands Branch, as administrative agent and collateral agent, and the lenders party thereto (incorporated by referenceto Exhibit 10.3 to the registrant’s Annual Report on Form 10-K for the fiscal year ended December 31, 2017) .
10.4
Fifth Amended and Restated Revolving Credit and Security Agreement, dated February 27, 2017, among theregistrant, HCAC Merger Sub, Inc. (which merged with and into Daseke, Inc., which changed its name to DasekeCompanies, Inc.) and certain of its subsidiaries party thereto, PNC Bank, National Association, as lender and agent,and certain financial institutions, as lenders, from time to time party thereto (incorporated by reference to Exhibit10.2 to the registrant’s Current Report on Form 8-K filed on March 3, 2017).
10.5
First Amendment to Fifth Amended and Restated Revolving Credit and Security Agreement, dated August 31,2017, by and among the registrant, Daseke Companies, Inc., and certain of its subsidiaries party thereto and PNCBank, National Association, as agent, and the lenders party thereto (incorporated by reference to Exhibit 10.2 to theregistrant’s Quarterly Report on Form 10-Q filed on November 9, 2017).
10.6
Second Amendment to Fifth Amended and Restated Revolving Credit and Security Agreement, dated November28, 2017, by and among the registrant, Daseke Companies, Inc. and certain of its subsidiaries party thereto, PNCBank, National Association, as agent, and the lenders party thereto (incorporated by reference to Exhibit 10.6 to theAnnual Report on Form 10-K for the fiscal year ended December 31, 2017) .
10.7
Third Amendment to Fifth Amended and Restated Revolving Credit and Security Agreement, dated June 15, 2018,by and among the registrant, Daseke Companies, Inc., each of its subsidiaries party thereto as borrowers, PNC BankNational Association, as agent, and the lenders party thereto (incorporated by reference to Exhibit 10.1 to theregistrant’s Quarterly Report on Form 10-Q filed on August 9, 2018).
10.8+
Employment Agreement, dated February 27, 2017, by and between the registrant and Don R. Daseke (incorporatedby reference to Exhibit 10.3 to the Current Report on Form 8-K filed by the registrant on March 3, 2017).
10.9+
Amendment to the Employment Agreement, dated August 30, 2018, by and between the registrant and Don R.Daseke (incorporated by reference to Exhibit 10.1 to the Current Report on Form 8-K filed by the registrant onAugust 30, 2018).
83

Table of Contents
Exhibit No. Exhibit10.10+
Employment Agreement, dated February 27, 2017, by and between the registrant and R. Scott Wheeler(incorporated by reference to Exhibit 10.4 to the Current Report on Form 8-K filed by the registrant on March 3,2017).
10.11+
Amendment to the Employment Agreement, dated August 30, 2018, by and between the registrant and R. ScottWheeler (incorporated by reference to Exhibit 10.2 to the Current Report on Form 8-K filed by the registrant onAugust 30, 2018).
10.12*+
S econd a mendment to the Employment Agreement, dated August 30, 2018, by and between the registrant and R.Scott Wheeler.
10.13+
Employment Agreement, dated February 27, 2017, by and between the registrant and Angie J. Moss (incorporatedby reference to Exhibit 10.5 to the Current Report on Form 8-K filed by the registrant on March 3, 2017).
10.14+
Employment Agreement, effective September 6, 2018, by and between the registrant and Bharat Mahajan(incorporated by reference to Exhibit 10.2 to the Quarterly Report on Form 10-Q filed by the registrant on August 9,2018).
10.15*+ Employment Agreement, effective Ja nuary 16, 2019, by and between the registrant and Christopher R. Easter. 10.16+
Form of Indemnification Agreement between the registrant and each of its directors and executive officers(incorporated by reference to Exhibit 10.6 to the Current Report on Form 8-K filed by the registrant on March 3,2017).
10.17+
Daseke, Inc. 2017 Omnibus Incentive Plan (incorporated by reference to Exhibit 10.13 to the Current Report onForm 8-K filed by the registrant on March 3, 2017).
10.18+
Daseke, Inc. 2017 Omnibus Incentive Plan, as amended and restated on May 26, 2017, effective as of February 27,2017 (incorporated by reference to Exhibit 4.3 to the registrant’s Registration Statement on Form S-8 filed on May31, 2017 (File No. 333-218386)).
10.19+
Daseke, Inc. 2017 Management Stock Ownership Program (incorporated by reference to Exhibit 10.10 to theCurrent Report on Form 8-K filed by the registrant on March 3, 2017).
10.20+
Daseke, Inc. 2017 Management Stock Ownership Program for Selected Management (incorporated by reference toExhibit 4.5 to the registrant’s Registration Statement on Form S-8 filed on May 31, 2017 (File No. 333-218386).
10.21+
Daseke, Inc. 2017 Stock Ownership Program for Employees (incorporated by reference to Exhibit 4.4 to theregistrant’s Registration Statement on Form S-8 filed on May 31, 2017 (File No. 333-218386)).
10.22+
Daseke, Inc. 2017 Stock Ownership Program for Truck Driver Employees (incorporated by reference to Exhibit 4.6to the registrant’s Registration Statement on Form S-8 filed on May 31, 2017 (File No. 333-218386)).
84

Table of Contents
Exhibit No. Exhibit10.23+
Daseke, Inc. Form of Restricted Stock Unit Award Agreement (Canadian Employee) (incorporated by reference toExhibit 4.10 to the registrant’s Registration Statement on Form S-8 filed on May 31, 2017 (File No. 333-218386)).
10.24+
Daseke, Inc. Form of Non-Qualified Stock Option Award Agreement (Canadian Employee) (incorporated byreference to Exhibit 4.11 to the registrant’s Registration Statement on Form S-8 filed on May 31, 2017 (File No.333-218386)).
10.25+
Form of Restricted Stock Unit Award Agreement of the registrant (incorporated by reference to Exhibit 10.7 to theregistrant’s Current Report on Form 8-K filed on March 3, 2017).
10.26+
Form of Non-Qualified Stock Option Award Agreement of the registrant (incorporated by reference to Exhibit 10.8to the registrant’s Current Report on Form 8-K filed on March 3, 2017).
10.27+
Form of Non-Qualified Stock Option Award Agreement for Non-Employee Directors of the registrant (incorporatedby reference to Exhibit 10.9 to the registrant’s Current Report on Form 8-K filed on March 3, 2017).
10.28
Voting and Support Agreement, dated as of December 22, 2016, by and among Daseke, Inc., Hennessy CapitalPartners II LLC and the other initial stockholders of Hennessy Capital Acquisition Corp. II set forth therein(incorporated by reference to Exhibit 10.3 to the Current Report on Form 8-K filed by the registrant on December29, 2016).
10.29
Letter Agreement, dated as of December 22, 2016, by and among Hennessy Capital Acquisition Corp. II, Daseke,Inc., The Walden Group, Inc. Prudential Capital Partners IV, L.P., Prudential Capital Partners Management FundIV, L.P., Prudential Capital Partners (Parallel Fund) IV, L.P., Main Street Capital Corporation, Main Street CapitalII, LP and Main Street Mezzanine Fund, LP (incorporated by reference to Exhibit 10.4 to the Current Report onForm 8-K filed by the registrant on December 29, 2016).
10.30
Commitment Letter, dated as of December 22, 2016 by and among Hennessy Capital Acquisition Corp. II andCredit Suisse Securities (USA) LLC, Credit Suisse AG, Cayman Islands Branch, UBS AG, Stamford Branch andUBS Securities LLC (incorporated by reference to Exhibit 10.8 to the Current Report on Form 8-K filed by theregistrant on December 29, 2016).
21.1* List of subsidiaries. 23.1* Consent of Independent Registered Public Accounting Firm 31.1* Chief Executive Officer certification under Section 302 of Sarbanes-Oxley Act of 2002. 31.2* Chief Financial Officer certification under Section 302 of Sarbanes-Oxley Act of 2002. 32.1** Chief Executive Officer certification under Section 906 of Sarbanes-Oxley Act of 2002. 32.2** Chief Financial Officer certification under Section 906 of Sarbanes-Oxley Act of 2002. 101.INS* XBRL Instance Document. 101.SCH* XBRL Taxonomy Extension Schema Document.
85

Table of Contents
Exhibit No. Exhibit 101.CAL* XBRL Taxonomy Extension Calculation Linkbase Document. 101.DEF* XBRL Taxonomy Extension Definition Linkbase Document. 101.LAB* XBRL Taxonomy Extension Label Linkbase Document. 101.PRE* XBRL Taxonomy Extension Presentation Linkbase Document. *
Filed herewith.
** Furnished herewith.+ Management contract or compensatory plan or arrangement.§ Schedules and similar attachments have been omitted pursuant to Item 601(b)(2) of Regulation S-K. Daseke, Inc. hereby
undertakes to furnish supplementally copies of any of the omitted schedules and attachments upon request by the UnitedStates Securities and Exchange Commission (the SEC); provided, however, that Daseke, Inc. may request confidentialtreatment pursuant to Rule 24b-2 (Rule 24b-2) of the Securities Exchange Act of 1934, as amended, for any schedules andattachments so furnished.
† Confidential information has been omitted from this Exhibit and has been filed separately with the SEC pursuant to aconfidential treatment request under Rule 24b-2.
Item 16. Form 10-K Summary None.
86

Table of Contents
SIGNATURES Pursuant to the requirements of Section 13 or 15(d) of the Securities Exchange Act of 1934, the registrant has duly caused this reportto be signed on its behalf by the undersigned, thereunto duly authorized.
DASEKE, INC.(Registrant)
Date: March 8, 2019 By: / S / Bharat MahajanBharat MahajanChief Financial Officer(Principal Financial Officer)
Pursuant to the requirements of the Securities Exchange Act of 1934, this report has been signed below by the following persons onMarch 8, 2019, behalf of the registrant and in the capacities indicated.
/s/ Don R. Daseke Chairman of the Board of Directors and ChiefExecutive Officer(Principal Executive Officer)Don R. Daseke
/s/ R. Scott Wheeler President and Director R. Scott Wheeler
/s/ Bharat Mahajan Chief Financial Officer(Principal Financial Officer)Bharat Mahajan
/s/ Angie J. Moss Senior Vice President and Chief Accounting Officer(Principal Accounting Officer)
Angie J. Moss
/s/ Daniel J. Hennessy Director
Daniel J. Hennessy
/s/ Brian Bonner Director
Brian Bonner
/s/ Kevin M. Charlton Director
Kevin M. Charlton
/s/ Ron Gafford Director
Ron Gafford
/s/ Mark Sinclair Director
Mark Sinclair
/s/ Jonathan Shepko Director
Jonathan Shepko
87

Table of Contents
REPORT OF INDEPENDENT REGISTERED PUBLIC ACCOUNTING FIRM
Board of Directors and StockholdersDaseke, Inc. Opinion on the financial statementsWe have audited the accompanying consolidated balance sheets of Daseke, Inc. (a Delaware corporation) and subsidiaries (the“Company”) as of December 31, 2018 and 2017, the related consolidated statements of operations and comprehensive income (loss),changes in stockholders’ equity, and cash flows for each of the three years in the period ended December 31, 2018, and the relatednotes (collectively referred to as the “financial statements”). In our opinion, the financial statements present fairly, in all materialrespects, the financial position of the Company as of December 31, 2018 and 2017, and the results of its operations and its cash flowsfor each of the three years in the period ended December 31, 2018, in conformity with accounting principles generally accepted in theUnited States of America. We also have audited, in accordance with the standards of the Public Company Accounting Oversight Board (United States)(“PCAOB”), the Company’s internal control over financial reporting as of December 31, 2018, based on criteria established in the2013 Internal Control—Integrated Framework issued by the Committee of Sponsoring Organizations of the Treadway Commission(“COSO”), and our report dated March 8, 2019 expressed an adverse opinion. Change in accounting principleAs discussed in Note 2 to the consolidated financial statements, the Company has changed its method of accounting for revenue fromcontracts with customers due to the adoption of the new revenue standard. The Company adopted the new revenue standard using themodified retrospective method. Basis for opinionThese financial statements are the responsibility of the Company’s management. Our responsibility is to express an opinion on theCompany’s financial statements based on our audits. We are a public accounting firm registered with the PCAOB and are required tobe independent with respect to the Company in accordance with the U.S. federal securities laws and the applicable rules andregulations of the Securities and Exchange Commission and the PCAOB. We conducted our audits in accordance with the standards of the PCAOB. Those standards require that we plan and perform the auditto obtain reasonable assurance about whether the financial statements are free of material misstatement, whether due to error orfraud. Our audits included performing procedures to assess the risks of material misstatement of the financial statements, whether dueto error or fraud, and performing procedures that respond to those risks. Such procedures included examining, on a test basis,evidence supporting the amounts and disclosures in the financial statements. Our audits also included evaluating the accountingprinciples used and significant estimates made by management, as well as evaluating the overall presentation of the financialstatements. We believe that our audits provide a reasonable basis for our opinion. /s/ GRANT THORNTON LLP We have served as the Company’s auditor since 2013. Dallas, TexasMarch 8, 2019
F-1

Table of Contents
DASEKE, INC. AND SUBSIDIARIESCONSOLIDATED BALANCE SHEETS
(In thousands, except share and per share data)
December 31, 2018 2017
ASSETS Current assets: Cash and cash equivalents $ 45,974 $ 90,679Accounts receivable, net 209,206 127,368Drivers’ advances and other receivables 5,461 4,792Current portion of net investment in sales-type leases 16,213 10,979Parts supplies 4,914 4,653Prepaid and other current assets 26,282 28,240Total current assets 308,050 266,711
Property and equipment, net 572,719 429,639Intangible assets, net 208,791 93,120Goodwill 258,365 302,702Other long-term assets 42,943 33,496
Total assets $ 1,390,868 $ 1,125,668
LIABILITIES AND STOCKHOLDERS’ EQUITY Current liabilities: Accounts payable $ 22,160 $ 12,488Accrued expenses and other liabilities 46,542 25,876Accrued payroll, benefits and related taxes 21,698 14,004Accrued insurance and claims 18,059 12,644Current portion of long-term debt 63,535 43,056Other current liabilities 21,865 —Total current liabilities 193,859 108,068
Line of credit — 4,561Long-term debt, net of current portion 622,650 569,740Deferred tax liabilities 126,830 90,434Other long-term liabilities 531 1,632
Total liabilities 943,870 774,435
Commitments and contingencies (Note 16) Stockholders’ equity: Series A convertible preferred stock, $0.0001 par value; 10,000,000 shares authorized; 650,000 shares issued withliquidation preference of $65,000 at December 31, 2018 and 2017, respectively 65,000 65,000Common stock (par value $0.0001 per share); 250,000,000 shares authorized, 64,455,174 and 48,712,288 sharesissued and outstanding at December 31, 2018 and 2017, respectively 6 5
Additional paid-in-capital 433,867 277,931Retained earnings (accumulated deficit) (51,005) 7,338Accumulated other comprehensive income (loss) (870) 959
Total stockholders’ equity 446,998 351,233Total liabilities and stockholders’ equity $ 1,390,868 $ 1,125,668
The accompanying notes are an integral part of the consolidated financial statements.
F-2

Table of Contents
DASEKE, INC. AND SUBSIDIARIESCONSOLIDATED STATEMENTS OF OPERATIONS AND COMPREHENSIVE INCOME (LOSS)
(In thousands, except share and per share data)
Years Ended December 31, 2018 2017 2016Revenues:
Freight $ 1,162,193 $ 632,764 $ 517,861Brokerage 266,437 120,943 87,410Logistics 42,764 22,074 —Fuel surcharge 141,688 70,523 46,531
Total revenue 1,613,082 846,304 651,802
Operating expenses: Salaries, wages and employee benefits 407,429 249,996 197,789Fuel 141,097 93,749 66,865Operations and maintenance 181,534 118,390 96,100Communications 3,334 2,145 1,618Purchased freight 588,603 225,254 154,054Administrative expenses 58,385 33,233 25,250Sales and marketing 3,369 1,965 1,743Taxes and licenses 17,174 11,055 9,222Insurance and claims 45,826 23,962 19,114Acquisition-related transaction expenses 2,684 3,377 25Depreciation and amortization 131,082 76,863 67,500Gain on disposition of revenue property and equipment (3,236) (700) (116)Impairment 13,890 — 2,005
Total operating expenses 1,591,171 839,289 641,169Income from operations 21,911 7,015 10,633
Other expense (income): Interest income (1,323) (398) (44)Interest expense 45,505 29,556 23,124Write-off of unamortized deferred financing fees — 3,883 —Other (1,162) (740) (331)
Total other expense 43,020 32,301 22,749
Income (loss) before provision (benefit) for income taxes (21,109) (25,286) (12,116)Provision (benefit) for income taxes (15,922) (52,282) 163
Net income (loss) (5,187) 26,996 (12,279)
Other comprehensive income: Unrealized income on interest rate swaps — 52 62Foreign currency translation adjustments, net of tax expense (benefit) of $(487) and $517,respectively (1,829) 959 —
Comprehensive income (loss) (7,016) 28,007 (12,217)
Net income (loss) (5,187) 26,996 (12,279)Less dividends to Series A convertible preferred stockholders (4,956) (4,158) —Less dividends to Series B convertible preferred stockholders — (806) (4,770)
Net income (loss) attributable to common stockholders $ (10,143) $ 22,032 $ (17,049)
Net income (loss) per common share: Basic $ (0.16) $ 0.59 $ (0.81)Diluted $ (0.16) $ 0.56 $ (0.81)
Weighted-average common shares outstanding: Basic 61,654,820 37,592,549 20,980,961Diluted 61,654,820 39,593,701 20,980,961
Dividends declared per Series A convertible preferred share $ 7.63 $ 6.40 $ —Dividends declared per Series B convertible preferred share $ — $ 12.50 $ 18.75
The accompanying notes are an integral part of the consolidated financial statements .
F-3

Table of Contents
DASEKE, INC. AND SUBSIDIARIESCONSOLIDATED STATEMENTS OF CHANGES IN STOCKHOLDERS’ EQUITY
Years Ended December 31, 2018, 2017 and 2016(In thousands, except share data)
Series A Convertible Series B Convertible Retained Accumulated Preferred Stock Preferred Stock Common Stock Earnings Other Par Par Additional (Accumulated Comprehensive Shares Amount Shares Value Shares Value Paid- In Capital Deficit) Income (Loss) TotalBalance at January 1,2016 — $ — 64,500 $ 1 20,980,961 $ 2 $ 117,806 $ 2,355 $ (114) $ 120,050
Unrealized gain oninterest rate swaps — — — — — — — — 62 62Series B convertiblepreferred stockdividend — — — — — — — (4,770) — (4,770)Net loss — — — — — — — (12,279) — (12,279)
Balance atDecember 31, 2016 — — 64,500 1 20,980,961 2 117,806 (14,694) (52) 103,063
Income on interestrate swaps — — — — — — — — 52 52Series B convertiblepreferred stockdividend — — — — — — — (806) — (806)Repurchase ofcommon shares — — — — (3,616,781) (1) (36,167) — — (36,168)Conversion of SeriesB convertiblepreferred stock tocommon shares — — (64,500) (1) 9,301,150 1 — — — —Shares assumed bylegal acquirer — — — — 11,050,630 1 83,639 — — 83,640Settlement of legalacquirer transactioncosts — — — — — — (19,063) — — (19,063)Issuance of Series Aconvertible preferredstock 650,000 65,000 — — — — — — — 65,000Issuance of commonstock — — — — 10,996,328 2 127,301 — — 127,303Effect of reverseacquisition ondeferred taxes — — — — — — 2,540 — — 2,540Series A convertiblepreferred stockdividend — — — — — — — (4,158) — (4,158)Stock-basedcompensationexpense — — — — — — 1,875 — — 1,875Foreign currencytranslationadjustments — — — — — — — — 959 959Net income — — — — — — — 26,996 — 26,996
Balance atDecember 31, 2017 650,000 65,000 — — 48,712,288 5 277,931 7,338 959 351,233
Exercise of stockoptions — — — — 5,000 — 50 — — 50Exercise of warrants — — — — 2 — — — — —Vesting of restrictedstock units — — — — 84,516 — (409) — — (409)Series A convertiblepreferred stockdividend — — — — — — — (4,956) — (4,956)Stock-basedcompensationexpense — — — — — — 3,585 — — 3,585Issuance of commonstock — — — — 10,653,368 1 104,510 — — 104,511Issuance of earnoutshares — — — — 5,000,000 — 48,200 (48,200) — —Foreign currencytranslationadjustments — — — — — — — — (1,829) (1,829)Net loss — — — — — — — (5,187) — (5,187)
Balance atDecember 31, 2018 650,000 $ 65,000 — $ — 64,455,174 $ 6 $ 433,867 $ (51,005) $ (870) $ 446,998
The accompanying notes are an integral part of the consolidated financial statements.
F-4

Table of Contents
DASEKE, INC. AND SUBSIDIARIESCONSOLID ATED STATEMENTS OF CASH FLOWS
(In thousands)
Years Ended December 31, 2018 2017 2016Cash flows from operating activities Net income (loss) $ (5,187) $ 26,996 $ (12,279)Adjustments to reconcile net income (loss) to net cash provided by operating activities Depreciation 114,439 70,168 61,499Amortization of intangible assets 16,643 6,695 6,001Amortization of deferred financing fees 2,951 1,777 1,347Write-off of deferred financing fees — 3,883 —Stock-based compensation expense 3,585 1,875 —Deferred taxes (19,836) (53,394) (349)Bad debt expense 1,097 235 612Non-cash interest expense — 92 1,078Gain on disposition of property and equipment (3,236) (699) (116)Gain on disposition of building (780) — —Deferred gain recognized on sales-type leases (2,403) (1,362) (751)Impairment 13,890 — 2,005
Changes in operating assets and liabilities Accounts receivable (33,176) (15,294) 8,660Drivers’ advances and other receivables 26 519 (405)Payments received on sales-type leases 14,723 5,761 3,653Prepaid and other current assets (4,240) (3,437) 6,352Accounts payable (8,889) 283 (1,034)Accrued expenses and other liabilities 15,656 1,666 (9,858)Net cash provided by operating activities 105,263 45,764 66,415
Cash flows from investing activities Purchase of property and equipment (66,414) (19,792) (4,108)Proceeds from sale of property and equipment 26,359 5,773 5,906Cash paid in acquisitions, net of cash acquired (131,716) (279,834) —Net cash provided by (used in) investing activities (171,771) (293,853) 1,798
Cash flows from financing activities: Advances on line of credit 1,101,197 754,635 702,846Repayments on line of credit (1,105,759) (756,932) (706,724)Principal payments on and payoff of long-term debt (58,593) (239,506) (72,987)Proceeds from Term Loan Facility — 500,000 —Proceeds from long-term debt 6,105 12,301 14,188Deferred financing fees (1,530) (19,193) (1,889)Pay off of subordinated debt — (66,715) —Proceeds from issuance of common stock 84,397 127,893 —Repurchase of common stock — (36,168) —Issuance of Series A convertible preferred stock — 65,000 —Exercise of options 50 — —Series A convertible preferred stock dividends (4,956) (4,158) —Series B convertible preferred stock dividends — (2,016) (4,838)Net cash provided by (used in) financing activities 20,911 335,141 (69,404)
Effect of exchange rates on cash and cash equivalents 892 (68) — Net increase (decrease) in cash and cash equivalents (44,705) 86,984 (1,191)Cash and cash equivalents – beginning of year 90,679 3,695 4,886Cash and cash equivalents – end of year $ 45,974 $ 90,679 $ 3,695
The accompanying notes are an integral part of the consolidated financial statements.
F-5

Table of Contents
DASEKE, INC. AND SUBSIDIARIESCONSOLIDATED STATEMENTS OF CASH FLOWS – (Continued)
(In thousands)
Years Ended December 31, 2018 2017 2016Supplemental disclosure of cash flow information Cash paid for interest $ 42,663 $ 28,676 $ 20,523Cash paid for income taxes 2,357 1,078 1,010
Noncash investing and financing activities Property and equipment acquired with debt or capital lease obligations 89,551 21,897 33,467Accrued capital expenditures 321 — —Property and equipment sold for notes receivable 786 555 452Property and equipment transferred to sales-type lease 9,437 7,053 6,240Assets held for sale returned to property and equipment — — 351Sales-type lease returns to property and equipment 1,322 818 1,830Sales-type lease assets acquired with debt or capital lease obligations 9,873 4 538Sales-type lease assets sold for notes receivable 57,600 28,405 20,934Sales-type lease returns to sales-type lease assets 32,913 19,720 16,784Common stock issued in acquisitions 19,706 63,987 —Issuance of earnout share 48,200 — —Accrued series B convertible preferred dividends — — 1,209BHE Subordinated Notes forgiven to fund pension plan liability $ — $ — $ 1,709
The accompanying notes are an integral part of the consolidated financial statements.
F-6

Table of Contents
DASEKE, INC. AND SUBSIDIARIES
NOTES TO CONSOLIDATED FINANCIAL STATEMENTS
NOTE 1 – NATURE OF OPERATIONS AND SUMMARY OF SIGNIFICANT ACCOUNTING POLICIES Nature of Operations The registrant was originally formed in April 2015 as a special purpose acquisition company (SPAC) under the name HennessyCapital Acquisition Corp. II (Hennessy). As a SPAC, Hennessy had no operations and its purpose was to go public with the intentionof merging with or acquiring an operating company with the proceeds of the SPAC’s initial public offering (the IPO). On February 27, 2017, Hennessy consummated the Business Combination (as defined and described in Note 3) with Daseke, Inc.Upon consummation of the Business Combination, Daseke, Inc. changed its name to Daseke Companies, Inc. and Hennessy changedits name to Daseke, Inc. Daseke, Inc. was formed in December 2008 and began operations on January 1, 2009. Daseke is engaged in full service open-decktrucking that specializes primarily in flatbed truckload and heavy haul transportation of specialized items throughout the UnitedStates, Canada and Mexico. The Company also provides logistical planning and warehousing services to customers. The Company issubject to regulation by the Department of Transportation and various state regulatory authorities, the Department of Defense and theDepartment of Energy in the United States. Additionally, the Company is also subject to regulations by the Ministries ofTransportation and Communications and various provinces regulatory authorities in Canada. Unless expressly stated otherwise, references to the Company or Daseke refers to Daseke, Inc. and its wholly owned subsidiaries,Hennessy refers to the registrant prior to the closing of the Business Combination, and Private Daseke refers to Daseke, Inc. and itssubsidiaries prior to the closing of the Business Combination. Principles of Consolidation The consolidated financial statements include the accounts of Daseke, Inc. and its wholly owned subsidiaries. All significantintercompany balances and transactions have been eliminated in consolidation. Use of Estimates The preparation of the consolidated financial statements in accordance with accounting principles generally accepted in the UnitedStates of America (GAAP) requires management to make estimates and assumptions that affect the reported amounts of assets andliabilities and disclosure of contingent assets and liabilities at the date of the consolidated financial statements and the reportedamounts of revenues and expenses during the reporting period. Actual results could differ from those estimates. Accounts Receivable The Company grants credit to its customers for substantially all of its sales. Accounts receivable are carried at original invoiceamount less an estimate for doubtful accounts. The Company establishes an allowance for doubtful accounts based on a periodicreview of its outstanding receivables and consideration of historical experience. Accounts receivable are written off when deemeduncollectible and recoveries of trade accounts receivable previously written off are recorded as income when received. Accountsreceivable are unsecured and the Company does not charge interest on outstanding receivables.
F-7

Table of Contents
DASEKE, INC. AND SUBSIDIARIES
NOTES TO CONSOLIDATED FINANCIAL STATEMENTS
Changes in the allowance for doubtful accounts is as follows (in thousands):
Year Ended December 31, 2018 2017Beginning balance $ 212 $ 321Provision, charged to expense 1,097 235Write-off, less recoveries (154) (344)Ending balance $ 1,155 $ 212
Cash and Cash Equivalents Cash equivalents are defined as short-term investments that have an original maturity of three months or less at the date of purchaseand are readily convertible into cash. The Company maintains cash in several banks and, at times, the balances may exceed federallyinsured limits. The Company does not believe it is exposed to any material credit risk on cash. The Company has a money marketaccount as of December 31, 2018 and 2017. Sales-Type Leases The Company leases revenue equipment to certain of its owner-operators and accounts for these transactions as sales-type leases.These leases have terms of 30 to 72 months and are collateralized by a security interest in the related revenue equipment. A minimumlease receivable is recorded, net of unearned interest income and deferred gain on sale of the equipment. The gain is recognized aspayments are collected, rather than in the period the lease is recorded due to the uncertainty of collection. Parts Supplies Parts supplies consists of parts, replacement tires, and miscellaneous supplies and are valued at the lower of cost or market with costdetermined principally on the first-in, first out method. Tires on new revenue equipment are capitalized as a component of the relatedequipment cost when the tractor or trailer is placed in service. Replacement tires are expensed when placed on the tractor or trailer. Property and Equipment Property and equipment are stated at cost less accumulated depreciation, and are depreciated to estimated salvage value using thestraight-line method over the estimated useful lives of the related assets as follows:
Buildings and building improvements 10 – 40 yearsLeasehold improvements 5 – 20 yearsRevenue equipment – tractors, trailers and accessories 5 – 15 yearsVehicles 5 – 7 yearsFurniture and fixtures 5 – 7 yearsOffice, computer equipment and capitalized software development 3 – 5 years
The Company periodically evaluates the carrying value of long-lived assets for recoverability. The carrying value of a long-livedasset is considered impaired if its future undiscounted cash flows is less than its carrying value. In 2016, the carrying value of assets held for sale, consisting primarily of tractors, was reduced by $1.6 million due to a change in theestimated fair value less costs to sell. This adjustment to fair value is included in impairment on the consolidated statements ofoperations and comprehensive income (loss).
F-8
Table of Contents
DASEKE, INC. AND SUBSIDIARIES
NOTES TO CONSOLIDATED FINANCIAL STATEMENTS
Goodwill and Intangible Assets Goodwill and other intangible assets result from business acquisitions. The Company accounts for business acquisitions by assigningthe purchase price to tangible and intangible assets and liabilities. Assets acquired and liabilities assumed are recorded at their fairvalues and the excess of the purchase price over amounts assigned is recorded as goodwill. Goodwill is tested for impairment at least annually (or more frequently if impairment indicators arise) for each reporting unit byapplying either a qualitative or quantitative analysis in accordance with the authoritative accounting guidance on goodwill. TheCompany first assesses qualitative factors to evaluate whether it is more likely than not that the fair value of a reporting unit is lessthan its carrying amount as the basis for determining whether it is necessary to perform a quantitative goodwill impairment test. TheCompany may bypass the qualitative assessment for any reporting unit in any period and proceed directly with the quantitativeanalysis. The quantitative analysis compares the fair value of the reporting unit with its carrying amount. The Company estimates thefair value of a reporting unit using a combination of discounted expected future cash flows (income approach) and guideline publiccompanies method (market approach). The Company’s annual assessment is conducted as of October 1 of each year. Prior to 2017,the annual assessment was conducted as of November 1, but was changed during 2017 to better align with the Company’s reportingperiods. The change in testing date does not delay, accelerate or avoid an impairment charge. The Company determined that it isimpractical to objectively determine projected cash flows and related valuation estimates that would have been used as of October 1for periods prior to October 1, 2017 without the use of hindsight. As such, the Company prospectively applied the change in theannual goodwill impairment assessment date beginning October 1, 2017. During the preparation of the annual goodwill impairment analysis in the fourth quarter of 2018, the Company identified a triggeringevent caused by the decline of the Company’s stock price from $8.20 per share at October 1, 2018 to $3.68 per share at December 31,2018 . Because of the significant decline in its stock price, the Company updated the annual impairment analysis as of December 31,2018. The result of the goodwill impairment analyses prepared in the fourth quarter was a non-cash, non-tax deductible goodwillimpairment charge of $11.1 million as the carrying value of one of the Company’s reporting units exceeded its estimated fair value.In 2016, the carrying value of one subsidiary exceeded its estimated fair value. Accordingly, a non-cash, non-tax deductible goodwillimpairment charge of $0.4 million was recognized for the year ended December 31, 2016. The impairment charges are included inimpairment on the consolidated statements of operations and comprehensive income (loss). There was no goodwill impairmentidentified for the year ended December 31, 2017. Other intangible assets recorded consist of indefinite lived trade names and definite lived non-competition agreements and customerrelationships. These intangible assets are stated at estimated fair value at the time of acquisition less accumulated amortization.Amortization is recorded using the straight-line method over the following estimated useful lives:
Customer relationships 10 – 15 yearsNon-competition agreements 2 – 5 years
The Company evaluates its definite lived intangible assets for impairment when current facts or circumstances indicate that thecarrying value of the assets to be held and used may not be recoverable. Indefinite-lived intangible assets are tested for impairmentannually applying a fair value based analysis in accordance with the authoritative accounting guidance for such assets. In June 2018,the Company recorded an impairment charge of $2.8 million related to the trade names category of intangible assets. The trade namewas impaired as a result of the reorganization and merger of two of the Company’s operating companies. No indicators ofimpairment for indefinite-lived intangible assets were identified for the years ended December 31, 2017 and 2016.
F-9

Table of Contents
DASEKE, INC. AND SUBSIDIARIES
NOTES TO CONSOLIDATED FINANCIAL STATEMENTS
Revenue and Expense Recognition The Company’s revenue and related costs are recognized when the Company satisfies its performance obligation(s) transferringgoods or services to the customer and the customer obtains control . With respect to freight, brokerage, logistics and fuel surchargerevenue, these conditions are met, and the Company recognizes freight, brokerage and fuel surcharge revenue, over time, andlogistics revenue, as the services are provided. While there may be master service agreements with Company customers, a contract isnot established until the customer specifically requests the Company’s services and the Company accepts. The Company evaluates each contract for distinct performance obligations. In the Company’s business, a typical performanceobligation is the transportation of a load including any highly interrelated ancillary services. The Company predominantly estimates the standalone selling price of its services based upon observable evidence, market conditionsand other relevant inputs. The Company allocates the total transaction price to each distinct performance obligation based upon therelative standalone selling prices. The Company’s customers simultaneously receive and consume the benefits of the Company’s contracts; therefore revenue isrecognized over time. This is a faithful depiction of the satisfaction of the performance obligation, as the customer does not need tore-perform the transportation services the Company has provided to date. Generally, the Company’s customers are billed upon delivery of the freight or monthly and remit payment according to the approvedpayment terms. Brokerage Revenue
The Company regularly engages third-party capacity providers to haul loads brokered to them when it needs additional capacity. TheCompany is primarily responsible for fulfilling the promise to provide load transportation services, and has discretion in settingprices, along with the risk to fulfill the contract to the customer. Based upon this evaluation, the Company has determined that it isthe principal and therefore, records gross revenues and expenses for brokerage services. Logistics Revenue In addition to freight revenue, the Company also recognizes logistics revenue as a separate revenue stream. Logistics revenue isgenerated from a range of services, including value-added warehousing, loading and unloading, vehicle maintenance and repair,preparation and packaging, fuel management, and other fleet management solutions. The Company recognizes logistics revenue asservices are completed. Advertising Advertising costs are expensed as incurred and were insignificant for the years ended December 31, 2018, 2017 and 2016. Sales Taxes Taxes collected from customers and remitted to governmental authorities are presented in revenues in the consolidated statements ofoperations and comprehensive income (loss) on a net basis.
F-10

Table of Contents
DASEKE, INC. AND SUBSIDIARIES
NOTES TO CONSOLIDATED FINANCIAL STATEMENTS
Income Taxes Income taxes are accounted for using an asset and liability approach that requires the recognition of deferred tax assets and liabilitiesfor the expected future tax consequences of temporary differences between the consolidated financial statement and tax basis ofassets and liabilities at the applicable enacted tax rates. The Company recognizes the tax benefit from uncertain tax positions only if it is more likely than not that the tax positions will besustained on examination by the tax authorities, based on the technical merits of the position. The tax benefit is measured based onthe largest benefit that has a greater than 50% likelihood of being realized upon ultimate settlement. The Company recognizesinterest and penalties related to income tax matters in income tax expense within the statements of operations and comprehensiveincome (loss). The Company had no uncertain tax positions as of December 31, 2018 and 2017. The Company is no longer subject toUnited States federal income tax examinations by tax authorities for years before 2015. The Company is no longer subject to stateincome tax examinations by tax authorities for years before 2014. Concentrations of Credit Risk Financial instruments that potentially subject the Company to credit risk include accounts receivable. No customer representedgreater than 7% of trade accounts receivable as of December 31, 2018 and 2017. No customer represented 10% or more of totalrevenue for the years ended December 31, 2018, 2017 and 2016. Deferred Financing Fees In conjunction with obtaining long-term debt, the Company incurred financing costs which are being amortized using the straight linemethod, which approximates the effective interest rate method, over the terms of the obligations. As of December 31, 2018 and 2017,the balance of deferred finance charges was $16.2 million and $17.7 million, respectively, which is included as a reduction of long-term debt, net of current portion in the consolidated balance sheets. Amortization expense for the years ended December 31, 2018,2017 and 2016 totaled $3.0 million, $1.8 million and $1.3 million, respectively, which is included in interest expense. In February2017, in conjunction with new term loan financing, as amended, discussed in Note 10, the Company incurred deferred financingcosts of $14.2 million and an additional $4.8 million in November 2017 related to the tack-on loan. Unamortized deferred financingfees totaling $3.9 million were expensed as a result of the new term loan financing. Fair Value Measurements The Company follows the accounting guidance for fair value measurements of financial assets and financial liabilities and for fairvalue measurements of nonfinancial items that are recognized or disclosed at fair value in the financial statements on a recurringbasis. Fair value guidance defines fair value as the price that would be received to sell an asset or paid to transfer a liability in anorderly transaction between market participants at the measurement date. It also establishes a framework for measuring fair value andexpands disclosures about fair value measurements. The three levels of the fair value framework are as follows:
Level 1 – Quoted market prices in active markets for identical assets or liabilities.Level 2 – Observable market-based inputs or unobservable inputs that are corroborated by market data.Level 3 – Unobservable inputs reflecting the reporting entity’s own assumptions or external inputs from inactive markets.
A financial asset or liability’s classification within the framework is determined based on the lowest level of input that is significantto the fair value measurement.
F-11

Table of Contents
DASEKE, INC. AND SUBSIDIARIES
NOTES TO CONSOLIDATED FINANCIAL STATEMENTS
The fair value of the Company’s interest rate swaps is determined using cash flow computer models with unobservable inputs,therefore the liability for interest rate swaps is classified within Level 3 of the fair value framework. In conjunction with the BusinessCombination discussed in Note 3, the Company’s lone interest rate swap was terminated. The table below is a summary of thechanges in the fair value of this liability for the year ended December 31, 2017 (in thousands):
2017Balance, beginning of year $ (52)Change in fair value 52Balance, end of year $ —
The Company may be required, on a non-recurring basis, to adjust the carrying value of the Company’s property and equipment,intangible assets, goodwill and contingent consideration. When necessary, these valuations are determined by the Company usingLevel 3 inputs. These assets are subject to fair value adjustments in certain circumstances, such as when there is evidence thatimpairment may exist. The Company valued contingent consideration for acquisition related earn-outs (see Note 4 for details) using Level 3 inputs. Thetables below are a summary of the changes in the fair value of the earn-out liability for the years ended December 31, 2018 and 2017(in thousands):
2018 2017Balance, beginning of year $ 800 $ 1,140Fair value of earn-out liability for acquisition 21,165 —Change in fair value (100) (340)Balance, end of year $ 21,865 $ 800
Fair Value of Financial Instruments The Company’s financial instruments consist of cash, accounts receivable, accounts payable and accrued expenses, interest rateswaps, the line of credit and long-term debt. The carrying value of these financial instruments approximates fair value based on theliquidity of these financial instruments, their short-term nature or variable interest rates. Stock-Based Compensation Awards of equity instruments issued to employees and directors are accounted for under the fair value method of accounting andrecognized in the consolidated statements of operations and comprehensive income (loss). Compensation cost is measured for allstock-based awards at fair value on the date of grant and recognized using the straight-line method over the service period over whichthe awards are expected to vest. Fair value of all time-vested options as of the date of grant is estimated using the Black-Scholes option valuation model, which wasdeveloped for use in estimating the fair value of traded options that have no vesting restrictions and are fully transferable. Optionvaluation models require the input of highly subjective assumptions, including the expected stock price volatility. Since the Companydoes not have a sufficient history of exercise behavior, expected term is calculated using the assumption that the options will beexercised ratably from the date of vesting to the end of the contractual term for each vesting tranche of awards. The risk-free interestrate is based on the United States Treasury yield curve for the period of the expected term of the stock option. Expected volatility iscalculated using an index of publicly traded peer companies. Fair values of nonvested stock awards (restricted stock units) are equal to the market value of the common stock on the date of theaward with compensation costs amortized over the vesting period of the award.
F-12

Table of Contents
DASEKE, INC. AND SUBSIDIARIES
NOTES TO CONSOLIDATED FINANCIAL STATEMENTS
Accrued Insurance and Claims The Company uses a combination of purchased insurance and self-insurance programs and beginning in December 2017, with theacquisition of the Roadmaster Group (see Note 4), a captive group insurance company. The insurance provides for the cost of vehicleliability, cargo loss, damage, general liability, property, workers’ compensation claims and employee medical benefits. Self-insurance accruals relate primarily to vehicle liability, cargo damage, workers’ compensation and employee medical claims. The measurement and classification of self-insured costs requires the consideration of historical cost experience, demographic andseverity factors, and judgments about the current and expected levels of cost per claim and retention levels. These methods provideestimates of the liability associated with claims incurred as of the balance sheet date, including claims not reported. The Companybelieves these methods are appropriate for measuring these highly judgmental self-insurance accruals. However, the use of anyestimation method is sensitive to the assumptions and factors described above, based on the magnitude of claims and the length oftime from the date the claim is incurred to ultimate settlement. Accordingly, changes in these assumptions and factors can materiallyaffect actual costs paid to settle the claims and those amounts may be different than estimates. Segment Reporting The Company determines its operating segments based on the information utilized by the chief operating decision maker to allocateresources and assess performance. Based on this information, the Company has determined it has 16 operating segments as ofDecember 31, 2018, 15 operating segments as of December 31, 2017 and 8 operating segments as of Deccember 31, 2016 that areaggregated into two reportable segments: Flatbed Solutions segment focuses on delivering transportation and logistics solutions thatprincipally require the use of flatbed and retractable-sided transportation equipment, and Specialized Solutions segment focuses ondelivering transportation and logistics solutions that require the use of specialized trailering transportation equipment. Earnings (Loss) Per Share Basic earnings (loss) per common share is calculated by dividing net income (loss) attributable to common stockholders by theweighted average number of shares of common stock outstanding during the period. Diluted earnings (loss) per share reflect thepotential dilution of earnings per share that could occur if securities or other contracts to issue common stock were exercised orconverted into common stock or resulted in the issuance of common stock that then shared in the Company’s earnings (loss). For the years ended December 31, 2018 and 2017, shares of the Company’s 7.625% Series A Convertible Cumulative PreferredStock (Series A Preferred Stock) and outstanding stock options were not included in the computation of diluted earnings (loss) pershare as their effects were anti-dilutive. Additionally, for the years ended December 31, 2018 and 2017, there was no dilutive effectfrom the Merger Agreement earn-out provision (see Note 3) or the outstanding warrants to purchase shares of the Company’scommon stock (the common stock purchase warrants). For the year ended December 31, 2017, shares of Private Daseke’s Series BConvertible Preferred Stock (Series B Preferred Stock) were not included in the computation of diluted loss per share as their effectswere anti-dilutive. See Note 18 for the effects of non-vested restricted stock units on basic and diluted earnings per share under thetwo-class method. Common Stock Purchase Warrants The Company accounts for the issuance of common stock purchase warrants in connection with equity offerings in accordance withthe provisions of the Accounting Standards Codification (ASC) 815, Derivatives and Hedging (ASC 815). The Company classifies asequity any contracts that (i) require physical settlement or net-share settlement or (ii) gives the
F-13

Table of Contents
DASEKE, INC. AND SUBSIDIARIES
NOTES TO CONSOLIDATED FINANCIAL STATEMENTS
Company a choice of net-cash settlement or settlement in its own shares (physical settlement or net-share settlement). The Companyclassifies as assets or liabilities any contracts that (i) require net-cash settlement (including a requirement to net-cash settle thecontract if an event occurs and if that event is outside the control of the Company) or (ii) gives the counterparty a choice of net-cashsettlement or settlement in shares (physical settlement or net-share settlement). See Note 13 for additional details on the commonstock purchase warrants. The Company assessed the classification of its common stock purchase warrants and determined that such instruments meet thecriteria for equity classification at the time of issuance. Foreign Currency Gains and Losses The local currency is the functional currency for the Company’s operations in Canada. For these operations, assets and liabilities aretranslated at the rates of exchange on the consolidated balance sheet date, while income and expense items are translated at averagerates of exchange during the period. The resulting gains or losses arising from the translation of accounts from the functionalcurrency into U.S. dollars are included as a separate component of stockholders’ equity in accumulated other comprehensive income(loss) until a partial or complete liquidation of the Company’s net investment in the foreign operation. From time to time, the Company’s foreign operations may enter into transactions that are denominated in a currency other than theirfunctional currency. These transactions are initially recorded in the functional currency of the operating company based on theapplicable exchange rate in effect on the date of the transaction. Monthly, these transactions are remeasured to an equivalent amountof the functional currency based on the applicable exchange rate in effect on the remeasurement date. Any adjustment required toremeasure a transaction to the equivalent amount of functional currency is recorded in the consolidated statements of operations ofthe foreign operating company as a component of foreign exchange gain or loss. Assets Held for Sale Assets held for sale is comprised of revenue equipment in the Company’s lease purchase program and is recorded as a component ofprepaid and other current assets on the consolidated balance sheets. Assets held for sale at December 31, 2018 and 2017, totaled $3.6million and $9.9 million, respectively. Assets held for sale totaled $2.7 million and $7.0 million for the Flatbed Solutions segment asof December 31, 2018 and 2017, respectively. Assets held for sale totaled $0.9 and $2.9 million for the Specialized Solutionssegment as of December 31, 2018 and 2017, respectively. Assets held for sale are not subject to depreciation, and are recorded at the lower of depreciated carrying value or fair market valueless selling costs. The Company expects to sell these assets in its lease purchase program within twelve months of being classified asassets held for sale. Any gains (losses) from the sale of these assets is recognized as a deferred gain in the consolidated balance sheetsin current portion of net investment in sales-type leases and other long-term assets. New Accounting Pronouncements In August 2018, the Financial Accounting Standards Board (FASB) issued Accounting Standards Updated (ASU) 2018-15,Intangibles – Goodwill and Other – Internal-Use Software (Subtopic 350-40). ASU 2018-15 aligns the requirements for capitalizingimplementation costs incurred in a hosting arrangement (Cloud-based) that is a service contract with the requirements for capitalizingimplementation costs incurred to develop or obtain internal-use software. ASU 2018-15 will become effective for annual periodsbeginning after December 15, 2019 and interim periods within those periods, with early adoption permitted. ASU 2018-15 can beapplied either retrospectively or prospectively to all implementation costs incurred after the date of adoption. The Company haselected to early adopt ASU 2018-15 on a prospective basis and has capitalized relevant software implementation costs ofapproximately $2.0 million as of December 31, 2018.
F-14
Table of Contents
DASEKE, INC. AND SUBSIDIARIES
NOTES TO CONSOLIDATED FINANCIAL STATEMENTS
In March 2018, the FASB issued ASU 2018-05, Income Taxes (Topic 740). ASU 2018-05 provides amendments to SEC paragraphspursuant to SEC Staff Accounting Bulletin (SAB) No. 118 related to the Tax Cuts and Jobs Act (TCJA) that became effectiveJanuary 2018. The Company adopted the disclosure requirements of SAB 118 as of December 31, 2017, which were included in theCompany’s Annual Report on Form 10-K filed March 16, 2018 and as described in SAB 118 carried forward through December 31,2018. In July 2017, the FASB issued ASU 2017-11, Earnings per Share (Topic 260), Distinguishing Liabilities from Equity (Topic 480)and Topic 815. ASU 2017-11 provides guidance on accounting for financial instruments with down round features and clarifies thedeferral of certain provisions in Topic 480. ASU 2017-11 will become effective for annual periods beginning after December 15,2018 and interim periods within those periods. The Company does not expect the adoption to have a material impact on theconsolidated financial statements. In May 2017, the FASB issued ASU 2017-09, Compensation – Stock Compensation (Topic 718). ASU 2017-09 provides guidanceabout which changes to the terms or conditions of a share-based payment award requires the application of modification accounting.Modification accounting will apply unless the fair value of the modified award is the same as the original award, the vestingconditions of the modified award are the same as the original award and the classification of the modified award as an equityinstrument or liability instrument is the same as the original award. ASU 2017-09 became effective for annual periods beginning afterDecember 15, 2017 and interim periods within those periods. The Company adopted this pronouncement on January 1, 2018 whichdid not have a material impact on its consolidated results of operations, financial condition, cash flows, or financial statementdisclosures as there were no changes to the terms or conditions of the Company’s share-based payment awards during year endedDecember 31, 2018. In August 2016, the FASB issued ASU 2016-15, Statement of Cash Flows (Topic 230). ASU 2016-15 provides new guidanceintended to reduce diversity in practice in how certain cash receipts and payments are classified in the statement of cash flows,including debt prepayment or extinguishment costs, the settlement of contingent liabilities arising from a business combination,proceeds from insurance settlements, and distributions from certain equity method investees. ASU 2016-15 became effective forfiscal years beginning after December 15, 2017 and interim periods within fiscal years. The Company adopted this pronouncementon January 1, 2018 which did not impact its consolidated statement of cash flows. In June 2016, the FASB issued ASU No. 2016-13, Accounting for Credit Losses (Topic 326). ASU 2016-13 requires the use of an“expected loss” model on certain types of financial instruments. ASU 2016-13 is effective for fiscal years, and interim periods withinthose years, beginning after December 15, 2019, with early adoption permitted. The Company is currently evaluating the impact ofadopting this guidance. In February 2016, the FASB issued ASU 2016-02, Leases, followed by additional accounting standards updates that providedadditional practical expedients and policy elections options (collectively, Accounting Standards Codification Topic 842, (ASC 842)).ASC 842 amends various aspects of existing guidance for leases and requires the recognition of assets and liabilities arising from alease for both financing and operating leases, along with additional qualitative and quantitative disclosures. The main differencebetween previous GAAP and the amended standard is the recognition of lease assets and lease liabilities of lessees on the balancesheet for those leases classified as operating leases under previous GAAP. ASC 842 is effective for annual periods beginning afterDecember 15, 2018, and interim periods within those annual periods. The Company will adopt ASC 842 using the modifiedretrospective method and elect the option to not apply ASC 842 to comparative periods. The Company also elected the followingpractical expedients:
· not to apply the recognition requirements to leases with terms of twelve months or less,
· carryforward previous conclusions related to current lease classification under the current lease accounting standard to leaseclassification for these existing leases under ASC 842,
· to combine lease and non-lease components for certain asset classes, and
· to apply the portfolio approach in determination of the incremental borrowing rate.
F-15

Table of Contents
DASEKE, INC. AND SUBSIDIARIES
NOTES TO CONSOLIDATED FINANCIAL STATEMENTS
The adoption of ASC 842 will result in increasing assets and liabilities with right-of-use assets and related liabilities on theCompany’s consolidated balance sheets. Right-of-use assets the Company expects to record on the balance sheet include primarilytrucking facilities and terminals and revenue equipment leases, all classified as operating leases. The impact to the Company’sconsolidated statements of operations and cash flows are not expected to be material. The Company has compiled and analyzed itscontracts and identified its full lease population and is still in the process of populating its leasing software and implementing newcontrols associated with the standard. NOTE 2 – REVENUE RECOGNITION Adoption of New Accounting Standard The Company has evaluated its current accounting practices to the requirements of ASU No. 2014-09, Revenue from Contracts withCustomers (Topic 606) and related amendments. This evaluation included an assessment of representative contracts from each of theCompany’s revenue streams. The Company was recognizing revenue upon completion of transportation or other services. By nature,the Company’s services are short in duration, typically representing less than one week to completion, therefore the Company hasdetermined that the difference between recognizing revenue upon completion and over time is minimal to its business. The adoption of this standard did not have a material impact on the Company’s financial position, results of operations or cash flows;however, there have been additions and modifications to its existing financial disclosures. While the overall revenue, systems andcontrols were minimally impacted by the new standard, the underlying recognition methodology has changed. Under the newstandard, the Company now recognizes revenue over time as its customers are simultaneously receiving and consuming the benefitsof its services, primarily based upon the output method of miles driven. The primary difference for the Company’s business, althoughcurrently immaterial, is the recognition of revenue for in-transit services at the end of each reporting period. The Company adopted this guidance as of January 1, 2018, utilizing the modified retrospective method and the practical expedientthat applies to all contracts that were not completed at the date of adoption. The Company determined the differences betweenrecognition methods was minimal; thus no opening adjustment was deemed necessary to retained earnings. The comparativeinformation was not restated and continues to be presented under the accounting standards in effect for those periods. The Companydoes not anticipate any material changes to the costs of obtaining or fulfilling a contract, or corporate taxes. Disclosure Designations The Company has designated the following preference and practical expedients:
· Not disclose remaining performance obligations when the expected performance obligation duration is one year or less. Thevast majority of the Company’s services transfer control within a month of the inception of the contract with selectspecialized loads taking several months to allow for increased planning and permitting.
· Recognize the incremental costs of obtaining or fulfilling a contract as an expense when incurred, as the amortization period
of a potential asset would be recognized in one year or less.
· Exclude taxes collected on behalf of government authorities from the Company’s measurement of transaction prices. Taxamounts are not included within net income or cost of sales.
Disaggregation of Revenue The Company’s income and segment disclosures have been reviewed to ensure revenues are properly disaggregated in accordancewith the new guidance as displayed in the table below:
F-16

Table of Contents
DASEKE, INC. AND SUBSIDIARIES
NOTES TO CONSOLIDATED FINANCIAL STATEMENTS
Flatbed Specialized Solutions Solutions Corporate/ Consolidated Segment Segment Eliminations TotalYear Ended December 31, 2018
Freight $ 477,722 $ 696,045 $ (11,574) $ 1,162,193Brokerage 104,184 163,092 (839) 266,437Logistics 2,987 39,927 (150) 42,764Fuel surcharge 77,110 66,000 (1,422) 141,688
Total revenue $ 662,003 $ 965,064 $ (13,985) $ 1,613,082 Year Ended December 31, 2017
Freight $ 276,592 $ 362,276 $ (6,104) $ 632,764Brokerage 40,882 80,225 (164) 120,943Logistics 192 21,940 (58) 22,074Fuel surcharge 36,440 34,691 (608) 70,523
Total revenue $ 354,106 $ 499,132 $ (6,934) $ 846,304 Significant Judgments Under ASC 606, significant judgments are required in order to identify contracts with customers and estimate transaction prices.Additional judgments are required for the identification of distinct performance obligations, the estimation of standalone sellingprices and the allocation of the transaction price by relative standalone selling prices. NOTE 3 – BUSINESS COMBINATION On February 27, 2017, Hennessy consummated the merger of Hennessy’s wholly-owned subsidiary with and into Daseke, Inc., withDaseke, Inc. surviving as a direct wholly-owned subsidiary of Hennessy (the Business Combination) pursuant to the Agreement andPlan of Merger, dated December 22, 2016 (the Merger Agreement). The aggregate consideration received by Private Dasekestockholders upon closing was $266.7 million, consisting of newly issued shares of common stock at a value of $10.00 per share. TheMerger Agreement contains an earn-out provision through which Private Daseke stockholders could receive up to 15 millionadditional shares of common stock (with up to 5 million shares payable annually with respect to 2017, 2018 and 2019 performance).The full 15 million shares are only payable if (i) the annualized Adjusted EBITDA (giving effect to acquisitions and as defined in theMerger Agreement) for 2017, 2018 and 2019 is at least $140.0 million, $170.0 million and $200.0 million, respectively, and (ii) theclosing share price of the Company’s common stock is at least $12.00, $14.00 and $16.00 for any 20 trading days in a consecutive 30trading day period in 2017, 2018 and 2019, respectively. For each year, the 5 million earn-out shares will be prorated to the extent theannualized Adjusted EBITDA (giving effect to acquisitions and as defined in the Merger Agreement) exceeds 90% but representsless than 100%, of the applicable earn-out target. The Company met the earn-out provisions for the year ended December 31, 2017and 5 million shares were issued to the Private Daseke stockholders in the second quarter of 2018. Following the consummation of the Business Combination on February 27, 2017 (the Closing), there were 37,715,960 shares ofcommon stock issued and outstanding, consisting of (i) 26,665,330 shares issued to Private Daseke stockholders pursuant to theMerger Agreement, (ii) 419,669 shares issued in a private placement that closed in conjunction with the Business Combination, (iii)2,288,043 shares originally issued to Hennessy Capital Partners II LLC (the Sponsor) in a private placement that closedsimultaneously with the consummation of the IPO, and (iv) 8,342,918 shares, following redemptions, which shares were originallyissued in the IPO. In connection with the Business Combination, $65.0 million of Series A Preferred Stock (650,000 shares) wereissued in a private placement.
F-17

Table of Contents
DASEKE, INC. AND SUBSIDIARIES
NOTES TO CONSOLIDATED FINANCIAL STATEMENTS
In conjunction with the Closing, the Company entered into (i) a $350.0 million term loan credit facility (the Term Loan Facility),which consists of a $250.0 million term loan funded on the closing date of the Term Loan Facility and up to $100.0 million of termloans to be funded from time to time under a delayed draw term loan facility, and (ii) an asset-based revolving credit facility (theABL Facility), in an aggregate maximum credit amount equal to $70.0 million (subject to availability under a borrowing base). SeeNote 10 for more information regarding the Term Loan Facility and the ABL Facility. Prior to the Closing, the Company had a creditfacility consisting of a term loan and a revolving line of credit. The following table is a summary of cash proceeds and utilization of proceeds in the Business Combination (in thousands):
Proceeds Public share proceeds $ 83,429Issuance of Series A Preferred Stock 65,000Term Loan Facility 250,000Cash 3,209Total proceeds 401,638 Use of Proceeds Repayment of Line of Credit 16,717Repayment of Senior Term Loan 122,724Repayment of equipment loans 89,488Repayment of subordinated debt 67,460Payment of deferred financing fees 14,148Repurchase Main Street and Prudential shares 36,168Hennessy transaction costs 19,063Daseke transaction costs 1,204Total use of proceeds 366,972 Net cash received $ 34,666
(1) - 8,342,918 public shares outstanding valued at $10.00 per share(2) - Daseke cash utilized for payment of deferred financing fees and transaction costs(3) - includes payment of $59 accrued interest recognized in interest expense(4) - includes payment of $422 accrued interest recognized in interest expense(5) - includes payment of $731 accrued interest recognized in interest expense(6) - includes payment of $745 accrued interest recognized in interest expense(7) - excludes $81 paid subsequent to the Closing(8) - Hennessy repurchased Private Daseke shares held by Main Street Capital II, LP, Main Street Mezzanine Fund, LP, Main Street Capital Corporation, Prudential Capital Partners IV, L.P., Prudential Capital Partners (Parallel Fund) IV, L.P. and Prudential Capital Partners Management Fund IV, L.P.(9) - $0.8 million and $0.4 million expensed in fourth quarter 2016 and first quarter 2017, respectively The Business Combination was accounted for as a reverse merger in accordance with GAAP. Under this method of accounting,Hennessy is treated as the “acquired” company. This determination was primarily based on Private Daseke comprising the ongoingoperations of the combined company, Private Daseke’s senior management comprising the senior management of the combinedcompany, and Private Daseke stockholders having a majority of the voting power of the combined company. For accountingpurposes, Private Daseke is deemed to be the accounting acquirer in the transaction and, consequently, the transaction is treated as arecapitalization of Private Daseke (i.e., a capital transaction involving the issuance of stock by Hennessy for the stock of PrivateDaseke). Accordingly, the consolidated assets, liabilities and results
F-18
(1)
(2)
(3)
(4)
(5)
(6)
(7)
(8)
(9)

Table of Contents
DASEKE, INC. AND SUBSIDIARIES
NOTES TO CONSOLIDATED FINANCIAL STATEMENTS
of operations of Private Daseke are the historical financial statements of the combined company, and Hennessy’s assets, liabilitiesand results of operations are consolidated with Private Daseke beginning on the acquisition date. In connection with the Closing, Daseke, Inc. changed its name to Daseke Companies, Inc. and Hennessy Capital Acquisition Corp. IIchanged its name to Daseke, Inc. Daseke, Inc.’s common stock and warrants began trading under the ticker symbols DSKE andDSKEW, respectively, on February 28, 2017. NOTE 4 – ACQUISITIONS The Company is a leading consolidator of the open-deck freight market in North America. From its inception in late 2008, theCompany has successfully acquired 20 open-deck trucking companies. Negotiations and discussions with potential targets are anintegral part of the Company’s operations, and the Company may be in varying stages of the acquisition process, from infancy tovery mature, at any point in time. To date, the primary reason for each acquisition was to add resources and services in geographicareas, customers and markets that the Company wants to serve, resulting in recognized goodwill. For each acquisition, the aggregate purchase price was allocated to the major categories of assets acquired and liabilities assumed atestimated fair values as of the acquisition date, which were based, in part, upon outside preliminary appraisals for certain assets andsubject to change when additional information concerning final asset and liability values is obtained. The final purchase priceallocations may result in adjustments to certain assets and liabilities, including the residual amount allocated to goodwill. 2018 Acquisitions The following is a summary of the allocation of the purchase price paid to the fair values of the net assets, net of cash acquired, of theCompany’s 2018 acquisitions (in thousands):
(all amounts in U.S. dollars) Leavitt's Builders Kelsey Trail AvedaAccounts receivable $ 1,968 $ 8,347 $ 2,320 $ 37,255Parts supplies 53 261 33 —Prepaid and other current assets 384 1,509 382 2,516Property and equipment 8,551 29,414 9,164 89,752Goodwill 5,108 14,730 4,201 7,037Intangible assets 3,600 10,600 1,550 15,001Other long-term assets — 536 — —Deferred tax liability — (9,202) (3,635) (5,950)Accounts payable and other liabilities (4,935) (19,931) (8,026) (30,007)Total $ 14,729 $ 36,264 $ 5,989 $ 115,604 Leavitt’s Freight Service
On August 1, 2018, the Company acquired 100% of the outstanding equity interests of Leavitt’s Freight Service, Inc. (Leavitt’s),based in Springfield, Oregon. Total consideration paid was $14.9 million of cash, which was funded with cash on hand. Theacquisition was treated as an asset purchase because Leavitt’s was a qualified subchapter S-subsidiary acquired directly from an S-corporation; therefore, the values assigned to the intangible assets and goodwill are deductible for tax purposes. Approximately $0.3million of transaction expenses were incurred in the acquisition, which will be deductible for tax purposes because the transactionqualified as an asset purchase. As of December 31, 2018, the valuation of identifiable intangible assets was completed resulting in adecrease of $1.6 million to the provisional intangible assets recorded of $5.2 million, with a corresponding increase to goodwill. Theresulting intangible assets totaling $3.6 million consist of trade name valued at $1.8 million, non-compete agreements valued at $0.5million and customer relationships
F-19

Table of Contents
DASEKE, INC. AND SUBSIDIARIES
NOTES TO CONSOLIDATED FINANCIAL STATEMENTS
intangible of $1.3 million. For the three months ended December 31, 2018, the change resulted in an insignificant decrease inamortization expense and accumulated amortization. Builders Transportation
On August 1, 2018, the Company acquired 100% of the outstanding equity interests of Builders Transportation Co., LLC (Builders),based in Memphis, Tennessee. Total consideration paid was $36.3 million, consisting of $30.0 million in cash, 399,530 shares ofDaseke common stock valued at $3.4 million and the payoff of $2.9 million of outstanding debt. The cash consideration was fundedwith cash on hand. The acquisition was a stock purchase; therefore, the values assigned to the intangible assets and goodwill are notdeductible for tax purposes. Approximately $0.2 million of transaction expenses were incurred in the acquisition, which are notdeductible for tax purposes. As of December 31, 2018, the valuation of identifiable intangible assets was completed resulting in adecrease of $2.5 million to the provisional intangible assets recorded of $13.1 million, with a corresponding increase to goodwill.The resulting intangible assets totaling $10.6 million consist of trade name valued at $5.0 million, non-compete agreements valued at$0.5 million and customer relationships intangible of $5.1 million. For the three months ended December 31, 2018, the changeresulted in an increase in amortization expense and accumulated amortization of $0.2 million, of which $0.1 million is related to theprevious quarter. Additionally, goodwill and deferred tax liability were increased by $0.4 million to recognize deferred taxes on theincrease in amortizable identifiable intangible assets. Kelsey Trail Trucking
On July 1, 2018, the Company acquired 100% of the outstanding equity interests of Kelsey Trail Trucking Ltd. (Kelsey Trail), basedin Saskatoon, Saskatchewan province, Canada. Total consideration paid was $6.2 million, consisting of $5.3 million in cash and95,859 shares of Daseke common stock valued at $0.9 million. The cash consideration was funded with cash on hand. Theacquisition was a stock purchase; therefore, the values assigned to the intangible assets and goodwill are not deductible for taxpurposes. Approximately $0.1 million of transaction expenses were incurred in the acquisition, which are not deductible for taxpurposes. As of December 31, 2018, the valuation of identifiable intangible assets was completed resulting in a decrease of $0.3million to the provisional intangible assets recorded of $1.9 million, with a corresponding increase to goodwill. The resultingintangible assets totaling $1.6 million consist of trade name valued at $1.5 million and non-compete agreements valued at $0.1million. For the three months ended December 31, 2018, the change resulted in an insignificant decrease in amortization expense andaccumulated amortization. Additionally, goodwill and deferred tax liability were increased by $2.5 million to adjust the beginningbalance of deferred taxes. Aveda Transportation and Energy Services
On June 6, 2018, the Company acquired all of the outstanding common shares of Aveda Transportation and Energy Services Inc., acorporation existing under the laws of the Province of Alberta, Canada (Aveda), pursuant to the Agreement and the Plan ofArrangement (the Agreement). Total consideration paid was $118.7 million, consisting of $27.3 million in cash, 1,612,979 shares ofDaseke common stock valued at $15.4 million, and the payoff of $54.8 million of outstanding debt. The Company will also pay tothe holders of Aveda common shares up to C$0.45 in cash per Aveda common share, contingent on and based on Aveda’s CompanyEBITDA (as defined in the Agreement) meeting certain thresholds set forth in the Agreement for the period beginning June 1, 2018and ending on May 1, 2019 or with agreement of the parties, July 1, 2018 to June 30, 2019. The contingent consideration for thisearn-out has been valued at an estimated $21.2 million. The Aveda acquisition was a stock purchase; therefore, the value assigned tothe intangible assets and goodwill are not deductible for tax purposes. Approximately $1.1 million of transaction expenses wereincurred in the acquisition, which are not deductible for tax purposes. As of December 31, 2018, the valuation of identifiableintangible assets was completed resulting in an increase of $6.1 million to the provisional intangible assets recorded of $9.0 million.The resulting intangible assets totaling $15.0 million consist of trade name valued at $6.3 million, non-compete agreements valued at$1.5 million and customer relationships intangible of $7.2 million. For the three months ended December 31, 2018, the changeresulted
F-20

Table of Contents
DASEKE, INC. AND SUBSIDIARIES
NOTES TO CONSOLIDATED FINANCIAL STATEMENTS
in an insignificant increase in amortization expense and accumulated amortization. Additionally, goodwill and deferred tax liabilitywere increased by $0.7 million to recognize deferred taxes on the increase in amortizable identifiable intangible assets. Additionally,goodwill and deferred tax liability were increased by $4.7 million to adjust the beginning balance of deferred taxes. 2017 Acquisitions The following is a summary of the allocation of the purchase price paid to the fair values of the net assets, net of cash acquired, of theCompany’s 2017 acquisitions (in thousands):
(all amounts in U.S. dollars) Tennessee Moore Roadmaster Steel Belmont Freight Group Haulers R&R Steelman Schilli Big FreightAccounts receivable $ 240 $ 4,456 $ 9,806 $ 20,207 $ 5,129 $ 4,383 $ 8,616 $ 4,914Parts supplies — 312 231 — 149 90 1,681 212Prepaid and other current assets 107 301 1,097 5,870 1,515 2,295 2,548 287Property and equipment 1,548 22,052 36,854 8,705 16,887 11,100 39,870 11,493Goodwill 2,427 17,272 51,673 34,600 15,676 9,747 11,050 7,638Intangible assets 1,760 30,400 22,900 49,850 11,010 6,620 6,000 4,210Other long-term assets — 114 670 19,049 156 5,013 915 121Deferred tax liability (1,300) (13,848) (10,036) (32,632) (8,922) (4,811) (15,424) (4,792)Accounts payable and other liabilities (248) (1,889) (26,764) (14,002) (3,362) (15,612) (27,896) (6,294)Total $ 4,534 $ 59,170 $ 86,431 $ 91,647 $ 38,238 $ 18,825 $ 27,360 $ 17,789 Belmont On December 29, 2017, the Company acquired 100% of the outstanding equity interests of Belmont Enterprises, Inc. (Belmont)based in Olympia, Washington. Total consideration paid was $4.6 million in cash funded through the Company’s line of credit underthe ABL Facility. The acquisition was a stock purchase; therefore, the values assigned to the intangible assets and goodwill are not deductible for taxpurposes. Transaction expenses incurred in the acquisition, which are not deductible for tax purposes, were immaterial. As of June30, 2018, the valuation of identifiable intangible assets was completed resulting in assets totaling $1.7 million, consisting of tradename valued at $0.3 million, non-compete agreements valued at $0.2 million and customer relationships intangible of $1.2 million,with a corresponding decrease to goodwill. For the three months ended June 30, 2018, the change resulted in an increase inamortization expense and accumulated amortization of $0.1 million, of which $62,566 is related to the previous quarter. Additionally,goodwill and a corresponding deferred tax liability of $0.6 million was recognized based on the rates in effect on the acquisition date.The deferred tax liability was re-measured using the TCJA rates, which resulted in the recognition of a $0.4 million deferred taxbenefit. Moore Freight Services On December 1, 2017, the Company acquired 100% of the outstanding equity interests of: (1) Moore Freight Service, Inc., (2) RT &L, LLC, (3) JD and Partners, LLC, (4) TM Transport and Leasing, LLC, and (5) Rand, LLC (collectively Moore Freight Services)based in Knoxville, Tennessee. Total consideration paid was $59.1 million, consisting of $35.1 million in cash and 145,129 shares ofDaseke common stock valued at $1.8 million and the repayment of $22.2 million of long-term debt by the Company. The cashconsideration was funded with cash on hand and the Term Loan Facility. The acquisition was a stock purchase; therefore, the valuesassigned to the intangible assets and goodwill are not deductible for tax purposes. Approximately $0.6 million of transactionexpenses were incurred in the acquisition, which are not deductible for tax purposes. As of June 30, 2018, the valuation ofidentifiable intangible assets was completed resulting in assets totaling $30.4 million, consisting of trade name valued at $3.2 million,non-compete agreements valued at $3.5 million and customer relationships intangible of $23.7 million, with a correspondingdecrease to goodwill. For the three
F-21

Table of Contents
DASEKE, INC. AND SUBSIDIARIES
NOTES TO CONSOLIDATED FINANCIAL STATEMENTS
months ended June 30, 2018, the change resulted in an increase in amortization expense and accumulated amortization of $1.5million, of which $0.9 million related to the previous quarter. Additionally, goodwill and a corresponding deferred tax liability of$11.7 million was recognized based on the rates in effect on the acquisition date. The deferred tax liability was re-measured using theTCJA rates, which resulted in the recognition of a $4.0 million deferred tax benefit. For the three months ended December 31 , 2018,the beginning balance of the deferred tax liability related to net operating losses was reduced by $0.5 million, based on the rates ineffect on the acquisition date, with a corresponding decrease to goodwill. The deferred tax adjustment was re-measured using theTCJA rates, which resulted in the recognition of $0.2 million deferred tax expense in the three months ended December 31, 2018. Roadmaster Group On December 1, 2017, the Company acquired 100% of the outstanding equity interests of Roadmaster Group, Inc. and subsidiaries,and Roadmaster Equipment Leasing, Inc. and all subsidiaries (collectively the Roadmaster Group) based in Phoenix, Arizona. Totalconsideration paid was $86.9 million, consisting of $37.5 million in cash, 3,114,247 shares of Daseke common stock valued at $39.1million and the repayment of $10.3 million of long-term debt by the Company. The cash consideration was funded with cash on handand the Term Loan Facility. The acquisition was a stock purchase; therefore, the values assigned to the intangible assets and goodwillare not deductible for tax purposes. Approximately $0.6 million of transaction expenses were incurred in the acquisition, which arenot deductible for tax purposes. As of June 30, 2018, the valuation of identifiable intangible assets was completed resulting in assetstotaling $22.9 million, consisting of trade name valued at $12.7 million, non-compete agreements valued at $2.9 million andcustomer relationships intangible of $7.3 million, with a corresponding decrease to goodwill. For the three months ended June 30,2018, the change resulted in an increase in amortization expense and accumulated amortization of $0.6 million, of which $0.3 millionrelated to the previous quarter. Additionally, goodwill and a corresponding deferred tax liability of $8.7 million was recognizedbased on the rates in effect on the acquisition date. The deferred tax liability was re-measured using the TCJA rates, which resulted inthe recognition of a $3.0 million deferred tax benefit. For the three months ended December 31, 2018, the beginning balance of thedeferred tax liability related to net operating losses and fixed assets was reduced by $9.4 million, based on the rates in effect on theacquisition date, with a corresponding decrease to goodwill. The deferred tax adjustment was re-measured at the TCJA rates,resulting in $3.5 million of deferred tax expense in the three months ended December 31, 2018. Tennessee Steel Haulers & Co. On December 1, 2017, the Company acquired 100% of the outstanding equity interests of: (1) Tennessee Steel Haulers, Inc., (2)Alabama Carriers, Inc., and (3) Fleet Movers Inc. (collectively TSH & Co.) based in Nashville, Tennessee. Total consideration paidwas $91.9 million, consisting of $74.9 million in cash and 972,680 shares of Daseke common stock valued at $12.0 million and therepayment of $5.0 million of long-term debt by the Company. The cash consideration was funded with cash on hand and the TermLoan Facility. The acquisition was a stock purchase; therefore, the values assigned to the intangible assets and goodwill are notdeductible for tax purposes. Approximately $0.5 million of transaction expenses were incurred in the acquisition, which are notdeductible for tax purposes. As of June 30, 2018, the valuation of identifiable intangible assets was completed resulting in assetstotaling $49.8 million, consisting of trade name valued at $21.5 million, non-compete agreements valued at $12.4 million andcustomer relationships intangible of $15.9 million, with a corresponding decrease to goodwill. For the three months ended June 30,2018, the change resulted in an increase in amortization expense and accumulated amortization of $2.1 million, of which $1.2 millionrelated to the previous quarter. Additionally, goodwill and a deferred tax liability of $19.2 million was recognized based on the ratesin effect on the acquisition date. The deferred tax liability was re-measured using the TCJA rates, which resulted in the recognition ofa $6.6 million deferred tax benefit. For the three months ended December 31, 2018, the beginning balance of the deferred tax liabilityrelated to certain deferred taxes was increased by $5.9 million, based on the rate in effect on the acquisition date, with acorresponding increase to goodwill. The deferred tax adjustment was re-measured at the TCJA rates, resulting in $1.6 million ofdeferred tax benefit in the three months ended December 31, 2018.
F-22

Table of Contents
DASEKE, INC. AND SUBSIDIARIES
NOTES TO CONSOLIDATED FINANCIAL STATEMENTS
R&R Trucking Holdings, LLC On September 1, 2017, the Company acquired 100% of the outstanding stock of R&R Trucking Holdings, LLC (R&R), based inDuenweg, Missouri. Total consideration paid was $38.4 million, consisting of $24.6 million in cash and the assumption andrepayment of $13.8 million of long-term debt by the Company. The cash consideration was funded through a delayed draw onSeptember 1, 2017 under the Term Loan Facility. The acquisition was a stock purchase; therefore, the values assigned to theintangible assets and goodwill are not deductible for tax purposes. Approximately $0.6 million of transaction expenses were incurredin the acquisition, which are not deductible for tax purposes. The Steelman Companies On July 1, 2017, the Company acquired 100% of the outstanding stock of The Steelman Companies (Steelman), based in Springfield,Missouri, for consideration of $18.8 million, consisting of $11.2 million in cash and 746,170 shares of Daseke common stock valuedat $7.6 million. The fair value of the 746,170 shares issued was determined based on the closing price of the stock on the acquisitionclose date. The cash consideration was funded through cash on hand. The acquisition was a stock purchase under GAAP. A Section338(h)(10) election was filed for certain of the entities acquired, which will deem those acquisitions as an asset purchase for taxpurposes; therefore, approximately $14.9 million of the values assigned to the intangible assets and goodwill are expected to bedeductible for tax purposes. Approximately $0.3 million of transaction expenses were incurred in the acquisition, which are notdeductible for tax purposes. As of June 30, 2018, the provisional amount of goodwill was increased by $1.7 million with acorresponding increase to deferred tax liability. The deferred tax adjustment was re-measured at the TCJA rates, resulting in $0.6million of deferred tax expense in the three months ended December 31, 2018. Schilli Transportation Services, Inc. On May 1, 2017, the Company acquired 100% of the outstanding stock of Schilli Transportation Services, Inc. and certain of itsaffiliates (Schilli), based in Remington, Indiana. Total consideration paid was $27.4 million, consisting of $21.0 million in cash,232,885 shares of Daseke common stock valued at $2.3 million and the refinancing of $4.0 million of long-term debt by theCompany. The fair value of the 232,885 shares issued was determined based on the closing price of the stock on the acquisition closedate. The cash consideration was funded through a delayed draw on May 1, 2017 under the Term Loan Facility. The acquisition wasa stock purchase; therefore, the values assigned to the intangible assets and goodwill are not deductible for tax purposes.Approximately $0.4 million of transaction expenses were incurred in the acquisition, which are not deductible for tax purposes. As ofJune 30, 2018, the provisional balance of goodwill was increased by $2.8 million for fair value adjustments to assets as of theacquisition date with a decrease to receivables of $0.9 million, held-for-sale assets of $0.3 million and fixed assets of $1.6 million.Additionally, the deferred tax liability was decreased by $0.7 million, with a corresponding decrease to goodwill. Big Freight Systems, Inc. On May 1, 2017, the Company acquired 100% of the outstanding stock of Big Freight Systems, Inc. (Big Freight), based inSteinbach, Manitoba. Total consideration paid was $16.7 million consisting of $12.4 million in cash, 109,248 shares of Dasekecommon stock valued at $1.1 million and the assumption of approximately $3.2 million of outstanding debt by the Company. Thefair value of the 109,248 shares issued was determined based on the closing price of the stock on the acquisition close date. BigFreight’s purchase agreement also contains an earn-out for additional cash consideration to be paid on the excess of each of 2017,2018 and 2019’s earnings before interest, taxes, depreciation and amortization (EBITDA Amount) over 2016’s EBITDA Amount (asdefined in the purchase agreement), multiplied by 0.4. A contingent liability of $1.1 million was included in the allocation of thepurchase price for this earn-out. The cash consideration was funded through a delayed draw on May 1, 2017 under the Term LoanFacility and cash on hand. The acquisition was a stock purchase; therefore, the values assigned to the intangible assets and goodwillare not deductible for tax purposes. Approximately $0.6 million of transaction expenses were incurred in the acquisition, which arenot deductible for tax
F-23

Table of Contents
DASEKE, INC. AND SUBSIDIARIES
NOTES TO CONSOLIDATED FINANCIAL STATEMENTS
purposes. As of June 30, 2018, the provisional amount of goodwill was increased by $0.6 million (net of a $0.3 million foreigncurrency translation adjustment) with a corresponding increase to deferred tax liability. For the year ended December 31, 2018, revenue and net loss of the acquired companies from their respective dates of acquisition was$163.6 million and $1.5 million, respectively. For the year ended December 31, 2017, revenue and net income of the acquiredcompanies from their respective dates of acquisition was $154.0 million and $15.6 million, respectively. There were no acquisitionsin 2016. Supplemental Pro Forma Information (Unaudited) The following supplemental pro forma financial information reflects the 2018 acquisitions as if they occurred on January 1, 2017.This pro forma financial information has been presented for illustrative purposes only and is not necessarily indicative of theoperating results that would have been achieved had the pro forma events taken place on January 1, 2017. Further, the pro formafinancial information does not purport to project the future operating results of the consolidated company.
Year Ended
December 31, (unaudited)(In millions, except per share amounts) 2018 2017Pro forma revenue $ 1,747.4 $ 1,144.2Pro forma net income (loss) $ (5.7) $ 22.6Pro forma net income (loss) per common share: Basic $ (0.09) $ 0.60Diluted $ (0.09) $ 0.57
NOTE 5 – PREPAID AND OTHER CURRENT ASSETS The components of prepaid expenses and other current assets are as follows as of December 31 (in thousands):
2018 2017Insurance $ 7,375 $ 7,642Licensing, permits and tolls 5,649 4,096Other assets 4,411 2,409Other prepaids 3,852 2,948Assets held for sale 3,573 9,907Highway and fuel taxes 1,422 1,238Total $ 26,282 $ 28,240
F-24

Table of Contents
DASEKE, INC. AND SUBSIDIARIES
NOTES TO CONSOLIDATED FINANCIAL STATEMENTS
NOTE 6 – GOODWILL AND INTANGIBLE ASSETS Changes in the carrying amount of goodwill for the years ended December 31, 2018 and 2017 are as follows (in thousands):
Flatbed Specialized TotalGoodwill balance at January 1, 2017 $ 46,660 42,375 $ 89,035Goodwill acquired and adjustments to previously recorded goodwill (net) 59,206 153,849 213,055Foreign currency translation adjustment — 612 612Goodwill balance at December 31, 2017 105,866 196,836 302,702Impairment — (11,050) (11,050)Goodwill acquired and adjustments to previously recorded goodwill (net) (4,368) (27,752) (32,120)Foreign currency translation adjustment — (1,167) (1,167)Goodwill balance at December 31, 2018 $ 101,498 $ 156,867 $ 258,365 Intangible assets consisted of the following at December 31, 2018 and 2017 (in thousands):
As of December 31, 2018 As of December 31, 2017 Intangible Accumulated Intangible Intangible Accumulated Intangible Assets Amortization Assets, net Assets Amortization Assets, netNon-competition agreements $ 33,840 $ (12,794) $ 21,046 $ 12,230 $ (5,765) $ 6,465Customer relationships 130,876 (33,536) 97,340 69,090 (23,921) 45,169Trade names 90,600 — 90,600 41,180 — 41,180Foreign currency translation adjustment (195) — (195) 306 — 306Total intangible assets $ 255,121 $ (46,330) $ 208,791 $ 122,806 $ (29,686) $ 93,120 As of December 31, 2018, non-competition agreements and customer relationships had weighted average remaining useful lives of3.0 and 10.4 years, respectively. See Note 4 for more information on intangible assets acquired. Amortization expense for intangible assets with definite lives was $16.6 million, $6. 7 million and $6.0 million forthe years ended December 31, 2018, 2017 and 2016, respectively. In June 2018, the Company recorded an impairment charge of $2.8 million related to the trade names category of intangible assetsrelated to the specialized segment. The trade name was impaired as a result of the reorganization and merger of two of theCompany’s operating companies. Future estimated amortization expense is as follows (in thousands):
Non-competition CustomerYear ending December 31, Agreements Relationships2019 $ 6,807 $ 9,5192020 5,426 9,5192021 4,662 9,5192022 3,928 9,5192023 223 9,519Thereafter — 49,745Total $ 21,046 $ 97,340
F-25

Table of Contents
DASEKE, INC. AND SUBSIDIARIES
NOTES TO CONSOLIDATED FINANCIAL STATEMENTS
NOTE 7 – PROPERTY AND EQUIPMENT The components of property and equipment are as follows at December 31 (in thousands):
2018 2017Revenue equipment $ 733,954 $ 544,876Buildings and improvements 61,913 53,366Furniture and fixtures, office and computer equipment and vehicles 36,553 20,805 832,420 619,047Accumulated depreciation (259,701) (189,408)Total $ 572,719 $ 429,639
Depreciation expense was $114.4 million, $70.2 million and $61.5 million for the years ended December 31, 2018, 2017 and 2016,respectively. NOTE 8 – SALES-TYPE LEASES The components of the net investment in sales-type leases at December 31, 2018 and 2017 are as follows (in thousands):
2018 2017Minimum lease receivable $ 78,087 $ 62,587Deferred gain (10,043) (9,352)Net minimum lease receivable 68,044 53,235Unearned interest income (12,285) (10,432)Net investment in sales-type leases 55,759 42,803Current portion (16,213) (10,979)
$ 39,546 $ 31,824
The long-term portion of sales-type leases is classified in other long-term assets on the consolidated balance sheets at December 31,2018 and 2017. Gain or loss on disposition of revenue equipment leased to owner-operators is included as a component of purchased freight in theconsolidated statements of operations and comprehensive income (loss). For the years ended December 31, 2018, 2017 and 2016, thegain totaled approximately $2.4 million, $1.4 million and $0.8 million, respectively. Future minimum lease receipts are as follows (in thousands):
Year ending December 31, Amount2019 $ 16,2132020 14,5352021 10,9732022 11,1952023 2,684Thereafter 159Total $ 55,759
F-26

Table of Contents
DASEKE, INC. AND SUBSIDIARIES
NOTES TO CONSOLIDATED FINANCIAL STATEMENTS
NOTE 9 – ACCRUED EXPENSES AND OTHER LIABILITIES The components of accrued expenses and other liabilities are as follows at December 31 (in thousands):
2018 2017Brokerage and escorts $ 12,587 $ 6,264Unvouchered payables 11,748 4,156Owner operator deposits 9,270 8,431Other accrued expenses 8,023 4,023Sales and local taxes payable 3,259 954Fuel and fuel taxes 1,197 1,508Interest 458 540 $ 46,542 $ 25,876
NOTE 10 – LONG-TERM DEBT Long-term debt consists of the following at December 31 (in thousands):
2018 2017Senior debt Line of credit $ — $ 4,561Term loan facility 493,478 498,462Equipment term loans 190,708 126,227Capital leases 18,228 5,757 702,414 635,007Less current portion (63,535) (43,056)Less unamortized debt issuance costs (16,229) (17,650)Long-term portion $ 622,650 $ 574,301
Term Loan Facility In conjunction with the close of the Business Combination on February 27, 2017, the Company entered into the $350.0 million TermLoan Facility under a loan agreement with Credit Suisse AG, Cayman Islands Branch, as administrative agent, and the lenders partythereto. The Term Loan Facility consists of (i) a $250.0 million term loan funded on the closing date of the Term Loan Facility (theClosing Date Term Loan); and (ii) up to $100.0 million of term loans to be funded from time to time under a delayed draw featureavailable until February 27, 2018. The size of the Term Loan Facility could increase from time to time pursuant to an uncommitted incremental facility in an aggregateamount for all such incremental loans and commitments up to the sum of (a) $65.0 million, (b) an uncapped amount based on themaximum first lien, secured and total leverage ratio-based formulas depending upon the security and ranking of the relevantincremental facility and (c) the $150.0 million tack-on loan incurred under the Term Loan Facility on November 28, 2017. Theproceeds from the Closing Date Term Loan were used to partially refinance certain of the Company’s capital leases, purchase moneydebt, equipment and real estate financings and to pay transaction costs associated with the Business Combination and refinance theLine of Credit and the Senior Term Loan. The Term Loan Facility has a scheduled maturity date of February 27, 2024. Term loans under the Term Loan Facility are, at theCompany’s election from time to time, comprised of alternate base rate loans (an ABR Borrowing) or adjusted LIBOR loans (aEurodollar Rate Borrowing), with the applicable margins of interest being an alternate base rate (subject to a 2.00% floor) plus 4.50%per annum through November 28, 2017, amended to 4.00% on that date for ABR Borrowings
F-27

Table of Contents
DASEKE, INC. AND SUBSIDIARIES
NOTES TO CONSOLIDATED FINANCIAL STATEMENTS
and LIBOR (subject to a 1.00% floor) plus 5.50% per annum through November 28, 2017, amended to 5.00% on that date forEurodollar Rate Borrowings. At December 31, 2018, the average interest rate on the Term Loan Facility was 7.1%. On August 16, 2017, the Company obtained an amendment of the Term Loan facility that increased the delayed draw incurrencecondition relating to pro forma total leverage ratio to 4.25x from 3.5x, effective August 15, 2017 through the maturity of the delayeddraw Term Loan Facility in February 2018, which enabled the Company to access $60.5 million from the delayed draw Term LoanFacility. On November 28, 2017, the Term Loan Facility was amended to provide for a $150.0 million tack-on to the existing Term LoanFacility. The Term Loan Facility is secured by all assets of the Company, except those assets collateralizing equipment and certain real estatelenders debt and subject to certain customary exceptions. As amended, on August 16, 2017, the Term Loan Facility contains a financial covenant requiring the Company to maintain aconsolidated total leverage ratio as of the last day of any fiscal quarter of less than or equal to 4.25 to 1.00, stepping down to 4.00 to1.00 on March 31, 2019 and stepping down to 3.75 to 1.00 on March 31, 2021. Additionally, as amended, the Term Loan Facilitycontains a pro forma total leverage ratio of less than or equal to 4.25 to 1.00 for term loans funded from the delayed draw feature.The consolidated total leverage ratio is defined as the ratio of (i) consolidated total debt minus unrestricted cash and cash equivalentsand cash and cash equivalents restricted in favor of the administrative agent and the lenders, to (ii) consolidated adjusted EBITDAfor the trailing 12 month period (with customary add-backs permitted to consolidated adjusted EBITDA, including in respect ofsynergies and cost-savings reasonably identifiable and factually supportable that are anticipated to be realized in an aggregate amountnot to exceed 25% of consolidated adjusted EBITDA and subject to other customary limitations). The Term Loan Facility permits voluntarily prepayments of borrowings. In certain circumstances (subject to exceptions, exclusionsand, in the case of excess cash flow, step-downs described below), the Company may also be required to make an offer to prepay theTerm Loan Facility if it receives proceeds as a result of certain asset sales, debt issuances, casualty or similar events of loss, or if ithas excess cash flow (defined as an annual amount calculated using a customary formula based on consolidated adjusted EBITDA,including, among other things, deductions for (i) the amount of certain voluntary prepayments of the Term Loan Facility and (ii) theamount of certain capital expenditures, acquisitions, investments and restricted payments). The percentage of excess cash flow thatmust be applied as a mandatory prepayment is 50% with respect to the initial excess cash flow period (the fiscal year ending onDecember 31, 2018) and will be 50%, 25% or 0% for future excess cash flow periods depending upon the first lien leverage ratio. The Term Loan Facility contains (i) certain customary affirmative covenants that, among other things, require compliance withapplicable laws, periodic financial reporting and notices of material events, payment of taxes and other obligations, maintenance ofproperty and insurance, and provision of additional guarantees and collateral, and (ii) certain customary negative covenants that,among other things, restrict the incurrence of additional indebtedness, liens on property, sale and leaseback transactions, investments,mergers, consolidations, liquidations and dissolutions, asset sales, acquisitions, the payment of distributions, dividends, redemptionsand repurchases of equity interests, transactions with affiliates, prepayments and redemptions of certain other indebtedness,burdensome agreements, holding company limitations, changes in fiscal year and modifications of organizational documents. ABL Facility Also, in conjunction with the Closing on February 27, 2017, the Company entered into a five-year, senior secured asset-basedrevolving line of credit (RLOC) with an aggregate maximum credit amount equal to $70.0 million, amended on June 15, 2018 to$100.0 million (subject to availability under a borrowing base equal to 85% of the Company’s eligible accounts receivable, 80% ofthe Company’s eligible unbilled accounts receivable and 50% of parts supplies (up to $3.0
F-28

Table of Contents
DASEKE, INC. AND SUBSIDIARIES
NOTES TO CONSOLIDATED FINANCIAL STATEMENTS
million)) under a credit agreement with PNC Bank, National Association, as administrative agent and the lenders party thereto. Asamended on June 15, 2018, the ABL Facility’s maximum credit amount was increased by $30.0 million pursuant to an uncommittedaccordion. The ABL Facility also provides for the issuance of letters of credit subject to certain restrictions and a sublimit of $20million, as defined in the credit agreement. The ABL Facility matures on February 27, 2022. As of December 31, 2018, the Companyhad a net debit balance of $14.1 million, $12.2 million in letters of credit outstanding, and could incur approximately $87.8 million ofadditional indebtedness under the ABL Facility.
Borrowings under the ABL Facility bear interest at rates based upon the Company’s fixed charge coverage ratio and, at theCompany’s election from time to time, either a base rate plus an applicable margin or an adjusted LIBOR rate plus an applicablemargin. Margins on the ABL Facility are adjusted, if necessary to the applicable rates set forth in the following table correspondingto the fixed charge coverage ratio for the trailing 12 month period on the last day of the most recently completed fiscal quarter.
Fixed Charge Coverage Ratio Base Rate Margins LIBOR Rate Margins
Less than 1.25 to 1.00 2.25% 3.25 %
Greater than or equal to 1.25 to 1.00, but less than 1.50 to 1.00 1.75% 2.75 %
Greater than or equal to 1.50 to 1.00, but less than 1.75 1.25% 2.25 %
Greater than or equal to 1.75 to 1.00 0.75% 1.75 %
The ABL Facility was amended on June 15, 2018, to adjust margins, if necessary, on the ABL Facility beginning in the fiscal quarterended September 30, 2018, to the applicable rates set forth in the following table corresponding to the average RLOC Utilization forthe trailing 12 month period on the last day of the most recently completed fiscal quarter. RLOC Utilization at a particular date shallmean an amount equal to (a)(i) outstanding amount of Revolving Advances plus (ii) the outstanding amount of the Swing Loans plus(iii) the aggregate Maximum Undrawn Amount of all outstanding Letters of Credit, divided by (b) Maximum Revolving AdvanceAmount.
RLOC Utilization Base Rate Margins LIBOR Rate Margins Less than 33.3% 0.50 % 1.50 %Greater than or equal to 33.3%, but less than 66.6% 0.75 % 1.75 %Greater than or equal to 66.6% 1.00 % 2.00 % At December 31, 2018, the interest rate on the ABL Facility was 6.00%. The ABL Facility is secured by all of the Company’s U.S.-based accounts receivable, parts supplies, cash and cash equivalentsexcluding proceeds of Term Loan Facility, securities and deposit accounts and other general assets not included in the Term LoanFacility collateral. The ABL Facility contains (i) a financial covenant similar to the consolidated total leverage ratio required under the Term LoanFacility (but, as amended on August 31, 2017, in any event requiring a leverage ratio of less than or equal to 4.25 to 1.00 for thefiscal quarter, stepping down to 3.75 to 1.00 on March 31, 2021, in the same increments as the Term Loan Facility noted above) and(ii) during any period after a default or event of default or after excess availability falling below the greater of (x) $15.0 million and(y) 20% of the maximum credit amount, continuing until such time as no default or event of default has existed and excessavailability has exceeded such amounts for a period of 60 consecutive days, a financial covenant requiring the Company to maintaina minimum consolidated fixed charge coverage ratio of 1.00x, tested on a quarterly basis. The Company’s fixed charge coverageratio is defined as the ratio of (1) consolidated adjusted EBITDA minus unfinanced capital expenditures, cash taxes and cashdividends or distributions, to (2) the sum of all funded debt payments for the four quarter period then ending (with customary add-backs permitted to consolidated adjusted EBITDA).
F-29

Table of Contents
DASEKE, INC. AND SUBSIDIARIES
NOTES TO CONSOLIDATED FINANCIAL STATEMENTS
The ABL Facility contains affirmative and negative covenants similar to those in the Term Loan Facility, together with suchadditional terms as are customary for a senior secured asset-based revolving credit facility. As of December 31, 2018, the Company was in compliance with all covenants contained in the Term Loan and ABL Facilities. Equipment Term Loans and Mortgages As of December 31, 2018, the Company had term loans collateralized by equipment in the aggregate amount of$190.7 million with 40 lenders (Equipment Term Loans). The Equipment Term Loans bear interest at ratesranging from 1.5% to 10.7%, require monthly payments of principal and interest and mature at various datesthrough January 2028. Certain of the Equipment Term Loans contain conditions, covenants, representations andwarranties, events of default, and indemnification provisions applicable to the Company and certain of itssubsidiaries that are customary for equipment financings, including, but not limited to, limitations on the incurrenceof additional debt and the prepayment of existing indebtedness, certain payments (including dividends and otherdistributions to persons not party to its credit facility) and transfers of assets. The Company had a construction loan with a balance of $8.8 million incurred to finance the construction of a new headquarters andterminal in Arlington, Washington which was repaid in February 2017 in conjunction with the Business Combination. See Note 3 foradditional details on the Business Combination. The construction loan was collateralized by such property and buildings. The initialprincipal amount on February 19, 2015 of $7.8 million was increased on April 26, 2016 to $8.8 million. The construction loan earnedinterest at 3.25% payable monthly. As of December 31, 2018, the Company has a bank mortgage loan with a balance of $3.9 million incurred to finance the constructionof the headquarters and terminal in Redmond, Oregon. The mortgage loan is collateralized by such property and buildings. Themortgage is payable in monthly installments of $15,776, including interest at 3.7% through November 2020. The interest rate and monthly payments will be adjusted on November 1, 2020 to a rate of 2.5%, plus the three-year advance ratepublished by the Federal Home Loan Bank of Seattle in effect 45 days prior to November 1, 2020 (which will not be less than 3.7%).The bank mortgage loan matures November 1, 2023. Real Estate Term Loan In April 2016, the Company refinanced $14.2 million of its Line of Credit with bank debt (Real Estate Term Loan) utilizing ninewholly-owned real estate assets which previously served as collateral on the PNC Term Loan. The Real Estate Term Loan wassubordinate to the PNC Credit Agreement and Equipment Term Loans and was due in monthly installments of $59,109 (based on 20year amortization schedule), plus applicable interest at either (a) the Libor Rate (as defined in the loan agreement), plus a margin of2.75%, or (b) the Default Rate (as defined in the loan agreement). The Company incurred debt issuance costs of $0.4 million, whichwere being amortized to interest expense over five years using the straight-line method. In conjunction with the BusinessCombination, the Real Estate Term Loan was repaid and all unamortized debt issuance costs written off to interest expense. See Note3 for additional details on the Business Combination.
F-30

Table of Contents
DASEKE, INC. AND SUBSIDIARIES
NOTES TO CONSOLIDATED FINANCIAL STATEMENTS
Capital Leases The Company leases certain equipment under long-term capital lease agreements that expire on various dates through May 2025. Asof December 31, 2018 and 2017, the book value of the property and equipment recorded under capital leases was $16.6 million and$7.0 million, net of accumulated depreciation of $7.8 million and $5.8 million, respectively. Depreciation expense related to propertyand equipment under capital lease was $2.9 million, $2.6 million and $7.0 million for the years ended December 31, 2018, 2017 and2016, respectively. Main Street Capital Corporation In 2013, Main Street Capital Corporation (Main Street) loaned the Company $20.0 million under a senior subordinated secured termloan (the Main Street Loan). The Main Street Loan was subordinate to the PNC Credit Agreement and Equipment Term Loans.Interest payments were due monthly through maturity at the rate of 12% per annum. Paid-in kind (PIK) interest, at a rate of 2.5% perannum, could have been paid monthly or accrued and added to the principal balance quarterly, at the option of the Company. For theyears ended December 31, 2017, $0.1 million of accrued PIK interest was added to the principal balanc e. In conjunction withBusiness Combination, the Main Street Loan was repaid in February 2017. See Note 3 for additional details on the BusinessCombination. Prudential Capital Partners In 2013, the Company issued senior secured subordinated promissory notes in the initial aggregate principal amount of $20.0 million(PCP Subordinated Notes) to Prudential Capital Partners IV, L.P., Prudential Capital Partners (Parallel Fund) IV, L.P. and PrudentialCapital Partners Management Fund IV, L.P. (collectively, the PCP Investors) pursuant to the Securities Purchase Agreement, datedas of November 12, 2013, by and among the Company, certain of its subsidiaries and the PCP Investors. The PCP SubordinatedNotes were subordinate to the PNC Credit Agreement and Equipment Term Loans. Interest payments were due monthly throughmaturity at the rate of 12% per annum. PIK interest, at a rate of 2.5% per annum, could have been paid monthly or accrued and addedto the principal balance quarterly, at the option of the Company. For the years ended December 31, 2017, $0.1 million of accruedPIK interest was added to the principal balance. In conjunction with Business Combination, the PCP Subordinated Notes were repaidin February 2017. See Note 3 for additional details on the Business Combination. The Main Street Loan and the PCP Subordinated Notes (Subordinated Debt) were collateralized by all assets of the Company, exceptthose assets collateralizing the Equipment Term Loans. The Main Street Loan and the PCP Subordinated Notes contained certainfinancial covenants, including a minimum fixed charge coverage ratio, a senior secured debt to consolidated EBITDA ratio and afunded debt to consolidated EBITDA ratio. Additionally, they contained negative covenants limiting, among other things, additionalindebtedness, capital expenditures, transactions with affiliates, additional liens, sales of assets, dividends, investments and advances,prepayments of debt, mergers and acquisitions, and other matters customarily restricted in such agreements. The Main Street Loanand the PCP Subordinated Notes were subject to a make-whole payment of 5.0% of the prepayment amount if such prepayment wasmade before the third anniversary of the agreements. LST Seller As part of the consideration paid to the seller of Lone Star Transportation, LLC and affiliates (LST), Daseke Lone Star, Inc. (asubsidiary of the Company) issued $22.0 million of subordinated notes (the LST Seller Notes). The LST Seller Notes bore interest at10% payable monthly and were subordinate to the PNC Credit Agreement, Main Street Loan and PCP Subordinated Notes. Inconjunction with the Business Combination, the LST Seller Notes were repaid in February 2017. See Note 3 for additional details onthe Business Combination.
F-31

Table of Contents
DASEKE, INC. AND SUBSIDIARIES
NOTES TO CONSOLIDATED FINANCIAL STATEMENTS
DTR Sellers As part of the consideration paid to the sellers of Davenport Transport & Rigging, LLC, LST issued $1.0 million of subordinatednotes (the DTR Seller Notes). The DTR Seller Notes bore interest at 5% payable monthly and were subordinate to the PNC CreditAgreement, Main Street Loan and PCP Subordinated Notes. In conjunction with Business Combination, the DTR Seller Notes wererepaid in February 2017. See Note 3 for additional details on the Business Combination. BHE Sellers As part of the consideration paid to the sellers of Bulldog Hiway Express (BHE), the Company issued $2.0 million of subordinatednotes (the BHE Seller Notes). The BHE Seller Notes bore interest at 7% payable monthly. On December 19, 2016, a portion of theoutstanding principal amount under the BHE Seller Notes was forgiven in exchange for the payment by the Company of certainpension liabilities of BHE. The BHE Seller Notes were subordinate to the PNC Credit Agreement and the Main Street Loan and thePCP Subordinated Notes. In conjunction with Business Combination, the BHE Seller Notes were repaid in February 2017. See Note3 for additional details on the Business Combination. Future principal payments on long-term debt are as follows (in thousands):
Year ending December 31, Term Loan
Facility
EquipmentTermLoans
Capital Leases Total
2019 $ 4,985 $ 53,703 $ 5,669 $ 64,3572020 2,500 42,660 4,537 49,6972021 2,500 34,952 4,354 41,8062022 2,500 24,863 2,367 29,7302023 2,500 21,486 2,899 26,885Thereafter 478,493 13,045 834 492,372 Total minimum lease payments 20,660 Loan amount attributable to interest (2,432) (2,432) Total (Present value of minimum lease payments on capital leases) $ 493,478 $ 190,709 18,228 $ 702,415Less current portion (4,848) Long-term capital leases $ 13,380
F-32

Table of Contents
DASEKE, INC. AND SUBSIDIARIES
NOTES TO CONSOLIDATED FINANCIAL STATEMENTS
NOTE 11 – INCOME TAXES The components of the Company’s United States and foreign provision for income taxes were as follows for the years endedDecember 31 (in thousands):
2018 2017 2016Current: Federal $ (46) $ (47) $ (70)State 3,960 1,258 582Total current taxes 3,914 1,211 512
Deferred: Federal (10,918) (51,388) (1,139)State (7,423) (1,863) 790Foreign (1,495) (242) —
Total deferred taxes (19,836) (53,493) (349)Provision (benefit) for income taxes $ (15,922) $ (52,282) $ 163 A reconciliation between the effective income tax rate and the United States statutory income tax rate for the years ended December31, 2018, 2017 and 2016 is as follows (in thousands):
2018 2017 2016 Income tax expense (benefit) at United States statutory income tax rate $ (4,443) $ (8,850) $ (4,241) Federal income tax effects of: State income tax expense (2,736) (333) 370 Foreign taxes — (242) — Foreign tax rate differential (293) 107 — Per diem and other nondeductible expenses 4,100 3,198 3,434 Cumulative effect of change in effective tax rate (12,611) (46,068) 522 Tax credits (46) (47) (70) Other 107 (47) 148
Provision (benefit) for income taxes $ (15,922) $ (52,282) $ 163 Effective tax rate 75.4 % 206.8 % (1.3)% The decrease in the effective tax rate for the year ended December 31, 2018 compared to the year ended December 31, 2017 isprimarily the result of a one-time tax benefit related to changes in future tax rates on net deferred tax liabilities as a result of theenactment of the Tax Cuts and Jobs Act (TCJA) in December 2017. The increase in the effective tax rate for the year endedDecember 31, 2017 compared to the year ended December 31, 2016 is primarily the result of a one-time tax benefit related tochanges in future tax rates on net deferred tax liabilities as a result of the enactment of the TCJA in December 2017. United States Tax Reform On December 22, 2017, the United States government enacted the TCJA comprehensive tax reform legislation . Effective January2018, the TCJA, among other things, reduces the marginal U.S. corporate income tax rate from 35% to 21%, limits the deductibilityof interest expenses, limits the deduction for net operating losses, eliminates net operating loss carrybacks and modifies or eliminatesmany business deductions and credits. The TCJA also includes international provisions, which generally establish a territorial-stylesystem for taxing foreign source income of domestic multinational corporations and imposes a mandatory one-time transition tax onundistributed international earnings. Financial statement impacts include adjustments for, among other things, the remeasurement of deferred tax assets and liabilities.United States GAAP accounting for income taxes requires that the Company record the impacts of any tax law change on deferredincome taxes in the quarter that the tax law change is enacted. The impact of the TCJA in the
F-33

Table of Contents
DASEKE, INC. AND SUBSIDIARIES
NOTES TO CONSOLIDATED FINANCIAL STATEMENTS
Company’s earnings for the year ended December 31, 2018 was related to the 2017 Acquisitions which finalized purchase accountingin 2018. Accordingly, the Company was able to assess the impact of the TCJA and has recorded an income tax benefit for thereduction in net deferred income tax liabilities of approximately $12.5 million due to the remeasurement of net United States deferredtax liabilities at the lower 21% United States federal corporate income tax rate. Additionally, the Company has completed itsevaluation of stock compensation and 162(m) limitations and unremitted foreign earnings resulting in no adjustment. The effects of temporary differences that give rise to significant elements of deferred tax assets and liabilities at December 31, 2018and 2017 were as follows (in thousands):
2018 2017Deferred tax assets Accrued expenses $ 5,235 $ 3,977Vacation accrual 610 527Accounts receivable 417 103Net operating losses 31,694 11,199Interest expense limitation 1,313 —Deferred start-up costs 1,405 1,502Stock based compensation 1,303 452Sales-type leases — 1,233Foreign assets 1,714 — Total deferred tax assets 43,691 18,993 Deferred tax liabilities Sales-type leases (2,263) —Prepaid expenses (4,061) (2,700)481(a) adjustment (1,719) (2,213)Intangible assets (44,056) (17,246)Property and equipment (111,726) (83,642)Foreign liabilities (6,696) (3,626) Total deferred tax liabilities (170,521) (109,427) Net deferred tax liability $ (126,830) $ (90,434)
At December 31, 2018, the Company has U.S. federal and state net operating loss carry forwards of approximately $113.5 millionand $64.1 million, respectively, which begin to expire in 2023. The Company had no uncertain tax positions as of December 31, 2018 and 2017. The Company is no longer subject to United Statesfederal income tax examinations by tax authorities for years before 2015, however, federal net operating loss carry forwards fromyears prior to 2015 remain subject to review and adjustment by tax authorities. The Company is no longer subject to state income taxexaminations by tax authorities for years before 2014. NOTE 12 – RELATED PARTY TRANSACTIONS Related Party Debt As described in Note 10, the Company issued Subordinated Debt to Main Street and PCP Investors. Both lenders were stockholdersof the Company. For the years ended December 31, 2017 and 2016, Main Street received interest payments of $0.5 million and $2.6million, respectively. Accrued interest was $0.4 million as of December 31, 2016. For the years ended December 31, 2017 and 2016,PCP Investors received interest payments of $0.5 million and $2.6 million, respectively. Accrued interest was $0.4 million as ofDecember 31, 2016. In conjunction with the Business Combination,
F-34

Table of Contents
DASEKE, INC. AND SUBSIDIARIES
NOTES TO CONSOLIDATED FINANCIAL STATEMENTS
the Main Street Loan and the PCP Subordinated Notes were both repaid in February 2017. See Note 3 for additional details on theBusiness Combination. As disclosed in Note 10, the LST seller received subordinated notes as partial consideration. Interest paid to the LST seller was $0.4and $2.2 million for the year ended December 31, 2017 and 2016, respectively. In conjunction with the Business Combination, theLST Seller Notes were repaid in February 2017. See Note 3 for additional details on the Business Combination. As disclosed in Note 10, the BHE Sellers received subordinated notes as partial consideration. Interest paid to the BHE sellers was$0.1 million for the year ended December 31, 2016. Interest paid for the year ended December 31, 2017 was immaterial. Inconjunction with Business Combination, the BHE Seller Notes were repaid in February 2017. See Note 3 for additional details on theBusiness Combination. Related Party Leases The Company leases certain office facilities, terminals and revenue equipment from entities owned or partially owned bystockholders or employees on month-to-month and long term operating leases. Total lease expense related to these leases was $4.7million, $2.9 million and $0.9 million for the years ended December 31, 2018, 2017 and 2016, respectively. Future minimum leasepayments under non-cancelable related party operating leases are as follows (in thousands):
Revenue Office andYear ending December 31, Equipment Terminals2019 $ 406 $ 4,3142020 390 4,1832021 305 3,9592022 25 3,8902023 — 3,433Thereafter — 13,043Total $ 1,126 $ 32,822
Other Related Party Transactions An employee and stockholder has a 1% investment in an entity that is also a Company vendor. Total amounts paid to this vendor forproduct and subscription purchases were approximately $0.6 million, $0.6 million and $0.8 million for the years ended December 31,2018, 2017 and 2016, respectively. Amounts due to the vendor as of December 31, 2018 and 2017 totaled approximately $10,000 and$10,000, respectively. The Company does business with an entity in which two employees, who are also stockholders, are minorityowners. Revenue received from this customer totaled approximately $0.7 million, $0. 4 million and $0.5 million forthe years ended December 31, 2018, 2017 and 2016, respectively. Accounts receivable due from this entity totaledapproximately $51,000 and $53,000 as of December 31, 2018 and 2017, respectively. The Company sold equipment to an entity partially owned by an employee and stockholder for proceeds of $1.0 million with a netbook value of $0.8 million, realizing a gain of $0.2 million for the year ended December 31, 2018. There were no such transactionsfor the years ended December 31, 2017 and 2016. Additionally, the Company does business with a carrier owned by a stockholder’s spouse. Revenue received from this carrier totaledapproximately $0.1 and $0.2 million for the years ended December 31, 2018 and 2017. There was no revenue received from thiscarrier for the year ended December 31, 2016. Accounts receivable due from this entity totaled approximately $0.1 million as ofDecember 31, 2018. There was no accounts receivable due as of December 31, 2017.
F-35

Table of Contents
DASEKE, INC. AND SUBSIDIARIES
NOTES TO CONSOLIDATED FINANCIAL STATEMENTS
NOTE 13 – STOCKHOLDERS’ EQUITY Common Stock Common stock has voting rights – one vote for each share of common stock. On September 19, 2017, the Company and certain stockholders of the Company (the Selling Stockholders) entered into anunderwriting agreement (the Underwriting Agreement) with Stifel, Nicolaus & Company, Incorporated and Cowen and Company,LLC, as representatives of the several underwriters named therein (collectively, the Underwriters), in connection with anunderwritten public offering (the Offering) of 5,292,000 shares of the Company’s common stock, par value $0.0001 per share,including 4,882,167 shares of common stock to be sold by the Company and 409,833 shares of common stock to be sold by theSelling Stockholders, at a price to the public of $12.00 per share ($11.34 per share net of underwriting discounts and commissions).Pursuant to the Underwriting Agreement, the Company granted the Underwriters a 30-day option to purchase up to an additional793,800 shares of common stock, which was exercised in full on September 20, 2017 and closed simultaneously with the Offering onSeptember 22, 2017. Net proceeds received by the Company from its sale of 5,675,967 shares of common stock were approximately$63.6 million, after deducting underwriting discounts and commissions and estimated offering expenses payable by the Company. Asdescribed in the prospectus supplement, dated September 19, 2017, filed with the SEC on September 20, 2017, the Company used thenet proceeds from the Offering for general corporate purposes, which may including, among other things, working capital, capitalexpenditures, debt repayment or refinancing or the financing of possible future acquisitions. On February 14, 2018, the Company and one of the Company’s stockholders entered into an underwriting agreement with Cowenand Company, LLC and Stifel, Nicolaus & Company, Incorporated, as representatives of the several underwriters named therein, inconnection with an underwritten public offering of 7,500,000 shares of the Company’s common stock, at a price to the public of$10.60 per share. Pursuant to the underwriting agreement, the Company granted the underwriters a 30-day option to purchase up toan additional 1,125,000 shares of common stock, which was exercised in full on February 16, 2018 and closed simultaneously withthe offering on February 20, 2018. Net proceeds received by the Company were approximately $84.4 million, after deductingunderwriting discounts and commissions and estimated offering expenses payable by the Company. The Company has used andintends to continue to use the net proceeds from the offering for general corporate purposes, including, among other things, workingcapital, capital expenditures, debt repayment or refinancing or the financing of possible future acquisitions. On June 1, 2018, after having met the earnout provisions contained in the Merger Agreement, the Company issued 5,000,000 sharesof the Company’s common stock, par value $0.0001 per share, pro rata among the Private Daseke Stockholders (Earnout Shares). The Earnout Shares were issued in reliance upon an exemption from the registration requirements of the Securities Act of 1933, asamended (the Securities Act), pursuant to Section 4(a)(2) thereof, which exempts transactions by an issuer not involving any publicoffering on the basis that the securities were offered and sold in a non-public offering to “accredited investors” (as defined inRule 501(a) of Regulation D under the Securities Act). Private Daseke engaged a purchaser representative to serve as the purchaserrepresentative for two Private Daseke Stockholders who were not “accredited investors,” which purchaser representative met all ofthe conditions set forth in Rule 501(i) of Regulation D, as required to comply with applicable federal securities laws in connectionwith the issuance of shares of the Company’s common stock to these two Private Daseke Stockholders pursuant to the MergerAgreement. On June 6, 2018, as part of the consideration paid for the Aveda acquisition, the Company issued 1,612,979 shares of Dasekecommon stock valued at $15.4 million. See Note 4 for additional details about the Aveda acquisition. On July 1, 2018, as part of the consideration paid for the Kelsey Trail acquisition, the Company issued 95,859 shares of Dasekecommon stock valued at $0.9 million. See Note 4 for additional details about the Kelsey Trail acquisition.
F-36

Table of Contents
DASEKE, INC. AND SUBSIDIARIES
NOTES TO CONSOLIDATED FINANCIAL STATEMENTS
On August 1, 2018, as part of the consideration paid for the Builders acquisition, the Company issued 399,530 shares of Dasekecommon stock valued at $3.4 million. See Note 4 for additional details about the Builders acquisition. As of December 31, 2018, the Company has approximately 1.5 million shares of common stock reserved for future issuances of stockoptions and restricted stock units under the Company’s 2017 Omnibus Incentive Plan. See Note 14 for additional details about theCompany’s stock-based compensation plan. Preferred Stock At the Closing, the Company issued 650,000 shares of Series A Preferred Stock for cash of $65.0 million. Proceeds from the saleswere part of the consideration received as part of a recapitalization and reverse acquisition completed in the Business Combination.See Note 3 for additional details about the Business Combination. The par value of Series A Preferred Stock is $0.0001 per share.Additional features of this preferred stock are as follows: Under the Certificate of Designations, Preferences, Rights and Limitations of the Series A Preferred Stock (the Certificate ofDesignations), each share of Series A Preferred Stock will be convertible, at the holder’s option at any time, initially intoapproximately 8.6957 shares of the Company’s common stock (assuming a conversion price of approximately $11.50 per share),subject to specified adjustments as set forth in the Certificate of Designations. If any holder elects to convert its Series A PreferredStock after the seven-year anniversary of the issue date, if the then-current Conversion Price (as defined in the Certificate ofDesignations) exceeds the Weighted Average Price (as defined in the Certificate of Designations) for the common stock during anyten consecutive Trading Days (as defined in the Certificate of Designations), at its option by delivery of a Notice of Conversion inaccordance with Section 8(b) of the Certificate of Designations no later than five business days following such tenth consecutiveTrading Day, to convert any or all of such holder’s shares of Series A Preferred Stock into, at the Company’s sole discretion, eithercommon stock, cash or a combination of common stock and cash; provided, that the Company shall provide such converting holdernotice of its election within two Trading Days of receipt of the Notice of Conversion; provided further, that in the event the Companyelects to issue common stock for all or a portion of such conversion, the Conversion Rate for such conversion (subject to thelimitations set forth in Section 11 of the Certificate of Designations) shall mean the quotient of the Liquidation Preference (as definedin the Certificate of Designations) divided by the average Weighted Average Price for the common stock during the 20 consecutiveTrading Days commencing on the Trading Day immediately following the Trading Day on which the Company provided such notice.If the Company does not elect a settlement method prior to the deadline set forth in the Certificate of Designations, the Companyshall be deemed to have elected to settle the conversion entirely in common stock. Based on the assumed conversion rate, a total of5,652,173 shares of Common Stock would be issuable upon conversion of all of the currently outstanding shares of Series APreferred Stock. On or after the third anniversary of the initial issuance date but prior to the fifth anniversary of the initial issuance date, the Companywill have the right, at its option, to give notice of its election to cause all outstanding shares of the Series A Preferred Stock to beautomatically converted into shares of the Company’s common stock at the then-effective conversion rate, if the Weighted AveragePrice of Company’s common stock equals or exceeds 140% of the then-current conversion price for at least 20 trading days (whetheror not consecutive) in a period of 30 consecutive trading days. On or after the fifth anniversary of the initial issuance date but prior tothe seventh anniversary of the initial issuance date, the Company will have the right, at its option, to give notice of its election tocause all outstanding shares of the Series A Preferred Stock to be automatically converted into shares of Company’s common stock atthe then-effective conversion rate, if the Weighted Average Price of Company’s common stock equals or exceeds 115% of the then-current conversion price for at least 20 trading days (whether or not consecutive) in a period of 30 consecutive trading days. On orafter the seventh anniversary of the initial issuance date, the Company will have the right, at its option, to give notice of its election tocause all outstanding shares of the Series A Preferred Stock to be automatically converted into shares of Company’s common stock atthe then-effective conversion rate, if the Weighted Average Price of Company’s common stock equals or exceeds the then-currentconversion price for at least 10 consecutive trading days. If the Company undergoes certain fundamental
F-37

Table of Contents
DASEKE, INC. AND SUBSIDIARIES
NOTES TO CONSOLIDATED FINANCIAL STATEMENTS
changes (as more fully described in the Certificate of Designations but including, among other things, certain change-in-controltransactions, recapitalizations, asset sales and liquidation events), each outstanding share of Series A Preferred Stock may, within 15days following the effective date of such fundamental change and at the election of the holder, be converted into Company’scommon stock at a conversion rate (subject to certain adjustments) equal to (i) the greater of (A) the sum of the conversion rate onthe effective date of such fundamental change plus the additional shares received by holders of Series A Preferred Stock followingsuch fundamental change (as set forth in the Certificate of Designations) and (B) the quotient of (x) $100.00, divided by (y) thegreater of (1) the applicable holder stock price and (2) 66 2/3% of the closing sale price of the Company’s common stock on the issuedate plus (ii) the number of shares of Company’s common stock that would be issued if any and all accumulated and unpaiddividends were paid in shares of Company’s common stock. The Series A Preferred Stock contains limitations that prevent the holders thereof from acquiring shares of the Company’s commonstock upon conversion that would result in (i) the number of shares beneficially owned by such holder and its affiliates exceeding9.99% of the total number of shares of the Company’s common stock then outstanding or (ii) the Series A Preferred Stock beingconverted into more than 19.99% of the shares of the Company’s common stock outstanding on the initial issue date of the Series APreferred Stock (subject to appropriate adjustment in the event of a stock split, stock dividend, combination or other similarrecapitalization) without, in the latter instance, stockholder approval of such issuance. Additional features of the Series A Preferred Stock are as follows:
a. Liquidation – In the event of liquidation, holders of Series A Preferred Stock have preferential rights to liquidationpayments over holders of common stock. Holders of Series A Preferred Stock shall be paid out of the assets of theCompany at an amount equal to $100 per share plus all accumulated and unpaid dividends.
b. Dividends – Dividends on the Series A Preferred Stock are cumulative at the Dividend Rate. The “Dividend Rate” isthe rate per annum of 7.625% per share of Series A Preferred Stock on the liquidation preference ($100 per share).Dividends are payable quarterly in arrears in cash or, at the Company’s election and subject to the receipt of thenecessary shareholder approval (to the extent necessary), in shares of the Company’s common stock. The Company’sboard of directors declared quarterly dividends of $0.68 per share on April 24, 2017, and $1.91 per share on July 18,2017, which were both then paid on July 28, 2017. On October 17, 2017 the Company’s board of directors declared aquarterly dividend of $1.91 per share, which was paid on October 20, 2017. On November 19, 2017 the Company’sboard of directors declared a quarterly dividend of $1.91 per share, which was paid on December 15, 2017. There wereno accrued dividends as of December 31, 2017. On February 27, 2018 the Company’s board of directors declared aquarterly dividend of $1.91 per share, which was paid on March 15, 2018. On May 22, 2018, the Company’s board ofdirectors declared a second quarterly dividend of $1.91 per share, which was paid on June 20, 2018. On August 21,2018, the Company’s board of directors declared a third quarterly dividend of $1.91 per share, which was paid onSeptember 14, 2018. On November 27, 2018, the Company’s board of directors declared a fourth quarterly dividend of$1.91 per share, which was paid on December 15, 2018. There were no accrued dividends as of December 31, 2018.
c. Voting rights – Except as required by Delaware law, holders of the Series A Preferred Stock will have no voting
rights except with respect to the approval of any material and adverse amendment to the Company’s certificate ofincorporation, and certain significant holders of Series A Preferred Stock may have approval rights with respect tocertain key economic terms of the Series A Preferred Stock, as set forth in the Certificate of Designations.
On February 27, 2017, dividends declared on 64,500 shares of Series B Preferred Stock outstanding on December 31, 2016, as ofOctober 13, 2016 and February 21, 2017 of $18.75 and $12.50 per share, respectively, were paid.
F-38

Table of Contents
DASEKE, INC. AND SUBSIDIARIES
NOTES TO CONSOLIDATED FINANCIAL STATEMENTS
In February 2017, in connection with, and immediately prior to, the Closing, 64,500 shares of issued and outstanding Series BPreferred Stock were converted into 9,301,150 shares of Private Daseke’s common stock. Private Daseke’s board of directors haddeclared a quarterly dividend on the Series B Preferred Stock of $12.50 per share on February 21, 2017, which was paid on February27, 2017. Warrants At December 31, 2018, there were a total of 35,040,658 warrants outstanding to purchase 17,520,329 shares of the Company’scommon stock. Hennessy has issued warrants to purchase its common stock which were originally issued as part of units in the IPO (the PublicWarrants). There are 19,959,902 Public Warrants outstanding. Hennessy has also issued 15,080,756 warrants (the Private PlacementWarrants) to Sponsor in a private placement that closed simultaneously with the consummation of the IPO. Each warrant entitles the registered holder to purchase one-half of one share of the Company’s common stock at a price of $5.75 perone-half of one share ($11.50 per whole share), subject to adjustment. The warrants may be exercised only for a whole number ofshares of the Company’s common stock. No fractional shares will be issued upon exercise of the warrants. The warrants will expireon February 27, 2022, five years after the completion of the Business Combination, or earlier upon redemption or liquidation. TheWarrants are listed on the NASDAQ market under the symbol DSKEW. The Company may call the Public Warrants for redemption at a price of $0.01 per warrant if, and only if, the reported last sale priceof the Company’s common stock equals or exceeds $24.00 per share for any 20 trading days within a 30-trading day period endingon the third trading day prior to the date the Company sends the notice of redemption to the Public Warrant holders. NOTE 14 – STOCK-BASED COMPENSATION On February 27, 2017, the Company and Hennessy’s common stockholders approved the 2017 Omnibus Incentive Plan (the Plan),whereby the Company may grant awards of stock options, stock appreciation rights, restricted stock, restricted stock units, otherstock-based awards and performance awards. Under the Plan, the Company is authorized to issue up to 4.5 million shares of commonstock. All awards granted were authorized under the Plan. Stock Options The following table summarizes stock option grants under the Plan from February 27, 2017 through the year ended December 31,2018:
Grantee Type
# of Options Granted
Issued and Outstanding
Vesting Period
Weighted Average Exercise
Price
WeightedAverage
Grant DateFair Value
(inthousands)
Director Group 150,000 145,000 5 years $ 9.98 $ 654Employee Group 2,001,594 1,921,529 5 years $ 10.25 $ 8,907Total 2,066,529
F-39

Table of Contents
DASEKE, INC. AND SUBSIDIARIES
NOTES TO CONSOLIDATED FINANCIAL STATEMENTS
The Company’s calculations of the fair value of stock options granted during the years ended December 31, 2018 and 2017 weremade using the Black-Scholes option-pricing model. The fair value of the Company’s stock option grants were estimated utilizing thefollowing assumptions for the years ended December 31, 2018 and 2017:
2018 2017Weighted average expected life 6.5 years 6.5 yearsRisk-free interest rates 2.28% to 3.00% 1.95% to 2.23%Expected volatility 36.7% to 39.9% 40.1% to 40.6%Expected dividend yield 0.00% 0.00% Since the Company does not have a sufficient history of exercise behavior, expected term is calculated using the assumption that theoptions will be exercised ratably from the date of vesting to the end of the contractual term for each vesting tranche of awards. Risk-free interest rate is based on the U.S. Treasury yield curve for the period of the expected term of the stock option. Expected volatilityis calculated using an index of publicly traded peer companies. Stock Options A summary of option activity under the Plan as of December 31, 2018 and changes during the year ended are as follows:
Shares
Weighted Average Exercise
Price
Weighted Average
Remaining Contractual
Terms (Years)
Aggregate Intrinsic Value (in
thousands) Outstanding as of January 1, 2017 — $ — — $ —Granted 1,664,995 10.36 10.0 341Exercised — — — —Forfeited (9,000) 9.98 — 20Outstanding as of December 31, 2017 1,655,995 10.36 9.3 6,505Granted 491,095 9.81 10.0 36Exercised (5,000) 9.98 — —Forfeited (75,561) 10.46 — —Outstanding as of December 31, 2018 2,066,529 $ 10.23 8.5 $ — Exercisable as of December 31, 2017 — $ — — $ —Vested and expected to vest as of December 31, 2017 1,655,995 10.36 9.3 6,505Exercisable as of December 31, 2018 323,737 10.39 8.3 —Vested and expected to vest as of December 31, 2018 2,066,529 $ 10.23 8.5 $ — The stock options’ maximum contract term is ten years. The total weighted average fair value of options granted during the yearsended December 31, 2018 and 2017 was $2.1 million and $7.5 million, respectively. Restricted Stock Units Restricted stock units are nontransferable until vested and the holders are entitled to receive dividends with respect to the non-vestedunits. Prior to vesting, the grantees of restricted stock units are not entitled to vote the shares. Restricted stock unit awards vest inequal annual increments over the vesting period.
F-40

Table of Contents
DASEKE, INC. AND SUBSIDIARIES
NOTES TO CONSOLIDATED FINANCIAL STATEMENTS
The following table summarizes restricted stock unit grants under the Plan from June 1, 2017 through the year ended December 31,2018:
Grantee Type
# of Restricted
Stock Units
Granted Issued and
Outstanding Vesting Period
Grant Date Fair Value
(inthousands)
Director Group 31,512 31,512 1 year $ 313Employee Group 1,568,655 809,849 5 years $ 16,612Total 841,361 All stock-based compensation cost is measured at the grant date, based on the estimated fair value of the award, and is recognized ona straight-line basis as expense over the employees’ requisite service period. Forfeitures will be recorded as a cumulative adjustmentto stock-based compensation expense in the period forfeitures occur. A summary of restricted stock unit awards activity under the Plan as of December 31, 2018 and changes during the year ended are asfollows:
Units
Weighted Average Grant Date Fair Value
(Per Unit) Non-vested as of January 1, 2017 — $ —Granted 1,008,868 9.99Vested — —Forfeited (245,277) 10.01Non-vested as of December 31, 2017 763,591 9.98Granted 592,015 11.57Vested (128,130) 9.86Forfeited (386,115) 11.43Non-vested as of December 31, 2018 841,361 $ 10.44 Aggregate stock-based compensation charges, net of forfeitures, were $3.6 million and $1.9 million during the years endedDecember 31, 2018 and 2017, respectively. These expenses are included as a component of salaries, wages and employee benefits onthe accompanying consolidated statements of operations and comprehensive income (loss). As of December 31, 2018, there was $6.4million and $7.4 million of unrecognized stock-based compensation expense related to stock options and restricted stock units,respectively. This expense will be recognized over the weighted average periods of 3.6 years for stock options and 3.8 years forrestricted stock units.
NOTE 15 – DEFINED CONTRIBUTION PLAN On January 1, 2015, the Company established the Daseke, Inc. 401(k) Retirement Plan (Retirement Plan). The Retirement Plan is adefined contribution plan and intended to qualify under The Employee Retirement Income Security Act of 1974 (ERISA) provisionsof 401(k). Under the safe harbor matching requirements, the Company had expenses of approximately $3.7 million, $2.4 million and$2.2 million for the years ended December 31, 2018, 2017 and 2016, respectively. The Company sponsors defined contributionprofit-sharing plans, including 401(k) provisions for substantially all employees of acquired companies whose plans have not beenmerged into the Retirement Plan at December 31, 2018. The Company provided matching contributions on some of these plans. Totalcontribution expenses under these plans were approximately $389,000 and $153,000 for the years ended December 31, 2018 and2017. There were no such expenses for the year ended December 31, 2016.
F-41
Table of Contents
DASEKE, INC. AND SUBSIDIARIES
NOTES TO CONSOLIDATED FINANCIAL STATEMENTS
NOTE 16 – COMMITMENTS AND CONTINGENCIES Operating Leases The Company leases certain office building facilities, terminal locations and revenue equipment under non-cancelable operatingleases. Certain of the Company’s operating lease agreements contain provisions for future rent increases, free rent periods or periodsin which rent payments are reduced (abated). The total amount of rent payments due over the lease terms are charged to rent expenseon the straight-line, undiscounted method over the lease terms. Rent expense under operating leases was $35.3 million, $23.8million and $16.0 million for the years ended December 31, 2018, 2017 and 2016, respectively. Future minimum lease paymentsunder non-cancelable operating leases, including related party leases, are as follows (in thousands):
Revenue Office andYear ending December 31, Equipment Terminals2019 $ 19,533 $ 11,9192020 12,988 11,2312021 5,730 9,4702022 3,181 8,4822023 220 6,586Thereafter — 22,969Total $ 41,652 $ 70,657
Letters of Credit The Company had outstanding letters of credit at December 31, 2018 totaling approximately $14.2 million, including those disclosedin Note 10. These letters of credit cover primarily liability insurance claims. Contingencies The Company is involved in certain claims and pending litigation arising in the normal course of business. These proceedingsprimarily involve claims for personal injury or property damage incurred in the transportation of freight or for personnel matters. TheCompany maintains liability insurance to cover liabilities arising from these matters but is responsible to pay self-insurance anddeductibles on such matters up to a certain threshold before the insurance is applied. NOTE 17 – REPORTABLE SEGMENTS The Company evaluates the performance of the segments primarily based on their respective revenues and operating income.Accordingly, interest expense and other non-operating items are not reported in segment results. In addition, the Company hasdisclosed a corporate segment, which is not an operating segment and includes acquisition transaction expenses, corporate salaries,interest expense and other corporate administrative expenses and intersegment eliminations. The Company’s operating segments also provide transportation and related services for one another. Such services are generallybilled at cost, and no profit is earned. Such intersegment revenues and expenses are eliminated in the Company’s consolidatedresults. Intersegment revenues and expenses totaled $5.1 million, $3.0 million and $2.2 million for the Flatbed Solutions segment forthe years ended December 31, 2018, 2017 and 2016, respectively. Intersegment revenues and expenses totaled $8.9 million, $3.9million and $2.4 million for the Specialized Solutions segment for the years ended December 31, 2018, 2017 and 2016, respectively.
F-42

Table of Contents
DASEKE, INC. AND SUBSIDIARIES
NOTES TO CONSOLIDATED FINANCIAL STATEMENTS
The following table reflects certain financial data of the Company’s reportable segments for the years ended December 31, 2018,2017 and 2016 (in thousands):
Flatbed Specialized Solutions Solutions Corporate/ Consolidated Segment Segment Eliminations TotalsYear Ended December 31, 2018 Total revenue $ 662,003 $ 965,064 $ (13,985) $1,613,082Operating income (loss) 32,918 23,051 (34,058) 21,911Depreciation 29,937 84,337 165 114,439Amortization of intangible assets 6,162 10,481 — 16,643Interest expense 8,588 11,281 25,636 45,505Income (loss) before income tax 13,811 (7,081) (27,839) (21,109)Total assets 464,836 884,189 41,843 1,390,868Capital expenditures 38,181 116,020 2,085 156,286
Year Ended December 31, 2017 Total revenue $ 354,106 $ 499,132 $ (6,934) $ 846,304Operating income (loss) 18,461 15,345 (26,791) 7,015Depreciation 27,436 42,583 149 70,168Amortization of intangible assets 1,747 4,948 — 6,695Interest expense 7,110 8,425 14,021 29,556Income (loss) before income tax (835) (6,288) (18,163) (25,286)Total assets 379,475 675,838 70,355 1,125,668Capital expenditures 8,405 32,684 600 41,689
Year Ended December 31, 2016 Total revenue $ 310,440 $ 345,998 $ (4,636) $ 651,802Operating income (loss) 15,643 16,278 (21,288) 10,633Depreciation 28,523 32,820 156 61,499Amortization of intangible assets 1,922 4,079 — 6,001Interest expense 5,953 6,440 10,731 23,124Income (loss) before income tax 852 1,983 (14,951) (12,116)Total assets 283,370 282,156 4,709 570,235Capital expenditures 18,427 21,926 215 40,568
NOTE 18 – EARNINGS PER SHARE Basic earnings per common share is calculated by dividing net income available to common stockholders by the weighted averagenumber of shares of common stock outstanding during the period. Diluted earnings per share reflect the potential dilution that couldoccur if securities or other contracts to issue common stock were exercised or converted into common stock or resulted in theissuance of common stock that then shared in the Company’s earnings. For the year ended December 31, 2018 and 2017, shares of the Company’s 7.625% Series A Convertible Cumulative Preferred Stock(Series A Preferred Stock) were not included in the computation of diluted earnings per share as their effects were anti-dilutive. Forthe years ended December 31, 2016, shares of Private Daseke’s Series B Convertible Preferred Stock (Series B Preferred Stock) were not included in the computation of diluted loss per share as their effects were anti-dilutive.
F-43
Table of Contents
DASEKE, INC. AND SUBSIDIARIES
NOTES TO CONSOLIDATED FINANCIAL STATEMENTS
The following table reconciles basic weighted average common stock outstanding to diluted weighted average common stockoutstanding:
Year Ended December 31, (In thousands except per share data) 2018 2017 2016Numerator Net income (loss) $ (5,187) $ 26,996 $ (12,279)Preferred stock dividends (4,956) (4,964) (4,770)
Net income (loss) available to common stockholders $ (10,143) $ 22,032 $ (17,049) Denominator Basic weighted average common shares outstanding 61,654,820 37,592,549 20,980,961
Effect of dilutive securities: Equivalent shares issuable upon achievement of Merger Agreement earn-out provision — 1,250,000 —Equivalent shares issuable upon exercises of stock options — 254,312 —Equivalent shares of restricted stock units — 496,840 —
Denominator for diluted earnings per share - adjusted weighted average shares andassumed conversions 61,654,820 39,593,701 20,980,961 Basic earnings (loss) per common share $ (0.16) $ 0.59 $ (0.81) Diluted earnings (loss) per common share $ (0.16) $ 0.56 $ (0.81)
NOTE 19 – QUARTERLY RESULTS (UNAUDITED) The following tables set forth certain unaudited consolidated quarterly financial data for each of the last eight quarters during ourfiscal years ended December 31, 2018 and 2017. We have derived the information from unaudited Consolidated Financial Statementsthat, in the opinion of management, reflect all adjustments (consisting only of normal recurring adjustments, except as noted)necessary for a fair presentation of such quarterly information. The second quarter of 2018 includes an impairment charge of $2.8million related to the trade names category of intangible assets and a $14.0 million deferred tax benefit to recognize deferred taxliabilities for valuations of intangible assets related to the December 2017 acquisitions, remeasured at the TCJA rate . T he fourthquarter of 2018 includes an impairment charge of $11.1 million related to one reporting unit’s carrying value exceeding its estimatedfair value. The fourth quarter of 2017 includes an adjustment for the cumulative effect of a change in the effective tax rate incompliance with the TCJA in the amount of $46.1 million. The operating results for any quarter are not necessarily indicative of theresults to be expected for any future period.
F-44
Table of Contents
DASEKE, INC. AND SUBSIDIARIES
NOTES TO CONSOLIDATED FINANCIAL STATEMENTS
2018 Quarter Ended Mar. 31 June. 30 Sep. 30 Dec. 31 (In thousands)Revenue: Freight $ 240,071 $ 272,583 $ 329,474 $ 320,065Brokerage 46,139 60,091 82,203 78,004Logistics 10,717 8,891 11,656 11,500Fuel surcharge 30,654 35,334 38,256 37,444
Total revenue 327,581 376,899 461,589 447,013Operating expenses: Salaries, wages and employee benefits 82,344 90,614 114,776 119,695Fuel 33,376 31,359 38,931 37,431Operations and maintenance 34,563 40,465 51,494 55,012Communications 699 807 920 908Purchased freight 117,724 141,582 170,548 158,749Administrative expense 12,137 13,077 16,075 17,096Sales and marketing 636 651 1,007 1,075Taxes and licenses 3,694 3,890 4,681 4,909Insurance and claims 9,184 10,428 12,738 13,476Acquisition transaction expenses 440 1,402 601 241Depreciation and amortization 25,182 31,766 36,800 37,334(Gain) loss on disposition of equipment (155) (490) (899) (1,692)Impairment — 2,840 — 11,050
Total operating expenses 319,824 368,391 447,672 455,284Total other expense 8,936 9,569 11,066 13,449Provision (benefit) for income taxes (382) (14,546) 670 (1,664)Net income (loss) (797) 13,485 2,181 (20,056)Less dividends to preferred stockholders (1,239) (1,239) (1,239) (1,239)
Net income (loss) attributable to common stockholders $ (2,036) $ 12,246 $ 942 $ (21,295)Net income (loss) per common share - Basic $ (0.04) $ 0.20 $ 0.01 $ (0.33)Net income (loss) per common share - Diluted $ (0.04) $ 0.20 $ 0.01 $ (0.33)
F-45

Table of Contents
DASEKE, INC. AND SUBSIDIARIES
NOTES TO CONSOLIDATED FINANCIAL STATEMENTS
2017 Quarter Ended Mar. 31 June. 30 Sep. 30 Dec. 31 (In thousands)Revenue: Freight $ 125,555 $ 149,654 $ 171,245 $ 186,310Brokerage 20,869 28,656 34,198 37,220Logistics — 2,700 7,871 11,503Fuel surcharge 14,010 16,313 18,008 22,192
Total revenue 160,434 197,323 231,322 257,225Operating expenses: Salaries, wages and employee benefits 50,121 58,186 64,955 76,734Fuel 19,223 20,466 24,734 29,326Operations and maintenance 23,224 28,967 35,132 31,067Communications 404 549 539 653Purchased freight 37,586 49,760 61,598 76,310Administrative expense 7,378 8,022 8,619 9,214Sales and marketing 383 555 488 539Taxes and licenses 2,281 2,611 2,963 3,200Insurance and claims 4,123 5,042 6,351 8,446Acquisition transaction expenses 445 1,037 773 1,122Depreciation and amortization 16,315 17,638 19,805 23,105(Gain) loss on disposition of equipment (200) 26 (339) (187)
Total operating expenses 161,283 192,859 225,618 259,529Total other expense 9,667 6,387 8,516 7,731Provision (benefit) for income taxes (2,770) 2,184 (2,862) (48,834)Net income (loss) (7,746) (4,107) 50 38,799Less dividends to preferred stockholders (806) (1,693) (1,225) (1,240)
Net loss available to common stockholders $ (8,552) $ (5,800) $ (1,175) $ 37,559Net loss per common share - Basic $ (0.32) $ (0.15) $ (0.03) $ 0.82Net loss per common share - Diluted $ (0.32) $ (0.15) $ (0.03) $ 0.62
F-46
Exhibit 10.12
SECOND AMENDMENT TO THE EMPLOYMENT AGREEMENT THIS SECOND AMENDMENT TO THE EMPLOYMENT AGREEMENT (the “ Amendment ”) by andbetween Daseke, Inc. a Delaware corporation (the “ Company ”) and Scott Wheeler (“ Employee ”), dated asof March 4, 2019, and effective as of January 1, 2019, amends the Employment Agreement dated February 27,2017, as amended by an amendment dated August 30, 2018, (collectively “ Agreement ”).
RECITALS
WHEREAS,Company and Employee desire to amend the Agreement in certain respects and have entered into thisAmendment for that purpose; and
NOW, THEREFORE, for good and valuable consideration, the receipt and sufficiency of which is hereby acknowledged,
Company and Employee agree as follows:
AMENDMENT
1. Incorporation of Recitals. The recitals set forth above are incorporated by reference herein, as though fully set forth at length.
2. Incorporation of Guaranty . The terms of the Agreement are incorporated by reference herein, as
though fully set forth at length. This Amendment shall be a part of the Agreement and incorporated byreference therein.
3. Amendment to Section 3(a) of the Agreement . Section 3(a) of the Agreement shall be deleted in
its entirety and replaced with the following:
Base Salary . During the Employment Period, the Company shall pay to Employee an annualized basesalary of $525,000 (the “ Base Salary ”) in consideration for Employee’s services under thisAgreement, payable in substantially equal installments in conformity with the Company’s customarypayroll practices for other senior executives as mayexist from time to time, but no less frequently than monthly. The Base Salary shall be reviewed bythe Compensation Committee of the Board (the “ Compensation Committee ”) in accordance with theCompany’s policies and practices, but no less frequently than once annually, and may be increased butnot decreased (unless agreed to in writing by Employee). To the extent applicable, the term “BaseSalary” shall include any such increases (or decreases agreed to in writing by Employee) to the BaseSalary enumerated above
4. Amendment to Section 3(b) of the Agreement . Section 3(b) of the Agreement shall be deleted in
its entirety and replaced with the following:
Employee shall be eligible for discretionary bonus compensation for each complete calendar year thatEmployee is employed by the Company hereunder (the “ Annual Bonus”) (which, for purposes of clarity will include calendar year 2017). Each Annual Bonus shall have atarget value that is not less than $275,000. The performancetargets that must be achieved in order to be eligible for certain bonus levels shall be established by theCompensation Committee annually, in its sole discretion. Each Annual Bonus, if any, shall be paid assoon as administratively feasible after the Compensation Committee certifies whether the applicableperformance targets for the applicable

calendar year to which such Annual Bonus relates (the “ Bonus Year ”) have been achieved, but in no event later than March 15 following theend of such Bonus Year. Notwithstanding anything in this Section 3(b) to the contrary, no AnnualBonus, if any, nor any portion thereof, shall be payable for any Bonus Year unless Employee remainscontinuously employed by the Company from the Effective Date through the date on which suchAnnual Bonus is paid
5. No Other Modifications
. Except as expressly amended pursuant to the terms of this Amendment, the Agreement has not beenamended in any other respect.
{Signature Page To Follow}

IN WITNESS WHEREOF, Company and Employee have executed this Amendment effective as of the date first above written. EMPLOYEE By: /s/ R. Scott Wheeler R. Scott Wheeler DASEKE, INC. By: /s/ Don R. Daseke Name: Don R. Daseke Title: Chief Executive Officer
Exhibit 10.15

Exhibit 10.15
EMPLOYMENT AGREEMENT
This Employment Agreement (“ Agreement ”) is made and entered into by and between Daseke,Inc., a Delaware corporation (the “ Company ”), and Christopher R. Easter (“ Employee ”) effective asof the January 16, 2019 (the “ Effective Date ”).
1. Employment . During the Employment Period (as defined in Section 4 ), the Companyshall employ Employee, and Employee shall serve, as Chief Operating Officer of the Company and insuch other position or positions as may be assigned from time to time by the CEO of the Company.
2. Duties and Responsibilities of Employee .
(a) During the Employment Period, Employee shall devote Employee’s full businesstime, attention and best efforts to the businesses of the Company and its direct and indirect subsidiaries(collectively, the “ Company Group ”) as may be requested by the CEO of the Company or hisdesignees from time to time. Employee’s duties shall include those normally incidental to theposition(s) identified in Section 1 , as well as such additional duties as may be assigned to Employee bythe CEO of the Company or his designees from time to time, which duties may include providingservices to other members of the Company Group in addition to the Company. Employee will beexpected to relocate to the Dallas-Ft. Worth metropolitan area but, until July 1, 2019, Employee will bepermitted to commute from his residence in Georgia, with the understanding that he will regularly workfrom the Company’s Addison, Texas office or travel on behalf of Company for at least 80% of thebusiness week.
(b) Employee may, without violating this Agreement: (i) as a passive investment,own publicly traded securities in such form or manner as shall not require any services by Employee inthe operation of the entities in which such securities are owned; (ii) engage in charitable and civicactivities, including participation in professional groups and associations; (iii) serve on other companyboards with the prior approval of the board of directors of the Company (the “ Board ”); or (iv) with theprior written consent of the Board, engage in other personal and passive investment activities, in eachcase, so long as such interests or activities do not interfere with Employee’s ability to fulfill Employee’sduties and responsibilities under this Agreement and are not inconsistent with Employee’s obligations tothe Company Group or competitive with the business of the Company Group.
(c) Employee hereby represents and warrants that Employee is not the subject of, ora party to, any employment agreement, non-competition covenant, nondisclosure agreement, or anyother agreement, obligation, restriction or understanding that would prohibit Employee from executingthis Agreement or fully performing each of Employee’s duties and responsibilities hereunder, or wouldin any manner, directly or indirectly, limit or affect any of the duties and responsibilities that may nowor in the future be assigned to Employee hereunder.
(d) Employee owes each member of the Company Group fiduciary duties (including(i) duties of loyalty and non-disclosure and (ii) such fiduciary duties that an officer of the Company hasunder applicable law), and the obligations described in this Agreement are in

addition to, and not in lieu of, the obligations Employee owes each member of the Company Groupunder statutory or common law.
3. Compensation .
(a) Base Salary . During the Employment Period, the Company shall pay toEmployee an annualized base salary of $525,000 (the “ Base Salary ”) in consideration for Employee’sservices under this Agreement, payable in substantially equal installments in conformity with theCompany’s customary payroll practices for other senior executives as may exist from time to time, butno less frequently than monthly. The Base Salary shall be reviewed by the Compensation Committee ofthe Board (the “ Compensation Committee ”) in accordance with the Company’s policies andpractices, but no less frequently than once annually, and may be increased but not decreased (unlessagreed to in writing by Employee). To the extent applicable, the term “Base Salary” shall include anysuch increases (or decreases agreed to in writing by Employee) to the Base Salary enumerated above.
(b) Annual Bonus . Employee shall be eligible for discretionary bonuscompensation for each complete calendar year that Employee is employed by the Company hereunder(the “ Annual Bonus ”) (including, for the calendar year in which the Effective Date occurs, a pro rataAnnual Bonus). Each Annual Bonus shall have a target value of $175,000. The performance targetsthat must be achieved in order to be eligible for certain bonus levels shall be established by theCompany’s Board’s Compensation C ommittee annually, in its sole discretion. Each Annual Bonus, ifany, shall be paid as soon as administratively feasible after the Compensation C ommittee certifieswhether the applicable performance targets for the applicable calendar year to which such AnnualBonus relates (the “ Bonus Year ”) have been achieved, but in no event later than May 15 following theend of such Bonus Year. Notwithstanding anything in this Section 3(b) to the contrary, no AnnualBonus, if any, nor any portion thereof, shall be payable for any Bonus Year unless Employee remainscontinuously employed by the Company from the Effective Date through the date on which suchAnnual Bonus is paid.
(c) Incentive Compensation .
(i) On or as soon as reasonably practicable after the Effective Date, theCompany shall cause Employee to be granted a stock option (the “ Initial Option ”) under andsubject to the terms of the Company’s 2017 Omnibus Incentive Plan (the “ Omnibus Plan”). The Initial Option shall: (A) cover 350,000 shares of the common stock of the Company atan exercise price per share equal to Company’s share price at 4:00PM EST on the EffectiveDate; (B) vest and become exercisable with respect to 20% of the shares covered by the InitialOption, subject to Employee’s continuous employment with the Company from such date ofgrant through each vesting date, on each of the first five annual anniversaries of such date ofgrant; and (C) subject to the provisions of Sections 6(d) and 6(g) , otherwise be subject to theterms and conditions of the Company’s standard form of Non-Qualified Stock Option AwardAgreement.
(ii) During the Employment Period, Employee shall be eligible to participatein all of the Company’s short-term and long-term incentive compensation plans, programs orarrangements made available to other senior executives, including the receipt
2

of awards under any equity incentive plan, programs or arrangements of the Company madeavailable to other senior executives, in each case, in amounts determined by the Company’sBoard’s Compensation C ommittee in its sole discretion and subject to the terms and conditionsof such plans, programs or arrangements as in effect from time to time . Nothing herein shall beconstrued to give Employee any rights to any amount or type of grant or award except asprovided in a written award agreement with Employee and approved by the CompensationCommittee.
(d) Business Expenses . Subject to Section 24 , the Company shall reimburseEmployee for Employee’s reasonable out-of-pocket business-related expenses actually incurred in theperformance of Employee’s duties under this Agreement so long as Employee timely submits alldocumentation for such reimbursement, as required by Company policy in effect from time totime. Any such reimbursement of expenses shall be made by the Company upon or as soon aspracticable following receipt of such documentation (but in any event not later than the close ofEmployee’s taxable year following the taxable year in which the expense is incurred by Employee). Inno event shall any reimbursement be made to Employee for such expenses incurred after the date ofEmployee’s termination of employment with the Company.
(e) Benefits . During the Employment Period, Employee shall be eligible toparticipate in the same benefit plans and programs in which other similarly situated senior executivesare eligible to participate, subject to the terms and conditions of the applicable plans and programs ineffect from time to time. In addition, during the Employment Period, Employee shall be entitled to fourweeks of paid vacation in accordance with the policies set forth in the employee handbook of theCompany or in any approved Company policy. The Company shall not, however, by reason of thisSection 3(e) , be obligated to institute, maintain, or refrain from changing, amending, or discontinuing,any such plan or policy, so long as such changes are similarly applicable to other similarly situatedsenior executives generally.
(f) 2018 Bonus Reimbursement . Within 60 days from the Effective Date,Company shall reimburse Employee for any lost bonus compensation resulting from Employee leavingits previous employer. Employee shall receive the difference between $130,000, and the amount ofbonus compensation, related to 2018 performance, which Employee receives from its previousemployer.
(g) Relocation Expenses . Subject to Section 24 , the Company shall reimburseEmployee for Employee’s reasonable out-of-pocket: (A) expenses associated with Employee’s travelbetween Employee’s residence in Georgia and the Company’s offices in Addison, Texas during theperiod between the Effective Date and the earlier of the date on which Employee establishes a residencein the Dallas-Ft. Worth metropolitan area or July 1, 2019 (the “Commuting Period”); (B) pre-approvedtemporary lodging expenses incurred while working in the Company’s offices in Addison, Texas duringthe Commuting Period; (C) expenses of up to $20,000 incurred by Employee in connection withEmployee’s relocation to the Dallas-Ft. Worth metropolitan area, including up to two house-huntingtrips by Employee and his immediate family, in each case, so long as Employee submits alldocumentation for such reimbursement within thirty (30) days following the date the applicable expenseis incurred by Employee, as required by Company policy in effect from time to time; (D) qualified, pre-approved moving expenses; and (E) up to $40,000 in closing expenses incurred by Employee inconnection with Employee’s purchase of a home in
3

the Dallas-Ft. Worth metropolitan area and sale of current residence. Any such reimbursement ofexpenses described in the first sentence of this subparagraph shall be made by the Company upon or assoon as practicable following receipt of supporting documentation (but in any event not later thanDecember 15 of the calendar year in which the related expense is incurred by Employee); provided,however, that in no event shall any reimbursement be made to Employee for any expenses incurred afterthe date of Employee’s termination of employment with the Company.
4. Term of Employment . The initial term of Employee’s employment under thisAgreement shall be for the period beginning on the Effective Date and ending on the fifth anniversary ofthe Effective Date (the “ Initial Term ”). On the fifth anniversary of the Effective Date and on eachsubsequent anniversary thereafter, the term of Employee’s employment under this Agreement shallautomatically renew and extend for a period of one year (each such one-year period being a “ RenewalTerm ”) unless written notice of non-renewal is delivered by either party to the other not less than sixty(60) days prior to the expiration of the then-existing Initial Term or Renewal Term, asapplicable. Notwithstanding any other provision of this Agreement, Employee’s employment pursuantto this Agreement may be terminated at any time in accordance with Section 5 . The period from theEffective Date through the expiration of this Agreement or, if sooner, the termination of Employee’semployment pursuant to this Agreement, regardless of the time or reason for such termination, shall bereferred to herein as the “ Employment Period .”
5. Termination of Employment .
(a) Company’s Right to Terminate Employee’s Employment for Cause . TheCompany shall have the right to terminate Employee’s employment hereunder at any time for“Cause.” For purposes of this Agreement, “ Cause ” shall mean:
(i) Employee’s commission of fraud, breach of fiduciary duty, theft, orembezzlement against the Company, its subsidiaries, affiliates or customers;
(ii) Employee’s willful refusal without proper legal cause to faithfully anddiligently perform Employee’s duties;
(iii) Employee’s breach of Sections 8 , 9 or 10 of this Agreement or materialbreach of any other written agreement between Employee and one or more members of theCompany Group;
(iv) Employee’s conviction of, or plea of guilty or nolo contendere to, anycrime involving harassment, moral turpitude or a felony (or state law equivalent);
(v) Employee’s willful misconduct or gross negligence in the performance ofduties to the Company that has or could reasonably be expected to have a material adverse effecton the Company;
(vi) Employee’s material breach and violation of the Company’s writtenpolicies pertaining to workplace conduct (including sexual harassment), discrimination or insidertrading; or
4

(vii) Employee’s failure to establish a residence in the Dallas-Ft. Worthmetropolitan area prior to July 1, 2019.
Provided, however, that solely with respect to the actions or omissions set forth in Section 5(a)(ii) , (iii) , (v) and (vi) , such actions or omissions must remain uncured thirty (30) days after the Board hasprovided Employee written notice of the obligation to cure such actions or omissions. For the avoidanceof doubt, the actions or omissions set forth in Section 5(a)(i) , (iv) and (vii) are not permitted to becured by Employee under any circumstances.
(b) Company’s Right to Terminate without Cause . The Company shall have theright to terminate Employee’s employment for convenience at any time and for any reason, or no reasonat all, upon written notice to Employee.
(c) Employee’s Right to Terminate for Good Reason . Employee shall have theright to terminate Employee’s employment with the Company at any time for “Good Reason.” Forpurposes of this Agreement, “ Good Reason ” shall mean:
(i) a material diminution in Employee’s position, responsibilities or duties orthe assignment of Employee to a position, responsibilities or duties of a materially lesser statusor degree of responsibility than his position, responsibilities or duties immediately following theEffective Date; or
(ii) any material breach by the Company of any provision of this Agreement.
Notwithstanding the foregoing provisions of this Section 5(c) or any other provision of this Agreementto the contrary, any assertion by Employee of a termination for Good Reason shall not be effectiveunless all of the following conditions are satisfied: (A) the condition giving rise to Employee’stermination of employment must have arisen without Employee’s consent; (B) Employee must providewritten notice to the Board of the existence of such condition(s) within thirty (30) days of the initialexistence of such condition(s); (C) the condition(s) specified in such notice must remain uncorrected forthirty (30) days following the Board’s receipt of such written notice; and (D) the date of Employee’stermination of employment must occur following the expiration of the thirty (30) day cure period, but inany event within sixty-five (65) days following the Board’s receipt of such notice.
(d) Death or Disability . Upon the death or Disability of Employee, Employee’semployment with Company shall terminate. For purposes of this Agreement, a “ Disability ” shallexist if Employee is entitled to receive long-term disability benefits under the Company’s disability planor, if there is no such plan, Employee’s inability to perform the essential functions of Employee’sposition (after accounting for reasonable accommodation, if applicable), due to an illness or physical ormental impairment or other incapacity that continues, or can reasonably be expected to continue, for aperiod in excess of one hundred-twenty (120) days, whether or not consecutive. The determination ofwhether Employee has incurred a Disability shall be made in good faith by the Board.
(e) Employee’s Right to Terminate for Convenience . In addition to Employee’sright to terminate Employee’s employment for Good Reason, Employee shall have
5

the right to terminate Employee’s employment with the Company for convenience at any time and forany other reason, or no reason at all, upon sixty (60) days’ advance written notice to the Company;provided , however , that if Employee has provided notice to the Company of Employee’s termination ofemployment, the Company may determine, in its sole discretion, that such termination shall be effectiveon any date prior to the effective date of termination provided in such notice (and, if such earlier date isso required, then it shall not change the basis for Employee’s termination of employment nor beconstrued or interpreted as a termination of employment pursuant to Section 5(b) ).
6. Obligations of the Company upon Termination of Employment .
(a) For Cause; Non-Renewal after Initial Term; Other than for Good Reason . IfEmployee’s employment is terminated during the Employment Period (i) by the Company for Causepursuant to Section 5(a) ; (ii) by notice of non-renewal of the Agreement following the completion ofthe Initial Term; or (iii) by Employee other than for Good Reason pursuant to Section 5(e) (including,for the avoidance of doubt, as a result of a non-renewal by Employee of the then-existing Initial Term orRenewal Term pursuant to Section 4) , then Employee shall be entitled to all Base Salary earned byEmployee through the date that Employee’s employment terminates (the “ Termination Date ”) and,subject to the terms and conditions of any benefit plans in which he may participate at the time of suchtermination, any post-employment benefits available pursuant to the terms of those plans; however,Employee shall not be entitled to any additional amounts or benefits as the result of such termination ofemployment.
(b) Without Cause; Good Reason . Subject to Section 6(e) below, Employee shall beentitled to certain severance consideration described below, payable at the times and in the form setforth in Section 6(d) below, if Employee’s employment is terminated during the Employment Period (x)by the Company without Cause pursuant to Section 5(b) , or (y) by Employee for Good Reason pursuantto Section 5(c) , in which case the Company shall provide Employee with a severance payment in anamount equal to the sum of Employee’s Base Salary as in effect immediately prior to the TerminationDate for a period of twenty four months (the “ Severance Payment ”).
(c) Death or Disability . If Employee’s employment is terminated during theEmployment Period due to Employee’s death or Disability pursuant to Section 5(d) , then Employeeshall be entitled to (i) all Base Salary earned by Employee through the Termination Date, (ii) subject tothe terms and conditions of any benefit plans in which he may participate at the time of suchtermination, any post-employment benefits available pursuant to the terms of those plans and (iii)Employee’s target Annual Bonus for the year in which such event occurred prorated for the period ofdays beginning on January 1 and ending on the date of death or Disability, as applicable, and payablewithin 60 days following the date of Employee’s death or termination due to Disability, as applicable;however, Employee shall not be entitled to any additional amounts or benefits as the result of suchtermination of employment.
(d) Payment Timing . Payment of the Severance Payment shall be divided intosubstantially equal installments and paid in accordance with the Company’s normal payroll proceduresover a 24-month period, following the Termination Date; provided, however , that (i) the firstinstallment of the Severance Payment shall be paid on the Company’s first regularly
6

scheduled pay date that is on or after the date that is sixty (60) days after the Termination Date (but inany event no later than March 15th of the year following the year in which the Termination Dateoccurs), and on such pay date the Company shall pay to Employee, without interest, a number of suchinstallments equal to the number of such installments that would have been paid during the periodbeginning on the Termination Date and ending on the Company’s first regularly scheduled pay date thatis on or after the date that is sixty (60) days after the Termination Date had the installments been paid ona monthly basis commencing on the Company’s first regularly scheduled pay date coincident with ornext following the Termination Date, and each of the remaining installments shall be paid on a monthlybasis thereafter, (ii) to the extent, if any, that the aggregate amount of the installments of the SeverancePayment that would otherwise be paid pursuant to the preceding provisions of this Section 6(d) afterMarch 15 of the calendar year following the calendar year in which the Termination Date occurs (the “Applicable March 15 ”) exceeds the maximum exemption amount under Treasury Regulation Section1.409A-1(b)(9)(iii)(A), then such excess shall be paid to Employee in a lump sum on the ApplicableMarch 15 (or the first business day preceding the Applicable March 15 if the Applicable March 15 is nota business day) and the installments of the Severance Payment payable after the Applicable March 15shall be reduced by such excess (beginning with the installment first payable after the Applicable March15 and continuing with the next succeeding installment until the aggregate reduction equals suchexcess), and (iii) all remaining installments of the Severance Payment, if any, that would otherwise bepaid pursuant to the preceding provisions of this Section 6(d) after December 31 of the calendar yearfollowing the calendar year in which the Termination Date occurs shall be paid with the installment ofthe Severance Payment, if any, due in December of the calendar year following the calendar year inwhich the Termination Date occurs. If Employee is eligible to receive the Severance Payment, then theCompany shall pay Employee such amount on the Company’s first regularly scheduled pay date that ison or after the date that is sixty (60) days after the sale of Employee’s residence in the Dallas-Ft. Worthmetropolitan area; provided, however , that in no event shall such payment be made before the first day,or after the last day, of the calendar year following the calendar year in which the Termination Dateoccurs.
(e) Conditions to Receipt of Severance Consideration . Notwithstanding theforegoing, Employee’s eligibility and entitlement to the Severance Payment, and any other payment orbenefit referenced in Section 6 above (collectively, the “ Severance Consideration ”) are dependentupon Employee’s (i) continued compliance with Employee’s obligations under each of Sections 8 , 9and 10 below and (ii) execution and delivery to the Company, on or before the Release Expiration Date(as defined below), and non-revocation within any time provided by the Company to do so, of a releaseof all claims in a form acceptable to the Company (the “ Release ”), which Release shall release eachmember of the Company Group and their respective affiliates, and the foregoing entities’ respectiveshareholders, members, partners, officers, managers, directors, fiduciaries, employees, representatives,attorneys, agents and benefit plans (and fiduciaries of such plans) from any and all claims, including anyand all causes of action arising out of Employee’s employment with the Company and any othermember of the Company Group or the termination of such employment, but excluding all claims toseverance payments Employee may have under this Section 6 . If the Release is not executed andreturned to the Company on or before the Release Expiration Date, and the required revocation periodhas not fully expired without revocation of the Release by Employee, then Employee shall not beentitled to any portion of the Severance Consideration. As used herein, the “ Release Expiration Date ”is that date that is twenty-one (21) days following the date upon which the Company delivers theRelease to
7

Employee (which shall occur no later than seven (7) days after the Termination Date) or, in the eventthat such termination of employment is “in connection with an exit incentive or other employmenttermination program” (as such phrase is defined in the Age Discrimination in Employment Act of 1967,as amended), the date that is forty-five (45) days following such delivery date.
7. Disclosures . Promptly (and in any event, within three business days) upon becoming awareof (a) any actual or potential Conflict of Interest or (b) any lawsuit, claim or arbitration filed against orinvolving Employee or any trust or vehicle owned or controlled by Employee, in each case, Employeeshall disclose such actual or potential Conflict of Interest or such lawsuit, claim or arbitration to theBoard. A “ Conflict of Interest ” shall exist when Employee engages in, or plans to engage in, anyactivities, associations, or interests that conflict with, or create an appearance of a conflict with,Employee’s duties, responsibilities, authorities, or obligations for and to the Company Group.
8. Confidentiality .
(a) Disclosure to and Property of the Company . All information, trade secrets,designs, ideas, concepts, improvements, product developments, discoveries and inventions, whetherpatentable or not, that are conceived, made, developed, acquired by or disclosed to Employee,individually or in conjunction with others, during the term of his employment (whether during businesshours or otherwise and whether on the Company’s premises or otherwise) that relate to the Company’sor any member of the Company Group’s business, products or services and all writings or materials ofany type embodying any such matters (collectively, “ Confidential Information ”) shall be disclosed tothe Company, and are and shall be the sole and exclusive property of the Company or itsAffiliates. Confidential Information does not, however, include any information that is available to thepublic other than as a result of any unauthorized act of Employee.
(b) No Unauthorized Use or Disclosure . Employee agrees that Employee willpreserve and protect the confidentiality of all Confidential Information and work product of theCompany and each member of the Company Group, and will not, at any time during or after thetermination of Employee’s employment with the Company, make any unauthorized disclosure of, andshall not remove from the Company premises, and will use reasonable efforts to prevent the removalfrom the Company premises of, Confidential Information or work product of the Company or itsAffiliates, or make any use thereof, in each case, except in the carrying out of Employee’sresponsibilities hereunder. Notwithstanding the foregoing, Employee shall have no obligationhereunder to keep confidential any Confidential Information if and to the extent (i) such informationbecomes generally known to the public or within the relevant trade or industry other than due toEmployee’s violation of this Section 8(b) , or (ii) disclosure thereof is specifically required by law;provided , however , that in the event disclosure is required by applicable law and Employee is makingsuch disclosure, Employee shall provide the Company with prompt notice of such requirement, andshall use commercially reasonable efforts to give such notice prior to making any disclosure so that theCompany may seek an appropriate protective order, or (iii) Employee is making a good faith report ofpossible violations of applicable law to any governmental agency or entity or is making disclosures thatare otherwise compelled by law or provided under the whistleblower provisions of applicable law.
8

(c) Remedies . Employee acknowledges that money damages would not be asufficient remedy for any breach of this Section 8 by Employee, and the Company or its Affiliates shallbe entitled to enforce the provisions of this Section 8 by terminating payments then owing to Employeeunder this Agreement and/or by specific performance and injunctive relief as remedies for such breachor any threatened breach. Such remedies shall not be deemed the exclusive remedies for a breach of thisSection 8 , but shall be in addition to all remedies available at law or in equity to the Company,including the recovery of damages from Employee and remedies available to the Company pursuant toother agreements with Employee.
(d) No Prohibition . Nothing in this Section 8 shall be construed as prohibitingEmployee, following the expiration of the 24-month period immediately following Employee’stermination of employment with the Company, from being employed by any entity engaged in theBusiness (as defined below) or engaging in any activity prohibited by Section 9 ; provided , that duringsuch employment or engagement Employee complies with his obligations under this Section 8 .
(e) Permitted Disclosures . Nothing herein will prevent Employee from: (i) makinga good faith report of possible violations of applicable law to any governmental agency or entity; or (ii)making disclosures that are protected under the whistleblower provisions of applicable law. Further, anindividual (including Employee) shall not be held criminally or civilly liable under any federal or statetrade secret law for the disclosure of a trade secret that: (A) is made (i) in confidence to a federal, stateor local government official, either directly or indirectly, or to an attorney; and (ii) solely for thepurpose of reporting or investigating a suspected violation of law; or (B) is made in a complaint or otherdocument filed in a lawsuit or other proceeding, if such filing is made under seal. An individual whofiles a lawsuit for retaliation by an employer of reporting a suspected violation of law may disclose thetrade secret to the attorney of the individual and use the trade secret information in the court proceeding,if the individual (x) files any document containing the trade secret under seal; and (y) does not disclosethe trade secret, except pursuant to court order.
9. Non-Competition; Non-Solicitation .
(a) The Company shall provide Employee access to Confidential Information for useonly during the Employment Period, and Employee acknowledges and agrees that the Company Groupshall be entrusting Employee, in Employee’s unique and special capacity, with developing the goodwillof the Company Group, and in consideration thereof and in consideration of the Company providingEmployee with access to Confidential Information and as an express incentive for the Company to enterinto this Agreement and employ Employee, Employee has voluntarily agreed to the covenants set forthin this Section 9 . Employee further agrees and acknowledges that the limitations and restrictions setforth herein, including geographical and temporal restrictions on certain competitive activities, arereasonable in all respects and not oppressive, shall not cause Employee undue hardship, and are materialand substantial parts of this Agreement intended and necessary to prevent unfair competition and toprotect the Company Group’s Confidential Information, goodwill and substantial and legitimatebusiness interests.
9

(b) Employee agrees that, during the Prohibited Period, Employee shall not,without the prior written approval of the Board, directly or indirectly, for Employee or on behalf of or inconjunction with any other person or entity of any nature:
(i) engage in or participate within the Market Area in competition with anymember of the Company Group in any aspect of the Business, which prohibition shall preventEmployee from directly or indirectly owning, managing, operating, joining, becoming an officer,director, employee or consultant of, or loaning money to, or selling or leasing equipment or realestate to or otherwise being affiliated with any person or entity engaged in, or planning to engagein, the Business in the Market Area in competition, or anticipated competition, with any memberof the Company Group;
(ii) appropriate any Business Opportunity of, or relating to, the CompanyGroup located in the Market Area;
(iii) solicit, canvass, approach, encourage, entice or induce any customer orsupplier of any member of the Company Group to cease or lessen such customer’s or supplier’sbusiness with the Company Group; or
(iv) solicit, canvass, approach, encourage, entice or induce any employee orcontractor of the Company Group to terminate his, her or its employment or engagement withany member of the Company Group.
(c) Because of the difficulty of measuring economic losses to the Company Groupas a result of a breach or threatened breach of the covenants set forth in Section 8 and in this Section 9 ,and because of the immediate and irreparable damage that would be caused to the members of theCompany Group for which they would have no other adequate remedy, the Company and each othermember of the Company Group shall be entitled to enforce the foregoing covenants, in the event of abreach or threatened breach, by injunctions and restraining orders from any court of competentjurisdiction, without the necessity of showing any actual damages or that money damages would notafford an adequate remedy, and without the necessity of posting any bond or other security. Theaforementioned equitable relief shall not be the Company’s or any other member of the CompanyGroup’s exclusive remedy for a breach but instead shall be in addition to all other rights and remediesavailable to the Company and each other member of the Company Group at law and equity. In addition,Employee acknowledges that money damages would not be a sufficient remedy for any breach of thisSection 9 by Employee, and the Company or its Affiliates shall be entitled to enforce the provisions ofthis Section 9 by terminating payments then owing to Employee under this Agreement.
(d) The covenants in this Section 9 , and each provision and portion hereof, areseverable and separate, and the unenforceability of any specific covenant (or portion thereof) shall notaffect the provisions of any other covenant (or portion thereof). Moreover, in the event any arbitrator orcourt of competent jurisdiction shall determine that the scope, time or territorial restrictions set forth areunreasonable, then it is the intention of the parties that such restrictions be enforced to the fullest extentwhich such arbitrator or court deems reasonable, and this Agreement shall thereby be reformed.
10

(e) For purposes of this Section 9 , the following terms shall have the followingmeanings:
(i) “ Business ” shall mean the business and operations that are the same orsimilar to those performed by the Company in the flatbed specialized, and open deck truckingbusiness and any other member of the Company Group for which Employee provides services orabout which Employee obtains Confidential Information during the Employment Period.
(ii) “ Business Opportunity ” shall mean any commercial, investment orother business opportunity relating to the Business.
(iii) “ Market Area ” shall mean the continental United States, Canada, andany other geographical area in which the company intends to conduct Business (to the extent theEmployee is aware of and involved in the development or the expansion of such Business) as ofthe Termination Date.
(iv) “ Prohibited Period ” shall mean the period during which Employee isemployed by any member of the Company Group and continuing for a period of 24 monthsfollowing the date that Employee is no longer employed by any member of the Company Group.
10. Ownership of Intellectual Property . Employee agrees that the Company shall own, andEmployee shall (and hereby does) assign, all right, title and interest (including patent rights, copyrights,trade secret rights, mask work rights, trademark rights, and all other intellectual and industrial propertyrights of any sort throughout the world) relating to any and all inventions (whether or not patentable),works of authorship, mask works, designs, know-how, ideas and information authored, created,contributed to, made or conceived or reduced to practice, in whole or in part, by Employee during theperiod in which Employee is or has been employed by or affiliated with the Company or any othermember of the Company Group that either (a) relate, at the time of conception, reduction to practice,creation, derivation or development, to any member of the Company Group’s businesses or actual oranticipated research or development, or (b) were developed on any amount of the Company’s or anyother member of the Company Group’s time or with the use of any member of the Company Group’sequipment, supplies, facilities or trade secret information (all of the foregoing collectively referred toherein as “ Company Intellectual Property ”), and Employee shall promptly disclose all CompanyIntellectual Property to the Company. All of Employee’s works of authorship and associated copyrightscreated during the period in which Employee is employed by or affiliated with the Company or anymember of the Company Group and in the scope of Employee’s employment shall be deemed to be“works made for hire” within the meaning of the Copyright Act. Employee shall perform, during andafter the period in which Employee is or has been employed by or affiliated with the Company or anyother member of the Company Group, all reasonable acts deemed necessary by the Company to assistthe Company Group, at the Company’s expense, in obtaining and enforcing its rights throughout theworld in the Company Intellectual Property. Such acts may include execution of documents andassistance or cooperation (i) in the filing, prosecution, registration, and memorialization of assignmentof any applicable patents, copyrights, mask work, or other applications, (ii) in the
11
enforcement of any applicable patents, copyrights, mask work, moral rights, trade secrets, or otherproprietary rights, and (iii) in other legal proceedings related to the Company Intellectual Property.
11. Arbitration .
(a) Subject to Section 11(b) , any dispute, controversy or claim between Employeeand the Company arising out of or relating to this Agreement or Employee’s employment with theCompany shall be finally settled by arbitration in Dallas, Texas before, and in accordance with the then-existing American Arbitration Association (“ AAA ”) Employment Arbitration Rules. The arbitrationaward shall be final and binding on both parties. Any arbitration conducted under this Section 11 shallbe heard by a single arbitrator (the “ Arbitrator ”) selected in accordance with the then-applicable rulesof the AAA. The Arbitrator shall expeditiously (and, if practicable, within ninety (90) days after theselection of the Arbitrator) hear and decide all matters concerning the dispute. Except as expresslyprovided to the contrary in this Agreement, the Arbitrator shall have the power to (i) gather suchmaterials, information, testimony and evidence as the Arbitrator deems relevant to the dispute beforehim or her (and each party shall provide such materials, information, testimony and evidence requestedby the Arbitrator), and (ii) grant injunctive relief and enforce specific performance. The decision of theArbitrator shall be reasoned, rendered in writing, be final and binding upon the disputing parties and theparties agree that judgment upon the award may be entered by any court of competent jurisdiction;provided , however , that the parties agree that the Arbitrator and any court enforcing the award of theArbitrator shall not have the right or authority to award punitive or exemplary damages to any disputingparty. The party whom the Arbitrator determines is the prevailing party in such arbitration shall receive,in addition to any other award pursuant to such arbitration or associated judgment, reimbursement fromthe other party of all reasonable legal fees and costs associated with such arbitration and associatedjudgment.
(b) Notwithstanding Section 11(a) , either party may make a timely application for,and obtain, judicial emergency or temporary injunctive relief to enforce any of the provisions ofSections 8 through 10 ; provided, however , that the remainder of any such dispute (beyond theapplication for emergency or temporary injunctive relief) shall be subject to arbitration under thisSection 11 .
(c) By entering into this Agreement and entering into the arbitration provisions ofthis Section 11 , THE PARTIES EXPRESSLY ACKNOWLEDGE AND AGREE THAT THEY AREKNOWINGLY, VOLUNTARILY AND INTENTIONALLY WAIVING THEIR RIGHTS TO A JURYTRIAL.
(d) Nothing in this Section 11 shall prohibit a party to this Agreement from(i) instituting litigation to enforce any arbitration award, or (ii) joining the other party to this Agreementin a litigation initiated by a person or entity that is not a party to this Agreement.
12. Defense of Claims . During the Employment Period and thereafter, upon request from theCompany, Employee shall cooperate with the Company Group in the defense of any claims or actionsthat may be made by or against any member of the Company Group that relate to Employee’s actual orprior areas of responsibility. The Company shall pay or reimburse Employee for all of Employee’sreasonable travel and other direct expenses reasonably incurred (including,
12

if applicable, lost wages), to comply with Employee’s obligations under this Section 12 , so long asEmployee provides reasonable documentation of such expenses and obtains the Company’s priorapproval before incurring such expenses.
13. Withholdings; Deductions . The Company may withhold and deduct from any benefitsand payments made or to be made pursuant to this Agreement (a) all federal, state, local and other taxesas may be required pursuant to any law or governmental regulation or ruling and (b) any deductionsconsented to in writing by Employee.
14. Indemnification . The Company agrees to indemnify Employee with respect to any acts oromissions he may in good faith commit during the period during which he is an officer, director and/oremployee of the Company or any member of the Company Group, and to provide Employee withcoverage under any directors’ and officers’ liability insurance policies, in each case on terms not lessfavorable than those provided to its other directors and officers generally, as in effect from time to time.
15. Title and Headings; Construction . Titles and headings to Sections hereof are for thepurpose of reference only and shall in no way limit, define or otherwise affect the provisionshereof. Unless the context requires otherwise, all references herein to an agreement, instrument or otherdocument shall be deemed to refer to such agreement, instrument or other document as amended,supplemented, modified and restated from time to time to the extent permitted by the provisionsthereof. All references to “dollars” or “$” in this Agreement refer to United States dollars. The words“herein”, “hereof”, “hereunder” and other compounds of the word “here” shall refer to the entireAgreement, and not to any particular provision hereof. Wherever the context so requires, the masculinegender includes the feminine or neuter, and the singular number includes the plural and conversely. Theuse herein of the word “including” following any general statement, term or matter shall not beconstrued to limit such statement, term or matter to the specific items or matters set forth immediatelyfollowing such word or to similar items or matters, whether or not non-limiting language (such as“without limitation”, “but not limited to”, or words of similar import) is used with reference thereto, butrather shall be deemed to refer to all other items or matters that could reasonably fall within the broadestpossible scope of such general statement, term or matter. Neither this Agreement nor any uncertainty orambiguity herein shall be construed or resolved against any party hereto, whether under any rule ofconstruction or otherwise. On the contrary, this Agreement has been reviewed by each of the partieshereto and shall be construed and interpreted according to the ordinary meaning of the words used so asto fairly accomplish the purposes and intentions of the parties hereto.
16. Applicable Law; Submission to Jurisdiction . This Agreement shall in all respects beconstrued according to the laws of the State of Texas without regard to its conflict of laws principlesthat would result in the application of the laws of another jurisdiction. With respect to any claim ordispute related to or arising under this Agreement, the parties hereby consent to the arbitrationprovisions of Section 11 and recognize and agree that should any resort to a court be necessary andpermitted under this Agreement, then they consent to the exclusive jurisdiction, forum and venue of thestate and federal courts located in Dallas, Dallas County, Texas.
17. Entire Agreement and Amendment . This Agreement contains the entire agreement ofthe parties with respect to the matters covered herein and supersedes all prior and
13

contemporaneous agreements and understandings, oral or written, between the parties hereto concerningthe subject matter hereof. This Agreement may be amended only by a written instrument executed byboth parties hereto.
18. Waiver of Breach . Any waiver of this Agreement must be executed by the party to bebound by such waiver. No waiver by either party hereto of a breach of any provision of this Agreementby the other party, or of compliance with any condition or provision of this Agreement to be performedby such other party, shall operate or be construed as a waiver of any subsequent breach by such otherparty or any similar or dissimilar provision or condition at the same or any subsequent time. The failureof either party hereto to take any action by reason of any breach shall not deprive such party of the rightto take action at any time.
19. Assignment . This Agreement is personal to Employee, and neither this Agreement norany rights or obligations hereunder shall be assignable or otherwise transferred by Employee. TheCompany may assign this Agreement without Employee’s consent, including to any member of theCompany Group and to any successor (whether by merger, purchase or otherwise) to all or substantiallyall of the equity, assets or businesses of the Company.
20. Notices . Notices provided for in this Agreement shall be in writing and shall be deemedto have been duly received (a) when delivered in person, (b) when sent by facsimile transmission (withconfirmation of transmission) on a business day to the number set forth below, if applicable; provided , however , that if a notice is sent by facsimile transmission after normal business hours of the recipient oron a non-business day, then it shall be deemed to have been received on the next business day after it issent, (c) on the first business day after such notice is sent by air express overnight courier service, or (d)on the second business day following deposit with an internationally-recognized overnight or second-day courier service with proof of receipt maintained, in each case, to the following address, asapplicable:
If to the Company, addressed to:
Daseke, Inc.ATTN: CEO15455 Dallas Parkway, Suite 550Addison, TX 75001
If to Employee, addressed to:
The most recent address on the Company’s records.
21. Counterparts . This Agreement may be executed in any number of counterparts,including by electronic mail or facsimile, each of which when so executed and delivered shall be anoriginal, but all such counterparts shall together constitute one and the same instrument. Eachcounterpart may consist of a copy hereof containing multiple signature pages, each signed by one party,but together signed by both parties hereto.
22. Deemed Resignations . Except as otherwise determined by the Board or as otherwiseagreed to in writing by Employee and any member of the Company Group prior to the termination
14

of Employee’s employment with the Company or any member of the Company Group, any terminationof Employee’s employment shall constitute, as applicable, an automatic resignation of Employee: (a) asan officer of the Company and each member of the Company Group; (b) from the Board, if applicable;and (c) from the board of directors or board of managers (or similar governing body) of any member ofthe Company Group and from the board of directors or board of managers (or similar governing body)of any corporation, limited liability entity, unlimited liability entity or other entity in which any memberof the Company Group holds an equity interest and with respect to which board of directors or board ofmanagers (or similar governing body) Employee serves as such Company Group member’s designee orother representative.
23. Certain Excise Taxes . Notwithstanding anything to the contrary in this Agreement, ifEmployee is a “disqualified individual” (as defined in Section 280G(c) of the Code), and the paymentsand benefits provided for in this Agreement, together with any other payments and benefits whichEmployee has the right to receive from the Company or any of its affiliates, would constitute a“parachute payment” (as defined in Section 280G(b)(2) of the Code), then the payments and benefitsprovided for in this Agreement shall be either (i) reduced (but not below zero) so that the present valueof such total amounts and benefits received by Employee from the Company or any of its affiliates shallbe one dollar ($1.00) less than three times Employee’s “base amount” (as defined in Section 280G(b)(3)of the Code) and so that no portion of such amounts and benefits received by Employee shall be subjectto the excise tax imposed by Section 4999 of the Code or (ii) paid in full, whichever produces the betternet after-tax position to Employee (taking into account any applicable excise tax under Section 4999 ofthe Code and any other applicable taxes). The reduction of payments and benefits hereunder, ifapplicable, shall be made by reducing, first, payments or benefits to be paid in cash hereunder in theorder in which such payment or benefit would be paid or provided (beginning with such payment orbenefit that would be made last in time and continuing, to the extent necessary, through to such paymentor benefit that would be made first in time) and, then, reducing any benefit to be provided in-kindhereunder in a similar order. The determination as to whether any such reduction in the amount of thepayments and benefits provided hereunder is necessary shall be made by the Company in good faith. Ifa reduced payment or benefit is made or provided and through error or otherwise that payment orbenefit, when aggregated with other payments and benefits from the Company or any of its affiliatesused in determining if a “parachute payment” exists, exceeds one dollar ($1.00) less than three timesEmployee’s base amount, then Employee shall immediately repay such excess to the Company uponnotification that an overpayment has been made. Nothing in this Section 23 shall require the Companyto be responsible for, or have any liability or obligation with respect to, Employee’s excise tax liabilitiesunder Section 4999 of the Code.
24. Section 409A .
(a) Notwithstanding any provision of this Agreement to the contrary, all provisionsof this Agreement are intended to comply with Section 409A of the Code, and the applicable Treasuryregulations and administrative guidance issued thereunder (collectively, “ Section 409A ”) or anexemption therefrom and shall be construed and administered in accordance with such intent. Anypayments under this Agreement that may be excluded from Section 409A either as separation pay due toan involuntary separation from service or as a short-term deferral shall be excluded from Section 409Ato the maximum extent possible. For purposes of Section 409A, each installment payment providedunder this Agreement shall be treated as a separate
15
payment. Any payments to be made under this Agreement upon a termination of Employee’semployment shall only be made if such termination of employment constitutes a “separation fromservice” under Section 409A.
(b) To the extent that any right to reimbursement of expenses or payment of anybenefit in-kind under this Agreement constitutes nonqualified deferred compensation (within themeaning of Section 409A), (i) any such expense reimbursement shall be made by the Company no laterthan the last day of the taxable year following the taxable year in which such expense was incurred byEmployee, (ii) the right to reimbursement or in-kind benefits shall not be subject to liquidation orexchange for another benefit, and (iii) the amount of expenses eligible for reimbursement or in-kindbenefits provided during any taxable year shall not affect the expenses eligible for reimbursement or in-kind benefits to be provided in any other taxable year.
(c) Notwithstanding any provision in this Agreement to the contrary, (i) if anypayment or benefit provided for herein would be subject to additional taxes and interest under Section409A if Employee’s receipt of such payment or benefit is not delayed until the earlier of (A) the date ofEmployee’s death or (B) the date that is six (6) months after the Termination Date (such date, the “Section 409A Payment Date ”), then such payment or benefit shall not be provided to Employee (orEmployee’s estate, if applicable) until the Section 409A Payment Date, and (ii) to the extent anypayment hereunder constitutes nonqualified deferred compensation (within the meaning of Section409A), then each such payment which is conditioned upon Employee’s execution of a release and whichis to be paid or provided during a designated period that begins in one taxable year and ends in a secondtaxable year shall be paid or provided in the later of the two taxable years. Notwithstanding theforegoing, the Company makes no representations that the payments and benefits provided under thisAgreement are exempt from, or compliant with, Section 409A and in no event shall any member of theCompany Group be liable for all or any portion of any taxes, penalties, interest or other expenses thatmay be incurred by Employee on account of non-compliance with Section 409A.
25. Clawback . To the extent required by applicable law, any applicable securities exchangelisting standards or any clawback policy adopted by the Company, the Annual Bonus and any incentivecompensation granted pursuant to Section 3(c) under this Agreement shall be subject to the provisionsof any applicable clawback policies or procedures, which clawback policies or procedures may providefor forfeiture and/or recoupment of such amounts paid or payable under this Agreement.
26. Effect of Termination . The provisions of Sections 5 , 8 - 13 and 22 and those provisionsnecessary to interpret and enforce them, shall survive any termination of this Agreement and anytermination of the employment relationship between Employee and the Company.
27. Third-Party Beneficiaries . Each member of the Company Group that is not a signatory tothis Agreement shall be a third-party beneficiary of Employee’s obligations under Sections 7 - 10 andshall be entitled to enforce such obligations as if a party hereto.
28. Severability . If an arbitrator or court of competent jurisdiction determines that anyprovision of this Agreement (or portion thereof) is invalid or unenforceable, then the invalidity orunenforceability of that provision (or portion thereof) shall not affect the validity or enforceability
16

of any other provision of this Agreement, and all other provisions shall remain in full force and effect.
[Remainder of Page Intentionally Blank; Signature Page Follows]
17

IN WITNESS WHEREOF, Employee and the Company each have caused this Agreement to
be executed and effective as of the Effective Date. EMPLOYEE By: /s/ Christopher R. Easter Name: Christopher R. Easter Title: Chief Operating Officer DASEKE, INC. By: /s/ Don R. Daseke Name: Don R. Daseke Title: Chief Executive Officer
Signature Page toEmployment Agreement
Exhibit 21.1

Exhibit 21.1
SUBSIDIARIES OF DASEKE, INC.
1.) Alabama Carriers, Inc. (Tennessee)2.) Aveda Logistics Inc. (North Dakota)
3.)Aveda Transportation and Energy Services Inc.(Federal)
4.) B.C. Hornady and Associates, Inc. (Alabama)5.) Bed Rock, Inc. (Missouri)6.) Belmont Enterprises, Inc. (Washington)7.) Big Freight Systems Inc. (Federal)8.) Boyd Bros. Transportation Inc. (Delaware)9.) Boyd Intermodal, LLC (Delaware)10.) Boyd Logistics Properties, LLC (Ohio)11.) Boyd Logistics, LLC (Alabama)12.) Bros., LLC (South Carolina)13.) BT Holdings of Memphis, Inc. (Tennessee)14.) Builders Transportation Co., LLC (Tennessee)15.) Bulldog Hiway Express, Inc. (South Carolina)16.) Bulldog Hiway Logistics, LLC (Delaware)17.) Central Oregon Truck Company, Inc. (Oregon)18.) Daseke Companies, Inc. (Delaware)19.) Daseke Fleet Services, LLC (Delaware)20.) Daseke Logistics, LLC (Delaware)21.) Daseke Lone Star, Inc. (Delaware)22.) Daseke MFS LLC (Delaware)23.) Daseke RM LLC (Delaware)24.) Daseke ST LLC (Delaware)25.) Daseke TRS LLC (Delaware)26.) Daseke TSH LLC (Delaware)27.) Daseke, Inc. (Delaware)28.) E.W. Wylie Corporation (North Dakota)29.) Fleet Movers, Inc. (Tennessee)30.) Group One, Inc. (Missouri)31.) Hodges Trucking Company, L.L.C. (Oklahoma)32.) Hornady Logistics, LLC (Delaware)33.) Hornady Transportation, LLC (Alabama)34.) Hornady Truck Line, Inc. (Alabama)35.) J. Grady Randolph, Inc. (South Carolina)36.) JD And Partners, LLC (Tennessee)37.) JGR Logistics, LLC (Delaware)38.) Kelsey-Trail Trucking Ltd. (Saskatchewan)39.) Leavitts Freight Service, Inc. (Oregon)40.) Lone Star Heavy Haul, Inc. (Texas)41.) Lone Star Project Specialists, Inc. (Texas)42.) Lone Star Transportation, LLC (Texas)43.) LST Equipment, Inc. (Texas)44.) LST Holdings, Inc. (Texas)45.) Mashburn Trucking, Inc. (Texas)46.) Mid-Seven Transportation Company, Inc. (Iowa)

47.) Moore Freight Service, Inc. (Tennessee)48.) National Rigging, Inc. (Texas)49.) NEI Transport, LLC (Texas)50.) R&R Trucking Holdings, LLC (Delaware)51.) R&R Trucking, Inc. (Mississippi)52.) Rand, LLC (Tennessee)53.) Randolph Brothers, LLC (South Carolina)54.) Roadmaster Equipment Leasing, Inc. (Delaware)55.) Roadmaster Group II, LLC (Delaware)56.) Roadmaster Specialized, Inc. (Arizona)57.) Roadmaster Transportation, Inc. (Arizona)58.) Rodan Transport (U.S.A.) Ltd. (Delaware)59.) RT & L, LLC (Tennessee)60.) Schilli Distribution Services, Inc. (Indiana)61.) Schilli Leasing, Inc. (Indiana)62.) Schilli Motor Lines, Inc. (Indiana)63.) Schilli National Truck Leasing & Sales, Inc. (Indiana)64.) Schilli Specialized Flatbed Division, Inc. (Indiana)65.) Schilli Specialized of Texas, Inc. (Texas)66.) Schilli Specialized, Inc. (Indiana)67.) Schilli Transportation Services, Inc. (Indiana)68.) SLT Express Way, Inc. (Utah)69.) Smokey Point Distributing, Inc. (Washington)70.) SPD Trucking, LLC (Delaware)71.) ST Leasing, Inc. (Missouri)72.) Steelman Transportation, Inc. (Missouri)73.) Tennessee Steel Haulers, Inc. (Tennessee)74.) TexR Assets 2, LLC (Texas)75.) TexR Assets, LLC (Texas)76.) TexR Equipment, LLC (Texas)77.) TM Transport And Leasing, LLC (Tennessee)78.) TNI (USA), Inc. (Delaware)79.) TSH International Services (Monterry, Nuevo Leon)80.) WTI Transport, Inc. (Alabama)
Exhibit 23.1

Exhibit 23.1
CONSENT OF INDEPENDENT REGISTERED PUBLIC ACCOUNTING FIRM We have issued our reports dated March 8, 2019, with respect to the consolidated financial statements and internal control overfinancial reporting included in the Annual Report of Daseke, Inc. on Form 10-K for the year ended December 31, 2018. Weconsent to the incorporation by reference of said reports in the Registration Statements of Daseke, Inc. on Forms S-3 (File No.333-218306 and File No. 333-216854) and on Form S-8 (File No. 333-218386). /s/ GRANT THORNTON LLP Dallas, TexasMarch 8, 2019
Exhibit 31.1

Exhibit 31.1CERTIFICATION PURSUANT TO SECTION 302 OF THE SARBANES-OXLEY ACT OF 2002
I, Don R. Daseke, certify that:
1. I have reviewed this Annual Report on Form 10-K for the year ended December 31, 2018 of Daseke, Inc.;
2. Based on my knowledge, this report does not contain any untrue statement of a material fact or omit to state a material factnecessary to make the statements made, in light of the circumstances under which such statements were made, notmisleading with respect to the period covered by this report;
3. Based on my knowledge, the financial statements, and other financial information included in this report, fairly present inall material respects the financial condition, results of operations and cash flows of the registrant as of, and for, the periodspresented in this report;
4. The registrant’s other certifying officer and I are responsible for establishing and maintaining disclosure controls andprocedures (as defined in Exchange Act Rules 13a-15(e) and 15d-15(e)) and internal control over financial reporting (asdefined in Exchange Act Rules 13a-15(f) and 15d-15(f)) for the registrant and have:
a) Designed such disclosure controls and procedures, or caused such disclosure controls and procedures to be designedunder our supervision, to ensure that material information relating to the registrant, including its consolidatedsubsidiaries, is made known to us by others within those entities, particularly during the period in which this report isbeing prepared;
b) Designed such internal control over financial reporting or caused such internal control over financial reporting to bedesigned under our supervision, to provide reasonable assurance regarding the reliability of financial reporting and thepreparation of financial statements for external purposes in accordance with generally accepted accounting principles;
c) Evaluated the effectiveness of the registrant’s disclosure controls and procedures and presented in this report ourconclusions about the effectiveness of the disclosure controls and procedures, as of the end of the period covered bythis report based on such evaluation;
d) Disclosed in this report any change in the registrant’s internal control over financial reporting that occurred during theregistrant’s most recent fiscal quarter (the registrant’s fourth fiscal quarter in the case of an annual report) that hasmaterially affected, or is reasonably likely to materially affect, the registrant’s internal control over financial reporting;and
5. The registrant’s other certifying officer and I have disclosed, based on our most recent evaluation of internal control overfinancial reporting, to the registrant’s auditors and the audit committee of the registrant’s board of directors (or personsperforming the equivalent functions):
a) All significant deficiencies and material weaknesses in the design or operation of internal control over financialreporting which are reasonably likely to adversely affect the registrant’s ability to record, process, summarize andreport financial information; and
b) Any fraud, whether or not material, that involves management or other employees who have a significant role in theregistrant’s internal control over financial reporting.
Date: March 8, 2019 By: /s/ Don R. Daseke Don R. Daseke Chairman of the Board of Directors and Chief Executive Officer (Principal Executive Officer)
Exhibit 31.2

Exhibit 31.2CERTIFICATION PURSUANT TO SECTION 302 OF THE SARBANES-OXLEY ACT OF 2002
I, Bharat Mahajan, certify that:
1. I have reviewed this Annual Report on Form 10-K for the year ended December 31, 2018 of Daseke, Inc.;
2. Based on my knowledge, this report does not contain any untrue statement of a material fact or omit to state a material factnecessary to make the statements made, in light of the circumstances under which such statements were made, notmisleading with respect to the period covered by this report;
3. Based on my knowledge, the financial statements, and other financial information included in this report, fairly present inall material respects the financial condition, results of operations and cash flows of the registrant as of, and for, the periodspresented in this report;
4. The registrant’s other certifying officer and I are responsible for establishing and maintaining disclosure controls andprocedures (as defined in Exchange Act Rules 13a-15(e) and 15d-15(e)) and internal control over financial reporting (asdefined in Exchange Act Rules 13a-15(f) and 15d-15(f)) for the registrant and have:
a) Designed such disclosure controls and procedures, or caused such disclosure controls and procedures to be designedunder our supervision, to ensure that material information relating to the registrant, including its consolidatedsubsidiaries, is made known to us by others within those entities, particularly during the period in which this report isbeing prepared;
b) Designed such internal control over financial reporting or caused such internal control over financial reporting to bedesigned under our supervision, to provide reasonable assurance regarding the reliability of financial reporting and thepreparation of financial statements for external purposes in accordance with generally accepted accounting principles;
c) Evaluated the effectiveness of the registrant’s disclosure controls and procedures and presented in this report ourconclusions about the effectiveness of the disclosure controls and procedures, as of the end of the period covered bythis report based on such evaluation;
d) Disclosed in this report any change in the registrant’s internal control over financial reporting that occurred during theregistrant’s most recent fiscal quarter (the registrant’s fourth fiscal quarter in the case of an annual report) that hasmaterially affected, or is reasonably likely to materially affect, the registrant’s internal control over financial reporting;and
5. The registrant’s other certifying officer and I have disclosed, based on our most recent evaluation of internal control overfinancial reporting, to the registrant’s auditors and the audit committee of the registrant’s board of directors (or personsperforming the equivalent functions):
a) All significant deficiencies and material weaknesses in the design or operation of internal control over financialreporting which are reasonably likely to adversely affect the registrant’s ability to record, process, summarize andreport financial information; and
b) Any fraud, whether or not material, that involves management or other employees who have a significant role in theregistrant’s internal control over financial reporting.
Date: March 8, 2019 By: /s/ Bharat Mahajan Bharat Mahajan Chief Financial Officer (Principal Financial Officer)
Exhibit 32.1

Exhibit 32.1CERTIFICATION PURSUANT TO 18 U.S.C. SECTION 1350,
AS ADOPTED PURSUANT TO SECTION 906
OF THE SARBANES-OXLEY ACT OF 2002
In connection with the Annual Report on Form 10-K of Daseke, Inc. (the Company) for the period ended December 31,2018 as filed with the Securities and Exchange Commission on the date hereof (the Report), I, Don R. Daseke, Chairman of theBoard of Directors and Chief Executive Officer of the Company, certify pursuant to 18 U.S.C. § 1350, as adopted pursuant to §906 of the Sarbanes-Oxley Act of 2002, that to the best of my knowledge: (1) the Report fully complies with the requirements ofSection 13(a) of the Securities Exchange Act of 1934; and (2) the information contained in the Report fairly presents, in allmaterial respects, the financial condition and results of operations of the Company.
Date: March 8, 2019 By: /s/ Don R. Daseke Name: Don R. Daseke Title: Chairman of the Board of Directors and Chief Executive Officer (Principal Executive Officer)
Exhibit 32.2

Exhibit 32.2CERTIFICATION PURSUANT TO 18 U.S.C. SECTION 1350,
AS ADOPTED PURSUANT TO SECTION 906
OF THE SARBANES-OXLEY ACT OF 2002
In connection with the Annual Report on Form 10-K of Daseke, Inc. (the Company) for the period ended December 31,2018 as filed with the Securities and Exchange Commission on the date hereof (the Report), I, Bharat Mahajan, Chief FinancialOfficer of the Company, certify pursuant to 18 U.S.C. § 1350, as adopted pursuant to § 906 of the Sarbanes-Oxley Act of 2002,that to the best of my knowledge: (1) the Report fully complies with the requirements of Section 13(a) of the SecuritiesExchange Act of 1934; and (2) the information contained in the Report fairly presents, in all material respects, the financialcondition and results of operations of the Company. Date: March 8, 2019 By: /s/ Bharat Mahajan Bharat Mahajan Chief Financial Officer (Principal Financial Officer)