Embed Size (px)
Citation preview
Table of Contents
UNITED STATES
SECURITIES AND EXCHANGE COMMISSIONWASHINGTON, D.C. 20549
____________________________________________
FORM 10-K____________________________________________
(Mark one) þ ANNUAL REPORT PURSUANT TO SECTION 13 OR 15(d) OF THE SECURITIES EXCHANGE ACT OF 1934For the fiscal year ended December 31, 2017
or
o TRANSITION REPORT PURSUANT TO SECTION 13 OR 15(d) OF THE SECURITIES EXCHANGE ACT OF 1934
For the transition period from ________________ to ________________Commission file number: 001-37444
____________________________________________FITBIT, INC.
(Exact name of registrant as specified in its charter)____________________________________________
Delaware(State or other jurisdiction of
incorporation or organization) 20-8920744
(I.R.S. Employer Identification No.)
199 Fremont Street, 14th FloorSan Francisco, California 94105
(Address of principal executive offices) (Zip Code)
(415) 513-1000(Registrant’s telephone number, including area code)
Securities registered pursuant to Section 12(b) of the Act: Title of each class
Class A Common Stock, par value $0.0001
Name of each exchange on which registered
New York Stock ExchangeSecurities registered pursuant to Section 12(g) of the Act: None
Indicate by check mark whether the registrant is a well-known seasoned issuer, as defined in Rule 405 of the Securities Act. Yes þNo o Indicate by check mark if the registrant is not required to file reports pursuant to Section 13 or Section 15(d) of the Act. Yes oNo þ
Indicate by check mark whether the registrant (1) has filed all reports required to be filed by Section 13 or 15(d) of the Securities Exchange Act of 1934 during the preceding 12 months (or forsuch shorter period that the registrant was required to file such reports), and (2) has been subject to such filing requirements for the past 90 days. Yes þNo o
Indicate by check mark whether the registrant has submitted electronically and posted on its corporate Web site, if any, every Interactive Data File required to be submitted and posted pursuantto Rule 405 of Regulation S-T (§232.405 of this chapter) during the preceding 12 months (or for such shorter period that the registrant was required to submit and post such files). Yes þNoo
Indicate by check mark if disclosure of delinquent filers pursuant to Item 405 of Regulation S-K (§229.405 of this chapter) is not contained herein, and will not be contained, to the best ofregistrant’s knowledge, in definitive proxy or information statements incorporated by reference in Part III of this Form 10-K or any amendment to this Form 10-K. þ
Indicate by check mark whether the registrant is a large accelerated filer, an accelerated filer, a non-accelerated filer, a smaller reporting company, or emerging growth company. See thedefinitions of “large accelerated filer,” “accelerated filer,” “smaller reporting company,” and “emerging growth company” in Rule 12b-2 of the Exchange Act.
Large accelerated filer þ Accelerated filer o
Non-accelerated filer o (Do not check if a smaller reporting company) Smaller reporting company o
Emerging growth company o
If an emerging growth company, indicate by check mark if the registrant has elected not to use the extended transition period for complying with any new or revised financial accountingstandards provided pursuant to Section 13(a) of the Exchange Act. o
Indicate by check mark whether the registrant is a shell company (as defined in Rule 12b-2 of the Exchange Act). Yes oNo þ
The aggregate market value of the voting and non-voting common equity held by non-affiliates of the registrant, based on the closing sale price of the registrant's Class A common stock on June30, 2017, the last business day of the registrant's most recently completed second fiscal quarter, as reported on the New York Stock Exchange, was approximately $1.0 billion.
As of February 20, 2018, there were 208,207,282 shares of the registrant’s Class A common stock outstanding and 31,289,730 shares of the registrant’s Class B common stock outstanding.
DOCUMENTS INCORPORATED BY REFERENCE
Portions of the registrant’s Definitive Proxy Statement for the Annual Meeting of Stockholders are incorporated herein by reference in Part II and Part III of this Annual Report on Form 10-K tothe extent stated herein. Such proxy statement will be filed with the Securities and Exchange Commission within 120 days of the registrant’s fiscal year ended December 31, 2017.
Table of Contents
Fitbit, Inc.Form 10-K
For the Fiscal Year Ended December 31, 2017
TABLE OF CONTENTS
Page
Part I Item 1. Business 2Item 1A. Risk Factors 8Item 1B. Unresolved Staff Comments 31Item 2. Properties 31Item 3. Legal Proceedings 31Item 4. Mine Safety Disclosures 31 Part II
Item 5.Market for Registrant's Common Equity, Related Stockholder Matters and Issuer Purchases of EquitySecurities 31
Item 6. Selected Financial Data 34Item 7. Management's Discussion and Analysis of Financial Condition and Results of Operations 38Item 7A. Quantitative and Qualitative Disclosures About Market Risk 57Item 8. Financial Statements and Supplementary Data 58Item 9. Changes in and Disagreements with Accountants on Accounting and Financial Disclosure 97Item 9A. Controls and Procedures 97Item 9B. Other Information 97 Part III Item 10. Directors, Executive Officers and Corporate Governance 98Item 11. Executive Compensation 98Item 12. Security Ownership of Certain Beneficial Owners and Management and Related Stockholder Matters 98Item 13. Certain Relationships and Related Transactions and Director Independence 98Item 14. Principal Accounting Fees and Services 98 Part IV Item 15. Exhibits, Financial Statement Schedules 99 Signatures 101
i
Table of Contents
NOTE ABOUT FORWARD-LOOKING STATEMENTS
This Annual Report on Form 10-K contains forward-looking statements, within the meaning of the Private Securities Litigation Reform Act of 1995, that involverisks and uncertainties. All statements contained in this Annual Report on Form 10-K other than statements of historical fact, including statements regarding ourfuture results of operations and financial position, our business strategy and plans, and our objectives for future operations, are forward-looking statements. Thewords “believe,” “may,” “will,” “estimate,” “continue,” “anticipate,” “intend,” “expect,” and similar expressions are intended to identify forward-lookingstatements. Forward-looking statements contained in this Annual Report on Form 10-K include, but are not limited to, statements about:
• continued investments in our business, including but not limited to growing our international sales, Fitbit Health Solutions and recurring revenueopportunities, and the impact of those investments;
• trends in our operating expenses, including personnel costs, research and development expense, sales and marketing expense, and general andadministrative expense;
• trends in our device mix, average selling price and gross margins;• competitors and competition in our markets;• our ability to anticipate and satisfy consumer preferences;• our wearable products and their market acceptance and future potential;• our ability to develop, timely introduce and effectively manage the introduction of new products and services or improve our existing products and
services, or engage or expand our user base;• our ability to expand into the healthcare sector;• potential insurance recoveries;• our ability to accurately forecast consumer demand and adequately manage inventory;• our ability to deliver an adequate supply of product to meet demand;• our ability to maintain and promote our brand and expand brand awareness;• our ability to detect, prevent, or fix defects; • our reliance on third-party suppliers, contract manufacturers and logistics providers and our limited control over such parties;• trends in our quarterly operating results and other operating metrics;• trends in revenue, costs of revenue, and gross margin;• legal proceedings and the impact of such proceedings;• the effect of seasonality on our results of operations;• our ability to attract and retain highly skilled employees;• our expectation to derive the substantial majority of our revenue from sales of devices;• growing our sales of subscription-based services ;• the impact of our acquisitions in enhancing the features and functionality of our devices;• the impact of foreign currency exchange rates;• releasing and shipping new products and services, and the timing thereof;• the sufficiency of our existing cash and cash equivalent balances and cash flow from operations to meet our working capital and capital expenditure
needs for at least the next 12 months; and• general market, political, economic and business conditions .
We caution you that the foregoing list does not contain all of the forward-looking statements made in this Annual Report on Form 10-K.
You should not rely upon forward-looking statements as predictions of future events. We have based the forward-looking statements contained in this AnnualReport on Form 10-K primarily on our current expectations and projections about future events and trends that we believe may affect our business, financialcondition, operating results, and prospects. The outcome of the events described in these forward-looking statements is subject to risks, uncertainties, and otherfactors described in the section titled “Risk Factors” and elsewhere in this Annual Report on Form 10-K. Moreover, we operate in a very competitive and rapidlychanging environment. New risks and uncertainties emerge from time to time, and it is not possible for us to predict all risks and uncertainties that could have animpact on the forward-looking statements contained in this Annual Report on Form 10-K. We cannot assure you that the results, events, and circumstancesreflected in the forward-looking statements will be achieved or occur, and actual results, events, or circumstances could differ materially from those described inthe forward-looking statements.
The forward-looking statements made in this Annual Report on Form 10-K relate only to events as of the date on which the statements are made. We undertake noobligation to update any forward-looking statements made in this Annual Report on Form 10-K to reflect events or circumstances after the date of this AnnualReport on Form 10-K or to reflect new information or the
1
Table of Contents
occurrence of unanticipated events, except as required by law. We may not actually achieve the plans, intentions, or expectations disclosed in our forward-lookingstatements and you should not place undue reliance on our forward-looking statements. Our forward-looking statements do not reflect the potential impact of anyfuture acquisitions, mergers, dispositions, joint ventures, or investments we may make.
PART I
Item 1. Business Our Vision
To make everyone in the world healthier.
Our Mission
To help people achieve positive health, wellness, and fitness outcomes by empowering them with intelligent insights, personalized guidance, and themotivation to reach their goals. Overview
Fitbit is a technology company focused on delivering health solutions that impact health outcomes. The Fitbit platform combines wearable devices withsoftware and services to give our users tools to help them reach their health and fitness goals, augmented by general purpose features that add further utility anddrive user engagement. Our wearable devices, which include health and fitness trackers and smartwatches, enable our users to view data about their daily activity,exercise and sleep in real-time. Our software and services, which include an online dashboard and mobile app, provide our users with data analytics, motivationaland social tools, and virtual coaching through customized fitness plans and interactive workouts. In addition, our software and services drive engagement and canbe leveraged to provide personalized insights. Together, our devices, services, and software have helped millions of users on their health and fitness journeys bemore active, sleep better, eat smarter, and manage their weight. Fitbit appeals to a wide spectrum of consumers by addressing key health and fitness needs withadvanced technology embedded in simple-to-use products and services.
The core of our platform is our family of wearable devices. These devices automatically track users’ daily steps, calories burned, distance traveled, andactive minutes, and display real-time feedback to encourage users to become more active in their daily lives. Most of our wearable devices also measure floorsclimbed, and sleep duration and quality, and our more advanced products track heart rate, and GPS-based information such as speed, distance, and exercise routes.Several of our devices also have more advanced features such as the ability to receive call and text notifications, and our first smartwatch, Fitbit Ionic, offerscontactless payments, on-board music, notifications, and several apps. To accompany certain of our products, we offer accessories that include wirelessheadphones, interchangeable wrist bands and frames, colored clips, device charging cables, wireless sync dongles, band clasps, and Fitbit apparel. In addition, weoffer a Wi-Fi connected scale that records weight, body fat, and BMI. We are able to enhance the functionality and features of our connected devices throughwireless updates.
Our platform also includes software that helps to encourage healthy behavior changes in three areas: activity, sleep, and nutrition. The software includes ouronline dashboard and mobile apps, which wirelessly and automatically sync with our devices. It enables users to see trends and achievements and, accessmotivational tools such as coaching and guidance, or connections to our community. We believe gamifying behaviors and providing virtual badges, real-timeprogress notifications, support, and a competition dashboard helps drive engagement. Our direct connection with our users also enables us to provide personalizedinsights. In addition, we extend the value of our platform through our open API, which enables third-party developers to create health and fitness apps that interactwith our platform. Through our open platform and our large community of users, we have established an ecosystem that includes thousands of third-party healthand fitness apps that connect with our products and enhance the Fitbit experience.
Our platform enables a wide range of people to get fit their own way, whatever their interests and goals. Our users range from people interested in improvingtheir health and fitness through everyday activities to endurance athletes seeking to maximize their performance. To address this wide range of needs, we designour devices, apps, and services to be easy to use so that they fit seamlessly into peoples’ daily lives and activities. Our users can sync their Fitbit devices with andview their dashboard on their computers and over 200 mobile devices, including iOS, Android, and Windows Phone products. This cross-platform capabilitycoupled with broad global distribution have enabled us to attract what we believe is one of the largest community of wearable device users. The size of our usercommunity increases the likelihood that our users will be able to find and engage with like-minded individuals, friends, and family, creating positive networkeffects that reinforce our growth. In addition, data from our
2
Table of Contents
large community enables us to enhance our product features, provide improved insights, and offer more valuable guidance for our users.
The Fitbit Platform
Our wearable platform is designed to enable our users to improve their health and fitness by:
• Tracking activities through our wearable devices. We empower users to live healthier, more active lifestyles by both tracking the information thatmatters most to them and providing them with real-time feedback. Our wearable devices span multiple styles, form factors, and price points, and, as aresult, address the needs of a wide range of people—from people simply looking to get fit by increasing their activity levels to endurance athletes seekingto maximize their performance. Our devices, which include both health and fitness trackers and smartwatches and our Wi-Fi connected scale, featureproprietary and advanced sensor technologies and algorithms and long battery lives. In addition, the ease of use and small, lightweight, and durabledesigns of our devices help them fit effortlessly into our users’ lifestyles.
• Learning through our online dashboard and mobile apps. We offer our users a personalized online dashboard and mobile apps that sync automaticallywith and display data from our wearable devices. We provide our users with a wide range of information and analytics, such as charts and graphs of theirprogress and the ability to log caloric intake. Both our online dashboard and mobile apps are free and work with all of our wearable devices. Ourinternally-developed software is regularly updated and enhanced, increasing the utility of our platform.
• Staying motivated through social features, notifications, challenges, and virtual badges. Our products help millions of users achieve their goals bothindividually and within the community that they choose. On an individual level, we motivate users by delivering real-time feedback, includingnotifications, leaderboard and challenge updates, and virtual badges. Our platform also offers users social features that allow them to view and participatein a social feed, receive and provide support through specific groups organized by activity or health, and engage in friendly competition. Users cansecurely share some or all of their health and fitness information on an opt-in basis with friends, family, and other parties and compete against each otheron key statistics through leaderboards and daily or multi-day fitness challenges. In addition, users can choose to share their data with thousands of third-party apps and through social networks on an opt-in basis. As users create more connections on our network, they often benefit from higher levels ofactivity.
• Improving health and fitness through goal-setting, personalized insights, premium services, and virtual coaching. Our primary goal is to help our usersimprove their health and fitness. We believe our platform assists users in changing their daily behavior, such as going for a run or walking more to reach agoal or win a challenge. We empower our users to set their own health and fitness goals and track their progress towards these goals. We also offerpremium services on a subscription basis that provide personalized insights and virtual coaching through customized fitness plans and interactive video-based exercise experiences on mobile devices and computers. Our premium services feature in-depth data analysis and personalized reports, as well asbenchmarking against peers.
Our Competitive Strengths
We believe our competitive strengths are brand, community, and data.
Brand
• Fitbit is the leading global wearables brand. We stand for health and fitness and have a trusted relationship with our users. We have a singular focus ondriving positive health outcomes by targeting activity, sleep, and nutrition.
• Broad and differentiated go-to-market strategy. We have developed a broad go-to-market strategy that reaches individuals regardless of where they shop.We sell our products in over 45,000 retail stores and in 86 countries, through our retailers’ websites, through our online store at Fitbit.com, and as part ofour corporate wellness offering. We believe the breadth and depth of our established selling channels and prominent presence in retail stores would bedifficult for a competitor to replicate.
3
Table of Contents
Community
• Broad range of wearable devices. We believe everyone’s approach to fitness is different, so we offer our users a range of wearable devices spanningmultiple styles, form factors, and price points to allow people to find the devices that fit their lifestyles and goals. In addition to our wrist-based andclippable wearable health and fitness devices, we also offer a Wi-Fi connected scale that tracks weight, body fat, and BMI. We believe the breadth of ourwearable devices provides us with a competitive advantage over our competitors, which often have a more limited line of products.
• Large and growing community and powerful network effects. We believe the size of our community of users makes it more likely that users can connectwith like-minded individuals, friends, and family and attracts many new users to our platform. Achieving meaningful health and fitness outcomes over thelong-term is difficult. We believe that access to a network of users who provide support and motivation can increase a user’s engagement with andduration on the platform, especially when that network provides positive support as observed on our social feed. Each of our users adds value to ourplatform by making progress towards their goals and syncing their data with our platform, which we leverage to provide better insights for our users. Asour community of users continues to grow, we will develop a deeper understanding of our users and expect to deliver additional value to them throughmore detailed insights and analysis. We believe the growth and scale of our user community allows users to become not only more engaged withpersonalized and relevant content, but also less likely to leave a community in which many of their friends and family are active members.
• Direct relationship and continuous communication with our users. The connectivity of our devices allows us to better understand our users’ health andfitness goals. This connectivity also allows us to communicate the most relevant analysis, features, advice, and content to our users throughout the daywith our online dashboard, mobile apps, emails, and notifications. It also allows us to focus on developing software that influences the behavior of ourusers to improve health outcomes, which can not only drive new forms of monetization, but also further engagement and duration of usage. We alsoutilize these communication channels to help our users become aware of our new products and services.
Data
• Advanced, purpose-built hardware and software technologies. Our wearable devices leverage industry-standard technologies, such as Bluetooth lowenergy, as well as proprietary technologies, such as our PurePulse continuous heart rate tracking and our algorithms that measure and analyze user healthand fitness metrics. We devote significant resources to ensure that our devices effortlessly fit into our users’ lifestyles. For example, we design our small,lightweight, durable, and fashionable products to be optimized for power efficiency, which enables automatic wireless data syncing withoutcompromising battery life. We place a similarly strong emphasis on our online dashboard and mobile apps to provide users with visualization of theirprogress and personalized guidance. Our highly-scalable cloud infrastructure enables millions of users around the world to engage with our platform inreal-time.
• Broad mobile compatibility and open API. Our broad mobile compatibility and open API enable a large health and fitness ecosystem that providesadditional value to our existing users and extends our reach to potential new users. Our users can sync their Fitbit devices with and view their onlinedashboard on their computers and over 200 mobile devices, including iOS, Android, and Windows Phone products. Additionally, we enable seamlessintegration with thousands of apps across iOS, Android, and Windows Phone through our open API, which allows our users to share data with third-partyapps on an opt-in basis.
Our Devices and Accessories
Our line of devices includes Fitbit Surge®, Fitbit Blaze®, Fitbit Charge 2®, Alta HR™, Alta®, Fitbit Flex 2®, Fitbit One® and Fitbit Zip® activity trackers,as well as Fitbit Ionic™ smartwatch, and Fitbit Aria 2™ Wi-Fi Smart Scales. We also offer a line of accessories including bands and frames for some of ourdevices, as well as Fitbit Flyer™, our wireless headphone designed for fitness.
4
Table of Contents
Our Software and Services
We believe our software and services offer the ability to engage the user and effect behavior change, representing an opportunity to diversify our revenuestream and deepen our relationship with our users. As we continue to work towards driving and influencing health outcomes, we believe there is an opportunity forour software to play a role in chronic disease management. We offer both enterprise software such as corporate challenges for Fitbit Health Solutions customersand coaching and guidance for our retail customers. Revenue from our software and services has historically represented less than one percent of our annualrevenue.
Fitbit online dashboard and mobile apps. We offer our users a personalized online dashboard and mobile apps that sync automatically with, and displayreal-time data from, our wearable devices. Through these offerings, we provide users with charts and graphs of their progress, deeper analysis of their activities,and the ability to log caloric intake. Additionally, we motivate users through real-time feedback including notifications, leaderboard and challenge updates, andvirtual badges. Our platform also offers users social features, such as access to an online community of users, leaderboards and challenges, that allow users toreceive and provide support and engage in friendly competition. Our online dashboard and mobile apps are available for free through the iOS App Store, GooglePlay, Windows Store, and on Fitbit.com.
Fitbit Coach. In March 2015, we acquired FitStar, a provider of interactive video-based exercise experiences on mobile devices and computers that utilizeproprietary algorithms to adjust and customize workouts for individual users based on data gathered during their workouts. We rebranded FitStar to Fitbit Coachbeginning in October 2017. Through our Fitbit Coach offering, we provide exercise programs through personal trainer and yoga apps that continuously adjust toour users based on feedback throughout the workout. Our Commitment to Privacy
We are committed to respecting our users’ privacy, letting our users decide how their information is used and shared, and keeping their data safe.
We have developed our data collection and use practices in accordance with the Fair Information Practice Principles, or FIPPs. We are committed to thefollowing privacy principles as outlined in our privacy policy:
• Transparent and Easy to Understand Policies. We are transparent about our data practices and explain them in clear language. Our data collectionpractices are designed to only collect data that is useful to improving our products, services, and user experience.
• No Unexpected Uses. We never sell personally identifiable data or use it other than as described in our privacy policy.
• Clear Notice and Consent. We only share personally identifiable data with third parties, including employers, when our users consent to the sharing andunder the limited circumstances outlined in our privacy policy where users’ personally identifiable data can be shared without specific consent, such asour receipt of search warrants or subpoenas from law enforcement agencies or in response to a validly issued legal process in a civil litigation matter.
• Prioritize Security. We take the security of our users’ data seriously. We use a combination of technical and administrative security controls to helpensure the security of user data.
Research and Development
We are passionate about developing innovative products and services that empower our users to reach their health and fitness goals. We believe our futuresuccess depends on our ability to develop new products and features that expand the versatility and performance of our existing platform, and we plan to continueto invest significant resources to enhance performance, functionality, convenience, and style for our users.
Our global research and development team supports the design and development of our wearable devices, proprietary sensors, firmware, data algorithms, andonline dashboard and mobile apps. Our team is also researching new advanced science to help deepen our penetration of wearable devices. The team is comprisedof dedicated research employees, electrical engineers, mechanical engineers, firmware engineers, site operations engineers, and mobile app developers. Ourresearch and development team is primarily based at our headquarters in San Francisco, California, as well as several other worldwide locations.
Our research and development expenses were $343.0 million , $320.2 million , and $150.0 million , for 2017 , 2016 , and 2015 , respectively.
5
Table of Contents
Manufacturing, Logistics and Fulfillment
We outsource the manufacturing of our products to several contract manufacturers. These contract manufacturers produce our products in their facilities,which are primarily located in Asia. The components used in our products are sourced either directly by us or on our behalf by our contract manufacturers from avariety of component suppliers selected by us and our contract manufacturers, and are located worldwide. Our operations employees coordinate our relationshipswith our contract manufacturers and component suppliers. We believe that using outsourced manufacturing enables greater scale and flexibility at lower costs thanestablishing our own manufacturing facilities. We evaluate our current contract manufacturers and component suppliers on an ongoing basis, including whether ornot to utilize new or alternative contract manufacturers or component suppliers.
We work with third-party fulfillment partners that deliver our products from multiple locations worldwide, which allows us to reduce order fulfillment time,reduce shipping costs, and improve inventory flexibility. Sales Channels and Customers
We sell our products through three primary channels:
Retail and distribution channel. We offer our products in over 45,000 retail stores and in 86 countries. We focus on building close relationships with ourretailers, working with them to merchandise our products in a compelling manner both in-store and on their e-commerce sites, promoting our products throughtheir marketing efforts, and educating their sales forces about our products. In addition, we sell to distributors who resell our products to retailers.
• Consumer electronics and specialty retailers. Our products are sold by retailers with a large domestic and international presence such as Best Buy.• e-Commerce retailers. Our products are sold on Amazon.com, in addition to the e-commerce sites of our retailers.• Mass merchant , department store, and club retailers. Our products are sold by large retailers, including Target, Costco, Macy’s, Kohl’s, and Walmart.• Sporting goods and outdoors retailers. Our products are sold by sporting goods and outdoors retailers, including Dick’s Sporting Goods and REI.• Wireless carriers. Our products are sold by wireless carriers, including Verizon.• Distributors. Our products are sold by a network of distributors.
Consumer direct channel. We sell our full line of products directly to consumers in the United States and other countries through our online store atFitbit.com, which represented 10% and 7% of our revenue in 2017 and 2016, respectively. We drive consumers to our website through online and offlineadvertising as well as marketing promotions.
Fitbit Health Solutions channel. We believe our strong brand recognition and success with consumers makes Fitbit a desirable partner for the healthcare andenterprise ecosystem. Fitbit Health Solutions partners and sells offerings to employer health and wellness plans, health plans, hospitals, and researchers. We offerproducts and services to employers looking to enhance their employee wellness programs. We sell our corporate wellness offering directly to employers or throughpartners, such as wellness program providers and insurance companies. Through our corporate wellness offering, employers can purchase our products at quantitydiscounts for their employees. We also offer a range of other services to maximize wellness program success, such as easy employee onboarding, an engagingemployee leaderboard, real-time group reporting for company administrators, and employee insight into progress towards program goals. We can also integratewith our partners’ existing wellness programs. Backlog
There is a relatively short cycle between order and shipment of our sales. Therefore, we believe that backlog information is not material to the understandingof our business.
Marketing and Advertising
Our marketing and advertising programs are focused on building global brand awareness, increasing product adoption, including the launch of new productofferings, and driving sales. Our marketing and advertising efforts target a wide range of consumers and leverage traditional advertising methods (includingtelevision, cinema, and print magazines), sponsorships and public relations, digital marketing, channel marketing, and endorsements by professional athletes andcelebrities.
Our in-store merchandising strategy focuses on our point of purchase, or POP displays. We install our freestanding, in-line, and endcap POP displays ofvarying sizes at our various retailers. These displays communicate our marketing messages, present
6
Table of Contents
our products and their features and, in many cases, allow consumers to try on our devices and view an interactive app that enables them to learn more about ourproducts. Intellectual Property
Intellectual property is an important aspect of our business, and we seek protection for our intellectual property as appropriate. We rely upon a combinationof patent, copyright, trade secret, and trademark laws and contractual restrictions, such as confidentiality agreements and licenses, to establish and protect ourproprietary rights.
As the leading global wearable brand, we have developed a significant patent portfolio to protect certain elements of our proprietary technology. As ofDecember 31, 2017 , we had 399 issued patents. We continually review our development efforts to assess the existence and patentability of new intellectualproperty. We pursue the registration of our domain names and trademarks and service marks in the United States and in certain locations outside the United States.
Competition
The market for wearable devices is both evolving and competitive. The wearable devices category has a multitude of participants including specializedconsumer electronics companies such as Garmin and Nokia, and traditional watch companies such as Fossil and Movado. In addition, many large, broad-basedconsumer electronics companies either compete in our market or adjacent markets or have announced plans to do so, including Apple, Google, LG, and Samsung.For example, Apple sells the Apple Watch, which is a smartwatch with broad-based functionalities, including some health and fitness tracking capabilities, andApple has sold a significant volume of its smartwatches since introduction. We also face competition from manufacturers of lower-cost devices, such as Xiaomiand its Mi Band device. In addition, we compete with a wide range of stand-alone health and fitness-related mobile apps that can be purchased or downloadedthrough mobile app stores.
The principal competitive factors in our market include:
• brand awareness and focus;• breadth of product offerings;• battery life, sensor technology, and tracking features;• online and mobile app experience;• cross-platform capability (iOS, Android, and Windows Phone);• software algorithms;• partnerships;• strength of sales and marketing efforts; and• distribution strategy.
We believe we compete favorably with our competitors on the basis of these factors as a result of our community of users, leading global brand, and data.The size of our user community increases the likelihood that our users will be able to find and engage with like-minded individuals, friends, and family, creatingpositive network effects. We believe that our success with consumers, along with our focus on health and fitness, makes us an attractive wearables partner for thehealthcare and enterprise ecosystem. Furthermore, our platform and open API have together enabled us to establish a large and growing health and fitnessecosystem that not only provides additional value to our existing users, but also extends our reach to potential new users. Employees
As of December 31, 2017 , we had 1,749 global employees. We have not experienced any work stoppages. We consider our relationship with our employeesto be good.
Information about Geographic Revenue
Information about geographic revenue is described in Note 11, “Significant Customer Information and Other Information” in the notes to our consolidatedfinancial statements.
Corporate Information
We were incorporated in Delaware in March 2007 as Healthy Metrics Research, Inc. We changed our name to Fitbit, Inc. in October 2007. We completedour initial public offering in June 2015 and our Class A common stock is listed on The New York Stock Exchange under the symbol “FIT.” Our principalexecutive offices are located at 199 Fremont Street, 14th Floor, San
7
Table of Contents
Francisco, California 94105, and our telephone number is (415) 513-1000. Our website address is www.fitbit.com and our investor relations website address ishttp://investor.fitbit.com. The information on, or that can be accessed through, our website is not incorporated by reference into this Annual Report on Form 10-K.Fitbit, the Fitbit logo, Fitbit Ionic, Fitbit Flyer, Fitbit Surge, Fitbit Blaze, Fitbit Charge 2, Fitbit Charge HR, Alta, Fitbit Charge, Fitbit Flex 2, Fitbit Flex, FitbitOne, Fitbit Zip, Aria, PurePulse, SmartTrack, FitStar, and our other registered or common law trade names, trademarks, or service marks appearing in this AnnualReport on Form 10-K are our intellectual property. This Annual Report on Form 10-K contains additional trade names, trademarks, and service marks of othercompanies that are the property of their respective owners.
Through a link on our website, we make available the following filings as soon as reasonably practicable after they are electronically filed with or furnishedto the Securities and Exchange Commission, or SEC: our Annual Report on Form 10-K, Quarterly Reports on Form 10-Q, Current Reports on Form 8-K, and anyamendments to those reports filed or furnished pursuant to Section 13(a) or 15(d) of the Securities Exchange Act of 1934, as amended, or the Exchange Act. Allsuch filings are available free of charge. The public may also read and copy any materials we file with the SEC at the SEC’s Public Reference Room at 100 FStreet, NE, Washington DC 20549. The public may obtain information on the operation of the Public Reference Room by calling the SEC at 1-800-SEC-0330. TheSEC also maintains a website at www.sec.gov that contains all reports that we file or furnish with the SEC electronically.
Item 1A. Risk Factors
An investment in our Class A common stock involves a high degree of risk. You should carefully consider the risks and uncertainties described below,together with all of the other information in this Annual Report on Form 10-K, including the section titled “Management’s Discussion and Analysis of FinancialCondition and Results of Operations” and our consolidated financial statements and related notes, before making a decision to invest in our Class A commonstock. Our business, operating results, financial condition, or prospects could be materially and adversely affected by any of these risks and uncertainties. If any ofthese risks actually occurs, the trading price of our Class A common stock could decline and you might lose all or part of your investment. Our business, operatingresults, financial performance, or prospects could also be harmed by risks and uncertainties not currently known to us or that we currently do not believe arematerial. Risks Related to Our Business We operate in a highly competitive market. If we do not compete effectively, our prospects, operating results, and financial condition could be adverselyaffected. The wearable device market is highly competitive, with companies offering a variety of products and services. Wearables can be broadly defined as connectedhealth and fitness trackers, fitness watches, smartwatches and devices beyond the wrist. We expect competition in our market to intensify in the future as new andexisting competitors introduce new or enhanced products and services that are potentially more competitive than our products and services. In terms of units sold,we have primarily operated in the connected health and fitness tracker segment of the wearables device market. The wearable device market has a multitude ofparticipants, including specialized consumer electronics companies, such as Garmin and Nokia, and traditional watch companies such as Fossil and Movado. Inaddition, many large, broad-based consumer electronics companies either compete in our market or adjacent markets or have announced plans to do so, includingApple, Google, LG and Samsung. For example, Apple sells the Apple Watch, which is a smartwatch with broad-based functionalities, including some health andfitness tracking capabilities, and Apple has sold a significant volume of its smartwatches since introduction. Moreover, smartwatches with health and fitnessfunctionalities may displace the market for traditional tracker devices. We also face competition from manufacturers of lower-cost devices, such as Xiaomi and itsMi Band device. In addition, we compete with a wide range of stand-alone health and fitness-related mobile apps that can be purchased or downloaded throughmobile app stores. We believe many of our competitors and potential competitors have significant advantages, including longer operating histories, ability toleverage their sales efforts and marketing expenditures across a broader portfolio of products and services, larger and broader customer bases, more establishedrelationships with a larger number of suppliers, contract manufacturers, and channel partners, greater brand recognition, ability to leverage app stores which theymay operate, experience manufacturing particular wearable devices, such as smartwatches, and greater financial, research and development, marketing,distribution, and other resources than we do. Our competitors and potential competitors may also be able to develop products or services that are equal or superiorto ours, achieve greater market acceptance of their products and services, and increase sales by utilizing different distribution channels than we do. Some of ourcompetitors may aggressively discount their products and services in order to gain market share, which could result in pricing pressures, reduced profit margins,lost market share, or a failure to grow market share for us. In addition, new products may have lower selling prices or higher costs than legacy products, whichcould negatively impact our gross margins and operating results. Furthermore, current or potential competitors may be acquired by third parties with greateravailable resources. As a result of such acquisitions, our current or potential competitors might be able to adapt more quickly to new technologies and consumerneeds, devote greater
8
Table of Contents
resources to the promotion or sale of their products and services, initiate or withstand substantial price competition, take advantage of acquisition or otheropportunities more readily or develop and expand their products and services more quickly than we do. If we are not able to compete effectively against our currentor potential competitors, our prospects, operating results, and financial condition could be adversely affected.
If we are unable to anticipate and satisfy consumer preferences in a timely manner, our business may be adversely affected.
Our success depends on our ability to anticipate and satisfy consumer preferences in a timely manner. All of our products and services are subject tochanging consumer preferences that cannot be predicted with certainty. In terms of units sold, we have primarily operated in the connected health and fitnesstracker segment of the wearables device market. However, consumer preference has increasingly shifted to the smartwatch segment of the wearables devicemarket. Although we intend to build out our smartwatch offerings, consumers may decide not to purchase our products and services as their preferences could shiftrapidly to different types of wearable devices or away from these types of products and services altogether. Our future success depends in part on our ability toanticipate and respond to shifts in consumer preferences. If we do not anticipate such shifts in a timely manner, our reputation and business may be adverselyaffected.
Our newer products and services that have additional features or new product designs, such as Fitbit Ionic and Fitbit Aria 2, may also have higher prices
than many of our earlier products and the products of some of our competitors, which may not appeal to consumers or only appeal to a smaller subset ofconsumers. It is also possible that competitors could introduce new products and services that negatively impact consumer preference for our wearable devices,which could result in decreased sales of our products and services and a loss in market share. Accordingly, if we fail to anticipate and satisfy consumer preferencesin a timely manner, or if it is perceived that our future products and services will not satisfy consumer preferences, our business may be adversely affected. If we are unable to successfully develop, timely introduce, and effectively manage the introduction of new products and services or enhance existing productsand services, our business may be adversely affected.
We must continually develop and introduce new products and services and improve and enhance our existing products and services to maintain or increaseour sales. We believe that our future growth depends on continuing to engage and expand our user base by introducing new form factors, softwareservices and other offerings. For example, in the third quarter of 2017, we started shipping Fitbit Ionic, our smartwatch and Fitbit Flyer, our first Bluetoothheadphone. In September 2017, we also announced our participation in the Food and Drug Administration’s, or FDA, new digital health software precertificationpilot program aimed to develop a new approach to regulating digital health technology and to promote innovation of high-quality and effective digital health tools.The success of new or enhanced products and services may depend on a number of factors including, anticipating and effectively addressing consumer preferencesand demand, timely and successful research and development, the success of our sales and marketing efforts, effective forecasting and management of productdemand, purchase commitments, and inventory levels, effective management of manufacturing and supply costs, and the quality of or defects in our products.
The development of our products and services is complex and costly, and we typically have several products and services in development at the same time.Given the complexity, we occasionally have experienced, and could experience in the future, delays in completing the development and introduction of new andenhanced products and services, product costs that are higher than planned, or lower than expected manufacturing yields of new and enhanced products, which mayadversely affect our revenue and gross margins. Unanticipated problems in developing products and services could also divert substantial research anddevelopment resources, which may impair our ability to develop new products and services and enhancements of existing products and services, and couldsubstantially increase our costs. Problems in the design or quality of our products or services may also have an adverse effect on our brand, business, financialcondition, and operating results.
We must also successfully manage introductions of new or enhanced products. Introductions of new or enhanced products could adversely impact the salesof our existing products to retailers and consumers. For instance, retailers often purchase less of our existing products in advance of new product launches.Furthermore, we may experience greater returns from retailers or users of existing products, or retailers may be granted stock rotation rights and price protection.Moreover, consumers may decide to purchase new or enhanced products instead of existing products. We may face challenges managing the inventory of existingproducts, which could lead to excess inventory and discounting of our existing products. In addition, new products may have lower selling prices or higher coststhan legacy products, which could negatively impact our gross margins and operating results. We have also historically incurred higher levels of sales andmarketing expenses accompanying each product introduction. Accordingly, if we fail to effectively manage introductions of new or enhanced products, ouroperating results could be harmed.
Our operating results could be materially harmed if we are unable to accurately forecast consumer demand for our products and services and adequatelymanage our inventory.
9
Table of Contents
If we fail to accurately forecast consumer demand, we may experience excess inventory levels or a shortage of products available for sale. Our ability to
accurately forecast demand for our products and services could be affected by many factors, including an increase or decrease in consumer demand for ourproducts and services or for products and services of our competitors, product and service introductions by us and our competitors, channel inventory levels, salespromotions by us or our competitors, unanticipated changes in general market conditions, and the weakening of economic conditions or consumer confidence infuture economic conditions. To ensure adequate inventory supply, we must forecast inventory needs and expenses and place orders sufficiently in advance with oursuppliers and contract manufacturers based on our estimates of future demand for particular products. We face challenges acquiring adequate and timely suppliesof our products to satisfy the levels of demand, particularly in connection with new product introductions, which we believe negatively affects our revenue. As wecontinue to introduce new products, we may face challenges managing the inventory of existing products. No assurance can be given that we will not incuradditional charges in future periods related to our inventory management or that we will not underestimate or overestimate forecasted sales in a future period.
Inventory levels in excess of consumer demand may result in inventory write-downs or write-offs and the sale of inventory at discounted prices, which havecaused and may continue to cause our gross margin to decline and could impair the strength of our brand. For example, during the fourth quarter of 2016, as aresult of reduced demand, we recorded write-downs for excess and obsolete inventory, accelerated depreciation of manufacturing and tooling equipment, andrecorded a liability to our contract manufacturers for unutilized manufacturing capacity and components. In addition, we offered, and recorded reserves for,additional rebates and promotions during the fourth quarter of 2016 to retailers and distributors. During 2017, we recorded additional write-downs for excess andobsolete inventory, accelerated depreciation of manufacturing and tooling equipment due to continued reduced demand, price protection on certain products, andrebates. Reserves and write-downs for rebates, promotions, excess inventory, tooling and manufacturing capacity are recorded based on our forecast of futuredemand. Actual future demand could be less than our forecast which may result in additional reserves and write-downs in the future or actual demand could bestronger than forecast which may result in a reduction to previously recorded reserves and write-downs in the future and increase the volatility of our operatingresults.
Conversely, if we underestimate consumer demand for our products, we may in future periods be unable to meet customer, retailer or distributor demand forour products. We may also be required to incur higher costs to secure the necessary production capacity and components if we underestimate demand and ourbusiness and operating results could be adversely affected, including damage to our brand and customer relationships.
Our quarterly operating results or other operating metrics may fluctuate significantly, which could cause the trading price of our Class A common stock todecline.
Our quarterly operating results and other operating metrics have fluctuated in the past and may continue to fluctuate from quarter to quarter. We expect thatthis trend will continue as a result of a number of factors, many of which are outside of our control and may be difficult to predict, including:
• the level of demand for our wearable devices and our ability to maintain or increase the size and engagement of our community of users;• the timing and success of new product and service introductions by us and the transition from legacy products;• the timing and success of new product and service introductions by our competitors or any other change in the competitive landscape of our market;• the mix of products sold in a quarter;• the continued market acceptance of, and the growth of the market for, wearable devices, and evolution of this market into smartwatches and other form
factors;• pricing pressure as a result of competition or otherwise;• delays or disruptions in our supply, manufacturing, or distribution chain;• errors in our forecasting of the demand for our products, which could lead to lower revenue or increased costs, or both;• seasonal buying patterns of consumers;• increases in levels of channel inventory resulting from sales to our retailers and distributors in anticipation of future demand;• increases in and timing of sales and marketing and other operating expenses that we may incur to grow and expand our operations and to remain
competitive;• impact of sales and marketing efforts and promotions by competitors, which are difficult to predict;• insolvency, credit, or other difficulties faced by our distributors and retailers, affecting their ability to purchase or pay for our products;
10
Table of Contents
• insolvency, credit, or other difficulties confronting our suppliers, contract manufacturers, or logistics providers leading to disruptions in our supply ordistribution chain;
• levels of product returns, stock rotation, and price protection rights;• levels of warranty claims or estimated costs of warranty claims;• adverse litigation judgments, settlements, or other litigation-related costs;• changes in the legislative or regulatory environment, such as with respect to privacy, information security, health and wellness devices, consumer product
safety, advertising, and taxes;• product recalls, regulatory proceedings, or other adverse publicity about our products;• fluctuations in foreign exchange rates;• costs related to the acquisition of businesses, talent, technologies, or intellectual property, including potentially significant amortization costs and possible
write-downs; and• general economic conditions in either domestic or international markets.
Any one of the factors above or the cumulative effect of some of the factors above may result in significant fluctuations in our operating results.
The variability and unpredictability of our quarterly operating results or other operating metrics could result in our failure to meet our expectations, those ofany analysts that publish financial coverage of us, or investors with respect to revenue or other operating results for a particular period. If we fail to meet or exceedsuch expectations for these or any other reasons, the market price of our Class A common stock could fall substantially, and we could face costly lawsuits,including securities class action suits.
We may not be able to achieve revenue growth or profitability in the future.
Our historical revenue growth should not be considered indicative of our future performance. Our revenue has declined in recent periods and we expect ourrevenue growth to be slower than in the past or decline in future periods due to a number of factors, which may include slowing demand for our products andservices, increasing competition, a decrease in the growth of our overall market, our failure, for any reason, to capitalize on growth opportunities, or the maturationof our business.
From 2014 to 2016, our annual revenue grew rapidly from $745.4 million to $2.2 billion. However, in recent quarters, our revenue growth has declined, andour historical growth should not be considered as indicative of our future performance. Although our annual revenue in 2016 was up 17% compared to 2015, ourrevenue in 2017 declined 26% on a year-over-year basis. In future periods, we could again experience a decline in revenue, or revenue could grow more slowlythan we expect, which could have a material negative effect on our future operating results.
Because we have only a limited history operating our business at its current scale, it is difficult to evaluate our current business and future prospects,including our ability to plan for and model future growth. Our limited operating experience at this scale, combined with the rapidly evolving nature of the market inwhich we sell our products and services, substantial uncertainty concerning how these markets may develop, and other economic factors beyond our control,reduces our ability to accurately forecast quarterly or annual revenue. As such, any predictions about our future revenue and expenses may not be as accurate asthey would be if we had a longer operating history or operated in a more developed and predictable market. Failure to manage our future growth effectively couldhave an adverse effect on our business, which, in turn, could have an adverse impact on our operating results and financial condition.
In addition, we have not consistently achieved profitability on a quarterly or annual basis. For example, we recorded a net loss of $277.2 million in 2017.Lower levels of revenue and higher levels of operating expenses may result in limited profitability or losses.
If we fail to manage our operating expenses effectively, our financial performance may be negatively impacted.
Our success also depends on our ability to manage our operating expenses effectively. Our employee headcount and the scope and complexity of our businesshave increased significantly during recent years and we had 1,749 employees as of December 31, 2017. We have incurred significant net losses of $277.2 millionand $102.8 million in 2017 and 2016, respectively. In January 2017, we announced cost-efficiency measures that included realigning sales and marketing spendand improved optimization of research and development investments. This reorganization impacted approximately 110 employees, or 6% of our global workforce.Although we plan to seek to operate efficiently and to manage our costs effectively, we may not realize the cost savings expected from these actions.
11
Table of Contents
In addition, we are also investing in areas we believe will grow revenue and our operating expenses might increase as a result of these investments. Thedevelopment of our products and services is complex and costly, and we typically have several products and services in development at the same time. Ourresearch and development efforts may require us to incur substantial expenses to support the development of our next generation devices and other new productsand services. Our research and development expenses were $343.0 million , $320.2 million and $150.0 million, for 2017, 2016 and 2015, respectively.
We could also be required to continue to expand our sales and marketing, product development, and distribution functions, to upgrade our managementinformation systems and other processes and technology, and to obtain more space for our expanding workforce. This expansion could increase the strain on ourresources, and we could experience serious operating difficulties, including difficulties in hiring, training, and managing an increasing number of employees.
In the future, we may again need to strategically realign our resources, adjust our product line and/or enact price reductions in order to stimulate demand, andimplement additional restructurings and workforce reductions. Any such actions may result in the recording of special charges including inventory-related write-offs, workforce reductions, or other restructuring costs. Additionally, our estimates with respect to the useful life or ultimate recoverability of our assets, includingpurchased intangible assets and tooling, could also change and result in impairment charges.
If we are unable to operate efficiently and manage our costs, we may continue to incur significant losses in the future and may not be able to achieve ormaintain profitability.
Because some of the key components in our products come from a limited number or single source of supply, we are susceptible to supply shortages, long leadtimes for components, and supply changes, any of which could disrupt our supply chain.
Some of the key components used to manufacture our products come from a limited or single source of supply. Our contract manufacturers generallypurchase these components on our behalf, subject to certain approved supplier lists. We are subject to the risk of shortages and long lead times in the supply ofthese components and the risk that our suppliers discontinue or modify components used in our products. In addition, the lead times associated with certaincomponents are lengthy and preclude rapid changes in quantities and delivery schedules. We have in the past experienced and may in the future experiencecomponent shortages, and the predictability of the availability of these components may be limited. While component shortages have historically been immaterial,they could be material in the future. In the event of a component shortage or supply interruption from suppliers of these components, we may not be able todevelop suitable alternate sources in a timely manner. In addition, some of our suppliers, contract manufacturers, and logistics providers may have moreestablished relationships with our competitors, and as a result of such relationships, such suppliers may choose to limit or terminate their relationship with us.Developing suitable alternate sources of supply for these components may be time-consuming, difficult, and costly and we may not be able to source thesecomponents on terms that are acceptable to us, or at all, which may adversely affect our ability to meet our requirements or to fill our orders in a timely or cost-effective manner. Any interruption or delay in the supply of any of these parts or components, or the inability to obtain these parts or components from alternatesources at acceptable prices and within a reasonable amount of time, would harm our ability to meet our scheduled product deliveries to our customers and users.This could harm our relationships with our channel partners and users and could cause delays in shipment of our products and adversely affect our operatingresults. In addition, increased component costs could result in lower gross margins. If we are unable to buy these components in quantities sufficient to meet ourrequirements on a timely basis, we will not be able to deliver products and services to our customers and users, which could adversely impact our revenue, grossmargins, and operating results.
Our future success depends on the continuing efforts of our key employees, including our founders, James Park and Eric N. Friedman, and on our ability toattract and retain highly skilled personnel and senior management.
Our future success depends, in part, on our ability to continue to attract and retain highly skilled personnel. In particular, we are highly dependent on thecontributions of our co-founders, James Park and Eric N. Friedman, as well as other members of our management team. The loss of any key personnel could makeit more difficult to manage our operations and research and development activities, reduce our employee retention and revenue, and impair our ability to compete.Although we have generally entered into employment offer letters with our key personnel, these agreements have no specific duration and provide for at-willemployment, which means they may terminate their employment relationship with us at any time.
Competition for highly skilled personnel is often intense, especially in the San Francisco Bay Area where we are located, and we may incur significant coststo attract them. We may not be successful in attracting, integrating, or retaining qualified personnel to fulfill our current or future needs. We have, from time totime, experienced, and we expect to continue to experience, difficulty in hiring and retaining highly skilled employees with appropriate qualifications. In addition,job candidates and existing employees often consider the value of the equity awards they receive in connection with their employment. Fluctuations in the price ofour Class A common stock may make it more difficult or costly to use equity awards to motivate, incentivize and retain our employees. The significant decline inthe price of our Class A common stock in recent periods may adversely affect our ability
12
Table of Contents
to attract or retain highly skilled employees. Furthermore, there can be no assurances that the number of shares reserved for issuance under our equity incentiveplans will be sufficient to grant equity awards adequate to recruit new employees and to compensate existing employees. If we fail to attract new personnel or failto retain and motivate our current personnel, our business and future growth prospects could be severely harmed.
We spend significant amounts on advertising and other marketing campaigns to acquire new users, which may not be successful or cost effective.
We spend significant amounts on advertising and other marketing campaigns, such as television, cinema, print advertising, and social media, as well aspromotional activities, to acquire new users and we expect to continue to spend significant amounts marketing our products and services to acquire new users andincrease awareness of our products and services. In 2017 and 2016, advertising expenses, excluding co-op advertising and rebates which are recorded as contra-revenue, were $226.3 million and $316.8 million, respectively, representing approximately 14% and 15% of our revenue, respectively. Co-op advertising costswere $45.0 million, $52.9 million, and $38.3 million for 2017, 2016 and 2015, respectively. A significant portion of our advertising and marketing spend istypically incurred in the fourth quarter as part of our holiday promotions, as well as when new products are released. While we seek to structure our advertisingcampaigns in the manner that we believe is most likely to encourage people to buy our products and services, we may fail to identify advertising opportunities thatsatisfy our anticipated return on advertising spend as we scale our investments in marketing, accurately predict user acquisition, or fully understand or estimate theconditions and behaviors that drive user behavior. Particularly during the holiday season, there is significant competition for holiday spending; if competitors orother products offer more compelling promotions or products, we may not realize our expected sales or recover our advertising and promotional spend. If newproducts do not meet customer expectations, we may not recover our advertising and promotional spend for new product introductions. If for any reason any of ouradvertising campaigns prove less successful than anticipated in attracting new users, we may not be able to recover our advertising spend, and our rate of useracquisition may fail to meet market expectations, either of which could have an adverse effect on our business. There can be no assurance that our advertising andother marketing efforts will result in increased sales of our products and services.
Our current and future products and services may experience quality problems from time to time that can result in adverse publicity, product recalls, litigation,regulatory proceedings, and warranty claims resulting in significant direct or indirect costs, decreased revenue and operating margin, and harm to our brand.
We sell complex products and services that could contain design and manufacturing defects in their materials, hardware, and firmware. These defects couldinclude defective materials or components, or “bugs,” that can unexpectedly interfere with the products’ intended operations or cause injuries to users or property.Although we extensively and rigorously test new and enhanced products and services before their release, there can be no assurance we will be able to detect,prevent, or fix all defects. For example, our products may fail to provide accurate measurements and data to users under all circumstances, or there may be reportsor claims of inaccurate measurements under certain circumstances.
Failure to detect, prevent, or fix defects, or an increase in defects could result in a variety of consequences including a greater number of returns of productsthan expected from users and retailers, increases in warranty costs, regulatory proceedings, product recalls, and litigation, which could harm our revenue andoperating results. For example, in 2016, we experienced an increase in actual and estimated warranty claims of $108.5 million as compared to 2015, which causeda 4% decline in gross margin in 2016 as compared to 2015. We generally provide a 45-day right of return for purchases through Fitbit.com and a 12-month limitedwarranty on all of our products, though warranty duration and scope may vary by jurisdiction in compliance with applicable local law. The occurrence of real orperceived quality problems or material defects in our current and future products could expose us to warranty claims in excess of our current reserves. Moreover,we may offer stock rotation rights and price protection to our distributors. If we experience greater returns from retailers or users, or greater warranty claims, inexcess of our reserves, our business, revenue, gross margin, and operating results could be harmed. In addition, any negative publicity or lawsuits filed against usrelated to the perceived quality and safety of our products could also affect our brand and decrease demand for our products and services, adversely affecting ouroperating results and financial condition.
We rely on a limited number of suppliers, contract manufacturers, and logistics providers, and each of our products is manufactured by a single contractmanufacturer.
We rely on a limited number of suppliers, contract manufacturers, and logistics providers. In particular, we use contract manufacturers located in Asia, andeach of our products is manufactured by a single contract manufacturer. Our reliance on a sole contract manufacturer for each of our products increases the riskthat in the event of an interruption from any one of these contract manufacturers, including, without limitation, due to a natural catastrophe or labor dispute, wemay not be able to develop an
13
Table of Contents
alternate source without incurring material additional costs and substantial delays. Accordingly, an interruption from any key supplier, contract manufacturer, orlogistics provider could adversely impact our revenue, gross margins, and operating results.
If we experience a significant increase in demand, or if we need to replace an existing supplier, contract manufacturer, or logistics provider, we may beunable to supplement or replace such supply, contract manufacturing, or logistics capacity on terms that are acceptable to us, which may adversely impact ourability to deliver our products to customers in a timely manner. For example, for certain of our products, it may take a significant amount of time to onboard acontract manufacturer that has the capability and resources to build the product to our specifications in sufficient volume. Identifying suitable suppliers, contractmanufacturers, and logistics providers is an extensive process that requires us to become satisfied with their quality control, technical capabilities, responsivenessand service, financial stability, regulatory compliance, and labor and other ethical practices. In addition, our contract manufacturers often make significantinvestments to build capacity based upon our forecasted production. If we experience a significant decrease in demand as compared to our forecast, our contractmanufacturers may seek to renegotiate the terms of their commitments or choose to limit or terminate their relationship with us. Accordingly, a loss of any keysupplier, contract manufacturer, or logistics provider could adversely impact our revenue, gross margins, and operating results. We have limited control over our suppliers, contract manufacturers, and logistics providers, which subjects us to significant risks, including the potentialinability to obtain or produce quality products on a timely basis or in sufficient quantity.
We have limited control over our suppliers, contract manufacturers, and logistics providers, including aspects of their specific manufacturing processes andtheir labor, environmental, or other practices, which subjects us to significant risks, including the following:
• inability to satisfy demand for our products;• reduced control over delivery timing and product reliability;• reduced ability to oversee the manufacturing process and components used in our products;• reduced ability to monitor compliance with our product manufacturing specifications;• price increases;• insolvency, credit problems, or other financial difficulties confronting our suppliers, contract manufacturers, or logistic providers;• difficulties in establishing additional or alternative contract manufacturing relationships if we experience difficulties with our existing suppliers, contract
manufacturers or logistic providers;• shortages of materials or components;• misappropriation of our intellectual property;• suppliers, contract manufacturers, and logistics providers may choose to limit or terminate their relationship with us;• exposure to natural catastrophes, political unrest, terrorism, labor disputes, and economic instability resulting in the disruption of trade from foreign
countries in which our products are manufactured;• changes in local economic conditions in countries where our suppliers, contract manufacturers, or logistics providers are located;• the imposition of new laws and regulations, including those relating to labor conditions, quality and safety standards, imports, duties, taxes, and other
charges on imports, as well as trade restrictions and restrictions on currency exchange or the transfer of funds; and• insufficient warranties and indemnities on components supplied to our contract manufacturers.
If there are defects in the manufacture of our products, we may face negative publicity, government investigations, and litigation, and we may not be fullycompensated by our contract manufacturers for any financial or other liability that we suffer as a result. We are, and may in the future, be subject to claims and lawsuits alleging that our products fail to provide accurate measurements and data to our users.
Our products and services are used to track and display various information about users’ activities, such as daily steps taken, calories burned, distancetraveled, floors climbed, active minutes, sleep duration and quality, and heart rate and GPS-based information such as speed, distance, and exercise routes. Weanticipate new features and functionality in the future, as well. From time to time, there have been reports and claims made against us alleging that our products donot provide accurate measurements and data to users, including claims asserting that certain features of our products do not operate as advertised. Such reports andclaims have resulted in negative publicity, and, in some cases, have required us to expend time and resources to defend litigation. For example, in the first quarterof 2016, class action lawsuits were filed against us based upon claims that the PurePulse heart rate tracking technology in the Fitbit Charge HR and Fitbit Surge donot consistently and accurately record users’ heart rates. If our products fail to provide accurate measurements and data to users, or if there are reports or claims ofinaccurate measurements,
14
Table of Contents
claims of false advertisement, or claims of inaccuracy regarding the overall health benefits of our products and services in the future, we may become the subject ofnegative publicity, litigation, including class action litigation, regulatory proceedings, and warranty claims, and our brand, operating results, and business could beharmed.
Our operating margins have declined and may continue to decline as a result of decreased revenues, increasing product costs and operating expenses.
Our business is subject to significant pressure on pricing and costs caused by many factors, including intense competition, new product introductions, thecost of components used in our products, labor costs, constrained sourcing capacity, inflationary pressure, pressure from users to reduce the prices we charge forour products and services, warranty claims, and changes in consumer demand. Costs for the components used in the manufacture of our products are affected by,among other things, energy prices, consumer demand, fluctuations in commodity prices and currency, and other factors that are generally unpredictable and beyondour control. Any change to pricing and costs could have an adverse effect on, among other things, our average selling price, the cost of our products, gross margins,operating results, financial condition, and cash flows. Moreover, if we are unable to offset any decreases in our average selling price by increasing our salesvolumes or by adjusting our product mix, our operating results and financial condition may be harmed.
A substantial portion of our expenses are personnel related and include salaries, stock-based compensation and benefits, which are not seasonal in nature.Accordingly, in the event of revenue shortfalls, we are generally unable to mitigate a negative impact on operating margins in the short term. To the extent suchrevenue shortfalls recur in future periods, our operating results would be harmed. Any insolvency, credit problems, or other financial difficulties impacting our retailers and distributors could expose us to financial risk.
Some of our retailers and distributors have experienced and may continue to experience financial difficulties. Insolvency, credit challenges, or other financialdifficulties may impact our retailers and distributors and could expose us to significant financial risk. In addition, if the credit capacity of any retailer or distributordeclines due to deterioration in their financial condition or increases in their outstanding payable balance to us, we may be subject to additional financial risk.Financial difficulties of our retailers and distributors could impede their effectiveness and also expose us to risks if they are unable to pay for the products theypurchase from us. For example, Wynit Distribution, LLC, or Wynit, historically our largest customer, filed for bankruptcy protection in September 2017, whichcaused us to incur $7.6 million in net bad debt expenses and $1.4 million in net cost of revenues in 2017. Credit and financial difficulties of our retailers anddistributors may also lead to a reduction in sales, price reductions, increased returns of our products, and adverse effects on our brand and operating results. Wemaintain credit insurance for the majority of our customer balances, perform ongoing credit evaluations of our customers, and maintain allowances for potentialcredit losses on customers’ accounts when deemed necessary. Credit and financial difficulties may lead to an increase in our credit insurance premiums and make itmore difficult or impossible to obtain sufficient coverage, which could increase our exposure and result in increased bad debt expense or additional write-offs. Wealso may not have sufficient insurance coverage to cover losses resulting from the credit and financial difficulties of our retailers and distributors. Any reduction insales by our current retailers or distributors, loss of large retailers or distributors, or decrease in revenue from our retailers or distributors could adversely affect ourrevenue, operating results, and financial condition.
We depend on retailers and distributors to sell and market our products, and our failure to maintain and further develop our sales channels could harm ourbusiness.
We primarily sell our products through retailers and distributors and depend on these third-parties to sell and market our products to consumers. Any changesto our current mix of retailers and distributors could adversely affect our gross margin and could negatively affect both our brand image and our reputation. Oursales depend, in part, on retailers adequately displaying our products, including providing attractive space and point of purchase displays in their stores, andtraining their sales personnel to sell our products. Our retailers also often offer products and services of our competitors in their stores. If our retailers anddistributors are not successful in selling our products or overestimate demand for our products or promote competing products and services more effectively thanour products and services, our revenue would decrease and our gross margins could decline due to increased product returns or price protection claims. In addition,our success in expanding and entering into new markets internationally will depend on our ability to establish relationships with new retailers and distributors. Wealso sell and will need to continue to expand our sales through online retailers, such as Amazon.com, and through our direct channel, Fitbit.com, as consumersincreasingly make purchases online. If we do not maintain our relationship with existing retailers and distributors or develop relationships with new retailers anddistributors our ability to sell our products and services could be adversely affected and our business may be harmed.
15
Table of Contents
In 2016 and 2017, our five largest retailers and distributors accounted for approximately 52% and 43% of our revenue, respectively. Of these retailers anddistributors, Wynit, Amazon.com and Best Buy accounted for approximately 14%, 14% and 10% of our revenue for 2016, respectively, and Amazon.comaccounted for approximately 13% of our revenue for 2017. No other retailers or distributors accounted for 10% or more of our revenue during these periods.Accordingly, the loss of a small number of our large retailers and distributors, or the reduction in business with one or more of these retailers and distributors,could have a significant adverse impact on our operating results. For example, Wynit, historically our largest customer at the time, filed for bankruptcy protectionin September 2017. While we have agreements with these large retailers and distributors, these agreements do not require them to purchase any meaningful amountof our products.
Consolidation of retailers or concentration of retail market share among a few retailers may increase and concentrate our credit risk and impair our ability tosell products.
The electronics retail and sporting goods markets in some countries, including the United States, our largest market, are dominated by a few large retailerswith many stores. These retailers have in the past increased their market share and may continue to do so in the future by expanding through acquisitions andconstruction of additional stores. This can further concentrate our credit risk to a relatively small number of retailers, and, if any of these retailers were toexperience credit or liquidity issues, it would increase the risk that our receivables from these customers may not be paid. In addition, increasing market shareconcentration among one or a few retailers in a particular country or region increases the risk that if any one of them substantially reduces their purchases of ourwearable devices, we may be unable to find a sufficient number of other retail outlets for our products to sustain the same level of sales. These situations also mayresult in pricing pressure to us. Any reduction in sales by our retailers would adversely affect our revenue, operating results, and financial condition.
Our success depends on our ability to maintain our brand. If events occur that damage our brand, our business and financial results may be harmed.
Our success depends on our ability to maintain the value of the “Fitbit” brand. The “Fitbit” name is integral to our business as well as to the implementationof our strategies for expanding our business. Maintaining, promoting, and positioning our brand will depend largely on the success of our marketing andmerchandising efforts, our ability to provide consistent, high quality products and services, and our ability to successfully secure, maintain, and defend our rights touse the “Fitbit” mark and other trademarks important to our brand. Our brand could be harmed if we fail to achieve these objectives or if our public image or brandwere to be tarnished by negative publicity. For example, there has been media coverage of some of the users of our products reporting skin irritation, as well aspersonal injury lawsuits filed against us relating to the Fitbit Zip, Fitbit One, Fitbit Flex, Fitbit Charge, Fitbit Charge HR, and Fitbit Surge products. We alsobelieve that our reputation and brand may be harmed if we fail to maintain a consistently high level of customer service. In addition, we believe the popularity ofthe “Fitbit” brand makes it a target for counterfeiting or imitation, with third parties attempting to sell counterfeit products that attempt to replicate our products.
In addition, our products may be diverted from our authorized retailers and distributors and sold on the “gray market.” Gray market products result inshadow inventory that is not visible to us, thus making it difficult to forecast demand accurately. Also, when gray market products enter the market, we and ourchannel partners compete with often heavily discounted gray market products, which adversely affects demand for our products and negatively impacts ourmargins. In addition, our inability to control gray market activities could result in user satisfaction issues, which may have a negative impact on our brand. Whenproducts are purchased outside our authorized retailers and distributors, there is a risk that our customers are buying substandard products, including products thatmay have been altered, mishandled, or damaged, or used products represented as new.
Any occurrence of counterfeiting, imitation, or confusion with our brand could adversely affect our reputation, place negative pricing pressure on ourproducts, reduce sales of our products, and impair the value of our brand. Additionally, counterfeit and unauthorized grey market sales may result in secondarywarranty replacement and service costs. Maintaining, protecting, and enhancing our brand may require us to make substantial investments, and these investmentsmay not be successful. If we fail to successfully maintain, promote, and position our brand and protect our reputation or if we incur significant expenses in thiseffort, our business, financial condition and operating results may be adversely affected.
Our business is affected by seasonality and if our sales fall below our forecasts, our overall financial conditions and operating results could be adverselyaffected.
Our revenue and operating results are affected by general seasonal spending trends associated with holidays. For example, our fourth quarter has typicallybeen our strongest quarter in terms of revenue and operating income, reflecting our historical strength in sales during the holiday season. We generatedapproximately 35%, 26% and 38% of our full year revenue during the
16
Table of Contents
fourth quarters of 2017, 2016 and 2015, respectively. Accordingly, any shortfall in expected fourth quarter revenue would adversely affect our annual operatingresults, as was the case in the fourth quarter of 2016. In addition, if we fail to accurately forecast consumer demand for the holiday season, we may experienceexcess inventory levels or a shortage of products available for sale.
Furthermore, our growth rate in recent years may obscure the extent to which seasonality trends have affected our business and may continue to affect ourbusiness. Accordingly, yearly or quarterly comparisons of our operating results may not be useful and our results in any particular period will not necessarily beindicative of the results to be expected for any future period. Seasonality in our business can also be significantly impacted by introductions of new or enhancedproducts and services, including the costs associated with such introductions. We collect, store, process, and use personal information and other customer data, which subjects us to governmental regulation and other legal obligationsrelated to privacy, information security, and data protection, and any security breaches or our actual or perceived failure to comply with such legal obligationscould harm our business.
We collect, store, process, and use personal information and other user data, and we rely on third parties that are not directly under our control to do so. Ourusers’ exercise and activity-related data and other personal information may include, among other information, names, addresses, phone numbers, email addresses,payment account information, height, weight, and information such as heart rates, sleeping patterns, GPS-based location, and activity patterns.
Due to the volume of the personal information and data we manage and the nature of our products, the security features of our platform and informationsystems are critical. If our security measures, some of which we manage using third-party solutions, are breached or fail, unauthorized persons may be able toobtain access to or acquire our users’ data. Furthermore, if third-party service providers that host user data on our behalf experience security breaches or violateapplicable laws, agreements, or our policies, such events may also put our users’ information at risk and could in turn have an adverse effect on our business.Additionally, if we or any third-party, including third-party applications, with which our users choose to share their Fitbit data were to experience a breach ofsystems compromising our users’ personal data, our brand and reputation could be adversely affected, use of our products and services could decrease, and wecould be exposed to a risk of loss, litigation, and regulatory proceedings.
Depending on the nature of the information compromised, in the event of a data breach or other unauthorized access to or acquisition of our user data, wemay also have obligations to notify users about the incident and we may need to provide some form of remedy, such as a subscription to a credit monitoringservice, for the individuals affected by the incident. A growing number of legislative and regulatory bodies have adopted consumer notification requirements in theevent of unauthorized access to or acquisition of certain types of personal data. Such breach notification laws continue to evolve and may be inconsistent from onejurisdiction to another. Complying with these obligations could cause us to incur substantial costs and could increase negative publicity surrounding any incidentthat compromises user data. Our users may also inadvertently disclose or lose control of their passwords, creating the perception that our systems are not secureagainst third-party access. While we maintain insurance coverage that, subject to policy terms and conditions and a significant self-insured retention, is designed toaddress certain aspects of cyber risks, such insurance coverage may be insufficient to cover all losses or all types of claims that may arise in the event weexperience a security breach. In addition, any such security breaches may result in negative publicity, adversely affect our brand, decrease demand for our productsand services, and adversely affect our operating results and financial condition. Cybersecurity risks could adversely affect our business and disrupt our operations.
The threats to network and data security are increasingly diverse and sophisticated. Despite our efforts and processes to prevent breaches, our devices, aswell as our servers, computer systems, and those of third parties that we use in our operations are vulnerable to cybersecurity risks, including cyber-attacks such asviruses and worms, phishing attacks, denial-of-service attacks, physical or electronic break-ins, employee theft or misuse, and similar disruptions fromunauthorized tampering with our servers and computer systems or those of third parties that we use in our operations, which could lead to interruptions, delays, lossof critical data, unauthorized access to user data, and loss of consumer confidence. In addition, we may be the target of email scams that attempt to acquirepersonal information or company assets. Despite our efforts to create security barriers to such threats, we may not be able to entirely mitigate these risks. Anycyber-attack that attempts to obtain our or our users’ data and assets, disrupt our service, or otherwise access our systems, or those of third parties we use, ifsuccessful, could adversely affect our business, operating results, and financial condition, be expensive to remedy, and damage our reputation. In addition, anysuch breaches may result in negative publicity, adversely affect our brand, decrease demand for our products and services, and adversely affect our operatingresults and financial condition.
17
Table of Contents
Any material disruption of our information technology systems, or those of third-party partners and data center providers could materially damage user andbusiness partner relationships, and subject us to significant reputational, financial, legal, and operational consequences.
We depend on our information technology systems, as well as those of third parties, to develop new products and services, operate our website, host andmanage our services, store data, process transactions, respond to user inquiries, and manage inventory and our supply chain. Any material disruption or slowdownof our systems or those of third parties whom we depend upon, including a disruption or slowdown caused by our failure to successfully manage significantincreases in user volume or successfully upgrade our or their systems, system failures, or other causes, could cause outages or delays in our services, which couldharm our brand and adversely affect our operating results. In addition, such disruption could cause information, including data related to orders, to be lost ordelayed which could---especially if the disruption or slowdown occurred during the holiday season---result in delays in the delivery of products to stores and usersor lost sales, which could reduce demand for our merchandise, harm our brand and reputation, and cause our revenue to decline. Problems with our third-party datacenter service providers, the telecommunications network providers with whom they contract, or with the systems by which telecommunications providers allocatecapacity among their users could adversely affect the experience of our users. Our third-party data center service providers could decide to close their facilities orcease providing us services without adequate notice. Any changes in third-party service levels at our data centers or any errors, defects, disruptions, or otherperformance problems with our platform could harm our brand and may damage the data of our users. If changes in technology cause our information systems, orthose of third parties whom we depend upon, to become obsolete, or if our or their information systems are inadequate to handle our growth, we could lose usersand our business and operating results could be adversely affected.
Our failure or inability to protect our intellectual property rights, or claims by others that we are infringing upon or unlawfully using their intellectual propertycould diminish the value of our brand and weaken our competitive position, and adversely affect our business, financial condition, operating results, andprospects.
We currently rely on a combination of patent, copyright, trademark, trade secret, and unfair competition laws, as well as confidentiality agreements andprocedures and licensing arrangements, to establish and protect our intellectual property rights. We have devoted substantial resources to the development of ourproprietary technologies and related processes. In order to protect our proprietary technologies and processes, we rely in part on trade secret laws andconfidentiality agreements with our employees, licensees, independent contractors, commercial partners, and other advisors. These agreements may not effectivelyprevent disclosure of confidential information and may not provide an adequate remedy in the event of unauthorized disclosure of confidential information. Wecannot be certain that the steps taken by us to protect our intellectual property rights will be adequate to prevent infringement of such rights by others, includingimitation of our products and misappropriation of our brand. Additionally, the process of obtaining patent or trademark protection is expensive and time-consuming, and we may not be able to file, apply for or prosecute all necessary or desirable patent applications or trademark applications at a reasonable cost or ina timely manner. We have obtained and applied for U.S. and foreign trademark registrations for the “Fitbit” brand and a variety of our product names, and willcontinue to evaluate the registration of additional trademarks as appropriate. However, we cannot guarantee that any of our pending trademark or patentapplications will be approved by the applicable governmental authorities. Moreover, intellectual property protection may be unavailable or limited in some foreigncountries where laws or law enforcement practices may not protect our intellectual property rights as fully as in the United States, and it may be more difficult forus to successfully challenge the use of our intellectual property rights by other parties in these countries. Costly and time-consuming litigation could be necessaryto enforce and determine the scope of our proprietary rights, and our failure or inability to obtain or maintain trade secret protection or otherwise protect ourproprietary rights could adversely affect our business.
We are and may in the future be subject to patent infringement and trademark claims and lawsuits in various jurisdictions, and we cannot be certain that ourproducts or activities do not violate the patents, trademarks, or other intellectual property rights of third-party claimants. Companies in the technology industry andother patent, copyright, and trademark holders seeking to profit from royalties in connection with grants of licenses own large numbers of patents, copyrights,trademarks, domain names, and trade secrets and frequently commence litigation based on allegations of infringement, misappropriation, or other violations ofintellectual property or other rights. Companies and individuals may also be subject to criminal prosecution for trade secret theft under 18 U.S.C. section 1832. Aswe face increasing competition, the intellectual property rights claims against us and asserted by us have grown and will likely continue to grow. For example, wehad been involved in litigation with Jawbone and under a related federal criminal investigation concerning alleged theft of Jawbone’s trade secrets, which isdescribed in Note 7, “Commitments and Contingencies” in the notes to our consolidated financial statements.
We intend to vigorously defend and prosecute these litigation matters and, based on our review, we believe we have valid defenses and claims with respect toeach of these matters. However, litigation is inherently uncertain, and any judgment or injunctive relief entered against us or any adverse settlement couldmaterially and adversely impact our business, financial condition, operating
18
Table of Contents
results, and prospects. In addition, litigation can involve significant management time and attention and can be expensive, regardless of outcome. During the courseof these litigation matters, there may be announcements of the results of hearings and motions, and other interim developments related to the litigation matters. Ifsecurities analysts or investors regard these announcements as negative, the market price of our Class A common stock may decline.
Further, from time to time, we have received and may continue to receive letters from third parties alleging that we are infringing upon their intellectualproperty rights. Successful infringement claims against us could result in significant monetary liability, prevent us from selling some of our products and services,or require us to change our branding. In addition, resolution of claims may require us to redesign our products, license rights from third parties at a significantexpense, or cease using those rights altogether. We have also in the past and may in the future bring claims against third parties for infringing our intellectualproperty rights. Costs of supporting such litigation and disputes may be considerable, and there can be no assurances that a favorable outcome will be obtained.Patent infringement, trademark infringement, trade secret misappropriation, and other intellectual property claims and proceedings brought against us or broughtby us, whether successful or not, could require significant attention of our management and resources and have in the past and could further result in substantialcosts, harm to our brand, and have an adverse effect on our business.
We may experience difficulties implementing and maintaining our new enterprise resource planning system.
We recently implemented a new enterprise resource planning, or ERP, system. ERP implementations are complex and time-consuming, and involvesubstantial expenditures on maintenance activities and software. The ERP system is critical to our ability to provide important information to our management,obtain and deliver products, provide services and customer support, send invoices and track payments, fulfill contractual obligations, accurately maintain booksand records, provide accurate, timely and reliable reports on our financial and operating results or otherwise operate our business. ERP implementations alsorequire transformation of business and financial processes in order to reap the benefits of the ERP system; any such transformation involves risks inherent in theconversion to a new computer system, including loss of information and potential disruption to our normal operations. We may discover deficiencies in our designor implementation or maintenance of the new ERP system that could adversely affect our ability to process orders, ship products, provide services and customersupport, send invoices and track payments, fulfill contractual obligations, accurately maintain books and records, provide accurate, timely and reliable reports onour financial and operating results, or otherwise operate our business. Additionally, if the system does not operate as intended, the effectiveness of our internalcontrol over financial reporting could be adversely affected or our ability to assess it adequately could be delayed.
The market for wearable devices is still in the early stages of growth and if it does not continue to grow, grows more slowly than we expect, or fails to grow aslarge as we expect, our business and operating results would be harmed.
The market for wearable devices, which includes both connected health and fitness trackers and smartwatches, is still evolving and unproven and it isuncertain whether wearable devices will sustain high levels of demand and wide market acceptance. Our success will depend to a substantial extent on thewillingness of people to widely adopt these products and services. In part, adoption of our products and services will depend on the increasing prevalence ofwearable devices driven by the introduction of new form factors, software services and other offerings. However, it is not certain whether consumers will respondto these new form factors, and if our offerings fail to satisfy consumer preferences, our business may be adversely affected.
Furthermore, some individuals may be reluctant or unwilling to use wearable devices because they have concerns regarding the risks associated with dataprivacy and security. If the wider public does not perceive the benefits of our wearable devices or chooses not to adopt them as a result of concerns regardingprivacy or data security or for other reasons, then the market for these products and services may not further develop, it may develop more slowly than we expect,or it may not achieve the growth potential we expect it to, any of which would adversely affect our operating results. The development and growth of this marketmay not be sustained.
Our active user metric only represents the potential size and growth of our engaged user community and our activation metric is only an indicator of potentialrepeat behavior. Therefore, you should not rely on the active user metrics as an indicator of future retention of users, continual user engagement, or futurepayments by users or the activation metric as a guarantee of repeat purchasing behavior.
Our active user metric tracks the number of users who have an active Fitbit Coach subscription, who paired a wearable device or Aria scale to a Fitbitaccount, or who logged at least 100 steps or took a weight measurement within three months of the measurement date.
19
Table of Contents
The active user only represents the potential size or growth of our engaged user community. The active user metric does not provide information regardinghow frequently users engage with our platform or pay us, the extent to which inactive users are offset by new active users or how long a user remains active orcontinues to pay us. This metric is also not intended to be an indicator of device sales in any period and does not have a direct effect on our revenue and operatingresults since substantially all of our revenue to date has been derived from sales of our wearable devices. Therefore, you should not rely on our active user metricas an indicator of the level of retention of individual users in the future, continual user engagement or future payments by users.
Our activation metric tracks the first instance of a Fitbit device (excluding Aria, Aria 2, Flyer and other accessories) pairing to a user account during the threemonths ending on the date of measurement, as well as Fitbit users who previously activated another Fitbit device to his or her account.
The activation metric is only an indicator of potential repeat behavior. Actual repeat purchase behavior may depend on a number of factors, including but notlimited to our ability to anticipate and satisfy consumer preferences. Therefore, you should not rely on our activation metric as a guarantee of repeat purchasebehavior.
See the sections titled, “Management’s Discussion and Analysis of Financial Condition and Results of Operations-Key Business Metrics-Active Users,” and“Management’s Discussion and Analysis of Financial Condition and Results of Operations-Key Business Metrics-Activations” in this Annual Report on Form 10-K for additional information.
Our failure to comply with U.S. and foreign laws related to privacy, data security, and data protection, such as European data protection law, which requiresan adequate legal mechanism for the transfer of personal data outside of Europe, could adversely affect our financial condition, operating results, and ourbrand.
We are or may become subject to a variety of laws and regulations in the United States and abroad regarding privacy, data protection, and data security.These laws and regulations are continuously evolving and developing. The scope and interpretation of the laws that are or may be applicable to us are oftenuncertain and may be conflicting, particularly with respect to foreign laws.
In particular, there are numerous U.S. federal, state, and local laws and regulations and foreign laws and regulations regarding privacy and the collection,sharing, use, processing, disclosure, and protection of personal data. Such laws and regulations often have changes in scope, may be subject to differinginterpretations, and may be inconsistent among different jurisdictions. For example, in April 2016, the EU Parliament adopted a new data protection regulation,known as the General Data Protection Regulation, or GDPR, which will become effective in May 2018. The GDPR will include operational requirements forcompanies that receive or process personal data of residents of the European Union that are more stringent than those currently in place in the European Union, andthat will include significant penalties for non-compliance, including fines of up to €20 million or 4% of total worldwide revenue. The costs of compliance with, andother burdens imposed by, the GDPR may limit the use and adoption of our products and services and could have an adverse impact on our business.
Additionally, we rely on various legal mechanisms for transferring certain personal data outside of the European Economic Area, or EEA, including the EU-US Privacy Shield Framework, or Privacy Shield, and EU Standard Contractual Clauses, or SCCs. In November 2016, the US Department of Commerce approvedour Privacy Shield self-certification, which is available on the Department’s Privacy Shield website. Both Privacy Shield and the SCCs are the subject of ongoinglegal challenges in European courts. If we fail or are perceived to fail to meet the Privacy Shield principles or our obligations under the SCCs, or if any of theselegal mechanisms for transferring data from the EEA are invalidated by European courts or otherwise become defunct, EU data protection authorities or theFederal Trade Commission could bring enforcement actions seeking to prohibit or suspend our data transfers or alleging unfair or deceptive practices. In suchcases, we could be required to make potentially expensive changes to our information technology infrastructure and business operations, and we could face legalliability, fines, negative publicity, and resulting loss of business.
We strive to comply with all applicable laws, policies, legal obligations, and industry codes of conduct relating to privacy, data security, and data protection.However, given that the scope, interpretation, and application of these laws and regulations are often uncertain and may be conflicting, it is possible that theseobligations may be interpreted and applied in a manner that is inconsistent from one jurisdiction to another and may conflict with other rules or our practices. Anyfailure or perceived failure by us or third-party service-providers to comply with our privacy or security policies or privacy-related legal obligations, or the failureor perceived failure by third-party apps with which our users choose to share their Fitbit data to comply with their privacy policies or privacy-related legalobligations as they relate to the Fitbit data shared with them, or any compromise of security that results in the unauthorized release or transfer of personal data, mayresult in governmental enforcement actions, litigation, or negative publicity, and could have an adverse effect on our brand and operating results.
20
Table of Contents
Certain health-related laws and regulations such as the Health Insurance Portability and Accountability Act of 1996, or HIPAA, and the Health Information
Technology for Economic and Clinical Health Act, or HITECH, may have an impact on our business. For example, in September 2015 we announced that weintend to offer HIPAA compliant capabilities to certain customers of our corporate wellness offerings who are “covered entities” under HIPAA, which may includeour execution of Business Associate Agreements with such covered entities. In addition, changes in applicable laws and regulations may result in the user data wecollect being deemed protected health information, or PHI, under HIPAA and HITECH. Furthermore, because we accept payment via credit cards, we are subjectto payment card association operating rules and certification requirements, including the Payment Card Industry Data Security Standard, or PCI DSS. If we areunable to comply with the applicable privacy and security requirements under HIPAA, HITECH, or PCI DSS, or we fail to comply with Business AssociateAgreements that we enter into with covered entities, we could be subject to claims, legal liabilities, penalties, fines, and negative publicity, which could harm ouroperating results.
Governments are continuing to focus on privacy and data security and it is possible that new privacy or data security laws will be passed or existing laws willbe amended in a way that is material to our business. Any significant change to applicable laws, regulations, or industry practices regarding our users’ data couldrequire us to modify our services and features, possibly in a material manner, and may limit our ability to develop new products, services, and features. Althoughwe have made efforts to design our policies, procedures, and systems to comply with the current requirements of applicable state, federal, and foreign laws,changes to applicable laws and regulations in this area could subject us to additional regulation and oversight, any of which could significantly increase ouroperating costs. Our business and products are subject to a variety of additional U.S. and foreign laws and regulations that are central to our business; our failure to complywith these laws and regulations could harm our business or our operating results.
We are or may become subject to a variety of laws and regulations in the United States and abroad that involve matters central to our business, includinglaws and regulations regarding consumer protection, advertising, privacy, intellectual property, manufacturing, anti-bribery and anti-corruption, and economic orother trade prohibitions or sanctions.
The manufacturing, labeling, distribution, importation, marketing, and sale of our products are subject to extensive regulation by various U.S. state andfederal and foreign agencies, including the U.S. Consumer Product Safety Commission, or CPSC, FTC, FDA, Federal Communications Commission, and stateattorneys general, as well as by various other federal, state, provincial, local, and international regulatory authorities in the countries in which our products andservices are manufactured, distributed marketed or sold. If we fail to comply with any of these regulations, we could become subject to enforcement actions or theimposition of significant monetary fines, other penalties, or claims, which could harm our operating results or our ability to conduct our business.
The global nature of our business operations also create various domestic and foreign regulatory challenges and subject us to laws and regulations such asthe U.S. Foreign Corrupt Practices Act, or FCPA, the U.K. Bribery Act, and similar anti-bribery and anti-corruption laws in other jurisdictions, and our productsare also subject to U.S. export controls, including the U.S. Department of Commerce’s Export Administration Regulations and various economic and tradesanctions regulations established by the Treasury Department’s Office of Foreign Assets Controls. If we become liable under these laws or regulations, we may beforced to implement new measures to reduce our exposure to this liability. This may require us to expend substantial resources or to discontinue certain products orservices, which would negatively affect our business, financial condition, and operating results. In addition, the increased attention focused upon liability issues asa result of lawsuits, regulatory proceedings, and legislative proposals could harm our brand or otherwise impact the growth of our business. Any costs incurred as aresult of compliance or other liabilities under these laws or regulations could harm our business and operating results. Our international operations subject us to additional costs and risks, and our continued expansion internationally may not be successful.
We have entered into many international markets in a relatively short time and may enter into additional markets in the future. Outside of the United States,we currently have operations in Australia and a number of countries in Asia and Europe. There are significant costs and risks inherent in conducting business ininternational markets, including:
• establishing and maintaining effective controls at foreign locations and the associated increased costs;• adapting our technologies, products, and services to non-U.S. consumers’ preferences and customs;• variations in margins by geography;• increased competition from local providers of similar products;
21
Table of Contents
• longer sales or collection cycles in some countries;• compliance with foreign laws and regulations;• compliance with the laws of numerous taxing jurisdictions where we conduct business, potential double taxation of our international earnings, and
potentially adverse tax consequences due to U.S. and foreign tax laws as they relate to our international operations;• compliance with anti-bribery laws, such as the FCPA and the U.K. Bribery Act, by us, our employees, and our business partners;• complexity and other risks associated with current and future foreign legal requirements, including legal requirements related to consumer protection,
consumer product safety, and data privacy frameworks, such as the E.U. General Data Protection Regulation, and any applicable privacy and dataprotection laws in foreign jurisdictions where we currently conduct business or intend to conduct business in the future;
• currency exchange rate fluctuations and related effects on our operating results;• economic and political instability in some countries, particularly those in China where we have expanded;• the uncertainty of protection for intellectual property rights in some countries and practical difficulties of enforcing rights abroad;• tariffs and customs duties and the classification of our products by applicable governmental bodies; and• other costs of doing business internationally.
Our products are manufactured overseas and imported into the United States, the European Union, and other countries and may be subject to duties, tariffsand anti-dumping penalties imposed by applicable customs authorities. Those duties and tariffs are based on the classification of each of our products and isroutinely subject to review by the applicable customs authorities. We are unable to predict whether those authorities will agree with our classifications and if thoseauthorities do not agree with our classifications additional duties, tariffs or other trade restrictions may be imposed on the importation of our products. Such actionscould result in increases in the cost of our products generally and might adversely affect our sales and profitability.
These factors and other factors could harm our international operations and, consequently, materially impact our business, operating results, and financialcondition. Further, we may incur significant operating expenses as a result of our international expansion, and it may not be successful. We have limited experiencewith regulatory environments and market practices internationally, and we may not be able to penetrate or successfully operate in new markets. We may alsoencounter difficulty expanding into new international markets because of limited brand recognition in certain parts of the world, leading to delayed acceptance ofour products and services by users in these new international markets. If we are unable to continue to expand internationally and manage the complexity of ourglobal operations successfully, our financial condition and operating results could be adversely affected.
To date, we have derived substantially all of our revenue from sales of our wearable devices, and sales of our subscription-based premium services havehistorically accounted for less than 1% of our revenue.
To date, substantially all of our revenue has been derived from sales of our wearable devices, and we expect to continue to derive the substantial majority ofour revenue from sales of these devices for the foreseeable future. In 2016 and 2017, we derived less than 1% of our revenue from sales of our subscription-basedpremium services. However, in the future we expect to increase sales of subscriptions to these services. For example, in October 2017, we launched Fitbit Coach,our new premium guidance and coaching paid offering. If consumer reception is unfavorable or we are unable to successfully sell and market our premiumservices, we may be deprived of a potentially significant source of revenue in the future. In addition, sales of our premium services may lead to additional sales ofour wearable devices and user engagement with our platform. As a result, our future growth and financial performance may depend, in part, on our ability to sellmore subscriptions to our premium services.
We are regularly subject to general litigation, regulatory disputes, and government inquiries.
We are regularly subject to claims, lawsuits, including potential class actions, government investigations, and other proceedings involving competition andantitrust, intellectual property, privacy, consumer protection, accessibility claims, securities, tax, labor and employment, commercial disputes, and other matters.The number and significance of these disputes and inquiries have increased as our company has grown larger, our business has expanded in scope and geographicreach, and our products and services have increased in complexity.
The outcome and impact of such claims, lawsuits, government investigations, and proceedings cannot be predicted with certainty. Regardless of the outcome,such investigations and proceedings can have an adverse impact on us because of legal costs, diversion of management resources, and other factors. Determiningreserves for our pending litigation is a complex, fact-intensive process that is subject to judgment calls. It is possible that a resolution of one or more suchproceedings could require us to make
22
Table of Contents
substantial payments to satisfy judgments, fines, or penalties or to settle claims or proceedings, any of which could harm our business. These proceedings couldalso result in reputational harm, criminal sanctions, or orders preventing us from offering certain products, or services, or requiring a change in our businesspractices in costly ways, or requiring development of non-infringing or otherwise altered products or technologies. Any of these consequences could harm ourbusiness.
An economic downturn or economic uncertainty may adversely affect consumer discretionary spending and demand for our products and services.
Our products and services may be considered discretionary items for consumers. Factors affecting the level of consumer spending for such discretionaryitems include general economic conditions, and other factors, such as consumer confidence in future economic conditions, fears of recession, the availability andcost of consumer credit, levels of unemployment, and tax rates. As global economic conditions continue to be volatile or economic uncertainty remains, includingeconomic conditions resulting from recent volatility in European markets, trends in consumer discretionary spending also remain unpredictable and subject toreductions. Unfavorable economic conditions may lead consumers to delay or reduce purchases of our products and services and consumer demand for ourproducts and services may not grow as we expect. Our sensitivity to economic cycles and any related fluctuation in consumer demand for our products and servicesmay have an adverse effect on our operating results and financial condition.
Our financial performance is subject to risks associated with changes in the value of the U.S. dollar versus local currencies.
Our primary exposure to movements in foreign currency exchange rates relates to non-U.S. dollar denominated sales and operating expenses worldwide.Weakening of foreign currencies relative to the U.S. dollar adversely affects the U.S. dollar value of our foreign currency-denominated sales and earnings, andgenerally leads us to raise international pricing, potentially reducing demand for our products. In some circumstances, for competitive or other reasons, we maydecide not to raise local prices to fully offset the strengthening of the U.S. dollar, or at all, which would adversely affect the U.S. dollar value of our foreigncurrency denominated sales and earnings. Conversely, a strengthening of foreign currencies relative to the U.S. dollar, while generally beneficial to our foreigncurrency-denominated sales and earnings, could cause us to reduce international pricing, incur losses on our foreign currency derivative instruments, and incurincreased operating expenses, thereby limiting any benefit. Additionally, strengthening of foreign currencies may also increase our cost of product componentsdenominated in those currencies, thus adversely affecting gross margins.
We use derivative instruments, such as foreign currency forward contracts, to hedge certain exposures to fluctuations in foreign currency exchange rates. Theuse of such hedging activities may not offset any, or more than a portion, of the adverse financial effects of unfavorable movements in foreign exchange rates overthe limited time the hedges are in place. In addition, our counterparties may be unable to meet the terms of the agreements. We seek to mitigate this risk by limitingcounterparties to major financial institutions and by spreading the risk across several major financial institutions.
Changes in our tax rates or exposure to additional tax liabilities could adversely affect our earnings and financial condition.
We are subject to income taxes in the United States and foreign jurisdictions in which we do business. These foreign jurisdictions have statutory tax ratesdifferent from those in the United States. Accordingly, our provision for income taxes is subject to volatility and could be adversely affected by earnings beinglower than anticipated in countries where we have lower statutory rates and higher than anticipated in countries where we have higher statutory rates, by changes inforeign currency exchange rates, or by changes in the relevant tax, accounting, and other laws, regulations, principles, and interpretations, or by changes in thevaluation of our deferred tax assets and liabilities. As we operate in numerous taxing jurisdictions, the application of tax laws can be subject to diverging andsometimes conflicting interpretations by tax authorities of these jurisdictions.
Uncertainties in the interpretation and application of the 2017 Tax Cuts and Jobs Act could materially affect our tax obligations and effective tax rate.
On December 22, 2017, the U.S. Tax Cuts and Jobs Act of 2017, or the 2017 Tax Act, was signed into law and includes several key tax provisions thataffected us, including a reduction of the statutory corporate tax rate from 35% to 21% effective for tax years beginning after December 31, 2017, elimination ofcertain deductions, and changes to how the United States imposes income tax on multinational corporations, among others. The 2017 Tax Act requires complexcomputations to be performed that were not previously required in U.S. tax law, and preparation and analysis of information not previously required or regularlyproduced which will require significant judgment in interpreting accounting guidance for such items that is currently uncertain. We have provided our best estimateof the impact of the 2017 Tax Act in our year-end income tax provision in accordance with our understanding of the 2017 Tax Act. However, the interpretation ofissued or future guidance on how provisions of the 2017
23
Table of Contents
Tax Act will be applied or otherwise administered by the U.S. Treasury Department, the Internal Revenue Services, and other standard-setting bodies could bedifferent from our interpretation. As additional regulatory guidance is issued by the applicable taxing authorities, as accounting treatment is clarified, as weperform additional analysis on the application of the law, and as we refine estimates in calculating the effect, our final analysis, which will be recorded in theperiod completed, may be different from our current provisional amounts, which could materially affect our tax obligations and effective tax rate. In addition,foreign governments may enact tax laws in response to the 2017 Tax Act that could result in further changes to global taxation that may affect our financialposition and results of operations in the future.
If we are unable to protect our domain names, our brand, business, and operating results could be adversely affected.
We have registered domain names for websites, or URLs, that we use in our business, such as Fitbit.com. If we are unable to maintain our rights in thesedomain names, our competitors or other third parties could capitalize on our brand recognition by using these domain names for their own benefit. In addition,although we own the “Fitbit” domain name under various global top level domains such as .com and .net, as well as under various country-specific domains, wemight not be able to, or may choose not to, acquire or maintain other country-specific versions of the “Fitbit” domain name or other potentially similar URLs. Theregulation of domain names in the United States and elsewhere is generally conducted by Internet regulatory bodies and is subject to change. If we lose the abilityto use a domain name in a particular country, we may be forced to either incur significant additional expenses to market our solutions within that country, includingthe development of a new brand and the creation of new promotional materials, or elect not to sell our solutions in that country. Either result could substantiallyharm our business and operating results. Regulatory bodies could establish additional top-level domains, appoint additional domain name registrars, or modify therequirements for holding domain names. As a result, we may not be able to acquire or maintain the domain names that utilize the name “Fitbit” in all of thecountries in which we currently conduct or intend to conduct business. Further, the relationship between regulations governing domain names and laws protectingtrademarks and similar proprietary rights varies among jurisdictions and is unclear in some jurisdictions. Domain names similar to ours have already beenregistered in the United States and elsewhere, and we may be unable to prevent third parties from acquiring and using domain names that infringe, are similar to, orotherwise decrease the value of, our brand or our trademarks. Protecting and enforcing our rights in our domain names and determining the rights of others mayrequire litigation, which could result in substantial costs, divert management attention, and not be decided favorably to us. Our use of “open source” software could negatively affect our ability to sell our products and subject us to possible litigation.
A portion of the technologies we use incorporates “open source” software, and we may incorporate open source software in the future. From time to time,companies that incorporate open source software into their products have faced claims challenging the ownership of open source software or compliance with opensource license terms. Therefore, we could be subject to suits by parties claiming ownership of what we believe to be open source software or noncompliance withopen source licensing terms. Some open source licenses may subject us to certain unfavorable conditions, including requirements that we offer our products andservices that incorporate the open source software for no cost or that we make publicly available all or part of the source code for modifications or derivativeworks. Additionally, if a third-party software provider has incorporated open source software into software that we license or obtain from such provider, we couldbe required to disclose or provide at no cost all or part of our source code that incorporates such licensed software. If a copyright holder that distributes open sourcesoftware that we use or license or other third party were to allege that we had not complied with the conditions of the applicable license, we could be required toincur significant legal expenses defending against such allegations and may be required to release portions of our proprietary source code, subject to significantdamages, re-engineer our products and services, enjoined from the sale of our products and services that contained the open source software if re-engineering ourproducts or services cannot be accomplished on a timely basis, or take other remedial action that may divert resources away from our development efforts. Any ofthe foregoing could disrupt the distribution and sale of our products and services and harm our business.
We may engage in merger and acquisition activities, which could require significant management attention, disrupt our business, dilute stockholder value, andadversely affect our operating results.
As part of our business strategy, we may make investments in other companies, products, or technologies. For example, in 2016, we acquired assets fromCoin, Inc., Pebble Industries, Inc., and Vector Watch S.R.L and in 2018 we acquired Twine Health, Inc. We may not be able to find suitable acquisition candidatesand we may not be able to complete acquisitions on favorable terms, if at all. If we do complete acquisitions, we may not ultimately strengthen our competitiveposition or achieve our goals, and any acquisitions we complete could be viewed negatively by users or investors. In addition, if we fail to successfully integratesuch acquisitions, or the technologies associated with such acquisitions, into our company, the revenue and operating results of the combined company could beadversely affected.
24
Table of Contents
Acquisitions may disrupt our ongoing operations, divert management from their primary responsibilities, subject us to additional liabilities, increase ourexpenses, and adversely impact our business, financial condition, operating results, and cash flows. We may not successfully evaluate or utilize the acquiredtechnology and accurately forecast the financial impact of an acquisition transaction, including accounting charges. We would have to pay cash, incur debt, or issueequity securities to pay for any such acquisition, each of which may affect our financial condition or the value of our capital stock and could result in dilution toour stockholders. If we incur more debt it would result in increased fixed obligations and could also subject us to covenants or other restrictions that would impedeour ability to manage our operations. Additionally, we may receive indications of interest from other parties interested in acquiring some or all of our business. Thetime required to evaluate such indications of interest could require significant attention from management, disrupt the ordinary functioning of our business, andadversely affect our operating results.
There have been reports that some users of certain of our devices have experienced skin irritations, which could result in additional negative publicity orotherwise harm our business. In addition, some of our users have filed personal injury lawsuits against us relating to certain of our devices, which could divertmanagement’s attention from our operations and result in substantial legal fees and other costs.
Due to the nature of some of our wearable devices, some users have had in the past and may in the future experience skin irritations or other biocompatibilityissues not uncommon with jewelry or other wearable products that stay in contact with skin for extended periods of time. There have been reports of some users ofcertain of our devices experiencing skin irritations. This negative publicity could harm sales of our products and also adversely affect our relationships withretailers that sell our products, including causing them to be reluctant to continue to sell our products. In addition, some of our users have filed personal injurylawsuits against us relating to certain of our devices. While we do not believe that these lawsuits are material, due to the inherent uncertainties of litigation, wecannot accurately predict the ultimate outcome of any proceedings arising from such claims, and these actions or other third-party claims against us may result inthe diversion of our management’s time and attention from other aspects of our business and may cause us to incur substantial litigation or settlement costs. If largenumbers of users experience these problems, we could be subject to enforcement actions or the imposition of significant monetary fines, other penalties, orproceedings by the CPSC or other U.S. or foreign regulatory agencies and face additional personal injury or class action litigation, any of which could have amaterial adverse impact on our business, financial condition, and operating results.
We may be subject to CPSC recalls, regulatory proceedings and litigation in various jurisdictions, including multi-jurisdiction federal and state class actionand personal injury claims, which may require significant management attention and disrupt our business operations, and adversely affect our financialcondition, operating results, and our brand.
We face product liability, product safety and product compliance risks relating to the marketing, sale, use, and performance of our products. The products wesell must be designed and manufactured to be safe for their intended purposes. Certain of our products must comply with certain federal and state laws andregulations. For example, some of our products are subject to the Consumer Product Safety Act and the Consumer Product Safety Improvement Act, whichempower the CPSC. The CPSC is empowered to take action against hazards presented by consumer products, up to and including product recalls. We are requiredto report certain incidents related to the safety and compliance of our products to the CPSC, and failure to do so could result in a civil penalty.
Our products may, from time to time, be subject to recall for product safety and compliance reasons. For example, in March 2014, we recalled one of ourproducts, the Fitbit Force, after some of our users experienced allergic reactions to adhesives in the wristband. These reactions included skin irritation, rashes, andblistering. The recall had a negative impact on our operating results, primarily in our fourth quarter of 2013, the first quarter of 2014, and the fourth quarter of2015. We have provided and are continuing to provide full refunds to consumers who return the Fitbit Force. If returns of the Fitbit Force or other costs related tothe recall are higher than anticipated, we will be required to increase our reserves related to the recall which would negatively impact our operating results in thefuture.
The recall was conducted in conjunction with the CPSC, which monitored recall effectiveness and compliance. In addition to the financial impacts discussedelsewhere in this Annual Report on Form 10-K, this recall required us to collect a significant amount of information for the CPSC, which takes significant time andinternal and external resources.
A large number of lawsuits, including multi-jurisdiction complex federal and state class action and personal injury claims, were filed against us relating tothe Fitbit Force. These litigation matters required significant attention of our management and resources and disrupted the ordinary course of our businessoperations. We have settled all of the class action lawsuits and related individual personal injury claims. In the fourth quarter of 2015, we received proceeds fromthe insurance policies that apply to
25
Table of Contents
these claims and related legal fees, and we recorded an accrual for liabilities arising under these claims that was immaterial and falls within the amount of theinsurance proceeds received.
In addition, the CPSC previously conducted an investigation into several of our products. Although the CPSC did not find a substantial product hazard, therecan be no assurances that investigations will not be conducted or that product hazards or other defects will not be found in the future with respect to our products.The Fitbit Force product recall, regulatory proceedings, and litigation have had and may continue to have, and any future recalls, regulatory proceedings, andlitigation could have an adverse impact on our financial condition, operating results, and brand. Furthermore, because of the global nature of our product sales, inthe event we experience defects with respect to products sold outside the United States, we could become subject to recalls, regulatory proceedings, and litigationby foreign governmental agencies and private litigants, which could significantly increase the costs of managing any product issues. Any ongoing and futureregulatory proceedings or litigation, regardless of their merits, could further divert management’s attention from our operations and result in substantial legal feesand other costs.
Our Aria scales are subject to FDA and corresponding regulations, and sales of this product or future regulated products could be adversely affected if we failto comply with the applicable requirements.
Medical devices, including our Aria scales, are regulated by the FDA and corresponding state regulatory agencies, and we may have future products that areregulated as medical devices by the FDA. The medical device industry in the United States is regulated by governmental authorities, principally the FDA andcorresponding state regulatory agencies. Before we can market or sell a new regulated product or make a significant modification to an existing medical device inthe United States, we must comply with FDA Quality Management System regulations, and must obtain regulatory clearance or approval from the FDA, unless anexemption from pre-market review applies. In addition, certain future software functionality, whether standalone or embedded in existing or future devices, may beregulated as a medical device and require pre-market review and approval by the FDA. The process of obtaining regulatory clearances or approvals to market amedical device can be costly and time consuming, and we may not be able to obtain these clearances or approvals on a timely basis, or at all, for futureproducts. Any delay in, or failure to receive or maintain, clearance or approval for any medical device products under development could prevent us fromgenerating revenue from these products. Medical devices are also subject to numerous ongoing compliance requirements under the regulations of the FDA andcorresponding state regulatory agencies, which can be costly and time consuming. For example, under FDA regulations medical device manufacturers are requiredto, among other things, (i) establish a quality management system to help ensure that their products consistently meet applicable requirements and specifications,(ii) establish and maintain procedures for receiving, reviewing, and evaluating complaints, (iii) establish and maintain a corrective and preventive action procedure,(iv) report certain device-related adverse events and product problems to the FDA, and (v) report to the FDA the removal or correction of a distributed product. Ifwe experience any product problems requiring reporting to the FDA or if we otherwise fail to comply with applicable FDA regulations or the regulations ofcorresponding state regulatory agencies, with respect to our Aria scales or future regulated products, we could jeopardize our ability to sell our products and couldbe subject to enforcement actions such as fines, civil penalties, injunctions, recalls of products, delays in the introduction of products into the market, and refusal ofthe FDA or other regulators to grant future clearances or approvals, which could harm our reputation, business, operating results, and financial condition.
If we fail to maintain an effective system of disclosure controls and internal control over financial reporting, our ability to produce timely and accuratefinancial statements or comply with applicable regulations could be impaired.
We are subject to the reporting requirements of the Exchange Act, the Sarbanes-Oxley Act of 2002, or the Sarbanes-Oxley Act, and the rules and regulationsof the applicable listing standards of the New York Stock Exchange. We expect that the requirements of these rules and regulations will continue to increase ourlegal, accounting, and financial compliance costs, make some activities more difficult, time-consuming, and costly, and place strain on our personnel, systems, andresources.
The Sarbanes-Oxley Act requires, among other things, that we maintain effective disclosure controls and procedures and internal control over financialreporting. We are also required to make a formal assessment and provide an annual management report on the effectiveness of our internal control over financialreporting, which must be attested to by our independent registered public accounting firm. In order to maintain the effectiveness of our disclosure controls andprocedures and internal control over financial reporting, we have expended, and anticipate that we will continue to expend, resources, including accounting-relatedcosts and management oversight.
As disclosed in Item 9A of this Annual Report on Form 10-K, we did not maintain effective controls over the accuracy of invoicing gross revenue. Thisrepresented a material weakness that did not result in the identification of any adjustments to our annual or interim consolidated financial statements. A materialweakness is defined as a deficiency, or combination of deficiencies, in internal control over financial reporting, such that there is a reasonable possibility that amaterial misstatement of our annual
26
Table of Contents
or interim financial statements will not be prevented or detected on a timely basis. As a result of the material weakness identified, our management concluded thatour internal control over financial reporting was not effective as of December 31, 2017. Management is currently assessing a plan to remediate this materialweakness. However, we cannot assure you that we will be able to do so in a timely manner and such remediation efforts could require increased management timeand attention and resources.
Additional current controls and any new controls that we develop may become inadequate because of changes in conditions in our business. Further,additional weaknesses in our disclosure controls and internal control over financial reporting may be discovered in the future. Any failure to maintain or developeffective controls or any difficulties encountered in their implementation or improvement could harm our operating results or cause us to fail to meet our reportingobligations and may result in a restatement of our financial statements for prior periods. Any failure to maintain effective internal control over financial reportingalso could adversely affect the results of periodic management evaluations and annual independent registered public accounting firm attestation reports regardingthe effectiveness of our internal control over financial reporting. Ineffective disclosure controls and procedures and internal control over financial reporting couldalso cause investors to lose confidence in our reported financial and other information, which would likely have a negative effect on the trading price of ourClass A common stock. In addition, if we are unable to continue to meet these requirements, we may not be able to remain listed on the New York StockExchange. Our business is subject to the risk of earthquakes, fire, power outages, floods, and other catastrophic events, and to interruption by manmade problems such asterrorism.
Our business is vulnerable to damage or interruption from earthquakes, fires, floods, power losses, telecommunications failures, terrorist attacks, acts of war,human errors, break-ins, and similar events. The third-party systems and operations and contract manufacturers we rely on, such as the data centers we lease, aresubject to similar risks. For example, a significant natural disaster, such as an earthquake, fire, or flood, could have an adverse effect on our business, operatingresults, and financial condition, and our insurance coverage may be insufficient to compensate us for losses that may occur. Our corporate offices and one of ourdata center facilities are located in California, a state that frequently experiences earthquakes. In addition, the facilities at which our contract manufacturersmanufacture our products are located in parts of Asia that frequently endure typhoons and earthquakes. Acts of terrorism, which may be targeted at metropolitanareas that have higher population density than rural areas, could also cause disruptions in our or our suppliers’, contract manufacturers’, and logistics providers’businesses or the economy as a whole. We may not have sufficient protection or recovery plans in some circumstances, such as natural disasters affectingCalifornia or other locations where we have data centers or store significant inventory of our products. As we rely heavily on our data center facilities, computerand communications systems, and the Internet to conduct our business and provide high-quality customer service, these disruptions could negatively impact ourability to run our business and either directly or indirectly disrupt suppliers’ businesses, which could have an adverse effect on our business, operating results, andfinancial condition. If our estimates or judgments relating to our critical accounting policies prove to be incorrect, our operating results could be adversely affected.
The preparation of financial statements in conformity with U.S. GAAP requires management to make estimates and assumptions that affect the amountsreported in the consolidated financial statements and accompanying notes. We base our estimates on historical experience and on various other assumptions thatwe believe to be reasonable under the circumstances, as provided in “Management’s Discussion and Analysis of Financial Condition and Results of Operations” inthis Annual Report on Form 10-K. The results of these estimates form the basis for making judgments about the carrying values of assets, liabilities, and equity,and the amount of revenue and expenses that are not readily apparent from other sources. Significant assumptions and estimates used in preparing our consolidatedfinancial statements include those related to revenue recognition, inventories, product warranty reserves, business combinations, accounting for income taxes, andstock-based compensation expense. Our operating results may be adversely affected if our assumptions change or if actual circumstances differ from those in ourassumptions, which could cause our operating results to fall below the expectations of securities analysts and investors, resulting in a decline in the price of ourClass A common stock.
Our revolving credit facility provides our lenders with first-priority liens against substantially all of our assets, excluding our intellectual property, andcontains financial covenants and other restrictions on our actions, which could limit our operational flexibility and otherwise adversely affect our financialcondition.
In December 2015, we amended and restated our existing revolving credit facility and revolving credit and guarantee agreement into one senior credit facility.We further amended this agreement in May 2017. Our credit agreement restricts our ability to, among other things:
• use our accounts receivable, inventory, trademarks, and most of our other assets as security in other borrowings or transactions;
27
Table of Contents
• incur additional indebtedness;• sell certain assets;• guarantee certain obligations of third parties;• declare dividends or make certain distributions; and• undergo a merger or consolidation or other transactions.
Our credit agreement requires us to maintain a minimum liquidity reserve. Our ability to comply with these and other covenants is dependent upon a numberof factors, some of which are beyond our control.
Our failure to comply with the covenants or payment requirements, or the occurrence of other events specified in our credit agreement, could result in anevent of default under the credit agreement, which would give our lenders the right to terminate their commitments to provide additional loans under the creditagreement and to declare all borrowings outstanding, together with accrued and unpaid interest and fees, to be immediately due and payable. In addition, we havegranted our lenders first-priority liens against all of our assets, excluding our intellectual property, as collateral. Failure to comply with the covenants or otherrestrictions in the credit agreement could result in a default. If the debt under our credit agreement was to be accelerated, we may not have sufficient cash on handor be able to sell sufficient collateral to repay it, which would have an immediate adverse effect on our business and operating results. This could potentially causeus to cease operations and result in a complete loss of your investment in our Class A common stock.
We are exposed to fluctuations in the market values of our investments.
Credit ratings and pricing of our investments can be negatively affected by liquidity, credit deterioration, financial results, economic risk, political risk,sovereign risk, changes in interest rates, or other factors. As a result, the value and liquidity of our cash, cash equivalents, and marketable securities may fluctuatesubstantially. Therefore, although we have not realized any significant losses on its cash, cash equivalents, and marketable securities, future fluctuations in theirvalue could result in a significant realized loss, which could materially adversely affect our financial condition and operating results. Regulations related to conflict minerals may cause us to incur additional expenses and could limit the supply and increase the costs of certain metals used inthe manufacturing of our products.
We are subject to requirements under the Dodd-Frank Wall Street Reform and Consumer Protection Act of 2010, which will require us to conduct duediligence on and disclose whether or not our products contain conflict minerals. The implementation of these requirements could adversely affect the sourcing,availability, and pricing of the materials used in the manufacture of components used in our products. In addition, we will incur additional costs to comply with thedisclosure requirements, including costs related to conducting diligence procedures to determine the sources of minerals that may be used or necessary to theproduction of our products and, if applicable, potential changes to products, processes, or sources of supply as a consequence of such due diligence activities. It isalso possible that we may face reputational harm if we determine that certain of our products contain minerals not determined to be conflict free or if we are unableto alter our products, processes, or sources of supply to avoid such materials. Risks Related to Ownership of Our Class A Common Stock The market price of our Class A common stock has been and will likely continue to be volatile, and you could lose all or part of your investment.
The market price of our Class A common stock has been, and will likely continue to be, volatile. Since shares of our Class A common stock were sold in ourIPO in June 2015 at a price of $20.00 per share, our stock price has ranged from $4.90 to $51.90 through December 31, 2017. In addition, the trading prices of thesecurities of technology companies in general have been highly volatile.
The market price of our Class A common stock may continue to fluctuate significantly in response to numerous factors, many of which are beyond ourcontrol, including:
• overall performance of the equity markets;• actual or anticipated fluctuations in our revenue and other operating results;• changes in the financial projections we may provide to the public or our failure to meet these projections;• failure of securities analysts to initiate or maintain coverage of us, changes in financial estimates by any securities analysts who follow our company, or
our failure to meet these estimates or the expectations of investors;• recruitment or departure of key personnel;
28
Table of Contents
• the economy as a whole and market conditions in our industry;• negative publicity related to problems in our manufacturing or the real or perceived quality of our products, as well as the failure to timely launch new
products that gain market acceptance;• rumors and market speculation involving us or other companies in our industry;• announcements by us or our competitors of significant technical innovations, acquisitions, strategic partnerships, joint ventures, or capital commitments;• new laws or regulations or new interpretations of existing laws or regulations applicable to our business;• lawsuits threatened or filed against us;• other events or factors, including those resulting from war, incidents of terrorism, or responses to these events; and• sales of shares of our Class A common stock by us or our stockholders.
In addition, the stock markets have experienced extreme price and volume fluctuations that have affected and continue to affect the market prices of equitysecurities of many companies. Stock prices of many companies have fluctuated in a manner unrelated or disproportionate to the operating performance of thosecompanies. We are currently subject to securities litigation, which is described in Note 7, “Commitments and Contingencies” in the notes to our consolidatedfinancial statements. This or any future securities litigation could subject us to substantial costs, divert resources and the attention of management from ourbusiness, and adversely affect our business.
Sales of substantial amounts of our Class A common stock in the public markets, or the perception that they might occur, could cause the market price of ourClass A common stock to decline.
Sales of a substantial number of shares of our Class A common stock into the public market, particularly sales by our directors, executive officers, andprincipal stockholders, or the perception that these sales might occur, could cause the market price of our Class A common stock to decline.
As of December 31, 2017, there were 238.8 million shares of Class A and Class B common stock outstanding. All shares of our common stock are availablefor sale in the public market, subject in certain cases to volume limitations under Rule 144 under the Securities Act of 1933, as amended, or the Securities Act,various vesting agreements, as well as our insider trading policy.
In addition, as of December 31, 2017, we had stock options outstanding that, if fully exercised, would result in the issuance of 1.7 million shares of Class Acommon stock and 19.6 million shares of Class B common stock (which shares of Class B common stock generally convert to Class A common stock upon theirsale or transfer). We also had RSUs outstanding as of December 31, 2017 that may be settled for 19.1 million shares of Class A common stock and 0.1 millionshares of Class B common stock. As of December 31, 2017, all of the shares issuable upon the exercise of stock options or settlement of RSUs and the sharesreserved for future issuance under our equity incentive plans, are registered for public resale under the Securities Act. Accordingly, these shares may be freely soldin the public market upon issuance subject to applicable vesting requirements.
In addition, certain holders of our capital stock have rights, subject to some conditions, to require us to file registration statements for the public resale oftheir shares or to include such shares in registration statements that we may file for us or other stockholders.
The dual class structure of our common stock has the effect of concentrating voting control with our founders and certain other holders of our Class Bcommon stock, including our directors, executive officers, and significant stockholders. This will limit or preclude your ability to influence corporate matters,including the election of directors, amendments of our organizational documents, and any merger, consolidation, sale of all or substantially all of our assets,or other major corporate transaction requiring stockholder approval.
Our Class B common stock has ten votes per share and our Class A common stock has one vote per share. As of December 31, 2017, our directors, executiveofficers, and holders of more than 5% of our common stock, and their respective affiliates, held a substantial majority of the voting power of our capital stock.Because of the ten-to-one voting ratio between our Class B and Class A common stock, our co-founders, who currently serve as our chief executive officer andchief technology officer, and certain other holders of our Class B common stock collectively will control a majority of the combined voting power of our commonstock and therefore are able to control all matters submitted to our stockholders for approval until the earlier of June 17, 2027 or the date the holders of a majorityof our Class B common stock choose to convert their shares. This concentrated control will limit or preclude your ability to influence corporate matters for theforeseeable future, including the election of directors, amendments of our organizational documents, and any merger, consolidation, sale of all or substantially allof our assets, or other major corporate transaction requiring stockholder approval. In addition, this may prevent or discourage unsolicited acquisition proposals oroffers for our capital stock that you may feel are in your best interest as one of our stockholders.
29
Table of Contents
Future transfers by holders of Class B common stock will generally result in those shares converting to Class A common stock, subject to limited exceptions,
such as certain transfers effected for estate planning purposes. The conversion of Class B common stock to Class A common stock will have the effect, over time,of increasing the relative voting power of those holders of Class B common stock who retain their shares in the long term.
If securities or industry analysts do not publish research, or publish inaccurate or unfavorable research, about our business, the price of our Class A commonstock and trading volume could decline.
The trading market for our Class A common stock depends in part on the research and reports that securities or industry analysts publish about us or ourbusiness. We do not have any control over these analysts. If industry analysts cease coverage of us, the trading price for our common stock would be negativelyaffected. If one or more of the analysts who cover us downgrade our Class A common stock or publish inaccurate or unfavorable research about our business, ourcommon stock price would likely decline. If one or more of these analysts’ cease coverage of us or fail to publish reports on us regularly, demand for our Class Acommon stock could decrease, which might cause our Class A common stock price and trading volume to decline.
We do not intend to pay dividends for the foreseeable future.
We have never declared or paid any cash dividends on our common stock and do not intend to pay any cash dividends in the foreseeable future. Weanticipate that we will retain all of our future earnings for use in the development of our business and for general corporate purposes. Any determination to paydividends in the future will be at the discretion of our board of directors. Accordingly, investors must rely on sales of their common stock after price appreciation,which may never occur, as the only way to realize any future gains on their investments. In addition, our credit facility contains restrictions on our ability to paydividends. Provisions in our charter documents and under Delaware law could make an acquisition of our company more difficult, limit attempts by our stockholders toreplace or remove our current management, limit our stockholders’ ability to obtain a favorable judicial forum for disputes with us or our directors, officers, oremployees, and limit the market price of our common stock.
Provisions in our restated certificate of incorporation and restated bylaws may have the effect of delaying or preventing a change of control or changes in ourmanagement. Our restated certificate of incorporation and restated bylaws include provisions that:
• provide that our board of directors will be classified into three classes of directors with staggered three-year terms at such time as the outstanding sharesof our Class B common stock represent less than a majority of the combined voting power of our common stock;
• permit the board of directors to establish the number of directors and fill any vacancies and newly created directorships;• require super-majority voting to amend some provisions in our restated certificate of incorporation and restated bylaws;• authorize the issuance of “blank check” preferred stock that our board of directors could use to implement a stockholder rights plan;• provide that only the chairman of our board of directors, our chief executive officer, or a majority of our board of directors will be authorized to call a
special meeting of stockholders;• provide for a dual class common stock structure in which holders of our Class B common stock have the ability to control the outcome of matters
requiring stockholder approval, even if they own significantly less than a majority of the outstanding shares of our Class A and Class B common stock,including the election of directors and significant corporate transactions, such as a merger or other sale of our company or its assets;
• prohibit stockholder action by written consent, which requires all stockholder actions to be taken at a meeting of our stockholders;• provide that the board of directors is expressly authorized to make, alter, or repeal our bylaws; and• establish advance notice requirements for nominations for election to our board of directors or for proposing matters that can be acted upon by
stockholders at annual stockholder meetings.
In addition, our restated certificate of incorporation provides that the Court of Chancery of the State of Delaware will be the exclusive forum for: anyderivative action or proceeding brought on our behalf; any action asserting a breach of fiduciary duty; any action asserting a claim against us arising pursuant to theDelaware General Corporation Law, our restated certificate of incorporation, or our restated bylaws; or any action asserting a claim against us that is governed bythe internal affairs doctrine. This choice of forum provision may limit a stockholder’s ability to bring a claim in a judicial forum that it finds favorable for disputeswith us or any of our directors, officers, or other employees, which may discourage lawsuits with respect to such claims.
30
Table of Contents
Alternatively, if a court were to find the choice of forum provision contained in our restated certificate of incorporation to be inapplicable or unenforceable in anaction, we may incur additional costs associated with resolving such action in other jurisdictions, which could harm our business, operating results, and financialcondition.
Moreover, Section 203 of the Delaware General Corporation Law may discourage, delay, or prevent a change in control of our company. Section 203imposes certain restrictions on mergers, business combinations, and other transactions between us and holders of 15% or more of our common stock.
Item 1B. Unresolved Staff Comments
None.
Item 2. Properties
We are a global company with our corporate headquarters located in San Francisco, California. Our headquarters facilities in San Francisco compriseapproximately 366,000 square feet of space pursuant to several leases that expire at various dates through June 2024. Our corporate headquarters serve as theprincipal facilities for our administrative, sales, marketing, product development, and customer support groups. We also lease additional office space in SanFrancisco and around the world for various product development, operational and support purposes. We believe our existing facilities are adequate to meet ourcurrent requirements. If we were to require additional space, we believe we will be able to obtain such space on acceptable and commercially reasonable terms.
Item 3. Legal Proceedings
For a discussion of legal proceedings, see Note 7, “Commitments and Contingencies,” in the notes to our consolidated financial statements included in PartII, Item 8 of this Annual Report on Form 10-K, which is incorporated herein by reference.
Further, we are and, from time to time, we may become, involved in legal proceedings or be subject to claims arising in the ordinary course of our business.We are not presently a party to any other legal proceedings that in the opinion of our management, if determined adversely to us, would individually or takentogether have a material adverse effect on our business, operating results, financial condition, or cash flows.
Item 4. Mine Safety Disclosures
None.
PART II
Item 5. Market for Registrant’s Common Equity, Related Stockholder Matters, and Issuer Purchases of Equity Securities
Price Range of Common Stock
Our Class A common stock has been listed on the New York Stock Exchange under the symbol “FIT” since June 18, 2015. Prior to that date, there was nopublic trading market for our Class A common stock. The following table sets forth for the periods indicated the high and low sale prices per share of our Class Acommon stock as reported on the New York Stock Exchange:
31
Table of Contents
High LowFiscal Year 2017 Fourth Quarter $ 7.32 $ 5.70Third Quarter $ 7.09 $ 5.00Second Quarter $ 6.80 $ 4.90First Quarter $ 8.40 $ 5.31Fiscal Year 2016 Fourth Quarter $ 15.08 $ 7.20Third Quarter $ 17.18 $ 12.05Second Quarter $ 18.85 $ 11.65First Quarter $ 30.96 $ 11.91
Our Class B common stock is neither listed nor traded.
Holders of Record
As of December 31, 2017 , we had 33 holders of record of our Class A common stock. Because many of our shares of Class A common stock are held bybrokers and other institutions on behalf of stockholders, we are unable to estimate the total number of stockholders represented by these record holders. As ofDecember 31, 2017 , we had 29 holders of record of our Class B common stock.
Dividends
We have never declared or paid any cash dividends on our capital stock. We currently intend to retain any future earnings and do not expect to pay any cashdividends on our common stock for the foreseeable future. Any determination to pay dividends in the future will be at the discretion of our board of directors,subject to applicable laws, and will depend on our financial condition, operating results, capital requirements, general business conditions, and other factors thatour board of directors considers relevant. In addition, the terms of our credit facility contains restrictions on our ability to declare and pay cash dividends.
Securities Authorized for Issuance under Equity Compensation Plans
The information required by this item with respect to our equity compensation plans is incorporated by reference to our Proxy Statement for the 2018 AnnualMeeting of Stockholders to be filed with the SEC within 120 days of the fiscal year ended December 31, 2017 .
Stock Performance Graph
The following graph compares the cumulative total return on our Class A common stock with that of the S&P 500 Index and the Nasdaq Composite Index.The period shown commences on June 18, 2015, our initial public offering date, and ends on December 31, 2017 , the end of our last fiscal year. The graphassumes $100 was invested at the close of market on June 18, 2015 in our Class A common stock, the S&P 500 Index and the Nasdaq Composite Index, andassumes the reinvestment of any dividends. The stock price performance on the following graph is not intended to forecast or be indicative of future stock priceperformance of our Class A common stock.
32
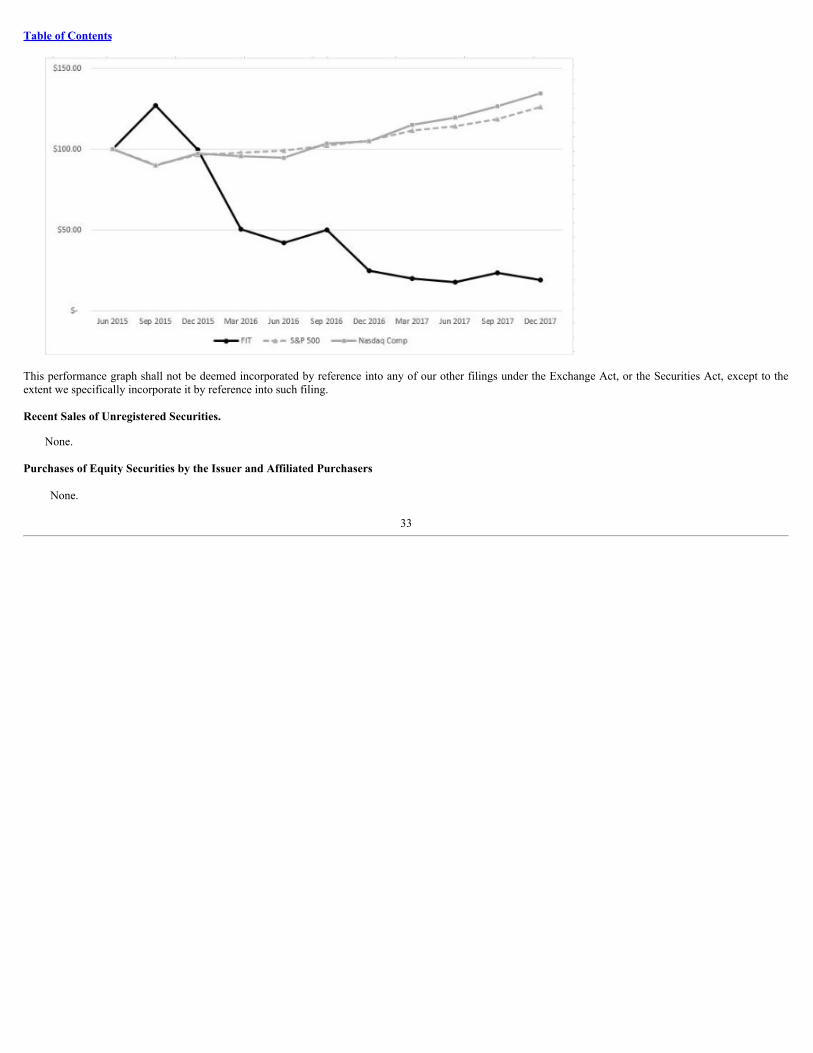
Table of Contents
This performance graph shall not be deemed incorporated by reference into any of our other filings under the Exchange Act, or the Securities Act, except to theextent we specifically incorporate it by reference into such filing.
Recent Sales of Unregistered Securities.
None.
Purchases of Equity Securities by the Issuer and Affiliated Purchasers
None.
33
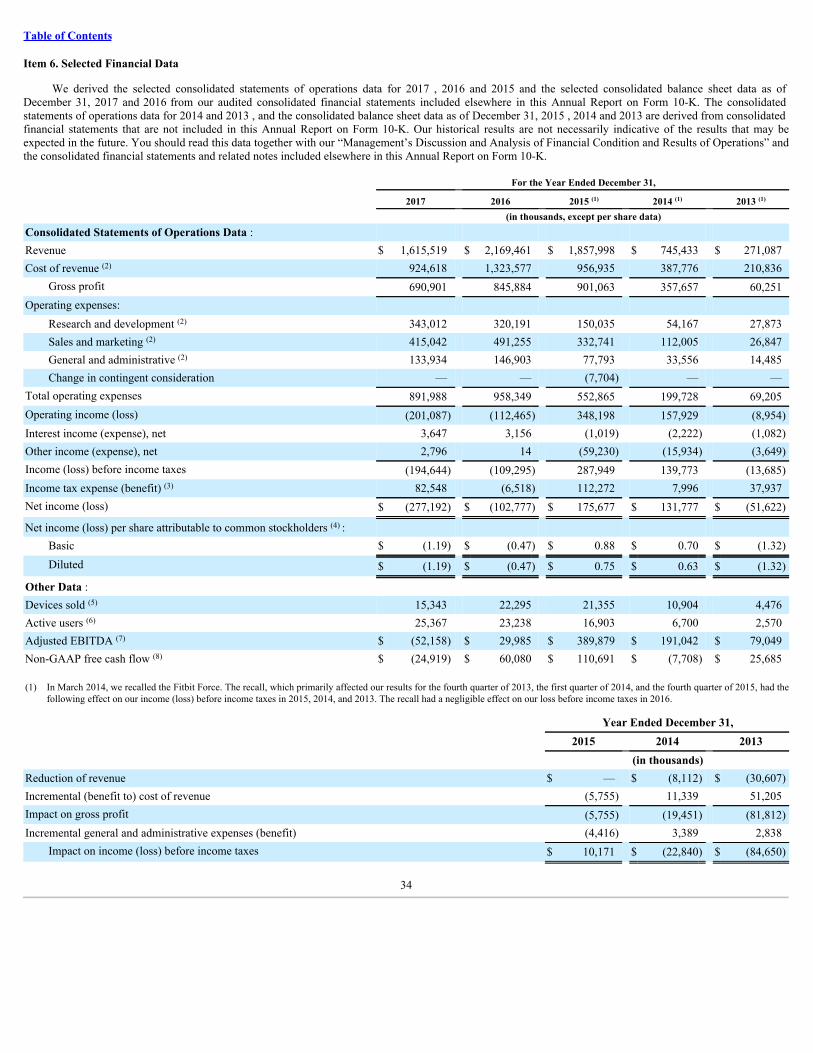
Table of Contents
Item 6. Selected Financial Data
We derived the selected consolidated statements of operations data for 2017 , 2016 and 2015 and the selected consolidated balance sheet data as ofDecember 31, 2017 and 2016 from our audited consolidated financial statements included elsewhere in this Annual Report on Form 10-K. The consolidatedstatements of operations data for 2014 and 2013 , and the consolidated balance sheet data as of December 31, 2015 , 2014 and 2013 are derived from consolidatedfinancial statements that are not included in this Annual Report on Form 10-K. Our historical results are not necessarily indicative of the results that may beexpected in the future. You should read this data together with our “Management’s Discussion and Analysis of Financial Condition and Results of Operations” andthe consolidated financial statements and related notes included elsewhere in this Annual Report on Form 10-K.
For the Year Ended December 31,
2017 2016 2015 (1) 2014 (1) 2013 (1)
(in thousands, except per share data)Consolidated Statements of Operations Data : Revenue $ 1,615,519 $ 2,169,461 $ 1,857,998 $ 745,433 $ 271,087Cost of revenue (2) 924,618 1,323,577 956,935 387,776 210,836
Gross profit 690,901 845,884 901,063 357,657 60,251Operating expenses:
Research and development (2) 343,012 320,191 150,035 54,167 27,873Sales and marketing (2) 415,042 491,255 332,741 112,005 26,847General and administrative (2) 133,934 146,903 77,793 33,556 14,485Change in contingent consideration — — (7,704) — —
Total operating expenses 891,988 958,349 552,865 199,728 69,205Operating income (loss) (201,087) (112,465) 348,198 157,929 (8,954)Interest income (expense), net 3,647 3,156 (1,019) (2,222) (1,082)Other income (expense), net 2,796 14 (59,230) (15,934) (3,649)Income (loss) before income taxes (194,644) (109,295) 287,949 139,773 (13,685)Income tax expense (benefit) (3) 82,548 (6,518) 112,272 7,996 37,937Net income (loss) $ (277,192) $ (102,777) $ 175,677 $ 131,777 $ (51,622)
Net income (loss) per share attributable to common stockholders (4) : Basic $ (1.19) $ (0.47) $ 0.88 $ 0.70 $ (1.32)Diluted $ (1.19) $ (0.47) $ 0.75 $ 0.63 $ (1.32)
Other Data : Devices sold (5) 15,343 22,295 21,355 10,904 4,476Active users (6) 25,367 23,238 16,903 6,700 2,570Adjusted EBITDA (7) $ (52,158) $ 29,985 $ 389,879 $ 191,042 $ 79,049Non-GAAP free cash flow (8) $ (24,919) $ 60,080 $ 110,691 $ (7,708) $ 25,685
(1) In March 2014, we recalled the Fitbit Force. The recall, which primarily affected our results for the fourth quarter of 2013, the first quarter of 2014, and the fourth quarter of 2015, had thefollowing effect on our income (loss) before income taxes in 2015, 2014, and 2013. The recall had a negligible effect on our loss before income taxes in 2016.
Year Ended December 31, 2015 2014 2013 (in thousands)Reduction of revenue $ — $ (8,112) $ (30,607)Incremental (benefit to) cost of revenue (5,755) 11,339 51,205Impact on gross profit (5,755) (19,451) (81,812)Incremental general and administrative expenses (benefit) (4,416) 3,389 2,838
Impact on income (loss) before income taxes $ 10,171 $ (22,840) $ (84,650)
34
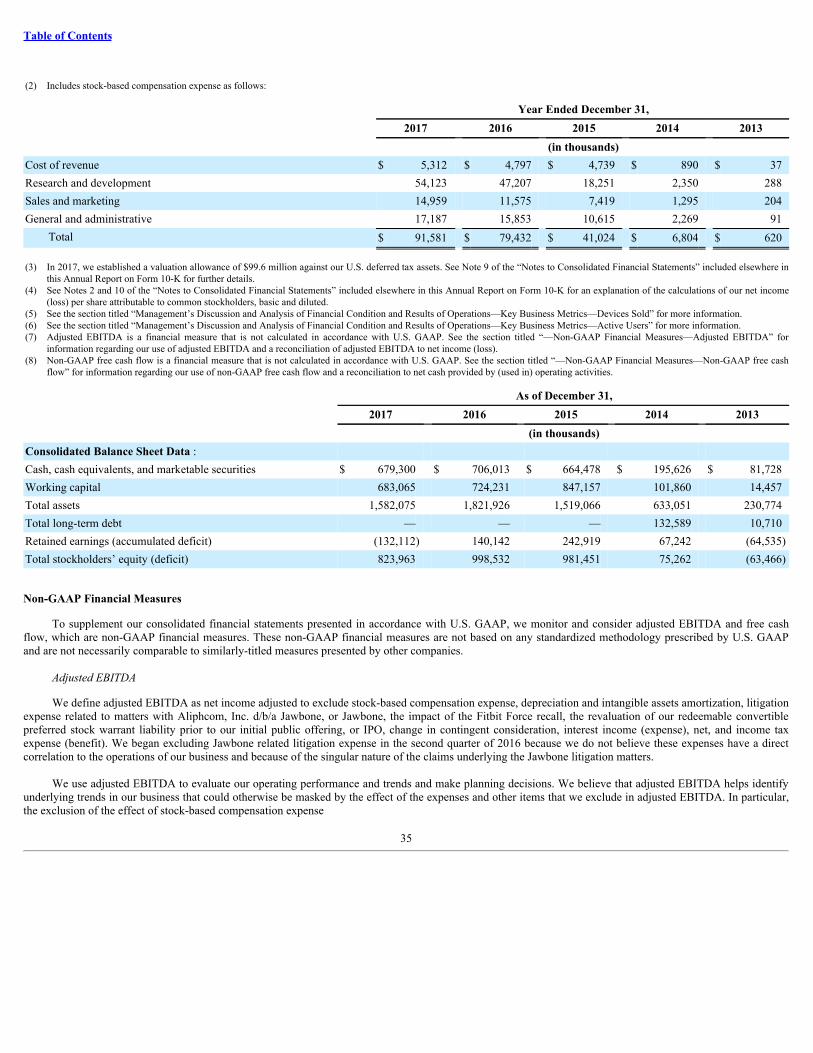
Table of Contents
(2) Includes stock-based compensation expense as follows:
Year Ended December 31, 2017 2016 2015 2014 2013 (in thousands)Cost of revenue $ 5,312 $ 4,797 $ 4,739 $ 890 $ 37Research and development 54,123 47,207 18,251 2,350 288Sales and marketing 14,959 11,575 7,419 1,295 204General and administrative 17,187 15,853 10,615 2,269 91
Total $ 91,581 $ 79,432 $ 41,024 $ 6,804 $ 620 (3) In 2017, we established a valuation allowance of $99.6 million against our U.S. deferred tax assets. See Note 9 of the “Notes to Consolidated Financial Statements” included elsewhere in
this Annual Report on Form 10-K for further details.(4) See Notes 2 and 10 of the “Notes to Consolidated Financial Statements” included elsewhere in this Annual Report on Form 10-K for an explanation of the calculations of our net income
(loss) per share attributable to common stockholders, basic and diluted.(5) See the section titled “Management’s Discussion and Analysis of Financial Condition and Results of Operations—Key Business Metrics—Devices Sold” for more information.(6) See the section titled “Management’s Discussion and Analysis of Financial Condition and Results of Operations—Key Business Metrics—Active Users” for more information.(7) Adjusted EBITDA is a financial measure that is not calculated in accordance with U.S. GAAP. See the section titled “—Non-GAAP Financial Measures—Adjusted EBITDA” for
information regarding our use of adjusted EBITDA and a reconciliation of adjusted EBITDA to net income (loss).(8) Non-GAAP free cash flow is a financial measure that is not calculated in accordance with U.S. GAAP. See the section titled “—Non-GAAP Financial Measures—Non-GAAP free cash
flow” for information regarding our use of non-GAAP free cash flow and a reconciliation to net cash provided by (used in) operating activities.
As of December 31, 2017 2016 2015 2014 2013 (in thousands)Consolidated Balance Sheet Data : Cash, cash equivalents, and marketable securities $ 679,300 $ 706,013 $ 664,478 $ 195,626 $ 81,728Working capital 683,065 724,231 847,157 101,860 14,457Total assets 1,582,075 1,821,926 1,519,066 633,051 230,774Total long-term debt — — — 132,589 10,710Retained earnings (accumulated deficit) (132,112) 140,142 242,919 67,242 (64,535)Total stockholders’ equity (deficit) 823,963 998,532 981,451 75,262 (63,466)
Non-GAAP Financial Measures
To supplement our consolidated financial statements presented in accordance with U.S. GAAP, we monitor and consider adjusted EBITDA and free cashflow, which are non-GAAP financial measures. These non-GAAP financial measures are not based on any standardized methodology prescribed by U.S. GAAPand are not necessarily comparable to similarly-titled measures presented by other companies.
Adjusted EBITDA
We define adjusted EBITDA as net income adjusted to exclude stock-based compensation expense, depreciation and intangible assets amortization, litigationexpense related to matters with Aliphcom, Inc. d/b/a Jawbone, or Jawbone, the impact of the Fitbit Force recall, the revaluation of our redeemable convertiblepreferred stock warrant liability prior to our initial public offering, or IPO, change in contingent consideration, interest income (expense), net, and income taxexpense (benefit). We began excluding Jawbone related litigation expense in the second quarter of 2016 because we do not believe these expenses have a directcorrelation to the operations of our business and because of the singular nature of the claims underlying the Jawbone litigation matters.
We use adjusted EBITDA to evaluate our operating performance and trends and make planning decisions. We believe that adjusted EBITDA helps identifyunderlying trends in our business that could otherwise be masked by the effect of the expenses and other items that we exclude in adjusted EBITDA. In particular,the exclusion of the effect of stock-based compensation expense
35
Table of Contents
and certain expenses in calculating adjusted EBITDA can provide a useful measure for period-to-period comparisons of our business. Accordingly, we believe thatadjusted EBITDA provides useful information to investors and others in understanding and evaluating our operating results, enhancing the overall understanding ofour past performance and future prospects, and allowing for greater transparency with respect to a key financial metric used by our management in its financial andoperational decision-making.
Adjusted EBITDA is not prepared in accordance with U.S. GAAP, and should not be considered in isolation of, or as an alternative to, measures prepared inaccordance with U.S. GAAP. There are a number of limitations related to the use of this non-GAAP financial measure rather than net income (loss), which is thenearest U.S. GAAP equivalent of adjusted EBITDA. Some of these limitations are:
• adjusted EBITDA excludes stock-based compensation expense, which has been, and will continue to be for the foreseeable future, a significant recurringexpense for our business and an important part of our compensation strategy;
• adjusted EBITDA excludes depreciation and intangible assets amortization expense and, although these are non-cash expenses, the assets beingdepreciated and amortized may have to be replaced in the future;
• adjusted EBITDA excludes external litigation expenses to support our legal proceedings with Jawbone, which may continue to be a recurring expense;• adjusted EBITDA excludes the Fitbit Force recall, which primarily impacted our results for the fourth quarter of 2013, the first quarter of 2014, and the
fourth quarter of 2015;• adjusted EBITDA excludes the impact of our restructuring in 2017, which has not been a recurring expense;• adjusted EBITDA excludes the revaluation of our redeemable convertible preferred stock warrant liability, which was a historically recurring non-cash
charge prior to our initial public offering, but will not recur in the periods following the completion of our initial public offering;• adjusted EBITDA excludes change in contingent consideration, a non-recurring benefit received for the reversal of a contingent liability incurred in
connection with the acquisition of FitStar;• adjusted EBITDA excludes interest expense, or the cash requirements necessary to service interest or principal payments on our debt, which reduces cash
available to us;• adjusted EBITDA excludes income tax expense (benefit); and• the expenses and other items that we exclude in our calculation of adjusted EBITDA may differ from the expenses and other items, if any, that other
companies may exclude from adjusted EBITDA when they report their operating results.
Because of these limitations, adjusted EBITDA should be considered along with other operating and financial performance measures presented inaccordance with U.S. GAAP.
36
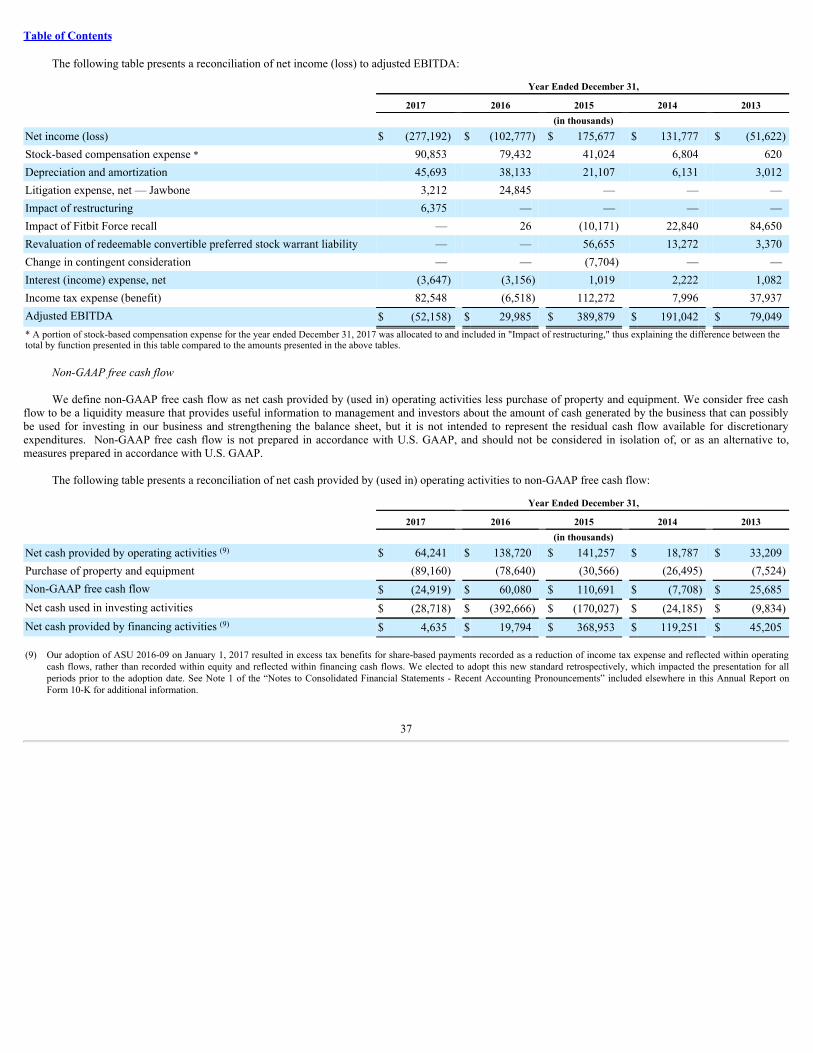
Table of Contents
The following table presents a reconciliation of net income (loss) to adjusted EBITDA:
Year Ended December 31,
2017 2016 2015 2014 2013 (in thousands)Net income (loss) $ (277,192) $ (102,777) $ 175,677 $ 131,777 $ (51,622)Stock-based compensation expense * 90,853 79,432 41,024 6,804 620Depreciation and amortization 45,693 38,133 21,107 6,131 3,012Litigation expense, net — Jawbone 3,212 24,845 — — —Impact of restructuring 6,375 — — — —Impact of Fitbit Force recall — 26 (10,171) 22,840 84,650Revaluation of redeemable convertible preferred stock warrant liability — — 56,655 13,272 3,370Change in contingent consideration — — (7,704) — —Interest (income) expense, net (3,647) (3,156) 1,019 2,222 1,082Income tax expense (benefit) 82,548 (6,518) 112,272 7,996 37,937Adjusted EBITDA $ (52,158) $ 29,985 $ 389,879 $ 191,042 $ 79,049* A portion of stock-based compensation expense for the year ended December 31, 2017 was allocated to and included in "Impact of restructuring," thus explaining the difference between thetotal by function presented in this table compared to the amounts presented in the above tables.
Non-GAAP free cash flow
We define non-GAAP free cash flow as net cash provided by (used in) operating activities less purchase of property and equipment. We consider free cashflow to be a liquidity measure that provides useful information to management and investors about the amount of cash generated by the business that can possiblybe used for investing in our business and strengthening the balance sheet, but it is not intended to represent the residual cash flow available for discretionaryexpenditures. Non-GAAP free cash flow is not prepared in accordance with U.S. GAAP, and should not be considered in isolation of, or as an alternative to,measures prepared in accordance with U.S. GAAP.
The following table presents a reconciliation of net cash provided by (used in) operating activities to non-GAAP free cash flow:
Year Ended December 31,
2017 2016 2015 2014 2013 (in thousands)Net cash provided by operating activities (9) $ 64,241 $ 138,720 $ 141,257 $ 18,787 $ 33,209Purchase of property and equipment (89,160) (78,640) (30,566) (26,495) (7,524)Non-GAAP free cash flow $ (24,919) $ 60,080 $ 110,691 $ (7,708) $ 25,685Net cash used in investing activities $ (28,718) $ (392,666) $ (170,027) $ (24,185) $ (9,834)Net cash provided by financing activities (9) $ 4,635 $ 19,794 $ 368,953 $ 119,251 $ 45,205
(9) Our adoption of ASU 2016-09 on January 1, 2017 resulted in excess tax benefits for share-based payments recorded as a reduction of income tax expense and reflected within operatingcash flows, rather than recorded within equity and reflected within financing cash flows. We elected to adopt this new standard retrospectively, which impacted the presentation for allperiods prior to the adoption date. See Note 1 of the “Notes to Consolidated Financial Statements - Recent Accounting Pronouncements” included elsewhere in this Annual Report onForm 10-K for additional information.
37
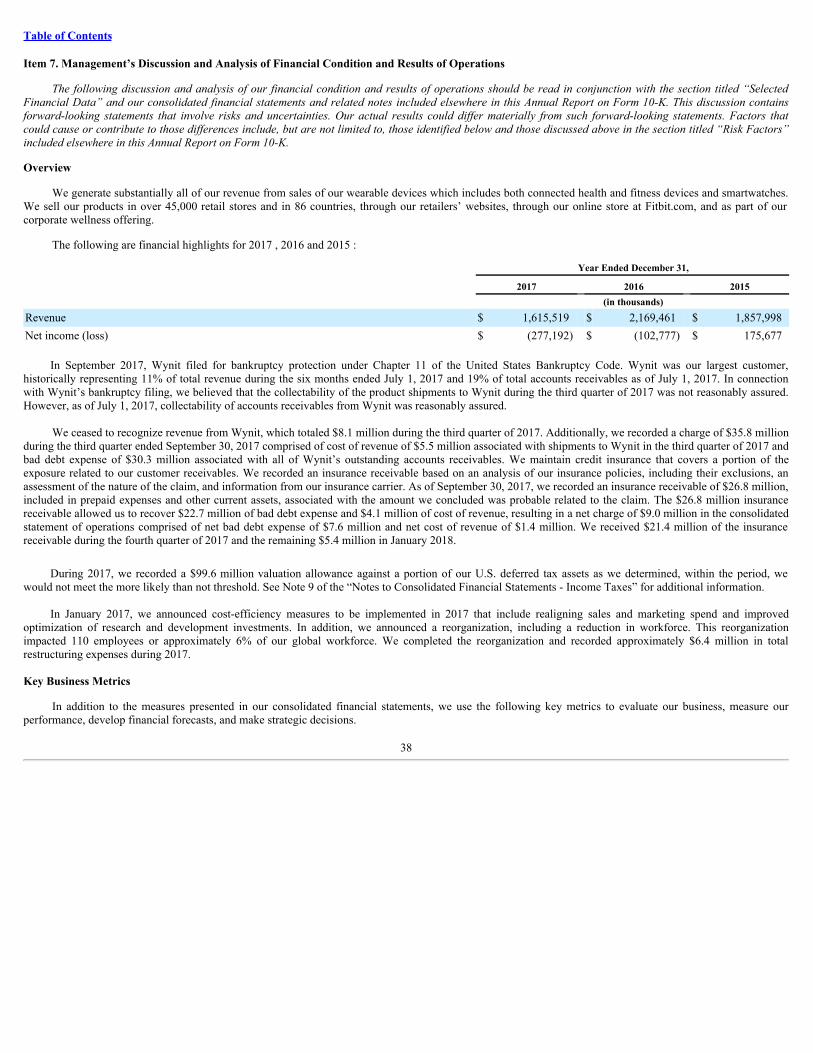
Table of Contents
Item 7. Management’s Discussion and Analysis of Financial Condition and Results of Operations
The following discussion and analysis of our financial condition and results of operations should be read in conjunction with the section titled “SelectedFinancial Data” and our consolidated financial statements and related notes included elsewhere in this Annual Report on Form 10-K. This discussion containsforward-looking statements that involve risks and uncertainties. Our actual results could differ materially from such forward-looking statements. Factors thatcould cause or contribute to those differences include, but are not limited to, those identified below and those discussed above in the section titled “Risk Factors”included elsewhere in this Annual Report on Form 10-K. Overview
We generate substantially all of our revenue from sales of our wearable devices which includes both connected health and fitness devices and smartwatches.We sell our products in over 45,000 retail stores and in 86 countries, through our retailers’ websites, through our online store at Fitbit.com, and as part of ourcorporate wellness offering.
The following are financial highlights for 2017 , 2016 and 2015 :
Year Ended December 31,
2017 2016 2015 (in thousands)Revenue $ 1,615,519 $ 2,169,461 $ 1,857,998Net income (loss) $ (277,192) $ (102,777) $ 175,677
In September 2017, Wynit filed for bankruptcy protection under Chapter 11 of the United States Bankruptcy Code. Wynit was our largest customer,historically representing 11% of total revenue during the six months ended July 1, 2017 and 19% of total accounts receivables as of July 1, 2017. In connectionwith Wynit’s bankruptcy filing, we believed that the collectability of the product shipments to Wynit during the third quarter of 2017 was not reasonably assured.However, as of July 1, 2017, collectability of accounts receivables from Wynit was reasonably assured.
We ceased to recognize revenue from Wynit, which totaled $8.1 million during the third quarter of 2017. Additionally, we recorded a charge of $35.8 millionduring the third quarter ended September 30, 2017 comprised of cost of revenue of $5.5 million associated with shipments to Wynit in the third quarter of 2017 andbad debt expense of $30.3 million associated with all of Wynit’s outstanding accounts receivables. We maintain credit insurance that covers a portion of theexposure related to our customer receivables. We recorded an insurance receivable based on an analysis of our insurance policies, including their exclusions, anassessment of the nature of the claim, and information from our insurance carrier. As of September 30, 2017, we recorded an insurance receivable of $26.8 million,included in prepaid expenses and other current assets, associated with the amount we concluded was probable related to the claim. The $26.8 million insurancereceivable allowed us to recover $22.7 million of bad debt expense and $4.1 million of cost of revenue, resulting in a net charge of $9.0 million in the consolidatedstatement of operations comprised of net bad debt expense of $7.6 million and net cost of revenue of $1.4 million. We received $21.4 million of the insurancereceivable during the fourth quarter of 2017 and the remaining $5.4 million in January 2018.
During 2017, we recorded a $99.6 million valuation allowance against a portion of our U.S. deferred tax assets as we determined, within the period, wewould not meet the more likely than not threshold. See Note 9 of the “Notes to Consolidated Financial Statements - Income Taxes” for additional information.
In January 2017, we announced cost-efficiency measures to be implemented in 2017 that include realigning sales and marketing spend and improvedoptimization of research and development investments. In addition, we announced a reorganization, including a reduction in workforce. This reorganizationimpacted 110 employees or approximately 6% of our global workforce. We completed the reorganization and recorded approximately $6.4 million in totalrestructuring expenses during 2017.
Key Business Metrics
In addition to the measures presented in our consolidated financial statements, we use the following key metrics to evaluate our business, measure ourperformance, develop financial forecasts, and make strategic decisions.
38
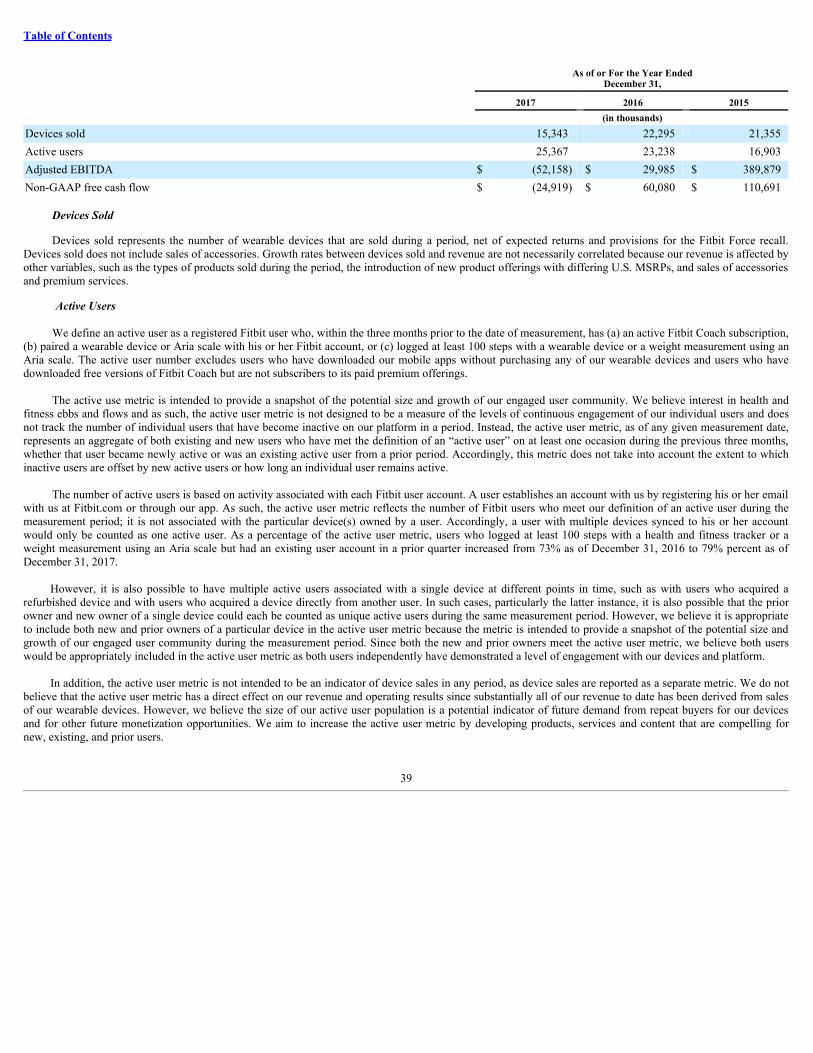
Table of Contents
As of or For the Year Ended
December 31,
2017 2016 2015 (in thousands)Devices sold 15,343 22,295 21,355Active users 25,367 23,238 16,903Adjusted EBITDA $ (52,158) $ 29,985 $ 389,879Non-GAAP free cash flow $ (24,919) $ 60,080 $ 110,691
Devices Sold
Devices sold represents the number of wearable devices that are sold during a period, net of expected returns and provisions for the Fitbit Force recall.Devices sold does not include sales of accessories. Growth rates between devices sold and revenue are not necessarily correlated because our revenue is affected byother variables, such as the types of products sold during the period, the introduction of new product offerings with differing U.S. MSRPs, and sales of accessoriesand premium services.
Active Users
We define an active user as a registered Fitbit user who, within the three months prior to the date of measurement, has (a) an active Fitbit Coach subscription,(b) paired a wearable device or Aria scale with his or her Fitbit account, or (c) logged at least 100 steps with a wearable device or a weight measurement using anAria scale. The active user number excludes users who have downloaded our mobile apps without purchasing any of our wearable devices and users who havedownloaded free versions of Fitbit Coach but are not subscribers to its paid premium offerings.
The active use metric is intended to provide a snapshot of the potential size and growth of our engaged user community. We believe interest in health andfitness ebbs and flows and as such, the active user metric is not designed to be a measure of the levels of continuous engagement of our individual users and doesnot track the number of individual users that have become inactive on our platform in a period. Instead, the active user metric, as of any given measurement date,represents an aggregate of both existing and new users who have met the definition of an “active user” on at least one occasion during the previous three months,whether that user became newly active or was an existing active user from a prior period. Accordingly, this metric does not take into account the extent to whichinactive users are offset by new active users or how long an individual user remains active.
The number of active users is based on activity associated with each Fitbit user account. A user establishes an account with us by registering his or her emailwith us at Fitbit.com or through our app. As such, the active user metric reflects the number of Fitbit users who meet our definition of an active user during themeasurement period; it is not associated with the particular device(s) owned by a user. Accordingly, a user with multiple devices synced to his or her accountwould only be counted as one active user. As a percentage of the active user metric, users who logged at least 100 steps with a health and fitness tracker or aweight measurement using an Aria scale but had an existing user account in a prior quarter increased from 73% as of December 31, 2016 to 79% percent as ofDecember 31, 2017.
However, it is also possible to have multiple active users associated with a single device at different points in time, such as with users who acquired arefurbished device and with users who acquired a device directly from another user. In such cases, particularly the latter instance, it is also possible that the priorowner and new owner of a single device could each be counted as unique active users during the same measurement period. However, we believe it is appropriateto include both new and prior owners of a particular device in the active user metric because the metric is intended to provide a snapshot of the potential size andgrowth of our engaged user community during the measurement period. Since both the new and prior owners meet the active user metric, we believe both userswould be appropriately included in the active user metric as both users independently have demonstrated a level of engagement with our devices and platform.
In addition, the active user metric is not intended to be an indicator of device sales in any period, as device sales are reported as a separate metric. We do notbelieve that the active user metric has a direct effect on our revenue and operating results since substantially all of our revenue to date has been derived from salesof our wearable devices. However, we believe the size of our active user population is a potential indicator of future demand from repeat buyers for our devicesand for other future monetization opportunities. We aim to increase the active user metric by developing products, services and content that are compelling fornew, existing, and prior users.
39
Table of Contents
Activations - Repeat and Re-Activated Users
We define an “Activation” as the first instance of a Fitbit device (excluding Aria, Aria 2, Flyer and other accessories) pairing to a user account during thethree months prior to the date of measurement. A “Repeat User” is defined as a Fitbit user who activated a Fitbit device to his or her account during themeasurement period and activated a different Fitbit device to his or her account during a prior period. A “Re-Activated User” is defined as Repeat User who hasnot synced his or her prior device and taken at least 100 steps for 90 days or more prior to the measurement period with such device. In the three months endedDecember 31, 2017, 32.6% of Activations came from Repeat Users, with Re-Activated Users representing 47.1% of those Repeat Users. In the three months endedDecember 31, 2016, 37.2% of Activations came from Repeat Users, with Re-Activated Users representing 36.5% of those Repeat Users.
In the twelve months ended December 31, 2017, 36.9% of Activations came from Repeat Users, with Re-Activated Users representing 41.3% of thoseRepeat Users. We calculated the full year Activation metric by summing the Activations from Repeat Users and Re-Activated Users in each of the four quarters in2017. As such, a user who activated more than one Fitbit device to his or her account during the year and had activated a different Fitbit device in a prior yearwould count as a Repeat User more than once.
We believe that the Activations metric is a potential indicator of repeat purchase behavior but not a guarantee of repeat purchase behavior. Actual repeatpurchase behavior may depend on a number of factors, including but not limited to our ability to anticipate and satisfy consumer preferences.
Adjusted EBITDA
We define adjusted EBITDA as net income adjusted to exclude stock-based compensation expense, depreciation and intangible assets amortization, litigationexpense related to matters with Aliphcom, Inc. d/b/a Jawbone, or Jawbone, the impact of our restructuring in 2017, the impact of the Fitbit Force recall, therevaluation of our redeemable convertible preferred stock warrant liability prior to our initial public offering, or IPO, change in contingent consideration, interestincome (expense), net, and income tax expense (benefit). See the section titled “Selected Financial Data-Non-GAAP Financial Measures-Adjusted EBITDA” inthis Annual Report on Form 10-K for information regarding our use of adjusted EBITDA and a reconciliation of adjusted EBITDA to net income (loss).
Non-GAAP free cash flow
We define non-GAAP free cash flow as net cash provided by (used in) operating activities less purchase of property and equipment. See the section titled“Selected Financial Data—Non-GAAP Financial Measures—Non-GAAP free cash flow” in this Annual Report on Form 10-K for information regarding our use ofnon-GAAP free cash flow and a reconciliation of non-GAAP free cash flow to net cash provided by (used in) operating activities. Factors Affecting Our Future Performance
Product Introductions
To date, product introductions have often had a significant, positive impact on our operating results due primarily to increases in revenue associated withsales of the new products in the quarters following their introduction. Furthermore, new product introductions, or NPI, could also adversely impact the sales of ourexisting products to retailers and users. New products may also have higher costs associated with them, which could adversely affect our margins. In addition, wehave incurred higher levels of sales and marketing expenses accompanying each product introduction. In the future, we intend to continue to release new productsand enhance our existing products, and we expect that our operating results will be impacted by these releases.
International Expansion
Our revenue, based on ship-to destinations, from sales outside of the United States increased from 29% of our revenue in 2016 to 42% of our revenue in2017. We believe our global opportunity is significant, and to address this opportunity, we intend to continue to invest in sales and marketing efforts, distributionchannels, and infrastructure and personnel to support our international expansion, including establishing additional sales offices globally. Our growth will dependin part on the adoption and sales of our products and services in international markets. Moreover, our international expansion efforts have resulted and willcontinue to result in increased costs and are subject to a variety of risks, including increased competition, uncertain enforcement of our intellectual property rights,more complex distribution logistics, and the complexity of compliance with foreign laws and regulations.
40
Table of Contents
Category Adoption, Expansion of our Total Addressable Market, and Market Growth
As a pioneer of the wearable device market, we believe we have contributed significantly to the market’s growth. However, our future growth depends inpart on the continued consumer adoption of wearable devices as a means to improve health and fitness and the growth of this market. In addition, our long-termgrowth depends in part on our ability to expand into adjacent markets in the future.
Competition
The market for wearable devices is both evolving and competitive. The wearable devices category has a multitude of participants, including specializedconsumer electronics companies such as Garmin and Nokia, and traditional watch companies such as Fossil and Movado. In addition, many large, broad-basedconsumer electronics companies either compete in our market or adjacent markets or have announced plans to do so, including Apple, Google, LG, and Samsung.For example, Apple sells the Apple Watch, which is a smartwatch with broad-based functionalities, including some health and fitness tracking capabilities, and hassold a significant volume of its smartwatches since introduction. We also face competition from manufacturers of lower-cost devices, such as Xiaomi and its MiBand device. In addition, we compete with a wide range of stand-alone health and fitness-related mobile apps that can be purchased or downloaded through mobileapp stores.
Seasonality
Historically, we have experienced higher revenue in the fourth quarter compared to other quarters due in large part to seasonal holiday demand. For example,in 2017, 2016 and 2015, our fourth quarter represented 35%, 26% and 38% of our annual revenue, respectively. We also incur higher sales and marketing expensesduring these periods.
Investing in Growth
Our business is in a multi-year transition process where we expect to leverage our core assets of brand, community, and data to focus on four key areas:adapting to the changing wearable device market; deepening our reach within healthcare; increasing our agility and optimizing our cost structure; and transformingour business from an episodic driven model centered around device sales to more life time value and recurring revenue. We expect our device mix to continue toshift towards smartwatches in 2018. This will benefit average selling price, but will not offset the decline in tracker unit growth. We expect the device mix shift tonegatively impact gross margins, partially offset by operating efficiencies. For the full year 2018, operating expenses are expected to decline in absolute dollars ascompared to the full year 2017. We intend to drive incremental margin on the device side of the business and redeploy capital to grow international sales, FitbitHealth Solutions and recurring revenue opportunities.
We also expect to leverage the strength of our partners or acquire where necessary to increase speed to market and our ability to scale the business moreeffectively. For example, in 2016, we acquired assets from Coin, Pebble and Vector Watch to enhance the features and functionality of our devices, accelerate theexpansion of our platform and ecosystem, and grow our capabilities in lower cost regions of the world.
Furthermore, we intend to increase our focus on the health ecosystem, building relationships with employers, wellness providers, and payers. The corporatewellness market for wearable devices market is new and is subject to a variety of challenges, including whether employers, health systems, and payers willcontinue to invest in such programs, long sales cycles, and substantial upfront sales costs. In each of 2017, 2016, and 2015, we derived less than 10% of ourrevenue from our Fitbit Health Solutions offerings. However, we believe that as healthcare costs continue to rise and as the healthcare ecosystem continues to seekways to manage their costs, this represents an opportunity to grow revenue. In order to grow our Fitbit Health Solutions presence, we intend to enhance ourofferings as well as expand our sales team focused on this market.
Product Quality
We sell complex products and services that could contain design and manufacturing defects in their materials, hardware, and firmware. These defects couldinclude defective materials or components, or “bugs,” that can unexpectedly interfere with the products’ intended operations or cause injuries to users or property.Although we extensively and rigorously test new and enhanced products and services before their release, there can be no assurance we will be able to detect,prevent, or fix all defects. In addition, we utilize products and services provided by third-parties, such as vendors and contract manufacturers, and we rely on theirrepresentations and do not have full control over their processes. Failure to detect, prevent, or fix defects, or an increase in defects could result in a variety ofconsequences including a greater number of returns of products than expected from users and retailers, increases in warranty costs, regulatory proceedings, productrecalls, and litigation, which could harm our revenue and operating results.
41
Table of Contents
Components of our Operating Results
Revenue
We generate substantially all of our revenue from the sale of our wearable devices, which includes both connected health and fitness devices and accessoriesand smartwatches. We also generate a small portion of our revenue from our subscription-based Fitbit Coach services and from our corporate wellness programs.
Cost of Revenue
Cost of revenue consists of product costs, including costs of contract manufacturers for production, shipping and handling costs, warranty replacement costs,packaging, costs related to the Fitbit Force recall, fulfillment costs, manufacturing and tooling equipment depreciation, warehousing costs, write-downs of excessand obsolete inventory, amortization of developed technology intangible assets acquired, and certain allocated costs related to management, facilities, andpersonnel-related expenses and other expenses associated with supply chain logistics. Personnel-related expenses include salaries, bonuses, benefits, and stock-based compensation.
Operating Expenses
Operating expenses consist of research and development, sales and marketing, general and administrative expenses, and change in contingent consideration.
Research and Development . Research and development expenses consist primarily of personnel-related expenses, consulting and contractor expenses,tooling and prototype materials, and allocated overhead costs.
Substantially all of our research and development expenses are related to developing new products and services and improving our existing products andservices. To date, research and development expenses have been expensed as incurred, because the release of products and services for sale has been short anddevelopment costs qualifying for capitalization have been insignificant.
Sales and Marketing. Sales and marketing expenses represent a significant component of our operating expenses and consist primarily of advertising andmarketing promotions of our products and services and personnel-related expenses, as well as sales incentives, trade show and event costs, sponsorship costs,consulting and contractor expenses, travel, POP display expenses and related amortization, and allocated overhead costs.
General and Administrative . General and administrative expenses consist of personnel-related expenses for our finance, legal, human resources, andadministrative personnel, as well as the costs of professional services, allocated overhead, information technology, bad debt expense, amortization of intangibleassets acquired, and other administrative expenses.
Change in contingent consideration . The change in contingent consideration relates to the benefit received from the reversal of a contingent liabilityincurred in connection with the acquisition of FitStar. See Note 12 of the “Notes to Consolidated Financial Statements-Acquisitions” included elsewhere in thisAnnual Report on Form 10-K for additional information.
Interest Income (Expense), Net
Interest income (expense), net consists of interest expense associated with our debt financing arrangements, amortization of debt issuance costs, and interestincome earned on our cash, cash equivalents, and marketable securities.
Other Income (Expense), Net
Other income (expense), net consists of mark-to-market adjustments for the revaluation of our redeemable convertible preferred stock warrant liability priorto our initial public offering in 2015 and foreign currency gains and losses.
Income Tax Expense (Benefit)
We are subject to income taxes in the United States and foreign jurisdictions in which we do business. These foreign jurisdictions have statutory tax ratesdifferent from those in the United States. Accordingly, our effective tax rates will vary depending on the relative proportion of foreign to U.S. income, theutilization of foreign tax credits, and changes in tax laws.
On December 22, 2017, the U.S. Tax Cuts and Jobs Act of 2017, or the 2017 Tax Act, was signed into law and includes several key tax provisions thataffected us, including a reduction of the statutory corporate tax rate from 35% to 21% effective for tax years beginning after December 31, 2017, elimination ofcertain deductions, and changes to how the United States imposes income tax on multinational corporations, among others. We are required to recognize the effectof tax law changes in the period
42
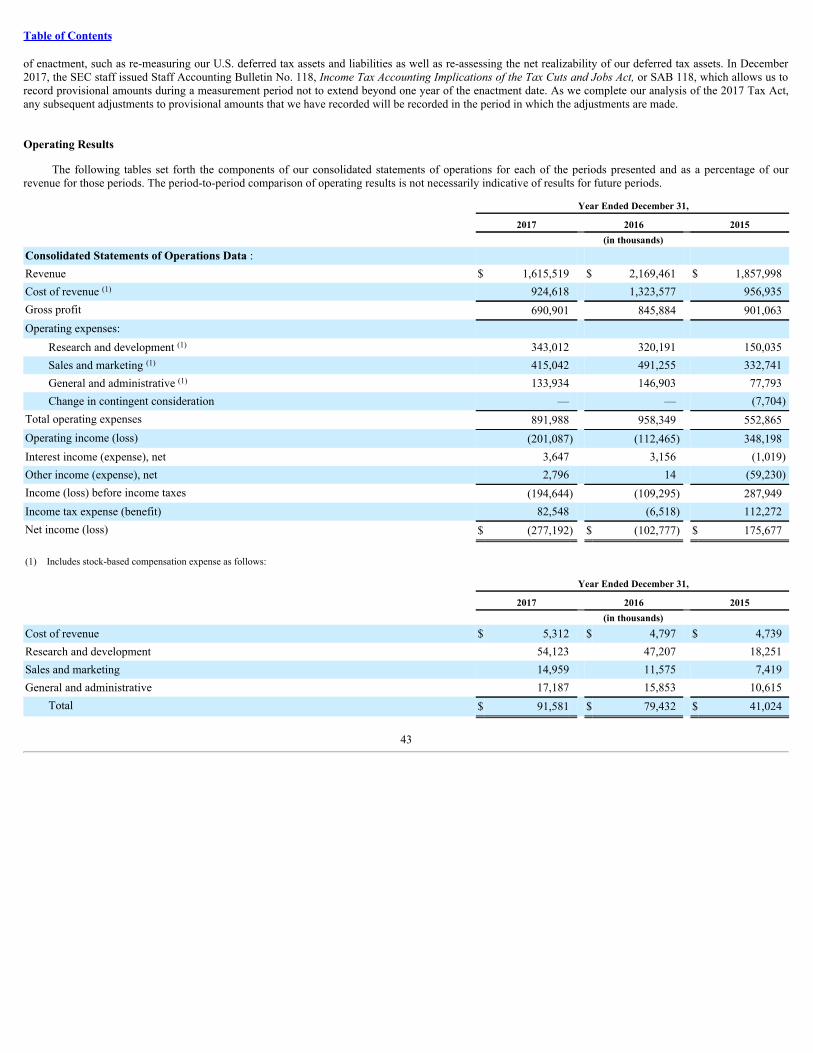
Table of Contents
of enactment, such as re-measuring our U.S. deferred tax assets and liabilities as well as re-assessing the net realizability of our deferred tax assets. In December2017, the SEC staff issued Staff Accounting Bulletin No. 118, Income Tax Accounting Implications of the Tax Cuts and Jobs Act, or SAB 118, which allows us torecord provisional amounts during a measurement period not to extend beyond one year of the enactment date. As we complete our analysis of the 2017 Tax Act,any subsequent adjustments to provisional amounts that we have recorded will be recorded in the period in which the adjustments are made.
Operating Results
The following tables set forth the components of our consolidated statements of operations for each of the periods presented and as a percentage of ourrevenue for those periods. The period-to-period comparison of operating results is not necessarily indicative of results for future periods.
Year Ended December 31,
2017 2016 2015 (in thousands)Consolidated Statements of Operations Data : Revenue $ 1,615,519 $ 2,169,461 $ 1,857,998Cost of revenue (1) 924,618 1,323,577 956,935Gross profit 690,901 845,884 901,063Operating expenses:
Research and development (1) 343,012 320,191 150,035Sales and marketing (1) 415,042 491,255 332,741General and administrative (1) 133,934 146,903 77,793Change in contingent consideration — — (7,704)
Total operating expenses 891,988 958,349 552,865Operating income (loss) (201,087) (112,465) 348,198Interest income (expense), net 3,647 3,156 (1,019)Other income (expense), net 2,796 14 (59,230)Income (loss) before income taxes (194,644) (109,295) 287,949Income tax expense (benefit) 82,548 (6,518) 112,272Net income (loss) $ (277,192) $ (102,777) $ 175,677 (1) Includes stock-based compensation expense as follows:
Year Ended December 31,
2017 2016 2015 (in thousands)Cost of revenue $ 5,312 $ 4,797 $ 4,739Research and development 54,123 47,207 18,251Sales and marketing 14,959 11,575 7,419General and administrative 17,187 15,853 10,615
Total $ 91,581 $ 79,432 $ 41,024
43
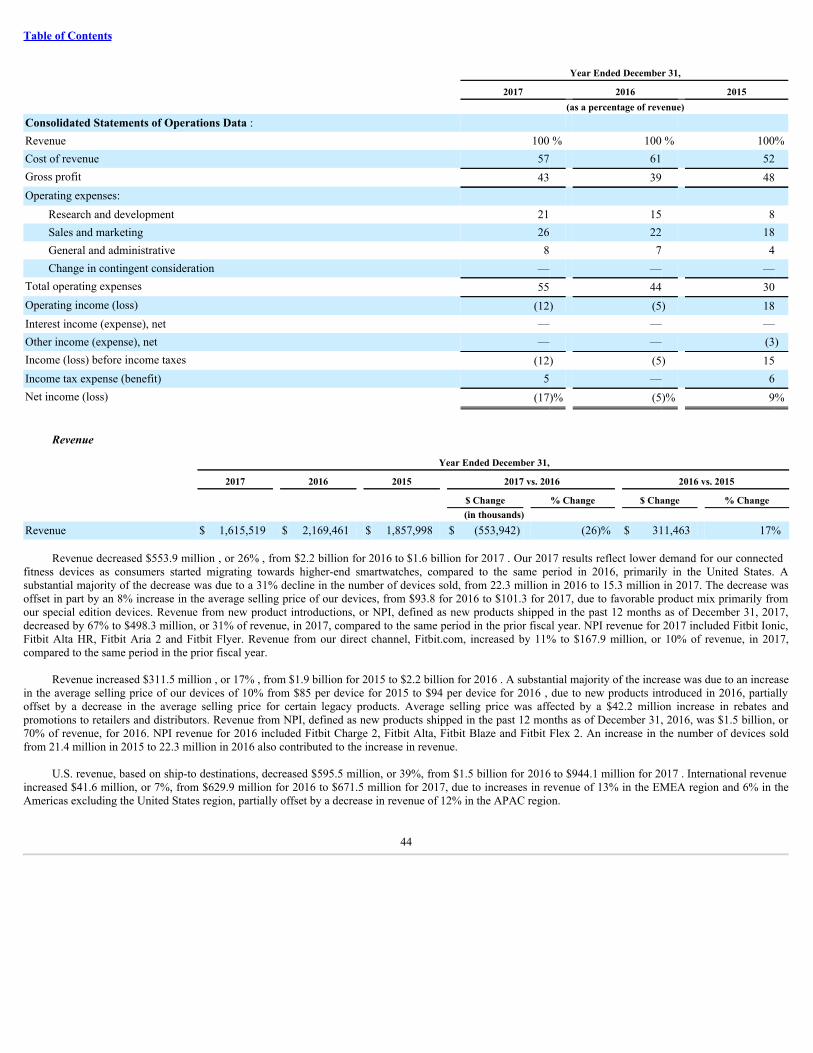
Table of Contents
Year Ended December 31,
2017 2016 2015 (as a percentage of revenue)Consolidated Statements of Operations Data : Revenue 100 % 100 % 100%Cost of revenue 57 61 52Gross profit 43 39 48Operating expenses:
Research and development 21 15 8Sales and marketing 26 22 18General and administrative 8 7 4Change in contingent consideration — — —
Total operating expenses 55 44 30Operating income (loss) (12) (5) 18Interest income (expense), net — — —Other income (expense), net — — (3)Income (loss) before income taxes (12) (5) 15Income tax expense (benefit) 5 — 6Net income (loss) (17)% (5)% 9%
Revenue
Year Ended December 31,
2017 2016 2015 2017 vs. 2016 2016 vs. 2015
$ Change % Change $ Change % Change (in thousands)Revenue $ 1,615,519 $ 2,169,461 $ 1,857,998 $ (553,942) (26)% $ 311,463 17%
Revenue decreased $553.9 million , or 26% , from $2.2 billion for 2016 to $1.6 billion for 2017 . Our 2017 results reflect lower demand for our connectedfitness devices as consumers started migrating towards higher-end smartwatches, compared to the same period in 2016, primarily in the United States. Asubstantial majority of the decrease was due to a 31% decline in the number of devices sold, from 22.3 million in 2016 to 15.3 million in 2017. The decrease wasoffset in part by an 8% increase in the average selling price of our devices, from $93.8 for 2016 to $101.3 for 2017, due to favorable product mix primarily fromour special edition devices. Revenue from new product introductions, or NPI, defined as new products shipped in the past 12 months as of December 31, 2017,decreased by 67% to $498.3 million, or 31% of revenue, in 2017, compared to the same period in the prior fiscal year. NPI revenue for 2017 included Fitbit Ionic,Fitbit Alta HR, Fitbit Aria 2 and Fitbit Flyer. Revenue from our direct channel, Fitbit.com, increased by 11% to $167.9 million, or 10% of revenue, in 2017,compared to the same period in the prior fiscal year.
Revenue increased $311.5 million , or 17% , from $1.9 billion for 2015 to $2.2 billion for 2016 . A substantial majority of the increase was due to an increasein the average selling price of our devices of 10% from $85 per device for 2015 to $94 per device for 2016 , due to new products introduced in 2016, partiallyoffset by a decrease in the average selling price for certain legacy products. Average selling price was affected by a $42.2 million increase in rebates andpromotions to retailers and distributors. Revenue from NPI, defined as new products shipped in the past 12 months as of December 31, 2016, was $1.5 billion, or70% of revenue, for 2016. NPI revenue for 2016 included Fitbit Charge 2, Fitbit Alta, Fitbit Blaze and Fitbit Flex 2. An increase in the number of devices soldfrom 21.4 million in 2015 to 22.3 million in 2016 also contributed to the increase in revenue.
U.S. revenue, based on ship-to destinations, decreased $595.5 million, or 39%, from $1.5 billion for 2016 to $944.1 million for 2017 . International revenueincreased $41.6 million, or 7%, from $629.9 million for 2016 to $671.5 million for 2017, due to increases in revenue of 13% in the EMEA region and 6% in theAmericas excluding the United States region, partially offset by a decrease in revenue of 12% in the APAC region.
44
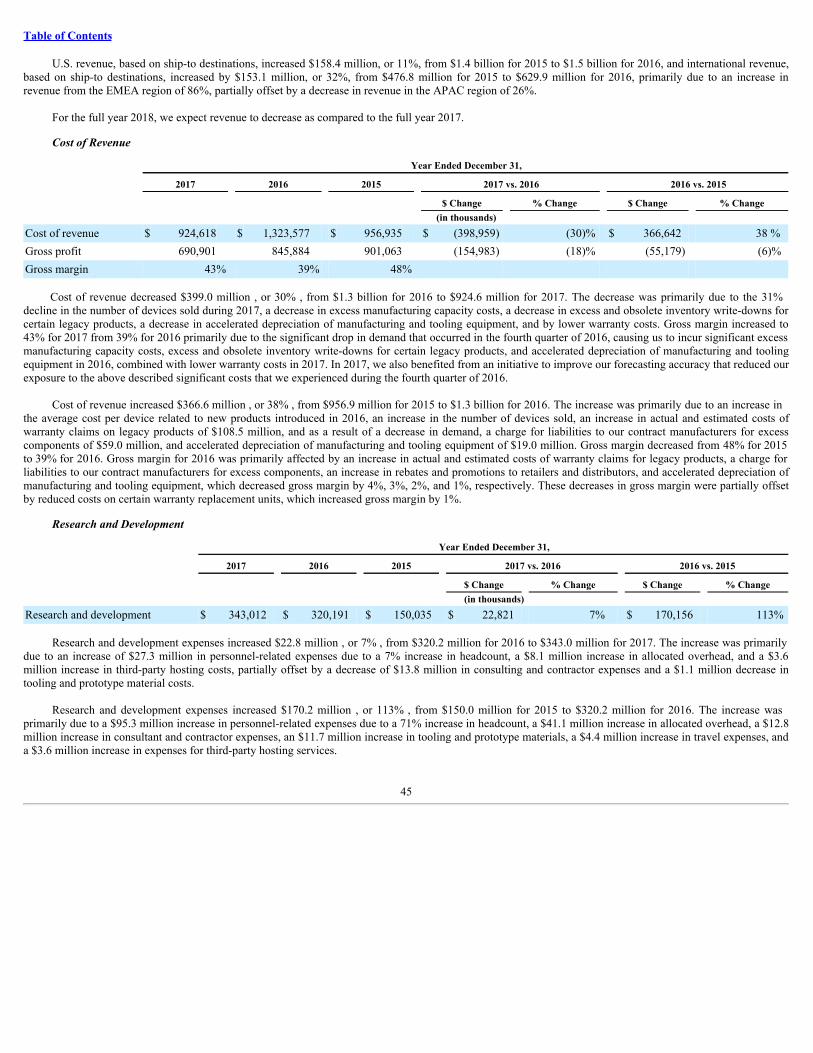
Table of Contents
U.S. revenue, based on ship-to destinations, increased $158.4 million, or 11%, from $1.4 billion for 2015 to $1.5 billion for 2016, and international revenue,based on ship-to destinations, increased by $153.1 million, or 32%, from $476.8 million for 2015 to $629.9 million for 2016, primarily due to an increase inrevenue from the EMEA region of 86%, partially offset by a decrease in revenue in the APAC region of 26%.
For the full year 2018, we expect revenue to decrease as compared to the full year 2017.
Cost of Revenue
Year Ended December 31,
2017 2016 2015 2017 vs. 2016 2016 vs. 2015
$ Change % Change $ Change % Change (in thousands)Cost of revenue $ 924,618 $ 1,323,577 $ 956,935 $ (398,959) (30)% $ 366,642 38 %Gross profit 690,901 845,884 901,063 (154,983) (18)% (55,179) (6)%Gross margin 43% 39% 48%
Cost of revenue decreased $399.0 million , or 30% , from $1.3 billion for 2016 to $924.6 million for 2017. The decrease was primarily due to the 31%decline in the number of devices sold during 2017, a decrease in excess manufacturing capacity costs, a decrease in excess and obsolete inventory write-downs forcertain legacy products, a decrease in accelerated depreciation of manufacturing and tooling equipment, and by lower warranty costs. Gross margin increased to43% for 2017 from 39% for 2016 primarily due to the significant drop in demand that occurred in the fourth quarter of 2016, causing us to incur significant excessmanufacturing capacity costs, excess and obsolete inventory write-downs for certain legacy products, and accelerated depreciation of manufacturing and toolingequipment in 2016, combined with lower warranty costs in 2017. In 2017, we also benefited from an initiative to improve our forecasting accuracy that reduced ourexposure to the above described significant costs that we experienced during the fourth quarter of 2016.
Cost of revenue increased $366.6 million , or 38% , from $956.9 million for 2015 to $1.3 billion for 2016. The increase was primarily due to an increase inthe average cost per device related to new products introduced in 2016, an increase in the number of devices sold, an increase in actual and estimated costs ofwarranty claims on legacy products of $108.5 million, and as a result of a decrease in demand, a charge for liabilities to our contract manufacturers for excesscomponents of $59.0 million, and accelerated depreciation of manufacturing and tooling equipment of $19.0 million. Gross margin decreased from 48% for 2015to 39% for 2016. Gross margin for 2016 was primarily affected by an increase in actual and estimated costs of warranty claims for legacy products, a charge forliabilities to our contract manufacturers for excess components, an increase in rebates and promotions to retailers and distributors, and accelerated depreciation ofmanufacturing and tooling equipment, which decreased gross margin by 4%, 3%, 2%, and 1%, respectively. These decreases in gross margin were partially offsetby reduced costs on certain warranty replacement units, which increased gross margin by 1%.
Research and Development
Year Ended December 31,
2017 2016 2015 2017 vs. 2016 2016 vs. 2015
$ Change % Change $ Change % Change (in thousands)Research and development $ 343,012 $ 320,191 $ 150,035 $ 22,821 7% $ 170,156 113%
Research and development expenses increased $22.8 million , or 7% , from $320.2 million for 2016 to $343.0 million for 2017. The increase was primarilydue to an increase of $27.3 million in personnel-related expenses due to a 7% increase in headcount, a $8.1 million increase in allocated overhead, and a $3.6million increase in third-party hosting costs, partially offset by a decrease of $13.8 million in consulting and contractor expenses and a $1.1 million decrease intooling and prototype material costs.
Research and development expenses increased $170.2 million , or 113% , from $150.0 million for 2015 to $320.2 million for 2016. The increase wasprimarily due to a $95.3 million increase in personnel-related expenses due to a 71% increase in headcount, a $41.1 million increase in allocated overhead, a $12.8million increase in consultant and contractor expenses, an $11.7 million increase in tooling and prototype materials, a $4.4 million increase in travel expenses, anda $3.6 million increase in expenses for third-party hosting services.
45
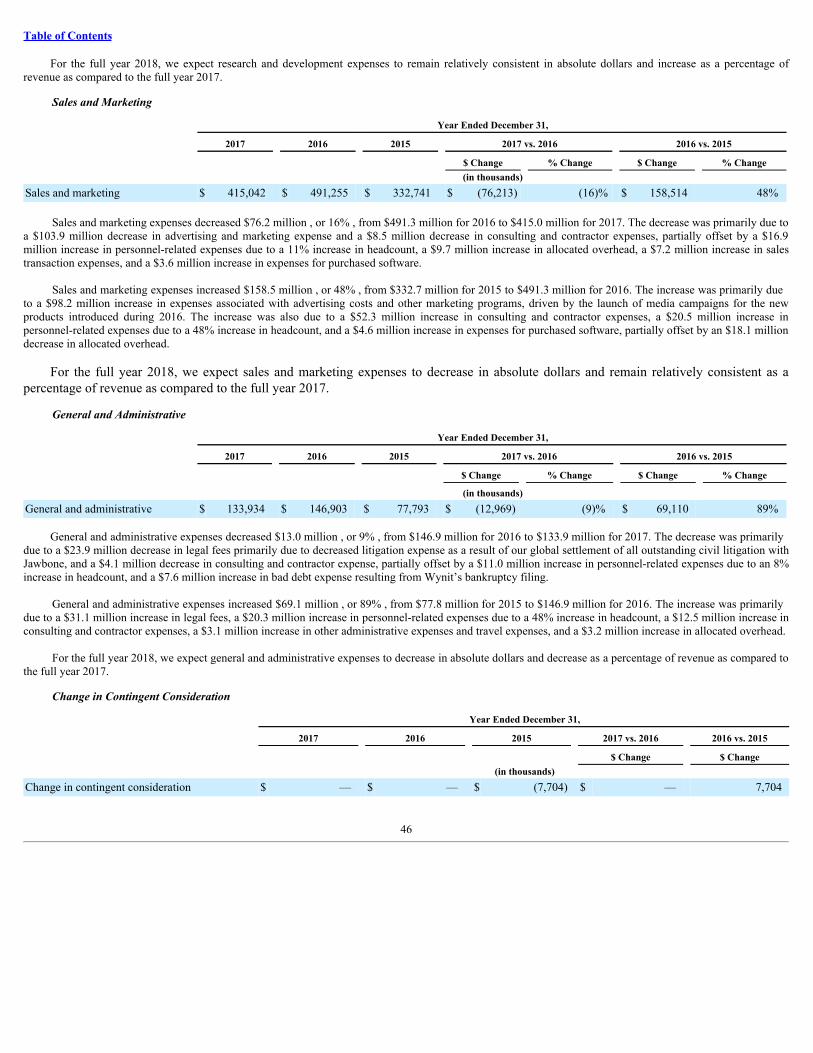
Table of Contents
For the full year 2018, we expect research and development expenses to remain relatively consistent in absolute dollars and increase as a percentage ofrevenue as compared to the full year 2017.
Sales and Marketing
Year Ended December 31,
2017 2016 2015 2017 vs. 2016 2016 vs. 2015
$ Change % Change $ Change % Change (in thousands)Sales and marketing $ 415,042 $ 491,255 $ 332,741 $ (76,213) (16)% $ 158,514 48%
Sales and marketing expenses decreased $76.2 million , or 16% , from $491.3 million for 2016 to $415.0 million for 2017. The decrease was primarily due toa $103.9 million decrease in advertising and marketing expense and a $8.5 million decrease in consulting and contractor expenses, partially offset by a $16.9million increase in personnel-related expenses due to a 11% increase in headcount, a $9.7 million increase in allocated overhead, a $7.2 million increase in salestransaction expenses, and a $3.6 million increase in expenses for purchased software.
Sales and marketing expenses increased $158.5 million , or 48% , from $332.7 million for 2015 to $491.3 million for 2016. The increase was primarily dueto a $98.2 million increase in expenses associated with advertising costs and other marketing programs, driven by the launch of media campaigns for the newproducts introduced during 2016. The increase was also due to a $52.3 million increase in consulting and contractor expenses, a $20.5 million increase inpersonnel-related expenses due to a 48% increase in headcount, and a $4.6 million increase in expenses for purchased software, partially offset by an $18.1 milliondecrease in allocated overhead.
For the full year 2018, we expect sales and marketing expenses to decrease in absolute dollars and remain relatively consistent as apercentage of revenue as compared to the full year 2017.
General and Administrative
Year Ended December 31,
2017 2016 2015 2017 vs. 2016 2016 vs. 2015
$ Change % Change $ Change % Change (in thousands)General and administrative $ 133,934 $ 146,903 $ 77,793 $ (12,969) (9)% $ 69,110 89%
General and administrative expenses decreased $13.0 million , or 9% , from $146.9 million for 2016 to $133.9 million for 2017. The decrease was primarilydue to a $23.9 million decrease in legal fees primarily due to decreased litigation expense as a result of our global settlement of all outstanding civil litigation withJawbone, and a $4.1 million decrease in consulting and contractor expense, partially offset by a $11.0 million increase in personnel-related expenses due to an 8%increase in headcount, and a $7.6 million increase in bad debt expense resulting from Wynit’s bankruptcy filing.
General and administrative expenses increased $69.1 million , or 89% , from $77.8 million for 2015 to $146.9 million for 2016. The increase was primarilydue to a $31.1 million increase in legal fees, a $20.3 million increase in personnel-related expenses due to a 48% increase in headcount, a $12.5 million increase inconsulting and contractor expenses, a $3.1 million increase in other administrative expenses and travel expenses, and a $3.2 million increase in allocated overhead.
For the full year 2018, we expect general and administrative expenses to decrease in absolute dollars and decrease as a percentage of revenue as compared tothe full year 2017.
Change in Contingent Consideration
Year Ended December 31,
2017 2016 2015 2017 vs. 2016 2016 vs. 2015
$ Change $ Change (in thousands)Change in contingent consideration $ — $ — $ (7,704) $ — 7,704
46
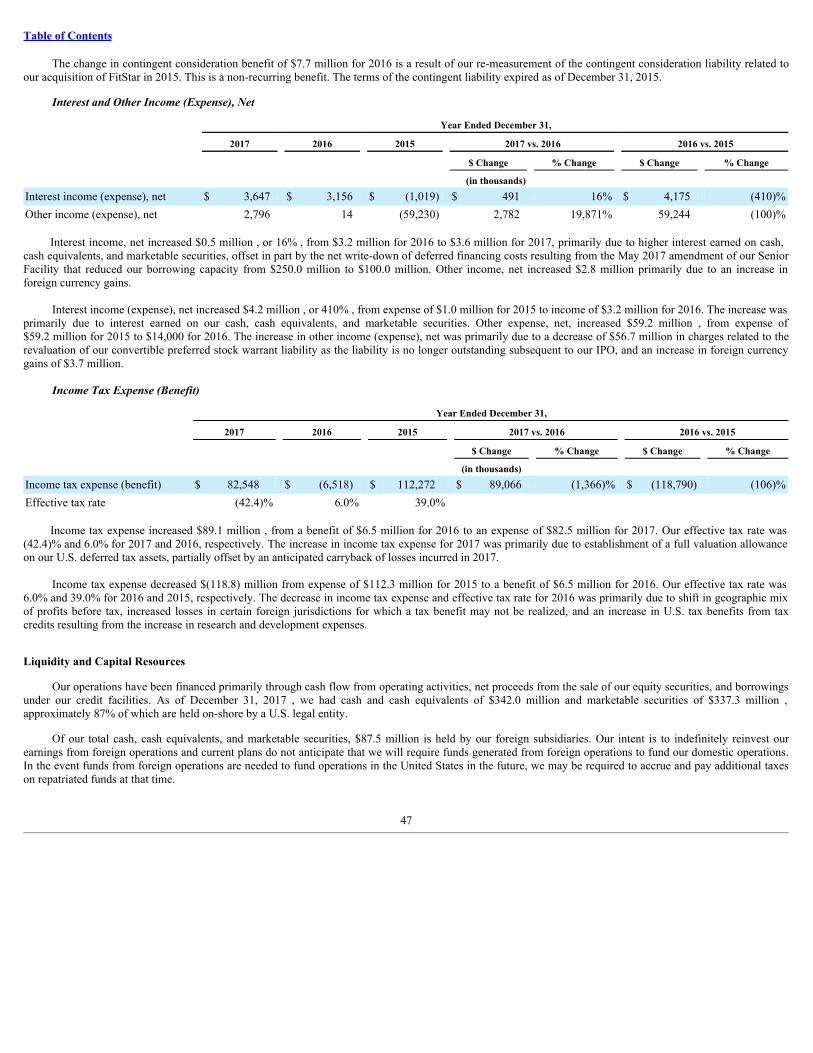
Table of Contents
The change in contingent consideration benefit of $7.7 million for 2016 is a result of our re-measurement of the contingent consideration liability related toour acquisition of FitStar in 2015. This is a non-recurring benefit. The terms of the contingent liability expired as of December 31, 2015.
Interest and Other Income (Expense), Net
Year Ended December 31,
2017 2016 2015 2017 vs. 2016 2016 vs. 2015
$ Change % Change $ Change % Change (in thousands)Interest income (expense), net $ 3,647 $ 3,156 $ (1,019) $ 491 16% $ 4,175 (410)%Other income (expense), net 2,796 14 (59,230) 2,782 19,871% 59,244 (100)%
Interest income, net increased $0.5 million , or 16% , from $3.2 million for 2016 to $3.6 million for 2017, primarily due to higher interest earned on cash,cash equivalents, and marketable securities, offset in part by the net write-down of deferred financing costs resulting from the May 2017 amendment of our SeniorFacility that reduced our borrowing capacity from $250.0 million to $100.0 million. Other income, net increased $2.8 million primarily due to an increase inforeign currency gains.
Interest income (expense), net increased $4.2 million , or 410% , from expense of $1.0 million for 2015 to income of $3.2 million for 2016. The increase wasprimarily due to interest earned on our cash, cash equivalents, and marketable securities. Other expense, net, increased $59.2 million , from expense of$59.2 million for 2015 to $14,000 for 2016. The increase in other income (expense), net was primarily due to a decrease of $56.7 million in charges related to therevaluation of our convertible preferred stock warrant liability as the liability is no longer outstanding subsequent to our IPO, and an increase in foreign currencygains of $3.7 million.
Income Tax Expense (Benefit)
Year Ended December 31,
2017 2016 2015 2017 vs. 2016 2016 vs. 2015
$ Change % Change $ Change % Change (in thousands)Income tax expense (benefit) $ 82,548 $ (6,518) $ 112,272 $ 89,066 (1,366)% $ (118,790) (106)%Effective tax rate (42.4)% 6.0% 39.0%
Income tax expense increased $89.1 million , from a benefit of $6.5 million for 2016 to an expense of $82.5 million for 2017. Our effective tax rate was(42.4)% and 6.0% for 2017 and 2016, respectively. The increase in income tax expense for 2017 was primarily due to establishment of a full valuation allowanceon our U.S. deferred tax assets, partially offset by an anticipated carryback of losses incurred in 2017.
Income tax expense decreased $(118.8) million from expense of $112.3 million for 2015 to a benefit of $6.5 million for 2016. Our effective tax rate was6.0% and 39.0% for 2016 and 2015, respectively. The decrease in income tax expense and effective tax rate for 2016 was primarily due to shift in geographic mixof profits before tax, increased losses in certain foreign jurisdictions for which a tax benefit may not be realized, and an increase in U.S. tax benefits from taxcredits resulting from the increase in research and development expenses. Liquidity and Capital Resources
Our operations have been financed primarily through cash flow from operating activities, net proceeds from the sale of our equity securities, and borrowingsunder our credit facilities. As of December 31, 2017 , we had cash and cash equivalents of $342.0 million and marketable securities of $337.3 million ,approximately 87% of which are held on-shore by a U.S. legal entity.
Of our total cash, cash equivalents, and marketable securities, $87.5 million is held by our foreign subsidiaries. Our intent is to indefinitely reinvest ourearnings from foreign operations and current plans do not anticipate that we will require funds generated from foreign operations to fund our domestic operations.In the event funds from foreign operations are needed to fund operations in the United States in the future, we may be required to accrue and pay additional taxeson repatriated funds at that time.
47
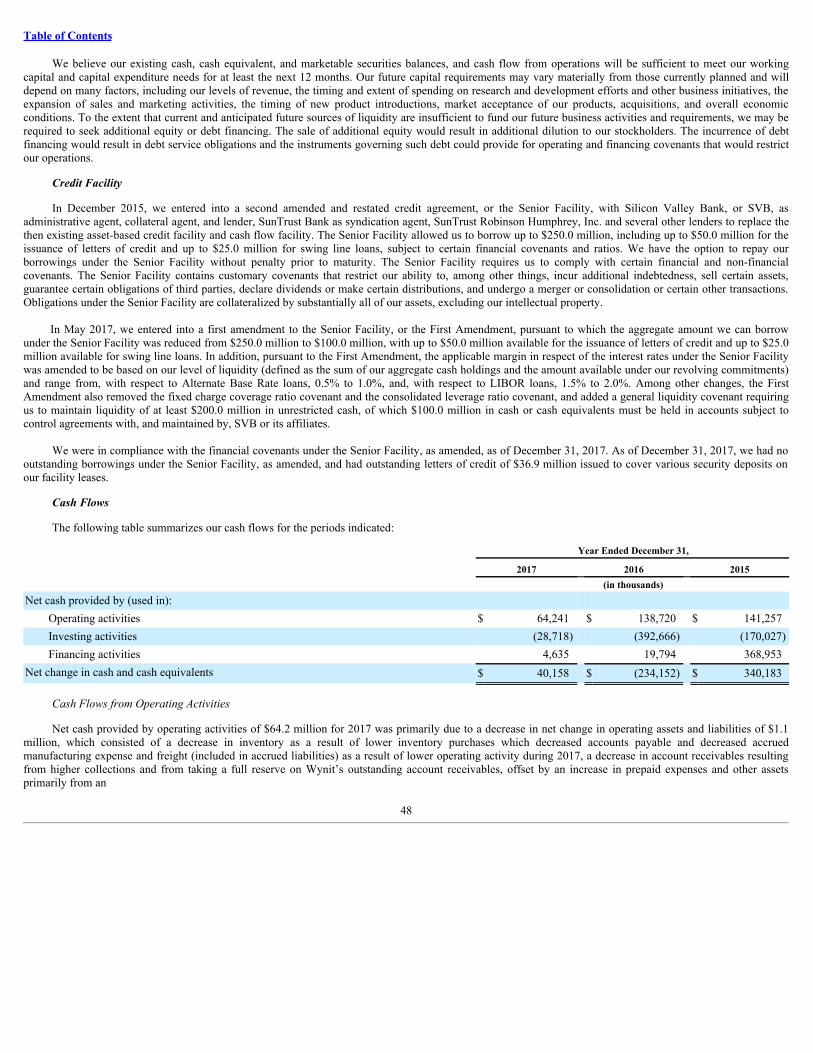
Table of Contents
We believe our existing cash, cash equivalent, and marketable securities balances, and cash flow from operations will be sufficient to meet our workingcapital and capital expenditure needs for at least the next 12 months. Our future capital requirements may vary materially from those currently planned and willdepend on many factors, including our levels of revenue, the timing and extent of spending on research and development efforts and other business initiatives, theexpansion of sales and marketing activities, the timing of new product introductions, market acceptance of our products, acquisitions, and overall economicconditions. To the extent that current and anticipated future sources of liquidity are insufficient to fund our future business activities and requirements, we may berequired to seek additional equity or debt financing. The sale of additional equity would result in additional dilution to our stockholders. The incurrence of debtfinancing would result in debt service obligations and the instruments governing such debt could provide for operating and financing covenants that would restrictour operations.
Credit Facility
In December 2015, we entered into a second amended and restated credit agreement, or the Senior Facility, with Silicon Valley Bank, or SVB, asadministrative agent, collateral agent, and lender, SunTrust Bank as syndication agent, SunTrust Robinson Humphrey, Inc. and several other lenders to replace thethen existing asset-based credit facility and cash flow facility. The Senior Facility allowed us to borrow up to $250.0 million, including up to $50.0 million for theissuance of letters of credit and up to $25.0 million for swing line loans, subject to certain financial covenants and ratios. We have the option to repay ourborrowings under the Senior Facility without penalty prior to maturity. The Senior Facility requires us to comply with certain financial and non-financialcovenants. The Senior Facility contains customary covenants that restrict our ability to, among other things, incur additional indebtedness, sell certain assets,guarantee certain obligations of third parties, declare dividends or make certain distributions, and undergo a merger or consolidation or certain other transactions.Obligations under the Senior Facility are collateralized by substantially all of our assets, excluding our intellectual property.
In May 2017, we entered into a first amendment to the Senior Facility, or the First Amendment, pursuant to which the aggregate amount we can borrowunder the Senior Facility was reduced from $250.0 million to $100.0 million, with up to $50.0 million available for the issuance of letters of credit and up to $25.0million available for swing line loans. In addition, pursuant to the First Amendment, the applicable margin in respect of the interest rates under the Senior Facilitywas amended to be based on our level of liquidity (defined as the sum of our aggregate cash holdings and the amount available under our revolving commitments)and range from, with respect to Alternate Base Rate loans, 0.5% to 1.0%, and, with respect to LIBOR loans, 1.5% to 2.0%. Among other changes, the FirstAmendment also removed the fixed charge coverage ratio covenant and the consolidated leverage ratio covenant, and added a general liquidity covenant requiringus to maintain liquidity of at least $200.0 million in unrestricted cash, of which $100.0 million in cash or cash equivalents must be held in accounts subject tocontrol agreements with, and maintained by, SVB or its affiliates.
We were in compliance with the financial covenants under the Senior Facility, as amended, as of December 31, 2017. As of December 31, 2017, we had nooutstanding borrowings under the Senior Facility, as amended, and had outstanding letters of credit of $36.9 million issued to cover various security deposits onour facility leases.
Cash Flows
The following table summarizes our cash flows for the periods indicated:
Year Ended December 31,
2017 2016 2015 (in thousands)Net cash provided by (used in):
Operating activities $ 64,241 $ 138,720 $ 141,257Investing activities (28,718) (392,666) (170,027)Financing activities 4,635 19,794 368,953
Net change in cash and cash equivalents $ 40,158 $ (234,152) $ 340,183
Cash Flows from Operating Activities
Net cash provided by operating activities of $64.2 million for 2017 was primarily due to a decrease in net change in operating assets and liabilities of $1.1million, which consisted of a decrease in inventory as a result of lower inventory purchases which decreased accounts payable and decreased accruedmanufacturing expense and freight (included in accrued liabilities) as a result of lower operating activity during 2017, a decrease in account receivables resultingfrom higher collections and from taking a full reserve on Wynit’s outstanding account receivables, offset by an increase in prepaid expenses and other assetsprimarily from an
48
Table of Contents
increase in income tax receivable due to expected refunds from prior tax years and from an insurance receivable due to a litigation settlement. The net change inoperating assets and liabilities was also impacted by non-cash adjustments of $340.3 million, primarily resulting from a valuation allowance recorded against ourU.S. deferred tax assets of $173.8 million, stock-based compensation expense of $91.6 million, depreciation and amortization expense of $45.7 million, provisionfor inventory obsolescence of $14.8 million, and provision for doubtful accounts of $7.9 million, partially offset by a net loss of $277.2 million. Our days salesoutstanding in accounts receivable, calculated as the number of days represented by the accounts receivable balance as of period end, decreased from 85 days as ofDecember 31, 2016 to 76 days as of December 31, 2017 due to higher collections during the fourth quarter of 2017 compared to the fourth quarter of 2016.
Net cash provided by operating activities of $138.7 million for 2016 was primarily due to an increase in net change in operating assets and liabilities of$199.2 million and non-cash adjustments of $42.3 million, partially offset by a net loss of $102.8 million. The increase in net change in operating assets andliabilities was primarily due to a $259.0 million increase in accounts payable and accrued liabilities, largely driven by increases in the product warranty reserve,sales rebates accruals, and reserves for excess components, partially offset by a $62.0 million increase in inventories, a $37.9 million increase in prepaid expensesand other assets, and an $8.7 million increase in accounts receivable. Non-cash adjustments primarily consisted of stock-based compensation expense, depreciationand amortization, and the abandonment of property and equipment, partially offset by deferred taxes. Our days sales outstanding in accounts receivable increasedfrom 56 days as of December 31, 2015 to 85 days as of December 31, 2016 due to slower collections in the fourth quarter of 2016 as compared to the fourthquarter of 2015.
Net cash provided by operating activities of $141.3 million for 2015 was primarily due to net income of $175.7 million and non-cash adjustments of $76.6million, partially offset by a decrease in net change in operating assets and liabilities of $111.1 million. Non-cash adjustments primarily consisted of therevaluation of the redeemable convertible preferred stock warrant liability, stock-based compensation expense, and depreciation and amortization, partially offsetby deferred taxes. The decrease in net change in operating assets and liabilities was primarily due to a $231.1 million increase in accounts receivable due toincreased sales in the fourth quarter of 2015, and a $68.1 million increase in inventories as a result of increased product demand, partially offset by a $195.5million increase in accounts payable and accrued liabilities related to growth of expenditures to support general business growth.
Cash Flows from Investing Activities
Net cash used in investing activities for 2017 of $28.7 million was primarily due to maturities and sales of marketable securities of $664.9 million, partiallyoffset by purchases of marketable securities of $597.9 million, purchases of property and equipment of $89.2 million, an equity investment of $6.0 million, and anasset purchase of $0.6 million.
Net cash used in investing activities for 2016 of $392.7 million was due to the purchases of marketable securities of $638.1 million, partially offset by thesale and maturities of marketable securities of $362.3 million, purchases of property and equipment of $78.6 million, and the cash portion of acquisitions of$38.3 million, net of cash acquired.
Net cash used in investing activities for 2015 of $170.0 million was due to the purchases of marketable securities of $230.9 million, purchases of propertyand equipment of $30.6 million, and the cash portion of the acquisition of FitStar of $11.0 million, net of cash acquired, partially offset by the sale and maturitiesof marketable securities of $102.5 million.
We may continue to use cash in the future to acquire businesses and technologies that enhance and expand our product offerings. Due to the nature of thesetransactions, it is difficult to predict the amount and timing of such cash requirements to complete such transactions. We may be required to raise additional fundsto complete future acquisitions.
Cash Flows from Financing Activities
Net cash provided by financing activities for 2017 of $4.6 million was primarily due to $19.0 million of proceeds from the exercise of stock options andstock purchases made through our 2015 Employee Stock Purchase Plan, or the 2015 ESPP, offset in part by $14.4 million in net cash used for payment of taxes oncommon stock issued under our employee equity incentive plans.
Net cash provided by financing activities for 2016 of $19.8 million was primarily related to net proceeds from the issuance of common stock related toemployee equity incentive plans of $21.0 million.
Net cash provided by financing activities for 2015 of $369.0 million was primarily related to proceeds from our public stock offerings of $505.3 millionpartially offset by net repayments of borrowings of $134.5 million under our credit facilities.
49
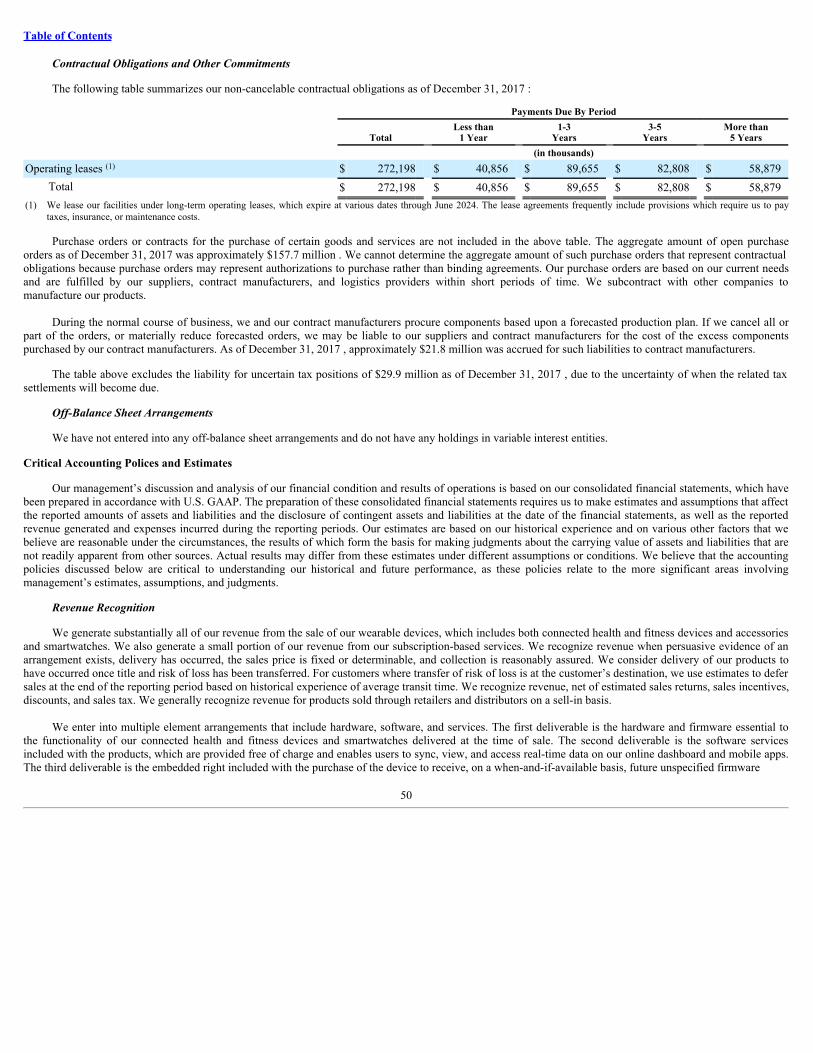
Table of Contents
Contractual Obligations and Other Commitments
The following table summarizes our non-cancelable contractual obligations as of December 31, 2017 :
Payments Due By Period
Total Less than
1 Year 1-3
Years 3-5
Years More than
5 Years (in thousands)Operating leases (1) $ 272,198 $ 40,856 $ 89,655 $ 82,808 $ 58,879
Total $ 272,198 $ 40,856 $ 89,655 $ 82,808 $ 58,879(1) We lease our facilities under long-term operating leases, which expire at various dates through June 2024. The lease agreements frequently include provisions which require us to pay
taxes, insurance, or maintenance costs.
Purchase orders or contracts for the purchase of certain goods and services are not included in the above table. The aggregate amount of open purchaseorders as of December 31, 2017 was approximately $157.7 million . We cannot determine the aggregate amount of such purchase orders that represent contractualobligations because purchase orders may represent authorizations to purchase rather than binding agreements. Our purchase orders are based on our current needsand are fulfilled by our suppliers, contract manufacturers, and logistics providers within short periods of time. We subcontract with other companies tomanufacture our products.
During the normal course of business, we and our contract manufacturers procure components based upon a forecasted production plan. If we cancel all orpart of the orders, or materially reduce forecasted orders, we may be liable to our suppliers and contract manufacturers for the cost of the excess componentspurchased by our contract manufacturers. As of December 31, 2017 , approximately $21.8 million was accrued for such liabilities to contract manufacturers.
The table above excludes the liability for uncertain tax positions of $29.9 million as of December 31, 2017 , due to the uncertainty of when the related taxsettlements will become due.
Off-Balance Sheet Arrangements
We have not entered into any off-balance sheet arrangements and do not have any holdings in variable interest entities. Critical Accounting Polices and Estimates
Our management’s discussion and analysis of our financial condition and results of operations is based on our consolidated financial statements, which havebeen prepared in accordance with U.S. GAAP. The preparation of these consolidated financial statements requires us to make estimates and assumptions that affectthe reported amounts of assets and liabilities and the disclosure of contingent assets and liabilities at the date of the financial statements, as well as the reportedrevenue generated and expenses incurred during the reporting periods. Our estimates are based on our historical experience and on various other factors that webelieve are reasonable under the circumstances, the results of which form the basis for making judgments about the carrying value of assets and liabilities that arenot readily apparent from other sources. Actual results may differ from these estimates under different assumptions or conditions. We believe that the accountingpolicies discussed below are critical to understanding our historical and future performance, as these policies relate to the more significant areas involvingmanagement’s estimates, assumptions, and judgments.
Revenue Recognition
We generate substantially all of our revenue from the sale of our wearable devices, which includes both connected health and fitness devices and accessoriesand smartwatches. We also generate a small portion of our revenue from our subscription-based services. We recognize revenue when persuasive evidence of anarrangement exists, delivery has occurred, the sales price is fixed or determinable, and collection is reasonably assured. We consider delivery of our products tohave occurred once title and risk of loss has been transferred. For customers where transfer of risk of loss is at the customer’s destination, we use estimates to defersales at the end of the reporting period based on historical experience of average transit time. We recognize revenue, net of estimated sales returns, sales incentives,discounts, and sales tax. We generally recognize revenue for products sold through retailers and distributors on a sell-in basis.
We enter into multiple element arrangements that include hardware, software, and services. The first deliverable is the hardware and firmware essential tothe functionality of our connected health and fitness devices and smartwatches delivered at the time of sale. The second deliverable is the software servicesincluded with the products, which are provided free of charge and enables users to sync, view, and access real-time data on our online dashboard and mobile apps.The third deliverable is the embedded right included with the purchase of the device to receive, on a when-and-if-available basis, future unspecified firmware
50
Table of Contents
upgrades and features relating to the product’s essential firmware. In addition, we occasionally offer a fourth deliverable in bundled arrangements that allowsaccess to certain subscription-based services related to our Fitbit Coach offering.
We allocate revenue to all deliverables based on their relative selling prices. We use a hierarchy to determine the selling price to be used for allocatingrevenue to deliverables: (i) vendor-specific objective evidence, or VSOE, of fair value, (ii) third-party evidence, or TPE, and (iii) best estimate of the selling price,or BESP, of selling price. Our process for determining BESP considers multiple factors including consumer behaviors and our internal pricing model and may varydepending upon the facts and circumstances related to each deliverable. BESP for our connected health and fitness devices and smartwatches and unspecifiedupgrade rights reflect our best estimate of the selling prices if they were sold regularly on a stand-alone basis and comprise the majority of the arrangementconsideration. BESP for upgrade rights currently ranges from $1 to $3. TPE for our online dashboard and mobile apps is currently estimated at $0.99. VSOE foraccess to Fitbit Coach subscription-based services is based on the price charged when sold separately.
Amounts allocated to the delivered health and fitness devices are recognized at the time of delivery, provided the other conditions for revenue recognitionhave been met. Amounts allocated to our online dashboard and mobile apps and unspecified upgrade rights are deferred and recognized on a straight-line basisover the estimated usage period.
We offer our users the ability to purchase subscription-based services, through which our users receive incremental features, including access to a digitalpersonal trainer, in-depth analytics regarding the user’s personal metrics, or video-based customized workouts. Amounts paid for subscriptions are deferred andrecognized ratably over the service period which is typically one year. Revenue from subscription-based premium services was less than 1% of revenue for allperiods presented.
In addition, we offer access to software and services to certain customers in the corporate wellness program, which includes distribution capabilities, a real-time dashboard, and support services. We are currently unable to establish VSOE or TPE for the corporate wellness software and services. BESP for the corporatewellness software and services is determined based on our internal pricing model for anticipated renewals for existing customers and pricing for new customers.Revenue allocated to the corporate wellness software and services is deferred and recognized on a straight-line basis over the estimated access period of one year,which is the typical service period. Revenue from the corporate wellness software and services was less than 1% of revenue for all periods presented.
We account for shipping and handling fees billed to customers as revenue. Sales taxes and value added taxes collected from customers are remitted togovernmental authorities, are not included in revenue, and are reflected as a liability on our consolidated balance sheets.
Rights of Return, Stock Rotation Rights, and Price Protection
We offer limited rights of return, stock rotation rights, and price protection under various policies and programs with our retailer and distributor customersand end-users. Below is a summary of the general provisions of such policies and programs:
• Retailers and distributors are generally allowed to return products that were originally sold through to an end-user under provisions of their contracts,called “open-box” returns, and such returns may be made at any time after the original sale.
• All purchases through Fitbit.com are covered by a 45-day right of return.• Certain distributors are allowed stock rotation rights which are limited rights of return of products purchased during a prior period, generally one
quarter.• Certain distributors and retailers are allowed return rights for defective products.• Certain distributors are offered price protection that allows for the right to a partial credit for unsold inventory held by the distributor if we reduce the
selling price of a product.
We estimate reserves for these policies and programs based on historical experience and record the reserves as a reduction of revenue and accountsreceivable. Through December 31, 2017 , actual returns have primarily been open-box returns. In addition, through December 31, 2017, we have had limited priceprotection claims. On a quarterly basis, the amount of revenue that is reserved for future returns is calculated based on historical trends and data specific to eachreporting period. The historical trends consider product life cycles, new product introductions, market acceptance of products, product sell-through, the type ofcustomer, seasonality, and other factors. Return rates can fluctuate over time, but have been sufficiently predictable to allow us to estimate expected future productreturns. We review the actual returns evidenced in prior quarters as a percent of related revenue to determine the historical rate of returns. We then apply thehistorical rate of returns to the current period revenue as a basis for estimating future returns. When necessary, we also provide a specific reserve for products inthe distribution channel in excess of estimated requirements. This estimate can be affected by the amount of a particular product in the channel, the rate of sell-through, product plans, and other factors. We also consider whether there are circumstances which may result in anticipated returns higher than the historical returnrate from direct customers and record an additional specific reserve as necessary. The estimates and assumptions
51
Table of Contents
used to reserve for rights of return, stock rotation rights, and price protection have been accurate in all material respects and have not materially changed in thepast.
Sales Incentives
We offer sales incentives such as cooperative advertising and marketing development fund programs, rebates, and other incentives. We record cooperativeadvertising and marketing development fund programs with customers as a reduction to revenue unless we receive an identifiable benefit in exchange for creditsclaimed by the customer and can reasonably estimate the fair value of the identifiable benefit received, in which case we will record it as a marketing expense. Werecognize a liability with a reduction to revenue for rebates or other incentives based on the estimated amount of rebates or credits that will be claimed bycustomers.
Inventories
Inventories consist of finished goods and component parts, which are purchased from contract manufacturers and component suppliers. Inventories are statedat the lower of cost or net realizable value. We assess the valuation of inventory and periodically write down the value for estimated excess and obsolete inventorybased upon estimates of future demand and market conditions.
Product Warranty
We offer a standard product warranty that our products will operate under normal use for a period of one-year from the date of original purchase, except inthe European Union and certain Asia Pacific countries where we provide a two-year warranty. We have the obligation, at our option, to either repair or replace adefective product. At the time revenue is recognized, an estimate of future warranty costs is recorded as a component of cost of revenues. The estimate of futurewarranty costs is based on historical and projected warranty claim rates, historical and projected cost-per-claim and knowledge of specific product failures, if any,that are outside of our typical experience. We regularly review these estimates to assess the appropriateness of our recorded warranty liabilities and adjust theamounts as necessary. Factors that affect the warranty obligation include product failure rates, service delivery costs incurred in correcting the product failures, andwarranty policies. Our products are manufactured by contract manufacturers, and in certain cases, we may have recourse against such contract manufacturers.Should actual product failure rates, use of materials or other costs differ from our estimates, additional warranty liabilities could be incurred, which couldmaterially affect our results of operations. The estimates and assumptions used to reserve for product warranty have been accurate in all material respects and havenot materially changed in the past.
Business Combinations, Goodwill, and Intangible Assets
We allocate the fair value of purchase consideration to tangible assets, liabilities assumed, and intangible assets acquired based on their estimated fair values.The excess of the fair value of purchase consideration over the fair values of these identifiable assets and liabilities is allocated to goodwill. The allocation of thepurchase consideration requires management to make significant estimates and assumptions, especially with respect to intangible assets. These estimates caninclude, but are not limited to, future expected cash flows of acquired customers, acquired technology, and trade names from a market participant perspective, andestimates of useful lives, and discount rates. Management’s estimates of fair value are based upon assumptions believed to be reasonable, but which are inherentlyuncertain and unpredictable and, as a result, actual results may differ from estimates. During the measurement period, which is up to one year from the acquisitiondate, we may record adjustments to the assets acquired and liabilities assumed, with the corresponding offset to goodwill. Upon the conclusion of the measurementperiod, any subsequent adjustments are recorded to earnings.
We assess goodwill for impairment at least annually during the fourth quarter and whenever events or changes in circumstances indicate that the carryingvalue of the asset may not be recoverable. Consistent with our determination that we have one operating segment, we have determined that there is one reportingunit and test goodwill for impairment at the entity level. We test goodwill using the two-step process in accordance with ASC 350, Intangibles—Goodwill andOther . In the first step, we compare the carrying amount of the reporting unit to the fair value based on the fair value of our common stock. If the fair value of thereporting unit exceeds the carrying value, goodwill is not considered impaired and no further testing is required. If the carrying value of the reporting unit exceedsthe fair value, goodwill is potentially impaired and the second step of the impairment test must be performed. In the second step, we would compare the impliedfair value of the goodwill, as defined by ASC 350, to its carrying amount to determine the amount of impairment loss, if any. We tested goodwill for impairment asof October 31, 2017 and 2016, and the fair value of our reporting unit exceeded the carrying value. We considered other factors in the performance of the annualgoodwill impairment test in the fourth quarter of 2017, including assumptions about expected future revenue forecasts, changes in the overall economy, trends inour stock price, and other operating conditions. It is reasonably possible that we could perform significantly below our expectations or a deterioration of marketand economic conditions could occur. This would adversely impact our ability to meet our projected results, which could cause our goodwill to becomeimpaired. If we determine that our goodwill is impaired,
52
Table of Contents
we would be required to record a non-cash charge that could have a material adverse effect on our results of operations and financial position.
Acquired finite-lived intangible assets are amortized over their estimated useful lives. We evaluate the recoverability of our intangible assets for possibleimpairment whenever events or circumstances indicate that the carrying amount of such assets may not be recoverable. Recoverability of these assets is measuredby a comparison of the carrying amounts to the future undiscounted cash flows the assets are expected to generate. If such review indicates that the carryingamount of intangible assets is not recoverable, the carrying amount of such assets is reduced to fair value. We have not recorded any such impairment chargeduring the years presented.
Income Taxes
We utilize the asset and liability method of accounting for income taxes, which requires the recognition of deferred tax assets and liabilities for expectedfuture consequences of temporary differences between the financial reporting and income tax bases of assets and liabilities using enacted tax rates. We makeestimates, assumptions, and judgments to determine our expense (benefit) for income taxes and also for deferred tax assets and liabilities and any valuationallowances recorded against our deferred tax assets. We assess the likelihood that our deferred tax assets will be recovered from future taxable income and, to theextent we believe that recovery is not likely, we establish a valuation allowance.
The calculation of our income tax expense involves the use of estimates, assumptions, and judgments while taking into account current tax laws, ourinterpretation of current tax laws, and possible outcomes of future tax audits. We have established reserves to address potential exposures related to tax positionsthat could be challenged by tax authorities. Although we believe our estimates, assumptions, and judgments to be reasonable, any changes in tax law or ourinterpretation of tax laws and the resolutions of potential tax audits could significantly impact the amounts provided for income taxes in our consolidated financialstatements.
The U.S. Tax Cuts and Jobs Act of 2017 (the “2017 Tax Act”) was enacted on December 22, 2017, and includes several key tax provisions that affected theCompany, including a reduction of the statutory corporate tax rate from 35% to 21% effective for tax years beginning after December 31, 2017, elimination of thecarryback of net operating losses generated after December 31, 2017, and changes to how the United States imposes income tax on multinational corporations,among others. The 2017 Tax Act requires complex computations to be performed that were not previously required in U.S. tax law, and preparation and analysis ofinformation not previously required or regularly produced, which require significant judgment in interpreting accounting guidance for such items that is currentlyuncertain. In December 2017, the SEC staff issued Staff Accounting Bulletin No. 118, Income Tax Accounting Implications of the Tax Cuts and Jobs Act (“SAB118”), which allows the Company to record provisional amounts during a measurement period not to extend beyond one year of the enactment date. The Companyhas provided its best estimate of the impact of the 2017 Tax Act in its year-end income tax provision in accordance with its understanding of the 2017 Tax Act andguidance available as of the date of issuance of these consolidated financial statements. As the Company completes its analysis of the 2017 Tax Act, anysubsequent adjustments to provisional amounts that it has recorded may or may not impact its provision for income taxes in the period in which the adjustments aremade due to a full valuation allowance on its U.S. deferred tax assets. The Company expects to complete its analysis within the measurement period in accordancewith SAB 118.
The calculation of our deferred tax asset balance involves the use of estimates, assumptions, and judgments while taking into account estimates of theamounts and type of future taxable income. Actual future operating results and the underlying amount and type of income could differ materially from ourestimates, assumptions and judgments, thereby impacting our financial position and operating results.
We include interest and penalties related to unrecognized tax benefits within income tax expense. Interest and penalties related to unrecognized tax benefitshave been recognized in the appropriate periods presented.
Stock-Based Compensation
Stock-based compensation is measured at the grant date based on the fair value of the award and is recognized as expense, over the requisite service period,which is generally the vesting period of the applicable award.
Determining the fair value of stock-based awards at the grant date requires judgment. The fair value of restricted stock units, or RSUs, is the fair value of ourcommon stock on the grant date. We use the Black-Scholes option-pricing model to determine the fair value of stock options and warrants and shares issued underour 2015 ESPP. The determination of the grant date fair value of stock options and warrants and shares issued under our 2015 ESPP using an option-pricing modelis affected by our estimated common stock fair value as well as assumptions regarding a number of variables. These variables include the fair value of our
53
Table of Contents
common stock, our expected common stock price volatility over the expected life of the stock options and warrants, the expected term of the stock option andwarrants, risk-free interest rates, and the expected dividends, which are estimated as follows:
Fair Value of Our Common Stock . Prior to our IPO, the fair value of the shares of common stock underlying stock options was historically established byour board of directors, which was responsible for these estimates, and was based in part upon a valuation provided by an independent third-party valuation firm.Because there was no public market for our common stock prior to our IPO, our board of directors considered this independent valuation and other factors,including, but not limited to, revenue growth, the current status of the technical and commercial success of our operations, our financial condition, the stage of ourdevelopment, and competition to establish the fair value of our common stock at the time of grant of the stock option. The fair value of the underlying commonstock was determined by the board of directors until our common stock was listed on a stock exchange. For stock options, warrants and RSUs granted subsequentto our IPO, the fair value was based on the closing price of our Class A common stock as reported on the New York Stock Exchange on the date of grant.
Expected Term . The expected term represents the period over which we anticipate stock-based awards to be outstanding. We do not have sufficient historicalexercise data to provide a reasonable basis upon which to estimate expected term due to the limited period of time stock-based awards have been exercisable. As aresult, for stock options and warrants, we used the simplified method to calculate the expected term estimate based on the vesting and contractual terms of the stockoption. Under the simplified method, the expected term is equal to the average of the stock-based award’s weighted average vesting period and its contractual term.The expected term of equity awards issued under our 2015 ESPP is the contractual term.
Volatility . Expected volatility is a measure of the amount by which the stock price is expected to fluctuate. We estimate the expected volatility of thecommon stock underlying our stock options, warrants and equity awards issued under our 2015 ESPP at the grant date by taking the average historical volatility ofthe common stock of a group of comparable publicly traded companies over a period equal to the expected life. We use this method because we have limitedinformation on the volatility of our Class A common stock because of our short trading history.
Risk-Free Rate . The risk-free interest rate is the estimated average interest rate based on U.S. Treasury zero-coupon notes with terms consistent with theexpected term of the awards.
Dividend Yield . We have never declared or paid any cash dividends and do not presently plan to pay cash dividends in the foreseeable future. Consequently,we used an expected dividend yield of zero.
The assumptions used in calculating the fair value of the stock-based awards represent management judgment. As a result, if factors change and differentassumptions are used, the stock-based compensation expense could be materially different in the future.
Recent Accounting Pronouncements
Accounting Pronouncements Not Yet Adopted
In May 2014, the Financial Accounting Standards Board, or the FASB, issued ASU 2014-09, Revenue from Contracts with Customers (Topic 606), whichaffects any entity that either enters into contracts with customers to transfer goods and services or enters into contracts for the transfer of nonfinancial assets. ASU2014-09 will replace most existing revenue recognition guidance in U.S. GAAP when it becomes effective. The standard’s core principle is that a company willrecognize revenue when it transfers promised goods or services to customers in an amount that reflects the consideration to which the company expects to beentitled in exchange for those goods or services. In doing so, companies will need to use more judgment and make more estimates than under the currentlyeffective guidance. These judgments may include identifying performance obligations in the contract, estimating the amount of variable consideration to include inthe transaction price and allocating the transaction price to each separate performance obligation. In April 2016, the FASB issued ASU 2016-10, which clarifiesguidance on identifying performance obligations and licensing implementation. We will adopt ASU 2014-09 effective January 1, 2018, utilizing the modifiedretrospective transition method. Upon adoption, we will recognize the cumulative effect of adopting this guidance as an adjustment to our opening accumulateddeficit balance. We expect this adjustment to be immaterial to our consolidated financial statements. Prior periods will not be retrospectively adjusted. We haveassessed the impact of the guidance, which includes evaluating customer contracts across the organization, developing policies, processes and tools to reportfinancial results, and implementing and evaluating our internal control over financial reporting that will be necessary under the new standard. The new standardmay, in certain circumstances, impact the timing of when revenue is recognized for products shipped, and the timing and classification of certain sales incentives,which are expected to generally be recognized earlier than historical guidance. In addition, we have determined that the presentation of certain reserve balancescurrently shown net within accounts receivable will be presented as refund liabilities within current liabilities upon adoption. We have also determined that theimpact of accounting for costs incurred
54
Table of Contents
to obtain a contract is immaterial. We believe the new guidance is materially consistent with our historical revenue recognition policy. Overall, we do not currentlyexpect the adoption to have a material impact on our consolidated financial statements.
In January 2016, the FASB issued ASU No. 2016-01, F inancial Instruments – Overall (Subtopic 825-10): Recognition and Measurement of Financial Assetsand Financial Liabilities , which updates certain aspects of recognition, measurement, presentation, and disclosure of financial instruments. We will adopt ASU2016-01 in our first quarter of 2018. We are currently evaluating the impact of this guidance on our consolidated financial statements.
In February 2016, the FASB issued ASU 2016-02, Leases (Topic 842) . ASU 2016-02 requires lessees to recognize right-of-use assets and lease liabilities foroperating leases, initially measured at the present value of the lease payments, on the balance sheet. ASU 2016-02 will become effective for us on January 1, 2019,and requires adoption using a modified retrospective approach. We are currently evaluating the impact of this guidance on our consolidated financial statements.We anticipate that the adoption will have a material impact on our consolidated balance sheets, as it will now include a right of use asset and a lease liability for theobligation to make lease payments related to substantially all operating lease arrangements; however, we do not expect the adoption to have a material impact onour consolidated statements of operations.
In June 2016, the FASB issued ASU 2016-13, Financial Instruments - Credit Losses (Topic 326): Measurement of Credit Losses on Financial Instruments.ASU 2016-13 provides for a new impairment model which requires measurement and recognition of expected credit losses for most financial assets and certainother instruments, including but not limited to accounts receivable and available for sale debt securities. ASU 2016-13 will become effective for us on January 1,2020 and early adoption is permitted. We are currently evaluating the impact of this guidance on the consolidated financial statements.
In August 2016, the FASB issued ASU 2016-15, Statement of Cash Flows (Topic 230) . ASU 2016-15 provides guidance intended to reduce diversity inpractice in how certain transactions are classified in the statement of cash flows. ASU 2016-15 provides guidance in a number of situation including, among others,contingent consideration payments made after a business combination, proceeds from the settlement of insurance claims, distributions received from equity methodinvestees, and classifying cash receipts and payments that have aspects of more than one class of cash flows. ASU 2016-15 will become effective for us on January1, 2018 and early adoption is permitted. We do not currently expect the adoption of this guidance to have a material impact on our consolidated financialstatements.
In January 2017, the FASB issued ASU 2017-01, Business Combinations (Topic 805): Clarifying the Definition of a Business . The purpose of ASU 2017-01 is to change the definition of a business to assist entities with evaluating when a set of transferred assets and activities is a business. ASU 2017-01 will becomeeffective for us on January 1, 2018. We do not expect the adoption of this guidance to have a material impact on our consolidated financial statements.
In January 2017, the FASB issued ASU 2017-04, Intangibles-Goodwill and Other (Topic 350): Simplifying the Test for Goodwill Impairment. ASU 2017-04 simplifies the subsequent measurement of goodwill by eliminating the second step of the goodwill impairment test. The second step measures a goodwillimpairment loss by comparing the implied fair value of a reporting unit’s goodwill with the carrying amount of that goodwill. Under ASU 2017-04, a company willrecord an impairment charge based on the excess of a reporting unit’s carrying amount over its fair value. ASU 2017-04 will be applied prospectively and iseffective for annual or interim goodwill impairment tests in fiscal years beginning after December 15, 2019. Early adoption is permitted for interim or annualgoodwill impairment tests performed on testing dates after January 1, 2017. We are currently evaluating the impact of this guidance on our consolidated financialstatements.
In May 2017, the FASB issued ASU 2017-09, Compensation-Stock Compensation (Topic 718): Scope of Modification Accounting . ASU 2017-09 wasissued to clarify and reduce both (i) diversity in practice and (ii) cost and complexity when applying the guidance in Topic 718 to a change to the terms andconditions of a share-based payment award. ASU 2017-09 will become effective for us on January 1, 2018 with early adoption permitted. The amendments to ASU2017-09 should be applied prospectively to an award modified on or after the adoption date. We do not currently expect the adoption of this guidance to have amaterial impact on our consolidated financial statements.
In August 2017, the FASB issued ASU 2017-12, Derivatives and Hedging (Topic 815): Targeted Improvements to Accounting for Hedging Activities. ASU2017-12 amends the hedge accounting rules to simplify the application of hedge accounting guidance and better portray the economic results of risk managementactivities in the financial statements. The guidance expands the ability to hedge non-financial and financial risk components, reduces complexity in fair valuehedges of interest rate risk, eliminates the requirement to separately measure and report hedge ineffectiveness, as well as eases certain hedge effectivenessassessment requirements. ASU 2017-12 will become effective for us on January 1, 2019 with early adoption permitted. We plan to early adopt this new guidance inthe first quarter of 2018 and do not expect the adoption will have a material impact on our consolidated financial statements.
55
Table of Contents
Accounting Pronouncements Recently Adopted
In March 2016, the FASB issued ASU 2016-09, Compensation-Stock Compensation (Topic 718). ASU 2016-09 simplifies several aspects of the accountingfor share-based payment transactions, including the income tax consequences, classification of awards as either equity or liabilities, and classification on thestatement of cash flows. Upon adoption, ASU 2016-09 requires that excess tax benefits for share-based payments be recorded as a reduction of income tax expenseand reflected within operating cash flows, rather than being recorded within equity and reflected within financing cash flows. ASU 2016-09 also permits therepurchase of more of an employee’s shares for tax withholding purposes without triggering liability accounting, clarifies that all cash payments made on anemployee’s behalf for withheld shares should be presented as a financing activity on our cash flows statement, and provides an accounting policy election toaccount for forfeitures as they occur. ASU 2016-09 became effective for us on January 1, 2017. The adoption of ASU 2016-09 resulted in a cumulative effectadjustment of $4.9 million to increase retained earnings as of January 1, 2017, related to the recognition of previously unrecognized excess tax benefits using themodified retrospective method. We elected to apply the change in presentation of excess tax benefits in the consolidated statement of cash flows retrospectively,which resulted in an increase in net cash provided by operations and a decrease in net cash provided by financing activities of $29.2 million for 2016 and $32.1million for 2015. We also elected to make an accounting policy change to recognize forfeitures starting on January 1, 2017 on a prospective basis. Adoption ofASU 2016-09 resulted in the recognition of net stock compensation shortfalls in our provision for income taxes rather than paid-in capital of $2.8 million for thethree months ended April 1, 2017.
56
Table of Contents
Item 7A. Quantitative and Qualitative Disclosures about Market Risk
We are exposed to market risks in the ordinary course of our business. These risks primarily include interest rate and foreign currency risks as follows:
Interest Rate Risk
Our exposure to changes in interest rates relates primarily to our investment portfolio. As of December 31, 2017 , we had cash and cash equivalents of$342.0 million and marketable securities of $337.3 million , which consisted primarily of bank deposits, money market funds, U.S. government and agencysecurities, commercial paper, and corporate notes and bonds. The primary objectives of our investment activities are to preserve principal and provide liquiditywithout significantly increasing risk. Our investment policy specifies credit quality standards for our investments and limits the amount of credit exposure to anysingle issue, issuer, or type of investment.
To date, we have not been exposed, nor do we anticipate being exposed, to material risks due to changes in interest rates. A hypothetical 10% change ininterest rates during any of the periods presented would not have had a material impact on our consolidated financial statements.
Foreign Currency Risk
To date, all of our inventory purchases have been denominated in U.S. dollars. Our international sales are primarily denominated in foreign currencies andany unfavorable movement in the exchange rate between U.S. dollars and the currencies in which we conduct sales in foreign countries could have an adverseimpact on our revenue. A portion of our operating expenses are incurred outside the United States and are denominated in foreign currencies, which are alsosubject to fluctuations due to changes in foreign currency exchange rates. In addition, our suppliers incur many costs, including labor costs, in other currencies. Tothe extent that exchange rates move unfavorably for our suppliers, they may seek to pass these additional costs on to us, which could have a material impact on ourgross margins. Our operating results and cash flows are, therefore, subject to fluctuations due to changes in foreign currency exchange rates. However, we believethat the exposure to foreign currency fluctuation from operating expenses is relatively small at this time as the related costs do not constitute a significant portionof our total expenses.
To partially mitigate the impact of changes in currency exchange rates on net cash flows from our foreign currency denominated revenue and expenses, weenter into foreign currency exchange forward and option contracts. We also hedge certain monetary assets and liabilities denominated in foreign currencies, whichreduces but does not eliminate our exposure to currency fluctuations between the date a transaction is recorded and the date that cash is collected or paid. Ingeneral, the market risks of these contracts are offset by corresponding gains and losses on the transactions being hedged.
We had no outstanding contracts in cash flow hedges for forecasted revenue and expense transactions as of December 31, 2017 . We had outstanding balancesheet hedges with a total notional amount of $141.2 million as of December 31, 2017 . We assessed our exposure to movements in currency exchange rates byperforming a sensitivity analysis of adverse changes in exchange rates and the corresponding impact to our results of operations. Based on transactionsdenominated in currencies other than respective functional currencies, a hypothetical change of 10% would have resulted in an impact on loss before income taxesof approximately $5.4 million for 2017 .
57
Table of Contents
Item 8. Financial Statements and Supplementary Data
FITBIT, INC.INDEX TO CONSOLIDATED FINANCIAL STATEMENTS
PageReport of Independent Registered Public Accounting Firm 59 Consolidated Financial Statements:
Consolidated Balance Sheets 61
Consolidated Statements of Operations 62
Consolidated Statements of Comprehensive Income (Loss) 63
Consolidated Statements of Stockholders’ Equity (Deficit) 64
Consolidated Statements of Cash Flows 65
Notes to Consolidated Financial Statements 66
58
Table of Contents
Report of Independent Registered Public Accounting Firm
To the Board of Directors and Stockholders of Fitbit, Inc.
Opinions on the Financial Statements and Internal Control over Financial Reporting
We have audited the accompanying consolidated balance sheets of Fitbit, Inc. and its subsidiaries as of December 31, 2017 and 2016, and the related consolidatedstatements of operations, of comprehensive income (loss), of redeemable convertible preferred stock and stockholders’ equity (deficit), and of cash flows for eachof the three years in the period ended December 31, 2017, including the related notes (collectively referred to as the “consolidated financial statements”). We alsohave audited the Company's internal control over financial reporting as of December 31, 2017, based on criteria established in Internal Control - IntegratedFramework (2013) issued by the Committee of Sponsoring Organizations of the Treadway Commission (COSO).
In our opinion, the consolidated financial statements referred to above present fairly, in all material respects, the financial position of the Company as of December31, 2017 and 2016, and the results of their operations and their cash flows for each of the three years in the period ended December 31, 2017 in conformity withaccounting principles generally accepted in the United States of America. Also in our opinion, the Company did not maintain, in all material respects, effectiveinternal control over financial reporting as of December 31, 2017, based on criteria established in Internal Control - Integrated Framework (2013) issued by theCOSO because a material weakness in internal control over financial reporting related to accuracy of inputs in the sales order entry process existed as of thatdate.
A material weakness is a deficiency, or a combination of deficiencies, in internal control over financial reporting, such that there is a reasonable possibility that amaterial misstatement of the annual or interim financial statements will not be prevented or detected on a timely basis. The material weakness referred to above isdescribed in Management's Report on Internal Control Over Financial Reporting appearing under Item 9A. We considered this material weakness in determiningthe nature, timing, and extent of audit tests applied in our audit of the 2017 consolidated financial statements, and our opinion regarding the effectiveness of theCompany’s internal control over financial reporting does not affect our opinion on those consolidated financial statements.
Change in Accounting Principle
As discussed in Note 2 to the consolidated financial statements, the Company changed the manner in which it accounts for certain elements of its employee share-based payments in 2017.
Basis for Opinions
The Company's management is responsible for these consolidated financial statements, for maintaining effective internal control over financial reporting, and forits assessment of the effectiveness of internal control over financial reporting included in management's report referred to above. Our responsibility is to expressopinions on the Company’s consolidated financial statements and on the Company's internal control over financial reporting based on our audits. We are a publicaccounting firm registered with the Public Company Accounting Oversight Board (United States) ("PCAOB") and are required to be independent with respect tothe Company in accordance with the U.S. federal securities laws and the applicable rules and regulations of the Securities and Exchange Commission and thePCAOB.
We conducted our audits in accordance with the standards of the PCAOB. Those standards require that we plan and perform the audits to obtain reasonableassurance about whether the consolidated financial statements are free of material misstatement, whether due to error or fraud, and whether effective internalcontrol over financial reporting was maintained in all material respects.
Our audits of the consolidated financial statements included performing procedures to assess the risks of material misstatement of the consolidated financialstatements, whether due to error or fraud, and performing procedures that respond to those risks. Such procedures included examining, on a test basis, evidenceregarding the amounts and disclosures in the consolidated financial statements. Our audits also included evaluating the accounting principles used and significantestimates made by management, as well as evaluating the overall presentation of the consolidated financial statements. Our audit of internal control over financialreporting included obtaining an understanding of internal control over financial reporting, assessing the risk that a material weakness exists, and testing andevaluating the design and operating effectiveness of internal control based on the assessed risk. Our audits also included performing such other procedures as weconsidered necessary in the circumstances. We believe that our audits provide a reasonable basis for our opinions.
59
Table of Contents
Definition and Limitations of Internal Control over Financial Reporting
A company’s internal control over financial reporting is a process designed to provide reasonable assurance regarding the reliability of financial reporting and thepreparation of financial statements for external purposes in accordance with generally accepted accounting principles. A company’s internal control over financialreporting includes those policies and procedures that (i) pertain to the maintenance of records that, in reasonable detail, accurately and fairly reflect the transactionsand dispositions of the assets of the company; (ii) provide reasonable assurance that transactions are recorded as necessary to permit preparation of financialstatements in accordance with generally accepted accounting principles, and that receipts and expenditures of the company are being made only in accordance withauthorizations of management and directors of the company; and (iii) provide reasonable assurance regarding prevention or timely detection of unauthorizedacquisition, use, or disposition of the company’s assets that could have a material effect on the financial statements.
Because of its inherent limitations, internal control over financial reporting may not prevent or detect misstatements. Also, projections of any evaluation ofeffectiveness to future periods are subject to the risk that controls may become inadequate because of changes in conditions, or that the degree of compliance withthe policies or procedures may deteriorate.
/s/PricewaterhouseCoopers LLPSan Francisco, CaliforniaMarch 1, 2018
We have served as the Company’s auditor since 2011.
60
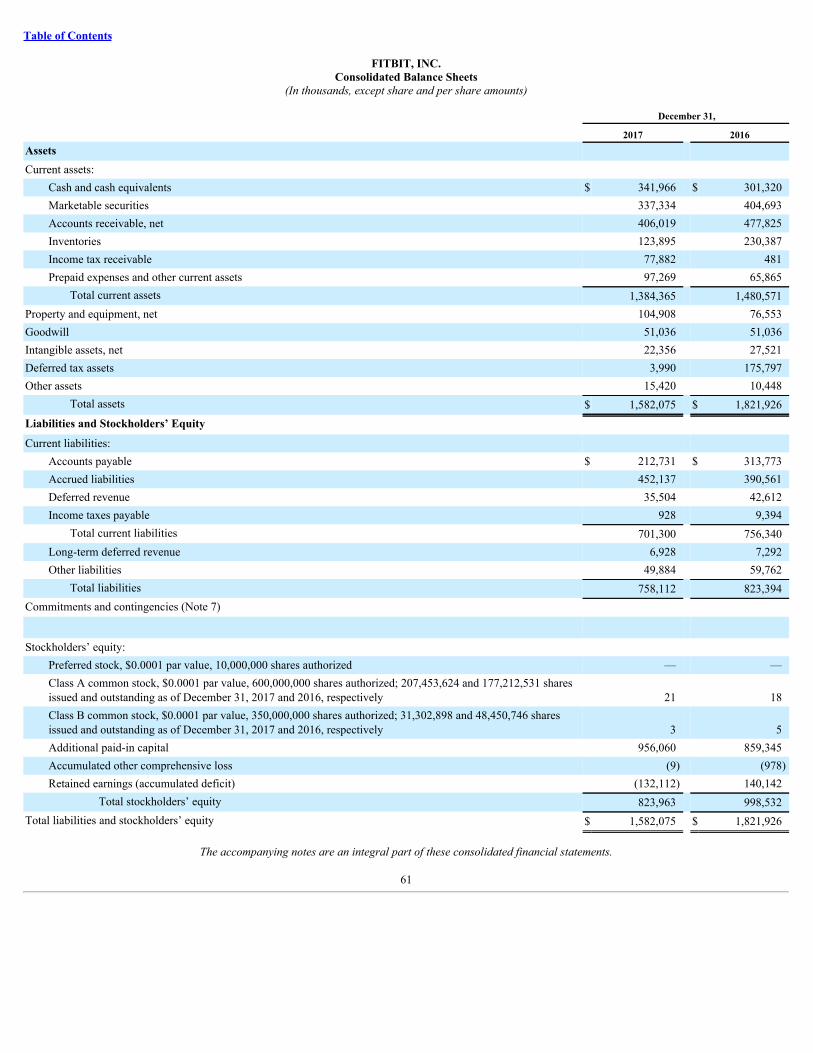
Table of Contents
FITBIT, INC.Consolidated Balance Sheets
(In thousands, except share and per share amounts)
December 31,
2017 2016Assets Current assets:
Cash and cash equivalents $ 341,966 $ 301,320Marketable securities 337,334 404,693Accounts receivable, net 406,019 477,825Inventories 123,895 230,387Income tax receivable 77,882 481Prepaid expenses and other current assets 97,269 65,865
Total current assets 1,384,365 1,480,571Property and equipment, net 104,908 76,553Goodwill 51,036 51,036Intangible assets, net 22,356 27,521Deferred tax assets 3,990 175,797Other assets 15,420 10,448
Total assets $ 1,582,075 $ 1,821,926Liabilities and Stockholders’ Equity Current liabilities:
Accounts payable $ 212,731 $ 313,773Accrued liabilities 452,137 390,561Deferred revenue 35,504 42,612Income taxes payable 928 9,394
Total current liabilities 701,300 756,340Long-term deferred revenue 6,928 7,292Other liabilities 49,884 59,762
Total liabilities 758,112 823,394Commitments and contingencies (Note 7)
Stockholders’ equity: Preferred stock, $0.0001 par value, 10,000,000 shares authorized — —Class A common stock, $0.0001 par value, 600,000,000 shares authorized; 207,453,624 and 177,212,531 sharesissued and outstanding as of December 31, 2017 and 2016, respectively 21 18Class B common stock, $0.0001 par value, 350,000,000 shares authorized; 31,302,898 and 48,450,746 sharesissued and outstanding as of December 31, 2017 and 2016, respectively 3 5Additional paid-in capital 956,060 859,345Accumulated other comprehensive loss (9) (978)Retained earnings (accumulated deficit) (132,112) 140,142
Total stockholders’ equity 823,963 998,532Total liabilities and stockholders’ equity $ 1,582,075 $ 1,821,926
The accompanying notes are an integral part of these consolidated financial statements.
61
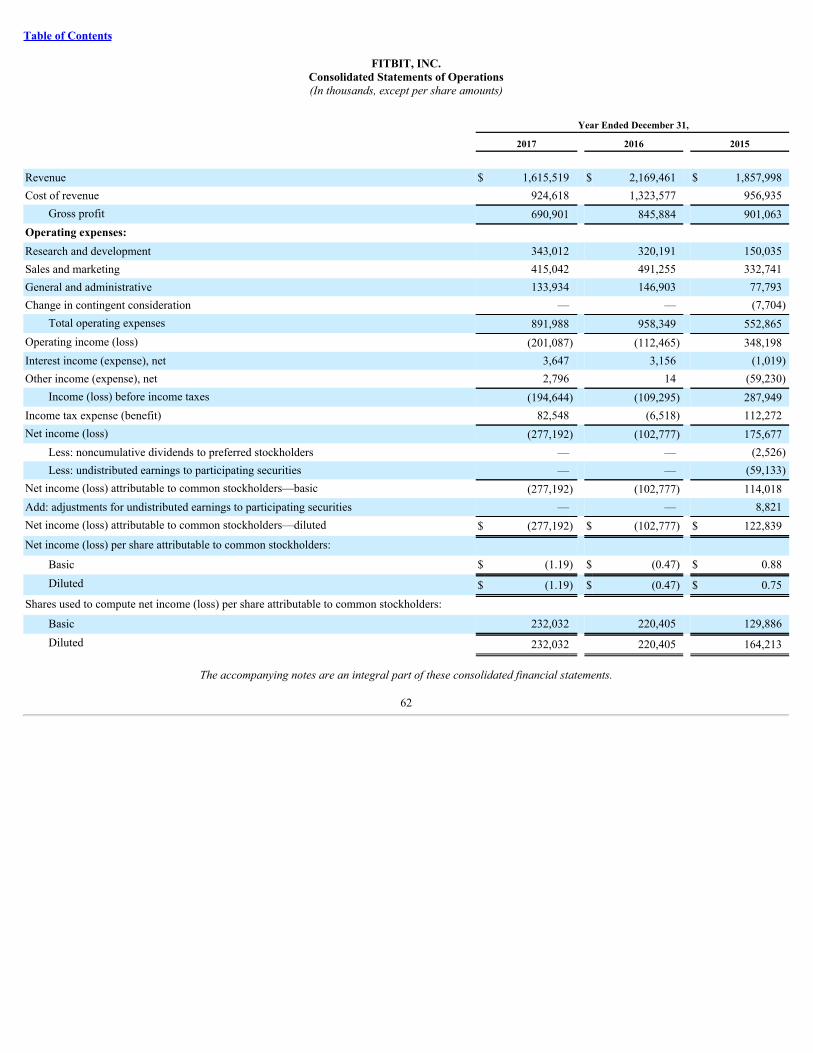
Table of Contents
FITBIT, INC.Consolidated Statements of Operations(In thousands, except per share amounts)
Year Ended December 31,
2017 2016 2015
Revenue $ 1,615,519 $ 2,169,461 $ 1,857,998Cost of revenue 924,618 1,323,577 956,935
Gross profit 690,901 845,884 901,063Operating expenses: Research and development 343,012 320,191 150,035Sales and marketing 415,042 491,255 332,741General and administrative 133,934 146,903 77,793Change in contingent consideration — — (7,704)
Total operating expenses 891,988 958,349 552,865Operating income (loss) (201,087) (112,465) 348,198Interest income (expense), net 3,647 3,156 (1,019)Other income (expense), net 2,796 14 (59,230)
Income (loss) before income taxes (194,644) (109,295) 287,949Income tax expense (benefit) 82,548 (6,518) 112,272Net income (loss) (277,192) (102,777) 175,677
Less: noncumulative dividends to preferred stockholders — — (2,526)Less: undistributed earnings to participating securities — — (59,133)
Net income (loss) attributable to common stockholders—basic (277,192) (102,777) 114,018Add: adjustments for undistributed earnings to participating securities — — 8,821Net income (loss) attributable to common stockholders—diluted $ (277,192) $ (102,777) $ 122,839Net income (loss) per share attributable to common stockholders:
Basic $ (1.19) $ (0.47) $ 0.88Diluted $ (1.19) $ (0.47) $ 0.75
Shares used to compute net income (loss) per share attributable to common stockholders: Basic 232,032 220,405 129,886Diluted 232,032 220,405 164,213
The accompanying notes are an integral part of these consolidated financial statements.
62
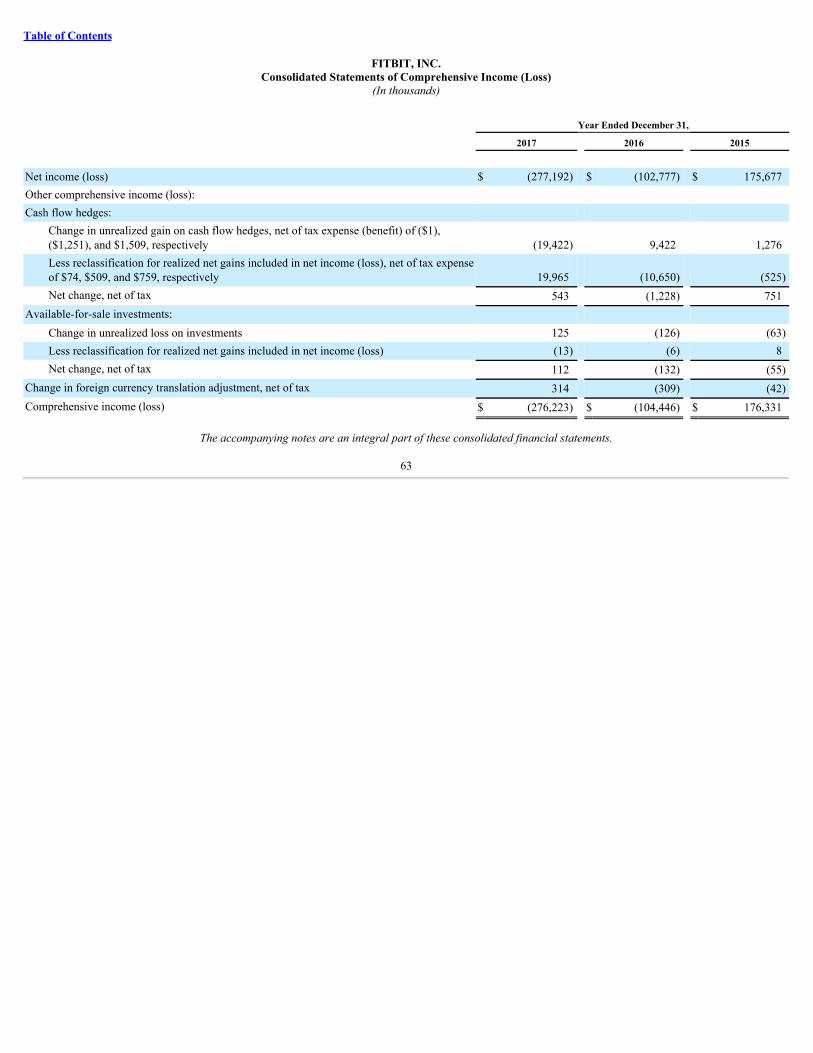
Table of Contents
FITBIT, INC.Consolidated Statements of Comprehensive Income (Loss)
(In thousands)
Year Ended December 31,
2017 2016 2015
Net income (loss) $ (277,192) $ (102,777) $ 175,677Other comprehensive income (loss): Cash flow hedges:
Change in unrealized gain on cash flow hedges, net of tax expense (benefit) of ($1),($1,251), and $1,509, respectively (19,422) 9,422 1,276Less reclassification for realized net gains included in net income (loss), net of tax expenseof $74, $509, and $759, respectively 19,965 (10,650) (525)Net change, net of tax 543 (1,228) 751
Available-for-sale investments: Change in unrealized loss on investments 125 (126) (63)Less reclassification for realized net gains included in net income (loss) (13) (6) 8Net change, net of tax 112 (132) (55)
Change in foreign currency translation adjustment, net of tax 314 (309) (42)Comprehensive income (loss) $ (276,223) $ (104,446) $ 176,331
The accompanying notes are an integral part of these consolidated financial statements.
63
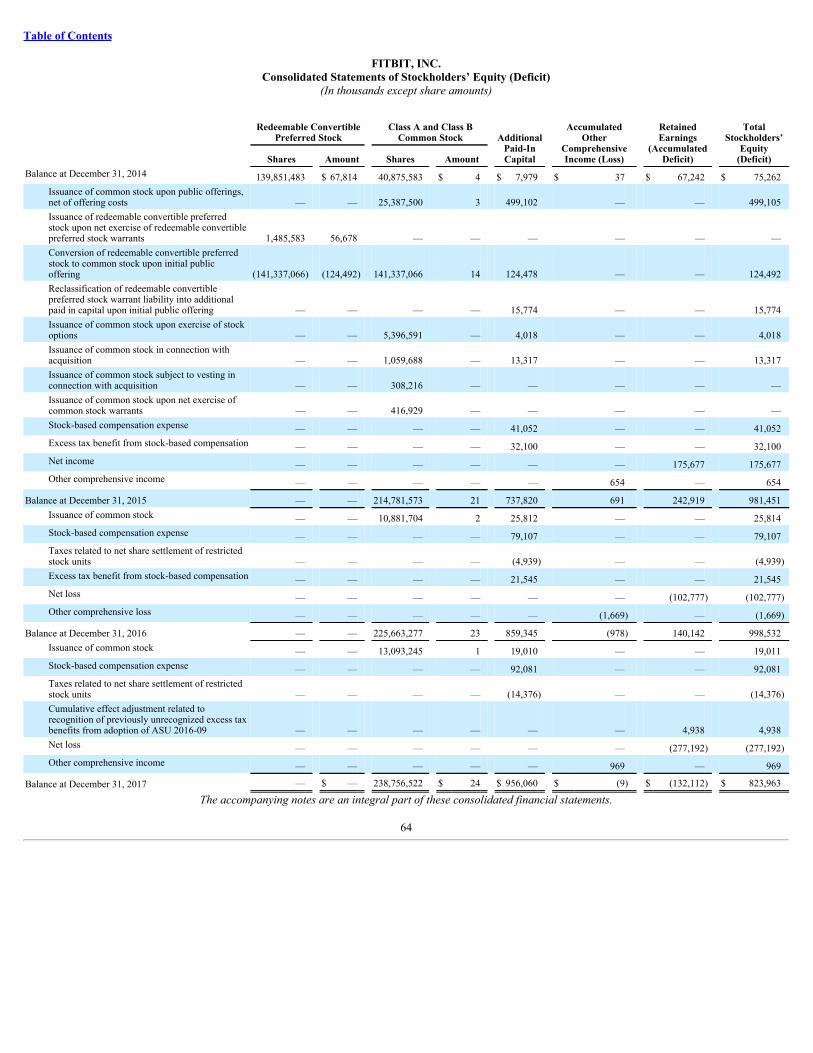
Table of Contents
FITBIT, INC.Consolidated Statements of Stockholders’ Equity (Deficit)
(In thousands except share amounts)
Redeemable Convertible
Preferred Stock Class A and Class B
Common Stock AdditionalPaid-InCapital
AccumulatedOther
ComprehensiveIncome (Loss)
RetainedEarnings
(AccumulatedDeficit)
TotalStockholders’
Equity(Deficit) Shares Amount Shares Amount
Balance at December 31, 2014 139,851,483 $ 67,814 40,875,583 $ 4 $ 7,979 $ 37 $ 67,242 $ 75,262Issuance of common stock upon public offerings,net of offering costs — — 25,387,500 3 499,102 — — 499,105Issuance of redeemable convertible preferredstock upon net exercise of redeemable convertiblepreferred stock warrants 1,485,583 56,678 — — — — — —Conversion of redeemable convertible preferredstock to common stock upon initial publicoffering (141,337,066) (124,492) 141,337,066 14 124,478 — — 124,492Reclassification of redeemable convertiblepreferred stock warrant liability into additionalpaid in capital upon initial public offering — — — — 15,774 — — 15,774Issuance of common stock upon exercise of stockoptions — — 5,396,591 — 4,018 — — 4,018Issuance of common stock in connection withacquisition — — 1,059,688 — 13,317 — — 13,317Issuance of common stock subject to vesting inconnection with acquisition — — 308,216 — — — — —Issuance of common stock upon net exercise ofcommon stock warrants — — 416,929 — — — — —Stock-based compensation expense — — — — 41,052 — — 41,052Excess tax benefit from stock-based compensation — — — — 32,100 — — 32,100Net income — — — — — — 175,677 175,677Other comprehensive income — — — — — 654 — 654
Balance at December 31, 2015 — — 214,781,573 21 737,820 691 242,919 981,451Issuance of common stock — — 10,881,704 2 25,812 — — 25,814Stock-based compensation expense — — — — 79,107 — — 79,107Taxes related to net share settlement of restrictedstock units — — — — (4,939) — — (4,939)Excess tax benefit from stock-based compensation — — — — 21,545 — — 21,545Net loss — — — — — — (102,777) (102,777)Other comprehensive loss — — — — — (1,669) — (1,669)
Balance at December 31, 2016 — — 225,663,277 23 859,345 (978) 140,142 998,532Issuance of common stock — — 13,093,245 1 19,010 — — 19,011Stock-based compensation expense — — — — 92,081 — — 92,081Taxes related to net share settlement of restrictedstock units — — — — (14,376) — — (14,376)Cumulative effect adjustment related torecognition of previously unrecognized excess taxbenefits from adoption of ASU 2016-09 — — — — — — 4,938 4,938Net loss — — — — — — (277,192) (277,192)Other comprehensive income — — — — — 969 — 969
Balance at December 31, 2017 — $ — 238,756,522 $ 24 $ 956,060 $ (9) $ (132,112) $ 823,963
The accompanying notes are an integral part of these consolidated financial statements.
64
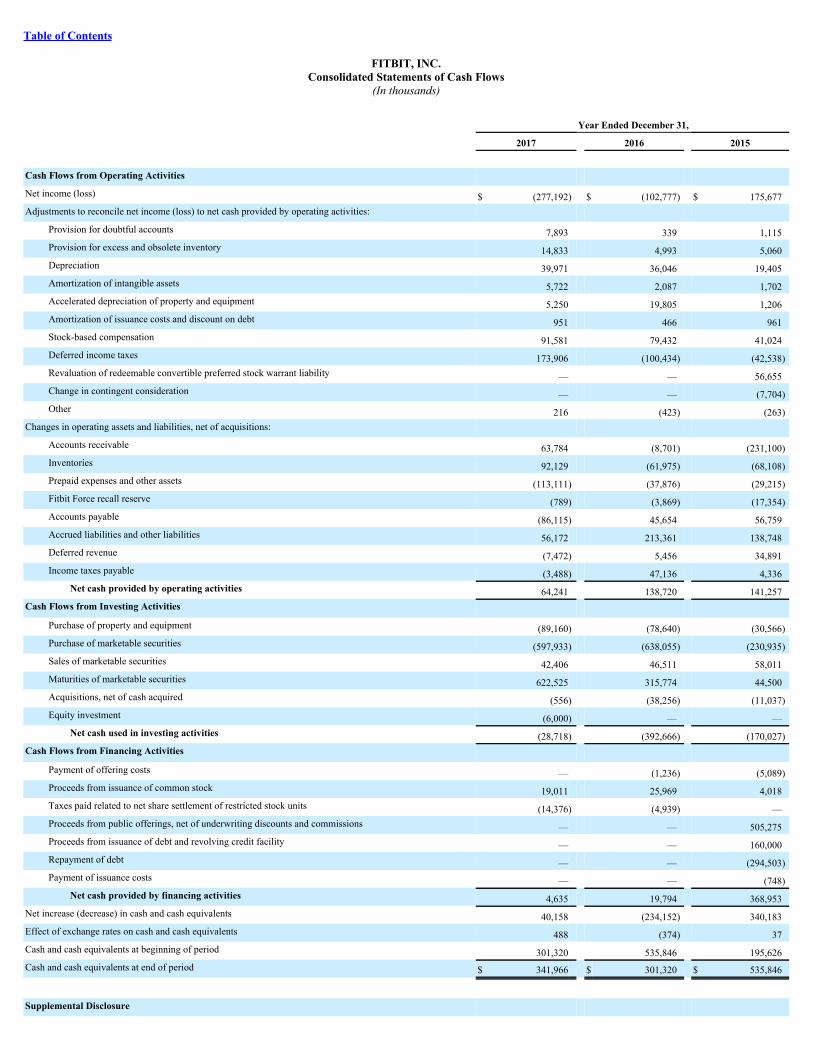
Table of Contents
FITBIT, INC.Consolidated Statements of Cash Flows
(In thousands)
Year Ended December 31,
2017 2016 2015
Cash Flows from Operating Activities Net income (loss) $ (277,192) $ (102,777) $ 175,677Adjustments to reconcile net income (loss) to net cash provided by operating activities:
Provision for doubtful accounts 7,893 339 1,115Provision for excess and obsolete inventory 14,833 4,993 5,060Depreciation 39,971 36,046 19,405Amortization of intangible assets 5,722 2,087 1,702Accelerated depreciation of property and equipment 5,250 19,805 1,206Amortization of issuance costs and discount on debt 951 466 961Stock-based compensation 91,581 79,432 41,024Deferred income taxes 173,906 (100,434) (42,538)Revaluation of redeemable convertible preferred stock warrant liability — — 56,655Change in contingent consideration — — (7,704)Other 216 (423) (263)
Changes in operating assets and liabilities, net of acquisitions: Accounts receivable 63,784 (8,701) (231,100)Inventories 92,129 (61,975) (68,108)Prepaid expenses and other assets (113,111) (37,876) (29,215)Fitbit Force recall reserve (789) (3,869) (17,354)Accounts payable (86,115) 45,654 56,759Accrued liabilities and other liabilities 56,172 213,361 138,748Deferred revenue (7,472) 5,456 34,891Income taxes payable (3,488) 47,136 4,336
Net cash provided by operating activities 64,241 138,720 141,257Cash Flows from Investing Activities
Purchase of property and equipment (89,160) (78,640) (30,566)Purchase of marketable securities (597,933) (638,055) (230,935)Sales of marketable securities 42,406 46,511 58,011Maturities of marketable securities 622,525 315,774 44,500Acquisitions, net of cash acquired (556) (38,256) (11,037)Equity investment (6,000) — —
Net cash used in investing activities (28,718) (392,666) (170,027)Cash Flows from Financing Activities
Payment of offering costs — (1,236) (5,089)Proceeds from issuance of common stock 19,011 25,969 4,018Taxes paid related to net share settlement of restricted stock units (14,376) (4,939) —Proceeds from public offerings, net of underwriting discounts and commissions — — 505,275Proceeds from issuance of debt and revolving credit facility — — 160,000Repayment of debt — — (294,503)Payment of issuance costs — — (748)
Net cash provided by financing activities 4,635 19,794 368,953Net increase (decrease) in cash and cash equivalents 40,158 (234,152) 340,183Effect of exchange rates on cash and cash equivalents 488 (374) 37Cash and cash equivalents at beginning of period 301,320 535,846 195,626Cash and cash equivalents at end of period $ 341,966 $ 301,320 $ 535,846
Supplemental Disclosure
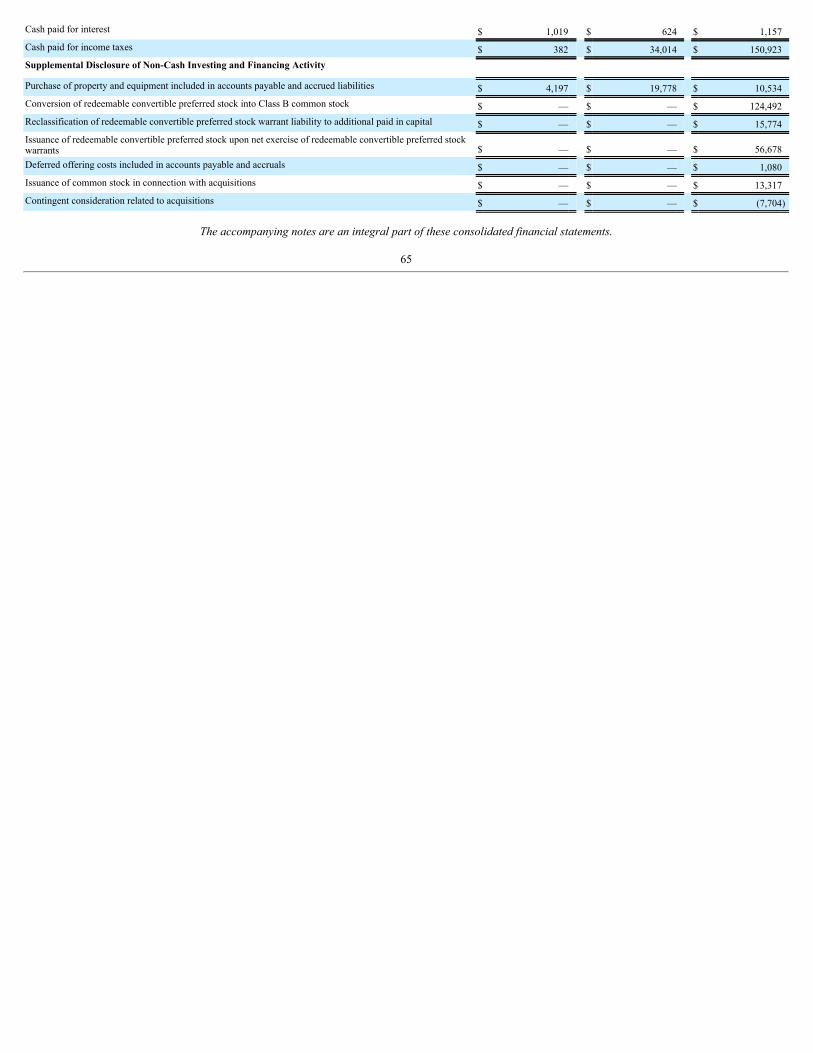
Cash paid for interest $ 1,019 $ 624 $ 1,157Cash paid for income taxes $ 382 $ 34,014 $ 150,923Supplemental Disclosure of Non-Cash Investing and Financing Activity Purchase of property and equipment included in accounts payable and accrued liabilities $ 4,197 $ 19,778 $ 10,534Conversion of redeemable convertible preferred stock into Class B common stock $ — $ — $ 124,492Reclassification of redeemable convertible preferred stock warrant liability to additional paid in capital $ — $ — $ 15,774Issuance of redeemable convertible preferred stock upon net exercise of redeemable convertible preferred stockwarrants $ — $ — $ 56,678Deferred offering costs included in accounts payable and accruals $ — $ — $ 1,080Issuance of common stock in connection with acquisitions $ — $ — $ 13,317Contingent consideration related to acquisitions $ — $ — $ (7,704)
The accompanying notes are an integral part of these consolidated financial statements.
65
Table of Contents
FITBIT, INC.Notes to Consolidated Financial Statements
1. Business Overview and Basis of Presentation
Description of Business
Fitbit, Inc. (the “Company”) is a technology company focused on driving health solutions and positively impacting health outcomes. The Fitbit platformcombines wearable devices with software and services to give its users tools to help them reach their health and fitness goals. The Company’s wearable devices,which include health and fitness trackers and smartwatches, enable its users to view data about their daily activity, exercise and sleep in real-time. The Company’ssoftware and services, which include an online dashboard and mobile app, provide its users with data analytics, motivational and social tools, and virtual coachingthrough customized fitness plans and interactive workouts, drive engagement and can be leveraged to provide personalized insights. The Company sells devicesthrough diversified sales channels that include distributors, retailers, a corporate wellness offering, and Fitbit.com. The Company has established wholly-ownedsubsidiaries globally and its corporate headquarters are located in San Francisco, California.
Basis of Presentation and Principles of Consolidation
The consolidated financial statements are prepared in accordance with U.S. generally accepted accounting principles (“U.S. GAAP”). The consolidatedfinancial statements include the accounts of the Company and its wholly-owned subsidiaries. All intercompany transactions and balances have been eliminated.
The Company’s fiscal year ends on December 31 of each year. In the first quarter of 2016, the Company adopted a 4-4-5 week quarterly calendar, which, forthe 2016 fiscal year, was comprised of four fiscal quarters ending on April 2, 2016, July 2, 2016, October 1, 2016, and December 31, 2016.
Use of Estimates
The preparation of consolidated financial statements in accordance with U.S. GAAP requires management to make estimates and assumptions that affect theamounts reported and disclosed in the consolidated financial statements and accompanying notes. The primary estimates and assumptions made by managementare related to revenue recognition, reserves for sales returns and incentives, reserves for warranty, valuation of stock options, fair value of derivative assets andliabilities, allowance for doubtful accounts, inventory valuation, fair value of goodwill and acquired tangible and intangible assets and liabilities assumed duringacquisitions, the number of reportable segments, the recoverability of intangible assets and their useful lives, contingencies, and income taxes. Actual results coulddiffer from those estimates, and such differences may be material to the consolidated financial statements.
Comprehensive Income (Loss)
Comprehensive income (loss) consists of two components, net income (loss) and other comprehensive income (loss), net of tax. Other comprehensiveincome refers to revenue, expenses, and gains and losses that are recorded as an element of stockholders’ equity but are excluded from net income (loss). TheCompany’s other comprehensive income (loss) consists of net unrealized gains and losses on derivative instruments accounted for as cash flow hedges, foreigncurrency translation adjustments from those subsidiaries not using the U.S. dollar as their functional currency, and unrealized gains and losses on available-for-salesecurities.
Out-of-Period Adjustments
During the preparation of the consolidated financial statements as of and for the year ended December 31, 2017, the Company identified errors within theCompany’s consolidated balance sheet for the year ended December 31, 2016, which financial statements were revised to correct the errors. The Companydetermined that within the consolidated balance sheet previously disclosed as of December 31, 2016, deferred revenue was overstated by $7.3 million and otherliabilities was understated by the same amount, and deferred tax assets and income taxes payable were understated by $1.7 million . The Company evaluated theerror and concluded that it was not material to the financial statements previously issued.
Customer Bankruptcy
In September 2017, Wynit Distribution (“Wynit”) filed for bankruptcy protection under Chapter 11 of the United States Bankruptcy Code. Wynit was theCompany’s largest customer, historically representing 11% of total revenue during the six months
66
Table of Contents
ended July 1, 2017 and 19% of total accounts receivables as of July 1, 2017. In connection with Wynit’s bankruptcy filing, the Company believed that thecollectability of the product shipments to Wynit during the third quarter of 2017 was not reasonably assured. However, as of July 1, 2017, collectability of accountsreceivables from Wynit was reasonably assured.
The Company ceased to recognize revenue from Wynit, which totaled $8.1 million during the third quarter of 2017. Additionally, the Company recorded acharge of $35.8 million during the third quarter ended September 30, 2017 comprised of cost of revenue of $5.5 million associated with shipments to Wynit in thethird quarter of 2017 and bad debt expense of $30.3 million associated with all of Wynit’s outstanding accounts receivables. The Company maintains creditinsurance that covers a portion of the exposure related to its customer receivables. The Company recorded an insurance receivable based on an analysis of itsinsurance policies, including their exclusions, an assessment of the nature of the claim, and information from its insurance carrier. As of September 30, 2017, theCompany had recorded an insurance receivable of $26.8 million , included in prepaid expenses and other current assets, associated with the amount it hadconcluded was probable related to the claim. The $26.8 million insurance receivable allowed the Company to recover $22.7 million of bad debt expense and $4.1million of cost of revenue, resulting in a net charge of $9.0 million in the consolidated statement of operations comprised of net bad debt expense of $7.6 millionand net cost of revenue of $1.4 million . The Company received $21.4 million of the insurance receivable during the fourth quarter of 2017, and the remaining $5.4million in January 2018.
Non-Monetary Transaction
The Company entered into an agreement with a third party during 2016 to exchange inventory for advertising credits and cash. The Company recorded thetransaction based on the estimated fair value of the products exchanged. For the year ended December 31, 2016, the Company recorded $15.0 million of revenueand $7.0 million of associated cost of goods sold upon exchange of the products for advertising credits of $13.0 million and cash of $2.0 million . The $13.0million of unused advertising credits remaining as of December 31, 2016 were recorded in prepaid expenses and other current assets, and other assets. Such creditsare expected to be used over the contractual period of four years, and will be expensed as advertising services are received. During the year ended December 31,2017 , $0.8 million of credits were utilized. The Company’s prepaid and other assets related to unused advertising credits as of December 31, 2017 andDecember 31, 2016 were $12.2 million and $13.0 million , respectively.
2. Significant Accounting Policies
Cash, Cash Equivalents and Marketable Securities
Cash and cash equivalents include all cash balances and highly liquid investments with original maturities of three months or less from the date of purchase.Cash equivalents and marketable securities consist of money market funds, U.S. government and agency securities, commercial paper, and corporate notes andbonds.
The Company’s marketable securities are classified as available-for-sale as of the balance sheet date and are reported at fair value with unrealized gains andlosses reported, net of tax, as a separate component of accumulated other comprehensive income in stockholders’ equity. Because the Company views marketablesecurities as available to support current operations as needed, it has classified all available-for-sale securities as current assets. Realized gains or losses and other-than-temporary impairments, if any, on available-for-sale securities are reported in other expense, net as incurred. Realized gains and losses on the sale ofsecurities are determined by specific identification of each security’s cost basis. Investments are reviewed periodically to identify possible other-than-temporaryimpairments. No impairment loss has been recorded on the securities as the Company believes that any decrease in fair value of these securities is temporary andexpects to recover up to, or beyond, the initial cost of investment for these securities.
Fair Value of Financial Instruments
Assets and liabilities recorded at fair value on a recurring basis are categorized based upon the level of judgment associated with inputs used to measure theirfair values. Fair value is defined as the price that would be received to sell an asset or paid to transfer a liability in an orderly transaction between marketparticipants at the reporting date.
The Company estimates fair value by applying the following hierarchy, which prioritizes the inputs used to measure fair value into three levels and bases thecategorization within the hierarchy upon the lowest level of input that is available and significant to the fair value measurement:
Level 1 —Quoted prices in active markets for identical assets or liabilities;
67
Table of Contents
Level 2 —Observable inputs other than quoted prices in active markets for identical assets and liabilities, quoted prices for identical or similar assets orliabilities in inactive markets, or other inputs that are observable or can be corroborated by observable market data for substantially the full term of the assets orliabilities; and
Level 3 —Inputs that are generally unobservable and typically reflect management’s estimate of assumptions that market participants would use in pricingthe asset or liability.
Foreign Currencies
The Company and all of its wholly-owned subsidiaries use the U.S. dollar as their functional currency.
The Company’s subsidiaries that use the U.S. dollar as their functional currency remeasure local currency denominated monetary assets and liabilities atexchange rates in effect at the end of each period, and inventories, property, plant and equipment and other nonmonetary assets and liabilities at historical rates.Gains and losses from these remeasurements have been included in the Company’s operating results within other income (expense), net. Local currencytransactions of these international operations are remeasured into U.S. dollars at the rates of exchange in effect at the date of the transaction. Foreign currencytransaction gains (losses) were $2.6 million , $ 11.7 million , and $(1.3) million for 2017 , 2016 , and 2015, respectively.
Derivative Instruments
The Company accounts for its derivative instruments as either assets or liabilities and carries them at fair value. Derivatives held by the Company that are notdesignated as hedges are adjusted to fair value through earnings at each reporting date. In addition, the Company enters into derivatives that are accounted for ascash flow hedges. The Company records the gains or losses, net of tax, related to the effective portion of its cash flow hedges as a component of accumulated othercomprehensive income in stockholders’ equity and subsequently reclassifies the gains or losses into revenue and operating expenses when the underlying hedgedtransactions are recognized. The Company periodically assesses the effectiveness of its cash flow hedges. The fair value of derivative assets and liabilities areincluded in prepaid expenses and other current assets and accrued liabilities on the consolidated balance sheets.
Concentration of Credit Risk
Financial instruments that potentially subject the Company to concentrations of credit risk consist primarily of cash, cash equivalents, marketable securities,accounts receivables, derivative instruments and cost method investments. Cash and cash equivalents are deposited with high quality financial institutions and may,at times, exceed federally insured limits. Management believes that the financial institutions that hold the Company’s deposits are financially credit worthy and,accordingly, minimal credit risk exists with respect to those balances. Generally, these deposits may be redeemed upon demand and, therefore, bear minimalinterest rate risk.
The Company’s accounts receivable is derived from customers located principally in the United States. The Company maintains credit insurance for themajority of its customer balances, performs ongoing credit evaluations of its customers, and maintains allowances for potential credit losses on customers’accounts when deemed necessary. Credit losses historically have not been significant. The Company continuously monitors customer payments and maintains anallowance for doubtful accounts based on its assessment of various factors including historical experience, age of the receivable balances, and other currenteconomic conditions or other factors that may affect customers’ ability to pay.
The Company’s derivative instruments expose it to credit risk to the extent that its counterparties may be unable to meet the terms of the agreements. TheCompany seeks to mitigate this risk by limiting counterparties to major financial institutions and by spreading the risk across several major financial institutions. Inaddition, the potential risk of loss with any one counterparty resulting from this type of credit risk is monitored on an ongoing basis.
Supplier Concentration
The Company relies on third parties for the supply and manufacture of its products, as well as third-party logistics providers. In instances where these partiesfail to perform their obligations, the Company may be unable to find alternative suppliers or satisfactorily deliver its products to its customers on time, if at all.
68
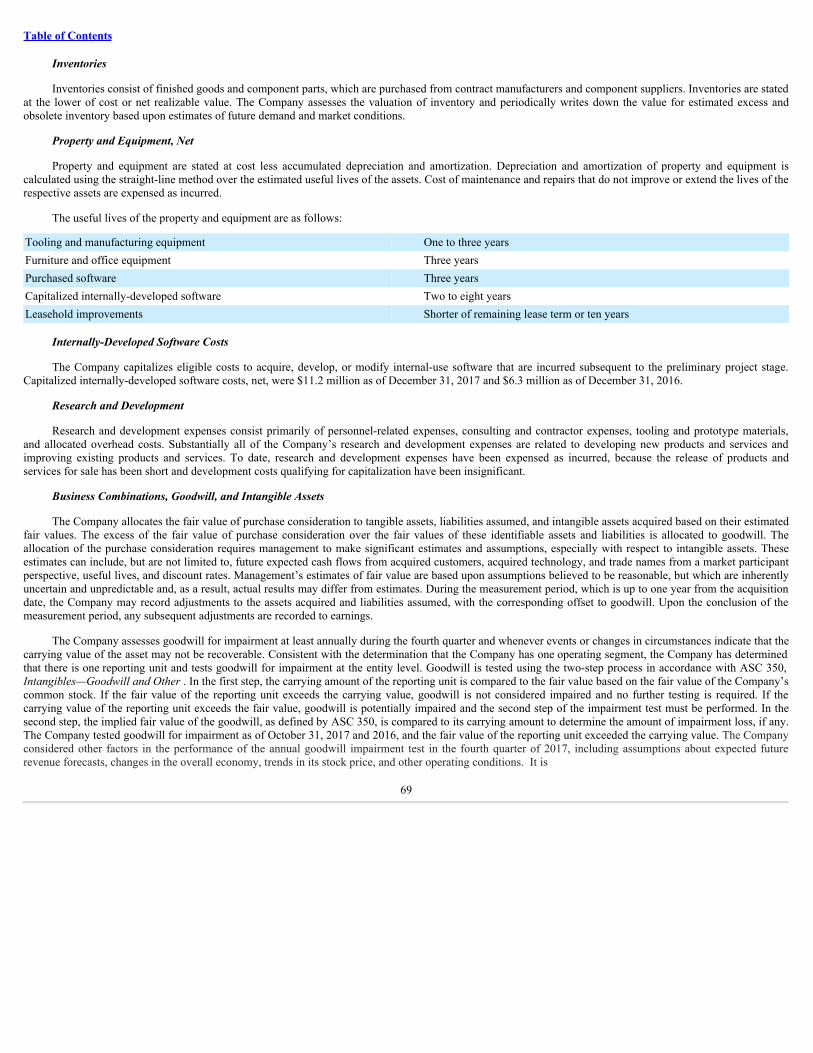
Table of Contents
Inventories
Inventories consist of finished goods and component parts, which are purchased from contract manufacturers and component suppliers. Inventories are statedat the lower of cost or net realizable value. The Company assesses the valuation of inventory and periodically writes down the value for estimated excess andobsolete inventory based upon estimates of future demand and market conditions.
Property and Equipment, Net
Property and equipment are stated at cost less accumulated depreciation and amortization. Depreciation and amortization of property and equipment iscalculated using the straight-line method over the estimated useful lives of the assets. Cost of maintenance and repairs that do not improve or extend the lives of therespective assets are expensed as incurred.
The useful lives of the property and equipment are as follows:
Tooling and manufacturing equipment One to three yearsFurniture and office equipment Three yearsPurchased software Three yearsCapitalized internally-developed software Two to eight yearsLeasehold improvements Shorter of remaining lease term or ten years
Internally-Developed Software Costs
The Company capitalizes eligible costs to acquire, develop, or modify internal-use software that are incurred subsequent to the preliminary project stage.Capitalized internally-developed software costs, net, were $11.2 million as of December 31, 2017 and $6.3 million as of December 31, 2016.
Research and Development
Research and development expenses consist primarily of personnel-related expenses, consulting and contractor expenses, tooling and prototype materials,and allocated overhead costs. Substantially all of the Company’s research and development expenses are related to developing new products and services andimproving existing products and services. To date, research and development expenses have been expensed as incurred, because the release of products andservices for sale has been short and development costs qualifying for capitalization have been insignificant.
Business Combinations, Goodwill, and Intangible Assets
The Company allocates the fair value of purchase consideration to tangible assets, liabilities assumed, and intangible assets acquired based on their estimatedfair values. The excess of the fair value of purchase consideration over the fair values of these identifiable assets and liabilities is allocated to goodwill. Theallocation of the purchase consideration requires management to make significant estimates and assumptions, especially with respect to intangible assets. Theseestimates can include, but are not limited to, future expected cash flows from acquired customers, acquired technology, and trade names from a market participantperspective, useful lives, and discount rates. Management’s estimates of fair value are based upon assumptions believed to be reasonable, but which are inherentlyuncertain and unpredictable and, as a result, actual results may differ from estimates. During the measurement period, which is up to one year from the acquisitiondate, the Company may record adjustments to the assets acquired and liabilities assumed, with the corresponding offset to goodwill. Upon the conclusion of themeasurement period, any subsequent adjustments are recorded to earnings.
The Company assesses goodwill for impairment at least annually during the fourth quarter and whenever events or changes in circumstances indicate that thecarrying value of the asset may not be recoverable. Consistent with the determination that the Company has one operating segment, the Company has determinedthat there is one reporting unit and tests goodwill for impairment at the entity level. Goodwill is tested using the two-step process in accordance with ASC 350,Intangibles—Goodwill and Other . In the first step, the carrying amount of the reporting unit is compared to the fair value based on the fair value of the Company’scommon stock. If the fair value of the reporting unit exceeds the carrying value, goodwill is not considered impaired and no further testing is required. If thecarrying value of the reporting unit exceeds the fair value, goodwill is potentially impaired and the second step of the impairment test must be performed. In thesecond step, the implied fair value of the goodwill, as defined by ASC 350, is compared to its carrying amount to determine the amount of impairment loss, if any.The Company tested goodwill for impairment as of October 31, 2017 and 2016, and the fair value of the reporting unit exceeded the carrying value. The Companyconsidered other factors in the performance of the annual goodwill impairment test in the fourth quarter of 2017, including assumptions about expected futurerevenue forecasts, changes in the overall economy, trends in its stock price, and other operating conditions. It is
69
Table of Contents
reasonably possible that the Company could perform significantly below its expectations or a deterioration of market and economic conditions could occur. Thiswould adversely impact the Company's ability to meet its projected results, which could cause its goodwill to become impaired. If the Company determines that itsgoodwill is impaired, it would be required to record a non-cash charge that could have a material adverse effect on its results of operations and financial position.
Acquired finite-lived intangible assets are amortized over their estimated useful lives. The Company evaluates the recoverability of intangible assets forpossible impairment whenever events or circumstances indicate that the carrying amount of such assets may not be recoverable. Recoverability of these assets ismeasured by a comparison of the carrying amounts to the future undiscounted cash flows the assets are expected to generate. If such review indicates that thecarrying amount of intangible assets is not recoverable, the carrying amount of such assets is reduced to fair value. The Company has not recorded any suchimpairment charge during the years presented.
Impairment of Long-Lived Assets
The Company evaluates its long-lived assets for impairment whenever events or changes in circumstances indicate that the carrying amount of an asset maynot be recoverable. Recoverability is measured by comparison of the carrying amounts to the expected future undiscounted cash flows attributable to these assets.If it is determined that an asset is not recoverable, an impairment loss is recorded in the amount by which the carrying amount of the assets exceeds the expecteddiscounted future cash flows arising from those assets.
Revenue Recognition
The Company derives substantially all of its revenue from sales of its wearable devices, which includes both connected health and fitness devices andaccessories and smartwatches. The Company also generates a small portion of revenue from its subscription-based services. The Company recognizes revenuewhen persuasive evidence of an arrangement exists, delivery has occurred, the sales price is fixed or determinable, and collection is reasonably assured. TheCompany considers delivery of its products to have occurred once title and risk of loss has been transferred. For customers where transfer of risk of loss is at thecustomer’s destination, the Company uses estimates to defer sales at the end of the reporting period based on historical experience of average transit time. TheCompany recognizes revenue, net of estimated sales returns, sales incentives, discounts, and sales tax. The Company generally recognizes revenue for productssold through retailers and distributors on a sell-in basis.
The Company enters into multiple element arrangements that include hardware, software, and services. The first deliverable is the hardware and firmwareessential to the functionality of the connected health and fitness device or smartwatch delivered at the time of sale. The second deliverable is the software servicesincluded with the products, which are provided free of charge and enable users to sync, view, and access real-time data on the Company’s online dashboard andmobile apps. The third deliverable is the embedded right included with the purchase of the device to receive, on a when-and-if-available basis, future unspecifiedfirmware upgrades and features relating to the product’s essential firmware. Commencing in the first quarter of 2015, the Company began accounting for theembedded right as a separate unit of accounting, which is when it believes, through public announcements, it had created an implied obligation to, from time totime, provide future unspecified firmware upgrades and features to the firmware to improve and add new functionality to the health and fitness devices. In addition,the Company occasionally offers a fourth deliverable in bundled arrangements that allows access to subscription-based services related to the Company’s FitbitCoach offering.
The Company allocates revenue to all deliverables based on their relative selling prices. The Company uses a hierarchy to determine the selling price to beused for allocating revenue to deliverables: (i) vendor-specific objective evidence (“VSOE”) of fair value, (ii) third-party evidence (“TPE”), and (iii) best estimateof the selling price (“BESP”). The Company’s process for determining its BESP considers multiple factors including consumer behaviors and the Company’sinternal pricing model and may vary depending upon the facts and circumstances related to each deliverable. BESP for the health and fitness devices andsmartwatches and unspecified upgrade rights reflect the Company’s best estimate of the selling prices if they were sold regularly on a stand-alone basis andcomprise the majority of the arrangement consideration. BESP for upgrade rights currently ranges from $1 to $3 . TPE for the online dashboard and mobile apps iscurrently estimated at $0.99 . VSOE for access to Fitbit Coach subscription-based services is based on the price charged when sold separately.
Amounts allocated to the delivered wearable devices are recognized at the time of delivery, provided the other conditions for revenue recognition have beenmet. Amounts allocated to the online dashboard and mobile apps and unspecified upgrade rights are deferred and recognized on a straight-line basis over theestimated usage period.
The Company offers its users the ability to purchase subscription-based services, through which the users receive incremental features, including access to adigital personal trainer, in-depth analytics regarding the user’s personal metrics, or video-based
70
Table of Contents
customized workouts. Amounts paid for subscriptions are deferred and recognized ratably over the service period which is typically one year. Revenue fromsubscription-based services was less than 1% of revenue for all periods presented.
In addition, the Company offers access to software and services to certain customers in the corporate wellness program, which includes distributioncapabilities, a real-time dashboard, and support services. The Company is currently unable to establish VSOE or TPE for the corporate wellness software andservices. BESP for the corporate wellness software and services is determined based on the Company’s internal pricing model for anticipated renewals for existingcustomers and pricing for new customers. Revenue allocated to the corporate wellness software and services is deferred and recognized on a straight-line basis overthe estimated access period of one year, which is the typical service period. Revenue for corporate wellness software and services was less than 1% of revenue forall periods presented.
The Company accounts for shipping and handling fees billed to customers as revenue. Sales taxes and value added taxes (“VAT”) collected from customersare remitted to governmental authorities are not included in revenue, and are reflected as a liability on the consolidated balance sheets.
Rights of Return, Stock Rotation Rights, and Price Protection
The Company offers limited rights of return, stock rotation rights, and price protection under various policies and programs with its retailer and distributorcustomers and end-users. Below is a summary of the general provisions of such policies and programs:
• Retailers and distributors are generally allowed to return products that were originally sold through to an end-user under provisions of their contracts, called“open-box” returns, and such returns may be made at any time after the original sale.
• All purchases through Fitbit.com are covered by a 45-day right of return.• Certain distributors are allowed stock rotation rights which are limited rights of return of products purchased during a prior period, generally one quarter.• Certain distributors and retailers are allowed return rights for defective products.• Certain distributors are offered price protection that allows for the right to a partial credit for unsold inventory held by the distributor if the Company reduces
the selling price of a product.
The Company estimates reserves for these policies and programs based on historical experience, and records the reserves as a reduction of revenue andaccounts receivable. Through December 31, 2017 , actual returns have primarily been open-box returns. In addition, through 2017, the Company has had limitedprice protection claims. On a quarterly basis, the amount of revenue that is reserved for future returns is calculated based on historical trends and data specific toeach reporting period. The historical trends consider product life cycles, new product introductions, market acceptance of products, product sell-through, the typeof customer, seasonality, and other factors. Return rates can fluctuate over time, but have been sufficiently predictable to allow the Company to estimate expectedfuture product returns. The Company reviews the actual returns evidenced in prior quarters as a percent of related revenue to determine the historical rate ofreturns. The Company then applies the historical rate of returns to the current period revenue as a basis for estimating future returns. When necessary, the Companyalso provides a specific reserve for products in the distribution channel in excess of estimated requirements. This estimate can be affected by the amount of aparticular product in the channel, the rate of sell-through, product plans, and other factors. The Company also considers whether there are circumstances whichmay result in anticipated returns higher than the historical return rate from direct customers and records an additional specific reserve as necessary. The estimatesand assumptions used to reserve for rights of return, stock rotation rights, and price protection have been accurate in all material respects and have not materiallychanged in the past.
Sales Incentives
The Company offers sales incentives through various programs, consisting primarily of cooperative advertising and marketing development fund programs.The Company records advertising and marketing development fund programs with customers as a reduction to revenue unless it receives an identifiable benefit inexchange for credits claimed by the customer and can reasonably estimate the fair value of the identifiable benefit received, in which case the Company records itas a marketing expense. The Company recognizes a liability and reduces revenue for rebates or other incentives based on the estimated amount of rebates or creditsthat will be claimed by customers.
Cost of Revenue
Cost of revenue consists of product costs, including costs of contract manufacturers for production, shipping and handling costs, packaging, warrantyreplacement costs, fulfillment costs, manufacturing and tooling equipment depreciation, warehousing costs, excess and obsolete inventory write-downs, costsrelated to the Fitbit Force product recall, and certain allocated costs related to management, facilities, and personnel-related expenses and other expenses associatedwith supply chain logistics.
71
Table of Contents
Advertising Costs and Point of Purchase (“POP”) Displays
Costs related to advertising and promotions, excluding cooperative advertising costs, are expensed to sales and marketing as incurred. Advertising and
promotion expenses, including expenses for POP displays, for 2017 , 2016 , and 2015 were $226.3 million , $316.8 million , and $237.0 million , respectively. Co-op advertising costs are recorded as a reduction to revenue, and for 2017 , 2016 , and 2015 were $45.0 million , $52.9 million , and $38.3 million , respectively.
The Company provides retailers with POP displays, generally free of charge, in order to facilitate the marketing of the Company’s products within retailstores. Any amounts capitalized related to the costs of the POP displays are recorded as prepaid expenses and other current assets on the consolidated balancesheets and recognized as expense over the expected period of the benefit provided by these assets, which is generally 12 months. The related expenses are includedin sales and marketing expenses on the consolidated statements of operations.
Product Warranty
The Company offers a standard product warranty that its products will operate under normal use for a period of one -year from the date of original purchase,except in the European Union and certain Asia Pacific countries where the Company provides a two -year warranty. The Company has the obligation, at its option,to either repair or replace a defective product. At the time revenue is recognized, an estimate of future warranty costs is recorded as a component of cost ofrevenues. The estimate of future warranty costs is based on historical and projected warranty claim rates, historical and projected cost-per-claim and knowledge ofspecific product failures, if any, that are outside of the Company’s typical experience. The Company regularly review these estimates to assess the appropriatenessof its recorded warranty liabilities and adjust the amounts as necessary. Factors that affect the warranty obligation include product failure rates, service deliverycosts incurred in correcting the product failures, and warranty policies. The Company’s products are manufactured by contract manufacturers, and in certain cases,the Company may have recourse against such contract manufacturers. Should actual product failure rates, use of materials or other costs differ from the Company’sestimates, additional warranty liabilities could be incurred, which could materially affect its results of operations. The estimates and assumptions used to reservefor product warranty have been accurate in all material respects and have not materially changed in the past.
Fitbit Force Product Recall
The Company established reserves for the Fitbit Force recall when circumstances giving rise to the recall became known. It considered various factors inestimating the product recall exposure. These include estimates for:
• refunds and product returns from retailer and distributor customers and end-users, which were charged to revenue and cost of revenue on theconsolidated statements of operations;
• logistics and handling fees for managing product returns and processing refunds, obsolescence of on-hand inventory, cancellation charges for existingpurchase commitments and rework of component inventory by the Company’s contract manufacturers, accelerated depreciation of tooling andmanufacturing equipment, which were charged to cost of revenue on the consolidated statements of operations; and
• legal fees and settlement costs, which were charged to general and administrative expenses on the consolidated statements of operations.
These factors above are updated and reevaluated each period and the related reserves are adjusted when factors indicate that the recall reserves are eitherinsufficient to cover or exceed the estimated product recall expenses.
Stock-Based Compensation
Stock-based compensation is measured at the grant date based on the fair value of the award and is recognized as expense over the requisite service period,which is generally the vesting period of the respective award. Determining the fair value of stock-based awards at the grant date requires judgment. The fair valueof restricted stock units, or RSUs, is the fair value of the Company’s common stock on the grant date. The Company uses the Black-Scholes option-pricing modelto determine the fair value of stock options, warrants and shares issued under the 2015 Employee Stock Purchase Plan (the “2015 ESPP”).
The Company recognizes tax benefits related to stock-based compensation to the extent that the total reduction to its income tax liability from stock-basedcompensation is greater than the amount of the deferred tax assets previously recorded in anticipation of these benefits.
72
Table of Contents
Segment Information
The Company operates as one operating segment as it only reports financial information on an aggregate and consolidated basis to its Chief ExecutiveOfficer, who is the Company’s chief operating decision maker.
Income Taxes
The Company utilizes the asset and liability method of accounting for income taxes, which requires the recognition of deferred tax assets and liabilities forexpected future consequences of temporary differences between the financial reporting and income tax bases of assets and liabilities using enacted tax rates. TheCompany makes estimates, assumptions, and judgments to determine our expense (benefit) for income taxes and also for deferred tax assets and liabilities and anyvaluation allowances recorded against its deferred tax assets. The Company assesses the likelihood that its deferred tax assets will be recovered from future taxableincome and, to the extent it believes that recovery is not likely, the Company establishes a valuation allowance.
The calculation of the Company’s income tax expense involves the use of estimates, assumptions, and judgments while taking into account current tax laws,its interpretation of current tax laws, and possible outcomes of future tax audits. The Company has established reserves to address potential exposures related to taxpositions that could be challenged by tax authorities. Although the Company believes its estimates, assumptions, and judgments to be reasonable, any changes intax law or its interpretation of tax laws and the resolutions of potential tax audits could significantly impact the amounts provided for income taxes in itsconsolidated financial statements.
The U.S. Tax Cuts and Jobs Act of 2017 (the “2017 Tax Act”) was enacted on December 22, 2017, and includes several key tax provisions that affected theCompany, including a reduction of the statutory corporate tax rate from 35% to 21% effective for tax years beginning after December 31, 2017, elimination of thecarryback of net operating losses generated after December 31, 2017, and changes to how the United States imposes income tax on multinational corporations,among others. The 2017 Tax Act requires complex computations to be performed that were not previously required in U.S. tax law, and preparation and analysis ofinformation not previously required or regularly produced, which require significant judgment in interpreting accounting guidance for such items that is currentlyuncertain. In December 2017, the SEC staff issued Staff Accounting Bulletin No. 118, Income Tax Accounting Implications of the Tax Cuts and Jobs Act (“SAB118”), which allows the Company to record provisional amounts during a measurement period not to extend beyond one year of the enactment date. The Companyhas provided its best estimate of the impact of the 2017 Tax Act in its year-end income tax provision in accordance with its understanding of the 2017 Tax Act andguidance available as of the date of issuance of these consolidated financial statements. As the Company completes its analysis of the 2017 Tax Act, anysubsequent adjustments to provisional amounts that it has recorded may or may not impact its provision for income taxes in the period in which the adjustments aremade due to a full valuation allowance on its U.S. deferred tax assets. The Company expects to complete its analysis within the measurement period in accordancewith SAB 118.
The calculation of the Company’s deferred tax asset balance involves the use of estimates, assumptions, and judgments while taking into account estimatesof the amounts and type of future taxable income. Actual future operating results and the underlying amount and type of income could differ materially from itsestimates, assumptions, and judgments, thereby impacting its financial position and operating results.
The Company includes interest and penalties related to unrecognized tax benefits within income tax expense. Interest and penalties related to unrecognizedtax benefits have been recognized in the appropriate periods presented.
Net Income (Loss) per Share Attributable to Common Stockholders
Basic and diluted net income (loss) per share attributable to common stockholders is presented in conformity with the two-class method required forparticipating securities. The Company considers its redeemable convertible preferred stock to be participating securities. The holders of the redeemable convertiblepreferred stock did not have a contractual obligation to share in losses. In accordance with the two-class method, earnings allocated to these participating securitiesand the related number of outstanding shares of the participating securities, which include contractual participation rights in undistributed earnings, have beenexcluded from the computation of basic and diluted net income per share attributable to common stockholders. For the calculation of diluted net income per share,net income attributable to common stockholders for basic net income per share is adjusted by the effect of dilutive securities. Diluted net income per shareattributable to common stockholders is computed by dividing the net income attributable to common stockholders by the weighted-average number of commonshares outstanding, including all potentially dilutive common shares, if the effect of such shares is dilutive.
In connection with the Company’s Initial Public Offering (“IPO”) in 2015, the Company established two classes of authorized common stock: Class Acommon stock and Class B common stock. As a result, all then-outstanding shares of common stock were converted into shares of Class B common stock. Therights of the holders of Class A common stock and Class B common stock
73
Table of Contents
are identical, except with respect to voting and conversion. Each share of Class A common stock is entitled to one vote per share and each share of Class Bcommon stock is entitled to ten votes per share. Each share of Class B common stock is convertible at any time at the option of the stockholder into one share ofClass A common stock, generally automatically converts into Class A common stock upon a transfer, and has no expiration date. The Company applies the two-class method of calculating earnings per share, but as the dividend rights of both classes are identical, basic and diluted earnings per share are the same for bothclasses.
As the Company was in a net loss position in 2017 and 2016, basic net loss per share attributable to common stockholders was the same as diluted net lossper share attributable to common stockholders as the inclusion of all potential shares of common stock outstanding would have been anti-dilutive.
Recent Accounting Pronouncements
Accounting Pronouncements Not Yet Adopted
In May 2014, the Financial Accounting Standards Board (the “FASB”), issued ASU 2014-09, Revenue from Contracts with Customers (Topic 606), whichaffects any entity that either enters into contracts with customers to transfer goods and services or enters into contracts for the transfer of nonfinancial assets. ASU2014-09 will replace most existing revenue recognition guidance in U.S. GAAP when it becomes effective. The standard’s core principle is that a company willrecognize revenue when it transfers promised goods or services to customers in an amount that reflects the consideration to which the company expects to beentitled in exchange for those goods or services. In doing so, companies will need to use more judgment and make more estimates than under the currentlyeffective guidance. These judgments may include identifying performance obligations in the contract, estimating the amount of variable consideration to include inthe transaction price and allocating the transaction price to each separate performance obligation. In April 2016, the FASB issued ASU 2016-10, which clarifiesguidance on identifying performance obligations and licensing implementation. The Company will adopt ASU 2014-09 effective January 1, 2018, utilizing themodified retrospective transition method. Upon adoption, the Company will recognize the cumulative effect of adopting this guidance as an adjustment to itsopening accumulated deficit balance. The Company expects this adjustment to be immaterial to its consolidated financial statements. Prior periods will not beretrospectively adjusted. The Company has assessed the impact of the guidance, which includes evaluating customer contracts across the organization, developingpolicies, processes and tools to report financial results, and implementing and evaluating the Company’s internal control over financial reporting that will benecessary under the new standard. The new standard may, in certain circumstances, impact the timing of when revenue is recognized for products shipped, and thetiming and classification of certain sales incentives, which are expected to generally be recognized earlier than historical guidance. In addition, the Company hasdetermined that the presentation of certain reserve balances currently shown net within accounts receivable will be presented as refund liabilities within currentliabilities upon adoption. The Company has also determined that the impact of accounting for costs incurred to obtain a contract is immaterial. The Companybelieves the new guidance is materially consistent with its historical revenue recognition policy. Overall, the Company does not currently expect the adoption tohave a material impact on its consolidated financial statements.
In January 2016, the FASB issued ASU No. 2016-01, F inancial Instruments – Overall (Subtopic 825-10): Recognition and Measurement of Financial Assetsand Financial Liabilities , which updates certain aspects of recognition, measurement, presentation and disclosure of financial instruments. The Company willadopt ASU 2016-01 in its first quarter of 2018. The Company is currently evaluating the impact of this guidance on its consolidated financial statements.
In February 2016, the FASB issued ASU 2016-02, Leases (Topic 842) . ASU 2016-02 requires lessees to recognize right-of-use assets and lease liabilities foroperating leases, initially measured at the present value of the lease payments, on the balance sheet. ASU 2016-02 will become effective for the Company onJanuary 1, 2019, and requires adoption using a modified retrospective approach. The Company is currently evaluating the impact of this guidance on itsconsolidated financial statements. The Company anticipates that the adoption will have a material impact on its consolidated balance sheets, as it will now includea right of use asset and a lease liability for the obligation to make lease payments related to substantially all operating lease arrangements; however, the Companydoes not expect the adoption to have a material impact on its consolidated statements of operations.
In June 2016, the FASB issued ASU 2016-13, Financial Instruments-Credit Losses (Topic 326): Measurement of Credit Losses on Financial Instruments.ASU 2016-13 provides for a new impairment model which requires measurement and recognition of expected credit losses for most financial assets and certainother instruments, including but not limited to accounts receivable and available for sale debt securities. ASU 2016-13 will become effective for the Company onJanuary 1, 2020 and early adoption is permitted. The Company is currently evaluating the impact of this guidance on its consolidated financial statements.
In August 2016, the FASB issued ASU 2016-15, Statement of Cash Flows (Topic 230) . ASU 2016-15 provides guidance intended to reduce diversity inpractice in how certain transactions are classified in the statement of cash flows. ASU 2016-15 provides guidance in a number of situation including, among others,contingent consideration payments made after a business
74
Table of Contents
combination, proceeds from the settlement of insurance claims, distributions received from equity method investees, and classifying cash receipts and paymentsthat have aspects of more than one class of cash flows. ASU 2016-15 will become effective for the Company on January 1, 2018 and early adoption is permitted.The Company does not currently expect the adoption of this guidance to have a material impact on its consolidated financial statements.
In January 2017, the FASB issued ASU 2017-01, Business Combinations (Topic 805): Clarifying the Definition of a Business . The purpose of ASU 2017-01 isto change the definition of a business to assist entities with evaluating when a set of transferred assets and activities is a business. ASU 2017-01 will becomeeffective for the Company on January 1, 2018. The Company does not expect the adoption of this guidance to have a material impact on its consolidated financialstatements.
In January 2017, the FASB issued ASU 2017-04, Intangibles-Goodwill and Other (Topic 350): Simplifying the Test for Goodwill Impairment. ASU2017-04 simplifies the subsequent measurement of goodwill by eliminating the second step of the goodwill impairment test. The second step measures a goodwillimpairment loss by comparing the implied fair value of a reporting unit’s goodwill with the carrying amount of that goodwill. Under ASU 2017-04, a company willrecord an impairment charge based on the excess of a reporting unit’s carrying amount over its fair value. ASU 2017-04 will be applied prospectively and iseffective for annual or interim goodwill impairment tests in fiscal years beginning after December 15, 2019. Early adoption is permitted for interim or annualgoodwill impairment tests performed on testing dates after January 1, 2017. The Company is currently evaluating the impact of this guidance on its consolidatedfinancial statements.
In May 2017, the FASB issued ASU 2017-09, Compensation-Stock Compensation (Topic 718): Scope of Modification Accounting . ASU 2017-09 was issued toclarify and reduce both (i) diversity in practice and (ii) cost and complexity when applying the guidance in Topic 718 to a change to the terms and conditions of ashare-based payment award. ASU 2017-09 will become effective for the Company on January 1, 2018 with early adoption permitted. The amendments to ASU2017-09 should be applied prospectively to an award modified on or after the adoption date. The Company does not currently expect the adoption of this guidanceto have a material impact on its consolidated financial statements.
In August 2017, the FASB issued ASU 2017-12, Derivatives and Hedging (Topic 815): Targeted Improvements to Accounting for Hedging Activities.ASU 2017-12 amends the hedge accounting rules to simplify the application of hedge accounting guidance and better portray the economic results of riskmanagement activities in the financial statements. The guidance expands the ability to hedge non-financial and financial risk components, reduces complexity infair value hedges of interest rate risk, eliminates the requirement to separately measure and report hedge ineffectiveness, as well as eases certain hedgeeffectiveness assessment requirements. ASU 2017-12 will become effective for the Company on January 1, 2019 with early adoption permitted. The Companyplans to early adopt this new guidance in the first quarter of 2018 and does not expect the adoption will have a material impact on its consolidated financialstatements.
Accounting Pronouncements Recently Adopted
In March 2016, the FASB issued ASU 2016-09, Compensation-Stock Compensation (Topic 718). ASU 2016-09 simplifies several aspects of the accountingfor share-based payment transactions, including the income tax consequences, classification of awards as either equity or liabilities, and classification on thestatement of cash flows. Upon adoption, ASU 2016-09 requires that excess tax benefits for share-based payments be recorded as a reduction of income tax expenseand reflected within operating cash flows, rather than being recorded within equity and reflected within financing cash flows. ASU 2016-09 also permits therepurchase of more of an employee’s shares for tax withholding purposes without triggering liability accounting, clarifies that all cash payments made on anemployee’s behalf for withheld shares should be presented as a financing activity on the Company’s cash flows statement, and provides an accounting policyelection to account for forfeitures as they occur. ASU 2016-09 became effective for the Company on January 1, 2017. The adoption of ASU 2016-09 resulted in acumulative effect adjustment of $4.9 million to increase retained earnings as of January 1, 2017, related to the recognition of previously unrecognized excess taxbenefits using the modified retrospective method. The Company elected to apply the change in presentation of excess tax benefits in the consolidated statement ofcash flows retrospectively, which resulted in an increase in net cash provided by operations and a decrease in net cash provided by financing activities of $29.2million for 2016 and $32.1 million for 2015. The Company also elected to make an accounting policy change to recognize forfeitures starting on January 1, 2017on a prospective basis.
3. Fair Value Measurements
Fair Value Measurement of Financial Assets and Liabilities
The carrying values of the Company’s accounts receivable and accounts payable, approximated their fair values due to the short period of time to maturity orrepayment.
The following tables set forth the Company’s financial instruments that were measured at fair value on a recurring basis by level within the fair valuehierarchy (in thousands):
December 31, 2017
Level 1 Level 2 Level 3 TotalAssets:
Money market funds $ 193,066 $ — $ — $ 193,066U.S. government agencies — 79,624 — 79,624Corporate debt securities — 291,582 — 291,582
Total $ 193,066 $ 371,206 $ — $ 564,272Liabilities:
Derivative liabilities $ — $ 2,138 $ — $ 2,138Stock warrant liability — — 208 208
$ — $ 2,138 $ 208 $ 2,346
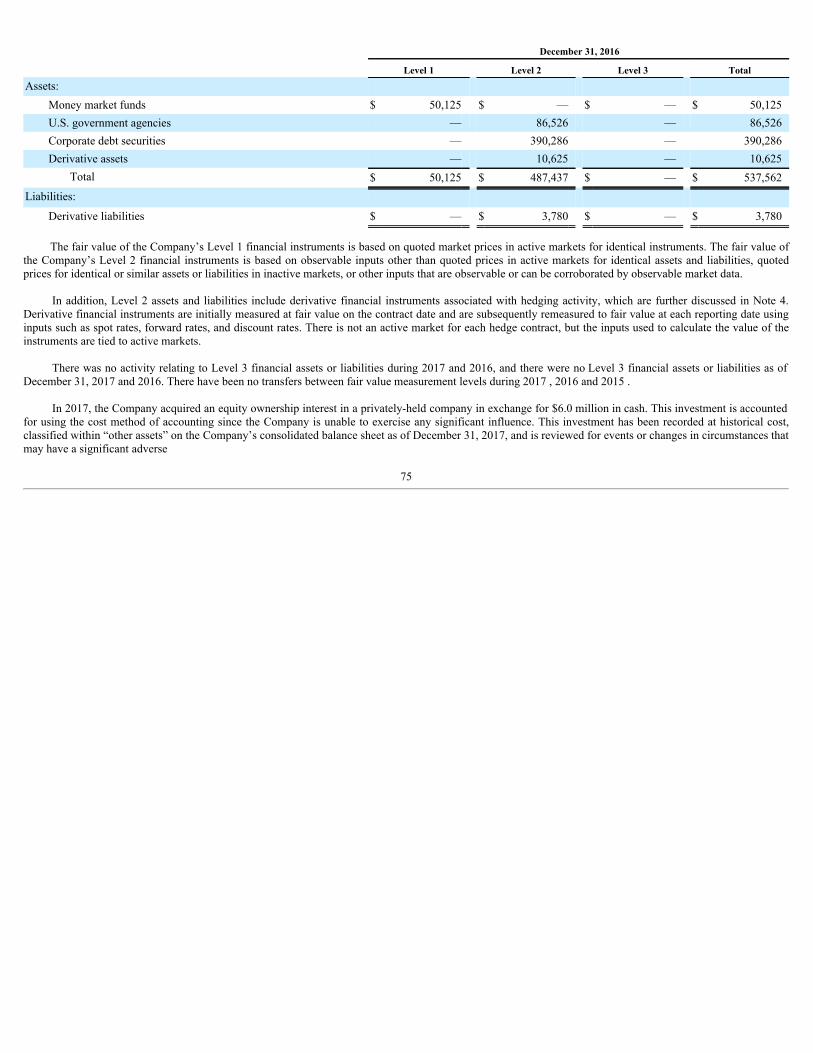
December 31, 2016
Level 1 Level 2 Level 3 TotalAssets:
Money market funds $ 50,125 $ — $ — $ 50,125U.S. government agencies — 86,526 — 86,526Corporate debt securities — 390,286 — 390,286Derivative assets — 10,625 — 10,625
Total $ 50,125 $ 487,437 $ — $ 537,562Liabilities:
Derivative liabilities $ — $ 3,780 $ — $ 3,780
The fair value of the Company’s Level 1 financial instruments is based on quoted market prices in active markets for identical instruments. The fair value ofthe Company’s Level 2 financial instruments is based on observable inputs other than quoted prices in active markets for identical assets and liabilities, quotedprices for identical or similar assets or liabilities in inactive markets, or other inputs that are observable or can be corroborated by observable market data.
In addition, Level 2 assets and liabilities include derivative financial instruments associated with hedging activity, which are further discussed in Note 4.Derivative financial instruments are initially measured at fair value on the contract date and are subsequently remeasured to fair value at each reporting date usinginputs such as spot rates, forward rates, and discount rates. There is not an active market for each hedge contract, but the inputs used to calculate the value of theinstruments are tied to active markets.
There was no activity relating to Level 3 financial assets or liabilities during 2017 and 2016, and there were no Level 3 financial assets or liabilities as ofDecember 31, 2017 and 2016. There have been no transfers between fair value measurement levels during 2017 , 2016 and 2015 .
In 2017, the Company acquired an equity ownership interest in a privately-held company in exchange for $6.0 million in cash. This investment is accountedfor using the cost method of accounting since the Company is unable to exercise any significant influence. This investment has been recorded at historical cost,classified within “other assets” on the Company’s consolidated balance sheet as of December 31, 2017, and is reviewed for events or changes in circumstances thatmay have a significant adverse
75
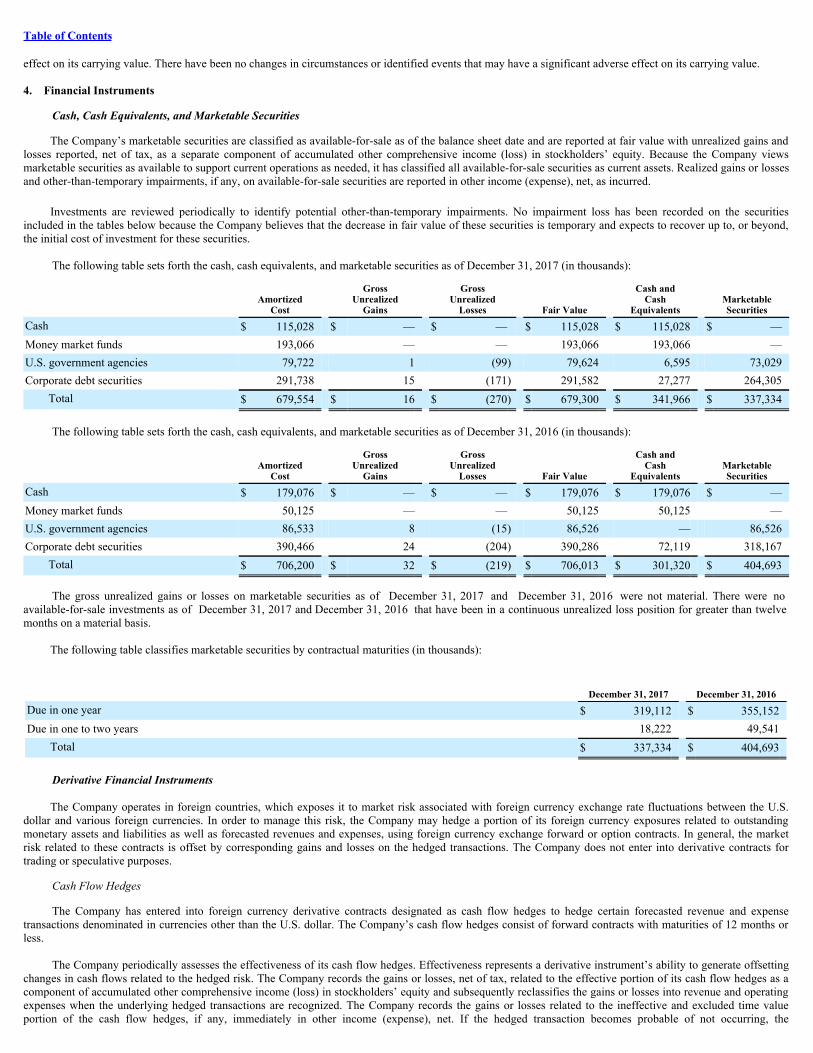
Table of Contents
effect on its carrying value. There have been no changes in circumstances or identified events that may have a significant adverse effect on its carrying value.
4. Financial Instruments
Cash, Cash Equivalents, and Marketable Securities
The Company’s marketable securities are classified as available-for-sale as of the balance sheet date and are reported at fair value with unrealized gains andlosses reported, net of tax, as a separate component of accumulated other comprehensive income (loss) in stockholders’ equity. Because the Company viewsmarketable securities as available to support current operations as needed, it has classified all available-for-sale securities as current assets. Realized gains or lossesand other-than-temporary impairments, if any, on available-for-sale securities are reported in other income (expense), net, as incurred.
Investments are reviewed periodically to identify potential other-than-temporary impairments. No impairment loss has been recorded on the securitiesincluded in the tables below because the Company believes that the decrease in fair value of these securities is temporary and expects to recover up to, or beyond,the initial cost of investment for these securities.
The following table sets forth the cash, cash equivalents, and marketable securities as of December 31, 2017 (in thousands):
Amortized
Cost
GrossUnrealized
Gains
GrossUnrealized
Losses Fair Value
Cash andCash
Equivalents MarketableSecurities
Cash $ 115,028 $ — $ — $ 115,028 $ 115,028 $ —Money market funds 193,066 — — 193,066 193,066 —U.S. government agencies 79,722 1 (99) 79,624 6,595 73,029Corporate debt securities 291,738 15 (171) 291,582 27,277 264,305
Total $ 679,554 $ 16 $ (270) $ 679,300 $ 341,966 $ 337,334
The following table sets forth the cash, cash equivalents, and marketable securities as of December 31, 2016 (in thousands):
Amortized
Cost
GrossUnrealized
Gains
GrossUnrealized
Losses Fair Value
Cash andCash
Equivalents MarketableSecurities
Cash $ 179,076 $ — $ — $ 179,076 $ 179,076 $ —Money market funds 50,125 — — 50,125 50,125 —U.S. government agencies 86,533 8 (15) 86,526 — 86,526Corporate debt securities 390,466 24 (204) 390,286 72,119 318,167
Total $ 706,200 $ 32 $ (219) $ 706,013 $ 301,320 $ 404,693
The gross unrealized gains or losses on marketable securities as of December 31, 2017 and December 31, 2016 were not material. There were noavailable-for-sale investments as of December 31, 2017 and December 31, 2016 that have been in a continuous unrealized loss position for greater than twelvemonths on a material basis.
The following table classifies marketable securities by contractual maturities (in thousands):
December 31, 2017
December 31, 2016 Due in one year $ 319,112 $ 355,152Due in one to two years 18,222 49,541
Total $ 337,334 $ 404,693
Derivative Financial Instruments
The Company operates in foreign countries, which exposes it to market risk associated with foreign currency exchange rate fluctuations between the U.S.dollar and various foreign currencies. In order to manage this risk, the Company may hedge a portion of its foreign currency exposures related to outstandingmonetary assets and liabilities as well as forecasted revenues and expenses, using foreign currency exchange forward or option contracts. In general, the marketrisk related to these contracts is offset by corresponding gains and losses on the hedged transactions. The Company does not enter into derivative contracts fortrading or speculative purposes.
Cash Flow Hedges
The Company has entered into foreign currency derivative contracts designated as cash flow hedges to hedge certain forecasted revenue and expensetransactions denominated in currencies other than the U.S. dollar. The Company’s cash flow hedges consist of forward contracts with maturities of 12 months orless.
The Company periodically assesses the effectiveness of its cash flow hedges. Effectiveness represents a derivative instrument’s ability to generate offsettingchanges in cash flows related to the hedged risk. The Company records the gains or losses, net of tax, related to the effective portion of its cash flow hedges as acomponent of accumulated other comprehensive income (loss) in stockholders’ equity and subsequently reclassifies the gains or losses into revenue and operatingexpenses when the underlying hedged transactions are recognized. The Company records the gains or losses related to the ineffective and excluded time valueportion of the cash flow hedges, if any, immediately in other income (expense), net. If the hedged transaction becomes probable of not occurring, the
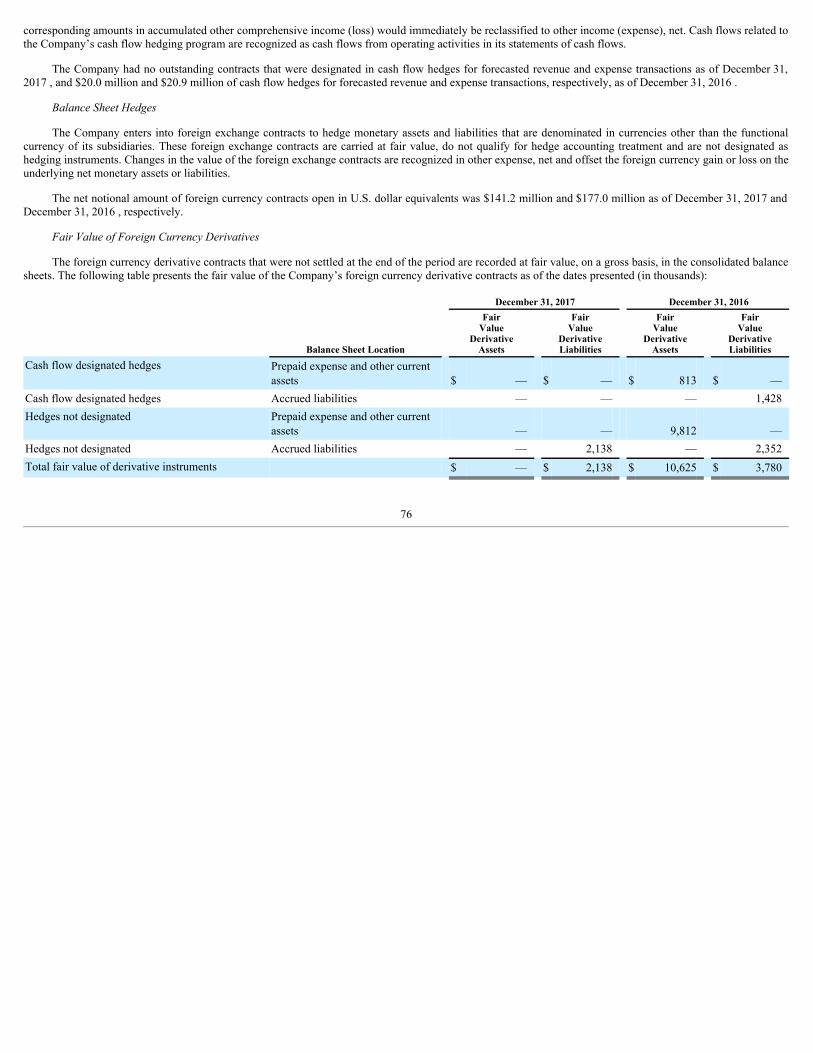
corresponding amounts in accumulated other comprehensive income (loss) would immediately be reclassified to other income (expense), net. Cash flows related tothe Company’s cash flow hedging program are recognized as cash flows from operating activities in its statements of cash flows.
The Company had no outstanding contracts that were designated in cash flow hedges for forecasted revenue and expense transactions as of December 31,2017 , and $20.0 million and $20.9 million of cash flow hedges for forecasted revenue and expense transactions, respectively, as of December 31, 2016 .
Balance Sheet Hedges
The Company enters into foreign exchange contracts to hedge monetary assets and liabilities that are denominated in currencies other than the functionalcurrency of its subsidiaries. These foreign exchange contracts are carried at fair value, do not qualify for hedge accounting treatment and are not designated ashedging instruments. Changes in the value of the foreign exchange contracts are recognized in other expense, net and offset the foreign currency gain or loss on theunderlying net monetary assets or liabilities.
The net notional amount of foreign currency contracts open in U.S. dollar equivalents was $141.2 million and $177.0 million as of December 31, 2017 andDecember 31, 2016 , respectively.
Fair Value of Foreign Currency Derivatives
The foreign currency derivative contracts that were not settled at the end of the period are recorded at fair value, on a gross basis, in the consolidated balancesheets. The following table presents the fair value of the Company’s foreign currency derivative contracts as of the dates presented (in thousands):
December 31, 2017 December 31, 2016
Balance Sheet Location
FairValue
DerivativeAssets
FairValue
DerivativeLiabilities
FairValue
DerivativeAssets
FairValue
DerivativeLiabilities
Cash flow designated hedges Prepaid expense and other currentassets $ — $ — $ 813 $ —
Cash flow designated hedges Accrued liabilities — — — 1,428Hedges not designated Prepaid expense and other current
assets — — 9,812 —Hedges not designated Accrued liabilities — 2,138 — 2,352Total fair value of derivative instruments $ — $ 2,138 $ 10,625 $ 3,780
76
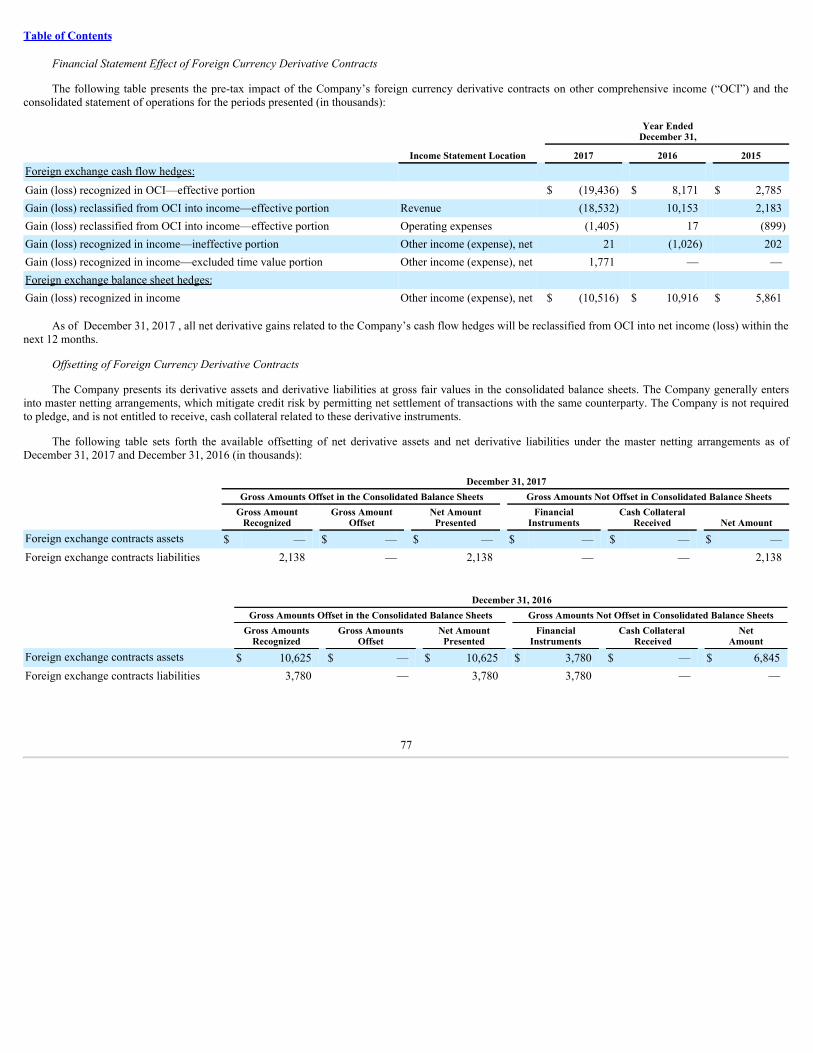
Table of Contents
Financial Statement Effect of Foreign Currency Derivative Contracts
The following table presents the pre-tax impact of the Company’s foreign currency derivative contracts on other comprehensive income (“OCI”) and theconsolidated statement of operations for the periods presented (in thousands):
Year Ended
December 31,
Income Statement Location 2017 2016 2015Foreign exchange cash flow hedges: Gain (loss) recognized in OCI—effective portion $ (19,436) $ 8,171 $ 2,785Gain (loss) reclassified from OCI into income—effective portion Revenue (18,532) 10,153 2,183Gain (loss) reclassified from OCI into income—effective portion Operating expenses (1,405) 17 (899)Gain (loss) recognized in income—ineffective portion Other income (expense), net 21 (1,026) 202Gain (loss) recognized in income—excluded time value portion Other income (expense), net 1,771 — —Foreign exchange balance sheet hedges: Gain (loss) recognized in income Other income (expense), net $ (10,516) $ 10,916 $ 5,861
As of December 31, 2017 , all net derivative gains related to the Company’s cash flow hedges will be reclassified from OCI into net income (loss) within thenext 12 months.
Offsetting of Foreign Currency Derivative Contracts
The Company presents its derivative assets and derivative liabilities at gross fair values in the consolidated balance sheets. The Company generally entersinto master netting arrangements, which mitigate credit risk by permitting net settlement of transactions with the same counterparty. The Company is not requiredto pledge, and is not entitled to receive, cash collateral related to these derivative instruments.
The following table sets forth the available offsetting of net derivative assets and net derivative liabilities under the master netting arrangements as ofDecember 31, 2017 and December 31, 2016 (in thousands):
December 31, 2017 Gross Amounts Offset in the Consolidated Balance Sheets
Gross Amounts Not Offset in Consolidated Balance Sheets
Gross Amount
Recognized Gross Amount
Offset Net Amount
PresentedFinancial
Instruments Cash Collateral
Received Net AmountForeign exchange contracts assets $ — $ — $ — $ — $ — $ —Foreign exchange contracts liabilities 2,138 — 2,138 — — 2,138
December 31, 2016 Gross Amounts Offset in the Consolidated Balance Sheets
Gross Amounts Not Offset in Consolidated Balance Sheets
Gross Amounts
Recognized Gross Amounts
Offset Net Amount
PresentedFinancial
Instruments Cash Collateral
Received Net
AmountForeign exchange contracts assets $ 10,625 $ — $ 10,625 $ 3,780 $ — $ 6,845Foreign exchange contracts liabilities 3,780 — 3,780 3,780 — —
77
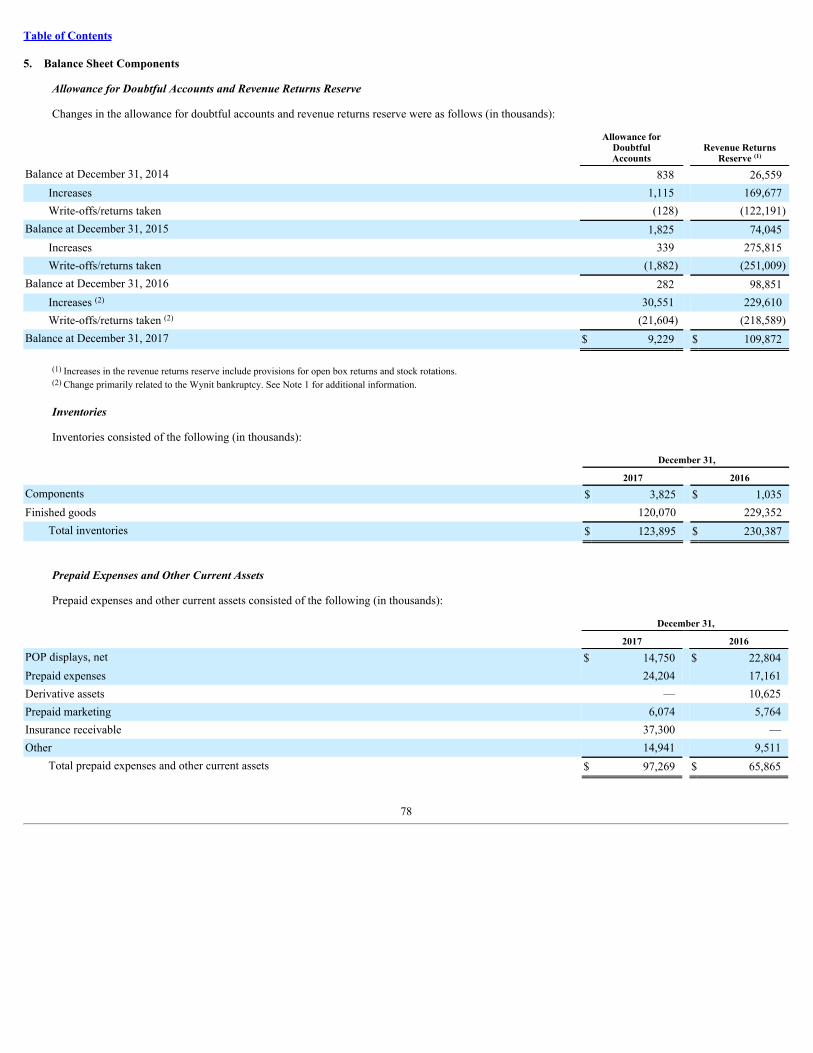
Table of Contents
5. Balance Sheet Components
Allowance for Doubtful Accounts and Revenue Returns Reserve
Changes in the allowance for doubtful accounts and revenue returns reserve were as follows (in thousands):
Allowance forDoubtfulAccounts
Revenue ReturnsReserve (1)
Balance at December 31, 2014 838 26,559Increases 1,115 169,677Write-offs/returns taken (128) (122,191)
Balance at December 31, 2015 1,825 74,045Increases 339 275,815Write-offs/returns taken (1,882) (251,009)
Balance at December 31, 2016 282 98,851Increases (2) 30,551 229,610Write-offs/returns taken (2) (21,604) (218,589)
Balance at December 31, 2017 $ 9,229 $ 109,872
(1) Increases in the revenue returns reserve include provisions for open box returns and stock rotations.(2) Change primarily related to the Wynit bankruptcy. See Note 1 for additional information.
Inventories
Inventories consisted of the following (in thousands):
December 31, 2017 2016Components $ 3,825 $ 1,035Finished goods 120,070 229,352
Total inventories $ 123,895 $ 230,387
Prepaid Expenses and Other Current Assets
Prepaid expenses and other current assets consisted of the following (in thousands):
December 31, 2017 2016POP displays, net $ 14,750 $ 22,804Prepaid expenses 24,204 17,161Derivative assets — 10,625Prepaid marketing 6,074 5,764Insurance receivable 37,300 —Other 14,941 9,511
Total prepaid expenses and other current assets $ 97,269 $ 65,865
78
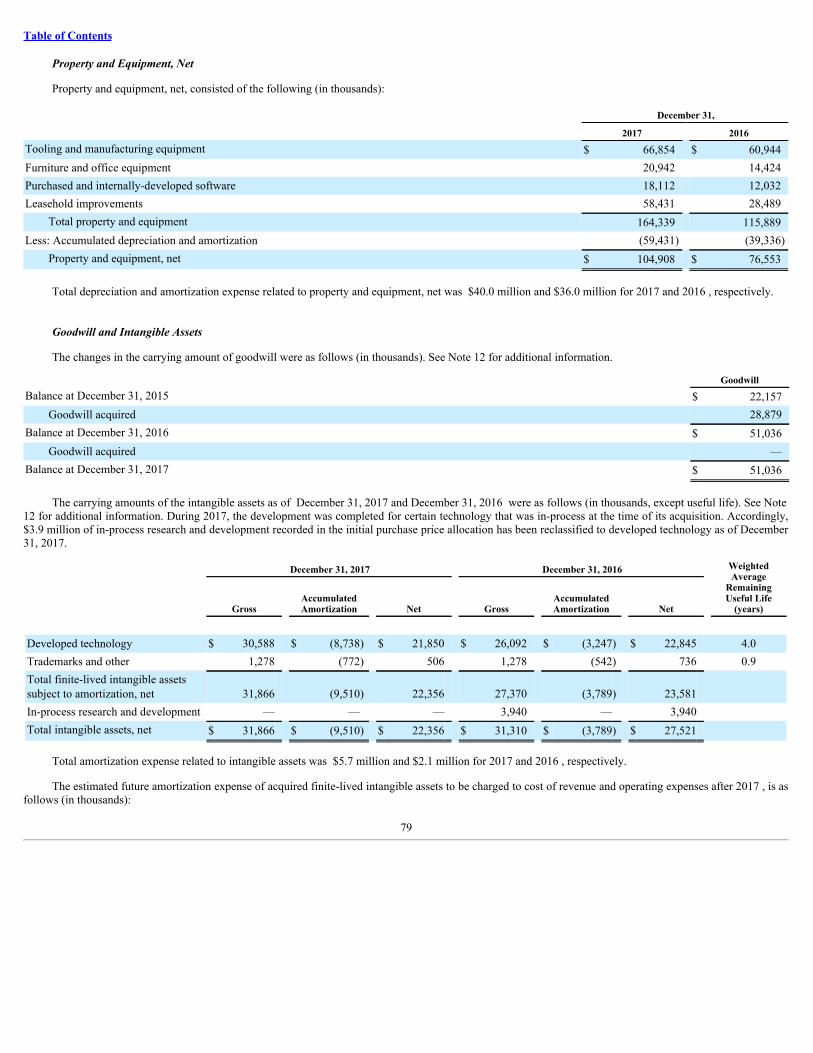
Table of Contents
Property and Equipment, Net
Property and equipment, net, consisted of the following (in thousands):
December 31, 2017 2016Tooling and manufacturing equipment $ 66,854 $ 60,944Furniture and office equipment 20,942 14,424Purchased and internally-developed software 18,112 12,032Leasehold improvements 58,431 28,489
Total property and equipment 164,339 115,889Less: Accumulated depreciation and amortization (59,431) (39,336)
Property and equipment, net $ 104,908 $ 76,553
Total depreciation and amortization expense related to property and equipment, net was $40.0 million and $36.0 million for 2017 and 2016 , respectively.
Goodwill and Intangible Assets
The changes in the carrying amount of goodwill were as follows (in thousands). See Note 12 for additional information.
GoodwillBalance at December 31, 2015 $ 22,157
Goodwill acquired 28,879Balance at December 31, 2016 $ 51,036
Goodwill acquired —Balance at December 31, 2017 $ 51,036
The carrying amounts of the intangible assets as of December 31, 2017 and December 31, 2016 were as follows (in thousands, except useful life). See Note12 for additional information. During 2017, the development was completed for certain technology that was in-process at the time of its acquisition. Accordingly,$3.9 million of in-process research and development recorded in the initial purchase price allocation has been reclassified to developed technology as of December31, 2017.
December 31, 2017 December 31, 2016 WeightedAverage
RemainingUseful Life
(years) Gross AccumulatedAmortization Net Gross
AccumulatedAmortization Net
Developed technology $ 30,588 $ (8,738) $ 21,850 $ 26,092 $ (3,247) $ 22,845 4.0Trademarks and other 1,278 (772) 506 1,278 (542) 736 0.9Total finite-lived intangible assetssubject to amortization, net 31,866 (9,510) 22,356 27,370 (3,789) 23,581 In-process research and development — — — 3,940 — 3,940 Total intangible assets, net $ 31,866 $ (9,510) $ 22,356 $ 31,310 $ (3,789) $ 27,521
Total amortization expense related to intangible assets was $5.7 million and $2.1 million for 2017 and 2016 , respectively.
The estimated future amortization expense of acquired finite-lived intangible assets to be charged to cost of revenue and operating expenses after 2017 , is as
follows (in thousands):
79
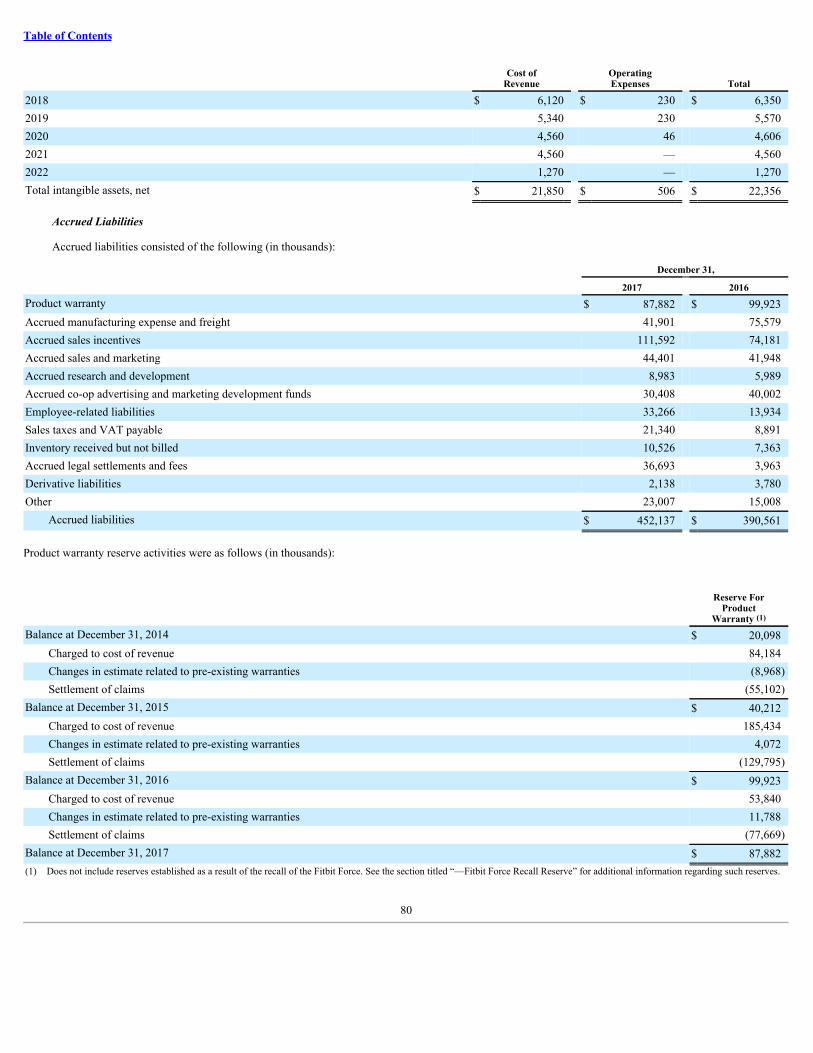
Table of Contents
Cost of
Revenue OperatingExpenses Total
2018 $ 6,120 $ 230 $ 6,3502019 5,340 230 5,5702020 4,560 46 4,6062021 4,560 — 4,5602022 1,270 — 1,270Total intangible assets, net $ 21,850 $ 506 $ 22,356
Accrued Liabilities
Accrued liabilities consisted of the following (in thousands):
December 31,
2017 2016Product warranty $ 87,882 $ 99,923Accrued manufacturing expense and freight 41,901 75,579Accrued sales incentives 111,592 74,181Accrued sales and marketing 44,401 41,948Accrued research and development 8,983 5,989Accrued co-op advertising and marketing development funds 30,408 40,002Employee-related liabilities 33,266 13,934Sales taxes and VAT payable 21,340 8,891Inventory received but not billed 10,526 7,363Accrued legal settlements and fees 36,693 3,963Derivative liabilities 2,138 3,780Other 23,007 15,008
Accrued liabilities $ 452,137 $ 390,561
Product warranty reserve activities were as follows (in thousands):
Reserve ForProduct
Warranty (1)
Balance at December 31, 2014 $ 20,098Charged to cost of revenue 84,184Changes in estimate related to pre-existing warranties (8,968)Settlement of claims (55,102)
Balance at December 31, 2015 $ 40,212Charged to cost of revenue 185,434Changes in estimate related to pre-existing warranties 4,072Settlement of claims (129,795)
Balance at December 31, 2016 $ 99,923Charged to cost of revenue 53,840Changes in estimate related to pre-existing warranties 11,788Settlement of claims (77,669)
Balance at December 31, 2017 $ 87,882(1) Does not include reserves established as a result of the recall of the Fitbit Force. See the section titled “—Fitbit Force Recall Reserve” for additional information regarding such reserves.
80
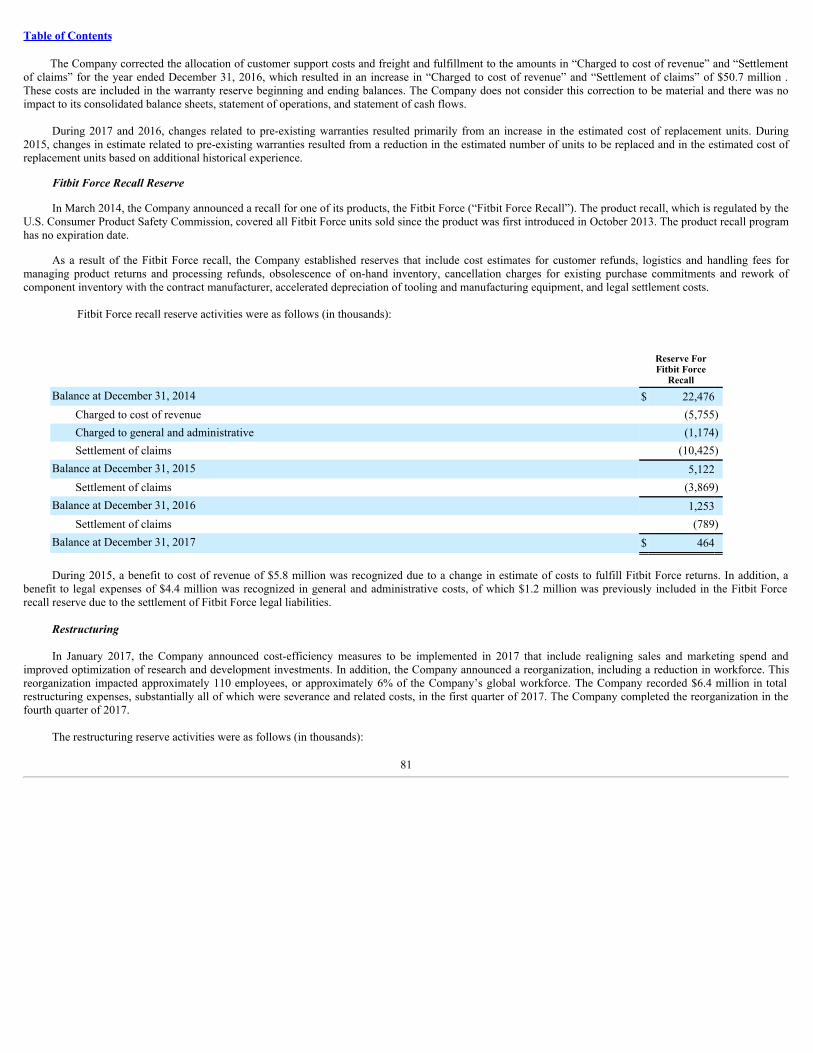
Table of Contents
The Company corrected the allocation of customer support costs and freight and fulfillment to the amounts in “Charged to cost of revenue” and “Settlementof claims” for the year ended December 31, 2016, which resulted in an increase in “Charged to cost of revenue” and “Settlement of claims” of $50.7 million .These costs are included in the warranty reserve beginning and ending balances. The Company does not consider this correction to be material and there was noimpact to its consolidated balance sheets, statement of operations, and statement of cash flows.
During 2017 and 2016, changes related to pre-existing warranties resulted primarily from an increase in the estimated cost of replacement units. During2015, changes in estimate related to pre-existing warranties resulted from a reduction in the estimated number of units to be replaced and in the estimated cost ofreplacement units based on additional historical experience.
Fitbit Force Recall Reserve
In March 2014, the Company announced a recall for one of its products, the Fitbit Force (“Fitbit Force Recall”). The product recall, which is regulated by theU.S. Consumer Product Safety Commission, covered all Fitbit Force units sold since the product was first introduced in October 2013. The product recall programhas no expiration date.
As a result of the Fitbit Force recall, the Company established reserves that include cost estimates for customer refunds, logistics and handling fees formanaging product returns and processing refunds, obsolescence of on-hand inventory, cancellation charges for existing purchase commitments and rework ofcomponent inventory with the contract manufacturer, accelerated depreciation of tooling and manufacturing equipment, and legal settlement costs.
Fitbit Force recall reserve activities were as follows (in thousands):
Reserve ForFitbit Force
RecallBalance at December 31, 2014 $ 22,476
Charged to cost of revenue (5,755)Charged to general and administrative (1,174)Settlement of claims (10,425)
Balance at December 31, 2015 5,122Settlement of claims (3,869)
Balance at December 31, 2016 1,253Settlement of claims (789)
Balance at December 31, 2017 $ 464
During 2015, a benefit to cost of revenue of $5.8 million was recognized due to a change in estimate of costs to fulfill Fitbit Force returns. In addition, abenefit to legal expenses of $4.4 million was recognized in general and administrative costs, of which $1.2 million was previously included in the Fitbit Forcerecall reserve due to the settlement of Fitbit Force legal liabilities.
Restructuring
In January 2017, the Company announced cost-efficiency measures to be implemented in 2017 that include realigning sales and marketing spend andimproved optimization of research and development investments. In addition, the Company announced a reorganization, including a reduction in workforce. Thisreorganization impacted approximately 110 employees, or approximately 6% of the Company’s global workforce. The Company recorded $6.4 million in totalrestructuring expenses, substantially all of which were severance and related costs, in the first quarter of 2017. The Company completed the reorganization in thefourth quarter of 2017.
The restructuring reserve activities were as follows (in thousands):
81
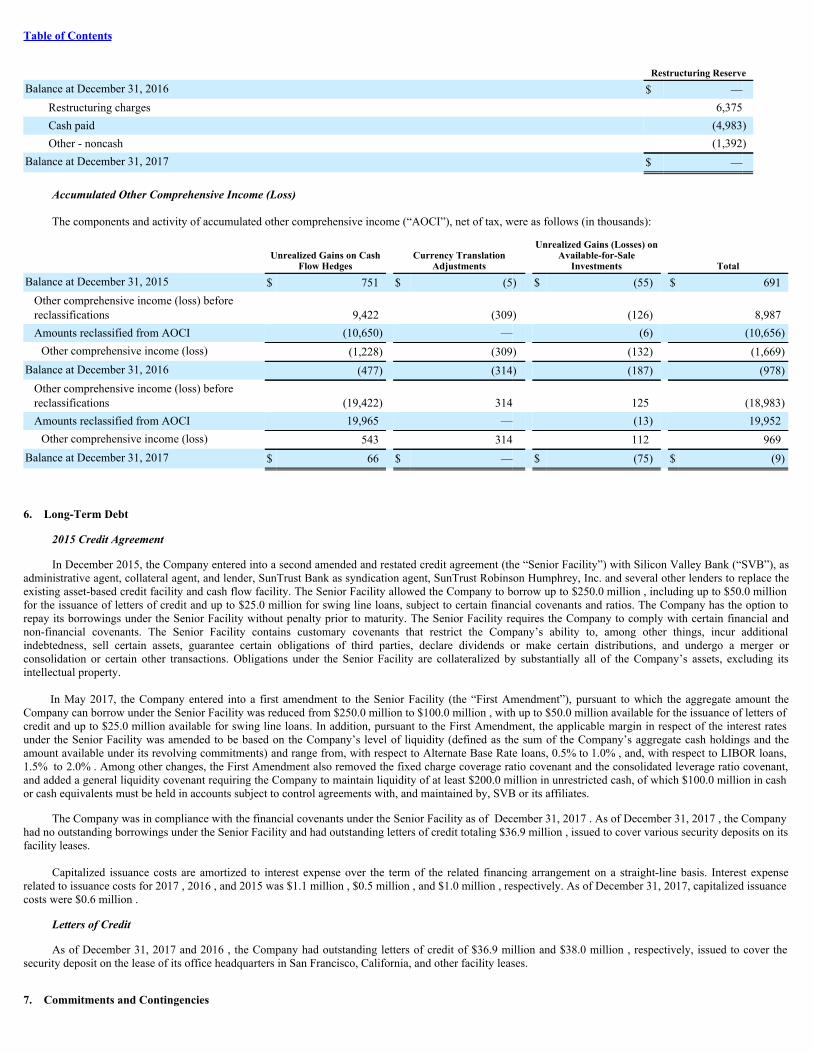
Table of Contents
Restructuring ReserveBalance at December 31, 2016 $ —
Restructuring charges 6,375Cash paid (4,983)Other - noncash (1,392)
Balance at December 31, 2017 $ —
Accumulated Other Comprehensive Income (Loss)
The components and activity of accumulated other comprehensive income (“AOCI”), net of tax, were as follows (in thousands):
Unrealized Gains on Cash
Flow Hedges Currency Translation
Adjustments
Unrealized Gains (Losses) onAvailable-for-Sale
Investments TotalBalance at December 31, 2015 $ 751 $ (5) $ (55) $ 691
Other comprehensive income (loss) beforereclassifications 9,422 (309) (126) 8,987Amounts reclassified from AOCI (10,650) — (6) (10,656)
Other comprehensive income (loss) (1,228) (309) (132) (1,669)Balance at December 31, 2016 (477) (314) (187) (978)
Other comprehensive income (loss) beforereclassifications (19,422) 314 125 (18,983)Amounts reclassified from AOCI 19,965 — (13) 19,952
Other comprehensive income (loss) 543 314 112 969Balance at December 31, 2017 $ 66 $ — $ (75) $ (9)
6. Long-Term Debt
2015 Credit Agreement
In December 2015, the Company entered into a second amended and restated credit agreement (the “Senior Facility”) with Silicon Valley Bank (“SVB”), asadministrative agent, collateral agent, and lender, SunTrust Bank as syndication agent, SunTrust Robinson Humphrey, Inc. and several other lenders to replace theexisting asset-based credit facility and cash flow facility. The Senior Facility allowed the Company to borrow up to $250.0 million , including up to $50.0 millionfor the issuance of letters of credit and up to $25.0 million for swing line loans, subject to certain financial covenants and ratios. The Company has the option torepay its borrowings under the Senior Facility without penalty prior to maturity. The Senior Facility requires the Company to comply with certain financial andnon-financial covenants. The Senior Facility contains customary covenants that restrict the Company’s ability to, among other things, incur additionalindebtedness, sell certain assets, guarantee certain obligations of third parties, declare dividends or make certain distributions, and undergo a merger orconsolidation or certain other transactions. Obligations under the Senior Facility are collateralized by substantially all of the Company’s assets, excluding itsintellectual property.
In May 2017, the Company entered into a first amendment to the Senior Facility (the “First Amendment”), pursuant to which the aggregate amount theCompany can borrow under the Senior Facility was reduced from $250.0 million to $100.0 million , with up to $50.0 million available for the issuance of letters ofcredit and up to $25.0 million available for swing line loans. In addition, pursuant to the First Amendment, the applicable margin in respect of the interest ratesunder the Senior Facility was amended to be based on the Company’s level of liquidity (defined as the sum of the Company’s aggregate cash holdings and theamount available under its revolving commitments) and range from, with respect to Alternate Base Rate loans, 0.5% to 1.0% , and, with respect to LIBOR loans,1.5% to 2.0% . Among other changes, the First Amendment also removed the fixed charge coverage ratio covenant and the consolidated leverage ratio covenant,and added a general liquidity covenant requiring the Company to maintain liquidity of at least $200.0 million in unrestricted cash, of which $100.0 million in cashor cash equivalents must be held in accounts subject to control agreements with, and maintained by, SVB or its affiliates.
The Company was in compliance with the financial covenants under the Senior Facility as of December 31, 2017 . As of December 31, 2017 , the Companyhad no outstanding borrowings under the Senior Facility and had outstanding letters of credit totaling $36.9 million , issued to cover various security deposits on itsfacility leases.
Capitalized issuance costs are amortized to interest expense over the term of the related financing arrangement on a straight-line basis. Interest expenserelated to issuance costs for 2017 , 2016 , and 2015 was $1.1 million , $0.5 million , and $1.0 million , respectively. As of December 31, 2017, capitalized issuancecosts were $0.6 million .
Letters of Credit
As of December 31, 2017 and 2016 , the Company had outstanding letters of credit of $36.9 million and $38.0 million , respectively, issued to cover thesecurity deposit on the lease of its office headquarters in San Francisco, California, and other facility leases.
7. Commitments and Contingencies
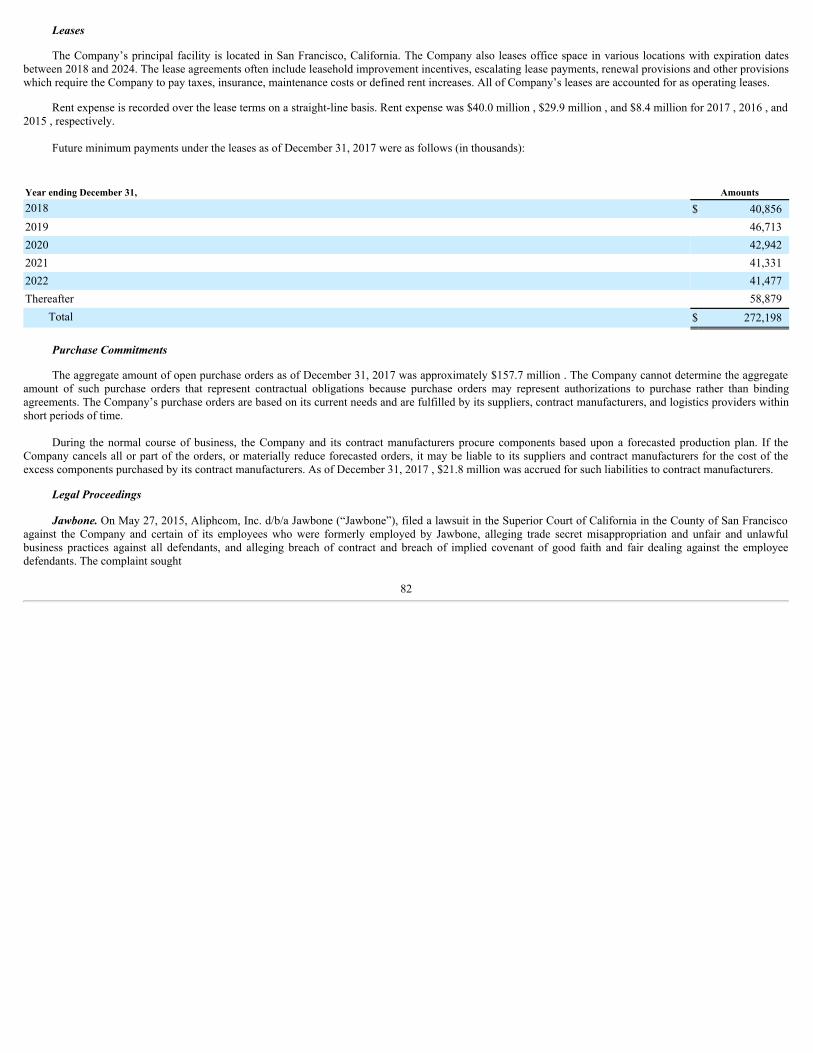
Leases
The Company’s principal facility is located in San Francisco, California. The Company also leases office space in various locations with expiration datesbetween 2018 and 2024. The lease agreements often include leasehold improvement incentives, escalating lease payments, renewal provisions and other provisionswhich require the Company to pay taxes, insurance, maintenance costs or defined rent increases. All of Company’s leases are accounted for as operating leases.
Rent expense is recorded over the lease terms on a straight-line basis. Rent expense was $40.0 million , $29.9 million , and $8.4 million for 2017 , 2016 , and2015 , respectively.
Future minimum payments under the leases as of December 31, 2017 were as follows (in thousands):
Year ending December 31, Amounts2018 $ 40,8562019 46,7132020 42,9422021 41,3312022 41,477Thereafter 58,879
Total $ 272,198
Purchase Commitments
The aggregate amount of open purchase orders as of December 31, 2017 was approximately $157.7 million . The Company cannot determine the aggregateamount of such purchase orders that represent contractual obligations because purchase orders may represent authorizations to purchase rather than bindingagreements. The Company’s purchase orders are based on its current needs and are fulfilled by its suppliers, contract manufacturers, and logistics providers withinshort periods of time.
During the normal course of business, the Company and its contract manufacturers procure components based upon a forecasted production plan. If theCompany cancels all or part of the orders, or materially reduce forecasted orders, it may be liable to its suppliers and contract manufacturers for the cost of theexcess components purchased by its contract manufacturers. As of December 31, 2017 , $21.8 million was accrued for such liabilities to contract manufacturers.
Legal Proceedings
Jawbone. On May 27, 2015, Aliphcom, Inc. d/b/a Jawbone (“Jawbone”), filed a lawsuit in the Superior Court of California in the County of San Franciscoagainst the Company and certain of its employees who were formerly employed by Jawbone, alleging trade secret misappropriation and unfair and unlawfulbusiness practices against all defendants, and alleging breach of contract and breach of implied covenant of good faith and fair dealing against the employeedefendants. The complaint sought
82
Table of Contents
unspecified damages, including punitive damages and injunctive relief. On June 23, 2016, Jawbone filed a Second Amended Complaint, adding an additionalemployee defendant and related allegations. The trial was currently scheduled for April 30, 2018.
On June 10, 2015, Jawbone and BodyMedia, Inc., a wholly-owned subsidiary of Jawbone (“BodyMedia”), filed a lawsuit against the Company in the U.S.District Court for the Northern District of California alleging that the Company infringes certain U.S. patents. The complaint sought unspecified compensatorydamages and attorneys’ fees from the Company and to permanently enjoin the Company from making, manufacturing, using, selling, importing, or offering theCompany’s products for sale. The lawsuit was stayed pending resolution the investigation in the U.S. International Trade Commission (the “ITC”).
On July 7, 2015, Jawbone and BodyMedia filed a complaint with the ITC requesting an investigation into purported violations of the Tariff Act of 1930 bythe Company and Flextronics International Ltd. and Flextronics Sales and Marketing (A-P) Ltd. The complaint makes the same patent infringement and tradesecret misappropriation claims as the two earlier cases. The complaint seeks a limited exclusion order and a cease and desist order halting the importation and saleof the infringing products. The ITC instituted the investigation on August 17, 2015. As a result of motions, all of the patent infringement claims were dismissedfrom the case. A trial on the trade secrets allegations took place from May 9 to 17, 2016. On August 23, 2016, the administrative law judge concluded that theCompany did not misappropriate any Jawbone trade secrets. On October 20, 2016, the ITC terminated the investigation in the ITC. Jawbone appealed the dismissalof the patent infringement claims to the Federal Circuit. Oral argument was scheduled for November 9, 2017.
On September 3, 2015, the Company filed a complaint for patent infringement against Jawbone in the U.S. District Court for the District of Delaware,asserting that Jawbone’s activity trackers infringe certain U.S. patents. This case was transferred to the U.S. District Court for the Northern District of California.The trial was scheduled for July 13, 2020. On September 8, 2015, the Company filed a complaint for patent infringement against Jawbone in the U.S. DistrictCourt for the Northern District of California, asserting that Jawbone’s activity trackers infringe certain U.S. patents. No trial date was set. On October 29, 2015, theCompany filed a complaint for patent infringement against Jawbone in the U.S. District Court for the District of Delaware, asserting that Jawbone’s activitytrackers infringe certain U.S. patents. That case was also transferred to the U.S. District Court for the Northern District of California. No trial date was set.
On November 2, 2015, the Company filed a complaint with the ITC requesting an investigation into violations of the Tariff Act of 1930 by Jawbone andBody Media. The complaint asserted that Jawbone’s products infringe certain U.S. patents. The complaint sought a limited exclusion order and a cease and desistorder halting the importation and sale of infringing products. The ITC instituted the investigation on December 1, 2015. On December 23, 2016, the Company fileda motion to terminate the investigation, and the ITC terminated the investigation on February 1, 2017.
On December 8, 2017, the parties announced the global settlement of all of the outstanding civil litigation on confidential terms. Each of the pending caseshas been dismissed with prejudice.
On August 12, 2016, the Company was notified by Jawbone that Jawbone had received a confidential subpoena from the U.S. Attorney’s Office for theNorthern District of California requesting certain of the Company’s confidential business information that appeared to be related to Jawbone’s allegations of tradesecret misappropriation. On February 17, 2017, the Company received a subpoena for documents from the same office. On February 1, 2018, the Companyreceived a second subpoena for documents. The Company is cooperating with the U.S. Attorney’s Office.
Sleep Tracking. On May 8, 2015, a purported class action lawsuit was filed against the Company in the U.S. District Court for the Northern District ofCalifornia, alleging that the sleep tracking function available in certain trackers does not perform as advertised. Plaintiffs seek class certification, restitution, anaward of unspecified compensatory and punitive damages, an award of reasonable costs and expenses, including attorneys’ fees, and other further relief as theCourt may deem just and proper. On January 31, 2017, plaintiffs filed a motion for class certification. Plaintiffs’ motion for class certification was granted onNovember 20, 2017. On April 20, 2017, the Company filed a motion for summary judgment. The Company’s motion for summary judgment was denied onDecember 8, 2017. Trial has been scheduled for April 30, 2018.
The Company believes that the plaintiffs’ allegations are without merit, and intends to vigorously defend against the claims. Because the Company is in theearly stages of this litigation matter, the Company is unable to estimate a reasonably possible loss or range of loss, if any, that may result from this matter.
Heart Rate Tracking . On January 6, 2016 and February 16, 2016, two purported class action lawsuits were filed against the Company in the U.S. DistrictCourt for the Northern District of California, alleging that the PurePulse® heart rate tracking technology does not consistently and accurately record users’ heartrates. Plaintiffs allege common law claims as well as violations of various states’ false advertising and unfair competition statutes, and seek class certification,injunctive and declaratory relief,
83
Table of Contents
restitution, an award of unspecified compensatory damages, exemplary damages, punitive damages, and statutory penalties and damages, an award of reasonablecosts and expenses, including attorneys’ fees, and other further relief as the Court may deem just and proper. On April 15, 2016, the plaintiffs filed a ConsolidatedMaster Class Action Complaint and, on May 19, 2016, filed an Amended Consolidated Master Class Action Complaint. On January 9, 2017, the Company filed amotion to compel arbitration. On October 11, 2017, the Court granted the motion to compel arbitration. Plaintiffs filed a motion for reconsideration, and thatmotion was denied on January 24, 2018.
The Company believes that the plaintiffs’ allegations are without merit, and intends to vigorously defend against the claims. Because the Company is in theearly stages of this litigation matter, the Company is unable to estimate a reasonably possible loss or range of loss, if any, that may result from this matter.
Securities Litigation. On January 11, 2016, a putative securities class action was filed in the U.S. District Court for the Northern District of Californianaming as defendants the Company, certain of its officers and directors, and the underwriters of the Company’s IPO. On May 10, 2016, the Court appointed theFitbit Investor Group (consisting of five individual investors) as lead plaintiff, and an Amended Complaint was filed on July 1, 2016. Plaintiffs allege violations ofthe Securities Act of 1933, as amended (the “Securities Act”), and the Securities Exchange Act of 1934, as amended, based on alleged materially false andmisleading statements about the Company’s products between October 27, 2014 and November 23, 2015. Plaintiffs seek to represent a class of persons whopurchased or otherwise acquired the Company’s securities (i) on the open market between June 18, 2015 and May 19, 2016; and/or (ii) pursuant to or traceable tothe IPO. Plaintiffs seek class certification, an award of unspecified compensatory damages, an award of reasonable costs and expenses, including attorneys’ fees,and other further relief as the Court may deem just and proper. On July 29, 2016, the Company filed a motion to dismiss. The court denied the motion on October26, 2016. On April 26, 2017, the Company filed a motion for summary judgment, which is still pending.
On April 28, 2016, a putative class action lawsuit alleging violations of the Securities Act was filed in the Superior Court of California, County of SanMateo, naming as defendants the Company, certain of its officers and directors, the underwriters of the IPO, and a number of its investors. Plaintiffs allege that theIPO registration statement contained material misstatements about the Company’s products. Plaintiffs seek to represent a class of persons who purchased theCompany’s common stock in and/or traceable to the IPO and/or the November 2015 follow-on public offering (the “Secondary Offering”). Plaintiffs seek classcertification, an award of unspecified compensatory damages, an award of reasonable costs and expenses, including attorneys’ fees, and other further relief as theCourt may deem just and proper. On May 17, 2016, a similar class action lawsuit was filed in the Superior Court of California, County of San Francisco. The caseshave now been consolidated in the County of San Francisco. On April 7, 2017, the Court granted a motion to dismiss the Section 11 claim based on the SecondaryOffering and stayed the cases.
On January 8, 2018, the plaintiffs in the federal and class action cases filed their motion for preliminary approval of settlement of the putative federal andstate class actions for $33.3 million . The settlement remains subject to further court approval. On January 19, 2018, the court entered an order preliminarilyapproving the proposed settlement. A hearing is currently scheduled for April 20, 2018 to determine whether the settlement is fair, reasonable, and accurate. Referto Note 14. Subsequent Events for more information.
On November 11, 2016, a derivative lawsuit was filed in the U.S. District Court for the Northern District of California derivatively on behalf of the Companynaming as defendants certain of its officers and directors and as a nominal plaintiff the Company. Plaintiffs alleges breach of fiduciary duty, unjust enrichment,section 14(a), and misappropriation based on the same set of alleged facts in the federal and state securities class action litigation. On February 2, 2017, a secondderivative lawsuit was filed in the U.S. District Court for the District of Delaware on the same allegations and also including claims for abuse of control, grossmismanagement, and waste. On June 27, 2017, another derivative law suit was filed in the U.S. District Court for the Northern District of California on the sameallegations. The Courts have ordered a stay in all three cases.
On June 1, 2017 and June 9, 2017, two additional derivative lawsuits were filed in the Delaware Court of Chancery. Plaintiffs allege breach of fiduciary dutyand insider trading against certain defendants who sold shares in the IPO and/or the Secondary Offering. On August 3, 2017, another derivative lawsuit was filed inthe Delaware Court of Chancery on the same allegations. There is temporary stay in all three cases.
On October 31, 2017, a seventh derivative lawsuit was filed in the Superior Court of California, Country of San Francisco, on the same allegations. We havenot yet been served in that case.
On June 27, 2017, an individual investor lawsuit alleging violations of the Securities Act and state law claims for statutory fraud and unfair business practicewas filed in the Superior Court of California, County of Alameda, naming as defendants the
84
Table of Contents
Company and certain of its officers. The allegations are based on the same set of alleged facts in the federal and state securities class action litigation.
The Company believes that the plaintiffs’ allegations in the derivative actions and individual action are without merit, and intends to vigorously defendagainst the claims. Because the Company is in the early stages of these litigation matters, the Company is unable to estimate a reasonably possible loss or range ofloss, if any, that may result from these matters.
Other. The Company is and, from time to time, may in the future become, involved in other legal proceedings in the ordinary course of business. TheCompany currently believes that the outcome of any of these existing legal proceedings, including the aforementioned cases, either individually or in the aggregate,will not have a material impact on the operating results, financial condition or cash flows of the Company. With respect to existing legal proceedings, the Companyhas either determined that the existence of a material loss is not reasonably possible or that it is unable to estimate a reasonably possible loss or range of loss. TheCompany may incur substantial legal fees, which are expensed as incurred, in defending against these legal proceedings.
Indemnifications
In the ordinary course of business, the Company enters into agreements that may include indemnification provisions. Pursuant to such agreements, theCompany may indemnify, hold harmless and defend an indemnified party for losses suffered or incurred by the indemnified party. Some of the provisions willlimit losses to those arising from third-party actions. In some cases, the indemnification will continue after the termination of the agreement. The maximumpotential amount of future payments the Company could be required to make under these provisions is not determinable. To date, the Company has not incurredmaterial costs to defend lawsuits or settle claims related to these indemnification provisions. The Company has also entered into indemnification agreements withits directors and officers that may require the Company to indemnify its directors and officers against liabilities that may arise by reason of their status or service asdirectors or officers to the fullest extent permitted by Delaware corporate law. The Company also currently has directors’ and officers’ insurance.
8. Stockholders’ Equity
Initial public offering and follow-on offering
In June 2015, the Company completed its IPO of Class A common stock, in which the Company issued and sold 22.4 million shares and certain of itsstockholders sold 19.7 million shares, for which the Company did not receive any proceeds, including 5.5 million shares pursuant to the underwriters’ option topurchase additional shares. The shares were sold at an initial public offering price of $20.00 per share for net proceeds of $420.9 million to the Company, afterdeducting underwriting discounts and commissions of $26.9 million . Offering costs incurred by the Company were approximately $5.0 million .
In November 2015, the Company completed a follow-on offering of Class A common stock, in which the Company sold 3.0 million shares and certain of itsstockholders sold 16.6 million shares, for which the Company did not receive any proceeds, including 2.6 million shares pursuant to the underwriters’ option topurchase additional shares. The shares were sold at a public offering price of $29.00 per share for net proceeds of $84.4 million to the Company, after deductingunderwriting discounts and commissions of $2.6 million . Offering costs incurred by the Company were approximately $1.2 million .
Redeemable convertible preferred stock and redeemable convertible preferred stock warrants
In connection with the Company’s IPO, the then-outstanding 141.3 million shares of redeemable convertible preferred stock were converted into Class Bcommon stock upon the closing of the IPO. In addition, the then-outstanding 0.4 million redeemable convertible preferred stock warrants automatically convertedto Class B common stock warrants upon the closing of the IPO. These remaining outstanding Class B common stock warrants were exercised subsequent to theIPO during 2015.
Preferred Stock
Upon completion of its IPO on June 22, 2015, the Company filed a Restated Certificate of Incorporation, which authorized the issuance of preferred stockwith rights and preferences, including voting rights, designated from time to time by the board of directors. As of December 31, 2017 , there were 10 millionshares of preferred stock authorized with a par value of $0.0001 per share, and no shares of preferred stock issued or outstanding.
85
Table of Contents
Common Stock
In connection with the IPO in 2015, the Company established two classes of authorized common stock, Class A common stock and Class B common stock.All shares of common stock outstanding immediately prior to the IPO were converted into an equivalent amount of shares of Class B common stock. As of December 31, 2017 , the Company had 600 million shares of Class A common stock authorized with a par value of $0.0001 per share and 350 million shares ofClass B common stock authorized with a par value of $0.0001 per share. As of December 31, 2017 , the Company 207.5 million shares of Class A common stockwere issued and outstanding and 31.3 million shares of Class B common stock were issued and outstanding. As of December 31, 2016 , 177.2 million shares ofClass A common stock were issued and outstanding and 48.5 million shares of Class B common stock were issued and outstanding.
Holders of Class A common stock are entitled to one vote for each share of Class A common stock held on all matters submitted to a vote of stockholdersand holders of Class B common stock are entitled to ten votes for each share of Class B common stock held on all matters submitted to a vote of stockholders.Except with respect to voting, the rights of the holders of Class A and Class B common stock are identical. Shares of Class B common stock are voluntarilyconvertible into shares of Class A common stock at the option of the holder and generally automatically convert into shares of our Class A common stock upon atransfer.
Stock Option Exchange
On April 13, 2017, the Company filed its definitive proxy statement, submitting to stockholders a proposal for a stock option exchange program (the“Program”). The Program would allow the Company employees, including its executive officers other than its President, Chief Executive Officer, and Chairman,Chief Technology Officer, and Chief Financial Officer (“Eligible Employees”), to exchange out-of-the-money or “underwater” options to purchase shares of theCompany’s Class A common stock or Class B common stock currently held by such Eligible Employees for a lesser number of restricted stock units (“RSUs”) thatmay be settled for shares of its Class A common stock, (“New RSUs”), under the Company’s 2015 Equity Incentive Plan (the “2015 Plan”). Each New RSUrepresents an unfunded right to receive one share of the Company’s Class A common stock on a date in the future, which generally is the date on which the NewRSU will vest. Eligible Employees participating in the Program would receive one New RSU for every two “out-of-the-money” options that they exchange. TheNew RSUs would generally vest over the remaining vesting period of the exchanged option (subject to a one-year minimum vesting period). None of the membersof the Company’s board of directors were eligible to participate in the Program. On May 25, 2017, the Company’s stockholders approved the Program at the 2017annual meeting of stockholders. The Company subsequently commenced the Program by filing a tender offer statement on Schedule TO with the Securities andExchange Commission on June 21, 2017. The Program expired on July 19, 2017. A total of 3.7 million “underwater” stock options were tendered by the EligibleEmployees, representing approximately 85% of the stock options eligible for exchange. On July 20, 2017, the Company granted an aggregate of 1.8 million NewRSUs under the 2015 Equity Incentive Plan (the “2015 Plan”) in exchange for the “underwater” stock options tendered. The completion of the Program resulted intotal incremental unrecognized stock-based compensation expense of $8.5 million , to be recognized over the greater of one year or the remaining vesting serviceperiod of the tendered stock options.
2007 Equity Incentive Plan
The Amended and Restated 2007 Stock Plan (the “2007 Plan”) provided for the grant of incentive and non-statutory stock options and RSUs to employees,directors, and consultants under terms and provisions established by the board of directors. Stock options granted under the 2007 Plan are generally subject to afour -year vesting period, with 25% vesting after a one -year period and monthly vesting thereafter. Stock options expire after ten years. RSUs granted under the2007 Plan are generally subject to a three - or four -year vesting period with annual vesting.
The 2015 Plan became effective in June 2015. As a result, the Company will not grant any additional stock options under the 2007 Plan and the 2007 Planhas been terminated. Any outstanding stock options and RSUs granted under the 2007 Plan will remain outstanding, subject to the terms of the 2007 Plan andapplicable award agreements, until such shares are issued under those awards, by exercise of stock options or settlement of RSUs, or until the awards terminate orexpire by their terms.
2015 Equity Incentive Plan
In May 2015, the Company’s board of directors and stockholders adopted and approved the 2015 Plan. The 2015 Plan became effective in June 2015 andserves as the successor to the 2007 Plan. The remaining shares available for issuance under the 2007 Plan became reserved for issuance under the 2015 Plan. Thenumber of shares reserved for issuance under the 2015 Plan will increase automatically on the first day of January of each year starting in 2016 through 2025 bythe number of shares of Class A common stock equal to 5% of the total outstanding shares of common stock as of the immediately preceding December 31. The
86
Table of Contents
share reserve may also increase to the extent that outstanding awards expire or terminate un-exercised. As of December 31, 2017 , 12.5 million shares wereavailable for grant under the 2015 Plan.
The 2015 Plan authorizes the award of stock options, restricted stock awards, stock appreciation rights, RSUs, performance awards, and stock bonuses toemployees, directors, consultants, independent contractors, and advisors. In general, stock options and RSUs will vest over a three - or four -year period, and havea maximum term of ten years. The exercise price of a stock option will be not less than 100% of the fair market value of the shares on the date of grant.
2015 Employee Stock Purchase Plan
In May 2015, the Company’s board of directors adopted the 2015 ESPP, which became effective in June 2015. The number of shares reserved for issuanceunder the 2015 Plan will increase automatically on the first day of January of each year starting in 2016 through 2025 by the number of shares of Class A commonstock equal to 1% of the total outstanding shares of common stock as of the immediately preceding December 31. The 2015 ESPP allows eligible employees topurchase shares of the Company’s Class A common stock at a discount through payroll deductions of up to 15% of eligible compensation, subject to any planlimitations. Except for the initial offering period, the 2015 ESPP provides for 6-month offering periods beginning in May and November of each year. The initialoffering period began June 17, 2015, and ended in May 2016. As of December 31, 2017 , 4.5 million shares were available for grant under the 2015 EmployeeStock Purchase Plan.
On each purchase date, eligible employees will purchase Class A common stock at a price per share equal to 85% of the lesser of the fair market value of theCompany’s Class A common stock (i) on the first trading day of the applicable offering period and (ii) the last trading day of each purchase period in the applicableoffering period.
Stock Options
Activity under the 2007 Plan and 2015 Plan is as follows (in thousands except per share amounts):
Stock Options Outstanding
Number ofShares Subject
toStock Options
Weighted–AverageExercise
Price
Weighted–Average RemainingContractual Term
(in years)
AggregateIntrinsic
ValueBalance—December 31, 2016 34,454 $ 3.85
Granted 1,150 $ 5.63 Exercised (7,164) $ 1.22 Canceled (7,054) $ 9.35
Balance—December 31, 2017 21,386 $ 3.01 5.7 $ 64,582Stock options exercisable—December 31, 2017 16,827 $ 2.52 5.3 $ 57,472Stock options vested and expected to vest—December 31, 2017 21,386 $ 3.01 5.7 $ 64,582
The aggregate intrinsic values of stock options outstanding, exercisable, vested and expected to vest were calculated as the difference between the exerciseprice of the stock options and the fair value of the Class A common stock of $5.71 as of December 31, 2017 .
87
Table of Contents
Restricted Stock Units
RSU activity under the equity incentive plans is as follows:
RSUs
Outstanding
Weighted-Average
Grant DateFair Value
(in thousands) Unvested balance—December 31, 2016 11,578 $ 16.85Granted 18,912 6.47Vested (6,191) 12.57Forfeited or canceled (5,111) 12.61Unvested balance—December 31, 2017 19,188 9.13
Warrants
On July 10, 2017, the Company issued a warrant to a third party vendor to purchase 0.5 million shares of Class A common stock. The warrant is exercisablebased on service and performance-based conditions and has an exercise price of $5.23 per share and a contractual term of ten years. As of December 31, 2017, 0.1 million shares have vested.
Stock-Based Compensation Expense
Total stock-based compensation recognized was as follows (in thousands):
Year Ended December 31,
2017 2016 2015
Cost of revenue $ 5,312 $ 4,797 $ 4,739Research and development 54,123 47,207 18,251Sales and marketing 14,959 11,575 7,419General and administrative 17,187 15,853 10,615
Total stock-based compensation expense $ 91,581 $ 79,432 $ 41,024
The weighted-average grant date fair value of stock options granted during 2017 , 2016 , and 2015 was $5.63 , $14.06 , and $10.67 per share, respectively.The total grant date fair value of stock options that vested during 2017 , 2016 , and 2015 was $20.2 million , $32.9 million , and $18.6 million , respectively. As ofDecember 31, 2017 , the total unrecognized compensation expense related to unvested stock options was $11.3 million , which the Company expects to recognizeover an estimated weighted average period of 1.4 years . As of December 31, 2017, the total unrecognized compensation expense related to unvested RSUs was$159.0 million , which the Company expects to recognize over an estimated weighted average period of 2.2 years .
Stock-based compensation is measured at the grant date based on the fair value of the award and is recognized as expense over the requisite service period,which is generally the vesting period of the respective award. The fair value of RSUs is the fair value of the Company’s Class A common stock on the grant date.In determining the fair value of the stock options, warrants and the equity awards issued under the 2015 ESPP, the Company uses the Black-Scholes option-pricingmodel and assumptions discussed below. Each of these inputs is subjective and generally requires significant judgment.
Fair Value of Common Stock —The fair value of the shares of common stock underlying stock options had historically been established by the Company’sboard of directors. Following the completion of the IPO, the Company began using the market closing price for the Company’s Class A common stock as reportedon the New York Stock Exchange.
Expected Term —The Company does not have sufficient historical exercise data to provide a reasonable basis upon which to estimate expected term due tothe limited period of time stock-based awards have been exercisable. As a result, for stock options, the Company used the simplified method to calculate theexpected term, which is equal to the average of the stock-based award’s weighted average vesting period and its contractual term. The expected term of the 2015ESPP is based on the contractual term.
88
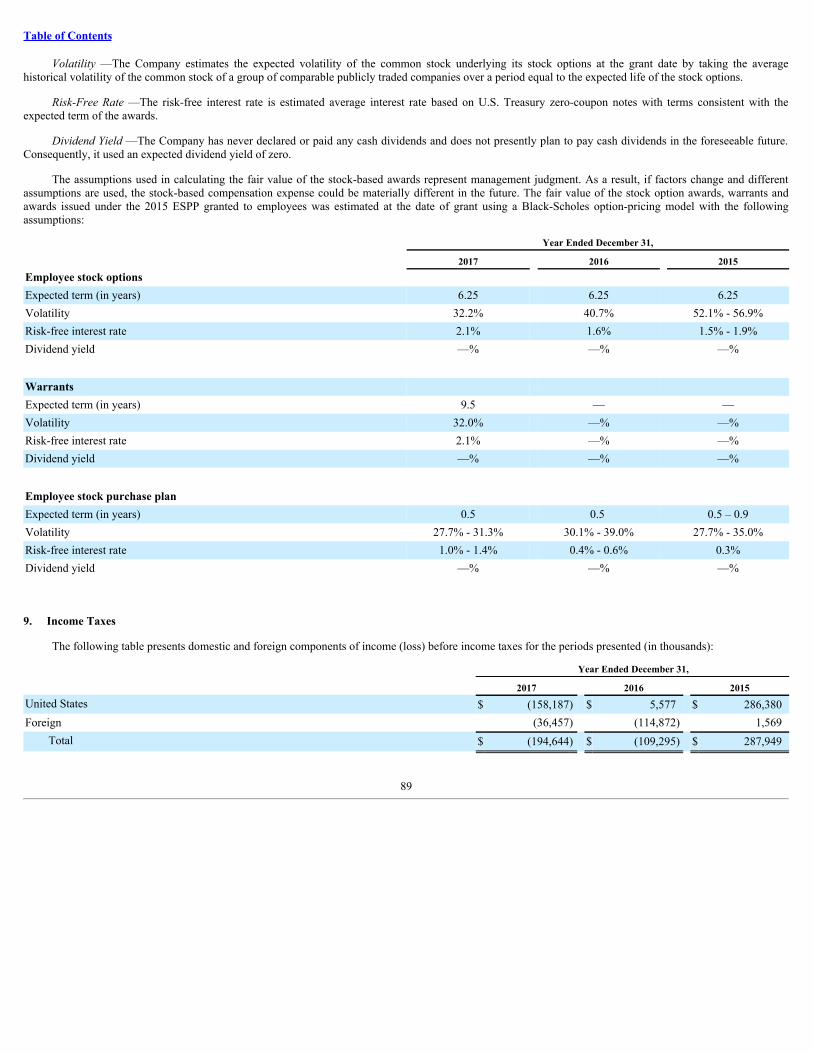
Table of Contents
Volatility —The Company estimates the expected volatility of the common stock underlying its stock options at the grant date by taking the averagehistorical volatility of the common stock of a group of comparable publicly traded companies over a period equal to the expected life of the stock options.
Risk-Free Rate —The risk-free interest rate is estimated average interest rate based on U.S. Treasury zero-coupon notes with terms consistent with theexpected term of the awards.
Dividend Yield —The Company has never declared or paid any cash dividends and does not presently plan to pay cash dividends in the foreseeable future.Consequently, it used an expected dividend yield of zero.
The assumptions used in calculating the fair value of the stock-based awards represent management judgment. As a result, if factors change and differentassumptions are used, the stock-based compensation expense could be materially different in the future. The fair value of the stock option awards, warrants andawards issued under the 2015 ESPP granted to employees was estimated at the date of grant using a Black-Scholes option-pricing model with the followingassumptions:
Year Ended December 31,
2017 2016 2015Employee stock options Expected term (in years) 6.25 6.25 6.25Volatility 32.2% 40.7% 52.1% - 56.9%Risk-free interest rate 2.1% 1.6% 1.5% - 1.9%Dividend yield —% —% —%
Warrants Expected term (in years) 9.5 — —Volatility 32.0% —% —%Risk-free interest rate 2.1% —% —%Dividend yield —% —% —%
Employee stock purchase plan Expected term (in years) 0.5 0.5 0.5 – 0.9Volatility 27.7% - 31.3% 30.1% - 39.0% 27.7% - 35.0%Risk-free interest rate 1.0% - 1.4% 0.4% - 0.6% 0.3%Dividend yield —% —% —%
9. Income Taxes
The following table presents domestic and foreign components of income (loss) before income taxes for the periods presented (in thousands):
Year Ended December 31,
2017 2016 2015United States $ (158,187) $ 5,577 $ 286,380Foreign (36,457) (114,872) 1,569
Total $ (194,644) $ (109,295) $ 287,949
89
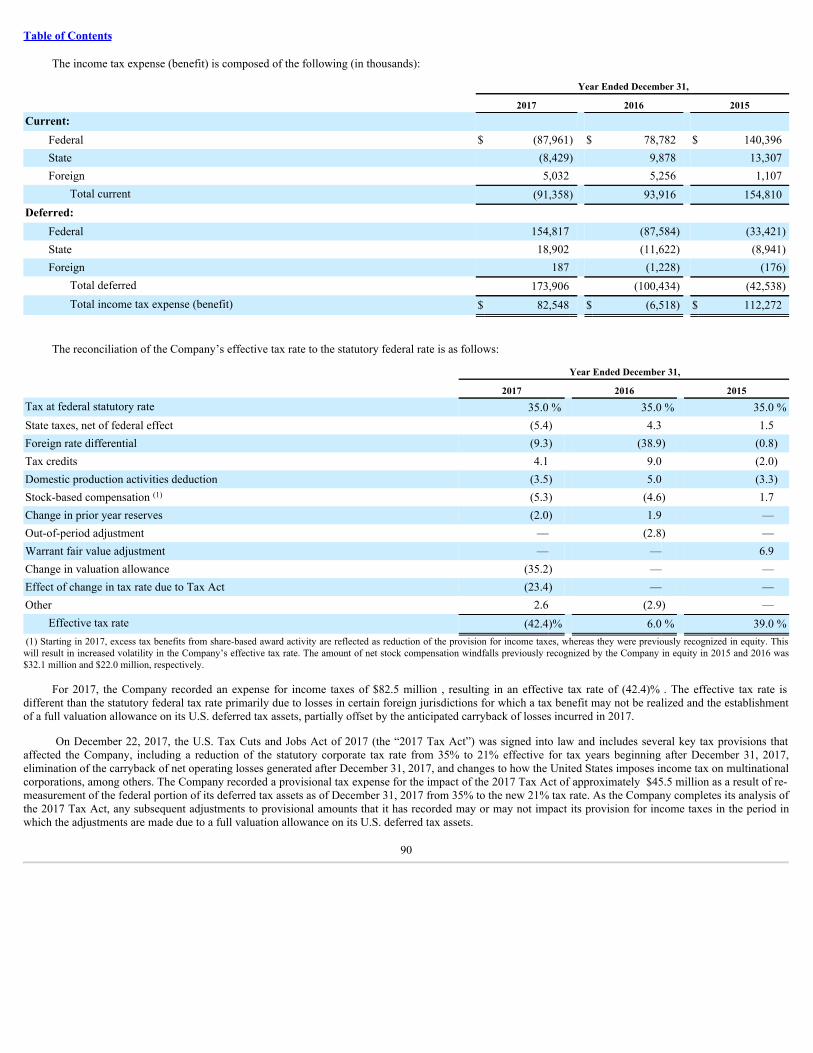
Table of Contents
The income tax expense (benefit) is composed of the following (in thousands):
Year Ended December 31,
2017 2016 2015Current:
Federal $ (87,961) $ 78,782 $ 140,396State (8,429) 9,878 13,307Foreign 5,032 5,256 1,107
Total current (91,358) 93,916 154,810Deferred:
Federal 154,817 (87,584) (33,421)State 18,902 (11,622) (8,941)Foreign 187 (1,228) (176)
Total deferred 173,906 (100,434) (42,538)Total income tax expense (benefit) $ 82,548 $ (6,518) $ 112,272
The reconciliation of the Company’s effective tax rate to the statutory federal rate is as follows:
Year Ended December 31,
2017 2016 2015Tax at federal statutory rate 35.0 % 35.0 % 35.0 %State taxes, net of federal effect (5.4) 4.3 1.5Foreign rate differential (9.3) (38.9) (0.8)Tax credits 4.1 9.0 (2.0)Domestic production activities deduction (3.5) 5.0 (3.3)Stock-based compensation (1) (5.3) (4.6) 1.7Change in prior year reserves (2.0) 1.9 —Out-of-period adjustment — (2.8) —Warrant fair value adjustment — — 6.9Change in valuation allowance (35.2) — —Effect of change in tax rate due to Tax Act (23.4) — —Other 2.6 (2.9) —
Effective tax rate (42.4)% 6.0 % 39.0 % (1) Starting in 2017, excess tax benefits from share-based award activity are reflected as reduction of the provision for income taxes, whereas they were previously recognized in equity. Thiswill result in increased volatility in the Company’s effective tax rate. The amount of net stock compensation windfalls previously recognized by the Company in equity in 2015 and 2016 was$32.1 million and $22.0 million, respectively.
For 2017, the Company recorded an expense for income taxes of $82.5 million , resulting in an effective tax rate of (42.4)% . The effective tax rate isdifferent than the statutory federal tax rate primarily due to losses in certain foreign jurisdictions for which a tax benefit may not be realized and the establishmentof a full valuation allowance on its U.S. deferred tax assets, partially offset by the anticipated carryback of losses incurred in 2017.
On December 22, 2017, the U.S. Tax Cuts and Jobs Act of 2017 (the “2017 Tax Act”) was signed into law and includes several key tax provisions thataffected the Company, including a reduction of the statutory corporate tax rate from 35% to 21% effective for tax years beginning after December 31, 2017,elimination of the carryback of net operating losses generated after December 31, 2017, and changes to how the United States imposes income tax on multinationalcorporations, among others. The Company recorded a provisional tax expense for the impact of the 2017 Tax Act of approximately $45.5 million as a result of re-measurement of the federal portion of its deferred tax assets as of December 31, 2017 from 35% to the new 21% tax rate. As the Company completes its analysis ofthe 2017 Tax Act, any subsequent adjustments to provisional amounts that it has recorded may or may not impact its provision for income taxes in the period inwhich the adjustments are made due to a full valuation allowance on its U.S. deferred tax assets.
90
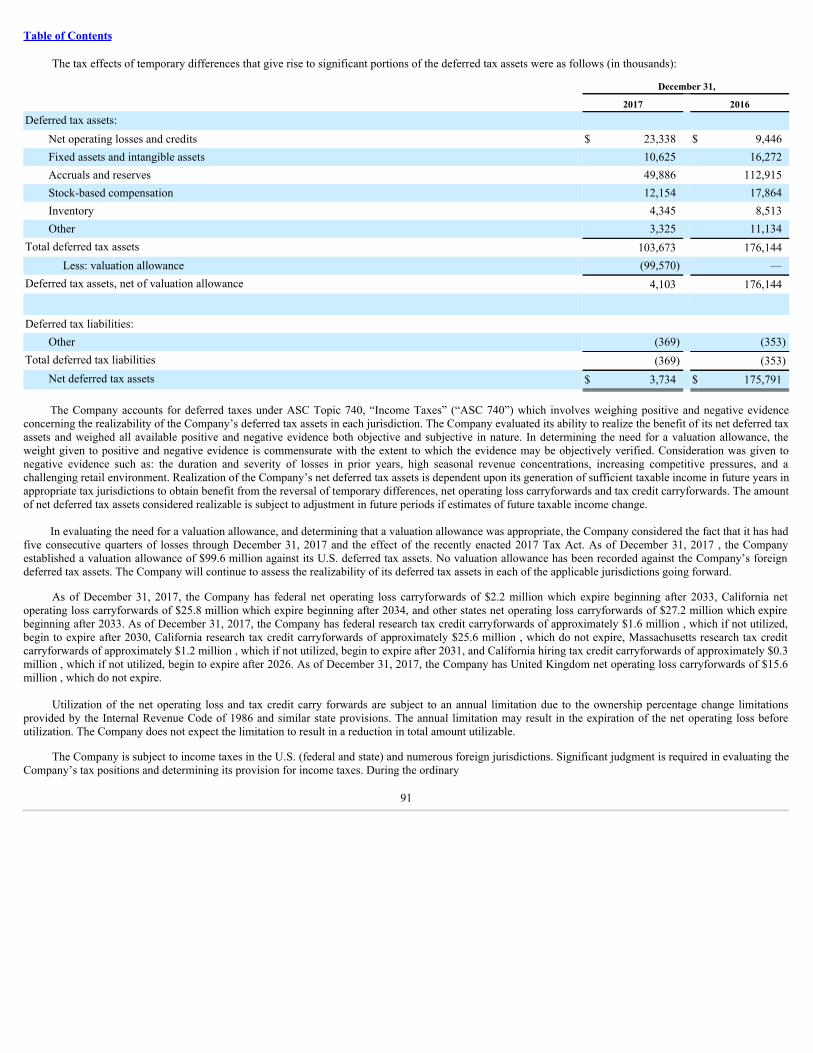
Table of Contents
The tax effects of temporary differences that give rise to significant portions of the deferred tax assets were as follows (in thousands):
December 31,
2017 2016Deferred tax assets:
Net operating losses and credits $ 23,338 $ 9,446Fixed assets and intangible assets 10,625 16,272Accruals and reserves 49,886 112,915Stock-based compensation 12,154 17,864Inventory 4,345 8,513Other 3,325 11,134
Total deferred tax assets 103,673 176,144Less: valuation allowance (99,570) —
Deferred tax assets, net of valuation allowance 4,103 176,144
Deferred tax liabilities: Other (369) (353)
Total deferred tax liabilities (369) (353)Net deferred tax assets $ 3,734 $ 175,791
The Company accounts for deferred taxes under ASC Topic 740, “Income Taxes” (“ASC 740”) which involves weighing positive and negative evidence
concerning the realizability of the Company’s deferred tax assets in each jurisdiction. The Company evaluated its ability to realize the benefit of its net deferred taxassets and weighed all available positive and negative evidence both objective and subjective in nature. In determining the need for a valuation allowance, theweight given to positive and negative evidence is commensurate with the extent to which the evidence may be objectively verified. Consideration was given tonegative evidence such as: the duration and severity of losses in prior years, high seasonal revenue concentrations, increasing competitive pressures, and achallenging retail environment. Realization of the Company’s net deferred tax assets is dependent upon its generation of sufficient taxable income in future years inappropriate tax jurisdictions to obtain benefit from the reversal of temporary differences, net operating loss carryforwards and tax credit carryforwards. The amountof net deferred tax assets considered realizable is subject to adjustment in future periods if estimates of future taxable income change.
In evaluating the need for a valuation allowance, and determining that a valuation allowance was appropriate, the Company considered the fact that it has hadfive consecutive quarters of losses through December 31, 2017 and the effect of the recently enacted 2017 Tax Act. As of December 31, 2017 , the Companyestablished a valuation allowance of $99.6 million against its U.S. deferred tax assets. No valuation allowance has been recorded against the Company’s foreigndeferred tax assets. The Company will continue to assess the realizability of its deferred tax assets in each of the applicable jurisdictions going forward.
As of December 31, 2017, the Company has federal net operating loss carryforwards of $2.2 million which expire beginning after 2033, California netoperating loss carryforwards of $25.8 million which expire beginning after 2034, and other states net operating loss carryforwards of $27.2 million which expirebeginning after 2033. As of December 31, 2017, the Company has federal research tax credit carryforwards of approximately $1.6 million , which if not utilized,begin to expire after 2030, California research tax credit carryforwards of approximately $25.6 million , which do not expire, Massachusetts research tax creditcarryforwards of approximately $1.2 million , which if not utilized, begin to expire after 2031, and California hiring tax credit carryforwards of approximately $0.3million , which if not utilized, begin to expire after 2026. As of December 31, 2017, the Company has United Kingdom net operating loss carryforwards of $15.6million , which do not expire.
Utilization of the net operating loss and tax credit carry forwards are subject to an annual limitation due to the ownership percentage change limitationsprovided by the Internal Revenue Code of 1986 and similar state provisions. The annual limitation may result in the expiration of the net operating loss beforeutilization. The Company does not expect the limitation to result in a reduction in total amount utilizable.
The Company is subject to income taxes in the U.S. (federal and state) and numerous foreign jurisdictions. Significant judgment is required in evaluating theCompany’s tax positions and determining its provision for income taxes. During the ordinary
91
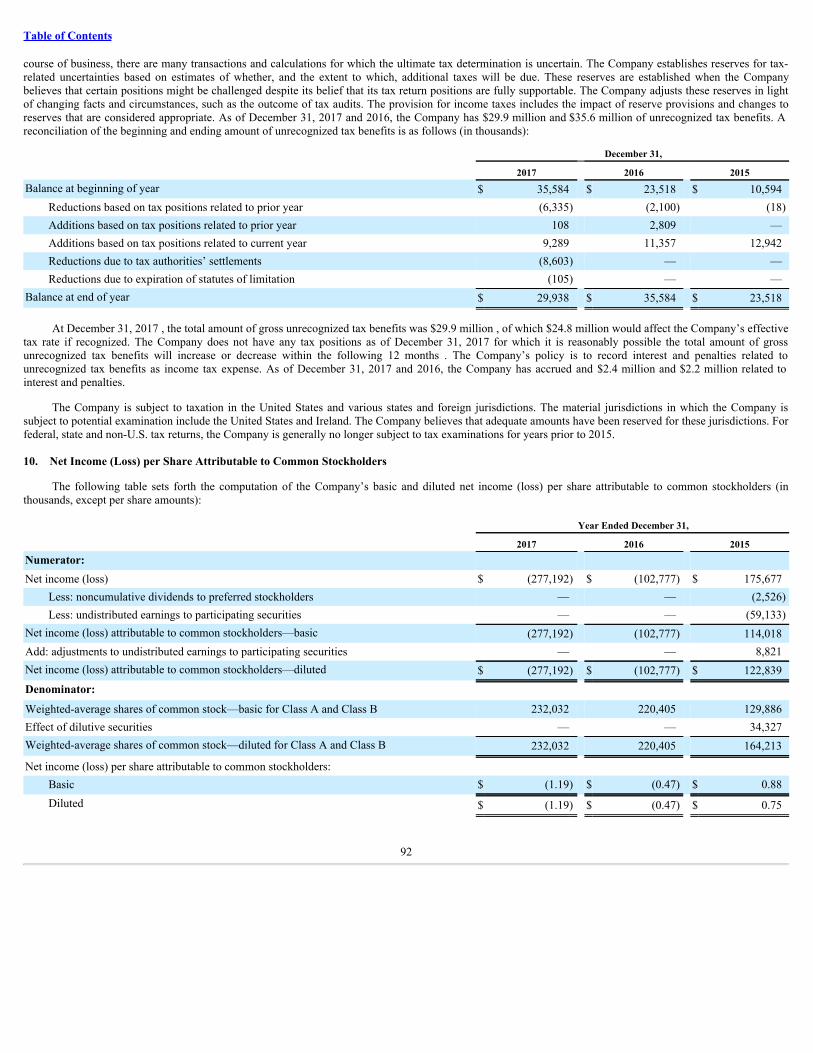
Table of Contents
course of business, there are many transactions and calculations for which the ultimate tax determination is uncertain. The Company establishes reserves for tax-related uncertainties based on estimates of whether, and the extent to which, additional taxes will be due. These reserves are established when the Companybelieves that certain positions might be challenged despite its belief that its tax return positions are fully supportable. The Company adjusts these reserves in lightof changing facts and circumstances, such as the outcome of tax audits. The provision for income taxes includes the impact of reserve provisions and changes toreserves that are considered appropriate. As of December 31, 2017 and 2016, the Company has $29.9 million and $35.6 million of unrecognized tax benefits. Areconciliation of the beginning and ending amount of unrecognized tax benefits is as follows (in thousands):
December 31,
2017 2016 2015Balance at beginning of year $ 35,584 $ 23,518 $ 10,594
Reductions based on tax positions related to prior year (6,335) (2,100) (18)Additions based on tax positions related to prior year 108 2,809 —Additions based on tax positions related to current year 9,289 11,357 12,942Reductions due to tax authorities’ settlements (8,603) — —Reductions due to expiration of statutes of limitation (105) — —
Balance at end of year $ 29,938 $ 35,584 $ 23,518
At December 31, 2017 , the total amount of gross unrecognized tax benefits was $29.9 million , of which $24.8 million would affect the Company’s effectivetax rate if recognized. The Company does not have any tax positions as of December 31, 2017 for which it is reasonably possible the total amount of grossunrecognized tax benefits will increase or decrease within the following 12 months . The Company’s policy is to record interest and penalties related tounrecognized tax benefits as income tax expense. As of December 31, 2017 and 2016, the Company has accrued and $2.4 million and $2.2 million related tointerest and penalties.
The Company is subject to taxation in the United States and various states and foreign jurisdictions. The material jurisdictions in which the Company issubject to potential examination include the United States and Ireland. The Company believes that adequate amounts have been reserved for these jurisdictions. Forfederal, state and non-U.S. tax returns, the Company is generally no longer subject to tax examinations for years prior to 2015.
10. Net Income (Loss) per Share Attributable to Common Stockholders
The following table sets forth the computation of the Company’s basic and diluted net income (loss) per share attributable to common stockholders (inthousands, except per share amounts):
Year Ended December 31,
2017 2016 2015Numerator: Net income (loss) $ (277,192) $ (102,777) $ 175,677
Less: noncumulative dividends to preferred stockholders — — (2,526)Less: undistributed earnings to participating securities — — (59,133)
Net income (loss) attributable to common stockholders—basic (277,192) (102,777) 114,018Add: adjustments to undistributed earnings to participating securities — — 8,821Net income (loss) attributable to common stockholders—diluted $ (277,192) $ (102,777) $ 122,839Denominator: Weighted-average shares of common stock—basic for Class A and Class B 232,032 220,405 129,886Effect of dilutive securities — — 34,327Weighted-average shares of common stock—diluted for Class A and Class B 232,032 220,405 164,213
Net income (loss) per share attributable to common stockholders: Basic $ (1.19) $ (0.47) $ 0.88Diluted $ (1.19) $ (0.47) $ 0.75
92
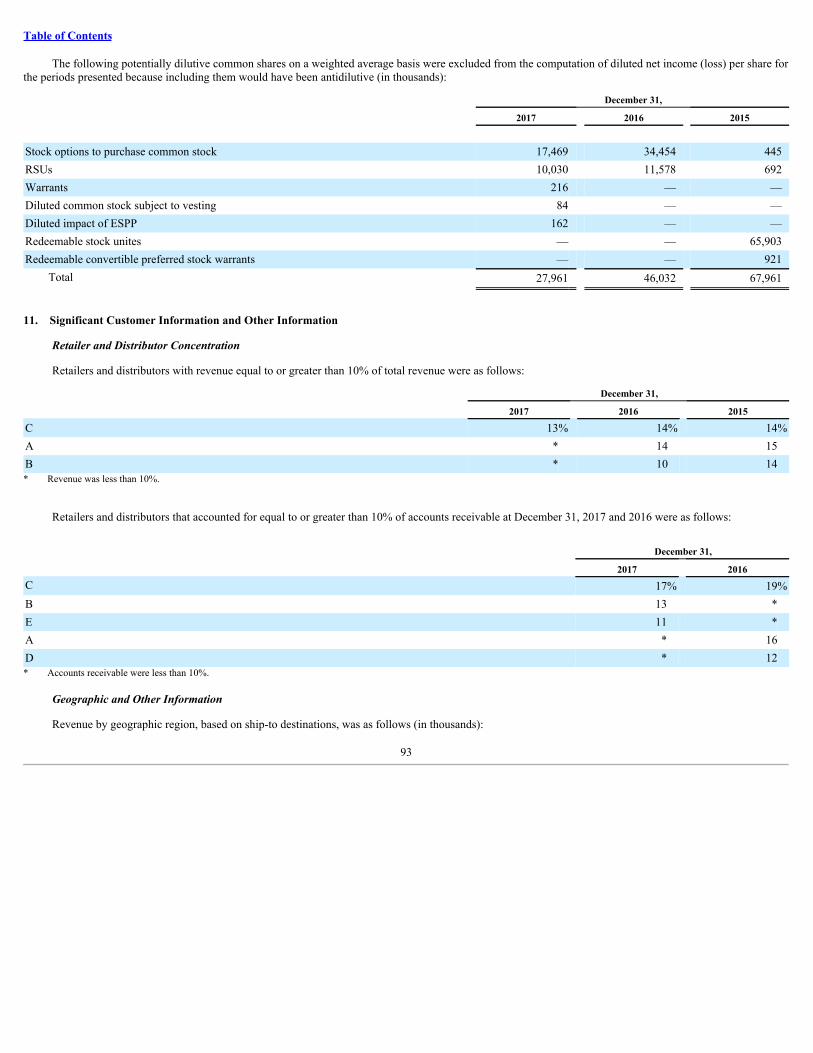
Table of Contents
The following potentially dilutive common shares on a weighted average basis were excluded from the computation of diluted net income (loss) per share forthe periods presented because including them would have been antidilutive (in thousands):
December 31,
2017 2016 2015
Stock options to purchase common stock 17,469 34,454 445RSUs 10,030 11,578 692Warrants 216 — —Diluted common stock subject to vesting 84 — —Diluted impact of ESPP 162 — —Redeemable stock unites — — 65,903Redeemable convertible preferred stock warrants — — 921
Total 27,961 46,032 67,961
11. Significant Customer Information and Other Information
Retailer and Distributor Concentration
Retailers and distributors with revenue equal to or greater than 10% of total revenue were as follows:
December 31,
2017 2016 2015
C 13% 14% 14%A * 14 15B * 10 14* Revenue was less than 10%.
Retailers and distributors that accounted for equal to or greater than 10% of accounts receivable at December 31, 2017 and 2016 were as follows:
December 31,
2017 2016C 17% 19%B 13 *E 11 *A * 16D * 12* Accounts receivable were less than 10%.
Geographic and Other Information
Revenue by geographic region, based on ship-to destinations, was as follows (in thousands):
93
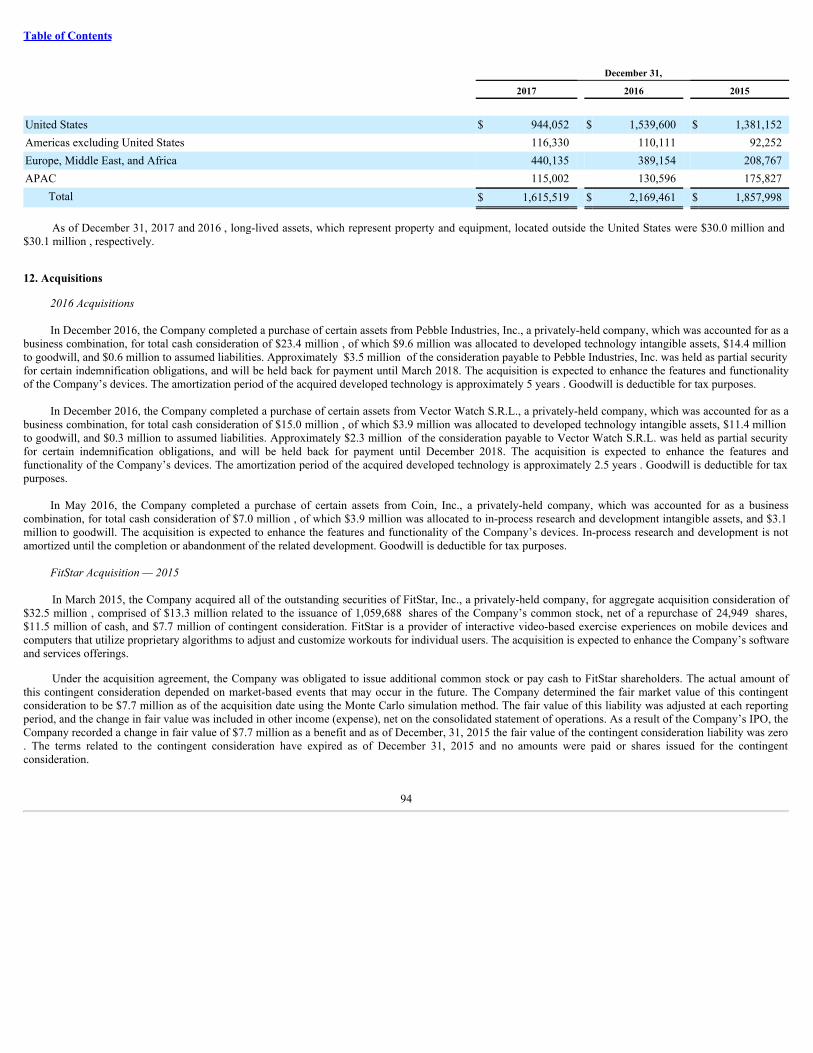
Table of Contents
December 31,
2017 2016 2015
United States $ 944,052 $ 1,539,600 $ 1,381,152Americas excluding United States 116,330 110,111 92,252Europe, Middle East, and Africa 440,135 389,154 208,767APAC 115,002 130,596 175,827
Total $ 1,615,519 $ 2,169,461 $ 1,857,998
As of December 31, 2017 and 2016 , long-lived assets, which represent property and equipment, located outside the United States were $30.0 million and$30.1 million , respectively.
12. Acquisitions
2016 Acquisitions
In December 2016, the Company completed a purchase of certain assets from Pebble Industries, Inc., a privately-held company, which was accounted for as abusiness combination, for total cash consideration of $23.4 million , of which $9.6 million was allocated to developed technology intangible assets, $14.4 millionto goodwill, and $0.6 million to assumed liabilities. Approximately $3.5 million of the consideration payable to Pebble Industries, Inc. was held as partial securityfor certain indemnification obligations, and will be held back for payment until March 2018. The acquisition is expected to enhance the features and functionalityof the Company’s devices. The amortization period of the acquired developed technology is approximately 5 years . Goodwill is deductible for tax purposes.
In December 2016, the Company completed a purchase of certain assets from Vector Watch S.R.L., a privately-held company, which was accounted for as abusiness combination, for total cash consideration of $15.0 million , of which $3.9 million was allocated to developed technology intangible assets, $11.4 millionto goodwill, and $0.3 million to assumed liabilities. Approximately $2.3 million of the consideration payable to Vector Watch S.R.L. was held as partial securityfor certain indemnification obligations, and will be held back for payment until December 2018. The acquisition is expected to enhance the features andfunctionality of the Company’s devices. The amortization period of the acquired developed technology is approximately 2.5 years . Goodwill is deductible for taxpurposes.
In May 2016, the Company completed a purchase of certain assets from Coin, Inc., a privately-held company, which was accounted for as a businesscombination, for total cash consideration of $7.0 million , of which $3.9 million was allocated to in-process research and development intangible assets, and $3.1million to goodwill. The acquisition is expected to enhance the features and functionality of the Company’s devices. In-process research and development is notamortized until the completion or abandonment of the related development. Goodwill is deductible for tax purposes.
FitStar Acquisition — 2015
In March 2015, the Company acquired all of the outstanding securities of FitStar, Inc., a privately-held company, for aggregate acquisition consideration of$32.5 million , comprised of $13.3 million related to the issuance of 1,059,688 shares of the Company’s common stock, net of a repurchase of 24,949 shares,$11.5 million of cash, and $7.7 million of contingent consideration. FitStar is a provider of interactive video-based exercise experiences on mobile devices andcomputers that utilize proprietary algorithms to adjust and customize workouts for individual users. The acquisition is expected to enhance the Company’s softwareand services offerings.
Under the acquisition agreement, the Company was obligated to issue additional common stock or pay cash to FitStar shareholders. The actual amount ofthis contingent consideration depended on market-based events that may occur in the future. The Company determined the fair market value of this contingentconsideration to be $7.7 million as of the acquisition date using the Monte Carlo simulation method. The fair value of this liability was adjusted at each reportingperiod, and the change in fair value was included in other income (expense), net on the consolidated statement of operations. As a result of the Company’s IPO, theCompany recorded a change in fair value of $7.7 million as a benefit and as of December, 31, 2015 the fair value of the contingent consideration liability was zero. The terms related to the contingent consideration have expired as of December 31, 2015 and no amounts were paid or shares issued for the contingentconsideration.
94
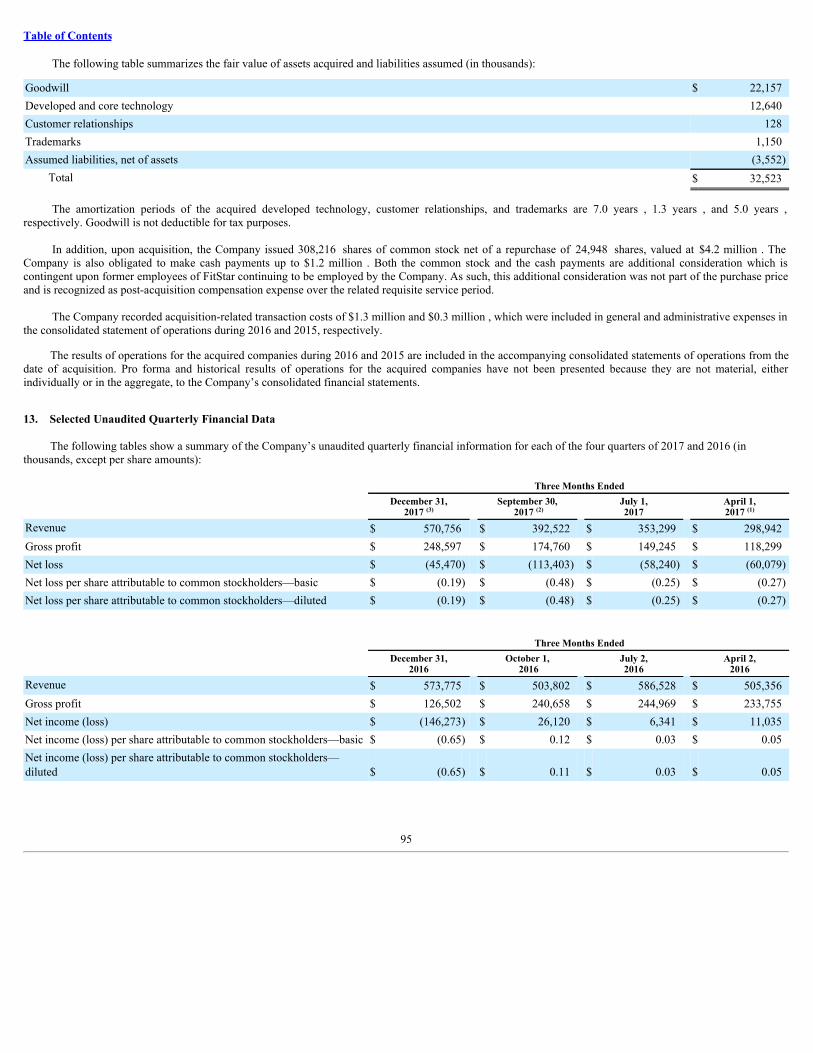
Table of Contents
The following table summarizes the fair value of assets acquired and liabilities assumed (in thousands):
Goodwill $ 22,157Developed and core technology 12,640Customer relationships 128Trademarks 1,150Assumed liabilities, net of assets (3,552)
Total $ 32,523
The amortization periods of the acquired developed technology, customer relationships, and trademarks are 7.0 years , 1.3 years , and 5.0 years ,respectively. Goodwill is not deductible for tax purposes.
In addition, upon acquisition, the Company issued 308,216 shares of common stock net of a repurchase of 24,948 shares, valued at $4.2 million . TheCompany is also obligated to make cash payments up to $1.2 million . Both the common stock and the cash payments are additional consideration which iscontingent upon former employees of FitStar continuing to be employed by the Company. As such, this additional consideration was not part of the purchase priceand is recognized as post-acquisition compensation expense over the related requisite service period.
The Company recorded acquisition-related transaction costs of $1.3 million and $0.3 million , which were included in general and administrative expenses inthe consolidated statement of operations during 2016 and 2015, respectively.
The results of operations for the acquired companies during 2016 and 2015 are included in the accompanying consolidated statements of operations from thedate of acquisition. Pro forma and historical results of operations for the acquired companies have not been presented because they are not material, eitherindividually or in the aggregate, to the Company’s consolidated financial statements.
13. Selected Unaudited Quarterly Financial Data
The following tables show a summary of the Company’s unaudited quarterly financial information for each of the four quarters of 2017 and 2016 (inthousands, except per share amounts):
Three Months Ended
December 31,
2017 (3) September 30,
2017 (2) July 1,2017
April 1,2017 (1)
Revenue $ 570,756 $ 392,522 $ 353,299 $ 298,942Gross profit $ 248,597 $ 174,760 $ 149,245 $ 118,299Net loss $ (45,470) $ (113,403) $ (58,240) $ (60,079)Net loss per share attributable to common stockholders—basic $ (0.19) $ (0.48) $ (0.25) $ (0.27)Net loss per share attributable to common stockholders—diluted $ (0.19) $ (0.48) $ (0.25) $ (0.27)
Three Months Ended
December 31,
2016 October 1,
2016 July 2,2016
April 2,2016
Revenue $ 573,775 $ 503,802 $ 586,528 $ 505,356Gross profit $ 126,502 $ 240,658 $ 244,969 $ 233,755Net income (loss) $ (146,273) $ 26,120 $ 6,341 $ 11,035Net income (loss) per share attributable to common stockholders—basic $ (0.65) $ 0.12 $ 0.03 $ 0.05Net income (loss) per share attributable to common stockholders—diluted $ (0.65) $ 0.11 $ 0.03 $ 0.05
95
Table of Contents
(1) During the first quarter of 2017, the Company recorded restructuring expenses of $6.3 million . See Note 5. Balance Sheet Components for moreinformation. In addition, the Company’s adoption of ASU 2016-09 on January 1, 2017 resulted in an increase to the provision for income taxes of $2.8million . See Note 2. Significant Accounting Policies for more information.
(2) During the third quarter of 2017, as a result of one of the Company’s customers filing for bankruptcy, the Company recorded a net charge of $9.0 millioncomprised of net bad debt expense of $7.6 million and net cost of revenue of $1.4 million . See Note 1. Customer Bankruptcy for more information. Inaddition, during the third quarter of 2017, the Company recorded a $111.4 million valuation allowance against a portion of its U.S. deferred taxes.
(3) During the fourth quarter of 2017, as a result of the Tax Act, the Company recorded a provisional tax expense for the impact of the 2017 Tax Act of $45.5million as a result of re-measurement of the federal portion of its deferred tax assets as of December 31, 2017 from 35% to the new 21% tax rate.
14. Subsequent Events
On January 8, 2018, the plaintiffs in the federal and state class action cases in the securities litigation filed a motion for preliminary approval of a globalsettlement of all of the putative federal and state class actions for $33.3 million . On January 19, 2018, the court preliminary approved the settlement. TheCompany evaluated this subsequent development concluding that it provided additional evidence about a condition that existed as of December 31, 2017. TheCompany accrued the entire amount of this liability and recorded the $33.3 million settlement expense within general and administrative expenses in 2017 since itconcluded that it was probable of payment and reasonably estimable. The Company maintains directors and officers liability insurance that covers the exposurerelated to the securities litigation. The Company recorded an insurance receivable based on an analysis of its insurance policies, including its exclusions, anassessment of the nature of the claim, and information from its insurance carriers. As of December 31, 2017, the Company has recorded an insurance receivable of $32.3 million , which is included in prepaid expenses and other current assets, associated with the amount it has concluded is probable related to the claim. The $32.3 million insurance receivable allowed the Company to recover the settlement expense, resulting in a net charge of $1.0 million in its consolidated statementof operations. The Company will continue to assess the probable amount of insurance proceeds expected to be received in future reporting periods until the finalresolution, and make adjustments, if necessary, based on additional facts as they arise.
In February 2018, the Company acquired Twine Health, Inc., a privately-held company with a health coaching platform for cash consideration of $17.5million . This acquisition is to be accounted for as a business combination. Management is currently evaluating the purchase price allocation for this transaction.
96
Table of Contents
Item 9. Changes in and Disagreements with Accountants on Accounting and Financial Disclosure
None.
Item 9A. Controls and Procedures
Evaluation of Disclosure Controls and Procedures
We maintain “disclosure controls and procedures,” as defined in Rules 13a-15(e) and 15d-15(e) under the Exchange Act, that are designed to ensure thatinformation required to be disclosed by a company in the reports that it files or submits under the Exchange Act is recorded, processed, summarized and reported,within the time periods specified in the SEC’s rules and forms. Disclosure controls and procedures include, without limitation, controls and procedures designed toensure that information required to be disclosed by a company in the reports that it files or submits under the Exchange Act is accumulated and communicated tothe company’s management, including its principal executive and principal financial officers, as appropriate to allow timely decisions regarding requireddisclosure.
Our management, with the participation of our Chief Executive Officer and our Chief Financial Officer, evaluated the effectiveness of our disclosure controls andprocedures as of December 31, 2017. Based on the evaluation of our disclosure controls and procedures as of December 31, 2017, our Chief Executive Officer andChief Financial Officer concluded that, as of such date, our disclosure controls and procedures were not effective due to the material weakness described below.
Management’s Report on Internal Control Over Financial Reporting
Our management is responsible for establishing and maintaining adequate internal control over financial reporting (as defined in Rule 13a-15(f) under theExchange Act). Our management conducted an assessment of the effectiveness of our internal control over financial reporting based on the criteria established inInternal Control - Integrated Framework (2013) issued by the Committee of Sponsoring Organizations of the Treadway Commission (COSO). A materialweakness is a deficiency, or combination of deficiencies, in internal control over financial reporting such that there is a reasonable possibility that a materialmisstatement of our annual or interim financial statements will not be prevented or detected on a timely basis.
In connection with management’s assessment of our internal control over financial reporting, management determined that we did not maintain effective controlsover the accuracy of the inputs in the sales order entry process. Specifically, we did not sufficiently execute controls over the review of data inputs in the salesorder entry process to ensure accuracy of the price, quantity, and related customer data. This control deficiency did not result in a misstatement; however, thiscontrol deficiency could result in a misstatement of revenue that would result in a material misstatement to the annual or interim consolidated financial statementsthat would not be prevented or detected . Accordingly, our management has determined that this control deficiency constitutes a material weakness.
Because of this material weakness, our management has concluded that our internal control over financial reporting was not effective as of December 31, 2017,based on the criteria in Internal Control Integrated Framework (2013) issued by the COSO.
The effectiveness of our internal control over financial reporting as of December 31, 2017 has been audited by PricewaterhouseCoopers LLP, an independentregistered public accounting firm, as stated in their report included in Part II, Item 8 of this Annual Report on Form 10-K.
Remediation Plans
We have identified and begun implementing a remediation plan to address the control deficiencies that led to the material weakness. Management’s plan toremediate this material weakness includes redesigning controls over the inputs of the sales order entry process, adding additional resources, and reassessingexisting order entry controls and procedures.
The material weakness will not be considered remediated until the applicable measures have been implemented for a sufficient period of time and management hasconcluded, through testing, that the enhanced control is operating effectively.
Changes in Internal Control over Financial Reporting
There was no change in our internal control over financial reporting identified in connection with the evaluation required by Rule 13a-15(d) and 15d-15(d) of theExchange Act that occurred during the three months ended December 31, 2017 that has materially affected, or is reasonably likely to materially affect, our internalcontrol over financial reporting.
Inherent Limitations on Effectiveness of Controls
Our management, including the CEO and CFO, recognizes that our disclosure controls or our internal control over financial reporting cannot prevent or detect allpossible instances of errors and all fraud. A control system, no matter how well designed and operated, can provide only reasonable, not absolute, assurance thatthe control system’s objectives will be met. The design of a control system must reflect the fact that there are resource constraints, and the benefits of controls mustbe considered relative to their costs.
Item 9B. Other Information
None.
Table of Contents
PART III
Item 10. Directors, Executive Officers and Corporate Governance The information required for this Item is incorporated by reference from our Proxy Statement to be filed in connection with our 2018 Annual Meeting ofStockholders within 120 days after the end of the fiscal year ended December 31, 2017 .
Item 11. Executive Compensation The information required for this Item is incorporated by reference from our Proxy Statement to be filed in connection with our 2018 Annual Meeting ofStockholders within 120 days after the end of the fiscal year ended December 31, 2017 .
Item 12. Security Ownership of Certain Beneficial Owners and Management and Related Stockholder Matters
The information required for this Item is incorporated by reference from our Proxy Statement to be filed in connection with our 2018 Annual Meeting ofStockholders within 120 days after the end of the fiscal year ended December 31, 2017 .
Item 13. Certain Relationships and Related Transaction, and Director Independence The information required for this Item is incorporated by reference from our Proxy Statement to be filed in connection with our 2018 Annual Meeting ofStockholders within 120 days after the end of the fiscal year ended December 31, 2017 .
Item 14. Principal Accounting Fees and Services The information required for this Item is incorporated by reference from our Proxy Statement to be filed in connection with our 2018 Annual Meeting ofStockholders within 120 days after the end of the fiscal year ended December 31, 2017 .
98

Table of Contents
PART IV ITEM 15. Exhibits, Financial Statement Schedules.
(a) The following documents are filed as part of this Annual Report on Form 10-K:1. Consolidated Financial Statements
The financial statements filed as part of this Annual Report on Form 10-K are listed in the “Index to Consolidated Financial Statements” under PartII, Item 8 of this Annual Report on Form 10-K.
2. Financial Statement SchedulesAll schedules are omitted as the required information is inapplicable or the information is presented in the consolidated financial statements or notesto consolidated financial statements under Item 8.
3. ExhibitsSee Exhibit Index following the signature page of this Annual Report on Form 10-K.
99
Table of Contents
EXHIBIT INDEX
Incorporated by Reference ExhibitNumber Exhibit Description Form File No. Exhibit
FilingDate
FiledHerewith
3.1 Restated Certificate of Incorporation of Registrant. 10-Q 001-37444 3.1 8/7/2015 3.2 Restated Bylaws of Registrant. 10-Q 001-37444 3.2 8/7/2015 4.1 Form of Registrant’s Class A common stock certificate. S-1/A 333-203941 4.1 6/2/2015 4.2
Third Amended and Restated Investors’ Rights Agreement by and amongthe Registrant and certain stockholders of the Registrant, dated June 6,2013.
S-1
333-203941
4.2
5/7/2015
4.3
Warrant to Purchase Stock by and between the Registrant and GranitePeak Technologies, LLC, dated July 10, 2017.
10-Q
001-37444
10.1
11/3/2017
10.1* Form of Indemnification Agreement. S-1 333-203941 10.1 5/7/2015 10.2*
Amended and Restated 2007 Stock Plan, as amended, and forms of awardagreements.
S-1
333-203941
10.2
5/7/2015
10.3* 2015 Equity Incentive Plan and forms of award agreements. S-1 333-203941 10.3 5/7/2015 10.4*
Form of Notice of Stock Option Grant and Stock Option Agreement underthe 2015 Equity Incentive Plan.
8-K
001-37444
10.1
2/9/2016
10.5* 2015 Employee Stock Purchase Plan. S-1 333-203941 10.4 5/7/2015 10.6*
Offer Letter by and between the Registrant and William Zerella, datedApril 24, 2014.
S-1
333-203941
10.5
5/7/2015
10.7*
Offer Letter by and between the Registrant and Andy Missan, datedMarch 15, 2013.
10-K
001-37444
10.8
2/29/2016
10.8*
Offer Letter by and between the Registrant and Jeff Devine, dated January26, 2017. X
10.9
Office Lease by and between the Registrant and 405 Howard, LLC, datedSeptember 30, 2013.
S-1
333-203941
10.6
5/7/2015
10.10
Office Lease by and between the Registrant and GLL BIT Fremont StreetPartners, L.P., dated June 26, 2015.
10-Q
001-37444
10.3
8/7/2015
10.11
Second Amended and Restated Credit Agreement, by and among Fitbit,Inc., the lenders party thereto and Silicon Valley Bank, as administrativeagent, dated December 10, 2015.
8-K
001-37444
10.1
12/15/2015
100
Table of Contents
Incorporated by Reference ExhibitNumber Exhibit Description Form File No. Exhibit
FilingDate
FiledHerewith
10.12
First Amendment to Second Amended and Restated Credit Agreement, byand among Fitbit, Inc., the lenders party thereto and Silicon Valley Bank,as administrative agent, dated May 3, 2017.
10-Q
001-37444
10.1
5/5/2017
10.13
Revolving Credit and Guaranty Agreement by and among Registrant, theGuarantors party thereto, the Lenders party thereto, Morgan Stanley BankN.A., and Morgan Stanley Senior Funding, Inc., dated August 13, 2014.
S-1
333-203941
10.9
5/7/2015
10.14* Form of Retention Agreement. S-1/A 333-203941 10.10 5/21/2015 10.15* Fitbit, Inc. Bonus Plan, as amended. X10.16*
Global Notice of Stock Option Grant and Global Stock Option Agreementunder the 2015 Equity Incentive Plan.
10-Q
001-37444
10.3
5/6/2016
10.17†
Office Sublease, dated April 11, 2016, by and between the Registrant andCharles Schwab & Co., Inc..
10-Q
001-37444
10.1
8/4/2016
21.1 List of Subsidiaries of Registrant. X23.1
Consent of PricewaterhouseCoopers LLP, independent registered publicaccounting firm. X
24.1 Power of Attorney. X31.1 Rule 13a-14(a)/ 15d-14(a) Certification of Chief Executive Officer. X31.2 Rule 13a-14(a)/ 15d-14(a) Certification of Chief Financial Officer. X32.1◊ Section 1350 Certification of Chief Executive Officer. X32.2◊ Section 1350 Certification of Chief Financial Officer. X
101.INS XBRL Instance Document. X101.SCH XBRL Schema Linkbase Document. X101.CAL XBRL Calculation Linkbase Document. X101.DEF XBRL Definition Linkbase Document. X101.LAB XBRL Extension Label Linkbase Document. X101.PRE XBRL Presentation Linkbase Document. X* Indicates a management contract or compensatory plan.† Portions of this exhibit have been granted confidential treatment by the SEC.◊ These certifications are deemed not filed for purposes of Section 18 of the Securities Exchange Act of 1934, as amended, or the Exchange Act, or otherwise subject to the liability of that
section, nor shall they be deemed incorporated by reference into any filing under the Securities Act of 1933, as amended, or the Exchange Act.
SIGNATURES
Pursuant to the requirements of Section 13 or 15(d) of the Securities Exchange Act of 1934, the registrant has duly caused this report to be signed on itsbehalf by the undersigned, thereunto duly authorized.
March 1, 2018 FITBIT, INC.
By: /s/ James Park James Park President, Chief Executive Officer, and Chairman
Table of Contents
POWER OF ATTORNEY
KNOW ALL PERSONS BY THESE PRESENTS that each individual whose signature appears below constitutes and appoints James Park and WilliamZerella, and each of them, his true and lawful attorneys-in-fact and agents with full power of substitution, for him and in his name, place, and stead, in any and allcapacities, to sign any and all amendments to this Annual Report on Form 10-K, and to file the same, with all exhibits thereto and other documents in connectiontherewith, with the Securities and Exchange Commission, granting unto said attorneys-in-fact and agents, and each of them, full power and authority to do andperform each and every act and thing requisite and necessary to be done in and about the premises, as fully to all intents and purposes as he might or could do inperson, hereby ratifying and confirming all that said attorneys-in-fact and agents or any of them, or his or their substitute or substitutes, may lawfully do or cause tobe done or by virtue hereof.
Pursuant to the requirements of the Securities Exchange Act of 1934, this report has been signed below by the following persons on behalf of the registrantand in the capacities and on the dates indicated.
Name Title Date
/s/ James Park President, Chief Executive Officer, and Chairman March 1, 2018James Park (Principal Executive Officer)
/s/ William Zerella Chief Financial Officer March 1, 2018
William Zerella (Principal Financial and Accounting Officer)
/s/ Eric N. Friedman Chief Technology Officer and Director March 1, 2018Eric N. Friedman
/s/ Laura J. Alber Director March 1, 2018
Laura J. Alber
/s/ Jonathan D. Callaghan Director March 1, 2018Jonathan D. Callaghan
/s/ Glenda Flanagan Director March 1, 2018
Glenda Flanagan
/s/ Steven Murray Director March 1, 2018Steven Murray
/s/ Christopher Paisley Director March 1, 2018
Christopher Paisley
January 26, 2017
PERSONAL AND CONFIDENTIAL
Jeff Devine Dear Jeff,
Fitbit, Inc. (the “Company”) is pleased to offer you the full-time position of EVP Operations reporting to CEO, James Park. We are excitedabout the prospect of you joining our team, and look forward to the addition of your professionalism and experience to help the Company achieve itsgoals.
You will be paid an annual salary of three hundred eighty-five thousand dollars ($385,000). Your salary will be paid in accordance with theCompany's normal payroll practices as established or modified from time to time. Currently, salaries are paid on a semi-monthly basis. In connectionwith your employment, you will be eligible to participate in benefits programs that have been adopted by the Company to the same extent as, andsubject to the same terms, conditions and limitations applicable to, other employees of the Company of similar rank and tenure.
In addition to your base salary, you will be eligible to receive an annual bonus of seventy- five percent (75%) of your base salary. Your actualbonus will be based on the achievement of the Company’s financial objectives and fulfillment of your individual performance goals that will beestablished and evaluated by your manager on an annual basis. The bonus, if earned, will be paid out during the first quarter of the following calendaryear. You must be employed on the day that bonuses are paid in order to be eligible for a bonus. For your first calendar year of employment, yourbonus will be pro-rated to your start date. Employees who commence work after September 30 are not eligible for a bonus for that calendar year.
Subject to the approval of the Company’s Board of Directors, you will be granted 125,000 restricted stock units (“RSUs”) under theCompany’s 2015 Equity Incentive Plan (the “Plan”). Each RSU entitles you to receive one share of Fitbit, Inc. Class A Common Stock on the date ofvesting and, unlike traditional stock options, you do not need to pay any exercise price for the shares of the Company’s stock subject to the RSUs. TheRSU's will generally commence vesting on (i) the 15th day of the month of your date of hire, if you start on the 1st through the 15th day of the month,or (ii) the 15th day of the month after your date of hire, if you start after the 15th of the month. Your RSUs will vest over 3 years, with 1/3rd of theRSUs vesting on the one-year anniversary of the vesting commencement date, and 1/12th of the RSUs vesting quarterly thereafter over the next twoyears. Vesting will, of course, depend on your continued employment with the Company.
By signing this offer, you represent that your employment with the Company and the performance of your duties does not and will not breachany agreement entered into by you (i.e., you have not entered into any agreements with previous employers that conflict with your obligations to theCompany). Please provide us with a copy of any such agreements. You will also be required to sign an Employee Invention

Assignment and Confidentiality Agreement as a condition of your employment with the Company. A copy of this agreement will be made available toyou.
Notwithstanding the foregoing, in the event there is a Change of Control (as defined in the Plan) and in connection with such Change ofControl or within 12 months following the closing of the Change of Control (i) Optionee’s employment is terminated by the Company (or a successor)for a reason other than Cause (as defined in the Plan) or (ii) there is a Constructive Termination (as defined in Optionee’s Offer Letter) and Optioneeresigns within six months following such Constructive Termination, then 50% of any then remaining unvested shares subject to the Option shall uponthe date of such termination become immediately vested and exercisable.
Moreover, you will be required to provide the Company with documents establishing your identity and right to work in the United States.Those documents must be provided to the Company within three business days of your employment start date.
We hope that this will be the beginning of a long and rewarding employment relationship. However, you are not being promised anyparticular term of employment. You understand that your employment with the Company will be “at-will,” meaning that either you or the Companymay terminate your employment relationship at any time, for any reason, with or without prior notice. The Company also has the right to change, orotherwise modify, in its sole discretion, the terms and conditions of your at-will employment, including your salary and benefits.
The Company reserves the right to conduct background investigations and/or reference checks on all of its potential employees, includingverification of criminal, education and/or employment background. Your offer of employment with Fitbit, therefore, is contingent upon a satisfactoryclearance of such a background investigation and/or reference check, if any.
This letter, together with the Employee Invention Assignment, Confidentiality and Arbitration Agreement, set forth the terms of youremployment with the Company and supersede any prior representations, agreements, discussions, or offers between the parties, whether written ororal.
We are very excited about having you join the Company. If you agree to the offer terms above, please sign below. If you have any questionsregarding this offer, please discuss with your recruiter or contact Human Resources, [email protected]. This offer shall remain open until February 6,2017 after which, if not accepted, shall expire.
Sincerely,
James Park
Co-Founder & CEO Fitbit, Inc.

I have read and accept the terms and conditions of this offer.
Signed: 1/26/2017 Jeff Devine Date
Bonus Plan, as amended through February 8, 2018
INTRODUCTION
1. EFFECTIVE DATE; OBJECTIVE: This Bonus Plan (“Plan”) shall be effective as of January 1, 2016, and iseffective for calendar year 2016 and each year thereafter (each, an “Eligibility Period”), unless otherwise amended orterminated by Fitbit, Inc. (“Fitbit” or the “Company”) in accordance with the Plan. The Plan supersedes all priorbonus plans. The objective of the Plan is to financially incentivize and reward employees based upon the Company’sperformance and for their individual contributions to the success of Fitbit.
2. ADMINISTRATION. The Plan shall be administered by the Compensation Committee of the Board of Directors(the “Plan Administrator”), which shall have the discretionary authority to interpret and administer the Plan,including all terms defined herein, and to adopt rules and regulations to implement the Plan, as it deems necessary.In addition, the Plan Administrator hereby delegates to the Company’s CEO, CFO and the Head of HumanResources or such other officers of the Company approved by the Company’s CEO (such individuals, the “ExecutiveAdministrators” and together with the Plan Administrator, the “Administrators”) the approval of payouts under thePlan to employees other than Fitbit’s “executive officers” (as determined by the Board of Directors for purposes ofSection 16 under the Securities Exchange Act of 1934).. All of the foregoing may also be approved by the Board ofDirectors. For covered employees within the meaning of Internal Revenue Code (“Code”) Section 162(m), the PlanAdministrator may choose to take applicable actions in conformance with the requirements of Code Section 162(m).Any action that requires the approval of the Executive Administrators must be approved unanimously, and anyaction that may be approved by the Executive Administrators may instead also be approved by the PlanAdministrator. The decisions of the Administrators are final and binding and shall be given the maximum deferencepermitted by law.
3. PARTICIPANTS: Participation in the Plan is limited to Full-Time regular and Part-Time regular Fitbit employeeswho are employed by Fitbit on or before the start of the applicable Eligibility Period who are not covered by anyother bonus, commission, or incentive plan (“Participants”). Participation in the Plan is effective on the later ofJanuary 1, 2016 or the applicable subsequent calendar year or the day the Participant commences as a Full-Time/Part-Time regular employee of Fitbit. A Participant may be considered ineligible for the Plan at any time andfor any reason at the Administrators’ discretion regardless of whether he or she remains an employee of theCompany. This Plan is intended to compensate individuals for performance as well as encourage employee retentionthrough and until the date the bonus is paid; retention is therefore a key component of Plan eligibility. This Planexcludes employees who are not expressly classified by Fitbit as “regular,” including but not limited to temporaryemployees.
4. CHANGES IN PLAN: The Company reserves the right, in its sole discretion, to modify or terminate the Plan intotal or in part, at any time. Any such change must be in writing and approved by the Plan Administrator. However,no modification or termination shall apply retroactively as to cause a forfeiture of an earned Bonus.
5. INTERPRETATION OF PLAN: In the event of a question or dispute involving the interpretation oradministration of the Plan, the Plan Administrator will interpret and administer the Plan. The decision of the PlanAdministrator shall be made based upon its sole discretion, and shall be final and binding. All inquiries should be inwriting to the Head of Human Resources, who will forward the inquiry to the Plan Administrator for considerationand decision within 30 business days.
6. ENTIRE AGREEMENT: This Plan is the entire plan between Fitbit and Participants and supersedes all priorcompensation or incentive plans or any written or verbal representations regarding the subject matter of this Plan.
BONUS PLAN ELEMENTS
7. BONUS POOL. Each Eligibility Period, the Plan Administrator, in its sole discretion, will establish a Bonus Pool,which may be established before, during or after the applicable Eligibility Period. Actual awards will be paid fromthe Bonus Pool.
8. DISCRETION TO DETERMINE CRITERIA . The Plan Administrator will, in its sole discretion, determine theperformance goals applicable to any award which shall be selected from the Performance Factors set forth in the2015 Equity Incentive Plan. The goals may be on the basis of any such factors the Plan Administrator determinesrelevant, and may be on an individual, divisional, business unit or Company-wide basis. Performance goals may bemeasured over the period of time determined by the Plan Administrator in its sole discretion. An Eligibility Periodmay be divided into one or more shorter periods if, for example, but not by way of limitation, the Plan Administratordesires to measure some performance criteria over 12 months and other criteria over fewer months. The performancegoals may differ from Participant to Participant and from award to award. Failure to meet the goals will result in afailure to earn the award, except as provided herein. As determined by the Plan Administrator, the performance goalsmay be based on GAAP or non-GAAP results and any actual results may be adjusted by the Plan Administrator forone-time items, unbudgeted or unexpected items, acquisition-related activities or changes in applicable accountingrules when determining whether the performance goals have been met. It is within the sole discretion of the PlanAdministrator to make or not make any such equitable adjustments.
9. ELIGIBLE EARNINGS are defined as base salary (“Eligible Earnings”), prorated for hire date, base salary ratechanges, bonus target percent changes and leaves of absence (proration based on 365 days in the year) that occur inthe Eligibility Period. Eligible earnings exclude Company payments that are in addition to base salary including butnot limited to payments for moving or relocation allowances, or other bonuses or commissions. Changes to basesalary throughout the calendar year will be reflected in final wages used to calculate the bonus.
10. BONUS TARGET is the percentage of Eligible Earnings to be paid out at 100% performance achievement,determined by each Participant’s position and communicated at the time of hire or as amended in writing. The bonusmay be weighted based on individual performance and Company performance. The bonus can provide for payoutabove target for performance in excess of the individual performance factors and/or Company performance factorsor below target for performance below the individual performance factors and/or Company performance factors.
11. BONUS VESTING AND PAYMENTS : Bonuses are earned on the date of payment and not sooner, either inwhole or in part. Bonuses will be paid in cash. Bonuses will be paid as soon as practicable after the Companyannounces its financial results for the fiscal year, which generally occurs in the first quarter of the succeeding year.All bonus payments will be made net of applicable withholding taxes.
12. TRANSFERS: Employees who participate in the Plan and who transfer to a new position not covered by this Planand instead covered by another bonus, sales or incentive plan may be considered for a Bonus calculated on a pro-ratabasis for the applicable period. The Administrators will coordinate and administer this Plan with the other bonus,sales, or incentive plan and his/her/its determinations shall be final and binding.
13. INACTIVE EMPLOYEES : Employees on a Company-approved leave of absence will be considered for a proratedBonus for both the Company performance and individual performance (based upon their level of performance andcontribution while actively employed during the plan year). The proration will be calculated based on the percentageof the year worked. The Administrators will determine the appropriate proration and his/her determinations shall befinal and binding.
14. TERMINATION OF EMPLOYMENT BEFORE DATE OF PAYMENT : A Participant who terminatesemployment before the date the bonus is earned, whether termination is voluntary or involuntary, shall earn noBonus.
15. EMPLOYMENT AT WILL : The employment of all Participants at Fitbit is for an indefinite period of time and isterminable at will, at any time by either party, with or without cause being shown or advance notice by either party.This Plan shall not be construed to create a contract of employment for a specified period of time between Fitbit andany Participant, or to change the at-will employment status of any Participant.
16. GENERAL PROVISIONS : Bonus payments represent unfunded and unsecured obligations of the Company and aholder of any right hereunder in respect of any incentive payment shall have no rights other than those of a generalunsecured creditor to the Company. No Participant will have the right to alienate, pledge or encumber his or herinterest in this Plan, and such interest will not (to the extent permitted by law) be subject in any way to the claims ofthe Participant’s creditors or to attachment, execution or other process of law. The validity, construction, and effect ofthe Plan, any rules and regulations relating to the Plan, and any bonus payment shall be determined in accordancewith the laws of the State of California (without giving effect to principles of conflicts of laws thereof) and applicableFederal law. No incentive payment made under the Plan shall be intended to be deferred compensation under Section409A of the Code and will be interpreted accordingly. The Plan is intended to be a “bonus program” as defined underU.S. Department of Labor regulation 2510.3-2(c) and will be construed and administered in accordance with suchintention.

EXHIBIT 21.1
LIST OF SUBSIDIARIESFITBIT, INC.*
Fitbit International Limited (Ireland)Fitbit Limited (United Kingdom)
*Pursuant to Item 601(b)(21)(ii) of Regulation S-K, the names of other subsidiaries of Fitbit, Inc. are omitted because, considered in the aggregate, they would not constitute a significantsubsidiary as of the end of the year covered by this Annual Report on Form 10-K.

EXHIBIT 23.1
CONSENT OF INDEPENDENT REGISTERED PUBLIC ACCOUNTING FIRM
We hereby consent to the incorporation by reference in the Registration Statement on Form S‑8 (No. 333-216382, No. 333-205045, and No. 333-209787) of Fitbit,Inc. of our report dated March 1, 2018 relating to the financial statements and the effectiveness of internal control over financial reporting, which appears in thisForm 10‑K.
/s/ PricewaterhouseCoopers LLP San Francisco, California March 1, 2018
EXHIBIT 31.1
CERTIFICATION OF CHIEF EXECUTIVE OFFICER PURSUANT TO SECTION 302 OF THESARBANES-OXLEY ACT OF 2002
I, James Park, certify that:1. I have reviewed this annual report on Form 10-K of Fitbit, Inc.;2. Based on my knowledge, this report does not contain any untrue statement of a material fact or omit to state a material fact necessary to make the statementsmade, in light of the circumstances under which such statements were made, not misleading with respect to the period covered by this report;3. Based on my knowledge, the financial statements, and other financial information included in this report, fairly present in all material respects the financialcondition, results of operations and cash flows of the registrant as of, and for, the periods presented in this report;4. The registrant’s other certifying officer and I are responsible for establishing and maintaining disclosure controls and procedures (as defined in Exchange ActRules 13a-15(e) and 15d-15(e)) and internal control over financial reporting (as defined in Exchange Act Rules 13a-15(f) and 15d-15(f)) for the registrant andhave:
a) Designed such disclosure controls and procedures, or caused such disclosure controls and procedures to be designed under our supervision, to ensurethat material information relating to the registrant, including its consolidated subsidiaries, is made known to us by others within those entities, particularly duringthe period in which this report is being prepared;
b) Designed such internal control over financial reporting, or caused such internal control over financial reporting to be designed under our supervision,to provide reasonable assurance regarding the reliability of financial reporting and the preparation of financial statements for external purposes in accordance withgenerally accepted accounting principles;
c) Evaluated the effectiveness of the registrant’s disclosure controls and procedures and presented in this report our conclusions about the effectivenessof the disclosure controls and procedures, as of the end of the period covered by this report based on such evaluation; and
d) Disclosed in this report any change in the registrant’s internal control over financial reporting that occurred during the registrant’s most recent fiscalquarter (the registrant’s fourth fiscal quarter in the case of an annual report) that has materially affected, or is reasonably likely to materially affect, the registrant’sinternal control over financial reporting.5. The registrant’s other certifying officer and I have disclosed, based on our most recent evaluation of internal control over financial reporting, to the registrant’sauditors and the audit committee of the registrant’s board of directors (or persons performing the equivalent functions):
a) All significant deficiencies and material weaknesses in the design or operation of internal control over financial reporting which are reasonably likelyto adversely affect the registrant’s ability to record, process, summarize and report financial information; and
b) Any fraud, whether or not material, that involves management or other employees who have a significant role in the registrant’s internal control overfinancial reporting.
Date: March 1, 2018 /s/ James Park
James ParkPresident, Chief Executive Officer, and Chairman(Principal Executive Officer)
EXHIBIT 31.2
CERTIFICATION OF CHIEF FINANCIAL OFFICER PURSUANT TO SECTION 302 OF THESARBANES-OXLEY ACT OF 2002
I, William Zerella, certify that:1. I have reviewed this annual report on Form 10-K of Fitbit, Inc.;2. Based on my knowledge, this report does not contain any untrue statement of a material fact or omit to state a material fact necessary to make the statementsmade, in light of the circumstances under which such statements were made, not misleading with respect to the period covered by this report;3. Based on my knowledge, the financial statements, and other financial information included in this report, fairly present in all material respects the financialcondition, results of operations and cash flows of the registrant as of, and for, the periods presented in this report;4. The registrant’s other certifying officer and I are responsible for establishing and maintaining disclosure controls and procedures (as defined in Exchange ActRules 13a-15(e) and 15d-15(e)) and internal control over financial reporting (as defined in Exchange Act Rules 13a-15(f) and 15d-15(f)) for the registrant andhave:
a) Designed such disclosure controls and procedures, or caused such disclosure controls and procedures to be designed under our supervision, to ensurethat material information relating to the registrant, including its consolidated subsidiaries, is made known to us by others within those entities, particularly duringthe period in which this report is being prepared;
b) Designed such internal control over financial reporting, or caused such internal control over financial reporting to be designed under our supervision,to provide reasonable assurance regarding the reliability of financial reporting and the preparation of financial statements for external purposes in accordance withgenerally accepted accounting principles;
c) Evaluated the effectiveness of the registrant’s disclosure controls and procedures and presented in this report our conclusions about the effectivenessof the disclosure controls and procedures, as of the end of the period covered by this report based on such evaluation; and
d) Disclosed in this report any change in the registrant’s internal control over financial reporting that occurred during the registrant’s most recent fiscalquarter (the registrant’s fourth fiscal quarter in the case of an annual report) that has materially affected, or is reasonably likely to materially affect, the registrant’sinternal control over financial reporting.5. The registrant’s other certifying officer and I have disclosed, based on our most recent evaluation of internal control over financial reporting, to the registrant’sauditors and the audit committee of the registrant’s board of directors (or persons performing the equivalent functions):
a) All significant deficiencies and material weaknesses in the design or operation of internal control over financial reporting which are reasonably likelyto adversely affect the registrant’s ability to record, process, summarize and report financial information; and
b) Any fraud, whether or not material, that involves management or other employees who have a significant role in the registrant’s internal control overfinancial reporting.
Date: March 1, 2018 /s/ William Zerella
William ZerellaChief Financial Officer(Principal Financial and Accounting Officer)
EXHIBIT 32.1
CERTIFICATION OF CHIEF EXECUTIVE OFFICERPURSUANT TO
18 U.S.C. SECTION 1350,AS ADOPTED PURSUANT TO
SECTION 906 OF THE SARBANES-OXLEY ACT OF 2002
I, James Park, President, Chief Executive Officer and Chairman of Fitbit Inc., do hereby certify, pursuant to 18 U.S.C. Section 1350, as adopted pursuant toSection 906 of the Sarbanes-Oxley Act of 2002, that to the best of my knowledge:
• the Annual Report on Form 10-K of Fitbit, Inc. for the year ended December 31, 2017 fully complies with the requirements of Section 13(a) or 15(d) ofthe Securities Exchange Act of 1934, as amended; and
• the information contained in such Annual Report on Form 10-K fairly presents, in all material respects, the financial condition and results of operations ofFitbit, Inc.
Date: March 1, 2018 By: /s/ James Park
James Park
President, Chief Executive Officer, and Chairman(Principal Executive Officer)
EXHIBIT 32.2
CERTIFICATION OF CHIEF FINANCIAL OFFICERPURSUANT TO
18 U.S.C. SECTION 1350,AS ADOPTED PURSUANT TO
SECTION 906 OF THE SARBANES-OXLEY ACT OF 2002
I, William Zerella, Chief Financial Officer of Fitbit Inc., do hereby certify, pursuant to 18 U.S.C. Section 1350, as adopted pursuant to Section 906 of the Sarbanes-Oxley Act of 2002, that to the best of my knowledge:
• the Annual Report on Form 10-K of Fitbit, Inc. for the year ended December 31, 2017 fully complies with the requirements of Section 13(a) or 15(d) ofthe Securities Exchange Act of 1934, as amended; and
• the information contained in such Annual Report on Form 10-K fairly presents, in all material respects, the financial condition and results of operations ofFitbit, Inc.
Date: March 1, 2018 By: /s/ William Zerella
William Zerella
Chief Financial Officer(Principal Financial and Accounting Officer)

![] Ò [ZëǯkÅ 1&7 Ñ% - d1lge852tjjqow.cloudfront.netd1lge852tjjqow.cloudfront.net/CIK-0001447599/65c68cfb-bb52-4c32-a... · ¨ Written communications pursuant to Rule 425 under](https://img.pdfslide.us/doc/110x75/5b1a6a237f8b9a3c258d9fd5/-o-zecka-17-n-written-communications-pursuant-to-rule-425-under.jpg)