Embed Size (px)
Citation preview

Table ofContentsTOC
Page TOC-1
CHAPTER 1 - EXECUTIVE SUMMARY 1
A. Introduction 1
B. Performance Benchmarking 1
C. Best Management Practices 4
D. Online Discussion Forum 10
E. Conclusion 10
CHAPTER 2 - INTRODUCTION 12
A. Background 12
B. Benefi ts of Participation 14
C. Study Goals 15
CHAPTER 3 - PERFORMANCE BENCHMARKING 16
A. Study Criteria 16
B. Data Collection and Confi rmation 16
C. Performance Data Database 17
I. Data Submission Challenges ............................................... 18
II. Projects Distribution Matrix ............................................... 18
III. Construction Contract Award Data .................................... 22
D. Performance Data Analyses 22
E. Change Order Classifi cation 24
I. Changed/Unforseen Conditions .......................................... 25
II. Changes to Bid Documents ................................................. 25
III. Client-Initiated Changes ...................................................... 25
F. Special Study - Consultant Usage 26
Page TOC-2
Annual Report Update 2005California Multi-Agency CIP Benchmarking Study
CHAPTER 4 - BEST MANAGEMENT PRACTICES 29
A. Progress on Best Management Practice Implementation 29
I. City of Long Beach ............................................................. 30
II. City of Los Angeles ............................................................. 30
III. City of Oakland .................................................................. 30
IV. City of Sacramento .............................................................. 31
V. City of San Diego ................................................................ 31
VI. City and County of San Francisco ....................................... 31
VII. City of San Jose .................................................................... 31
B. New Best Management Practices 32
C. Implementation Challenges 38
D. Regulatory Challenges 39
CHAPTER 5 - ONLINE DISCUSSION FORUM 41
A. Construction Traffi c Control Management 42
B. Street Construction Coordination 47
C. Construction Cost Estimating 49
D Bond Measure Considerations 50
E. Online Bid Advertising, Bid Documents, and Bidding 50
F. Cost Impacts of LEED Certifi cation and In-House Green Design Teams 51
G. Environmental Approvals 52
H. Consultant Selection, Management, and Fees 53
I. As-Built Record Documents 54
CHAPTER 6 - CONCLUSION 55
A. Performance Data Improvement 55
B. Update 2005 Observations 55
C. Acknowledgements 56
Page TOC-3
TOCTable of Contents
APPENDICES
APPENDIX A - PERFORMANCE CURVES A-1
Curves Group 1 ........................................................................... A-1
Curves Group 2 ........................................................................... A-11
Curves Group 3 ........................................................................... A-21
APPENDIX B - INDIRECT RATES B-1
FIGURES
Figure 3-1 Consultant Usage Histogram ...................................... 27
Figure 5-1 San Diego’s CityWorks ................................................ 48
TABLES
Table 1-1 Summary of Performance Models ............................... 3
Table 1-2 Implementation of BMPs ............................................ 5
Table 2-1 Agencies’ Overall Information ..................................... 13
Table 3-1 Update 2005 Database ................................................ 17
Table 3-2 Projects Distribution Matrix ........................................ 19
Table 3-3 Update 2005 Project Count and Project Delivery by Completion Year ....................................................... 20
Table 3-4 Update 2005 Project Delivery Performance by Agency 21
Table 3-5 Construction Contract Awards .................................... 22
Table 3-6 Summary of Performance Models ................................ 23
Table 4-1 Implementation of BMPs ............................................ 33
Table 5-1 Cost Estimating Survey ................................................ 49
Table 5-2 Bond Measures (1999-2004) ....................................... 51
Table 5-3 Environmental Approval Processes ............................... 52
Table A-1 Performance Graphs R2 Results .................................... A-31
Table B-1 Indirect Rates Applied to Capital Projects .................... B-1

CHAPTER ExecutiveSummary1
Page 1
A. INTRODUCTION
Seven of the largest municipalities in Cali-fornia have been working together over the last four years to quantify and document
the actual cost of delivering capital projects and to identify and implement Best Management Prac-tices (BMPs) to improve the effi ciency of capital project delivery. The California Multi-Agency CIP Benchmarking Study (Study) published in 2002 presented design and construction manage-ment cost data on 239 completed projects with a total construction value of $490 million, and has been growing with each annual update. The Update 2005 analysis includes 642 projects with a total construction value of $993 million.
The agencies participating in the study are the Cities of Long Beach, Los Angeles, Oakland, Sac-ramento, San Diego, and San Jose, and the City and County of San Francisco. By participating in this effort, these agencies have demonstrated their sincere interest in improving project delivery. They have assembled real project delivery data with which to make decisions and gauge perfor-mance. They have identifi ed BMPs for imple-mentation and they have mutually benefi ted by sharing their procedures and experiences.
This is the fourth year of a continuing study. This Update 2005 documents the agencies’ progress on the following goals:
1. Improve the quality of the performance data and the functionality of the data-base.
2. Track the implementation of BMPs by each participating agency.
3. Continue sharing information with one another through the online discussion forum.
4. Classify change orders.
5. Perform special studies on topics of interest.
B. PERFORMANCE BENCHMARKING
Performance benchmarking involves collecting documented project costs and creating data mod-els of the component costs of project delivery ver-sus the total construction cost. Project delivery costs are defi ned as the sum of all agency, internal client, and consultant costs associated with the planning, design, bid, award, construction man-agement, and closeout activities on projects.
The Update 2005 study performance curves include projects completed between January 1, 1999 and January 1, 2005. Outlier projects were identifi ed and eliminated. The remaining 642 projects used in this analysis were all delivered using the design-bid-build delivery method and each have a total construction cost of greater than $100,000.
The Update 2005 performance data shows that relative project delivery costs appear to be in-creasing with completion year. Some agencies attribute this to the increased cost of compliance with more stringent environmental require-ments and the move toward greater community involvement and coordination. It is also likely that improved data collection and reporting of project delivery costs is contributing to this appearance that project delivery costs are increas-ing. Through the diligent focus required by this study itself, the agencies are getting better at tracking and capturing all of the costs associated with project delivery.
Page 2
Annual Report Update 2005California Multi-Agency CIP Benchmarking Study
Project delivery costs as a percentage of Total Construction Cost (TCC) tend to be higher on smaller projects. Between 1999 and 2004, the average and median construction value of the projects included in the study decreased. The infl uence of project size on the relative project delivery cost is clear from the performance curves.
The Study Team also collected design cost and contract award data on over 200 projects with a total awarded value of over $460 million. These projects were awarded between approximately July 1, 2003 and June 30, 2004 and have not yet been completed, so they are not included in the Update 2005 database nor analyses. The award data provided indicate that design costs as a percentage of construction contract award ranged from 8 to 50 percent for these projects. These projects will be added to the database as they are completed by the agencies.
Performance curves produced for this Study are regressions of data, demonstrating how close of a relationship exists between the dependent variable (y-axis) and the independent variable (x-axis). A best-fi t logarithmic curve is calculated using the least-squares method in Excel®, and a R2 value is displayed. The R2 value, also called the regression coeffi cient, is a value between 1 and 0, with a value approaching 0 indicating a poor model and a value approaching 1 indicating a highly-predictable relationship.
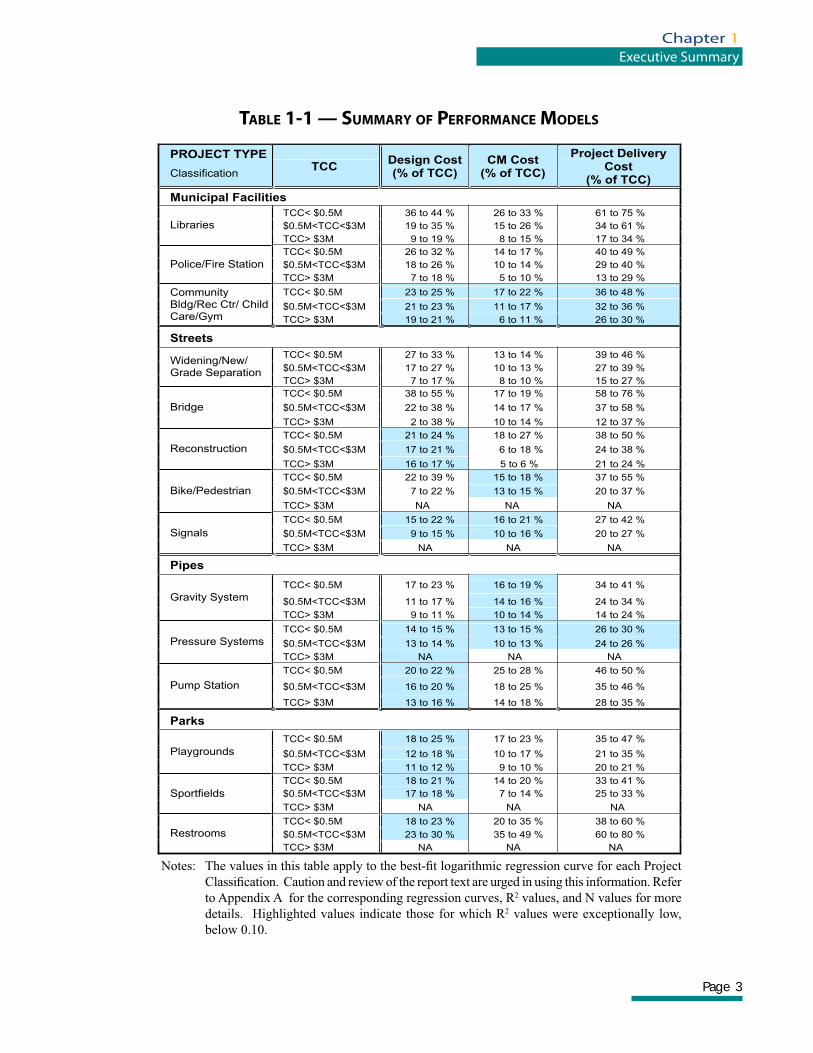
As in prior years, data was collected on four project types and fourteen project classifi ca-tions. Project performance data were analyzed at both the Project Type level and the Project Classifi cation level. The results of the analyses are presented in Table 1-1 and in the performance curves included in Appendix A .
The table and best-fi t curves provide an average of the projects that can be used as a starting point for budgeting an entire program of projects, or for comparison of performance among the agen-
cies. Caution and use of professional judgment is suggested if the best-fi t curve is used to budget an individual project.
Preliminary curves on change orders were devel-oped using the data on approximately one-third of the projects in the database. There was poor correlation between the value of total change orders on a project and the project size. The analysis indicated that projects generally averaged change orders of 10 percent of TCC regardless of the relative amount spent on design.
The agencies plan to continue the analysis of change orders and have now defi ned three catego-ries into which all changes will be classifi ed. The agencies agreed to provide change order data on all future project contributions as follows:
1. Changed/Unforseen Conditions
2. Changes to Bid Documents
3. Client-Initiated Changes
The Study Team conducted a special analysis of consultant usage as it relates to project perfor-mance. While the agencies agree that consultant usage is generally increasing and will continue to escalate in the future, consultants were used in less than half of the projects included in the Update 2005 analysis.
Regressions were performed comparing projects for which consultant use exceeded 25 percent of project delivery cost and projects on which there were no consultant costs. The agencies expected project delivery costs to be lower on projects that included consultant usage, which was true in only selected cases. From these regressions, the agencies made the following observations:
� Generally, the design cost for projects on which consultant usage exceeded 25 percent of project delivery was 6 or 7 percent higher than for projects with no consultant usage.
Page 3
Chapter 1Executive Summary
TABLE 1-1 — SUMMARY OF PERFORMANCE MODELS
Notes: The values in this table apply to the best-fi t logarithmic regression curve for each Project
Classifi cation. Caution and review of the report text are urged in using this information. Refer
to Appendix A for the corresponding regression curves, R2 values, and N values for more
details. Highlighted values indicate those for which R2 values were exceptionally low,
below 0.10.
PROJECT TYPE
Classification TCC
Design Cost (% of TCC)
CM Cost(% of TCC)
Project Delivery Cost
(% of TCC)
Municipal Facilities
TCC< $0.5M 36 to 44 % 26 to 33 % 61 to 75 %
$0.5M<TCC<$3M 19 to 35 % 15 to 26 % 34 to 61 % Libraries
TCC> $3M 9 to 19 % 8 to 15 % 17 to 34 %
TCC< $0.5M 26 to 32 % 14 to 17 % 40 to 49 %
$0.5M<TCC<$3M 18 to 26 % 10 to 14 % 29 to 40 % Police/Fire Station
TCC> $3M 7 to 18 % 5 to 10 % 13 to 29 %
TCC< $0.5M 23 to 25 % 17 to 22 % 36 to 48 %
$0.5M<TCC<$3M 21 to 23 % 11 to 17 % 32 to 36 %
Community Bldg/Rec Ctr/ Child Care/Gym TCC> $3M 19 to 21 % 6 to 11 % 26 to 30 %
Streets
TCC< $0.5M 27 to 33 % 13 to 14 % 39 to 46 %
$0.5M<TCC<$3M 17 to 27 % 10 to 13 % 27 to 39 % Widening/New/ Grade Separation
TCC> $3M 7 to 17 % 8 to 10 % 15 to 27 %
TCC< $0.5M 38 to 55 % 17 to 19 % 58 to 76 %
$0.5M<TCC<$3M 22 to 38 % 14 to 17 % 37 to 58 % Bridge
TCC> $3M 2 to 38 % 10 to 14 % 12 to 37 %
TCC< $0.5M 21 to 24 % 18 to 27 % 38 to 50 %
$0.5M<TCC<$3M 17 to 21 % 6 to 18 % 24 to 38 % Reconstruction
TCC> $3M 16 to 17 % 5 to 6 % 21 to 24 %
TCC< $0.5M 22 to 39 % 15 to 18 % 37 to 55 %
$0.5M<TCC<$3M 7 to 22 % 13 to 15 % 20 to 37 % Bike/Pedestrian
TCC> $3M NA NA NA
TCC< $0.5M 15 to 22 % 16 to 21 % 27 to 42 %
$0.5M<TCC<$3M 9 to 15 % 10 to 16 % 20 to 27 % Signals
TCC> $3M NA NA NA
Pipes
TCC< $0.5M 17 to 23 % 16 to 19 % 34 to 41 %
$0.5M<TCC<$3M 11 to 17 % 14 to 16 % 24 to 34 % Gravity System
TCC> $3M 9 to 11 % 10 to 14 % 14 to 24 %
TCC< $0.5M 14 to 15 % 13 to 15 % 26 to 30 %
$0.5M<TCC<$3M 13 to 14 % 10 to 13 % 24 to 26 % Pressure Systems
TCC> $3M NA NA NA
TCC< $0.5M 20 to 22 % 25 to 28 % 46 to 50 %
$0.5M<TCC<$3M 16 to 20 % 18 to 25 % 35 to 46 % Pump Station
TCC> $3M 13 to 16 % 14 to 18 % 28 to 35 %
Parks
TCC< $0.5M 18 to 25 % 17 to 23 % 35 to 47 %
$0.5M<TCC<$3M 12 to 18 % 10 to 17 % 21 to 35 % Playgrounds
TCC> $3M 11 to 12 % 9 to 10 % 20 to 21 %
TCC< $0.5M 18 to 21 % 14 to 20 % 33 to 41 %
$0.5M<TCC<$3M 17 to 18 % 7 to 14 % 25 to 33 % Sportfields
TCC> $3M NA NA NA
TCC< $0.5M 18 to 23 % 20 to 35 % 38 to 60 %
$0.5M<TCC<$3M 23 to 30 % 35 to 49 % 60 to 80 % Restrooms
TCC> $3M NA NA NA
Page 4
Annual Report Update 2005California Multi-Agency CIP Benchmarking Study
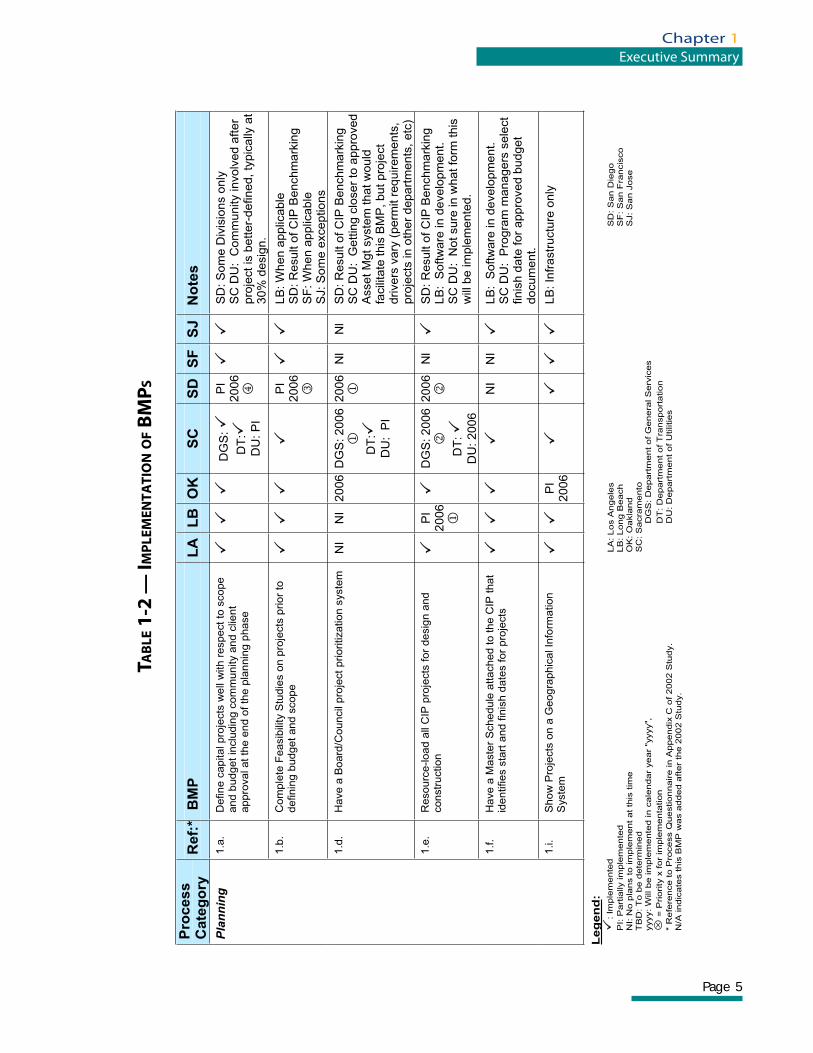
lected by year of project completion. It is antici-pated that the performance data will eventually demonstrate that as BMPs were implemented, project delivery costs were reduced. However, it is recognized that “processes” become effective “practices” only after a learning curve and full implementation on projects. Therefore, obtain-ing empirical evidence of this trend is expected to take several years.
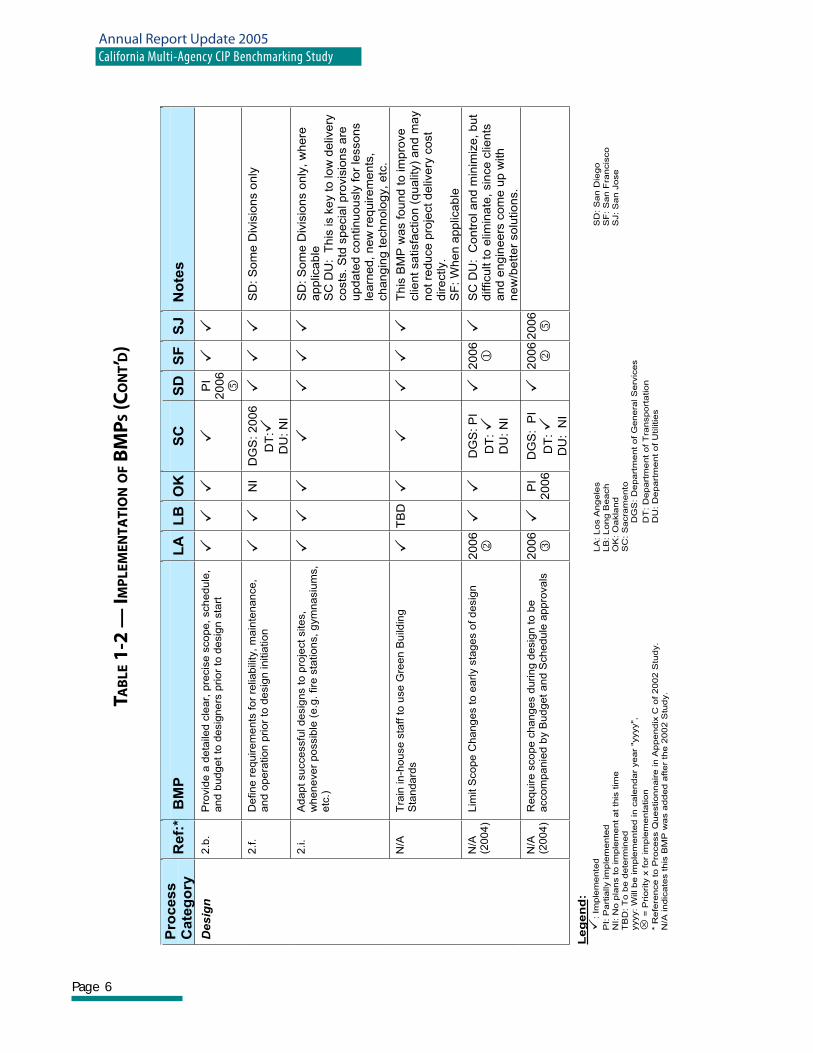
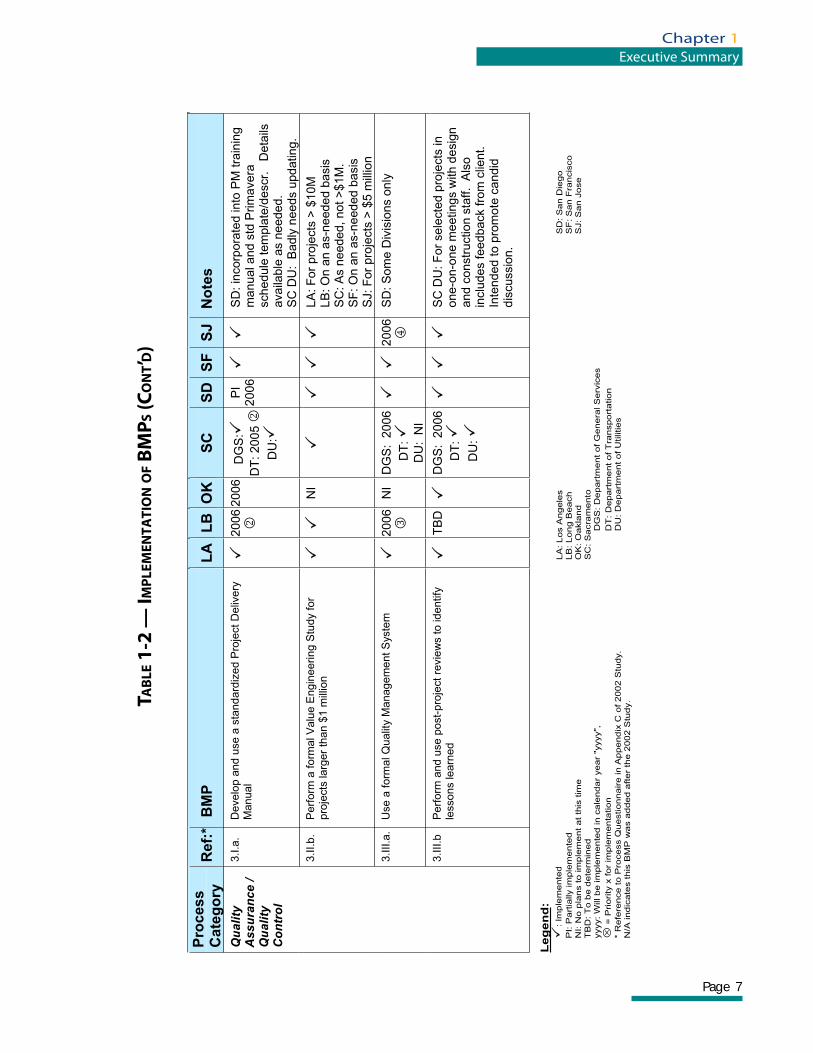
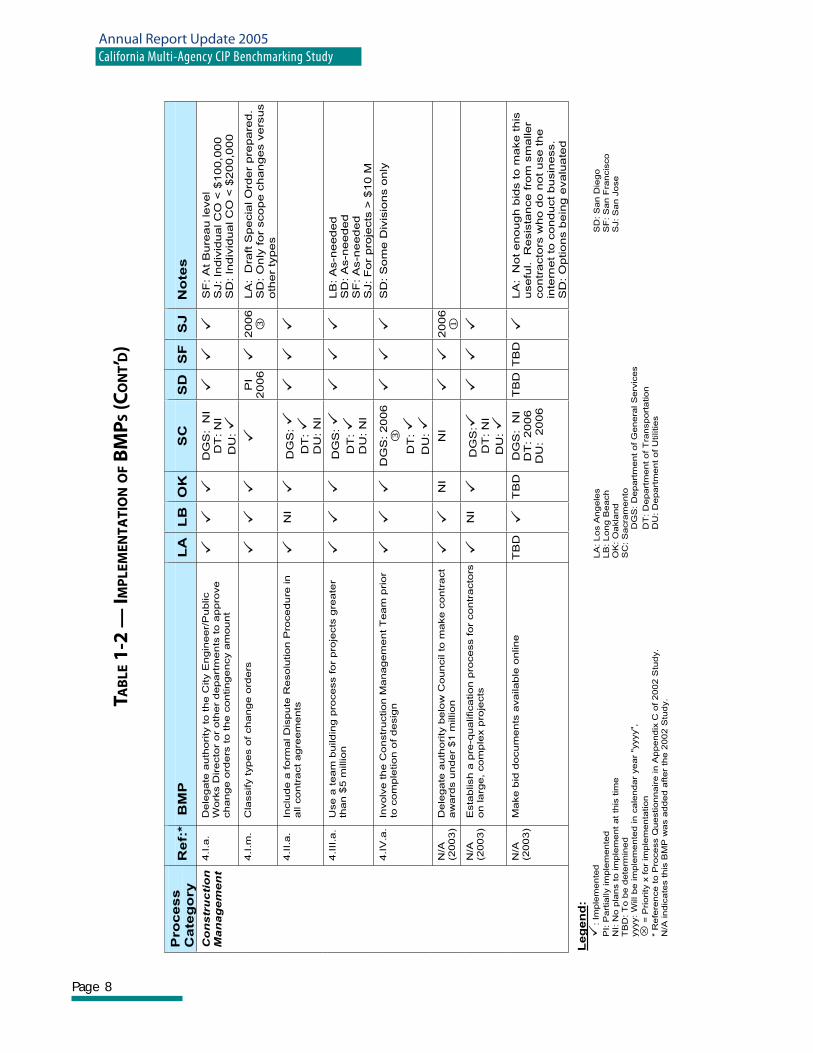
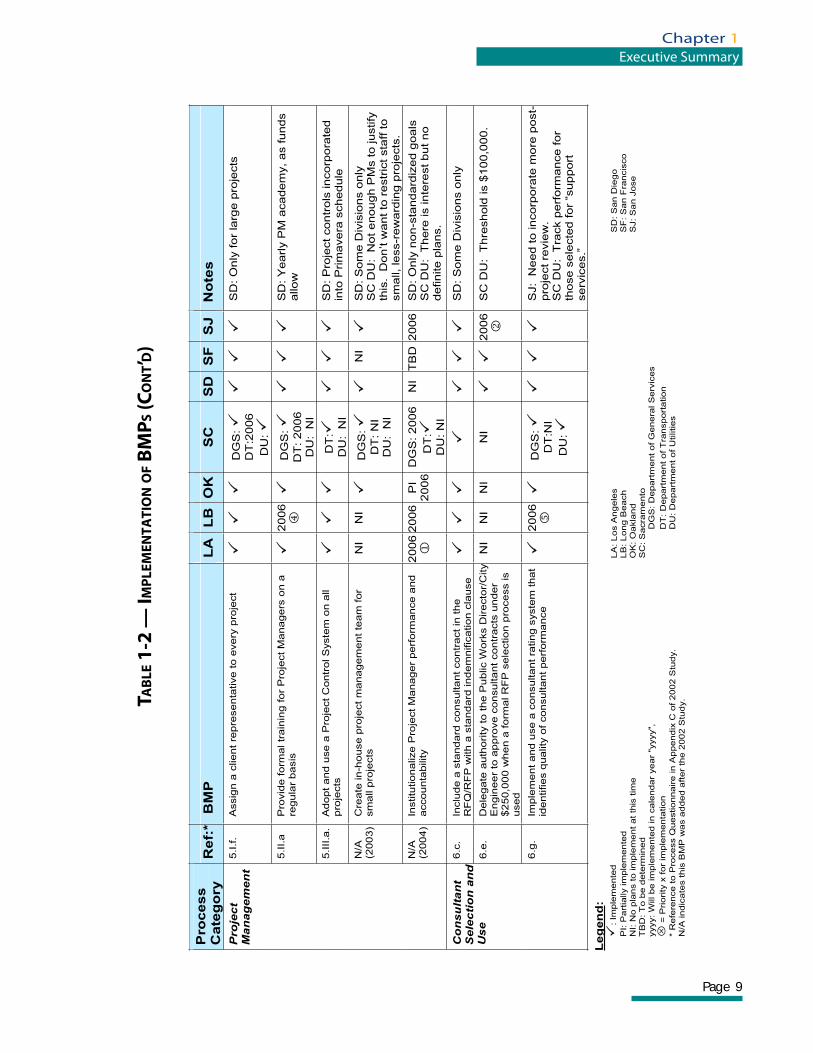
In Update 2005, the agencies continued to ex-change ideas regarding strategies for implement-ing various BMPs using both the networking opportunities at the quarterly meetings and the online discussion forum. Table 1-2 summarizes BMPs that have been implemented by the partici-pating agencies, as well as the priorities of those that are planned for implementation.
While continuing to track the implementation of BMPs identifi ed in previous years, the team also continued their efforts to identify new BMPs consistent with their goal of continuous improve-ment in project delivery.
The implementation of BMPs by the agencies was exceptionally challenging over the past year. Cities in California, like the state itself, had dif-fi culty securing budgets and addressing unusual winter and spring storm damage. The ability of the agencies to implement particular BMPs as planned was adversely impacted. Implementa-tion was delayed in many cases.
The participating agencies encountered a number of regulatory challenges this year, which they also believe, have impacted capital project delivery. As these challenges surfaced, the agencies began to strategize ways to minimize the impact on project delivery cost. It is anticipated that new BMPs related to these regulatory issues will be identifi ed and implemented as the team contin-ues to work together.
It is acknowledged that regulatory changes in our communities will continue. It is also rec-
� For Municipal Facilities projects with a TCC greater than $5 million, design costs were lower when more than 25 percent of project delivery costs could be attributed to consultant use.
� The R2 values were consistently higher for projects where consultant usage exceeded 25 percent of project delivery cost versus those where these was no con-sultant usage. This indicates less scatter and therefore more predictability and consistency in fi nancial performance. This may be because the scope must be better-defi ned when consultants are hired and because consultants’ fees are limited by contract.
� The increase in design costs associated with using consultants on smaller or more specialized projects may be justifi ed in cases where consultants offer special-ized technical expertise, the projects are complex, there is an aggressive project schedule, there are peak workload de-mands that can’t easily be met using in-house staff, or there are other resource limitations on in-house staff.
C. BEST MANAGEMENT PRACTICES
Since the inception of the Study in 2002, the agencies have examined over 100 practices used in the design and construction management phases of project delivery. Thirty-nine of these practices were identifi ed as those which all partic-ipating agencies do not already use, but should be fully implemented as BMPs. Thirty-one of these thirty-nine targeted practices directly infl uence the cost of design or construction management and, ultimately, effi cient project delivery.
Over the last three years, the participating agen-cies have implemented many of the BMPs. BMP implementation has been tracked and project delivery performance data continues to be col-
Page 5
Chapter 1Executive Summary
TAB
LE 1
-2 —
IMP
LEM
ENTA
TIO
N O
F BM
PS
Leg
en
d:
�:
Imple
mente
d�
LA
: Los A
ng
ele
s
SD
: S
an D
iego
P
I: P
art
ially im
ple
mente
d
LB
: Long B
each
SF
: S
an F
rancis
co
NI: N
o p
lans t
o im
ple
ment
at
this
tim
e
OK
: O
akla
nd
SJ:
San J
ose
TB
D: T
o b
e d
ete
rmin
ed
SC
: S
acra
mento
yyyy:
Will be im
ple
me
nte
d in
cale
ndar
ye
ar
"yyyy",
D
GS
: D
epart
ment
of
Genera
l S
erv
ices
� =
Priority
x f
or
imple
menta
tion
DT
: D
epart
me
nt
of T
ransport
ation
*
Refe
rence t
o P
rocess Q
uestionnaire in A
ppendix
C o
f 2
00
2 S
tud
y.
D
U: D
ep
art
me
nt
of
Utilitie
s
N
/A indic
ate
s t
his
BM
P w
as a
dded a
fter
the 2
00
2 S
tud
y.
Pro
cess
Cate
go
ry
Re
f:*
BM
PL
AL
BO
KS
CS
DS
FS
J
No
tes
1.a
. D
efin
e c
apital pro
jects
we
ll w
ith r
espect
to s
cope
and b
ud
get
inclu
din
g c
om
mu
nity a
nd c
lient
appro
val at
the
end o
f th
e p
lannin
g p
hase
�����
D
GS
: �
DT
:��
DU
: P
I�
PI
20
06�
�
����
SD
: S
om
e D
ivis
ions o
nly
S
C D
U: C
om
munity involv
ed a
fter
pro
ject is
bette
r-defined, ty
pic
ally
at
30%
desig
n.
1.b
. C
om
ple
te F
easib
ility
Stu
die
s o
n p
roje
cts
prior
to
definin
g b
ud
ge
t and s
cope
������
��
PI
20
06
�
����
LB
: W
he
n a
pp
licab
le
SD
: R
esu
lt o
f C
IP B
en
ch
ma
rkin
g
SF
: W
hen a
pplic
able
S
J: S
om
e e
xceptions
1.d
. H
ave a
Bo
ard
/Council
pro
ject
prioritization s
yste
m
NI
NI
2006
DG
S: 2006
��
DT
:��
DU
: P
I
20
06
�N
l N
l S
D: R
esu
lt o
f C
IP B
en
ch
ma
rkin
g
SC
DU
: G
ettin
g c
loser
to a
ppro
ved
Asset M
gt syste
m that w
ould
fa
cili
tate
this
BM
P, but pro
ject
drivers
vary
(perm
it r
equirem
ents
, pro
jects
in o
ther
depart
ments
, etc
)
1.e
. R
esourc
e-lo
ad a
ll C
IP p
roje
cts
for
desig
n a
nd
constr
uction
��
PI
20
06
�
��
DG
S: 2006
�D
T:��
DU
: 2
00
6
20
06
�N
l�
SD
: R
esu
lt o
f C
IP B
en
ch
ma
rkin
g
LB
: S
oftw
are
in d
evelo
pm
ent.
SC
DU
: N
ot sure
in w
hat fo
rm this
w
ill b
e im
ple
mente
d.
1.f.
Have a
Maste
r S
chedule
attached t
o t
he C
IP t
hat
identifies s
tart
and f
inis
h d
ate
s f
or
pro
jects
���
��
��
NI
NI ��
LB
: S
oftw
are
in d
evelo
pm
ent.
SC
DU
: P
rogra
m m
anagers
sele
ct
finis
h d
ate
for
appro
ved b
udget
docum
ent.
Plan
ning
1.i.
Sho
w P
roje
cts
on a
Geogra
phic
al In
form
ation
Syste
m
����
PI
20
06�
��
���
��
LB
: In
frastr
uctu
re o
nly
Page 6
Annual Report Update 2005California Multi-Agency CIP Benchmarking Study
TAB
LE 1
-2 —
IMP
LEM
ENTA
TIO
N O
F BM
PS (C
ON
T’D)
Pro
cess
Cate
go
ry
Re
f:*
BM
PL
AL
BO
KS
CS
DS
FS
J
No
tes
2.b
. P
rovid
e a
deta
iled c
lear,
pre
cis
e s
cope,
sch
edule
, and b
ud
get
to d
esig
ners
pri
or
to d
esig
n s
tart
������
��
PI
20
06�
�
����
2.f.
Define r
equirem
ents
for
relia
bili
ty,
main
tenance,
and o
pera
tion p
rior
to d
esig
n initia
tion
���
NI
DG
S: 2006
DT
:��
DU
: N
I
�����
SD
: S
om
e D
ivis
ions o
nly
2.i.
Adapt
successfu
l desig
ns t
o p
roje
ct
sites,
wh
en
eve
r p
ossib
le (
e.g
. fire
sta
tio
ns,
gym
na
siu
ms,
etc
.)
������
��
�����
SD
: S
om
e D
ivis
ions o
nly
, w
here
a
pp
lica
ble
S
C D
U: T
his
is k
ey to low
deliv
ery
costs
. S
td s
pe
cia
l pro
vis
ion
s a
re
update
d c
ontinuously
for
lessons
lea
rne
d, n
ew
re
qu
ire
me
nts
, changin
g technolo
gy, etc
.
N/A
T
rain
in-h
ouse s
taff t
o u
se G
reen B
uild
ing
Sta
ndard
s
��
TB
D�
��
������
This
BM
P w
as found to im
pro
ve
clie
nt satisfa
ction (
qualit
y)
and m
ay
not re
duce p
roje
ct deliv
ery
cost
directly.
SF
: W
hen a
pplic
able
N/A
(200
4)
Lim
it S
cope C
hang
es t
o e
arl
y s
tages o
f desig
n
20
06
��
�D
GS
: P
I
DT
:��
DU
: N
I
�2
00
6�
�S
C D
U: C
ontr
ol and m
inim
ize, but
difficult to e
limin
ate
, sin
ce c
lients
and e
ngin
eers
com
e u
p w
ith
new
/better
solu
tions.
Des
ign
N/A
(200
4)
Req
uire s
co
pe c
han
ges d
urin
g d
esig
n t
o b
e
accom
panie
d b
y B
udget
and S
ched
ule
appro
vals
2
00
6�
�P
I2
00
6D
GS
: P
I
DT
:��
DU
: N
I
�2
00
6�
20
06
�
Leg
en
d:
�:
Imple
mente
d�
LA
: Los A
ng
ele
s
SD
: S
an D
iego
P
I: P
art
ially im
ple
mente
d
LB
: Long B
each
SF
: S
an F
rancis
co
NI: N
o p
lans t
o im
ple
ment
at
this
tim
e
OK
: O
akla
nd
SJ:
San J
ose
TB
D: T
o b
e d
ete
rmin
ed
SC
: S
acra
mento
yyyy:
Will be im
ple
mente
d in
cale
ndar
ye
ar
"yyyy",
D
GS
: D
epart
ment
of
Genera
l S
erv
ices
� =
Priority
x f
or
imple
menta
tion
DT
: D
epart
me
nt
of T
ransport
ation
*
Refe
rence t
o P
rocess Q
uestionnaire in A
ppendix
C o
f 2
00
2 S
tud
y.
D
U: D
ep
art
me
nt
of
Utilitie
s
N
/A indic
ate
s t
his
BM
P w
as a
dded a
fter
the 2
00
2 S
tud
y.
Page 7
Chapter 1Executive Summary
TAB
LE 1
-2 —
IMP
LEM
ENTA
TIO
N O
F BM
PS (C
ON
T’D)
Pro
cess
Cate
go
ry
Re
f:*
BM
PL
AL
BO
KS
CS
DS
FS
J
No
tes
3.I.a
. D
evelo
p a
nd u
se a
sta
nd
ard
ized P
roje
ct
Deliv
ery
M
anu
al
��
20
06
�2
00
6D
GS
: ��
DT
: 2
00
5 ��
DU
:�
PI
20
06�
��
SD
: in
corp
ora
ted into
PM
tra
inin
g
manual and s
td P
rim
avera
schedule
tem
pla
te/d
escr.
D
eta
ils
availa
ble
as n
eeded.
SC
DU
: B
adly
needs u
pdating.
3.II.b.
Perf
orm
a f
orm
al V
alu
e E
ngin
eering S
tudy
for
pro
jects
larg
er
than $
1 m
illio
n
���
NI
��
�����
LA
: F
or
pro
jects
> $
10
M
LB
: O
n a
n a
s-n
eed
ed
ba
sis
S
C: A
s n
eeded, not >
$1M
. S
F: O
n a
n a
s-n
eed
ed
ba
sis
S
J: F
or
pro
jects
> $
5 m
illio
n
3.III.a
. U
se a
form
al Q
ualit
y M
anagem
ent
Sys
tem
��
20
06�
�N
I D
GS
: 2
006
DT
:�
DU
: N
I
��
20
06
��
SD
: S
om
e D
ivis
ions o
nly
Qua
lity
Ass
uran
ce /
Qua
lity
Con
trol
3.III.b
P
erf
orm
and u
se p
ost-
pro
ject
revie
ws t
o identify
le
sso
ns learn
ed
��
TB
D���
DG
S: 2
006
DT
:��
DU
:�
������
SC
DU
: F
or
sele
cte
d p
roje
cts
in
on
e-o
n-o
ne
me
etin
gs w
ith d
esig
n
and c
onstr
uction s
taff. A
lso
inclu
des feedback fro
m c
lient.
Inte
nded to p
rom
ote
candid
d
iscussio
n.
Leg
en
d:
�:
Imple
mente
d�
LA
: Los A
ng
ele
s
SD
: S
an D
iego
P
I: P
art
ially im
ple
mente
d
LB
: Long B
each
SF
: S
an F
rancis
co
NI: N
o p
lans t
o im
ple
ment
at
this
tim
e
OK
: O
akla
nd
SJ:
San J
ose
TB
D: T
o b
e d
ete
rmin
ed
SC
: S
acra
mento
yyyy:
Will be im
ple
mente
d in
cale
ndar
ye
ar
"yyyy",
D
GS
: D
epart
ment
of
Genera
l S
erv
ices
� =
Priority
x f
or
imple
menta
tion
DT
: D
epart
me
nt
of T
ransport
ation
*
Refe
rence t
o P
rocess Q
uestionnaire in A
ppendix
C o
f 2
00
2 S
tud
y.
D
U: D
ep
art
me
nt
of
Utilitie
s
N
/A indic
ate
s t
his
BM
P w
as a
dded a
fter
the 2
00
2 S
tud
y.
Page 8
Annual Report Update 2005California Multi-Agency CIP Benchmarking Study
TAB
LE 1
-2 —
IMP
LEM
ENTA
TIO
N O
F BM
PS (C
ON
T’D)
Pro
cess
Cate
go
ry
Re
f:*
BM
PL
AL
BO
KS
CS
DS
FS
J
No
tes
4.I.a
. D
ele
gate
auth
ority
to t
he C
ity E
ngin
eer/
Public
Work
s D
irecto
r or
oth
er
depart
ments
to a
ppro
ve
chan
ge o
rders
to t
he c
ontin
ge
ncy a
mou
nt
������
DG
S: N
I D
T: N
I
DU
:�
������
SF
: A
t B
ure
au level
SJ: In
div
idual C
O <
$100,0
00
SD
: In
div
idual C
O <
$200,0
00
4.I.m
. C
lassify t
ypes o
f change o
rders
�
���
��
PI
20
06��
20
06
�LA
: D
raft S
pecia
l O
rder
pre
pare
d.
SD
: O
nly
fo
r sco
pe
ch
an
ge
s v
ers
us
oth
er
types
4.II.a.
Inclu
de a
form
al D
ispute
Resolu
tion P
rocedure
in
all c
ontr
act
agre
em
ents
��
NI��
DG
S:�
DT
:�
DU
: N
I
������
4.III.a
. U
se a
team
buildin
g p
rocess f
or
pro
jects
gre
ate
r th
an $
5 m
illion
������
DG
S:�
DT
:�
DU
: N
I�
������
LB
: A
s-n
eed
ed
S
D: A
s-n
ee
de
d
SF
: A
s-n
eeded
SJ: F
or
pro
jects
> $
10
M
4.IV
.a.
Involv
e t
he C
onstr
uction M
anagem
ent
Team
prior
to c
om
ple
tion o
f desig
n
���
��
DG
S: 2006
��
DT
:��
DU
:�
������
SD
: S
om
e D
ivis
ions o
nly
N/A
(200
3)
Dele
gate
auth
ority
belo
w C
ouncil t
o m
ake c
ontr
act
aw
ard
s u
nd
er
$1 m
illio
n
����
NI�
NI
����
20
06
�N
/A(2
00
3)
Esta
blish a
pre
-qua
lification p
rocess f
or
contr
acto
rs
on larg
e,
com
ple
x p
roje
cts
��
NI�
DG
S:��
DT
: N
I
DU
:��
���
��
Co
nst
ruct
ion
M
anag
emen
t
N/A
(200
3)
Make b
id d
ocu
ments
availab
le o
nline
TB
D�
TB
DD
GS
: N
I D
T: 2
00
6
DU
: 2
006
TB
D T
BD�
LA
: N
ot enough b
ids to m
ake this
usefu
l. R
esis
tance fro
m s
maller
contr
acto
rs w
ho d
o n
ot use the
inte
rne
t to
con
duct b
usin
ess.
SD
: O
ptio
ns b
ein
g e
va
lua
ted
Leg
en
d:
�:
Imple
mente
d�
LA
: Los A
ng
ele
s
SD
: S
an D
iego
P
I: P
art
ially im
ple
mente
d
LB
: Long B
each
SF
: S
an F
rancis
co
NI: N
o p
lans t
o im
ple
ment
at
this
tim
e
OK
: O
akla
nd
SJ:
San J
ose
TB
D: T
o b
e d
ete
rmin
ed
SC
: S
acra
mento
yyyy:
Will be im
ple
me
nte
d in
cale
ndar
ye
ar
"yyyy",
D
GS
: D
epart
ment
of
Genera
l S
erv
ices
� =
Priority
x f
or
imple
menta
tion
DT
: D
epart
me
nt
of T
ransport
ation
*
Refe
rence t
o P
rocess Q
uestionnaire in A
ppendix
C o
f 2
00
2 S
tud
y.
D
U: D
ep
art
me
nt
of
Utilitie
s
N
/A indic
ate
s t
his
BM
P w
as a
dded a
fter
the 2
00
2 S
tud
y.
Page 9
Chapter 1Executive Summary
TAB
LE 1
-2 —
IMP
LEM
ENTA
TIO
N O
F BM
PS (C
ON
T’D)
Pro
cess
Cate
go
ry
Re
f:*
BM
PL
AL
BO
KS
CS
DS
FS
J
No
tes
5.I.f.
Assig
n a
client
repre
senta
tive t
o e
very
pro
ject
������
DG
S:��
DT
:20
06
DU
:��
�����
SD
: O
nly
for
larg
e p
roje
cts
5.II.a
Pro
vid
e f
orm
al tr
ain
ing f
or
Pro
ject
Managers
on a
re
gu
lar
basis
��
20
06
���
DG
S:��
DT
: 2006
DU
: N
I
������
SD
: Y
early P
M a
cadem
y, as funds
allo
w
5.III.a
. A
dopt
and u
se a
Pro
ject
Contr
ol S
yste
m o
n a
ll
pro
jects
���
�D
T:��
DU
: N
I������
SD
: P
roje
ct contr
ols
incorp
ora
ted
into
Prim
avera
schedule
N/A
(200
3)
Cre
ate
in-h
ouse p
roje
ct
managem
ent
team
for
sm
all p
roje
cts
N
I N
I �
DG
S:�
DT
: N
I D
U: N
I
�N
I��
SD
: S
om
e D
ivis
ions o
nly
S
C D
U: N
ot enough P
Ms to justify
th
is. D
on’t w
ant to
restr
ict sta
ff to
sm
all, le
ss-r
ew
ard
ing p
roje
cts
.
Pro
ject
Man
agem
ent
N/A
(200
4)
Institu
tionalize P
roje
ct
Manager
perf
orm
ance a
nd
accou
nta
bility
20
06
�2006
PI
20
06�D
GS
: 2006
DT
:��
DU
: N
I
NI
TB
D2
00
6S
D: O
nly
no
n-s
tand
ard
ize
d g
oa
ls
SC
DU
: T
here
is inte
rest but no
definite p
lans.
6.c
. In
clu
de a
sta
nd
ard
consulta
nt
contr
act
in t
he
RF
Q/R
FP
with a
sta
ndard
in
dem
nific
ation c
lause ������
��
�����
SD
: S
om
e D
ivis
ions o
nly
C
on
sult
ant
Sel
ecti
on
an
d
Use
6.e
. D
ele
gate
auth
ority
to t
he P
ublic W
ork
s D
irecto
r/C
ity
Engin
eer
to a
ppro
ve c
onsulta
nt
contr
acts
under
$25
0,0
00 w
he
n a
form
al R
FP
sele
ctio
n p
rocess is
used
NI
NI
NI
NI
����
20
06
�S
C D
U: T
hre
shold
is $
100,0
00.
6.g
. Im
ple
me
nt
and u
se a
consulta
nt
rating s
yste
m t
hat
identifies q
uality
of
consultant
perf
orm
ance
��
20
06
���
DG
S:�
DT
:NI
DU
:�
������
SJ: N
eed to in
corp
ora
te m
ore
post-
pro
ject re
vie
w.
SC
DU
: T
rack p
erf
orm
ance for
tho
se
se
lecte
d fo
r “s
up
po
rt
se
rvic
es.”
Leg
en
d:
�:
Imple
mente
d�
LA
: Los A
ng
ele
s
SD
: S
an D
iego
P
I: P
art
ially im
ple
mente
d
LB
: Long B
each
SF
: S
an F
rancis
co
NI: N
o p
lans t
o im
ple
ment
at
this
tim
e
OK
: O
akla
nd
SJ:
San J
ose
TB
D: T
o b
e d
ete
rmin
ed
SC
: S
acra
mento
yyyy:
Will be im
ple
me
nte
d in
cale
ndar
ye
ar
"yyyy",
D
GS
: D
epart
ment
of
Genera
l S
erv
ices
� =
Priority
x f
or
imple
menta
tion
DT
: D
epart
me
nt
of T
ransport
ation
*
Refe
rence t
o P
rocess Q
uestionnaire in A
ppendix
C o
f 2
00
2 S
tud
y.
D
U: D
ep
art
me
nt
of
Utilitie
s
N
/A indic
ate
s t
his
BM
P w
as a
dded a
fter
the 2
00
2 S
tud
y.
Page 10
Annual Report Update 2005California Multi-Agency CIP Benchmarking Study
ognized that regulatory changes are made with the intent of improving the quality of life for residents. The challenge for responsible agencies, the participants in this study, is to deliver capital projects compliant with the regulatory changes while keeping the cost of compliance from having an overwhelming impact on the cost of project delivery. Working together to develop effective BMPs, which reduce the impact and disruption of compliance, remains a goal of the agencies.
D. ONLINE DISCUSSION FORUM
Among the primary benefi ts accruing to the par-ticipating agencies during this ongoing Study has been the opportunity to discuss the challenges of public works project delivery with their peers. These successful open forum communications included online discussions of over thirty topics that infl uence project delivery effi ciency. The following discussion topics are summarized in Chapter 5 Online Discussion Forum:
� Construction Traffi c Control Manage-ment
� Street Construction Coordination
� Construction Cost Estimating
� Bond Measure Considerations
� Online Bid Advertising, Bid Documents, and Bidding
� Cost Impacts of LEED Certifi cation and In-House Green Design Teams
� Environmental Approvals Processes
� Consultant Selection, Management, and Fees
� As-Built Record Documents
An archive of the full discussion forum is posted on the Study website. To maintain the confi den-tiality of the communications, this archive can only be accessed by the participants.
E. CONCLUSION
The results of the performance benchmarking showed there are outstanding data gaps that should be fi lled in the medium size project range. The performance models are currently driven by a large number of very small projects and can be made more reliable for medium-sized and larger-sized projects if more data are collected.
It is also observed that the agencies do not con-tribute data equally to the various classifi cations. More reliable models will be developed as the distribution of the number of projects becomes more uniform among all classifi cations for each agency.
To further improve the R2 values, it is recom-mended that outlier analysis be performed on the whole dataset, identifying projects submitted throughout the Study phases for possible elimina-tion from analysis. Re-evaluation of P-values is also recommended. P-values indicate whether or not enough data were used for statistically-signifi -cant conclusions to be drawn from analyses.
Other observations include:
� Improvement in project delivery percent-ages due to implementation of BMPs cannot yet be directly linked. “Processes” become effective “practices” only after a learning curve and full implementation on projects. Therefore, obtaining em-pirical evidence of trends is expected to take several years.
� Generally, the relative cost of design, construction management, and overall project delivery decreases as total con-struction cost increases. This is consis-tent with what is intuitively expected.
� Median and average TCC values of projects included in the Study have de-creased slightly over time. This may be because agencies can more easily assign
Page 11
Chapter 1Executive Summary
small projects to one project classifi cation than large projects, which may include broader scopes and components. An-other reason may be that the agencies complete small projects more often than large projects and can therefore submit more of them to the Study.
� Project delivery costs as a percentage of TCC are increasing. This may be because project delivery costs as a per-centage of TCC tend to be higher on smaller projects than larger ones, so some of the increase in project delivery costs may be explained by the decreas-ing average TCC of projects discussed above. Agencies also report that as time goes on, it costs more money to meet more stringent regulatory and munici-pal requirements. Better data tracking and collection may have also resulted in higher reported project delivery costs.
� Change orders may be limited automati-cally by the project’s contingency budget, typically 10 percent of TCC.
� The design cost when consultant usage exceeded 25 percent of project delivery was generally around 6 or 7 percent higher than when there was no consul-tant usage.
� The increase in design costs associated with using consultants on smaller or more specialized projects may be justifi ed in cases where consultants offer special-ized technical expertise, the projects are complex, there is an aggressive project schedule, there are peak workload de-mands that can’t easily be met using in-house staff, or there are other resource limitations on in-house staff.

CHAPTER
Introduction2
Page 12
Seven of the largest municipalities in Cali-fornia have been working together over the last four years to study the actual cost
of delivering capital projects and how to make project delivery more effi cient. The California Multi-Agency CIP Benchmarking Study (Study) published in 2002 presented design and con-struction management cost data on 239 com-pleted projects with a total construction value of $490 million. In the Study’s Update 2003, the list grew to 453 projects with a total con-struction value of $830 million, and Update 2004 included project delivery cost data on 595 projects with a construction value of just over $1 billion. Following a revision of criteria for analysis and elimination of selected projects from the database, the Update 2005 analysis included 642 projects with a total construction value of $993 million.
The analysis of actual project data gives mu-nicipal decision-makers a valuable tool to more accurately anticipate the true total cost of public projects. The study of the practices used in deliv-ering projects and determining the effectiveness of those practices is valuable in reducing project delivery costs. Best Management Practices (BMPs) identifi ed as most effective are targeted for implementation. The implementation of new BMPs, which will reduce project delivery cost, continues to be an important goal for the participating agencies.
The Study is intended to be a continuing effort. In future annual updates, refi nements and improvements of the conclusions and recom-mendations will be made as additional project data are collected.
A. BACKGROUND
In October 2001, the City of Los Angeles, De-partment of Public Works, Bureau of Engineer-ing initiated the Study with several of the largest cities in California. These cities joined together to form the Project Team for the Study. After working together for four years, this team agrees that they benefi t from collaborating and pooling their knowledge and experience regarding project delivery.
The Study initially involved six agencies, with a seventh (City of Oakland) joining the team in 2003. The participating agencies currently include:
� City of Long Beach - Department of Public Works
� City of Los Angeles, Department of Public Works - Bureau of Engineering
� City of Oakland - Public Works Agency
� City of Sacramento - Department of General Services, Department of Trans-portation, and Department of Utilities
� City of San Diego - Engineering & Capi-tal Projects
� City and County of San Francisco, De-partment of Public Works - Bureau of Engineering, Bureau of Architecture, and Bureau of Construction Management
� City of San Jose, Department of Public Works - City Manager’s Offi ce
Table 2-1 summarizes some of general charac-teristics of the participating agencies and/or of specifi c departments.
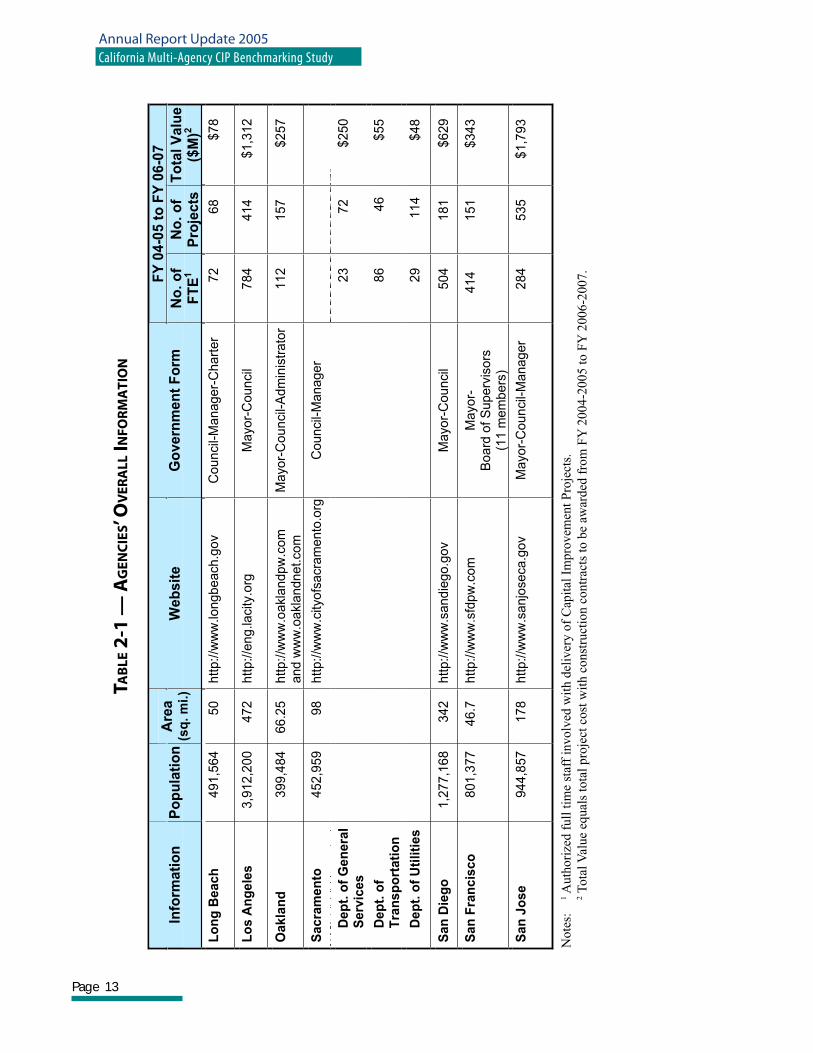
Page 13
Annual Report Update 2005California Multi-Agency CIP Benchmarking Study
TAB
LE 2
-1 —
AG
ENC
IES’
OV
ERA
LL IN
FOR
MA
TIO
N
FY
04-0
5 t
o F
Y 0
6-0
7
Info
rma
tio
n
Po
pu
lati
on
Are
a(s
q.
mi.
)W
eb
sit
eG
ov
ern
me
nt
Fo
rm
No
. o
f F
TE
1N
o.
of
Pro
jects
To
tal
Va
lue
($
M)2
Lo
ng
Be
ac
h
49
1,5
64
5
0
htt
p:/
/ww
w.lo
ng
be
ach
.go
vC
ou
nci
l-M
an
ag
er-
Ch
art
er
72
6
8
$7
8
Lo
s A
ng
ele
s
3,9
12
,20
0
47
2
htt
p:/
/en
g.la
city
.org
Ma
yor-
Co
un
cil
78
4
41
4
$1
,31
2
Oa
kla
nd
39
9,4
84
6
6.2
5
htt
p:/
/ww
w.o
akl
an
dp
w.c
om
a
nd
ww
w.o
akl
an
dn
et.
com
Ma
yor-
Co
un
cil-
Ad
min
istr
ato
r1
12
1
57
$
25
7
Sa
cra
me
nto
De
pt.
of
Ge
ne
ral
Se
rvic
es
23
7
2
$2
50
De
pt.
of
Tra
ns
po
rta
tio
n8
6
46
$
55
De
pt.
of
Uti
liti
es
45
2,9
59
9
8
htt
p:/
/ww
w.c
ityo
fsa
cra
me
nto
.org
Co
un
cil-
Ma
na
ge
r
29
1
14
$
48
Sa
n D
ieg
o
1,2
77
,16
8
34
2
htt
p:/
/ww
w.s
an
die
go
.go
vM
ayo
r-C
ou
nci
l 5
04
1
81
$
62
9
Sa
n F
ran
cis
co
8
01
,37
7
46
.7
htt
p:/
/ww
w.s
fdp
w.c
om
Ma
yor-
Bo
ard
of
Su
pe
rvis
ors
(11
me
mb
ers
)
41
4
15
1
$3
43
Sa
n J
os
e
94
4,8
57
1
78
h
ttp
://w
ww
.sa
njo
seca
.go
vM
ayo
r-C
ou
nci
l-M
an
ag
er
28
4
53
5
$1
,79
3
Note
s:
1 A
uth
ori
zed f
ull
tim
e st
aff
involv
ed w
ith d
eliv
ery o
f C
apit
al I
mpro
vem
ent
Pro
ject
s.
2 T
ota
l V
alue
equal
s to
tal
pro
ject
cost
wit
h c
onst
ruct
ion c
ontr
acts
to b
e aw
arded
fro
m F
Y 2
004-2
005 t
o F
Y 2
006-2
007.
Page 14
Chapter 2Introduction
In 2002, upon initiation of the Study, it was agreed that published data provided by Study participants should remain anonymous in or-der to create a positive, non-competitive team environment, conducive to meeting the Study’s goals. Therefore, no projects are identifi ed by name in this document or in the project database, and agencies are referred to by an alias (such as “Agency A”) when anonymity is appropriate.
B. BENEFITS OF PARTICIPATION
The sponsoring agencies have been very sup-portive of the Study efforts over the years. The Study is possible only because the agencies believe they are benefi ting from their continued partici-pation. The benefi ts have been experienced by the agencies in a variety of ways, including the following:
� Los Angeles believes staff is more focused on delivering projects on time and within budget. The Study report was also used to support project planning and to dem-onstrate efforts being made to improve project delivery performance.
� Long Beach has benefi ted from participa-tion through the use of project delivery data to negotiate agreements with the Long Beach Redevelopment Agency. Several BMPs have been implemented on the basis that they are commonly used by the other participating agencies to improve project delivery effi ciency.
� According to San Francisco, the greatest benefi t is the ability to share information between agencies doing similar work. The agencies learn from each other and use the online discussion forum and the quarterly meetings as a sounding board for ideas.
� San Diego’s chief benefi t is having data to support expectations of project delivery
costs. It has allowed San Diego to dem-onstrate that its performance falls within the range of project delivery achieved by other cities in California. In addition, collaboration through the online discus-sion forum and the quarterly meetings on BMPs has helped them improve their project delivery processes.
� Sacramento has benefi ted by using data to establish business performance bench-marks and BMPs. Having a forum to discuss practices and ideas relating to project delivery is invaluable with respect to gaining from the experience of others, avoiding pitfalls, expanding an agency’s knowledge base, and developing long-term goals. Validation of its current practices and access to project delivery data for comparison is also of signifi cant value. The study has helped Sacramento stay focused on improvements that are contemplated but may otherwise have been ignored.
� Oakland says the benefi ts of participating in the Study have exceeded its expecta-tions. The opportunity to freely discuss challenges and successes has been both enlightening and empowering. The collected data have allowed staff to ob-jectively measure their capital project delivery effi ciency. Perhaps most impor-tantly, the efforts to develop BMPs have helped staff make improvements where needed.
� As a result of participation, San Jose has a greater awareness of how other cities operate and enjoys the opportunity to seek information and advice from other participants, as well as gaining infor-mation through the discussion forum. Reporting project delivery costs for the Study has prompted a more critical look at its budgeting and accounting proce-dures.
Page 15
Annual Report Update 2005California Multi-Agency CIP Benchmarking Study
C. STUDY GOALS
The Study Methodology is described in detail in the 2002 report, and modifi cations to that method have been documented in subsequent Study reports. In Update 2005, the agencies made progress on several goals:
1. Improve the quality of the perfor-mance data and the functionality of the database. The agencies continued their efforts to capture complete project delivery costs for the database. Perfor-mance curves were developed for projects falling into 14 classifi cations among 4 project types. Regressions were done for design, construction management, and overall project delivery costs as a function of total construction costs. The Performance Questionnaire was modi-fi ed to acquire additional data. Agencies verifi ed and corrected randomly-selected project data, and made presentations on their data collection process. A statistical outlier analysis was also performed.
2. Track the implementation of BMPs by each participating agency. This information will be used in linking these practices to improvement of capital proj-ect performance over time.
3. Continue sharing information with one another through the online discus-sion forum. The participating agencies use an email list to pose questions or request information from one another. The agencies agreed that one of the primary benefi ts of participation in the Study is the opportunity to discuss issues and practices with one another.
4. Classify change orders. To help the agencies better understand what drives change orders and to facilitate change order analysis in the future, the agencies defi ned three change order categories to be used: changed conditions, changes to bid documents, and Client-initiated changes. All null (blank) values were also corrected in the database.
5. Perform special studies on topics of interest. This year’s special study was of the relationship between consultant usage and project delivery performance. The participants are generally fi nding that to deliver growing capital programs, work is contracted to consultants more frequently. Because of this, it is impor-tant to understand if and how project delivery costs are affected, and to iden-tify and implement BMPs to help make consultant usage more effective.

CHAPTER Performance Benchmarking3
Page 16
Performance benchmarking involves col-lecting documented project costs and plotting the component costs of project
delivery against the total construction cost. All of the actual project costs are collected by the agencies using a Performance Questionnaire created in Microsoft Excel®. Data is then com-piled from the questionnaire in Excel® using a Visual Basic for Applications (VBA) code and transferred into the database, where the data is reviewed and vetted. The 2002 Study report in-cludes a comprehensive listing of project delivery cost components and a copy of the Performance Questionnaire can be found in the Update 2004 report.
A. STUDY CRITERIA
The following criteria applied to Update 2005 performance benchmarking analyses:
� Total Construction Costs – All projects included in the analyses have a total construction cost exceeding $100,000. The Total Construction Cost (TCC) is the sum of the awarded construction contract, change orders, utility reloca-tion, and construction by agency forces. TCC does not include, land acquisition, environmental monitoring and mitiga-tion, design, or construction manage-ment costs.
� Completion Date – Projects included in the Study analyses were completed on or after January 1, 1999. Projects with earlier completion dates were kept in the database, but excluded from the analyses.
� Outlier Elimination – Statistical outli-ers were identifi ed using the method described in the Update 2004 report. All project data were evaluated against the full database. Potential outliers were then eliminated from the analysis only if the respective agency confi rmed that the project delivery process was not representative of the procedures normally used to deliver projects. All outliers were kept in the database, but excluded from the analyses.
� Project Delivery Method – All projects in this Study were delivered through the traditional Design-Bid-Build delivery method. Projects delivered using other methods are not included in this Study at this time.
� Change Order Classifi cation – In order to perform meaningful change order analyses in the future, the agencies agreed to classify change order costs into one of three classifi cations:
1. Changed/Unforeseen Conditions
2. Changes to Bid Documents
3. Client-Initiated Changes
B. DATA COLLECTION AND CONFIRMATION
The success of the Study is dependent upon ac-curate data coming from each agency on each project. Continuous emphasis was placed on the importance of accurate and complete data collection.
Page 17
Annual Report Update 2005California Multi-Agency CIP Benchmarking Study
Agencies committed to submit complete project delivery data to capture the total construction costs and project delivery costs of projects. Project delivery costs are defi ned as the sum of all agency, internal client, and consultant costs associated with the planning, design, bid, award, construction management, and closeout activities on projects.
Each agency was asked to present an explanation of its data collection method to the rest of the agencies, demonstrating how values entered into the Performance Questionnaire were obtained. The goal of these presentations was to confi rm that the agencies were completing the question-naires with comparable, complete, and accurate values.
In addition, each agency was asked to confi rm the data submitted for 5 randomly-selected projects submitted in earlier project phases. The confi rmations were collected, corrections, if required, were made, and the results of the confi rmation were shared with the agencies. The overall impact of the revisions upon the analyses was inconsequential.
These exercises resulted in increased attention to the data sources and the collection methods, which are both crucial to the credibility of the study.
C. PERFORMANCE DATA DATABASE
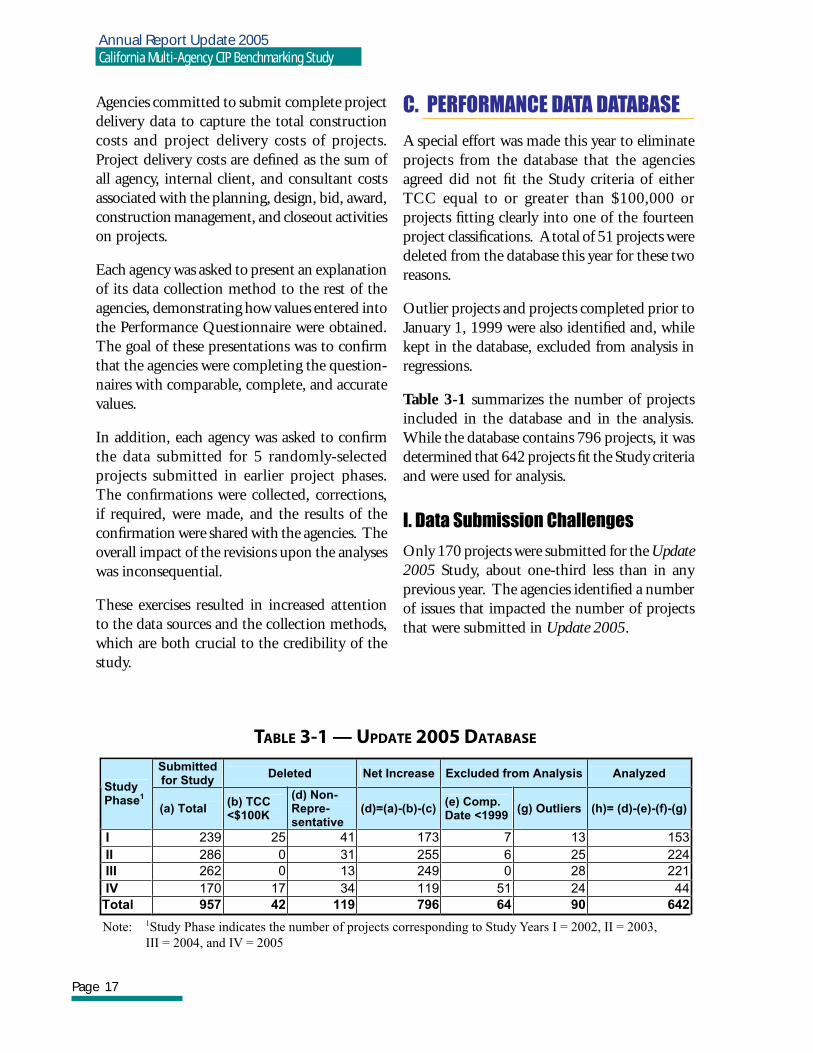
A special effort was made this year to eliminate projects from the database that the agencies agreed did not fi t the Study criteria of either TCC equal to or greater than $100,000 or projects fi tting clearly into one of the fourteen project classifi cations. A total of 51 projects were deleted from the database this year for these two reasons.
Outlier projects and projects completed prior to January 1, 1999 were also identifi ed and, while kept in the database, excluded from analysis in regressions.
Table 3-1 summarizes the number of projects included in the database and in the analysis. While the database contains 796 projects, it was determined that 642 projects fi t the Study criteria and were used for analysis.
I. Data Submission Challenges
Only 170 projects were submitted for the Update 2005 Study, about one-third less than in any previous year. The agencies identifi ed a number of issues that impacted the number of projects that were submitted in Update 2005.
TABLE 3-1 — UPDATE 2005 DATABASE
Submittedfor Study
Deleted Net Increase Excluded from Analysis Analyzed Study Phase1
(a) Total (b) TCC <$100K
(d) Non-Repre-sentative
(d)=(a)-(b)-(c)(e) Comp.Date <1999
(g) Outliers (h)= (d)-(e)-(f)-(g)
I 239 25 41 173 7 13 153
II 286 0 31 255 6 25 224
III 262 0 13 249 0 28 221
IV 170 17 34 119 51 24 44
Total 957 42 119 796 64 90 642
Note: 1Study Phase indicates the number of projects corresponding to Study Years I = 2002, II = 2003,
III = 2004, and IV = 2005
Page 18
Chapter 3Performance Benchmarking
Some common issues included:
� Capital funding shortfalls reducing the number of projects that could be built
� Budget constraints affecting the avail-ability of personnel to perform project closeout and produce reports
� Heavy workloads causing diffi culty to meet data submission schedules
The agencies acknowledged that it is vital to the success of the Study to continue increasing the size of the data set as much as possible, thereby increasing the confi dence, consistency, and reli-ability of results. In the Study 2002 report, the number of projects required to achieve statisti-cally signifi cant results was recommended to be at least 1,000 distributed evenly among clas-sifi cations and ranges of total construction cost. The agencies will continue to work toward that objective.
II. Projects Distribution Matrix
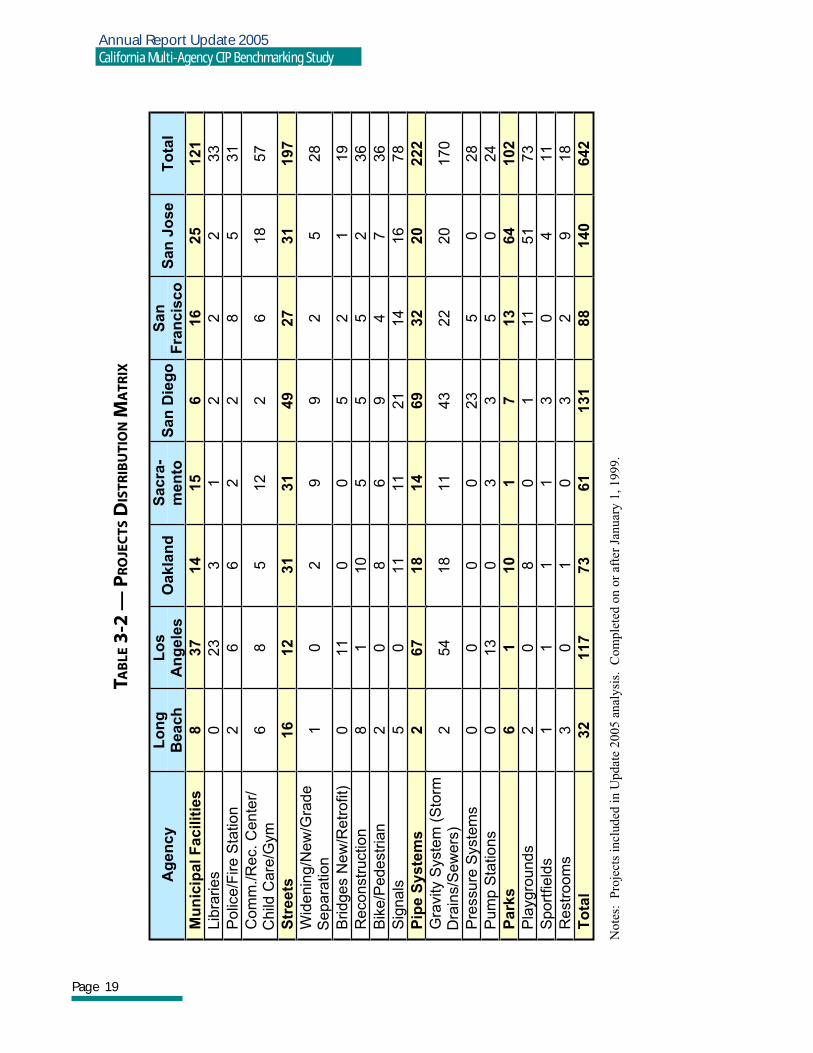
There are 4 project types (Municipal Facilities, Streets, Pipe Systems, and Parks) and 14 project classifi cations included in this Study. Table 3-2 summarizes the distribution of projects included in the Update 2005 analysis.
The number of projects in the database for Mu-nicipal Facilities showed a slight net decrease from Update 2004 due to the database cleanup efforts. The number of Streets and Pipe Systems projects increased the most, indicating that municipalities are probably focused more on building these types of critical infrastructure in the face of growing populations and aging in-frastructure. The net increase in the number of Parks projects since last year’s Study was slight.
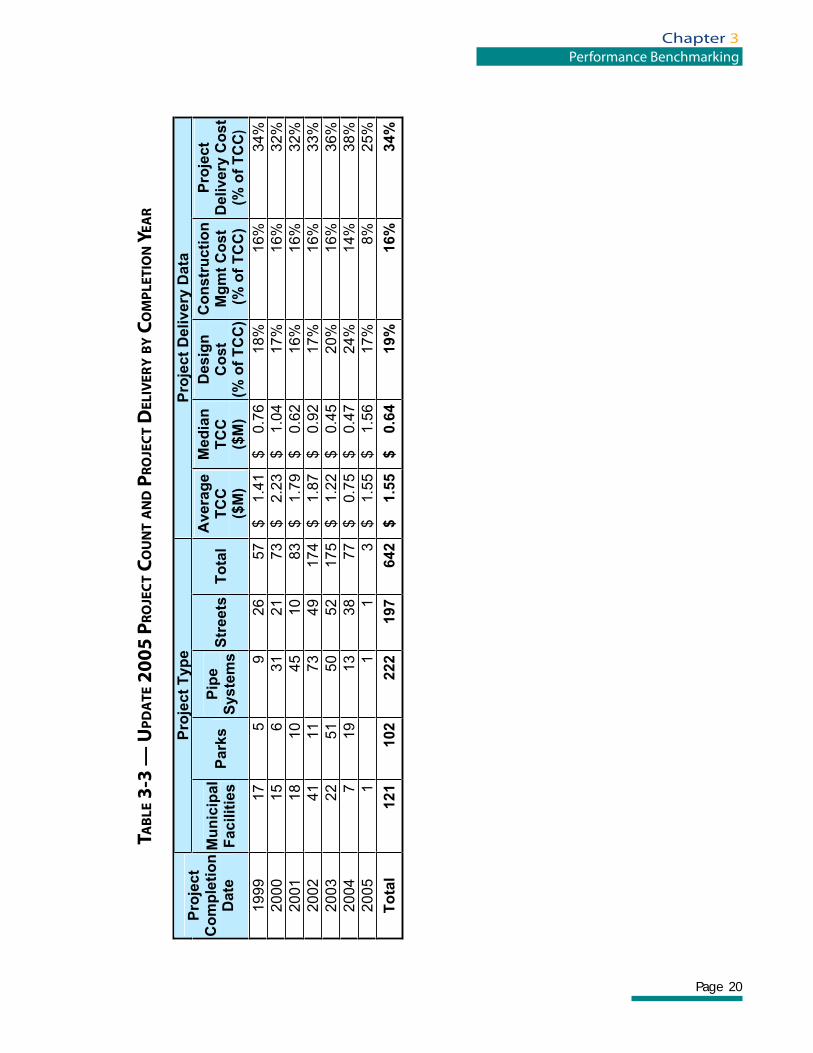
Table 3-3 summarizes characteristics of the 642 projects included in the Update 2005 analysis by project completion year, and shows trends in the average TCC values, median TCC values,
design costs, construction management costs, and overall project delivery costs.
The agencies have reported that the sizes of indi-vidual projects are growing larger, yet the median TCCs of projects in this Study have been getting smaller over time. Between project completion dates from 1999 to 2004, the average and median TCC of projects in the Study decrease, as shown in Table 3-3. Part of the decrease may be because the agencies fi nd it easier to assign small projects to one project classifi cation than large projects, since large projects tend to have broader scopes and include more components. Another reason may be that the agencies complete small projects more often than large projects and can therefore submit more of them to the Study. This is rea-sonably supported by the fact that the median TCC of projects in the Study completed between 1999 and 2004 is below the average TCC. The skew indicates that more projects have a TCC below the average than above the average. As larger projects are completed and submitted to the Study, the gap between the median TCC and average TCC will close.
Project delivery costs as a percentage of TCC have increased with project completion year, also shown in Table 3-3. Project delivery costs as a percentage of TCC tend to be higher on smaller projects than larger ones, so some of the increase in project delivery costs may be explained by the decreasing average TCC of projects as discussed above. Agencies also report that as time goes on, it costs more to meet increasingly stringent regu-latory and municipal requirements. Better data tracking and collection may have also resulted in higher reported project delivery costs.
Table 3-4 summarizes the average cost of design, construction management, and project delivery costs by agency, along with the use of in-house staff versus consultants for project delivery, for projects included in the Update 2005 analysis.
Page 19
Annual Report Update 2005California Multi-Agency CIP Benchmarking Study
Note
s: P
roje
cts
incl
uded
in U
pdat
e 2005 a
nal
ysi
s. C
om
ple
ted o
n o
r af
ter
Januar
y 1
, 1999.
Ag
en
cy
Lo
ng
Beach
Lo
sA
ng
ele
sO
akla
nd
Sacra
-m
en
toS
an
Die
go
San
Fra
ncis
co
San
Jo
se
To
tal
Mu
nic
ipa
l F
ac
ilit
ies
8
37
14
15
616
25
121
Lib
raries
0
23
3
1
2
2
2
33
Polic
e/F
ire S
tation
2
6
6
2
2
8
5
31
Co
mm
./R
ec.
Ce
nte
r/
C
hild
Ca
re/G
ym
6
8
5
12
2
6
18
57
Str
eets
16
12
31
31
49
27
31
197
Wid
enin
g/N
ew
/Gra
de
S
epara
tion
1
0
2
9
9
2
5
28
Bridges N
ew
/Retr
ofit)
0
11
0
0
5
2
1
19
Reconstr
uction
8
1
10
5
5
5
2
36
Bik
e/P
edestr
ian
2
0
8
6
9
4
7
36
Sig
nals
5
0
11
11
21
14
16
78
Pip
e S
yste
ms
267
18
14
69
32
20
222
Gra
vity S
yst
em
(S
torm
Dra
ins/S
ew
ers
) 2
54
18
11
43
22
20
170
Pre
ssure
Syste
ms
0
0
0
0
23
5
0
28
Pum
p S
tations
0
13
0
3
3
5
0
24
Park
s6
110
17
13
64
102
Pla
ygro
unds
2
0
8
0
1
11
51
73
Sport
field
s
1
1
1
1
3
0
4
11
Restr
oom
s
3
0
1
0
3
2
9
18
To
tal
32
117
73
61
131
88
140
642
TAB
LE 3
-2 —
PR
OJE
CTS
DIS
TRIB
UTI
ON
MA
TRIX
Page 20
Chapter 3Performance Benchmarking
TAB
LE 3
-3 —
UP
DA
TE 2
005
PRO
JEC
T C
OU
NT
AN
D P
RO
JEC
T D
ELIV
ERY
BY
CO
MP
LETI
ON
YEA
R
Pro
jec
t T
yp
e
Pro
jec
t D
eli
ve
ry D
ata
P
roje
ct
Co
mp
leti
on
Da
teM
un
icip
al
Fa
cil
itie
s
Park
sP
ipe
Syste
ms
Str
ee
tsT
ota
lA
vera
ge
TC
C($
M)
Med
ian
TC
C($
M)
Desig
nC
ost
(% o
f T
CC
)
Co
nstr
ucti
on
Mg
mt
Co
st
(%
of
TC
C)
Pro
ject
Delivery
Co
st
(% o
f T
CC
)1999
17
5
926
57
$
1.4
1
$
0.7
6
18%
16%
34%
2000
15
6
31
21
73
$
2.2
3
$
1.0
4
17%
16%
32%
2001
18
10
45
10
83
$
1.7
9
$
0.6
2
16%
16%
32%
2002
41
11
73
49
174
$
1.8
7
$
0.9
2
17%
16%
33%
2003
22
51
50
52
175
$
1.2
2
$
0.4
5
20%
16%
36%
2004
7
19
13
38
77
$
0.7
5
$
0.4
7
24%
14%
38%
2005
1
1
13
$
1.5
5
$
1.5
6
17%
8%
25%
To
tal
121
102
222
197
642
$
1.5
5
$
0.6
4
19
%16
%34
%

Page 21
Annual Report Update 2005California Multi-Agency CIP Benchmarking Study
Note
s:
1 I
n-H
ouse
and C
onsu
ltan
t co
sts
are
calc
ula
ted a
s per
centa
ges
of
tota
l ag
ency
Des
ign, C
M (
Const
ruct
ion M
anag
emen
t), an
d P
D (
Pro
ject
Del
iver
y)
cost
s.
2 T
CC
(T
ota
l C
onst
ruct
ion C
ost
) is
th
e su
m o
f co
nst
ruct
ion c
ontr
act
awar
d, ch
ange
ord
ers,
uti
lity
rel
oca
tion c
ost
, an
d c
ity f
orc
es c
onst
ruct
ion c
ost
.
3 D
esig
n, C
M, an
d P
D c
ost
s as
per
cen
tages
of
TC
C a
re u
nw
eighte
d, ar
ithm
etic
aver
ages
of
pro
ject
s by a
gen
cy.
TAB
LE 3
-4 —
UP
DA
TE 2
005
PRO
JEC
T D
ELIV
ERY
PER
FOR
MA
NC
E B
Y A
GEN
CY
D E
S I G
NC
ON
ST
RU
CT
ION
MA
NA
GE
ME
NT
P
RO
JE
CT
DE
LIV
ER
Y
In-H
ou
se
Co
ns
ult
an
tsIn
-Ho
us
eC
on
su
lta
nts
In-H
ou
se
Co
ns
ult
an
tsA
GE
NC
Y
($)
% o
f D
es
ign
1($
)%
of
De
sig
n
To
tal
% o
f T
CC
2,3
($)
% o
f C
M($
)%
of
CM
To
tal
% o
f T
CC
($)
% o
f P
D($
)%
of
PD
To
tal
% o
f T
CC
Ag
en
cy A
19,22
4,452
78
.0%
5,410
,475
22.0%
21
.6%
16,95
5,429
97
.8%
384,8
59
2.2%
15
.3%
36,17
9,881
86
.2%
5,795
,334
13.8%
36
.8%
Ag
en
cy B
6,146
,123
51.0%
5,9
13,66
7 49
.0%
17.8%
5,9
57,25
6 66
.7%
2,975
,625
33.3%
12
.0%
12,10
3,379
57
.7%
8,889
,292
42.3%
29
.8%
Ag
en
cy C
15,96
4,212
81
.1%
3,727
,966
18.9%
14
.6%
16,10
8,000
96
.4%
602,9
84
3.6%
15
.2%
32,07
2,212
88
.1%
4,330
,950
11.9%
29
.8%
Ag
en
cy D
33,57
6,726
64
.0%
18,87
0,304
36
.0%
17.5%
46
,353,5
42
93.2%
3,3
77,65
1 6.8
%
17.6%
79
,930,2
68
78.2%
22
,247,9
55
21.8%
35
.0%
Ag
en
cy E
2,117
,850
41.8%
2,9
44,01
0 58
.2%
19.9%
2,2
40,06
6 83
.3%
448,2
34
16.7%
15
.4%
4,357
,916
56.2%
3,3
92,24
4 43
.8%
35.3%
Ag
en
cy F
14,14
4,295
69
.8%
6,106
,712
30.2%
20
.1%
14,53
8,094
95
.1%
743,4
65
4.9%
18
.3%
28,68
2,389
80
.7%
6,850
,177
19.3%
38
.5%
Ag
en
cy G
9,395
,025
63.3%
5,4
43,27
4 36
.7%
17.0%
8,7
74,90
3 99
.0%
91,94
4 1.0
%
13.4%
18
,169,9
28
76.6%
5,5
35,21
8 23
.4%
30.5%
OV
ER
AL
L10
0,568
,683
67.5%
48
,416,4
08
32%
18
.7%
110,9
27,29
0 92
.8%
8,62
4,762
7.2
%
15.8%
21
1,495
,973
78.8%
57
,041,1
70
21.2%
34
.4%
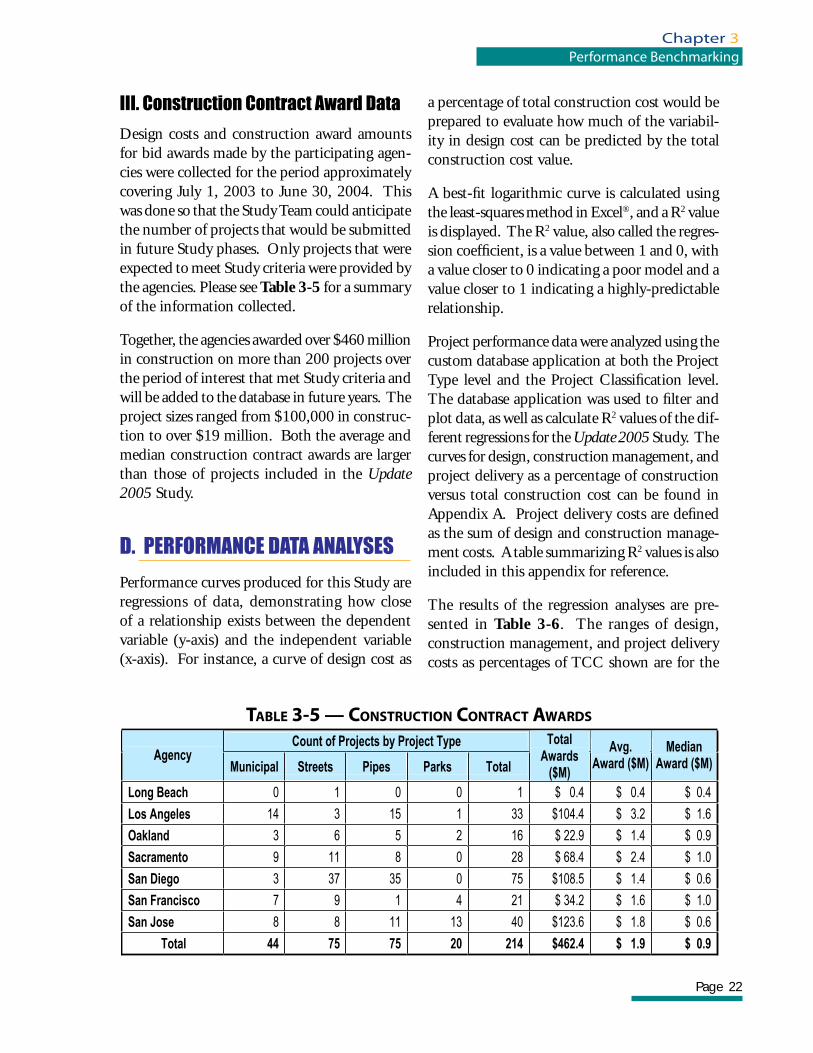
Page 22
Chapter 3Performance Benchmarking
III. Construction Contract Award Data
Design costs and construction award amounts for bid awards made by the participating agen-cies were collected for the period approximately covering July 1, 2003 to June 30, 2004. This was done so that the Study Team could anticipate the number of projects that would be submitted in future Study phases. Only projects that were expected to meet Study criteria were provided by the agencies. Please see Table 3-5 for a summary of the information collected.
Together, the agencies awarded over $460 million in construction on more than 200 projects over the period of interest that met Study criteria and will be added to the database in future years. The project sizes ranged from $100,000 in construc-tion to over $19 million. Both the average and median construction contract awards are larger than those of projects included in the Update 2005 Study.
D. PERFORMANCE DATA ANALYSES
Performance curves produced for this Study are regressions of data, demonstrating how close of a relationship exists between the dependent variable (y-axis) and the independent variable (x-axis). For instance, a curve of design cost as
a percentage of total construction cost would be prepared to evaluate how much of the variabil-ity in design cost can be predicted by the total construction cost value.
A best-fi t logarithmic curve is calculated using the least-squares method in Excel®, and a R2 value is displayed. The R2 value, also called the regres-sion coeffi cient, is a value between 1 and 0, with a value closer to 0 indicating a poor model and a value closer to 1 indicating a highly-predictable relationship.
Project performance data were analyzed using the custom database application at both the Project Type level and the Project Classifi cation level. The database application was used to fi lter and plot data, as well as calculate R2 values of the dif-ferent regressions for the Update 2005 Study. The curves for design, construction management, and project delivery as a percentage of construction versus total construction cost can be found in Appendix A. Project delivery costs are defi ned as the sum of design and construction manage-ment costs. A table summarizing R2 values is also included in this appendix for reference.
The results of the regression analyses are pre-sented in Table 3-6. The ranges of design, construction management, and project delivery costs as percentages of TCC shown are for the
TABLE 3-5 — CONSTRUCTION CONTRACT AWARDS
Count of Projects by Project TypeAgency
Municipal Streets Pipes Parks Total
TotalAwards
($M)
Avg.Award ($M)
MedianAward ($M)
Long Beach 0 1 0 0 1 $ 0.4 $ 0.4 $ 0.4
Los Angeles 14 3 15 1 33 $104.4 $ 3.2 $ 1.6
Oakland 3 6 5 2 16 $ 22.9 $ 1.4 $ 0.9
Sacramento 9 11 8 0 28 $ 68.4 $ 2.4 $ 1.0
San Diego 3 37 35 0 75 $108.5 $ 1.4 $ 0.6
San Francisco 7 9 1 4 21 $ 34.2 $ 1.6 $ 1.0
San Jose 8 8 11 13 40 $123.6 $ 1.8 $ 0.6
Total 44 75 75 20 214 $462.4 $ 1.9 $ 0.9
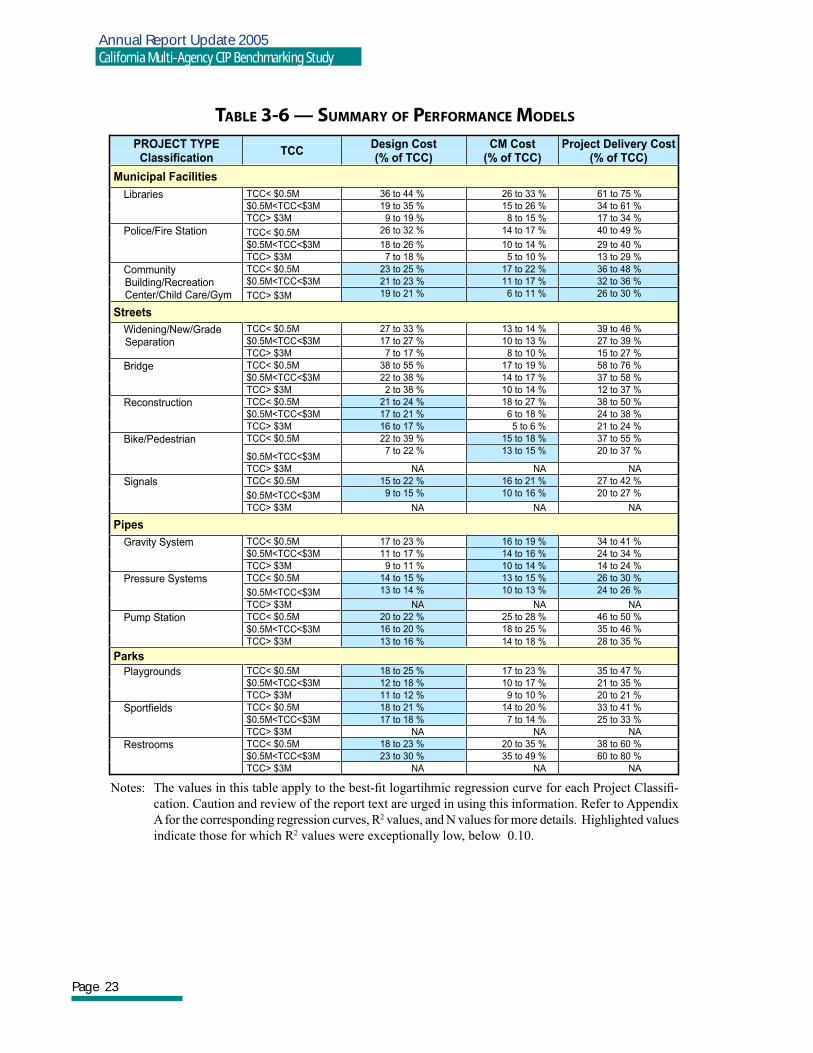
Page 23
Annual Report Update 2005California Multi-Agency CIP Benchmarking Study
TABLE 3-6 — SUMMARY OF PERFORMANCE MODELS
PROJECT TYPE Classification
TCCDesign Cost(% of TCC)
CM Cost(% of TCC)
Project Delivery Cost (% of TCC)
Municipal Facilities
TCC< $0.5M 36 to 44 % 26 to 33 % 61 to 75 % $0.5M<TCC<$3M 19 to 35 % 15 to 26 % 34 to 61 %
Libraries
TCC> $3M 9 to 19 % 8 to 15 % 17 to 34 %
TCC< $0.5M 26 to 32 % 14 to 17 % 40 to 49 %
$0.5M<TCC<$3M 18 to 26 % 10 to 14 % 29 to 40 %
Police/Fire Station
TCC> $3M 7 to 18 % 5 to 10 % 13 to 29 % TCC< $0.5M 23 to 25 % 17 to 22 % 36 to 48 % $0.5M<TCC<$3M 21 to 23 % 11 to 17 % 32 to 36 %
Community Building/Recreation Center/Child Care/Gym TCC> $3M 19 to 21 % 6 to 11 % 26 to 30 %
Streets
TCC< $0.5M 27 to 33 % 13 to 14 % 39 to 46 % $0.5M<TCC<$3M 17 to 27 % 10 to 13 % 27 to 39 %
Widening/New/Grade Separation
TCC> $3M 7 to 17 % 8 to 10 % 15 to 27 % TCC< $0.5M 38 to 55 % 17 to 19 % 58 to 76 % $0.5M<TCC<$3M 22 to 38 % 14 to 17 % 37 to 58 %
Bridge
TCC> $3M 2 to 38 % 10 to 14 % 12 to 37 % TCC< $0.5M 21 to 24 % 18 to 27 % 38 to 50 % $0.5M<TCC<$3M 17 to 21 % 6 to 18 % 24 to 38 %
Reconstruction
TCC> $3M 16 to 17 % 5 to 6 % 21 to 24 % TCC< $0.5M 22 to 39 % 15 to 18 % 37 to 55 %
$0.5M<TCC<$3M 7 to 22 % 13 to 15 % 20 to 37 %
Bike/Pedestrian
TCC> $3M NA NA NA TCC< $0.5M 15 to 22 % 16 to 21 % 27 to 42 %
$0.5M<TCC<$3M 9 to 15 % 10 to 16 % 20 to 27 % Signals
TCC> $3M NA NA NA
Pipes
TCC< $0.5M 17 to 23 % 16 to 19 % 34 to 41 % $0.5M<TCC<$3M 11 to 17 % 14 to 16 % 24 to 34 %
Gravity System
TCC> $3M 9 to 11 % 10 to 14 % 14 to 24 % TCC< $0.5M 14 to 15 % 13 to 15 % 26 to 30 %
$0.5M<TCC<$3M 13 to 14 % 10 to 13 % 24 to 26 % Pressure Systems
TCC> $3M NA NA NA TCC< $0.5M 20 to 22 % 25 to 28 % 46 to 50 %
$0.5M<TCC<$3M 16 to 20 % 18 to 25 % 35 to 46 % Pump Station
TCC> $3M 13 to 16 % 14 to 18 % 28 to 35 %
ParksTCC< $0.5M 18 to 25 % 17 to 23 % 35 to 47 % $0.5M<TCC<$3M 12 to 18 % 10 to 17 % 21 to 35 %
Playgrounds
TCC> $3M 11 to 12 % 9 to 10 % 20 to 21 % TCC< $0.5M 18 to 21 % 14 to 20 % 33 to 41 % $0.5M<TCC<$3M 17 to 18 % 7 to 14 % 25 to 33 %
Sportfields
TCC> $3M NA NA NA TCC< $0.5M 18 to 23 % 20 to 35 % 38 to 60 % $0.5M<TCC<$3M 23 to 30 % 35 to 49 % 60 to 80 %
Restrooms
TCC> $3M NA NA NA
Notes: The values in this table apply to the best-fi t logartihmic regression curve for each Project Classifi -
cation. Caution and review of the report text are urged in using this information. Refer to Appendix
A for the corresponding regression curves, R2 values, and N values for more details. Highlighted values
indicate those for which R2 values were exceptionally low, below 0.10.
Page 24
Chapter 3Performance Benchmarking
of a project and thus allow for the design effort to be more focused. This would lead to more consistent performance and therefore higher R2 values. They also observed that Construction Management exhibited higher variability in rela-tive cost than Design for the same project types and classifi cations
Regressions for the Restrooms classification showed a direct relationship between the depen-dent variable and TCC. That is, as the TCC increased, the average of the dependent variable also increased. This is true of the regressions of design, construction management, and project delivery. The agencies commented that more expensive restrooms tend to require more com-plex features and elaborate architectural design elements, explaining some of the trend. Also, the relatively low number of data points overall and clustering of nearly all data points in the range of less than $500,000 TCC may contribute. One data point that is relatively high in both project delivery percentage and TCC skews the best-fi t curve to a positive slope. Without that data point included, the best-fi t curve is relatively fl at.
Based upon the results of an evaluation performed in the Update 2004 report, the Study Team agreed that normalization of the cost data for differences in overhead rates was not necessary at this time. Please see the Update 2004 report for more details on the overhead rate analysis and Appendix B of this report for a summary of overhead rates.
E. CHANGE ORDER CLASSIFICATION
The agencies discussed the benefi t of classifying change orders and the necessity of clear defi ni-tions of change order classifi cations. Some of the participating agencies are beginning to imple-ment change order classifi cation as a BMP (see Chapter 4 Best Management Practices) as well as to facilitate data submission for this Study. Los Angeles presented a draft of its Special Order, re-quiring change order classifi cation in the Bureau
best-fi t logarithmic regression curve. Because the correlation coeffi cients and, in many cases, the number of relevant data points are quite low, the reader is cautioned that this table is to be used as a reference and not for prediction of performance. Readers are urged to review the curves in Appendix A in conjunction with using this table.
The curves display the upper bound of the 50 percent confi dence interval for all of the data points shown. The confi dence interval indicates the level of certainty in a data set, and how likely it is that a random sample from the data set will fall within the interval. The wider the distance between the upper and lower bounds of a con-fi dence interval, the less certainty in the model and greater the need to collect more data before drawing conclusions from the data set.
The best-fi t curve provides an average of the projects that can be used as a starting point for budgeting an entire program of projects, or for comparison of performance among the agen-cies. Caution and use of professional judgment is required to use the best-fi t curve to budget an individual project.
The results of the analysis show that the R2 val-ues for the data are improving somewhat with continued additions of data to the database and repetition of the outlier analysis.
The shape of most of the best-fi t curves is con-sistent with what is intuitively expected. The dependent variable (i.e., design, construction management, and project delivery) has higher average values and greater scatter at the low values of TCC. This decrease in both average value and variability as TCC increases, exhibits an inverse relationship.
The agencies theorized that one of the reasons R2 values varied by project type and classifi cation is that Pipe and Municipal Facilities projects, for instance, were better-defi ned at the beginning
Page 25
Annual Report Update 2005California Multi-Agency CIP Benchmarking Study
of Engineering, to the agencies. The defi nitions used in this Special Order were proposed for use by the agencies in classifying change orders for this Study.
The agencies agreed to classify change orders into the three categories in preparation for future analyses as follows:
1. Changed/Unforeseen Conditions
2. Changes to Bid Documents
3. Client Initiated Changes
I. Changed/Unforseen Conditions
This type of change is necessitated by discovery of actual job site conditions that differ from those shown on the contract plans or described in the specifi cations. These are conditions a de-signer could not have reasonably been expected to know about during the design of the project, including:
� Differing site conditions, such as soil conditions different than shown in the geotechnical report or structural building elements different than shown on record drawings.
� Undocumented presence of substruc-tures, buried utilities, or unknown ele-ments within building walls.
� Substructures, buried utilities, or utilities within building walls found in a different location than shown on the plans.
� Known structures discovered to be materially different than shown on the plans.
� Industry-wide strikes (to document time extensions).
� Unusually severe weather (to document time extensions).
� Acts of God, defi ned as earthquakes in excess of a magnitude of 3.5 on the Rich-
ter Scale and Tidal Waves (to document time extensions).
� Acts of Government subsequent to re-ceipt of bids that affect the project’s cost, but not its physical elements. If physical changes are required, the change order should be categorized as a “Client-Initi-ated Change.”
� Reduction of the scope of work.
� Expansion of the scope of work.
II. Changes to Bid Documents
This type of change is necessitated by a mistake or oversight in the original contract documents and is required to correct the plans and specifi cations. These are things that the designer should have known about and dealt with successfully during the design of the project, including:
� Interference with existing improvements or other elements of the project.
� Ambiguities or inconsistencies in the contract documents which are typically resolved in response to the contractor’s Request for Information (RFI).
� Confl icts between the contract plans and specifi cations.
� Plans or specifi cations that are impossible or impractical to construct or perform.
� Incomplete design documents.
� General project or design optimization.
III. Client-Initiated Changes
This type of change results from additions, deletions or revisions to the physical work, in-cluding:
� Unit price quantity adjustments. If the discrepancy is very large, the change should be categorized as a “Change to Bid Documents.”
Page 26
Chapter 3Performance Benchmarking
establish a whole new contract. This encour-ages the agencies and their contractors to work within the allotted limits. In addition, when a new contract is established to pay for a change order, the cost is no longer linked to the original project.
The Study Team will continue to work with the agencies to collect reliable change order data in preparation for a future Special Study on change orders, and re-classify if needed.
F. SPECIAL STUDY: CONSULTANT USAGE
The Study Team conducted a special analysis of consultant usage as it relates to project per-formance. A histogram of the Update 2005 projects was prepared showing consultant us-age as a percentage of project delivery cost, to identify potential groupings of consultant usage rates to compare. The histogram is shown in Figure 3-1.
While the agencies agree that consultant usage is generally increasing and will continue to escalate in the future, consultant costs are included in less than half of the projects in the Update 2005 analysis. Of the projects on which consultants were used, 153 projects had consultant costs that exceeded 25 percent of the project delivery cost. And of these, only 42 exceeded 50 percent of project delivery costs, too few for analysis. Therefore, regressions were performed compar-ing projects for which consultant use exceeded 25 percent of project delivery cost and projects on which there were no consultant costs.
Since consultant use in construction manage-ment by the agencies was quite low overall, only design performance data (as a percentage of con-struction) were evaluated. Given that the overall number of data points in the comparison was low, performance was evaluated by Project Type
� Fixed-cash allowance item adjustments (additions or deletions).
� Change in the nature of the work or de-sign intent, such as landscaping an area originally shown as paved.
� If the request is a result of the designer not having consulted with the Owner during the design phase, the change should be categorized as a “Change to Bid Documents.”
� Regulatory changes resulting in physical modifi cations to the equipment, process or facility. Regulatory changes, which result in added costs, but do not require physical modifications to the project should be categorized as a “Changed/Unforseen Condition.”
� Material or equipment substitutions requested by the contractor.
� Construction incentive proposals re quested by the contractor.
The agencies agreed that they were most inter-ested in the study of change orders arising from changes to the bid documents, with the hope that the results of the analysis will help establish a standard of care to be expected from the design team.
The Study Team examined and presented pre-liminary curves to the agencies on change or-ders. The curves indicated there was very poor correlation between the value of total change orders on a project and the project size. The analysis also seemed to indicate that projects generally averaged change orders of 10 percent of TCC, regardless of the relative amount spent on design. Observing this, the group discussed the idea that approved change orders are usually limited in practice by the project’s contingency budget. When a contingency is exceeded, often the agencies must go to their Councils or Boards for approval to increase the existing contract or
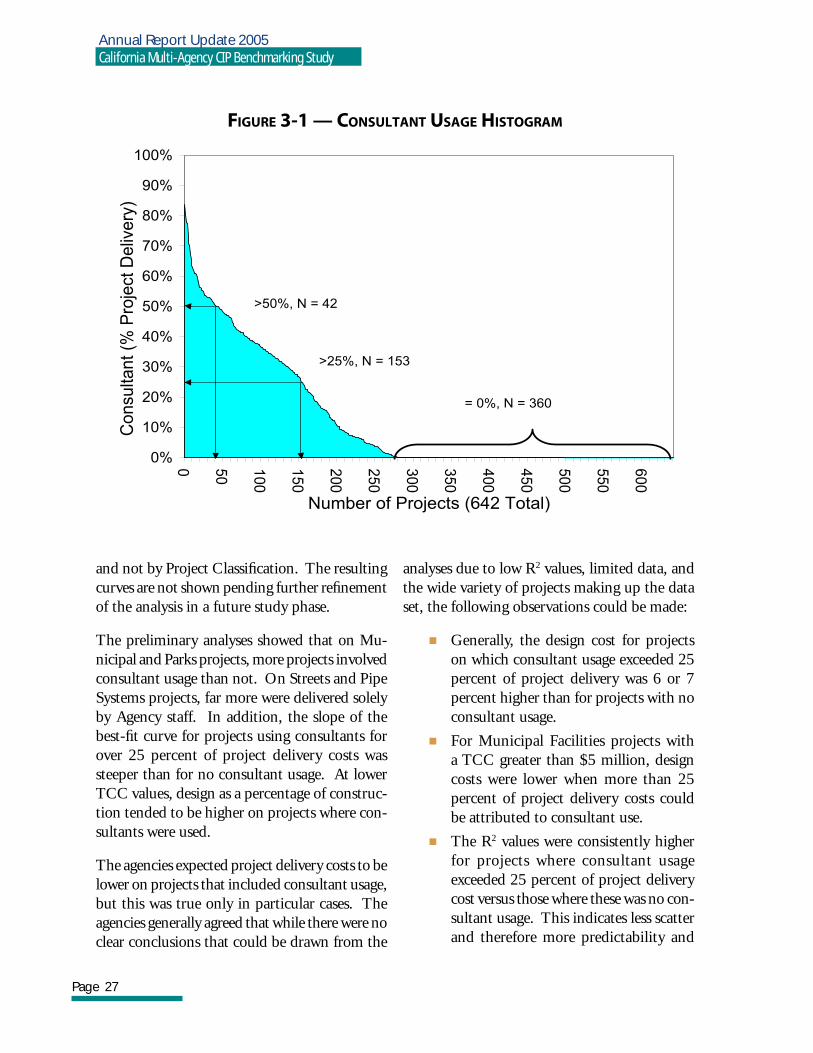
Page 27
Annual Report Update 2005California Multi-Agency CIP Benchmarking Study
and not by Project Classifi cation. The resulting curves are not shown pending further refi nement of the analysis in a future study phase.
The preliminary analyses showed that on Mu-nicipal and Parks projects, more projects involved consultant usage than not. On Streets and Pipe Systems projects, far more were delivered solely by Agency staff. In addition, the slope of the best-fi t curve for projects using consultants for over 25 percent of project delivery costs was steeper than for no consultant usage. At lower TCC values, design as a percentage of construc-tion tended to be higher on projects where con-sultants were used.
The agencies expected project delivery costs to be lower on projects that included consultant usage, but this was true only in particular cases. The agencies generally agreed that while there were no clear conclusions that could be drawn from the
analyses due to low R2 values, limited data, and the wide variety of projects making up the data set, the following observations could be made:
� Generally, the design cost for projects on which consultant usage exceeded 25 percent of project delivery was 6 or 7 percent higher than for projects with no consultant usage.
� For Municipal Facilities projects with a TCC greater than $5 million, design costs were lower when more than 25 percent of project delivery costs could be attributed to consultant use.
� The R2 values were consistently higher for projects where consultant usage exceeded 25 percent of project delivery cost versus those where these was no con-sultant usage. This indicates less scatter and therefore more predictability and
FIGURE 3-1 — CONSULTANT USAGE HISTOGRAM
0%
10%
20%
30%
40%
50%
60%
70%
80%
90%
100%
0 50
100
150
200
250
300
350
400
450
500
550
600
Number of Projects (642 Total)
Consu
ltant (%
Pro
ject
Deliv
ery
)
>50%, N = 42
>25%, N = 153
= 0%, N = 360
Page 28
Chapter 3Performance Benchmarking
consistency in fi nancial performance. This may be because the project scope must be better-defi ned when consultants are hired and because consultants’ fees are limited by contract.
� The increase in design costs associated with using consultants on smaller or
more specialized projects may be justifi ed in cases where consultants offer special-ized technical expertise, the projects are complex, there is an aggressive project schedule, there are peak workload de-mands that can’t easily be met using in-house staff, or there are other resource limitations on in-house staff.

CHAPTER
Best Management Practices4
Page 29
Since the inception of the Study in 2002, the agencies have examined over 100 practices used in the design and construction man-
agement phases of project delivery. Thirty-nine of these practices were identifi ed as ones which the participating agencies do not already com-monly use, but should be fully implemented as BMPs. Thirty-one of these thirty-nine targeted practices directly infl uence the cost of either design or construction management and, ulti-mately, effi cient project delivery.
A. PROGRESS ON BEST MANAGEMENT PRACTICE IMPLEMENTATION
Over the last four years, the participating agen-cies have implemented many of the BMPs. BMP implementation has been tracked and project delivery performance data includes the project completion date. It is anticipated that the per-formance data will eventually demonstrate that as BMPs were implemented, project delivery costs were reduced. However, it is recognized that “processes” become effective “practices” only after a learning curve and full implementation on projects. Therefore, obtaining empirical evidence of this trend is expected to take several years.
In Update 2005, the agencies continued to ex-change ideas regarding strategies for implement-ing various BMPs using both the networking opportunities at the quarterly meetings and the online discussion forum. The agencies’ prog-ress on actual BMP implementation since the last Study update and BMPs targeted for future implementation are summarized below:
I. City of Long Beach
Implemented June 2004 to May 2005:
� Have a Master Schedule attached to the CIP that identifi es start and fi nish dates for projects
� Defi ne requirements for reliability, main-tenance, and operation prior to design initiation
� Limit Scope Changes to early stages of design
� Require scope changes during design to be accompanied by Budget and Schedule approvals
� Classify types of change orders
� Involve the Construction Management Team prior to completion of design
� Make bid documents available online.
� Adopt and use a Project Control System on all projects
Targeted from June 2005 Onward:
� Resource-load all CIP projects for design and construction
� Develop and use a standardized Project Delivery Manual
� Use a formal Quality Management Sys-tem
� Provide formal training for Project Man-agers on a regular basis
� Implement and use a consultant rating system that identifi es quality of consul-tant performance
Page 30
Annual Report Update 2005California Multi-Agency CIP Benchmarking Study
II. City of Los Angeles
Implemented June 2004 to May 2005:
� Perform a formal Value Engineering Study for projects larger than $10 million (origi-nal BMP is $1 million)
� Perform and use post-project reviews to identify lessons learned
� Classify types of change orders
Targeted from June 2005 Onward:
� Limit Scope Changes to early stages of design
� Require scope changes during design to be accompanied by Budget and Schedule approvals
� Institutionalize Project Manager perfor mance and accountability
III. City of Oakland
Implemented June 2004 to May 2005:
� Defi ne Capital projects well with respect to scope and budget including commu-nity and client approval at the end of the planning phase
� Train in-house staff to use Green Build-ing Standards
� Limit Scope Changes to early stages of design
� Require scope changes during design to be accompanied by Budget and Schedule approvals
� Establish a pre-qualifi cation process for contractors on large, complex projects
� Adopt and use a Project Control System on all projects
� Create in-house project management team for small projects
Targeted from June 2005 Onward:
� Have a Board/Council project prioritiza-tion system
� Show Projects on a Geographical Infor-mation System
� Develop and use a standardized Project Delivery Manual
� Institutionalize Project Manager perfor mance and accountability
IV. City of Sacramento
Implemented June 2004 to May 2005:
� Defi ne Capital projects well with respect to scope and budget including commu-nity and client approval at the end of the planning phase
� Adapt successful designs to project sites, whenever possible (e.g. fire stations, gymnasiums, etc.)
� Limit scope changes to early stages of design
� Require scope changes during design to be accompanied by Budget and Schedule approvals
� Use a formal Quality Management Sys-tem
� Delegate authority to the City Engineer/Public Works Director or other depart-ments to approve change orders to the contingency amount
� Perform and use post-project reviews to identify lessons learned
� Provide formal training for Project Man-agers on a regular basis
� Adopt and use a Project Control System on all projects
� Create in-house project management team for small projects
� Institutionalize Project Manager perfor-
Page 31
Chapter 4Best Management Practices
mance and accountability
� Implement and use a consultant rating system that identifi es quality of consul-tant performance
Targeted from June 2005 Onward:
� Have a Board/Council project prioritiza-tion system
� Resource-load all CIP projects for de-sign and construction (targeted by two departments)
� Develop and use a standardized Project Delivery Manual
� Involve the Construction Management Team prior to completion of design
V. City of San Diego
Implemented June 2004 to May 2005:
� Defi ne requirements for reliability, main-tenance, and operation prior to design initiation
� Adapt successful designs to project sites, whenever possible (e.g. fire stations, gymnasiums, etc.)
� Limit Scope Changes to early stages of design
� Require scope changes during design to be accompanied by Budget and Schedule approvals
� Use a formal Quality Management Sys-tem
� Create in-house project management team for small projects
� Include a standard consultant contract in the RFQ/RFP with a standard indemni-fi cation clause
Targeted from June 2005 Onward:
� Defi ne capital projects well with respect
to scope and budget including commu-nity and client approval at the end of the planning phase
� Complete Feasibility Studies on projects prior to defi ning budget and scope
� Have a Board/Council project prioritiza-tion system
� Resource-load all CIP projects for design and construction
� Provide a detailed clear, precise scope, schedule, and budget to designers prior to design start
VI. City & County of San Francisco
Implemented June 2004 to May 2005:
� Show Projects on a Geographical Infor-mation System
� Use a formal Quality Management Sys-tem
� Establish a pre-qualifi cation process for contractors on large, complex projects
Targeted from June 2005 Onward:
� Limit Scope Changes to early stages of design
� Require scope changes during design to be accompanied by Budget and Schedule approvals
� Implement and use a consultant rating system that identifi es quality of consul tant performance
VII. City of San Jose
Implemented June 2004 to May 2005:
� Resource-load all CIP projects for design and construction
� Perform a formal value engineering study for projects larger than $1 million
Page 32
Annual Report Update 2005California Multi-Agency CIP Benchmarking Study
� Limit Scope Changes to early stages of design
� Perform and use post-project reviews to identify lessons learned
� Implement and use a consultant rating system that identifi es quality of consul-tant performance
Targeted from June 2005 Onward:
� Require scope changes during design to be accompanied by Budget and Schedule approvals
� Perform a formal Value Engineering Study for projects larger than $1 mil-lion
� Use a formal Quality Management Sys-tem
� Classify types of change orders
� Delegate authority to the City Engineer/ Public Works Director or other depart- ments to approve change orders to the contingency amount
Table 4-1 summarizes the BMPs that have been implemented by the participating agencies, as well as the priorities of those that are planned for implementation.
B. NEW BEST MANAGEMENT PRAC-
TICES
The agencies continued efforts to identify new BMPs consistent with their goal of continu-ously improving project delivery. Following are examples of new BMPs that may be considered for future development and implementation:
� Prevent Scope Creep – The scope of a project should be memorialized as early as is possible. Stakeholders (including the agency’s internal client) might pre-pare the scope, document it and send it
to the Project Manager who would de-velop a budget based on the scope. This would be returned to the stakeholders for discussion, agreement, and written confi rmation.
� Improve the Quality of Bid Documents – Design consultants should be rigor-ously pre-qualified based upon past performance on similar projects. Evalua-tions of design schedule compliance and the amount of change orders related to errors and omissions might be two of the criteria used.
� Promote Collaboration Between Team Members – Sharing project documen-tation (RFIs, change orders, etc.) in “real time” through an expanded use of online project management software and including stakeholders in design and construction progress meetings, would enhance collaboration and improve project delivery.
� Reduce the Budget Impact of Problem Bids – BMPs related to decreasing the number of bid irregularities should be identified and implemented. It was noted that some agencies experienced bid irregularities on 12 percent of their bids in 2003 and on 29 percent of their bids in 2004.
� Establish Minimum Qualifi cations for Defi ning a “Responsive” Bidder – Some agencies have implemented specifi c defi -nitions for “responsive” bidders. Bidders on some projects must have fi ve years of experience building similar projects and must document that experience to the agency prior to bid.
� Provide resources to Perform “Check Estimates” on Change Orders – Project Managers might receive additional train-ing or resources might be made available to procure “check estimates” from inde-pendent third parties.
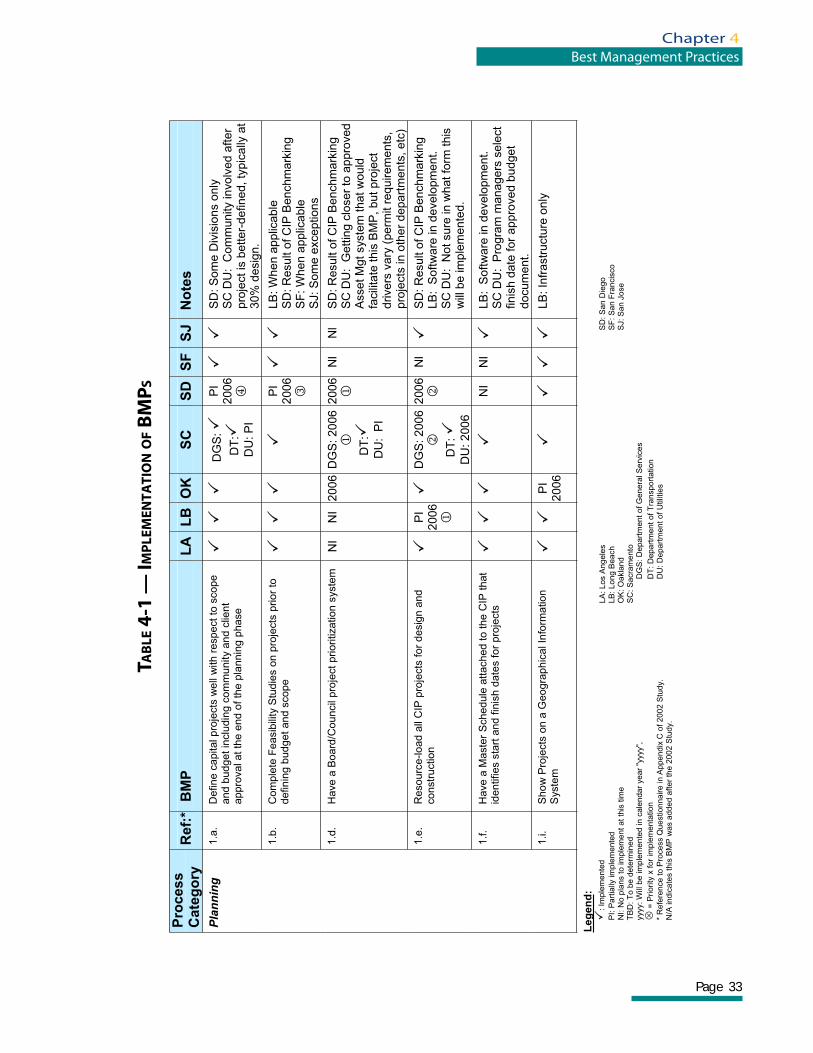
Page 33
Chapter 4Best Management Practices
TAB
LE 4
-1 —
IMP
LEM
ENTA
TIO
N O
F BM
PS
Leg
en
d:
�:
Imple
mente
d�
LA
: Los A
ngele
s
SD
: S
an D
iego
P
I: P
art
ially
im
ple
mente
d
LB
: Long B
each
SF
: S
an F
rancis
co
NI: N
o p
lans t
o im
ple
ment
at
this
tim
e
OK
: O
akla
nd
SJ:
San J
ose
TB
D: T
o b
e d
ete
rmin
ed
SC
: S
acra
mento
yyyy:
Will
be im
ple
mente
d in
cale
ndar
year
"yyyy"
, D
GS
: D
epart
ment
of
Genera
l S
erv
ices
� =
Priority
x f
or
imple
menta
tion
DT
: D
epart
ment
of T
ransport
ation
*
Refe
rence t
o P
rocess Q
uestionnaire in A
pp
en
dix
C o
f 2
00
2 S
tud
y.
D
U: D
ep
art
me
nt
of
Utilit
ies
N
/A indic
ate
s t
his
BM
P w
as a
dded a
fter
the 2
00
2 S
tudy.
Pro
cess
Cate
go
ry
Re
f:*
BM
PL
AL
BO
KS
CS
DS
FS
J
No
tes
1.a
. D
efin
e c
apital pro
jects
we
ll w
ith r
espect
to s
cope
and b
ud
get
inclu
din
g c
om
mu
nity
an
d c
lient
appro
val at
the
end o
f th
e p
lannin
g p
hase
�����
D
GS
: �
DT
:��
DU
: P
I�
PI
20
06�
�
����
SD
: S
om
e D
ivis
ions o
nly
S
C D
U: C
om
munity involv
ed a
fter
pro
ject is
better-
defined, ty
pic
ally
at
30%
desig
n.
1.b
. C
om
ple
te F
easib
ility
Stu
die
s o
n p
roje
cts
prior
to
definin
g b
ud
ge
t and s
cope
������
��
PI
20
06
�
����
LB
: W
he
n a
pp
licab
le
SD
: R
esult o
f C
IP B
enchm
ark
ing
SF
: W
hen a
pplic
able
S
J: S
om
e e
xceptions
1.d
. H
ave a
Bo
ard
/Council
pro
ject
prioritization s
yste
m
NI
NI
2006
DG
S: 2006
��
DT
: ��
DU
: P
I
20
06
�N
l N
l S
D: R
esu
lt o
f C
IP B
en
ch
ma
rkin
g
SC
DU
: G
ettin
g c
loser
to a
ppro
ved
Asset M
gt sys
tem
that w
ould
fa
cili
tate
this
BM
P, but pro
ject
drivers
vary
(perm
it r
equirem
ents
, pro
jects
in o
ther
depart
ments
, etc
)
1.e
. R
esourc
e-lo
ad a
ll C
IP p
roje
cts
for
desig
n a
nd
constr
uction
��
PI
20
06
�
��
DG
S: 2006
�D
T:��
DU
: 2006
20
06
�N
l�
SD
: R
esult o
f C
IP B
enchm
ark
ing
LB
: S
oftw
are
in d
evelo
pm
ent.
SC
DU
: N
ot sure
in w
hat fo
rm this
w
ill b
e im
ple
mente
d.
1.f.
Have a
Maste
r S
chedule
attached t
o t
he C
IP t
hat
identifies s
tart
and f
inis
h d
ate
s f
or
pro
jects
���
��
��
NI
NI ��
LB
: S
oftw
are
in d
evelo
pm
ent.
SC
DU
: P
rogra
m m
anagers
sele
ct
finis
h d
ate
for
appro
ved b
udget
docum
ent.
Plan
ning
1.i.
Sho
w P
roje
cts
on a
Geogra
phic
al In
form
ation
Sys
tem
����
PI
20
06�
��
���
��
LB
: In
frastr
uctu
re o
nly
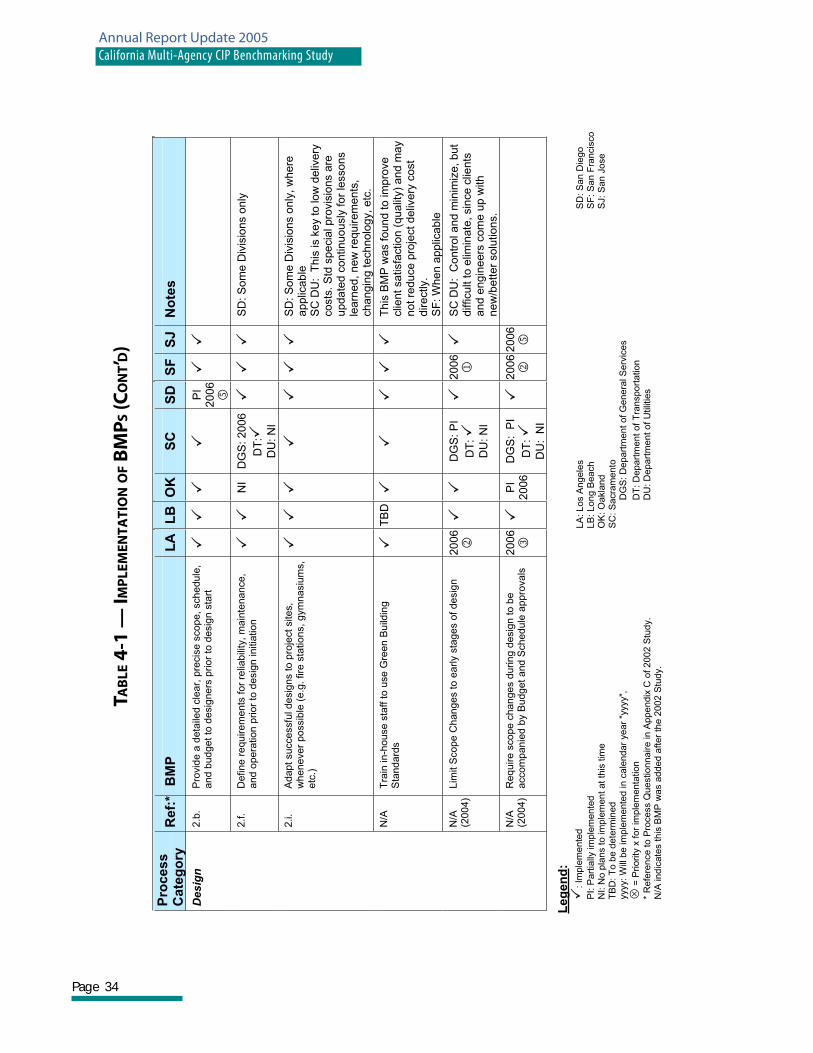
Page 34
Annual Report Update 2005California Multi-Agency CIP Benchmarking Study
TAB
LE 4
-1 —
IMP
LEM
ENTA
TIO
N O
F BM
PS (C
ON
T’D)
Pro
cess
Cate
go
ry
Re
f:*
BM
PL
AL
BO
KS
CS
DS
FS
J
No
tes
2.b
. P
rovid
e a
deta
iled c
lear,
pre
cis
e s
cope,
sch
edule
, and b
ud
get
to d
esig
ners
pri
or
to d
esig
n s
tart
������
��
PI
20
06�
�
����
2.f.
Define r
equirem
ents
for
relia
bili
ty,
main
tenance,
and o
pera
tion p
rior
to d
esig
n initia
tion
���
NI
DG
S: 2006
DT
:��
DU
: N
I
�����
SD
: S
om
e D
ivis
ions o
nly
2.i.
Adapt
successfu
l desig
ns t
o p
roje
ct
sites,
wh
en
eve
r p
ossib
le (
e.g
. fir
e s
tatio
ns,
gym
na
siu
ms,
etc
.)
������
��
�����
SD
: S
om
e D
ivis
ions o
nly
, w
here
a
pp
lica
ble
S
C D
U: T
his
is k
ey to low
deliv
ery
costs
. S
td s
pe
cia
l pro
vis
ion
s a
re
up
da
ted
con
tin
uo
usly
fo
r le
sso
ns
lea
rne
d, n
ew
re
qu
ire
me
nts
, changin
g technolo
gy, etc
.
N/A
T
rain
in-h
ouse s
taff t
o u
se G
reen B
uild
ing
Sta
ndard
s
��
TB
D�
��
������
Th
is B
MP
was fo
un
d to
im
pro
ve
clie
nt satisfa
ction (
qualit
y)
and m
ay
not re
duce p
roje
ct deliv
ery
cost
directly.
SF
: W
hen a
pplic
able
N/A
(200
4)
Lim
it S
cope C
hanges t
o e
arl
y sta
ges o
f desig
n
20
06
��
�D
GS
: P
I
DT
:��
DU
: N
I
�2
00
6�
�S
C D
U: C
ontr
ol and m
inim
ize, but
difficult to e
limin
ate
, sin
ce c
lients
a
nd
eng
ine
ers
com
e u
p w
ith
new
/better
solu
tions.
Des
ign
N/A
(200
4)
Req
uire s
co
pe c
han
ges d
urin
g d
esig
n t
o b
e
accom
panie
d b
y B
udget
and S
ched
ule
appro
vals
2
00
6�
�P
I2
00
6D
GS
: P
I
DT
:��
DU
: N
I
�2
00
6�
20
06
�
Leg
en
d:
�:
Imple
mente
d�
LA
: Los A
ngele
s
SD
: S
an D
iego
P
I: P
art
ially
im
ple
mente
d
LB
: Long B
each
SF
: S
an F
rancis
co
NI: N
o p
lans t
o im
ple
ment
at
this
tim
e
OK
: O
akla
nd
SJ:
San J
ose
TB
D: T
o b
e d
ete
rmin
ed
SC
: S
acra
mento
yyyy:
Will
be im
ple
mente
d in
cale
ndar
year
"yyyy"
, D
GS
: D
epart
ment
of
Genera
l S
erv
ices
� =
Priority
x f
or
imple
menta
tion
DT
: D
epart
ment
of T
ransport
ation
*
Refe
rence t
o P
rocess Q
uestionnair
e in
Ap
pe
nd
ix C
of
20
02
Stu
dy.
DU
: D
ep
art
me
nt
of
Utilit
ies
N
/A indic
ate
s t
his
BM
P w
as a
dded a
fter
the 2
00
2 S
tudy.
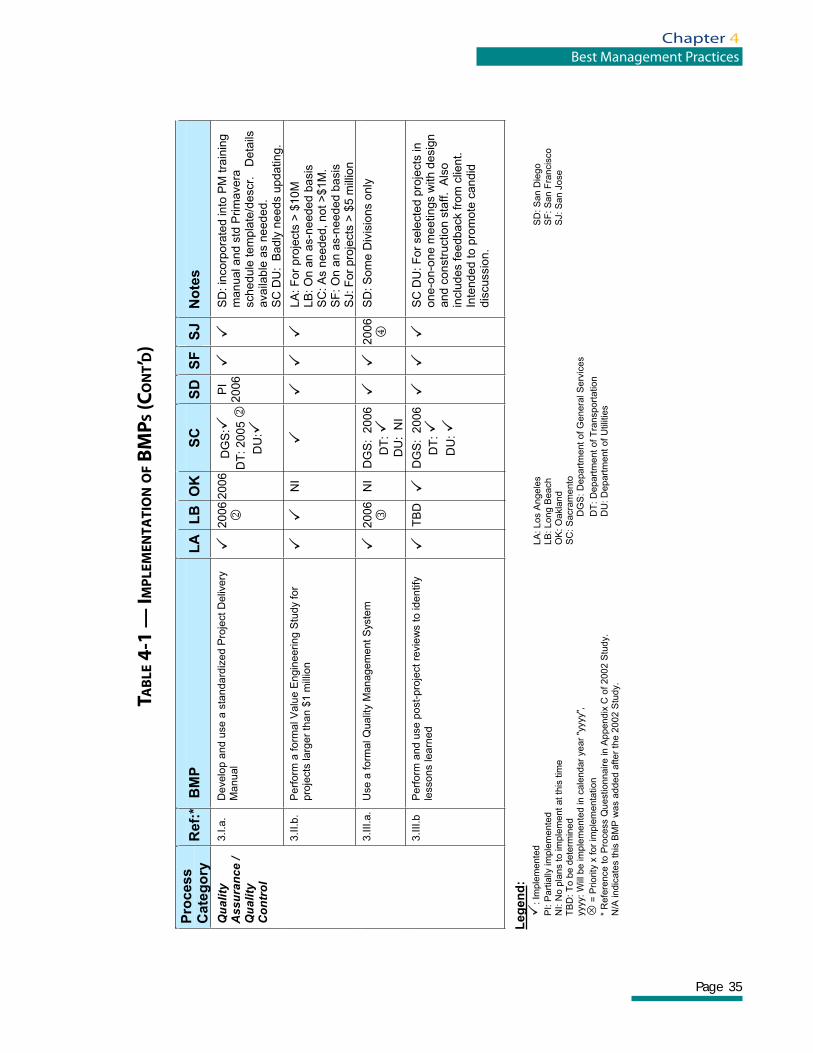
Page 35
Chapter 4Best Management Practices
TAB
LE 4
-1 —
IMP
LEM
ENTA
TIO
N O
F BM
PS (C
ON
T’D)
Pro
cess
Cate
go
ry
Re
f:*
BM
PL
AL
BO
KS
CS
DS
FS
J
No
tes
3.I.a
. D
evelo
p a
nd u
se a
sta
nd
ard
ized P
roje
ct
Deliv
ery
M
anu
al
��
20
06
�2
00
6D
GS
: ��
DT
: 2005 ��
DU
: �
PI
20
06�
��
SD
: in
corp
ora
ted into
PM
tra
inin
g
manual and s
td P
rim
avera
schedule
tem
pla
te/d
escr.
D
eta
ils
availa
ble
as n
eeded.
SC
DU
: B
adly
needs u
pdating.
3.II.b.
Perf
orm
a f
orm
al V
alu
e E
ngin
eering S
tudy
for
pro
jects
larg
er
than $
1 m
illio
n
���
NI
��
�����
LA
: F
or
pro
jects
> $
10
M
LB
: O
n a
n a
s-n
eed
ed
ba
sis
S
C: A
s n
eeded, not >
$1M
. S
F: O
n a
n a
s-n
eed
ed
ba
sis
S
J: F
or
pro
jects
> $
5 m
illio
n
3.I
II.a
. U
se
a f
orm
al Q
ua
lity
Ma
na
ge
me
nt
Sys
tem
��
20
06�
�N
I D
GS
: 2
006
DT
:�
DU
: N
I
��
20
06
��
SD
: S
om
e D
ivis
ions o
nly
Qua
lity
Ass
uran
ce /
Qua
lity
Con
trol
3.III.b
P
erf
orm
and u
se p
ost-
pro
ject
revie
ws t
o identify
le
sso
ns learn
ed
��
TB
D���
DG
S: 2
006
DT
:��
DU
:�
������
SC
DU
: F
or
sele
cte
d p
roje
cts
in
one-o
n-o
ne m
eetings w
ith d
esig
n
and c
onstr
uction s
taff. A
lso
inclu
des feedback fro
m c
lient.
Inte
nded to p
rom
ote
candid
d
iscussio
n.
Leg
en
d:
�:
Imple
mente
d�
LA
: Los A
ngele
s
SD
: S
an D
iego
P
I: P
art
ially
im
ple
mente
d
LB
: Long B
each
SF
: S
an F
rancis
co
NI: N
o p
lans t
o im
ple
ment
at
this
tim
e
OK
: O
akla
nd
SJ:
San J
ose
TB
D: T
o b
e d
ete
rmin
ed
SC
: S
acra
mento
yyyy:
Will
be im
ple
mente
d in
cale
ndar
year
"yyyy"
, D
GS
: D
epart
ment
of
Genera
l S
erv
ices
� =
Priority
x f
or
imple
menta
tion
DT
: D
epart
ment
of T
ransport
ation
*
Refe
rence t
o P
rocess Q
uestionnair
e in A
pp
en
dix
C o
f 2
00
2 S
tud
y.
D
U: D
ep
art
me
nt
of
Utilit
ies
N
/A indic
ate
s t
his
BM
P w
as a
dded a
fter
the 2
00
2 S
tudy.
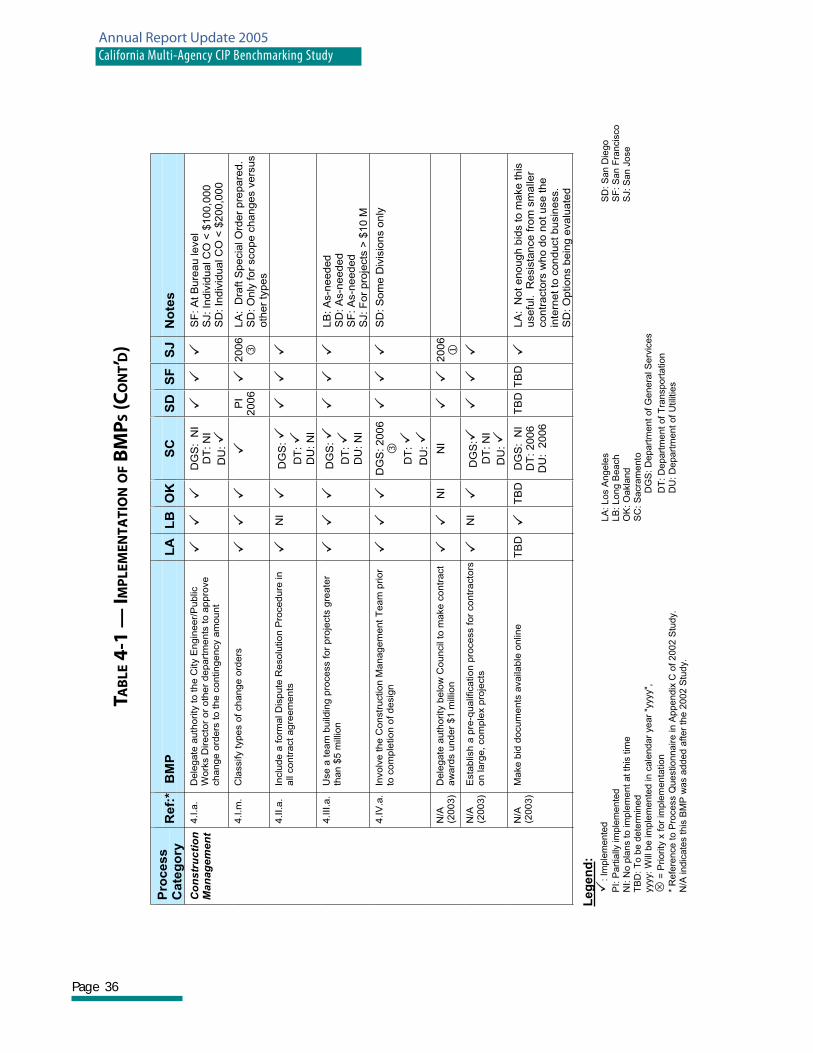
Page 36
Annual Report Update 2005California Multi-Agency CIP Benchmarking Study
TAB
LE 4
-1 —
IMP
LEM
ENTA
TIO
N O
F BM
PS (C
ON
T’D)
Pro
cess
Cate
go
ry
Re
f:*
BM
PL
AL
BO
KS
CS
DS
FS
J
No
tes
4.I.a
. D
ele
gate
auth
ority
to t
he C
ity E
ngin
eer/
Public
W
ork
s D
irecto
r or
oth
er
depart
ments
to a
ppro
ve
chan
ge o
rders
to t
he c
ontin
ge
ncy a
mou
nt
������
DG
S: N
I D
T: N
I
DU
:�
������
SF
: A
t B
ure
au level
SJ: In
div
idual C
O <
$100,0
00
SD
: In
div
idual C
O <
$200,0
00
4.I.m
. C
lassify t
ypes o
f change o
rders
�
���
��
PI
20
06��
20
06
�LA
: D
raft S
pecia
l O
rder
pre
pare
d.
SD
: O
nly
fo
r sco
pe
ch
an
ge
s v
ers
us
oth
er
types
4.II.a.
Inclu
de a
form
al D
ispute
Resolu
tion P
rocedure
in
all
contr
act
agre
em
ents
��
NI��
DG
S:�
DT
:�
DU
: N
I
������
4.III.a
. U
se a
team
build
ing p
rocess f
or
pro
jects
gre
ate
r th
an $
5 m
illio
n
������
DG
S:�
DT
:�
DU
: N
I�
������
LB
: A
s-n
eed
ed
S
D: A
s-n
ee
de
d
SF
: A
s-n
eeded
SJ: F
or
pro
jects
> $
10
M
4.IV
.a.
Involv
e t
he C
onstr
uction M
an
agem
ent
Team
prior
to c
om
ple
tion o
f desig
n
���
��
DG
S: 2006
��
DT
:��
DU
:�
������
SD
: S
om
e D
ivis
ions o
nly
N/A
(200
3)
Dele
gate
auth
ority
belo
w C
ouncil
to m
ake c
ontr
act
aw
ard
s u
nd
er
$1 m
illio
n
����
NI�
NI
����
20
06
�N
/A(2
00
3)
Esta
blis
h a
pre
-qua
lific
ation p
rocess f
or
contr
acto
rs
on larg
e,
com
ple
x p
roje
cts
��
NI�
DG
S:��
DT
: N
I
DU
:��
���
��
Con
stru
ctio
n M
anag
emen
t
N/A
(200
3)
Make b
id d
ocu
ments
availa
ble
onlin
e
TB
D�
TB
DD
GS
: N
I D
T: 2006
DU
: 2
006
TB
D T
BD�
LA
: N
ot enough b
ids to m
ake this
usefu
l. R
esis
tance fro
m s
malle
r contr
acto
rs w
ho d
o n
ot use the
inte
rne
t to
con
duct b
usin
ess.
SD
: O
ptio
ns b
ein
g e
va
lua
ted
Leg
en
d:
�:
Imple
mente
d�
LA
: Los A
ngele
s
SD
: S
an D
iego
P
I: P
art
ially
im
ple
mente
d
LB
: Long B
each
SF
: S
an F
rancis
co
NI: N
o p
lans t
o im
ple
ment
at
this
tim
e
OK
: O
akla
nd
SJ:
San J
ose
TB
D: T
o b
e d
ete
rmin
ed
SC
: S
acra
mento
yyyy:
Will
be im
ple
mente
d in
cale
ndar
year
"yyyy"
, D
GS
: D
epart
ment
of
Genera
l S
erv
ices
� =
Priority
x f
or
imple
menta
tion
DT
: D
epart
me
nt
of T
ransport
ation
*
Refe
rence t
o P
rocess Q
uestionnair
e in
Ap
pe
nd
ix C
of
20
02
Stu
dy.
DU
: D
ep
art
me
nt
of
Utilit
ies
N
/A indic
ate
s t
his
BM
P w
as a
dded a
fter
the 2
00
2 S
tudy.
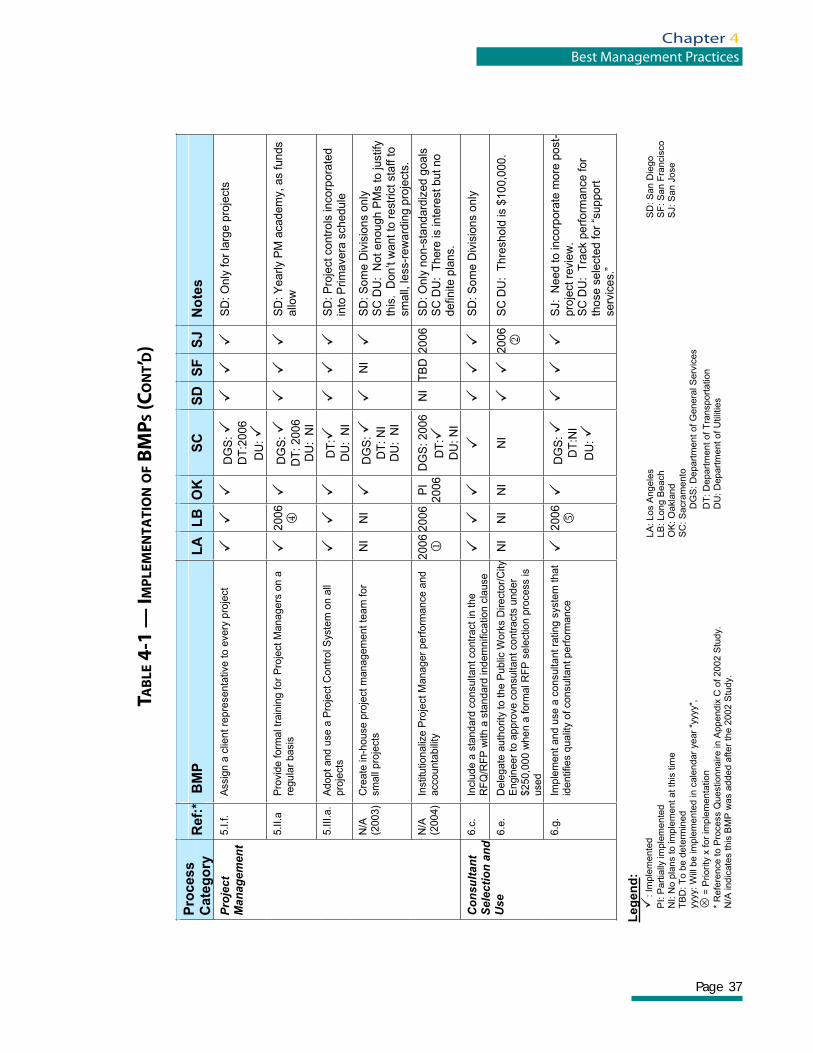
Page 37
Chapter 4Best Management Practices
TAB
LE 4
-1 —
IMP
LEM
ENTA
TIO
N O
F BM
PS (C
ON
T’D)
Pro
cess
Cate
go
ry
Re
f:*
BM
PL
AL
BO
KS
CS
DS
FS
J
No
tes
5.I.f.
Ass
ign a
clie
nt
repre
senta
tive t
o e
very
pro
ject
������
DG
S:��
DT
:20
06
DU
:��
�����
SD
: O
nly
for
larg
e p
roje
cts
5.II.a
Pro
vide f
orm
al t
rain
ing f
or
Pro
ject
Managers
on a
re
gu
lar
basi
s ��
20
06
���
DG
S:��
DT
: 2006
DU
: N
I
������
SD
: Y
early
PM
aca
dem
y, a
s fu
nds
allo
w
5.III.a
. A
dopt
and u
se a
Pro
ject
Contr
ol S
yste
m o
n a
ll pro
ject
s ���
�D
T:��
DU
: N
I������
SD
: P
roje
ct c
ontr
ols
inco
rpora
ted
into
Prim
ave
ra s
chedule
N/A
(200
3)
Cre
ate
in-h
ouse
pro
ject
managem
ent
team
for
small
pro
ject
s N
I N
I �
DG
S:�
DT
: N
I D
U: N
I
�N
I��
SD
: S
om
e D
ivis
ions
only
S
C D
U: N
ot enough P
Ms
to ju
stify
th
is. D
on’t
want to
rest
rict
sta
ff to
small,
less
-rew
ard
ing p
roje
cts.
Proj
ect
Man
agem
ent
N/A
(200
4)
Inst
itutio
naliz
e P
roje
ct M
anager
perf
orm
ance
and
acc
ou
nta
bili
ty
20
06
�2006
PI
20
06�D
GS
: 2006
DT
: ��
DU
: N
I
NI
TB
D2
00
6S
D: O
nly
no
n-s
tand
ard
ize
d g
oa
ls
SC
DU
: T
here
is in
tere
st b
ut no
defin
ite p
lans.
6.c
. In
clud
e a
sta
nd
ard
consulta
nt
contr
act
in t
he
RF
Q/R
FP
with
a s
tandard
ind
em
nifi
catio
n c
lause
������
��
�����
SD
: S
om
e D
ivis
ions
only
C
onsu
ltant
Se
lect
ion
and
Use
6.e
. D
ele
gate
auth
ority
to t
he P
ublic
Work
s D
irect
or/
City
E
ngin
eer
to a
ppro
ve c
onsu
ltant
contr
act
s under
$25
0,0
00 w
he
n a
form
al R
FP
sele
ctio
n p
roce
ss is
use
d
NI
NI
NI
NI
����2
00
6�
SC
DU
: T
hre
shold
is $
100,0
00.
6.g
. Im
ple
me
nt
and
use
a c
onsu
ltant
ratin
g s
yste
m t
hat
identif
ies
qualit
y of
consu
ltant
perf
orm
ance
��
20
06
���
DG
S:�
DT
:NI
DU
:�
������
SJ:
N
eed to in
corp
ora
te m
ore
post
-pro
ject
revi
ew
.
SC
DU
: T
rack
perf
orm
ance
for
tho
se s
ele
cted
fo
r “s
up
po
rt
serv
ices.
”
Leg
en
d:
�:
Imple
mente
d�
LA
: Los A
ngele
s
SD
: S
an D
iego
P
I: P
art
ially
im
ple
mente
d
LB
: Long B
each
SF
: S
an F
rancis
co
NI: N
o p
lans t
o im
ple
ment
at
this
tim
e
OK
: O
akla
nd
SJ:
San J
ose
TB
D: T
o b
e d
ete
rmin
ed
SC
: S
acra
mento
yyyy:
Will
be im
ple
mente
d in
cale
ndar
year
"yyyy"
, D
GS
: D
epart
ment
of
Genera
l S
erv
ices
� =
Priority
x f
or
imple
menta
tion
DT
: D
epart
ment
of T
ransport
ation
*
Refe
rence t
o P
rocess Q
uestionnair
e in
Ap
pe
nd
ix C
of
20
02
Stu
dy.
DU
: D
ep
art
me
nt
of
Utilit
ies
N
/A indic
ate
s t
his
BM
P w
as a
dded a
fter
the 2
00
2 S
tudy.
Page 38
Annual Report Update 2005California Multi-Agency CIP Benchmarking Study
Los Angeles targeted implementing the BMP of performing Value Engineering on projects with a construction value of $1 million or greater. How-ever, this BMP was implemented only on projects $10 million and larger or when it was otherwise necessary on smaller projects, for example, after unexpectedly high bids were received.
Also, Los Angeles chose not to make bid docu-ments available online because it was felt that the number and size of projects, as well as the low prevalence of internet use by contractors responding, did not warrant implementation of this BMP at this time.
When Sacramento is unable to implement a BMP, the delay was usually associated with not having followed basic project management practices to pursue the BMP. In contrast, Sacra-mento noted that its success in implementing a Project Management Manual was associated with making this BMP into a project and assigning it a schedule, budget, and a responsible project manager.
While Sacramento has found that implementa-tion of BMPs has fostered teamwork and ensures that projects have a higher level of quality from start to fi nish, it is sometimes a challenge to convince staff that the new practices will result in direct benefi ts to them and the quality of their projects. Reporting on the results of BMP imple-mentation in a quantifi able way is an important step in the implementation process.
San Diego sees a tremendous benefi t in imple-menting BMPs for project delivery improvement, but as other agencies have reported, resource limitations present a major challenge. In ad-dition, San Diego desires to turn some of the BMPs into citywide policy for all departments, rather than just those departments involved in the Study. This requires the approval of its city council and can be a time-consuming process leading to delays in BMP implementation.
C. IMPLEMENTATION CHALLENGES
The implementation of BMPs by participating agencies was exceptionally challenging over the past year. Cities in California, like the State itself, had diffi culty securing budgets and addressing unusual winter and spring storm damage. The ability of the agencies to implement particular BMPs as planned was impacted and implementa-tion had to be delayed in many cases.
As San Francisco put it:
“Most public works agencies focus their time addressing the day-to-day challenges of running their agency and carrying out their missions. In doing so, they often place on the back-burner the important, but not necessarily urgent, task of seeking ways to improve the way they do business. Thus, the one big challenge in implementing BMPs is simply being able to allocate resources to make improvements in the face of compet-ing (public) demands.”
While implementation was challenging, partici-pants remain determined. For example, Oakland implemented most of the BMPs it had targeted and will continue to implement the rest in the next 12 to 18 months. Oakland commented that:
“These BMPs have benefi ted us to become a more effective organization in delivering capital projects. However, due to compet-ing demands for resources, it is challenging to allocate staff to implement some of the practices that are more time-consuming, such as developing a standardized Project Delivery Manual. Another challenge is to streamline the award process for small consulting and construction contracts (those under $150,000 and $250,000, respec-tively) for more responsive service.”
Page 39
Chapter 4Best Management Practices
ects where San Francisco wants to incorporate sewer replacement work, the sewer excavation is often in areas that contain compacted fi ll from the original sewer construction. Archaeological or cultural resources would not normally be ex-pected in such excavations. However, due to the federal requirement, project durations, schedules, and costs are adversely impacted.
Agencies often want to acquire Leadership in Energy and Environmental Design (LEED) building certifi cation from the US Green Build-ing Council. Los Angeles has found that these types of projects have delivery costs that are greater than those of standard buildings.
San Diego requires all new buildings to obtain LEED certifi cation at the silver level to emphasize higher energy effi ciency and use of recycled ma-terials. Building costs, especially for equipment and façades, have increased as a result.
Sacramento fi nds that environmental awareness and an emphasis on sustainability, procedures, and scorecards drives many of their activities. Its council set a goal that all signifi cant city build-ings should meet standards at the gold level of LEED certifi cation. This creates the challenge for Sacramento staff to increase training and adopt new design practices while identifying additional funds for projects that were started before the adoption of LEED practices.
Los Angeles commented that new Federal Highway Administration and Caltrans funding regulations can be time-consuming and diffi -cult to follow. It can be diffi cult to predict the results on funding applications, impacting Los Angeles’ ability to plan, design, and build its streets projects.
New regulations also require that Los Angeles submit a Bridge Evaluation and Historical Prop-erties Survey Report to Caltrans for all bridges that are at least 50 years old. This adversely im-pacts costs associated with Los Angeles’ ongoing
San Jose’s biggest challenges in BMP implemen-tation are fi nding the time to properly develop, plan, and gain approval for making such changes. Implementing new BMPs in an organization as large as San Jose is diffi cult and requires substan-tial effort to be successful.
The agencies will continue to identify and imple-ment BMPs to improve project delivery. Their progress will be documented to support the agencies’ efforts to identify links between process and performance.
D. REGULATORY CHALLENGES
The participating agencies encountered a number of regulatory challenges this year, which they believe have impacted capital project delivery. As these challenges surfaced, the agencies began to strategize ways to minimize the impact upon project delivery cost. It is anticipated that new BMPs related to these regulatory issues will be identifi ed and implemented as the team contin-ues to work together.
Until mid-2005, San Francisco encountered challenges in the use of as-needed consulting services. San Francisco’s Administrative Code limited these types of contracts to a 3-year term with no option for extensions. If a design task order was given to the consultant in the last year of the term, the contract sometimes expired before the design was completed. This provi-sion often prevented use of the same consultant in design and construction phases, leading to a lack of continuity. To address this, San Francisco recently amended its code to allow consultants to complete task orders after the expiration of a 3-year contract if they were issued in the last year of the contract.
Another regulatory challenge for San Francisco is the federal requirement for historic and cultural investigation on excavations deeper than the pavement structural section. In roadway proj-
Page 40
Annual Report Update 2005California Multi-Agency CIP Benchmarking Study
Bridge Program because consultant contracts are already in place for design. These changes require approvals of new task orders for consultants. This requirement, combined with a Caltrans’ require-ment that an individual certifi ed by Caltrans shall complete the report, leads to schedule delays and increased costs.
Project delivery in Long Beach has been im-pacted by additional requirements for public outreach during both design and construction. The required outreach, which typically includes community meetings, commission reviews, and direct notifi cation, has increased costs and lengthened project delivery schedules. Other regulatory impacts on project delivery include regularly-contested California Environmental Quality Act approvals and compliance with Na-tional Pollutant Discharge Elimination System (NPDES) regulations.
New stormwater runoff requirements, in ad-dition to a new tree protection ordinance, has caused San Diego’s project delivery to be im-pacted by increased schedule durations, costs, and resource needs.
During the holiday season from Thanksgiving Day to New Year’s Day, Sacramento does not allow construction in downtown Sacramento right-of-ways and in designated “primary streets.” This leads to increased costs by forcing projects to be delayed into the winter. In addition, construc-tion projects in the extensive list of designated primary streets are restricted from 7:00 am to 8:30 am, and again from 4:00 to 5:30 pm, also increasing project delivery as well as total con-struction costs.
Inconsistency in Caltrans permitting caused dif-fi culties for a recent Sacramento project. Single-pass HOBAS pipe had been allowed by Caltrans in the past and, following preliminary discussions with Caltrans, Sacramento believed it would be allowed on a microtunneling project. Dur-ing permit procurement in construction phase,
Caltrans disallowed its use and Sacramento was required to use another type of pipe construction. This led to increased costs in order to change the construction contract documents to conform to the approved method.
Sacramento encountered diffi culties with Storm Water Pollution Prevention regulations, which have become more stringent since they were in-troduced in 1990 Project delivery and construc-tion costs increase for projects disturbing over 1 acre because additional plans and inspections are required. The Sacramento Department of Utilities employs 2 full-time staff members for inspecting and citing violations, which increases overhead costs.
Recently, Sacramento has also found it harder to obtain permits from the U.S. Army Corps of Engineers, under Section 404 of the Clean Water Act for detention basin and channel improve-ment projects. This permit allows discharge of dredged or fi ll materials into waters of the US. Stricter enforcement of permit procurement requirements has resulted in signifi cant delays, leading to signifi cantly increased land acquisition costs. In one case, the permit was not approved and the project was canceled entirely. Similarly, permitting diffi culties have also arisen for Sacra-mento on projects involving the California Public Utilities Commission (CPUC), adding cost and signifi cant schedule delays. Sacramento is mak-ing an effort to involve the CPUC early in the project to avert these issues.
It is acknowledged that regulatory changes in our communities will continue. It is also recognized that regulatory changes are made with the intent of improving the quality of life for residents. The challenge for responsible agencies is to de-liver capital projects compliant with regulatory changes while keeping the cost of compliance from having a detrimental impact on the cost of project delivery. Working together to develop ef-fective BMPs to reduce the impact and disruption of compliance remains a goal of the agencies.


CHAPTER Online Discussion Forum5
Page 41
Among the primary benefi ts accruing to the participating agencies during this multi-year Study has been the opportunity to
discuss the challenges of public works project delivery with their peers. These successful open forum communications included online discus-sions of over thirty topics that infl uence project delivery effi ciency:
� Tracking/coordinating street and utility work to avoid re-work (including street cut moratoriums)
� Design error and omissions cost recov-ery
� 3-D design tools
� Impacts of SUVs on roads
� Bond measures for infrastructure
� Consultant selection, management, and fees
� Public works cost estimating
� Insurance challenges and solutions for MBE, DBE, and WBE fi rms
� Pavement aggregate gradation for slip resistance
� Enforcement of truncated domes in pedestrian ramps
� Obtaining approval of property use within existing utility easements
� Subdivision review procedures (using peer reviewers)
� Maintenance and management require-ments for Wetlands Mitigation Projects
� Environmental approvals processes
� Online bid service providers and soft-ware
� ISO certifi cation for public agencies
� Making contract documents available on line to bidders
� Cost impacts of LEED certifi cation of buildings and in-house “green” design teams
� Contract awards and insurance require-ments
� Bidder experience requirements
� Payment of prevailing wages on proj-ects
� In-house geotechnical services
� Indemnifi cation clauses for professional services contracts
� Staff performance incentives
� QA/QC of plans and specifi cations
� Parking standards on streets
� Construction traffi c control manage-ment
� Use of rubberized asphalt concrete
� Utility markings
� Classifi cation of change orders
� Bid opening process
� As-Built Record Documents
Following are examples of the type of informa-tion exchanged in those discussions. The discus-sions and solutions to issues are provided herein in the hope that they may be helpful to agencies struggling with similar issues and concerns. The following discussion topics are summarized in this chapter:
� Construction Traffi c Control Manage-ment
� Street Construction Coordination
� Construction Cost Estimating
Page 42
Annual Report Update 2005California Multi-Agency CIP Benchmarking Study
� Bond Measure Considerations
� Online Bid Advertising, Bid Documents, and Bidding
� Cost Impacts of LEED Certifi cation and In-House Green Design Teams
� Environmental Approvals Processes
� Consultant Selection, Management, and Fees
� As-Built Record Documents
A. CONSTRUCTION TRAFFIC CONTROL MANAGEMENT
Sacramento is experiencing a signifi cant growth cycle in its downtown area with several large projects concurrently under construction. Five additional projects are also planned in the next few years. It took advantage of its participation in the Study by posting the following questions to the agencies:
1. Generally, what is your process for manag-ing traffi c control in downtown areas related to construction and encroachment permits (street, lane, or pedestrian closures)?
2. What department and section approves traffi c control plans and street, lane, and pedestrian closure permits?
3. How many staff members and at what clas-sifi cations are dedicated for review, approval and enforcement of traffi c control plans, street, lane, and pedestrian closures?
4. Who decides working times for street, lane, and pedestrian closures, and determines other requirements related to traffi c control plans?
5. Do you have a typical standard for working hours and the number of lanes that must remain open in your downtown area? If
there are no set standards, what criteria do you use to approve working hours and lane closures?
6. Do you have citation authority or the ability to fi ne “permitees” for failure to comply with traffi c control plans or permit requirements? If so how much are your fi nes and how many staff have enforcement/citation authority?
7. How long does it typically take for a permit to be issued after being requested?
8. Do you have a hotline for citizens to call to report traffi c problems or concerns?
9. What special provisions to traffi c control and right-of-way management do you apply to high-rise construction? Do you allow full street closures for these types of projects?
10. Do you have a traffi c operations control cen-ter and, if so, how is it used for construction traffi c control management?
In addition to posting the questions, Sacra-mento described its current response to the growth cycle. Sacramento explained that it has a Right-of-Way Management Group comprised of two staff members in the Street Division. Their responsibilities are to coordinate construc-tion activities, review traffi c control plans, and monitor safety, noise, and other issues associated with construction citywide. Because of a large amount of construction work, particularly in their downtown area (offi ce buildings, a light rail extension, and major utilities), they have also re-assigned a Supervising Engineer and a Construction Inspector to manage construction traffi c control and right-of-way issues downtown. They are also in the process of evaluating their overall construction traffi c control management program. The review and approval of traffi c control permits is coordinated with the Traffi c Engineering Services Section. There are also
Page 43
Chapter 5Online Discussion Forum
volume cannot be supported with the requested lane closures, night work is permitted between 10:00 pm and 5:00 am. San Diego is looking at establishing standards for these as part of the proposed changes to the shop drawing process.
The length of time it takes to get a traffi c control permit in San Diego depends on what method is used. Prepared design sheets take several months during design to develop but only take one week to permit during construction if the contractor does not propose changes. Shop drawings or changes to design traffi c control drawings usually take 45 days to get approved.
Paradise in Progress has a hotline for work in downtown, but this is for information only, since it does not issue the permits.
High rise construction permits are evaluated like all other permits on a case-by-case basis. So, unless extra capacity exists in the existing road to handle all hours of traffi c demand, continu-ous (day and night) closures are rare. Again, coordination through Paradise in Progress is encouraged.
San Diego does not have a traffi c operations control center.
San Francisco:
In 1964, San Francisco passed an ordinance granting authority for establishing the “Regula-tions for Working in San Francisco Streets.” This guide, called the “blue book,” is now in its 6th edition and available at www.sfgov.org/sfblue-book. It is used by other San Francisco agencies, utility crews, private contractors and others doing work in San Francisco streets to help convey the general rules under which work is conducted.
Section 1 of the blue book discusses the different types of permits required. For major construc-tion projects, a street space meeting is typically held before street space permits are issued. At
28 inspectors who monitor and inspect projects citywide. Sacramento has an administrative penalty ordinance that allows a levy of $500 fi nes for traffi c control plan violations.
Members of the agencies responded as follows:
San Diego:
Coincidentally, San Diego was also looking for improvements in the way that traffi c control plans were developed on projects. Currently the traffi c control permits are obtained by preparing and including traffi c control drawings as part of the design of municipal projects.
In San Diego, traffi c permits for downtown proj-ects are handled the same way as other permits, except that there are moratoriums during holiday seasons and during large events. Coordination of work in the downtown area is encouraged through the downtown partnership group, Paradise in Progress. You can see the web site at: http://www.downtownsandiego.org/index.cfm/fuseaction/about.abt_pp
The Development Services Department issues permits for projects by developers. Permits for CIP projects are handled by the its Field En-gineering Division. The Field Division traffi c control staff is comprised of one half-time senior engineer, one associate engineer, and assistant engineers. Its Developer Services Department has a similar number of staff.
The conditions of each permit (working times, number of lanes, etc.) are decided by the re-spective Development Services Department or Engineering and Capital Projects Group. In San Diego, there are no published standards for the conditions applicable to each permit. These are decided on a project-by-project basis, using the volume-versus-capacity of road. In general, major streets may be closed between 8:30 am and 3:30 pm, and other streets may be closed be-tween 7:00 am to 3:30 pm. If the daytime traffi c
Page 44
Annual Report Update 2005California Multi-Agency CIP Benchmarking Study
this meeting, held by the Department of Public Works (DPW), street space needs and allowances are discussed. The Department of Parking and Traffi c (DPT) administers (in cooperation with police enforcement) a program to issue Special Traffi c Permits when work is required outside the limits of the street space permits.
The Construction Section and the Special Proj-ects and Street-Use Section of the DPT’s Traffi c Engineering Division typically approve traffi c control plans and, for San Francisco projects, draft contract provisions and specifi cations that dictate traffi c control requirements as they relate to street, lane, and sidewalk usage.
In the Special Projects and Street Use Section, for example, there are fi ve staff members responsible for permit administration, review and approval. Not all staff members are dedicated full time to the permitting responsibilities. Staff includes a half-time clerk, an assistant engineer, an as-sociate engineer, a full engineer, and a senior engineer who is the section head. Enforcement of the permits is done by the San Francisco Police Department through a separate program administered by DPT called the “Safe Paths of Travel” (“SPOT”) program. Several offi cers have been trained to enforce the provisions of the “Regulations for Working in San Francisco Streets” and do so as funding permits. Enforce-ment is funded in part by paid citations. One Sergeant Inspector manages deployment of the enforcement offi cers.
Working times for various streets have long been established based on the input of various depart-ments in the San Francisco and are tabulated in the “Regulations for Working in San Francisco Streets.” The needs of the contractors and various projects are balanced with DPT’s duty to move goods and people safely and effi ciently. When exceptions are granted to the basic street space provisions, they are typically authorized by the DPW via Additional Street Space or by the DPT via a Special Traffi c Permit. Often, San Francisco
and contractors also solicit the input of the neigh-boring community when developing the traffi c control plans so as to minimize impacts.
San Francisco has a standard for working hours and the number of lanes that must remain open. The “Regulations for Working in San Francisco Streets” specifi es hours and lane requirements citywide. Furthermore, the streets of major traffi c importance have additional restrictions based on scheduled events, time of year and time of day.
Under Section 194.3 of the San Francisco Traf-fi c Code, the San Francisco Police Department may cite those who fail to comply with the pro-visions of the “Regulations for Working in San Francisco Streets.” Any person and/or business entity violating any provision of this section shall be deemed guilty of an infraction and upon conviction thereof shall be punished by a fi ne of $500 for the fi rst offense, $750 for the second offense within one year, and $975 for the third offense within one year. Any person and/or business entity that obstructs traffi c in violation of the provisions of this section four or more times within one year shall be deemed guilty of a misdemeanor and upon conviction thereof shall be punished by a fi ne of $1,000 unless the fourth or subsequent violation is for obstruction of traffi c without a valid Special Traffi c Permit, in which case they shall be guilty of a misdemeanor and upon conviction thereof shall be punished by a fi ne of $5,000 and/or a term of up to one year in jail. Under San Francisco contracts, the construction inspector can typically assess dam-ages for failure of the contractor to comply with the provisions of the specifi cations including the traffi c control plans.
To issue Special Traffi c Permits, the DPT requests a minimum of 48 hours to process a permit ap-plication. In some cases, depending on the com-plexity of the request, more time may be needed to legislate traffi c control changes, to notice and effect tow-away no parking, or discuss with other municipal agencies.
Page 45
Chapter 5Online Discussion Forum
The DPT does not maintain a hotline for the purposes of reporting concerns related to Special Traffi c Permits or work permitted under that process.
The same traffi c engineering principles apply to high rise construction as to other projects. When these projects cannot comply with the rules for working in the streets, variances are considered on a case-by-case basis. Full street closures are allowed in San Francisco often for special events but typically not for the duration of a construction project due to the nature of our dense city and the many needs of various street users. Under certain conditions with adequate detouring and traffi c control, street closures are allowed for brief periods. The DPT also at-tempts to accommodate pedestrian traffi c near construction sites.
The DPT is presently developing an Integrated Transportation Management System and Traffi c Management Center. The DPT’s mission, vision and goals of the “SFgo” team can be found at http://www.sfgo.org.
San Jose:
Traffi c control plans in the downtown area are reviewed by the Project Inspector, the Principal Construction Inspector (PCI), and the Depart-ment of Transportation (DOT) Downtown Co-ordinator. The DOT Downtown Coordinator is responsible for managing the traffi c operations which impact the downtown area. For long-term sidewalk closures and lane closures, a revocable encroachment permit is required and reviewed by the project inspector, the PCI, the project engineer, and Re-Development Agency (RDA) as required.
The Department of Public Works (DPW) and the DOT review traffi c control plans for down-town. Public Works approves them and then issues revocable encroachment permits for any
long-term lane and sidewalk closures.
Working times and closures are dictated by the Traffi c Ordinance in San Jose Municipal Code, but can be modifi ed with input from the inspec-tors and DOT and if approved by the project engineer.
The typical working hours in the downtown area are 8:30 am to 3:30 pm or, if the project is near a signalized intersection, 9 am to 3 pm. Typically, on streets with two or more traffi c lanes in each direction, only one lane can be closed.
The San Jose Police Department can issue cita-tions according to the Municipal Code, Chapter 11.14, “Limitation of Hours of Construction in City Streets.” Otherwise there are no other citations given for failure to comply. Contrac-tors that do not comply are required correct the problem or shut down operations.
There is no specifi c traffi c hotline. Citizen con-cerns can be directed to the Help Desk (408-277-4000), DOT (408-277-4373) or directly to the DPW Storm/Utility Section at 408-998-6090.
In the case of high-rise construction, full street closures are rarely necessary. For certain crane and concrete pumping operations, there are requests to take more than one lane and for longer working hours, such as for 12 to 24-hour concrete placements. There are also requests to close the sidewalk or take a traffi c lane to set up a crane or trailers in the street for long-term use. In these cases, a revocable permit is required after a plan is submitted showing things like re-strip-ing of lanes, K-rail installation, or traffi c signal modifi cations. Placing trailers in the street is not encouraged. On temporary lane closures where more than one lane will be taken, such as for material deliveries that necessitate a crane and for concrete pumping operations, traffi c control plans are reviewed in the fi eld with the developer’s contractors, DOT, RDA, and DPW inspectors. If a pedestrian-covered walkway is needed next
Page 46
Annual Report Update 2005California Multi-Agency CIP Benchmarking Study
to the site, the developer’s engineer submits a plan to DPW for review prior to receiving a revocable permit.
In San Jose, the DOT functions as the traffi c operations center.
Los Angeles:
In Los Angeles, an applicant applies for a permit online or at the Public Counter. Depending on specifi cs, the applicant will be asked to obtain Transit and Transportation Construction Traf-fic Management Committee (TCTMC) ap-proval. TCTMC meets weekly and it accepts both walk-ins and agenda items. Complicated permits are taken under advisement where both the Los Angeles Department of Transportation (LADOT) and Los Angeles Bureau of Street Services (LABSS) are allowed adequate time to review plans and perform fi eld investigations prior to recommending for approval at a subse-quent TCTMC meeting.
The LADOT approves traffi c control plans and makes street lane requirements. The LABSS issues street use permits that impact pedestrian paths of travel.
A Traffi c Engineer approves Traffi c Plans. A Civil Engineer Associate III approves Utility Plans. A Senior Inspector in Contract Administration performs inspections. The TCTMC Chair is a Civil Engineer/Civil Engineering Associate III. The Street Use inspector is a Senior Street Service Investigator II.
The TCTMC approves work hours based on traffi c conditions and other project schedules. For example, if construction of a signifi cant project was scheduled to close a street for pile installation, then no other construction work would be approved along the detour routes of that project.
Typical work hours are 9:00 am to 3:30 pm during weekdays (non-peak hours) and 8:00
am to 6:00 pm on Saturdays. LADOT typically requires that a minimum of one lane of traffi c be maintained in each direction.
If the contractor does not have TCTMC ap-proval, inspectors will shut down the work until TCTMC approval is obtained. TCTMC’s fee is $220/lane reduction/day/block impacted. Also, the LABSS can shut down the project and either issue a Notice to Pay the Fee to Obtain the Permit or a citation which is resolved by the court with a bail fee.
For small projects, permits are issued on the same day at the TCTMC meeting. Others may take a week. If the traffi c plans require review by LADOT, it can take a couple of weeks.
Los Angeles has a hotline to process complaints on an expedited basis, which can be reached by dialing 311 within Los Angeles. However, com-mittees overseeing major construction projects have public relations offi ces to address public complaints. Public complaints can also go to City Council Offi ces and Council fi eld offi ces.
For high rise projects, LADOT determines detours and may allow full street closure. Full street closure requires Board of Public Works (BPW) approval for major streets. BPW approval can take as long as a month or more.
LADOT has a Traffi c Operation Center (TOC). Typically LADOT requires CCTV cameras along major transportation construction projects. Dur-ing construction, LADOT monitors traffi c from TOC and corrects traffi c impacts by either con-trolling signal timing or instructing contractors to remove legal/illegal traffi c lane closures.
Other Comments:
During the discussions on the construction traffi c control issues, San Jose made additional inquiries and received responses as follows:
1) Do your Municipal Code, policies, or prac-
Page 47
Chapter 5Online Discussion Forum
tices direct who is qualifi ed to direct traffi c at construction sites?
San Francisco responded that its codes and poli-cies do not explicitly state who is qualifi ed. How-ever, the agency recognizes the need to certify its own personnel and are investigating a course to be set up through the Technology Transfer Pro-gram at the University of California, Berkeley’s Institute of Transportation Studies. The curricu-lum would be California Occupational Safety and Health Administration (OSHA)-compliant and incorporate requirements from the new Manual on Uniform Traffi c Control Devices and its California Supplement.
2) Do you require the contractor to have a Certi-fi ed Flagger (if so, what certifi cation?) or do you require police offi cers to direct traffi c under certain situations?
San Francisco responded that generally it is the contractor’s responsibility to staff personnel with the proper training. However, it is its expectation that the training follow a curriculum similar to that developed by the National Safety Council and that the training have a certifi cation process that is compliant with California OSHA and the California Code of Regulations.
San Francisco chooses to use either offi cers or fl aggers depending on the individual location. Following are some examples.
� When lane closures reduce capacity such that a longer green light is needed at the intersection to serve a phase, police of-fi cers or parking control offi cers will be deployed to manually override the traffi c signal and/or direct traffi c in the intersec-tion.
� When double-parking must be pro-hibited around a site, offi cers will be deployed to discourage double-parking in the area.
� When pedestrian volumes are heavy and
strict control is required, offi cers will be assigned to the site.
� When a reversible lane situation is es-tablished, traffi c will be controlled using fl aggers on residential streets or minor streets. Offi cers may be added if the work is on a major collector or arterial.
� When a contractor needs to close the sidewalk for brief periods (e.g., when hoisting rebar off a fl atbed and over the sidewalk for 45 seconds or less), one or two fl aggers are required to control pedestrians. Likewise, when a sidewalk section is closed and pedestrians must be redirected to the other side of the street, fl aggers are typically stationed at the cor-ners. San Francisco’s experience is that fl aggers and offi cers are equally capable of following the engineer’s traffi c control instructions on the permit and directing vehicular and pedestrian traffi c, but that offi cers gain a modicum of better compli-ance because they are more authoritative and the public responds better to them. This can be important for pedestrian control.
Oakland responded that it requires the contrac-tor receiving the permit to take responsibility for traffi c control and it has no specifi cations that qualify who can direct traffi c. The police department rarely gets involved in traffi c con-trol and the fl aggers are required at locations meeting Work Area Traffi c Control Handbook standards.
B. STREET CONSTRUCTION COORDI-NATION
San Francisco initiated a discussion of coordina-tion of construction within right-of-ways. The excavation of newly constructed or re-paved streets was a problem faced by many of the agen-cies. Some agencies implement time-specifi c
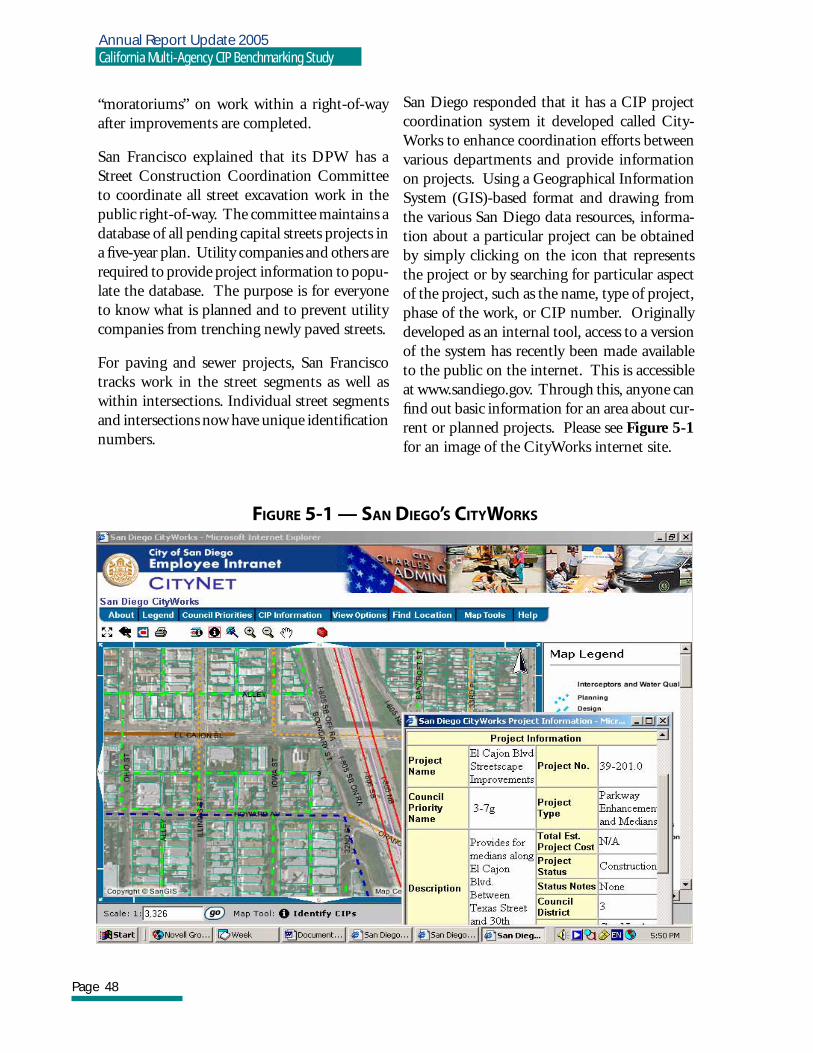
Page 48
Annual Report Update 2005California Multi-Agency CIP Benchmarking Study
“moratoriums” on work within a right-of-way after improvements are completed.
San Francisco explained that its DPW has a Street Construction Coordination Committee to coordinate all street excavation work in the public right-of-way. The committee maintains a database of all pending capital streets projects in a fi ve-year plan. Utility companies and others are required to provide project information to popu-late the database. The purpose is for everyone to know what is planned and to prevent utility companies from trenching newly paved streets.
For paving and sewer projects, San Francisco tracks work in the street segments as well as within intersections. Individual street segments and intersections now have unique identifi cation numbers.
San Diego responded that it has a CIP project coordination system it developed called City-Works to enhance coordination efforts between various departments and provide information on projects. Using a Geographical Information System (GIS)-based format and drawing from the various San Diego data resources, informa-tion about a particular project can be obtained by simply clicking on the icon that represents the project or by searching for particular aspect of the project, such as the name, type of project, phase of the work, or CIP number. Originally developed as an internal tool, access to a version of the system has recently been made available to the public on the internet. This is accessible at www.sandiego.gov. Through this, anyone can fi nd out basic information for an area about cur-rent or planned projects. Please see Figure 5-1 for an image of the CityWorks internet site.
FIGURE 5-1 — SAN DIEGO’S CITYWORKS
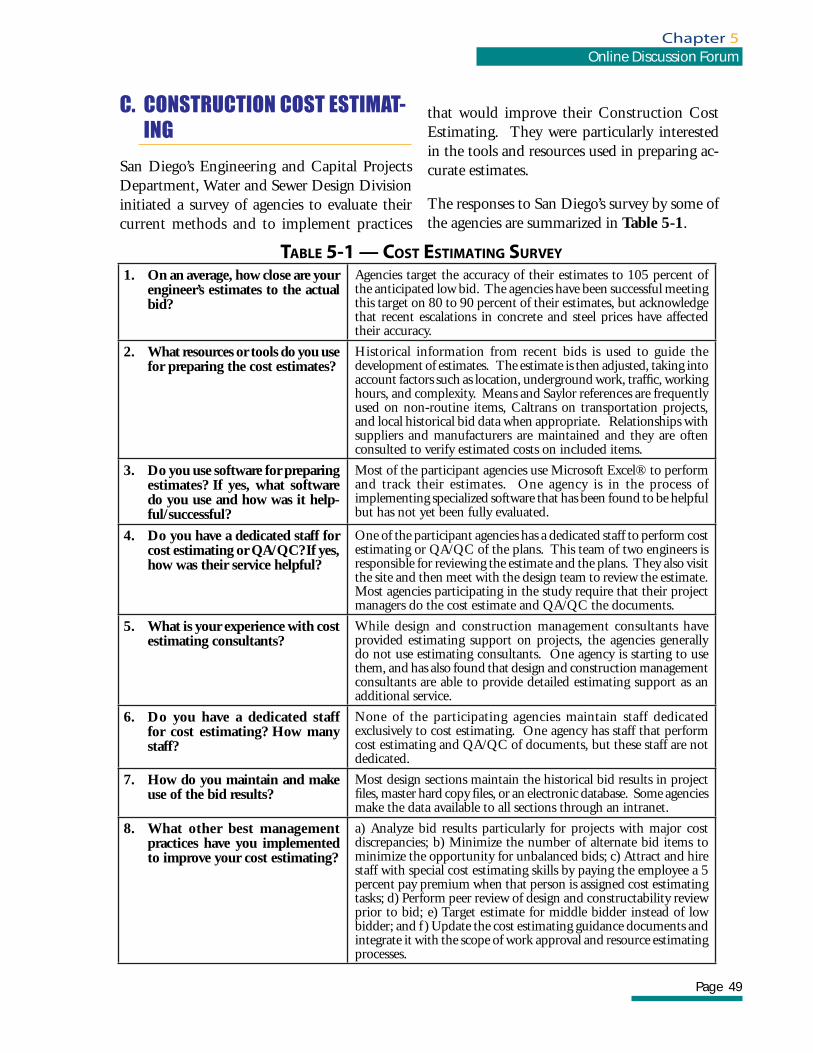
Page 49
Chapter 5Online Discussion Forum
C. CONSTRUCTION COST ESTIMAT-ING
San Diego’s Engineering and Capital Projects Department, Water and Sewer Design Division initiated a survey of agencies to evaluate their current methods and to implement practices
that would improve their Construction Cost Estimating. They were particularly interested in the tools and resources used in preparing ac-curate estimates.
The responses to San Diego’s survey by some of the agencies are summarized in Table 5-1.
TABLE 5-1 — COST ESTIMATING SURVEY
1. On an average, how close are your engineer’s estimates to the actual bid?
Agencies target the accuracy of their estimates to 105 percent of the anticipated low bid. The agencies have been successful meeting this target on 80 to 90 percent of their estimates, but acknowledge that recent escalations in concrete and steel prices have affected their accuracy.
2. What resources or tools do you use for preparing the cost estimates?
Historical information from recent bids is used to guide the development of estimates. The estimate is then adjusted, taking into account factors such as location, underground work, traffi c, working hours, and complexity. Means and Saylor references are frequently used on non-routine items, Caltrans on transportation projects, and local historical bid data when appropriate. Relationships with suppliers and manufacturers are maintained and they are often consulted to verify estimated costs on included items.
3. Do you use software for preparing estimates? If yes, what software do you use and how was it help-ful/successful?
Most of the participant agencies use Microsoft Excel® to perform and track their estimates. One agency is in the process of implementing specialized software that has been found to be helpful but has not yet been fully evaluated.
4. Do you have a dedicated staff for cost estimating or QA/QC? If yes, how was their service helpful?
One of the participant agencies has a dedicated staff to perform cost estimating or QA/QC of the plans. This team of two engineers is responsible for reviewing the estimate and the plans. They also visit the site and then meet with the design team to review the estimate. Most agencies participating in the study require that their project managers do the cost estimate and QA/QC the documents.
5. What is your experience with cost estimating consultants?
While design and construction management consultants have provided estimating support on projects, the agencies generally do not use estimating consultants. One agency is starting to use them, and has also found that design and construction management consultants are able to provide detailed estimating support as an additional service.
6. Do you have a dedicated staff for cost estimating? How many staff?
None of the participating agencies maintain staff dedicated exclusively to cost estimating. One agency has staff that perform cost estimating and QA/QC of documents, but these staff are not dedicated.
7. How do you maintain and make use of the bid results?
Most design sections maintain the historical bid results in project fi les, master hard copy fi les, or an electronic database. Some agencies make the data available to all sections through an intranet.
8. What other best management practices have you implemented to improve your cost estimating?
a) Analyze bid results particularly for projects with major cost discrepancies; b) Minimize the number of alternate bid items to minimize the opportunity for unbalanced bids; c) Attract and hire staff with special cost estimating skills by paying the employee a 5 percent pay premium when that person is assigned cost estimating tasks; d) Perform peer review of design and constructability review prior to bid; e) Target estimate for middle bidder instead of low bidder; and f ) Update the cost estimating guidance documents and integrate it with the scope of work approval and resource estimating processes.
Page 50
Annual Report Update 2005California Multi-Agency CIP Benchmarking Study
D. BOND MEASURE CONSIDER-ATIONS
Long Beach was considering a bond measure for various infrastructure improvements and looked for information to present to its Council on what types of bond measures other cities have passed, what amounts were approved, and when the bond measures were approved. The participating agencies responded and Long Beach assembled the matrix shown in Table 5-2.
E. ONLINE BID ADVERTISING, BID DOCUMENTS, AND BIDDING
There were three online discussion topics relating to making effective use of the internet with re-spect to bidding. Many of the agencies currently make bid notices available to potential bidders on their websites or on internet bidding service sites. At least two of the agencies also make bid documents available to contractors online. The requirement for signed and notarized bid bonds is a current challenge faced by the agencies in accepting actual bids online.
Long Beach has a contract with “Planet Bids” (www.planetbids.com), which has customized its software to meet Long Beach’s needs. Using this program, Long Beach provides online notices to vendors and contractors inviting bids and makes the bid documents themselves available. In addition, Long Beach now accepts bids online for contracts less than $100,000. Projects over $100,000 require bid bonds and Long Beach has not been able to create a workable solution to accept bid bonds online.
After an initial learning curve for Long Beach, vendors, and contractors, Long Beach has ob-served that the online bid system has increased
the number of notices being received by potential bidders and notices have been received much more quickly than by the more traditional trade publications or newspaper ads.
Long Beach has noted that a peripheral benefi t of making bid notices and documents available on line is that a database of contractors interested in doing work for the agency is easily created.
At this time, most agencies do not issue plans and specifi cations electronically. Paper sets of plans and specs are issued and contractors are charged, usually based on the estimated value of the project.
F. COST IMPACTS OF LEED CERTI-FICATION AND IN-HOUSE GREEN DESIGN TEAMS
San Francisco initiated a discussion on the pro-motion of Green Design on new and existing fa-cilities. The primary questions explored whether agencies had adopted ordinances requiring that designs meet or exceed LEED certification requirements and, if so, how had their design budgets been impacted.
It was found that at only one of the agencies had a Council-adopted ordinance that required LEED design as a standard, and in this instance it was only required on projects over 7,500 square feet. Other agencies had completed LEED projects or had LEED projects underway, some of the projects having received statewide or national recognition. Agencies were inclined to fi nd a way to train in-house personnel to certify the projects. Agencies were also budgeting between 2 and 5 percent more for LEED projects. The agencies will continue to study this issue.
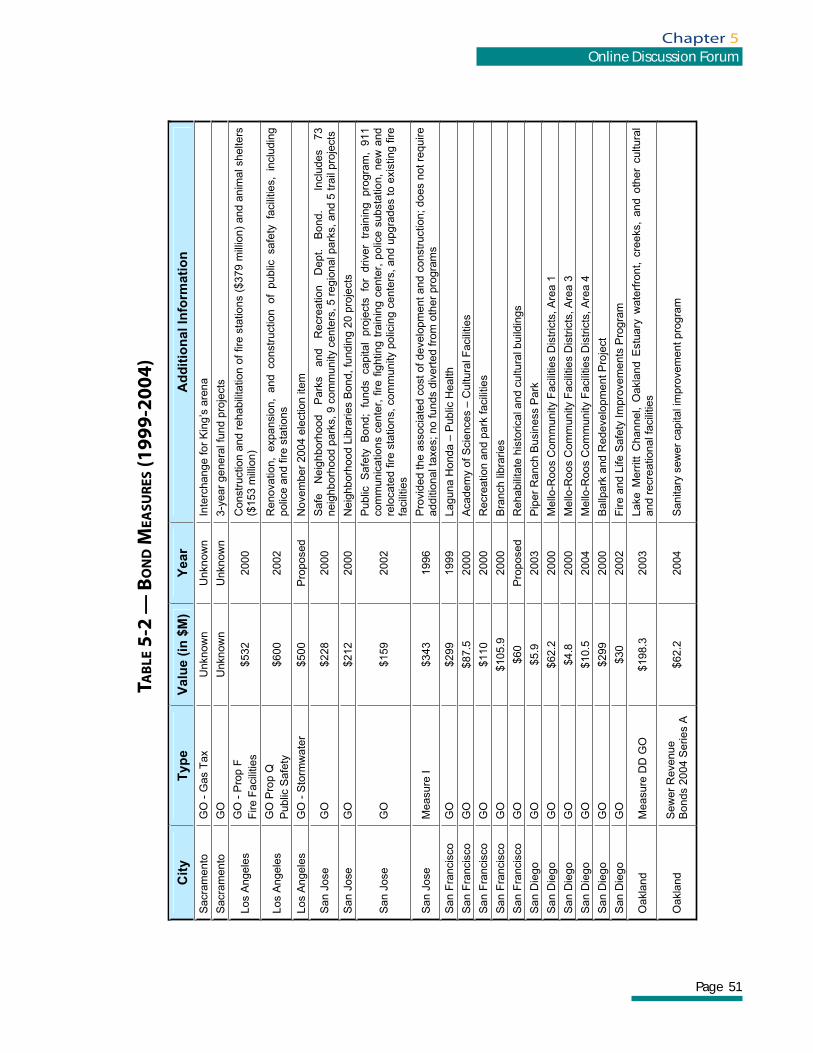
Page 51
Chapter 5Online Discussion Forum
TAB
LE 5
-2 —
BO
ND
MEA
SUR
ES (1
999-
2004
)
Cit
y
Typ
e
Va
lue
(in
$M
) Y
ear
Ad
dit
ion
al
Info
rma
tio
n
Sa
cra
me
nto
G
O -
Gas T
ax
Unkn
ow
n
Unkn
ow
n
Inte
rcha
nge
fo
r K
ing
’s a
ren
a
Sa
cra
me
nto
G
O
Unkn
ow
n
Unkn
ow
n
3-y
ear
ge
ne
ral fu
nd
pro
jects
Lo
s A
nge
les
GO
- P
rop
F
Fire F
acili
ties
$5
32
2
00
0
Co
nstr
uctio
n a
nd
re
hab
ilita
tio
n o
f fire
sta
tio
ns (
$37
9 m
illio
n)
an
d a
nim
al sh
elte
rs
($153 m
illio
n)
Lo
s A
nge
les
GO
Pro
p Q
Public
Safe
ty
$6
00
2
00
2
Re
no
va
tio
n,
exp
ansio
n,
an
d co
nstr
uctio
n o
f p
ub
lic sa
fety
fa
cili
ties,
inclu
din
g
polic
e a
nd fire s
tations
Lo
s A
nge
les
GO
- S
torm
wa
ter
$5
00
P
rop
osed
N
ove
mbe
r 200
4 e
lectio
n ite
m
Sa
n J
ose
G
O
$2
28
2
00
0
Sa
fe
Ne
igh
bo
rhoo
d
Park
s
and
R
ecre
atio
n
De
pt.
Bo
nd
.
Inclu
des
73
neig
hborh
ood p
ark
s, 9 c
om
munity c
ente
rs, 5 r
egio
nal p
ark
s, and 5
tra
il pro
jects
Sa
n J
ose
G
O
$2
12
2
00
0
Ne
igh
borh
ood
Lib
rari
es B
on
d, fu
nd
ing
20
pro
jects
Sa
n J
ose
G
O
$1
59
2
00
2
Pu
blic
S
afe
ty
Bo
nd
; fu
nds
ca
pita
l p
roje
cts
fo
r d
rive
r tr
ain
ing
pro
gra
m,
911
co
mm
un
ica
tion
s c
en
ter,
fire
fig
htin
g t
rain
ing
ce
nte
r, p
olic
e s
ub
sta
tio
n,
ne
w a
nd
re
locate
d f
ire s
tations,
com
munity p
olic
ing c
ente
rs,
and u
pgra
des t
o e
xis
ting f
ire
facili
tie
s
Sa
n J
ose
M
ea
su
re I
$3
43
1
99
6
Pro
vid
ed
the
associa
ted
cost o
f d
eve
lopm
en
t a
nd
co
nstr
uctio
n;
do
es n
ot re
qu
ire
additio
nal ta
xes; no funds d
ivert
ed fro
m o
ther
pro
gra
ms
Sa
n F
rancis
co
G
O
$2
99
1
99
9
La
gun
a H
on
da
– P
ub
lic H
ea
lth
Sa
n F
rancis
co
G
O
$8
7.5
2
00
0
Aca
dem
y o
f S
cie
nces –
Cu
ltu
ral F
acili
ties
Sa
n F
rancis
co
G
O
$1
10
2
00
0
Recre
atio
n a
nd
pa
rk fa
cili
ties
Sa
n F
rancis
co
G
O
$1
05
.9
20
00
B
ranch
lib
rarie
s
Sa
n F
rancis
co
G
O
$6
0
Pro
posed
R
eha
bili
tate
his
torica
l a
nd
cu
ltu
ral b
uild
ing
s
Sa
n D
iego
G
O
$5
.9
20
03
P
ipe
r R
anch
Bu
sin
ess P
ark
Sa
n D
iego
G
O
$6
2.2
2
00
0
Me
llo-R
oo
s C
om
mu
nity F
acili
tie
s D
istr
icts
, A
rea
1
Sa
n D
iego
G
O
$4
.8
20
00
M
ello
-Roo
s C
om
mu
nity F
acili
tie
s D
istr
icts
, A
rea
3
Sa
n D
iego
G
O
$1
0.5
2
00
4
Me
llo-R
oo
s C
om
mu
nity F
acili
tie
s D
istr
icts
, A
rea
4
Sa
n D
iego
G
O
$2
99
2
00
0
Ba
llpa
rk a
nd
Re
de
ve
lop
me
nt P
roje
ct
Sa
n D
iego
G
O
$3
0
20
02
F
ire
and
Life
Sa
fety
Im
pro
ve
me
nts
Pro
gra
m
Oa
kla
nd
M
ea
su
re D
D G
O
$1
98
.3
20
03
Lake M
err
itt
Channel, O
akla
nd E
stu
ary
wate
rfro
nt, c
ree
ks,
and o
ther
cultura
l a
nd
recre
ation
al fa
cili
ties
Oa
kla
nd
S
ew
er
Re
venu
e
Bonds 2
004 S
eries A
$
62
.2
20
04
S
an
ita
ry s
ew
er
cap
ita
l im
pro
ve
men
t p
rog
ram
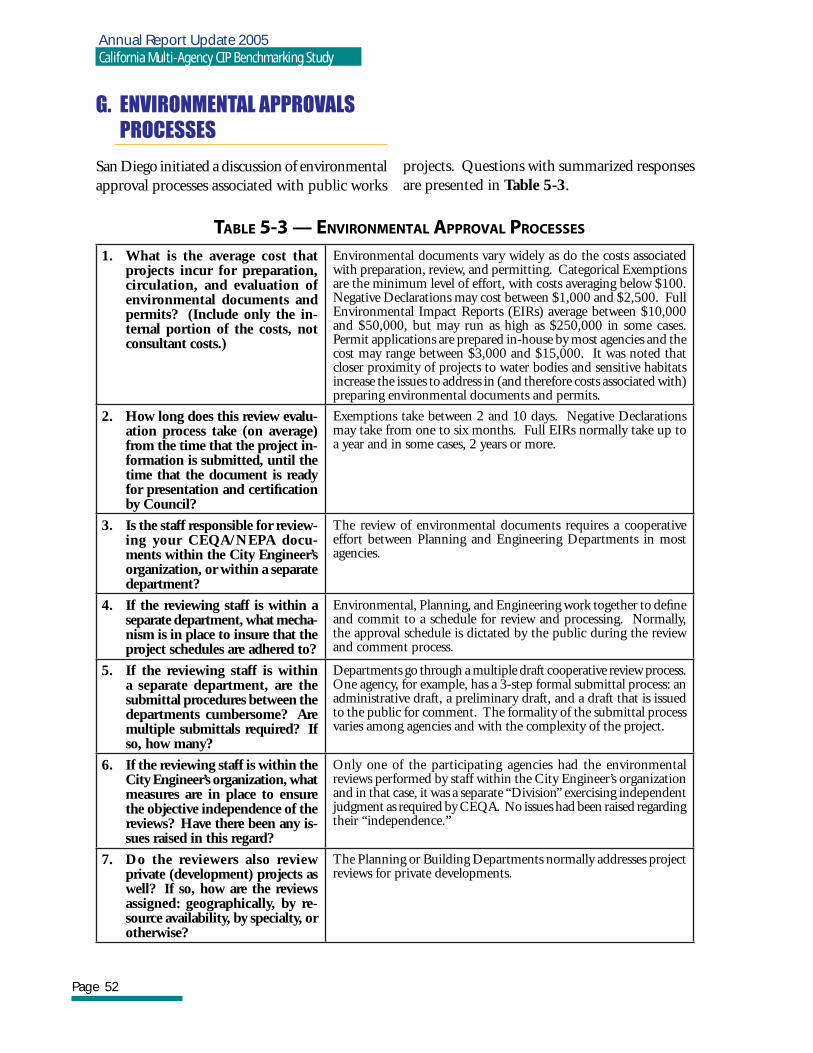
Page 52
Annual Report Update 2005California Multi-Agency CIP Benchmarking Study
G. ENVIRONMENTAL APPROVALS PROCESSES
San Diego initiated a discussion of environmental approval processes associated with public works
projects. Questions with summarized responses are presented in Table 5-3.
TABLE 5-3 — ENVIRONMENTAL APPROVAL PROCESSES
1. What is the average cost that projects incur for preparation, circulation, and evaluation of environmental documents and permits? (Include only the in-ternal portion of the costs, not consultant costs.)
Environmental documents vary widely as do the costs associated with preparation, review, and permitting. Categorical Exemptions are the minimum level of effort, with costs averaging below $100. Negative Declarations may cost between $1,000 and $2,500. Full Environmental Impact Reports (EIRs) average between $10,000 and $50,000, but may run as high as $250,000 in some cases. Permit applications are prepared in-house by most agencies and the cost may range between $3,000 and $15,000. It was noted that closer proximity of projects to water bodies and sensitive habitats increase the issues to address in (and therefore costs associated with) preparing environmental documents and permits.
2. How long does this review evalu-ation process take (on average) from the time that the project in-formation is submitted, until the time that the document is ready for presentation and certifi cation by Council?
Exemptions take between 2 and 10 days. Negative Declarations may take from one to six months. Full EIRs normally take up to a year and in some cases, 2 years or more.
3. Is the staff responsible for review-ing your CEQA/NEPA docu-ments within the City Engineer’s organization, or within a separate department?
The review of environmental documents requires a cooperative effort between Planning and Engineering Departments in most agencies.
4. If the reviewing staff is within a separate department, what mecha-nism is in place to insure that the project schedules are adhered to?
Environmental, Planning, and Engineering work together to defi ne and commit to a schedule for review and processing. Normally, the approval schedule is dictated by the public during the review and comment process.
5. If the reviewing staff is within a separate department, are the submittal procedures between the departments cumbersome? Are multiple submittals required? If so, how many?
Departments go through a multiple draft cooperative review process. One agency, for example, has a 3-step formal submittal process: an administrative draft, a preliminary draft, and a draft that is issued to the public for comment. The formality of the submittal process varies among agencies and with the complexity of the project.
6. If the reviewing staff is within the City Engineer’s organization, what measures are in place to ensure the objective independence of the reviews? Have there been any is-sues raised in this regard?
Only one of the participating agencies had the environmental reviews performed by staff within the City Engineer’s organization and in that case, it was a separate “Division” exercising independent judgment as required by CEQA. No issues had been raised regarding their “independence.”
7. Do the reviewers also review private (development) projects as well? If so, how are the reviews assigned: geographically, by re-source availability, by specialty, or otherwise?
The Planning or Building Departments normally addresses project reviews for private developments.
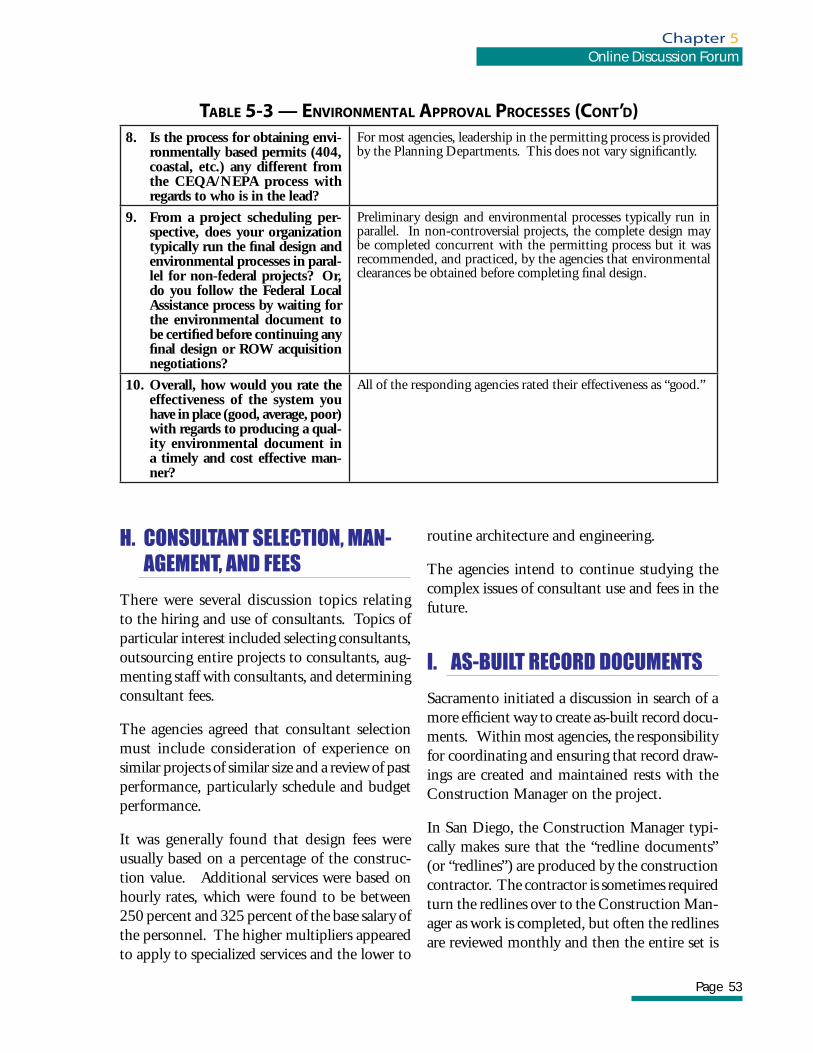
Page 53
Chapter 5Online Discussion Forum
H. CONSULTANT SELECTION, MAN-AGEMENT, AND FEES
There were several discussion topics relating to the hiring and use of consultants. Topics of particular interest included selecting consultants, outsourcing entire projects to consultants, aug-menting staff with consultants, and determining consultant fees.
The agencies agreed that consultant selection must include consideration of experience on similar projects of similar size and a review of past performance, particularly schedule and budget performance.
It was generally found that design fees were usually based on a percentage of the construc-tion value. Additional services were based on hourly rates, which were found to be between 250 percent and 325 percent of the base salary of the personnel. The higher multipliers appeared to apply to specialized services and the lower to
routine architecture and engineering.
The agencies intend to continue studying the complex issues of consultant use and fees in the future.
I. AS-BUILT RECORD DOCUMENTS
Sacramento initiated a discussion in search of a more effi cient way to create as-built record docu-ments. Within most agencies, the responsibility for coordinating and ensuring that record draw-ings are created and maintained rests with the Construction Manager on the project.
In San Diego, the Construction Manager typi-cally makes sure that the “redline documents” (or “redlines”) are produced by the construction contractor. The contractor is sometimes required turn the redlines over to the Construction Man-ager as work is completed, but often the redlines are reviewed monthly and then the entire set is
TABLE 5-3 — ENVIRONMENTAL APPROVAL PROCESSES (CONT’D)8. Is the process for obtaining envi-
ronmentally based permits (404, coastal, etc.) any different from the CEQA/NEPA process with regards to who is in the lead?
For most agencies, leadership in the permitting process is provided by the Planning Departments. This does not vary signifi cantly.
9. From a project scheduling per-spective, does your organization typically run the fi nal design and environmental processes in paral-lel for non-federal projects? Or, do you follow the Federal Local Assistance process by waiting for the environmental document to be certifi ed before continuing any fi nal design or ROW acquisition negotiations?
Preliminary design and environmental processes typically run in parallel. In non-controversial projects, the complete design may be completed concurrent with the permitting process but it was recommended, and practiced, by the agencies that environmental clearances be obtained before completing fi nal design.
10. Overall, how would you rate the effectiveness of the system you have in place (good, average, poor) with regards to producing a qual-ity environmental document in a timely and cost effective man-ner?
All of the responding agencies rated their effectiveness as “good.”
Page 54
Annual Report Update 2005California Multi-Agency CIP Benchmarking Study
turned over at completion. Once received by the Construction Manager, they are transmitted to the Project Manager who updates the electronic fi les, marks them “as-built,” and fi les them with the records section.
In Sacramento’s Department of Utilities, the redlines are received from the contractor and checked by the Construction Inspector and Con-struction Manager. A Project Manager approves the redlines and a Supervising Technician tracks the drafting effort (in-house or by consultant) to digitally update the electronic fi les. When the update is complete, the as-builts are used by the GIS group to update the Facility On-line Information System and maps.
In Long Beach, Project Managers are responsible for delivering as-built drawings to the records section. If the drawings were done in-house, the AutoCAD® fi les are updated to as-built, signed, and fi led. If an outside consultant did the draw-
ings, the consultant’s contract requires them to produce the as-built drawings and submit them to Long Beach.
San Francisco’s current procedure is to scan the contractor’s redlines and archive both the hard copy redlines and scanned fi le in its records man-agement system. San Francisco has found that eliminating the step of transferring the changes via AutoCAD® saves time and effort. For most types of projects, the likelihood of needing an updated AutoCAD® drawing in the future is low. If a need arose, San Francisco would incorporate the changes at that time. Under this procedure, the as-built information is not lost; it is just not digitized. For certain types of projects, such as sewer and traffi c signal project, the changes are incorporated onto the AutoCAD® fi le if the client department requires it for their asset manage-ment purposes. This service would be included in the fees charged to the client department.

CHAPTER
Conclusion6
Page 55
A. PERFORMANCE DATA IMPROVE-MENT
The results of the performance bench-marking showed there are outstanding data gaps to be fi lled. Most agencies
provide a large number of small projects (less than $5 million) and a few large projects (more than $10 million). As a result, there are data gaps in the medium size project range in nearly all the graphs. The performance models are mainly driven by a large number of very small projects. The models can be made more reliable for medium-sized and larger-sized projects if more data are collected.
It is also observed that agencies do not contrib-ute data equally to the various classifi cations. More reliable models will be developed as the distribution of the number of projects becomes more uniform among all classifi cations for each agency.
Monitoring and correcting the data collection procedures by the participating agencies is im-portant to improve confi dence in the data and obtain consistent results from the analysis.
It is recommended that to further improve the R2 values, outlier analysis be performed on the whole dataset, identifying projects submitted throughout the Study phases for possible elimi-nation from analysis. Re-evaluation of P-values is also recommended. P-values indicate whether or not enough data were used for statistically-sig-nifi cant conclusion to be drawn from an analysis. This was originally done in a special analysis included in the Study 2002 report and has not been repeated. Generally speaking, the selection
of desirable P-values is purely subjective. Typi-cally, P values in the range of 0.10 to 0.05 or lower are considered desirable.
B. UPDATE 2005 OBSERVATIONS
� Improvement in project delivery per-centages due to implementation of spe-cifi c BMPs cannot yet be directly linked. “Processes” become effective “practices” only after a learning curve and full im-plementation on projects. Therefore, obtaining empirical evidence of trends is expected to take several years.
� Generally, the relative cost of design, construction management, and overall project delivery decreases as total con-struction cost increases. This is consis-tent with what is intuitively expected.
� Median and average TCC values of projects have decreased over time. This may be because agencies can more easily assign small projects to one project clas-sifi cation than large projects, which may include broader scopes and components. Another reason may be that the agencies complete small projects more often than large projects and can therefore submit more of them to the Study.
� Project delivery costs as a percentage of TCC are increasing. This may be be-cause project delivery costs as a percent-age of TCC tend to be higher on smaller projects than larger ones, so some of the increase in project delivery costs may be explained by the decreasing average TCC of projects discussed above. Agencies also
Page 56
Annual Report Update 2005California Multi-Agency CIP Benchmarking Study
report that as time goes on, it costs more to meet increasingly stringent regulatory and municipal requirements. Better data tracking and collection may have also resulted in higher reported project delivery costs.
� Change orders may be limited automati-cally by the project’s contingency budget, typically 10 percent of TCC.
� The design cost, when consultant usage exceeded 25 percent of project delivery, was generally around 6 or 7 percent
higher than when there was no consul-tant usage.
� The increase in design costs associated with using consultants on smaller or more specialized projects may be justifi ed in cases where consultants offer special-ized technical expertise, the projects are complex, there is an aggressive project schedule, there are peak workload de-mands that can’t easily be met using in-house staff, or there are other resource limitations on in-house staff.
Page 57
Chapter 6Conclusion
C. ACKNOWLEDGEMENTS
The participation and contribution of the following individuals to the Study is grate-fully acknowledged. This work would not have been possible without their contributions.
Study Team:
Gary Lee Moore, P.E., City EngineerCity of Los Angeles, Department of Public Works, Bureau of Engineering650 South Spring Street, Suite 200Los Angeles, CA 90014T 213.847.8766 F 213.847.9603 E [email protected]
Alex J. Vidaurrazaga, S.E., Principal Civil EngineerCity of Los Angeles, Department of Public Works, Bureau of EngineeringStructural Engineering Division650 South Spring Street, Suite 400Los Angeles, CA 90014T 213.847.8773 F 213.847.8999 E [email protected]
Dorine Moreno, CADD Group ManagerCity of Los Angeles, Department of Public Works, Bureau of Engineering12000 Vista Del Mar, Pregerson Building, Suite 200Playa del Rey, CA 90293T 310.648.6222 F 310.648.6155 E [email protected]
Joseph Wojslaw, P.E., Consultant ManagerMWH12000 Vista Del Mar, Pregerson Building, Suite 200Playa Del Rey, CA 90293T 310.648.6102 F 310.648.6155 E [email protected]
Bill Lacher, CCM, LEEDVanir Construction Management, Inc.3435 Wilshire Boulevard, Suite 2050Los Angeles, CA 90010-2006T 213.487.1145 F 213.487.1051 E [email protected]
Meha Patel, ConsultantMWH626 Wilshire Blvd., Suite 850Los Angeles, CA 90017T 213.316.7000 F 213.316.7048 E [email protected]
Page 58
Annual Report Update 2005California Multi-Agency CIP Benchmarking Study
Project Team:
Christine Andersen, DirectorCity of Long Beach, Department of Public Works333 W. Ocean Blvd., 9th FloorLong Beach, CA 90802T 562.570.6641
Mark Christoffels, City EngineerCity of Long Beach, Department of Public Works333 W. Ocean Blvd., 9th FloorLong Beach, CA 90802T 562.570.6771 F 562.570.6012 E [email protected]
Edward Villanueva, Administrative Analyst City of Long Beach, Department of Public Works333 W. Ocean Blvd., 9th FloorLong Beach, CA 90802T 562.570.6465 F 562.570.6012 E [email protected]
Roger Beaman, Administrative AnalystCity of Long Beach, Department of Public Works333 W. Ocean Blvd., 10th FloorLong Beach, CA 90802T 562.570.6895 F 562.570.6012 E [email protected]
Raul Godinez, P.E., DirectorCity of Oakland, Public Works Agency250 Frank H. Ogawa Plaza, Suite 4314Oakland, CA 94612T 510.238.4470 F 510.238.6412 E [email protected]
Michael Neary, P.E., Assistant Director, Design and Construction Services Dept. City of Oakland, Public Works Agency250 Frank H. Ogawa Plaza, Suite 4314Oakland, CA 94612T 510.238.6659 F 510.238.7227 E [email protected]
David Lau, P.E., Project Delivery ManagerCity of Oakland, Public Works Agency250 Frank H. Ogawa Plaza, Suite 4314Oakland, CA 94612T 510.238.7131 F 510.238.2085 E [email protected]
Page 59
Chapter 6Conclusion
Gus Amirzehni, Supervising Civil Engineer City of Oakland, Public Works Agency250 Frank H. Ogawa Plaza, Suite 4314Oakland, CA 94612T 510.238.6601 F 510.238.7227 E [email protected]
Fuad Sweiss, Engineering Design & ROW Manager City of Oakland, Public Works Agency250 Frank H. Ogawa Plaza, Suite 4314Oakland, CA 94612T 510.238.6607 F 510.238.7227 E [email protected]
Bob Williamson, Supervising ArchitectCity of Sacramento, Department of General Services921 10th Street, 7th FloorSacramento, CA 95814T 916.808.8430 F 916.808.8337 E [email protected]
Shirley Wong, Administrative AnalystCity of Sacramento, Department of General Services921 10th Street, 7th FloorSacramento, CA 95814T 916.808.5879 F 916.808.8337 E [email protected]
Nicholas Theocharides, Engineering Division ManagerCity of Sacramento, Department of Transportation915 I Street, Room 2000Sacramento, CA 95814T 916.359.7400 F 916.808.8357 E [email protected]
Tim Mar, Supervising EngineerCity of Sacramento, Department of Transportation915 I Street, Room 2000Sacramento, CA 95814T 916.808.7531 F 916.808.7903 E [email protected]
Nicole Henderson, Administrative Offi cerCity of Sacramento, Department of Transportation915 I Street, Room 2000Sacramento, CA 95814T 916.808.8242 F 916.808.8357 E [email protected]
Cherisse M. Knapp, Senior Accountant AuditorCity of Sacramento, Department of Transportation915 I Street, Room 2000Sacramento, CA 95814T 916.808.2680 F 916.808.8357 E [email protected]
Page 60
Annual Report Update 2005California Multi-Agency CIP Benchmarking Study
David Brent, Engineering Division ManagerCity of Sacramento, Department of Utilities, Engineering Services1395 35th Avenue Sacramento, CA 95822T 916.808.1420 F 916.808.1497 E [email protected]
Richard S. Batha, Supervising EngineerCity of Sacramento, Department of Utilities, Engineering Services1395 35th Avenue Sacramento, CA 95822T 916.808.1448 F 916.808.1497 E [email protected]
Patti Boekamp, P.E., DirectorCity of San Diego, Engineering & Capital Projects Department202 “C” Street, MS 9BSan Diego, CA 92101T 619.236.6274 F 619.533.4736 E [email protected]
Darren Greenhalgh, P.E., Senior Civil EngineerCity of San Diego, Engineering and Capital Projects DepartmentArchitectural Engineering and Contract Services Division1010 2nd Avenue, Suite 1400, MS 614San Diego, CA 92101T 619.533.3104 F 619.533.3112 E [email protected]
Richard Leja, P.E., Senior Civil EngineerCity of San Diego, Engineering and Capital Projects DepartmentTransportation Engineering Division1010 2nd Avenue, Suite 1200, MS 611San Diego, CA 92101T 619.533.3764 F 619.533.3071 E [email protected]
George Qsar, P.E., Senior Civil EngineerCity of San Diego, Engineering and Capital Projects DepartmentField Engineering Division9485 Aero DriveSan Diego, CA 92123T 858.627.3240 F 858.627.3297 E [email protected]
Jeffrey A. Shoaf, P.E., Senior Civil EngineerCity of San Diego, Engineering and Capital Projects DepartmentWater & Sewer Design Division600 B Street, Suite 800, MS 908ASan Diego, CA 92101T 619.533.5109 F 619.533.5176 E [email protected]
Page 61
Chapter 6Conclusion
Edwin M. Lee, City Administrator and Director of Public WorksCity and County of San Francisco, Department of Public Works City Hall, Room 3481 Dr. Carlton B. Goodlett PlaceSan Francisco, CA 94102T 415.554.6920 F 415.554.6944 E [email protected]
Robert Beck, Deputy Director of Public WorksCity and County of San FranciscoCity Hall, Room 3481 Dr. Carlton B. Goodlett PlaceSan Francisco, CA 94102T 415.554.6940 F 415.554.6944 E [email protected]
Nelson Wong, Bureau ManagerCity and County of San Francisco, Dept. of Public Works, Bureau of Engineering30 Van Ness Avenue, 5th FloorSan Francisco, CA 94102T 415.558.4517 F 415.558.4519 E [email protected]
Steven T. Lee, Electrical EngineerCity and County of San Francisco, Dept. of Public Works, Bureau of Engineering30 Van Ness Avenue, 5th FloorSan Francisco, CA 94102T 415.558.5226 F 415.558.4590 E [email protected]
Katy Allen, P.E., DirectorCity of San Jose, Department of Public Works200 E. Santa Clara St.5th Floor TowerSan Jose, CA 95113T 408.535.8444 F 408.292.6268 E [email protected]
David D. Sykes, P.E., Assistant DirectorCity of San Jose, Department of Public Works200 E. Santa Clara St.5th Floor TowerSan Jose, CA 95113T 408.535.8440 F 408.292.6268 E [email protected]
Kevin S. Briggs, P.E., Senior EngineerCity of San Jose, Department of Public Works200 E. Santa Clara St.5th Floor TowerSan Jose, CA 95113 T 408.535.8448 F 408.292.6263 E kevin.briggs@ sanjoseca.gov
Page 62
Annual Report Update 2005California Multi-Agency CIP Benchmarking Study
Lisa Cheung, CIP SpecialistCity of San Jose, Offi ce of the City Manager200 E. Santa Clara St.16th Floor TowerSan Jose, CA 95113T 408.535.8148 F 408.292.6724 E [email protected]
Allen Fong, Capital Projects SpecialistCity of San Jose, Offi ce of the City Manager200 E. Santa Clara St.16th Fl. TowerSan Jose, CA 95113T 408.535.8146 F 408.292.6724 E [email protected]
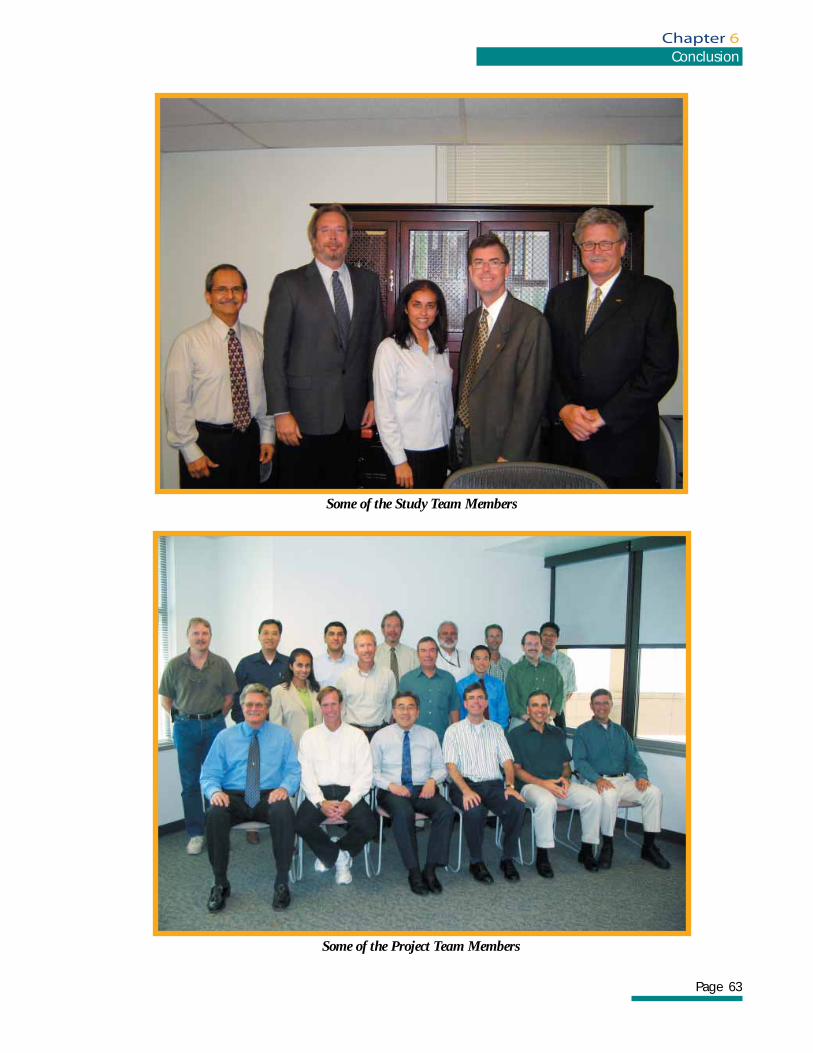
Page 63
Chapter 6Conclusion
Some of the Study Team Members
Some of the Project Team Members

Page A-1
CURVES GROUP 1
Design as Percentage ofTotal Construction Cost
Versus
Total Construction Cost
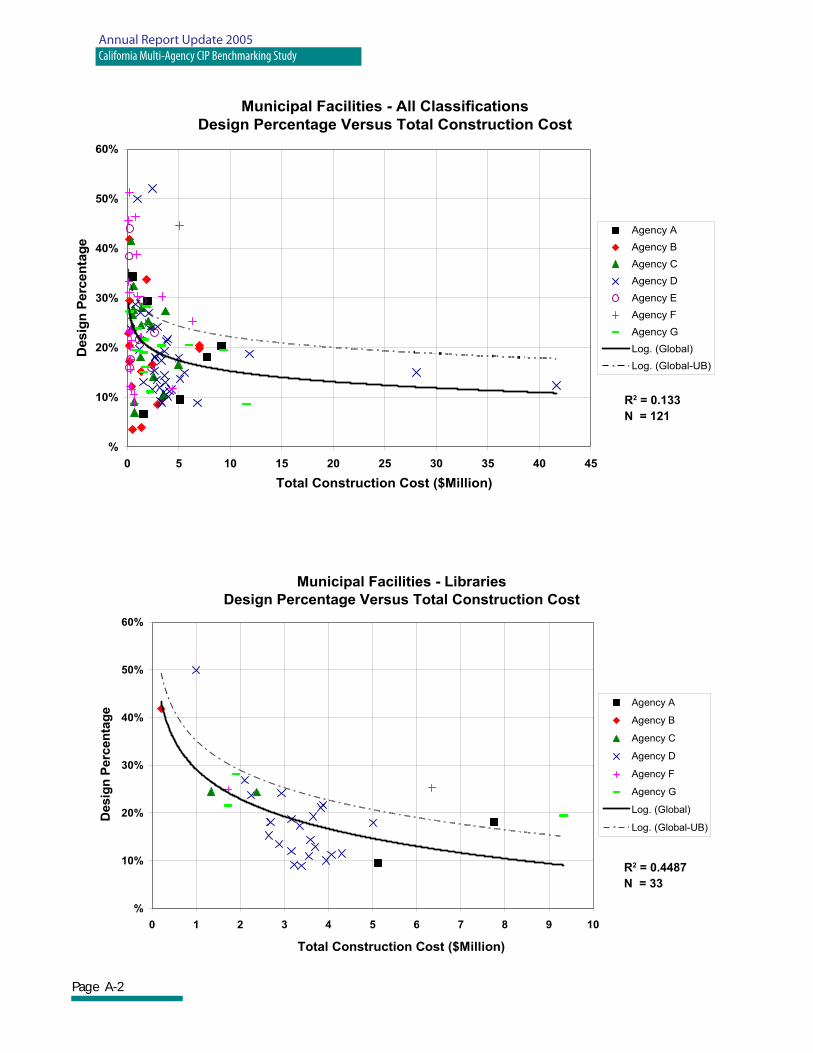
Page A-2
Annual Report Update 2005California Multi-Agency CIP Benchmarking Study
Municipal Facilities - Libraries
Design Percentage Versus Total Construction Cost
%
10%
20%
30%
40%
50%
60%
0 1 2 3 4 5 6 7 8 9 10
Total Construction Cost ($Million)
Desig
n P
erc
en
tag
e
Agency A
Agency B
Agency C
Agency D
Agency F
Agency G
Log. (Global)
Log. (Global-UB)
Municipal Facilities - All Classifications
Design Percentage Versus Total Construction Cost
%
10%
20%
30%
40%
50%
60%
0 5 10 15 20 25 30 35 40 45
Total Construction Cost ($Million)
Desig
n P
erc
en
tag
e
Agency A
Agency B
Agency C
Agency D
Agency E
Agency F
Agency G
Log. (Global)
Log. (Global-UB)
R2 = 0.133
N = 121
R2 = 0.4487
N = 33
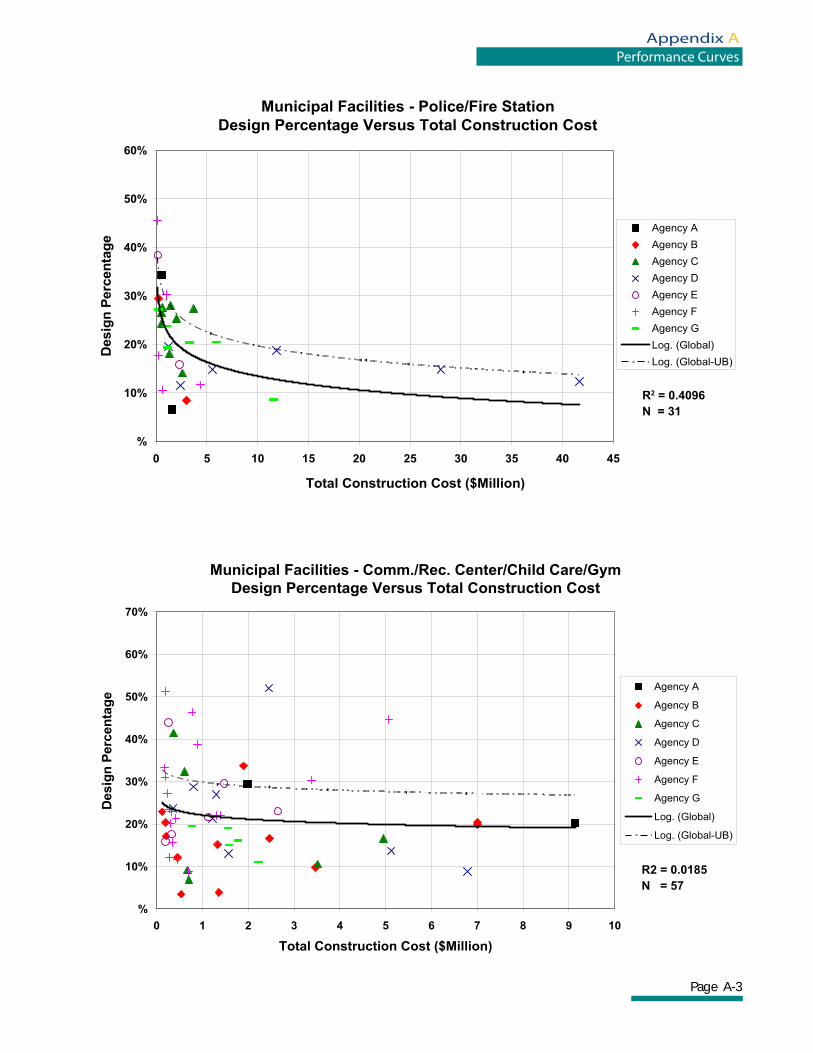
Page A-3
Appendix APerformance Curves
Municipal Facilities - Comm./Rec. Center/Child Care/Gym
Design Percentage Versus Total Construction Cost
%
10%
20%
30%
40%
50%
60%
70%
0 1 2 3 4 5 6 7 8 9 10
Total Construction Cost ($Million)
Desig
n P
erc
en
tag
e
Agency A
Agency B
Agency C
Agency D
Agency E
Agency F
Agency G
Log. (Global)
Log. (Global-UB)
Municipal Facilities - Police/Fire Station
Design Percentage Versus Total Construction Cost
%
10%
20%
30%
40%
50%
60%
0 5 10 15 20 25 30 35 40 45
Total Construction Cost ($Million)
Desig
n P
erc
en
tag
e
Agency A
Agency B
Agency C
Agency D
Agency E
Agency F
Agency G
Log. (Global)
Log. (Global-UB)
R2 = 0.4096
N = 31
R2 = 0.0185
N = 57
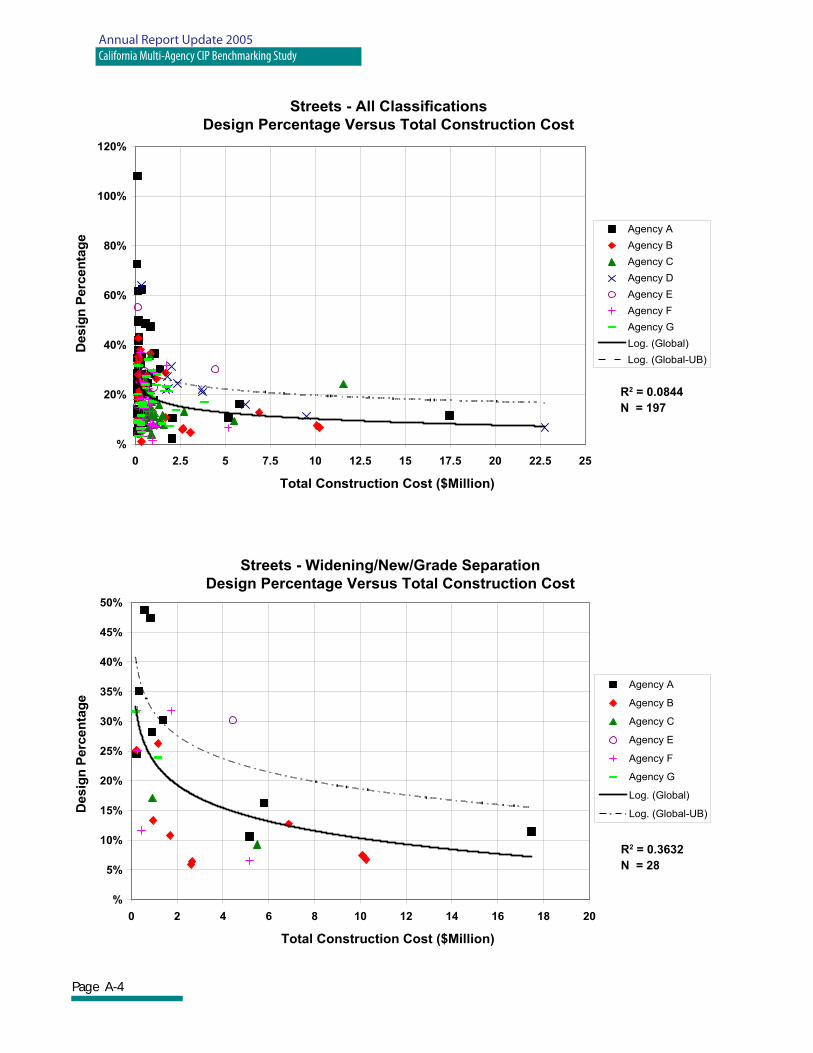
Page A-4
Annual Report Update 2005California Multi-Agency CIP Benchmarking Study
Streets - All Classifications
Design Percentage Versus Total Construction Cost
%
20%
40%
60%
80%
100%
120%
0 2.5 5 7.5 10 12.5 15 17.5 20 22.5 25
Total Construction Cost ($Million)
Desig
n P
erc
en
tag
e
Agency A
Agency B
Agency C
Agency D
Agency E
Agency F
Agency G
Log. (Global)
Log. (Global-UB)
Streets - Widening/New/Grade Separation
Design Percentage Versus Total Construction Cost
%
5%
10%
15%
20%
25%
30%
35%
40%
45%
50%
0 2 4 6 8 10 12 14 16 18 20
Total Construction Cost ($Million)
Desig
n P
erc
en
tag
e
Agency A
Agency B
Agency C
Agency E
Agency F
Agency G
Log. (Global)
Log. (Global-UB)
R2 = 0.0844
N = 197
R2 = 0.3632
N = 28
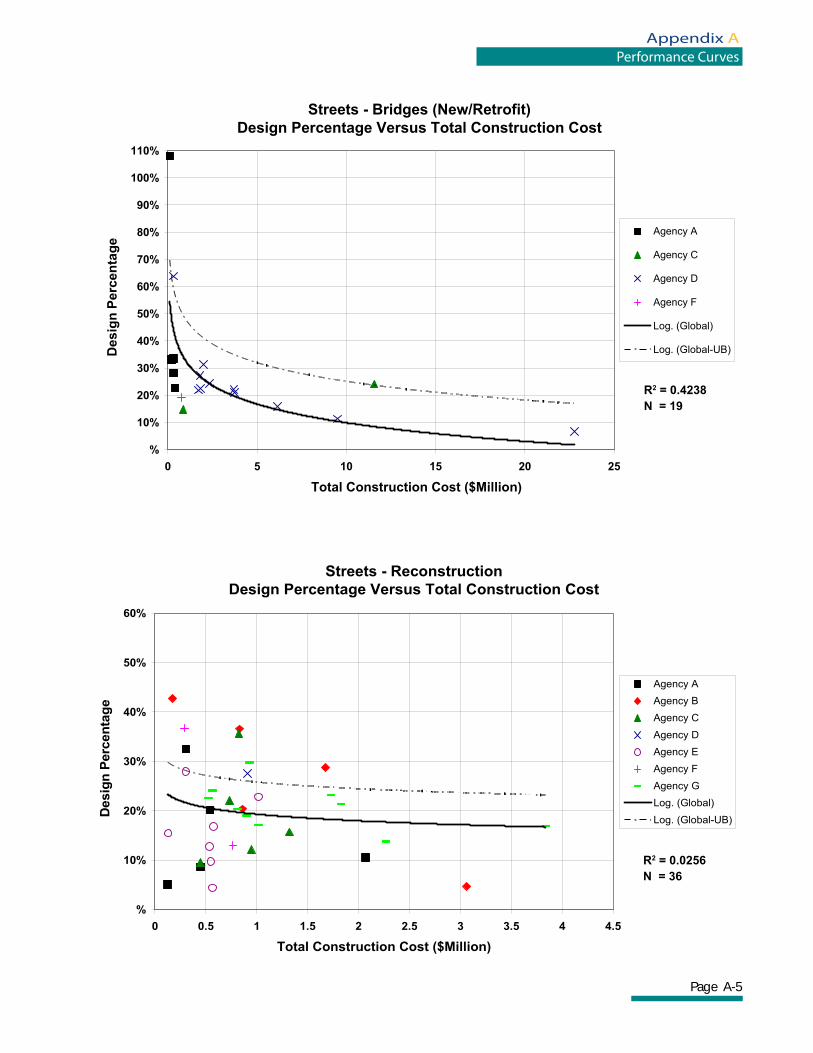
Page A-5
Appendix APerformance Curves
Streets - Reconstruction
Design Percentage Versus Total Construction Cost
%
10%
20%
30%
40%
50%
60%
0 0.5 1 1.5 2 2.5 3 3.5 4 4.5
Total Construction Cost ($Million)
Desig
n P
erc
en
tag
e
Agency A
Agency B
Agency C
Agency D
Agency E
Agency F
Agency G
Log. (Global)
Log. (Global-UB)
Streets - Bridges (New/Retrofit)
Design Percentage Versus Total Construction Cost
%
10%
20%
30%
40%
50%
60%
70%
80%
90%
100%
110%
0 5 10 15 20 25
Total Construction Cost ($Million)
Desig
n P
erc
en
tag
e
Agency A
Agency C
Agency D
Agency F
Log. (Global)
Log. (Global-UB)
R2 = 0.4238
N = 19
R2 = 0.0256
N = 36
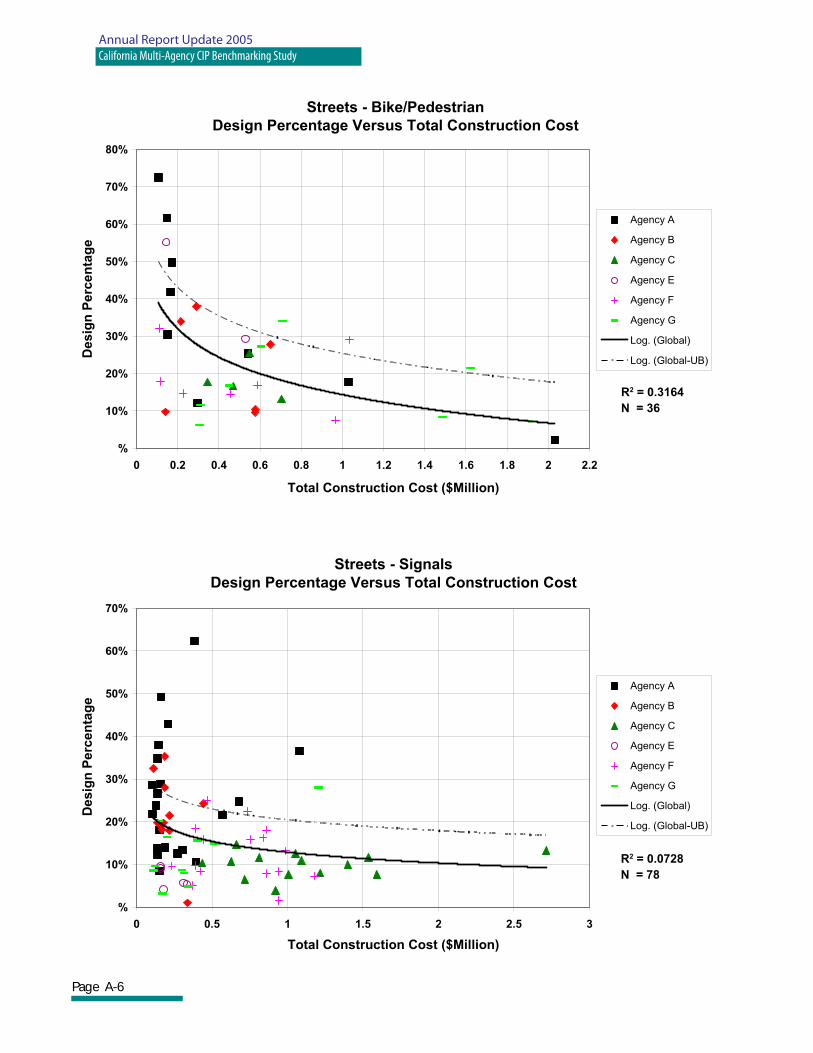
Page A-6
Annual Report Update 2005California Multi-Agency CIP Benchmarking Study
Streets - Bike/Pedestrian
Design Percentage Versus Total Construction Cost
%
10%
20%
30%
40%
50%
60%
70%
80%
0 0.2 0.4 0.6 0.8 1 1.2 1.4 1.6 1.8 2 2.2
Total Construction Cost ($Million)
Desig
n P
erc
en
tag
e
Agency A
Agency B
Agency C
Agency E
Agency F
Agency G
Log. (Global)
Log. (Global-UB)
Streets - Signals
Design Percentage Versus Total Construction Cost
%
10%
20%
30%
40%
50%
60%
70%
0 0.5 1 1.5 2 2.5 3
Total Construction Cost ($Million)
De
sig
n P
erc
en
tag
e
Agency A
Agency B
Agency C
Agency E
Agency F
Agency G
Log. (Global)
Log. (Global-UB)
R2 = 0.3164
N = 36
R2 = 0.0728
N = 78
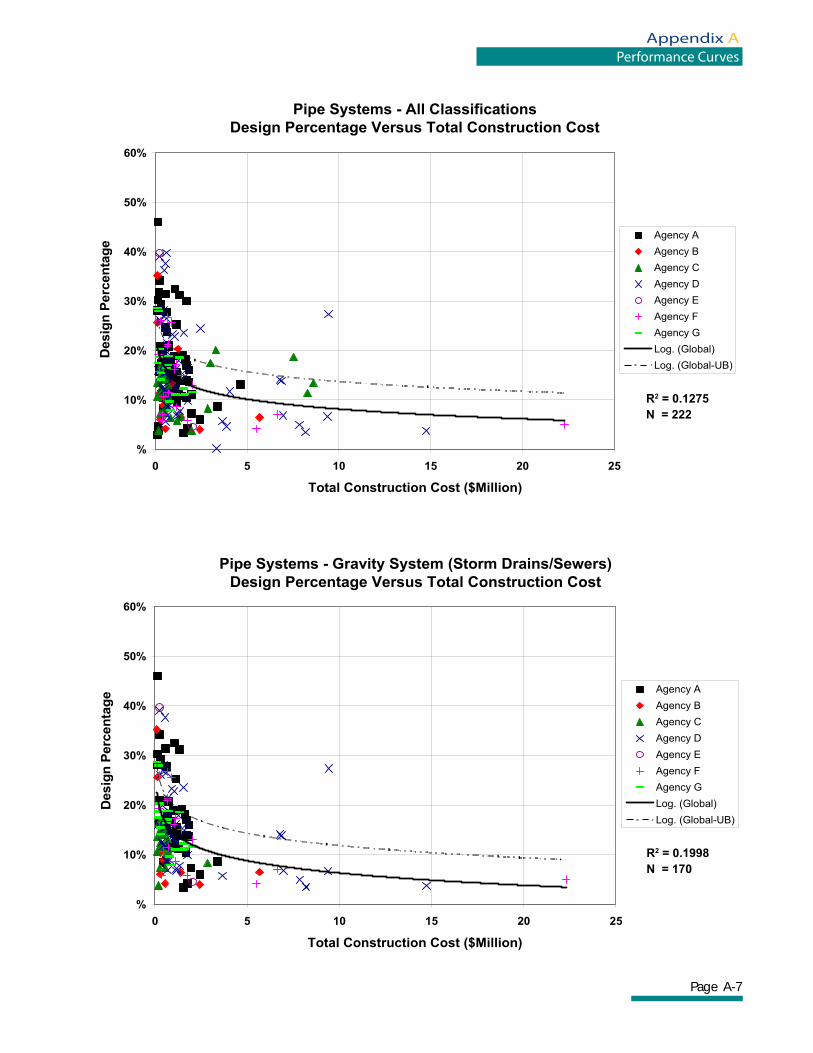
Page A-7
Appendix APerformance Curves
Pipe Systems - All Classifications
Design Percentage Versus Total Construction Cost
%
10%
20%
30%
40%
50%
60%
0 5 10 15 20 25
Total Construction Cost ($Million)
Desig
n P
erc
en
tag
e
Agency A
Agency B
Agency C
Agency D
Agency E
Agency F
Agency G
Log. (Global)
Log. (Global-UB)
Pipe Systems - Gravity System (Storm Drains/Sewers)
Design Percentage Versus Total Construction Cost
%
10%
20%
30%
40%
50%
60%
0 5 10 15 20 25
Total Construction Cost ($Million)
Desig
n P
erc
en
tag
e
Agency A
Agency B
Agency C
Agency D
Agency E
Agency F
Agency G
Log. (Global)
Log. (Global-UB)
R2 = 0.1275
N = 222
R2 = 0.1998
N = 170
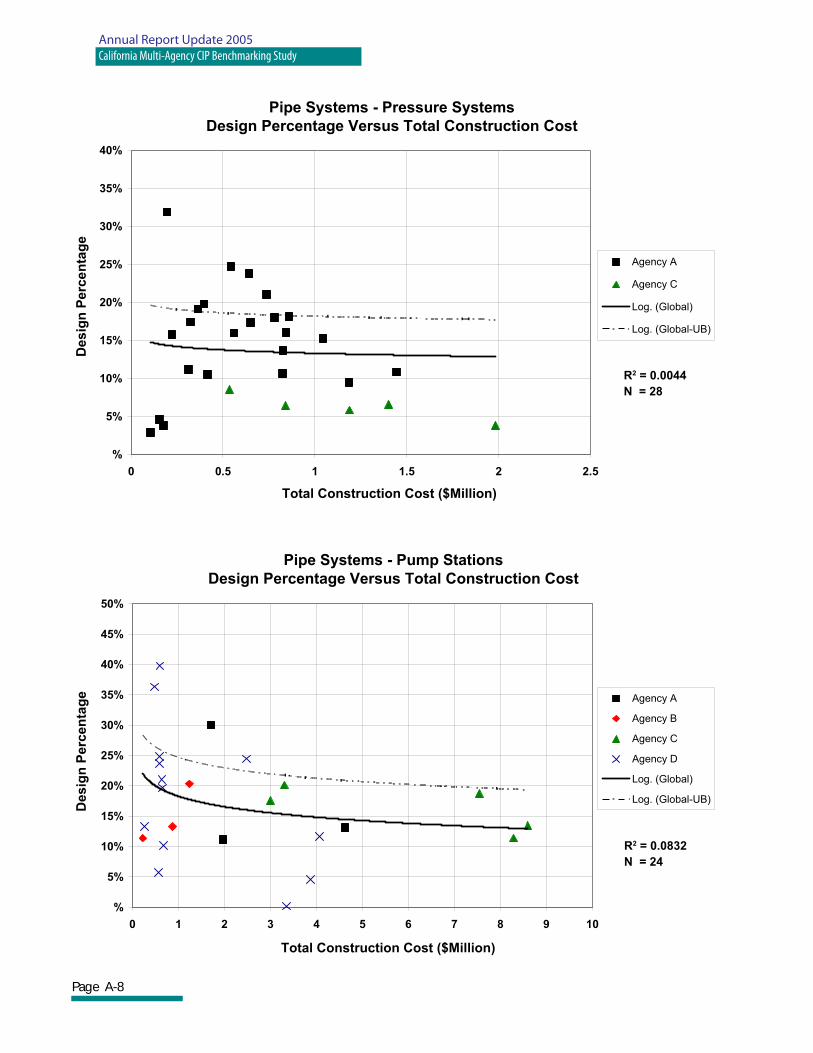
Page A-8
Annual Report Update 2005California Multi-Agency CIP Benchmarking Study
Pipe Systems - Pressure Systems
Design Percentage Versus Total Construction Cost
%
5%
10%
15%
20%
25%
30%
35%
40%
0 0.5 1 1.5 2 2.5
Total Construction Cost ($Million)
De
sig
n P
erc
en
tag
e
Agency A
Agency C
Log. (Global)
Log. (Global-UB)
Pipe Systems - Pump Stations
Design Percentage Versus Total Construction Cost
%
5%
10%
15%
20%
25%
30%
35%
40%
45%
50%
0 1 2 3 4 5 6 7 8 9 10
Total Construction Cost ($Million)
De
sig
n P
erc
en
tag
e Agency A
Agency B
Agency C
Agency D
Log. (Global)
Log. (Global-UB)
R2 = 0.0044
N = 28
R2 = 0.0832
N = 24
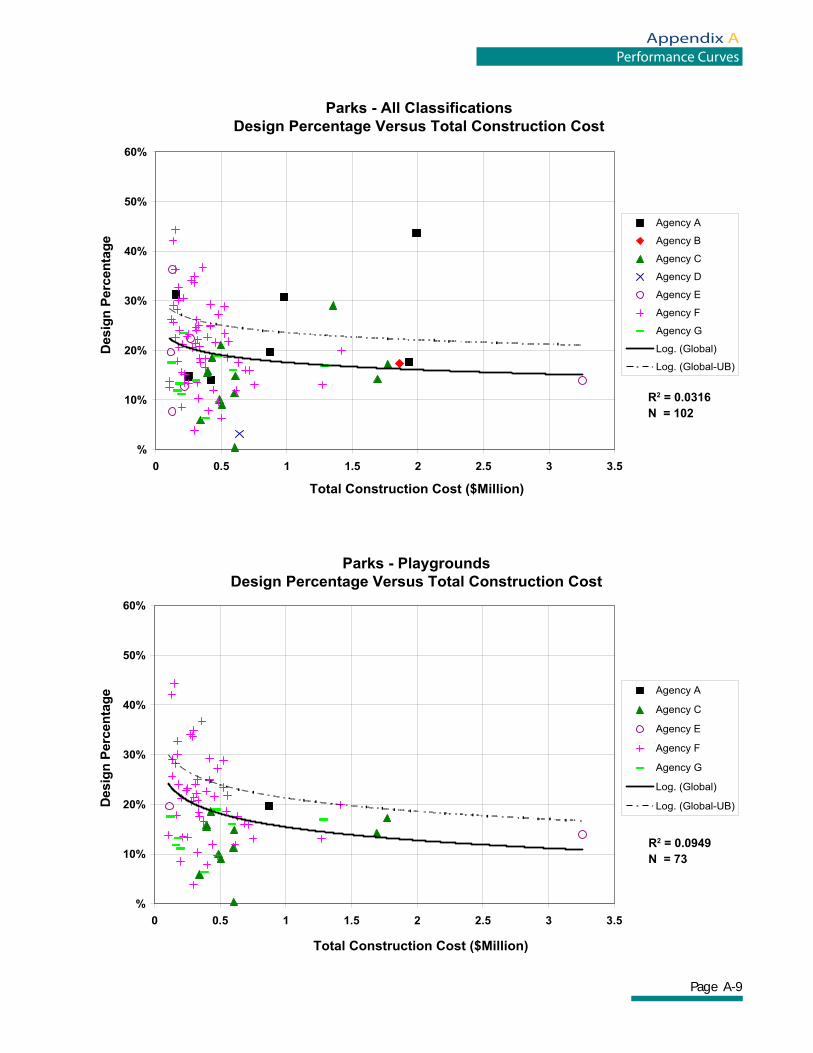
Page A-9
Appendix APerformance Curves
Parks - All Classifications
Design Percentage Versus Total Construction Cost
%
10%
20%
30%
40%
50%
60%
0 0.5 1 1.5 2 2.5 3 3.5
Total Construction Cost ($Million)
Desig
n P
erc
en
tag
e
Agency A
Agency B
Agency C
Agency D
Agency E
Agency F
Agency G
Log. (Global)
Log. (Global-UB)
Parks - Playgrounds
Design Percentage Versus Total Construction Cost
%
10%
20%
30%
40%
50%
60%
0 0.5 1 1.5 2 2.5 3 3.5
Total Construction Cost ($Million)
Desig
n P
erc
en
tag
e Agency A
Agency C
Agency E
Agency F
Agency G
Log. (Global)
Log. (Global-UB)
R2 = 0.0316
N = 102
R2 = 0.0949
N = 73
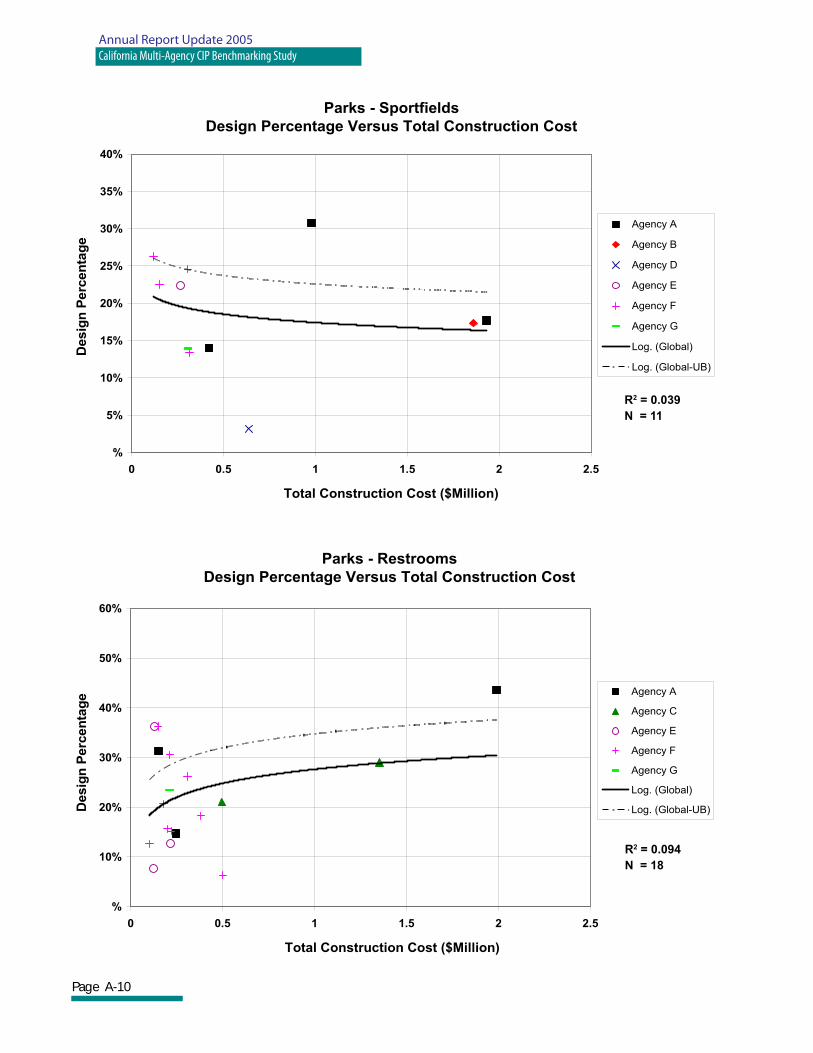
Page A-10
Annual Report Update 2005California Multi-Agency CIP Benchmarking Study
Parks - Sportfields
Design Percentage Versus Total Construction Cost
%
5%
10%
15%
20%
25%
30%
35%
40%
0 0.5 1 1.5 2 2.5
Total Construction Cost ($Million)
Desig
n P
erc
en
tag
e
Agency A
Agency B
Agency D
Agency E
Agency F
Agency G
Log. (Global)
Log. (Global-UB)
Parks - Restrooms
Design Percentage Versus Total Construction Cost
%
10%
20%
30%
40%
50%
60%
0 0.5 1 1.5 2 2.5
Total Construction Cost ($Million)
Desig
n P
erc
en
tag
e Agency A
Agency C
Agency E
Agency F
Agency G
Log. (Global)
Log. (Global-UB)
R2 = 0.039
N = 11
R2 = 0.094
N = 18
Page A-11
Appendix APerformance Curves
CURVES GROUP 2
Construction Management as Percentage of Total Construction Cost
Versus
Total Construction Cost
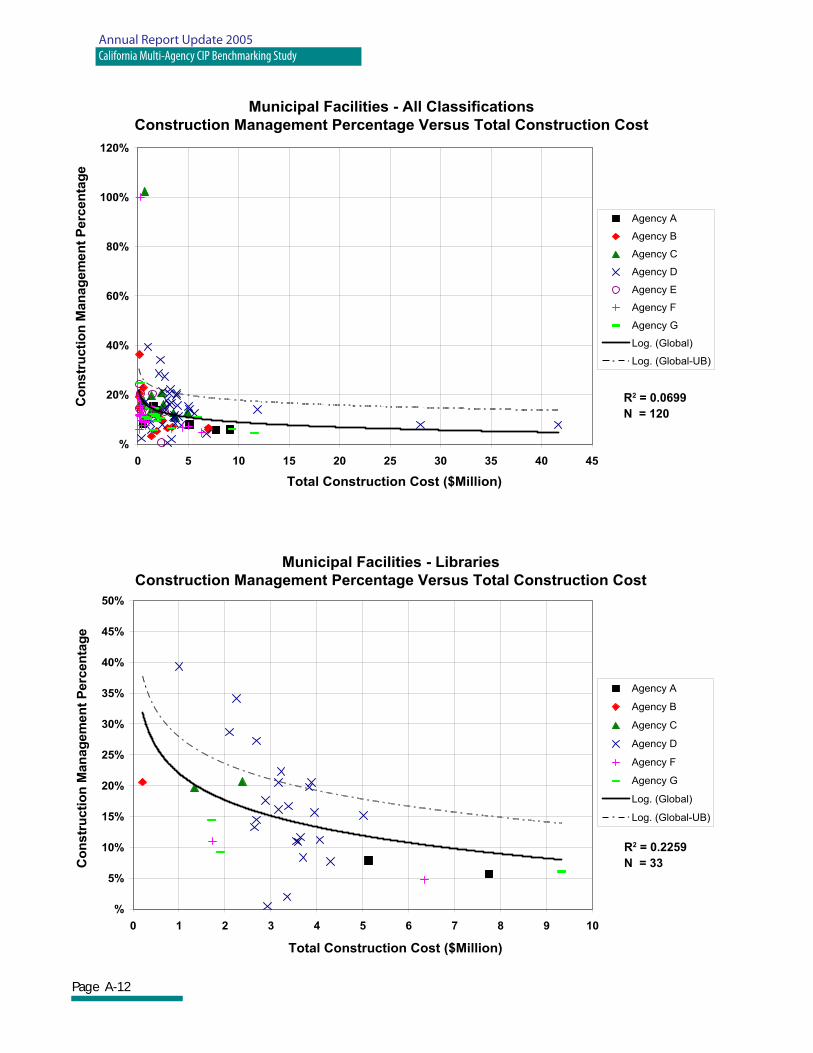
Page A-12
Annual Report Update 2005California Multi-Agency CIP Benchmarking Study
%
20%
40%
60%
80%
100%
120%
0 5 10 15 20 25 30 35 40 45
Total Construction Cost ($Million)
Co
nstr
ucti
on
Man
ag
em
en
t P
erc
en
tag
e
Agency A
Agency B
Agency C
Agency D
Agency E
Agency F
Agency G
Log. (Global)
Log. (Global-UB)
Municipal Facilities - All Classifications
Construction Management Percentage Versus Total Construction Cost
%
5%
10%
15%
20%
25%
30%
35%
40%
45%
50%
0 1 2 3 4 5 6 7 8 9 10
Total Construction Cost ($Million)
Co
nstr
ucti
on
Man
ag
em
en
t P
erc
en
tag
e
Agency A
Agency B
Agency C
Agency D
Agency F
Agency G
Log. (Global)
Log. (Global-UB)
Municipal Facilities - Libraries
Construction Management Percentage Versus Total Construction Cost
R2 = 0.0699
N = 120
R2 = 0.2259
N = 33
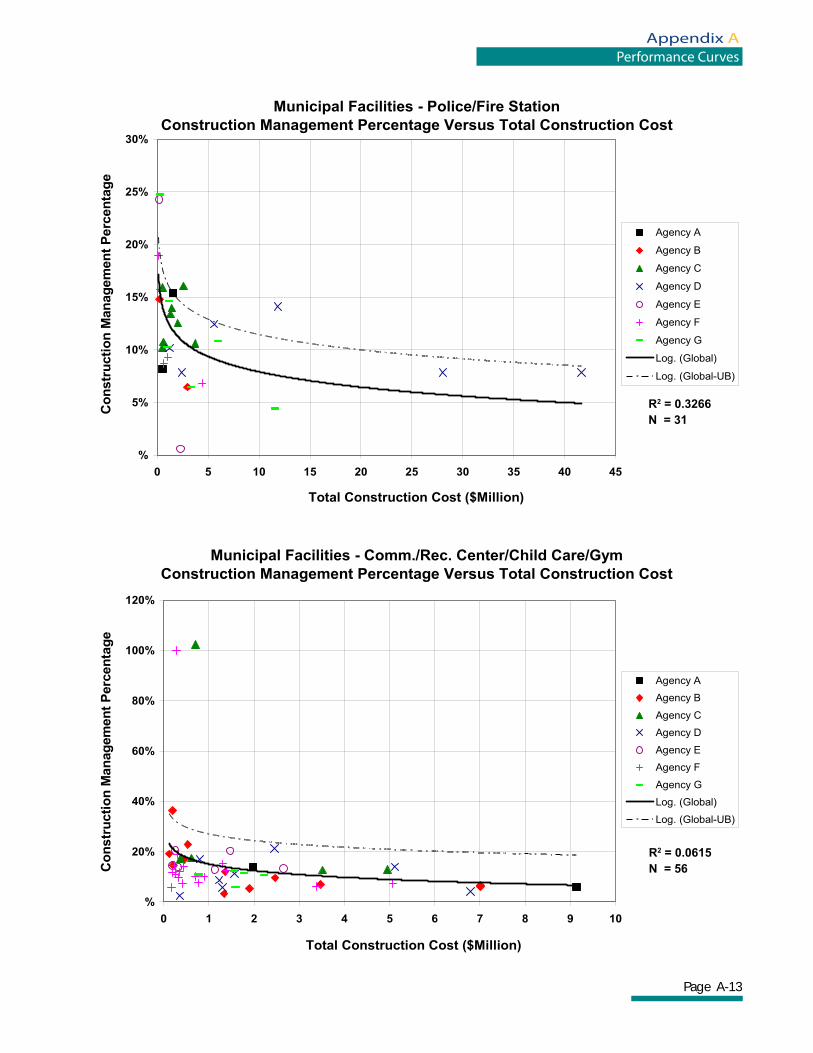
Page A-13
Appendix APerformance Curves
%
5%
10%
15%
20%
25%
30%
0 5 10 15 20 25 30 35 40 45
Total Construction Cost ($Million)
Co
nstr
ucti
on
Man
ag
em
en
t P
erc
en
tag
e
Agency A
Agency B
Agency C
Agency D
Agency E
Agency F
Agency G
Log. (Global)
Log. (Global-UB)
Municipal Facilities - Police/Fire Station
Construction Management Percentage Versus Total Construction Cost
%
20%
40%
60%
80%
100%
120%
0 1 2 3 4 5 6 7 8 9 10
Total Construction Cost ($Million)
Co
nstr
ucti
on
Man
ag
em
en
t P
erc
en
tag
e
Agency A
Agency B
Agency C
Agency D
Agency E
Agency F
Agency G
Log. (Global)
Log. (Global-UB)
Municipal Facilities - Comm./Rec. Center/Child Care/Gym
Construction Management Percentage Versus Total Construction Cost
R2 = 0.3266
N = 31
R2 = 0.0615
N = 56
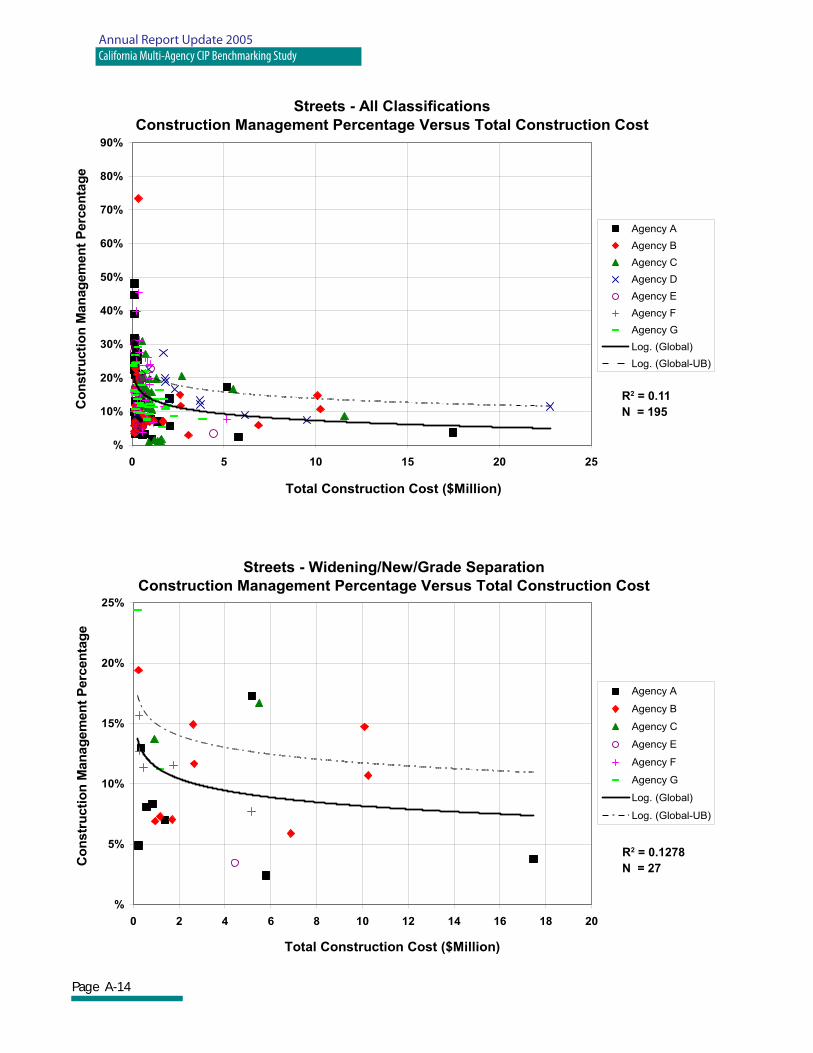
Page A-14
Annual Report Update 2005California Multi-Agency CIP Benchmarking Study
%
10%
20%
30%
40%
50%
60%
70%
80%
90%
0 5 10 15 20 25
Total Construction Cost ($Million)
Co
nstr
ucti
on
Man
ag
em
en
t P
erc
en
tag
e
Agency A
Agency B
Agency C
Agency D
Agency E
Agency F
Agency G
Log. (Global)
Log. (Global-UB)
Streets - All Classifications
Construction Management Percentage Versus Total Construction Cost
%
5%
10%
15%
20%
25%
0 2 4 6 8 10 12 14 16 18 20
Total Construction Cost ($Million)
Co
nstr
ucti
on
Man
ag
em
en
t P
erc
en
tag
e
Agency A
Agency B
Agency C
Agency E
Agency F
Agency G
Log. (Global)
Log. (Global-UB)
Streets - Widening/New/Grade Separation
Construction Management Percentage Versus Total Construction Cost
R2 = 0.11
N = 195
R2 = 0.1278
N = 27
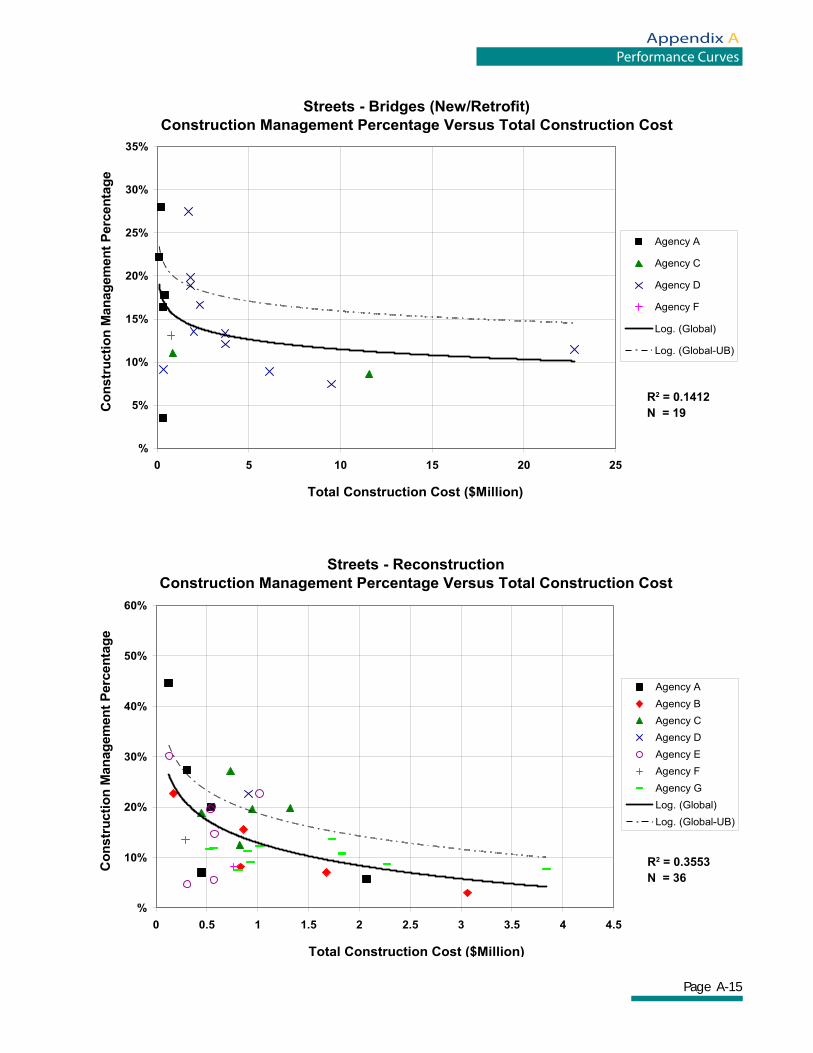
Page A-15
Appendix APerformance Curves
%
5%
10%
15%
20%
25%
30%
35%
0 5 10 15 20 25
Total Construction Cost ($Million)
Co
nstr
ucti
on
Man
ag
em
en
t P
erc
en
tag
e
Agency A
Agency C
Agency D
Agency F
Log. (Global)
Log. (Global-UB)
Streets - Bridges (New/Retrofit)
Construction Management Percentage Versus Total Construction Cost
%
10%
20%
30%
40%
50%
60%
0 0.5 1 1.5 2 2.5 3 3.5 4 4.5
Total Construction Cost ($Million)
Co
nstr
ucti
on
Man
ag
em
en
t P
erc
en
tag
e
Agency A
Agency B
Agency C
Agency D
Agency E
Agency F
Agency G
Log. (Global)
Log. (Global-UB)
Streets - Reconstruction
Construction Management Percentage Versus Total Construction Cost
R2 = 0.1412
N = 19
R2 = 0.3553
N = 36
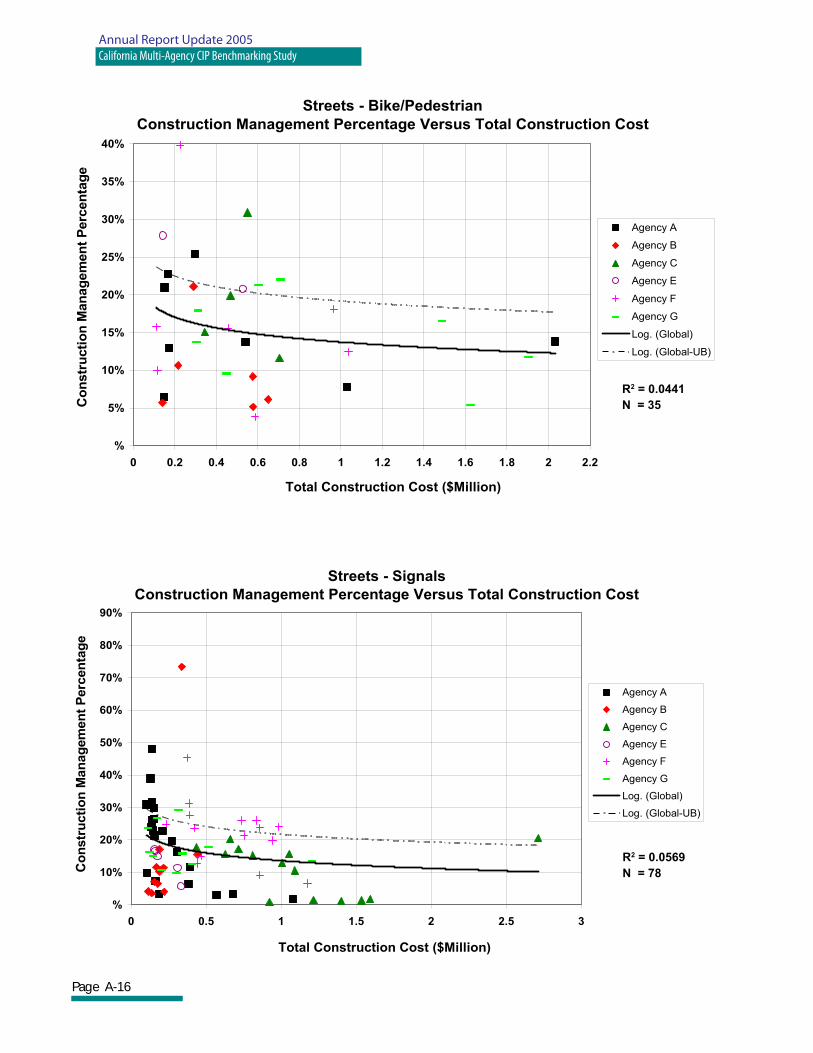
Page A-16
Annual Report Update 2005California Multi-Agency CIP Benchmarking Study
%
5%
10%
15%
20%
25%
30%
35%
40%
0 0.2 0.4 0.6 0.8 1 1.2 1.4 1.6 1.8 2 2.2
Total Construction Cost ($Million)
Co
nstr
ucti
on
Man
ag
em
en
t P
erc
en
tag
e
Agency A
Agency B
Agency C
Agency E
Agency F
Agency G
Log. (Global)
Log. (Global-UB)
Streets - Bike/Pedestrian
Construction Management Percentage Versus Total Construction Cost
%
10%
20%
30%
40%
50%
60%
70%
80%
90%
0 0.5 1 1.5 2 2.5 3
Total Construction Cost ($Million)
Co
nstr
ucti
on
Man
ag
em
en
t P
erc
en
tag
e
Agency A
Agency B
Agency C
Agency E
Agency F
Agency G
Log. (Global)
Log. (Global-UB)
Streets - Signals
Construction Management Percentage Versus Total Construction Cost
R2 = 0.0441
N = 35
R2 = 0.0569
N = 78
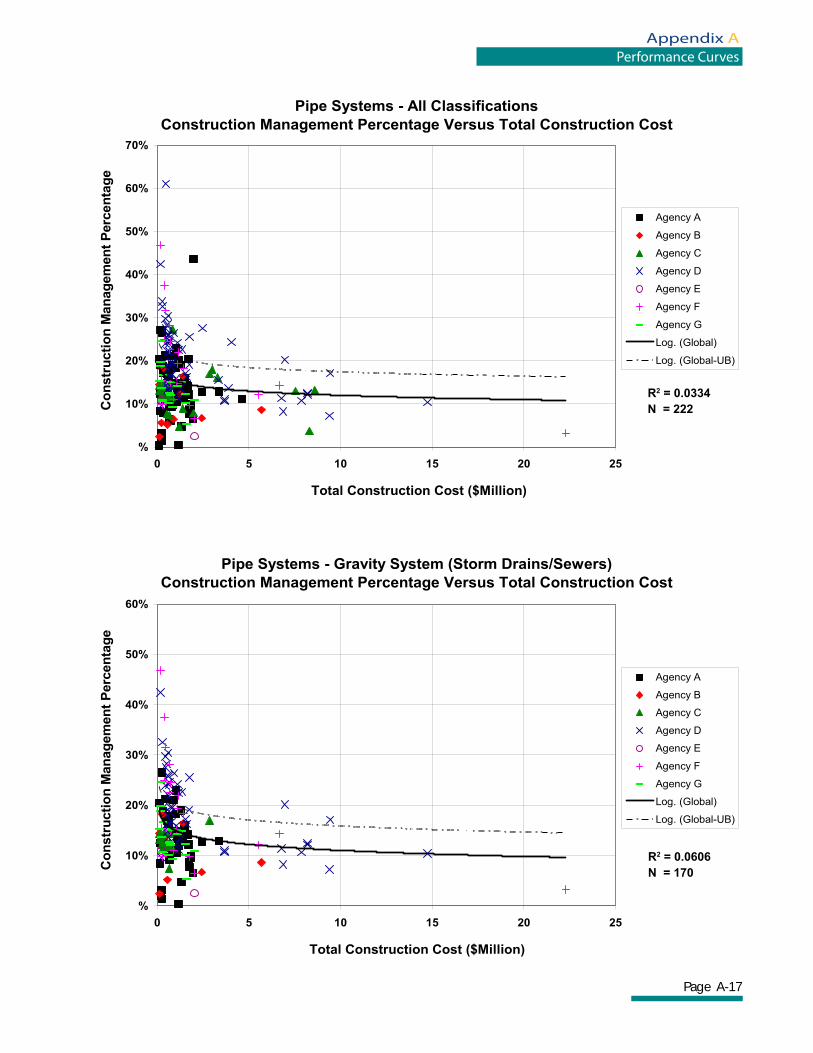
Page A-17
Appendix APerformance Curves
%
10%
20%
30%
40%
50%
60%
70%
0 5 10 15 20 25
Total Construction Cost ($Million)
Co
nstr
ucti
on
Man
ag
em
en
t P
erc
en
tag
e
Agency A
Agency B
Agency C
Agency D
Agency E
Agency F
Agency G
Log. (Global)
Log. (Global-UB)
Pipe Systems - All Classifications
Construction Management Percentage Versus Total Construction Cost
%
10%
20%
30%
40%
50%
60%
0 5 10 15 20 25
Total Construction Cost ($Million)
Co
nstr
ucti
on
Man
ag
em
en
t P
erc
en
tag
e
Agency A
Agency B
Agency C
Agency D
Agency E
Agency F
Agency G
Log. (Global)
Log. (Global-UB)
Pipe Systems - Gravity System (Storm Drains/Sewers)
Construction Management Percentage Versus Total Construction Cost
R2 = 0.0334
N = 222
R2 = 0.0606
N = 170
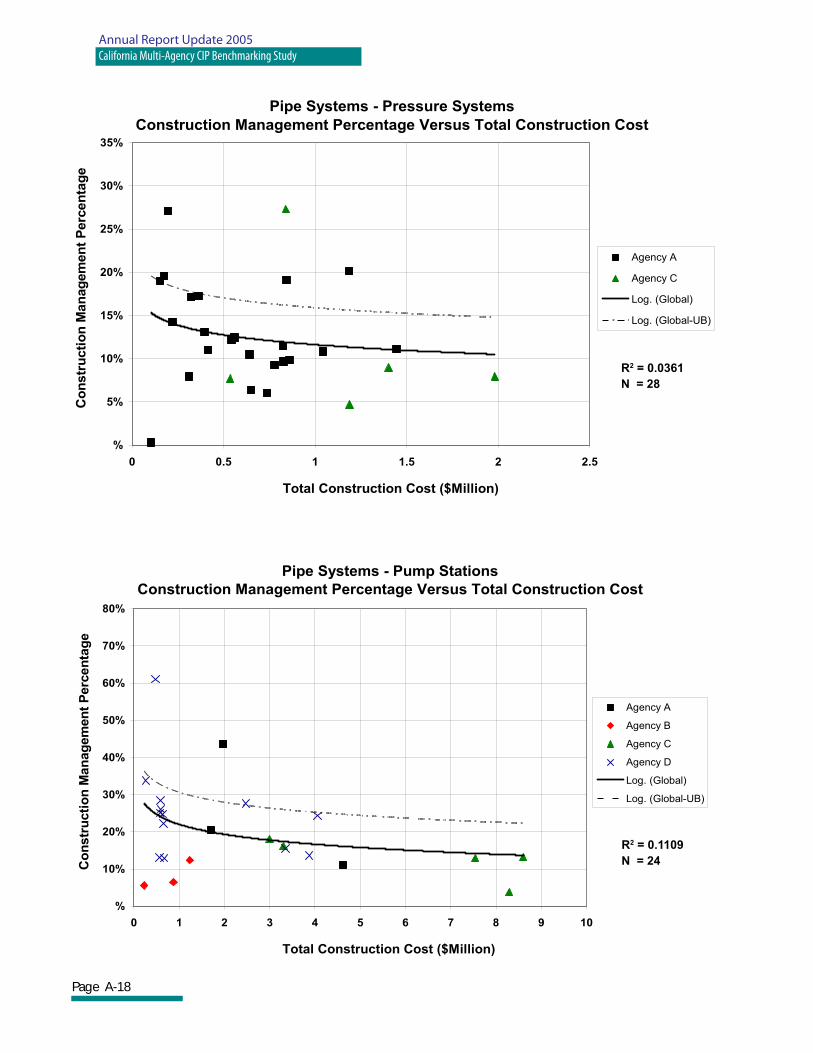
Page A-18
Annual Report Update 2005California Multi-Agency CIP Benchmarking Study
%
5%
10%
15%
20%
25%
30%
35%
0 0.5 1 1.5 2 2.5
Total Construction Cost ($Million)
Co
nstr
ucti
on
Man
ag
em
en
t P
erc
en
tag
e
Agency A
Agency C
Log. (Global)
Log. (Global-UB)
Pipe Systems - Pressure Systems
Construction Management Percentage Versus Total Construction Cost
%
10%
20%
30%
40%
50%
60%
70%
80%
0 1 2 3 4 5 6 7 8 9 10
Total Construction Cost ($Million)
Co
nstr
ucti
on
Man
ag
em
en
t P
erc
en
tag
e
Agency A
Agency B
Agency C
Agency D
Log. (Global)
Log. (Global-UB)
Pipe Systems - Pump Stations
Construction Management Percentage Versus Total Construction Cost
R2 = 0.0361
N = 28
R2 = 0.1109
N = 24
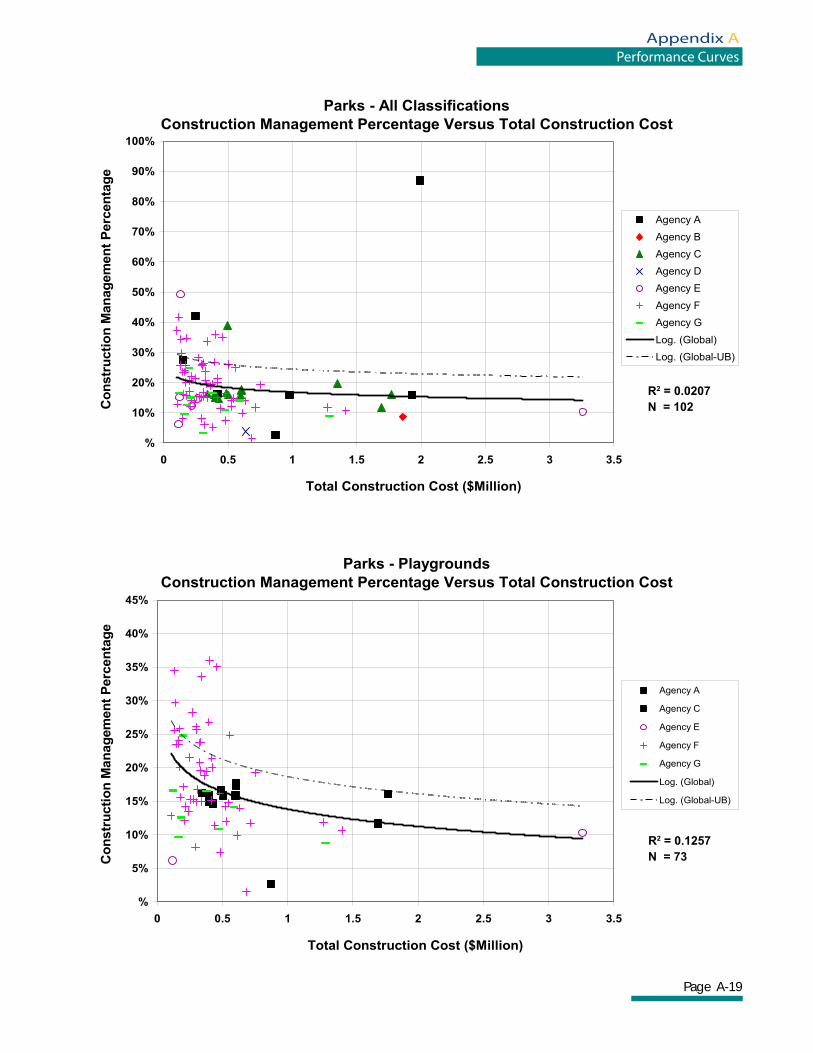
Page A-19
Appendix APerformance Curves
%
10%
20%
30%
40%
50%
60%
70%
80%
90%
100%
0 0.5 1 1.5 2 2.5 3 3.5
Total Construction Cost ($Million)
Co
nstr
ucti
on
Man
ag
em
en
t P
erc
en
tag
e
Agency A
Agency B
Agency C
Agency D
Agency E
Agency F
Agency G
Log. (Global)
Log. (Global-UB)
Parks - All Classifications
Construction Management Percentage Versus Total Construction Cost
%
5%
10%
15%
20%
25%
30%
35%
40%
45%
0 0.5 1 1.5 2 2.5 3 3.5
Total Construction Cost ($Million)
Co
nstr
ucti
on
Man
ag
em
en
t P
erc
en
tag
e
Agency A
Agency C
Agency E
Agency F
Agency G
Log. (Global)
Log. (Global-UB)
Parks - Playgrounds
Construction Management Percentage Versus Total Construction Cost
R2 = 0.0207
N = 102
R2 = 0.1257
N = 73
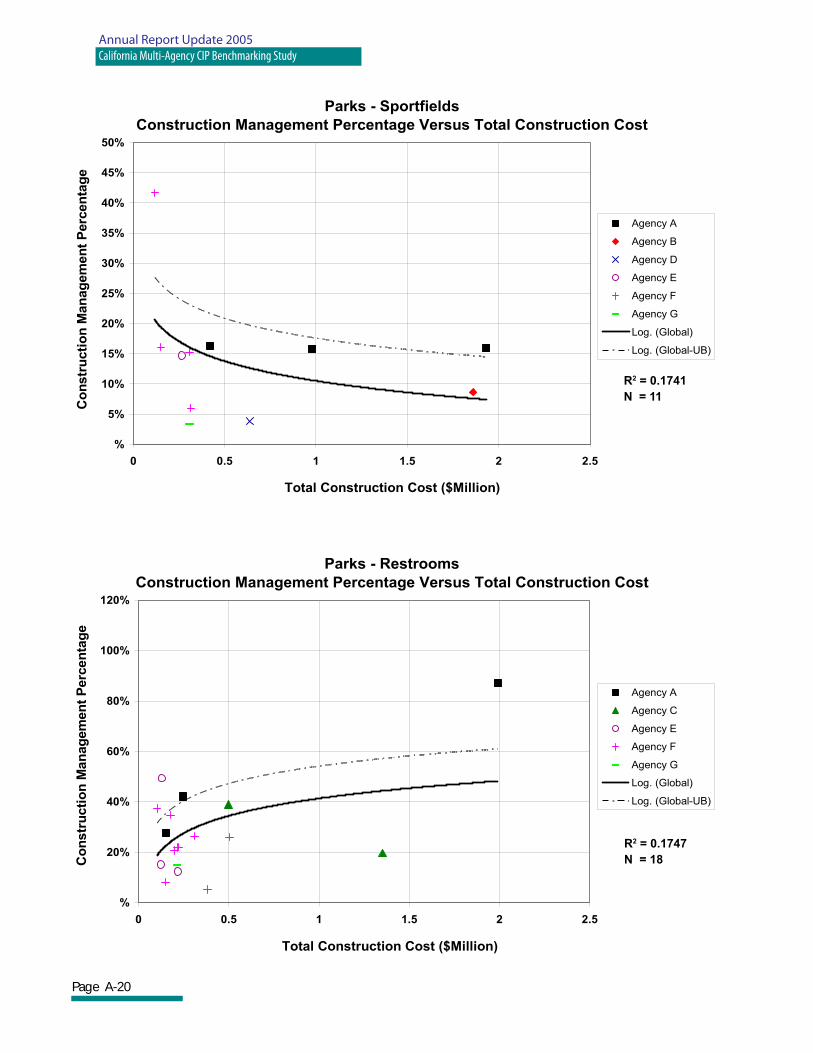
Page A-20
Annual Report Update 2005California Multi-Agency CIP Benchmarking Study
%
5%
10%
15%
20%
25%
30%
35%
40%
45%
50%
0 0.5 1 1.5 2 2.5
Total Construction Cost ($Million)
Co
nstr
ucti
on
Man
ag
em
en
t P
erc
en
tag
e
Agency A
Agency B
Agency D
Agency E
Agency F
Agency G
Log. (Global)
Log. (Global-UB)
Parks - Sportfields
Construction Management Percentage Versus Total Construction Cost
%
20%
40%
60%
80%
100%
120%
0 0.5 1 1.5 2 2.5
Total Construction Cost ($Million)
Co
nstr
ucti
on
Man
ag
em
en
t P
erc
en
tag
e
Agency A
Agency C
Agency E
Agency F
Agency G
Log. (Global)
Log. (Global-UB)
Parks - Restrooms
Construction Management Percentage Versus Total Construction Cost
R2 = 0.1741
N = 11
R2 = 0.1747
N = 18
Page A-21
Appendix APerformance Curves
CURVES GROUP 3
Project Delivery as Percentage of Total Construction Cost
Versus
Total Construction Cost
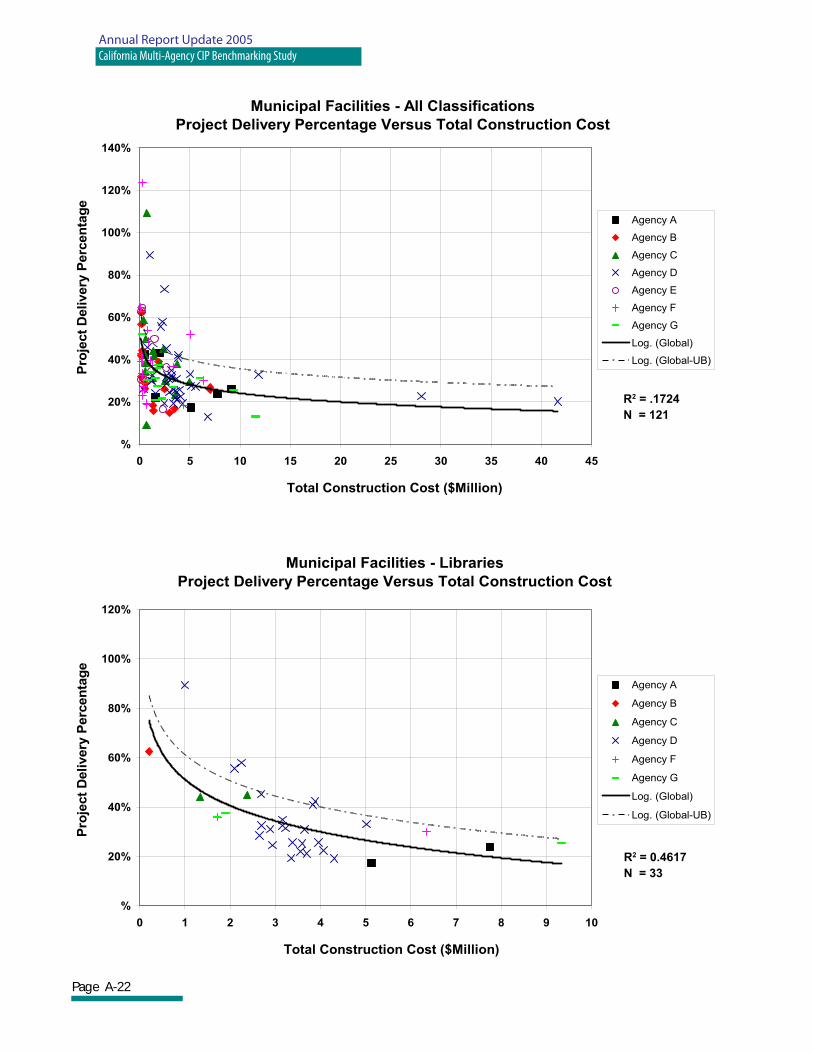
Page A-22
Annual Report Update 2005California Multi-Agency CIP Benchmarking Study
Municipal Facilities - All Classifications
Project Delivery Percentage Versus Total Construction Cost
%
20%
40%
60%
80%
100%
120%
140%
0 5 10 15 20 25 30 35 40 45
Total Construction Cost ($Million)
Pro
ject
Delivery
Perc
en
tag
e
Agency A
Agency B
Agency C
Agency D
Agency E
Agency F
Agency G
Log. (Global)
Log. (Global-UB)
Municipal Facilities - Libraries
Project Delivery Percentage Versus Total Construction Cost
%
20%
40%
60%
80%
100%
120%
0 1 2 3 4 5 6 7 8 9 10
Total Construction Cost ($Million)
Pro
ject
Delivery
Perc
en
tag
e
Agency A
Agency B
Agency C
Agency D
Agency F
Agency G
Log. (Global)
Log. (Global-UB)
R2 = .1724
N = 121
R2 = 0.4617
N = 33
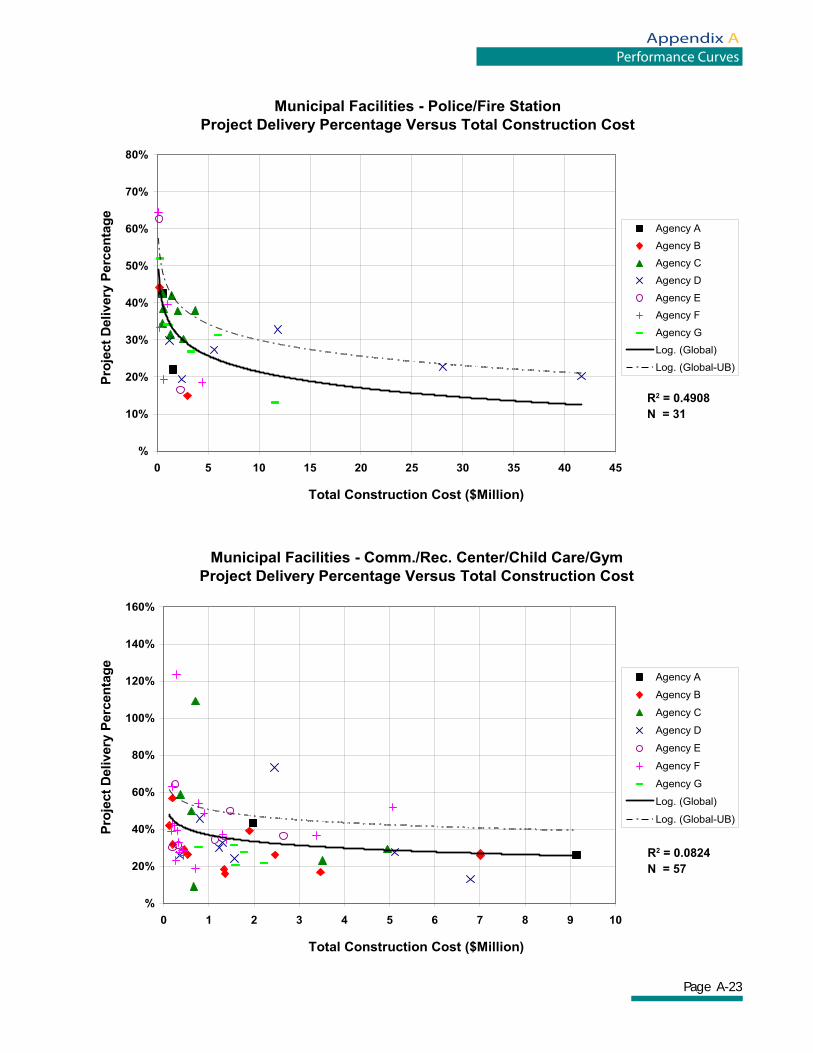
Page A-23
Appendix APerformance Curves
Municipal Facilities - Police/Fire Station
Project Delivery Percentage Versus Total Construction Cost
%
10%
20%
30%
40%
50%
60%
70%
80%
0 5 10 15 20 25 30 35 40 45
Total Construction Cost ($Million)
Pro
ject
Delivery
Perc
en
tag
e
Agency A
Agency B
Agency C
Agency D
Agency E
Agency F
Agency G
Log. (Global)
Log. (Global-UB)
Municipal Facilities - Comm./Rec. Center/Child Care/Gym
Project Delivery Percentage Versus Total Construction Cost
%
20%
40%
60%
80%
100%
120%
140%
160%
0 1 2 3 4 5 6 7 8 9 10
Total Construction Cost ($Million)
Pro
ject
Delivery
Perc
en
tag
e
Agency A
Agency B
Agency C
Agency D
Agency E
Agency F
Agency G
Log. (Global)
Log. (Global-UB)
R2 = 0.4908
N = 31
R2 = 0.0824
N = 57
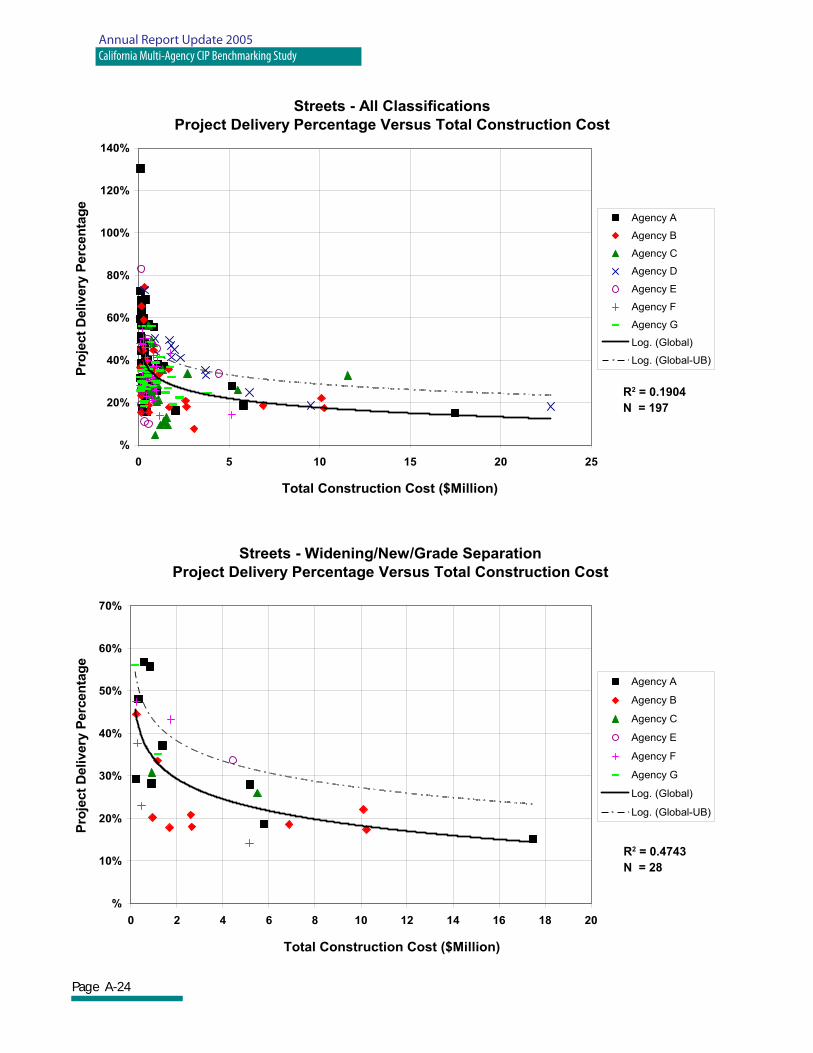
Page A-24
Annual Report Update 2005California Multi-Agency CIP Benchmarking Study
Streets - All Classifications
Project Delivery Percentage Versus Total Construction Cost
%
20%
40%
60%
80%
100%
120%
140%
0 5 10 15 20 25
Total Construction Cost ($Million)
Pro
ject
Delivery
Perc
en
tag
e
Agency A
Agency B
Agency C
Agency D
Agency E
Agency F
Agency G
Log. (Global)
Log. (Global-UB)
Streets - Widening/New/Grade Separation
Project Delivery Percentage Versus Total Construction Cost
%
10%
20%
30%
40%
50%
60%
70%
0 2 4 6 8 10 12 14 16 18 20
Total Construction Cost ($Million)
Pro
ject
Delivery
Perc
en
tag
e
Agency A
Agency B
Agency C
Agency E
Agency F
Agency G
Log. (Global)
Log. (Global-UB)
R2 = 0.1904
N = 197
R2 = 0.4743
N = 28
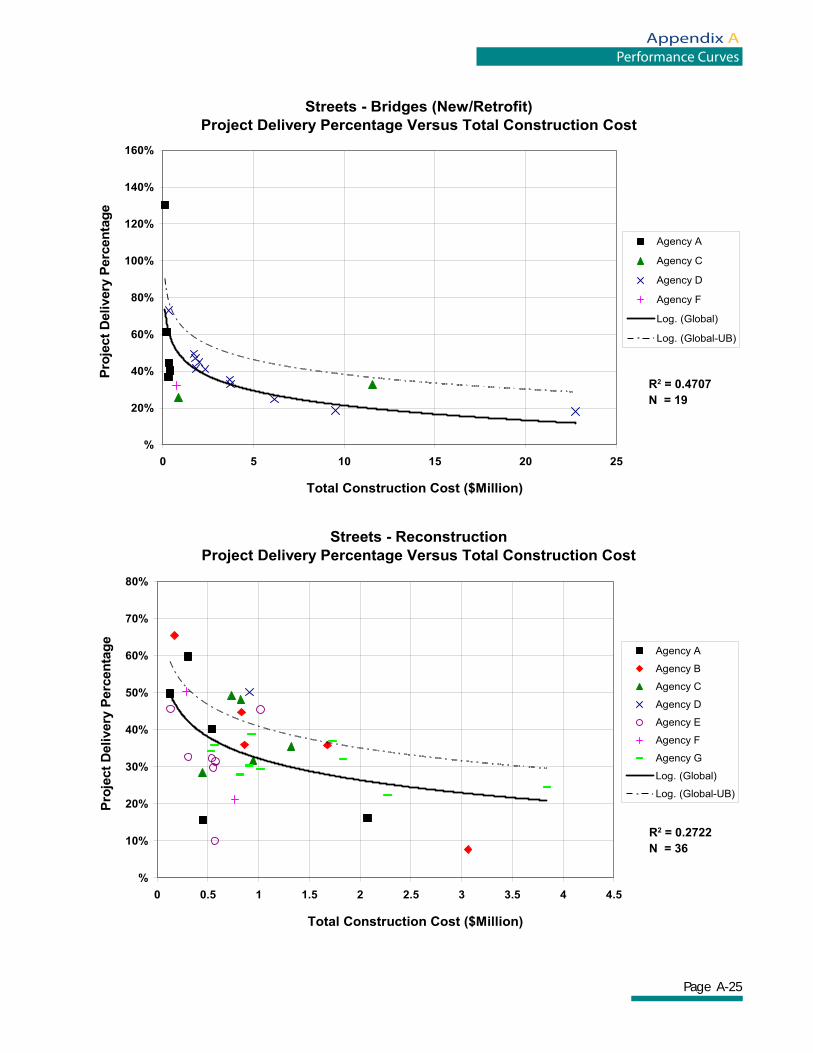
Page A-25
Appendix APerformance Curves
Streets - Bridges (New/Retrofit)
Project Delivery Percentage Versus Total Construction Cost
%
20%
40%
60%
80%
100%
120%
140%
160%
0 5 10 15 20 25
Total Construction Cost ($Million)
Pro
ject
Delivery
Perc
en
tag
e
Agency A
Agency C
Agency D
Agency F
Log. (Global)
Log. (Global-UB)
Streets - Reconstruction
Project Delivery Percentage Versus Total Construction Cost
%
10%
20%
30%
40%
50%
60%
70%
80%
0 0.5 1 1.5 2 2.5 3 3.5 4 4.5
Total Construction Cost ($Million)
Pro
ject
Delivery
Perc
en
tag
e
Agency A
Agency B
Agency C
Agency D
Agency E
Agency F
Agency G
Log. (Global)
Log. (Global-UB)
R2 = 0.4707
N = 19
R2 = 0.2722
N = 36
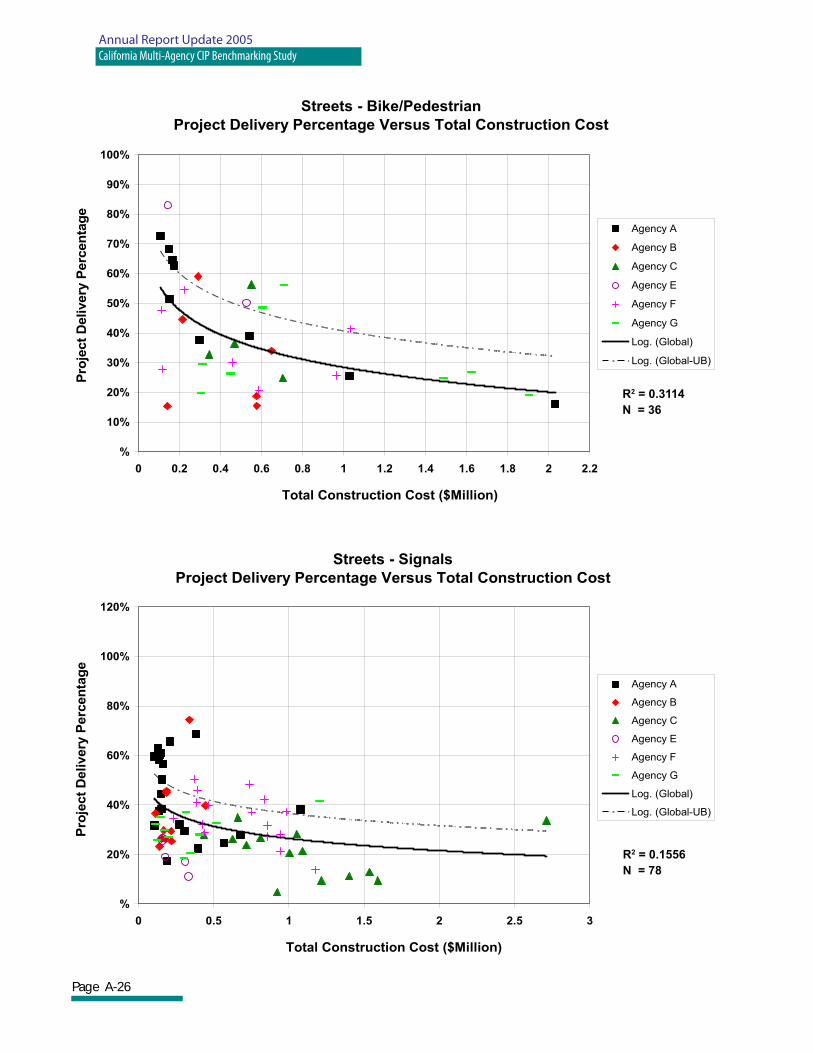
Page A-26
Annual Report Update 2005California Multi-Agency CIP Benchmarking Study
Streets - Bike/Pedestrian
Project Delivery Percentage Versus Total Construction Cost
%
10%
20%
30%
40%
50%
60%
70%
80%
90%
100%
0 0.2 0.4 0.6 0.8 1 1.2 1.4 1.6 1.8 2 2.2
Total Construction Cost ($Million)
Pro
ject
Delivery
Perc
en
tag
e
Agency A
Agency B
Agency C
Agency E
Agency F
Agency G
Log. (Global)
Log. (Global-UB)
Streets - Signals
Project Delivery Percentage Versus Total Construction Cost
%
20%
40%
60%
80%
100%
120%
0 0.5 1 1.5 2 2.5 3
Total Construction Cost ($Million)
Pro
ject
Delivery
Perc
en
tag
e
Agency A
Agency B
Agency C
Agency E
Agency F
Agency G
Log. (Global)
Log. (Global-UB)
R2 = 0.3114
N = 36
R2 = 0.1556
N = 78
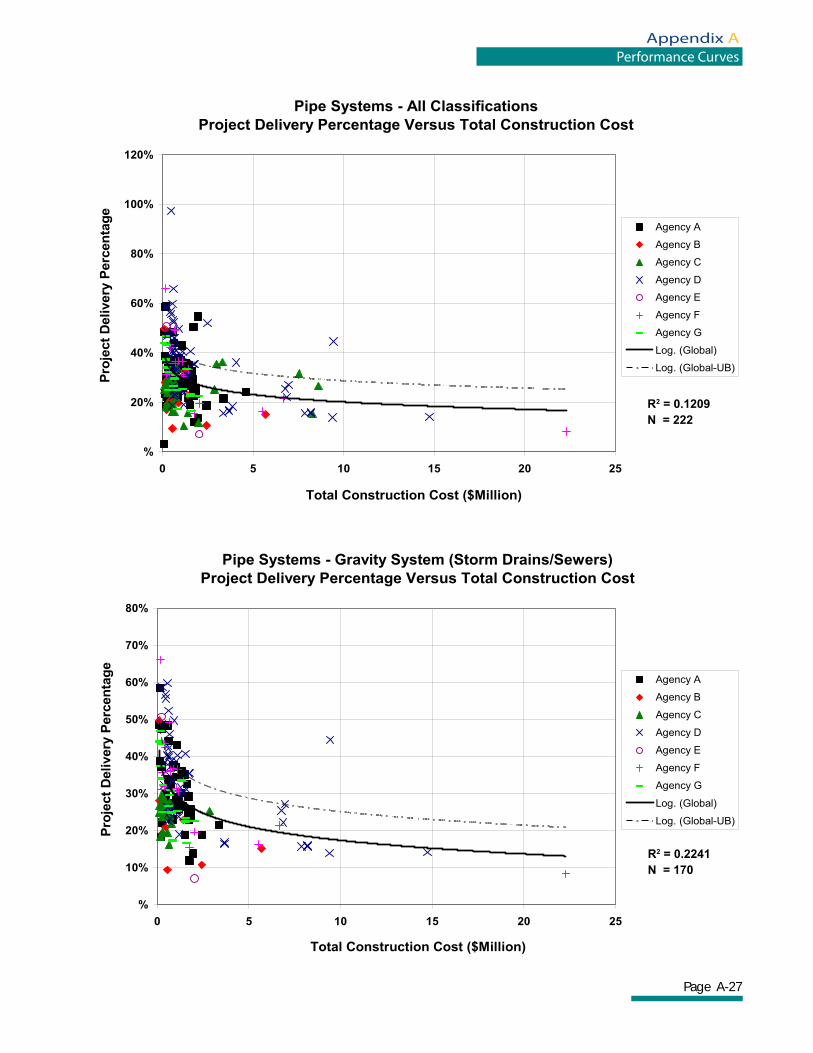
Page A-27
Appendix APerformance Curves
Pipe Systems - All Classifications
Project Delivery Percentage Versus Total Construction Cost
%
20%
40%
60%
80%
100%
120%
0 5 10 15 20 25
Total Construction Cost ($Million)
Pro
ject
Delivery
Perc
en
tag
e
Agency A
Agency B
Agency C
Agency D
Agency E
Agency F
Agency G
Log. (Global)
Log. (Global-UB)
Pipe Systems - Gravity System (Storm Drains/Sewers)
Project Delivery Percentage Versus Total Construction Cost
%
10%
20%
30%
40%
50%
60%
70%
80%
0 5 10 15 20 25
Total Construction Cost ($Million)
Pro
ject
Delivery
Perc
en
tag
e
Agency A
Agency B
Agency C
Agency D
Agency E
Agency F
Agency G
Log. (Global)
Log. (Global-UB)
R2 = 0.1209
N = 222
R2 = 0.2241
N = 170
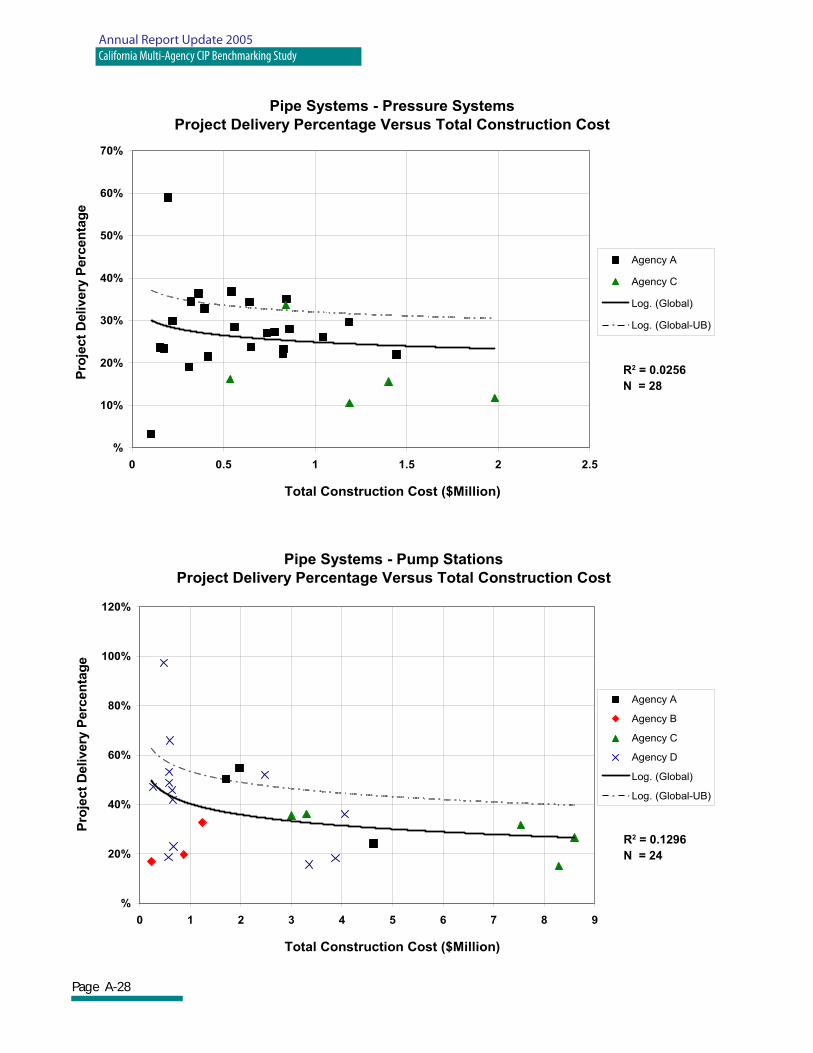
Page A-28
Annual Report Update 2005California Multi-Agency CIP Benchmarking Study
Pipe Systems - Pressure Systems
Project Delivery Percentage Versus Total Construction Cost
%
10%
20%
30%
40%
50%
60%
70%
0 0.5 1 1.5 2 2.5
Total Construction Cost ($Million)
Pro
ject
Delivery
Perc
en
tag
e
Agency A
Agency C
Log. (Global)
Log. (Global-UB)
Pipe Systems - Pump Stations
Project Delivery Percentage Versus Total Construction Cost
%
20%
40%
60%
80%
100%
120%
0 1 2 3 4 5 6 7 8 9
Total Construction Cost ($Million)
Pro
ject
Delivery
Perc
en
tag
e
Agency A
Agency B
Agency C
Agency D
Log. (Global)
Log. (Global-UB)
R2 = 0.0256
N = 28
R2 = 0.1296
N = 24
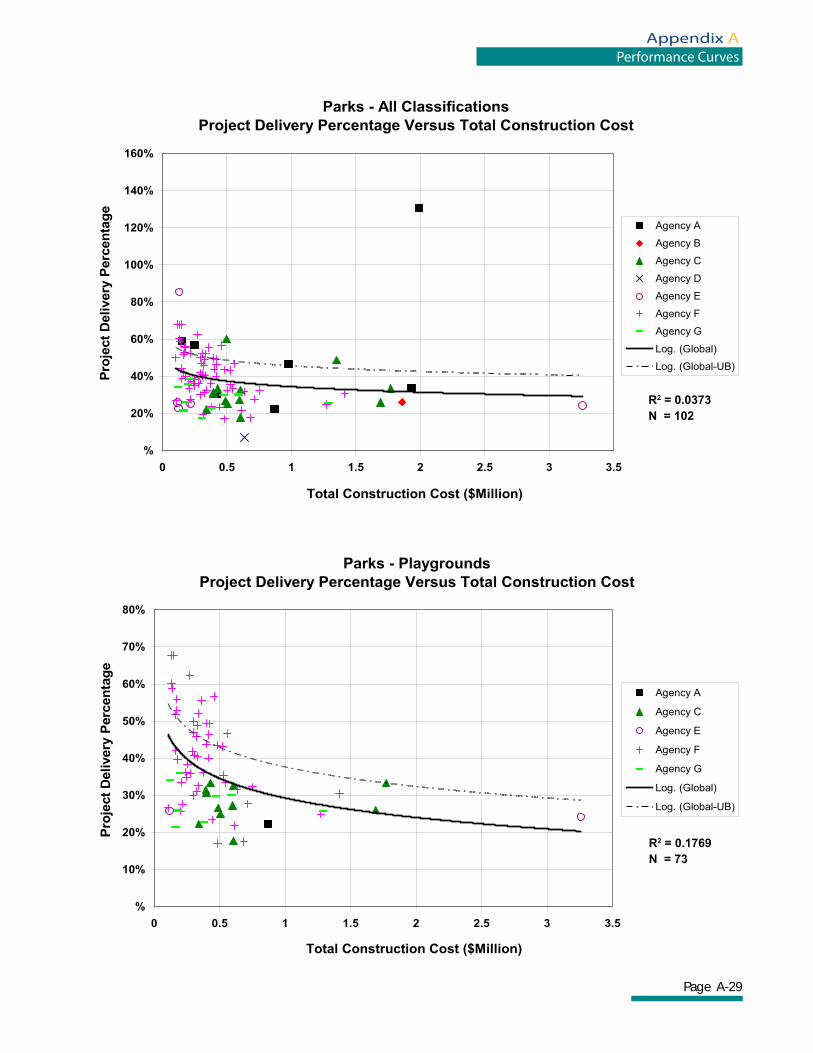
Page A-29
Appendix APerformance Curves
Parks - All Classifications
Project Delivery Percentage Versus Total Construction Cost
%
20%
40%
60%
80%
100%
120%
140%
160%
0 0.5 1 1.5 2 2.5 3 3.5
Total Construction Cost ($Million)
Pro
ject
Delivery
Perc
en
tag
e
Agency A
Agency B
Agency C
Agency D
Agency E
Agency F
Agency G
Log. (Global)
Log. (Global-UB)
Parks - Playgrounds
Project Delivery Percentage Versus Total Construction Cost
%
10%
20%
30%
40%
50%
60%
70%
80%
0 0.5 1 1.5 2 2.5 3 3.5
Total Construction Cost ($Million)
Pro
ject
Delivery
Perc
en
tag
e
Agency A
Agency C
Agency E
Agency F
Agency G
Log. (Global)
Log. (Global-UB)
R2 = 0.0373
N = 102
R2 = 0.1769
N = 73
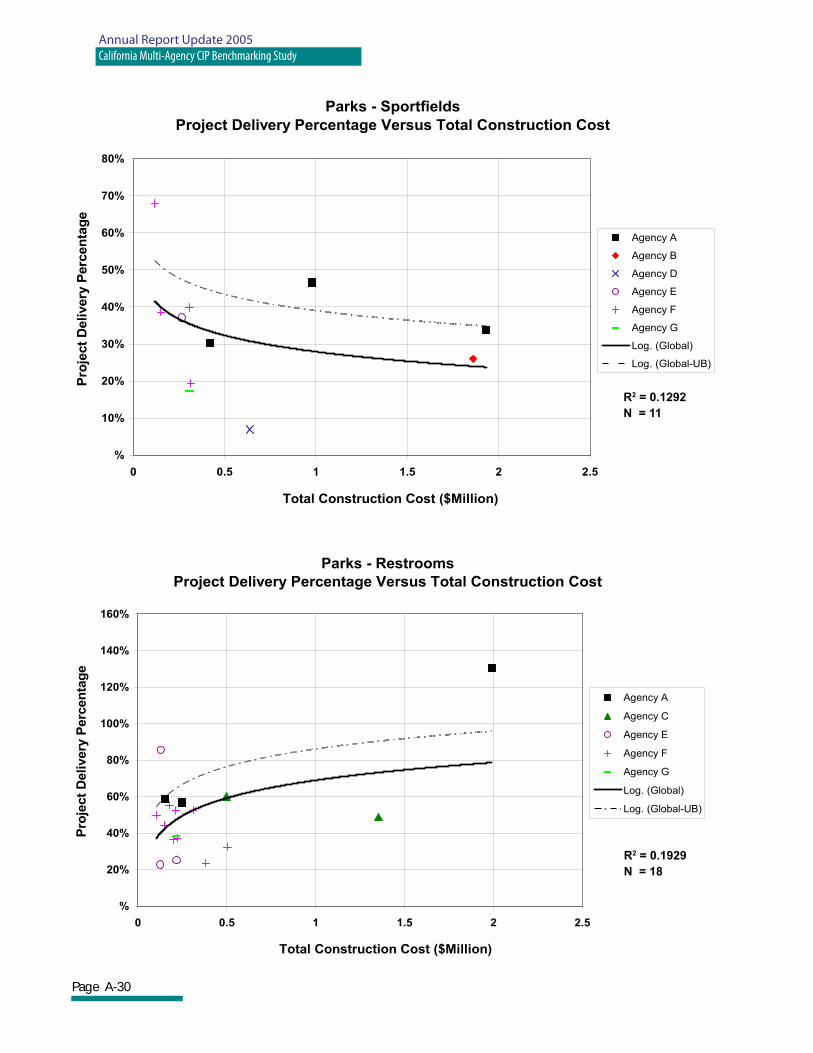
Page A-30
Annual Report Update 2005California Multi-Agency CIP Benchmarking Study
Parks - Sportfields
Project Delivery Percentage Versus Total Construction Cost
%
10%
20%
30%
40%
50%
60%
70%
80%
0 0.5 1 1.5 2 2.5
Total Construction Cost ($Million)
Pro
ject
Delivery
Perc
en
tag
e
Agency A
Agency B
Agency D
Agency E
Agency F
Agency G
Log. (Global)
Log. (Global-UB)
Parks - Restrooms
Project Delivery Percentage Versus Total Construction Cost
%
20%
40%
60%
80%
100%
120%
140%
160%
0 0.5 1 1.5 2 2.5
Total Construction Cost ($Million)
Pro
ject
Delivery
Perc
en
tag
e
Agency A
Agency C
Agency E
Agency F
Agency G
Log. (Global)
Log. (Global-UB)
R2 = 0.1292
N = 11
R2 = 0.1929
N = 18
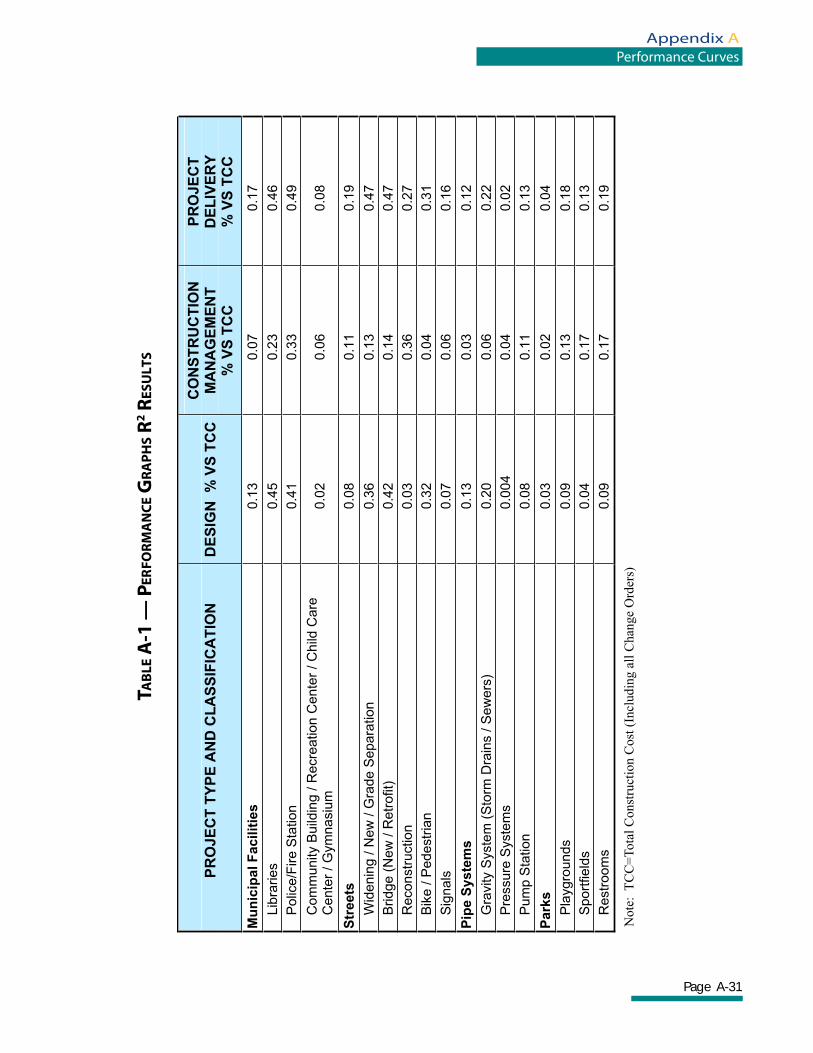
Page A-31
Appendix APerformance Curves
PR
OJE
CT
TY
PE
AN
D C
LA
SS
IFIC
AT
ION
D
ES
IGN
%
VS
TC
C
CO
NS
TR
UC
TIO
NM
AN
AG
EM
EN
T%
VS
TC
C
PR
OJE
CT
DE
LIV
ER
Y%
VS
TC
C
Mu
nic
ipa
l F
ac
ilit
ies
0.1
3
0.0
7
0.1
7
Lib
raries
0.4
5
0.2
3
0.4
6
Polic
e/F
ire S
tation
0.4
1
0.3
3
0.4
9
Com
munity B
uild
ing /
Recre
ation C
ente
r /
Child
Care
C
en
ter
/ G
ym
na
siu
m
0.0
2
0.0
6
0.0
8
Str
eets
0.0
8
0.1
1
0.1
9
Wid
enin
g /
New
/ G
rade S
epara
tion
0.3
6
0.1
3
0.4
7
Bridge (
New
/ R
etr
ofit)
0.4
2
0.1
4
0.4
7
Reconstr
uction
0.0
3
0.3
6
0.2
7
Bik
e /
Pedestr
ian
0.3
2
0.0
4
0.3
1
Sig
nals
0.0
7
0.0
6
0.1
6
Pip
e S
ys
tem
s
0.1
3
0.0
3
0.1
2
Gra
vity S
yste
m (
Sto
rm D
rain
s /
Sew
ers
) 0.2
0
0.0
6
0.2
2
Pre
ssure
Syste
ms
0.0
04
0.0
4
0.0
2
Pum
p S
tation
0.0
8
0.1
1
0.1
3
Park
s0.0
3
0.0
2
0.0
4
Pla
ygro
unds
0.0
9
0.1
3
0.1
8
Sport
field
s
0.0
4
0.1
7
0.1
3
Restr
oom
s
0.0
9
0.1
7
0.1
9
Note
: T
CC
=T
ota
l C
onst
ruct
ion C
ost
(In
cludin
g a
ll C
han
ge
Ord
ers)
TAB
LE A
-1 —
PER
FOR
MA
NC
E G
RA
PH
S R
2 RES
ULT
S

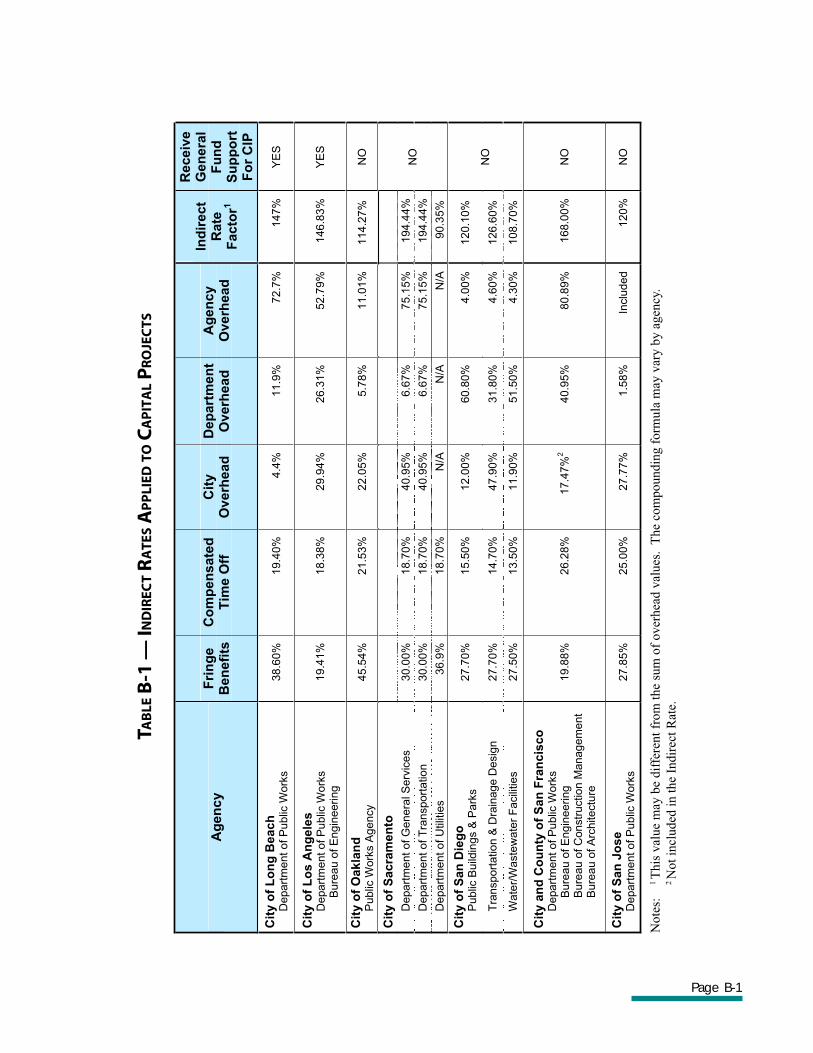
Page B-1
Ag
en
cy
Fri
ng
eB
en
efi
tsC
om
pen
sate
dT
ime
Off
C
ity
Overh
ead
De
pa
rtm
en
tO
verh
ead
A
gen
cy
Ov
erh
ea
d
Ind
ire
ct
Rate
Facto
r1
Receiv
eG
en
era
lF
un
dS
up
po
rtF
or
CIP
Cit
y o
f L
on
g B
ea
ch
D
epart
ment of P
ublic
Work
s38.6
0%
19.4
0%
4.4
%
11.9
%
72.7
%147%
YE
S
Cit
y o
f L
os
An
ge
les
D
epa
rtm
en
t o
f P
ub
lic W
ork
s
Bure
au o
f E
ngin
eering
19.4
1%
18.3
8%
29.9
4%
26.3
1%
52.7
9%
146.8
3%
Y
ES
Cit
y o
f O
ak
lan
d
Public
Work
s A
gency
45
.54
%2
1.5
3%
22
.05
%
5.7
8%
1
1.0
1%
11
4.2
7%
NO
Cit
y o
f S
ac
ram
en
to
Depart
ment of G
enera
l S
erv
ices
30.0
0%
18.7
0%
40.9
5%
6.6
7%
75.1
5%
194.4
4%
De
pa
rtm
ent o
f T
ran
sp
ort
atio
n
30
.00
%1
8.7
0%
40
.95
%6
.67
%7
5.1
5%
19
4.4
4%
Depart
ment of U
tilit
ies
36.9
%18.7
0%
N/A
N/A
N/A
90.3
5%
NO
Cit
y o
f S
an
Die
go
P
ublic
Build
ings &
Park
s
27.7
0%
15.5
0%
12.0
0%
60.8
0%
4.0
0%
120.1
0%
Tra
nsport
ation &
Dra
inage D
esig
n
27.7
0%
14.7
0%
47.9
0%
31.8
0%
4.6
0%
126.6
0%
Wate
r/W
aste
wate
r F
acili
ties
27.5
0%
13.5
0%
11.9
0%
51.5
0%
4.3
0%
108.7
0%
NO
Cit
y a
nd
Co
un
ty o
f S
an
Fra
nc
isc
o
De
pa
rtm
en
t o
f P
ub
lic W
ork
s
Bure
au o
f E
ngin
eering
Bu
reau
of C
on
str
uctio
n M
an
ag
em
en
t B
ure
au o
f A
rchitectu
re
19.8
8%
26.2
8%
17.4
7%
2
40.9
5%
80.8
9%
168.0
0%
NO
Cit
y o
f S
an
Jo
se
D
epart
ment of P
ublic
Work
s2
7.8
5%
25
.00
%2
7.7
7%
1
.58
%
Inclu
de
d1
20
%N
O
TAB
LE B
-1 —
IND
IREC
T R
ATE
S A
PP
LIED
TO
CA
PIT
AL P
RO
JEC
TS
Note
s:
1 T
his
val
ue
may
be
dif
fere
nt
from
the
sum
of
over
hea
d v
alues
. T
he
com
poundin
g f
orm
ula
may
var
y b
y a
gen
cy.
2
Not
incl
uded
in t
he
Indir
ect
Rat
e.