Embed Size (px)
Citation preview
2
TABLE OF CONTENTS
3 EXECUTIVE SUMMARY / EXECUTIVE SUMMARY OF SURVEY RESULTS
4 BRAND AWARENESS / HOW MANY AUSTRALIANS KNOW ABOUT WEARABLES?
5 WEARABLE USAGE / HOW MANY AUSTRALIANS HAVE USED A WEARABLE?
6 WEARABLE OWNERSHIP / WHO OWNS A WEARABLE?
7 SMARTWATCH USAGE & OWNERSHIP / A DEEP DIVE INTO SMARTWATCH USE & OWNERSHIP
8 SMARTWATCH BRAND AWARENESS / WHICH SMARTWATCHES DO AUSTRALIANS KNOW?
9 PURCHASE INTENTION / WHICH WEARABLES DO AUSTRALIANS WANT?
10 PURCHASE DRIVERS / WHY ARE PEOPLE BUYING WEARABLES?
11 WEARABLES IN THE WORKPLACE / ARE AUSTRALIAN BUSINESSES USING WEARABLES?
12 ANSIBLE INSIGHT / SOLVING BUSINESS CHALLENGES USING WEARABLES
13 360 VIDEO / ARE AUSTRALIANS WATCHING 360 VIDEOS?
14 AR & VR / GAUGING EXPERIENCES WITH AUGMENTED REALITY & VIRTUAL REALITY
15-18 M-COMMERCE / WHAT ARE AUSTRALIANS’ MOBILE SHOPPING HABITS?
19 ONLINE SECURITY / A LOOK AT AUSTRALIANS’ ATTITUDES TOWARDS ONLINE SECURITY
20-21 APPENDIX / WHO WERE THE PEOPLE WE SURVEYED?
3
EXECUTIVE SUMMARY
THANKS FOR HAVING A READ OF OUR SECOND ANNUAL MOBILE AND WEARABLES REPORT.
Over the past 12 months, mobile and related technologies continued to grow in popularity; as a way for businesses to connect with consumers and a way for businesses to solve their own internal challenges. Below is a topline summary of the report findings: WEARABLE TECHNOLOGIES
- Awareness is growing with 96% of Australians having heard of one or more wearable devices- Big brands such as Apple and Fitbit continue to lead the way
- Most Australians have used a wearable (2/3 of 18-35) - Smartwatch ownership has doubled in the past 12 months - Half of Australians plan to buy a wearable device in the next 6 months - Awareness of Wearables in the workplace is growing – with many successful pilots already in market
AUGMENTED REALITY, VIRTUAL REALITY & 360 VIDEO
- Exposure to AR and VR has significantly increased - 360 Video Viewership is growing in Australia with 83% of 18-35’s having watched a 360 video
MOBILE RELATED PURCHASES
- Mobile and tablet purchases have significantly increased, more than doubling in many categories - Purchases made by ‘tapping’ have increased across all categories
SECURITY
- Online security concerns are here to stay - All demographics remain careful about who they transact with online
WHAT IT MEANS FOR MARKETERS?Consumers are transacting on mobile devices more than ever before, with purchases made both directly online on mobile devices and through tap to pay have seen growth across the board. Marketers should be ready to embrace this heightened shift from browsing only, towards mobile transactions, ensuring that websites are optimised for mobile purchases and that retail stores are ready to accept mobile tap payments. Over the past year, we’ve also seen a big shift in use of, ownership and intention to purchase wearables, which are increasingly offering new ways for brands to engage with consumers in highly personal and time sensitive ways. Whether it be a wearable connected app or branded wearable technology, now is the time to consider how your brand can leverage this technology and growing consumer bases, or how your business can leverage wearable technology for efficiency/productivity improvements. If you have any questions regarding this report, or mobile related technologies, please contact Ansible at [email protected] Thanks, and enjoy
Scott PlayerCEO, Ansible
3
HOW WAS THE SURVEY CONDUCTED? The methodology of this research consisted of a 15-minute online survey amongst people aged 18-54 within Australia. The sample size is nationally representative, n=400. Fieldwork ran for a duration of one week in July 2016.
RESEARCH METHODOLOGY
4
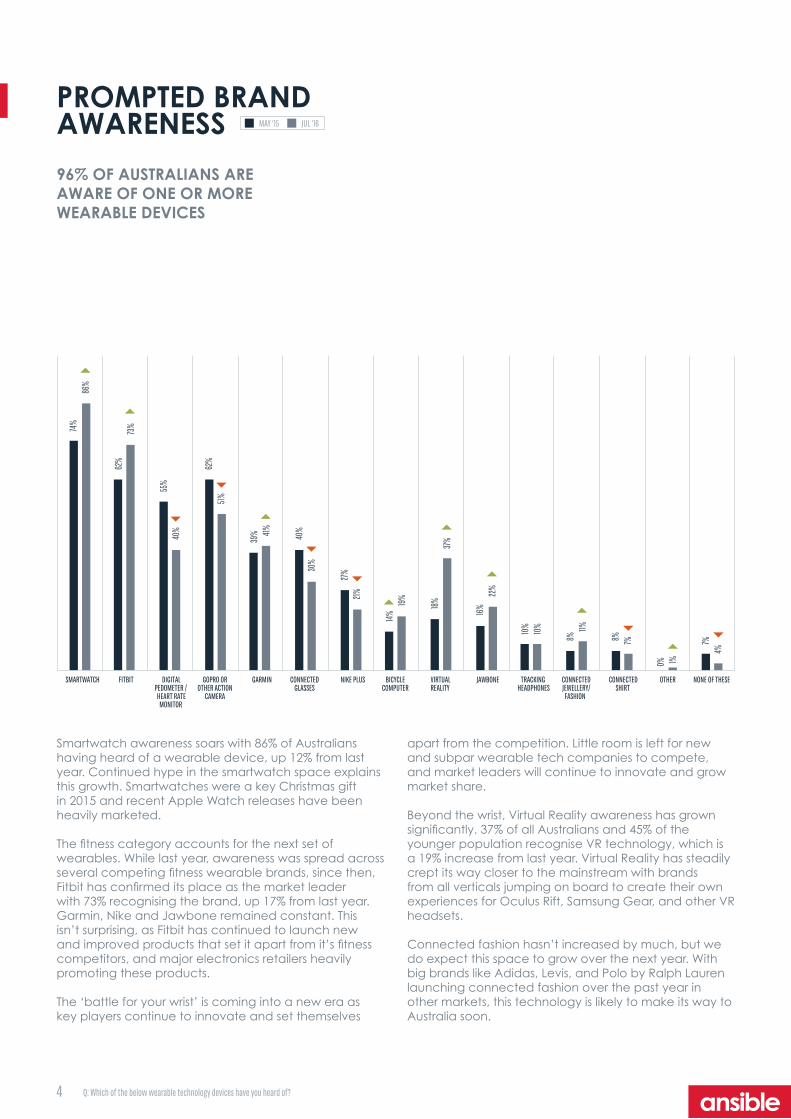
PROMPTED BRAND AWARENESS MAY ‘15 JUL ‘16
96% OF AUSTRALIANS ARE AWARE OF ONE OR MORE WEARABLE DEVICES
Smartwatch awareness soars with 86% of Australians having heard of a wearable device, up 12% from last year. Continued hype in the smartwatch space explains this growth. Smartwatches were a key Christmas gift in 2015 and recent Apple Watch releases have been heavily marketed.
The fitness category accounts for the next set of wearables. While last year, awareness was spread across several competing fitness wearable brands, since then, Fitbit has confirmed its place as the market leader with 73% recognising the brand, up 17% from last year. Garmin, Nike and Jawbone remained constant. This isn’t surprising, as Fitbit has continued to launch new and improved products that set it apart from it’s fitness competitors, and major electronics retailers heavily promoting these products.
The ‘battle for your wrist’ is coming into a new era as key players continue to innovate and set themselves
apart from the competition. Little room is left for new and subpar wearable tech companies to compete, and market leaders will continue to innovate and grow market share.
Beyond the wrist, Virtual Reality awareness has grown significantly. 37% of all Australians and 45% of the younger population recognise VR technology, which is a 19% increase from last year. Virtual Reality has steadily crept its way closer to the mainstream with brands from all verticals jumping on board to create their own experiences for Oculus Rift, Samsung Gear, and other VR headsets.
Connected fashion hasn’t increased by much, but we do expect this space to grow over the next year. With big brands like Adidas, Levis, and Polo by Ralph Lauren launching connected fashion over the past year in other markets, this technology is likely to make its way to Australia soon.
74%
62%
55%
62%
39% 40
%
27%
14%
18%
16%
10%
8%
8%
0%
7%
86%
73%
40%
51%
41%
30%
21%
19%
37%
22%
10% 11%
7%
1% 4%
SMARTWATCH FITBIT DIGITALPEDOMETER / HEART RATE MONITOR
GOPRO OR OTHER ACTION
CAMERA
GARMIN CONNECTED GLASSES
NIKE PLUS BICYCLE COMPUTER
VIRTUAL REALITY
JAWBONE TRACKING HEADPHONES
CONNECTEDJEWELLERY/FASHION
CONNECTED SHIRT
OTHER NONE OF THESE
Q: Which of the below wearable technology devices have you heard of?

5
0+2+100+20+110+13+120+12+210+2+30+1+10+54+430+5+20+3+30+3+20+5+70+8+50+1+00+12+230+8+8 MAY ‘15 JUL ‘16WEARABLE USAGE
TWO THIRDS OF AUSTRALIANS 18-35 HAVE USED A WEARABLE DEVICE
VIRTUAL REALITY
JAWBONE CONNECTED SHIRT NONE
TRACKING HEADPHONES CONNECTED GLASSES
CONNECTED JEWELLERY
5
Usage rates for most wearables have increased year on year. The standouts are Fitbit and Smartwatches with usage doubling.
The only wearable to see considerable decrease is digital pedometers. This is not surprising as there has been a recent shift towards using “fitbit” as the generic term for a fitness tracking device or digital pedometer.
Connected glasses, jewellery, clothing and headphones usage remains low. These products are yet to be introduced let alone widely adopted in the Australian market.
NIKE PLUSBICYCLE COMPUTER
2% 1% 54%3% 1%
OTHER
3% 1% 43%2% 0%
Q: Which of the below wearable technology devices have you ever used?
DIGITAL PEDOMETERFITBIT GOPRO
2% 3%5%5%8%
5% 3%7%8%8%
GARMIN
2% 20%12% 13%12%
SMARTWATCH
10% 11%23% 12%21%

6
18% of all Australians and almost 1 in 4 18-35s now own a smartwatch.
Ownership for all wearables continues to grow across the market, with smartwatches recording the biggest growth in the last 12 months. Usage of almost all wearable devices is higher than ownership, showing that people are still trialling and sharing these devices between multiple people. Wearable Integration with fashion labels and jewellery companies like Hermes, Michael Kors, and Tory Burch have made wearable devices more attractive to consumers. As we say goodbye to devices with bulky plastic bands and introduce a new batch of stylish smart accessories that come in all sizes and styles imaginable, ownership will continue to increase.
WEARABLE OWNERSHIPSMARTWATCH OWNERSHIP HAS DOUBLED IN THE PAST 12 MONTHS
MAY ‘15 JUL ‘16
18%
16%
12%
12%
5%
5% 9%
5%
1% 3%
1%
1%
1%
0%
49%
6%
23%
13%
24%
8%
3% 5%
1% 2%
3%
2%
10%
3%
0%
40%
DIGITAL PEDOMETERETC
FITBIT GOPRO OR OTHER ACTION
CAMERA
SMARTWATCH GARMIN BICYCLE COMPUTER
NIKE PLUS TRACKING HEADPHONES
JAWBONE CONNECTED GLASSES
CONNECTED JEWELLERY/FASHION
VIRTUAL REALITY
CONNECTED SHIRT
OTHER NONE
More than half of respondents who own a wearable have used an app for their wearable device.
Of the wearable apps that have been used, the majority are health & fitness related. This is not surprising as health & fitness are the main purchase reasons for wearables. Gaming came next with 28% of people having used a gaming app on their wearable. As seen earlier in the report, gaming has become a key driver in wearable purchases, likely with the introduction of gamified fitness and gaming apps for wearables.
Virtual Reality and payment apps were low in usage but had high levels of interest. Both of these technologies are fairly new and have received a great deal of publicity in 2016. Apple Pay has continued to gain traction overseas and the technology is now trickling into Australia with ANZ and American Express launching Apple Pay earlier this year. This indicates that consumers are ready for ‘tap and pay’ via mobile technology to make its way to the mainstream Australian market.
WEARABLE APPS
Q: Which of the below wearable technology devices do you own?
7
28+19+9+3+4+6+2+t
21+12+8+3+3+4+3+t
TOTAL 21%
APPL
E 12%
SAMSUNG 8%LG 3%
SONY 3%
PEBBLE 3%
OTHER 3%
TOTAL 28%
APPLE 19%
SAMSUNG 9%
LG 3%SONY 4%
PEBBLE 6%
OTHER 2%
Smartwatches were among the mostly likely wearables to have been used. 21% of all Australians have used a smartwatch, nearly twice as many as last year.
Of smartwatch brands used. Apple once again led the way with Samsung following close behind. The results also show that some people have trialled more than one type of smartwatch. We expect the number of people trialling smartwatches to greatly increase. With high profile launches such as the recent Apple Watch Series 2, new functionalities and decreasing cost, barriers to purchase are diminishing. More electronic retailers are carrying and featuring smartwatches, giving people more opportunities to use the tech.
SMARTWATCH USAGE
JULY ‘16 TOTAL [18-54] JULY ‘16 YOUNGER [18-35]
1 IN 5 AUSTRALIANS HAS USED A SMARTWATCH
SMARTWATCH OWNERSHIP
TOTAL
APPLE
SAMSUNG
SONY
LG
PEBBLE
OTHER
JULY ‘16 TOTAL [18-54]JULY ‘16 YOUNGER [18-35]
18%24%
10%15%
7%8%
2%3%
3%4%
3%4%
3%2%
Smartwatch ownership has seen significant growth since last year. Of smartwatches owned, the majority were Apple Watches, fitting as the Apple Watch became available a little over a year ago. Other smartwatches such as Samsung, LG, Sony, and Pebble accounted for the remaining ownership. The results also show that some people now own more than one smartwatch and may have trialled a Pebble or LG before investing in an Apple Watch or Samsung Galaxy Gear.
Looking at the traditional technology adoption cycle, smartwatches are moving beyond the early adoption phase and into the early stages of mainstream. We expect these numbers to increase dramatically in the coming months. The Apple Watch Series 2 recently launched featuring more affordable pricing and new features such as being waterproof, 50% faster, and 2x brighter than the Series 1. Most watch brands are making strides in turning their own watches into ‘smartwatches’. With Christmas just around the corner, sales are set to spike.
18% OF ALL AUSTRALIANS OWN A SMARTWATCH
Q: Which of the below wearable technology devices have you ever used? Q: Which of the below wearable technology devices do you own?
8
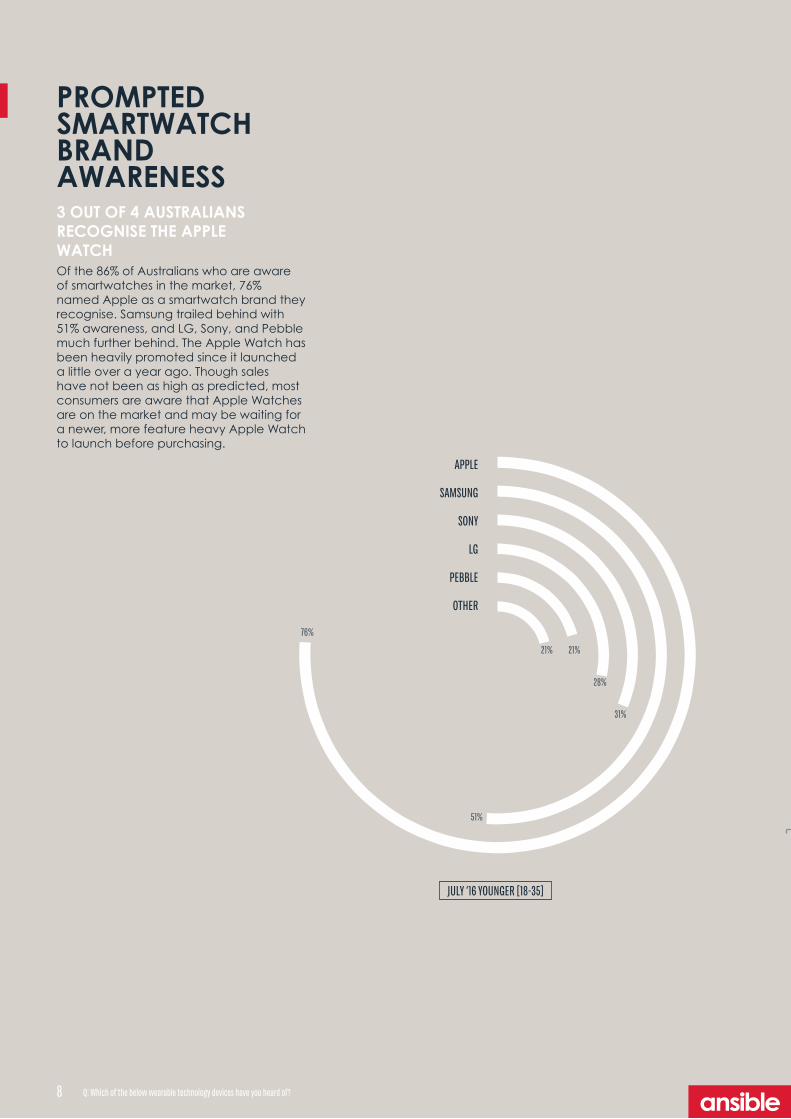
Of the 86% of Australians who are aware of smartwatches in the market, 76% named Apple as a smartwatch brand they recognise. Samsung trailed behind with 51% awareness, and LG, Sony, and Pebble much further behind. The Apple Watch has been heavily promoted since it launched a little over a year ago. Though sales have not been as high as predicted, most consumers are aware that Apple Watches are on the market and may be waiting for a newer, more feature heavy Apple Watch to launch before purchasing.
86%
75%
50%
30% 28%
20% 20%
86%
76%
51%
31% 28%
21% 21%
Smartwatch (Total)
Smartwatch (Apple)
Smartwatch (Samsung)
Smartwatch (Sony)
Smartwatch (LG) Smartwatch (Pebble)
Smartwatch (Other)
Prompted Brand Awareness (Total 18-54)
July '16 - Total (18-54)
July'16 - Younger (18-35) 0+21+21+28+31+51+76APPLE
SAMSUNG
SONY
LG
PEBBLE
OTHER
76%
51%
31%
28%
21%21%
PROMPTED SMARTWATCH BRAND AWARENESS
JULY ‘16 YOUNGER [18-35]
8
3 OUT OF 4 AUSTRALIANS RECOGNISE THE APPLE WATCH
Q: Which of the below wearable technology devices have you heard of?
9
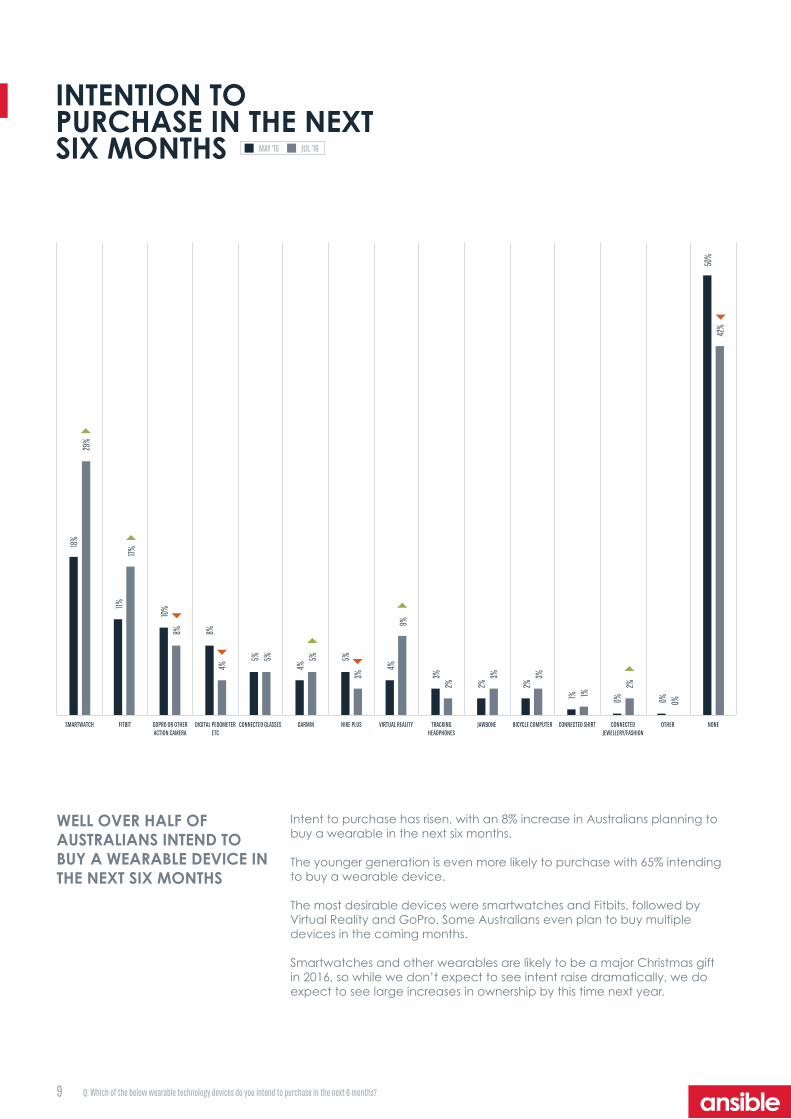
Intent to purchase has risen, with an 8% increase in Australians planning to buy a wearable in the next six months.
The younger generation is even more likely to purchase with 65% intending to buy a wearable device.
The most desirable devices were smartwatches and Fitbits, followed by Virtual Reality and GoPro. Some Australians even plan to buy multiple devices in the coming months.
Smartwatches and other wearables are likely to be a major Christmas gift in 2016, so while we don’t expect to see intent raise dramatically, we do expect to see large increases in ownership by this time next year.
INTENTION TO PURCHASE IN THE NEXT SIX MONTHS
WELL OVER HALF OF AUSTRALIANS INTEND TO BUY A WEARABLE DEVICE IN THE NEXT SIX MONTHS
MAY ‘15 JUL ‘16
18%
11%
10%
8%
5%
4% 5%
4%
3%
2%
2%
1%
0%
0%
50%
29%
17%
8%
4% 5%
5%
3%
9%
2% 3%
3%
1% 2%
0%
42%
SMARTWATCH FITBIT GOPRO OR OTHER ACTION CAMERA
DIGITAL PEDOMETER ETC
CONNECTED GLASSES GARMIN NIKE PLUS VIRTUAL REALITY TRACKING HEADPHONES
JAWBONE BICYCLE COMPUTER CONNECTED SHIRT CONNECTED JEWELLERY/FASHION
OTHER NONE
Q: Which of the below wearable technology devices do you intend to purchase in the next 6 months?
10
0+3+30+3+40+28+170+6+230+7+24 0+25+240+45+230+54+430+39+420+31+26
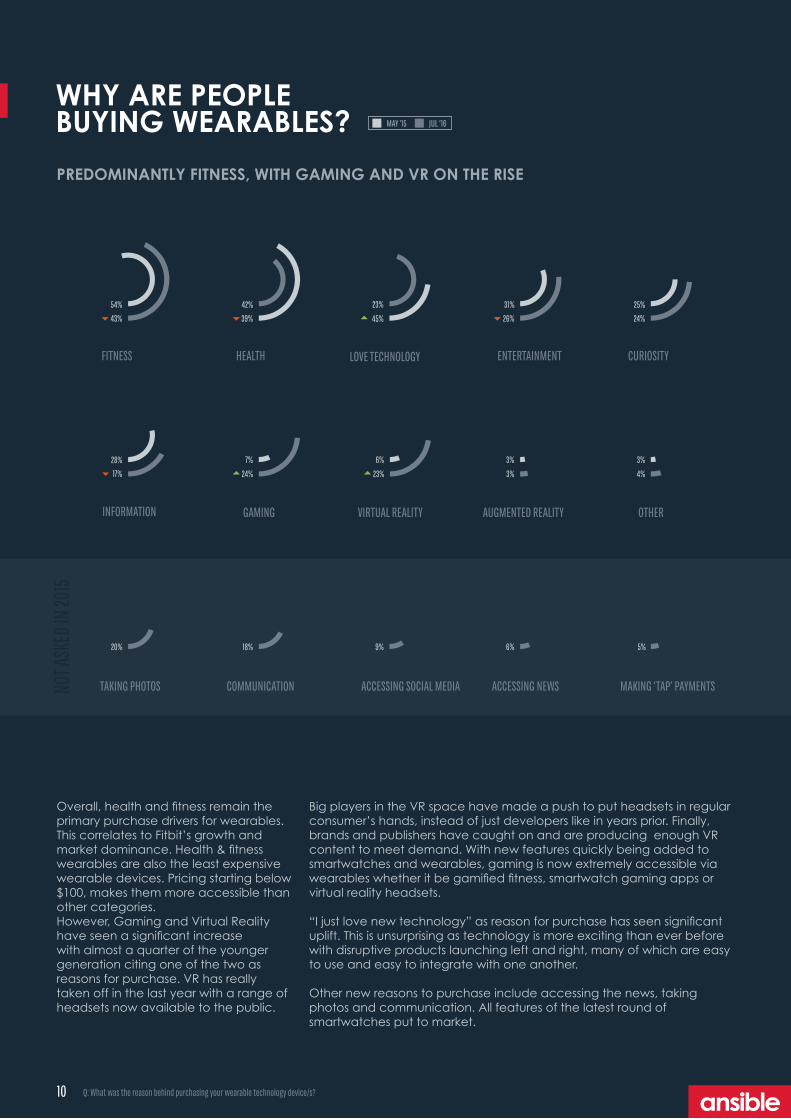
Overall, health and fitness remain the primary purchase drivers for wearables. This correlates to Fitbit’s growth and market dominance. Health & fitness wearables are also the least expensive wearable devices. Pricing starting below $100, makes them more accessible than other categories.However, Gaming and Virtual Reality have seen a significant increase with almost a quarter of the younger generation citing one of the two as reasons for purchase. VR has really taken off in the last year with a range of headsets now available to the public.
CURIOSITY
AUGMENTED REALITY OTHER
0+18COMMUNICATION
18%
0+6ACCESSING NEWS
6%
0+5MAKING ‘TAP’ PAYMENTS
5%
0+9ACCESSING SOCIAL MEDIA
9%
0+20TAKING PHOTOS
20%
WHY ARE PEOPLE BUYING WEARABLES?
Big players in the VR space have made a push to put headsets in regular consumer’s hands, instead of just developers like in years prior. Finally, brands and publishers have caught on and are producing enough VR content to meet demand. With new features quickly being added to smartwatches and wearables, gaming is now extremely accessible via wearables whether it be gamified fitness, smartwatch gaming apps or virtual reality headsets.
“I just love new technology” as reason for purchase has seen significant uplift. This is unsurprising as technology is more exciting than ever before with disruptive products launching left and right, many of which are easy to use and easy to integrate with one another.
Other new reasons to purchase include accessing the news, taking photos and communication. All features of the latest round of smartwatches put to market.
NOT A
SKED
IN 20
15
MAY ‘15 JUL ‘16
INFORMATION
LOVE TECHNOLOGY
VIRTUAL REALITYGAMING
3% 3%28% 6%7%
3% 4%17% 23%24%
10
PREDOMINANTLY FITNESS, WITH GAMING AND VR ON THE RISE
Q: What was the reason behind purchasing your wearable technology device/s?
FITNESS HEALTH ENTERTAINMENT
25%23%54% 42% 31%
24%45%43% 39% 26%
11
WEARABLE TECH IN THE WORKPLACE
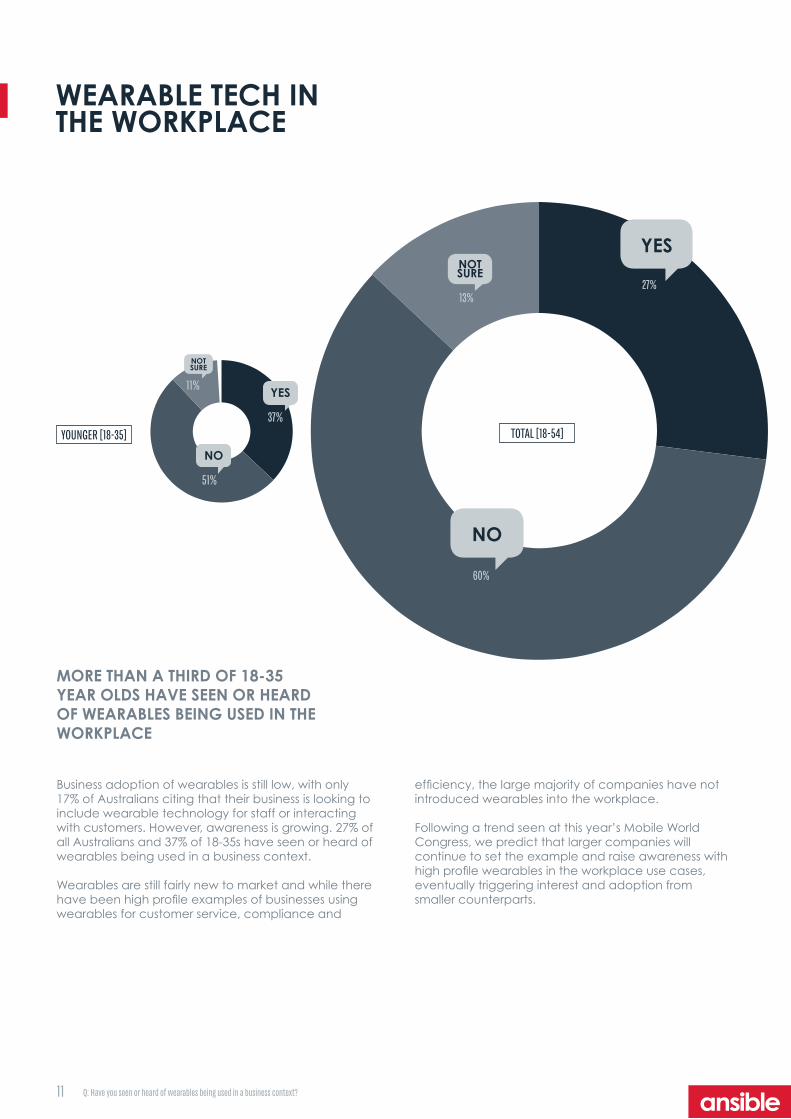
Business adoption of wearables is still low, with only 17% of Australians citing that their business is looking to include wearable technology for staff or interacting with customers. However, awareness is growing. 27% of all Australians and 37% of 18-35s have seen or heard of wearables being used in a business context.
Wearables are still fairly new to market and while there have been high profile examples of businesses using wearables for customer service, compliance and
27+60+13+zYES
NOTSURE
NO
TOTAL [18-54]
27%13%
60%
37+51+11+tYOUNGER [18-35]
NOTSURE
YES
NO
37%
51%
11%
MORE THAN A THIRD OF 18-35 YEAR OLDS HAVE SEEN OR HEARD OF WEARABLES BEING USED IN THE WORKPLACE
efficiency, the large majority of companies have not introduced wearables into the workplace.
Following a trend seen at this year’s Mobile World Congress, we predict that larger companies will continue to set the example and raise awareness with high profile wearables in the workplace use cases, eventually triggering interest and adoption from smaller counterparts.
Q: Have you seen or heard of wearables being used in a business context?

12
ANSIBLE INSIGHT
DfreeDeveloped in Japan, the Dfree is a wearable device that attaches to the skin, monitoring your internals and alerting you ahead of time that you need to visit the toilet. Whilst I’m sure you have a smile on your face right now, imagine the possibilities when used broadly across aged care, anyone with a physical disability and other healthcare scenarios. In many elderly care centres, incontinence is a major issue, and patient comfort is a primary objective – this device is helping shift to a preventative as opposed to cure-based approach.
DaqriThe Daqri is an industrial grade smart helmet that enables workers to connect to their work environments through the power of augmented reality. Combining a camera and audio capabilities to enable remote help, an AR visor to overlay data on a heads up display, alert functions along with traditional safety of a hard hat and safety lenses, Daqri have proven efficiency increases of up to 30% and reductions in error rates of up to 90% in some applications.
SOLVING BUSINESS CHALLENGES USING WEARABLES
VR to showcase productsThere is a wide range of examples where Virtual Reality is being used to showcase products remotely, or increase the speed of products to market. Examples such as Real Estate agents utilising VR to showcase multiple high end properties from a remote location, or Ford utilising Virtual Reality to showcase vehicle design to consumers, taking feedback and adjusting parameters in real time, significantly reducing the prototyping stage of vehicle development.
Virtual Reality theme parksVR is not only about experiencing something on the lounge at home. In the US, there is a huge amount of investment into Virtual Reality theme parks. Examples include Six Flags investing to launch VR roller coasters in 6 parks across the USA and Sony Pictures working with a startup called The Void to build a Virtual Reality “Ghostbusters” interactive environment in New York. The Void combines VR with the real world to create an immersive experience blending the two.
Whilst there is a high awareness of wearables amongst consumers, with the big brands such as Fitbit and Apple leading the way, businesses and organisations across wide and varied industries are finding ways to solve business challenges utilising wearable technologies. Below are a few weird and wonderful examples of how wearables are helping transform industries, workflow or solve other problems in everyday life.
Overall, it’s a very exciting space. The opportunity is there to disrupt, transform, or simply evolve industries utilising the power and capability of dynamic mobility and technology solutions – Scott Player, CEO, Ansible
13
360 VIDEO VIEWERSHIP IS GROWING IN AUSTRALIA
AROUND 1 IN 2 AUSTRALIANS HAVE HEARD OF 360 VIDEO AND OF THOSE WHO HAVE HEARD OF IT, THE MAJORITY HAVE ALSO WATCHED ONE 43+48+956+40+4
74+20+583+12+368
%
51%
26%
19%
14%
4%
2%
73%
53%
26%
21%
12%
3%
1%
YOUTUBE FACEBOOK GOOGLE OCCULUS SAMSUNG OTHER CAN'T REMEMBER
YES - 43%YES - 57%
NO - 48%
NO - 40%
9% 4%
NOTSURENOT
SURE
YES - 74% YES - 83%
NO - 20%NO - 12%
5% 3%
NOTSURENOT
SURE
TOTAL [18-54] YOUNGER [18-35]
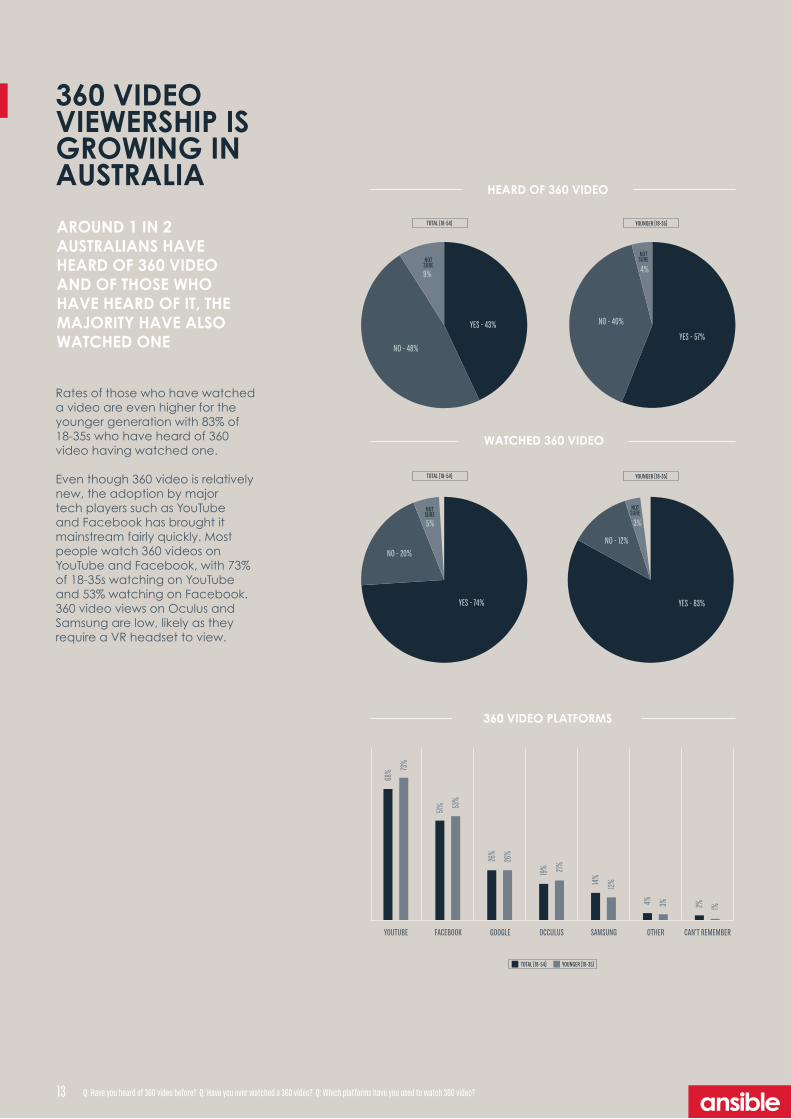
Rates of those who have watched a video are even higher for the younger generation with 83% of 18-35s who have heard of 360 video having watched one.
Even though 360 video is relatively new, the adoption by major tech players such as YouTube and Facebook has brought it mainstream fairly quickly. Most people watch 360 videos on YouTube and Facebook, with 73% of 18-35s watching on YouTube and 53% watching on Facebook. 360 video views on Oculus and Samsung are low, likely as they require a VR headset to view.
HEARD OF 360 VIDEO
TOTAL [18-54] YOUNGER [18-35]
WATCHED 360 VIDEO
360 VIDEO PLATFORMS
TOTAL [18-54] YOUNGER [18-35]
13 Q: Have you heard of 360 video before? Q: Have you ever watched a 360 video? Q: Which platforms have you used to watch 360 video?
14
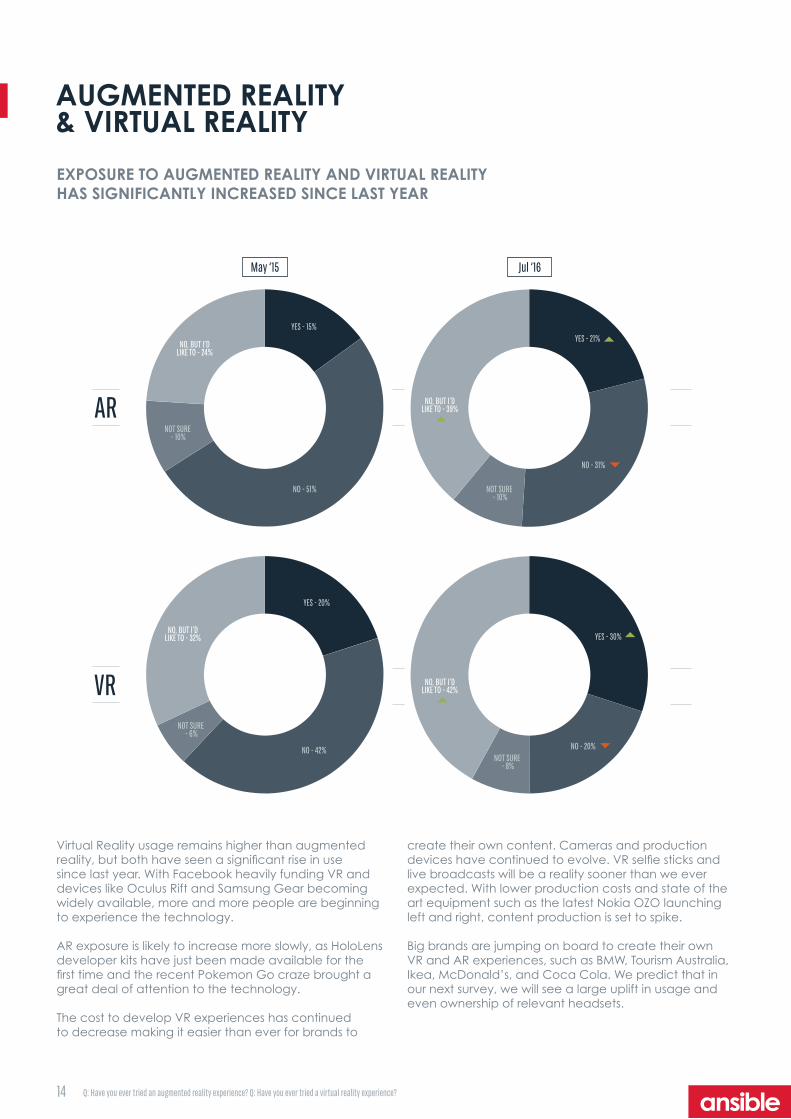
21+30+10+39+zVirtual Reality usage remains higher than augmented reality, but both have seen a significant rise in use since last year. With Facebook heavily funding VR and devices like Oculus Rift and Samsung Gear becoming widely available, more and more people are beginning to experience the technology.
AR exposure is likely to increase more slowly, as HoloLens developer kits have just been made available for the first time and the recent Pokemon Go craze brought a great deal of attention to the technology.
The cost to develop VR experiences has continued to decrease making it easier than ever for brands to
AUGMENTED REALITY & VIRTUAL REALITY
EXPOSURE TO AUGMENTED REALITY AND VIRTUAL REALITY HAS SIGNIFICANTLY INCREASED SINCE LAST YEAR
15+51+10+24+z20+42+6+32+z30+20+8+42+z
create their own content. Cameras and production devices have continued to evolve. VR selfie sticks and live broadcasts will be a reality sooner than we ever expected. With lower production costs and state of the art equipment such as the latest Nokia OZO launching left and right, content production is set to spike.
Big brands are jumping on board to create their own VR and AR experiences, such as BMW, Tourism Australia, Ikea, McDonald’s, and Coca Cola. We predict that in our next survey, we will see a large uplift in usage and even ownership of relevant headsets.
May ‘15 Jul ‘16
AR
VR
YES - 15%YES - 21%
NO - 51%
NO - 31%
NOT SURE - 10%
NO, BUT I’D LIKE TO - 24%
NO, BUT I’D LIKE TO - 39%
NOT SURE - 10%
YES - 20%
YES - 30%
NO - 42% NO - 20%
NOT SURE - 6%
NOT SURE - 8%
NO, BUT I’D LIKE TO - 32%
NO, BUT I’D LIKE TO - 42%
Q: Have you ever tried an augmented reality experience? Q: Have you ever tried a virtual reality experience?

15
MOBILE PURCHASES
MORE PEOPLE ARE MAKING MOBILE PURCHASES ACROSS THE BOARD
HOME
WARE
S / EL
ECTR
ONICS
ORDE
R FOO
D
RESERVATIONS
SUBSCRIPTIONS MUSIC OR MOVIES VIDEO CONTENT CLOTHING & APPAREL GAMBLING
GROCERIES GIFTS VOUCHERS TRANSPORT PHONE WALLPAPERS ENTERTAINMENT
TRAVE
L
C
OMPE
TITION
S
GAM
ING
5%
40%
35%
30%
25%
20%
15%
10%
MAY ‘15 JUL ‘16
Consumers are making more purchases with their mobile devices than ever before. These purchases are made in all categories.Music and movies, gaming, and entertainment purchases are the most likely to made via mobile.
Larger purchases such as clothing and apparel, food and beverages, and homewares and electronics are now being made via mobile devices too, showing that consumers are getting comfortable making regular purchases with their mobile phone. Whilst, we don’t expect major purchases on mobile to become mainstream anytime soon, we do expect smaller everyday transactions to continue to increase.
As more businesses rush to become mobile first, almost all major e-commerce sites are now optimised for mobile and tablet purchases. And, the savviest of e-commerce companies now have apps.
Companies like Uber have made linking a credit card to a mobile service the norm. Consumers don’t think twice about ordering an Uber and automatically paying via mobile. Ordering food to be picked up or delivered has never been easier with apps like Hey You, Menulog, and Foodora promoting local restaurants and cafes.
Mobile video and digital radio consumption are also on the rise in Australia, meaning more Australians are likely to purchase content or subscriptions to services like Apple Music, Spotify, and Netflix for downtime like commuting on the train or sitting in a waiting room.
Q: Which of the below have you purchased online using your mobile phone or tablet in the last month?
16
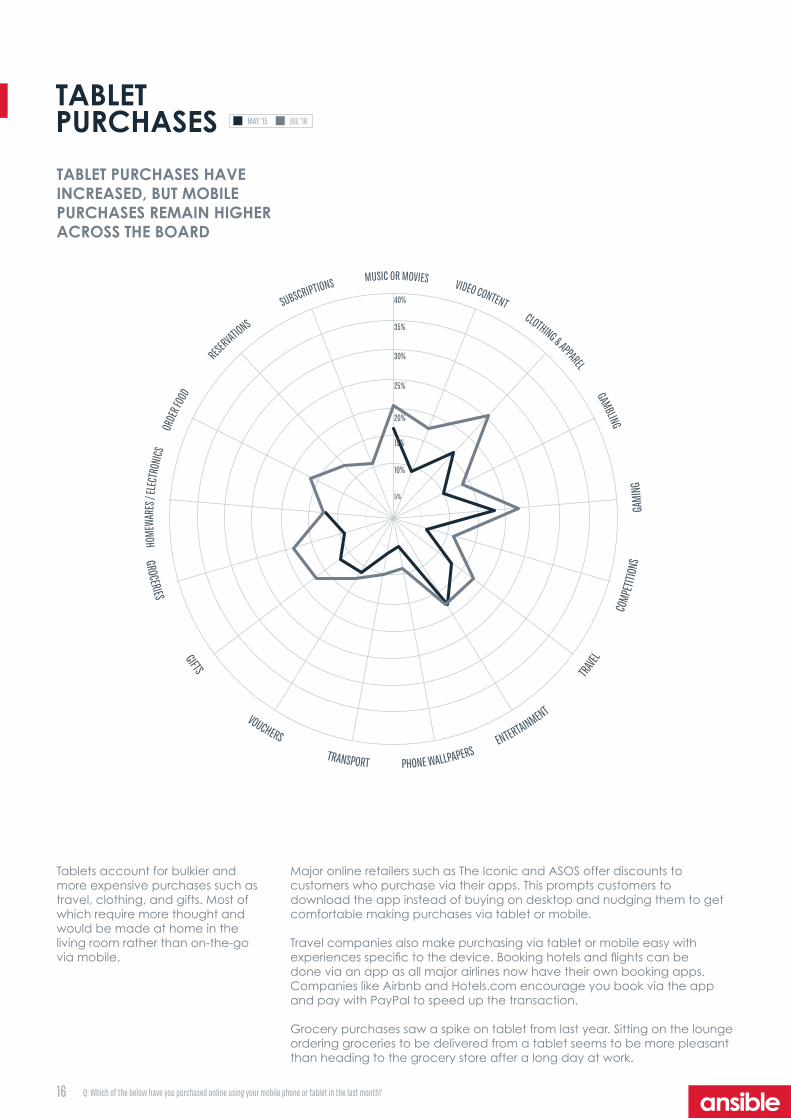
Tablets account for bulkier and more expensive purchases such as travel, clothing, and gifts. Most of which require more thought and would be made at home in the living room rather than on-the-go via mobile.
TABLET PURCHASES
TABLET PURCHASES HAVE INCREASED, BUT MOBILE PURCHASES REMAIN HIGHER ACROSS THE BOARD
MAY ‘15 JUL ‘16
HOME
WARE
S / EL
ECTR
ONICS
ORDE
R FOO
D
RESERVATIONS
SUBSCRIPTIONS MUSIC OR MOVIES VIDEO CONTENT CLOTHING & APPAREL GAMBLING
GROCERIES GIFTS VOUCHERS TRANSPORT PHONE WALLPAPERS ENTERTAINMENT
TRAVE
L
C
OMPE
TITION
S
GAM
ING
5%
40%
35%
30%
25%
20%
15%
10%
Major online retailers such as The Iconic and ASOS offer discounts to customers who purchase via their apps. This prompts customers to download the app instead of buying on desktop and nudging them to get comfortable making purchases via tablet or mobile.
Travel companies also make purchasing via tablet or mobile easy with experiences specific to the device. Booking hotels and flights can be done via an app as all major airlines now have their own booking apps. Companies like Airbnb and Hotels.com encourage you book via the app and pay with PayPal to speed up the transaction.
Grocery purchases saw a spike on tablet from last year. Sitting on the lounge ordering groceries to be delivered from a tablet seems to be more pleasant than heading to the grocery store after a long day at work.
Q: Which of the below have you purchased online using your mobile phone or tablet in the last month?
17
45%
29%
27%
24%
22%
2%
46%
28% 30
%
22% 24
%
0%
APPLEPAY ANDROID PAY/GOOGLE SAMSUNGPAY BANK PAYTAG BANK DIGITAL WALLET OTHER (PLEASE SPECIFY)
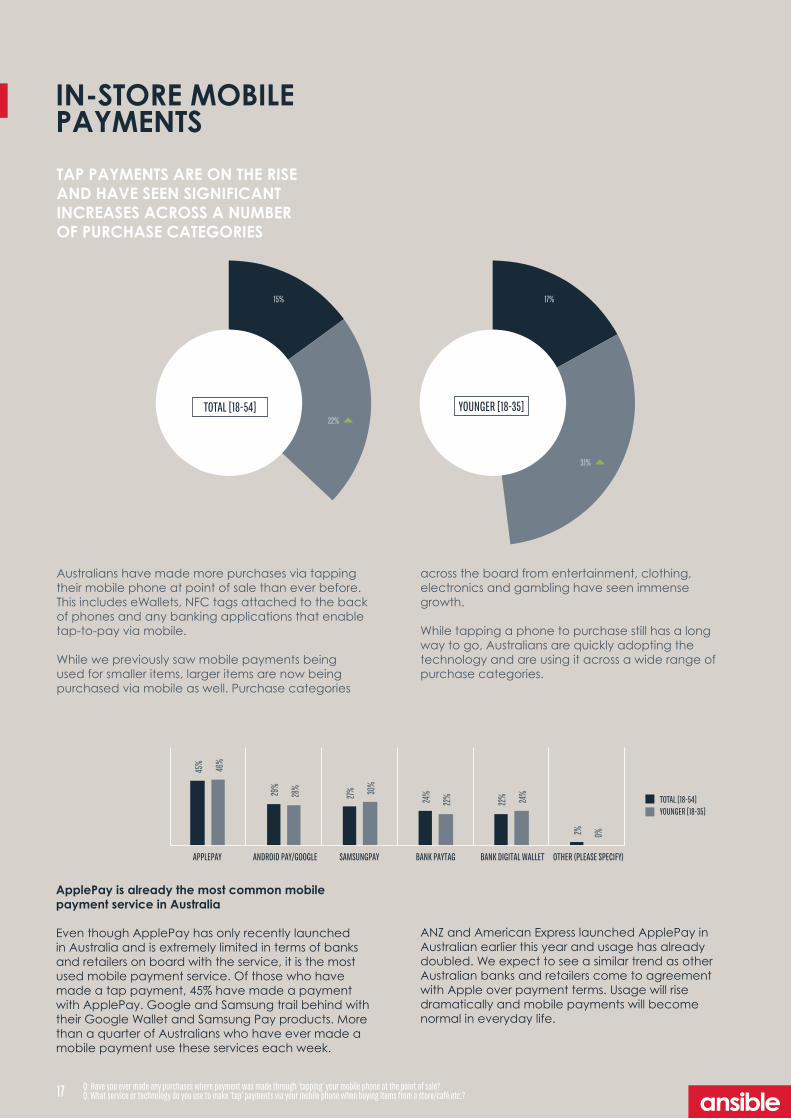
Australians have made more purchases via tapping their mobile phone at point of sale than ever before. This includes eWallets, NFC tags attached to the back of phones and any banking applications that enable tap-to-pay via mobile.
While we previously saw mobile payments being used for smaller items, larger items are now being purchased via mobile as well. Purchase categories
IN-STORE MOBILE PAYMENTS
TAP PAYMENTS ARE ON THE RISE AND HAVE SEEN SIGNIFICANT INCREASES ACROSS A NUMBER OF PURCHASE CATEGORIES
17+31+zYOUNGER [18-35]15+22+zTOTAL [18-54]
across the board from entertainment, clothing, electronics and gambling have seen immense growth.
While tapping a phone to purchase still has a long way to go, Australians are quickly adopting the technology and are using it across a wide range of purchase categories.
ApplePay is already the most common mobile payment service in Australia
Even though ApplePay has only recently launched in Australia and is extremely limited in terms of banks and retailers on board with the service, it is the most used mobile payment service. Of those who have made a tap payment, 45% have made a payment with ApplePay. Google and Samsung trail behind with their Google Wallet and Samsung Pay products. More than a quarter of Australians who have ever made a mobile payment use these services each week.
ANZ and American Express launched ApplePay in Australian earlier this year and usage has already doubled. We expect to see a similar trend as other Australian banks and retailers come to agreement with Apple over payment terms. Usage will rise dramatically and mobile payments will become normal in everyday life.
15% 17%
22%
31%
17
TOTAL [18-54]YOUNGER [18-35]
Q: Have you ever made any purchases where payment was made through ‘tapping’ your mobile phone at the point of sale?Q: What service or technology do you use to make ‘tap’ payments via your mobile phone when buying items from a store/café etc.?
18
5% 8%
7%
5%
5%
5%
5%
4%
3%
0%
75%
14%
12% 14%
9%
14%
10%
9%
6% 8%
1%
61%
ENTERTAINMENT FOOD AND BEVERAGE GROCERIES MUSIC OR MOVIES CLOTHING AND APPAREL HOMEWARES / ELECTRONICS
TRANSPORT TRAVEL GAMBLING OTHER NONE OF THESE
TYPES OF PURCHASESMADE BY TAPPING MAY ‘15 JUL ‘16
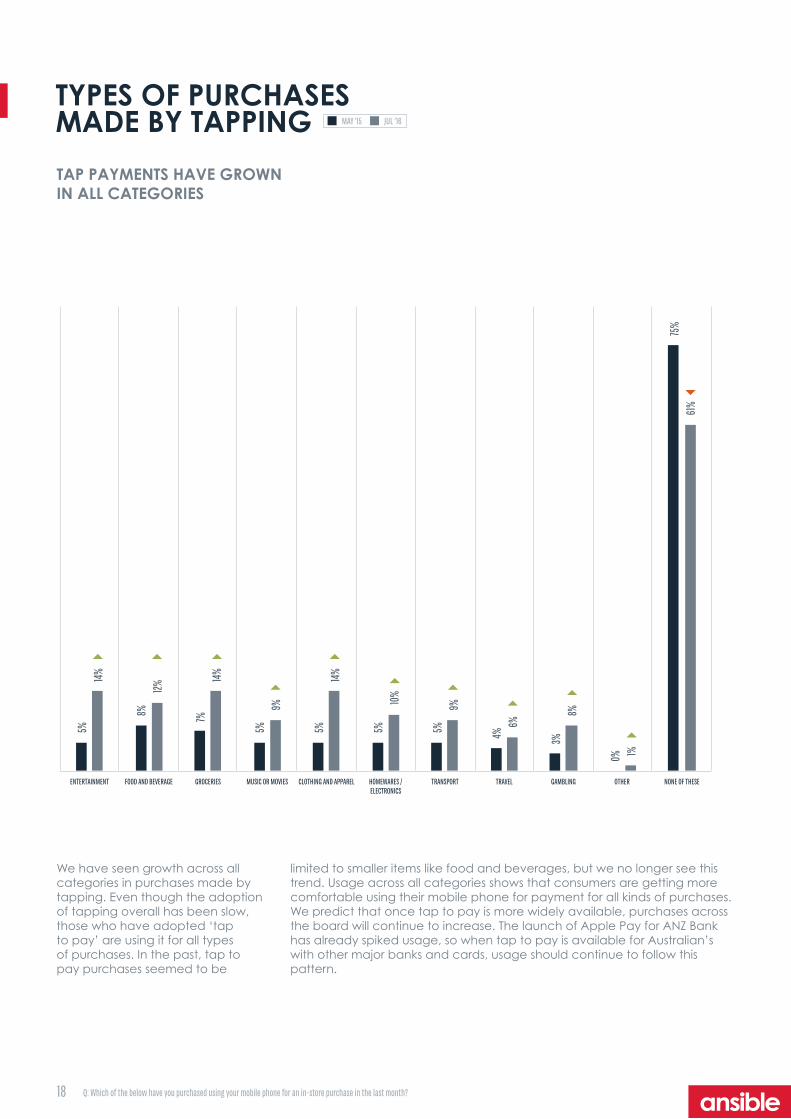
We have seen growth across all categories in purchases made by tapping. Even though the adoption of tapping overall has been slow, those who have adopted ‘tap to pay’ are using it for all types of purchases. In the past, tap to pay purchases seemed to be
limited to smaller items like food and beverages, but we no longer see this trend. Usage across all categories shows that consumers are getting more comfortable using their mobile phone for payment for all kinds of purchases. We predict that once tap to pay is more widely available, purchases across the board will continue to increase. The launch of Apple Pay for ANZ Bank has already spiked usage, so when tap to pay is available for Australian’s with other major banks and cards, usage should continue to follow this pattern.
TAP PAYMENTS HAVE GROWN IN ALL CATEGORIES
Q: Which of the below have you purchased using your mobile phone for an in-store purchase in the last month?
19
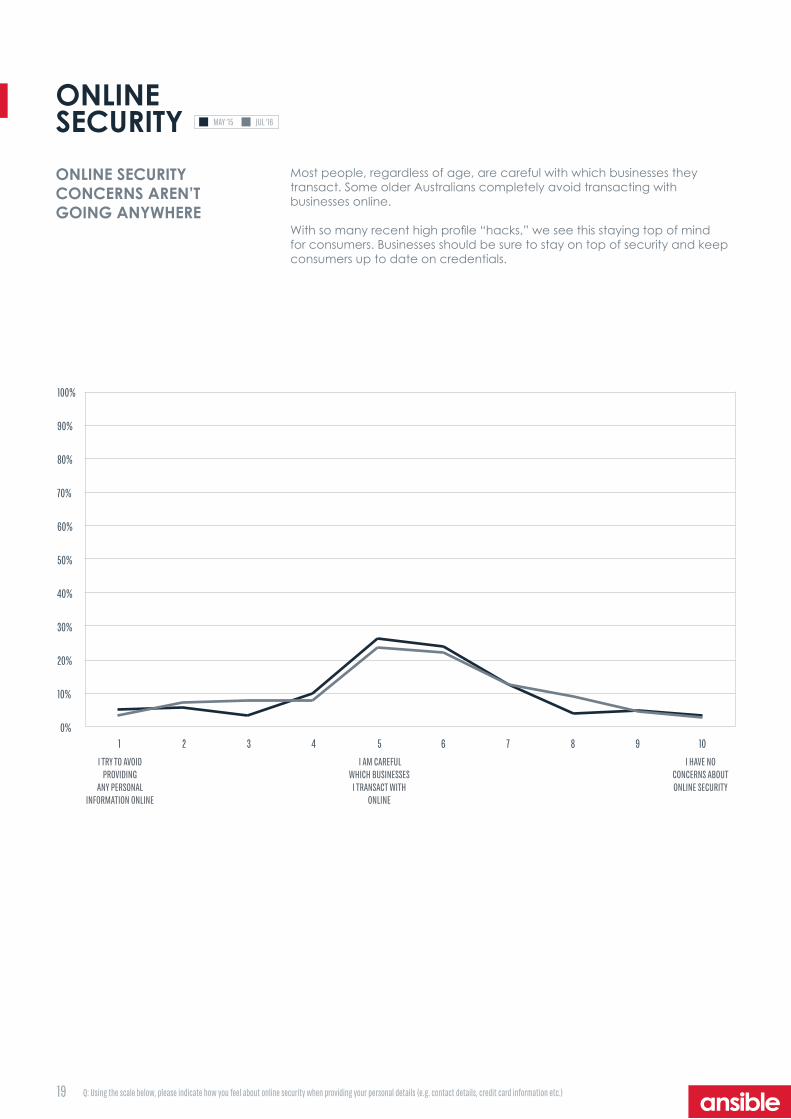
ONLINE SECURITY
0%
10%
20%
30%
40%
50%
60%
70%
80%
90%
100%
1 2 3 4 5 6 7 8 9 10 I TRY TO AVOID
PROVIDING ANY PERSONAL
INFORMATION ONLINE
I AM CAREFUL WHICH BUSINESSES
I TRANSACT WITH ONLINE
I HAVE NO CONCERNS ABOUT ONLINE SECURITY
Most people, regardless of age, are careful with which businesses they transact. Some older Australians completely avoid transacting with businesses online.
With so many recent high profile “hacks,” we see this staying top of mind for consumers. Businesses should be sure to stay on top of security and keep consumers up to date on credentials.
ONLINE SECURITY CONCERNS AREN’T GOING ANYWHERE
MAY ‘15 JUL ‘16
Q: Using the scale below, please indicate how you feel about online security when providing your personal details (e.g. contact details, credit card information etc.)
20
42+21+7+11+6+10+3+t40+18+8+15+9+8+2+t
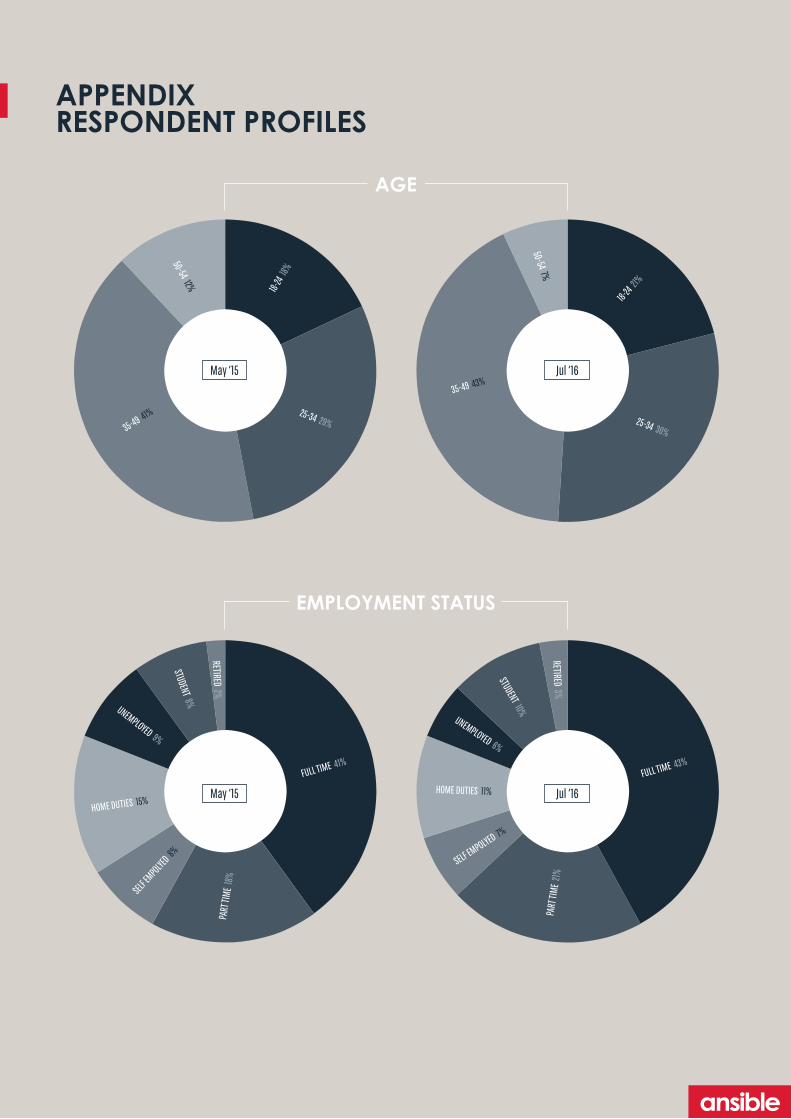
APPENDIX RESPONDENT PROFILES
FULL TIME 41%
PART
TIME
18%
SELF EMPOLYE
D 8%
HOME DUTIES 15%
UNEMPLOYED 9%
STUDENT 8%
RETIRED 2%
FULL TIME 43%
PART
TIME
21%
SELF EMPOLYED 7%
HOME DUTIES 11%
UNEMPLOYED 6%
STUDENT 10%
RETIRED 3%
May ‘15 Jul ‘16
18+29+41+12+t21+30+42+7+tMay ‘15 Jul ‘16
18-24
18%
25-34 29%35-49 41%
50-54 12%
18-24 21
%
25-34 30%
35-49 43%
50-54 7%
AGE
EMPLOYMENT STATUS

21
APPENDIX RESPONDENT PROFILES CONT...
0%
5%
10%
15%
20%
25%
30%
COMMUNICATIONS INSURANCE TRANSPORTATION BANKING/FINANCE MANUFACTURING HOSPITALITY GOVERNMENT EDUCATION TECHNOLOGY HEALTHCARE RETAIL OTHER
0%
5%
10%
15%
20%
25%
30%
SYDNEY REST OF NSW MELBOURNE REST OF VIC BRISBANE REST OF QLD ADELAIDE REST OF SA PERTH REST OF WA REST OF AUS
INDUSTRY
REGION
HOW WAS THE SURVEY CONDUCTED? The methodology of this research consisted of a 15-minute online survey amongst people aged 18-54 within Australia. The sample size is nationally representative, n=400. Fieldwork ran for a duration of one week in July 2016.
RESEARCH METHODOLOGY
0%
5%
10%
15%
20%
25%
30%
COMMUNICATIONS INSURANCE TRANSPORTATION BANKING/FINANCE MANUFACTURING HOSPITALITY GOVERNMENT EDUCATION TECHNOLOGY HEALTHCARE RETAIL OTHER
0%
5%
10%
15%
20%
25%
30%
SYDNEY REST OF NSW MELBOURNE REST OF VIC BRISBANE REST OF QLD ADELAIDE REST OF SA PERTH REST OF WA REST OF AUS