Embed Size (px)
Citation preview

Table of Contents LIST OF FIGURES .............................................................................................................................. 3
LIST OF TABLES ................................................................................................................................ 3
EXECUTIVE SUMMARY ..................................................................................................................... 4
INTRODUCTION ............................................................................................................................... 5
I. CHARACTERISTICS OF THE STEEL INDUSTRY IN CHINA............................................................ 8
Fragmentation ......................................................................................................................... 9
Supply and Demand .............................................................................................................. 13
Cost Structure ........................................................................................................................ 16
Exports ................................................................................................................................... 18
II. MEASURING ENERGY SUBSIDIES IN CHINA ........................................................................... 19
Data ....................................................................................................................................... 20
Definition and Measurement of Variables ............................................................................ 24
III. ENERGY SUBSIDIES TO THE CHINESE STEEL INDUSTRY ......................................................... 26
Subsidies to Coal .................................................................................................................... 29
Subsidies to Electricity ........................................................................................................... 31
Subsidies to Natural Gas ........................................................................................................ 38
IV. CONCLUSIONS ....................................................................................................................... 41
©Usha C. V. Haley 2
LIST OF FIGURES
Figure 1. Production of Crude and Finished Steel in China ............................................................ 5 Figure 2. Growth of China’s Energy Subsidies, Crude Steel Production ......................................... 6 Figure 3. Firm Share of Chinese Steel Production in 2004 and 2006 ........................................... 11 Figure 4. Chinese Steel Production by Province in 2005 (millions of tons) .................................. 12 Figure 5. Supply and Demand of Chinese Steel 2000 ‐ 2010 ........................................................ 16 Figure 6. Breakdowns of Steel Production Costs in China and India ............................................ 18 Figure 7. Energy Subsidies to Chinese Steel 2000 ‐ 2007 ............................................................. 28 Figure 8. Subsidies to Thermal Coal in Chinese Steel Production 2000 ‐ 2007 ............................ 30 Figure 9. Subsidies to Coking Coal in Chinese Steel Production 2000 ‐ 2007 ............................... 31 Figure 10. Subsidies to Electricity in Chinese Steel Production 2000 ‐ 2007 ................................ 37 Figure 11. Provincial Subsidies to Electricity in Chinese Steel Production 2000 ‐ 2007 ............... 37 Figure 12. Natural Gas Supply Chain and Pricing Mechanisms in China ...................................... 39 Figure 13. Subsidies to Natural Gas in Chinese Steel Production 2000 ‐ 2007 ............................ 40
LIST OF TABLES
Table 1. Some Subsidies to Electricity in China ............................................................................ 36 Table 2. Relationships Between Chinese Energy Subsidies, Chinese Steel Exports Worldwide and US Imports of Chinese Steel .......................................................................................................... 41
©Usha C. V. Haley 3

EXECUTIVE SUMMARY
• In 2007, China is the largest producer and consumer of steel in the world, with 40 percent of the global market. Much has changed for China’s steel industry in the last 5 years. In 2005, China went from a net steel importer to a steel exporter. In 2006, China became the largest steel exporter in the world by volume, up from fifth largest in 2005. Iron and steel accounted for 28 percent of total industrial consumption in China.
• Energy subsidies fell in 2002 and 2003, after China joined the WTO. However, the subsidies surged in 2004 and continued to grow exponentially till today, along with China’s rise as the largest producer and exporter of steel in the world, and with steel’s designation as a strategic industry for China. From 2000 to 2006, total energy subsidies to steel grew by 1365 percent. In 2007, energy subsidies to Chinese steel are estimated at approximately $15.7 billion, showing a 3800 percent increase since 2000; similarly, in 2007, Chinese production of steel and Chinese global steel exports (including to the USA) are estimated to grow by 289 percent and 1276 percent from 2000.
• The central government‘s policies of consolidating the steel industry have failed. The Chinese steel industry is becoming more fragmented, while the rest of the world is concentrating production. Every Chinese province and region wants its own steel mill, and local governments provide lavish benefits to their steel industries. The forecasted growth of Chinese steel supply in 2007 is 19.3 percent, compared to 25 percent and 26.4 percent in 2005 and 2006, respectively.
• Total energy subsidies to Chinese steel from 2000 to mid‐year 2007 reached $27.11 billion. Energy subsidies to Chinese steel since 2002 (following China’s WTO entry) through mid‐year 2007, approximated $25.07 billion. Energy subsidies included subsidies to thermal and coking coal, electricity and natural gas.
• Thermal‐coal subsidies to Chinese steel from 2000 to mid‐year 2007 reached $11.16 billion. From 2002 (following China’s WTO entry) through mid‐year 2007, the subsidies approximated $10.21 billion.
• Coking‐coal subsidies to Chinese steel from 2000 to mid‐year 2007 reached $15.29 billion. From 2002 (following China’s WTO entry) through mid‐year 2007, the subsidies approximated $13.88 billion.
• Electricity subsidies to Chinese steel from 2000 to mid‐year 2007 reached $916.39 million. From 2002 (following China’s WTO entry) through mid‐year 2007, the subsidies approximated $912.97 million.
• Natural‐gas subsidies to Chinese steel industry from 2000 to mid‐year 2007 reached $54.12 million. From 2002 (following China’s WTO entry) through mid‐year 2007, the subsidies approximated $66.75 million.
• Statistical analysis shows that energy subsidies have a very strong correlation with Chinese steel exports and US steel imports from China. Indeed, one can almost perfectly predict China’s steel exports from its energy subsidies.
©Usha C. V. Haley 4

INTRODUCTION
In 2007, China is the largest producer as well as consumer of steel in the world,
representing 40 percent of the global market. Much has changed for China’s steel industry in
the last 5 years. In 2003, China imported 43.2 million tons of semi‐finished and finished steel
products, or about 13 percent of the global steel trade flow. In late 2005, China went from a net
steel importer to a steel exporter. In 2006, China became the largest steel exporter in the world
by volume, up from fifth largest in 2005. In 2006, China claimed 34 percent of the global steel
production of 1.24 billion tons, displaying a six year Compounded Annual Growth Rate (CAGR) of
23 percent and enormous ramping up of domestic supply1. In the first 9 months of 2007, China
produced 308 million tons of crude steel and 337 million tons of finished steel. Figure 1 shows
the growth in Chinese production of crude and finished steel.
Figure 1. Production of Crude and Finished Steel in China
0
100
200
300
400
500
2000 2001 2002 2003 2004 2005 2006 2007 (Jan‐Sep)
Millions of T
ons
Year
Crude Steel Finished Steel
Source: CEIC, Mysteel
The Chinese steel industry as it exists today stems from government intervention,
oversight and subsidies. Previous reports have documented the off‐the‐book and on‐the book
1 US Department of Commerce, ISI Analytics
©Usha C. V. Haley 5

subsidies that permeate Chinese industry, including steel2. This report concentrates on energy
subsidies to the Chinese steel industry from 2000 to 2007. Drawing on published research and
public data sources, many from the Chinese government, the research shows that energy
subsidies fell in 2002 and 2003, immediately after China joined the WTO; however, the subsidies
surged in 2004 and have continued to grow exponentially since then, corresponding to China’s
rise as the largest producer and exporter of steel in the world.
Figure 2. Growth of China’s Energy Subsidies, Crude Steel Production and Steel Exports from Base Year 2000
‐500%
0%
500%
1000%
1500%
2000%
2500%
3000%
3500%
4000%
4500%
2000 2001 2002 2003 2004 2005 2006 2007E
Ann
ual Percentage Growth from
200
0
Year
Subsidies Global Exports Production Exports to US
Sources: Mysteel, Iron and Steel Statistics Bureau, Citigroup Global Markets, Business Standard, United States International Trade Commission, author’s estimates
2 See U. C. V. Haley (2006) Testimony on “Chinese Economic Planning and the Role of Subsidies,” Hearing on China’s WTO Compliance and Industrial Subsidies, the US‐China Economic and Security Review Commission, Washington, DC, April 4. Available at http://www.uscc.gov/hearings/2006hearings/written_testimonies/06_04_04wrts/06_04_04_haley.php; and, Wiley Rein LLP (2007) “Money for Metal: A Detailed Examination of Chinese Government Subsidies to its Steel Industry”, July.
©Usha C. V. Haley 6
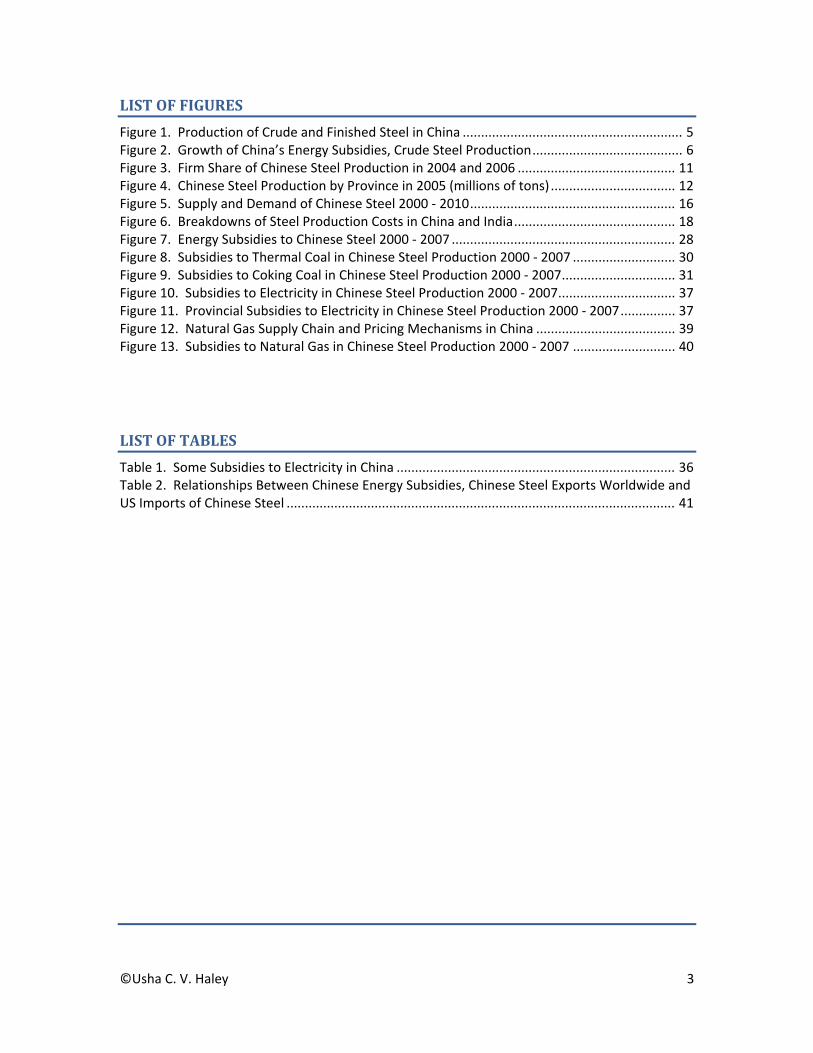
Figure 2 traces how energy subsidies to Chinese steel have continued to rise along with
the industry’s growth and exports. By 2006, total energy subsidies to steel had grown by 1365
percent over 2000. Energy subsidies to steel exceeded $7.8 billion in the first half of 2007,
growing 25 percent since 2006. In 2007, energy subsidies to Chinese steel are estimated at
approximately $15.7 billion, showing a 3800 percent increase since 2000; similarly, in 2007,
Chinese production of steel and Chinese global steel exports (including to the USA) are
estimated to grow by 289 percent and 1276 percent from 20003. In 2007, Chinese steel exports
to the USA alone are estimated to grow by 751 percent from 20004. Growth of Chinese steel
exports to the USA may have decelerated relative to the rest of the world because of the
declining value of the dollar in 20075.
The Chinese government has not acknowledged the presence of energy or any other
subsidies to its domestic steel producers in its declaration to the World Trade Organization
(WTO). The WTO requires annual notification from members on subsidies they maintain and
encourages additional, needed information on subsidies. On April 13, 2006, China, a WTO
member since 2001, submitted an overdue subsidies notification to the WTO in which it
identified 78 subsidy programs from 2001 to 2004, but none to the steel industry. The WTO
specifies that members should provide sufficient information “to enable other members to
evaluate the trade effects and to understand the operation of notified subsidy programs.”
China’s report stated that several central government ministries and agencies distributed and
3 Growth in China’s global steel exports is derived from data from the Iron and Steel Statistics Bureau, Mysteel, and A. Mathur (2007), “Chinese Steel Exports Boom Despite Curbs”, Business Standard, November 24; growth in China’s steel production is derived from data from Citigroup Global Markets (2005), “Metals‐Steel”, August 30, and Mysteel. 4 Growth in China’s exports to the USA is derived from United States International Trade Commission data. 5 See remarks of Cheng Siwei, Vice Chairman of National People’s Congress, and Xu Jian, Director of Central Bank, quoted in A. Lovasz and S. White (2007), “Dollar Hits Low against the Euro”, Bloomberg News, November 7; and analysis by Credit Suisse (2007) “US Steel Sector. May US Steel Imports – China Imports Rise”, June 26.
©Usha C. V. Haley 7
monitored subsidies, and extensive legislation in China supported the subsidies. Yet,
surprisingly, no statistical data existed in China to assess the trade effects of any subsidy or even
the total annual amounts budgeted to these subsidies. Foreign‐Invested Enterprises
(FIEs)/Foreign Equity Joint Ventures and Agriculture/Animal Husbandry appeared as the primary
beneficiaries in China’s notification. China’s subsidy notification to the WTO ignored subsidies
to the steel industry by:
• Concentrating on subsidies to FIEs to invest in key strategic Chinese sectors and ignoring
most subsidies that reduce local steel producers' operating and production costs vis‐à‐
vis foreign producers6;
• Concentrating on subsidy programs supported by the central government and ignoring
all programs offered by provincial and municipal governments which greatly benefit
domestic steel producers in China; and,
• Ignoring the subsidy effects of maintaining a cheap currency, as well as subsidies in
several sectors including commercial banks’ lending policies or other financial
preferences that infuse the steel industry7.
I. CHARACTERISTICS OF THE STEEL INDUSTRY IN CHINA
In July 2005, the National Development and Reform Commission (NDRC) released the
China Iron and Steel Industry Development Policy highlighting steel as a strategic and pillar
6 On November 29, 2007, China agreed to terminate a dozen subsidies and tax rebates. At the time of writing this report, details of this agreement are still pending. However, the agreement mostly affects exports by Chinese companies that have foreign investors or are joint ventures with foreign companies, not the steel industry. See S. R. Wesiman (2007), “China Agrees to Remove Certain Subsidies”, New York Times, November 30. 7 For a more complete discussion of China’s subsidy notification to the WTO, see U. C. V. Haley (2007) Testimony in “Support for the Non‐Market Economy Trade Remedy Act,” Committee on Ways and Means, Subcommittee on Trade, 110th Congress, Washington, DC, March 15. Available at http://waysandmeans.house.gov/hearings.asp?formmode=view&id=5688
©Usha C. V. Haley 8

industry. The policy announced the central government’s aim of consolidating and modernizing
the industry, with the specific goal of “strategic reorganization”. The policy also announced the
creation by 2010 of two 30‐million‐ton annual capacity producers and several “internationally
competitive” companies at the 10‐million‐ton level.
In October 2005, in a joint statement to the WTO Transitional Review Mechanism on
China’s accession, the United States, Canada and Mexico noted that two articles on the state’s
role in implementing policy could violate WTO anti‐subsidy rules. Specifically, article 16 of the
Chinese policy provided for various types of state support in developing and modernizing the
industry. Also, article 18 “encouraged” the Chinese steel industry to use domestically produced
equipment, and to import equipment only if domestically made equipment was insufficiently
advanced, unavailable or in short supply8.
The central government has also repeatedly announced its intention to control and to
direct the steel industry. For example, in its Steel Policy of 2005, China banned foreign
acquisition of large steel mills. The Eleventh Five‐year plan for National Economic and Social
Development of the People’s Republic of China also reiterated the principle of using central
control to eliminate the obsolete, to restructure, to upgrade industrial product and to lower
consumption of raw materials9. Yet, in 2007, the Chinese steel industry is characterized by
overcapacity and fragmentation and is the arena of political struggles between the central and
the provincial governments.
Fragmentation Beijing has learned that fewer producers can lead to stronger pricing power in the global
markets, and its policies’ objectives seem aimed in that direction. The Steel Policy of 2005
8 S. Cooney (2006), “Steel: Price and Policy Issues”, CRS Report to Congress, August 31. 9 Outline of the Eleventh Five‐Year Plan for National Economic and Social Development, available at http://en.ndrc.gov.cn/hot/W020060531535878205383.jpg
©Usha C. V. Haley 9
emphasized the government’s proclaimed determination to avoid inefficient use of resources,
including capital, energy, and raw materials (such as iron ore and coking coal), and to protect
both intangible (such as environmental) and tangible assets. Raising the equity requirements for
steel plants also highlighted the central government’s efforts to curb excess capacity. These
attempts at consolidation synchronize with Beijing’s policy of building 150 State Owned
Enterprises (SOEs) as global champions10, 11.
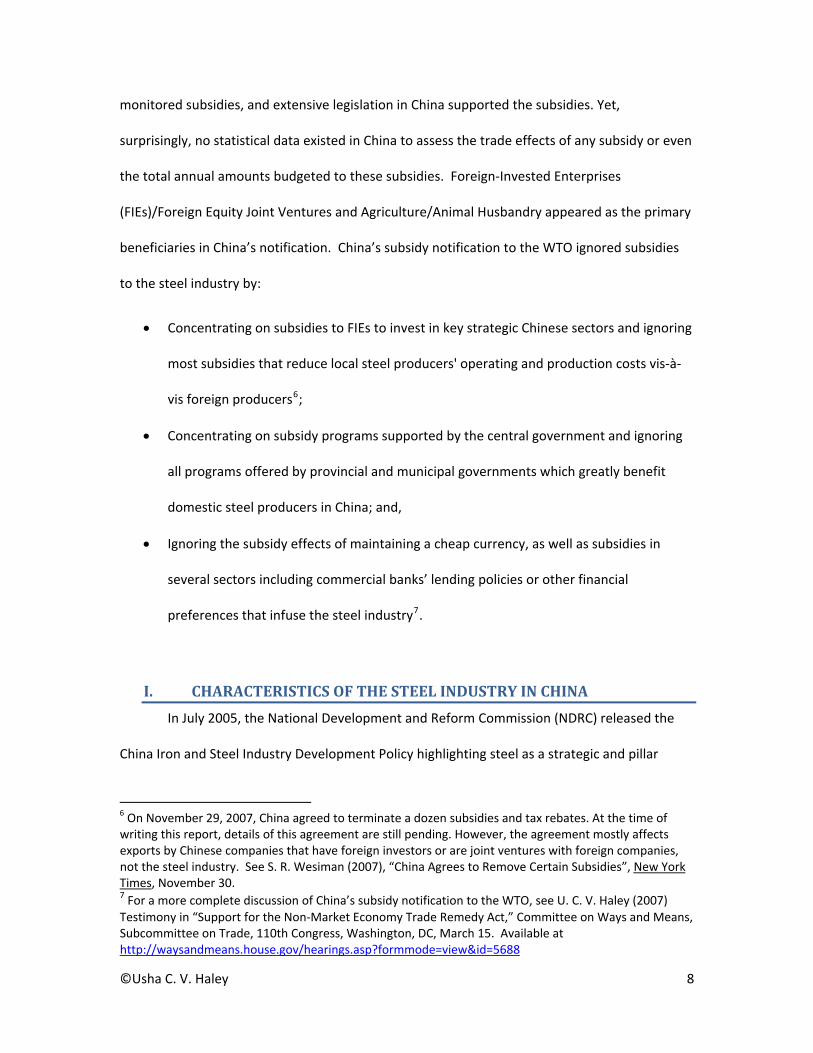
The central government ‘s policies of consolidating the steel industry have failed. As
Figure 3 shows, the top 15 producers controlled 48 percent of domestic production in 2004, but
their aggregate share dropped to 43 percent in 2006. These data indicate that the central
government can strongly influence the major producers’ expansion, yet production is shifting
out of Beijing’s radar and weakening the major producers’ market power. The Chinese steel
industry is becoming more fragmented, while the rest of the world is moving towards more
concentrated production.
The major Chinese steel producers’ production rankings bring the industry’s
fragmentation into sharper focus. Although China has the world’s largest steel industry, in 2004
only one Chinese producer, Shanghai Baosteel, ranked among the world’s ten largest producers.
Only two Chinese producers, Shanghai Baosteel and Anshan (now Anben), produced more than
10 million tons in that year, while eight reached that level in 2005. In 2005, 25 Chinese
producers ranked in the top 80 in the world. Yet, these producers accounted for less than 40
percent of total Chinese production12.
10 See G.T. Haley (2007) Testimony on “State‐Owned Enterprises: Vehicles of Industrial Policy Implementation”, Hearing on the Extent of the Government's Control of China's Economy, and Implications for the United States, the US‐China Economic and Security Review Commission, Washington, DC, May 24‐25. Available at http://www.uscc.gov/hearings/2007hearings/hr07_05_24_25.php 11 Beijing has chosen Baosteel, Beijing Shougang, Tangshan Iron and Steel, Anben Steel and Wugang as a focus for industry consolidation activities, with limited success. 12 ISI Analytics
©Usha C. V. Haley 10
Figure 3. Firm Share of Chinese Steel Production in 2004 and 2006
0%
10%
20%
30%
40%
50%
60%
70%
80%
90%
100%
2004 2006
Others
Anyang
Panzhihua
Bengang
Baotou
Handan
Valin
Maanshan
Laigang
Jinan
Shougang
Shagang
Angang
Wugang
Tang Steel
Baosteel
Source: BNP Paribas
The structure of the Chinese steel industry also reflects the Chinese central and
provincial governments’ ongoing roles. The Chinese steel industry continues as primarily state‐
owned. Although minority positions in some of the larger producers are privately owned, the
Chinese governments hold majority interests in every major Chinese steel producer. Every
©Usha C. V. Haley 11
provin
provid
nce and every
ding lavish be
y region seem
enefits to buil
mingly wants
ld or to keep
its own steel
their steel ind
mill, and loca
dustries13.
al governmennts are
produ
China
five m
provin
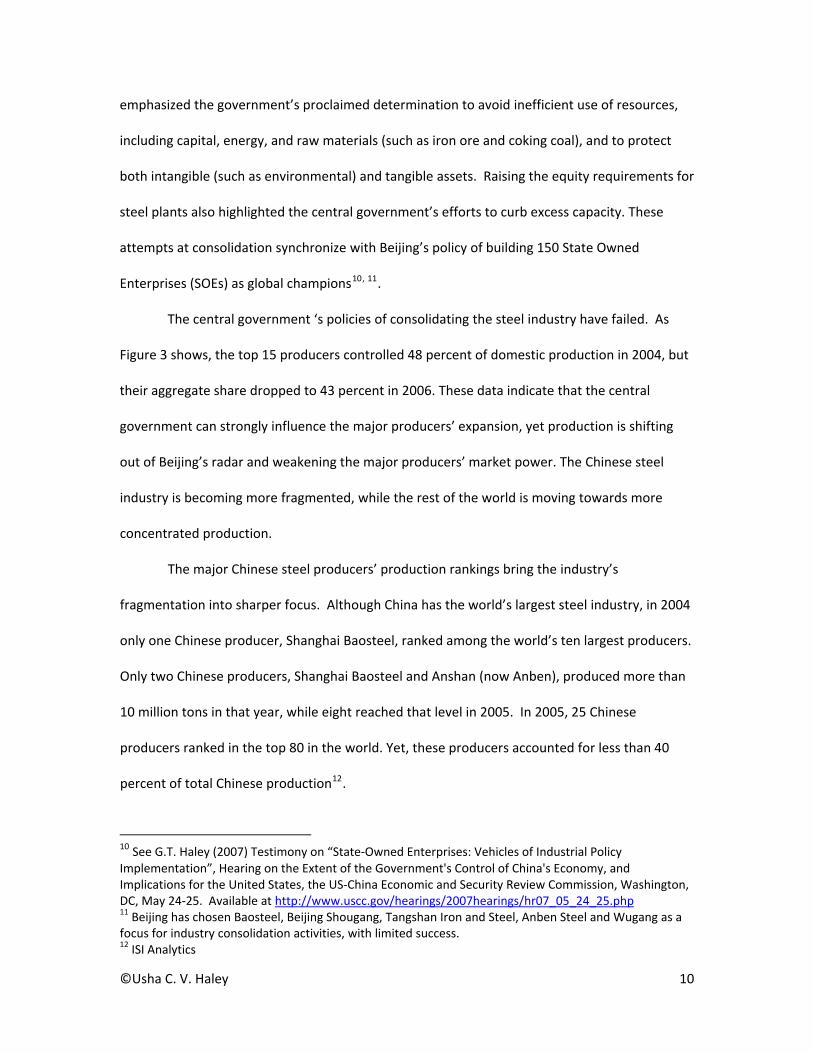
Consequen
uction is conc
a’s annual pro
million metric
nce, in 200514
ntly, the Chin
centrated in t
oduction. Mo
tons per yea
4.
nese steel ind
he Northeast
oreover, sever
r. Figure 4 sh
ustry is also f
t, no province
ral provinces
hows annual p
fragmented g
e accounts for
have annual
production of
eographically
r more than 1
production o
f finished ste
y. While stee
18 percent of
of less than
el in China, b
el
y
Figurre 4. Chinesse Steel Prodduction by PProvince in 22005 (millionns of tons)
By Se
13 DireChinesDSTI/S14 Chin
ha C. V. Haley
Source: Ch
In 2005, H
ptember 200
ectorate for Scise Steel IndustSU/SC(2006)9. na Steel Indust
y
hina Steel Ind
ebei province
06, Hebei earn
ience Technolotry”, OECD, Join
try Association
Hebei
Tianjin
Sichuan
Nei Mongg
Jilin
Heilongjian
ustry Associa
e ranked high
ned $2.04 bill
ogy and Industnt India/OECD/
, CEIC
Jiangsu
Hubei
Anhui
gul Fujian
Gansu
ng Guizhou
ation, CEIC
hest among C
ion for the ex
try Steel Comm/IISI Workshop
Liaonin
Guangd
Jiangxi
Zhejian
Shaanx
Qingha
hina’s provin
xport of iron
mittee (2006), “p, New Delhi, I
g Shand
dong Shanx
Beijin
g Guanx
i Xinjia
i Haina
ces for steel p
and steel pro
“Current Situatndia, May 16‐1
dong Shan
xi Hen
g Hun
xi Yun
ng Cho
an Ning
nghai
an
nan
nan
ngqing
gxia
production.
oducts, up by
tion of the 17,
©Ush
112
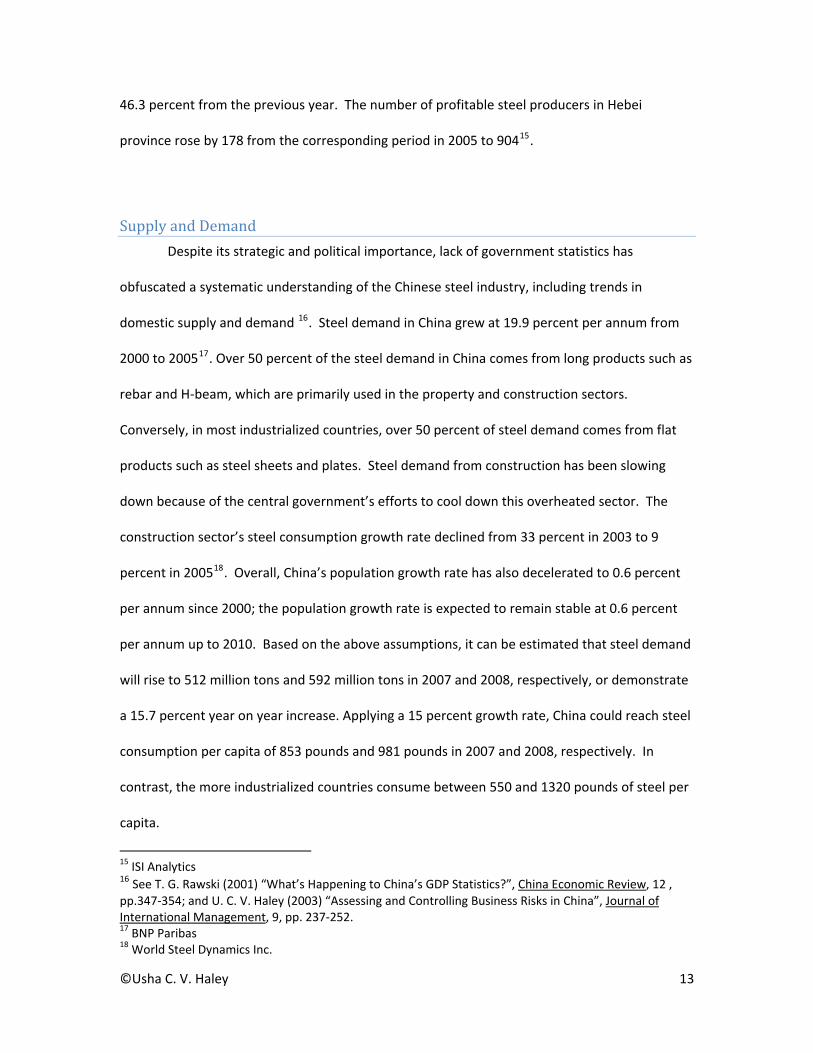
46.3 percent from the previous year. The number of profitable steel producers in Hebei
province rose by 178 from the corresponding period in 2005 to 90415.
Supply and Demand Despite its strategic and political importance, lack of government statistics has
obfuscated a systematic understanding of the Chinese steel industry, including trends in
domestic supply and demand 16. Steel demand in China grew at 19.9 percent per annum from
2000 to 200517. Over 50 percent of the steel demand in China comes from long products such as
rebar and H‐beam, which are primarily used in the property and construction sectors.
Conversely, in most industrialized countries, over 50 percent of steel demand comes from flat
products such as steel sheets and plates. Steel demand from construction has been slowing
down because of the central government’s efforts to cool down this overheated sector. The
construction sector’s steel consumption growth rate declined from 33 percent in 2003 to 9
percent in 200518. Overall, China’s population growth rate has also decelerated to 0.6 percent
per annum since 2000; the population growth rate is expected to remain stable at 0.6 percent
per annum up to 2010. Based on the above assumptions, it can be estimated that steel demand
will rise to 512 million tons and 592 million tons in 2007 and 2008, respectively, or demonstrate
a 15.7 percent year on year increase. Applying a 15 percent growth rate, China could reach steel
consumption per capita of 853 pounds and 981 pounds in 2007 and 2008, respectively. In
contrast, the more industrialized countries consume between 550 and 1320 pounds of steel per
capita.
15 ISI Analytics 16 See T. G. Rawski (2001) “What’s Happening to China’s GDP Statistics?”, China Economic Review, 12 , pp.347‐354; and U. C. V. Haley (2003) “Assessing and Controlling Business Risks in China”, Journal of International Management, 9, pp. 237‐252. 17 BNP Paribas 18 World Steel Dynamics Inc.
©Usha C. V. Haley 13
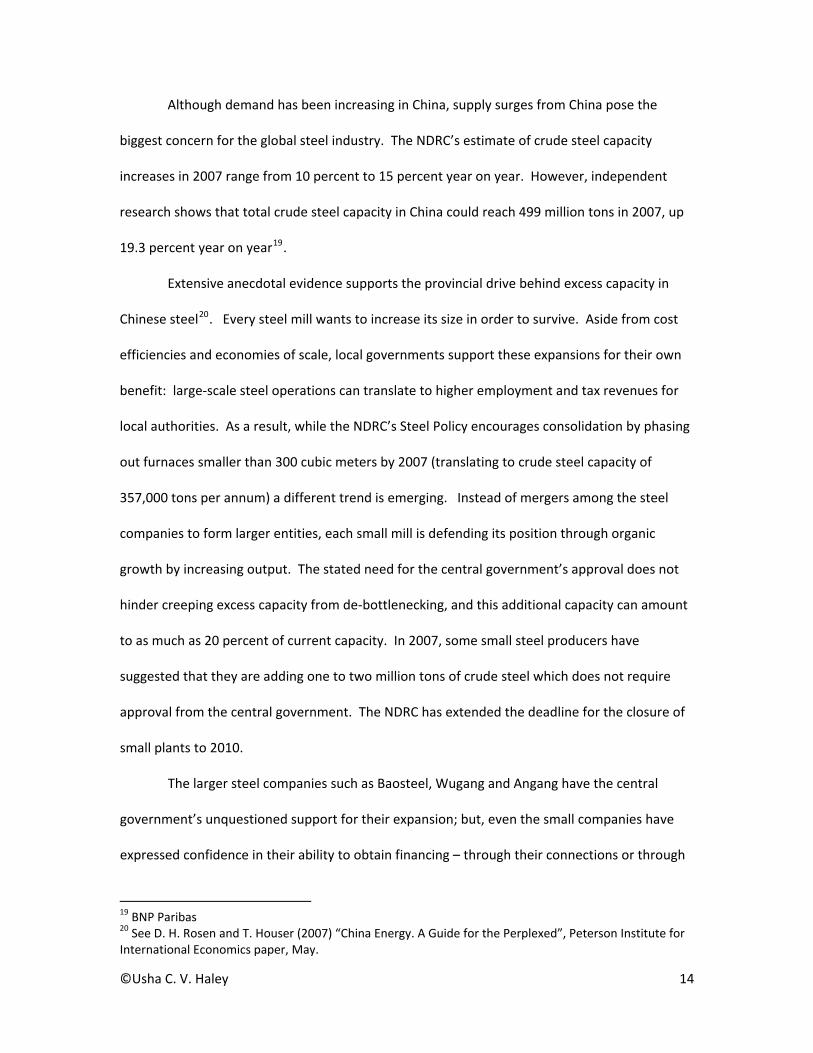
Although demand has been increasing in China, supply surges from China pose the
biggest concern for the global steel industry. The NDRC’s estimate of crude steel capacity
increases in 2007 range from 10 percent to 15 percent year on year. However, independent
research shows that total crude steel capacity in China could reach 499 million tons in 2007, up
19.3 percent year on year19.
Extensive anecdotal evidence supports the provincial drive behind excess capacity in
Chinese steel20. Every steel mill wants to increase its size in order to survive. Aside from cost
efficiencies and economies of scale, local governments support these expansions for their own
benefit: large‐scale steel operations can translate to higher employment and tax revenues for
local authorities. As a result, while the NDRC’s Steel Policy encourages consolidation by phasing
out furnaces smaller than 300 cubic meters by 2007 (translating to crude steel capacity of
357,000 tons per annum) a different trend is emerging. Instead of mergers among the steel
companies to form larger entities, each small mill is defending its position through organic
growth by increasing output. The stated need for the central government’s approval does not
hinder creeping excess capacity from de‐bottlenecking, and this additional capacity can amount
to as much as 20 percent of current capacity. In 2007, some small steel producers have
suggested that they are adding one to two million tons of crude steel which does not require
approval from the central government. The NDRC has extended the deadline for the closure of
small plants to 2010.
The larger steel companies such as Baosteel, Wugang and Angang have the central
government’s unquestioned support for their expansion; but, even the small companies have
expressed confidence in their ability to obtain financing – through their connections or through
19 BNP Paribas 20 See D. H. Rosen and T. Houser (2007) “China Energy. A Guide for the Perplexed”, Peterson Institute for International Economics paper, May.
©Usha C. V. Haley 14

convertible bonds. For example, in December 2006, Panzhihua New Steel and Vanadium Co.
Ltd., a Shenzhen‐listed arm of Panzhihua Iron and Steel Group (Pangang), announced it would
issue convertible bonds to raise RMB 3.2 billion ($406.63 million) to buy assets from Pangang.
Net proceeds from bond placements amounting to RMB 3.107 billion ($394.82 million) were to
be used to acquire Pangang's steel and mining assets, including a cold‐rolling plant with a 1.3
million ton capacity of cold‐rolled plates and galvanized plates a year, and the first phase of
Baima iron ore mine, which was scheduled to start operation in December 2006 and to reach
designed capacity by 200821.
Consequently, rapid growth of steel production has outstripped consumption since the
second quarter of 2004, when the central government announced the tightening of measures to
control construction activities. The large gap between demand and supply, will lead to even
more Chinese steel flooding the world markets. Taking the steel consumption per capita, and
the central government’s policy measures, and cross‐checking these figures with other industrial
data and economic indices, the forecasted growth of Chinese steel supply in 2007 is 19.3
percent, compared to 25.0 percent and 26.4 percent in 2005 and 2006, respectively. Figure 5
sketches supply and demand of Chinese steel from 2000 to 2006 and the projected increase
from 2007 to 2010. China will be producing more steel than its domestic appetite can digest.
21 Interfax‐China Metals Weekly, 2006
©Usha C. V. Haley 15

Figure 5. Supply and Demand of Chinese Steel 2000 ‐ 2010
0
100000
200000
300000
400000
500000
600000
700000
800000
900000
1000000
Thou
sand
s of Ton
s
Year
Chinese Steel Supply Chinese Steel Demand
Source: BNP Paribas, author’s estimates
Cost Structure Eighty‐seven percent of China’s crude‐steel capacity comes from blast furnaces (BOF),
the highest percentage in the world. The process of making steel influences the choice of raw
materials and thereby determines the steel producers’ cost structures. The more the
steelmakers integrate upstream, the more cost efficient their production. BOF steel production
on average has lower costs per ton of crude steel, given its integration with iron ore. The raw
materials for BOF steel production (iron ore, coking coal, and thermal coal) form the principal
components of steel‐manufacturing costs, and represent 50 percent to 70 percent of the cost of
goods sold for Chinese steel producers.
The author’s research shows that Chinese steel producers’ costs are generally 20 to 25
percent lower than those of the American and European producers. Quality differentials
©Usha C. V. Haley 16

contribute to overall differences in costs as China has focused on low‐end steel22. However,
even if we assume the same quality, factors such as the production process and costs of raw
materials and electricity/utilities reduce costs. As the analysis later elaborates, the costs of raw
materials and electricity in Chinese steel factories have been significantly reduced through
subsidies.
Transportation costs associated with raw materials also affect steel producers’ costs,
but they vary widely in China. Low‐cost producers such as Baosteel are located at harbors,
whereas others, such as Wugang, rely on inland transportation to get raw materials from the
port to the mills, adding additional costs. Compared with steel mills located inland, plants
located by harbors can save about RMB20 to 30 per ton on time and costs associated with
inland transportation. Producers with their own fleets also have lower freight costs for
imported raw materials such as coking coal and iron ore than those that depend on external
ships. For instance, the prevailing rate to transport coking coal from Australia to China is US$16
per ton; but, Baosteel pays only US$6 per ton as shipping takes place on its own vessels 23.
Figure 6 below compares production costs for steel in China and India, another large
Asian emerging‐market country. For the Chinese steel maker, raw materials form a greater
proportion of the cost structure than for the Indian; but, labor and fuel each form a smaller
proportion of the costs.
22 RNCOS 23 BNP Paribas
©Usha C. V. Haley 17

Figure 6. Breakdowns of Steel Production Costs in China and India
0%
10%
20%
30%
40%
50%
60%
70%
80%
90%
100%
Baoshan (China) Tata (India)
Maintenance & Others
Labor
Depreciation
Fuel
Raw Materials
Source: BNP Paribas, Yuanta Core Pacific Securities, author’s estimates
Exports Previous research has shown a relationship between China’s exports and subsidies to
SOEs24. Other research has shown that a large portion of the subsidies have come from local
and provincial governments to enhance regional exports25.
The surge in exports outlined in Figure 2 has resulted from fragmentation in the steel
industry, ramped up production, destocking of steel products and a significant slowing of
demand growth26. Lower prices for Chinese steel have also served as drivers for exports . The
cost structure of the Chinese steel industry, and the US and European companies’ strong pricing
power have elevated steel prices in the two markets above steel prices in Asia, particularly in
China. In 2006, Hot Rolled Coil (3.0mm) was priced at $602 per ton and $633 per ton in the USA
24 See S. Girma, Y. Gong, H Gorg and Z Yu (2007) “Can Production Subsidies Foster Export Activity? Evidence from Chinese Firm‐Level Data”, Centre for Economic Policy Research Working Paper Series, No. 6052, January. 25 See R. S. Eckaus (2006) “China’s Exports, Subsidies to State Owned Enterprises and the WTO”, China Economic Review, 17, pp. 1‐13. 26 See Macquarie Research (2007) “Steel sector – China continues to Export Aggressively”, January 12.
©Usha C. V. Haley 18

and Europe, respectively, compared to $505 per ton in Asia and $424 per ton in China (excluding
value‐added tax or VAT). With shipping freight at $60 to $70 per ton, Chinese steel can still sell
at an 18.8 percent discount to domestic products in the USA, the largest steel importer27.
Consequently, US imports of finished steel products from China more than doubled in
2006, increasing from 2.3 million tons in 2005 to 5.35 million tons in 2006. This rate of increase
has continued in 2007. In the first half of 2007, US imports increased 23.8 percent over the
same period in 2006. China’s total finished steel exports surged to 33.8 million tons in the first
half of 2007, up nearly 100 percent compared to the same period in 200628.
To summarize, under true market conditions, China would undoubtedly have had a large
and diverse steel industry, but not one that has grown to account for a staggering 34 percent of
total world steel production in three years. The Chinese steel industry in its current form is the
creation of the Chinese government. It has benefited from massive direct and indirect subsidies,
many of which violate the WTO’s Subsidies Agreement, China’s obligations under its WTO
accession agreement, or both. As described earlier, the Chinese government has also adopted
an official policy that requires it to continue to provide the steel industry with massive subsidies.
II. MEASURING ENERGY SUBSIDIES IN CHINA29
The WTO has generally defined subsidies as unrequited transfers from governments to
enterprises, including direct payments, tax concessions, contingent liabilities and the purchase
and provision of goods and services30. China defines subsidies more narrowly as unrequited
27 Mysteel, BNP Paribas, CEIC, US Department of Commerce 28 United States Department of Commerce, Bureau of Census 29 The author is indebted to George T. Haley for his help with data collection, analysis and interpretation. 30 World Trade Organization (2006) “World Trade Report: Exploring the Links Between Subsidies, Trade and the WTO”. Available at http://www.wto.org/english/res_e/booksp_e/anrep_e/world_trade_report06_e.pdf
©Usha C. V. Haley 19

direct payments from governments to enterprises, including the returning of VAT31. This study
uses the WTO definition.
Subsidies exist in all industries that the Chinese central and provincial governments
consider economically or militarily strategic, including Steel, Energy, Resource Extraction,
Computing, Software, R & D, Environmental Services and Conservation, and Autos. The Chinese
central and provincial governments have subsidized the growth of steel and other strategic
industries through at least 14 different subsidies32. The Chinese governments have also
historically supported inefficient firms, such as those in the steel sector, through subsidies33.
Data Institutional reasons (including poor infrastructure to gather data) and strategic reasons
(such as using data to create an informational black hole to confuse competitors) hinder the
collection of high‐quality data in China34. Researchers and analysts have found energy subsidies
particularly difficult to measure because of the problems with the quality of energy statistics as
well as the quality of accounting data35,36. In China’s case, the country’s size, its rapidly shifting
quasi‐market system and the tendency of provincial officials to lie to boost their political
31 S. Girma et al., op. cit. 32 U. C. V. Haley (2006), op. cit. 33 See S. Claro (2006) “Supporting Inefficient Firms with Capital Subsidies: China and Germany in the 1990s”, Journal of Comparative Economics, 34, pp. 377‐401. 34 For a discussion of the informational black hole see G. T. Haley and C. T. Tan (1996), “The Black Hole of South‐East Asia: Strategic Decision‐Making in an Informational Void”, Management Decision, 34, 9, pp. 37‐48; and, G. T. Haley, C. T. Tan and U. C. V. Haley (1998) New Asian Emperors: The Overseas Chinese their Strategies and Competitive Advantages, Butterworth‐Heinemann, Oxford (updated and to be republished in 2008 by John Wiley & Sons, Singapore and New Jersey). 35 Wiley Rein, op. cit., found no systematic evidence of energy subsidies to the Chinese steel industry, but presented anecdotal evidence of an electricity subsidy to Baosteel. 36 See F. Birol and J. H. Keppler (1999) “Looking at Energy Subsidies: Getting the Prices Right”, Energy Prices and Taxes, 3rd Quarter, for a listing of some of the measurement problems attending the gauging of energy subsidies in China.
©Usha C. V. Haley 20

fortunes magnify the problems of data quality37. Chinese central and provincial governments
also covertly and overtly use many policy instruments to reduce industrial costs. For example,
analysts from the International Energy Agency (IEA) noted major problems with energy statistics
submitted by China, including the substantial discrepancy between coal supply and demand
arising from poor data on stock changes. Consequently, the IEA started compiling its own
statistics to estimate Chinese coal production based on demand‐side statistics38.
Lack of regular and rigorous surveys also clouds other official statistics on energy.
China’s official statistics are riddled with inconsistencies. For example, the numbers reported on
growth in both GDP and Fixed Investment, as well as between Investment and Savings are
incompatible. Services are poorly covered in national‐account measures and consumption of all
kinds, including industrial consumption, is probably grossly underestimated39
Accounting data in China are particularly opaque. Despite Beijing’s avowed goal of
adopting international accounting standards, certain activities, such as “related‐party
transactions”, are not consistent with international standards, so officials and managers fudge.
Under international accounting norms, managers should clearly disclose deals between
companies with overlapping ownership. But, because overlapping ownership permeates China,
and the government still owns majority shares in every large steel company40, detailing
individual transactions would overwhelm financial reports. Consequently, “pure state‐
37 For a discussion of problems surrounding data collection in China and interpretation of official Chinese statistics see G. T. Haley, U. C. V. Haley, and C. T. Tan (2004) The Chinese Tao of Business: The Logic of Successful Business Strategy, John Wiley & Sons, Hoboken, NJ & Singapore. 38 International Energy Agency (2007) China and India Insights, World Energy Outlook , Insights Series, OECD, Paris. 39 See The Economist (2002) “How Cooked are the Books?”, March 14; and, The Economist (2006) “Dim Sums”, November 2. 40 See Wiley Rein (2007) op. cit.
©Usha C. V. Haley 21
controlled enterprises” have no disclosure requirements41. For this study, many of the steel
companies’ annual reports did not reveal standard accounting data such as “Bad Debts” and did
not define terms such as "Payables to The Government". Cash Inflows from some companies’
operations exceeded the Sales reported on the Income statements with no clarification.
Given the monumental problems associated with getting valid and reliable data from
China, this study used data from multiple reliable sources across China, the USA, Taiwan, India,
and Australia including Chinese government agencies (such as the NDRC), US government
agencies (such as the United States International Trade Commission), international agencies
(such as the IEA), international investment houses (such as BNP Paribas), and industry
associations (such as the American Iron and Steel Institute). Data were also obtained from
individual Chinese companies. Data were cross‐checked across at least two sources when
possible, and when discrepancies arose, the most conservative data were used. Estimates were
checked against accounting data provided by individual companies and interviews with
managers. Ill‐defined data were discarded. For example, the China Iron and Steel Association’s
(CISA’s) Financial Assets Department has recorded subsidies to steel companies and disclosed in
publicly‐available accounting statements that subsidies to the industry are included in various
industry‐level calculations. However, the CISA’s accounting figures were incompatible across
variables. Inquires revealed that the Department officially defines only two terms that it
publishes – “Pretax Profit” and “Recovery Rate of Payment”. Third parties were not entitled to
define the terms that the CISA published. Consequently, the data were not used in the analysis.
41 For a discussion of research on obtaining valid information in Asia see The Economist (2001) “From Bamboo to Bits and Bytes”, April 7, p. 13; and, for a discussion of Chinese accounting see The Economist (2007) “Cultural Revolution”, January 11.
©Usha C. V. Haley 22
In cases of murky data, analysts commonly adopt the price‐gap approach to measure
subsidies42. According to the price‐gap approach, subsidies to consumers lower end‐user prices
and result in higher consumption levels. End‐user prices are compared to reference prices to
measure the price gap. The reference price represents the efficient price that would prevail in a
market undistorted by subsidies and corresponds to the opportunity cost of the last unit
consumed. The reference price is usually taken as the border price adjusted for transport and
distribution margins and any country‐specific taxes in the case of traded goods or the long‐run
marginal cost of production in the case of goods that are not significantly traded. The approach
is designed to capture the net effects of all the different policy instruments that affect a good’s
price43. The price gap can be represented as a dollar value of subsidy per unit of subsidized
good or as a percentage of the reference price.
Several issues and assumptions shape the calculation of subsidies. The estimation of the
reference price plays a key role in the calculation of the price gap and therefore in the size of the
subsidy. Different reference prices can produce very different subsidy estimates. The choice of
exchange rate used to compare domestic and international prices also assumes importance. The
use of official exchange rates may give very different results from the use of purchasing power
parities (PPP) as end‐user prices can differ significantly across countries in non‐traded goods44.
Multiple prices in one economy (as exists in China) can also affect the estimation of end‐user
prices. This study used official exchange rates for the years in question; the reference prices
42 World Bank (1997) “Expanding the Measure of Wealth: Indicators of Environmentally Sustainable Development”, Environmentally Sustainable Development Studies and Monograph Series no.17, Washington, DC; and, International Energy Agency (1999) Looking at Energy Subsidies: Getting the Prices Right, World Energy Outlook, Insights Series, OECD, Paris 43 Ibid. 44 For a discussion of the problems surrounding using PPP to understand China’s economy and prices see The Economist (2007) “A Less Fiery Dragon?”, November 29.
©Usha C. V. Haley 23

were industry‐specified world prices for thermal coal, coking coal and natural gas as indicated by
the international industry associations for steel.
Definition and Measurement of Variables This study identifies and measures energy subsidies to the steel industry in China,
specifically to coking coal, thermal coal, natural gas and electricity. The mathematical equations
to calculate subsidies follow:
1. Thermal Coal Subsidies (Tcs): 2007 Tcs = Σyr ((WPTyr – CPTyr) KTyr), where: Tcs = Total subsidies paid to Chinese steel industry for thermal coal WPTyr = World price of thermal coal in each year from 2000 to 2007 CPTyr = Chinese price for thermal coal in each year from 2000 to 2007 KTyr = Kiloton usage in the Chinese steel industry of thermal coal in each year from 2000 to 2007 2. Coking Coal Subsidies (Ccs): 2007 Ccs = Σyr ((WPCyr – CPCyr) KCyr), where: Ccs = Total subsidies paid to Chinese steel industry for coking coal WPCyr = World price of coking coal in each year from 2000 to 2007 CPCyr = Chinese price for coking coal in each year from 2000 to 2007 KCyr = Kiloton usage in the Chinese steel industry of coking coal in each year from 2000 to
2007
©Usha C. V. Haley 24

3. Electricity Coal‐Price Increase Subsidy (CPIs): 2007 CPIs = Σyr ( Syr (EUyr – SEUyr)), where: CPIs = Total benefits to Chinese steel industry for coal‐price subsidy paid to electricity‐
generation industry. EUyr = Total electricity usage in each year from 2005 to 2007 SEUyr = Percent of electricity usage by Chinese steel industry in each year from 2005 to 2007 Syr = Coal‐price‐increase subsidy rate in each year from 2005 to 2007 4. Provincial Electricity Subsidies (PEs): 2007 PEs = Σyr ( Skwhyr (EUyr x SEUyr)), where: PEs = Total benefits to Chinese steel industry by provinces’ electricity subsidies. EUyr = Total electricity usage of Chinese steel industry in each year from 2000 to 2007 SEUyr = Percent of steel produced by Chinese steel industry in electricity‐subsidizing provinces in
each year from 2000 to 2007 Skwhyr
= Coal‐price‐increase subsidy rate in each year from 2000 to 2007 And SEUyr is determined by: 2007 SEUyr = Σyr (( 6(( TSyr – TSIPyr )/22) + TSIPyr) /TSyr), where
45: TS = Total steel production in all 30 Chinese provinces producing steel
TSIP = Total steel production in 8 Chinese provinces producing steel identified as paying
electricity subsidies
45 Six provinces are paying electricity subsidies but have not been specifically identified by the NDRC; 22 steel‐producing provinces have not been specifically identified as paying electricity subsidies by the NDRC.
©Usha C. V. Haley 25
5. Natural‐Gas Usage Subsidies ( NGs ): 2007 NGs = Σyr (( WPyr ‐ CPyr) SGyr)), where: NGs = Total natural‐gas subsidies paid to steel industry WPyr = World price of natural gas in year 2000 to 2007 CPyr = Chinese price of natural gas in year 2000 to 2007 SGyr = Natural‐gas usage by Chinese steel industry in year 2000 to 2007
III. ENERGY SUBSIDIES TO THE CHINESE STEEL INDUSTRY
In 2007, China has become the world’s second‐largest consumer of energy. Industry
accounts for over 70 percent of final energy consumption in China, while the residential,
commercial and transportation sectors account for 10, 2, and 7 percent, respectively46. In
2005, the iron and steel industry accounted for 28 percent of total industrial consumption and
coal dominated the energy mix 47.
As the preceding sub‐section highlighted, despite its importance, researchers and
analysts have difficulty deciphering China’s energy consumption, and attendant effects on steel.
The steel industry’s energy consumption fluctuates constantly, and presents a fusion of
governmental plans and market forces, formal regulation and seat‐of‐the‐pant remedies, central
intentions, and local interests. National security considerations or SOEs’ habits of secrecy
obscure many key metrics. While the NDRC, the country’s top economic planning agency, sets
price guidelines, the actual costs and subsidies vary across China since local regulators influence
the prices. In a recent white paper, the Information Office of the State Council admitted that
“China’s energy market system is yet to be completed, as the energy pricing mechanism fails to
46 CEIC 47 International Energy Agency (2007) op. cit.
©Usha C. V. Haley 26

fully reflect the scarcity of resources, its supply and demand, and the environmental cost”48.
Local influences on pricing, dual supply chains for steel companies and arrears can obfuscate
assessments of what the steel companies pay for coal, electricity or natural gas.
In September 2007, a draft version of China's Energy Law included the suggestion that
China establish a unified institution, such as a Ministry of Energy, to supervise the country's
energy industry49. Currently, multiple ministries and commissions govern China's energy
industry, including the NDRC, the State Electricity Regulatory Commission (SERC), the Ministry of
Land Resources (MLR) and the Ministry of Commerce (MOFCOM). The Energy Bureau, an NDRC
bureau in charge of supervising the energy industry, has a full‐time staff of only 100 people; in
contrast, the USA’s Energy Department has a staff of 110,00050. Furthermore, companies such
as the China National Petroleum Corporation (CNPC) and the China Petroleum and Chemical
Corporation (Sinopec), both of which originally comprised one ministry before being converted
to SOEs in the 1980s, still retain the same hierarchical rank as ministries in the government,
putting them higher than the bureau that is charged with supervising them. The proposed
institution would have a higher rank than these companies. However, experts have argued that
the establishment of such a Ministry of Energy would involve the interests of too many parties,
leading to potential bureaucratic conflict, and the plan would stall as similar plans have in the
past51.
This research shows that though some subsidies have fallen, total energy subsidies to
steel have increased overall and most dramatically since 2004, corresponding to the sharp
increase in exports. Figure 7 summarizes subsidies to thermal coal, coking coal, electricity and
48 Information Office of the State Council of the People’s Republic of China (2007) “China’s Energy Conditions and Policies”, White Paper, December. 49 Shanghai Securities News 50 J. Kahn and J. Yardley (2007) “As China Roars, Pollution Reaches Deadly Extremes”, New York Times, August 26. 51 Interfax China Energy Weekly, 2006
©Usha C. V. Haley 27
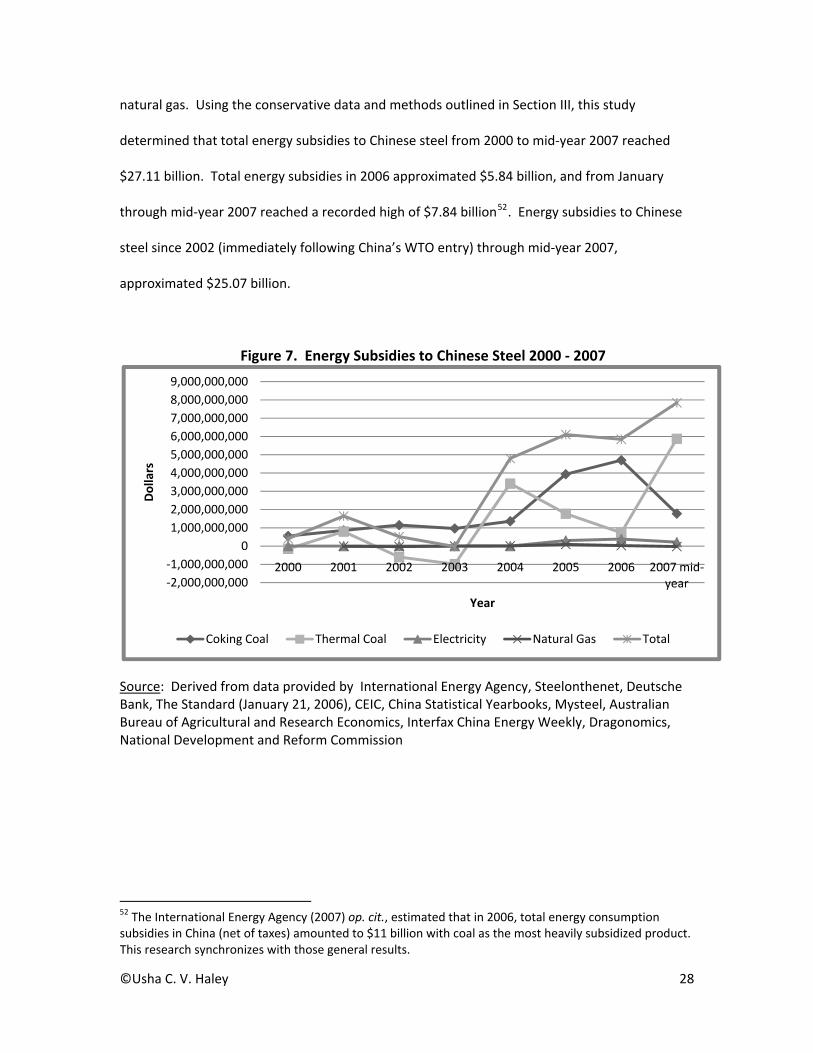
natural gas. Using the conservative data and methods outlined in Section III, this study
determined that total energy subsidies to Chinese steel from 2000 to mid‐year 2007 reached
$27.11 billion. Total energy subsidies in 2006 approximated $5.84 billion, and from January
through mid‐year 2007 reached a recorded high of $7.84 billion52. Energy subsidies to Chinese
steel since 2002 (immediately following China’s WTO entry) through mid‐year 2007,
approximated $25.07 billion.
Figure 7. Energy Subsidies to Chinese Steel 2000 ‐ 2007
‐2,000,000,000‐1,000,000,000
01,000,000,0002,000,000,0003,000,000,0004,000,000,0005,000,000,0006,000,000,0007,000,000,0008,000,000,0009,000,000,000
2000 2001 2002 2003 2004 2005 2006 2007 mid‐year
Dollars
Year
Coking Coal Thermal Coal Electricity Natural Gas Total
Source: Derived from data provided by International Energy Agency, Steelonthenet, Deutsche Bank, The Standard (January 21, 2006), CEIC, China Statistical Yearbooks, Mysteel, Australian Bureau of Agricultural and Research Economics, Interfax China Energy Weekly, Dragonomics, National Development and Reform Commission
52 The International Energy Agency (2007) op. cit., estimated that in 2006, total energy consumption subsidies in China (net of taxes) amounted to $11 billion with coal as the most heavily subsidized product. This research synchronizes with those general results.
©Usha C. V. Haley 28

Subsidies to Coal Since the 1980s, China has gradually liberalized coal pricing. As with many other
Chinese goods , a two‐tiered price system emerged, the first set by the NDRC for plan‐allocated
quotas and the second set by the market for other demand. Over the last two decades, the
amount of coal produced for other demand has grown. At the beginning of 2007, the Chinese
government abolished the two‐tier system and both contract and spot coal must now be
negotiated at market rates; however, legacy behaviors linger among the steel companies53.
China has the world’s largest coal market, double the size of the USA’s. While down
from a post‐reform high of 76 percent in 1990, coal still meets over two‐thirds of China’s energy
needs. In 2006, China consumed 2.4 billion tons of coal, nearly twice the amount consumed just
six years ago. Over 75 percent of the demand growth in recent years has come from the power
sector, as electricity demand boomed and alternative fuel sources (hydro, natural gas, wind, and
nuclear) for generating that electricity failed to keep pace. Of the 50 percent of coal not
consumed by the power sector, the majority sells directly to industry for use in boilers, coking
ovens and on‐site (“inside the fence”) power generation. Household coal consumption, which
accounted for 20 percent of total demand in 1985, dropped to 4 percent as China’s residents
move into homes equipped with gas and electricity for cooking and heating.
In 2004, the iron and steel industry accounted for around 13 per cent of total coal consumption
in China54.
Figure 8 traces the subsidies towards thermal coal received by China’s steel industry.
Using the data and methods outlined in Section III, this study determined that subsidies for
thermal coal to the Chinese steel industry from 2000 to mid‐year 2007 reached $11.16 billion.
53 For discussions of China’s coal sector see J. Melanie, R. Curtotti, M. Saunders, K. Schneider, L. Fairhead and Y. Qian (2002) “Global Coal Markets”, ABARE Research Report 02.2; and, J. Melanie and A. Austin (2006) “China’s Coal Sector. Recent Developments and Implications for Prices”, Australian Commodities, 13, 3, September, pp. 542‐554. 54 International Energy Agency (2006) World Energy Outlook, OECD, Paris.
©Usha C. V. Haley 29

Subsidies to thermal coal in 2006 fell to $731.25 million, as coal prices tended to converge
towards market prices. However, from January through mid‐year 2007, subsidies to thermal
coal rose to an all time high of $5.88 billion as provincial subsidies may have kicked in to bolster
steel production. Thermal‐coal subsidies to Chinese steel since 2002 (immediately following
China’s WTO entry) through mid‐year 2007, approximated $10.21 billion.
Figure 8. Subsidies to Thermal Coal in Chinese Steel Production 2000 ‐ 2007
‐2,000,000,000
‐1,000,000,000
0
1,000,000,000
2,000,000,000
3,000,000,000
4,000,000,0005,000,000,000
6,000,000,000
7,000,000,000
2000 2001 2002 2003 2004 2005 2006 2007 Jan‐July
Dollars
Year
Thermal‐Coal Subsidies
Source: International Energy Agency, Steelonthenet, Deutsche Bank, The Standard (January 21, 2006),
Similarly, coke prices have continued to converge upwards with world prices since 2004,
leading to increased provincial subsidies. The Chinese coke industry which supplies about 80
percent of its products to the domestic steel sector has traditionally suffered from
fragmentation and overcapacity. At the end of 2005, China had 1480 coke producers and a total
production capacity of 300 million tons. Demand stood at 220 million tons in 2005 and capacity
exceeded demand by as much as 100 million tons. Yet, new coke facilities capable of producing
30 million tons are being planned across the country. The overcapacity has led in 2007 to
©Usha C. V. Haley 30

decreases in coke prices55. In the first half of 2007, recorded subsides to coke fell to $1.8 billion,
substantially down from the same time last year.
Using the data and methods outlined in Section III, this study determined that subsidies
for coking coal to the Chinese steel industry from 2000 to mid‐year 2007 reached $15.29 billion.
Subsidies to coking coal in 2006 reached an all‐time high of $4.70 billion and from January
through mid‐year 2007 fell to $1.77 billion. Coking‐coal subsidies to Chinese steel since 2002
(immediately following China’s WTO entry) through mid‐year 2007, approximated $13.88 billion.
Figure 9. Subsidies to Coking Coal in Chinese Steel Production 2000 ‐ 2007
0
1,000,000,000
2,000,000,000
3,000,000,000
4,000,000,000
5,000,000,000
2000 2001 2002 2003 2004 2005 2006 2007 Jan‐July
Dollars
Year
Coking‐Coal Subsidies
Source: Steelonthenet, CEIC, International Energy Agency, China Statistical Yearbooks, Mysteel
Subsidies to Electricity Like the coal used to generate it, industry consumes the majority of the country’s
electricity, with 10 percent going to iron and steel production. Households account for 11
percent of demand, down slightly from a high of 12.5 percent in 200156.
55 RNCOS, National Bureau of Statistics
©Usha C. V. Haley 31
Electricity prices for Chinese industry appear high. However, conversations with industry
analysts indicate that many steel companies do not bear the full costs indicated by national
average figures from the National Statistics Bureau. Subsidies or “price adjustments” permeate
the system, and some of these price adjustments occasionally become declassified. The NDRC
sets electricity tariffs province‐by province based on the recommendations of local pricing
bureaus that answer to local officials. Local social and economic concerns often impede the
NDRC’s efforts to rationalize energy pricing and to reduce overall energy consumption. The
Chinese steel industry’s energy‐intensive firms consume about 20 to 40 percent more energy
per ton of output than their competitors in the OECD57, and are therefore sensitive to
electricity‐price increases. The provinces that support their inefficient steel companies have
resisted the NDRC’s recent efforts to raise prices for steel and nonpayment has become an
important issue.
The NDRC on April 16, 2007 required 14 provinces to halt immediately their preferential
electricity‐price policy for local, high‐energy‐consuming enterprises, in an attempt to curb these
industries’ development58. To restrain high‐energy‐consuming industries, China had previously
introduced in September 2006 differentiated electricity prices for such industries as steel,
electrolytic aluminum, ferroalloy, calcium carbide, caustic soda, cement, yellow phosphorus and
zinc smelting. The provincial governments failed to implement the policies uniformly.
Consequently, the NDRC, together with the SERC ordered locals to rectify their misbehavior by
the end of April 2007.
56 CEIC 57 Y. Wan (2006) “China’s Energy Efficiency Policy in Industry”, Expert Group Seminar with the OECD Global Forum on Sustainable Development, Paris, March. 58 Asia Pulse (2007) “China Halts Preferential Pricing of 14 Provinces”, April 17.
©Usha C. V. Haley 32

Yet, provinces continue to subsidize routinely the cost of electricity for steel and metal
production. In 2006, when Beijing announced its nationwide campaign to raise electricity prices
to energy‐consuming industries, officials in the Ningxia province worked to evade the
requirements. Fearing the impact on the local economy, the provincial government brokered a
special deal for the Qingtongxia Aluminum Group which accounts for 20 percent of the
province’s industrial consumption and 10 percent of its GDP. Provincial officials removed the
company from the national electricity grid and supplied electricity directly to it, exempting it
from expensive fees. Consequently, Qingtongxia continued to get its electricity at the lowest
price available59.
Statistics show that some energy‐intensive industries have recorded rapid surges in
production and profits. Specifically, the steel industry logged year‐on‐year profit surges of 3.6
times in the first two months of 2007, with crude steel production up 23.1 per cent. In the same
period, electricity‐generation capacity went up 16.6 per cent, 5.4 percentage points faster than
growth in 2006.
Electricity prices overtly remain tightly controlled by the NDRC’s Price Bureau. Unlike
the developed countries, China has no separately determined transmission tariffs. The NDRC
determines both the price at which the generators can sell power to the grid and what the grid
can charge different categories of users. The NDRC sets these prices province‐by‐province in
consultation with local price bureaus and tries to accommodate provincial stakeholders’
interests. Provincial officials lobby for end‐user pricing low enough to keep their industries
viable and citizens happy. The power generators lobby for on‐grid tariffs high enough to cover
their fuel costs and to ensure profits for future investments. And, the grid companies
emphasize that they need the margins to finance a $130 billion expansion of China’s
59 H. W. French (2007) “Beijing Seeks Energy Cuts; Localities Find Loopholes”, New York Times, November 24.
©Usha C. V. Haley 33
transmission network between 2006 and 201060. Complex and opaque end‐user pricing and
transmission costs obfuscate the allocation of rents across the electricity‐value chain. Because
this study relied solely on published prices and the NDRC’s disclosures on provinces that had
subsidized their steel industries, the subsidies to electricity are probably underrepresented.
The demand surges over the past three years shrank coal inventories and doubled spot
prices. In response, the NDRC enacted a price pass‐through mechanism whereby electricity
tariffs could be raised by 75 percent of coal‐price increases. Yet, electricity prices have only risen
by 20 percent on average since the beginning of 2004. The gap between the published national
average on‐grid price and end‐user prices indicate that the grid should make huge profits.
However, the reported transmission industry‐wide data show meager 2006 profits of 4 percent,
up from 1.6 percent in 2004. Further investigation has revealed that the grid can collect less
from end‐users such as steel companies (either because of reduced rates or nonpayment) than
the published rate tables suggest61.
Reflecting the dominance of coal in China’s electricity fuel mix, substantial growth in
electricity output has increased demand for thermal coal. Coal consumption by the electricity
sector increased at an average annual rate of around 21 per cent between 2002 and 2004
following an increase of 5.6 per cent in 2001. Many coal and power‐generation companies have
public listings, but considerable government control and ownership remains in both industries.
The government is increasingly linking electricity prices with coal costs, and electricity
consumption with the introduction of more transparent pricing mechanisms. For example, two‐
part tariff rates have been introduced to curb electricity consumption by energy‐intensive
industries and retail electricity charges have also risen recently to reflect higher coal prices62.
60 D. H. Rosen and T. Houser (2007) op. cit. 61 Ibid. 62 Australian Bureau of Agricultural and Research Economics
©Usha C. V. Haley 34
In mid‐2004, the price of electricity was increased on average by 0.08 cents per kWh.
A further increase of 0.27 cents per kWh was introduced in the east, north, central and southern
grids to pass on additional costs of transmission. In 2005, the State Council approved the
implementation of a new pricing mechanism to link electricity charges to coal costs. An increase
in the coal price is passed on to electricity consumers when the average coal price changes by
more than 5 percent over six‐months. If the change in the average coal price is less than 5
percent in six months, the percentage price change carries over to the next six months.
However, as Table 1 reveals, the central government simultaneously offers a subsidy to the
electricity‐generation industry, in effect since 2005, to offset the higher electricity prices; this
subsidy is then passed on to electricity’s customers, including the steel industry63. The fuel‐
input adjustment in 2005, and the attendant increase in subsidy, responded to a significant
increase in thermal‐coal prices in 200464. In June 2006, electricity charges were increased in
response to higher coal costs, additional adjustments for new generation and transmission
projects’ higher construction costs, and relocation compensation and support for the
development of renewable‐energy projects. Simultaneously, a subsidy to industry was added to
“adjust” for the increased prices.
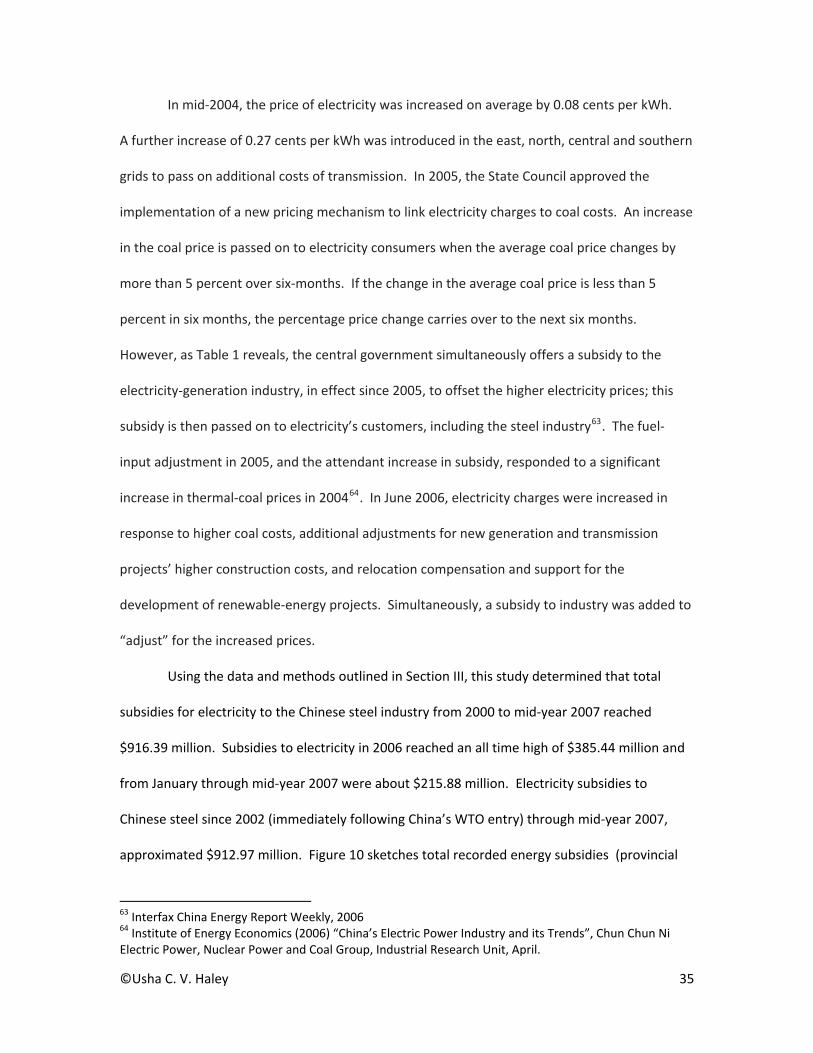
Using the data and methods outlined in Section III, this study determined that total
subsidies for electricity to the Chinese steel industry from 2000 to mid‐year 2007 reached
$916.39 million. Subsidies to electricity in 2006 reached an all time high of $385.44 million and
from January through mid‐year 2007 were about $215.88 million. Electricity subsidies to
Chinese steel since 2002 (immediately following China’s WTO entry) through mid‐year 2007,
approximated $912.97 million. Figure 10 sketches total recorded energy subsidies (provincial
63 Interfax China Energy Report Weekly, 2006 64 Institute of Energy Economics (2006) “China’s Electric Power Industry and its Trends”, Chun Chun Ni Electric Power, Nuclear Power and Coal Group, Industrial Research Unit, April.
©Usha C. V. Haley 35

and coal price) to China’s steel industry. The coal‐price subsidies (to compensate for the
increased price of coal) that started in 2005 dwarf the recorded provincial subsidies; Figure 11
records these subsidies from 2000 to 2007. Because of the circumstances described in this sub‐
section, most of the subsidies to electricity have probably not been uncovered.
Table 1. Some Subsidies to Electricity in China Rise in Price
USc/kWh Average Regional Increases in Sales Prices Eastern China 0.22 Central China 0.36 Southern China 0.37 Northeastern China 0.17 Average Increase (all regions) 0.30 Subsidies for State Government Projects Relocation compensation for new projects) 0.78 Support for the development of renewable energy projects
0.0125
Subsidies for Power Generation Projects Compensation for losses caused by the rise in coal cost and transport fees
0.122
Compensation for installation of desulphurization facilities
0.03
Subsidies for Grid Construction State power grid construction 0.026 Rural power grid construction 0.007 Subsidies for Local Government Projects Subsidies to small hydropower projects, gas fired projects, wind power projects and WEP projects
0.016
Source: Derived from data provided by Australian Bureau of Agricultural and Research Economics, Interfax China Energy Weekly
©Usha C. V. Haley 36
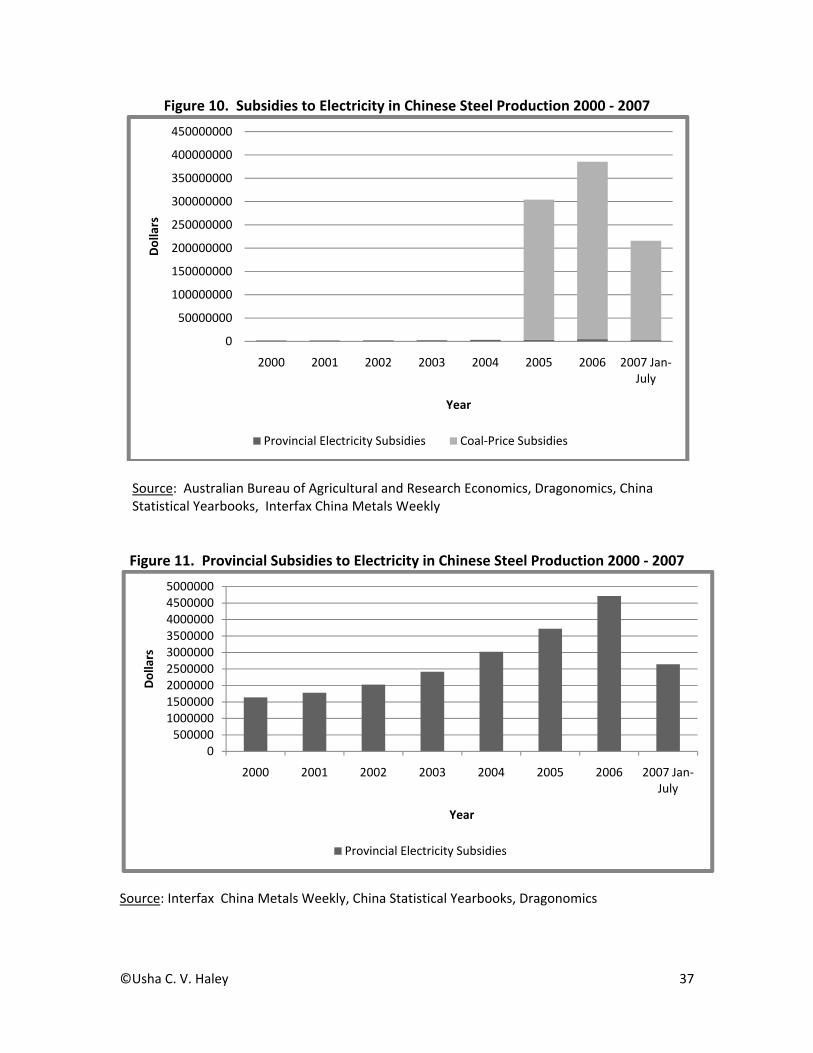
Figure 10. Subsidies to Electricity in Chinese Steel Production 2000 ‐ 2007
0
50000000
100000000
150000000
200000000
250000000
300000000
350000000
400000000
450000000
2000 2001 2002 2003 2004 2005 2006 2007 Jan‐July
Dollars
Year
Provincial Electricity Subsidies Coal‐Price Subsidies
Source: Australian Bureau of Agricultural and Research Economics, Dragonomics, China Statistical Yearbooks, Interfax China Metals Weekly Figure 11. Provincial Subsidies to Electricity in Chinese Steel Production 2000 ‐ 2007
0500000100000015000002000000250000030000003500000400000045000005000000
2000 2001 2002 2003 2004 2005 2006 2007 Jan‐July
Dollars
Year
Provincial Electricity Subsidies
Source: Interfax China Metals Weekly, China Statistical Yearbooks, Dragonomics
©Usha C. V. Haley 37
Subsidies to Natural Gas China’s central government has tightly controlled natural‐gas prices and attempted to
keep gas prices for industry competitive with other developing countries. But, this approach
failed to induce the development or importation of sufficient quantities of natural gas to meet
burgeoning demand. Consequently, natural‐gas prices have increased. Although Beijing sets
natural‐gas prices, they vary by province and sector. In most provinces, residential users pay the
highest price, followed by chemical producers, power generators, and fertilizer manufacturers65.
China has a long history of using natural gas. Yet, in 2000, because of underdeveloped
gas markets and institutions, and the lack of an integrated, national gas‐pipeline network, the
share of gas in the fuel mix remained at a low 3.0 percent. The chemicals and fertilizer
industries, and the oil and gas sector, served as primary consumers of natural gas. In 2000, only
0.5 percent of electricity generation in China was gas fired.
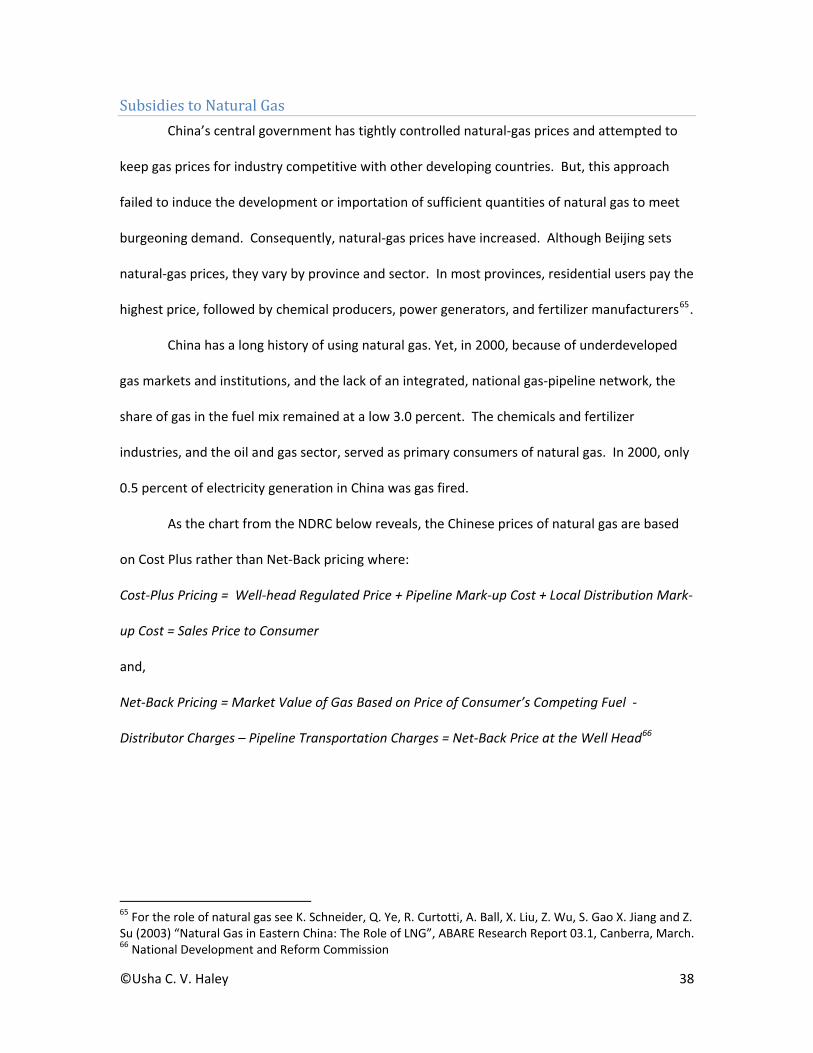
As the chart from the NDRC below reveals, the Chinese prices of natural gas are based
on Cost Plus rather than Net‐Back pricing where:
Cost‐Plus Pricing = Well‐head Regulated Price + Pipeline Mark‐up Cost + Local Distribution Mark‐
up Cost = Sales Price to Consumer
and,
Net‐Back Pricing = Market Value of Gas Based on Price of Consumer’s Competing Fuel ‐
Distributor Charges – Pipeline Transportation Charges = Net‐Back Price at the Well Head66
65 For the role of natural gas see K. Schneider, Q. Ye, R. Curtotti, A. Ball, X. Liu, Z. Wu, S. Gao X. Jiang and Z. Su (2003) “Natural Gas in Eastern China: The Role of LNG”, ABARE Research Report 03.1, Canberra, March. 66 National Development and Reform Commission
©Usha C. V. Haley 38

Figure 12. Natural Gas Supply Chain and Pricing Mechanisms in China
Source: National Development and Reform Commission through HSBC
On 22 December 2005, the NDRC announced that it had changed the natural‐gas pricing
system and would allow a natural‐gas price hike of 8 percent per annum67. Despite the
government proposal of hiking prices by 8 percent a year, it could be the year 2016 before
China’s domestic‐gas prices synchronize with international averages68.
Due to pricing controls
on natural gas, China’s well‐head gas price trades 60 percent lower on average to international
prices, providing a significant subsidy. The EBITDA69 margin on the domestic wellhead price is 16
percent against the 60 percent of major international benchmarks. These artificially low gas
prices reduce the financial burden for end‐users, including steel companies.
Despite the low usage of natural gas in the Chinese steel industry’s cost structure, the
industry benefited in 2005 from the artificially low prices. However, as natural gas prices have
67 Andrew Yeh, “China Raises Price of Natural Gas”, Financial Times, December 27, 2005 68 HSBC 69 Earnings before Interest, Taxes, Depreciation and Amortization
©Usha C. V. Haley 39
risen 8 percent per annum, many of these gains appear to have eroded. Also, a tight gas market
creates an incentive for CNPC and Sinopec to supply residential customers at the expense of
industry. Several companies have had difficulty ensuring reliable supply at the government‐
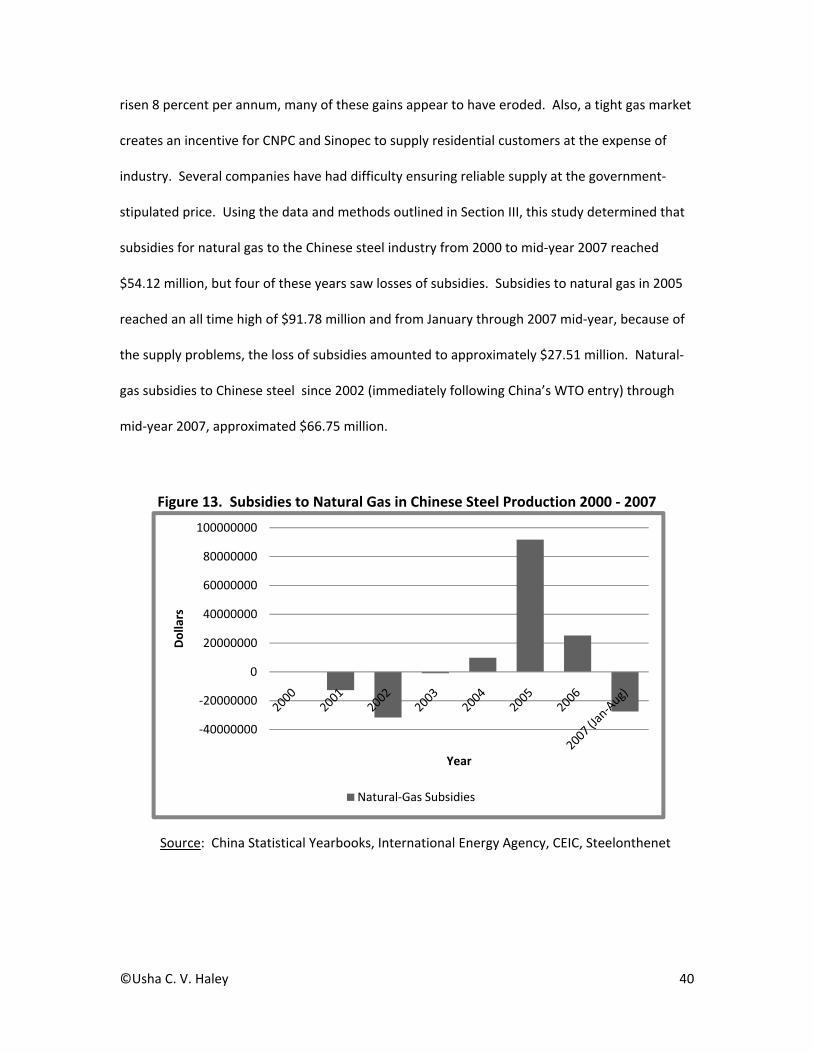
stipulated price. Using the data and methods outlined in Section III, this study determined that
subsidies for natural gas to the Chinese steel industry from 2000 to mid‐year 2007 reached
$54.12 million, but four of these years saw losses of subsidies. Subsidies to natural gas in 2005
reached an all time high of $91.78 million and from January through 2007 mid‐year, because of
the supply problems, the loss of subsidies amounted to approximately $27.51 million. Natural‐
gas subsidies to Chinese steel since 2002 (immediately following China’s WTO entry) through
mid‐year 2007, approximated $66.75 million.
Figure 13. Subsidies to Natural Gas in Chinese Steel Production 2000 ‐ 2007
‐40000000
‐20000000
0
20000000
40000000
60000000
80000000
100000000
Dollars
Year
Natural‐Gas Subsidies
Source: China Statistical Yearbooks, International Energy Agency, CEIC, Steelonthenet
©Usha C. V. Haley 40
IV. CONCLUSIONS
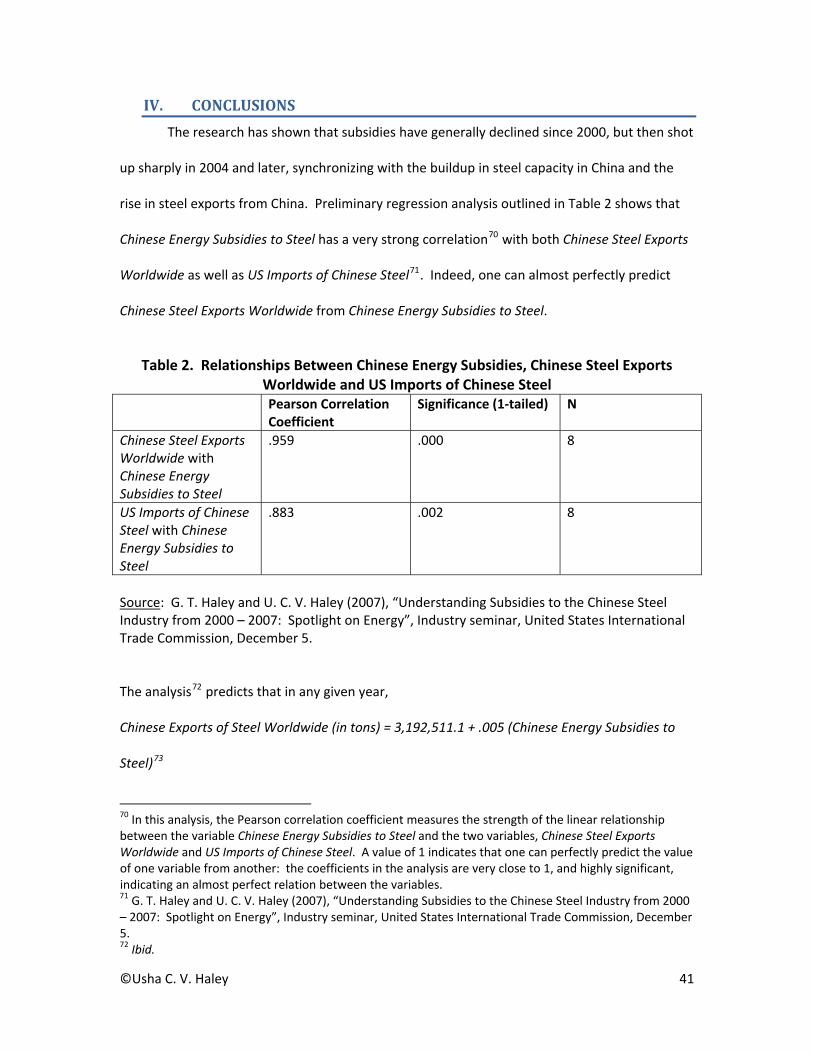
The research has shown that subsidies have generally declined since 2000, but then shot
up sharply in 2004 and later, synchronizing with the buildup in steel capacity in China and the
rise in steel exports from China. Preliminary regression analysis outlined in Table 2 shows that
Chinese Energy Subsidies to Steel has a very strong correlation70 with both Chinese Steel Exports
Worldwide as well as US Imports of Chinese Steel71. Indeed, one can almost perfectly predict
Chinese Steel Exports Worldwide from Chinese Energy Subsidies to Steel.
Table 2. Relationships Between Chinese Energy Subsidies, Chinese Steel Exports
Worldwide and US Imports of Chinese Steel Pearson Correlation
Coefficient Significance (1‐tailed) N
Chinese Steel Exports Worldwide with Chinese Energy Subsidies to Steel
.959 .000 8
US Imports of Chinese Steel with Chinese Energy Subsidies to Steel
.883 .002 8
Source: G. T. Haley and U. C. V. Haley (2007), “Understanding Subsidies to the Chinese Steel Industry from 2000 – 2007: Spotlight on Energy”, Industry seminar, United States International Trade Commission, December 5.
The analysis72 predicts that in any given year,
Chinese Exports of Steel Worldwide (in tons) = 3,192,511.1 + .005 (Chinese Energy Subsidies to
Steel)73
70 In this analysis, the Pearson correlation coefficient measures the strength of the linear relationship between the variable Chinese Energy Subsidies to Steel and the two variables, Chinese Steel Exports Worldwide and US Imports of Chinese Steel. A value of 1 indicates that one can perfectly predict the value of one variable from another: the coefficients in the analysis are very close to 1, and highly significant, indicating an almost perfect relation between the variables. 71 G. T. Haley and U. C. V. Haley (2007), “Understanding Subsidies to the Chinese Steel Industry from 2000 – 2007: Spotlight on Energy”, Industry seminar, United States International Trade Commission, December 5. 72 Ibid.
©Usha C. V. Haley 41

and,
US Imports of Steel from China (in $) = 480,000,000 + .27 (Chinese Energy Subsidies to Steel)74
The Chinese central government’s policies appear to be aimed at consolidating the steel
industry and curbing excess capacity. However, the policies have failed to reduce energy
subsidies to steel and are unlikely to do so in the future if recent pronouncements from the steel
companies’ senior executives provide indicators. For example, on October 26, 2007, Chairman
Li Xiawei of Hunan Valin Iron and Steel Group said China will keep exporting steel despite
governmental efforts to rein in exports of low‐end products75. Hunan Valin plans to export
between 2.2 million and 2.3 million tons of steel products in 2007, a rise of at least 24 percent
from last year, Chairman Li said. Valin Group, China's tenth‐largest producer, plans to raise its
output by 9 percent to 10.8 million tons in 2007, and it expects revenue to rise 12 percent to
about 45.5 billion yuan, Li said. "This year a few dozen million tons were supposed to be shut; if
they haven't it creates more pressure for next year. So far, I haven't seen the policies have much
effect," he said76.
What one hand takes away – the other hand gives, and vice versa. The center and
provinces differ on policies and goals77. The central government’s removal of subsidies often
results in the provincial government’s increasing them. For example, at a State Council
conference held on Apr 27, 2007, NDRC’s director, Ma Kai, revealed that 10 provinces and
municipalities, i.e. Beijing, Hebei, Shanxi, Liaoning, Jiangsu, Zhejiang, Jiangxi, Shandong, Henan,
and Xinjiang, had signed a first round of written commitments to shut down and to eliminate
outdated iron‐making capacity and obsolete steelmaking capacity of 39.86 and 41.67 million
73 Ibid., significant at .000 level 74 Ibid., significant at .004 level. 75 “Execs refuse to co‐operate”, Shanghai Securities News, October 18, 2007. 76 Ibid. 77 See G. T. Haley, U. C. V. Haley and C. T. Tan (2004), op. cit..for an elaboration of the historical and strategic divergence between the Chinese central and provincial governments’ goals and strategies.
©Usha C. V. Haley 42

©Usha C. V. Haley 43
tons respectively in the next five years; 22.55 and 24.23 million tons were to be closed down by
the end of 2007. Five out of the above‐mentioned steelmaking provinces, Hebei, Shanxi, Henan,
Jiangsu and Shandong, are responsible for 70 percent of the nation's outdated iron‐making
capacity and 50 percent of obsolete steelmaking capacity. However, according to the NDRC,
some enterprises reconstruct those would‐be eliminated facilities and expand production scale
to ward off the elimination; some only suspend production and can resume operation at any
moment; some sell outdated equipment to other regions; and, some switch iron‐making blast
furnaces to the production of ductile iron pipes and ferroalloy, which are already severely
oversupplied, thereby thwarting the agreements78.
In conclusion, substantial energy subsidies pervade China’s steel production. These
subsidies have contributed directly to the ballooning of Chinese steel exports and have affected
the global and US steel industries. The Chinese central government’s policies on consolidating
their steel industry appear to have had limited or no effect on the provinces’ subsidies. Future
policy initiatives from both the USA and China regarding China’s steel exports and compliance
with WTO standards may need to accommodate these provincial realities to enhance
effectiveness.
© Usha C. V. Haley, December 26, 2007. The author may be reached through email [email protected] or tel/fax 1-212-208-2468 This research report is based on material compiled from data considered to be reliable at the time of writing. However, information and opinions expressed will be subject to change without notice. We do not accept any liability directly or indirectly that may arise from investment decision-making based on this report.
78 Ibid.